UNITED STATES
SECURITIES AND EXCHANGE COMMISSION
Washington, D.C. 20549
FORM N-CSR
CERTIFIED SHAREHOLDER REPORT OF REGISTERED
MANAGEMENT INVESTMENT COMPANIES
Investment Company Act file number | 811-08510 | |||||
| ||||||
Matthews International Funds | ||||||
(Exact name of registrant as specified in charter) | ||||||
| ||||||
Four Embarcadero Center, Suite 550 | ||||||
(Address of principal executive offices) (Zip code) | ||||||
| ||||||
William J. Hackett, President Four Embarcadero Center, Suite 550 San Francisco, CA 94111 | ||||||
(Name and address of agent for service) | ||||||
| ||||||
Registrant’s telephone number, including area code: | 415-788-6036 |
| ||||
| ||||||
Date of fiscal year end: | December 31 |
| ||||
| ||||||
Date of reporting period: | December 31, 2009 |
| ||||
Form N-CSR is to be used by management investment companies to file reports with the Commission not later than 10 days after the transmission to stockholders of any report that is required to be transmitted to stockholders under Rule 30e-1 under the Investment Company Act of 1940 (17 CFR 270.30e-1). The Commission may use the information provided on Form N-CSR in its regulatory, disclosure review, inspection, and policymaking roles.
A registrant is required to disclose the information specified by Form N-CSR, and the Commission will make this information public. A registrant is not required to respond to the collection of information contained in Form N-CSR unless the Form displays a currently valid Office of Management and Budget ("OMB") control number. Please direct comments concerning the accuracy of the information collection burden estimate and any suggestions for reducing the burden to Secretary, Securities and Exchange Commission, 100 F Street, NE, Washington, DC 20549. The OMB has reviewed this collection of information under the clearance requirements of 44 U.S.C. § 3507.
Item 1. Reports to Stockholders.
The Report to Shareholders is attached herewith.
Matthews Asia Funds | Annual Report
December 31, 2009 | matthewsasia.com
ASIA GROWTH AND INCOME STRATEGIES
Matthews Asian Growth and Income Fund
Matthews Asia Dividend Fund
Matthews China Dividend Fund
ASIA GROWTH STRATEGIES
Matthews Asia Pacific Fund
Matthews Pacific Tiger Fund
Matthews China Fund
Matthews India Fund
Matthews Japan Fund
Matthews Korea Fund
ASIA SMALL COMPANY STRATEGY
Matthews Asia Small Companies Fund
ASIA SPECIALTY STRATEGY
Matthews Asian Technology Fund
'09

Performance and Expenses
Through December 31, 2009
| Average Annual Total Return | 2009 Gross Annual | 2008 Gross Annual | |||||||||||||||||||||||||||||
| 1 year | 5 years | 10 years | Since Inception | Inception Date | Operating Expenses | Operating Expenses | |||||||||||||||||||||||||
| ASIA GROWTH AND INCOME STRATEGIES | |||||||||||||||||||||||||||||||
| Matthews Asian Growth and Income Fund | 41.44 | % | 10.77 | % | 13.76 | % | 11.18 | % | 9/12/94 | 1.18 | % | 1.16 | % | ||||||||||||||||||
| Matthews Asia Dividend Fund | 47.59 | % | n.a. | n.a. | 11.00 | % | 10/31/06 | 1.28 | % | 1.35 | % | ||||||||||||||||||||
| After Fee Waiver, Reimbursement and Recoupment | 1.30 | %1 | 1.32 | %1 | |||||||||||||||||||||||||||
| Matthews China Dividend Fund | n.a. | n.a. | n.a. | 1.80 | %2 | 11/30/09 | 10.05 | % | n.a. | ||||||||||||||||||||||
| After Fee Waiver, Reimbursement and Recoupment | 1.50 | %3 | n.a. | ||||||||||||||||||||||||||||
| ASIA GROWTH STRATEGIES | |||||||||||||||||||||||||||||||
| Matthews Asia Pacific Fund | 44.82 | % | 7.18 | % | n.a. | 9.86 | % | 10/31/03 | 1.28 | % | 1.23 | % | |||||||||||||||||||
| Matthews Pacific Tiger Fund | 75.37 | % | 14.50 | % | 11.55 | % | 9.13 | % | 9/12/94 | 1.13 | % | 1.12 | % | ||||||||||||||||||
| Matthews China Fund | 78.30 | % | 22.23 | % | 17.18 | % | 13.53 | % | 2/19/98 | 1.21 | % | 1.23 | % | ||||||||||||||||||
| Matthews India Fund | 97.25 | % | n.a. | n.a. | 16.43 | % | 10/31/05 | 1.27 | % | 1.29 | % | ||||||||||||||||||||
| Matthews Japan Fund | 10.06 | % | -5.49 | % | -3.85 | % | 3.11 | % | 12/31/98 | 1.31 | % | 1.23 | % | ||||||||||||||||||
| Matthews Korea Fund | 62.92 | % | 10.47 | % | 8.98 | % | 4.81 | % | 1/3/95 | 1.30 | % | 1.27 | % | ||||||||||||||||||
| ASIA SMALL COMPANY STRATEGY | |||||||||||||||||||||||||||||||
| Matthews Asia Small Companies Fund | 103.00 | % | n.a. | n.a. | 44.05 | % | 9/15/08 | 2.09 | % | 14.31 | % | ||||||||||||||||||||
| After Fee Waiver, Reimbursement and Recoupment | 2.00 | %4 | 2.00 | %4 | |||||||||||||||||||||||||||
| ASIA SPECIALTY STRATEGIES | |||||||||||||||||||||||||||||||
| Matthews Asian Technology Fund | 70.28 | % | 8.03 | % | n.a. | -1.64 | % | 12/27/99 | 1.40 | % | 1.33 | % | |||||||||||||||||||
1 The Advisor has contractually agreed to waive Matthews Asia Dividend Fund's fees and reimburse expenses until at least August 31, 2010 to the extent needed to limit total annual operating expenses to 1.50%.
2 Actual Return for fiscal period beginning 11/30/09 through 12/31/09, not annualized.
3 The Advisor has contractually agreed to waive Matthews China Dividend Fund's fees and reimburse expenses until at least November 30, 2012 to the extent needed to limit total annual operating expenses to 1.50%.
4 The Advisor has contractually agreed to waive Matthews Asia Small Companies Fund's fees and reimburse expenses until at least April 30, 2012 to the extent needed to limit total annual operating expenses to 2.00%.
Investor Disclosure
Past Performance: All performance quoted in this report is past performance and is no guarantee of future results. Investment return and principal value will fluctuate with changing market conditions so that when redeemed, shares may be worth more or less than their original cost. Current performance may be lower or higher than the returns quoted. If certain of the Funds' fees and expenses had not been waived, returns would have been lower. For the Funds' most recent month-end performance, please call 800.789.ASIA (2742) or visit matthewsasia.com.
Investment Risk: Mutual fund shares are not deposits or obligations of, or guaranteed by, any depositary institution. Shares are not insured by the FDIC, Federal Reserve Board or any government agency and are subject to investment risks, including possible loss of principal amount invested. Investing in international markets may involve additional risks, such as social and political instability, market illiquidity, exchange-rate fluctuations, a high level of volatility and limited regulation. In addition, single-country and sector funds may be subject to a higher degree of market risk than diversified funds because of concentration in a specific industry, sector or geographic location. Investing in small and mid-size companies is more risky than investing in large companies as they may be more volatile and less liquid than larger companies. Please see the Funds' prospectus and Statement of Additional Information for more risk disclosure.
Redemption Fee Policy
The Funds assess a redemption fee of 2.00% on the total redemption proceeds on most sales or exchanges of shares that take place within 90 calendar days after their purchase as part of the Funds' efforts to discourage market timing activity. This fee is payable directly to the Funds. For purposes of determining whether the redemption fee applies, the shares that have been held longest will be redeemed first. The Funds may grant exemptions from the redemption fee in certain circumstances. For more information on this policy, please see the Funds' prospectus.
Cover photo: Huc Bridge, Hanoi, Vietnam
©Eric Brandt
Contents
| Messages to Shareholders | 2 | ||||||
| Manager Commentaries, Fund Characteristics and Schedules of Investments: | |||||||
| ASIA GROWTH AND INCOME STRATEGIES | |||||||
| Matthews Asian Growth and Income Fund | 5 | ||||||
| Matthews Asia Dividend Fund | 10 | ||||||
| Matthews China Dividend Fund | 15 | ||||||
| ASIA GROWTH STRATEGIES | |||||||
| Matthews Asia Pacific Fund | 20 | ||||||
| Matthews Pacific Tiger Fund | 25 | ||||||
| Matthews China Fund | 30 | ||||||
| Matthews India Fund | 35 | ||||||
| Matthews Japan Fund | 40 | ||||||
| Matthews Korea Fund | 45 | ||||||
| ASIA SMALL COMPANY STRATEGY | |||||||
| Matthews Asia Small Companies Fund | 50 | ||||||
| ASIA SPECIALTY STRATEGY | |||||||
| Matthews Asian Technology Fund | 55 | ||||||
| Disclosures and Index Definitions | 59 | ||||||
| Disclosure of Fund Expenses | 60 | ||||||
| Statements of Assets and Liabilities | 62 | ||||||
| Statements of Operations | 64 | ||||||
| Statements of Changes in Net Assets | 66 | ||||||
| Financial Highlights | 72 | ||||||
| Notes to Financial Statements | 83 | ||||||
| Report of Independent Registered Public Accounting Firm | 94 | ||||||
| Tax Information | 95 | ||||||
| Approval of Investment Advisory Agreement | 96 | ||||||
| Trustees and Officers of the Funds | 100 | ||||||
This report has been prepared for Matthews Asia Funds shareholders. It is not authorized for distribution to prospective investors unless accompanied or preceded by a current Matthews Asia Funds prospectus, which contains more complete information about the Funds' investment objectives, risks and expenses. Additional copies of the prospectus may be obtained at matthewsasia.com. Please read the prospectus carefully before you invest or send money.
The views and opinions in this report were current as of December 31, 2009. They are not guarantees of performance or investment results and should not be taken as investment advice. Investment decisions reflect a variety of factors, and the managers reserve the right to change their views about individual stocks, sectors and the markets at any time. As a result, the views expressed should not be relied upon as a forecast of a Fund's future investment intent.
Statements of fact are from sources considered reliable, but neither the Funds nor the Investment Advisor makes any representation or guarantee as to their completeness or accuracy.
Matthews Asia Funds are distributed by:
PFPC Distributors, Inc. | 760 Moore Road | King of Prussia, PA 19406

"Sitting in San Francisco might have made us appear far removed from the maelstrom in Asia's markets, but it gave us perspective."
Message to Shareholders
from the Investment Advisor
Dear Fellow Shareholders,
Many commentators are describing 2009 as a watershed year—one in which global economic leadership shifted decisively from the West to the East. Indeed, the U.S. and European economies appeared to bottom out in the middle of 2009 when GDP fell 3.8% and 5.0% year-on-year, respectively. Meanwhile, Asia recovered sooner than the West, and China and India grew throughout the crisis with year-on-year growth rates falling to approximately 6% in both countries. In political circles, the Group of 20 (G–20) usurped the position of the Group of 8 (G–8) as the prime decision-making body while the world's finance ministers struggled to coordinate global stimulus. Japan had been Asia's sole representative in the G–8, but this change brought China, India, South Korea, Indonesia and Australia into the main forum for global economic policymaking. Some of the commentary has been hyperbole, with editorial writers, book authors and even some foreign leaders announcing the "end of the American Empire." Even now, however, the conventional wisdom is that the U.S. faces many years of slow growth because of its debt-laden consumers, while Asian consumers are just starting to open their wallets.
You could say that markets mirrored the trends in underlying fundamentals—the S&P 500 Index bottomed out in early March 2009, but the MSCI All Country Asia ex Japan Index had already seen its lowest point in late November of the previous year. Asia is now valued at 10% to 15% higher than the U.S. on popular metrics. This can only be justified by higher growth expectations. Equities have rebounded very strongly—more rapidly than many people, myself included, would have imagined. It is hard to see how any part of the world—however "decoupled" some may argue—can truly prosper if North America and Europe (more than half the global economy) are each suffering unemployment rates of about 10%. We may have started 2009 more isolated in our optimism about the strength of Asia's corporate fundamentals and its economies; now there are many more people who agree with our belief and perhaps express it too incautiously . That sort of company is a little disconcerting.
West Coast Offense
I believe that a certain amount of isolation and distance is a good thing for investors. Sitting in San Francisco might have made us appear far removed from the maelstrom in Asia's markets, but it gave us perspective. Local fund managers tend to get caught up in the gossip and rumor that surround their own markets. They seem constantly tempted to trade on sentiment and momentum. At Matthews, we are able—perhaps forced—to take a measured view. We try to resist the temptation of making the "big play" or to wager everything on one big call. During the depths of the recent economic crisis, our analysts and portfolio managers continued their regular research trips to Asia to meet with business leaders, and to form independent views of how events were unfolding. Even as the container ships passed in and out of San Francisco Bay—empty and high in the water—and even as trade was collapsing, the message from businesse s in Asia was that their domestic sales were still growing. I know from my own contacts in Hong Kong that more than a few local fund managers were raising cash to try to prosper from the poor sentiment and avoid market falls. Our approach at Matthews has been to remain fully invested, and whenever possible, to take incremental opportunities to build positions in specific stocks at depressed prices.
This approach was not without controversy. 2009 was a year when markets seemed to diverge widely from fundamentals, as witnessed by large swings in valuations. These divergences gave rise to the criticism that, surely, we are able to see these great dislocations before they happen. Along with the panic in global equity markets, some investors also lost confidence (or perhaps patience)
2 MATTHEWS ASIA FUNDS
with the strategy of being fully invested—to "buy and hold." Some will no doubt argue that Asia's markets are still 25% below their highs of October 2007. Point taken. However, in my mind, "buy and hold" still has at least one thing going for it—we only have to focus on the stock decision and get that one decision right. Trading requires you to get multiple decisions right: when to buy the market, when to sell and then when to buy again. Trading also puts a premium on the liquidity of a company's equity and raises it to a level of importance equal to, if not greater than, the underlying soundness of the company itself. During the past two years or so, the market certainly offered up big opportunities for trading. But as I have noted, the market also whipsawed investors' emotions, and caused them to question their basic assumptions about the future. Once people have their confidence in a market so shaken as to cause the m to abandon it, how many are then able to quickly reinvest when the fear of loss is greatest? How many people invested on the basis that they held a "liquid" asset only to see that liquidity dry up when its financial soundness was called into question? According to some research, many funds that took a more active trading stance were indeed caught with high cash levels or "liquidity" when the markets bounced back. It seems to me almost by definition that many traders must be caught out of the market this way, and miss the recovery.
Markets and Fundamentals—Diverging Again?
As we enter 2010, it is of some concern to me that interest rates remain exceptionally low in the developed world, and that Asia's recovery is underway and indeed interest rates have started to rise. It has occurred three times in Australia and once in China. Sell-side analysts are talking breathlessly of a U.S. dollar-fed "carry trade," a strategy of selling a currency with a relatively low interest rate in order to purchase a different currency yielding a higher interest rate. Analysts also talk of the potential for an emerging market bubble, as if the prime objective of investment is to read policymakers' minds and to try to jump the gun on their decisions. There are fundamental reasons to expect Asia to perform well as its households grow wealthier; we mostly agree with that assessment. Nevertheless, the structural reforms required of Asian economies will take time and some government commitment. Markets are increasingly wil ling to discount a smooth transition to the "new economic order." Are markets starting to diverge from fundamentals again? If so, what should be done with investments?
Valuations are a source of concern, and they enter into our investment process in one of two ways. For some funds, a measure of valuation—more specifically dividend yield—is a crucial first step in the idea generation process. For other funds, the focus on valuation may be relaxed when warranted by the quality of a company's business model and management. But in neither case is valuation a primary reason to sell out of a position completely if we believe in the long-term future of the company. High valuations are, however, reason enough to proceed into the new year with caution. This caution is already starting to influence the stock decisions we are making in the Funds and I hope that it tempers the ardor of those making some of the wilder predictions for markets this year. Nevertheless, we maintain our commitment to being fully invested because, despite our concerns, we have no particular insight as to where the mark ets may be trading a year from now.
We also remain committed to the belief that Asia will enjoy many years of good growth and that the new decade will see a further reshaping of the region's economies. We believe that it should also offer new opportunities to invest in growing companies in both established and emerging industries—Asia's economic landscape will surely look very different 10 years from now. Our old image of Asia—centered on infrastructure, export manufacturing and heavy industry—is gradually being replaced by one in which service industries, including finance, health care, retail and leisure play a bigger role in the economy. Finding and researching those potential opportunities remains the focus of Matthews' investment team. We seek to identify and hold companies that make it through each cycle stronger than they were before, r ather than to invest in stocks primarily on the basis of their liquidity and to try to trade in and out of each cycle.
During the past year, we celebrated the 15-year anniversary of our flagship funds, the Pacific Tiger Fund and the Asian Growth and Income Fund and the 10-year anniversary of the Asian Technology Fund. Along with our China, Japan and Korea Funds, these portfolios have track records in excess of 10 years.
We also celebrated the one-year anniversary of the Asia Small Companies Fund and launched the China Dividend Fund. This new Fund enables us to execute our dividend-focused strategy in a single-country portfolio for the first time. Few people question the importance of using different strategies when investing in the U.S. market—we think this same approach should be applied in Asia.
We thank you for your continued and continuous support during this past year, particularly as it has been an unusually volatile and challenging one. It is more than usually true to say that it is a privilege and an honor to serve as your investment advisor.

Robert J. Horrocks, PhD
Chief Investment Officer
Matthews International Capital Management, LLC
matthewsasia.com | 800.789.ASIA 3
Message to Shareholders
from the Board of Trustees
Dear Shareholders,
I am pleased to inform you that Dean Richard Lyons will be rejoining the Matthews Asia Funds Board of Trustees. Dean Lyons served as a Trustee of the Matthews Asia Funds from the inception of the Fund family in 1994 until 2006, and served as the Funds' independent Chairman for eight of those years. He is currently the Dean of the Haas School of Business at the University of California at Berkeley. Prior to becoming Dean in July 2008, he served as the Chief Learning Officer at Goldman Sachs. Dean Lyons made significant contributions to the Fund family and its development during his previous tenure as Trustee, and I believe the Funds' shareholders will benefit greatly from his return to the Board.
The Board of Trustees appreciates your investment in the Funds and looks forward to its continued work on behalf of the shareholders.
Sincerely,

Geoffrey H. Bobroff
Chairman of the Board of Trustees
Matthews Asia Funds
4 MATTHEWS ASIA FUNDS

ASIA GROWTH AND INCOME STRATEGIES
PORTFOLIO MANAGERS
Andrew Foster
Lead Manager
Robert J. Horrocks, PhD
Co-Manager
FUND FACTS
| Ticker | MACSX | ||||||
| Inception Date | 9/12/94 | ||||||
| Assets | $2.5 billion | ||||||
| NAV | $15.77 | ||||||
| Total # of Positions | 83 | ||||||
Fiscal Year 2009 Ratios
| Portfolio Turnover | 17.51 | %1 | |||||
| Gross Expense Ratio | 1.18 | %2 | |||||
Benchmarks
MSCI AC Asia ex Japan Index
MSCI AC Far East ex Japan Index
Redemption Fee
2% within first 90 calendar days of purchase
OBJECTIVE
Long-term capital appreciation.
The Fund also seeks to provide some current income.
STRATEGY
Under normal market conditions, the Fund seeks to achieve its investment objective by investing at least 80% of its total net assets, which include borrowings for investment purposes, in dividend-paying equity securities and the convertible securities, of any duration or quality, of companies located in Asia.
1 The lesser of fiscal year 2009 long-term purchase costs or sales proceeds divided by the average monthly market value of long-term securities.
2 Matthews Asia Funds does not charge 12b-1 fees.
Matthews Asian Growth and Income Fund
Portfolio Manager Commentary
For the year ending December 31, 2009, the Matthews Asian Growth and Income Fund generated a return of 41.44%, while its benchmark, the MSCI All Country Asia ex Japan Index, rose 72.53%. During the fourth quarter, the Fund gained 4.24%, versus a 6.59% increase in the benchmark. Over the course of the year, each share of the Fund paid approximately 44 cents, or about 3.8% of the Fund's initial share price, in income via semi-annual dividends.
Just as 2008 was a year in which financial markets defied nearly every expectation, so was 2009. The breathless pace at which stocks and other financial assets regained a portion of their nominal value was remarkable. Also remarkable was how quickly economic activity in Asia—particularly in China—resumed an expansionary path.
For some market observers, the surprise of the year was that the Chinese economy did not collapse amid a Western recession. Earnings growth seems to again be underway in Asia. However, while fundamental conditions have improved, they have been eclipsed by a sharp increase in stock prices. Yields on Asian fixed-income markets are near historic lows, and equity prices are not far from record highs, leaving a reduced margin for error. Looking forward, relatively high valuations may pose a challenge to the continued outperformance of Asian equity markets.
The Fund's strategy has been sorely tested over the past two years. Historically, the Fund has made use of U.S. dollar-denominated convertible bonds to achieve a degree of capital protection when conditions were adverse for equities. However, dollar credit markets were at the epicenter of the financial collapse in late 2008; consequently dollar-denominated convertibles in Asia offered no safe haven. As markets rallied violently in the first half of 2009, the Fund's risk-averse strategy meant that the stocks it favored—those of established, mature companies capable of sustained dividend payments—were not central beneficiaries of the market's recovery. Instead, premiums were assigned to the stocks of riskier businesses, small companies and deeply cyclical industries. Amid such conditions, the Fund's recent performance was largely in line with our expectations, with some notable disappointments in Japan.
Some of the Fund's largest gains in 2009 resulted from portfolio shifts undertaken at the outset of the year. One critical decision was to place greater weight on the technology sector, especially on companies in the computer and semiconductor industries. A year ago, such companies suffered from severely depressed valuations despite stable financial positions and relatively attractive growth prospects. Ironically, while the market perceived many of these companies to be financially weak, few had much debt. With strong balance sheets and reasonably stable cash flows, some semiconductor and computer-related firms have become substantial payers of dividends. Ultimately, two such companies made the largest contribution to the Fund's performance: ASM Pacific Technology, one of the world's largest manufacturers of assembly and packaging equipment for semiconductors, and VTech Holdings, a leading maker of cordless phones, as well as ed ucational electronics and video games.
The Fund also benefited from a shift toward industrial conglomerates, particularly those with underlying exposure to energy and agricultural products. Historically, the Fund has eschewed direct investment in such businesses as their sharp cyclicality makes it difficult to value or to assess the quality of their management. However, at the beginning of 2009, we recognized a number of industrials that had seen precipitous declines in their share prices. Their common denominator was indirect or diversified exposure to energy and commodities. This was attractive, as the diversified nature of these companies could yield consistency in cash flow, thereby shielding the portfolio from the worst aspects of the commodity
(continued)
matthewsasia.com | 800.789.ASIA 5
PERFORMANCE AS OF DECEMBER 31, 2009
| Average Annual Total Returns | |||||||||||||||||||||||||||
| 3 Months | 1 Year | 3 Years | 5 Years | 10 Years | Inception 9/12/94 | ||||||||||||||||||||||
| Matthews Asian Growth and Income Fund | 4.24 | % | 41.44 | % | 5.31 | % | 10.77 | % | 13.76 | % | 11.18 | % | |||||||||||||||
| MSCI AC Asia ex Japan Index3 | 6.59 | % | 72.53 | % | 5.02 | % | 13.79 | % | 6.55 | % | 3.62 | %4 | |||||||||||||||
| MSCI AC Far East ex Japan3 | 6.46 | % | 69.39 | % | 4.79 | % | 13.13 | % | 5.92 | % | 3.25 | %4 | |||||||||||||||
| Lipper Pacific ex Japan Funds Category Average5 | 6.49 | % | 71.34 | % | 4.72 | % | 13.05 | % | 7.53 | % | 5.22 | %4 | |||||||||||||||
Performance assumes reinvestment of all dividends and/or distributions before taxes. All performance quoted represents past performance and is no guarantee of future results. Investment return and principal value will fluctuate with market conditions so that when redeemed, shares may be worth more or less than their original cost. Current performance may be lower or higher than the return figures quoted. Returns would have been lower if certain of the Fund's fees and expenses had not been waived. For the Fund's most recent month-end performance visit matthewsasia.com.
INCOME DISTRIBUTION HISTORY
| June | December | Total | |||||||||||||
| 2009 | $ | 0.22 | $ | 0.22 | $ | 0.44 | |||||||||
| 2008 | $ | 0.25 | $ | 0.17 | $ | 0.42 | |||||||||
| 2007 | $ | 0.22 | $ | 0.69 | $ | 0.90 | |||||||||
| 1994–2006 | $ | 2.10 | $ | 2.47 | $ | 4.57 | |||||||||
Note: This table does not include capital gains distributions.
30-DAY YIELD: 1.61%
The 30-Day Yield represents net investment income earned by the Fund over the 30-day period ended 12/31/09, expressed as an annual percentage rate based on the Fund's share price at the end of the 30-day period. The 30-Day Yield should be regarded as an estimate of the Fund's rate of investment income, and it may not equal the Fund's actual income distribution rate.
Source: PNC Global Investment Servicing (U.S.) Inc.
DIVIDEND YIELD: 3.63%
The dividend yield (trailing) for the portfolio is the weighted average sum of the dividend paid per share during the last 12 months divided by the current price. The annualized dividend yield for the Fund is for the equity-only portion of the portfolio. Please note that this is based on gross portfolio holdings and does not reflect the actual yield an investor in the Fund would receive. Past yields are no guarantee of future yields.
Source: FactSet Research Systems
GROWTH OF A $10,000 INVESTMENT SINCE INCEPTION
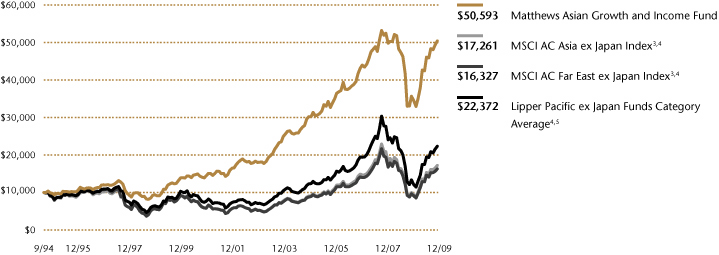
Plotted monthly. The performance data and graph do not reflect the deduction of taxes that a shareholder would pay on dividends, capital gain distributions or redemption of Fund shares. Values are in US$.
3 It is not possible to invest directly in an index. Source: Index data from Morgan Stanley Capital Management; total return calculations performed by PNC Global Investment Servicing (U.S.) Inc. Please see page 59 for index definitions.
4 Calculated from 8/31/94.
5 The Lipper Category Average does not reflect sales charges and is based on total return, including reinvestment of dividends and capital gains for the stated periods.
TOP TEN HOLDINGS6
| Security Type | Country | % of Net Assets | |||||||||||||
| Hongkong Land CB 2005, Ltd., Cnv., 2.750%, 12/21/12 | Convertible Bond | China/Hong Kong | 2.7 | % | |||||||||||
| Taiwan Semiconductor Manufacturing Co., Ltd. | Equity | Taiwan | 2.5 | % | |||||||||||
| CLP Holdings, Ltd. | Equity | China/Hong Kong | 2.5 | % | |||||||||||
| HSBC Holdings PLC | Equity | United Kingdom | 2.3 | % | |||||||||||
| Ascendas REIT | Equity | Singapore | 2.2 | % | |||||||||||
| Keppel Corp., Ltd. | Equity | Singapore | 2.1 | % | |||||||||||
| Rafflesia Capital, Ltd., Cnv., 1.250%, 10/04/11 | Convertible Bond | Malaysia | 2.0 | % | |||||||||||
| Hang Seng Bank, Ltd. | Equity | China/Hong Kong | 2.0 | % | |||||||||||
| Singapore Technologies Engineering, Ltd. | Equity | Singapore | 2.0 | % | |||||||||||
| China Petroleum & Chemical Corp. (Sinopec), Cnv., 0.000%, 04/24/14 | Convertible Bond | China/Hong Kong | 2.0 | % | |||||||||||
| % OF ASSETS IN TOP TEN | 22.3 | % | |||||||||||||
6 Holdings may combine more than one security from same issuer and related depositary receipts.
6 MATTHEWS ASIA FUNDS
Matthews Asian Growth and Income Fund
Portfolio Manager Commentary (continued)
cycle. We added a few such positions, notably Singapore's Keppel Corporation, one of the largest offshore oil rig builders in the world. We were attracted to Keppel for its secure balance sheet, with cash reserves and a manageable level of debt; and for its diversified operating structure that offered exposure to property and infrastructure projects alongside the oil industry. Keppel is also one of the largest dividend-paying companies in Singapore, paying out approximately US$385 million in dividends during 2008 (the firm has not yet declared final dividends for the 2009 financial period).
Other positions, such as convertible bonds, contributed mixed results to Fund performance. Some of the Fund's positions performed in line with our expectations, gaining as credit markets stabilized and as their underlying conversion values rose. However, some of the convertibles issued by small and mid-size companies were hampered by continued distress in credit markets. Capital markets were not disposed toward issuance in the first half of the year; and thus, smaller companies faced some challenges when attempting to refinance their balance sheets. However, issuance has recently resumed in earnest and will hopefully lead to healthier future supply and valuations in convertibles.
The greatest detractor to performance arose from the Fund's exposure to the Japanese market. At the beginning of the year, the Fund held two positions in large-capitalization Japanese real estate investment trusts (J-REITs)—Japan's large-cap REITS underperformed small-cap REITS in 2009. It also held a position in one of Asia's largest software companies by market capitalization, Trend Micro. Over the course of the year, the Fund added three other positions in sectors spanning pharmaceuticals, technology and industrial equipment. Collectively, these investments have done little to promote the Fund's performance and have cost us the opportunity to invest elsewhere in Asia.
The Fund's roughly 10% weighting to Japan is at a historic high. We strongly believe that value in select Japanese companies—especially mid-size industrials and technology companies—is compelling. Admittedly, Japan may lack an obvious catalyst to spur broad-based market performance. Nevertheless, as the country's stock market has stagnated over the past two decades, investors have overlooked a number of companies. Most of these firms are global leaders in a given technology or marketplace, and most also enjoy substantial operating leverage should an economic recovery ensue. A few have taken to paying dividends, with some growth visible over time. Though such companies are worthy of strong consideration, we, nevertheless, do not intend to actively increase the Fund's weighting in Japan as we believe this to already be a substantial allocation.
As we look forward, a number of risks present themselves for the year ahead. As mentioned previously, relatively rich valuations may prove an impediment to continued gains. If inflation in the region does resurface, we believe that it will have a pronounced effect on staples, food and subsidized forms of energy. The Fund has sought some exposure to this possibility via its positions in agricultural and soft-commodity companies. A third risk may arise from the increased propensity for trade tensions, which may likely be directed toward China and its currency policies. If tensions escalate, stock markets may be shaken.
However, ahead of all these risks is the Fund's greatest challenge: to continue to refashion and adapt its strategy in light of the region's ever-evolving markets. Despite its caution, the Fund has always pursued growth; and indeed, there are new growth industries emerging in Asia, especially in health sciences, software and financial services. Thus, the Fund's mission for the next decade is the same as the last: to retain its conservative philosophy and approach, yet probe emerging pockets of growth, investing in areas not well represented in benchmark indices or widely present in investors' portfolios.
COUNTRY ALLOCATION (%)7
| China/Hong Kong | 32.0 | ||||||
| Singapore | 15.5 | ||||||
| Japan | 10.0 | ||||||
| South Korea | 9.0 | ||||||
| India | 8.3 | ||||||
| Taiwan | 6.1 | ||||||
| Malaysia | 5.1 | ||||||
| Thailand | 2.6 | ||||||
| United Kingdom | 2.3 | ||||||
| Indonesia | 2.3 | ||||||
| Australia | 1.8 | ||||||
| Philippines | 1.3 | ||||||
| Vietnam | 0.9 | ||||||
| Cash and Other Assets, Less Liabilities | 2.8 | ||||||
SECTOR ALLOCATION (%)
| Financials | 27.9 | ||||||
| Industrials | 15.3 | ||||||
| Information Technology | 13.0 | ||||||
| Telecommunication Services | 12.4 | ||||||
| Consumer Discretionary | 8.7 | ||||||
| Consumer Staples | 5.9 | ||||||
| Utilities | 5.0 | ||||||
| Health Care | 4.8 | ||||||
| Energy | 2.0 | ||||||
| Non Classified | 1.5 | ||||||
| Materials | 0.7 | ||||||
| Cash and Other Assets, Less Liabilities | 2.8 | ||||||
MARKET CAP EXPOSURE (%)8
| Large Cap (Over $5B) | 51.7 | ||||||
| Mid Cap ($1B-$5B) | 31.4 | ||||||
| Small Cap (Under $1B) | 12.6 | ||||||
| Non-Classified | 1.5 | ||||||
| Cash and Other Assets, Less Liabilities | 2.8 | ||||||
BREAKDOWN BY SECURITY TYPE (%)
| Common Equities | 64.6 | ||||||
| Convertible Bonds9 | 26.4 | ||||||
| Preferred Equities | 3.1 | ||||||
| Government Bonds | 1.5 | ||||||
| Corporate Bonds | 1.4 | ||||||
| Warrants | 0.2 | ||||||
| Cash and Other Assets, Less Liabilities | 2.8 | ||||||
7 Australia, United Kingdom and Japan are not included in the MSCI All Country Asia ex Japan Index.
8 Source: FactSet Research Systems. Percentage values in data are rounded to the nearest tenth of one percent; the values may not sum to 100% due to rounding.
9 Convertible bonds are not included in the MSCI All Country Asia ex Japan Index.
matthewsasia.com | 800.789.ASIA 7
Matthews Asian Growth and Income Fund December 31, 2009
Schedule of Investmentsa
COMMON EQUITIES: 64.6%
| Shares | Value | ||||||||||
| CHINA/HONG KONG: 22.0% | |||||||||||
| CLP Holdings, Ltd. | 9,410,200 | $ | 63,684,163 | ||||||||
| Hang Seng Bank, Ltd. | 3,490,100 | 51,346,297 | |||||||||
| Hang Lung Properties, Ltd. | 12,688,920 | 49,745,023 | |||||||||
| Shandong Weigao Group Medical Polymer Co., Ltd. H Shares | 13,664,000 | 45,538,296 | |||||||||
| Television Broadcasts, Ltd. | 8,747,000 | 42,024,080 | |||||||||
| China Mobile, Ltd. ADR | 818,500 | 38,002,955 | |||||||||
| Vitasoy International Holdings, Ltd.† | 51,297,000 | 35,815,626 | |||||||||
| VTech Holdings, Ltd. | 3,732,300 | 35,598,115 | |||||||||
| ASM Pacific Technology, Ltd. | 3,445,300 | 32,574,137 | |||||||||
| Hang Lung Group, Ltd. | 4,683,000 | 23,159,870 | |||||||||
| HongKong Electric Holdings, Ltd. | 4,122,500 | 22,456,399 | |||||||||
| Inspur International, Ltd. | 150,205,000 | 21,353,601 | |||||||||
| China Pacific Insurance Group Co., Ltd. H Sharesb | 4,926,600 | 19,634,217 | |||||||||
| Hong Kong & China Gas Co., Ltd. | 7,721,490 | 19,366,666 | |||||||||
| I-CABLE Communications, Ltd.b† | 128,079,000 | 18,768,537 | |||||||||
| Bank of Communications Co., Ltd. H Shares | 14,192,000 | 16,322,702 | |||||||||
| Café de Coral Holdings, Ltd. | 7,137,100 | 16,300,050 | |||||||||
| China Green Holdings, Ltd. | 8,877,000 | 8,406,370 | |||||||||
| Total China/Hong Kong | 560,097,104 | ||||||||||
| SINGAPORE: 11.6% | |||||||||||
| Ascendas REIT | 35,913,000 | 56,376,112 | |||||||||
| Keppel Corp., Ltd. | 8,992,000 | 52,379,634 | |||||||||
| Singapore Technologies Engineering, Ltd. | 22,119,000 | 50,908,496 | |||||||||
| Parkway Holdings, Ltd.b | 13,793,093 | 28,506,269 | |||||||||
| Hong Leong Finance, Ltd. | 12,354,000 | 27,694,584 | |||||||||
| Fraser and Neave, Ltd. | 8,556,100 | 25,433,478 | |||||||||
| Cerebos Pacific, Ltd. | 7,740,000 | 23,436,881 | |||||||||
| Singapore Post, Ltd. | 29,847,000 | 21,393,639 | |||||||||
| Parkway Life REIT | 10,233,110 | 8,845,563 | |||||||||
| Total Singapore | 294,974,656 | ||||||||||
| JAPAN: 10.0% | |||||||||||
| Hisamitsu Pharmaceutical Co., Inc. | 1,472,000 | 47,538,682 | |||||||||
| Japan Real Estate Investment Corp., REIT | 6,318 | 46,575,088 | |||||||||
| Nippon Building Fund, Inc., REIT | 6,038 | 45,889,651 | |||||||||
| Hamamatsu Photonics, K.K. | 1,660,400 | 40,445,772 | |||||||||
| Trend Micro, Inc. | 1,021,000 | 38,781,905 | |||||||||
| Nintendo Co., Ltd. | 147,500 | 35,228,461 | |||||||||
| Total Japan | 254,459,559 | ||||||||||
| TAIWAN: 6.1% | |||||||||||
| Taiwan Semiconductor Manufacturing Co., Ltd. | 19,179,187 | 38,655,162 | |||||||||
| Cathay Financial Holding Co., Ltd.b | 20,412,240 | 38,002,740 | |||||||||
| Chunghwa Telecom Co., Ltd. ADR | 1,674,848 | 31,101,927 | |||||||||
| Taiwan Semiconductor Manufacturing Co., Ltd. ADR | 2,210,624 | 25,289,539 | |||||||||
| CyberLink Corp. | 5,464,938 | 23,299,981 | |||||||||
| Total Taiwan | 156,349,349 | ||||||||||
| Shares | Value | ||||||||||
| SOUTH KOREA: 5.2% | |||||||||||
| S1 Corp. | 817,555 | $ | 33,986,571 | ||||||||
| GS Home Shopping, Inc.† | 388,299 | 28,572,175 | |||||||||
| SK Telecom Co., Ltd. ADR | 1,522,933 | 24,762,891 | |||||||||
| Hana Financial Group, Inc. | 720,489 | 20,364,124 | |||||||||
| SK Telecom Co., Ltd. | 123,215 | 17,985,344 | |||||||||
| Daehan City Gas Co., Ltd. | 325,300 | 7,805,468 | |||||||||
| Total South Korea | 133,476,573 | ||||||||||
| THAILAND: 2.6% | |||||||||||
| Advanced Info Service Public Co., Ltd. | 13,488,300 | 34,995,434 | |||||||||
| BEC World Public Co., Ltd. | 37,652,500 | 27,811,407 | |||||||||
| Thai Reinsurance Public Co., Ltd. NVDR | 25,672,800 | 3,925,919 | |||||||||
| Total Thailand | 66,732,760 | ||||||||||
| UNITED KINGDOM: 2.3% | |||||||||||
| HSBC Holdings PLC ADR | 1,046,733 | 59,757,987 | |||||||||
| Total United Kingdom | 59,757,987 | ||||||||||
| AUSTRALIA: 1.8% | |||||||||||
| AXA Asia Pacific Holdings, Ltd. | 7,821,742 | 45,733,160 | |||||||||
| Total Australia | 45,733,160 | ||||||||||
| INDONESIA: 1.6% | |||||||||||
| PT Telekomunikasi Indonesia ADR | 1,003,200 | 40,077,840 | |||||||||
| Total Indonesia | 40,077,840 | ||||||||||
| PHILIPPINES: 1.3% | |||||||||||
| Globe Telecom, Inc. | 1,631,960 | 32,094,600 | |||||||||
| Total Philippines | 32,094,600 | ||||||||||
| VIETNAM: 0.1% | |||||||||||
| Baoviet Holdingsb | 2,206,620 | 3,161,851 | |||||||||
| Total Vietnam | 3,161,851 | ||||||||||
| TOTAL COMMON EQUITIES | 1,646,915,439 | ||||||||||
| (Cost $1,381,470,159) | |||||||||||
PREFERRED EQUITIES: 3.1%
| SOUTH KOREA: 3.1% | |||||||||||
| Samsung Fire & Marine Insurance Co., Ltd., Pfd. | 405,331 | 31,840,260 | |||||||||
| Hyundai Motor Co., Ltd., Pfd. | 566,280 | 20,336,174 | |||||||||
| LG Household & Health Care, Ltd., Pfd. | 210,290 | 14,732,989 | |||||||||
| Hyundai Motor Co., Ltd., 2nd Pfd. | 305,760 | 11,226,322 | |||||||||
| Total South Korea | 78,135,745 | ||||||||||
| TOTAL PREFERRED EQUITIES | 78,135,745 | ||||||||||
| (Cost $41,572,790) | |||||||||||
8 MATTHEWS ASIA FUNDS
Matthews Asian Growth and Income Fund December 31, 2009
Schedule of Investmentsa (continued)
WARRANTS: 0.2%
| Shares | Value | ||||||||||
| INDIA: 0.2% | |||||||||||
| Housing Development Finance Corp., expires 08/23/12 | 669,700 | $ | 6,040,036 | ||||||||
| Total India | 6,040,036 | ||||||||||
| TOTAL WARRANTS | 6,040,036 | ||||||||||
| (Cost $5,995,564) | |||||||||||
INTERNATIONAL BONDS: 29.3%
| Face Amount | |||||||||||
| CHINA/HONG KONG: 10.0% | |||||||||||
| Hongkong Land CB 2005, Ltd., Cnv. 2.750%, 12/21/2012 | $ | 50,700,000 | 68,254,875 | ||||||||
| China Petroleum & Chemical Corp. (Sinopec), Cnv. 0.000%, 04/24/2014 | HKD | 355,580,000 | 50,688,059 | ||||||||
| China High Speed Transmission Equipment Group Co., Ltd., Cnv. 0.000%, 05/14/2011 | CNY | 215,800,000 | 37,686,766 | ||||||||
| Yue Yuen Industrial Holdings, Ltd., Cnv. 0.000%, 11/17/2011 | CNY | 246,300,000 | 35,459,589 | ||||||||
| Power Regal Group, Ltd., Cnv. 2.250%, 06/02/2014 | HKD | 160,400,000 | 28,983,465 | ||||||||
| PB Issuer, Ltd., Cnv. 3.300%, 02/01/2013 | 19,750,000 | 18,885,937 | |||||||||
| China Green Holdings, Ltd., Cnv. 0.000%, 10/29/2010 | CNY | 115,000,000 | 16,255,310 | ||||||||
| Total China/Hong Kong | 256,214,001 | ||||||||||
| INDIA: 8.1% | |||||||||||
| Reliance Communications, Ltd., Cnv. 0.000%, 05/10/2011 | 35,915,000 | 40,494,162 | |||||||||
| Housing Development Finance Corp. 0.000%, 08/24/2012 | INR | 1,650,000,000 | 36,506,715 | ||||||||
| Tata Motors, Ltd., Cnv. 1.000%, 04/27/2011 | 25,149,000 | 29,267,149 | |||||||||
| Sintex Industries, Ltd., Cnv. 0.000%, 03/13/2013 | 27,400,000 | 24,112,000 | |||||||||
| Larsen & Toubro, Ltd., Cnv. 3.500%, 10/22/2014 | 20,300,000 | 23,548,000 | |||||||||
| Financial Technologies India, Ltd., Cnv. 0.000%, 12/21/2011 | 19,314,000 | 22,790,520 | |||||||||
| Rolta India, Ltd., Cnv. 0.000%, 06/29/2012 | 17,931,000 | 18,110,310 | |||||||||
| Housing Development Finance Corp., Cnv. 0.000%, 09/27/2010 | 6,400,000 | 11,376,000 | |||||||||
| Total India | 206,204,856 | ||||||||||
| MALAYSIA: 5.1% | |||||||||||
| Rafflesia Capital, Ltd., Cnv. 1.250%c, 10/04/2011 | 44,200,000 | 51,935,000 | |||||||||
| Cherating Capital, Ltd., Cnv. 2.000%c, 07/05/2012 | 38,000,000 | 41,562,500 | |||||||||
| Paka Capital, Ltd., Cnv. 0.000%, 03/12/2013 | 21,300,000 | 21,699,375 | |||||||||
| YTL Power Finance Cayman, Ltd., Cnv. 0.000%, 05/09/2010 | 11,000,000 | 13,722,500 | |||||||||
| Total Malaysia | 128,919,375 | ||||||||||
| Face Amount | Value | ||||||||||
| SINGAPORE: 3.9% | |||||||||||
| Wilmar International, Ltd., Cnv. 0.000%, 12/18/2012 | $ | 35,400,000 | $ | 45,931,500 | |||||||
| CapitaLand, Ltd., Cnv. 3.125%, 03/05/2018 | SGD | 57,000,000 | 40,218,707 | ||||||||
| Olam International, Ltd., Cnv. 6.000%, 10/15/2016 | 6,700,000 | 7,281,225 | |||||||||
| ST Treasury Services, Ltd., Cnv. 1.560%, 10/23/2010 | SGD | 6,250,000 | 5,107,974 | ||||||||
| Total Singapore | 98,539,406 | ||||||||||
| VIETNAM: 0.8% | |||||||||||
| Socialist Republic of Vietnam 6.875%, 01/15/2016 | 19,411,000 | 20,090,385 | |||||||||
| Total Vietnam | 20,090,385 | ||||||||||
| INDONESIA: 0.7% | |||||||||||
| Republic of Indonesia 10.375%, 05/04/2014 | 14,700,000 | 18,301,500 | |||||||||
| Total Indonesia | 18,301,500 | ||||||||||
| SOUTH KOREA: 0.7% | |||||||||||
| POSCO 8.750%, 03/26/2014 | 14,500,000 | 17,125,660 | |||||||||
| Total South Korea | 17,125,660 | ||||||||||
| TOTAL INTERNATIONAL BONDS | 745,395,183 | ||||||||||
| (Cost $702,424,730) | |||||||||||
| TOTAL INVESTMENTS: 97.2% | 2,476,486,403 | ||||||||||
| (Cost $2,131,463,243d) | |||||||||||
| CASH AND OTHER ASSETS, LESS LIABILITIES: 2.8% | 70,924,567 | ||||||||||
| NET ASSETS: 100.0% | $ | 2,547,410,970 | |||||||||
a Certain securities were fair valued under the discretion of the Board of Trustees (Note 1-A).
b Non-income producing security.
c Variable rate security. The rate represents the rate in effect at December 31, 2009.
d Cost for Federal income tax purposes is $2,145,949,524 and net unrealized appreciation consists of:
| Gross unrealized appreciation | $ | 396,656,544 | |||||
| Gross unrealized depreciation | (66,119,665 | ) | |||||
| Net unrealized appreciation | $ | 330,536,879 | |||||
† Affiliated Issuer, as defined under the Investment Company Act of 1940 (ownership of 5% or more of the outstanding voting securities of this issuer). (Note 4)
ADR American Depositary Receipt
CNY Chinese Renminbi (Yuan)
HKD Hong Kong Dollar
INR Indian Rupee
Cnv. Convertible
NVDR Non-voting Depositary Receipt
Pfd. Preferred
REIT Real Estate Investment Trust
SGD Singapore Dollar
See accompanying notes to financial statements.
matthewsasia.com | 800.789.ASIA 9

ASIA GROWTH AND INCOME STRATEGIES
PORTFOLIO MANAGERS
Jesper O. Madsen, CFA
Lead Manager
Andrew Foster
Co-Manager
FUND FACTS
| Ticker | MAPIX | ||||||
| Inception Date | 10/31/06 | ||||||
| Assets | $322.0 million | ||||||
| NAV | $12.06 | ||||||
| Total # of Positions | 63 | ||||||
Fiscal Year 2009 Ratios
| Portfolio Turnover | 32.41 | %1 | |||||
| Gross Expense Ratio | 1.28 | % | |||||
| After Fee Waiver, Reimbursement and Recoupment | 1.30 | %2 | |||||
Benchmark
MSCI AC Asia Pacific Index
Redemption Fee
2% within first 90 calendar days of purchase
OBJECTIVE
Total return with an emphasis on providing current income.
STRATEGY
Under normal market conditions, the Fund seeks to achieve its investment objective by investing at least 80% of its total net assets, which include borrowings for investment purposes, in income-paying equity securities of companies located in the Asia Pacific region.
1 The lesser of fiscal year 2009 long-term purchase costs or sales proceeds divided by the average monthly market value of long-term securities.
2 The Advisor has contractually agreed to waive certain fees and reimburse certain expenses for Matthews Asia Dividend Fund. Please see page 89 for additional information. Matthews Asia Funds does not charge 12b-1 fees.
Matthews Asia Dividend Fund
Portfolio Manager Commentary
For the year ending December 31, 2009, the Matthews Asia Dividend Fund gained 47.59%, outperforming its benchmark, the MSCI All Country (AC) Asia Pacific Index, which rose 37.86%. For the fourth quarter, the Fund rose 7.53%, while the benchmark gained 2.31%. The Fund began 2009 with a share price of $8.61, and shareholders who were invested throughout the year would have received income distributions totaling approximately 55 cents, or 6.3%, of the initial share price. To better reflect our investment strategy, the Fund's name was changed from Matthews Asia Pacific Equity Income Fund to Matthews Asia Dividend Fund on November 30, 2009.
The outperformance of the Matthews Asia Dividend Fund relative to its benchmark during 2009 was a testament to the importance of staying flexible in the execution of an investment strategy. The Fund employs a stock selection process that seeks to identify and invest in companies that offer a combination of attractive dividend yields and the potential for dividend growth. While this investment philosophy remains unchanged, its implementation in the portfolio will adapt to the opportunities present in the equity markets.
The Fund's positive performance in 2009 was, in large part, derived from its holdings in China and Hong Kong, and its significant allocation to small and mid-capitalization companies. At the end of the first quarter, 63% of the portfolio was invested in companies with a market capitalization of less than US$5 billion, while the Fund's weighting in China increased from 1.1% in June of 2008 to 9.0%. As share prices were sharply lower in China in the fourth quarter of 2008 and the first quarter of 2009, investors were presented with attractive dividend yields on shares of companies that offered both the potential for long-term earnings growth and the relative safety of healthy balance sheets. The Fund's increased allocation to faster-growing Chinese stocks and smaller companies was an effort to upgrade its dividend growth profile at attractive valuations. These companies had previously traded at lofty valuations that did not match the yield criteria of the Fund's investment strategy. However, in evaluating investments, the Fund weighs current yield against the potential growth in dividends. While current yield is an important component of total return, it is the growth in dividends that, over time, will tend to underpin capital appreciation.
The Fund's main contributor to performance for 2009 was Minth Group, a smaller-capitalization Chinese company. The company manufactures and supplies trims and decorative auto parts to the Chinese subsidiaries of international automobile manufacturers from the U.S., Japan and Europe. Large customers, such as major auto makers tend to demand lower prices, often resulting in lower margins for suppliers such as Minth. However, Minth's products make up only a small part of the total manufacturing cost of a car, and the company has faced fewer pricing pressures, enabling it to enjoy net profit margins in excess of 20%. The Fund's investment in Minth gave it exposure to the fast-growing Chinese passenger car market—the largest in the world in 2009, with 10.3 million passenger cars sold. Since Minth supplies to several car manufacturers it is less reliant on a single product, thereby lowering the product risk and increasing the pre dictability of cash flows. The company has more cash than debt on the balance sheet, giving it flexibility to weather short-term headwinds, and allowing for the continuation of dividend payments and capital investments for future growth. Our on-site meetings with management near Shanghai, and our research into the firm's historical financial data, convinced us that the company had the capacity
(continued)
10 MATTHEWS ASIA FUNDS
PERFORMANCE AS OF DECEMBER 31, 2009
| Average Annual Total Returns | |||||||||||||||||||
| 3 Months | 1 Year | 3 Year | Inception 10/31/06 | ||||||||||||||||
| Matthews Asia Dividend Fund | 7.53 | % | 47.59 | % | 8.86 | % | 11.00 | % | |||||||||||
| MSCI AC Asia Pacific Index3 | 2.31 | % | 37.86 | % | -2.65 | % | -0.56 | % | |||||||||||
| Lipper Pacific Region Funds Category Average4 | 3.84 | % | 38.40 | % | -3.49 | % | -0.97 | % | |||||||||||
Performance assumes reinvestment of all dividends and/or distributions before taxes. All performance quoted represents past performance and is no guarantee of future results. Investment return and principal value will fluctuate with market conditions so that when redeemed, shares may be worth more or less than their original cost. Current performance may be lower or higher than the return figures quoted. Returns would have been lower if certain of the Fund's fees and expenses had not been waived. For the Fund's most recent month-end performance visit matthewsasia.com.
INCOME DISTRIBUTION HISTORY
| Q1 | Q2 | Q3 | Q4 | Total | |||||||||||||||||||
| 2009 | $ | 0.10 | $ | 0.14 | $ | 0.13 | $ | 0.18 | $ | 0.55 | |||||||||||||
| 2008 | $ | 0.06 | $ | 0.08 | $ | 0.11 | $ | 0.06 | $ | 0.30 | |||||||||||||
| 2007 | — | $ | 0.10 | — | $ | 0.17 | $ | 0.27 | |||||||||||||||
| 2006 (Fund inception: 10/31/06) | — | — | — | $ | 0.02 | $ | 0.02 | ||||||||||||||||
Note: This table does not include capital gains distributions. In March 2008, the Fund began to distribute investment income dividends on a quarterly rather than semi-annual basis. For additional details regarding Fund distributions, visit matthewsasia.com.
30-DAY YIELD: 1.95%
The 30-Day Yield represents net investment income earned by the Fund over the 30-day period ended 12/31/09, expressed as an annual percentage rate based on the Fund's share price at the end of the 30-day period. The 30-Day Yield should be regarded as an estimate of the Fund's rate of investment income, and it may not equal the Fund's actual income distribution rate.
Source: PNC Global Investment Servicing (U.S.) Inc.
DIVIDEND YIELD: 3.78%
The dividend yield (trailing) for the portfolio is the weighted average sum of the dividend paid per share during the last 12 months divided by the current price. The annualized dividend yield for the Fund is for the equity-only portion of the portfolio. Please note that this is based on gross portfolio holdings and does not reflect the actual yield an investor in the Fund would receive. Past yields are no guarantee of future yields.
Source: FactSet Research Systems.
GROWTH OF A $10,000 INVESTMENT SINCE INCEPTION
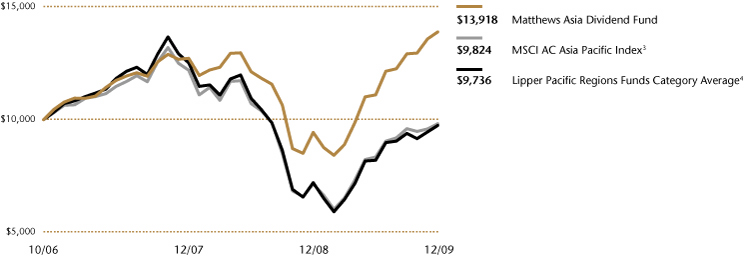
Plotted monthly. The performance data and graph do not reflect the deduction of taxes that a shareholder would pay on dividends, capital gain distributions or redemption of Fund shares. Values are in US$.
3 It is not possible to invest directly in an index. Source: Index data from Morgan Stanley Capital Management; total return calculations performed by PNC Global Investment Servicing (U.S.) Inc. Please see page 59 for index definition.
4 The Lipper Category Average does not reflect sales charges and is based on total return, including reinvestment of dividends and capital gains for the stated periods.
TOP TEN HOLDINGS5
| Country | % of Net Assets | ||||||||||
| SK Telecom Co., Ltd. | South Korea | 3.1 | % | ||||||||
| China Mobile, Ltd. | China/Hong Kong | 3.1 | % | ||||||||
| Chunghwa Telecom Co., Ltd. | Taiwan | 3.0 | % | ||||||||
| Globe Telecom, Inc. | Philippines | 2.9 | % | ||||||||
| PT Telekomunikasi Indonesia | Indonesia | 2.7 | % | ||||||||
| Cheung Kong Infrastructure Holdings, Ltd. | China/Hong Kong | 2.5 | % | ||||||||
| HSBC Holdings PLC | United Kingdom | 2.4 | % | ||||||||
| Monex Group, Inc. | Japan | 2.3 | % | ||||||||
| Esprit Holdings, Ltd. | China/Hong Kong | 2.3 | % | ||||||||
| Minth Group, Ltd. | China/Hong Kong | 2.2 | % | ||||||||
| % OF ASSETS IN TOP TEN | 26.5 | % | |||||||||
5 Holdings may combine more than one security from same issuer and related depositary receipts.
matthewsasia.com | 800.789.ASIA 11
COUNTRY ALLOCATION (%)6
| China/Hong Kong | 25.2 | ||||||
| Japan | 20.4 | ||||||
| Taiwan | 10.4 | ||||||
| South Korea | 8.5 | ||||||
| Thailand | 7.6 | ||||||
| Singapore | 6.2 | ||||||
| Indonesia | 4.7 | ||||||
| Malaysia | 4.5 | ||||||
| Australia | 3.3 | ||||||
| Philippines | 2.9 | ||||||
| United Kingdom | 2.4 | ||||||
| Cash and Other Assets, Less Liabilities | 3.9 | ||||||
SECTOR ALLOCATION (%)
| Consumer Discretionary | 19.8 | ||||||
| Financials | 14.9 | ||||||
| Telecommunication Services | 14.8 | ||||||
| Information Technology | 13.1 | ||||||
| Consumer Staples | 12.0 | ||||||
| Health Care | 7.7 | ||||||
| Utilities | 7.1 | ||||||
| Industrials | 5.0 | ||||||
| Energy | 1.7 | ||||||
| Cash and Other Assets, Less Liabilities | 3.9 | ||||||
MARKET CAP EXPOSURE (%)7
| Large Cap (Over $5B) | 37.8 | ||||||
| Mid Cap ($1B-$5B) | 34.3 | ||||||
| Small Cap (Under $1B) | 24.0 | ||||||
| Cash and Other Assets, Less Liabilities | 3.9 | ||||||
6 The United Kingdom is not included in the MSCI All Country Asia Pacific Index.
7 Source: FactSet Research Systems. Percentage values in data are rounded to the nearest tenth of one percent; the values may not sum to 100% due to rounding.
Matthews Asia Dividend Fund
Portfolio Manager Commentary (continued)
to deliver growing earnings and dividends. The company raised its dividend by 25% in 2009.
Dividend payments in Asia Pacific continued to exhibit significantly less volatility than earnings, indicating that companies in the region are committed to paying dividends. While earnings for the constituents of the MSCI AC Asia Pacific Index more than halved, dividends fell by about 14%. In comparison, dividend payments for the S&P 500 Index are estimated to have fallen by 21% in 2009. Not surprisingly, dividend cuts in Asia Pacific mainly occurred among companies in cyclical industries, such as materials, industrials and information technology—many of which reside in Korea and Taiwan. The Fund tends to minimize exposure to cyclical companies because of this inherent volatility in dividend payments.
Dividend yields in the region compressed as markets rallied in response to the slowing pace of deteriorating economic data and fiscal stimulus packages combined with expansive monetary policies. With dividend yields falling to "pre-Lehman" levels, the price of dividend growth rose and, as a result, the Fund increasingly allocated to companies that had lagged the general rebound in markets. This resulted in net additions, particularly in Japan and Korea, as the year progressed, and to higher yielding large-cap companies such as China Mobile. The Fund will continue its focus on companies that offer attractive dividend yields in relation to their potential for dividend growth.
Asia continues to offer attractive opportunities to dividend-focused investors, when compared to fixed-income yields or other regional equity markets globally. Based on consensus estimates, the projected dividend yield for 2010 for the MSCI AC Asia Pacific Index of 2.5% exceeds the 2.0% expected of the MSCI U.S. Index. The relative stability of dividend payments in Asia Pacific in 2009 and the region's higher historical rate of dividend growth raises the question: Why should Asia Pacific dividends continue to trade at a discount to those of the U.S.? For long-term investors, we believe that companies in Asia Pacific continue to offer an attractive combination of current yield, dividend growth and diversification opportunities.
We are pleased to announce that in October, the Fund marked its third year of operation. We reached this milestone as a result of the long-term commitment of our shareholders through some volatile market cycles. We thank you for your ongoing support and will continue to work hard on your behalf.
12 MATTHEWS ASIA FUNDS
Matthews Asia Dividend Fund December 31, 2009
Schedule of Investmentsa
COMMON EQUITIES: 93.5%
| Shares | Value | ||||||||||
| CHINA/HONG KONG: 25.2% | |||||||||||
| China Mobile, Ltd. ADR | 214,000 | $ | 9,936,020 | ||||||||
| Cheung Kong Infrastructure Holdings, Ltd. | 2,130,000 | 8,099,731 | |||||||||
| Esprit Holdings, Ltd. | 1,115,000 | 7,397,655 | |||||||||
| Minth Group, Ltd. | 4,933,000 | 7,241,537 | |||||||||
| Television Broadcasts, Ltd. | 1,494,000 | 7,177,772 | |||||||||
| CLP Holdings, Ltd. | 929,500 | 6,290,454 | |||||||||
| VTech Holdings, Ltd. | 557,000 | 5,312,582 | |||||||||
| Café de Coral Holdings, Ltd. | 2,074,000 | 4,736,700 | |||||||||
| China Resources Enterprise, Ltd. | 1,218,000 | 4,424,850 | |||||||||
| ASM Pacific Technology, Ltd. | 460,100 | 4,350,089 | |||||||||
| Yantai Changyu Pioneer Wine Co. B Shares | 469,896 | 4,163,571 | |||||||||
| Xinao Gas Holdings, Ltd. | 1,582,000 | 4,050,383 | |||||||||
| Sa Sa International Holdings, Ltd. | 6,080,000 | 4,017,000 | |||||||||
| Shenzhen Chiwan Wharf Holdings, Ltd. B Shares | 1,244,344 | 2,068,538 | |||||||||
| Hang Lung Properties, Ltd. | 458,000 | 1,795,521 | |||||||||
| Total China/Hong Kong | 81,062,403 | ||||||||||
| JAPAN: 19.3% | |||||||||||
| Monex Group, Inc. | 21,794 | 7,463,177 | |||||||||
| Hamamatsu Photonics, K.K. | 288,400 | 7,025,151 | |||||||||
| Nintendo Co., Ltd. | 28,700 | 6,854,623 | |||||||||
| Hisamitsu Pharmaceutical Co., Inc. | 211,200 | 6,820,767 | |||||||||
| Shiseido Co., Ltd. | 312,000 | 5,996,330 | |||||||||
| Shinko Plantech Co., Ltd. | 541,300 | 5,488,838 | |||||||||
| Fanuc, Ltd. | 56,100 | 5,228,633 | |||||||||
| Lawson, Inc. | 107,200 | 4,734,513 | |||||||||
| Sysmex Corp. | 85,000 | 4,444,396 | |||||||||
| ORIX Corp. | 45,000 | 3,063,792 | |||||||||
| United Urban Investment Corp., REIT | 470 | 2,484,585 | |||||||||
| MID REIT, Inc. | 1,124 | 2,379,590 | |||||||||
| Total Japan | 61,984,395 | ||||||||||
| TAIWAN: 10.4% | |||||||||||
| CyberLink Corp. | 1,668,860 | 7,115,251 | |||||||||
| Chunghwa Telecom Co., Ltd. ADR | 359,196 | 6,670,270 | |||||||||
| St. Shine Optical Co., Ltd. | 1,086,000 | 6,482,487 | |||||||||
| Taiwan Semiconductor Manufacturing Co., Ltd. | 3,046,469 | 6,140,081 | |||||||||
| Taiwan Secom Co., Ltd. | 2,126,000 | 3,565,606 | |||||||||
| Chunghwa Telecom Co., Ltd. | 1,544,076 | 2,879,742 | |||||||||
| Taiwan Semiconductor Manufacturing Co., Ltd. ADR | 50,590 | 578,750 | |||||||||
| Total Taiwan | 33,432,187 | ||||||||||
| SOUTH KOREA: 8.5% | |||||||||||
| KT&G Corp. | 126,500 | 6,990,010 | |||||||||
| SK Telecom Co., Ltd. ADR | 346,300 | 5,630,838 | |||||||||
| S1 Corp. | 134,880 | 5,607,095 | |||||||||
| Cheil Worldwide, Inc. | 17,658 | 4,782,090 | |||||||||
| SK Telecom Co., Ltd. | 29,816 | 4,352,157 | |||||||||
| Total South Korea | 27,362,190 | ||||||||||
| Shares | Value | ||||||||||
| THAILAND: 7.6% | |||||||||||
| Thai Beverage Public Co., Ltd. | 36,413,000 | $ | 6,349,939 | ||||||||
| Siam Makro Public Co., Ltd. | 1,830,000 | 4,797,215 | |||||||||
| Major Cineplex Group Public Co., Ltd. | 18,600,900 | 4,756,277 | |||||||||
| Land & Houses Public Co., Ltd. NVDR | 23,358,200 | 4,397,885 | |||||||||
| Thai Tap Water Supply Public Co., Ltd. | 31,646,200 | 4,241,530 | |||||||||
| Total Thailand | 24,542,846 | ||||||||||
| SINGAPORE: 4.7% | |||||||||||
| Venture Corp., Ltd. | 767,000 | 4,811,615 | |||||||||
| CapitaRetail China Trust, REIT | 5,229,000 | 4,731,477 | |||||||||
| Parkway Life REIT | 4,695,868 | 4,059,137 | |||||||||
| CapitaLand, Ltd. | 555,000 | 1,646,442 | |||||||||
| Total Singapore | 15,248,671 | ||||||||||
| INDONESIA: 4.7% | |||||||||||
| PT Ramayana Lestari Sentosa | 102,013,000 | 6,617,919 | |||||||||
| PT Telekomunikasi Indonesia | 4,466,000 | 4,445,573 | |||||||||
| PT Telekomunikasi Indonesia ADR | 102,900 | 4,110,855 | |||||||||
| Total Indonesia | 15,174,347 | ||||||||||
| MALAYSIA: 4.5% | |||||||||||
| Top Glove Corp. BHD | 2,445,700 | 7,179,510 | |||||||||
| Astro All Asia Networks PLC | 5,570,000 | 4,863,061 | |||||||||
| Media Prima BHD | 4,931,200 | 2,398,642 | |||||||||
| Total Malaysia | 14,441,213 | ||||||||||
| AUSTRALIA: 3.3% | |||||||||||
| Billabong International, Ltd. | 561,631 | 5,495,107 | |||||||||
| Coca-Cola Amatil, Ltd. | 499,730 | 5,152,470 | |||||||||
| Total Australia | 10,647,577 | ||||||||||
| PHILIPPINES: 2.9% | |||||||||||
| Globe Telecom, Inc. | 481,940 | 9,477,972 | |||||||||
| Total Philippines | 9,477,972 | ||||||||||
| UNITED KINGDOM: 2.4% | |||||||||||
| HSBC Holdings PLC ADR | 86,691 | 4,949,189 | |||||||||
| HSBC Holdings PLC | 256,133 | 2,913,497 | |||||||||
| Total United Kingdom | 7,862,686 | ||||||||||
| TOTAL COMMON EQUITIES | 301,236,487 | ||||||||||
| (Cost $245,829,753) | |||||||||||
WARRANTS: 0.0%
| MALAYSIA: 0.0% | |||||||||||
| Media Prima BHD, expires 12/31/14 | 140,891 | 0 | |||||||||
| Total Malaysia | 0 | ||||||||||
| TOTAL WARRANTS | 0 | ||||||||||
| (Cost $0) | |||||||||||
matthewsasia.com | 800.789.ASIA 13
Matthews Asia Dividend Fund December 31, 2009
Schedule of Investmentsa (continued)
INTERNATIONAL BONDS: 2.6%
| Face Amount | Value | ||||||||||
| SINGAPORE: 1.5% | |||||||||||
| CapitaLand, Ltd., Cnv. 3.125%, 03/05/2018 | SGD | 3,500,000 | $ | 2,469,570 | |||||||
| CapitaCommerical Trust, Cnv. 2.000%, 05/06/2013 | SGD | 3,000,000 | 2,207,531 | ||||||||
| Total Singapore | 4,677,101 | ||||||||||
| JAPAN: 1.1% | |||||||||||
| ORIX Corp., Cnv. 1.000%, 03/31/2014 | JPY | 310,000,000 | 3,648,870 | ||||||||
| Total Japan | 3,648,870 | ||||||||||
| TOTAL INTERNATIONAL BONDS | 8,325,971 | ||||||||||
| (Cost $6,992,644) | |||||||||||
| TOTAL INVESTMENTS: 96.1% | 309,562,458 | ||||||||||
| (Cost $252,822,397b) | |||||||||||
| CASH AND OTHER ASSETS, LESS LIABILITIES: 3.9% | 12,440,888 | ||||||||||
| NET ASSETS: 100.0% | $ | 322,003,346 | |||||||||
a Certain securities were fair valued under the discretion of the Board of Trustees (Note 1-A).
b Cost for Federal income tax purposes is $258,755,555 and net unrealized appreciation consists of:
| Gross unrealized appreciation | $ | 61,198,758 | |||||
| Gross unrealized depreciation | (10,391,855 | ) | |||||
| Net unrealized appreciation | $ | 50,806,903 | |||||
ADR American Depositary Receipt
BHD Berhad
JPY Japanese Yen
Cnv. Convertible
NVDR Non-voting Depositary Receipt
REIT Real Estate Investment Trust
SGD Singapore Dollar
See accompanying notes to financial statements.
14 MATTHEWS ASIA FUNDS

ASIA GROWTH AND
INCOME STRATEGIES
PORTFOLIO MANAGERS
Jesper O. Madsen
Lead Manager
Richard Gao
Co-Manager
FUND FACTS
| Ticker | MCDFX | ||||||
| Inception Date | 11/30/09 | ||||||
| Assets | $7.1 million | ||||||
| NAV | $10.18 | ||||||
| Total # of Positions | 34 | ||||||
Fiscal Year 2009 Ratios
| Portfolio Turnover | 0.00 | %1 | |||||
| Gross Expense Ratio | 10.05 | % | |||||
| After Fee Waiver, Reimbursement and Recoupment | 1.50 | %2 | |||||
Benchmarks
MSCI China Index
Redemption Fee
2% within first 90 calendar days of purchase
OBJECTIVE
Total return with an emphasis on providing current income.
STRATEGY
Under normal market conditions, the Fund seeks to achieve its investment objective by investing at least 80% of its total net assets, which include borrowings for investment purposes, in income-paying equity securities of companies located in China and Taiwan. China Includes its administrative and other districts, such as Hong Kong.
1 The lesser of fiscal year 2009 long-term purchase costs or sales proceeds divided by the average monthly market value of long-term securities.
2 The Advisor has contractually agreed to waive certain fees and reimburse certain expenses for Matthews China Dividend Fund. Please see page 89 for additional information. Matthews Asia Funds does not charge 12b-1 fees.
Matthews China Dividend Fund
Portfolio Manager Commentary
The Matthews China Dividend Fund was launched on November 30, 2009. For the month ending December 31, 2009, the Fund gained 1.80%, while its benchmark, the MSCI China Index, rose 0.46%.
The deepening of the Chinese equity market, and the expanding universe of the country's dividend-paying companies, made it possible for Matthews to pursue a scalable dividend investing strategy in China across a variety of industries. The Matthews China Dividend Fund seeks to generate total return with an emphasis on providing current income by focusing on the significant and fast-growing number of dividend-paying companies in China. It leverages both our experience of investing in Chinese companies gained through our long track record in China as well as the dividend-focused stock selection process of the Matthews Asia Dividend Fund.
While often overlooked, dividends are an essential component of total shareholder return for long-term investors in China. Since the inception of the MSCI China Index in December 1998, approximately 38% of its total return has been derived from reinvested dividends. Even though the universe of dividend paying companies in Asia Pacific, in general, has expanded significantly over the past decade, the growth in Chinese dividend payments stands out. Aggregate dividend payments grew from close to US$8 billion in 1998 to US$73 billion by 2008. Importantly, US$57 billion of the total dividend payment in 2008 was accounted for by companies that had their initial public offering (IPO) after 1998. These IPOs were often by large-capitalization, state-owned enterprises (SOEs). While these companies still exhibit earnings growth, they are "mature" in the sense they have the business scale and financial strength to provide for dividend payment right out of the gate. This is unlike IPOs in the U.S., which in general are of smaller companies in need of capital for business expansion, and for which dividends are but a distant goal.
The investment universe of dividend payers has also deepened with the overall growth of Chinese dividend payments, allowing dividend-focused investors greater diversification potential. The financial services sector (banks, insurance and real estate) paid the most in absolute terms—approximately US$33 billion (or 45% of total payouts). Energy stocks paid out a combined total of US$14 billion (about 19% of payouts) and telecommunication services paid approximately US$9 billion (12% of payouts). It is important to note that all sectors except health care now offer sizeable dividend payments. By market capitalization, as of August 2009, the majority, or 84%, of dividend payments in China were by large-cap companies. An estimated 12% came from mid-cap companies and 4% from small-cap firms.
Similar to our Matthews Asia Dividend Fund, the Matthews China Dividend Fund seeks to invest in companies that we believe offer an attractive combination of current dividend yield and growth in dividends. Our process begins by screening companies for their ability to pay dividends, and researching their competitive advantages to assess the sustainability of cash flows, profit margins and long-term dividend payments. Company visits and meetings with management are essential to our process. These meetings give us better insight into a company's business model as well as management's thoughts about capital allocation—particularly as they pertain to dividends. In constructing our portfolio, we consider valuation and diversification. We assess whether a company's current price is attractive given both the current as well as the future yield based on our projections regarding dividend growth. We also consider whether
(continued)
matthewsasia.com | 800.789.ASIA 15
PERFORMANCE AS OF DECEMBER 31, 2009
| Actual Return, Not Annualized | |||||||
| Inception 11/30/09 | |||||||
| Matthews China Dividend Fund | 1.80 | % | |||||
| MSCI China Index3 | 0.46 | % | |||||
| Lipper China Funds Category Average4 | 2.16 | % | |||||
Performance assumes reinvestment of all dividends and/or distributions before taxes. All performance quoted represents past performance and is no guarantee of future results. Investment return and principal value will fluctuate with market conditions so that when redeemed, shares may be worth more or less than their original cost. Current performance may be lower or higher than the return figures quoted. Returns would have been lower if certain of the Fund's fees and expenses had not been waived. For the Fund's most recent month-end performance visit matthewsasia.com.
The performance data does not reflect the deduction of taxes that a shareholder would pay on dividends, capital gain distributions or redemption of Fund shares. Values are in US$.
3 It is not possible to invest directly in an index. Source: Index data from Morgan Stanley Capital Management; total return calculations performed by PNC Global Investment Servicing (U.S.) Inc. Please see page 59 for index definition.
4 The Lipper Category Average does not reflect sales charges and is based on total return, including reinvestment of dividends and capital gains for the stated periods.
TOP TEN HOLDINGS5
| Sector | % of Net Assets | ||||||||||
| China Mobile, Ltd. | Telecommunication Services | 5.2 | % | ||||||||
| Cheung Kong Infrastructure Holdings, Ltd. | Utilities | 4.7 | % | ||||||||
| Chunghwa Telecom Co., Ltd. | Telecommunication Services | 4.0 | % | ||||||||
| Television Broadcasts, Ltd. | Consumer Discretionary | 3.9 | % | ||||||||
| Hang Seng Bank, Ltd. | Financials | 3.9 | % | ||||||||
| Guangdong Investment, Ltd. | Utilities | 3.8 | % | ||||||||
| Taiwan Semiconductor Manufacturing Co., Ltd. | Information Technology | 3.8 | % | ||||||||
| HSBC Holdings PLC | Financials | 3.8 | % | ||||||||
| Jiangsu Expressway Co., Ltd. | Industrials | 3.7 | % | ||||||||
| CapitaRetail China Trust, REIT | Financials | 3.7 | % | ||||||||
| % OF ASSETS IN TOP TEN | 40.5 | % | |||||||||
5 Holdings may combine more than one security from same issuer and related depositary receipts.
16 MATTHEWS ASIA FUNDS
Matthews China Dividend Fund
Portfolio Manager Commentary (continued)
the company is a better holding compared to current portfolio holdings or whether it will improve the portfolio's overall diversification.
The rationale for launching an additional China-focused fund was based on the premise that when investing in China, strategy matters depending on the investor's risk/return profile. Furthermore, China's equity markets now allow investors to pursue various strategies within the same geographic region, just as they would in the U.S. The Fund's distinct focus on yield and dividend growth is likely to result in a relatively high allocation to conservative business models, such as the utilities and telecommunication sectors, which exhibit strong balance sheets and stable cash flows. That said, as the Fund seeks dividend growth, its allocation to smaller-cap companies will likely be higher relative to the benchmark, as well as higher than that of our growth-oriented Matthews China Fund. These companies, while often exhibiting strong growth potential, also come with greater share price volatility. Investors should expect the Fund to ha ve the higher volatility associated with a single-country or small company fund.
Dividend yields in China and Hong Kong have compressed throughout 2009 as a result of positive stock market gains. However, Chinese equities continue to offer attractive opportunities to dividend-focused investors given their yield and dividend growth potential. We believe that companies in China offer an attractive combination of current yield, dividend growth and diversification for long-term investors.
SECTOR ALLOCATION (%)
| Financials | 19.6 | ||||||
| Utilities | 15.1 | ||||||
| Telecommunication Services | 12.1 | ||||||
| Consumer Discretionary | 11.7 | ||||||
| Information Technology | 11.1 | ||||||
| Industrials | 8.6 | ||||||
| Energy | 6.7 | ||||||
| Health Care | 5.6 | ||||||
| Consumer Staples | 4.5 | ||||||
| Cash and Other Assets, Less Liabilities | 5.0 | ||||||
MARKET CAP EXPOSURE (%)6
| Large Cap (Over $5B) | 49.7 | ||||||
| Mid Cap ($1B-$5B) | 25.9 | ||||||
| Small Cap (Under $1B) | 19.4 | ||||||
| Cash and Other Assets, Less Liabilities | 5.0 | ||||||
6 Source: FactSet Research Systems. Percentage values in data are rounded to the nearest tenth of one percent; the values may not sum to 100% due to rounding.
matthewsasia.com | 800.789.ASIA 17
Matthews China Dividend Fund December 31, 2009
Schedule of Investmentsa
COMMON EQUITIES: 95.0%
| Shares | Value | ||||||||||
| FINANCIALS: 19.6% | |||||||||||
| Commercial Banks: 7.7% | |||||||||||
| Hang Seng Bank, Ltd. | 18,900 | $ | 278,056 | ||||||||
| HSBC Holdings PLC ADR | 4,700 | 268,323 | |||||||||
| 546,379 | |||||||||||
| Real Estate Management & Development: 5.3% | |||||||||||
| Hang Lung Properties, Ltd. | 53,000 | 207,779 | |||||||||
| Swire Pacific, Ltd. A Shares | 14,000 | 169,307 | |||||||||
| 377,086 | |||||||||||
| Real Estate Investment Trusts: 3.7% | |||||||||||
| CapitaRetail China Trust, REIT | 293,000 | 265,122 | |||||||||
| Capital Markets: 2.1% | |||||||||||
| Yuanta Financial Holding Co., Ltd. | 207,000 | 151,462 | |||||||||
| Insurance: 0.8% | |||||||||||
| China Pacific Insurance Group Co., Ltd. H Sharesb | 15,000 | 59,780 | |||||||||
| Total Financials | 1,399,829 | ||||||||||
| UTILITIES: 15.1% | |||||||||||
| Electric Utilities: 8.4% | |||||||||||
| Cheung Kong Infrastructure Holdings, Ltd. | 89,000 | 338,439 | |||||||||
| CLP Holdings, Ltd. | 38,000 | 257,168 | |||||||||
| 595,607 | |||||||||||
| Water Utilities: 3.8% | |||||||||||
| Guangdong Investment, Ltd. | 466,000 | 270,800 | |||||||||
| Gas Utilities: 2.9% | |||||||||||
| Hong Kong & China Gas Co., Ltd. | 82,000 | 205,668 | |||||||||
| Total Utilities | 1,072,075 | ||||||||||
| TELECOMMUNICATION SERVICES: 12.1% | |||||||||||
| Diversified Telecommunication Services: 6.9% | |||||||||||
| Chunghwa Telecom Co., Ltd. ADR | 15,400 | 285,978 | |||||||||
| China Communications Services Corp., Ltd. H Shares | 428,000 | 209,505 | |||||||||
| 495,483 | |||||||||||
| Wireless Telecommunication Services: 5.2% | |||||||||||
| China Mobile, Ltd. ADR | 7,930 | 368,190 | |||||||||
| Total Telecommunication Services | 863,673 | ||||||||||
| Shares | Value | ||||||||||
| CONSUMER DISCRETIONARY: 11.7% | |||||||||||
| Media: 3.9% | |||||||||||
| Television Broadcasts, Ltd. | 58,000 | $ | 278,655 | ||||||||
| Hotels, Restaurants & Leisure: 3.2% | |||||||||||
| Café de Coral Holdings, Ltd. | 98,000 | 223,817 | |||||||||
| Textiles, Apparel & Luxury Goods: 2.1% | |||||||||||
| Shenzhou International Group Holdings, Ltd. | 116,000 | 151,060 | |||||||||
| Auto Components: 1.9% | |||||||||||
| Xinyi Glass Holdings Co., Ltd. | 148,000 | 133,386 | |||||||||
| Multiline Retail: 0.6% | |||||||||||
| PCD Stores, Ltd.b | 114,100 | 44,295 | |||||||||
| Total Consumer Discretionary | 831,213 | ||||||||||
| INFORMATION TECHNOLOGY: 11.1% | |||||||||||
| Software: 4.8% | |||||||||||
| Kingsoft Corp., Ltd. | 214,000 | 175,982 | |||||||||
| CyberLink Corp. | 40,000 | 170,542 | |||||||||
| 346,524 | |||||||||||
| Semiconductors & Semiconductor Equipment: 4.8% | |||||||||||
| Taiwan Semiconductor Manufacturing Co., Ltd. | 134,000 | 270,074 | |||||||||
| ASM Pacific Technology, Ltd. | 7,400 | 69,964 | |||||||||
| 340,038 | |||||||||||
| Electronic Equipment & Instruments: 1.5% | |||||||||||
| Digital China Holdings, Ltd. | 80,000 | 106,502 | |||||||||
| Total Information Technology | 793,064 | ||||||||||
| INDUSTRIALS: 8.6% | |||||||||||
| Transportation Infrastructure: 6.6% | |||||||||||
| Jiangsu Expressway Co., Ltd. H Shares | 300,000 | 266,693 | |||||||||
| China Merchants Holdings International Co., Ltd. | 64,000 | 206,460 | |||||||||
| 473,153 | |||||||||||
| Electrical Equipment: 2.0% | |||||||||||
| Hangzhou Steam Turbine Co., Ltd. B Shares | 63,800 | 142,317 | |||||||||
| Total Industrials | 615,470 | ||||||||||
| ENERGY: 6.7% | |||||||||||
| Oil, Gas & Consumable Fuels: 6.7% | |||||||||||
| China Petroleum & Chemical Corp. ADR | 2,040 | 179,663 | |||||||||
| CNOOC, Ltd. ADR | 1,150 | 178,767 | |||||||||
| China Shenhua Energy Co., Ltd. H Shares | 24,500 | 118,931 | |||||||||
| Total Energy | 477,361 | ||||||||||
18 MATTHEWS ASIA FUNDS
Matthews China Dividend Fund December 31, 2009
Schedule of Investmentsa (continued)
COMMON EQUITIES (continued)
| Shares | Value | ||||||||||
| HEALTH CARE: 5.6% | |||||||||||
| Health Care Equipment & Supplies: 3.3% | |||||||||||
| St. Shine Optical Co., Ltd. | 39,000 | $ | 232,796 | ||||||||
| Pharmaceuticals: 2.3% | |||||||||||
| United Laboratories, Ltd. (The) | 318,000 | 167,981 | |||||||||
| Total Health Care | 400,777 | ||||||||||
| CONSUMER STAPLES: 4.5% | |||||||||||
| Food Products: 3.2% | |||||||||||
| Vitasoy International Holdings, Ltd. | 330,000 | 230,406 | |||||||||
| Beverages: 1.3% | |||||||||||
| Yantai Changyu Pioneer Wine Co. B Shares | 10,327 | 91,504 | |||||||||
| Total Consumer Staples | 321,910 | ||||||||||
| TOTAL INVESTMENTS: 95.0% | 6,775,372 | ||||||||||
| (Cost $6,661,391c) | |||||||||||
| CASH AND OTHER ASSETS, LESS LIABILITIES: 5.0% | 359,086 | ||||||||||
| NET ASSETS: 100.0% | $ | 7,134,458 | |||||||||
a Certain securities were fair valued under the discretion of the Board of Trustees (Note 1-A).
b Non-income producing security.
c Cost for Federal income tax purposes is $6,664,469 and net unrealized appreciation consists of:
| Gross unrealized appreciation | $ | 158,951 | |||||
| Gross unrealized depreciation | (48,048 | ) | |||||
| Net unrealized appreciation | $ | 110,903 | |||||
ADR American Depositary Receipt
REIT Real Estate Investment Trust
See accompanying notes to financial statements.
matthewsasia.com | 800.789.ASIA 19

ASIA GROWTH STRATEGIES
PORTFOLIO MANAGERS
Taizo Ishida
Lead Manager
Sharat Shroff, CFA
Co-Manager
FUND FACTS
| Ticker | MPACX | ||||||
| Inception Date | 10/31/03 | ||||||
| Assets | $227.7 million | ||||||
| NAV | $14.29 | ||||||
| Total # of Positions | 60 | ||||||
Fiscal Year 2009 Ratios
| Portfolio Turnover | 58.10 | %1 | |||||
| Gross Expense Ratio | 1.28 | %2 | |||||
Benchmark
MSCI AC Asia Pacific Index
Redemption Fee
2% within first 90 calendar days of purchase
OBJECTIVE
Long-term capital appreciation.
STRATEGY
Under normal market conditions, the Fund seeks to achieve its investment objective by investing at least 80% of its total net assets, which include borrowings for investment purposes, in the common and preferred stocks of companies located in the Asia Pacific region. The Fund may also invest in the convertible securities, of any duration or quality, of Asia Pacific companies.
1 The lesser of fiscal year 2009 long-term purchase costs or sales proceeds divided by the average monthly market value of long-term securities.
2 Matthews Asia Funds does not charge 12b-1 fees.
Matthews Asia Pacific Fund
Portfolio Manager Commentary
For the year ending December 31, 2009, the Matthews Asia Pacific Fund gained 44.82%, while its benchmark, the MSCI All Country Asia Pacific Index rose 37.86%. For the fourth quarter, the Fund returned 5.87%, compared to a 2.31% rise for the benchmark.
Consumer discretionary stocks were the main drivers of performance, specifically auto-related companies. Our decision early in the year to increase holdings in cyclical sectors, such as autos and real estate, served the Fund well. In addition, our increased exposure to China, Korea and Taiwan also benefited the Fund throughout the year. As we have previously reported, we repositioned the portfolio at the end of 2008 to be concentrated in fewer holdings. This shift contributed to Fund performance in 2009.
2009 was a good year to be invested in China despite concerns about the pace of the country's GDP growth. In addition, India's market received a boost from the landslide victory of the Indian National Congress in its general elections. Asian markets were buoyed by these two economies, indicating the interconnectedness of countries in the region. Exchange rates played a significant role in market movements this year: the Korean won remained weak from the end of 2008 through the first half of 2009, relative to both the U.S. dollar and the yen, providing Korean manufacturers a competitive advantage against their Japanese peers. Chinese manufacturers were able to maintain cost advantages as China's yuan remained unchanged against the falling U.S. dollar.
Though we generally minimize exposure to cyclical sectors, the portfolio sought to capture some of the secular growth taking place in markets like China, India and Indonesia, particularly via increasing auto sales. We seek to identify companies that will provide the best exposure to Asia's growing auto industry. One holding is Hyundai Motor, a Korean manufacturer with significant sales in China and India. Another is China's Dongfeng Motor Group. The company is the main joint venture partner with Japan's Nissan Motor and Honda Motor, and manufactures Japanese cars and trucks for the Chinese market. The Fund also holds Astra International, an Indonesian conglomerate with an automotive arm. The firm has a dominant market share in the domestic sale of Japanese cars and trucks in Indonesia.
Among the Fund's worst performers during the year were Japanese financial stocks, though the portfolio minimized exposure to the sector in Japan. Specifically, the investment bank GCA Savvian Group and financial services group ORIX were down for the year due to the global credit crunch that persisted throughout the year and the ongoing weakness of Japan's economy. Holdings in the consumer staples sector also detracted from Fund performance, partly due to their defensive nature and partly because of their outperformance in 2008. Japan's Unicharm Petcare was one such company that did not perform as well in 2009 as it had in previous years. However, it remains a Fund holding as the company still boasts high margins and very strong returns on investment.
Despite the fact that Japan's economy remains weak, we believe Japanese stocks are still undervalued and we continue to find compelling investment opportunities on a company-by-company basis, especially Japanese companies that are capitalizing on growth within Asia.
We continue to seek investment opportunities that are poised to benefit from the region's continuing integration. A core holding of the Fund, Tingyi Holding, is quickly becoming one of the better-known Chinese food and beverage companies in the region. The firm is worth highlighting as it is not only a solid
(continued)
20 MATTHEWS ASIA FUNDS
PERFORMANCE AS OF DECEMBER 31, 2009
| Average Annual Total Returns | |||||||||||||||||||||||
| 3 Month | 1 Year | 3 Year | 5 Year | Inception 10/31/03 | |||||||||||||||||||
| Matthews Asia Pacific Fund | 5.87 | % | 44.82 | % | 0.46 | % | 7.18 | % | 9.86 | % | |||||||||||||
| MSCI AC Asia Pacific Index3 | 2.31 | % | 37.86 | % | -2.65 | % | 5.94 | % | 8.51 | % | |||||||||||||
| Lipper Pacific Regions Fund Category Average4 | 3.84 | % | 38.40 | % | -3.49 | % | 6.23 | % | 8.34 | % | |||||||||||||
Performance assumes reinvestment of all dividends and/or distributions before taxes. All performance quoted represents past performance and is no guarantee of future results. Investment return and principal value will fluctuate with market conditions so that when redeemed, shares may be worth more or less than their original cost. Current performance may be lower or higher than the return figures quoted. Returns would have been lower if certain of the Fund's fees and expenses had not been waived. For the Fund's most recent month-end performance visit matthewsasia.com.
GROWTH OF A $10,000 INVESTMENT SINCE INCEPTION
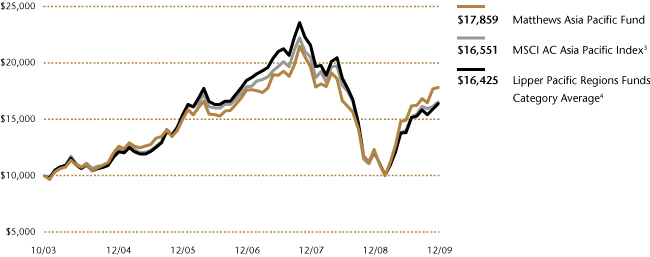
Plotted monthly. The performance data and graph do not reflect the deduction of taxes that a shareholder would pay on dividends, capital gain distributions or redemption of Fund shares. Values are in US$.
3 It is not possible to invest directly in an index. Source: Index data from Morgan Stanley Capital Management; total return calculations performed by PNC Global Investment Servicing (U.S.) Inc. Please see page 59 for index definition.
4 The Lipper Category Average does not reflect sales charges and is based on total return, including reinvestment of dividends and capital gains for the stated periods.
TOP TEN HOLDINGS5
| Country | % of Net Assets | ||||||||||
| Ctrip.com International, Ltd. | China/Hong Kong | 3.8 | % | ||||||||
| Sysmex Corp. | Japan | 3.1 | % | ||||||||
| Softbank Corp. | Japan | 3.0 | % | ||||||||
| The Japan Steel Works, Ltd. | Japan | 3.0 | % | ||||||||
| CSL Australia, Ltd. | Australia | 3.0 | % | ||||||||
| PT Astra International | Indonesia | 2.7 | % | ||||||||
| Tingyi (Cayman Islands) Holding Corp. | China/Hong Kong | 2.6 | % | ||||||||
| HDFC Bank, Ltd. | India | 2.5 | % | ||||||||
| PT Bank Rakyat Indonesia | Indonesia | 2.3 | % | ||||||||
| China Life Insurance Co., Ltd. | China/Hong Kong | 2.3 | % | ||||||||
| % OF ASSETS IN TOP TEN | 28.3 | % | |||||||||
5 Holdings may combine more than one security from same issuer and related depositary receipts.
matthewsasia.com | 800.789.ASIA 21
COUNTRY ALLOCATION (%)
| Japan | 31.5 | ||||||
| China/Hong Kong | 27.5 | ||||||
| India | 7.1 | ||||||
| Indonesia | 6.7 | ||||||
| Taiwan | 6.2 | ||||||
| Australia | 6.1 | ||||||
| South Korea | 5.4 | ||||||
| Thailand | 3.4 | ||||||
| Singapore | 3.2 | ||||||
| Malaysia | 1.4 | ||||||
| New Zealand | 0.6 | ||||||
| Cash and Other Assets, Less Liabilities | 0.9 | ||||||
SECTOR ALLOCATION (%)
| Financials | 28.9 | ||||||
| Consumer Discretionary | 18.6 | ||||||
| Information Technology | 11.0 | ||||||
| Industrials | 10.2 | ||||||
| Consumer Staples | 10.0 | ||||||
| Health Care | 9.3 | ||||||
| Telecommunication Services | 7.9 | ||||||
| Energy | 2.2 | ||||||
| Materials | 1.0 | ||||||
| Cash and Other Assets, Less Liabilities | 0.9 | ||||||
MARKET CAP EXPOSURE (%)6
| Large Cap (Over $5B) | 55.4 | ||||||
| Mid Cap ($1B-$5B) | 28.5 | ||||||
| Small Cap (Under $1B) | 15.2 | ||||||
| Cash and Other Assets, Less Liabilities | 0.9 | ||||||
6 Source: FactSet Research Systems. Percentage values in data are rounded to the nearest tenth of one percent; the values may not sum to 100% due to rounding.
Matthews Asia Pacific Fund
Portfolio Manager Commentary (continued)
company, but also exemplifies the type of business we seek. Though Tingyi is classified as a Chinese company, listed in Hong Kong, and serves the Chinese market, it is quintessentially Asian from our perspective. Built around a superb management team of both Taiwanese and Japanese executives, the company utilizes the most advanced technology and know-how from all over the world for its two main businesses—instant noodles and packaged beverages. Both businesses are partnered with Japanese firms—privately held Sanyo Foods for its noodle products and Asahi Breweries for Tingyi's beverage arm. This seems to be a mutually beneficial strategy for all companies involved. Notably, Tingyi's market capitalization has grown from US$5.5 billion at the beginning of 2007 to US$13 billion at the end of 2009. In addition, it is one of the few consumer staples companies to do well last year in what was a poorly performing sector.
Though we remain strongly convinced of Asia's long-term growth prospects, the market may pay more attention to changes in the cost of capital in 2010 as we expect these costs to increase over the medium term. We will closely monitor the basic policy rates of each central bank in the region. Both fixed costs, such as labor, and the variable cost of materials may also rise due to potential inflationary pressures. We expect there to be an increased focus on earnings announcements as earnings growth is likely to be the ultimate test for some of stocks that have seen valuations soar in 2009.
22 MATTHEWS ASIA FUNDS
Matthews Asia Pacific Fund December 31, 2009
Schedule of Investmentsa
COMMON EQUITIES: 97.6%
| Shares | Value | ||||||||||
| JAPAN: 31.5% | |||||||||||
| Sysmex Corp. | 134,700 | $ | 7,043,061 | ||||||||
| Softbank Corp. | 296,100 | 6,941,393 | |||||||||
| The Japan Steel Works, Ltd. | 537,000 | 6,847,326 | |||||||||
| Pigeon Corp. | 121,500 | 4,757,598 | |||||||||
| ORIX Corp. | 67,690 | 4,608,624 | |||||||||
| Nintendo Co., Ltd. | 19,100 | 4,561,787 | |||||||||
| Benesse Holding, Inc. | 100,900 | 4,218,729 | |||||||||
| Komatsu, Ltd. | 188,900 | 3,954,465 | |||||||||
| Asahi Breweries, Ltd. | 213,100 | 3,924,734 | |||||||||
| Fanuc, Ltd. | 41,900 | 3,905,164 | |||||||||
| MID REIT, Inc. | 1,832 | 3,878,477 | |||||||||
| Monex Group, Inc. | 9,218 | 3,156,628 | |||||||||
| Keyence Corp. | 14,930 | 3,098,626 | |||||||||
| Unicharm Petcare Corp. | 100,400 | 3,066,690 | |||||||||
| Mori Trust Sogo REIT, Inc. | 364 | 2,930,733 | |||||||||
| FamilyMart Co., Ltd. | 88,100 | 2,600,852 | |||||||||
| Mitsubishi UFJ Financial Group, Inc. ADR | 216,100 | 1,063,212 | |||||||||
| GCA Savvian Group Corp. | 991 | 1,053,133 | |||||||||
| Total Japan | 71,611,232 | ||||||||||
| CHINA/HONG KONG: 27.5% | |||||||||||
| Ctrip.com International, Ltd. ADRb | 119,200 | 8,565,712 | |||||||||
| Tingyi (Cayman Islands) Holding Corp. | 2,370,000 | 5,864,562 | |||||||||
| China Life Insurance Co., Ltd. H Shares | 1,049,000 | 5,133,044 | |||||||||
| China Merchants Bank Co., Ltd. H Shares | 1,594,450 | 4,148,602 | |||||||||
| China Vanke Co., Ltd. B Shares | 3,319,787 | 4,148,181 | |||||||||
| Hong Kong Exchanges and Clearing, Ltd. | 228,900 | 4,072,680 | |||||||||
| Shangri-La Asia, Ltd. | 2,096,000 | 3,927,031 | |||||||||
| Hang Lung Group, Ltd. | 782,000 | 3,867,397 | |||||||||
| Dongfeng Motor Group Co., Ltd. H Shares | 2,460,000 | 3,512,796 | |||||||||
| China Mobile, Ltd. | 375,000 | 3,489,191 | |||||||||
| Kingdee International Software Group Co., Ltd. | 14,118,000 | 3,143,920 | |||||||||
| Shanda Games, Ltd. ADRb | 282,800 | 2,881,732 | |||||||||
| Dairy Farm International Holdings, Ltd. | 477,354 | 2,850,997 | |||||||||
| China South Locomotive and Rolling Stock Corp. H Shares | 3,334,900 | 2,435,371 | |||||||||
| Sany Heavy Equipment International Holdings Co., Ltd.b | 1,456,000 | 1,842,206 | |||||||||
| Shandong Weigao Group Medical Polymer Co., Ltd. H Shares | 504,000 | 1,679,691 | |||||||||
| New Oriental Education & Technology Group, Inc. ADRb | 14,100 | 1,066,101 | |||||||||
| Total China/Hong Kong | 62,629,214 | ||||||||||
| INDIA: 7.1% | |||||||||||
| HDFC Bank, Ltd. | 126,958 | 4,626,023 | |||||||||
| Jain Irrigation Systems, Ltd. | 231,623 | 4,322,487 | |||||||||
| Bharti Airtel, Ltd. | 479,493 | 3,387,986 | |||||||||
| Sun Pharmaceutical Industries, Ltd. | 83,845 | 2,710,402 | |||||||||
| HDFC Bank, Ltd. ADR | 9,000 | 1,170,720 | |||||||||
| Total India | 16,217,618 | ||||||||||
| Shares | Value | ||||||||||
| INDONESIA: 6.7% | |||||||||||
| PT Astra International | 1,667,500 | $ | 6,130,388 | ||||||||
| PT Bank Rakyat Indonesia | 6,401,500 | 5,145,099 | |||||||||
| PT Telekomunikasi Indonesia | 4,104,500 | 4,085,727 | |||||||||
| Total Indonesia | 15,361,214 | ||||||||||
| TAIWAN: 6.2% | |||||||||||
| Taiwan Semiconductor Manufacturing Co., Ltd. | 2,301,585 | 4,638,786 | |||||||||
| Richtek Technology Corp. | 343,350 | 3,498,219 | |||||||||
| St. Shine Optical Co., Ltd. | 533,000 | 3,181,552 | |||||||||
| Polaris Securities Co., Ltd.b | 4,888,000 | 2,897,013 | |||||||||
| Total Taiwan | 14,215,570 | ||||||||||
| AUSTRALIA: 6.1% | |||||||||||
| CSL Australia, Ltd. | 231,715 | 6,738,136 | |||||||||
| Oil Search, Ltd. | 899,999 | 4,934,477 | |||||||||
| BHP Billiton, Ltd. | 57,562 | 2,202,704 | |||||||||
| Total Australia | 13,875,317 | ||||||||||
| SOUTH KOREA: 3.9% | |||||||||||
| Kiwoom Securities Co., Ltd. | 89,246 | 3,210,473 | |||||||||
| NHN Corp.b | 18,752 | 3,099,292 | |||||||||
| LG Electronics, Inc. | 23,758 | 2,476,729 | |||||||||
| Total South Korea | 8,786,494 | ||||||||||
| THAILAND: 3.4% | |||||||||||
| Major Cineplex Group Public Co., Ltd. | 17,056,000 | 4,361,244 | |||||||||
| Siam Commercial Bank Public Co., Ltd. | 1,264,400 | 3,290,355 | |||||||||
| Total Thailand | 7,651,599 | ||||||||||
| SINGAPORE: 3.2% | |||||||||||
| CapitaCommerical Trust, REIT | 5,456,000 | 4,518,066 | |||||||||
| Keppel Land, Ltd. | 1,074,000 | 2,653,982 | |||||||||
| Total Singapore | 7,172,048 | ||||||||||
| MALAYSIA: 1.4% | |||||||||||
| Parkson Holdings BHD | 2,107,264 | 3,261,121 | |||||||||
| Total Malaysia | 3,261,121 | ||||||||||
| NEW ZEALAND: 0.6% | |||||||||||
| Fisher & Paykel Appliances Holdings, Ltd. H Sharesb | 3,414,628 | 1,432,682 | |||||||||
| Total New Zealand | 1,432,682 | ||||||||||
| TOTAL COMMON EQUITIES | 222,214,109 | ||||||||||
| (Cost $164,830,756) | |||||||||||
matthewsasia.com | 800.789.ASIA 23
Matthews Asia Pacific Fund December 31, 2009
Schedule of Investmentsa (continued)
PREFERRED EQUITIES: 1.5%
| Shares | Value | ||||||||||
| SOUTH KOREA: 1.5% | |||||||||||
| Hyundai Motor Co., Ltd. Pfd. | 96,520 | $ | 3,466,214 | ||||||||
| Total South Korea | 3,466,214 | ||||||||||
| TOTAL PREFERRED EQUITIES | 3,466,214 | ||||||||||
| (Cost $1,069,680) | |||||||||||
| TOTAL INVESTMENTS: 99.1% | 225,680,323 | ||||||||||
| (Cost $165,900,436c) | |||||||||||
| CASH AND OTHER ASSETS, LESS LIABILITIES: 0.9% | 1,970,193 | ||||||||||
| NET ASSETS: 100.0% | $ | 227,650,516 | |||||||||
a Certain securities were fair valued under the discretion of the Board of Trustees (Note 1-A).
b Non-income producing security.
c Cost for Federal income tax purposes is $168,900,856 and net unrealized appreciation consists of:
| Gross unrealized appreciation | $ | 65,863,174 | |||||
| Gross unrealized depreciation | (9,083,707 | ) | |||||
| Net unrealized appreciation | $ | 56,779,467 | |||||
ADR American Depositary Receipt
BHD Berhad
Pfd. Preferred
REIT Real Estate Investment Trust
See accompanying notes to financial statements.
24 MATTHEWS ASIA FUNDS

ASIA GROWTH STRATEGIES
PORTFOLIO MANAGERS
Richard H. Gao
Lead Manager
Sharat Shroff, CFA
Lead Manager
Mark W. Headley
Co-Manager
FUND FACTS
| Ticker | MAPTX | ||||||
| Inception Date | 9/12/94 | ||||||
| Assets | $3.6 billion | ||||||
| NAV | $19.23 | ||||||
| Total # of Positions | 76 | ||||||
Fiscal Year 2009 Ratios
| Portfolio Turnover | 13.22 | %1 | |||||
| Gross Expense Ratio | 1.13 | %2 | |||||
Benchmarks
MSCI AC Asia ex Japan Index
MSCI AC Far East ex Japan Index
Redemption Fee
2% within first 90 calendar days of purchase
OBJECTIVE
Long-term capital appreciation.
STRATEGY
Under normal market conditions, the Fund seeks to achieve its investment objective by investing at least 80% of its total net assets, which include borrowings for investment purposes, in the common and preferred stocks of companies located in Asia, excluding Japan.
1 The lesser of fiscal year 2009 long-term purchase costs or sales proceeds divided by the average monthly market value of long-term securities.
2 Matthews Asia Funds does not charge 12b-1 fees.
Matthews Pacific Tiger Fund
Portfolio Manager Commentary
For the year ending December 31, 2009, the Matthews Pacific Tiger Fund gained 75.37%, while its benchmark, the MSCI All Country Asia ex Japan Index, increased by 72.53%. More than half of these gains were recorded in the second quarter underscoring the virtues of staying fully invested through some of the worst periods in the history of Asia ex-Japan's equity market. The outperformance relative to the benchmark was driven by consumer stocks in China and Indonesia, while the portfolio's underweight in energy and materials stocks hurt relative performance.
The consumer in Asia, particularly in China, continues to be a driver of the region's growth. The Fund's primary emphasis is on investing in companies that benefit from spending related to the consumption of staples such as food items and personal care—areas we added to in 2009. We remain convinced of the secular growth that is underpinned by a rise in household income and believe it will continue for several years. If anything, the recent crisis has highlighted the breadth and depth of the Chinese economy: even as some of China's coastal and southern cities were experiencing slow to negative growth, western areas of the country and its other smaller cities registered sustained momentum helped by government programs. These cities saw a rise in prices of food commodities over the last few years and better availability of credit. As we enter 2010, we remain focused on leveraging opportunities arising from the advancement of s ocial infrastructure programs needed to spur domestic consumption across the region, most notably in China.
In the face of one of the worst crises to hit the global economy, Asian consumers, particularly in China, India and Indonesia, demonstrated their strength and resilience. The portfolio's automotive holdings in China and Indonesia were up significantly as the year progressed, benefiting from government subsidy programs, growing consumer income and a low interest rate environment. During the year, China eclipsed the U.S. as the world's largest market for auto sales—this news sparked a sharp recovery in Dongfeng Motor Group. This outcome is in stark contrast to the severe decline the stock suffered in 2008 when it was being priced for value destruction. After Dongfeng's outperformance last year, valuations are pricing in some fairly high growth expectations for the company. While we believe Dongfeng's business model and management team are key drivers of shareholder value creation, we do not intend to overpay for the company's earnings or production capacity.
The Fund's financial holdings were positive contributors for the year, due primarily to a sharp recovery in real estate stocks. Beyond the ongoing demand for residential housing in economies such as China and India, some important structural reforms took place that may benefit commercial property owners. In October, China amended legislation to allow insurance companies to invest a greater percentage of their assets in properties. Across the region, the risks associated with real estate stocks stem from monetary policies being pursued outside Asia. In particular, if the U.S. Federal Reserve persists with a loose monetary policy then the odds of an acceleration in overseas inflows to Asia's capital markets increases. This could then lead to overvaluation and asset prices that deviate from fundamentals. There is already some evidence, albeit spotty, of lofty prices being paid for residential real estate in Hong Kong and in some ci ties in China. For the most part, prices across a broader segment of cities in China and India are still rising in more controlled fashion. We remain alert to the risks of a "melt up" and continue to monitor the quality of the underlying assets within each of our investments.
(continued)
matthewsasia.com | 800.789.ASIA 25
PERFORMANCE AS OF DECEMBER 31, 2009
| Average Annual Total Returns | |||||||||||||||||||||||||||
| 3 Months | 1 Year | 3 Years | 5 Years | 10 Years | Inception 9/12/94 | ||||||||||||||||||||||
| Matthews Pacific Tiger Fund | 7.60 | % | 75.37 | % | 8.10 | % | 14.50 | % | 11.55 | % | 9.13 | % | |||||||||||||||
| MSCI AC Asia ex Japan Index3 | 6.59 | % | 72.53 | % | 5.02 | % | 13.79 | % | 6.55 | % | 3.62 | %4 | |||||||||||||||
| MSCI AC Far East ex Japan Index3 | 6.46 | % | 69.39 | % | 4.79 | % | 13.13 | % | 5.92 | % | 3.25 | %4 | |||||||||||||||
| Lipper Pacific ex Japan Fund Category Average5 | 6.49 | % | 71.34 | % | 4.72 | % | 13.05 | % | 7.53 | % | 5.22 | %4 | |||||||||||||||
Performance assumes reinvestment of all dividends and/or distributions before taxes. All performance quoted represents past performance and is no guarantee of future results. Investment return and principal value will fluctuate with market conditions so that when redeemed, shares may be worth more or less than their original cost. Current performance may be lower or higher than the return figures quoted. Returns would have been lower if certain of the Fund's fees and expenses had not been waived. For the Fund's most recent month-end performance visit matthewsasia.com.
GROWTH OF A $10,000 INVESTMENT SINCE INCEPTION
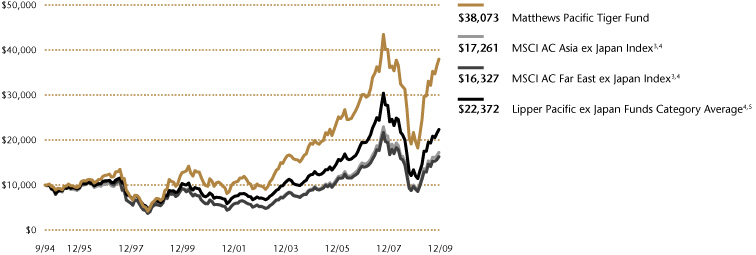
Plotted monthly. The performance data and graph do not reflect the deduction of taxes that a shareholder would pay on dividends, capital gain distributions or redemption of Fund shares. Values are in US$.
3 It is not possible to invest directly in an index. Source: Index data from Morgan Stanley Capital Management; total return calculations performed by PNC Global Investment Servicing (U.S.) Inc. Please see page 59 for index definitions.
4 Calculated from 8/31/94.
5 The Lipper Category Average does not reflect sales charges and is based on total return, including reinvestment of dividends and capital gains for the stated periods.
TOP TEN HOLDINGS6
| Country | % of Net Assets | ||||||||||
| LS Corp. | South Korea | 2.6 | % | ||||||||
| Hang Lung Group, Ltd. | China/Hong Kong | 2.5 | % | ||||||||
| Tencent Holdings, Ltd. | China/Hong Kong | 2.4 | % | ||||||||
| PT Bank Central Asia | Indonesia | 2.4 | % | ||||||||
| HDFC Bank, Ltd. | India | 2.3 | % | ||||||||
| Hon Hai Precision Industry Co., Ltd. | Taiwan | 2.2 | % | ||||||||
| PT Telekomunikasi Indonesia | Indonesia | 2.2 | % | ||||||||
| Swire Pacific, Ltd. A Shares | China/Hong Kong | 2.2 | % | ||||||||
| Ctrip.com International, Ltd. | China/Hong Kong | 2.1 | % | ||||||||
| Tingyi (Cayman Islands) Holding Corp. | China/Hong Kong | 2.0 | % | ||||||||
| % OF ASSETS IN TOP TEN | 22.9 | % | |||||||||
6 Holdings may combine more than one security from same issuer and related depositary receipts.
26 MATTHEWS ASIA FUNDS
Matthews Pacific Tiger Fund
Portfolio Manager Commentary (continued)
While we do not select stocks based on political outcomes, there were important political transitions in 2009, and a number of events that impacted stock performance in the region. Taiwan's relations with China are improving and there were some tangible developments in normalizing cross-strait trade and economic integration, including the first instance of a Chinese telecom company investing directly in Taiwan. Stronger capital links between the two economies should benefit both countries, including Taiwan's Yuanta Financial Holdings, a new Fund holding. Yuanta is also one of Taiwan's largest brokerage firms with a market share of around 12%—nearly double that of the second-largest player. The firm is trying to position itself to benefit from the opening of financial markets in China following progress on an Economic Cooperation and Framework Agreement between China and Taiwan in 2009. There may be setbacks and delays in co operation between the two sides, but we take comfort in Yuanta's dominance in its home market.
Elsewhere, results from general elections in India and Indonesia in 2009 provided a boost to the equity markets in those countries, and may set the stage for a longer-term pick up in investment spending. Coupled with the domestically driven nature of both these economies, the election results sparked a sharp rally that lifted several different asset classes, local currencies being one of them. Indonesia's rupiah was one of the best-performing currencies in 2009, and bond yields there have also tightened sharply. Despite reasons to be optimistic about Indonesia, inflation remains among the risks, and it was not so long ago—the end of 2008—that the rupiah depreciated by almost 35% in a single month. Our holdings in Indonesia are, therefore, more defensively oriented.
At the start of the year, we argued that "sudden withdrawal of foreign investors can often lead to a dislocation between fundamentals and stock prices," and it seems that we have come full circle. In today's environment, the risk stems from investors rushing into Asia, attracted by enticing headlines and past performance. It is important to note that valuation levels are at or above historical averages. We remain committed to a discipline that searches for long-term growth but strives to avoid overvalued assets. This can be challenging when investors fixate on a particular country or sector over a short-term horizon. As we look ahead to the next decade, it seems clear that Asia is entering a period of somewhat more mature growth relative to its own history, but one that could be more profitable. In building the portfolio for the next decade, we believe that the best ideas may emanate from areas that are not obvious at present. W e will continue to canvas all of Asia ex-Japan, including some of the region's smaller markets, for compelling long-term investment opportunities.
COUNTRY ALLOCATION (%)
| China/Hong Kong | 36.0 | ||||||
| India | 18.1 | ||||||
| South Korea | 16.1 | ||||||
| Taiwan | 8.1 | ||||||
| Indonesia | 6.1 | ||||||
| Malaysia | 4.6 | ||||||
| Thailand | 4.2 | ||||||
| Singapore | 3.6 | ||||||
| Philippines | 1.2 | ||||||
| Vietnam | 0.3 | ||||||
| Cash and Other Assets, Less Liabilities | 1.7 | ||||||
SECTOR ALLOCATION (%)
| Financials | 32.1 | ||||||
| Consumer Discretionary | 17.0 | ||||||
| Information Technology | 15.8 | ||||||
| Consumer Staples | 8.3 | ||||||
| Health Care | 7.4 | ||||||
| Industrials | 7.0 | ||||||
| Telecommunication Services | 4.9 | ||||||
| Utilities | 2.9 | ||||||
| Materials | 1.8 | ||||||
| Energy | 1.1 | ||||||
| Cash and Other Assets, Less Liabilities | 1.7 | ||||||
MARKET CAP EXPOSURE (%)7
| Large Cap (Over $5B) | 60.2 | ||||||
| Mid Cap ($1B-$5B) | 34.0 | ||||||
| Small Cap (Under $1B) | 4.1 | ||||||
| Cash and Other Assets, Less Liabilities | 1.7 | ||||||
7 Source: FactSet Research Systems. Percentage values in data are rounded to the nearest tenth of one percent; the values may not sum to 100% due to rounding.
matthewsasia.com | 800.789.ASIA 27
Matthews Pacific Tiger Fund December 31, 2009
Schedule of Investmentsa
COMMON EQUITIES: 98.3%
| Shares | Value | ||||||||||
| CHINA/HONG KONG: 36.0% | |||||||||||
| Hang Lung Group, Ltd. | 18,089,000 | $ | 89,459,512 | ||||||||
| Tencent Holdings, Ltd. | 3,949,800 | 85,425,162 | |||||||||
| Swire Pacific, Ltd. A Shares | 6,376,500 | 77,113,352 | |||||||||
| Ctrip.com International, Ltd. ADRb | 1,033,975 | 74,301,443 | |||||||||
| Tingyi (Cayman Islands) Holding Corp. | 29,096,000 | 71,998,021 | |||||||||
| Ping An Insurance (Group) Co. of China, Ltd. H Shares | 7,866,000 | 68,396,173 | |||||||||
| Dongfeng Motor Group Co., Ltd. H Shares | 44,440,000 | 63,458,800 | |||||||||
| Lenovo Group, Ltd. | 99,568,000 | 61,704,537 | |||||||||
| China Mobile, Ltd. ADR | 1,256,750 | 58,350,903 | |||||||||
| China Merchants Bank Co., Ltd. H Shares | 22,182,350 | 57,716,287 | |||||||||
| Hengan International Group Co., Ltd. | 7,171,000 | 53,095,833 | |||||||||
| Shangri-La Asia, Ltd. | 28,326,000 | 53,071,121 | |||||||||
| China Vanke Co., Ltd. B Shares | 41,875,296 | 52,324,531 | |||||||||
| China Resources Land, Ltd. | 22,558,000 | 50,776,989 | |||||||||
| Hong Kong Exchanges and Clearing, Ltd. | 2,839,500 | 50,521,514 | |||||||||
| China Resources Enterprise, Ltd. | 13,700,000 | 49,770,479 | |||||||||
| Mindray Medical International, Ltd. ADR | 1,324,297 | 44,920,154 | |||||||||
| NetEase.com, Inc. ADRb | 1,177,350 | 44,280,134 | |||||||||
| Dairy Farm International Holdings, Ltd. | 7,139,646 | 42,641,543 | |||||||||
| New Oriental Education & Technology Group, Inc. ADRb | 539,400 | 40,784,034 | |||||||||
| NWS Holdings, Ltd. | 15,032,636 | 27,590,421 | |||||||||
| Inspur International, Ltd. | 180,000,000 | 25,589,349 | |||||||||
| Shenzhen Chiwan Wharf Holdings, Ltd. B Shares | 11,949,117 | 19,863,645 | |||||||||
| Baidu, Inc. ADRb | 42,000 | 17,271,660 | |||||||||
| Sinopharm Group Co., Ltd. H Sharesb | 1,256,400 | 4,420,622 | |||||||||
| Total China/Hong Kong | 1,284,846,219 | ||||||||||
| INDIA: 18.1% | |||||||||||
| HDFC Bank, Ltd. | 1,997,184 | 72,772,246 | |||||||||
| Housing Development Finance Corp. | 1,087,137 | 62,200,585 | |||||||||
| Tata Power Co., Ltd. | 1,935,014 | 56,940,000 | |||||||||
| Sun Pharmaceutical Industries, Ltd. | 1,665,363 | 53,835,094 | |||||||||
| Infosys Technologies, Ltd. | 948,401 | 52,783,363 | |||||||||
| Unitech, Ltd. | 27,649,406 | 48,621,587 | |||||||||
| Kotak Mahindra Bank, Ltd. | 2,787,941 | 48,032,819 | |||||||||
| Bharti Airtel, Ltd. | 5,563,480 | 39,310,253 | |||||||||
| Larsen & Toubro, Ltd. | 1,069,599 | 38,509,989 | |||||||||
| Dabur India, Ltd. | 10,030,888 | 34,049,028 | |||||||||
| Titan Industries, Ltd. | 989,621 | 30,124,603 | |||||||||
| Glenmark Pharmaceuticals, Ltd. | 4,529,022 | 26,756,814 | |||||||||
| Sintex Industries, Ltd. | 4,505,656 | 26,467,976 | |||||||||
| Sun TV Network, Ltd. | 3,402,590 | 24,920,788 | |||||||||
| Infosys Technologies, Ltd. ADR | 219,611 | 12,137,900 | |||||||||
| ICICI Bank, Ltd. ADR | 226,800 | 8,552,628 | |||||||||
| HDFC Bank, Ltd. ADR | 63,900 | 8,312,112 | |||||||||
| Total India | 644,327,785 | ||||||||||
| Shares | Value | ||||||||||
| SOUTH KOREA: 16.1% | |||||||||||
| LS Corp. | 943,281 | $ | 93,830,152 | ||||||||
| Hyundai Mobis | 485,000 | 71,071,508 | |||||||||
| POSCO | 123,000 | 64,866,694 | |||||||||
| NHN Corp.b | 379,802 | 62,772,892 | |||||||||
| Amorepacific Corp. | 65,152 | 52,257,005 | |||||||||
| Cheil Worldwide, Inc. | 177,154 | 47,976,350 | |||||||||
| Yuhan Corp. | 289,321 | 44,225,229 | |||||||||
| MegaStudy Co., Ltd. | 193,231 | 39,721,848 | |||||||||
| Hana Financial Group | 1,057,923 | 29,901,462 | |||||||||
| Hyundai Development Co. | 776,952 | 25,158,015 | |||||||||
| Samsung Securities Co., Ltd. | 426,989 | 23,115,823 | |||||||||
| S1 Corp. | 427,918 | 17,788,975 | |||||||||
| Total South Korea | 572,685,953 | ||||||||||
| TAIWAN: 8.1% | |||||||||||
| Hon Hai Precision Industry Co., Ltd. | 17,104,492 | 79,991,826 | |||||||||
| Taiwan Semiconductor Manufacturing Co., Ltd. | 33,587,513 | 67,694,775 | |||||||||
| Yuanta Financial Holding Co., Ltd. | 77,500,000 | 56,706,681 | |||||||||
| Synnex Technology International Corp. | 26,039,200 | 56,238,466 | |||||||||
| President Chain Store Corp. | 12,442,608 | 29,556,523 | |||||||||
| Total Taiwan | 290,188,271 | ||||||||||
| INDONESIA: 6.1% | |||||||||||
| PT Bank Central Asia | 166,625,000 | 85,289,819 | |||||||||
| PT Telekomunikasi Indonesia | 67,960,500 | 67,649,661 | |||||||||
| PT Astra International | 14,665,230 | 53,915,173 | |||||||||
| PT Telekomunikasi Indonesia ADR | 275,700 | 11,014,215 | |||||||||
| Total Indonesia | 217,868,868 | ||||||||||
| MALAYSIA: 4.6% | |||||||||||
| Genting BHD | 24,807,700 | 52,877,192 | |||||||||
| KNM Group BHD | 172,000,000 | 38,320,435 | |||||||||
| Top Glove Corp. BHD | 12,587,980 | 36,952,828 | |||||||||
| Public Bank BHD | 10,679,337 | 35,213,623 | |||||||||
| Total Malaysia | 163,364,078 | ||||||||||
| THAILAND: 4.2% | |||||||||||
| Bank of Ayudhya Public Co., Ltd. NVDR | 83,968,600 | 56,757,590 | |||||||||
| Land & Houses Public Co., Ltd. | 224,719,500 | 44,811,948 | |||||||||
| Central Pattana Public Co., Ltd. | 43,346,100 | 26,395,259 | |||||||||
| Land & Houses Public Co., Ltd. NVDR | 122,450,000 | 23,054,902 | |||||||||
| Total Thailand | 151,019,699 | ||||||||||
| SINGAPORE: 3.6% | |||||||||||
| Parkway Holdings, Ltd.b | 26,194,540 | 54,136,414 | |||||||||
| Hyflux, Ltd. | 17,990,187 | 45,123,617 | |||||||||
| Keppel Land, Ltd. | 11,762,000 | 29,065,306 | |||||||||
| Total Singapore | 128,325,337 | ||||||||||
| PHILIPPINES: 1.2% | |||||||||||
| SM Prime Holdings, Inc. | 198,519,117 | 41,809,827 | |||||||||
| Total Philippines | 41,809,827 | ||||||||||
28 MATTHEWS ASIA FUNDS
Matthews Pacific Tiger Fund December 31, 2009
Schedule of Investmentsa (continued)
COMMON EQUITIES (continued)
| Shares | Value | ||||||||||
| VIETNAM: 0.3% | |||||||||||
| Vietnam Dairy Products JSC | 3,288,630 | $ | 11,529,173 | ||||||||
| Total Vietnam | 11,529,173 | ||||||||||
| TOTAL INVESTMENTS: 98.3% | 3,505,965,210 | ||||||||||
| (Cost $2,590,562,912c) | |||||||||||
| CASH AND OTHER ASSETS, LESS LIABILITIES: 1.7% | 59,779,801 | ||||||||||
| NET ASSETS: 100.0% | $ | 3,565,745,011 | |||||||||
a Certain securities were fair valued under the discretion of the Board of Trustees (Note 1-A).
b Non-income producing security.
c Cost for Federal income tax purposes is $2,612,311,977 and net unrealized appreciation consists of:
| Gross unrealized appreciation | $ | 967,023,598 | |||||
| Gross unrealized depreciation | (73,370,365 | ) | |||||
| Net unrealized appreciation | $ | 893,653,233 | |||||
ADR American Depositary Receipt
BHD Berhad
JSC Joint Stock Co.
NVDR Non-voting Depositary Receipt
See accompanying notes to financial statements.
matthewsasia.com | 800.789.ASIA 29

ASIA GROWTH STRATEGIES
PORTFOLIO MANAGERS
Richard H. Gao
Lead Manager
Andrew Foster
Co-Manager
FUND FACTS
| Ticker | MCHFX | ||||||
| Inception Date | 2/19/98 | ||||||
| Assets | $2.6 billion | ||||||
| NAV | $25.50 | ||||||
| Total # of Positions | 65 | ||||||
Fiscal Year 2009 Ratios
| Portfolio Turnover | 5.28 | %1 | |||||
| Gross Expense Ratio | 1.21 | %2 | |||||
Benchmark
MSCI China Index
Redemption Fee
2% within first 90 calendar days of purchase
OBJECTIVE
Long-term capital appreciation.
STRATEGY
Under normal market conditions, the Fund seeks to achieve its investment objective by investing at least 80% of its total net assets, which include borrowings for investment purposes, in the common and preferred stocks of companies located in China and Taiwan. China includes its administrative and other districts, such as Hong Kong.
1 The lesser of fiscal year 2009 long-term purchase costs or sales proceeds divided by the average monthly market value of long-term securities.
2 Matthews Asia Funds does not charge 12b-1 fees.
Matthews China Fund
Portfolio Manager Commentary
For the year ending December 31, 2009, the Matthews China Fund gained 78.30%, outperforming its benchmark, the MSCI China Index, which rose 62.63%. Strong momentum for Chinese equities continued in the fourth quarter, with the Fund advancing 11.89%, versus the benchmark gain of 9.56%.
After performing poorly in 2008 amid the widespread global financial crisis, Chinese stocks staged a robust comeback in 2009, and China demonstrated that its economy can be driven by internal growth, rather than relying on exports. Although official numbers have yet to be released, China should be able to achieve its goal of maintaining GDP growth of 8% for the year. Fixed-asset investments and consumption were key drivers of China's growth; however, the traditionally important export sector became a drag on growth. China's US$590 billion stimulus program played a key role in boosting the economy through various areas of infrastructure, and the purchasing power of Chinese consumers that was triggered by the program was quite impressive. Domestic demand in areas ranging from automotives to luxury goods, electronic appliances and real estate recovered rapidly during the year.
China's increasing internal growth bodes well for the Fund, which has long held overweight positions in the country's consumer-related sectors in anticipation of growing domestic consumption. This year, the strategy was particularly rewarding. The Fund's holdings in the consumer discretionary, consumer staples, information technology and financials sectors contributed the majority of the portfolio's gains.
One investment criteria for the Fund's domestic-oriented holdings is that they are either a leader in their industry or have the potential to be a leader with impressive brand recognition. Although the Chinese consumer sector offers strong growth potential, it is also very competitive and, in many cases, fragmented. Only industry leaders with strong branding are most likely to survive. One of the Fund's holdings, Ports Design, has become one of China's most recognized high-end fashion brands. Originally a lesser-known Canadian manufacturer of women's and men's clothing and accessories, Ports Design entered the Chinese market in the early 1990s. The company hired top international designers—based overseas—imported all its raw materials from Europe and positioned itself as a luxury brand. The company manufactures all its products in China with a high level of quality control. As an early entrant to the country, the firm gradually built up its brand name through advertising placements, sponsorships and store openings in prime locations in major Chinese cities. Today, Ports Design enjoys a high profit margin and exemplifies the rewards to shareholders of successful brand building.
In the financial sector, China took some noteworthy steps during the year to further open its capital markets to both domestic and foreign investors. A NASDAQ-style exchange for start-ups was launched in Shenzhen, opening up a new source of funding for entrepreneurs. China is also actively preparing to create an international exchange that would enable foreign companies to be listed domestically in the country. Meanwhile, China continues to be one of the most active places for initial public offerings (IPOs), providing investors more opportunities with its expanding stock market universe. A total of US$55 billion was raised through Chinese IPOs on both domestic and overseas markets during the year and the Fund participated in several of them.
An IPO we invested in was Sinopharm Group. For years, the Fund has sought investments in China's growing health care industry—a sector in which it can
(continued)
30 MATTHEWS ASIA FUNDS
PERFORMANCE AS OF DECEMBER 31, 2009
| Average Annual Total Returns | |||||||||||||||||||||||||||
| 3 Months | 1 Year | 3 Years | 5 Years | 10 Years | Inception 2/19/98 | ||||||||||||||||||||||
| Matthews China Fund | 11.89 | % | 78.30 | % | 15.70 | % | 22.23 | % | 17.18 | % | 13.53 | % | |||||||||||||||
| MSCI China Index3 | 9.56 | % | 62.63 | % | 9.96 | % | 23.83 | % | 9.72 | % | 4.14 | %4 | |||||||||||||||
| Lipper China Funds Category Average4 | 9.82 | % | 69.27 | % | 7.38 | % | 16.01 | % | 10.22 | % | 10.09 | %4 | |||||||||||||||
Performance assumes reinvestment of all dividends and/or distributions before taxes. All performance quoted represents past performance and is no guarantee of future results. Investment return and principal value will fluctuate with market conditions so that when redeemed, shares may be worth more or less than their original cost. Current performance may be lower or higher than the return figures quoted. Returns would have been lower if certain of the Fund's fees and expenses had not been waived. For the Fund's most recent month-end performance visit matthewsasia.com.
GROWTH OF A $10,000 INVESTMENT SINCE INCEPTION
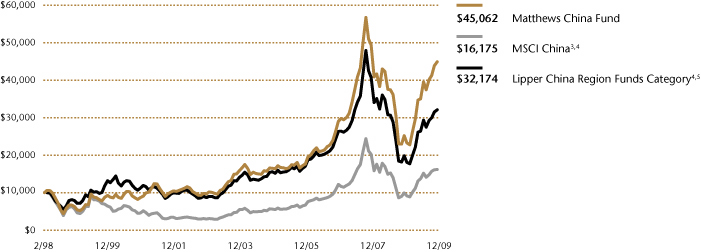
Plotted monthly. The performance data and graph do not reflect the deduction of taxes that a shareholder would pay on dividends, capital gain distributions or redemption of Fund shares. Values are in US$.
3 It is not possible to invest directly in an index. Source: Index data from Morgan Stanley Capital Management; total return calculations performed by PNC Global Investment Servicing (U.S.) Inc. Please see page 59 for index definition.
4 Calculated from 2/28/98.
5 The Lipper Category Average does not reflect sales charges and is based on total return, including reinvestment of dividends and capital gains for the stated periods.
TOP TEN HOLDINGS6
| Sector | % of Net Assets | ||||||||||
| Dongfeng Motor Group Co., Ltd. | Consumer Discretionary | 3.4 | % | ||||||||
| ZTE Corp. | Information Technology | 3.1 | % | ||||||||
| Tingyi (Cayman Islands) Holding Corp. | Consumer Staples | 3.0 | % | ||||||||
| Tencent Holdings, Ltd. | Information Technology | 2.5 | % | ||||||||
| China Life Insurance Co., Ltd. | Financials | 2.5 | % | ||||||||
| Golden Eagle Retail Group, Ltd. | Consumer Discretionary | 2.5 | % | ||||||||
| China Resources Enterprise, Ltd. | Consumer Discretionary | 2.5 | % | ||||||||
| China Mobile, Ltd. | Telecommunication Services | 2.4 | % | ||||||||
| China Merchants Holdings International Co., Ltd. | Industrials | 2.3 | % | ||||||||
| Ping An Insurance (Group) Co. of China, Ltd. | Financials | 2.3 | % | ||||||||
| % OF ASSETS IN TOP TEN | 26.5 | % | |||||||||
CHINA EXPOSURE7
| SAR (Hong Kong) | 40.1 | % | |||||
| H Share | 33.8 | % | |||||
| China-affiliated Corporations | 15.4 | % | |||||
| Overseas Listed | 7.5 | % | |||||
| B Share | 1.5 | % | |||||
| Cash and Other Assets, Less Liabilities | 1.7 | % | |||||
6 Holdings may combine more than one security from same issuer and related depositary receipts.
7 SAR (Hong Kong) companies are companies that conduct business in Hong Kong and/or mainland China. H Shares are mainland China companies listed on the Hong Kong exchange but incorporated in mainland China. China-affiliated corporations (CAC), also known as "Red Chips," are mainland China companies with partial state ownership listed in Hong Kong, and incorporated in Hong Kong. Overseas Listed (OL) companies are companies that conduct business in mainland China but listed in overseas markets such as Japan, Singapore, Taiwan and the United States. B Shares are mainland Chinese companies listed on the Shanghai and Shenzhen stock exchanges, available to both Chinese and non-Chinese investors.
matthewsasia.com | 800.789.ASIA 31
SECTOR ALLOCATION (%)
| Consumer Discretionary | 25.2 | ||||||
| Financials | 19.2 | ||||||
| Information Technology | 12.6 | ||||||
| Industrials | 12.0 | ||||||
| Consumer Staples | 11.2 | ||||||
| Energy | 6.3 | ||||||
| Utilities | 5.7 | ||||||
| Telecommunication Services | 3.5 | ||||||
| Health Care | 1.9 | ||||||
| Materials | 0.7 | ||||||
| Cash and Other Assets, Less Liabilities | 1.7 | ||||||
MARKET CAP EXPOSURE (%)8
| Large Cap (Over $5B) | 65.6 | ||||||
| Mid Cap ($1B-$5B) | 30.1 | ||||||
| Small Cap (Under $1B) | 2.6 | ||||||
| Cash and Other Assets, Less Liabilities | 1.7 | ||||||
8 Source: FactSet Research Systems. Percentage values in data are rounded to the nearest tenth of one percent; the values may not sum to 100% due to rounding.
Matthews China Fund
Portfolio Manager Commentary (continued)
be difficult to find solid companies. The public offering this year of Sinopharm Group—China's largest pharmaceutical distributor with a total market share of about 11%—caught our attention. We were impressed by the company's strong domestic distribution networks and successful track record of acquisitions. We continue to look for other leaders in the health care industry to add to the portfolio.
While the Fund's main focus is growth, we are also cautious about valuations and strive to ensure that we are not overpaying for this growth. The Fund became more aggressive in building its consumer and financial holdings; in particular, we took advantage of a sell-off in the stock market in late 2008 and early 2009 to add to property-related companies. Toward the end of 2009, after our consumer holdings posted strong gains, we started to trim some of these positions and switched our focus to companies in industries such as telecommunications and infrastructure. Valuations in these lagging industries are relatively cheap while growth prospects remain intact. We also started to build positions in companies that we believe should benefit from the global economic recovery, including Li & Fung, a global apparel supply chain manager, and China Merchants Holdings International, a conglomerate that operates container and cargo term inals, port transportation and container manufacturing.
As we enter 2010, the Chinese central bank raised its reserve ratio by 50 basis points (0.50%) for the first time since June 2008, sending a clear signal about government concerns over inflation and an overheating economy. China's economy expanded 8.9% in the third quarter of 2009, even as the bank lending that drove its recovery slowed. While economic growth continues to accelerate, China seems to be keenly aware of the negative side effects of excessive financial liquidity that has mostly resulted from its earlier stimulus program. We believe that the central bank will continue to fine tune its expansionary policy and seek moderate loan growth while managing inflation. Drastic tightening measures are not expected to occur in the near term as policymakers have reaffirmed a moderately loose monetary policy.
32 MATTHEWS ASIA FUNDS
Matthews China Fund December 31, 2009
Schedule of Investmentsa
COMMON EQUITIES: CHINA/HONG KONG: 98.3%
| Shares | Value | ||||||||||
| CONSUMER DISCRETIONARY: 25.2% | |||||||||||
| Distributors: 4.7% | |||||||||||
| China Resources Enterprise, Ltd. | 17,332,000 | $ | 62,965,106 | ||||||||
| Li & Fung, Ltd. | 13,929,200 | 57,589,402 | |||||||||
| 120,554,508 | |||||||||||
| Hotels, Restaurants & Leisure: 4.7% | |||||||||||
| Ctrip.com International, Ltd. ADRb | 713,600 | 51,279,296 | |||||||||
| Café de Coral Holdings, Ltd. | 16,808,100 | 38,387,141 | |||||||||
| Shangri-La Asia, Ltd. | 16,033,600 | 30,040,286 | |||||||||
| 119,706,723 | |||||||||||
| Multiline Retail: 4.1% | |||||||||||
| Golden Eagle Retail Group, Ltd. | 31,096,000 | 63,075,289 | |||||||||
| Parkson Retail Group, Ltd. | 23,947,500 | 42,140,715 | |||||||||
| 105,216,004 | |||||||||||
| Textiles, Apparel & Luxury Goods: 4.1% | |||||||||||
| Li Ning Co., Ltd. | 13,332,500 | 50,554,373 | |||||||||
| Ports Design, Ltd. | 13,438,500 | 41,433,944 | |||||||||
| Glorious Sun Enterprises, Ltd. | 33,994,000 | 12,642,082 | |||||||||
| 104,630,399 | |||||||||||
| Automobiles: 3.4% | |||||||||||
| Dongfeng Motor Group Co., Ltd. H Shares | 60,878,000 | 86,931,702 | |||||||||
| Specialty Retail: 2.0% | |||||||||||
| Belle International Holdings, Ltd. | 44,930,000 | 52,050,113 | |||||||||
| Diversified Consumer Services: 1.4% | |||||||||||
| New Oriental Education & Technology Group, Inc. ADRb | 484,100 | 36,602,801 | |||||||||
| Media: 0.8% | |||||||||||
| Television Broadcasts, Ltd. | 2,542,000 | 12,212,783 | |||||||||
| AirMedia Group, Inc. ADRb | 1,021,400 | 7,670,714 | |||||||||
| 19,883,497 | |||||||||||
| Total Consumer Discretionary | 645,575,747 | ||||||||||
| FINANCIALS: 19.2% | |||||||||||
| Real Estate Management & Development: 6.4% | |||||||||||
| Swire Pacific, Ltd. A Shares | 4,163,000 | 50,344,685 | |||||||||
| Hang Lung Group, Ltd. | 8,856,000 | 43,797,525 | |||||||||
| China Vanke Co., Ltd. B Shares | 29,906,484 | 37,369,115 | |||||||||
| China Resources Land, Ltd. | 14,852,000 | 33,431,148 | |||||||||
| 164,942,473 | |||||||||||
| Commercial Banks: 6.2% | |||||||||||
| BOC Hong Kong Holdings, Ltd. | 25,215,500 | 56,650,985 | |||||||||
| China Merchants Bank Co., Ltd. H Shares | 18,517,800 | 48,181,489 | |||||||||
| China Construction Bank Corp. H Shares | 37,010,000 | 31,611,945 | |||||||||
| Bank of Communications Co., Ltd. H Shares | 19,607,000 | 22,550,677 | |||||||||
| 158,995,096 | |||||||||||
| Shares | Value | ||||||||||
| Insurance: 4.8% | |||||||||||
| Ping An Insurance (Group) Co. of China, Ltd. H Shares | 6,731,000 | $ | 58,527,160 | ||||||||
| China Life Insurance Co., Ltd. H Shares | 11,080,000 | 54,217,474 | |||||||||
| China Life Insurance Co., Ltd. ADR | 136,300 | 9,997,605 | |||||||||
| 122,742,239 | |||||||||||
| Diversified Financial Services: 1.8% | |||||||||||
| Hong Kong Exchanges and Clearing, Ltd. | 2,648,500 | 47,123,166 | |||||||||
| Total Financials | 493,802,974 | ||||||||||
| INFORMATION TECHNOLOGY: 12.6% | |||||||||||
| Internet Software & Services: 5.2% | |||||||||||
| Tencent Holdings, Ltd. | 3,023,200 | 65,384,918 | |||||||||
| Sina Corp.b | 821,900 | 37,133,442 | |||||||||
| NetEase.com, Inc. ADRb | 851,400 | 32,021,154 | |||||||||
| 134,539,514 | |||||||||||
| Computers & Peripherals: 3.2% | |||||||||||
| Lenovo Group, Ltd. | 88,832,000 | 55,051,196 | |||||||||
| TPV Technology, Ltd. | 45,168,000 | 27,657,399 | |||||||||
| 82,708,595 | |||||||||||
| Communications Equipment: 3.1% | |||||||||||
| ZTE Corp. H Shares | 12,843,236 | 78,962,726 | |||||||||
| Software: 1.1% | |||||||||||
| Kingdee International Software Group Co., Ltd.† | 120,330,000 | 26,796,138 | |||||||||
| Total Information Technology | 323,006,973 | ||||||||||
| INDUSTRIALS: 12.0% | |||||||||||
| Transportation Infrastructure: 3.6% | |||||||||||
| China Merchants Holdings International Co., Ltd. | 18,540,581 | 59,810,773 | |||||||||
| Beijing Capital International Airport Co., Ltd. H Sharesb | 29,740,000 | 19,527,635 | |||||||||
| GZI Transport, Ltd. | 36,765,000 | 14,595,388 | |||||||||
| 93,933,796 | |||||||||||
| Machinery: 3.1% | |||||||||||
| China South Locomotive and Rolling Stock Corp. H Shares | 70,400,000 | 51,410,868 | |||||||||
| China National Materials Co., Ltd. H Shares | 37,943,000 | 28,021,244 | |||||||||
| Sany Heavy Equipment International Holdings Co., Ltd.b | 138,000 | 174,605 | |||||||||
| 79,606,717 | |||||||||||
| Electrical Equipment: 2.2% | |||||||||||
| China High Speed Transmission Equipment Group Co., Ltd. | 23,313,000 | 56,603,103 | |||||||||
| Airlines: 1.4% | |||||||||||
| Air China, Ltd. H Sharesb | 45,585,900 | 35,339,914 | |||||||||
| Construction & Engineering: 0.9% | |||||||||||
| China Railway Construction Corp., Ltd. H Shares | 17,344,500 | 22,101,287 | |||||||||
matthewsasia.com | 800.789.ASIA 33
Matthews China Fund December 31, 2009
Schedule of Investmentsa (continued)
COMMON EQUITIES: CHINA/HONG KONG (continued)
| Shares | Value | ||||||||||
| Industrial Conglomerates: 0.8% | |||||||||||
| NWS Holdings, Ltd. | 11,017,276 | $ | 20,220,757 | ||||||||
| Total Industrials | 307,805,574 | ||||||||||
| CONSUMER STAPLES: 11.2% | |||||||||||
| Food Products: 5.2% | |||||||||||
| Tingyi (Cayman Islands) Holding Corp. | 31,007,000 | 76,726,788 | |||||||||
| China Yurun Food Group, Ltd. | 18,868,000 | 55,802,272 | |||||||||
| 132,529,060 | |||||||||||
| Beverages: 2.1% | |||||||||||
| Tsingtao Brewery Co., Ltd. H Shares | 9,707,000 | 53,693,890 | |||||||||
| Food & Staples Retailing: 2.0% | |||||||||||
| Lianhua Supermarket Holdings Co., Ltd. H Shares† | 17,150,000 | 51,603,893 | |||||||||
| Household & Personal Products: 1.9% | |||||||||||
| Hengan International Group Co., Ltd. | 6,797,000 | 50,326,646 | |||||||||
| Total Consumer Staples | 288,153,489 | ||||||||||
| ENERGY: 6.3% | |||||||||||
| Oil, Gas & Consumable Fuels: 5.2% | |||||||||||
| China Shenhua Energy Co., Ltd. H Shares | 11,211,000 | 54,421,653 | |||||||||
| CNOOC, Ltd. | 33,580,000 | 52,315,699 | |||||||||
| China Petroleum & Chemical Corp. (Sinopec) H Shares | 28,676,000 | 25,264,797 | |||||||||
| 132,002,149 | |||||||||||
| Energy Equipment & Services: 1.1% | |||||||||||
| China Oilfield Services, Ltd. H Shares | 24,186,000 | 28,686,285 | |||||||||
| Total Energy | 160,688,434 | ||||||||||
| UTILITIES: 5.7% | |||||||||||
| Electric Utilities: 2.2% | |||||||||||
| Cheung Kong Infrastructure Holdings, Ltd. | 14,771,500 | 56,171,444 | |||||||||
| Gas Utilities: 2.0% | |||||||||||
| Hong Kong & China Gas Co., Ltd. | 20,163,594 | 50,573,346 | |||||||||
| Independent Power Producers & Energy Traders: 1.5% | |||||||||||
| China Longyuan Power Group Corp. H Sharesb | 10,478,000 | 13,568,127 | |||||||||
| Datang International Power Generation Co., Ltd. H Shares | 30,990,000 | 13,247,507 | |||||||||
| Huaneng Power International, Inc. H Shares | 12,078,000 | 6,762,532 | |||||||||
| Huaneng Power International, Inc. ADR | 223,400 | 5,004,160 | |||||||||
| 38,582,326 | |||||||||||
| Total Utilities | 145,327,116 | ||||||||||
| Shares | Value | ||||||||||
| TELECOMMUNICATION SERVICES: 3.5% | |||||||||||
| Wireless Telecommunication Services: 2.4% | |||||||||||
| China Mobile, Ltd. | 4,532,083 | $ | 42,168,805 | ||||||||
| China Mobile, Ltd. ADR | 410,900 | 19,078,087 | |||||||||
| 61,246,892 | |||||||||||
| Diversified Telecommunication Services: 1.1% | |||||||||||
| China Communications Services Corp., Ltd. H Shares | 58,928,000 | 28,845,140 | |||||||||
| Total Telecommunication Services | 90,092,032 | ||||||||||
| HEALTH CARE: 1.9% | |||||||||||
| Health Care Equipment & Supplies: 1.1% | |||||||||||
| Mindray Medical International, Ltd. ADR | 844,468 | 28,644,355 | |||||||||
| Health Care Providers & Services: 0.8% | |||||||||||
| Sinopharm Group Co., Ltd. H Sharesb | 6,073,600 | 21,369,856 | |||||||||
| Total Health Care | 50,014,211 | ||||||||||
| MATERIALS: 0.7% | |||||||||||
| Construction Materials: 0.7% | |||||||||||
| China National Building Material Co., Ltd. H Shares | 8,606,000 | 17,681,770 | |||||||||
| Total Materials | 17,681,770 | ||||||||||
| TOTAL INVESTMENTS: 98.3% | 2,522,148,320 | ||||||||||
| (Cost $1,904,320,140c) | |||||||||||
| CASH AND OTHER ASSETS, LESS LIABILITIES: 1.7% | 43,856,989 | ||||||||||
| NET ASSETS: 100.0% | $ | 2,566,005,309 | |||||||||
a Certain securities were fair valued under the discretion of the Board of Trustees (Note 1-A).
b Non-income producing security.
c Cost for Federal income tax purposes is $1,907,451,310 and net unrealized appreciation consists of:
| Gross unrealized appreciation | $ | 678,358,004 | |||||
| Gross unrealized depreciation | (63,660,994 | ) | |||||
| Net unrealized appreciation | $ | 614,697,010 | |||||
† Affiliated Issuer, as defined under the Investment Company Act of 1940 (ownership of 5% or more of the outstanding voting securities of this issuer). (Note 4)
ADR American Depositary Receipt
See accompanying notes to financial statements.
34 MATTHEWS ASIA FUNDS

ASIA GROWTH STRATEGIES
PORTFOLIO MANAGERS
Sharat Shroff, CFA
Lead Manager
Andrew Foster
Co-Manager
FUND FACTS
| Ticker | MINDX | ||||||
| Inception Date | 10/31/05 | ||||||
| Assets | $720.9 million | ||||||
| NAV | $16.29 | ||||||
| Total # of Positions | 56 | ||||||
Fiscal Year 2009 Ratios
| Portfolio Turnover | 18.09 | %1 | |||||
| Gross Expense Ratio | 1.27 | %2 | |||||
Benchmark
Bombay Stock Exchange 100 Index
Redemption Fee
2% within first 90 calendar days of purchase
OBJECTIVE
Long-term capital appreciation.
STRATEGY
Under normal market conditions, the Fund seeks to achieve its investment objective by investing at least 80% of its total net assets, which include borrowings for investment purposes, in publicly traded common stocks, preferred stocks and convertible securities of companies located in India.
1 The lesser of fiscal year 2009 long-term purchase costs or sales proceeds divided by the average monthly market value of long-term securities.
2 Matthews Asia Funds does not charge 12b-1 fees.
Matthews India Fund
Portfolio Manager Commentary
For the year ending December 31, 2009, the Matthews India Fund gained 97.25%, while its benchmark, the Bombay Stock Exchange (BSE) 100 Index rose 95.83%, with most gains recorded in the first half of the year. In fact, the BSE 100 Index surged nearly 20% in a single day in May, reflecting investor excitement over the results of India's general elections. The Fund participated in the sharp single-day move in Indian markets as we maintain a philosophy of being fully invested at all times.
During the fourth quarter, the Fund returned 10.95%, while its benchmark increased by 7.05%. The relative outperformance stemmed from some of the portfolio's smaller and mid-size companies that benefited from better-than-expected earnings performance in the third quarter. Operating performance for these companies, in sectors such as consumer staples and industrials, is particularly noteworthy as it provides a favorable contrast to the mixed performance of their larger peers.
While 2008 was the worst year in the history of India's equity market, 2009 proved to be the second-best year of annual returns per the BSE 100 Index (only 2003 posted better returns). The volatility in U.S. dollar-denominated returns was especially exaggerated due to the fluctuation of the Indian rupee on the back of uneven foreign capital flows. We believe the past two years have shown it is difficult to predict the short-term course of the markets, and may be a fruitless exercise to attempt. In periods of such turbulence, we have maintained our discipline of investing in companies and businesses for the long term.
The volatility of capital and foreign exchange markets lies in stark contrast to the relative stability of the Indian economy, which has grown at a mid-single digit rate through the worst periods of the financial crisis and is recovering faster than many other world economies. The depth in the Indian economy has been particularly visible in the past two years with the increasing importance of rural spending as a component of the country's overall personal consumption. The Fund strives to identify such emerging opportunities, and maintains a strategy of focusing on smaller and mid-size companies that are nimble enough to benefit from such bottom-up growth.
This strategy was tested during the start of the year. In the aftermath of one of the worst corporate governance scandals to hit India, small and mid-size companies suffered a disproportionate decline in market capitalizations compared to their larger peers. The decline was fairly broad-based with little differentiation between companies. In this environment, we stayed consistent with our belief of building portfolios anchored in the analysis of individual companies. It was our conviction in the sustainability of these businesses that enabled us to stay invested, and to participate in the rather steep recovery that followed through the rest of the year.
The Fund's investment in Crompton Greaves, a manufacturer of power transmission and distribution equipment, demonstrates our approach of scouting for companies that may not be index heavyweights. Crompton Greaves has been competing with more established multinational companies in India for the last several decades. In recent years, the company has abandoned the "cost-plus" business model to focus on becoming technologically competitive with its multinational peers. In a sign of a calculated expansion strategy, the management team has deployed its cash flows from existing businesses, and made foreign acquisitions intended to enhance its technological expertise and keep pace with competitors. In spite of these promising acquisitions, and better
(continued)
matthewsasia.com | 800.789.ASIA 35
PERFORMANCE AS OF DECEMBER 31, 2009
| Average Annual Total Returns | |||||||||||||||||||
| 3 Months | 1 Year | 3 Years | Inception 10/31/05 | ||||||||||||||||
| Matthews India Fund | 10.95 | % | 97.25 | % | 6.85 | % | 16.43 | % | |||||||||||
| Bombay Stock Exchange 100 Index3 | 7.05 | % | 95.83 | % | 9.23 | % | 21.63 | % | |||||||||||
| Lipper Emerging Markets Funds Category Average4 | 7.59 | % | 75.74 | % | 2.00 | % | 11.89 | % | |||||||||||
Performance assumes reinvestment of all dividends and/or distributions before taxes. All performance quoted represents past performance and is no guarantee of future results. Investment return and principal value will fluctuate with market conditions so that when redeemed, shares may be worth more or less than their original cost. Current performance may be lower or higher than the return figures quoted. Returns would have been lower if certain of the Fund's fees and expenses had not been waived. For the Fund's most recent month-end performance visit matthewsasia.com.
GROWTH OF A $10,000 INVESTMENT SINCE INCEPTION
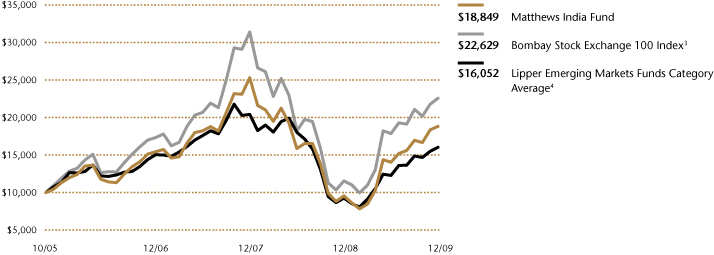
Plotted monthly. The performance data and graph do not reflect the deduction of taxes that a shareholder would pay on dividends, capital gain distributions or redemption of Fund shares. Values are in US$.
3 It is not possible to invest directly in an index. Source: Index data from Morgan Stanley Capital Management; total return calculations performed by PNC Global Investment Servicing (U.S.) Inc. Please see page 59 for index definition.
4 The Lipper Category Average does not reflect sales charges and is based on total return, including reinvestment of dividends and capital gains for the stated periods.
TOP TEN HOLDINGS5
| Sector | % of Net Assets | ||||||||||
| HDFC Bank, Ltd. | Financials | 4.5 | % | ||||||||
| Infosys Technologies, Ltd. | Information Technology | 3.7 | % | ||||||||
| Crompton Greaves, Ltd. | Industrials | 3.5 | % | ||||||||
| Dabur India, Ltd. | Consumer Staples | 3.3 | % | ||||||||
| Sun Pharmaceutical Industries, Ltd. | Health Care | 3.2 | % | ||||||||
| Jain Irrigation Systems, Ltd. | Industrials | 3.0 | % | ||||||||
| Reliance Industries, Ltd. | Energy | 2.9 | % | ||||||||
| Container Corp. of India, Ltd. | Industrials | 2.9 | % | ||||||||
| Gail India, Ltd. | Utilities | 2.8 | % | ||||||||
| Asian Paints, Ltd. | Materials | 2.7 | % | ||||||||
| % OF ASSETS IN TOP TEN | 32.5 | % | |||||||||
5 Holdings may combine more than one security from same issuer and related depositary receipts.
36 MATTHEWS ASIA FUNDS
Matthews India Fund
Portfolio Manager Commentary (continued)
operating performance, buyers of Crompton Greaves equities enjoy a valuation discount compared to its larger peers. With India's peak power deficit rising to 14% in recent years, there will likely be opportunities for Crompton Greaves to benefit from rising investments in the power sector. At the same time, we believe the real challenge for the management team is to continue to deploy its cash flow in accretive projects to sustain long-term returns for shareholders.
On a sector basis, the portfolio continues to maintain an overweight in industrials and a significant allocation to financials, which includes banks, insurance companies and real estate firms. As Indian banks posted stable results over several consecutive quarters, the perception of risk associated with global financials subsided, and stocks in the sector recovered strongly. By contrast, the recovery in the real estate sector seems more tenuous, and challenges stemming from a lack of transparency remain a hurdle for investors. However, both residential and commercial properties in the real estate sector are likely to grow at least in line with, if not faster than, the rest of the economy. One of the real estate holdings in the portfolio is Ascendas India Trust (AIT), a Singapore-listed firm with commercial real estate holdings in southern India. We were attracted to the stock's yield of close to 10% last year as well as the comp any's more robust accounting and governing principles, relative to those typically found in India's real estate sector. One risk we will monitor is the limitations of AIT's geographical concentration.
Given the recent appreciation in India's broader indices, valuations are at or slightly above historical averages. The volatility in the capital and foreign exchange markets underscores the importance of a longer investment horizon when investing in India. From that perspective, India offers much to be excited about. Compared with other emerging markets, India has a greater depth and breadth in the quality of its companies, and entrepreneurs who are mindful of returns on equity. In addition, the country's capital market infrastructure helps facilitate investment in these companies; firms which are driven mainly by domestic demand.
Several challenges remain for the Indian economy, including the structural challenge of attracting more stable, long-term foreign capital, particularly as the economy embarks on a much-needed investment cycle. It is encouraging that in the past two years, foreign direct investments (FDI) have accelerated sharply to a rate of almost 2% of GDP, up from less than 1% at the start of the century. To put this in perspective, the Chinese economy was attracting FDI at a rate of 4% to 6% of GDP during the investment-led growth of the 1990s. Beyond the changes in global risk appetite, the gradual removal of regulatory hurdles has been the biggest driver of this jump in FDI. India's political transition earlier this year set the stage for a continuation of these reforms, but history has shown that progress can come haltingly and require close monitoring.
India's more pressing and immediate risk stems from the prospect of a sharp rise in inflationary expectations driven by a combination of structural and cyclical factors like the recent rise in food prices. The central bank has already started to withdraw from the loose monetary policies enacted in the past two years. The risk is that the tightening process can lead to a disorderly rise in interest rates. Furthermore, India's equity market is likely to remain exposed to changes in global risk assessment. Pullbacks driven by these shorter-term factors are often investment opportunities as we continue to look for companies that are providing solutions to some of India's structural challenges.
SECTOR ALLOCATION (%)
| Financials | 26.2 | ||||||
| Industrials | 20.7 | ||||||
| Consumer Discretionary | 11.6 | ||||||
| Information Technology | 10.1 | ||||||
| Health Care | 8.0 | ||||||
| Consumer Staples | 6.5 | ||||||
| Utilities | 4.8 | ||||||
| Energy | 4.1 | ||||||
| Materials | 3.4 | ||||||
| Telecommunication Services | 2.2 | ||||||
| Cash and Other Assets, Less Liabilities | 2.4 | ||||||
MARKET CAP EXPOSURE (%)6
| Large Cap (Over $5B) | 31.5 | ||||||
| Mid Cap ($1B-$5B) | 47.6 | ||||||
| Small Cap (Under $1B) | 18.5 | ||||||
| Cash and Other Assets, Less Liabilities | 2.4 | ||||||
6 Source: FactSet Research Systems. Percentage values in data are rounded to the nearest tenth of one percent; the values may not sum to 100% due to rounding.
matthewsasia.com | 800.789.ASIA 37
Matthews India Fund December 31, 2009
Schedule of Investmentsa
COMMON EQUITIES: 94.7%
| Shares | Value | ||||||||||
| FINANCIALS: 26.2% | |||||||||||
| Commercial Banks: 13.3% | |||||||||||
| HDFC Bank, Ltd. ADR | 135,727 | $ | 17,655,368 | ||||||||
| Oriental Bank of Commerce | 2,946,834 | 15,748,962 | |||||||||
| Corporation Bank | 1,719,331 | 15,446,605 | |||||||||
| HDFC Bank, Ltd. | 408,033 | 14,867,673 | |||||||||
| Allahabad Bank | 4,550,000 | 12,202,815 | |||||||||
| Axis Bank, Ltd. | 575,032 | 12,143,271 | |||||||||
| ICICI Bank, Ltd. ADR | 178,283 | 6,723,052 | |||||||||
| ICICI Bank, Ltd. | 50,000 | 936,989 | |||||||||
| 95,724,735 | |||||||||||
| Diversified Financial Services: 4.3% | |||||||||||
| Kotak Mahindra Bank, Ltd. | 1,075,000 | 18,520,937 | |||||||||
| Infrastructure Development Finance Co., Ltd. | 2,135,735 | 7,050,393 | |||||||||
| SREI Infrastructure Finance, Ltd. | 3,125,000 | 5,173,801 | |||||||||
| 30,745,131 | |||||||||||
| Real Estate Management & Development: 3.4% | |||||||||||
| Unitech, Ltd. | 7,203,178 | 12,666,816 | |||||||||
| Ascendas India Trust | 17,090,000 | 11,812,068 | |||||||||
| Emami Infrastructure, Ltd.b | 212,681 | 326,609 | |||||||||
| 24,805,493 | |||||||||||
| Consumer Finance: 2.2% | |||||||||||
| Shriram Transport Finance Co., Ltd. | 1,497,977 | 15,710,322 | |||||||||
| Thrifts & Mortgage Finance: 1.9% | |||||||||||
| Housing Development Finance Corp. | 245,000 | 14,017,684 | |||||||||
| Capital Markets: 1.1% | |||||||||||
| HSBC InvestDirect India, Ltd.c | 1,439,981 | 7,675,670 | |||||||||
| Total Financials | 188,679,035 | ||||||||||
| INDUSTRIALS: 20.7% | |||||||||||
| Machinery: 7.6% | |||||||||||
| Jain Irrigation Systems, Ltd. | 1,166,127 | 21,761,955 | |||||||||
| Ashok Leyland, Ltd. | 18,511,277 | 19,568,788 | |||||||||
| Thermax, Ltd. | 1,043,128 | 13,587,163 | |||||||||
| 54,917,906 | |||||||||||
| Electrical Equipment: 3.5% | |||||||||||
| Crompton Greaves, Ltd. | 2,730,000 | 25,000,021 | |||||||||
| Road & Rail: 2.9% | |||||||||||
| Container Corp. of India, Ltd. | 745,386 | 20,923,066 | |||||||||
| Building Products: 2.6% | |||||||||||
| Sintex Industries, Ltd. | 3,183,251 | 18,699,655 | |||||||||
| Construction & Engineering: 2.4% | |||||||||||
| Larsen & Toubro, Ltd. | 481,660 | 17,341,752 | |||||||||
| Industrial Conglomerates: 1.7% | |||||||||||
| MAX India, Ltd.c | 2,663,102 | 12,650,370 | |||||||||
| Total Industrials | 149,532,770 | ||||||||||
| Shares | Value | ||||||||||
| CONSUMER DISCRETIONARY: 11.6% | |||||||||||
| Media: 5.1% | |||||||||||
| Sun TV Network, Ltd. | 1,825,127 | $ | 13,367,348 | ||||||||
| HT Media, Ltd. | 3,154,470 | 9,786,517 | |||||||||
| Jagran Prakashan, Ltd. | 3,140,502 | 9,203,050 | |||||||||
| Dish TV India, Ltd.c | 4,737,097 | 4,310,495 | |||||||||
| 36,667,410 | |||||||||||
| Auto Components: 3.7% | |||||||||||
| Exide Industries, Ltd. | 6,916,741 | 17,054,519 | |||||||||
| Bharat Forge, Ltd. | 1,637,459 | 9,551,468 | |||||||||
| 26,605,987 | |||||||||||
| Hotels, Restaurants & Leisure: 1.8% | |||||||||||
| Indian Hotels Co., Ltd. | 6,024,840 | 13,244,576 | |||||||||
| Textiles, Apparel & Luxury Goods: 1.0% | |||||||||||
| Titan Industries, Ltd. | 229,691 | 6,991,919 | |||||||||
| Total Consumer Discretionary | 83,509,892 | ||||||||||
| INFORMATION TECHNOLOGY: 9.7% | |||||||||||
| IT Services: 6.8% | |||||||||||
| Infosys Technologies, Ltd. | 298,281 | 16,600,862 | |||||||||
| HCL-Infosystems, Ltd. | 4,119,485 | 13,469,395 | |||||||||
| Infosys Technologies, Ltd. ADR | 188,179 | 10,400,653 | |||||||||
| CMC, Ltd. | 299,419 | 8,598,911 | |||||||||
| 49,069,821 | |||||||||||
| Internet Software & Services: 1.9% | |||||||||||
| Info Edge India, Ltd. | 733,656 | 14,037,906 | |||||||||
| Software: 1.0% | |||||||||||
| Financial Technologies India, Ltd. | 240,752 | 6,906,986 | |||||||||
| Total Information Technology | 70,014,713 | ||||||||||
| HEALTH CARE: 7.0% | |||||||||||
| Pharmaceuticals: 7.0% | |||||||||||
| Sun Pharmaceutical Industries, Ltd. | 710,460 | 22,966,573 | |||||||||
| Cipla, Ltd. | 1,953,275 | 14,010,104 | |||||||||
| Glenmark Pharmaceuticals, Ltd. | 2,228,091 | 13,163,243 | |||||||||
| Total Health Care | 50,139,920 | ||||||||||
| CONSUMER STAPLES: 5.7% | |||||||||||
| Personal Products: 5.7% | |||||||||||
| Dabur India, Ltd. | 6,939,715 | 23,556,295 | |||||||||
| Marico, Ltd. | 4,349,720 | 9,613,006 | |||||||||
| Emami, Ltd. | 750,000 | 7,915,533 | |||||||||
| Total Consumer Staples | 41,084,834 | ||||||||||
| UTILITIES: 4.8% | |||||||||||
| Gas Utilities: 2.8% | |||||||||||
| Gail India, Ltd. | 2,264,751 | 20,069,894 | |||||||||
| Electric Utilities: 2.0% | |||||||||||
| CESC, Ltd. | 1,750,920 | 14,481,119 | |||||||||
| Total Utilities | 34,551,013 | ||||||||||
38 MATTHEWS ASIA FUNDS
Matthews India Fund December 31, 2009
Schedule of Investmentsa (continued)
COMMON EQUITIES (continued)
| Shares | Value | ||||||||||
| ENERGY: 4.1% | |||||||||||
| Oil, Gas & Consumable Fuels: 4.1% | |||||||||||
| Reliance Industries, Ltd. | 895,742 | $ | 20,929,763 | ||||||||
| Chennai Petroleum Corp., Ltd.c | 1,889,744 | 8,855,374 | |||||||||
| Total Energy | 29,785,137 | ||||||||||
| MATERIALS: 2.7% | |||||||||||
| Chemicals: 2.7% | |||||||||||
| Asian Paints, Ltd. | 512,500 | 19,769,164 | |||||||||
| Total Materials | 19,769,164 | ||||||||||
| TELECOMMUNICATION SERVICES: 2.2% | |||||||||||
| Wireless Telecommunication Services: 2.2% | |||||||||||
| Bharti Airtel, Ltd. | 2,194,382 | 15,504,992 | |||||||||
| Total Telecommunication Services | 15,504,992 | ||||||||||
| TOTAL COMMON EQUITIES | 682,571,470 | ||||||||||
| (Cost $533,744,950) | |||||||||||
INTERNATIONAL BONDS: 2.9%
| Face Amount | |||||||||||
| HEALTH CARE: 1.0% | |||||||||||
| Pharmaceuticals: 1.0% | |||||||||||
| Aurobindo Pharma, Ltd., Cnv. 0.000%, 05/17/2011 | $ | 3,150,000 | 3,969,000 | ||||||||
| Aurobindo Pharma, Ltd., Cnv. 0.000%, 08/11/2010 | 2,000,000 | 3,110,000 | |||||||||
| Total Health Care | 7,079,000 | ||||||||||
| CONSUMER STAPLES: 0.8% | |||||||||||
| Beverages: 0.8% | |||||||||||
| Radico Khaitan, Ltd., Cnv. 3.500%, 07/27/2011 | 6,000,000 | 5,970,000 | |||||||||
| Total Consumer Staples | 5,970,000 | ||||||||||
| MATERIALS: 0.7% | |||||||||||
| Metals & Mining: 0.7% | |||||||||||
| Sesa Goa, Ltd., Cnv. 5.000%, 10/31/2014 | 4,000,000 | 4,756,640 | |||||||||
| Total Materials | 4,756,640 | ||||||||||
| Face Amount | Value | ||||||||||
| INFORMATION TECHNOLOGY: 0.4% | |||||||||||
| Software: 0.4% | |||||||||||
| Financial Technologies India, Ltd., Cnv. 0.000%, 12/21/2011 | $ | 2,500,000 | $ | 2,950,000 | |||||||
| Total Information Technology | 2,950,000 | ||||||||||
| TOTAL INTERNATIONAL BONDS | 20,755,640 | ||||||||||
| (Cost $20,553,118) | |||||||||||
| TOTAL INVESTMENTS: 97.6% | 703,327,110 | ||||||||||
| (Cost $554,298,068d) | |||||||||||
| CASH AND OTHER ASSETS, LESS LIABILITIES: 2.4% | 17,598,253 | ||||||||||
| NET ASSETS: 100.0% | $ | 720,925,363 | |||||||||
a Certain securities were fair valued under the discretion of the Board of Trustees (Note 1-A).
b Illiquid security.
c Non-income producing security.
d Cost for Federal income tax purposes is $564,886,661 and net unrealized appreciation consists of:
| Gross unrealized appreciation | $ | 185,820,742 | |||||
| Gross unrealized depreciation | (47,380,293 | ) | |||||
| Net unrealized appreciation | $ | 138,440,449 | |||||
ADR American Depositary Receipt
Cnv. Convertible
See accompanying notes to financial statements.
matthewsasia.com | 800.789.ASIA 39

ASIA GROWTH STRATEGIES
PORTFOLIO MANAGER
Taizo Ishida
Lead Manager
FUND FACTS
| Ticker | MJFOX | ||||||
| Inception Date | 12/31/98 | ||||||
| Assets | $88.3 million | ||||||
| NAV | $10.91 | ||||||
| Total # of Positions | 51 | ||||||
Fiscal Year 2009 Ratios
| Portfolio Turnover | 126.75 | %1 | |||||
| Gross Expense Ratio | 1.31 | %2 | |||||
Benchmarks
MSCI Japan Index
Tokyo Stock Price Index (TOPIX)
Redemption Fee
2% within first 90 calendar days of purchase
OBJECTIVE
Long-term capital appreciation.
STRATEGY
Under normal market conditions, the Fund seeks to achieve its investment objective by investing at least 80% of its total net assets, which include borrowings for investment purposes, in the common and preferred stocks of companies located in Japan.
1 The lesser of fiscal year 2009 long-term purchase costs or sales proceeds divided by the average monthly market value of long-term securities.
2 Matthews Asia Funds does not charge 12b-1 fees.
Matthews Japan Fund
Portfolio Manager Commentary
For the year ending December 31, 2009, the Matthews Japan Fund gained 10.06%, outperforming its benchmark, the MSCI Japan Index, which returned 6.39%. Considering the year was one of the worst for Japanese equities in terms of relative global performance, the Fund performed well, helped by fourth quarter gains. For the last quarter of 2009, the Fund returned 2.15% while the benchmark declined –2.76%.
While Japan's stock market avoided a third consecutive year of decline, the year was still a difficult one for Japanese equity investors; returns were modest at best compared with other major world markets. Japan's stock market began the first half of the year in line with U.S. and European markets. However, as other major markets rose in the second half of the year, Japan's market sagged. Japanese stocks suffered, in part, from concerns over record-breaking capital raising via share offerings by companies, mainly banks, that reached approximately US$55 billion. Interest by foreign investors in Japan's markets also seemed to be lacking due to more attractive opportunities elsewhere in the region.
During the year, our stock selection in the auto industry benefited the Fund, with holdings such as Nissan Motor and Fuji Heavy Industries. The Fund's overweight in the industrials sector also paid off. Specifically, two global machinery firms, Komatsu and Fanuc, benefited from increased demand from emerging markets. In particular, increased infrastructure spending in China has generated substantial demand for their machinery products. Information technology firm Toshiba, the portfolio's fourth largest holding, performed well on the back of improved pricing in the flash memory market and growing demand for smart phones, which, in turn, is boosting demand for flash memory. In addition, our continued avoidance of stocks in the low-growth utilities sector helped the portfolio.
In the health care sector, the Fund did well to avoid large pharmaceutical holdings, and focused instead on medical equipment makers and suppliers. One significant contributor to Fund performance was Sysmex, which saw its overseas business, particularly in China, increase.
Our long-term holdings in the Japanese Real Estate Investment Trust (J-REITs) sector performed well in the second half of the year following a consolidation in the industry, which we have been anticipating for some time. This was particularly rewarding for the Fund as its small-capitalization holdings in J-REITs performed far better than the large-cap J-REIT Index.
The Fund's largest holdings—The Japan Steel Works, Nidec and Softbank—all positively contributed to performance during the year. The biggest contributor to Fund performance during the year was Nidec, a leading global manufacturer of small motors used for consumer electronic products, household appliances and vehicles. Although the firm was founded in 1973, it is among a growing breed of companies in Japan that focuses on energy savings. The firm's fortunes are not tightly tied to Japan's macroeconomic environment as its business is mostly linked to the global trend of energy efficiency. As motors represent more than 50% of total electricity consumption worldwide and up to nearly 70% in factories, power reduction in motors is key to energy savings. Nidec's main product, a brushless motor used primarily in hard disc drives, is said to be three times more energy efficient than conventional motors, and seems to be well-sui ted for a more energy-conscious era. Not only is Nidec globally competitive, it also boasts shareholder-friendly management led by its founder, Shigenobu Nagamori. With more than 30 acquisitions, both foreign and domestic, over the past 30 years, Nidec has gained a reputation as an industry consolidator. Its recent acquisitions
(continued)
40 MATTHEWS ASIA FUNDS
PERFORMANCE AS OF DECEMBER 31, 2009
| Average Annual Total Returns | |||||||||||||||||||||||||||
| 3 Months | 1 Year | 3 Years | 5 Years | 10 Years | Inception 12/31/98 | ||||||||||||||||||||||
| Matthews Japan Fund | 2.15 | % | 10.06 | % | -11.13 | % | -5.49 | % | -3.85 | % | 3.11 | % | |||||||||||||||
| MSCI Japan Index3 | -2.76 | % | 6.39 | % | -10.25 | % | -0.70 | % | -3.55 | % | 1.10 | % | |||||||||||||||
| Tokyo Stock Price Index3 | -3.08 | % | 5.22 | % | -9.96 | % | -1.21 | % | -4.17 | % | 1.43 | % | |||||||||||||||
| Lipper Japanese Funds Category Average4 | -2.25 | % | 7.08 | % | -14.24 | % | -4.49 | % | -5.41 | % | 1.40 | % | |||||||||||||||
Performance assumes reinvestment of all dividends and/or distributions before taxes. All performance quoted represents past performance and is no guarantee of future results. Investment return and principal value will fluctuate with market conditions so that when redeemed, shares may be worth more or less than their original cost. Current performance may be lower or higher than the return figures quoted. Returns would have been lower if certain of the Fund's fees and expenses had not been waived. For the Fund's most recent month-end performance visit matthewsasia.com.
GROWTH OF A $10,000 INVESTMENT SINCE INCEPTION
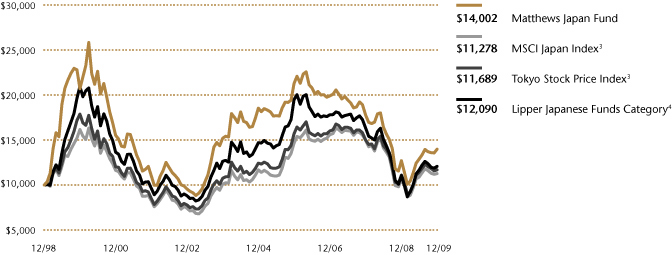
Plotted montly. The performance data and graph do not reflect the deduction of taxes that a shareholder would pay on dividends, capital gain distributions or redemption of Fund shares. Values are in US$.
3 It is not possible to invest directly in an index. Source: Index data from Morgan Stanley Capital Management; total return calculations performed by PNC Global Investment Servicing (U.S.) Inc. Please see page 59 for index definitions.
4 The Lipper Category Average does not reflect sales charges and is based on total return, including reinvestment of dividends and capital gains for the stated periods.
TOP TEN HOLDINGS5
| Sector | % of Net Assets | ||||||||||
| The Japan Steel Works, Ltd. | Industrials | 5.3 | % | ||||||||
| Nidec Corp. | Information Technology | 5.0 | % | ||||||||
| Softbank Corp. | Telecommunication Services | 5.0 | % | ||||||||
| Toshiba Corp. | Information Technology | 4.3 | % | ||||||||
| Sysmex Corp. | Health Care | 3.4 | % | ||||||||
| Nissan Motor Co., Ltd. | Consumer Discretionary | 3.4 | % | ||||||||
| Fuji Heavy Industries, Ltd. | Consumer Discretionary | 3.4 | % | ||||||||
| Pigeon Corp. | Consumer Staples | 2.9 | % | ||||||||
| Nomura Holdings, Inc. | Financials | 2.9 | % | ||||||||
| So-net Entertainment Corp. | Information Technology | 2.9 | % | ||||||||
| % OF ASSETS IN TOP TEN | 38.5 | % | |||||||||
5 Holdings may combine more than one security from same issuer and related depositary receipts.
matthewsasia.com | 800.789.ASIA 41
SECTOR ALLOCATION (%)
| Financials | 23.8 | ||||||
| Information Technology | 23.0 | ||||||
| Industrials | 20.6 | ||||||
| Consumer Discretionary | 13.9 | ||||||
| Health Care | 5.8 | ||||||
| Consumer Staples | 5.5 | ||||||
| Telecommunication Services | 5.0 | ||||||
| Materials | 1.6 | ||||||
| Cash and Other Assets, Less Liabilities | 0.8 | ||||||
MARKET CAP EXPOSURE (%)6
| Large Cap (Over $5B) | 44.6 | ||||||
| Mid Cap ($1B-$5B) | 28.7 | ||||||
| Small Cap (Under $1B) | 25.9 | ||||||
| Cash and Other Assets, Less Liabilities | 0.8 | ||||||
6 Source: FactSet Research Systems. Percentage values in data are rounded to the nearest tenth of one percent; the values may not sum to 100% due to rounding.
Matthews Japan Fund
Portfolio Manager Commentary (continued)
have been in Europe, and are aimed at the growing need for energy efficient motors for home appliances and cars sold in Europe and worldwide. The firm is aligned with one of the Fund's key investment themes, clean and green energy, and exemplifies the type of company we will continue to seek out.
The largest detractor to Fund performance was Doutour Nichires Holdings, a domestic restaurant group operator, which underperformed after posting positive returns in 2008. Although Doutour Nichires had been one of the most profitable operators in the industry, it still was not immune to the contraction in consumer spending. Although the Fund exited the position during the first half of the year, we continue to monitor its long-term potential as Japan's economic condition improves.
We hold an optimistic outlook for Japan's equity market in 2010 due primarily to a shift in investors' perception of Japanese companies. We expect that over the next decade, more opportunities for Japanese companies will arise than in the previous 10 years due to the emergence of new markets. Historically, the U.S. has been the primary export market for Japanese companies, with Europe as their second-largest market. However, the emergence of Asia's growing consumer class is changing this. China is not only a growing market for Japanese products, it also appears to be a very profitable one. Furthermore, the caché of the "Made in Japan" label carries weight with many middle class Asian consumers who desire quality and safety in their purchases. One notable data point: Japan's export revenues from Asia exceeded those from the U.S. in the first half of 2009, suggesting an emerging shift from West to East.
In addition, we believe that demand for Japan's energy efficient products—and nuclear power plants—will increase. Even in the Middle East, more energy-efficient mining equipment may be sought to replace old gas-guzzling heavy equipment. Energy efficiency is also a concern as Chinese factories make the shift from manual labor to automation. Simply put, we believe more customers will desire Japanese products over the next 10 years. Of course, the potential benefit will not be equally distributed to every company in Japan. Stock selection will be important as we believe only select Japanese companies will adapt to the new world order and flourish as a result.
Looking ahead, valuations in the current market have become more compelling for several reasons. Free cash flow yield for Japanese firms, a valuation metric reflecting a company's ability to generate cash, was high at more than 10% in the third quarter of 2009—a rate not seen even at the bottom of the stock market during Japan's financial crisis of 2003. Even compared with more widely quoted metrics, such as low price-to-book ratios or high dividend yields, increased free cash flow yields may present stronger evidence that Japanese companies are meaner, leaner and ready to invest in themselves again. We are encouraged by what we see for Japan in 2010.
42 MATTHEWS ASIA FUNDS
Matthews Japan Fund December 31, 2009
Schedule of Investmentsa
COMMON EQUITIES: JAPAN: 99.2%
| Shares | Value | ||||||||||
| FINANCIALS: 23.8% | |||||||||||
| Real Estate Investment Trusts: 11.8% | |||||||||||
| Advance Residence Investment Corp., REIT | 378 | $ | 1,448,554 | ||||||||
| Nippon Residential Investment Corp., REIT | 565 | 1,372,509 | |||||||||
| BLife Investment Corp., REIT | 293 | 1,294,934 | |||||||||
| United Urban Investment Corp., REIT | 238 | 1,258,152 | |||||||||
| Premier Investment Corp., REIT | 308 | 1,008,569 | |||||||||
| LaSalle Japan REIT, Inc. | 693 | 882,910 | |||||||||
| Japan Hotel and Resort, Inc., REIT | 632 | 876,152 | |||||||||
| Nippon Commercial Investment Corp., REIT | 490 | 711,506 | |||||||||
| Starts Proceed Investment Corp., REIT | 722 | 638,816 | |||||||||
| Japan Single-Residence REIT, Inc. | 430 | 493,709 | |||||||||
| Crescendo Investment Corp., REIT | 376 | 474,263 | |||||||||
| 10,460,074 | |||||||||||
| Capital Markets: 4.4% | |||||||||||
| Nomura Holdings, Inc. | 348,500 | 2,591,681 | |||||||||
| Jafco Co., Ltd. | 53,000 | 1,282,684 | |||||||||
| 3,874,365 | |||||||||||
| Consumer Finance: 2.6% | |||||||||||
| ORIX Corp. | 33,210 | 2,261,079 | |||||||||
| Diversified Financial Services: 2.4% | |||||||||||
| Japan Securities Finance Co., Ltd. | 276,100 | 2,132,690 | |||||||||
| Commercial Banks: 1.4% | |||||||||||
| Mitsubishi UFJ Financial Group, Inc. | 258,100 | 1,271,345 | |||||||||
| Real Estate Management & Development: 1.2% | |||||||||||
| Goldcrest Co., Ltd. | 37,070 | 1,038,042 | |||||||||
| Total Financials | 21,037,595 | ||||||||||
| INFORMATION TECHNOLOGY: 23.0% | |||||||||||
| Electronic Equipment & Instruments: 10.6% | |||||||||||
| Nidec Corp. | 47,500 | 4,390,089 | |||||||||
| Kyocera Corp. | 15,300 | 1,347,478 | |||||||||
| Nippon Electric Glass Co., Ltd. | 97,000 | 1,335,096 | |||||||||
| Hamamatsu Photonics, K.K. | 51,700 | 1,259,363 | |||||||||
| Keyence Corp. | 4,897 | 1,016,341 | |||||||||
| 9,348,367 | |||||||||||
| Computers & Peripherals: 6.6% | |||||||||||
| Toshiba Corp.b | 685,000 | 3,800,997 | |||||||||
| Wacom Co., Ltd. | 916 | 1,997,708 | |||||||||
| 5,798,705 | |||||||||||
| Internet Software & Services: 4.9% | |||||||||||
| So-net Entertainment Corp. | 1,122 | 2,547,698 | |||||||||
| Kakaku.com., Inc. | 454 | 1,764,778 | |||||||||
| 4,312,476 | |||||||||||
| Software: 0.9% | |||||||||||
| Nintendo Co., Ltd. | 3,500 | 835,930 | |||||||||
| Total Information Technology | 20,295,478 | ||||||||||
| Shares | Value | ||||||||||
| INDUSTRIALS: 20.6% | |||||||||||
| Machinery: 16.2% | |||||||||||
| The Japan Steel Works, Ltd. | 367,000 | $ | 4,679,643 | ||||||||
| Komatsu, Ltd. | 116,900 | 2,447,205 | |||||||||
| Kubota Corp. | 239,000 | 2,193,026 | |||||||||
| Nabtesco Corp. | 164,000 | 1,878,830 | |||||||||
| Fanuc, Ltd. | 18,100 | 1,686,956 | |||||||||
| Mitsubishi Heavy Industries, Ltd. | 394,000 | 1,389,625 | |||||||||
| 14,275,285 | |||||||||||
| Trading Companies & Distributors: 2.4% | |||||||||||
| ITOCHU Corp. | 289,000 | 2,134,777 | |||||||||
| Construction & Engineering: 2.0% | |||||||||||
| Toshiba Plant Systems & Services Corp. | 104,000 | 1,312,925 | |||||||||
| Daimei Telecom Engineering Corp. | 57,400 | 436,462 | |||||||||
| 1,749,387 | |||||||||||
| Total Industrials | 18,159,449 | ||||||||||
| CONSUMER DISCRETIONARY: 13.9% | |||||||||||
| Automobiles: 6.8% | |||||||||||
| Nissan Motor Co., Ltd.b | 339,700 | 2,985,256 | |||||||||
| Fuji Heavy Industries, Ltd.b | 608,000 | 2,970,887 | |||||||||
| 5,956,143 | |||||||||||
| Household Durables: 3.5% | |||||||||||
| Panasonic Corp. | 144,000 | 2,073,082 | |||||||||
| Rinnai Corp. | 21,600 | 1,043,820 | |||||||||
| 3,116,902 | |||||||||||
| Diversified Consumer Services: 1.5% | |||||||||||
| Benesse Holding, Inc. | 31,700 | 1,325,409 | |||||||||
| Hotels, Restaurants & Leisure: 1.2% | |||||||||||
| WATAMI Co., Ltd. | 61,000 | 1,097,672 | |||||||||
| Media: 0.9% | |||||||||||
| Toei Co., Ltd. | 154,000 | 820,706 | |||||||||
| Total Consumer Discretionary | 12,316,832 | ||||||||||
| HEALTH CARE: 5.8% | |||||||||||
| Health Care Equipment & Supplies: 3.4% | |||||||||||
| Sysmex Corp. | 57,800 | 3,022,189 | |||||||||
| Pharmaceuticals: 2.4% | |||||||||||
| Tsumura & Co. | 66,000 | 2,133,682 | |||||||||
| Total Health Care | 5,155,871 | ||||||||||
| CONSUMER STAPLES: 5.5% | |||||||||||
| Household Products: 2.9% | |||||||||||
| Pigeon Corp. | 66,300 | 2,596,121 | |||||||||
| Tobacco: 1.5% | |||||||||||
| Japan Tobacco, Inc. | 380 | 1,283,068 | |||||||||
| Food Products: 1.1% | |||||||||||
| Unicharm Petcare Corp. | 32,400 | 989,649 | |||||||||
| Total Consumer Staples | 4,868,838 | ||||||||||
matthewsasia.com | 800.789.ASIA 43
Matthews Japan Fund December 31, 2009
Schedule of Investmentsa (continued)
COMMON EQUITIES: JAPAN (continued)
| Shares | Value | ||||||||||
| TELECOMMUNICATION SERVICES: 5.0% | |||||||||||
| Wireless Telecommunication Services: 5.0% | |||||||||||
| Softbank Corp. | 187,100 | $ | 4,386,135 | ||||||||
| Total Telecommunication Services | 4,386,135 | ||||||||||
| MATERIALS: 1.6% | |||||||||||
| Chemicals: 1.1% | |||||||||||
| Kansai Paint Co., Ltd. | 112,000 | 938,608 | |||||||||
| Metals & Mining: 0.5% | |||||||||||
| Hitachi Metals, Ltd. | 50,000 | 481,043 | |||||||||
| Total Materials | 1,419,651 | ||||||||||
| TOTAL INVESTMENTS: 99.2% | 87,639,849 | ||||||||||
| (Cost $76,518,826c) | |||||||||||
| CASH AND OTHER ASSETS, LESS LIABILITIES: 0.8% | 693,887 | ||||||||||
| NET ASSETS: 100.0% | $ | 88,333,736 | |||||||||
a Certain securities were fair valued under the discretion of the Board of Trustees (Note 1-A).
b Non-income producing security.
c Cost for Federal income tax purposes is $77,961,896 and net unrealized appreciation consists of:
| Gross unrealized appreciation | $ | 13,839,951 | |||||
| Gross unrealized depreciation | (4,161,998 | ) | |||||
| Net unrealized appreciation | $ | 9,677,953 | |||||
REIT Real Estate Investment Trust
See accompanying notes to financial statements.
44 MATTHEWS ASIA FUNDS

ASIA GROWTH STRATEGIES
PORTFOLIO MANAGERS
J. Michael Oh
Lead Manager
Michael B. Han, CFA
Co-Manager
Mark W. Headley
Co-Manager
FUND FACTS
| Ticker | MAKOX | ||||||
| Inception Date | 1/3/95 | ||||||
| Assets | $138.4 million | ||||||
| NAV | $4.31 | ||||||
| Total # of Positions | 58 | ||||||
Fiscal Year 2009 Ratios
| Portfolio Turnover | 52.47 | %1 | |||||
| Gross Expense Ratio | 1.30 | %2 | |||||
Benchmark
Korean Composite Stock Price Index (KOSPI)
Redemption Fee
2% within first 90 calendar days of purchase
OBJECTIVE
Long-term capital appreciation.
STRATEGY
Under normal market conditions, the Fund seeks to achieve its investment objective by investing at least 80% of its total net assets, which include borrowings for investment purposes, in the common and preferred stocks of companies located in South Korea.
1 The lesser of fiscal year 2009 long-term purchase costs or sales proceeds divided by the average monthly market value of long-term securities.
2 Matthews Asia Funds does not charge 12b-1 fees.
Matthews Korea Fund
Portfolio Manager Commentary
For the year ending December 31, 2009, the Matthews Korea Fund returned 62.92% while its benchmark, the Korea Composite Stock Price Index (KOSPI), gained 66.56%. 2009 was a very challenging year for the Korean equity market as well as for Korea's currency, the won. Although the market was weak at the start of the fourth quarter, it managed to rebound to finish the year with strong gains. The Fund returned 3.95% in the last quarter, while its benchmark rose 1.56%.
The beginning of the year was marked by volatility; the KOSPI lost approximately 25% through early March, before beginning a strong rally. The won hit bottom during the first quarter—falling to its lowest level against the U.S. dollar in 10 years—before strengthening to post a gain for the year. The Korean market continued to strengthen in the second half of the year, with the KOSPI climbing about 30% over that period.
The Fund underperformed the benchmark primarily due to its exposure to holdings in the consumer staples, telecommunication services and pharmaceutical sectors. These stocks had outperformed in 2008, and some investors took gains as the market rebounded. Despite their underperformance, we maintained our positions in these sectors because their fundamentals remain solid. Korean telecommunication services firms continue to be some of the most attractive relative to their peers in the region in terms of valuation. Additionally, the pharmaceutical industry is one of the few in Korea expected to post double-digit growth. The consumer staples companies in the portfolio have stable earnings profiles, and tend to perform well during downturns.
While the past year and a half was arguably one of the most challenging business environments in some time, large Korean companies performed considerably well in the global market, particularly in automotive- and technology-related areas. To some extent, Korea's weak currency aided performance, but more importantly, the relatively sound balance sheets of Korean firms enabled them to engage in aggressive marketing activities including the introduction of new products. Government subsidies around the world benefited Korean businesses. For example, the Chinese government subsidized consumer purchases of various appliances, including TVs and computers, and the Korean government offered tax breaks on auto purchases.
Samsung Electronics, Korea's largest exporter by dollar value, was the biggest contributor to Fund performance during the year. Samsung, the portfolio's largest holding, best exemplifies a Korean company that has established itself globally. The company has become a global leader in LED TVs and is also now the second-largest mobile phone manufacturer in the world. During the year, the company increased its research and development spending, invested in new products and conducted aggressive marketing while its competitors largely remained in a defensive mode. Samsung's brand image continued to improve in 2009, which helped it gain market share in various product areas. We remain positive on the company's future prospects.
One of the Fund's key strategies is to find dominant companies that can leverage their experience and financial strength in the domestic Korean market to penetrate markets overseas. Korea is home to some of the largest global companies in the information technology and automotive industries, and we believe that businesses in other sectors can follow suit. Cheil Worldwide, an affiliate of Samsung, is one such company that has emerged on the international stage. A leader in Korean advertising for many years, Cheil entered the overseas market a few years ago and recently acquired a U.S. advertising agency, thereby
(continued)
matthewsasia.com | 800.789.ASIA 45
PERFORMANCE AS OF DECEMBER 31, 2009
| Average Annual Total Returns | |||||||||||||||||||||||||||
| 3 Months | 1 Year | 3 Years | 5 Years | 10 Years | Inception 1/3/95 | ||||||||||||||||||||||
| Matthews Korea Fund | 3.95 | % | 62.92 | % | -2.85 | % | 10.47 | % | 8.98 | % | 4.81 | % | |||||||||||||||
| Korea Composite Stock Price Index3 | 1.56 | % | 66.56 | % | -1.59 | % | 11.36 | % | 5.16 | % | 1.22 | % | |||||||||||||||
| Lipper Pacific ex Japan Funds Category Average4 | 6.49 | % | 71.34 | % | 4.72 | % | 13.05 | % | 7.53 | % | 6.99 | %5 | |||||||||||||||
Performance assumes reinvestment of all dividends and/or distributions before taxes. All performance quoted represents past performance and is no guarantee of future results. Investment return and principal value will fluctuate with market conditions so that when redeemed, shares may be worth more or less than their original cost. Current performance may be lower or higher than the return figures quoted. Returns would have been lower if certain of the Fund's fees and expenses had not been waived. For the Fund's most recent month-end performance visit matthewsasia.com.
GROWTH OF A $10,000 INVESTMENT SINCE INCEPTION
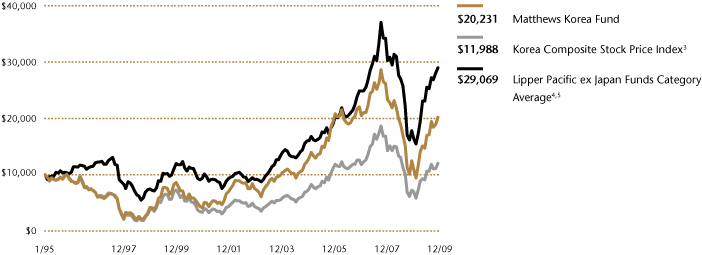
Plotted monthly. The performance data and graph do not reflect the deduction of taxes that a shareholder would pay on dividends, capital gain distributions or redemption of Fund shares. Values are in US$.
3 It is not possible to invest directly in an index. Source: Index data from Morgan Stanley Capital Management; total return calculations performed by PNC Global Investment Servicing (U.S.) Inc. Please see page 59 for index definition.
4 The Lipper Category Average does not reflect sales charges and is based on total return, including reinvestment of dividends and capital gains for the stated periods.
5 Calculated from 12/31/94.
TOP TEN HOLDINGS6
| Sector | % of Net Assets | ||||||||||
| Samsung Electronics Co., Ltd. | Information Technology | 10.8 | % | ||||||||
| POSCO | Materials | 5.3 | % | ||||||||
| Hyundai Motor Co. | Consumer Discretionary | 3.8 | % | ||||||||
| KB Financial Group, Inc. | Financials | 3.7 | % | ||||||||
| Shinhan Financial Group Co., Ltd. | Financials | 3.1 | % | ||||||||
| SK Telecom Co., Ltd. | Telecommunication Services | 2.7 | % | ||||||||
| NHN Corp. | Information Technology | 2.7 | % | ||||||||
| LG Electronics, Inc. | Consumer Discretionary | 2.5 | % | ||||||||
| Kiwoom Securities Co., Ltd. | Financials | 2.5 | % | ||||||||
| Modetour Network, Inc. | Consumer Discretionary | 2.5 | % | ||||||||
| % OF ASSETS IN TOP TEN | 39.6 | % | |||||||||
6 Holdings may combine more than one security from same issuer and related depositary receipts.
46 MATTHEWS ASIA FUNDS
Matthews Korea Fund
Portfolio Manager Commentary (continued)
expanding its pool of clients and talent. Another holding that demonstrates our strategy is Amorepacific, Korea's largest cosmetics company. Amorepacific began selling its products in China eight years ago following extensive research into the market. More recently, its effort has begun bearing fruit, with AmorePacific's China sales recording impressive growth in 2009.
Looking forward, we believe Korea is well-positioned to benefit from a global recovery as its businesses have a solid market presence in both developed and emerging markets. However, its currency fluctuations remain a risk for the year ahead. If the won strengthens too fast, Korean exporters may come under pressure. We believe that the fundamentals of Korean companies have improved compared with those of their global competitors, and that they can compete on quality, despite some currency appreciation. Though market sentiment in Korea is improving, overall consumption remains weak. Relatively slow income growth poses another potential risk to domestic companies. Foreign currency reserves grew to near record levels during the year, which may serve as a buffer should the global economy worsen again. However, Korea's export industry remains a sizable segment of its economy, and further deterioration globally could adversely impact it. North Korea remains a potential threat to South Korea and its nuclear weapons testing continues to be an international concern; although actual military action between North and South Korea appears to be quite low, unpredictable moves by North Korea could cause market jitters.
Korea's overall valuation remains attractive, and we will continue to seek growth companies with the potential to do well both in Korea as well as in overseas markets.
SECTOR ALLOCATION (%)
| Consumer Discretionary | 21.5 | ||||||
| Information Technology | 19.7 | ||||||
| Financials | 19.4 | ||||||
| Industrials | 10.3 | ||||||
| Materials | 9.2 | ||||||
| Consumer Staples | 8.4 | ||||||
| Health Care | 4.4 | ||||||
| Telecommunication Services | 4.0 | ||||||
| Energy | 1.1 | ||||||
| Cash and Other Assets, Less Liabilities | 2.0 | ||||||
MARKET CAP EXPOSURE (%)7
| Large Cap (Over $5B) | 54.9 | ||||||
| Mid Cap ($1B-$5B) | 26.1 | ||||||
| Small Cap (Under $1B) | 17.0 | ||||||
| Cash and Other Assets, Less Liabilities | 2.0 | ||||||
7 Source: FactSet Research Systems. Percentage values in data are rounded to the nearest tenth of one percent; the values may not sum to 100% due to rounding.
matthewsasia.com | 800.789.ASIA 47
Matthews Korea Fund December 31, 2009
Schedule of Investmentsa
COMMON EQUITIES: SOUTH KOREA: 96.0%
| Shares | Value | ||||||||||
| CONSUMER DISCRETIONARY: 21.5% | |||||||||||
| Automobiles: 4.6% | |||||||||||
| Hyundai Motor Co. | 50,273 | $ | 5,203,840 | ||||||||
| Kia Motors Corp.b | 64,430 | 1,106,306 | |||||||||
| 6,310,146 | |||||||||||
| Household Durables: 3.8% | |||||||||||
| LG Electronics, Inc. | 33,273 | 3,468,650 | |||||||||
| Samsung Digital Imaging Co., Ltd. | 48,871 | 1,846,874 | |||||||||
| 5,315,524 | |||||||||||
| Auto Components: 3.4% | |||||||||||
| Hyundai Mobis | 22,885 | 3,353,549 | |||||||||
| Hankook Tire Co., Ltd. | 65,250 | 1,426,149 | |||||||||
| 4,779,698 | |||||||||||
| Hotels, Restaurants & Leisure: 3.2% | |||||||||||
| Modetour Network, Inc.b | 145,057 | 3,454,928 | |||||||||
| Hana Tour Service, Inc. | 21,850 | 937,304 | |||||||||
| 4,392,232 | |||||||||||
| Multiline Retail: 2.0% | |||||||||||
| Hyundai Department Store Co., Ltd. | 28,065 | 2,708,600 | |||||||||
| Media: 1.8% | |||||||||||
| Cheil Worldwide, Inc. | 9,373 | 2,538,370 | |||||||||
| Textiles, Apparel & Luxury Goods: 1.2% | |||||||||||
| LG Fashion Corp. | 61,780 | 1,677,175 | |||||||||
| Diversified Consumer Services: 1.0% | |||||||||||
| MegaStudy Co., Ltd. | 6,695 | 1,376,269 | |||||||||
| Internet & Catalog Retail: 0.5% | |||||||||||
| Interpark Corp.b | 117,442 | 635,788 | |||||||||
| Total Consumer Discretionary | 29,733,802 | ||||||||||
| INFORMATION TECHNOLOGY: 18.6% | |||||||||||
| Semiconductors & Semiconductor Equipment: 10.8% | |||||||||||
| Samsung Electronics Co., Ltd. | 21,714 | 14,889,941 | |||||||||
| Electronic Equipment & Instruments: 5.2% | |||||||||||
| LG Display Co., Ltd. ADR | 146,300 | 2,476,859 | |||||||||
| Samsung Electro-Mechanics Co., Ltd. | 19,188 | 1,764,655 | |||||||||
| Samsung SDI Co., Ltd. | 13,363 | 1,701,564 | |||||||||
| SFA Engineering Corp. | 42,516 | 1,218,221 | |||||||||
| 7,161,299 | |||||||||||
| Internet Software & Services: 2.6% | |||||||||||
| NHN Corp.b | 22,236 | 3,675,120 | |||||||||
| Total Information Technology | 25,726,360 | ||||||||||
| Shares | Value | ||||||||||
| FINANCIALS: 18.5% | |||||||||||
| Commercial Banks: 10.6% | |||||||||||
| Shinhan Financial Group Co., Ltd.b | 115,048 | $ | 4,257,246 | ||||||||
| KB Financial Group, Inc.b | 75,059 | 3,822,023 | |||||||||
| Korea Exchange Bank | 157,310 | 1,952,638 | |||||||||
| Hana Financial Group, Inc. | 66,952 | 1,892,352 | |||||||||
| Daegu Bank | 99,300 | 1,460,874 | |||||||||
| KB Financial Group, Inc. ADRb | 26,553 | 1,350,220 | |||||||||
| 14,735,353 | |||||||||||
| Capital Markets: 4.0% | |||||||||||
| Kiwoom Securities Co., Ltd. | 96,081 | 3,456,333 | |||||||||
| Samsung Securities Co., Ltd. | 38,648 | 2,092,279 | |||||||||
| 5,548,612 | |||||||||||
| Insurance: 3.9% | |||||||||||
| Dongbu Insurance Co., Ltd. | 110,140 | 3,061,372 | |||||||||
| Samsung Fire & Marine Insurance Co., Ltd. | 13,321 | 2,280,140 | |||||||||
| 5,341,512 | |||||||||||
| Total Financials | 25,625,477 | ||||||||||
| INDUSTRIALS: 10.3% | |||||||||||
| Construction & Engineering: 3.2% | |||||||||||
| Samsung Engineering Co., Ltd. | 19,108 | 1,775,611 | |||||||||
| HanmiParsons Co., Ltd.b | 101,480 | 1,410,030 | |||||||||
| Hyundai Development Co. | 39,395 | 1,275,626 | |||||||||
| 4,461,267 | |||||||||||
| Industrial Conglomerates: 2.5% | |||||||||||
| Samsung Techwin Co., Ltd. | 23,244 | 1,812,474 | |||||||||
| Orion Corp. | 6,727 | 1,665,666 | |||||||||
| 3,478,140 | |||||||||||
| Commercial Services & Supplies: 2.1% | |||||||||||
| S1 Corp. | 35,587 | 1,479,387 | |||||||||
| Korea Plant Service & Engineering Co., Ltd. | 37,700 | 1,374,793 | |||||||||
| 2,854,180 | |||||||||||
| Machinery: 1.4% | |||||||||||
| JVM Co., Ltd.b | 63,181 | 1,997,456 | |||||||||
| Building Products: 1.1% | |||||||||||
| Sung Kwang Bend Co., Ltd. | 60,036 | 1,452,178 | |||||||||
| Total Industrials | 14,243,221 | ||||||||||
| MATERIALS: 9.2% | |||||||||||
| Metals & Mining: 5.8% | |||||||||||
| POSCO ADR | 37,800 | 4,955,580 | |||||||||
| POSCO | 4,495 | 2,370,535 | |||||||||
| Korea Zinc Co., Ltd. | 3,695 | 645,255 | |||||||||
| 7,971,370 | |||||||||||
| Chemicals: 3.4% | |||||||||||
| LG Chem, Ltd. | 17,133 | 3,358,022 | |||||||||
| Hyosung Corp. | 18,970 | 1,387,421 | |||||||||
| 4,745,443 | |||||||||||
| Total Materials | 12,716,813 | ||||||||||
48 MATTHEWS ASIA FUNDS
Matthews Korea Fund December 31, 2009
Schedule of Investmentsa (continued)
COMMON EQUITIES: SOUTH KOREA (continued)
| Shares | Value | ||||||||||
| CONSUMER STAPLES: 8.4% | |||||||||||
| Food & Staples Retailing: 3.8% | |||||||||||
| Shinsegae Food Co., Ltd. | 44,331 | $ | 2,961,774 | ||||||||
| Shinsegae Co., Ltd. | 5,000 | 2,309,443 | |||||||||
| 5,271,217 | |||||||||||
| Personal Products: 2.0% | |||||||||||
| Amorepacific Corp. | 3,425 | 2,747,118 | |||||||||
| Household Products: 1.7% | |||||||||||
| LG Household & Health Care, Ltd. | 9,484 | 2,372,713 | |||||||||
| Tobacco: 0.9% | |||||||||||
| KT&G Corp. | 21,750 | 1,201,840 | |||||||||
| Total Consumer Staples | 11,592,888 | ||||||||||
| HEALTH CARE: 4.4% | |||||||||||
| Pharmaceuticals: 4.4% | |||||||||||
| Yuhan Corp. | 18,475 | 2,824,024 | |||||||||
| Dong-A Pharmaceutical Co., Ltd. | 18,542 | 2,046,092 | |||||||||
| LG Life Sciences, Ltd.b | 23,294 | 1,240,612 | |||||||||
| Total Health Care | 6,110,728 | ||||||||||
| TELECOMMUNICATION SERVICES: 4.0% | |||||||||||
| Wireless Telecommunication Services: 2.6% | |||||||||||
| SK Telecom Co., Ltd. ADR | 119,700 | 1,946,322 | |||||||||
| SK Telecom Co., Ltd. | 11,874 | 1,733,214 | |||||||||
| 3,679,536 | |||||||||||
| Diversified Telecommunication Services: 1.4% | |||||||||||
| KT Corp. | 40,734 | 1,370,978 | |||||||||
| KT Corp. ADR | 30,500 | 513,010 | |||||||||
| 1,883,988 | |||||||||||
| Total Telecommunication Services | 5,563,524 | ||||||||||
| ENERGY: 1.1% | |||||||||||
| Oil, Gas & Consumable Fuels: 1.1% | |||||||||||
| SK Energy Co., Ltd. | 14,474 | 1,454,188 | |||||||||
| Total Energy | 1,454,188 | ||||||||||
| TOTAL COMMON EQUITIES | 132,767,001 | ||||||||||
| (Cost $98,855,857) | |||||||||||
PREFERRED EQUITIES: SOUTH KOREA: 2.0%
| Shares | Value | ||||||||||
| INFORMATION TECHNOLOGY: 1.1% | |||||||||||
| Semiconductors & Semiconductor Equipment: 1.1% | |||||||||||
| Samsung Electronics Co., Ltd., Pfd. | 3,331 | $ | 1,501,426 | ||||||||
| FINANCIALS: 0.9% | |||||||||||
| Insurance: 0.9% | |||||||||||
| Samsung Fire & Marine Insurance Co., Ltd., Pfd. | 16,574 | 1,301,949 | |||||||||
| TOTAL PREFERRED EQUITIES | 2,803,375 | ||||||||||
| (Cost $2,257,897) | |||||||||||
| TOTAL INVESTMENTS: 98.0% | 135,570,376 | ||||||||||
| (Cost $101,113,754c) | |||||||||||
| CASH AND OTHER ASSETS, LESS LIABILITIES: 2.0% | 2,800,192 | ||||||||||
| NET ASSETS: 100.0% | $ | 138,370,568 | |||||||||
a Certain securities were fair valued under the discretion of the Board of Trustees (Note 1-A).
b Non-income producing security.
c Cost for Federal income tax purposes is $101,852,746 and net unrealized appreciation consists of:
| Gross unrealized appreciation | $ | 37,839,552 | |||||
| Gross unrealized depreciation | (4,121,922 | ) | |||||
| Net unrealized appreciation | $ | 33,717,630 | |||||
ADR American Depositary Receipt
Pfd. Preferred
See accompanying notes to financial statements.
matthewsasia.com | 800.789.ASIA 49

ASIA SMALL COMPANY STRATEGY
PORTFOLIO MANAGER
Lydia So
Lead Manager
FUND FACTS
| Ticker | MSMLX | ||||||
| Inception Date | 9/15/08 | ||||||
| Assets | $109.7 million | ||||||
| NAV | $15.79 | ||||||
| Total # of Positions | 72 | ||||||
Fiscal Year 2009 Ratios
| Portfolio Turnover | 21.39 | %1 | |||||
| Gross Expense Ratio | 2.09 | %2 | |||||
| After Contractual Fee Waiver | 2.00 | %2 | |||||
Benchmark
MSCI AC Asia ex Japan Small Cap Index
Redemption Fee
2% within first 90 calendar days of purchase
OBJECTIVE
Long-term capital appreciation.
STRATEGY
Under normal market conditions, the Fund seeks to achieve its investment objective by investing at least 80% of its total net assets, which include borrowings for investment purposes, in the common and preferred stocks of small companies located in Asia, excluding Japan.
1 The lesser of fiscal year 2009 long-term purchase costs or sales proceeds divided by the average monthly market value of long-term securities.
2 The Advisor has contractually agreed to waive certain fees and reimburse certain expenses for Matthews Asia Small Companies Fund. Please see page 89 for additional information. Matthews Asia Funds does not charge 12b-1 fees.
Matthews Asia Small Companies Fund
Portfolio Manager Commentary
For the year ending December 31, 2009, the Matthews Asia Small Companies Fund gained 103.00%, while its benchmark, the MSCI All Country (AC) Asia ex Japan Small Cap Index, rose 113.48%. For the fourth quarter, the Fund gained 14.67%, while its benchmark rose 12.10%.
Asian markets got off to a rocky start in 2009 amid the global financial crisis, but eventually stabilized. Small-cap companies recovered faster and rebounded further than their large-capitalization counterparts; in fact, the MSCI AC Asia ex Japan Small Cap Index outperformed the MSCI AC Asia ex Japan Large Cap Index by 44.76% in 2009. During the first half of 2009, the market transitioned from a "panic mode" back to a more rational state. Asia's economies demonstrated their strength and resilience, relative to those in other regions of the world. The return of a more stabilized credit market enabled small- to mid-size companies better access to financing. A reversal of investors' risk appetite along with improved liquidity led to a sharp market rally. In general, cyclical industries such as energy, commodities and real estate along with lower quality, highly leveraged companies performed very strongly. Because the Fund minimize s exposure to cyclical stocks, it underperformed its benchmark for the first half of the year. The Fund's relative performance improved in the second half of 2009 as investors returned to focusing on company fundamentals and growth prospects.
On a country basis, China, India and Taiwan were the Fund's top weightings throughout the year, and also accounted for the lion's share of its performance. China and India were among the few countries that still registered positive GDP growth in 2009, while Taiwan's closer economic ties with China reignited interest in its growth prospects. On a sector basis, top contributors to Fund performance came from holdings in the industrials, information technology and consumer discretionary sectors as they benefited most from the pickup in business activities and consumer spending.
During the year, we positioned the Fund to focus on companies that derive growth from Asia's domestic markets. We sought businesses with sustainable revenue streams, high returns on investments and conservative capital structures that could weather the crisis in the short term, and emerge as industry leaders in the long run. Some of the Fund's main contributors to performance were Chinese stocks that we consider "blue-chip companies in the making." Such notable holdings included Zhuzhou CSR Times Electric, a provider of railway electrical systems; Minth Group, a leading manufacturer of exterior auto-parts; and Golden Eagle Retail Group, a popular department store operator. While the financial crisis and contraction in demand had threatened the survival of some small companies, these firms still managed to reinvest in and expand their businesses as well as gain new customers.
The portfolio's fourth-largest holding, Singapore Airport Terminal Services (SATS), the main provider of ground handling and in-flight catering services in Singapore, grew more dominant, gaining market share and increasing its economies of scale in the process. During the downturn, another airport services operator shut its Singapore operations, leaving SATS with only one other competitor. Separately, SATS acquired an integrated food company in early 2009, aiming to expand it catering business beyond the aviation sector. Looking ahead, the acquisition should benefit SATS by diversifying its customer base and industry exposure. We feel that the firm is well-positioned as tourism and business activities improve in the region.
(continued)
50 MATTHEWS ASIA FUNDS
PERFORMANCE AS OF DECEMBER 31, 2009
| Average Annual Total Return | |||||||||||||||
| 3 Months | 1 Year | Inception 9/15/08 | |||||||||||||
| Matthews Asia Small Companies Fund | 14.67 | % | 103.00 | % | 44.05 | % | |||||||||
| MSCI All Country Asia ex Japan Small Cap Index3 | 12.10 | % | 113.48 | % | 34.33 | % | |||||||||
| Lipper Pacific ex Japan Funds Category Average4 | 6.49 | % | 71.34 | % | 27.86 | %5 | |||||||||
Performance assumes reinvestment of all dividends and/or distributions before taxes. All performance quoted represents past performance and is no guarantee of future results. Investment return and principal value will fluctuate with market conditions so that when redeemed, shares may be worth more or less than their original cost. Current performance may be lower or higher than the return figures quoted. Returns would have been lower if certain of the Fund's fees and expenses had not been waived. For the Fund's most recent month-end performance visit matthewsasia.com.
GROWTH OF A $10,000 INVESTMENT SINCE INCEPTION
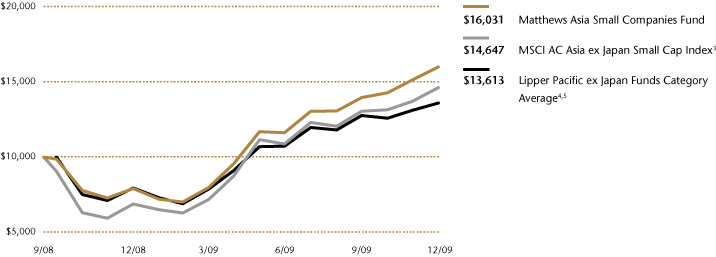
The performance data does not reflect the deduction of taxes that a shareholder would pay on dividends, capital gain distributions or redemption of Fund shares. Values are in US$.
3 It is not possible to invest directly in an index. Source: Index data from Morgan Stanley Capital Management; total return calculations performed by PNC Global Investment Servicing (U.S.) Inc. Please see page 59 for index definition.
4 The Lipper Category Average does not reflect sales charges and is based on total return, including reinvestment of dividends and capital gains for the stated periods.
5 Calculated from 9/30/08.
TOP TEN HOLDINGS6
| Country | % of Net Assets | ||||||||||
| St. Shine Optical Co., Ltd. | Taiwan | 2.8 | % | ||||||||
| Synnex Technology International Corp. | Taiwan | 2.5 | % | ||||||||
| Uni-President China Holdings, Ltd. | China/Hong Kong | 2.5 | % | ||||||||
| Singapore Airport Terminal Services, Ltd. | Singapore | 2.4 | % | ||||||||
| Vinda International Holdings, Ltd. | China/Hong Kong | 2.2 | % | ||||||||
| Dongbu Insurance Co., Ltd. | South Korea | 2.1 | % | ||||||||
| YES24 Co., Ltd. | South Korea | 2.1 | % | ||||||||
| Xinyi Glass Holdings Co., Ltd. | China/Hong Kong | 2.0 | % | ||||||||
| Richtek Technology Corp. | Taiwan | 1.9 | % | ||||||||
| KWG Property Holding, Ltd. | China/Hong Kong | 1.9 | % | ||||||||
| % OF ASSETS IN TOP TEN | 22.4 | % | |||||||||
6 Holdings may combine more than one security from same issuer and related depositary receipts.
matthewsasia.com | 800.789.ASIA 51
COUNTRY ALLOCATION (%)
| China/Hong Kong | 30.6 | ||||||
| India | 19.3 | ||||||
| Taiwan | 16.5 | ||||||
| South Korea | 14.7 | ||||||
| Singapore | 11.1 | ||||||
| Malaysia | 3.2 | ||||||
| Indonesia | 1.4 | ||||||
| Cash and Other Assets, Less Liabilities | 3.2 | ||||||
SECTOR ALLOCATION (%)
| Industrials | 21.7 | ||||||
| Consumer Discretionary | 19.9 | ||||||
| Information Technology | 16.3 | ||||||
| Financials | 14.2 | ||||||
| Consumer Staples | 8.5 | ||||||
| Health Care | 7.6 | ||||||
| Materials | 6.5 | ||||||
| Energy | 1.2 | ||||||
| Utilities | 0.9 | ||||||
| Cash and Other Assets, Less Liabilities | 3.2 | ||||||
MARKET CAP EXPOSURE (%)7,8
| Large Cap (Over $5B) | 0.6 | ||||||
| Mid Cap ($1B-$5B) | 45.0 | ||||||
| Small Cap (Under $1B) | 51.2 | ||||||
| Cash and Other Assets, Less Liabilities | 3.2 | ||||||
7 Source: FactSet Research Systems. Percentage values in data are rounded to the nearest tenth of one percent; the values may not sum to 100% due to rounding.
8 The Fund defines Small Companies as companies with market capitalization generally between $100 million and $3 billion.
Matthews Asia Small Companies Fund
Portfolio Manager Commentary (continued)
India's Exide Industries, a leading manufacturer of batteries for automobiles and industrial usage, also performed well. With over 70% market share in the branded battery market and an extensive sales network, Exide continued to grow over the year. It benefits from an increasing demand for new automobiles and battery replacements in India, one of the world's largest auto markets. The company is able to control costs through in-house recycling of key raw materials, such as lead, thereby reducing the need to import lead from overseas.
However, not all of the Fund's holdings performed as well as we had hoped, and we sold several names that fell short of our expectations. Taiwan's largest online job search operator, 104 Corp., is one such firm. It failed to adapt to the pricing needs of employers during a difficult year, and its China expansion plans have yielded few results after years of investment.
During the economic downturn, many of Asia's small companies controlled costs by downsizing and streamlining staffing and operations. Many also took advantage of lower prices for raw materials to protect profit margins. The weak U.S. dollar, combined with improving consumer demand toward the end of 2009, boosted energy and metal prices to record high levels. As a result, we expect pressure on profit margins may manifest in the short to medium term. Another area of concern is that small companies may experience renewed challenges in gaining access to funding. Thus far, central banks in Asia have been supportive of a loose monetary policy; however, banks may reverse this accommodative stance amid looming concerns over excess liquidity and inflation. We will continue to closely monitor the potential for these external factors to negatively impact companies and market sentiment in the small-cap universe.
Looking ahead, we will continue to seek companies with strong fundamentals, particularly those likely to endure through strong franchises, growing brand value and pricing power. Our focus remains on investing in good businesses that can survive investments cycles, and going forward, we expect our investment universe to continue to expand. The resumption of the region's initial public offerings in June, as market conditions began stabilizing, indicated to us that entrepreneurial activities were healthy and that capital markets were also continuing to deepen—both important factors to increasing the breadth and depth of the small-cap universe.
52 MATTHEWS ASIA FUNDS
Matthews Asia Small Companies Fund December 31, 2009
Schedule of Investmentsa
COMMON EQUITIES: 96.8%
| Shares | Value | ||||||||||
| CHINA/HONG KONG: 30.6% | |||||||||||
| Uni-President China Holdings, Ltd. | 3,675,000 | $ | 2,694,325 | ||||||||
| Vinda International Holdings, Ltd. | 3,353,000 | 2,373,272 | |||||||||
| Xinyi Glass Holdings Co., Ltd. | 2,468,000 | 2,224,295 | |||||||||
| KWG Property Holding, Ltd. | 2,787,500 | 2,126,622 | |||||||||
| Yip's Chemical Holdings, Ltd. | 2,514,000 | 2,048,543 | |||||||||
| Zhuzhou CSR Times Electric Co., Ltd. H Shares | 976,000 | 1,991,637 | |||||||||
| Hengdeli Holdings, Ltd. | 5,236,000 | 1,977,057 | |||||||||
| Minth Group, Ltd. | 1,272,000 | 1,867,268 | |||||||||
| Kingdee International Software Group Co., Ltd. | 7,638,000 | 1,700,897 | |||||||||
| AAC Acoustic Technologies Holdings, Inc. | 1,006,000 | 1,651,740 | |||||||||
| Xingda International Holdings, Ltd. | 3,459,000 | 1,610,373 | |||||||||
| Golden Eagle Retail Group, Ltd. | 774,000 | 1,569,986 | |||||||||
| Wasion Group Holdings, Ltd. | 1,472,000 | 1,529,985 | |||||||||
| PCD Stores, Ltd.b | 3,654,900 | 1,418,894 | |||||||||
| Dalian Port PDA Co., Ltd. H Shares | 3,612,000 | 1,388,795 | |||||||||
| China Green Holdings, Ltd. | 1,248,000 | 1,181,835 | |||||||||
| Towngas China Co., Ltd. | 2,448,000 | 982,273 | |||||||||
| Mindray Medical International, Ltd. ADR | 26,800 | 909,056 | |||||||||
| Shandong Weigao Group Medical Polymer Co., Ltd. H Shares | 260,000 | 866,507 | |||||||||
| Times, Ltd. | 1,001,000 | 716,207 | |||||||||
| Sino-Ocean Land Holdings, Ltd. | 748,500 | 687,259 | |||||||||
| Sany Heavy Equipment International Holdings Co., Ltd.b | 33,000 | 41,753 | |||||||||
| Total China/Hong Kong | 33,558,579 | ||||||||||
| INDIA: 19.3% | |||||||||||
| Exide Industries, Ltd. | 764,907 | 1,886,021 | |||||||||
| CMC, Ltd. | 59,094 | 1,697,100 | |||||||||
| Sintex Industries, Ltd. | 286,542 | 1,683,259 | |||||||||
| Thermax, Ltd. | 123,967 | 1,614,720 | |||||||||
| Ipca Laboratories, Ltd. | 69,276 | 1,550,356 | |||||||||
| Sun TV Network, Ltd. | 202,493 | 1,483,072 | |||||||||
| Federal Bank, Ltd. | 266,822 | 1,343,504 | |||||||||
| Sanghvi Movers, Ltd. | 245,013 | 1,179,679 | |||||||||
| Page Industries, Ltd. | 60,266 | 1,123,234 | |||||||||
| Jain Irrigation Systems, Ltd. | 60,116 | 1,121,869 | |||||||||
| Emami, Ltd.b | 105,274 | 1,111,066 | |||||||||
| Asian Paints, Ltd. | 28,364 | 1,094,112 | |||||||||
| India Infoline, Ltd. | 384,630 | 1,057,982 | |||||||||
| Container Corp. of India, Ltd. | 37,557 | 1,054,229 | |||||||||
| CRISIL, Ltd. | 10,292 | 984,357 | |||||||||
| Dabur India, Ltd. | 203,265 | 689,966 | |||||||||
| Unitech, Ltd. | 255,452 | 449,213 | |||||||||
| Emami Infrastructure, Ltd. | 35,091 | 53,889 | |||||||||
| Total India | 21,177,628 | ||||||||||
| Shares | Value | ||||||||||
| TAIWAN: 16.5% | |||||||||||
| St. Shine Optical Co., Ltd. | 519,492 | $ | 3,100,921 | ||||||||
| Synnex Technology International Corp. | 1,270,800 | 2,744,625 | |||||||||
| Richtek Technology Corp. | 210,000 | 2,139,584 | |||||||||
| Pacific Hospital Supply Co., Ltd. | 786,000 | 1,983,121 | |||||||||
| TXC Corp. | 1,049,900 | 1,922,571 | |||||||||
| ACES Electronic Co., Ltd. | 473,000 | 1,880,221 | |||||||||
| Everlight Electronic Co., Ltd. | 425,046 | 1,596,098 | |||||||||
| Formosa International Hotels Corp. | 116,700 | 1,492,146 | |||||||||
| Chroma ATE, Inc. | 525,175 | 1,193,295 | |||||||||
| Total Taiwan | 18,052,582 | ||||||||||
| SOUTH KOREA: 14.7% | |||||||||||
| Dongbu Insurance Co., Ltd. | 83,400 | 2,318,127 | |||||||||
| YES24 Co., Ltd. | 245,490 | 2,291,573 | |||||||||
| Sung Kwang Bend Co., Ltd. | 72,052 | 1,742,826 | |||||||||
| Korea Plant Service & Engineering Co., Ltd. | 45,090 | 1,644,282 | |||||||||
| POSCO Refractories & Environment Co., Ltd. | 31,315 | 1,343,552 | |||||||||
| Kiwoom Securities Co., Ltd. | 35,605 | 1,280,837 | |||||||||
| MegaStudy Co., Ltd. | 5,637 | 1,158,779 | |||||||||
| Modetour Network, Inc.b | 47,283 | 1,126,174 | |||||||||
| Samsung Digital Imaging Co., Ltd. | 29,580 | 1,117,852 | |||||||||
| Cheil Worldwide, Inc. | 3,991 | 1,080,832 | |||||||||
| Korea Zinc Co., Ltd. | 5,859 | 1,023,153 | |||||||||
| Total South Korea | 16,127,987 | ||||||||||
| SINGAPORE: 11.1% | |||||||||||
| Singapore Airport Terminal Services, Ltd. | 1,347,000 | 2,617,391 | |||||||||
| Ascendas India Trust | 2,750,000 | 1,900,713 | |||||||||
| Keppel Land, Ltd. | 736,000 | 1,818,744 | |||||||||
| CSE Global, Ltd. | 2,943,000 | 1,805,113 | |||||||||
| CapitaRetail China Trust, REIT | 1,725,000 | 1,560,872 | |||||||||
| Tat Hong Holdings, Ltd. | 1,883,000 | 1,400,247 | |||||||||
| Armstrong Industrial Corp., Ltd. | 6,291,000 | 1,106,792 | |||||||||
| Total Singapore | 12,209,872 | ||||||||||
| MALAYSIA: 3.2% | |||||||||||
| Dialog Group BHD | 4,008,742 | 1,535,118 | |||||||||
| KNM Group BHD | 6,115,500 | 1,362,492 | |||||||||
| CB Industrial Product Holding BHD | 778,400 | 662,097 | |||||||||
| Total Malaysia | 3,559,707 | ||||||||||
matthewsasia.com | 800.789.ASIA 53
Matthews Asia Small Companies Fund December 31, 2009
Schedule of Investmentsa (continued)
COMMON EQUITIES (continued)
| Shares | Value | ||||||||||
| INDONESIA: 1.4% | |||||||||||
| PT Jasa Marga | 5,752,500 | $ | 1,104,766 | ||||||||
| PT Bisi Internationalb | 2,804,500 | 402,181 | |||||||||
| Total Indonesia | 1,506,947 | ||||||||||
| TOTAL INVESTMENTS: 96.8% | 106,193,302 | ||||||||||
| (Cost $85,284,174c) | |||||||||||
| CASH AND OTHER ASSETS, LESS LIABILITIES: 3.2% | 3,532,259 | ||||||||||
| NET ASSETS: 100.0% | $ | 109,725,561 | |||||||||
a Certain securities were fair valued under the discretion of the Board of Trustees (Note 1-A).
b Non-income producing security.
c Cost for Federal income tax purposes is $85,874,625 and net unrealized appreciation consists of:
| Gross unrealized appreciation | $ | 21,173,356 | |||||
| Gross unrealized depreciation | (854,679 | ) | |||||
| Net unrealized appreciation | $ | 20,318,677 | |||||
ADR American Depositary Receipt
BHD Berhad
REIT Real Estate Investment Trust
See accompanying notes to financial statements.
54 MATTHEWS ASIA FUNDS

ASIA SPECIALTY STRATEGY
PORTFOLIO MANAGERS
J. Michael Oh
Lead Manager
Lydia So
Co-Manager
FUND FACTS
| Ticker | MATFX | ||||||
| Inception Date | 12/27/99 | ||||||
| Assets | $130.4 million | ||||||
| NAV | $8.02 | ||||||
| Total # of Positions | 59 | ||||||
Fiscal Year 2009 Ratios
| Portfolio Turnover | 83.27 | %1 | |||||
| Gross Expense Ratio | 1.40 | %2 | |||||
Benchmark
MSCI/Matthews Asian Technology Index
Redemption Fee
2% within first 90 calendar days of purchase
OBJECTIVE
Long-term capital appreciation.
STRATEGY
Under normal market conditions, the Fund seeks to achieve its investment objective by investing at least 80% of its total net assets, which include borrowings for investment purposes, in the common and preferred stocks of companies located in Asia that derive more than 50% of their revenues from the sale of products or services in technology-related industries and services.
1 The lesser of fiscal year 2009 long-term purchase costs or sales proceeds divided by the average monthly market value of long-term securities.
2 Matthews Asia Funds does not charge 12b-1 fees.
Matthews Asian Technology Fund
Portfolio Manager Commentary
For the year ending December 31, 2009, the Matthews Asian Technology Fund returned 70.28% while its benchmark, the MSCI/Matthews Asian Technology Index, gained 40.59%. For the fourth quarter, the Fund rose 7.08%, compared to a 2.70% increase for the benchmark. Overall, the year saw a recovery in Asia's technology sector after it fell to its lowest level in more than five years during the first quarter of 2009.
Asian technology stocks quickly rebounded on the back of government stimulus programs from around the world and easing concerns over the global financial crisis. China's demand for IT products, as well as the government's subsidies on technology purchases, such as computers and televisions, helped sentiment and led the sector's recovery.
The Fund has historically sought to invest in companies poised to benefit from growth in Asia's domestic consumption; this strategy paid off during 2009. The Fund's outperformance relative to the benchmark was due primarily to its overweight in China, and particularly in domestically oriented firms, such as Internet and software companies. The portfolio's holdings in the hardware sector also performed well as the demand outlook for technology products improved and inventory levels of various technology firms remained healthy. Our increased exposure to Taiwanese technology firms—a shift we made in the first quarter when valuations became more compelling—also benefited Fund performance in 2009.
Telecommunication services and Japanese consumer electronics were two areas that underperformed during the year. The telecommunication services sector generally outperformed in 2008, but underperformed in 2009 as investors' risk appetite grew. Japanese consumer electronics companies were negatively impacted by a strong yen as exports constitute a large part of their sales. However, we maintain a positive outlook for the global competitiveness of Japanese consumer electronics companies, especially in developed markets, and increased our holdings in these stocks during the last quarter of the year as valuations became attractive.
In 2009, we also added to our positions in technology-related health care companies. Asia is already the world's largest health care market in terms of number of patients, and we see great potential for the sector's long-term growth as per patient spending in Asia is still among the lowest globally. In 2008, U.S. health care spending per capita was approximately US$7,000. By comparison, per capita spending in Asia ex-Japan was only US$600.The Fund specifically seeks to focus on medical device makers as we believe these firms are well-poised to benefit from the industry's overall growth. That said, we expect to increase our exposure to the health care sector gradually as valuations in these industries remain high.
During the year, the biggest contributor to Fund performance was Baidu, China's leading online search service provider. We believe that Baidu has demonstrated a better understanding of both the Chinese consumer and local regulations than its competitors. While China has surpassed the U.S. in terms of its number of Internet users, with more than 300 million users, the penetration is only at approximately 22% of the total population in China, according to the World Bank. As China's Internet penetration rate rises, we expect Baidu to maintain its leadership position in the market. However, the relationship between the Chinese government and Internet firms, such as Google, raises questions about regulatory risk related to China's Internet industry. Another
(continued)
matthewsasia.com | 800.789.ASIA 55
PERFORMANCE AS OF DECEMBER 31, 2009
| Average Annual Total Return | |||||||||||||||||||||||||||
| 3 Months | 1 Year | 3 Years | 5 Years | 10 Years | Inception 12/27/99 | ||||||||||||||||||||||
| Matthews Asian Technology Fund | 7.08 | % | 70.28 | % | 0.42 | % | 8.03 | % | -1.78 | % | -1.64 | % | |||||||||||||||
| MSCI/Matthews Asian Technology Index3 | 2.70 | % | 40.59 | % | -2.08 | % | 4.69 | % | -6.32 | % | -6.31 | %4 | |||||||||||||||
| Lipper Global Sciences and Technology Funds Category Average5 | 7.89 | % | 68.51 | % | 0.75 | % | 3.42 | % | -4.90 | % | -4.90 | %4 | |||||||||||||||
Performance assumes reinvestment of all dividends and/or distributions before taxes. All performance quoted represents past performance and is no guarantee of future results. Investment return and principal value will fluctuate with market conditions so that when redeemed, shares may be worth more or less than their original cost. Current performance may be lower or higher than the return figures quoted. Returns would have been lower if certain of the Fund's fees and expenses had not been waived. For the Fund's most recent month-end performance visit matthewsasia.com.
GROWTH OF A $10,000 INVESTMENT SINCE INCEPTION
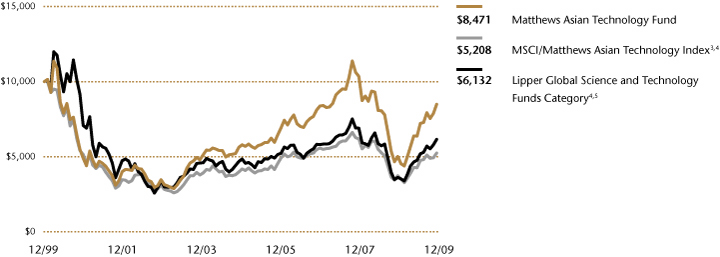
Plotted monthly. The performance data and graph do not reflect the deduction of taxes that a shareholder would pay on dividends, capital gain distributions or redemption of Fund shares. Values are in US$.
3 It is not possible to invest directly in an index. Source: Index data from Morgan Stanley Capital Management; total return calculations performed by PNC Global Investment Servicing (U.S.) Inc. Please see page 59 for index definition.
4 Calculated from 12/31/99.
5 The Lipper Category Average does not reflect sales charges and is based on total return, including reinvestment of dividends and capital gains for the stated periods.
TOP TEN HOLDINGS6
| Country | % of Net Assets | ||||||||||
| Baidu, Inc. | China/Hong Kong | 4.5 | % | ||||||||
| Samsung Electronics Co., Ltd. | South Korea | 3.9 | % | ||||||||
| Hon Hai Precision Industry Co., Ltd. | Taiwan | 3.7 | % | ||||||||
| Taiwan Semiconductor Manufacturing Co., Ltd. | Taiwan | 3.0 | % | ||||||||
| Sony Corp. | Japan | 2.7 | % | ||||||||
| Toshiba Corp. | Japan | 2.7 | % | ||||||||
| NHN Corp. | South Korea | 2.6 | % | ||||||||
| Infosys Technologies, Ltd. | India | 2.4 | % | ||||||||
| Tencent Holdings, Ltd. | China/Hong Kong | 2.4 | % | ||||||||
| ZTE Corp. | China/Hong Kong | 2.4 | % | ||||||||
| % OF ASSETS IN TOP TEN | 30.3 | % | |||||||||
6 Holdings may combine more than one security from same issuer and related depositary receipts.
56 MATTHEWS ASIA FUNDS
Matthews Asian Technology Fund
Portfolio Manager Commentary (continued)
large contributor to Fund performance was Hon Hai Precision Industry, an electronics manufacturing services firm headquartered in Taiwan. Hon Hai provides manufacturing services to almost all major technology companies, including Apple and Sony. The firm manufactures a very broad set of products, ranging from mobile phones to gaming consoles, and the company is well-positioned to benefit from the technology sector's ongoing recovery.
Over the past few years, we have seen more innovation taking place in Asia and companies in the region are now market leaders in many emerging technologies. For example, Asian companies now manufacture more than 80% of the world's rechargeable lithium-ion batteries, and own the majority of related patents. Asian companies also lead the market for electronic display technology and are developing the next generation of displays. In addition, a Taiwanese company owns the main technology that is used in more than 90% of all electronic reading devices, or "e-readers," sold worldwide. The Fund has invested in these and other emerging technologies, and believes the growth prospects for Asian technology remain bright.
Asia is now the largest market for many of its own consumer technology products. Not only has the region become the biggest market for Internet services, it is also the largest market for mobile handsets and wireless telecommunication services. Furthermore, Asia is also expected to become the largest market for personal computers and LCD televisions. What is even more exciting about this trend is that the region's consumers are favoring Asian brands over competitors from the West.
It is important to note that some long-term risks remain. In addition to issues relating to China's control over Internet firms, there is also the risk of weak intellectual property (IP) protection, especially in the region's emerging countries, which can deter innovation. Another risk is that Asia's technology sector tends to trade on short-term investor sentiment and that can sometimes exaggerate stock movements and cause volatility. We believe that investing in the sector for the long term, can minimize some of these risks.
Looking ahead, we expect the global demand for technology products and services to steadily improve as the global economy continues to recover. The overall demand for technology products remains healthy in many emerging countries; however, in most developed countries the demand remains weak. Additionally, as government stimulus programs wane, there may be some risk that the global demand for technology products and services falls again. We remain focused on finding firms that can benefit from the region's long-term growth prospects and specifically, in two long-term trends: increasing Asian consumption and corporate IT spending. While we expect the sector to remain volatile over the short-term, we are optimistic about its long-term prospects.
We are pleased to announce that in December, the Fund marked its 10th year of operation. We reached this milestone as a result of the long-term commitment of our shareholders through some volatile market cycles. We thank you for your ongoing support and will continue to work hard on your behalf.
COUNTRY ALLOCATION (%)
| China/Hong Kong | 25.7 | ||||||
| Taiwan | 22.6 | ||||||
| Japan | 22.3 | ||||||
| South Korea | 16.4 | ||||||
| India | 6.7 | ||||||
| United States | 2.0 | ||||||
| Indonesia | 1.8 | ||||||
| Philippines | 1.1 | ||||||
| Cash and Other Assets, Less Liabilities | 1.4 | ||||||
SECTOR ALLOCATION (%)
| Information Technology | 66.2 | ||||||
| Consumer Discretionary | 11.9 | ||||||
| Telecommunication Services | 9.1 | ||||||
| Health Care | 4.7 | ||||||
| Industrials | 4.6 | ||||||
| Materials | 1.1 | ||||||
| Financials | 1.0 | ||||||
| Cash and Other Assets, Less Liabilities | 1.4 | ||||||
MARKET CAP EXPOSURE (%)7
| Large Cap (Over $5B) | 62.6 | ||||||
| Mid Cap ($1B-$5B) | 26.8 | ||||||
| Small Cap (Under $1B) | 9.2 | ||||||
| Cash and Other Assets, Less Liabilities | 1.4 | ||||||
7 Source: FactSet Research Systems. Percentage values in data are rounded to the nearest tenth of one percent; the values may not sum to 100% due to rounding.
matthewsasia.com | 800.789.ASIA 57
Matthews Asian Technology Fund December 31, 2009
Schedule of Investmentsa
COMMON EQUITIES: 98.6%
| Shares | Value | ||||||||||
| CHINA/HONG KONG: 25.7% | |||||||||||
| Baidu, Inc. ADRb | 14,400 | $ | 5,921,712 | ||||||||
| Tencent Holdings, Ltd. | 147,200 | 3,183,600 | |||||||||
| ZTE Corp. H Shares | 509,280 | 3,131,153 | |||||||||
| China Mobile, Ltd. ADR | 59,000 | 2,739,370 | |||||||||
| Ctrip.com International, Ltd. ADRb | 31,300 | 2,249,218 | |||||||||
| Mindray Medical International, Ltd. ADR | 66,200 | 2,245,504 | |||||||||
| New Oriental Education & Technology Group, Inc. ADRb | 25,500 | 1,928,055 | |||||||||
| ASM Pacific Technology, Ltd. | 199,200 | 1,883,368 | |||||||||
| Kingdee International Software Group Co., Ltd. | 7,478,000 | 1,665,267 | |||||||||
| Lenovo Group, Ltd. | 2,584,000 | 1,601,363 | |||||||||
| Sohu.com, Inc.b | 27,900 | 1,598,112 | |||||||||
| AAC Acoustic Technologies Holdings, Inc. | 972,000 | 1,595,916 | |||||||||
| Shanda Games, Ltd. ADRb | 147,800 | 1,506,082 | |||||||||
| NetEase.com, Inc. ADRb | 37,700 | 1,417,897 | |||||||||
| Shandong Weigao Group Medical Polymer Co., Ltd. H Shares | 268,000 | 893,169 | |||||||||
| Total China/Hong Kong | 33,559,786 | ||||||||||
| TAIWAN: 22.6% | |||||||||||
| Hon Hai Precision Industry Co., Ltd. | 1,018,333 | 4,762,393 | |||||||||
| Taiwan Semiconductor Manufacturing Co., Ltd. | 1,928,933 | 3,887,715 | |||||||||
| Richtek Technology Corp. | 288,150 | 2,935,814 | |||||||||
| MediaTek, Inc. | 157,156 | 2,730,516 | |||||||||
| Synnex Technology International Corp. | 1,157,300 | 2,499,492 | |||||||||
| Acer, Inc. | 674,780 | 2,024,834 | |||||||||
| ACES Electronic Co., Ltd. | 456,000 | 1,812,644 | |||||||||
| Prime View International Co., Ltd.b | 682,000 | 1,781,967 | |||||||||
| St. Shine Optical Co., Ltd. | 261,000 | 1,557,946 | |||||||||
| Epistar Corp. | 406,000 | 1,519,161 | |||||||||
| WPG Holdings Co., Ltd. | 864,000 | 1,504,955 | |||||||||
| Chunghwa Telecom Co., Ltd. | 660,038 | 1,230,988 | |||||||||
| TXC Corp. | 637,000 | 1,166,471 | |||||||||
| Total Taiwan | 29,414,896 | ||||||||||
| JAPAN: 22.3% | |||||||||||
| Sony Corp. | 122,700 | 3,567,107 | |||||||||
| Toshiba Corp.b | 642,000 | 3,562,394 | |||||||||
| Canon, Inc. | 70,000 | 2,977,693 | |||||||||
| Softbank Corp. | 97,600 | 2,288,011 | |||||||||
| Fanuc, Ltd. | 23,500 | 2,190,247 | |||||||||
| Disco Corp. | 34,700 | 2,173,517 | |||||||||
| Nidec Corp. | 23,000 | 2,125,727 | |||||||||
| Nippon Electric Glass Co., Ltd. | 152,000 | 2,092,110 | |||||||||
| Tokyo Electron, Ltd. | 24,300 | 1,559,770 | |||||||||
| Shinko Electric Industries Co., Ltd. | 104,100 | 1,515,347 | |||||||||
| JSR Corp. | 68,700 | 1,398,170 | |||||||||
| Keyence Corp. | 6,480 | 1,344,883 | |||||||||
| Nikon Corp. | 63,000 | 1,244,028 | |||||||||
| Wacom Co., Ltd. | 482 | 1,051,196 | |||||||||
| Total Japan | 29,090,200 | ||||||||||
| Shares | Value | ||||||||||
| SOUTH KOREA: 16.4% | |||||||||||
| Samsung Electronics Co., Ltd. | 7,400 | $ | 5,074,402 | ||||||||
| NHN Corp.b | 20,228 | 3,343,242 | |||||||||
| LG Electronics, Inc. | 21,999 | 2,293,356 | |||||||||
| JVM Co., Ltd.b | 61,129 | 1,932,582 | |||||||||
| Samsung Electro-Mechanics Co., Ltd. | 20,343 | 1,870,877 | |||||||||
| SK Telecom Co., Ltd. ADR | 112,900 | 1,835,754 | |||||||||
| LG Display Co., Ltd. ADR | 105,400 | 1,784,422 | |||||||||
| Samsung SDI Co., Ltd. | 12,985 | 1,653,431 | |||||||||
| Samsung Digital Imaging Co., Ltd. | 41,237 | 1,558,379 | |||||||||
| Total South Korea | 21,346,445 | ||||||||||
| INDIA: 6.7% | |||||||||||
| Infosys Technologies, Ltd. | 57,312 | 3,189,706 | |||||||||
| Exide Industries, Ltd. | 628,792 | 1,550,404 | |||||||||
| Lupin, Ltd. | 43,481 | 1,373,500 | |||||||||
| Sun TV Network, Ltd. | 185,908 | 1,361,602 | |||||||||
| India Infoline, Ltd. | 474,697 | 1,305,725 | |||||||||
| Total India | 8,780,937 | ||||||||||
| UNITED STATES: 2.0% | |||||||||||
| Cognizant Technology Solutions Corp., Class Ab | 57,400 | 2,600,220 | |||||||||
| Total United States | 2,600,220 | ||||||||||
| INDONESIA: 1.8% | |||||||||||
| PT Telekomunikasi Indonesia ADR | 58,600 | 2,341,070 | |||||||||
| Total Indonesia | 2,341,070 | ||||||||||
| PHILIPPINES: 1.1% | |||||||||||
| Globe Telecom, Inc. | 71,130 | 1,398,863 | |||||||||
| Total Philippines | 1,398,863 | ||||||||||
| TOTAL INVESTMENTS: 98.6% | 128,532,417 | ||||||||||
| (Cost $99,393,029c) | |||||||||||
| CASH AND OTHER ASSETS, LESS LIABILITIES: 1.4% | 1,834,694 | ||||||||||
| NET ASSETS: 100.0% | $ | 130,367,111 | |||||||||
a Certain securities were fair valued under the discretion of the Board of Trustees (Note 1-A).
b Non-income producing security.
c Cost for Federal income tax purposes is $101,346,564 and net unrealized appreciation consists of:
| Gross unrealized appreciation | $ | 31,984,340 | |||||
| Gross unrealized depreciation | (4,798,487 | ) | |||||
| Net unrealized appreciation | $ | 27,185,853 | |||||
ADR American Depositary Receipt
See accompanying notes to financial statements.
58 MATTHEWS ASIA FUNDS
Disclosures and Index Definitions
Disclosures
Fund Holdings: The Fund holdings shown in this report are as of December 31, 2009. Holdings are subject to change at any time, so holdings shown in this report may not reflect current Fund holdings. The Funds file complete schedules of portfolio holdings with the Securities and Exchange Commission (the "SEC") for the first and third quarters of each fiscal year on Form N-Q. The Funds' Form N-Q is filed with the SEC within 60 days of the end of the quarter to which it relates, and is available on the SEC's website at www.sec.gov. It may also be reviewed and copied at the Commission's Public Reference Room in Washington, D.C. Information on the operation of the Public Reference Room may be obtained by calling 800-SEC-0330. Complete schedules of investment are also available without charge, upon request, from the Funds by calling us at 800.789.ASIA (2472 ).
Proxy Voting Record: The Funds' Statement of Additional Information containing a description of the policies and procedures that the Funds have used to vote proxies relating to portfolio securities, along with each Fund's proxy voting record relating to portfolio securities held during the 12-month period ended June 30, 2009, is available upon request, at no charge, at the Funds' website at matthewsasia.com or by calling 1.800.789.ASIA (2742), or on the SEC's website at www.sec.gov.
Shareholder Reports and Prospectuses: To reduce the Funds' expenses, we try to identify related shareholders in a household and send only one copy of the Funds' prospectus and financial reports to that address. This process, called "householding," will continue indefinitely unless you instruct us otherwise. At any time you may view the Funds' current prospectus and financial reports on our website. If you prefer to receive individual copies of the Funds' prospectus or financial reports, please call us at 1.800.789.ASIA (2742).
Index Definitions
The MSCI All Country Asia ex Japan Index is a free float–adjusted market capitalization–weighted index of the stock of markets of China, Hong Kong, India, Indonesia, Malaysia, Philippines, Singapore, South Korea, Taiwan and Thailand.
The MSCI All Country Far East ex Japan Index is a free float–adjusted market capitalization–weighted index of the stock markets of China, Hong Kong, Indonesia, Malaysia, Philippines, Singapore, South Korea, Taiwan and Thailand.
The MSCI All Country Asia Pacific Index is a free float– adjusted market capitalization–weighted index of the stock markets of Australia, China, Hong Kong, India, Indonesia, Japan, Malaysia, New Zealand, Philippines, Singapore, South Korea, Taiwan and Thailand.
The MSCI China Index is a free float–adjusted market capitalization–weighted index of Chinese equities that includes China-affiliated corporations and H shares listed on the Hong Kong Exchange, and B shares listed on the Shanghai and Shenzhen exchanges.
The Bombay Stock Exchange (BSE) 100 Index is a free float–adjusted market capitalization–weighted index of the 100 stocks listed on the Bombay Stock Exchange.
The MSCI Japan Index is a free float–adjusted market capitalization–weighted index of Japanese equities listed in Japan.
The Tokyo Stock Price Index (TOPIX) is a market capitalization–weighted index of all companies listed on the First Section of the Tokyo Stock Exchange.
The Korea Composite Stock Price Index (KOSPI) is a market capitalization–weighted index of all common stocks listed on the Korea Stock Exchange.
The MSCI All Country Asia ex Japan Small Cap Index is a free float–adjusted market capitalization–weighted small cap index of the stock markets of China, Hong Kong, India, Indonesia, Malaysia, Philippines, Singapore, South Korea, Taiwan and Thailand.
The MSCI/Matthews Asian Technology Index is a free float–adjusted market capitalization–weighted index of Asian equities tracking a broad range of technology stocks including semiconductor equipment and products, communications equipment, computers and peripherals, electronic equipment and instruments, office electronics, software, IT consulting and services, Internet software and services, diversified telecommunications services, and wireless telecommunications services.
matthewsasia.com | 800.789.ASIA 59
Disclosure of Fund Expenses (Unaudited)
We believe it is important for you to understand the impact of fees regarding your investment. All mutual funds have operating expenses. As a shareholder of a mutual fund, you incur ongoing costs, which include costs for portfolio management, administrative services, and shareholder reports (like this one), among others. Operating expenses, which are deducted from a fund's gross income, directly reduce the investment return of the fund. A fund's operating expenses are expressed as a percentage of its average net assets. This figure is known as the expense ratio. The following examples are intended to help you understand the ongoing fees (in dollars) of investing in your fund and to compare these costs with those of other mutual funds. The examples are based on an investment of $1,000 made at the beginning of the period shown and held for the entire period.
This table illustrates your fund's costs in two ways:
Actual Fund Return: This section helps you to estimate the actual operating expenses, after any applicable fee waivers, that you paid over the period. The "Ending Account Value" shown is derived from the fund's actual return for the past six month period, the "Expense Ratio" column shows the period's annualized expense ratio, and the "Operating Expenses Paid During Period" column shows the dollar amount that would have been paid by an investor who started with $1,000 in the fund at the beginning of the period. You may use the information here, together with your account value, to estimate the expenses that you paid over the period. To do so, simply divide your account value by $1,000 (for example, an $8,600 account value divided by $1,000 = 8.6), then multiply the result by the number given for your fund in the first line under the heading entitled "O perating Expenses Paid During Period."
Hypothetical 5% Return: This section is intended to help you compare your fund's costs with those of other mutual funds. It assumes that the fund had an annual return of 5% before operating expenses, but that the expense ratio is unchanged. In this case, because the return used is not the fund's actual return, the results do not apply to your investment. This example is useful in making comparisons to other mutual funds because the Securities and Exchange Commission requires all mutual funds to calculate expenses based on an assumed 5% annual return. You can assess your fund's costs by comparing this hypothetical example with the hypothetical examples that appear in shareholder reports of other funds.
Please note that the operating expenses shown in the table are meant to highlight and help you compare your ongoing costs only and do not reflect any transactional costs such as sales charges (loads), redemption fees, or exchange fees. The Funds generally assess a redemption fee of 2.00% of the total redemption proceeds if you sell or exchange your shares within 90 calendar days after purchasing them. The redemption fee is paid directly to the Funds and is designed to discourage frequent short-term trading and to offset transaction costs associated with such trading of Fund shares. For purposes of detemining whether the redemption fee applies, the shares that have been held the longest will be redeemed first. The Funds may grant exemption from the redemption fee when the Funds have previously received assurances that transactions do not involve market timing activity. The Funds may also waive the imposition of redemption fees in certain circumstances.
For more information on this policy, please see the Funds' prospectus.
The Matthews Asia Funds do not charge any sales loads, exchange fees, or 12b-1 fees, but these may be present in other funds to which you compare this data. Therefore, the hypothetical portions of the table are useful in comparing ongoing costs only, and will not help you determine the relative total costs of owning different funds.
60 MATTHEWS ASIA FUNDS
December 31, 2009
| Beginning Account Value 7/01/09 | Ending Account Value12/31/09 | Expense Ratio1 | Operating Expenses Paid During Period 7/1/09–12/31/092 | ||||||||||||||||
| ASIA GROWTH AND INCOME STRATEGIES | |||||||||||||||||||
| Matthews Asian Growth and Income Fund | |||||||||||||||||||
| Actual Fund Return | $ | 1,000.00 | $ | 1,187.20 | 1.16 | % | $ | 6.40 | |||||||||||
| Hypothetical 5% Return | $ | 1,000.00 | $ | 1,019.36 | 1.16 | % | $ | 5.90 | |||||||||||
| Matthews Asia Dividend Fund | |||||||||||||||||||
| Actual Fund Return | $ | 1,000.00 | $ | 1,252.80 | 1.28 | % | $ | 7.27 | |||||||||||
| Hypothetical 5% Return | $ | 1,000.00 | $ | 1,018.75 | 1.28 | % | $ | 6.51 | |||||||||||
| Matthews China Dividend Fund3 | |||||||||||||||||||
| Actual Fund Return | $ | 1,000.00 | $ | 1,001.32 | 1.50 | % | $ | 1.32 | |||||||||||
| Hypothetical 5% Return | $ | 1,000.00 | $ | 1,003.07 | 1.50 | % | $ | 1.32 | |||||||||||
| ASIA GROWTH STRATEGIES | |||||||||||||||||||
| Matthews Asia Pacific Fund | |||||||||||||||||||
| Actual Fund Return | $ | 1,000.00 | $ | 1,195.50 | 1.20 | % | $ | 6.64 | |||||||||||
| Hypothetical 5% Return | $ | 1,000.00 | $ | 1,019.16 | 1.20 | % | $ | 6.11 | |||||||||||
| Matthews Pacific Tiger Fund | |||||||||||||||||||
| Actual Fund Return | $ | 1,000.00 | $ | 1,274.90 | 1.10 | % | $ | 6.31 | |||||||||||
| Hypothetical 5% Return | $ | 1,000.00 | $ | 1,019.66 | 1.10 | % | $ | 5.60 | |||||||||||
| Matthews China Fund | |||||||||||||||||||
| Actual Fund Return | $ | 1,000.00 | $ | 1,282.20 | 1.20 | % | $ | 6.90 | |||||||||||
| Hypothetical 5% Return | $ | 1,000.00 | $ | 1,019.16 | 1.20 | % | $ | 6.11 | |||||||||||
| Matthews India Fund | |||||||||||||||||||
| Actual Fund Return | $ | 1,000.00 | $ | 1,340.10 | 1.21 | % | $ | 7.14 | |||||||||||
| Hypothetical 5% Return | $ | 1,000.00 | $ | 1,019.11 | 1.21 | % | $ | 6.16 | |||||||||||
| Matthews Japan Fund | |||||||||||||||||||
| Actual Fund Return | $ | 1,000.00 | $ | 1,086.80 | 1.30 | % | $ | 6.84 | |||||||||||
| Hypothetical 5% Return | $ | 1,000.00 | $ | 1,018.65 | 1.30 | % | $ | 6.61 | |||||||||||
| Matthews Korea Fund | |||||||||||||||||||
| Actual Fund Return | $ | 1,000.00 | $ | 1,374.30 | 1.25 | % | $ | 7.48 | |||||||||||
| Hypothetical 5% Return | $ | 1,000.00 | $ | 1,018.90 | 1.25 | % | $ | 6.36 | |||||||||||
| ASIA SMALL COMPANY STRATEGY | |||||||||||||||||||
| Matthews Asia Small Companies Fund | |||||||||||||||||||
| Actual Fund Return | $ | 1,000.00 | $ | 1,379.00 | 2.00 | % | $ | 11.99 | |||||||||||
| Hypothetical 5% Return | $ | 1,000.00 | $ | 1,015.12 | 2.00 | % | $ | 10.16 | |||||||||||
| ASIA SPECIALTY STRATEGY | |||||||||||||||||||
| Matthews Asian Technology Fund | |||||||||||||||||||
| Actual Fund Return | $ | 1,000.00 | $ | 1,336.70 | 1.31 | % | $ | 7.72 | |||||||||||
| Hypothetical 5% Return | $ | 1,000.00 | $ | 1,018.60 | 1.31 | % | $ | 6.67 | |||||||||||
1 Annualized, based on the Fund's most recent fiscal half-year expenses.
2 Operating expenses are equal to the Fund's annualized expense ratio multiplied by the average account value over the period, multiplied by the number of days in the most recent fiscal half-year, then divided by 365.
3 The Matthews China Dividend Fund commenced operations on November 30, 2009.
matthewsasia.com | 800.789.ASIA 61
Statements of Assets and Liabilities December 31, 2009
| Matthews Asian Growth and Income Fund | Matthews Asia Dividend Fund | Matthews China Dividend Fund | Matthews Asia Pacific Fund | Matthews Pacific Tiger Fund | Matthews China Fund | ||||||||||||||||||||||
| ASSETS: | |||||||||||||||||||||||||||
| Investments at value (A) (Note 1-A and 5): | |||||||||||||||||||||||||||
| Unaffiliated issuers | $ | 2,393,330,065 | $ | 309,562,458 | $ | 6,775,372 | $ | 225,680,323 | $ | 3,505,965,210 | $ | 2,443,748,289 | |||||||||||||||
| Affiliated issuers | 83,156,338 | — | — | — | — | 78,400,031 | |||||||||||||||||||||
| Total investments | 2,476,486,403 | 309,562,458 | 6,775,372 | 225,680,323 | 3,505,965,210 | 2,522,148,320 | |||||||||||||||||||||
| Cash | 77,184,002 | 11,437,617 | 446,000 | 3,107,156 | 67,089,402 | 48,208,586 | |||||||||||||||||||||
| Segregated foreign currency at value (B) | 2,504,833 | — | — | — | 1,284,920 | — | |||||||||||||||||||||
| Foreign currency at value (B) | 1,030,239 | 154,921 | 11,648 | 9,896 | 163,861 | — | |||||||||||||||||||||
| Dividends and interest receivable | 9,444,799 | 1,261,828 | — | 262,576 | 4,947,449 | 1,105,625 | |||||||||||||||||||||
| Receivable for securities sold | 5,252,598 | — | — | — | 1,430,314 | — | |||||||||||||||||||||
| Receivable for capital shares sold | 5,907,717 | 4,516,641 | 486,000 | 889,256 | 11,922,209 | 12,179,890 | |||||||||||||||||||||
| Due from Advisor (Note 3) | — | — | 28,271 | — | — | — | |||||||||||||||||||||
| Deferred offering costs (Note 1-E) | — | — | 31,072 | — | — | — | |||||||||||||||||||||
| Prepaid expenses and other assets | 32,437 | 19,041 | 1,118 | 11,351 | 33,668 | 62,968 | |||||||||||||||||||||
| TOTAL ASSETS | 2,577,843,028 | 326,952,506 | 7,779,481 | 229,960,558 | 3,592,837,033 | 2,583,705,389 | |||||||||||||||||||||
| LIABILITIES: | |||||||||||||||||||||||||||
| Payable for securities purchased | 20,375,735 | 4,233,672 | 593,316 | 255,442 | 9,309,887 | 10,427,280 | |||||||||||||||||||||
| Payable for capital shares redeemed | 7,518,932 | 363,798 | — | 1,787,971 | 2,286,149 | 4,595,959 | |||||||||||||||||||||
| Deferred tax liability (Note 1-D) | 4,289 | — | — | — | 12,003,858 | — | |||||||||||||||||||||
| Due to Advisor (Note 3) | 1,417,494 | 168,086 | — | 128,887 | 1,966,697 | 1,409,039 | |||||||||||||||||||||
| Administration and accounting fees payable | 69,884 | 7,838 | 62 | 6,333 | 96,928 | 68,710 | |||||||||||||||||||||
| Administration and shareholder servicing fees payable | 454,641 | 59,070 | 1,140 | 46,130 | 580,901 | 513,307 | |||||||||||||||||||||
| Professional fees payable | 40,263 | 24,570 | 15,040 | 27,772 | 45,449 | 26,055 | |||||||||||||||||||||
| Trustees fees payable | 662 | 970 | — | 100 | 671 | 441 | |||||||||||||||||||||
| Offering costs | — | — | 20,946 | — | — | — | |||||||||||||||||||||
| Accrued expenses payable | 550,158 | 91,156 | 14,519 | 57,407 | 801,482 | 659,289 | |||||||||||||||||||||
| TOTAL LIABILITIES | 30,432,058 | 4,949,160 | 645,023 | 2,310,042 | 27,092,022 | 17,700,080 | |||||||||||||||||||||
| NET ASSETS | $ | 2,547,410,970 | $ | 322,003,346 | $ | 7,134,458 | $ | 227,650,516 | $ | 3,565,745,011 | $ | 2,566,005,309 | |||||||||||||||
| SHARES OUTSTANDING: | |||||||||||||||||||||||||||
| (shares of beneficial interest issued and outstanding, respectively, unlimited number of shares authorized with a $0.001 par value) | 161,537,334 | 26,691,787 | 701,006 | 15,932,579 | 185,428,790 | 100,622,594 | |||||||||||||||||||||
| Net asset value, offering price and redemption price | $ | 15.77 | $ | 12.06 | $ | 10.18 | $ | 14.29 | $ | 19.23 | $ | 25.50 | |||||||||||||||
| NET ASSETS CONSIST OF: | |||||||||||||||||||||||||||
| Capital paid-in | $ | 2,278,402,200 | $ | 288,172,452 | $ | 7,019,836 | $ | 250,612,864 | $ | 2,877,521,028 | $ | 1,995,310,147 | |||||||||||||||
| Undistributed (distributions in excess of) net investment income (loss) | (7,490,172 | ) | (4,122,176 | ) | 613 | 90,967 | (19,578,638 | ) | 318,992 | ||||||||||||||||||
| Undistributed/(accumulated) net realized gain (loss) on investments, and foreign currency related transactions | (68,528,874 | ) | (18,779,341 | ) | — | (82,830,487 | ) | (195,616,603 | ) | (47,451,784 | ) | ||||||||||||||||
| Net unrealized appreciation on investments, foreign currency transactions and deferred taxes | 345,027,816 | 56,732,411 | 114,009 | 59,777,172 | 903,419,224 | 617,827,954 | |||||||||||||||||||||
| NET ASSETS | $ | 2,547,410,970 | $ | 322,003,346 | $ | 7,134,458 | $ | 227,650,516 | $ | 3,565,745,011 | $ | 2,566,005,309 | |||||||||||||||
| (A) Investments at cost: | |||||||||||||||||||||||||||
| Unaffiliated issuers | $ | 2,055,891,604 | $ | 252,822,397 | $ | 6,661,391 | $ | 165,900,436 | $ | 2,590,562,912 | $ | 1,864,483,009 | |||||||||||||||
| Affiliated issuers | 75,571,639 | — | — | — | — | 39,837,131 | |||||||||||||||||||||
| Total investments at cost | $ | 2,131,463,243 | $ | 252,822,397 | $ | 6,661,391 | $ | 165,900,436 | $ | 2,590,562,912 | $ | 1,904,320,140 | |||||||||||||||
| (B) Foreign currency at cost | $ | 3,536,138 | $ | 154,151 | $ | 11,532 | $ | 9,896 | $ | 1,449,262 | $ | — | |||||||||||||||
See accompanying notes to financial statements.
62 MATTHEWS ASIA FUNDS
| Matthews India Fund | Matthews Japan Fund | Matthews Korea Fund | Matthews Asia Small Companies Fund | Matthews Asian Technology Fund | |||||||||||||||||||
| ASSETS: | |||||||||||||||||||||||
| Investments at value (A) (Note 1-A and 5): | |||||||||||||||||||||||
| Unaffiliated issuers | $ | 703,327,110 | $ | 87,639,849 | $ | 135,570,376 | $ | 106,193,302 | $ | 128,532,417 | |||||||||||||
| Affiliated issuers | — | — | — | — | — | ||||||||||||||||||
| Total investments | 703,327,110 | 87,639,849 | 135,570,376 | 106,193,302 | 128,532,417 | ||||||||||||||||||
| Cash | 15,543,532 | 8,471 | 1,345,993 | 4,994,365 | 1,658,821 | ||||||||||||||||||
| Segregated foreign currency at value (B) | — | — | — | — | — | ||||||||||||||||||
| Foreign currency at value (B) | 396,670 | 1 | — | 401,005 | — | ||||||||||||||||||
| Dividends and interest receivable | 1,088,275 | 314,258 | 930,220 | 113,050 | 164,775 | ||||||||||||||||||
| Receivable for securities sold | 718,324 | 628,100 | 744,623 | — | — | ||||||||||||||||||
| Receivable for capital shares sold | 2,298,747 | 527,830 | 707,679 | 678,585 | 344,284 | ||||||||||||||||||
| Due from Advisor (Note 3) | — | — | — | — | — | ||||||||||||||||||
| Deferred offering costs (Note 1-E) | — | — | — | — | — | ||||||||||||||||||
| Prepaid expenses and other assets | 18,117 | 5,434 | 7,807 | 13,730 | 12,232 | ||||||||||||||||||
| TOTAL ASSETS | 723,390,775 | 89,123,943 | 139,306,698 | 112,394,037 | 130,712,529 | ||||||||||||||||||
| LIABILITIES: | |||||||||||||||||||||||
| Payable for securities purchased | 420,311 | 516,632 | 427,263 | 1,781,105 | — | ||||||||||||||||||
| Payable for capital shares redeemed | 1,230,883 | 156,304 | 337,471 | 63,195 | 172,047 | ||||||||||||||||||
| Deferred tax liability (Note 1-D) | — | — | — | 639,789 | — | ||||||||||||||||||
| Due to Advisor (Note 3) | 402,452 | 50,459 | 77,059 | 107,209 | 71,344 | ||||||||||||||||||
| Administration and accounting fees payable | 19,729 | 2,549 | 3,820 | 2,574 | 3,475 | ||||||||||||||||||
| Administration and shareholder servicing fees payable | 121,459 | 16,854 | 26,895 | 14,391 | 25,570 | ||||||||||||||||||
| Professional fees payable | 77,036 | 22,997 | 22,983 | 22,970 | 30,610 | ||||||||||||||||||
| Trustees fees payable | 186 | 106 | 59 | — | 50 | ||||||||||||||||||
| Offering costs | — | — | — | — | — | ||||||||||||||||||
| Accrued expenses payable | 193,356 | 24,306 | 40,580 | 37,243 | 42,322 | ||||||||||||||||||
| TOTAL LIABILITIES | 2,465,412 | 790,207 | 936,130 | 2,668,476 | 345,418 | ||||||||||||||||||
| NET ASSETS | $ | 720,925,363 | $ | 88,333,736 | $ | 138,370,568 | $ | 109,725,561 | $ | 130,367,111 | |||||||||||||
| SHARES OUTSTANDING: | |||||||||||||||||||||||
| (shares of beneficial interest issued and outstanding, respectively, unlimited number of shares authorized with a $0.001 par value) | 44,265,822 | 8,095,849 | 32,087,009 | 6,947,475 | 16,256,918 | ||||||||||||||||||
| Net asset value, offering price and redemption price | $ | 16.29 | $ | 10.91 | $ | 4.31 | $ | 15.79 | $ | 8.02 | |||||||||||||
| NET ASSETS CONSIST OF: | |||||||||||||||||||||||
| Capital paid-in | $ | 661,565,338 | $ | 156,658,985 | $ | 103,789,425 | $ | 89,700,619 | $ | 139,201,636 | |||||||||||||
| Undistributed (distributions in excess of) net investment income (loss) | (1,124,056 | ) | 1,174,149 | (6,223 | ) | (365,943 | ) | (8,293 | ) | ||||||||||||||
| Undistributed/(accumulated) net realized gain (loss) on investments, and foreign currency related transactions | (88,547,215 | ) | (80,608,533 | ) | 128,849 | 122,941 | (37,965,208 | ) | |||||||||||||||
| Net unrealized appreciation on investments, foreign currency transactions and deferred taxes | 149,031,296 | 11,109,135 | 34,458,517 | 20,267,944 | 29,138,976 | ||||||||||||||||||
| NET ASSETS | $ | 720,925,363 | $ | 88,333,736 | $ | 138,370,568 | $ | 109,725,561 | $ | 130,367,111 | |||||||||||||
| (A) Investments at cost: | |||||||||||||||||||||||
| Unaffiliated issuers | $ | 554,298,068 | $ | 76,518,826 | $ | 101,113,754 | $ | 85,284,174 | $ | 99,393,029 | |||||||||||||
| Affiliated issuers | — | — | — | — | — | ||||||||||||||||||
| Total investments at cost | $ | 554,298,068 | $ | 76,518,826 | $ | 101,113,754 | $ | 85,284,174 | $ | 99,393,029 | |||||||||||||
| (B) Foreign currency at cost | $ | 396,050 | $ | 1 | $ | — | $ | 400,188 | $ | — | |||||||||||||
matthewsasia.com | 800.789.ASIA 63
Statements of Operations Year Ended December 31, 2009
| Matthews Asian Growth and Income Fund | Matthews Asia Dividend Fund | Matthews China Dividend Fund* | Matthews Asia Pacific Fund | Matthews Pacific Tiger Fund | Matthews China Fund | ||||||||||||||||||||||
| INVESTMENT INCOME: | |||||||||||||||||||||||||||
| Dividends—Unaffiliated Issuers | $ | 53,695,712 | $ | 8,472,047 | $ | 2,479 | $ | 3,378,493 | $ | 37,910,595 | $ | 25,527,836 | |||||||||||||||
| Dividends—Affiliated Issuers (Note 5) | 2,406,240 | — | — | — | — | 855,083 | |||||||||||||||||||||
| Interest | 26,629,542 | 286,786 | — | — | — | — | |||||||||||||||||||||
| Foreign withholding tax | (3,818,972 | ) | (773,547 | ) | — | (259,640 | ) | (3,743,217 | ) | (686,842 | ) | ||||||||||||||||
| TOTAL INVESTMENT INCOME | 78,912,522 | 7,985,286 | 2,479 | 3,118,853 | 34,167,378 | 25,696,077 | |||||||||||||||||||||
| EXPENSES: | |||||||||||||||||||||||||||
| Investment advisory fees (Note 3) | 11,768,584 | 1,243,079 | 2,392 | 1,221,346 | 15,346,132 | 10,678,650 | |||||||||||||||||||||
| Administration and accounting fees (Note 3) | 308,692 | 32,562 | 62 | 32,059 | 402,575 | 280,167 | |||||||||||||||||||||
| Administration and shareholder servicing fees (Note 3) | 4,313,957 | 451,032 | 1,141 | 449,671 | 5,142,778 | 3,980,615 | |||||||||||||||||||||
| Custodian fees | 440,026 | 78,477 | 10,020 | 63,584 | 860,003 | 456,183 | |||||||||||||||||||||
| Insurance fees | 37,743 | 4,266 | — | 6,075 | 42,193 | 27,072 | |||||||||||||||||||||
| Printing fees | 258,931 | 45,000 | 400 | 25,600 | 261,678 | 367,232 | |||||||||||||||||||||
| Professional fees | 92,912 | 44,230 | 15,040 | 52,663 | 111,183 | 67,780 | |||||||||||||||||||||
| Registration fees | 166,762 | 46,196 | 45 | 31,139 | 148,554 | 131,488 | |||||||||||||||||||||
| Transfer agent fees | 2,355,090 | 277,750 | 1,500 | 292,930 | 2,457,487 | 2,478,887 | |||||||||||||||||||||
| Trustees fees | 85,576 | 10,000 | — | 10,459 | 104,009 | 71,481 | |||||||||||||||||||||
| Offering costs (Note 1-E) | — | — | 2,765 | — | — | — | |||||||||||||||||||||
| Other expenses | 149,175 | 59,970 | 2,675 | 56,632 | 152,996 | 116,896 | |||||||||||||||||||||
| TOTAL EXPENSES | 19,977,448 | 2,292,562 | 36,040 | 2,242,158 | 25,029,588 | 18,656,451 | |||||||||||||||||||||
| Advisory fees waived or recaptured and expenses waived or reimbursed (Note 3) | — | 30,160 | (30,662 | ) | — | — | — | ||||||||||||||||||||
| NET EXPENSES | 19,977,448 | 2,322,722 | 5,378 | 2,242,158 | 25,029,588 | 18,656,451 | |||||||||||||||||||||
| NET INVESTMENT INCOME (LOSS) | 58,935,074 | 5,662,564 | (2,899 | ) | 876,695 | 9,137,790 | 7,039,626 | ||||||||||||||||||||
| REALIZED AND UNREALIZED GAIN (LOSS) ON INVESTMENTS, FOREIGN CURRENCY RELATED TRANSACTIONS AND DEFERRED TAXES: | |||||||||||||||||||||||||||
| Net realized gain (loss) on investments— Unaffiliated Issuers | (36,585,716 | ) | (12,975,051 | ) | — | (25,576,077 | ) | (22,893,868 | ) | (29,077,187 | ) | ||||||||||||||||
| Net realized loss on investments—Affiliated Issuers | (429,218 | ) | — | — | (13,133,538 | ) | — | — | |||||||||||||||||||
| Net realized capital gain tax | 260,167 | (56,659 | ) | — | 4,469 | 45 | — | ||||||||||||||||||||
| Net realized gain (loss) on foreign currency related transactions | (514,307 | ) | (30,565 | ) | 747 | (87,975 | ) | (1,635,801 | ) | (183,531 | ) | ||||||||||||||||
| Net change in unrealized appreciation/depreciation on investments | 552,997,605 | 72,576,441 | 113,981 | 98,161,377 | 1,192,670,569 | 862,559,470 | |||||||||||||||||||||
| Net change in deferred taxes on unrealized appreciation | (4,289 | ) | — | — | — | (11,832,470 | ) | — | |||||||||||||||||||
| Net change in unrealized appreciation/depreciation on foreign currency-related transactions | 9,611 | (16,755 | ) | 28 | (3,104 | ) | 8,926 | (371 | ) | ||||||||||||||||||
| Net realized and unrealized gain on investments, foreign currency related transactions and deferred taxes | 515,733,853 | 59,497,411 | 114,756 | 59,365,152 | 1,156,317,401 | 833,298,381 | |||||||||||||||||||||
| NET INCREASE IN NET ASSETS FROM OPERATIONS | $ | 574,668,927 | $ | 65,159,975 | $ | 111,857 | $ | 60,241,847 | $ | 1,165,455,191 | $ | 840,338,007 | |||||||||||||||
* The Matthews China Dividend Fund commenced operations on November 30, 2009.
See accompanying notes to financial statements.
64 MATTHEWS ASIA FUNDS
| Matthews India Fund | Matthews Japan Fund | Matthews Korea Fund | Matthews Asia Small Companies Fund | Matthews Asian Technology Fund | |||||||||||||||||||
| INVESTMENT INCOME: | |||||||||||||||||||||||
| Dividends—Unaffiliated Issuers | $ | 6,280,173 | $ | 2,630,643 | $ | 1,197,181 | $ | 801,202 | $ | 1,562,831 | |||||||||||||
| Dividends—Affiliated Issuers (Note 5) | — | — | — | — | — | ||||||||||||||||||
| Interest | 2,616,040 | — | — | 5,269 | 3,515 | ||||||||||||||||||
| Foreign withholding tax | (6,778 | ) | (184,161 | ) | (204,942 | ) | (68,398 | ) | (244,410 | ) | |||||||||||||
| TOTAL INVESTMENT INCOME | 8,889,435 | 2,446,482 | 992,239 | 738,073 | 1,321,936 | ||||||||||||||||||
| EXPENSES: | |||||||||||||||||||||||
| Investment advisory fees (Note 3) | 3,305,116 | 752,042 | 733,098 | 344,183 | 644,901 | ||||||||||||||||||
| Administration and accounting fees (Note 3) | 86,729 | 19,794 | 19,254 | 6,155 | 16,931 | ||||||||||||||||||
| Administration and shareholder servicing fees (Note 3) | 1,200,026 | 274,448 | 262,638 | 81,635 | 240,857 | ||||||||||||||||||
| Custodian fees | 309,941 | 29,879 | 42,494 | 103,405 | 61,197 | ||||||||||||||||||
| Insurance fees | 11,461 | 4,396 | 2,788 | 92 | 2,625 | ||||||||||||||||||
| Printing fees | 128,132 | 32,617 | 21,793 | 8,813 | 29,116 | ||||||||||||||||||
| Professional fees | 55,846 | 44,470 | 42,895 | 25,892 | 52,956 | ||||||||||||||||||
| Registration fees | 76,518 | 22,406 | 21,907 | 26,350 | 25,404 | ||||||||||||||||||
| Transfer agent fees | 790,617 | 161,779 | 180,827 | 54,596 | 176,914 | ||||||||||||||||||
| Trustees fees | 24,258 | 7,275 | 5,739 | 926 | 5,157 | ||||||||||||||||||
| Offering costs (Note 1-E) | — | — | — | 33,276 | — | ||||||||||||||||||
| Other expenses | 67,697 | 57,596 | 42,072 | 36,647 | 41,523 | ||||||||||||||||||
| TOTAL EXPENSES | 6,056,341 | 1,406,702 | 1,375,505 | 721,970 | 1,297,581 | ||||||||||||||||||
| Advisory fees waived or recaptured and expenses waived or reimbursed (Note 3) | — | — | — | (30,274 | ) | — | |||||||||||||||||
| NET EXPENSES | 6,056,341 | 1,406,702 | 1,375,505 | 691,696 | 1,297,581 | ||||||||||||||||||
| NET INVESTMENT INCOME (LOSS) | 2,833,094 | 1,039,780 | (383,266 | ) | 46,377 | 24,355 | |||||||||||||||||
| REALIZED AND UNREALIZED GAIN (LOSS) ON INVESTMENTS, FOREIGN CURRENCY RELATED TRANSACTIONS AND DEFERRED TAXES: | |||||||||||||||||||||||
| Net realized gain (loss) on investments— Unaffiliated Issuers | (42,621,299 | ) | (25,141,893 | ) | 1,293,610 | 1,183,179 | (9,767,108 | ) | |||||||||||||||
| Net realized loss on investments—Affiliated Issuers | — | — | — | — | — | ||||||||||||||||||
| Net realized capital gain tax | 526,637 | — | — | (53,676 | ) | 1,053 | |||||||||||||||||
| Net realized gain (loss) on foreign currency related transactions | (241,880 | ) | 61,558 | (88,677 | ) | (61,799 | ) | (86,161 | ) | ||||||||||||||
| Net change in unrealized appreciation/depreciation on investments | 359,025,438 | 34,382,797 | 51,584,871 | 21,074,338 | 58,603,949 | ||||||||||||||||||
| Net change in deferred taxes on unrealized appreciation | — | — | — | (635,975 | ) | — | |||||||||||||||||
| Net change in unrealized appreciation/depreciation on foreign currency-related transactions | 41,724 | (30,605 | ) | (1,715 | ) | (1,389 | ) | 637 | |||||||||||||||
| Net realized and unrealized gain on investments, foreign currency related transactions and deferred taxes | 316,730,620 | 9,271,857 | 52,788,089 | 21,504,678 | 48,752,370 | ||||||||||||||||||
| NET INCREASE IN NET ASSETS FROM OPERATIONS | $ | 319,563,714 | $ | 10,311,637 | $ | 52,404,823 | $ | 21,551,055 | $ | 48,776,725 | |||||||||||||
matthewsasia.com | 800.789.ASIA 65
Statements of Changes in Net Assets
| MATTHEWS ASIAN GROWTH AND INCOME FUND | Year Ended December 31, 2009 | Year Ended December 31, 2008 | |||||||||
| OPERATIONS: | |||||||||||
| Net investment income | $ | 58,935,074 | $ | 57,121,713 | |||||||
| Net realized gain (loss) on investments and foreign currency related transactions | (37,269,074 | ) | 97,126,605 | ||||||||
| Net change in unrealized appreciation/depreciation on investments and foreign currency related transactions | 553,007,216 | (821,256,501 | ) | ||||||||
| Net change in deferred taxes on unrealized appreciation | (4,289 | ) | — | ||||||||
| Net increase (decrease) in net assets resulting from operations | 574,668,927 | (667,008,183 | ) | ||||||||
| DISTRIBUTIONS TO SHAREHOLDERS FROM: | |||||||||||
| Net investment income | (60,961,205 | ) | (41,328,215 | ) | |||||||
| Realized gains on investments | — | (152,469,801 | ) | ||||||||
| Net decrease in net assets resulting from distributions | (60,961,205 | ) | (193,798,016 | ) | |||||||
| CAPITAL SHARE TRANSACTIONS (net) (Note 2) | 943,643,994 | (323,206,605 | ) | ||||||||
| REDEMPTION FEES | 347,176 | 317,302 | |||||||||
| Total increase (decrease) in net assets | 1,457,698,892 | (1,183,695,502 | ) | ||||||||
| NET ASSETS: | |||||||||||
| Beginning of year | 1,089,712,078 | 2,273,407,580 | |||||||||
| End of year (including distributions in excess of net investment income of ($7,490,172) and ($5,209,901), respectively) | $ | 2,547,410,970 | $ | 1,089,712,078 | |||||||
| MATTHEWS ASIA DIVIDEND FUND | Year Ended December 31, 2009 | Year Ended December 31, 2008 | |||||||||
| OPERATIONS: | |||||||||||
| Net investment income | $ | 5,662,564 | $ | 3,439,463 | |||||||
| Net realized loss on investments and foreign currency related transactions | (13,062,275 | ) | (5,566,940 | ) | |||||||
| Net change in unrealized appreciation/depreciation on investments and foreign currency related transactions | 72,559,686 | (20,959,878 | ) | ||||||||
| Net increase (decrease) in net assets resulting from operations | 65,159,975 | (23,087,355 | ) | ||||||||
| DISTRIBUTIONS TO SHAREHOLDERS FROM: | |||||||||||
| Net investment income | (10,189,013 | ) | (3,011,638 | ) | |||||||
| Realized gains on investments | — | (142,300 | ) | ||||||||
| Net decrease in net assets resulting from distributions | (10,189,013 | ) | (3,153,938 | ) | |||||||
| CAPITAL SHARE TRANSACTIONS (net) (Note 2) | 124,976,685 | 86,427,296 | |||||||||
| REDEMPTION FEES | 104,220 | 141,421 | |||||||||
| Total increase in net assets | 180,051,867 | 60,327,424 | |||||||||
| NET ASSETS: | |||||||||||
| Beginning of year | 141,951,479 | 81,624,055 | |||||||||
| End of year (including undistributed/(distributions in excess of) net investment income of ($4,122,176) and $370,442, respectively) | $ | 322,003,346 | $ | 141,951,479 | |||||||
See accompanying notes to financial statements.
66 MATTHEWS ASIA FUNDS
| MATTHEWS CHINA DIVIDEND FUND | Period Ended December 31, 2009* | ||||||
| OPERATIONS: | |||||||
| Net investment loss | $ | (2,899 | ) | ||||
| Net realized gain on investments and foreign currency related transactions | 747 | ||||||
| Net change in unrealized appreciation/depreciation on investments and foreign currency related transactions | 114,009 | ||||||
| Net increase in net assets resulting from operations | 111,857 | ||||||
| CAPITAL SHARE TRANSACTIONS (net) (Note 2) | 7,022,503 | ||||||
| REDEMPTION FEES | 98 | ||||||
| Total increase in net assets | 7,134,458 | ||||||
| NET ASSETS: | |||||||
| Beginning of period | — | ||||||
| End of period (including undistributed net investment income of $613) | $ | 7,134,458 | |||||
* The Matthews China Dividend Fund commenced operations on November 30, 2009.
| MATTHEWS ASIA PACIFIC FUND | Year Ended December 31, 2009 | Year Ended December 31, 2008 | |||||||||
| OPERATIONS: | |||||||||||
| Net investment income | $ | 876,695 | $ | 3,129,713 | |||||||
| Net realized loss on investments and foreign currency related transactions | (38,793,121 | ) | (44,136,285 | ) | |||||||
| Net change in unrealized appreciation/depreciation on investments and foreign currency related transactions | 98,158,273 | (122,047,621 | ) | ||||||||
| Net increase (decrease) in net assets resulting from operations | 60,241,847 | (163,054,193 | ) | ||||||||
| DISTRIBUTIONS TO SHAREHOLDERS FROM: | |||||||||||
| Net investment income | (3,712,448 | ) | — | ||||||||
| Realized gains on investments | — | (12,659,661 | ) | ||||||||
| Net decrease in net assets resulting from distributions | (3,712,448 | ) | (12,659,661 | ) | |||||||
| CAPITAL SHARE TRANSACTIONS (net) (Note 2) | 3,023,527 | (127,465,358 | ) | ||||||||
| REDEMPTION FEES | 66,709 | 155,627 | |||||||||
| Total increase (decrease) in net assets | 59,619,635 | (303,023,585 | ) | ||||||||
| NET ASSETS: | |||||||||||
| Beginning of year | 168,030,881 | 471,054,466 | |||||||||
| End of year (including undistributed net investment income of $90,967 and $2,965,080, respectively) | $ | 227,650,516 | $ | 168,030,881 | |||||||
See accompanying notes to financial statements.
matthewsasia.com | 800.789.ASIA 67
Statements of Changes in Net Assets
| MATTHEWS PACIFIC TIGER FUND | Year Ended December 31, 2009 | Year Ended December 31, 2008 | |||||||||
| OPERATIONS: | |||||||||||
| Net investment income | $ | 9,137,790 | $ | 28,838,219 | |||||||
| Net realized loss on investments and foreign currency related transactions | (24,529,624 | ) | (1,214,937 | ) | |||||||
| Net change in unrealized appreciation/depreciation on investments and foreign currency related transactions | 1,192,679,495 | (1,663,543,511 | ) | ||||||||
| Net change in deferred taxes on unrealized appreciation | (11,832,470 | ) | (171,388 | ) | |||||||
| Net increase (decrease) in net assets resulting from operations | 1,165,455,191 | (1,636,091,617 | ) | ||||||||
| DISTRIBUTIONS TO SHAREHOLDERS FROM: | |||||||||||
| Net investment income | (26,580,408 | ) | (25,721,709 | ) | |||||||
| Realized gains on investments | — | (297,363,454 | ) | ||||||||
| Net decrease in net assets resulting from distributions | (26,580,408 | ) | (323,085,163 | ) | |||||||
| CAPITAL SHARE TRANSACTIONS (net) (Note 2) | 1,223,811,012 | (645,522,620 | ) | ||||||||
| REDEMPTION FEES | 618,672 | 425,473 | |||||||||
| Total increase (decrease) in net assets | 2,363,304,467 | (2,604,273,927 | ) | ||||||||
| NET ASSETS: | |||||||||||
| Beginning of year | 1,202,440,544 | 3,806,714,471 | |||||||||
| End of year (including distributions in excess of net investment income of ($19,578,638) and ($500,264), respectively) | $ | 3,565,745,011 | $ | 1,202,440,544 | |||||||
| MATTHEWS CHINA FUND | Year Ended December 31, 2009 | Year Ended December 31, 2008 | |||||||||
| OPERATIONS: | |||||||||||
| Net investment income | $ | 7,039,626 | $ | 13,674,237 | |||||||
| Net realized gain (loss) on investments and foreign currency related transactions | (29,260,718 | ) | 166,610,803 | ||||||||
| Net change in unrealized appreciation/depreciation on investments and foreign currency related transactions | 862,559,099 | (1,123,566,150 | ) | ||||||||
| Net increase (decrease) in net assets resulting from operations | 840,338,007 | (943,281,110 | ) | ||||||||
| DISTRIBUTIONS TO SHAREHOLDERS FROM: | |||||||||||
| Net investment income | (6,595,986 | ) | (12,907,246 | ) | |||||||
| Realized gains on investments | — | (222,146,010 | ) | ||||||||
| Net decrease in net assets resulting from distributions | (6,595,986 | ) | (235,053,256 | ) | |||||||
| CAPITAL SHARE TRANSACTIONS (net) (Note 2) | 949,569,226 | (377,939,336 | ) | ||||||||
| REDEMPTION FEES | 1,589,585 | 1,976,040 | |||||||||
| Total increase (decrease) in net assets | 1,784,900,832 | (1,554,297,662 | ) | ||||||||
| NET ASSETS: | |||||||||||
| Beginning of year | 781,104,477 | 2,335,402,139 | |||||||||
| End of year (including undistributed net investment income of $318,992 and $58,882, respectively) | $ | 2,566,005,309 | $ | 781,104,477 | |||||||
See accompanying notes to financial statements.
68 MATTHEWS ASIA FUNDS
| MATTHEWS INDIA FUND | Year Ended December 31, 2009 | Year Ended December 31, 2008 | |||||||||
| OPERATIONS: | |||||||||||
| Net investment income | $ | 2,833,094 | $ | 1,284,842 | |||||||
| Net realized loss on investments and foreign currency related transactions | (42,336,542 | ) | (26,119,442 | ) | |||||||
| Net change in unrealized appreciation/depreciation on investments and foreign currency related transactions | 359,067,162 | (716,872,965 | ) | ||||||||
| Net change in deferred taxes on unrealized appreciation | — | 2,706,668 | |||||||||
| Net increase (decrease) in net assets resulting from operations | 319,563,714 | (739,000,897 | ) | ||||||||
| DISTRIBUTIONS TO SHAREHOLDERS FROM: | |||||||||||
| Net investment income | (4,170,390 | ) | (3,800,136 | ) | |||||||
| Realized gains on investments | (5,361,117 | ) | (25,042,065 | ) | |||||||
| Net decrease in net assets resulting from distributions | (9,531,507 | ) | (28,842,201 | ) | |||||||
| CAPITAL SHARE TRANSACTIONS (net) (Note 2) | 93,020,027 | (227,289,535 | ) | ||||||||
| REDEMPTION FEES | 357,124 | 1,576,948 | |||||||||
| Total increase (decrease) in net assets | 403,409,358 | (993,555,685 | ) | ||||||||
| NET ASSETS: | |||||||||||
| Beginning of year | 317,516,005 | 1,311,071,690 | |||||||||
| End of year (including distributions in excess of net investment income of ($1,124,056) and ($71,501), respectively) | $ | 720,925,363 | $ | 317,516,005 | |||||||
| MATTHEWS JAPAN FUND | Year Ended December 31, 2009 | Year Ended December 31, 2008 | |||||||||
| OPERATIONS: | |||||||||||
| Net investment income | $ | 1,039,780 | $ | 1,446,185 | |||||||
| Net realized loss on investments and foreign currency related transactions | (25,080,335 | ) | (53,681,873 | ) | |||||||
| Net change in unrealized appreciation/depreciation on investments and foreign currency related transactions | 34,352,192 | (5,961,085 | ) | ||||||||
| Net increase (decrease) in net assets resulting from operations | 10,311,637 | (58,196,773 | ) | ||||||||
| DISTRIBUTIONS TO SHAREHOLDERS FROM: | |||||||||||
| Net investment income | (2,466,218 | ) | — | ||||||||
| Realized gains on investments | — | (2,681,675 | ) | ||||||||
| Net decrease in net assets resulting from distributions | (2,466,218 | ) | (2,681,675 | ) | |||||||
| CAPITAL SHARE TRANSACTIONS (net) (Note 2) | (43,296,044 | ) | 17,520,852 | ||||||||
| REDEMPTION FEES | 110,632 | 171,094 | |||||||||
| Total decrease in net assets | (35,339,993 | ) | (43,186,502 | ) | |||||||
| NET ASSETS: | |||||||||||
| Beginning of year | 123,673,729 | 166,860,231 | |||||||||
| End of year (including undistributed net investment income of $1,174,149 and $1,213,496, respectively) | $ | 88,333,736 | $ | 123,673,729 | |||||||
See accompanying notes to financial statements.
matthewsasia.com | 800.789.ASIA 69
Statements of Changes in Net Assets
| MATTHEWS KOREA FUND | Year Ended December 31, 2009 | Year Ended December 31, 2008 | |||||||||
| OPERATIONS: | |||||||||||
| Net investment loss | $ | (383,266 | ) | $ | (524,760 | ) | |||||
| Net realized gain on investments and foreign currency related transactions | 1,204,933 | 8,040,061 | |||||||||
| Net change in unrealized appreciation/depreciation on investments and foreign currency related transactions | 51,583,156 | (122,326,673 | ) | ||||||||
| Net increase (decrease) in net assets resulting from operations | 52,404,823 | (114,811,372 | ) | ||||||||
| DISTRIBUTIONS TO SHAREHOLDERS FROM: | |||||||||||
| Net investment income | — | (1,673,455 | ) | ||||||||
| Realized gains on investments | (5,234,879 | ) | (7,207,688 | ) | |||||||
| Net decrease in net assets resulting from distributions | (5,234,879 | ) | (8,881,143 | ) | |||||||
| CAPITAL SHARE TRANSACTIONS (net) (Note 2) | 3,895,556 | (39,546,578 | ) | ||||||||
| REDEMPTION FEES | 51,933 | 70,799 | |||||||||
| Total increase (decrease) in net assets | 51,117,433 | (163,168,294 | ) | ||||||||
| NET ASSETS: | |||||||||||
| Beginning of year | 87,253,135 | 250,421,429 | |||||||||
| End of year (including distributions in excess of net investment income of ($6,223) and $0, respectively) | $ | 138,370,568 | $ | 87,253,135 | |||||||
| MATTHEWS ASIA SMALL COMPANIES FUND | Year Ended December 31, 2009 | Year Ended December 31, 20081 | |||||||||
| OPERATIONS: | |||||||||||
| Net investment income | $ | 46,377 | $ | 2,686 | |||||||
| Net realized gain (loss) on investments and foreign currency related transactions | 1,067,704 | (56,968 | ) | ||||||||
| Net change in unrealized appreciation/depreciation on investments and foreign currency related transactions | 21,072,949 | (165,216 | ) | ||||||||
| Net change in deferred taxes on unrealized appreciation | (635,975 | ) | (3,814 | ) | |||||||
| Net increase (decrease) in net assets resulting from operations | 21,551,055 | (223,312 | ) | ||||||||
| DISTRIBUTIONS TO SHAREHOLDERS FROM: | |||||||||||
| Net investment income | (303,466 | ) | (5,234 | ) | |||||||
| Realized gains on investments | (947,544 | ) | — | ||||||||
| Net decrease in net assets resulting from distributions | (1,251,010 | ) | (5,234 | ) | |||||||
| CAPITAL SHARE TRANSACTIONS (net) (Note 2) | 86,137,752 | 3,388,549 | |||||||||
| REDEMPTION FEES | 114,406 | 13,355 | |||||||||
| Total increase in net assets | 106,552,203 | 3,173,358 | |||||||||
| NET ASSETS: | |||||||||||
| Beginning of year | 3,173,358 | — | |||||||||
| End of year (including undistributed/(distributions in excess of) net investment income of ($365,943) and $6,470, respectively) | $ | 109,725,561 | $ | 3,173,358 | |||||||
1 The Matthews Asia Small Companies Fund commenced operations on September 15, 2008.
See accompanying notes to financial statements.
70 MATTHEWS ASIA FUNDS
| MATTHEWS ASIAN TECHNOLOGY FUND | Year Ended December 31, 2009 | Year Ended December 31, 2008 | |||||||||
| OPERATIONS: | |||||||||||
| Net investment income | $ | 24,355 | $ | 128,371 | |||||||
| Net realized loss on investments and foreign currency related transactions | (9,852,216 | ) | (24,158,197 | ) | |||||||
| Net change in unrealized appreciation/depreciation on investments and foreign currency related transactions | 58,604,586 | (90,630,615 | ) | ||||||||
| Net increase (decrease) in net assets resulting from operations | 48,776,725 | (114,660,441 | ) | ||||||||
| CAPITAL SHARE TRANSACTIONS (net) (Note 2) | 7,072,491 | (63,347,458 | ) | ||||||||
| REDEMPTION FEES | 41,571 | 180,136 | |||||||||
| Total increase (decrease) in net assets | 55,890,787 | (177,827,763 | ) | ||||||||
| NET ASSETS: | |||||||||||
| Beginning of year | 74,476,324 | 252,304,087 | |||||||||
| End of year (including undistributed net investment loss of ($8,293) and $0, respectively) | $ | 130,367,111 | $ | 74,476,324 | |||||||
See accompanying notes to financial statements.
matthewsasia.com | 800.789.ASIA 71
Financial Highlights
Matthews Asian Growth and Income Fund
The table below sets forth financial data for a share of beneficial interest outstanding throughout each period presented.
| Year Ended December 31, | |||||||||||||||||||||||
| 2009 | 2008 | 2007 | 2006 | 2005 | |||||||||||||||||||
| Net Asset Value, beginning of year | $ | 11.50 | $ | 19.78 | $ | 18.68 | $ | 17.14 | $ | 15.82 | |||||||||||||
| INCOME (LOSS) FROM INVESTMENT OPERATIONS: | |||||||||||||||||||||||
| Net investment income | 0.481 | 0.541 | 1.07 | 0.46 | 0.45 | ||||||||||||||||||
| Net realized gain (loss) and unrealized appreciation/ depreciation on investments and foreign currency | 4.23 | (6.73 | ) | 2.93 | 3.47 | 2.02 | |||||||||||||||||
| Total from investment operations | 4.71 | (6.19 | ) | 4.00 | 3.93 | 2.47 | |||||||||||||||||
| LESS DISTRIBUTIONS FROM: | |||||||||||||||||||||||
| Net investment income | (0.44 | ) | (0.42 | ) | (0.90 | ) | (0.62 | ) | (0.43 | ) | |||||||||||||
| Net realized gains on investments | — | (1.67 | ) | (2.00 | ) | (1.77 | ) | (0.72 | ) | ||||||||||||||
| Total distributions | (0.44 | ) | (2.09 | ) | (2.90 | ) | (2.39 | ) | (1.15 | ) | |||||||||||||
| Paid-in capital from redemption fees (Note 2) | —2 | —2 | —2 | —2 | —2 | ||||||||||||||||||
| Net Asset Value, end of year | $ | 15.77 | $ | 11.50 | $ | 19.78 | $ | 18.68 | $ | 17.14 | |||||||||||||
| TOTAL RETURN | 41.44 | % | (32.07 | %) | 21.54 | % | 23.38 | % | 15.76 | % | |||||||||||||
| RATIOS/SUPPLEMENTAL DATA | |||||||||||||||||||||||
| Net assets, end of year (in 000's) | $ | 2,547,411 | $ | 1,089,712 | $ | 2,273,408 | $ | 2,021,363 | $ | 1,676,559 | |||||||||||||
| Ratio of expenses to average net assets before reimbursement, waiver or recapture of expenses by Advisor and Administrator (Note 3) | 1.18 | % | 1.16 | % | 1.16 | % | 1.20 | % | 1.28 | % | |||||||||||||
| Ratio of expenses to average net assets after reimbursement, waiver or recapture of expenses by Advisor and Administrator | 1.18 | % | 1.16 | % | 1.15 | % | 1.19 | % | 1.27 | % | |||||||||||||
| Ratio of net investment income to average net assets | 3.47 | % | 3.19 | % | 2.59 | % | 2.27 | % | 2.60 | % | |||||||||||||
| Portfolio turnover | 17.51 | % | 25.16 | % | 27.93 | % | 28.37 | % | 20.16 | % | |||||||||||||
1 Calculated using the average daily shares method.
2 Less than $0.01 per share.
See accompanying notes to financial statements.
72 MATTHEWS ASIA FUNDS
Matthews Asia Dividend Fund*
The table below sets forth financial data for a share of beneficial interest outstanding throughout each period presented.
| Year Ended December 31, | Period Ended | ||||||||||||||||||
| 2009 | 2008 | 2007 | Dec. 31, 20061 | ||||||||||||||||
| Net Asset Value, beginning of period | $ | 8.61 | $ | 12.00 | $ | 10.77 | $ | 10.00 | |||||||||||
| INCOME (LOSS) FROM INVESTMENT OPERATIONS: | |||||||||||||||||||
| Net investment income | 0.322 | 0.382 | 0.27 | 0.02 | |||||||||||||||
| Net realized gain (loss) and unrealized appreciation/ depreciation on investments and foreign currency | 3.67 | (3.47 | ) | 1.67 | 0.77 | ||||||||||||||
| Total from investment operations | 3.99 | (3.09 | ) | 1.94 | 0.79 | ||||||||||||||
| LESS DISTRIBUTIONS FROM: | |||||||||||||||||||
| Net investment income | (0.55 | ) | (0.30 | ) | (0.27 | ) | (0.02 | ) | |||||||||||
| Net realized gains on investments | — | (0.02 | ) | (0.45 | ) | — | |||||||||||||
| Total distributions | (0.55 | ) | (0.32 | ) | (0.72 | ) | (0.02 | ) | |||||||||||
| Paid-in capital from redemption fees (Note 2) | 0.01 | 0.02 | 0.01 | —3 | |||||||||||||||
| Net Asset Value, end of period | $ | 12.06 | $ | 8.61 | $ | 12.00 | $ | 10.77 | |||||||||||
| TOTAL RETURN | 47.59 | % | (25.97 | %) | 18.05 | % | 7.90 | %4 | |||||||||||
| RATIOS/SUPPLEMENTAL DATA | |||||||||||||||||||
| Net assets, end of period (in 000's) | $ | 322,003 | $ | 141,951 | $ | 81,624 | $ | 25,740 | |||||||||||
| Ratio of expenses to average net assets before reimbursement, waiver or recapture of expenses by Advisor and Administrator (Note 3) | 1.28 | % | 1.35 | % | 1.42 | % | 2.93 | %5 | |||||||||||
| Ratio of expenses to average net assets after reimbursement, waiver or recapture of expenses by Advisor and Administrator | 1.30 | % | 1.32 | % | 1.39 | % | 1.50 | %5 | |||||||||||
| Ratio of net investment income to average net assets | 3.16 | % | 3.74 | % | 2.66 | % | 1.34 | %5 | |||||||||||
| Portfolio turnover | 32.41 | % | 25.07 | % | 26.95 | % | 0.00 | %4 | |||||||||||
* The Fund's name changed from Matthews Asia Pacific Equity Income Fund to Matthews Asia Dividend Fund on November 30, 2009.
1 The Matthews Asia Dividend Fund commenced operations on October 31, 2006.
2 Calculated using the average daily shares method.
3 Less than $0.01 per share.
4 Not annualized.
5 Annualized.
See accompanying notes to financial statements.
matthewsasia.com | 800.789.ASIA 73
Financial Highlights
Matthews China Dividend Fund
The table below sets forth financial data for a share of beneficial interest outstanding throughout the period presented.
| Period Ended Dec. 31, 20091 | |||||||
| Net Asset Value, beginning of period | $ | 10.00 | |||||
| INCOME (LOSS) FROM INVESTMENT OPERATIONS: | |||||||
| Net investment loss2 | (0.01 | ) | |||||
| Net realized gain and unrealized appreciation/depreciation on investments and foreign currency | 0.19 | ||||||
| Total from investment operations | 0.18 | ||||||
| Paid-in capital from redemption fees (Note 2) | —3 | ||||||
| Net Asset Value, end of period | $ | 10.18 | |||||
| TOTAL RETURN | 1.80 | %4 | |||||
| RATIOS/SUPPLEMENTAL DATA | |||||||
| Net assets, end of period (in 000's) | $ | 7,134 | |||||
| Ratio of expenses to average net assets before reimbursement, or waiver of expenses by Advisor (Note 3) | 10.05 | %5 | |||||
| Ratio of expenses to average net assets after reimbursement, or waiver of expenses by Advisor | 1.50 | %5 | |||||
| Ratio of net investment loss to average net assets | (0.81 | %)5 | |||||
| Portfolio turnover | 0 | %4 | |||||
1 The Matthews China Dividend Fund commenced operations on November 30, 2009.
2 Calculated using the average daily shares method.
3 Less than $0.01 per share.
4 Not annualized.
5 Annualized.
See accompanying notes to financial statements.
74 MATTHEWS ASIA FUNDS
Matthews Asia Pacific Fund
The table below sets forth financial data for a share of beneficial interest outstanding throughout each period presented.
| Year Ended December 31, | |||||||||||||||||||||||
| 2009 | 2008 | 2007 | 2006 | 2005 | |||||||||||||||||||
| Net Asset Value, beginning of year | $ | 10.03 | $ | 17.29 | $ | 16.92 | $ | 14.89 | $ | 12.58 | |||||||||||||
| INCOME (LOSS) FROM INVESTMENT OPERATIONS: | |||||||||||||||||||||||
| Net investment income | 0.061 | 0.131 | 0.09 | 0.07 | 0.07 | ||||||||||||||||||
| Net realized gain (loss) and unrealized appreciation/ depreciation on investments and foreign currency | 4.44 | (6.64 | ) | 2.02 | 2.50 | 2.30 | |||||||||||||||||
| Total from investment operations | 4.50 | (6.51 | ) | 2.11 | 2.57 | 2.37 | |||||||||||||||||
| LESS DISTRIBUTIONS FROM: | |||||||||||||||||||||||
| Net investment income | (0.24 | ) | — | (0.09 | ) | (0.07 | ) | (0.06 | ) | ||||||||||||||
| Net realized gains on investments | — | (0.76 | ) | (1.66 | ) | (0.48 | ) | — | |||||||||||||||
| Total distributions | (0.24 | ) | (0.76 | ) | (1.75 | ) | (0.55 | ) | (0.06 | ) | |||||||||||||
| Paid-in capital from redemption fees (Note 2) | —2 | 0.01 | 0.01 | 0.01 | —2 | ||||||||||||||||||
| Net Asset Value, end of year | $ | 14.29 | $ | 10.03 | $ | 17.29 | $ | 16.92 | $ | 14.89 | |||||||||||||
| TOTAL RETURN | 44.82 | % | (37.44 | %) | 11.92 | % | 17.39 | % | 18.84 | % | |||||||||||||
| RATIOS/SUPPLEMENTAL DATA | |||||||||||||||||||||||
| Net assets, end of year (in 000's) | $ | 227,651 | $ | 168,031 | $ | 471,054 | $ | 449,699 | $ | 285,169 | |||||||||||||
| Ratio of expenses to average net assets before reimbursement, waiver or recapture of expenses by Advisor and Administrator (Note 3) | 1.28 | % | 1.23 | % | 1.20 | % | 1.26 | % | 1.35 | % | |||||||||||||
| Ratio of expenses to average net assets after reimbursement, waiver or recapture of expenses by Advisor and Administrator | 1.28 | % | 1.23 | % | 1.20 | % | 1.24 | % | 1.34 | % | |||||||||||||
| Ratio of net investment income to average net assets | 0.50 | % | 0.93 | % | 0.60 | % | 0.47 | % | 0.67 | % | |||||||||||||
| Portfolio turnover | 58.10 | % | 37.10 | % | 40.49 | % | 40.45 | % | 15.84 | % | |||||||||||||
1 Calculated using the average daily shares method.
2 Less than $0.01 per share.
See accompanying notes to financial statements.
matthewsasia.com | 800.789.ASIA 75
Financial Highlights
Matthews Pacific Tiger Fund
The table below sets forth financial data for a share of beneficial interest outstanding throughout each period presented.
| Year Ended December 31, | |||||||||||||||||||||||
| 2009 | 2008 | 2007 | 2006 | 2005 | |||||||||||||||||||
| Net Asset Value, beginning of year | $ | 11.05 | $ | 27.86 | $ | 23.71 | $ | 19.27 | $ | 15.90 | |||||||||||||
| INCOME (LOSS) FROM INVESTMENT OPERATIONS: | |||||||||||||||||||||||
| Net investment income | 0.061 | 0.241 | 0.30 | 0.22 | 0.14 | ||||||||||||||||||
| Net realized gain (loss) and unrealized appreciation/ depreciation on investments and foreign currency | 8.27 | (13.31 | ) | 7.78 | 5.01 | 3.43 | |||||||||||||||||
| Total from investment operations | 8.33 | (13.07 | ) | 8.08 | 5.23 | 3.57 | |||||||||||||||||
| LESS DISTRIBUTIONS FROM: | |||||||||||||||||||||||
| Net investment income | (0.15 | ) | (0.30 | ) | (0.31 | ) | (0.21 | ) | (0.12 | ) | |||||||||||||
| Net realized gains on investments | — | (3.44 | ) | (3.62 | ) | (0.58 | ) | (0.09 | ) | ||||||||||||||
| Total distributions | (0.15 | ) | (3.74 | ) | (3.93 | ) | (0.79 | ) | (0.21 | ) | |||||||||||||
| Paid-in capital from redemption fees (Note 2) | — | —2 | —2 | —2 | 0.01 | ||||||||||||||||||
| Net Asset Value, end of year | $ | 19.23 | $ | 11.05 | $ | 27.86 | $ | 23.71 | $ | 19.27 | |||||||||||||
| TOTAL RETURN | 75.37 | % | (46.12 | %) | 33.66 | % | 27.22 | % | 22.51 | % | |||||||||||||
| RATIOS/SUPPLEMENTAL DATA | |||||||||||||||||||||||
| Net assets, end of year (in 000's) | $ | 3,565,745 | $ | 1,202,441 | $ | 3,806,714 | $ | 3,303,717 | $ | 2,031,995 | |||||||||||||
| Ratio of expenses to average net assets before reimbursement, waiver or recapture of expenses by Advisor and Administrator (Note 3) | 1.13 | % | 1.12 | % | 1.11 | % | 1.18 | % | 1.31 | % | |||||||||||||
| Ratio of expenses to average net assets after reimbursement, waiver or recapture of expenses by Advisor and Administrator | 1.13 | % | 1.12 | % | 1.10 | % | 1.16 | % | 1.31 | % | |||||||||||||
| Ratio of net investment income to average net assets | 0.41 | % | 1.10 | % | 1.12 | % | 1.12 | % | 1.10 | % | |||||||||||||
| Portfolio turnover | 13.22 | % | 16.76 | % | 24.09 | % | 18.80 | % | 3.03 | % | |||||||||||||
1 Calculated using the average daily shares method.
2 Less than $0.01 per share.
See accompanying notes to financial statements.
76 MATTHEWS ASIA FUNDS
Matthews China Fund
The table below sets forth financial data for a share of beneficial interest outstanding throughout each period presented.
| Year Ended December 31, | |||||||||||||||||||||||
| 2009 | 2008 | 2007 | 2006 | 2005 | |||||||||||||||||||
| Net Asset Value, beginning of year | $ | 14.34 | $ | 39.73 | $ | 24.16 | $ | 14.76 | $ | 14.01 | |||||||||||||
| INCOME (LOSS) FROM INVESTMENT OPERATIONS: | |||||||||||||||||||||||
| Net investment income | 0.091 | 0.301 | 0.12 | 0.15 | 0.22 | ||||||||||||||||||
| Net realized gain (loss) and unrealized appreciation/ depreciation on investments and foreign currency | 11.12 | (19.78 | ) | 16.85 | 9.39 | 0.74 | |||||||||||||||||
| Total from investment operations | 11.21 | (19.48 | ) | 16.97 | 9.54 | 0.96 | |||||||||||||||||
| LESS DISTRIBUTIONS FROM: | |||||||||||||||||||||||
| Net investment income | (0.07 | ) | (0.33 | ) | (0.11 | ) | (0.15 | ) | (0.22 | ) | |||||||||||||
| Net realized gains on investments | — | (5.62 | ) | (1.37 | ) | — | — | ||||||||||||||||
| Return of capital | — | — | — | —2 | — | ||||||||||||||||||
| Total distributions | (0.07 | ) | (5.95 | ) | (1.48 | ) | (0.15 | ) | (0.22 | ) | |||||||||||||
| Paid-in capital from redemption fees (Note 2) | 0.02 | 0.04 | 0.08 | 0.01 | 0.01 | ||||||||||||||||||
| Net Asset Value, end of year | $ | 25.50 | $ | 14.34 | $ | 39.73 | $ | 24.16 | $ | 14.76 | |||||||||||||
| TOTAL RETURN | 78.30 | % | (48.95 | %) | 70.14 | % | 64.81 | % | 6.91 | % | |||||||||||||
| RATIOS/SUPPLEMENTAL DATA | |||||||||||||||||||||||
| Net assets, end of year (in 000's) | $ | 2,566,005 | $ | 781,104 | $ | 2,335,402 | $ | 966,528 | $ | 388,950 | |||||||||||||
| Ratio of expenses to average net assets before reimbursement, waiver or recapture of expenses by Advisor and Administrator (Note 3) | 1.21 | % | 1.23 | % | 1.18 | % | 1.27 | % | 1.31 | % | |||||||||||||
| Ratio of expenses to average net assets after reimbursement, waiver or recapture of expenses by Advisor and Administrator | 1.21 | % | 1.23 | % | 1.17 | % | 1.26 | % | 1.30 | % | |||||||||||||
| Ratio of net investment income to average net assets | 0.46 | % | 1.03 | % | 0.49 | % | 0.96 | % | 1.46 | % | |||||||||||||
| Portfolio turnover | 5.28 | % | 7.91 | % | 22.13 | % | 11.65 | % | 11.82 | % | |||||||||||||
1 Calculated using the average daily shares method.
2 Less than $0.01 per share.
See accompanying notes to financial statements.
matthewsasia.com | 800.789.ASIA 77
Financial Highlights
Matthews India Fund
The table below sets forth financial data for a share of beneficial interest outstanding throughout each period presented.
| Year Ended December 31, | |||||||||||||||||||||||
| 2009 | 2008 | 2007 | 2006 | Period Ended Dec. 31 20051 | |||||||||||||||||||
| Net Asset Value, beginning of period | $ | 8.37 | $ | 24.44 | $ | 15.45 | $ | 11.32 | $ | 10.00 | |||||||||||||
| INCOME (LOSS) FROM INVESTMENT OPERATIONS: | |||||||||||||||||||||||
| Net investment income (loss) | 0.072 | 0.032 | (0.01 | ) | (0.01 | ) | (0.01 | ) | |||||||||||||||
| Net realized gain (loss) and unrealized appreciation/ depreciation on investments and foreign currency | 8.06 | (15.33 | ) | 9.87 | 4.11 | 1.33 | |||||||||||||||||
| Total from investment operations | 8.13 | (15.30 | ) | 9.86 | 4.10 | 1.32 | |||||||||||||||||
| LESS DISTRIBUTIONS FROM: | |||||||||||||||||||||||
| Net investment income | (0.10 | ) | (0.11 | ) | (0.21 | ) | — | — | |||||||||||||||
| Net realized gains on investments | (0.12 | ) | (0.69 | ) | (0.68 | ) | — | — | |||||||||||||||
| Total distributions | (0.22 | ) | (0.80 | ) | (0.89 | ) | — | — | |||||||||||||||
| Paid-in capital from redemption fees (Note 2) | 0.01 | 0.03 | 0.02 | 0.03 | —3 | ||||||||||||||||||
| Net Asset Value, end of period | $ | 16.29 | $ | 8.37 | $ | 24.44 | $ | 15.45 | $ | 11.32 | |||||||||||||
| TOTAL RETURN | 97.25 | % | (62.32 | %) | 64.13 | % | 36.48 | % | 13.20 | %4 | |||||||||||||
| RATIOS/SUPPLEMENTAL DATA | |||||||||||||||||||||||
| Net assets, end of period (in 000's) | $ | 720,925 | $ | 317,516 | $ | 1,311,072 | $ | 669,643 | $ | 80,897 | |||||||||||||
| Ratio of expenses to average net assets before reimbursement, waiver or recapture of expenses by Advisor and Administrator (Note 3) | 1.27 | % | 1.29 | % | 1.29 | % | 1.41 | % | 2.75 | %5 | |||||||||||||
| Ratio of expenses to average net assets after reimbursement, waiver or recapture of expenses by Advisor and Administrator | 1.27 | % | 1.29 | % | 1.28 | % | 1.41 | % | 2.00 | %5 | |||||||||||||
| Ratio of net investment income (loss) to average net assets | 0.59 | % | 0.16 | % | (0.04 | %) | (0.08 | %) | (1.17 | %)5 | |||||||||||||
| Portfolio turnover | 18.09 | % | 26.68 | % | 25.59 | % | 21.57 | % | 0.00 | %4 | |||||||||||||
1 The Matthews India Fund commenced operations on October 31, 2005.
2 Calculated using the average daily shares method.
3 Less than $0.01 per share.
4 Not annualized.
5 Annualized.
See accompanying notes to financial statements.
78 MATTHEWS ASIA FUNDS
Matthews Japan Fund
The table below sets forth financial data for a share of beneficial interest outstanding throughout each period presented.
| Year Ended December 31, | |||||||||||||||||||||||
| 2009 | 2008 | 2007 | 2006 | 2005 | |||||||||||||||||||
| Net Asset Value, beginning of year | $ | 10.19 | $ | 14.55 | $ | 17.29 | $ | 18.48 | $ | 16.12 | |||||||||||||
| INCOME (LOSS) FROM INVESTMENT OPERATIONS: | |||||||||||||||||||||||
| Net investment income (loss) | 0.101 | 0.111 | 0.03 | (0.08 | ) | 0.02 | |||||||||||||||||
| Net realized gain (loss) and unrealized appreciation/ depreciation on investments and foreign currency | 0.92 | (4.26 | ) | (1.86 | ) | (1.12 | ) | 2.36 | |||||||||||||||
| Total from investment operations | 1.02 | (4.15 | ) | (1.83 | ) | (1.20 | ) | 2.38 | |||||||||||||||
| LESS DISTRIBUTIONS FROM: | |||||||||||||||||||||||
| Net investment income | (0.31 | ) | — | (0.01 | ) | — | (0.03 | ) | |||||||||||||||
| Net realized gains on investments | — | (0.22 | ) | (0.91 | ) | — | — | ||||||||||||||||
| Total distributions | (0.31 | ) | (0.22 | ) | (0.92 | ) | — | (0.03 | ) | ||||||||||||||
| Paid-in capital from redemption fees (Note 2) | 0.01 | 0.01 | 0.01 | 0.01 | 0.01 | ||||||||||||||||||
| Net Asset Value, end of year | $ | 10.91 | $ | 10.19 | $ | 14.55 | $ | 17.29 | $ | 18.48 | |||||||||||||
| TOTAL RETURN | 10.06 | % | (28.38 | %) | (10.96 | %) | (6.44 | %) | 14.83 | % | |||||||||||||
| RATIOS/SUPPLEMENTAL DATA | |||||||||||||||||||||||
| Net assets, end of year (in 000's) | $ | 88,334 | $ | 123,674 | $ | 166,860 | $ | 276,656 | $ | 367,618 | |||||||||||||
| Ratio of expenses to average net assets before reimbursement, waiver or recapture of expenses by Advisor and Administrator (Note 3) | 1.31 | % | 1.23 | % | 1.24 | % | 1.25 | % | 1.29 | % | |||||||||||||
| Ratio of expenses to average net assets after reimbursement, waiver or recapture of expenses by Advisor and Administrator | 1.31 | % | 1.23 | % | 1.23 | % | 1.24 | % | 1.28 | % | |||||||||||||
| Ratio of net investment income (loss) to average net assets | 0.97 | % | 0.84 | % | (0.01 | %) | (0.29 | %) | (0.10 | %) | |||||||||||||
| Portfolio turnover | 126.75 | % | 88.97 | % | 45.51 | % | 59.95 | % | 20.88 | % | |||||||||||||
1 Calculated using the average daily shares method.
See accompanying notes to financial statements.
matthewsasia.com | 800.789.ASIA 79
Financial Highlights
Matthews Korea Fund
The table below sets forth financial data for a share of beneficial interest outstanding throughout each period presented.
| Year Ended December 31, | |||||||||||||||||||||||
| 2009 | 2008 | 2007 | 2006 | 2005 | |||||||||||||||||||
| Net Asset Value, beginning of year | $ | 2.75 | $ | 6.56 | $ | 6.23 | $ | 6.37 | $ | 4.08 | |||||||||||||
| INCOME (LOSS) FROM INVESTMENT OPERATIONS: | |||||||||||||||||||||||
| Net investment income (loss) | �� | (0.01 | )1 | (0.02 | )1 | 0.07 | 0.01 | 0.01 | |||||||||||||||
| Net realized gain (loss) and unrealized appreciation/ depreciation on investments and foreign currency | 1.74 | (3.48 | ) | 1.15 | 0.80 | 2.39 | |||||||||||||||||
| Total from investment operations | 1.73 | (3.50 | ) | 1.22 | 0.81 | 2.40 | |||||||||||||||||
| LESS DISTRIBUTIONS FROM: | |||||||||||||||||||||||
| Net investment income | — | (0.06 | ) | (0.02 | ) | (0.01 | ) | — | |||||||||||||||
| Net realized gains on investments | (0.17 | ) | (0.25 | ) | (0.87 | ) | (0.95 | ) | (0.11 | ) | |||||||||||||
| Total distributions | (0.17 | ) | (0.31 | ) | (0.89 | ) | (0.96 | ) | (0.11 | ) | |||||||||||||
| Paid-in capital from redemption fees (Note 2) | —2 | —2 | —2 | 0.01 | —2 | ||||||||||||||||||
| Net Asset Value, end of year | $ | 4.31 | $ | 2.75 | $ | 6.56 | $ | 6.23 | $ | 6.37 | |||||||||||||
| TOTAL RETURN | 62.92 | % | (52.66 | %) | 18.90 | % | 12.99 | % | 58.76 | % | |||||||||||||
| RATIOS/SUPPLEMENTAL DATA | |||||||||||||||||||||||
| Net assets, end of year (in 000's) | $ | 138,371 | $ | 87,253 | $ | 250,421 | $ | 241,003 | $ | 269,925 | |||||||||||||
| Ratio of expenses to average net assets before reimbursement, waiver or recapture of expenses by Advisor and Administrator (Note 3) | 1.30 | % | 1.27 | % | 1.21 | % | 1.30 | % | 1.35 | % | |||||||||||||
| Ratio of expenses to average net assets after reimbursement, waiver or recapture of expenses by Advisor and Administrator | 1.30 | % | 1.27 | % | 1.21 | % | 1.28 | % | 1.35 | % | |||||||||||||
| Ratio of net investment income (loss) to average net assets | (0.36 | %) | (0.34 | %) | 1.17 | % | (0.09 | %) | 0.27 | % | |||||||||||||
| Portfolio turnover | 52.47 | % | 28.70 | % | 24.20 | % | 25.82 | % | 10.13 | % | |||||||||||||
1 Calculated using the average daily shares method.
2 Less than $0.01 per share.
See accompanying notes to financial statements.
80 MATTHEWS ASIA FUNDS
Matthews Asia Small Companies Fund
The table below sets forth financial data for a share of beneficial interest outstanding throughout each period presented.
| Year Ended Dec. 31, 2009 | Period Ended Dec. 31, 20081 | ||||||||||
| Net Asset Value, beginning of period | $ | 7.89 | $ | 10.00 | |||||||
| INCOME (LOSS) FROM INVESTMENT OPERATIONS: | |||||||||||
| Net investment income | 0.022 | 0.012 | |||||||||
| Net realized gain (loss) and unrealized appreciation/depreciation on investments and foreign currency | 8.04 | (2.16 | ) | ||||||||
| Total from investment operations | 8.06 | (2.15 | ) | ||||||||
| LESS DISTRIBUTIONS FROM: | |||||||||||
| Net investment income | (0.05 | ) | (0.02 | ) | |||||||
| Net realized gains on investments | (0.15 | ) | — | ||||||||
| Total distributions | (0.20 | ) | (0.02 | ) | |||||||
| Paid-in capital from redemption fees (Note 2) | 0.04 | 0.06 | |||||||||
| Net Asset Value, end of period | $ | 15.79 | $ | 7.89 | |||||||
| TOTAL RETURN | 103.00 | % | (21.03 | %)3 | |||||||
| RATIOS/SUPPLEMENTAL DATA | |||||||||||
| Net assets, end of period (in 000's) | $ | 109,726 | $ | 3,173 | |||||||
| Ratio of expenses to average net assets before reimbursement, or waiver of expenses by Advisor (Note 3) | 2.09 | % | 14.31 | %4 | |||||||
| Ratio of expenses to average net assets after reimbursement, or waiver of expenses by Advisor | 2.00 | % | 2.00 | %4 | |||||||
| Ratio of net investment income to average net assets | 0.13 | % | 0.15 | %4 | |||||||
| Portfolio turnover | 21.39 | % | 3.10 | %3 | |||||||
1 The Matthews Asia Small Companies Fund commenced operations on September 15, 2008.
2 Calculated using the average daily shares method.
3 Not annualized.
4 Annualized.
See accompanying notes to financial statements.
matthewsasia.com | 800.789.ASIA 81
Financial Highlights
Matthews Asian Technology Fund
The table below sets forth financial data for a share of beneficial interest outstanding throughout each period presented.
| Year Ended December 31, | |||||||||||||||||||||||
| 2009 | 2008 | 2007 | 2006 | 2005 | |||||||||||||||||||
| Net Asset Value, beginning of year | $ | 4.71 | $ | 9.80 | $ | 7.92 | $ | 6.53 | $ | 5.45 | |||||||||||||
| INCOME (LOSS) FROM INVESTMENT OPERATIONS: | |||||||||||||||||||||||
| Net investment income (loss) | —1,2 | 0.011 | —2 | (0.02 | ) | —2 | |||||||||||||||||
| Net realized gain (loss) and unrealized appreciation/ depreciation on investments and foreign currency | 3.31 | (5.11 | ) | 1.87 | 1.40 | 1.08 | |||||||||||||||||
| Total from investment operations | 3.31 | (5.10 | ) | 1.87 | 1.38 | 1.08 | |||||||||||||||||
| Paid-in capital from redemption fees (Note 2) | —2 | 0.01 | 0.01 | 0.01 | —2 | ||||||||||||||||||
| Net Asset Value, end of year | $ | 8.02 | $ | 4.71 | $ | 9.80 | $ | 7.92 | $ | 6.53 | |||||||||||||
| TOTAL RETURN | 70.28 | % | (51.94 | %) | 23.74 | % | 21.29 | % | 19.82 | % | |||||||||||||
| RATIOS/SUPPLEMENTAL DATA | |||||||||||||||||||||||
| Net assets, end of year (in 000's) | $ | 130,367 | $ | 74,476 | $ | 252,304 | $ | 129,819 | $ | 50,426 | |||||||||||||
| Ratio of expenses to average net assets before reimbursement, waiver or recapture of expenses by Advisor and Administrator (Note 3) | 1.40 | % | 1.33 | % | 1.26 | % | 1.41 | % | 1.49 | % | |||||||||||||
| Ratio of expenses to average net assets after reimbursement, waiver or recapture of expenses by Advisor and Administrator | 1.40 | % | 1.33 | % | 1.25 | % | 1.39 | % | 1.48 | % | |||||||||||||
| Ratio of net investment income (loss) to average net assets | 0.30 | % | 0.08 | % | (0.30 | %) | (0.29 | %) | 0.08 | % | |||||||||||||
| Portfolio turnover | 83.27 | % | 44.84 | % | 33.21 | % | 34.77 | % | 29.76 | % | |||||||||||||
1 Calculated using the average daily shares method.
2 Less than $0.01 per share.
See accompanying notes to financial statements.
82 MATTHEWS ASIA FUNDS
Notes to Financial Statements
1. SIGNIFICANT ACCOUNTING POLICIES
Matthews Asia Funds, formerly known as Matthews Asian Funds (the "Trust"), is an open-end management investment company registered under the Investment Company Act of 1940, as amended (the "Act"). The Trust currently issues eleven separate series of shares (each a "Fund" and collectively, the "Funds"): Matthews Asian Growth and Income Fund, Matthews Asia Dividend Fund (formerly known as Matthews Asia Pacific Equity Income Fund), Matthews China Dividend Fund, Matthews Asia Pacific Fund, Matthews Pacific Tiger Fund, Matthews China Fund, Matthews India Fund, Matthews Japan Fund, Matthews Korea Fund, Matthews Asia Small Companies Fund and Matthews Asian Technology Fund. Matthews Pacific Tiger Fund, Matthews China Fund and Matthews Korea Fund are authorized to offer two classes of shares: Class I shares and Class A shares. Currently, only Class I shares are offered. The following is a summary of significant accounting policies consis tently followed by the Funds in preparation of their financial statements.
A. SECURITY VALUATION: The Funds' equity securities are valued based on market quotations, or at fair value as determined in good faith by or under the direction of the Board of Trustees (the "Board") when no market quotations are available or when market quotations have become unreliable. Securities that trade in over-the-counter markets, including most debt securities (bonds), may be valued using indicative bid and ask quotations from bond dealers or market makers, or other available market information, or on their fair value as determined by or under the direction of the Board. The Board has delegated the responsibility of making fair value determinations to the Funds' Valuation Committee (the "Valuation Committee") subject to the Funds' Pricing Policies. When fair value pricing is employed, the prices of securities used by a Fund to cal culate its NAV differ from any quoted or published prices for the same securities for that day. All fair value determinations are made subject to the Board's oversight.
The books and records of the Funds are maintained in U.S. dollars. Transactions, portfolio securities, and assets and liabilities denominated in a foreign currency are translated and recorded in U.S. dollars at the prevailing exchange rate as of the close of trading on the New York Stock Exchange ("NYSE"). Translation gains or losses resulting from changes in the exchange rate during the reporting period and realized gains and losses on the settlement of foreign currency transactions are reported in the results of operations for the current period. The Funds do not isolate that portion of gains and losses on investments in equity securities that is due to changes in foreign exchange rate from that which is due to changes in market prices of equity securities.
Market values for equity securities are determined based on quotations from the principal (or most advantageous) market on which the security is traded. Market quotations used by the Funds include last reported sale prices, or, if such prices are not reported or available, bid and asked prices. Securities are valued through valuations obtained from a commercial pricing service or by securities dealers in accordance with procedures established by the Board.
Events affecting the value of foreign investments occur between the time at which they are determined and the close of trading on the NYSE. If the Funds believe that such events render market quotations unreliable, and the impact of such events can be reasonably determined, the investments will be valued at their fair value. The fair value of a security held by the Funds may be determined using the services of third-party pricing services retained by the Funds or by the Valuation Committee, in either case subject to the Board's oversight.
Foreign securities held by the Funds may be traded on days and at times when the NYSE is closed. Accordingly, the NAV of the Funds may be significantly affected on days when shareholders have no access to the Funds.
B. FAIR VALUE MEASUREMENTS: In accordance with the guidance on fair value measurements and disclosures under generally accepted accounting principles ("GAAP"), the Funds disclose the fair value of their investments in a hierarchy that prioritizes the inputs to valuation techniques used to measure the fair value. The hierarchy gives the highest priority to valuations based upon unadjusted quoted prices in active markets for identical assets or liabilities (level 1 measurement) and the lowest priority to valuations based upon unobservable inputs that are significant to the valuation (level 3 measurements). Various inputs are used in determining the fair value of investments, which are as follows:
Level 1: Quoted prices in active markets for identical securities.
Level 2: Other significant observable inputs (including quoted prices for similar securities, interest rates, prepayment speeds, credit risk, etc.).
Level 3: Significant unobservable inputs (including the Fund's own assumptions in determining the fair value of investments).
As of December 31, 2009, Level 3 Securities consist primarily of international bonds that trade in over-the-counter markets. As described in Note 1-A, these securities are valued using indicative bid and ask quotations from bond dealers and market makers, or on their fair value as determined under the direction of the Board. Indicative quotations and other information used by the Funds may not always be directly observable in the marketplace due to the nature of these markets and the manner of execution. These inputs, the methodology used for valuing such securities, and the characterization of such securities as Level 3 Securities are not necessarily an indication of liquidity, or the risk associated with investing in these securities.
matthewsasia.com | 800.789.ASIA 83
Notes to Financial Statements (continued)
The summary of inputs used to determine the fair valuation of the Fund's investments as of December 31, 2009 is as follows:
| Matthews Asian Growth and Income Fund | Matthews Asia Dividend Fund | Matthews Asia Pacific Fund | Matthews Pacific Tiger Fund | ||||||||||||||||
| Level 1: Quoted Prices | |||||||||||||||||||
| Common Equities: | |||||||||||||||||||
| China/Hong Kong | $ | 57,637,172 | $ | 9,936,020 | $ | 14,355,751 | $ | 279,908,328 | |||||||||||
| India | — | — | 1,170,720 | 29,002,640 | |||||||||||||||
| Indonesia | 40,077,840 | 4,110,855 | — | 11,014,215 | |||||||||||||||
| Japan | — | — | 1,063,212 | — | |||||||||||||||
| South Korea | 24,762,891 | 5,630,838 | — | 96,482,234 | |||||||||||||||
| Taiwan | 56,391,466 | 7,249,020 | — | — | |||||||||||||||
| United Kingdom | 59,757,987 | 4,949,189 | — | — | |||||||||||||||
| Level 2: Other Significant Observable Inputs | |||||||||||||||||||
| Common Equities: | |||||||||||||||||||
| Australia | 45,733,160 | 10,647,577 | 13,875,317 | — | |||||||||||||||
| China/Hong Kong | 502,459,932 | 71,126,383 | 48,273,463 | 1,004,937,891 | |||||||||||||||
| India | — | — | 15,046,898 | 615,325,145 | |||||||||||||||
| Indonesia | — | 11,063,492 | 15,361,214 | 206,854,653 | |||||||||||||||
| Japan | 254,459,559 | 61,984,395 | 70,548,020 | — | |||||||||||||||
| Malaysia | — | 14,441,213 | 3,261,121 | 163,364,078 | |||||||||||||||
| New Zealand | — | — | 1,432,682 | — | |||||||||||||||
| Philippines | 32,094,600 | 9,477,972 | — | 41,809,827 | |||||||||||||||
| Singapore | 294,974,656 | 15,248,671 | 7,172,048 | 128,325,337 | |||||||||||||||
| South Korea | 108,713,682 | 21,731,352 | 8,786,494 | 476,203,719 | |||||||||||||||
| Taiwan | 99,957,883 | 26,183,167 | 14,215,570 | 290,188,271 | |||||||||||||||
| Thailand | 66,732,760 | 24,542,846 | 7,651,599 | 151,019,699 | |||||||||||||||
| United Kingdom | — | 2,913,497 | — | — | |||||||||||||||
| Vietnam | 3,161,851 | — | — | 11,529,173 | |||||||||||||||
| Preferred Equities: | |||||||||||||||||||
| South Korea | 78,135,745 | — | 3,466,214 | — | |||||||||||||||
| Warrants: | |||||||||||||||||||
| India | 6,040,036 | — | — | — | |||||||||||||||
| Level 3: Significant Unobservable Inputs | |||||||||||||||||||
| International Bonds | 745,395,183 | 8,325,971 | — | — | |||||||||||||||
| Total Market Value of Investments | $ | 2,476,486,403 | $ | 309,562,458 | $ | 225,680,323 | $ | 3,505,965,210 | |||||||||||
84 MATTHEWS ASIA FUNDS
| Matthews China Dividend Fund | Matthews China Fund | Matthews India Fund | Matthews Japan Fund | Matthews Korea Fund | |||||||||||||||||||
| Level 1: Quoted Prices | |||||||||||||||||||||||
| Common Equities: | |||||||||||||||||||||||
| Consumer Discretionary | $ | 44,295 | $ | 95,552,811 | $ | — | $ | — | $ | — | |||||||||||||
| Consumer Staples | — | — | — | — | 2,747,118 | ||||||||||||||||||
| Energy | 358,430 | — | — | — | — | ||||||||||||||||||
| Financials | 328,103 | 9,997,605 | 32,054,090 | — | 1,350,220 | ||||||||||||||||||
| Health Care | — | 28,644,355 | — | — | 4,870,116 | ||||||||||||||||||
| Industrials | — | 174,605 | — | — | — | ||||||||||||||||||
| Information Technology | — | 69,154,596 | 10,400,653 | — | 2,476,859 | ||||||||||||||||||
| Materials | — | — | — | — | 4,955,580 | ||||||||||||||||||
| Telecommunication Services | 654,168 | 19,078,087 | — | — | 2,459,332 | ||||||||||||||||||
| Utilities | — | 18,572,287 | — | — | — | ||||||||||||||||||
| Level 2: Other Significant Observable Inputs | |||||||||||||||||||||||
| Common Equities: | |||||||||||||||||||||||
| Consumer Discretionary | 786,918 | 550,022,936 | 83,509,892 | 12,316,832 | 29,733,802 | ||||||||||||||||||
| Consumer Staples | 321,910 | 288,153,489 | 41,084,834 | 4,868,838 | 8,845,770 | ||||||||||||||||||
| Energy | 118,931 | 160,688,434 | 29,785,137 | — | 1,454,188 | ||||||||||||||||||
| Financials | 1,071,726 | 483,805,369 | 156,298,336 | 21,037,595 | 24,275,257 | ||||||||||||||||||
| Health Care | 400,777 | 21,369,856 | 50,139,920 | 5,155,871 | 1,240,612 | ||||||||||||||||||
| Industrials | 615,470 | 307,630,969 | 149,532,770 | 18,159,449 | 14,243,221 | ||||||||||||||||||
| Information Technology | 793,064 | 253,852,377 | 59,614,060 | 20,295,478 | 23,249,501 | ||||||||||||||||||
| Materials | — | 17,681,770 | 19,769,164 | 1,419,651 | 7,761,233 | ||||||||||||||||||
| Telecommunication Services | 209,505 | 71,013,945 | 15,504,992 | 4,386,135 | 3,104,192 | ||||||||||||||||||
| Utilities | 1,072,075 | 126,754,829 | 34,551,013 | — | — | ||||||||||||||||||
| Preferred Equities: | |||||||||||||||||||||||
| Financials | — | — | — | — | 1,301,949 | ||||||||||||||||||
| Information Technology | — | — | — | — | 1,501,426 | ||||||||||||||||||
| Level 3: Significant Unobservable Inputs | |||||||||||||||||||||||
| Common Equities: | |||||||||||||||||||||||
| Financials | — | — | 326,609 | — | — | ||||||||||||||||||
| International Bonds | — | — | 20,755,640 | — | — | ||||||||||||||||||
| Total Market Value of Investments | $ | 6,775,372 | $ | 2,522,148,320 | $ | 703,327,110 | $ | 87,639,849 | $ | 135,570,376 | |||||||||||||
| Matthews Asia Small Companies Fund | Matthews Asian Technology Fund | ||||||||||
| Level 1: Quoted Prices | |||||||||||
| Common Equities: | |||||||||||
| China/Hong Kong | $ | 2,369,703 | $ | 19,605,950 | |||||||
| Indonesia | — | 2,341,070 | |||||||||
| South Korea | — | 3,620,176 | |||||||||
| United States | — | 2,600,220 | |||||||||
| Level 2: Other Significant Observable Inputs | |||||||||||
| Common Equities: | |||||||||||
| China/Hong Kong | 31,188,876 | 13,953,836 | |||||||||
| India | 21,123,739 | 8,780,937 | |||||||||
| Indonesia | 1,506,947 | — | |||||||||
| Japan | — | 29,090,200 | |||||||||
| Malaysia | 3,559,707 | — | |||||||||
| Philippines | — | 1,398,863 | |||||||||
| Singapore | 12,209,872 | — | |||||||||
| South Korea | 16,127,987 | 17,726,269 | |||||||||
| Taiwan | 18,052,582 | 29,414,896 | |||||||||
| Level 3: Significant Unobservable Inputs | |||||||||||
| Common Equities: | |||||||||||
| India | 53,889 | — | |||||||||
| Total Market Value of Investments | $ | 106,193,302 | $ | 128,532,417 | |||||||
matthewsasia.com | 800.789.ASIA 85
Notes to Financial Statements (continued)
Following is a reconciliation of Level 3 investments for which significant unobservable inputs were used to determine fair value:
| Matthews Asian Growth and Income Fund | Matthews Asia Dividend Fund | Matthews India Fund | Matthews India Fund | Matthews Asia Small Companies Fund | |||||||||||||||||||
| International Bonds | International Bonds | International Bonds | Common Equities — Financials | Common Equities — India | |||||||||||||||||||
| Balance as of 12/31/08 (market value) | $ | 368,908,419 | $ | 2,803,227 | $ | 15,405,773 | $ | — | $ | — | |||||||||||||
| Accrued discounts/premiums | 20,308,241 | 171,514 | 2,353,969 | — | — | ||||||||||||||||||
| Realized gain/(loss) | (2,826,050 | ) | 136,018 | 2,106,588 | — | — | |||||||||||||||||
| Change in unrealized appreciation/ depreciation | 117,993,915 | 845,286 | 3,368,410 | 66,793 | 9,478 | ||||||||||||||||||
| Net purchases/(sales) | 241,010,658 | 4,369,926 | (2,479,100 | ) | 259,816 | 44,411 | |||||||||||||||||
| Transfers in and/or out of Level 3 | — | — | — | — | — | ||||||||||||||||||
| Balance as of 12/31/09 (market value) | $ | 745,395,183 | $ | 8,325,971 | $ | 20,755,640 | $ | 326,609 | $ | 53,889 | |||||||||||||
| Net change in unrealized appreciation/ depreciation on Level 3 investments held as of 12/31/09* | $ | 109,952,753 | $ | 845,285 | $ | 4,111,455 | $ | 66,793 | $ | 9,478 | |||||||||||||
* Included in the related amounts on the Statements of Operations.
C. RISKS ASSOCIATED WITH NON-U.S. COMPANIES: Investments by the Funds in the securities of non-U.S. companies may involve investment risks not typically associated with investments in U.S. issuers. These risks include possible political, economical, social and religious instability of the country of the issuer or other countries in the region, adverse diplomatic developments and the possibility of disruption to international trade patterns. Foreign investing may also include the risk of expropriation or confiscatory taxation, limitation on the removal or funds or other assets, currency crises and exchange controls, the imposition of foreign withholding tax on the interest income payable on such instruments, the possible seizure or nationalization of foreign deposits or assets, or the adoption of other foreign government restrictions that mi ght adversely affect the foreign securities held by the Funds. Foreign securities may be subject to greater fluctuations in price than securities of domestic corporations or the U.S. government. Securities of many foreign companies may be less liquid and their prices more volatile. Foreign securities are generally denominated and pay distributions in foreign currencies, exposing the Funds to changes in foreign currency exchange rates. Individual foreign economies may differ from the economy of the United States in many ways, including the growth of gross domestic products, rates of inflation, capital reinvestments, resource self-sufficiency, and balance of payments positions. Some non-U.S. companies are subject to different accounting, auditing, and financial reporting standards, practices, and requirements than U.S. companies. There is generally less government regulation of stock exchanges, brokers, and listed companies abroad than in the U.S., which may result in less transparency with respect to a compan y's operations, and make obtaining information about them more difficult (or such information may be unavailable). Foreign stock markets may not be as developed or efficient as those in the United States, and the absence of negotiated brokerage commissions in certain countries may result in higher brokerage fees. The time between the trade and settlement dates of securities transactions on foreign exchanges ranges from one day to four weeks or longer and may result in higher custody charges.
D. FEDERAL INCOME TAXES: It is the policy of the Funds to comply with all requirements of the Internal Revenue Code of 1986, as amended ("the Code"), applicable to regulated investment companies and to distribute substantially all of their taxable income to their shareholders. The Funds have met the requirements of the Code applicable to regulated investment companies for the year ended December 31, 2009. Therefore, no federal income tax provision is required. Income and capital gains of the Funds are determined in accordance with both tax regulations and GAAP. Such treatment may result in temporary and permanent differences between tax basis earnings and earnings reported for financial statement purposes. These reclassifications, which have no impact on the net asset value of the Funds, are primarily attributable to certain differences in computation of distributable income and capital gains under federal tax rules versus GAAP, and the use of the tax accounting practice known as equalization.
In addition to the requirements of the Code, the Funds may be subject to short-term capital gains tax in India on gains realized upon disposition of Indian securities held less than one year. The tax is computed on net realized gains; any realized losses in excess of gains may be carried forward for a period of up to eight years to offset future gains. Any net taxes payable must be remitted to the Indian government prior to repatriation of sales proceeds. The Funds that invest in Indian securities accrue a deferred tax liability for net unrealized short-term gains in excess of available carryforwards on Indian securities. This accrual may reduce a Fund's net asset value. As of December 31, 2009, the Matthews Asian Growth and Income Fund, Matthews Pacific Tiger Fund and Matthews Asia Small Companies Fund have recorded a payable of $4,289, $12,003,858 and $639,789, respectively, as an estimate for potential future India capital ga ins taxes.
China has recently adopted certain revisions to its tax laws and regulations that may result in holdings of the Funds in companies headquartered in China (whether A shares, B shares, H shares or shares traded in depositary receipt form) being subject to withholding taxes on dividends and other income. While the application of these changes to the Funds' remains subject to clarification, to the extent that such taxes are imposed on holdings of the Funds in companies headquartered in China, or withholding is imposed, the Funds' returns would be adversely impacted. The Funds consider the impact of a country's tax laws and regulations, as well as withholding, when considering investment decisions.
Management has analyzed the Funds tax positions taken on federal income tax returns for all open tax years (current and prior three tax years), and has concluded that no provision for federal income tax is required in the Funds financial statements. The Funds federal and
86 MATTHEWS ASIA FUNDS
state income and federal excise tax returns for tax years for which the applicable statutes of limitations have not expired are subject to examination by the Internal Revenue Service and state departments of revenue.
E. OFFERING COSTS: Offering costs are amortized on a straight-line basis over one year from each Fund's respective commencement of operations. In the event that any of the initial shares are redeemed during the period of amortization of the Fund's offering costs, the redemption proceeds will be reduced by any such unamortized offering costs in the same proportion as the number of shares being redeemed bears to the number of those shares outstanding at the time of redemption.
F. DISTRIBUTIONS TO SHAREHOLDERS: It is the policy of Matthews Asian Growth and Income Fund and Matthews China Dividend Fund to distribute net investment income on a semi-annual basis and capital gains, if any, annually. It is the policy of Matthews Asia Dividend Fund to distribute net investment income on a quarterly basis and capital gains, if any, annually. Matthews Asia Pacific Fund, Matthews Pacific Tiger Fund, Matthews China Fund, Matthews India Fund, Matthews Japan Fund, Matthews Korea Fund, Matthews Asia Small Companies Fund and Matthews Asian Technology Fund distribute net investment income and capital gains, if any, annually. Distributions to shareholders are recorded on the ex-dividend date. Income and capital gain distributions are determined in accordance with income tax regulations which may differ from GAAP. Net investment lo sses may not be utilized to offset net investment income in future periods for tax purposes.
The tax character of distributions paid for the fiscal years ended December 31, 2009 and December 31, 2008 were as follows:
| YEAR ENDED DECEMBER 31, 2009 | Ordinary Income | Net Long-Term Capital Gains | Total Taxable Distributions | ||||||||||||
| Matthews Asian Growth and Income Fund | $ | 60,961,205 | $ | — | $ | 60,961,205 | |||||||||
| Matthews Asia Dividend Fund | 10,189,013 | — | 10,189,013 | ||||||||||||
| Matthews Asia Pacific Fund | 3,712,448 | — | 3,712,448 | ||||||||||||
| Matthews Pacific Tiger Fund | 26,580,408 | — | 26,580,408 | ||||||||||||
| Matthews China Fund | 6,595,986 | — | 6,595,986 | ||||||||||||
| Matthews India Fund | 4,170,406 | 5,361,101 | 9,531,507 | ||||||||||||
| Matthews Japan Fund | 2,466,218 | — | 2,466,218 | ||||||||||||
| Matthews Korea Fund | — | 5,234,879 | 5,234,879 | ||||||||||||
| Matthews Asia Small Companies Fund | 1,251,010 | — | 1,251,010 | ||||||||||||
| YEAR ENDED DECEMBER 31, 2008 | Ordinary Income | Net Long-Term Capital Gains | Total Taxable Distributions | ||||||||||||
| Matthews Asian Growth and Income Fund | $ | 46,939,388 | $ | 146,858,628 | $ | 193,798,016 | |||||||||
| Matthews Asia Dividend Fund | 3,061,632 | 92,307 | 3,153,939 | ||||||||||||
| Matthews Asia Pacific Fund | 589,467 | 12,070,194 | 12,659,661 | ||||||||||||
| Matthews Pacific Tiger Fund | 33,450,241 | 289,634,922 | 323,085,163 | ||||||||||||
| Matthews China Fund | 13,004,926 | 222,048,330 | 235,053,256 | ||||||||||||
| Matthews India Fund | 4,953,902 | 23,888,299 | 28,842,201 | ||||||||||||
| Matthews Japan Fund | 29 | 2,681,646 | 2,681,675 | ||||||||||||
| Matthews Korea Fund | 1,673,243 | 7,207,898 | 8,881,141 | ||||||||||||
| Matthews Asia Small Companies Fund | 5,235 | — | 5,235 | ||||||||||||
G. INVESTMENT TRANSACTIONS AND INCOME: Securities transactions are accounted for on the date the securities are purchased or sold. Gains or losses on the sale of securities are determined on the identified cost basis. Interest income is recorded on the accrual basis. Dividend income is recorded on the ex-dividend date.
H. FUND EXPENSE ALLOCATIONS: The Funds account separately for the assets, liabilities and operations of each Fund. Direct expenses of each Fund are charged to the Fund while Trust level expenses are allocated pro-rata among the Funds based on net assets or other appropriate methods.
I. CASH OVERDRAFTS: When cash balances are overdrawn, a Fund is charged an overdraft fee by the custodian of 1.00% above the 30-day LIBOR rate on outstanding balances. These amounts, if any, are included in Other expenses on the Statements of Operations.
J. USE OF ESTIMATES: The preparation of financial statements in conformity with GAAP requires management to make estimates and assumptions that affect the amounts reported in the financial statements and accompanying notes. Actual results may differ from those estimates.
matthewsasia.com | 800.789.ASIA 87
Notes to Financial Statements (continued)
2. CAPITAL SHARE TRANSACTIONS
Each Fund is authorized to issue an unlimited number of shares of beneficial interest with a par value of $0.001 per share.
| Year Ended December 31, 2009 | Year Ended December 31, 2008 | ||||||||||||||||||
| MATTHEWS ASIAN GROWTH AND INCOME FUND | Shares | Amount | Shares | Amount | |||||||||||||||
| Shares sold | 90,611,648 | $ | 1,251,164,099 | 21,899,058 | $ | 328,702,177 | |||||||||||||
| Shares issued through reinvestment of distributions | 3,866,007 | 56,619,667 | 14,082,294 | 183,071,148 | |||||||||||||||
| Shares redeemed | (27,730,103 | ) | (364,139,772 | ) | (56,110,939 | ) | (834,979,930 | ) | |||||||||||
| Net increase (decrease) | 66,747,552 | $ | 943,643,994 | (20,129,587 | ) | ($ | 323,206,605 | ) | |||||||||||
| Year Ended December 31, 2009 | Year Ended December 31, 2008 | ||||||||||||||||||
| MATTHEWS ASIA DIVIDEND FUND | Shares | Amount | Shares | Amount | |||||||||||||||
| Shares sold | 18,522,977 | $ | 197,768,100 | 14,488,000 | $ | 132,923,382 | |||||||||||||
| Shares issued through reinvestment of distributions | 892,613 | 9,454,356 | 301,620 | 2,985,343 | |||||||||||||||
| Shares redeemed | (9,206,330 | ) | (82,245,771 | ) | (5,108,990 | ) | (49,481,429 | ) | |||||||||||
| Net increase | 10,209,260 | $ | 124,976,685 | 9,680,630 | $ | 86,427,296 | |||||||||||||
| Period Ended December 31, 2009* | |||||||||||
| MATTHEWS CHINA DIVIDEND FUND | Shares | Amount | |||||||||
| Shares sold | 701,503 | $ | 7,027,389 | ||||||||
| Shares issued through reinvestment of distributions | - | - | |||||||||
| Shares redeemed | (497 | ) | (4,886 | ) | |||||||
| Net increase | 701,006 | $ | 7,022,503 | ||||||||
* The Matthews China Dividend Fund commenced operations on November 30, 2009.
| Year Ended December 31, 2009 | Year Ended December 31, 2008 | ||||||||||||||||||
| MATTHEWS ASIA PACIFIC FUND | Shares | Amount | Shares | Amount | |||||||||||||||
| Shares sold | 8,060,298 | $ | 99,703,728 | 4,889,230 | $ | 68,077,616 | |||||||||||||
| Shares issued through reinvestment of distributions | 235,615 | 3,411,707 | 969,733 | 9,357,976 | |||||||||||||||
| Shares redeemed | (9,119,800 | ) | (100,091,908 | ) | (16,349,415 | ) | (204,900,950 | ) | |||||||||||
| Net increase (decrease) | (823,887 | ) | $ | 3,023,527 | (10,490,452 | ) | ($ | 127,465,358 | ) | ||||||||||
| Year Ended December 31, 2009 | Year Ended December 31, 2008 | ||||||||||||||||||
| MATTHEWS PACIFIC TIGER FUND | Shares | Amount | Shares | Amount | |||||||||||||||
| Shares sold | 110,513,779 | $ | 1,710,149,408 | 19,644,970 | $ | 353,833,666 | |||||||||||||
| Shares issued through reinvestment of distributions | 964,998 | 18,306,012 | 25,829,966 | 269,180,612 | |||||||||||||||
| Shares redeemed | (34,894,575 | ) | (504,644,408 | ) | (73,247,167 | ) | (1,268,536,898 | ) | |||||||||||
| Net increase (decrease) | 76,584,202 | $ | 1,223,811,012 | (27,772,231 | ) | ($ | 645,522,620 | ) | |||||||||||
| Year Ended December 31, 2009 | Year Ended December 31, 2008 | ||||||||||||||||||
| MATTHEWS CHINA FUND | Shares | Amount | Shares | Amount | |||||||||||||||
| Shares sold | 67,632,449 | $ | 1,395,811,306 | 18,251,837 | $ | 493,677,884 | |||||||||||||
| Shares issued through reinvestment of distributions | 253,434 | 6,406,676 | 15,859,820 | 227,429,542 | |||||||||||||||
| Shares redeemed | (21,738,238 | ) | (452,648,756 | ) | (38,423,260 | ) | (1,099,046,762 | ) | |||||||||||
| Net increase (decrease) | 46,147,645 | $ | 949,569,226 | (4,311,603 | ) | ($ | 377,939,336 | ) | |||||||||||
88 MATTHEWS ASIA FUNDS
| Year Ended December 31, 2009 | Year Ended December 31, 2008 | ||||||||||||||||||
| MATTHEWS INDIA FUND | Shares | Amount | Shares | Amount | |||||||||||||||
| Shares sold | 16,867,471 | $ | 216,332,772 | 17,545,512 | $ | 335,946,623 | |||||||||||||
| Shares issued through reinvestment of distributions | 569,533 | 9,186,402 | 3,513,386 | 27,932,026 | |||||||||||||||
| Shares redeemed | (11,092,885 | ) | (132,499,147 | ) | (36,786,710 | ) | (591,168,184 | ) | |||||||||||
| Net increase (decrease) | 6,344,119 | $ | 93,020,027 | (15,727,812 | ) | ($ | 227,289,535 | ) | |||||||||||
| Year Ended December 31, 2009 | Year Ended December 31, 2008 | ||||||||||||||||||
| MATTHEWS JAPAN FUND | Shares | Amount | Shares | Amount | |||||||||||||||
| Shares sold | 4,372,850 | $ | 41,047,221 | 10,668,491 | $ | 133,481,261 | |||||||||||||
| Shares issued through reinvestment of distributions | 196,404 | 2,164,373 | 212,615 | 2,066,617 | |||||||||||||||
| Shares redeemed | (8,609,002 | ) | (86,507,638 | ) | (10,211,602 | ) | (118,027,026 | ) | |||||||||||
| Net increase (decrease) | (4,039,748 | ) | ($ | 43,296,044 | ) | 669,504 | $ | 17,520,852 | |||||||||||
| Year Ended December 31, 2009 | Year Ended December 31, 2008 | ||||||||||||||||||
| MATTHEWS KOREA FUND | Shares | Amount | Shares | Amount | |||||||||||||||
| Shares sold | 6,981,091 | $ | 25,016,110 | 6,335,159 | $ | 27,007,960 | |||||||||||||
| Shares issued through reinvestment of distributions | 1,182,569 | 5,014,485 | 3,519,633 | 8,410,812 | |||||||||||||||
| Shares redeemed | (7,765,520 | ) | (26,135,039 | ) | (16,351,965 | ) | (74,965,350 | ) | |||||||||||
| Net increase (decrease) | 398,140 | $ | 3,895,556 | (6,497,173 | ) | ($ | 39,546,578 | ) | |||||||||||
| Year Ended December 31, 2009 | Year Ended December 31, 2008 | ||||||||||||||||||
| MATTHEWS ASIA SMALL COMPANIES FUND | Shares | Amount | Shares | Amount | |||||||||||||||
| Shares sold | 7,498,692 | $ | 97,918,511 | 488,968 | $ | 4,048,615 | |||||||||||||
| Shares issued through reinvestment of distributions | 78,594 | 1,216,628 | 655 | 4,960 | |||||||||||||||
| Shares redeemed | (1,032,135 | ) | (12,997,387 | ) | (87,299 | ) | (665,026 | ) | |||||||||||
| Net increase | 6,545,151 | $ | 86,137,752 | 402,324 | $ | 3,388,549 | |||||||||||||
| Year Ended December 31, 2009 | Year Ended December 31, 2008 | ||||||||||||||||||
| MATTHEWS ASIAN TECHNOLOGY FUND | Shares | Amount | Shares | Amount | |||||||||||||||
| Shares sold | 4,939,270 | $ | 33,834,530 | 6,537,904 | $ | 53,738,475 | |||||||||||||
| Shares redeemed | (4,484,328 | ) | (26,762,039 | ) | (16,482,244 | ) | (117,085,933 | ) | |||||||||||
| Net increase (decrease) | 454,942 | $ | 7,072,491 | (9,944,340 | ) | ($ | 63,347,458 | ) | |||||||||||
The Funds generally assess a redemption fee of 2.00% of the total redemption proceeds if shareholders sell or exchange their shares within 90 calendar days after purchasing them. The redemption fee is paid directly to the Funds and is designed to offset transaction costs associated with short-term trading of Fund shares. For purposes of determining whether the redemption fee applies, the shares that have been held the longest will be redeemed first. The Funds may grant exemption from the redemption fee when the Funds have previously received assurances that transactions do not involve market timing activity. The Funds may also waive the imposition of redemption fees in certain circumstances. For more information on this policy, please see the Funds' prospectus. The redemption fees returned to the assets of the Funds are stated in the Statements of Changes in Net Assets.
3. INVESTMENT ADVISORY FEES AND OTHER TRANSACTIONS WITH AFFILIATES
Matthews International Capital Management, LLC ("Matthews"), a registered investment advisor under the Investment Advisers Act of 1940, as amended, provides the Funds with investment management services. Pursuant to an investment Advisory Agreement dated August 13, 2004, as amended (the "Advisory Agreement"), the Funds, pay Matthews (i) for management and advisory services; and (ii) for certain administrative services, an annual fee as a percentage of average daily net assets. Under the Advisory Agreement each of the Funds, other than the Matthews Asia Small Companies Fund, pays Matthews 0.75% of their aggregate annual average daily net assets from $0 to $2 billion, 0.6834% on their annual aggregate average daily net assets between $2 billion and $5 billion, and 0.65% on their annual aggregate average daily net assets over $5 billion. The Matthews Asia Small Companies Fund pay Matthews an annual fee of 1.00% of its annual averag e daily net assets pursuant to the Advisory Agreement. Each Fund pays Matthews a monthly fee of one-twelth (1/12) of the management fee of the Fund's average daily net asset value for each month in arrears.
Under a written agreement between the Funds and Matthews, Matthews agrees to reimburse money to a Fund if its expense ratio exceeds a certain percentage level. For Matthews China Fund, Matthews India Fund, Matthews Japan Fund, Matthews Korea Fund, Matthews Asia
matthewsasia.com | 800.789.ASIA 89
Notes to Financial Statements (continued)
Small Companies Fund and Matthews Asian Technology Fund, the level is 2.00%. For Matthews Asian Growth and Income Fund, Matthews Asia Pacific Fund and Matthews Pacific Tiger Fund, the level is 1.90%. For Matthews Asia Dividend Fund and Matthews China Dividend Fund, the level is 1.50%. In turn, if a Fund's expenses fall below the level noted within three years after Matthews has made such a reimbursement, the Fund may reimburse Matthews up to an amount not to exceed its expense limitation. For each Fund, other than the Matthews Asia Small Companies Fund and Matthews China Dividend Fund, this agreement will continue through at least August 31, 2010. For the Matthews Asia Small Companies Fund and Matthews China Dividend Fund, this agreement will continue through at least April 30, 2012 and November 30, 2012, respectively. These agreements may be extended for additional periods for each of the Funds. At December 31, 2009, Matthews A sia Dividend Fund had $34,648 available for recoupment, of which $10,105 expires in 2010 and $24,543 expires in 2011. At December 31, 2009, Matthews Asia Small Companies Fund had $94,607 available for recoupment, of which $64,333 expires in 2011 and $30,274 expires in 2012. At December 31, 2009, Matthews China Dividend Fund had $30,662 available for recoupment which expires in 2012.
Investment advisory fees charged and waived and fees recaptured for the year ended December 31, 2009, were as follows:
| Gross Advisory Fees | Advisory Fees Waived and Reimbursed in Excess of the Expense Limitation | Recapture of Previously Waived Fees | Net Advisory Fee | ||||||||||||||||
| Matthews Asian Growth and Income Fund | $ | 11,768,584 | $ | — | $ | — | $ | 11,768,584 | |||||||||||
| Matthews Asia Dividend Fund | 1,243,079 | — | 30,160 | 1,273,239 | |||||||||||||||
| Matthews China Dividend Fund | 2,392 | (30,662 | ) | — | (28,270 | ) | |||||||||||||
| Matthews Asia Pacific Fund | 1,221,346 | — | — | 1,221,346 | |||||||||||||||
| Matthews Pacific Tiger Fund | 15,346,132 | — | — | 15,346,132 | |||||||||||||||
| Matthews China Fund | 10,678,650 | — | — | 10,678,650 | |||||||||||||||
| Matthews India Fund | 3,305,116 | — | — | 3,305,116 | |||||||||||||||
| Matthews Japan Fund | 752,042 | — | — | 752,042 | |||||||||||||||
| Matthews Korea Fund | 733,098 | — | — | 733,098 | |||||||||||||||
| Matthews Asia Small Companies Fund | 344,183 | (30,274 | ) | — | 313,909 | ||||||||||||||
| Matthews Asian Technology Fund | 644,901 | — | — | 644,901 | |||||||||||||||
Certain officers and Trustees of the Funds are also officers and directors of the Advisor. All officers serve without compensation from the Funds. The Funds paid the Independent Trustees $298,450 in aggregate for regular compensation during the year ended December 31, 2009; no special compensation was paid during this period.
The Funds have an administration and shareholder servicing agreement, pursuant to which, the Funds pay the Advisor for Administration and shareholder servicing activities based on each Fund's aggregate average daily net assets. The fee is charged at a rate of 0.25% of the aggregate average daily net assets in the Trust between $0 and $2 billion, 0.1834% of aggregate average daily net assets in the Trust between $2 billion and $5 billion, 0.15% of the aggregate average daily net assets in the Trust between $5 billion and $7.5 billion and 0.125% of aggregate average daily net assets in the Trust over $7.5 billion.
Administration and shareholder servicing fees charged, for the year ended December 31, 2009, were as follows:
| Administration and Shareholder Servicing Fees | |||||||
| Matthews Asian Growth and Income Fund | $ | 3,247,550 | |||||
| Matthews Asia Dividend Fund | 343,782 | ||||||
| Matthews China Dividend Fund | 608 | ||||||
| Matthews Asia Pacific Fund | 340,372 | ||||||
| Matthews Pacific Tiger Fund | 4,207,210 | ||||||
| Matthews China Fund | 2,930,995 | ||||||
| Matthews India Fund | 911,032 | ||||||
| Matthews Japan Fund | 212,715 | ||||||
| Matthews Korea Fund | 203,791 | ||||||
| Matthews Asia Small Companies Fund | 62,808 | ||||||
| Matthews Asian Technology Fund | 179,039 | ||||||
90 MATTHEWS ASIA FUNDS
The Funds bear a portion of the fees paid to certain service providers (exclusive of the Funds' Transfer Agent) which provide transfer agency and shareholder servicing to certain shareholders. Additional information concerning these services and fees is contained in the Fund's prospectus. Fees accrued to pay to such service providers for the year ended December 31, 2009 are a component of Transfer Agent fees and Administration and Shareholder Servicing Fees in the Statements of Operations as follows:
| Transfer Agent Fees | Administration & Shareholder Servicing Fees | Total | |||||||||||||
| Matthews Asian Growth and Income Fund | $ | 2,165,128 | $ | 1,066,407 | $ | 3,231,535 | |||||||||
| Matthews Asia Dividend Fund | 217,750 | 107,250 | 325,000 | ||||||||||||
| Matthews China Dividend Fund | 1,081 | 533 | 1,614 | ||||||||||||
| Matthews Asia Pacific Fund | 221,911 | 109,299 | 331,210 | ||||||||||||
| Matthews Pacific Tiger Fund | 1,899,487 | 935,568 | 2,835,055 | ||||||||||||
| Matthews China Fund | 2,131,047 | 1,049,620 | 3,180,667 | ||||||||||||
| Matthews India Fund | 586,746 | 288,994 | 875,740 | ||||||||||||
| Matthews Japan Fund | 125,338 | 61,733 | 187,071 | ||||||||||||
| Matthews Korea Fund | 119,477 | 58,847 | 178,324 | ||||||||||||
| Matthews Asia Small Companies Fund | 38,225 | 18,827 | 57,052 | ||||||||||||
| Matthews Asian Technology Fund | 125,509 | 61,818 | 187,327 | ||||||||||||
PNC Global Investment Servicing (U.S.) Inc. ("PNCGIS"), an indirect wholly owned subsidiary of The PNC Financial Services Group, serves as the Trust's administrator, and in that capacity, performs various administrative and accounting services for each Fund. PNCGIS also serves as the Trust's transfer agent, dividend disbursing agent and registrar. An officer of PNCGIS serves as Assistant Treasurer to the Trust. Total fees accrued by the Funds for administration and accounting services for the year ended December 31, 2009 were as follows:
| Administration and Accounting Fees | |||||||
| Matthews Asian Growth and Income Fund | $ | 308,692 | |||||
| Matthews Asia Dividend Fund | 32,562 | ||||||
| Matthews China Dividend Fund | 62 | ||||||
| Matthews Asia Pacific Fund | 32,059 | ||||||
| Matthews Pacific Tiger Fund | 402,575 | ||||||
| Matthews China Fund | 280,167 | ||||||
| Matthews India Fund | 86,729 | ||||||
| Matthews Japan Fund | 19,794 | ||||||
| Matthews Korea Fund | 19,254 | ||||||
| Matthews Asia Small Companies Fund | 6,155 | ||||||
| Matthews Asian Technology Fund | 16,931 | ||||||
Brown Brothers Harriman & Co. serves as custodian to the Trust. PFPC Distributors, Inc., (the "Distributor"), an indirect wholly owned subsidiary of The PNC Financial Services Group, (the "Distributor"), serves as the Fund's Distributor pursuant to an Underwriting Agreement.
4. INVESTMENT TRANSACTIONS
The value of investment transactions made for affiliated and unaffiliated holdings for the year ended December 31, 2009, excluding short-term investments, were as follows:
| Affiliated Purchases | Proceeds from Affiliated Sales | Unaffiliated Purchases | Proceeds from Unaffiliated Sales | ||||||||||||||||
| Matthews Asian Growth and Income Fund | $ | 26,692,182 | $ | 429,218 | $ | 1,135,367,938 | $ | 287,882,808 | |||||||||||
| Matthews Asia Dividend Fund | — | — | 169,642,924 | 57,491,191 | |||||||||||||||
| Matthews China Dividend Fund | — | — | 6,661,391 | — | |||||||||||||||
| Matthews Asia Pacific Fund | — | 13,133,538 | 101,306,858 | 89,191,510 | |||||||||||||||
| Matthews Pacific Tiger Fund | — | — | 1,429,043,689 | 286,939,827 | |||||||||||||||
| Matthews China Fund | 9,953,054 | — | 985,094,181 | 79,985,370 | |||||||||||||||
| Matthews India Fund | — | — | 150,968,870 | 84,749,683 | |||||||||||||||
| Matthews Japan Fund | — | — | 132,963,090 | 177,941,685 | |||||||||||||||
| Matthews Korea Fund | — | — | 54,598,547 | 57,772,799 | |||||||||||||||
| Matthews Asia Small Companies Fund | — | — | 88,676,097 | 7,649,919 | |||||||||||||||
| Matthews Asian Technology Fund | — | — | 81,900,360 | 76,487,840 | |||||||||||||||
matthewsasia.com | 800.789.ASIA 91
Notes to Financial Statements (continued)
5. HOLDINGS OF 5% VOTING SHARES OF PORTFOLIO COMPANIES
The Act defines "affiliated companies" to include investments in portfolio companies in which a fund owns 5% or more of the outstanding voting shares. During the year ended December 31, 2009, the Funds below held 5% or more of the outstanding voting shares of the noted portfolio companies. During this period, other Funds in the Trust may also have held voting shares of the issuers at levels below 5%.
Investments in affiliates:
A summary of transactions in securities of issuers affiliated with a Fund for the year ended December 31, 2009 is set forth below:
| Shares Held at Dec. 31, 2008 | Shares Purchased | Shares Sold | Shares Held at Dec. 31, 2009 | Value at Dec. 31, 2009 | Dividend Income Jan.1, 2009– Dec. 31, 2009 | ||||||||||||||||||||||
| MATTHEWS ASIAN GROWTH AND INCOME FUND | |||||||||||||||||||||||||||
| Name of Issuer: | |||||||||||||||||||||||||||
| I-CABLE Communications, Ltd. | 129,832,000 | — | 1,753,000 | 128,079,000 | $ | 18,768,537 | $ | — | |||||||||||||||||||
| GS Home Shopping, Inc. | — | 388,299 | — | 388,299 | 28,572,175 | 994,618 | |||||||||||||||||||||
| Vitasoy International Holdings, Ltd. | 41,197,000 | 10,100,000 | — | 51,297,000 | 35,815,626 | 1,411,622 | |||||||||||||||||||||
| Total Affiliates | $ | 83,156,338 | $ | 2,406,240 | |||||||||||||||||||||||
| MATTHEWS ASIA PACIFIC FUND | |||||||||||||||||||||||||||
| Name of Issuer: | |||||||||||||||||||||||||||
| Funai Zaisan Consultants Co., Ltd.* | 7,081 | — | 7,081 | — | $ | — | $ | — | |||||||||||||||||||
| Total Affiliates | $ | — | $ | — | |||||||||||||||||||||||
| MATTHEWS CHINA FUND | |||||||||||||||||||||||||||
| Name of Issuer: | |||||||||||||||||||||||||||
| Kingdee International Software Group Co., Ltd. | 120,330,000 | — | — | 120,330,000 | $ | 26,796,138 | $ | 341,580 | |||||||||||||||||||
| Lianhua Supermarket Holdings Co., Ltd. H Shares | 12,995,000 | 4,155,000 | — | 17,150,000 | 51,603,893 | 513,503 | |||||||||||||||||||||
| Total Affiliates | $ | 78,400,031 | $ | 855,083 | |||||||||||||||||||||||
* Issuer was not an affiliated company as of December 31, 2009.
6. SHORT-TERM BORROWINGS
The Funds were a party to a $75,000,000 credit agreement with a group of lenders, which expired October 6, 2009. The Funds were able to borrow under the credit agreement, if necessary, to fund shareholder redemptions to allow the Funds to manage the sale of portfolio holdings at times that the Advisor believed such sales would had been unfavorable to shareholders. Each Fund was able to borrow up to the maximum amount allowable under the Funds current Prospectus and Statement of Additional Information. The Funds paid a commitment fee of 0.12% per annum based on each Fund's pro rata share of the unused portion of the credit agreement, which is included in Other expenses in the Statements of Operations as well as other certain related fees. Amounts borrowed under the credit agreement would bear an interest rate equal to the Federal Funds Rate plus 0.50%. The Funds did not borrow under the credit agreement during the year ended Dece mber 31, 2009. The credit agreement was not renewed.
7. FEDERAL INCOME TAX INFORMATION
As of December 31, 2009, the components of accumulated earnings/(deficit) on tax basis were as follows:
| Undistributed Ordinary Income | Undistributed Long-Term Capital Gains | Capital Loss Carryforwards | Post October Capital Losses** | ||||||||||||||||
| Matthews Asian Growth and Income Fund | $ | 2,661,873 | $ | — | ($ | 64,043,804 | ) | $ | — | ||||||||||
| Matthews Asia Dividend Fund | 673,586 | — | (17,572,254 | ) | — | ||||||||||||||
| Matthews China Dividend Fund | 3,691 | — | — | — | |||||||||||||||
| Matthews Asia Pacific Fund | 2,855,163 | — | (82,339,492 | ) | (251,590 | ) | |||||||||||||
| Matthews Pacific Tiger Fund | 1,104,889 | — | (194,447,297 | ) | — | ||||||||||||||
| Matthews China Fund | 319,409 | — | (44,320,615 | ) | — | ||||||||||||||
| Matthews India Fund | 6,198,631 | — | (84,698,767 | ) | (549,463 | ) | |||||||||||||
| Matthews Japan Fund | 2,536,490 | — | (80,527,804 | ) | — | ||||||||||||||
| Matthews Korea Fund | — | 867,841 | — | — | |||||||||||||||
| Matthews Asia Small Companies Fund | 306,547 | 64,912 | — | — | |||||||||||||||
| Matthews Asian Technology Fund | — | — | (36,011,673 | ) | — | ||||||||||||||
92 MATTHEWS ASIA FUNDS
| Post October Currency Losses** | Other Temporary Differences | Unrealized Appreciation*** | Total Accumulated Earnings/(Deficit) | ||||||||||||||||
| Matthews Asian Growth and Income Fund | ($ | 150,834 | ) | $ | — | $ | 330,541,535 | $ | 269,008,770 | ||||||||||
| Matthews Asia Dividend Fund | (14,963 | ) | (54,728 | ) | 50,799,253 | 33,830,894 | |||||||||||||
| Matthews China Dividend Fund | — | — | 110,931 | 114,622 | |||||||||||||||
| Matthews Asia Pacific Fund | (3,181 | ) | — | 56,776,752 | (22,962,348 | ) | |||||||||||||
| Matthews Pacific Tiger Fund | (103,768 | ) | — | 881,670,159 | 688,223,983 | ||||||||||||||
| Matthews China Fund | (416 | ) | — | 614,696,784 | 570,695,162 | ||||||||||||||
| Matthews India Fund | (5,874 | ) | (27,205 | ) | 138,442,703 | 59,360,025 | |||||||||||||
| Matthews Japan Fund | — | — | 9,666,065 | (68,325,249 | ) | ||||||||||||||
| Matthews Korea Fund | (6,223 | ) | — | 33,719,525 | 34,581,143 | ||||||||||||||
| Matthews Asia Small Companies Fund | (24,010 | ) | — | 19,677,493 | 20,024,942 | ||||||||||||||
| Matthews Asian Technology Fund | (8,293 | ) | — | 27,185,441 | (8,834,525 | ) | |||||||||||||
** Under current tax law capital and currency losses realized after October 31 and prior to the Funds' fiscal year end may be deferred as occurring on the first day of the following fiscal year.
*** The differences between book-basis and tax-basis unrealized appreciation/(depreciation) is attributable primarily to the tax deferral of losses on wash sales and passive foreign investment company (PFIC) mark to market adjustments.
For federal income tax purposes, the Funds indicated below have capital loss carryforwards, which expire in the year indicated, as of December 31, 2009, which are available to offset future capital gains, if any:
| LOSSES DEFERRED EXPIRING IN: | 2010 | 2016 | 2017 | Total | |||||||||||||||
| Matthews Asian Growth and Income Fund | $ | — | $ | — | $ | 64,043,804 | $ | 64,043,804 | |||||||||||
| Matthews Asia Dividend Fund | — | 1,466,788 | 16,105,466 | 17,572,254 | |||||||||||||||
| Matthews Asia Pacific Fund | — | 24,090,517 | 58,248,975 | 82,339,492 | |||||||||||||||
| Matthews Pacific Tiger Fund | — | — | 194,447,297 | 194,447,297 | |||||||||||||||
| Matthews China Fund | — | — | 44,320,615 | 44,320,615 | |||||||||||||||
| Matthews India Fund | — | — | 84,698,767 | 84,698,767 | |||||||||||||||
| Matthews Japan Fund | — | 36,495,378 | 44,032,426 | 80,527,804 | |||||||||||||||
| Matthews Asian Technology Fund | 3,461,198 | 17,493,413 | 15,057,062 | 36,011,673 | |||||||||||||||
The Matthews Asia Small Companies Fund utilized $7,715 in capital loss carryforward. Matthews Asian Technology Fund had $5,967,059 in capital loss carryforward that expired in the current year.
Accounting principles generally accepted in the United States require that certain components of net assets be reclassified between financial and tax reporting. These reclassifications have no effect on net assets or net asset value per share. The permanent differences are primarily attributable to net realized gains on PFICs, the utilization of accumulated earnings and profits distributed to shareholders on redemptions of shares as part of the dividends-paid deduction for income tax purposes, foreign currency gain reclassification, write-off of net operating losses, application of foreign tax credit to short-term gain and recharacterization of distributions. For the year ended December 31, 2009, permanent differences in book and tax accounting have been reclassified to paid-in capital, undistributed net investment income (loss) and accumulated realized gain (loss) as follows:
| Increase/ (Decrease) Paid-In-Capital | Increase/(Decrease) Undistributed Net Investment Income/(Loss) | Increase/ (Decrease) Accumulated Realized Gain/(Loss) | |||||||||||||
| Matthews Asian Growth and Income Fund | $ | — | ($ | 254,140 | ) | $ | 254,140 | ||||||||
| Matthews Asia Dividend Fund | 78,366 | 33,831 | (112,197 | ) | |||||||||||
| Matthews China Dividend Fund | (2,765 | ) | 3,512 | (747 | ) | ||||||||||
| Matthews Asia Pacific Fund | — | (38,360 | ) | 38,360 | |||||||||||
| Matthews Pacific Tiger Fund | — | (1,635,756 | ) | 1,635,756 | |||||||||||
| Matthews China Fund | — | (183,530 | ) | 183,530 | |||||||||||
| Matthews India Fund | — | 284,741 | (284,741 | ) | |||||||||||
| Matthews Japan Fund | — | 1,387,091 | (1,387,091 | ) | |||||||||||
| Matthews Korea Fund | (465,720 | ) | 377,043 | 88,677 | |||||||||||
| Matthews Asia Small Companies Fund | 56,850 | (115,324 | ) | 58,474 | |||||||||||
| Matthews Asian Technology Fund | (6,019,519 | ) | (32,648 | ) | 6,052,167 | ||||||||||
8. SUBSEQUENT EVENTS
On February 2, 2010, The PNC Financial Services Group, Inc. ("PNC") entered into a Stock Purchase Agreement (the "Stock Purchase Agreement") with The Bank of New York Mellon Corporation ("BNY Mellon"). Upon the terms and subject to the conditions set forth in the Stock Purchase Agreement, which has been approved by the board of directors of each company, PNC will sell to BNY Mellon (the "Stock Sale") 100% of the issued and outstanding shares of PNC Global Investment Servicing Inc., an indirect, wholly owned subsidiary of PNC. The Stock Sale includes PNCGIS and PFPC Distributors, Inc. and is expected to close in the third quarter of 2010.
Management has evaluated the impact of all subsequent events on the Funds through February 23, 2010, the date the financial statements were issued, and has determined that there were no additional subsequent events that require recognition or disclosure in the financial statements. Management is evaluating the impact of the Stock Sale and will monitor any impact on the Trust.
matthewsasia.com | 800.789.ASIA 93
Report of Independent Registered Public Accounting Firm
To the Board of Trustees and Shareholders of Matthews Asia Funds:
In our opinion, the accompanying statements of assets and liabilities, including the schedules of investments, and the related statements of operations and of changes in net assets and the financial highlights present fairly, in all material respects, the financial position of Matthews Asian Growth and Income Fund, Matthews Asia Dividend Fund, Matthews China Dividend Fund, Matthews Asia Pacific Fund, Matthews Pacific Tiger Fund, Matthews China Fund, Matthews India Fund, Matthews Japan Fund, Matthews Korea Fund, Matthews Asia Small Companies Fund, and Matthews Asian Technology Fund (each a portfolio comprising the Matthews Asia Funds, hereafter referred as the "Funds") at December 31, 2009, and the results of each of their operations for the period then ended, the changes in net assets for the two years in the period then ended and the financial highlights for the three years in the period then ended for Matthews Asian Growth and Income Fund, Matthews Asia Dividend Fund, Matthews Asia Pacific Fund, Matthews Pacific Tiger Fund, Matthews China Fund, Matthews India Fund, Matthews Japan Fund, Matthews Korea Fund, and Matthews Asian Technology Fund, the changes in net assets for the two years in the period then ended and the financial highlights for the two years in the period then ended for Matthews Asia Small Companies Fund, and the changes in net assets and the financial highlights for the period then ended for Matthews China Dividend Fund, in conformity with accounting principles generally accepted in the United States of America. These financial statements and financial highlights (hereafter referred to as "financial statements") are the responsibility of the Funds' management; our responsibility is to express an opinion on these financial statements based on our audits. We conducted our audits of these financial statements in accordance with the standards of the Public Company Accounting Oversight Board (United States). Those stand ards require that we plan and perform the audit to obtain reasonable assurance about whether the financial statements are free of material misstatement. An audit includes examining, on a test basis, evidence supporting the amounts and disclosures in the financial statements, assessing the accounting principles used and significant estimates made by management, and evaluating the overall financial statement presentation. We believe that our audits, which included confirmation of securities at December 31, 2009 by correspondence with the custodian and brokers, provide a reasonable basis for our opinion.
Prior to January 1, 2007, the financial highlights for each of the periods presented through December 31, 2006 were audited by another independent registered public accounting firm whose report dated February 12, 2007 expressed an unqualified opinion on those financial highlights.
PricewaterhouseCoopers LLP
San Francisco, CA
February 23, 2010
94 MATTHEWS ASIA FUNDS
Tax Information (Unaudited)
For shareholders who do not have a December 31, 2009 tax year-end, this notice is for informational purposes.
For the period January 1, 2009 to December 31, 2009, the Funds designate the following items with regard to distributions paid during the period. All designations are based on financial information available as of the date of this annual report and, accordingly, are subject to change. For each item, it is the intention of each Fund to designate the maximum amount permitted under the Internal Revenue Code and the regulations thereunder.
1. Qualified Dividend Income
The Funds designate a portion of the ordinary income distributed during the year ended December 31, 2009 as Qualified Dividend Income ("QDI") as defined in the Internal Revenue code as follows:
| QDI Portion | |||||||
| Matthews Asian Growth and Income Fund | 28.84 | % | |||||
| Matthews Asia Dividend Fund | 44.50 | % | |||||
| Matthews Asia Pacific Fund | 97.71 | % | |||||
| Matthews Pacific Tiger Fund | 68.00 | % | |||||
| Matthews China Fund | 99.69 | % | |||||
| Matthews India Fund | 55.12 | % | |||||
| Matthews Japan Fund | 80.28 | % | |||||
| Matthews Asia Small Companies Fund | 12.12 | % | |||||
2. Long-Term Capital Gain Distributions
The Funds designate Long-Term Capital Gain distributions pursuant to Section 852(b)(3) of the Internal Revenue Code for the year ended December 31, 2009 as follows:
| Long-Term Capital Gains | |||||||
| Matthews India Fund | $ | 5,361,101 | |||||
| Matthews Korea Fund | 5,234,879 | ||||||
| Matthews Asia Small Companies Fund | 1,079 | ||||||
3. Foreign Taxes Paid
The Funds have elected to pass through to their shareholders the foreign taxes paid for year ended December 31, 2009 as follows:
| Foreign Source Income | Foreign Taxes Paid | ||||||||||
| Matthews Asian Growth and Income Fund | $ | 82,970,816 | $ | 3,631,161 | |||||||
| Matthews Asia Dividend Fund | 8,756,493 | 791,817 | |||||||||
| Matthews Asia Pacific Fund | 3,382,112 | 229,569 | |||||||||
| Matthews Pacific Tiger Fund | 37,890,873 | 3,535,295 | |||||||||
| Matthews China Fund | 26,372,417 | 58,644 | |||||||||
| Matthews India Fund | 9,389,302 | 6,778 | |||||||||
| Matthews Japan Fund | 2,630,128 | 184,161 | |||||||||
| Matthews Asia Small Companies Fund | 800,819 | 122,074 | |||||||||
matthewsasia.com | 800.789.ASIA 95
Approval of Investment Advisory Agreement (Unaudited)
The Funds, which are series of the Trust, have retained Matthews International Capital Management, LLC (the "Advisor") to manage their assets pursuant to the Advisory Agreement, which has been approved by the Board of Trustees of the Funds, including the Independent Trustees. Following an initial term of two years, the Advisory Agreement continues in effect from year to year provided such continuance is specifically approved at least annually by the vote of the holders of at least a majority of the outstanding shares of the Funds, or by the Board of Trustees, and, in either event, by a majority of the Independent Trustees of the Trust casting votes in person at a meeting called for such purpose.
At a meeting held on August 27, 2009, the Board, including the Independent Trustees of the Trust, approved the continuance of the Advisory Agreement, with respect to each Fund, for an additional one-year period ending August 31, 2010. At a meeting held on November 20, 2009, the Board, including the Independent Trustees of the Trust, approved the Advisory Agreement with respect to the China Dividend Fund, for an initial two-year period from the commencement of that Fund's operations.
Before those meetings, the Independent Trustees had requested detailed information from the Advisor about the matters to be considered. This information, together with the information provided to the Independent Trustees throughout the course of year, formed the primary (but not exclusive) basis for the Board's determinations as summarized below. The Independent Trustees reviewed and discussed the extensive information provided by the Advisor at separate executive sessions held on August 19 and 27, 2009, and again on November 20, 2009 with respect to the new China Dividend Fund. The Independent Trustees were assisted in their deliberations by their independent legal counsel. Below is a summary of the factors considered by the Board in approving the Advisory Agreement with respect to each Fund.
 The nature, extent and quality of the services provided by the Advisor under the Advisory Agreement. The Trustees considered the experience and qualifications of the personnel at the Advisor who are responsible for providing services to the Funds and who are responsible for the daily management of the Funds' investment objectives. They also reviewed significant recent changes to the Advisor's portfolio management personnel and their responsibilities, reflecting a long-term vision for the Advisor's business and for the Funds. In particular, the Trustees noted there were no cuts to the portfolio management teams, and the addition of a trading desk professional. The Trustees viewed the Advisor as having been successful in continuing to provide high-quality services to the Funds while weathering very challenging securities markets as well as asset and revenue contractions. The Trustees attributed much of that success to the Advisor's emphasis of preserving and enhancing portfolio management team resources, careful business planning and management, as well as its solid financial condition and strong cash reserves. As in past years, the Trustees considered the Advisor's succession planning to address situations where key personnel become unavailable, and the design and implementation of the Advisor's disaster recovery and business continuity plan. The Trustees also considered the Chief Compliance Officer's report regarding the compliance resources, initiatives, programs and structures of the Advisor, including the compliance record of the Advisor and the Advisor's supervision of the Funds' service providers. The Trustees concluded that the Advisor has high-quality compliance and a culture of compliance. The Trustees further noted in this regard that, despite the Advisor's decline in profitability, there had been no noteworthy cuts to the compliance personne l or resources supporting the Funds, further evidencing the Advisor's commitment to compliance. The Trustees recognized the extent of the Advisor's ongoing commitment to marketing and distribution, particularly new branding and marketing initiatives, enhancement to client retention efforts, as well as resources devoted to investor education publications and website design and function. Other initiatives observed by the Trustees included significant efforts related to relationships with broker-dealers, independent advisors, and other financial institutions. The Trustees concluded that the Advisor had the quality and depth of personnel and investment methods essential to performing its duties under the Advisory Agreement, and that the nature, overall quality, cost and extent of such management services are satisfactory and reliable.
 The investment performance of the Advisor. The Trustees reviewed the short-term and long-term performance of each Fund on both an absolute basis and in comparison to peer funds and benchmark indices. The Trustees emphasized longer-term performance, which they believe is more important to evaluate the Advisor's success in meeting shareholder objectives than short isolated periods. They also noted largely favorable recent relative performance trends. To the extent of any concerns about performance with respect to any particular period for a Fund, the Trustees noted that the Advisor had articulated and taken credible plans to address performance and explained its reasons for maintaining a consistent investment philosophy. The Trustees also reviewed both the Lipper peer comparison measures and Morningstar ratings for each of the Funds for various perio ds ending June 30, 2009. With respect to the China Dividend Fund, the
96 MATTHEWS ASIA FUNDS
Approval of Investment Advisory Agreement (Unaudited) (continued)
Trustees considered the Advisor's performance for the other Funds and in the dividend-and China-specific strategies.
For Matthews Asian Growth and Income Fund, the Trustees noted that the Fund is the top-performing fund for the ten-year and since-inception periods in its Lipper peer group, but underperformed with respect to the three-year and five-year periods with a ranking below the peer group average (while still producing positive performance). Relative performance for the one-year period was above median.
For Matthews Asia Dividend Fund, the Trustees noted that the Fund had outperformed its peer group during the one-year and since inception periods, again ranking in the top quintile for those periods.
For Matthews Asia Pacific Fund, the Trustees noted that the Fund's performance compared more favorably against its peers for the one-year, three-year, five-year and since-inception periods than it had last year. The Fund ranked in the top quintile for those periods in its Pacific region peer group.
For Matthews Pacific Tiger Fund, the Trustees noted that the Fund's performance was favorable in the one-year, three-year, five-year, ten-year and since-inception periods, ranking in the first or second quintiles for those periods against the Lipper peer group.
For Matthews China Fund, the Trustees noted that the Fund had outperformed the median of its peer funds over the one-year, three-year, five-year, ten-year and since-inception periods, ranking in the top quintile for most of those periods. The Trustees also noted the Fund's positive absolute performance over those periods other than the most recent one-year period.
For Matthews India Fund, the Trustees noted that the Fund had outperformed its peer funds over the one-year, three-year and since inception periods, ranking in the first quintile. The Trustees also noted that most of the Fund's peers do not focus on India, but instead invest more generally across emerging markets.
For Matthews Japan Fund, the Trustees noted that the Fund's performance was more favorable than the median return of its peer funds over the one-year, three-year and since-inception periods, but had substantially lagged its peer funds for the five-year and ten-year periods. The Trustees noted that the underperformance concerns had been addressed to the Trustees' satisfaction by the Advisor and the more-recent performance trends showed preliminary signs that actions taken by the Advisor had the potential to be effective.
For Matthews Korea Fund, the Trustees noted that the Fund had underperformed its peer group over the one-year, three-year, five-year, ten-year and since inception periods, but that the Fund was the best performing fund in its broader peer group for the ten-year period. The Trustees noted that the broader Lipper peer group consists of Pacific-oriented funds excluding Japan, which is too broad to be a useful peer group. A more limited peer group of funds with 50% or more of their assets in Korea shows the Fund ranked favorably above the average for those time periods.
For Matthews Asia Small Companies Fund, the Trustees noted that the Fund had exceeded the average performance of its peer group for the very short period since inception, which was not yet a full year.
For Matthews Asian Technology Fund, the Trustees noted that the Fund's performance was much more favorable than the median return of its peer funds over the five-year and since-inception periods (ranking first), but less favorable than the average return of its peer funds over the one-year and three-year periods and that absolute performance was negative like its peers. The Trustees also observed that the funds in the peer group invested globally, rather than being limited to Asia as the Fund's investment strategy is.
The Trustees noted of the difficulty of fairly benchmarking certain of the Funds in terms of performance and noted that they were of the view that more weight should be given to the Advisor's analysis of relative performance and comparability of the peer groups than to standard data provided by Lipper, Inc. and Morningstar, Inc. The Trustees also gave more weight to each Fund's longer-term investment performance given the long-term investment philosophy of each Fund. On that basis, the Trustees concluded that they were satisfied with the Funds' overall performance records. The Trustees also reviewed the Advisor's trading policies and efforts to obtain best overall execution for the Funds in the various markets in which the Funds trade securities. The Trustees noted the relatively low turnover rates in the various Funds and the Advisor's consistent adherence to its long-standing investment approach, which emphasizes fundamental b ottom-up driven investment selection.
 The extent to which the Advisor realizes economies of scale as the Funds grow larger and whether fee levels reflect these economies of scale for the benefit of Fund investors. The Trustees discussed the Advisor's ongoing investment in its business and personnel, which is an acceptable way of realizing economies of scale. The Trustees considered the personnel, technology and other infrastructure investments by the Advisor that could be
matthewsasia.com | 800.789.ASIA 97
Approval of Investment Advisory Agreement (Unaudited) (continued)
expected to benefit shareholders. The Trustees also recognize that, earlier in the year, the Funds' economies of scale had diminished as total assets declined, but that market conditions and asset growth improved later in the year, which was consistent with industry-wide trends. The Trustees concluded that the current fee structure enhances the ability of the Funds and their shareholders to benefit from past and future potential economies of scale, and continues to be appropriate given the size and objectives of the Funds. The Trustees noted that the China Dividend Fund would benefit from the scale of most of the other Funds because of the combined advisory fee structure.
 The costs of the services provided by the Advisor and others. The Trustees considered the advisory fees and total fees and expenses of each Fund in comparison to the advisory fees and other fees and expenses of other funds in each Fund's relevant peer group. The Trustees considered both the gross advisory fee rates charged by the Advisor, as well as the effective advisory fee rates after taking into consideration the expense limitation arrangements and voluntary fee waivers. The Trustees found that the contractual advisory rates (excluding administrative services) for the Funds were very competitive and generally lower than the relevant peer group averages. Also, the total expense ratios paid by investors in the Funds, which are most representative of an investor's net experience, were also very competitive, with all but the newest (Small Companies ) Fund ranking below the peer group averages. The Trustees noted that the fees and expenses for the China Dividend Fund were expected to be competitive and reasonable although there were no sufficiently specific fund peer groups to determine a more-precise ranking.
For each of Matthews Asia Dividend Fund, Matthews China Fund, Matthews Japan Fund, Matthews Korea Fund and Matthews Asian Technology Fund, the Trustees noted that the gross advisory fee rates, the gross management fee (including administration) rates, the total expense ratio, the effective advisory fee rates and the actual nonmanagement fee rates (which include transfer agent and custodian fees) are all lower than most of the funds in each Fund's peer group. In the case of the Matthews Asian Technology Fund, the total expenses are slightly higher than the comparable fee ratios of median funds (excluding Rule 12b-1 fees and non-Rule 12b-1 servicing fees) in this peer group.
For Matthews Pacific Tiger Fund, the Trustees noted that the gross advisory fee rates, the total expense ratio, the effective advisory fee rates and the actual nonmanagement expense rates (which include transfer agent and custodian fees) are lower than most of the funds in that Fund's peer group while the gross management fee (including administration) rates are slightly higher than the average of the Fund's peer group.
For Matthews Asian Growth and Income Fund, the Trustees noted that the gross advisory fee rates, the total expense ratio and the effective advisory fee rates are lower than most of the funds in that Fund's peer group while the gross management fee (including administration) rates and the actual nonmanagement fee rates (which include transfer agent and custodian fees) are very slightly higher than the median of the Fund's peer group.
For Matthews Asia Pacific Fund, the Trustees noted that the gross advisory fee rates, the gross management fee (including administration) rates, the total expense ratio, the effective advisory fee rates and the actual nonmanagement expense rates (which include transfer agent and custodian fees) are all lower than most of the funds in that Fund's peer group.
For Matthews India Fund, the Trustees noted that the gross advisory fee rates, the gross management fee (including administration) rates, the total expense ratio and the effective advisory fee rates are all lower than most of the funds in that Fund's peer group while the actual nonmanagement fee rates (which include transfer agent and custodian fees) are slightly less than the average of the Fund's peer group.
For Matthews Asian Small Companies Fund, the Trustees noted that the gross advisory fee rate is lower than the peer group funds, but that the Fund's small size (in light of its relatively recent inception) has resulted in total expense ratio and actual nonmanagement fee rates (which include transfer agent and custodian fees) well above the median of the Fund's peer group. The Trustees expect that the Fund's comparative position should improve as the Fund grows.
The Trustees also compared the Advisor's advisory fees with those of the Advisor's separate accounts and other investment products, noting that the Funds' advisory expenses were not disadvantageous (being equal to the separate accounts). Total expenses appeared to be appropriate in comparison and taking into account the service differences between these products and the Funds, including the differences in the frequency of net asset value calculations. The Trustees considered various specific Fund expenses, including the custody fees and transfer agent fees. The Trustees noted the Advisor's efforts in early 2008 had resulted in, for each of the Funds, (a) reduced expenses under the administration and shareholders services plan, (b) reduced custodian expenses, and (c) reduced transfer agency fees. The Trustees also observed the generally lower commission
98 MATTHEWS ASIA FUNDS
Approval of Investment Advisory Agreement (Unaudited) (continued)
rates enjoyed by the Funds. The Trustees concluded that the Advisor's advisory fee ratio and the Funds' expense ratios are reasonable in light of comparative performance and expense and advisory fee information for each of the Funds.
 The profits to be realized by the Advisor and its affiliates from the relationships with the Funds. The Trustees reviewed the profitability of the Advisor on both an absolute basis and in comparison to other investment advisers. The Trustees noted that the Advisor's pretax profit margin appeared to be reasonable in relation to other advisers. The Trustees also noted that the Advisor appeared to be sufficiently profitable to operate as a viable investment management firm, able to honor its obligations as a sponsor of the Funds, including the Funds that did not generate a profit for the Advisor, without earning excessive profits from any particular Fund or from the overall relationship with the Funds. The Trustees noted that, with more recent declines in asset levels, declines in profitability could be expected, but also noted the continued expenditu res on information technology and personnel. The Trustees further noted that the Advisor's continued upgrading of its trading, research, compliance, disaster recovery and other technological systems should increase the Advisor's capacity, speed and reliability in providing services to the Funds, which further support the long-term viability of the Funds and the Advisor. The Trustees also considered that the additional benefits derived by the Advisor from its relationship with the Funds are limited solely to research and execution benefits received in exchange for "soft dollars." After such review, the Trustees determined that the profitability rate to the Advisor with respect to the Advisory Agreement is fair and reasonable in consideration of the services it provides to the Funds.
No single factor was determinative of the Board's decision to approve the Advisory Agreement, but rather the Trustees based their determination on the total mix of information available to them. After considering the factors described above, the Board concluded that the terms of the advisory arrangements are fair and reasonable to each Fund in light of the services that the Advisor provides, its costs and reasonably foreseeable Fund asset levels, and that each Fund's shareholders received and would receive reasonable value in return for the advisory fees paid. The Board agreed that the continuance of the Advisory Agreement with respect to each Fund would be in the best interests of the Funds and their shareholders. The Independent Trustees concluded separately that continuance of the Advisory Agreement was supported by reasonable and impartial records and information, including the performance of the Funds in relation to their p eer groups, the services provided by the Advisor, and the competitive expense structure, and that the continuance of the Advisory Agreement with respect to each Fund would be in the best interests of each Fund and its shareholders.
The Advisory Agreement may be terminated by the Trustees on behalf of the Funds, or by the Advisor upon 60 days' prior written notice without penalty. The Advisory Agreement will also terminate automatically in the event of its assignment, as defined in the 1940 Act.
matthewsasia.com | 800.789.ASIA 99
Trustees and Officers of the Funds (Unaudited)
The operations of each Fund are under the direction of the Board of Trustees. The Board of Trustees establishes each Fund's policies and oversees and reviews the management of each Fund. The Board meets regularly to review the activities of the officers, who are responsible for the day-to-day operations of the Funds. The Statement of Additional Information, which includes additional information about Fund Trustees, is available without charge by calling 800.789.2742 or by visiting the Funds' website, matthewsasia.com. The Trustees and executive officers of the Funds, their year of birth, business address and principal occupations during the past five years are set forth below:
| Name, Year of Birth, Address and Position(s) Held with Trust | Term of Office and Length of Time Served1 | Principal Occupation(s) During Past 5 Years | Number of Portfolios in Fund Complex Overseen by Trustee | Other Trusteeships/Directorships (number of portfolios) Held by Trustee | |||||||||||||||
| INDEPENDENT TRUSTEES | |||||||||||||||||||
| GEOFFREY H. BOBROFF Born 1944 Four Embarcadero Center Suite 550 San Francisco, CA 94111 Chairman of the Board of Trustees and Trustee | Since 2006 | President, Bobroff Consulting, Inc. (since 1993). | 11 | None | |||||||||||||||
| TOSHI SHIBANO Born 1950 Four Embarcadero Center Suite 550 San Francisco, CA 94111 Trustee | Since 2003 | President, Strategic Financial Literacy, Inc. (since 1995); Adjunct Professor, Columbia Graduate School of Business (since 2001); Associate Professor, Thunderbird American Graduate School of International Management (2000–2004); Faculty, General Electric Corporate Leadership Development Center (since 2000); Executive Education Lecturer, Haas School of Business, UC Berkeley (since 1995). | 11 | None | |||||||||||||||
| RHODA ROSSMAN Born 1958 Four Embarcadero Center Suite 550 San Francisco, CA 94111 Trustee | Since 2006 | Vice President, Corporate Investment Officer (2007–2010); and Senior Vice President and Treasurer (2003–2007), The PMI Group, Inc. | 11 | None | |||||||||||||||
| JONATHAN F. ZESCHIN Born 1953 Four Embarcadero Center Suite 550 San Francisco, CA 94111 Trustee | Since 2007 | Partner, Essential Investment Partners, LLC (since 2009); President, Essential Advisers Inc. (since 2000); Managing Partner, JZ Partners LLC (since 1998). | 11 | Independent Chairman of the Board of Trustees, DCA Total Return Fund (since 2005) (1 Portfolio) and DCW Total Return Fund (since 2007) (1 Portfolio); Independent Trustee, ICON Funds (2002–2007) (17 Portfolios); Independent Director, Wasatch Funds (2002–2004) (10 Portfolios). | |||||||||||||||
| RICHARD K. LYONS Born 1961 Four Embarcadero Center Suite 550 San Francisco, CA 94111 Trustee | Since 2010 | Dean (since 2008), Haas School of Business, UC Berkeley; Chief Learning Officer (2006–2008), Goldman Sachs; Executive Associate Dean (2005–2006), Acting Dean (2004–2005), Professor (2000–2004), Associate Professor (1996–2000), Assistant Professor (1993–1996), Haas School of Business, UC Berkeley. | 11 | Director (2000–2006), iShares Fund Complex, consisting of iShares, Inc. (24 Portfolios) and iShares Trust (over 70 Portfolios) managed by Barclays Global Investors; Trustee (2001–2006), Barclays Global Investor Fund Complex, consisting of Barclays Global Investor Funds and Barclays Master Investment Portfolios (15 Portfolios); Independent Trustee, Matthews Asia Funds (1994–2006) (9 Portfolios). | |||||||||||||||
100 MATTHEWS ASIA FUNDS
| Name, Year of Birth, Address and Position(s) Held with Trust | Term of Office and Length of Time Served1 | Principal Occupation(s) During Past 5 Years | Number of Portfolios in Fund Complex Overseen by Trustee | Other Trusteeships/Directorships (number of portfolios) Held by Trustee | |||||||||||||||
| INTERESTED TRUSTEES2 | |||||||||||||||||||
| G. PAUL MATTHEWS Born 1956 Four Embarcadero Center Suite 550 San Francisco, CA 94111 Trustee | Since 2007 | Director and Portfolio Manager (Since 2009), Chairman and Portfolio Manager (1991–2009), Chief Investment Officer (1991–2007), Matthews International Capital Management, LLC; President of the Funds (1994–2007). | 11 | Director, Matthews Asian Selections Funds Plc (1 Portfolio). | |||||||||||||||
| Name, Year of Birth, Address and Position(s) Held with Trust | Term of Office and Length of Time Served1 | Principal Occupation(s) During Past 5 Years | Other Trusteeships/ Directorships (number of portfolios) Held by Officer | ||||||||||||
| OFFICERS WHO ARE NOT TRUSTEES | |||||||||||||||
| WILLIAM J. HACKETT Born 1967 Four Embarcadero Center Suite 550 San Francisco, CA 94111 President | Since 2008 | Chief Executive Officer (since 2009), President and Secretary (since 2007), Matthews International Capital Management, LLC; Partner (2002–2007), Deloitte & Touche, LLP. | Director, Matthews Asian Selections Funds Plc (1 Portfolio); Director, Matthews Asia Funds S.I.C.A.V. (1 Portfolio). | ||||||||||||
| ROBERT J. HORROCKS, PHD Born 1968 Four Embarcadero Center Suite 550 San Francisco, CA 94111 Vice President | Since 2009 | Chief Investment Officer (Since 2009), Director of Research (2008–2009), Matthews Matthews International Capital Management, LLC; Head of Research, Mirae Asset Management (2006–2008); Chief Investment Officer, Everbright Pramerica (2003–2006). | None | ||||||||||||
| JOHN P. McGOWAN Born 1964 Four Embarcadero Center Suite 550 San Francisco, CA 94111 Vice President and Secretary | Since 2005 | Senior Vice President of Business Administration (since 2009), Chief Administrative Officer (2007–2008), Chief Operating Officer (2004–2007), Matthews International Capital Management, LLC; Chief Operating Officer, Treasurer and Chief Compliance Officer, Forward Management LLC (1998–2004). | Director, Matthews Asian Selections Funds Plc (1 Portfolio); Director, Matthews Asia Funds S.I.C.A.V. (1 Portfolio). | ||||||||||||
| SHAI A. MALKA Born 1973 Four Embarcadero Center Suite 550 San Francisco, CA 94111 Treasurer | Since 2005 | Vice President of Fund Accounting and Operations (since 2010), Senior Manager of Fund Accounting and Operations (2004–2009), Matthews International Capital Management, LLC. | None | ||||||||||||
| TIMOTHY B. PARKER Born 1958 Four Embarcadero Center Suite 550 San Francisco, CA 94111 Vice President | Since 2008 | General Counsel (since 2005), Matthews International Capital Management, LLC; Partner, Kirkpatrick & Lockhart Nicholson Graham LLP (2003–2005); Global Head of Compliance and Risk Management, Allianz Dresdner Asset Management (2001–2003); Managing director, RCM Global Investors (1993–2001). | Director, Matthews Asia Funds S.I.C.A.V. (1 Portfolio). | ||||||||||||
| MANOJ K. POMBRA Born 1964 Four Embarcadero Center Suite 550 San Francisco, CA 94111 Chief Compliance Officer | Since 2005 | Chief Compliance Officer, Matthews International Capital Management, LLC (since 2005); Senior Manager, Mutual Fund Compliance/Manager Portfolio Compliance, Franklin Templeton Investments (2001–2005). | None | ||||||||||||
1 Each trustee serves for an indefinite term, until retirement age or until his/her successor is elected. Officers serve at the pleasure of the Board of Trustees.
2 This trustee is considered an "interested person" of the Trust as defined under the 1940 Act because of an ownership interest in the Advisor and an office held with the Advisor.
matthewsasia.com | 800.789.ASIA 101
Matthews Asia Funds
INVESTMENT ADVISOR
Matthews International Capital Management, LLC
Four Embarcadero Center, Suite 550
San Francisco, CA 94111
800-789-ASIA
CUSTODIAN
Brown Brothers Harriman & Co.
40 Water Street
Boston, MA 02109
ACCOUNT SERVICES
PNC Global Investment Servicing (U.S.) Inc.
P.O. Box 9791
Providence, RI 02940
800-789-ASIA
LEGAL COUNSEL
Paul, Hastings, Janofsky & Walker LLP
55 Second Street, 24th Floor
San Francisco, CA 94105

P.O. Box 9791 | Providence, RI 02940 | matthewsasia.com | 800.789.ASIA (2742)
©2010 Matthews International Capital Management, LLC AR-1209-275M
Item 2. Code of Ethics.
(a) The registrant, as of the end of the period covered by this report, has adopted a code of ethics that applies to the registrant’s principal executive officer, principal financial officer, principal accounting officer or controller, or persons performing similar functions, regardless of whether these individuals are employed by the registrant or a third party.
(c) There have been no amendments, during the period covered by this report, to a provision of the code of ethics that applies to the registrant’s principal executive officer, principal financial officer, principal accounting officer or controller, or persons performing similar functions, regardless of whether these individuals are employed by the registrant or a third party, and that relates to any element of the code of ethics description.
(d) The registrant has not granted any waivers, including an implicit waiver, from a provision of the code of ethics that applies to the registrant’s principal executive officer, principal financial officer, principal accounting officer or controller, or persons performing similar functions, regardless of whether these individuals are employed by the registrant or a third party, that relates to one or more of the items set forth in paragraph (b) of this item’s instructions.
Item 3. Audit Committee Financial Expert.
(a) As of the end of the period covered by the report, the registrant’s board of directors has determined that the registrant has two audit committee financial experts serving on its audit committee, Toshi Shibano and Jonathan F. Zeschin, and that both are “independent.”
(b) Prof. Shibano is an Adjunct Professor at the Columbia Graduate School of Business and a member of the Faculty of the General Electric Corporate Leadership Development Center. He also serves as Executive Education Lecturer at the Haas School of Business at the University of California, Berkeley, and has served on the faculties of Thunderbird American Graduate School of International Management, Stanford Graduate School of Business, the University of Chicago School of Business and the Australian Graduate School of Management at the University of New South Wales. He regularly reviews current research in accounting both for use in instruction of courses and for internal faculty evaluation. He has experience analyzing and evaluating financial statements at the appropriate level of complexity through his professional activities on the educational faculties referenced above.
Prof. Shibano also has extensive experience in executive education worldwide (Hong Kong, Taiwan, Singapore, Finland, Italy, Mexico, India) and has developed innovative new
programs in financial analysis, management control systems and strategy implementation. Prof. Shibano has published in the Journal of Accounting Research, the Journal of Accounting and Economics, the Rand Journal of Economics, and the Journal of Applied Corporate Finance, on the topics of strategic audit risk, accounting standard setting, international accounting standards, tax minimization, foreign currency risk management, and organizational structure. Prof. Shibano received his MBA from the Haas School at UC Berkeley and earned his PhD at the Stanford Graduate School of Business, earning the highest academic honors in both programs. Prof. Shibano has gained additional accounting expertise as the Audit Committee Chair of Matthews Asian Funds.
Mr. Zeschin is Partner of Essential Investment Partners, LLC, a wealth management and investment advisory firm. He is also the portfolio manager for that firm’s Essential Growth Portfolio. Essential Investment Partners, LLC succeeded to the business of Essential Advisers, Inc. He is Managing Partner of JZ Partners, LLC, a business consulting firm for investment managers. Prior to forming Essential Advisers, Inc., Mr. Zeschin held senior executive positions with Founders Asset Management, Inc., Invesco Fund Group, and Stein Roe & Farnham, Inc. Mr. Zeschin holds a Masters of Management from the Kellogg School at Northwestern University, with majors in Finance and Marketing, and a Bachelor in Business Administration in Accounting with distinction from the University of Michigan. He holds a Certified Public Accountant certificate from the state of Illinois and is a Certified Financial Planner certificant. Mr. Zeschin is a former chair of the ICI’s Accounting Treasurer’s Committee and a former member of the AICPA Investment Companies committee. Mr. Zeschin is currently the chairman of the Board of Trustees to two NYSE listed closed-end funds. He has served on the audit committees of mutual fund boards since 2002. He has experience analyzing and evaluating financial statements at the appropriate level of complexity through his professional activities on the educational faculties referenced above. Mr. Zeschin has gained additional expertise as a member of the Audit Committee of Matthews Asian Funds.
Item 4. Principal Accountant Fees and Services.
Audit Fees
(a) The aggregate fees billed for each of the last two fiscal years for professional services rendered by the principal accountant for the audit of the registrant’s annual financial statements or services that are normally provided by the accountant in connection with statutory and regulatory filings or engagements for those fiscal years are $ 261,300 in 2008 and $280,800 in 2009.
Audit-Related Fees
(b) The aggregate fees billed in each of the last two fiscal years for assurance and related services by the principal accountant that are reasonably related to the performance of the audit of the registrant’s financial statements and are not reported under paragraph (a) of this Item are $0 in 2008 and $0 in 2009.
Tax Fees
(c) The aggregate fees billed in each of the last two fiscal years for professional services rendered by the principal accountant for tax compliance, tax advice, and tax planning are $69,000 in 2008 and $69, 113 in 2009. Tax fees include services provided by PWC for tax return preparations.
All Other Fees
(d) The aggregate fees billed in each of the last two fiscal years for products and services provided by the principal accountant, other than the services reported in paragraphs (a) through (c) of this Item are $0 in 2008 and $0 in 2009.
(e)(1) Disclose the audit committee’s pre-approval policies and procedures described in paragraph (c)(7) of Rule 2-01 of Regulation S-X.
Pre-Approval of Auditor Services.
Pre-Approval Requirements. Before the Auditor is engaged by the Trust to render audit related or permissible non-audit services, either:
(i) The Audit Committee shall pre-approve all audit related services and permissible non-audit services (e.g., tax services) to be provided to the Trust; or
(ii) The Audit Committee shall establish policies and procedures governing the Auditor’s engagement. Any such policies and procedures must (1) be detailed as to the particular service and (2) not involve any delegation of the Audit Committee’s responsibilities to the Adviser. The Audit Committee may delegate to one or more of its members the authority to grant pre-approvals. The pre-approval policies and procedures shall include the requirement that the decisions of any member to whom authority is delegated under this Section 4(e) shall be presented to the full Audit Committee at its next scheduled meeting.
De Minimis Exceptions to Pre-Approval Requirements. Pre-approval for a service provided to the Trust other than audit, review or attest services is not required if: (1) the aggregate amount of all such non-audit services provided to the Trust constitutes not more than 5 percent of the total amount of revenues paid by the Trust to the Auditor during the fiscal year in which the non-audit services are provided; (2) such services were not recognized by the Trust at the time of the engagement to be non-audit services; and (3) such services are promptly brought to the attention of the Audit Committee and are approved by the Audit Committee or by one or more members of the Audit Committee to whom authority to grant such approvals has been delegated by the Audit Committee.
Pre-Approval of Non-Audit Services Provided to the Adviser and Certain Control Persons. With respect to services that have a direct impact on the operations or financial reporting of the Trust, the Audit Committee shall pre-approve all such non-audit services proposed to be provided by the Auditor to (i) the Adviser and (ii) any entity controlling, controlled by, or under common control with the Adviser that provides ongoing services to the Trust.
Application of De Minimis Exception: The de minimis exceptions set forth above under Section 4(e)(ii) apply to pre-approvals under this Section 4(e)(iii) as well, except that the “total amount of revenues” calculation for Section 4(e)(iii) services is based on the total
amount of revenues paid to the Auditor by the Trust and any other entity that has its services approved under this Section (i.e., the Adviser or any control person).
(e)(2) The percentage of services described in each of paragraphs (b) through (d) of this Item that were approved by the audit committee pursuant to paragraph (c)(7)(i)(C) of Rule 2-01 of Regulation S-X are as follows:
(b) N/A
(c) 100%
(d) N/A
(f) The percentage of hours expended on the principal accountant’s engagement to audit the registrant’s financial statements for the most recent fiscal year that were attributed to work performed by persons other than the principal accountant’s full-time, permanent employees was 0% percent.
(g) The aggregate non-audit fees billed by the registrant’s accountant for services rendered to the registrant, and rendered to the registrant’s investment adviser (not including any sub-adviser whose role is primarily portfolio management and is subcontracted with or overseen by another investment adviser), and any entity controlling, controlled by, or under common control with the adviser that provides ongoing services to the registrant for each of the last two fiscal years of the registrant was $91,300 for fiscal year ended December 31, 2008 and $96,663 for the fiscal year ended December��31, 2009.
(h) The registrant’s audit committee of the board of directors has considered whether the provision of non-audit services that were rendered to the registrant’s investment adviser (not including any sub-adviser whose role is primarily portfolio management and is subcontracted with or overseen by another investment adviser), and any entity controlling, controlled by, or under common control with the investment adviser that provides ongoing services to the registrant that were not pre-approved pursuant to paragraph (c)(7)(ii) of Rule 2-01 of Regulation S-X is compatible with maintaining the principal accountant’s independence.
Item 5. Audit Committee of Listed registrants.
Not applicable.
Item 6. Investments.
(a) Schedule of Investments in securities of unaffiliated issuers as of the close of the reporting period is included as part of the report to shareholders filed under Item 1 of this form.
(b) Not applicable.
Item 7. Disclosure of Proxy Voting Policies and Procedures for Closed-End Management Investment Companies.
Not applicable.
Item 8. Portfolio Managers of Closed-End Management Investment Companies.
Not applicable.
Item 9. Purchases of Equity Securities by Closed-End Management Investment Company and Affiliated Purchasers.
Not applicable.
Item 10. Submission of Matters to a Vote of Security Holders.
There have been no material changes to the procedures by which the shareholders may recommend nominees to the registrant’s board of directors, where those changes were implemented after the registrant last provided disclosure in response to the requirements of Item 407(c)(2)(iv) of Regulation S-K (17 CFR 229.407) (as required by Item 22(b)(15) of Schedule 14A (17 CFR 240.14a-101)), or this Item.
Item 11. Controls and Procedures.
(a) The registrant’s principal executive and principal financial officers, or persons performing similar functions, have concluded that the registrant’s disclosure controls and procedures (as defined in Rule 30a-3(c) under the Investment Company Act of 1940, as amended (the “1940 Act”) (17 CFR 270.30a-3(c))) are effective, as of a date within 90 days of the filing date of the report that includes the disclosure required by this paragraph, based on their evaluation of these controls and procedures required by Rule 30a-3(b) under the 1940 Act (17 CFR 270.30a-3(b)) and Rules 13a-15(b) or 15d-15(b) under the Securities Exchange Act of 1934, as amended (17 CFR 240.13a-15(b) or 240.15d-15(b)).
(b) There were no changes in the registrant’s internal control over financial reporting (as defined in Rule 30a-3(d) under the 1940 Act (17 CFR 270.30a-3(d)) that occurred during the registrant’s second fiscal quarter of the period covered by this report that has materially affected, or is reasonably likely to materially affect, the registrant’s internal control over financial reporting.
Item 12. Exhibits.
(a)(1) Code of ethics, or any amendment thereto, that is the subject of disclosure required by Item 2 is attached hereto.
(a)(2) Certifications pursuant to Rule 30a-2(a) under the 1940 Act and Section 302 of the Sarbanes-Oxley Act of 2002 are attached hereto.
(a)(3) Not applicable.
(b) Certifications pursuant to Rule 30a-2(b) under the 1940 Act and Section 906 of the Sarbanes-Oxley Act of 2002 are attached hereto.
SIGNATURES
Pursuant to the requirements of the Securities Exchange Act of 1934 and the Investment Company Act of 1940, the registrant has duly caused this report to be signed on its behalf by the undersigned, thereunto duly authorized.
(registrant) |
|
| Matthews International Funds |
| |
|
|
|
| ||
By (Signature and Title)* |
| /s/ William J. Hackett |
| ||
|
| William J. Hackett, President |
| ||
|
| (principal executive officer) |
| ||
|
|
|
| ||
Date | March 4, 2010 |
|
|
| |
Pursuant to the requirements of the Securities Exchange Act of 1934 and the Investment Company Act of 1940, this report has been signed below by the following persons on behalf of the registrant and in the capacities and on the dates indicated.
By (Signature and Title)* |
| /s/ William J. Hackett |
| |
|
| William J. Hackett, President |
| |
|
| (principal executive officer) |
| |
|
|
|
| |
Date | March 4, 2010 |
|
|
|
By (Signature and Title)* |
| /s/ Shai Malka |
| |
|
| Shai Malka, Treasurer |
| |
|
| (principal financial officer) |
| |
|
|
|
| |
Date | March 4, 2010 |
|
|
|
* Print the name and title of each signing officer under his or her signature.