UNITED STATES
SECURITIES AND EXCHANGE COMMISSION
Washington, D.C. 20549
FORM N-CSR
CERTIFIED SHAREHOLDER REPORT
OF
REGISTERED MANAGEMENT INVESTMENT COMPANIES
Investment Company Act file number: 811-07175
Name of Registrant: Vanguard Tax-Managed Funds
Address of Registrant:
P.O. Box 2600
Valley Forge, PA 19482
Name and address of agent for service:
Heidi Stam, Esquire
P.O. Box 876
Valley Forge, PA 19482
Registrant’s telephone number, including area code: (610) 669-1000
Date of fiscal year end: December 31
Date of reporting period: January 1, 2008– June 30, 2009
Item 1: Reports to Shareholders
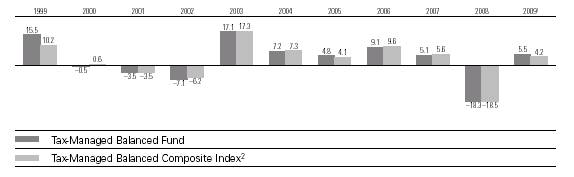
> For the six months ended June 30, 2009, the returns for the domestic Vanguard Tax-Managed Funds ranged from 0.72% for the Tax-Managed Small-Cap Fund (Investor Shares) to 5.54% for the Tax-Managed Balanced Fund.
> After suffering severe losses in the beginning of the period, stocks began to bounce back in mid-March, with a few sectors of the market posting gains for the six months.
> The biggest contributors to performance included holdings in the information technology, consumer discretionary, and materials sectors.
Contents |
|
|
|
Your Fund’s Total Returns | 1 |
President’s Letter | 2 |
Tax-Managed Balanced Fund | 7 |
Tax-Managed Growth and Income Fund | 29 |
Tax-Managed Capital Appreciation Fund | 46 |
Tax-Managed Small-Cap Fund | 64 |
About Your Fund’s Expenses | 81 |
Trustees Approve Advisory Arrangement | 83 |
Glossary | 84 |
Please note: The opinions expressed in this report are just that—informed opinions. They should not be considered promises or advice. Also, please keep in mind that the information and opinions cover the period through the date on the front of this report. Of course, the risks of investing in your fund are spelled out in the prospectus.
Your Fund’s Total Returns
Six Months Ended June 30, 2009 |
|
|
| Ticker | Total |
| Symbol | Returns |
Vanguard Tax-Managed Balanced Fund | VTMFX | 5.54% |
Tax-Managed Balanced Composite Index1 |
| 4.21 |
Average Mixed-Asset Target Moderate Fund2 |
| 6.53 |
|
|
|
|
|
|
Vanguard Tax-Managed Growth and Income Fund |
|
|
Investor Shares | VTGIX | 3.19% |
Admiral™ Shares3 | VTGLX | 3.23 |
Institutional Shares4 | VTMIX | 3.26 |
S&P 500 Index |
| 3.16 |
Average Large-Cap Core Fund2 |
| 4.83 |
|
|
|
|
|
|
Vanguard Tax-Managed Capital Appreciation Fund |
|
|
Investor Shares | VMCAX | 5.21% |
Admiral Shares3 | VTCLX | 5.24 |
Institutional Shares4 | VTCIX | 5.30 |
Russell 1000 Index |
| 4.32 |
Average Multi-Cap Core Fund2 |
| 7.28 |
|
|
|
|
|
|
Vanguard Tax-Managed Small-Cap Fund |
|
|
Investor Shares | VTMSX | 0.72% |
Institutional Shares4 | VTSIX | 0.78 |
S&P SmallCap 600 Index |
| 0.67 |
Average Small-Cap Core Fund2 |
| 6.29 |
1 50% Russell 1000 Index, 50% Barclays Capital 7 Year Municipal Bond Index.
2 Derived from data provided by Lipper Inc.
3 A lower-cost class of shares available to many longtime shareholders and to those with significant investments in the fund.
4 This class of shares also carries low expenses and is available for a minimum investment of $5 million.
1
President’s Letter

Dear Shareholder,
Each of Vanguard’s domestic Tax-Managed Funds posted positive returns for the first six months of 2009. Tax-Managed Growth and Income Fund and Tax-Managed Small-Cap Fund closely tracked their respective indexes. Meanwhile, Tax-Managed Balanced Fund and Tax-Managed Capital Appreciation Fund did a fair amount better than their benchmarks, a result of tax-management modifications to their index-based strategies.
Holdings in the information technology, consumer discretionary, and materials sectors helped boost the funds’ returns. Meanwhile, stocks in the industrial sector weighed heavily on performance. Returns for Tax-Managed Small-Cap Fund were hurt by the fund’s financial holdings.
Please note: We review the performance of Vanguard Tax-Managed International Fund in a separate report.
Stock gains petered out by the end of the period
For the six months ended June 30, the broad U.S. stock market returned 5%. The stock market began the period in negative territory, rallied through much of the spring, but then lost steam in June. While the second quarter was the strongest quarter for U.S. stocks since 2003, equity gains fizzled in mid-June as investors were taken
2
aback by a drop in consumer confidence, falling home prices, and a larger-than-expected rise in the unemployment rate.
International stocks registered a stronger showing, returning about 14% for the half-year. Emerging markets posted the best results as investors poured money into countries with robust growth prospects. Higher commodity prices and a slight rebound in manufacturing orders helped reverse steep declines in international stocks from earlier in the period.
Still, pockets of the developed and developing markets, particularly in Europe, continued to struggle amid the global recession. After three consecutive monthly gains, the MSCI All Country World Index ex USA declined slightly for June.
Bond investors grew confident, sought out higher yields
As the half-year began, investors panicked by the credit-market crisis sought shelter in U.S. Treasury bonds, considered the safest of all securities. The difference between the yields of Treasuries and those of corporate bonds surged to levels not seen since the 1930s.
By mid-March, investors had gained confidence from the federal government’s efforts to thaw the credit market and stimulate the economy. Bond investors were more optimistic and more willing to take on risk; they shifted their focus away from Treasuries to higher-yielding corporate bonds. For the six months, the Barclays Capital U.S. Aggregate Bond Index returned about 2%, while high-yield
Market Barometer |
|
|
|
|
|
| Total Returns |
|
| Periods Ended June 30, 2009 | |
| Six Months | One Year | Five Years1 |
Stocks |
|
|
|
Russell 1000 Index (Large-caps) | 4.32% | –26.69% | –1.85% |
Russell 2000 Index (Small-caps) | 2.64 | –25.01 | –1.71 |
Dow Jones U.S. Total Stock Market Index | 5.00 | –26.11 | –1.47 |
MSCI All Country World Index ex USA (International) | 14.35 | –30.54 | 4.95 |
|
|
|
|
|
|
|
|
Bonds |
|
|
|
Barclays Capital U.S. Aggregate Bond Index |
|
|
|
(Broad taxable market) | 1.90% | 6.05% | 5.01% |
Barclays Capital Municipal Bond Index | 6.43 | 3.77 | 4.14 |
Citigroup 3-Month Treasury Bill Index | 0.10 | 0.78 | 3.02 |
|
|
|
|
|
|
|
|
CPI |
|
|
|
Consumer Price Index | 2.60% | –1.43% | 2.60% |
1 Annualized.
3
bonds, as measured by the Barclays Capital U.S. Corporate High Yield Bond Index, returned about 30%.
Despite some murmurs in the market about longer-term inflation risks, the Federal Reserve in recent months unveiled plans to purchase Treasury and mortgage-backed securities. The Fed hoped to drive up the securities’ prices and push down yields, and thus keep borrowing costs, such as mortgage rates, low. Government initiatives also helped bring down municipal bond yields, which earlier in the period were higher than those of Treasuries, a reversal in the traditional relationship between taxable and tax-exempt yields. For the six months, the tax-exempt bond market returned more than 6%. The Fed kept the target for short-term interest rates at an all-time low of 0% to 0.25% throughout the period.
Expense Ratios1 |
|
Your Fund Compared With Its Peer Group |
|
| Expense |
Tax-Managed Fund | Ratio |
Balanced | 0.15% |
Average Mixed-Asset Target Moderate Fund | 0.94 |
|
|
|
|
Growth and Income |
|
Investor Shares | 0.21% |
Admiral Shares | 0.15 |
Institutional Shares | 0.09 |
Average Large-Cap Core Fund | 1.26 |
|
|
|
|
Capital Appreciation |
|
Investor Shares | 0.21% |
Admiral Shares | 0.15 |
Institutional Shares | 0.09 |
Average Multi-Cap Core Fund | 1.18 |
|
|
|
|
Small-Cap |
|
Investor Shares | 0.19% |
Institutional Shares | 0.09 |
Average Small-Cap Core Fund | 1.43 |
1 The fund expense ratios shown are from the prospectuses dated April 24, 2009, and represent estimated costs for the current fiscal year based on the funds’ net assets as of the prospectus date. For the six months ended June 30, 2009, the funds’ annualized expense ratios were: for the Tax-Managed Balanced Fund, 0.15%; for the Tax-Managed Growth and Income Fund, 0.21% for Investor Shares, 0.15% for Admiral Shares, and 0.09% for Institutional Shares; for the Tax-Managed Capital Appreciation Fund, 0.21% for Investor Shares, 0.15% for Admiral Shares, and 0.09% for Institutional Shares; for the Tax-Managed Small-Cap Fund, 0.19% for Investor Shares and 0.09% for Institutional Shares. The peer-group expense ratios are derived from data provided by Lipper Inc. and capture information through year-end 2008.
4
A few strong sectors led to positive results
The broad U.S. stock market was down significantly at the beginning of 2009. In mid-March, however, stocks began to rally and, by the end of the period, had crept into positive territory for the first half of 2009.
Holdings in the information technology sector helped boost returns in each of the Tax-Managed Funds. Blue chip computer and software companies staged a strong comeback over the last few months of the half-year, as corporations began spending on technology again after trimming their budgets in 2008 in response to the worldwide recession.
Consumer discretionary stocks were also up for the period, as consumers slowly resumed spending. The biggest contributors to performance included specialty retailers, internet and catalog companies, and media outlets. In the materials sector, chemicals as well as metals and mining companies also helped boost returns.
Stocks in the industrial sector weighed heavily on the returns of Tax-Managed Balanced Fund, Tax-Managed Capital Appreciation Fund, and Tax-Managed Growth and Income Fund. Holdings in the aerospace and defense industry, as well as poor results from a huge industrial conglomerate, took a toll on performance.
In Tax-Managed Small-Cap Fund, financial stocks had the greatest negative effect on returns. Small-cap financial companies underperformed their larger counterparts for the period, as investors preferred the bigger, better-known financial firms.
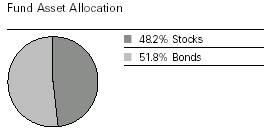
The bond portion of the Tax-Managed Balanced Fund, which accounted for a little more than 50% of the fund’s assets, on average, posted a strong six-month showing. The fund invests in municipal bonds to generate tax-exempt income. Barclay’s Capital Municipal Bond Index returned 6.43%—an impressive six-month return for municipal securities—and the fund captured much of that return.
A long-term strategy puts things in perspective
Over the past 18 months, investors’ resolve has been tested repeatedly. In 2008, the U.S. financial markets endured their worst calendar year since the 1930s. The first two months of 2009 brought more bad news and falling prices before stocks rebounded to turn in their best calendar quarter since 2003. Nobody knows where the stock market will go from here, particularly in the shorter term.
5
At Vanguard, we recommend that you maintain a long-term perspective. With low expense ratios, a proven tax-efficient strategy, and a record of closely tracking their benchmarks, the Vanguard Tax-Managed Funds can play a useful role in helping investors work toward their long-term financial goals.
Thank you for entrusting your assets to Vanguard.
Sincerely,

F. William McNabb III
President and Chief Executive Officer
July 22, 2009
Your Fund’s Performance at a Glance |
|
|
|
|
December 31, 2008–June 30, 2009 |
|
|
|
|
|
|
| Distributions Per Share | |
| Starting | Ending | Income | Capital |
Tax-Managed Fund | Share Price | Share Price | Dividends | Gains |
Balanced | $16.19 | $16.84 | $0.239 | $0.000 |
Growth and Income |
|
|
|
|
Investor Shares | $19.65 | $20.04 | $0.224 | $0.000 |
Admiral Shares | 40.39 | 41.19 | 0.475 | 0.000 |
Institutional Shares | 19.65 | 20.04 | 0.236 | 0.000 |
Capital Appreciation |
|
|
|
|
Investor Shares | $21.39 | $22.49 | $0.011 | $0.000 |
Admiral Shares | 43.04 | 45.27 | 0.021 | 0.000 |
Institutional Shares | 21.38 | 22.50 | 0.010 | 0.000 |
Small-Cap |
|
|
|
|
Investor Shares | $17.44 | $17.56 | $0.004 | $0.000 |
Institutional Shares | 17.47 | 17.60 | 0.005 | 0.000 |
6
Tax-Managed Balanced Fund
Fund Profile
As of June 30, 2009
Total Fund Characteristics |
|
|
|
Yield1 | 2.6% |
Turnover Rate2 | 20% |
Expense Ratio3 | 0.15% |
Short-Term Reserves | 0.0% |
Equity Characteristics |
|
|
|
|
| Comparative | Broad |
| Fund | Index4 | Index5 |
Number of Stocks | 581 | 970 | 4,399 |
Median Market Cap | $26.4B | $29.7B | $24.2B |
Price/Earnings Ratio | 17.7x | 17.6x | 18.6x |
Price/Book Ratio | 2.0x | 2.0x | 1.9x |
Dividend Yield | 1.9% | 2.3% | 2.2% |
Return on Equity | 20.6% | 20.5% | 19.7% |
Earnings Growth Rate | 15.3% | 14.1% | 13.5% |
Foreign Holdings | 0.0% | 0.0% | 0.0% |
Sector Diversification (% of equity exposure) | |||
|
| Comparative | Broad |
| Fund | Index4 | Index5 |
Consumer Discretionary | 9.8% | 9.7% | 9.7% |
Consumer Staples | 11.3 | 11.2 | 10.4 |
Energy | 11.8 | 11.8 | 11.8 |
Financials | 13.3 | 13.7 | 15.0 |
Health Care | 13.7 | 13.7 | 13.6 |
Industrials | 10.1 | 10.0 | 10.3 |
Information Technology | 18.6 | 18.4 | 18.2 |
Materials | 3.8 | 3.8 | 3.6 |
Telecommunication |
|
|
|
Services | 3.4 | 3.4 | 3.2 |
Utilities | 4.2 | 4.3 | 4.2 |
Total Fund Volatility Measures6 |
| |
| Fund Versus | Fund Versus |
| Composite Index7 | Broad Index5 |
R-Squared | 0.99 | 0.92 |
Beta | 0.97 | 0.49 |
Ten Largest Stocks8 (% of equity portfolio) | ||
|
|
|
ExxonMobil Corp. | integrated oil |
|
| and gas | 3.8% |
Microsoft Corp. | systems software | 2.1 |
The Procter & Gamble Co. | household products | 1.7 |
Johnson & Johnson | pharmaceuticals | 1.7 |
International Business |
|
|
Machines Corp. | computer hardware | 1.5 |
JPMorgan Chase & Co. | diversified financial |
|
| services | 1.5 |
AT&T Inc. | integrated |
|
| telecommunication |
|
| services | 1.5 |
Apple Inc. | computer hardware | 1.5 |
Chevron Corp. | integrated oil |
|
| and gas | 1.4 |
Cisco Systems, Inc. | communications |
|
| equipment | 1.3 |
Top Ten |
| 18.0% |
Top Ten as % of Total Net Assets | 8.5% | |
Fund Asset Allocation
1 30-day SEC yield. See the Glossary.
2 Annualized.
3 The expense ratio shown is from the prospectus dated April 24, 2009, and represents estimated costs for the current fiscal year based on the fund’s net assets as of the prospectus date. For the six months ended June 30, 2009, the annualized expense ratio was 0.15%.
4 Russell 1000 Index.
5 Dow Jones U.S. Total Stock Market Index.
6 For an explanation of R-squared, beta, and other terms used here, see the Glossary.
7 50% Russell 1000 Index, 50% Barclays Capital 7 Year Municipal Bond Index.
8 The holdings listed exclude any temporary cash investments and equity index products.
7
Tax-Managed Balanced Fund
Fixed Income Characteristics |
|
| |
|
| Comparative | Broad |
| Fund | Index1 | Index2 |
Number of Bonds | 179 | 4,315 | 45,745 |
Yield to Maturity | 3.6%3 | 3.5% | 4.1% |
Average Coupon | 4.7% | 5.0% | 5.0% |
Average Effective |
|
|
|
Maturity | 6.3 years | 6.9 years | 13.3 years |
Average Quality | AA- | AA | AA |
Average Duration | 5.8 years | 5.4 years | 8.4 years |
Distribution by Credit Quality |
|
(% of fixed income portfolio) |
|
|
|
AAA | 25.8% |
AA | 43.3 |
A | 25.3 |
BBB | 5.6 |
Distribution by Maturity |
|
(% of fixed income portfolio) |
|
|
|
Under 1 Year | 9.7% |
1–5 Years | 33.6 |
5–10 Years | 43.9 |
10–20 Years | 12.3 |
20–30 Years | 0.5 |
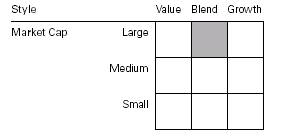
Equity Investment Focus
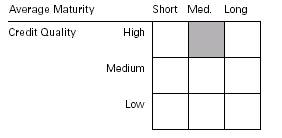
Fixed Income Investment Focus
Largest State Concentrations4 |
|
(% of fixed income portfolio) |
|
|
|
New York | 16.3% |
California | 7.2 |
Texas | 6.9 |
Massachusetts | 6.1 |
Arizona | 5.5 |
Ohio | 4.7 |
New Jersey | 4.6 |
Florida | 4.1 |
Missouri | 3.7 |
Georgia | 3.2 |
Top Ten | 62.3% |
1 Barclays Capital 7 Year Municipal Bond Index.
2 Barclays Capital Municipal Bond Index.
3 Before expenses.
4 “Largest State Concentrations” figures exclude any fixed income futures contracts.
8
Tax-Managed Balanced Fund
Performance Summary
All of the returns in this report represent past performance, which is not a guarantee of future results that may be achieved by the fund. (Current performance may be lower or higher than the performance data cited. For performance data current to the most recent month-end, visit our website at www.vanguard.com/performance.) Note, too, that both investment returns and principal value can fluctuate widely, so an investor’s shares, when sold, could be worth more or less than their original cost. The returns shown do not reflect taxes that a shareholder would pay on fund distributions or on the sale of fund shares.
Fiscal-Year Total Returns (%): December 31, 1998–June 30, 2009
Average Annual Total Returns: Periods Ended June 30, 2009 | ||||
|
|
|
|
|
| Inception Date | One Year | Five Years | Ten Years |
Tax-Managed Balanced Fund3 | 9/6/1994 | –9.77% | 1.85% | 2.31% |
Fee-Adjusted Returns4 |
| –10.64 | 1.85 | 2.31 |
1 Six months ended June 30, 2009.
2 50% Russell 1000 Index, 50% Barclays Capital 7 Year Municipal Bond Index.
3 Total returns do not include the account service fee that may be applicable to certain accounts with balances below $10,000.
4 Reflective of the 1% fee assessed on redemptions of shares held in the fund for less than five years. Note: See Financial Highlights tables for dividend and capital gains information.
9
Tax-Managed Balanced Fund
Financial Statements (unaudited)
Statement of Net Assets
As of June 30, 2009
The fund provides a complete list of its holdings four times in each fiscal year, at the quarter-ends. For the second and fourth fiscal quarters, the lists appear in the fund’s semiannual and annual reports to shareholders. For the first and third fiscal quarters, the fund files the lists with the Securities and Exchange Commission on Form N-Q. Shareholders can look up the fund’s Forms N-Q on the SEC’s website at www.sec.gov. Forms N-Q may also be reviewed and copied at the SEC’s Public Reference Room (see the back cover of this report for further information).
|
|
| Market |
|
|
| Value• |
|
| Shares | ($000) |
Common Stocks (47.9%) |
|
| |
Consumer Discretionary (4.7%) |
|
| |
| McDonald’s Corp. | 35,809 | 2,059 |
| The Walt Disney Co. | 68,650 | 1,602 |
| Comcast Corp. Class A | 98,050 | 1,421 |
| Target Corp. | 29,400 | 1,160 |
| Lowe’s Cos., Inc. | 55,800 | 1,083 |
* | Amazon.com, Inc. | 12,600 | 1,054 |
| Home Depot, Inc. | 40,299 | 952 |
| NIKE, Inc. Class B | 15,000 | 777 |
| Yum! Brands, Inc. | 20,800 | 693 |
| Time Warner Inc. | 25,796 | 650 |
* | Liberty Media Corp. | 23,648 | 633 |
| Staples, Inc. | 30,155 | 608 |
| TJX Cos., Inc. | 19,200 | 604 |
* | Ford Motor Co. | 96,900 | 588 |
| News Corp., Class A | 64,100 | 584 |
* | DIRECTV Group, Inc. | 22,871 | 565 |
| Time Warner Cable Inc. | 16,951 | 537 |
* | Kohl’s Corp. | 12,000 | 513 |
* | Viacom Inc. Class B | 22,558 | 512 |
| Best Buy Co., Inc. | 15,075 | 505 |
* | Apollo Group, Inc. Class A | 6,300 | 448 |
* | Starbucks Corp. | 28,800 | 400 |
| Marriott International, Inc. |
|
|
| Class A | 16,159 | 357 |
| Coach, Inc. | 12,800 | 344 |
| Ross Stores, Inc. | 8,800 | 340 |
| BorgWarner, Inc. | 9,900 | 338 |
| The Gap, Inc. | 19,725 | 323 |
* | Bed Bath & Beyond, Inc. | 10,500 | 323 |
* | O’Reilly Automotive, Inc. | 8,000 | 305 |
| Advance Auto Parts, Inc. | 7,205 | 299 |
| Strayer Education, Inc. | 1,320 | 288 |
| Polo Ralph Lauren Corp. | 5,300 | 284 |
| PetSmart, Inc. | 13,000 | 279 |
| Scripps Networks Interactive | 9,800 | 273 |
| Harley-Davidson, Inc. | 16,100 | 261 |
| DeVry, Inc. | 5,100 | 255 |
| RadioShack Corp. | 17,500 | 244 |
* | NVR, Inc. | 470 | 236 |
| Darden Restaurants Inc. | 7,150 | 236 |
* | Liberty Media Corp.–Capital |
|
|
| Series A | 17,200 | 233 |
| Brinker International, Inc. | 13,375 | 228 |
| Sherwin-Williams Co. | 4,100 | 220 |
| Hasbro, Inc. | 8,925 | 216 |
| International Speedway Corp. | 8,410 | 215 |
| John Wiley & Sons Class A | 6,400 | 213 |
| Cablevision Systems |
|
|
| NY Group Class A | 10,594 | 206 |
| Pulte Homes, Inc. | 23,100 | 204 |
| Phillips-Van Heusen Corp. | 7,000 | 201 |
| Washington Post Co. Class B | 560 | 197 |
* | AutoNation, Inc. | 11,292 | 196 |
| Weight Watchers |
|
|
| International, Inc. | 7,600 | 196 |
| International Game |
|
|
| Technology | 11,600 | 184 |
| Harman International |
|
|
| Industries, Inc. | 9,800 | 184 |
| Tiffany & Co. | 6,700 | 170 |
| Macy’s Inc. | 14,400 | 169 |
* | CarMax, Inc. | 11,406 | 168 |
| Thor Industries, Inc. | 9,120 | 168 |
| Guess ?, Inc. | 6,000 | 155 |
* | DISH Network Corp. | 8,757 | 142 |
| Burger King Holdings Inc. | 8,000 | 138 |
| D. R. Horton, Inc. | 13,399 | 125 |
* | Brink’s Home Security |
|
|
| Holdings, Inc. | 4,300 | 122 |
| Gentex Corp. | 10,200 | 118 |
* | Career Education Corp. | 4,500 | 112 |
* | Mohawk Industries, Inc. | 3,100 | 111 |
| Abercrombie & Fitch Co. | 4,300 | 109 |
| Black & Decker Corp. | 3,700 | 106 |
| Omnicom Group Inc. | 3,200 | 101 |
* | Toll Brothers, Inc. | 5,800 | 98 |
| Comcast Corp. Special |
|
|
| Class A | 6,476 | 91 |
10
Tax-Managed Balanced Fund
|
|
| Market |
|
|
| Value• |
|
| Shares | ($000) |
| Family Dollar Stores, Inc. | 3,200 | 91 |
* | Discovery |
|
|
| Communications Inc. |
|
|
| Class A | 3,841 | 87 |
* | Liberty Global, Inc. Series C | 5,446 | 86 |
* | Liberty Global, Inc. Class A | 5,015 | 80 |
* | Discovery |
|
|
| Communications Inc. |
|
|
| Class C | 3,841 | 79 |
| Centex Corp. | 8,100 | 68 |
| WABCO Holdings Inc. | 3,334 | 59 |
| Tim Hortons, Inc. | 2,300 | 56 |
* | Expedia, Inc. | 3,568 | 54 |
* | The Goodyear Tire & |
|
|
| Rubber Co. | 4,200 | 47 |
| H & R Block, Inc. | 2,600 | 45 |
* | MGM Mirage, Inc. | 4,013 | 26 |
| The McGraw-Hill Cos., Inc. | 700 | 21 |
* | Liberty Media Corp.– |
|
|
| Interactive Series A | 4,200 | 21 |
| Foot Locker, Inc. | 1,600 | 17 |
| Lennar Corp. Class B | 680 | 5 |
| Newell Rubbermaid, Inc. | 218 | 2 |
* | Krispy Kreme Doughnuts, Inc. |
|
|
| Warrants Exp. 3/2/12 | 243 | — |
|
|
| 28,873 |
Consumer Staples (5.4%) |
|
| |
| The Procter & Gamble Co. | 98,384 | 5,027 |
| Wal-Mart Stores, Inc. | 75,700 | 3,667 |
| The Coca-Cola Co. | 73,700 | 3,537 |
| PepsiCo, Inc. | 53,927 | 2,964 |
| Philip Morris International Inc. | 54,200 | 2,364 |
| CVS Caremark Corp. | 52,198 | 1,664 |
| Costco Wholesale Corp. | 18,027 | 824 |
| Walgreen Co. | 27,000 | 794 |
| General Mills, Inc. | 14,100 | 790 |
| Kraft Foods Inc. | 30,516 | 773 |
| Archer-Daniels-Midland Co. | 28,121 | 753 |
| Colgate-Palmolive Co. | 10,200 | 722 |
| Altria Group, Inc. | 40,900 | 670 |
| The Kroger Co. | 28,500 | 628 |
| Kellogg Co. | 11,300 | 526 |
| Kimberly-Clark Corp. | 9,172 | 481 |
| Safeway, Inc. | 19,334 | 394 |
| J.M. Smucker Co. | 7,746 | 377 |
| Molson Coors Brewing Co. |
|
|
| Class B | 8,000 | 339 |
* | Dr. Pepper Snapple |
|
|
| Group, Inc. | 15,400 | 326 |
| Tyson Foods, Inc. | 25,331 | 319 |
| The Pepsi Bottling Group, Inc. | 9,300 | 315 |
| Coca-Cola Enterprises, Inc. | 18,900 | 315 |
| The Clorox Co. | 5,400 | 302 |
| Brown-Forman Corp. Class B | 6,950 | 299 |
| Church & Dwight, Inc. | 5,500 | 299 |
| McCormick & Co., Inc. | 8,400 | 273 |
| Del Monte Foods Co. | 28,300 | 265 |
* | Dean Foods Co. | 13,750 | 264 |
| The Estee Lauder Cos. Inc. |
|
|
| Class A | 7,800 | 255 |
| Alberto-Culver Co. | 9,950 | 253 |
| Corn Products |
|
|
| International, Inc. | 9,407 | 252 |
| PepsiAmericas, Inc. | 9,300 | 249 |
| Hormel Foods Corp. | 7,100 | 245 |
* | Constellation Brands, Inc. |
|
|
| Class A | 18,600 | 236 |
* | Smithfield Foods, Inc. | 16,600 | 232 |
* | Energizer Holdings, Inc. | 4,294 | 224 |
* | NBTY, Inc. | 7,200 | 202 |
* | Central European |
|
|
| Distribution Corp. | 7,400 | 197 |
* | Ralcorp Holdings, Inc. | 2,800 | 171 |
* | Mead Johnson Nutrition Co. | 3,600 | 114 |
| Whole Foods Market, Inc. | 5,600 | 106 |
| Lorillard, Inc. | 1,000 | 68 |
| Sysco Corp. | 2,600 | 58 |
| Bunge Ltd. | 800 | 48 |
| Sara Lee Corp. | 500 | 5 |
| ConAgra Foods, Inc. | 100 | 2 |
|
|
| 33,188 |
Energy (5.7%) |
|
| |
| ExxonMobil Corp. | 160,394 | 11,213 |
| Chevron Corp. | 61,033 | 4,043 |
| Schlumberger Ltd. | 32,867 | 1,778 |
| ConocoPhillips Co. | 41,687 | 1,753 |
| Occidental Petroleum Corp. | 20,404 | 1,343 |
| Apache Corp. | 13,456 | 971 |
| Devon Energy Corp. | 17,646 | 962 |
| Anadarko Petroleum Corp. | 19,492 | 885 |
| EOG Resources, Inc. | 10,400 | 706 |
| Hess Corp. | 12,300 | 661 |
| XTO Energy, Inc. | 16,266 | 620 |
* | National Oilwell Varco Inc. | 18,029 | 589 |
| Noble Energy, Inc. | 8,500 | 501 |
| Peabody Energy Corp. | 15,400 | 464 |
* | Cameron International Corp. | 13,900 | 393 |
| Range Resources Corp. | 9,150 | 379 |
| Murphy Oil Corp. | 6,700 | 364 |
| ENSCO International, Inc. | 10,300 | 359 |
| Diamond Offshore |
|
|
| Drilling, Inc. | 4,300 | 357 |
| CONSOL Energy, Inc. | 10,100 | 343 |
* | Pride International, Inc. | 13,200 | 331 |
* | Nabors Industries, Inc. | 19,489 | 304 |
| BJ Services Co. | 22,200 | 303 |
* | Newfield Exploration Co. | 9,100 | 297 |
| Marathon Oil Corp. | 9,682 | 292 |
| Helmerich & Payne, Inc. | 9,200 | 284 |
| Pioneer Natural |
|
|
| Resources Co. | 11,000 | 280 |
| Cabot Oil & Gas Corp. | 9,100 | 279 |
11
Tax-Managed Balanced Fund
|
|
| Market |
|
|
| Value• |
|
| Shares | ($000) |
| Rowan Cos., Inc. | 14,000 | 270 |
| Valero Energy Corp. | 15,268 | 258 |
| Foundation Coal |
|
|
| Holdings, Inc. | 8,700 | 245 |
* | FMC Technologies Inc. | 6,140 | 231 |
* | SEACOR Holdings Inc. | 3,000 | 226 |
| St. Mary Land & |
|
|
| Exploration Co. | 10,400 | 217 |
* | Helix Energy Solutions |
|
|
| Group, Inc. | 19,500 | 212 |
* | Mariner Energy Inc. | 17,700 | 208 |
* | Forest Oil Corp. | 13,500 | 201 |
* | Continental Resources, Inc. | 7,000 | 194 |
* | SandRidge Energy, Inc. | 22,400 | 191 |
* | CNX Gas Corp. | 7,100 | 187 |
| Smith International, Inc. | 7,179 | 185 |
| Halliburton Co. | 8,664 | 179 |
* | Superior Energy |
|
|
| Services, Inc. | 9,700 | 168 |
* | Plains Exploration & |
|
|
| Production Co. | 4,748 | 130 |
| Patterson-UTI Energy, Inc. | 8,502 | 109 |
* | Exterran Holdings, Inc. | 6,500 | 104 |
| Tesoro Corp. | 6,752 | 86 |
* | Southwestern Energy Co. | 1,100 | 43 |
| Chesapeake Energy Corp. | 1,100 | 22 |
* | Denbury Resources, Inc. | 1,400 | 21 |
|
|
| 34,741 |
Financials (6.4%) |
|
| |
| JPMorgan Chase & Co. | 127,764 | 4,358 |
| Wells Fargo & Co. | 149,656 | 3,631 |
| Bank of America Corp. | 224,785 | 2,967 |
| The Goldman Sachs |
|
|
| Group, Inc. | 16,100 | 2,374 |
| State Street Corp. | 18,776 | 886 |
| U.S. Bancorp | 43,300 | 776 |
| Bank of New York |
|
|
| Mellon Corp. | 25,100 | 736 |
| Morgan Stanley | 25,760 | 734 |
| Charles Schwab Corp. | 39,305 | 689 |
| CME Group, Inc. | 2,039 | 634 |
| Prudential Financial, Inc. | 15,812 | 589 |
| Northern Trust Corp. | 10,100 | 542 |
| Franklin Resources, Inc. | 7,500 | 540 |
| Citigroup Inc. | 172,412 | 512 |
| Loews Corp. | 18,200 | 499 |
| AFLAC Inc. | 16,000 | 497 |
| Aon Corp. | 13,000 | 492 |
* | Progressive Corp. of Ohio | 32,000 | 484 |
| Public Storage, Inc. REIT | 7,200 | 471 |
| The Travelers Cos., Inc. | 10,589 | 435 |
| American Express Co. | 17,233 | 401 |
| Hudson City Bancorp, Inc. | 26,200 | 348 |
| Unum Group | 21,800 | 346 |
* | SLM Corp. | 33,600 | 345 |
| MetLife, Inc. | 11,440 | 343 |
| Host Hotels & Resorts Inc. |
|
|
| REIT | 40,875 | 343 |
* | TD Ameritrade Holding Corp. | 18,800 | 330 |
| Lincoln National Corp. | 19,000 | 327 |
| Plum Creek Timber Co. Inc. |
|
|
| REIT | 10,700 | 319 |
| BlackRock, Inc. | 1,750 | 307 |
| Discover Financial Services | 29,180 | 300 |
| People’s United Financial Inc. | 19,800 | 298 |
| Moody’s Corp. | 11,300 | 298 |
| Fifth Third Bancorp | 41,100 | 292 |
* | Leucadia National Corp. | 13,500 | 285 |
| Federal Realty |
|
|
| Investment Trust REIT | 5,500 | 283 |
* | Jefferies Group, Inc. | 12,800 | 273 |
| SEI Investments Co. | 15,000 | 271 |
| Torchmark Corp. | 7,300 | 270 |
* | CB Richard Ellis Group, Inc. | 28,800 | 270 |
| Digital Realty Trust, Inc. REIT | 7,500 | 269 |
| HCC Insurance |
|
|
| Holdings, Inc. | 11,000 | 264 |
* | The St. Joe Co. | 9,900 | 262 |
| W.R. Berkley Corp. | 11,950 | 257 |
* | AmeriCredit Corp. | 18,900 | 256 |
| First Horizon National Corp. | 21,026 | 252 |
| Reinsurance Group of |
|
|
| America, Inc. | 7,224 | 252 |
| RenaissanceRe Holdings Ltd. | 5,400 | 251 |
| Janus Capital Group Inc. | 21,800 | 249 |
* | Arch Capital Group Ltd. | 4,200 | 246 |
| M & T Bank Corp. | 4,800 | 244 |
| KeyCorp | 46,300 | 243 |
| Brown & Brown, Inc. | 11,800 | 235 |
| Simon Property Group, Inc. |
|
|
| REIT | 4,543 | 234 |
| The Hanover Insurance |
|
|
| Group Inc. | 6,100 | 232 |
| Eaton Vance Corp. | 8,600 | 230 |
| The Allstate Corp. | 9,400 | 229 |
| BancorpSouth, Inc. | 10,900 | 224 |
| Lazard Ltd. Class A | 8,200 | 221 |
| Jones Lang LaSalle Inc. | 6,500 | 213 |
| Allied World Assurance |
|
|
| Holdings, Ltd. | 5,200 | 212 |
| Cullen/Frost Bankers, Inc. | 4,600 | 212 |
| AMB Property Corp. REIT | 11,200 | 211 |
| Forest City Enterprise |
|
|
| Class A | 31,240 | 206 |
| Hospitality Properties Trust |
|
|
| REIT | 16,400 | 195 |
| Bank of Hawaii Corp. | 5,300 | 190 |
* | Interactive Brokers |
|
|
| Group, Inc. | 11,900 | 185 |
| GLG Partners, Inc. | 44,600 | 182 |
* | Markel Corp. | 630 | 177 |
| Whitney Holdings Corp. | 19,100 | 175 |
12
Tax-Managed Balanced Fund
|
|
| Market |
|
|
| Value• |
|
| Shares | ($000) |
| Assurant, Inc. | 7,200 | 173 |
| Commerce Bancshares, Inc. | 5,419 | 172 |
| Wesco Financial Corp. | 590 | 172 |
| First Citizens BancShares |
|
|
| Class A | 1,267 | 169 |
| TFS Financial Corp. | 15,600 | 166 |
| Marshall & Ilsley Corp. | 34,500 | 166 |
| American Financial |
|
|
| Group, Inc. | 7,650 | 165 |
* | Alleghany Corp. | 591 | 160 |
* | Nasdaq OMX Group, Inc. | 7,500 | 160 |
| Raymond James |
|
|
| Financial, Inc. | 9,250 | 159 |
* | MBIA, Inc. | 35,400 | 153 |
| BOK Financial Corp. | 4,040 | 152 |
| PNC Financial Services Group | 3,900 | 151 |
| The Hartford Financial |
|
|
| Services Group Inc. | 12,700 | 151 |
| Regions Financial Corp. | 36,100 | 146 |
| Washington Federal Inc. | 11,100 | 144 |
| StanCorp Financial |
|
|
| Group, Inc. | 5,000 | 143 |
| Legg Mason Inc. | 5,600 | 137 |
| Genworth Financial Inc. | 10,500 | 73 |
| Comerica, Inc. | 2,600 | 55 |
| Apartment Investment & |
|
|
| Management Co. |
|
|
| Class A REIT | 4,700 | 42 |
| CIT Group Inc. | 17,700 | 38 |
| BB&T Corp. | 1,500 | 33 |
| Ameriprise Financial, Inc. | 1,180 | 29 |
| The Chubb Corp. | 700 | 28 |
| Odyssey Re Holdings Corp. | 300 | 12 |
| Taubman Co. REIT | 400 | 11 |
|
|
| 39,063 |
Health Care (6.6%) |
|
| |
| Johnson & Johnson | 86,332 | 4,904 |
| Pfizer Inc. | 196,110 | 2,942 |
| Abbott Laboratories | 54,300 | 2,554 |
| Wyeth | 43,200 | 1,961 |
* | Amgen Inc. | 36,674 | 1,942 |
* | Gilead Sciences, Inc. | 33,555 | 1,572 |
| Schering-Plough Corp. | 59,700 | 1,500 |
| Merck & Co., Inc. | 52,600 | 1,471 |
| UnitedHealth Group Inc. | 46,374 | 1,158 |
| Medtronic, Inc. | 29,300 | 1,022 |
* | WellPoint Inc. | 18,825 | 958 |
* | Medco Health Solutions, Inc. | 19,862 | 906 |
| Bristol-Myers Squibb Co. | 43,000 | 873 |
* | Thermo Fisher Scientific, Inc. | 18,303 | 746 |
| Eli Lilly & Co. | 20,500 | 710 |
| Baxter International, Inc. | 12,800 | 678 |
* | Genzyme Corp. | 12,080 | 672 |
| Allergan, Inc. | 13,400 | 638 |
* | Biogen Idec Inc. | 13,460 | 608 |
| Stryker Corp. | 14,849 | 590 |
| McKesson Corp. | 13,200 | 581 |
* | Express Scripts Inc. | 8,400 | 577 |
| Aetna Inc. | 21,513 | 539 |
| Cardinal Health, Inc. | 16,790 | 513 |
* | St. Jude Medical, Inc. | 12,168 | 500 |
| Quest Diagnostics, Inc. | 8,500 | 480 |
* | Forest Laboratories, Inc. | 17,400 | 437 |
| C.R. Bard, Inc. | 5,600 | 417 |
| CIGNA Corp. | 17,000 | 410 |
* | Life Technologies Corp. | 9,800 | 409 |
* | Celgene Corp. | 7,919 | 379 |
* | Zimmer Holdings, Inc. | 8,470 | 361 |
| AmerisourceBergen Corp. | 20,096 | 356 |
* | Waters Corp. | 6,900 | 355 |
* | Laboratory Corp. of |
|
|
| America Holdings | 5,200 | 352 |
| Becton, Dickinson & Co. | 4,684 | 334 |
| DENTSPLY International Inc. | 10,900 | 333 |
* | Hospira, Inc. | 8,060 | 310 |
| Beckman Coulter, Inc. | 5,300 | 303 |
* | Mylan Inc. | 22,850 | 298 |
* | Millipore Corp. | 4,200 | 295 |
* | King Pharmaceuticals, Inc. | 28,400 | 273 |
* | Watson |
|
|
| Pharmaceuticals, Inc. | 8,000 | 269 |
| Techne Corp. | 4,200 | 268 |
* | Sepracor Inc. | 14,400 | 249 |
* | Varian Medical Systems, Inc. | 6,700 | 235 |
* | Endo Pharmaceuticals |
|
|
| Holdings, Inc. | 12,700 | 228 |
| IMS Health, Inc. | 17,576 | 223 |
* | Warner Chilcott Ltd. | 16,400 | 216 |
| Universal Health Services |
|
|
| Class B | 4,400 | 215 |
* | Humana Inc. | 6,500 | 210 |
| The Cooper Companies, Inc. | 8,400 | 208 |
* | Boston Scientific Corp. | 18,300 | 186 |
| Perrigo Co. (U.S.Shares) | 6,400 | 178 |
* | Patterson Companies, Inc. | 6,600 | 143 |
* | Lincare Holdings, Inc. | 5,700 | 134 |
* | Amylin Pharmaceuticals, Inc. | 8,400 | 113 |
| Omnicare, Inc. | 2,000 | 52 |
* | Charles River |
|
|
| Laboratories, Inc. | 900 | 30 |
* | Abraxis BioScience | 62 | 2 |
|
|
| 40,376 |
Industrials (4.8%) |
|
| |
| General Electric Co. | 308,409 | 3,615 |
| United Technologies Corp. | 24,876 | 1,293 |
| 3M Co. | 16,900 | 1,016 |
| Union Pacific Corp. | 18,318 | 954 |
| General Dynamics Corp. | 14,700 | 814 |
| Lockheed Martin Corp. | 9,703 | 783 |
| United Parcel Service, Inc. | 15,200 | 760 |
| Raytheon Co. | 17,000 | 755 |
| FedEx Corp. | 13,000 | 723 |
13
Tax-Managed Balanced Fund
|
|
| Market |
|
|
| Value• |
|
| Shares | ($000) |
| Danaher Corp. | 11,450 | 707 |
| The Boeing Co. | 15,820 | 672 |
| Illinois Tool Works, Inc. | 14,600 | 545 |
| Precision Castparts Corp. | 7,157 | 523 |
| Fluor Corp. | 9,648 | 495 |
| CSX Corp. | 13,800 | 478 |
| ITT Industries, Inc. | 10,100 | 450 |
| L-3 Communications |
|
|
| Holdings, Inc. | 6,300 | 437 |
| C.H. Robinson |
|
|
| Worldwide Inc. | 8,269 | 431 |
| Expeditors International of |
|
|
| Washington, Inc. | 12,500 | 417 |
| Emerson Electric Co. | 12,100 | 392 |
| Cummins Inc. | 10,224 | 360 |
* | McDermott International, Inc. | 17,300 | 351 |
* | Jacobs Engineering |
|
|
| Group Inc. | 8,220 | 346 |
| Republic Services, Inc. |
|
|
| Class A | 14,110 | 344 |
| W.W. Grainger, Inc. | 4,200 | 344 |
| Southwest Airlines Co. | 50,618 | 341 |
| Honeywell International Inc. | 10,800 | 339 |
* | Quanta Services, Inc. | 14,200 | 328 |
* | URS Corp. | 6,600 | 327 |
| Burlington Northern |
|
|
| Santa Fe Corp. | 4,338 | 319 |
* | Iron Mountain, Inc. | 10,975 | 316 |
| Roper Industries Inc. | 6,700 | 304 |
| AMETEK, Inc. | 8,650 | 299 |
| Fastenal Co. | 8,900 | 295 |
| KBR Inc. | 16,000 | 295 |
| Donaldson Co., Inc. | 8,400 | 291 |
| J.B. Hunt Transport |
|
|
| Services, Inc. | 9,300 | 284 |
* | Stericycle, Inc. | 5,500 | 283 |
| The Dun & Bradstreet Corp. | 3,400 | 276 |
| Flowserve Corp. | 3,900 | 272 |
| Northrop Grumman Corp. | 5,918 | 270 |
| Rockwell Collins, Inc. | 6,400 | 267 |
* | Alliant Techsystems, Inc. | 3,144 | 259 |
| Equifax, Inc. | 9,900 | 258 |
| Caterpillar, Inc. | 7,700 | 254 |
| Bucyrus International, Inc. | 8,800 | 251 |
| SPX Corp. | 5,007 | 245 |
| Valmont Industries, Inc. | 3,400 | 245 |
| Copa Holdings SA Class A | 6,000 | 245 |
* | Covanta Holding Corp. | 14,400 | 244 |
| Landstar System, Inc. | 6,625 | 238 |
| Lennox International Inc. | 7,400 | 238 |
* | WESCO International, Inc. | 9,400 | 235 |
| IDEX Corp. | 9,500 | 233 |
* | Gardner Denver Inc. | 8,947 | 225 |
| Textron, Inc. | 22,900 | 221 |
| The Toro Co. | 7,000 | 209 |
* | Aecom Technology Corp. | 6,300 | 202 |
| The Brink’s Co. | 6,833 | 198 |
* | UTI Worldwide, Inc. | 17,100 | 195 |
| Robert Half International, Inc. | 8,200 | 194 |
| MSC Industrial |
|
|
| Direct Co., Inc. Class A | 5,400 | 192 |
* | Terex Corp. | 15,137 | 183 |
| Manpower Inc. | 4,300 | 182 |
| Deere & Co. | 4,400 | 176 |
| Pentair, Inc. | 6,800 | 174 |
* | Armstrong Worldwide |
|
|
| Industries, Inc. | 10,500 | 173 |
| The Manitowoc Co., Inc. | 32,100 | 169 |
* | USG Corp. | 15,100 | 152 |
| Con-way, Inc. | 4,000 | 141 |
* | Thomas & Betts Corp. | 3,800 | 110 |
| Cintas Corp. | 4,550 | 104 |
* | Spirit Aerosystems |
|
|
| Holdings Inc. | 5,400 | 74 |
* | AGCO Corp. | 1,500 | 44 |
| Ryder System, Inc. | 1,400 | 39 |
* | Kirby Corp. | 1,200 | 38 |
* | Owens Corning Inc. | 2,500 | 32 |
* | Corrections Corp. of America | 1,800 | 31 |
| Norfolk Southern Corp. | 800 | 30 |
| PACCAR, Inc. | 900 | 29 |
| Pall Corp. | 400 | 11 |
| Waste Management, Inc. | 101 | 3 |
|
|
| 29,587 |
Information Technology (8.9%) |
|
| |
| Microsoft Corp. | 258,300 | 6,140 |
| International Business |
|
|
| Machines Corp. | 42,247 | 4,411 |
* | Apple Inc. | 30,338 | 4,321 |
* | Cisco Systems, Inc. | 197,600 | 3,683 |
* | Google Inc. | 8,260 | 3,482 |
| Hewlett-Packard Co. | 82,712 | 3,197 |
| Intel Corp. | 177,700 | 2,941 |
| Oracle Corp. | 133,200 | 2,853 |
| QUALCOMM Inc. | 57,300 | 2,590 |
| Texas Instruments, Inc. | 50,500 | 1,076 |
| Visa Inc. | 17,000 | 1,058 |
* | EMC Corp. | 80,100 | 1,049 |
| Corning, Inc. | 62,900 | 1,010 |
| Accenture Ltd. | 25,740 | 861 |
* | Dell Inc. | 61,300 | 842 |
* | Yahoo! Inc. | 51,000 | 799 |
| Motorola, Inc. | 105,000 | 696 |
| Applied Materials, Inc. | 61,251 | 672 |
* | eBay Inc. | 36,500 | 625 |
* | Symantec Corp. | 38,462 | 599 |
| Western Union Co. | 33,414 | 548 |
* | Adobe Systems, Inc. | 17,000 | 481 |
* | Intuit, Inc. | 15,800 | 445 |
| CA, Inc. | 22,630 | 394 |
* | Sun Microsystems, Inc. | 41,913 | 386 |
| Xilinx, Inc. | 18,200 | 372 |
14
Tax-Managed Balanced Fund
|
|
| Market |
|
|
| Value• |
|
| Shares | ($000) |
| MasterCard, Inc. Class A | 2,200 | 368 |
* | Fiserv, Inc. | 7,625 | 349 |
| Amphenol Corp. Class A | 10,800 | 342 |
* | BMC Software, Inc. | 10,100 | 341 |
* | Broadcom Corp. | 13,350 | 331 |
| Fidelity National Information |
|
|
| Services, Inc. | 16,100 | 321 |
| Altera Corp. | 19,600 | 319 |
| KLA-Tencor Corp. | 12,500 | 316 |
* | Citrix Systems, Inc. | 9,200 | 293 |
* | Autodesk, Inc. | 15,400 | 292 |
| Analog Devices, Inc. | 11,434 | 283 |
| National |
|
|
| Semiconductor Corp. | 22,100 | 277 |
| Global Payments Inc. | 7,300 | 274 |
* | Agilent Technologies, Inc. | 13,144 | 267 |
* | Tellabs, Inc. | 44,600 | 256 |
* | NetApp, Inc. | 12,912 | 255 |
* | Computer Sciences Corp. | 5,700 | 253 |
| Paychex, Inc. | 9,850 | 248 |
| FactSet Research |
|
|
| Systems Inc. | 4,900 | 244 |
* | Affiliated Computer |
|
|
| Services, Inc. Class A | 5,300 | 235 |
* | Ingram Micro, Inc. Class A | 12,100 | 212 |
* | NVIDIA Corp. | 17,900 | 202 |
| Microchip Technology, Inc. | 8,800 | 198 |
* | Teradata Corp. | 8,336 | 195 |
* | Compuware Corp. | 26,600 | 183 |
| Automatic Data |
|
|
| Processing, Inc. | 4,900 | 174 |
* | Fairchild Semiconductor |
|
|
| International, Inc. | 24,600 | 172 |
* | Avnet, Inc. | 8,100 | 170 |
* | LAM Research Corp. | 6,500 | 169 |
* | Cadence Design |
|
|
| Systems, Inc. | 23,600 | 139 |
| Intersil Corp. | 10,800 | 136 |
* | DST Systems, Inc. | 3,600 | 133 |
| Molex, Inc. | 8,466 | 132 |
* | Atmel Corp. | 33,600 | 125 |
* | CommScope, Inc. | 4,200 | 110 |
* | NCR Corp. | 8,336 | 99 |
* | Synopsys, Inc. | 4,800 | 94 |
* | Lexmark International, Inc. | 4,500 | 71 |
* | LSI Corp. | 14,400 | 66 |
| Harris Corp. | 2,100 | 60 |
* | Tech Data Corp. | 1,400 | 46 |
* | Metavante Technologies | 1,600 | 41 |
* | IAC/InterActiveCorp | 2,350 | 38 |
* | Integrated Device |
|
|
| Technology Inc. | 6,200 | 38 |
* | Convergys Corp. | 3,100 | 29 |
* | EchoStar Corp. | 1,751 | 28 |
| AVX Corp. | 2,600 | 26 |
* | Arrow Electronics, Inc. | 700 | 15 |
|
|
| 54,496 |
Materials (1.8%) |
|
| |
| Monsanto Co. | 20,208 | 1,502 |
| Newmont Mining Corp. |
|
|
| (Holding Co.) | 20,289 | 829 |
| Praxair, Inc. | 11,500 | 817 |
| Freeport-McMoRan |
|
|
| Copper & Gold, Inc. |
|
|
| Class B | 13,587 | 681 |
| Nucor Corp. | 10,400 | 462 |
| Ecolab, Inc. | 10,800 | 421 |
| The Mosaic Co. | 9,300 | 412 |
| Sigma-Aldrich Corp. | 7,900 | 392 |
| International Paper Co. | 25,100 | 380 |
| E.I. du Pont de |
|
|
| Nemours & Co. | 13,700 | 351 |
| Ball Corp. | 7,428 | 336 |
* | Crown Holdings, Inc. | 12,800 | 309 |
| Airgas, Inc. | 7,500 | 304 |
| CF Industries Holdings, Inc. | 3,900 | 289 |
| FMC Corp. | 6,100 | 289 |
| Celanese Corp. Series A | 11,400 | 271 |
| Reliance Steel & |
|
|
| Aluminum Co. | 6,800 | 261 |
* | Pactiv Corp. | 11,700 | 254 |
| Ashland, Inc. | 8,600 | 241 |
| Nalco Holding Co. | 13,400 | 226 |
| Sealed Air Corp. | 11,800 | 218 |
| Scotts Miracle-Gro Co. | 6,200 | 217 |
| Terra Industries, Inc. | 8,900 | 216 |
| Schnitzer Steel |
|
|
| Industries, Inc. Class A | 3,800 | 201 |
* | Owens-Illinois, Inc. | 6,700 | 188 |
| Dow Chemical Co. | 11,600 | 187 |
| Martin Marietta |
|
|
| Materials, Inc. | 2,286 | 180 |
| Cytec Industries, Inc. | 9,100 | 169 |
| Titanium Metals Corp. | 17,200 | 158 |
| Steel Dynamics, Inc. | 9,800 | 144 |
| Cliffs Natural Resources Inc. | 4,000 | 98 |
| Albemarle Corp. | 2,000 | 51 |
| Air Products & |
|
|
| Chemicals, Inc. | 500 | 32 |
| Vulcan Materials Co. | 334 | 14 |
|
|
| 11,100 |
Other (0.0%) |
|
| |
1 | Miscellaneous Securities |
| 149 |
|
|
|
|
Telecommunication Services (1.6%) |
| ||
| AT&T Inc. | 175,166 | 4,351 |
| Verizon Communications Inc. | 88,200 | 2,710 |
* | Sprint Nextel Corp. | 128,168 | 617 |
* | American Tower Corp. |
|
|
| Class A | 19,200 | 605 |
* | Crown Castle |
|
|
| International Corp. | 17,900 | 430 |
* | SBA Communications Corp. | 11,100 | 272 |
15
Tax-Managed Balanced Fund
|
|
| Market |
|
|
| Value• |
|
| Shares | ($000) |
* | NII Holdings Inc. | 11,805 | 225 |
* | U.S. Cellular Corp. | 4,450 | 171 |
* | Leap Wireless |
|
|
| International, Inc. | 5,000 | 165 |
| Telephone & |
|
|
| Data Systems, Inc. | 5,800 | 164 |
* | Clearwire Corp. | 28,900 | 160 |
| Telephone & |
|
|
| Data Systems, Inc.– |
|
|
| Special Common Shares | 3,000 | 78 |
|
|
| 9,948 |
| Utilities (2.0%) |
|
|
| Exelon Corp. | 25,300 | 1,296 |
| FPL Group, Inc. | 16,200 | 921 |
| PG&E Corp. | 15,400 | 592 |
| Sempra Energy | 11,867 | 589 |
| PPL Corp. | 16,500 | 544 |
| Edison International | 16,700 | 525 |
| FirstEnergy Corp. | 12,800 | 496 |
* | AES Corp. | 40,700 | 473 |
| Southern Co. | 14,600 | 455 |
* | NRG Energy, Inc. | 15,600 | 405 |
| Questar Corp. | 11,676 | 363 |
| EQT Corp. | 9,400 | 328 |
* | Calpine Corp. | 28,700 | 320 |
| Allegheny Energy, Inc. | 12,211 | 313 |
| Wisconsin Energy Corp. | 7,500 | 305 |
| MDU Resources Group, Inc. | 15,450 | 293 |
| Energen Corp. | 7,300 | 291 |
* | Mirant Corp. | 18,354 | 289 |
| NSTAR | 8,800 | 283 |
| Dominion Resources, Inc. | 8,308 | 278 |
| NV Energy Inc. | 25,717 | 277 |
| CMS Energy Corp. | 22,101 | 267 |
| National Fuel Gas Co. | 7,200 | 260 |
| UGI Corp. Holding Co. | 10,100 | 257 |
| SCANA Corp. | 7,800 | 253 |
| Northeast Utilities | 11,100 | 248 |
| Aqua America, Inc. | 13,200 | 236 |
* | RRI Energy, Inc. | 44,900 | 225 |
| American |
|
|
| Water Works Co., Inc. | 9,800 | 187 |
| Public Service Enterprise |
|
|
| Group, Inc. | 5,564 | 182 |
| DPL Inc. | 7,800 | 181 |
| Duke Energy Corp. | 11,692 | 171 |
| Ormat Technologies Inc. | 4,200 | 169 |
| Entergy Corp. | 700 | 54 |
* | Dynegy, Inc. | 2,300 | 5 |
|
|
| 12,331 |
Total Common Stocks |
|
| |
(Cost $235,926) |
| 293,852 | |
|
|
|
| Face | Market | |
|
| Maturity |
| Amount | Value• | |
| Coupon | Date |
| ($000) | ($000) | |
Tax-Exempt Municipal Bonds (51.4%) |
|
|
|
|
| |
Alabama (0.3%) |
|
|
|
|
| |
Huntsville AL Capital Improvement GO | 5.000% | 9/1/26 |
| 2,000 | 2,094 | |
|
|
|
|
|
| |
Alaska (0.3%) |
|
|
|
|
| |
Matanuska-Susitna Borough AK GO | 5.500% | 3/1/12 | (1) | 1,695 | 1,787 | |
|
|
|
|
|
| |
Arizona (2.8%) |
|
|
|
|
| |
Arizona Transp. Board Highway Rev. | 5.250% | 7/1/12 | (Prere.) | 1,965 | 2,194 | |
Arizona Transp. Board Highway Rev. | 5.250% | 7/1/17 |
| 2,215 | 2,413 | |
Glendale AZ Trans. Excise Tax Rev. | 5.000% | 7/1/23 | (1) | 4,585 | 4,770 | |
Phoenix AZ Civic Improvement Corp. |
|
|
|
|
| |
Water System Rev. | 5.000% | 7/1/21 | (1) | 500 | 520 | |
Salt River Project Arizona Agricultural |
|
|
|
|
| |
Improvement & Power Dist. Rev. | 5.000% | 1/1/28 |
| 3,250 | 3,377 | |
Salt Verde Arizona Financial Project Rev. | 5.250% | 12/1/24 |
| 5,000 | 4,129 | |
|
|
|
|
| 17,403 | |
16
Tax-Managed Balanced Fund
|
|
|
| Face | Market |
|
| Maturity |
| Amount | Value• |
| Coupon | Date |
| ($000) | ($000) |
California (3.7%) |
|
|
|
|
|
ABAG Finance Auth. for Non-Profit Corp. |
|
|
|
|
|
California (Acacia Creek) VRDO | 0.300% | 7/1/09 |
| 1,000 | 1,000 |
California GO | 5.250% | 10/1/13 | (1) | 500 | 534 |
California GO | 6.000% | 2/1/16 |
| 500 | 542 |
California GO | 5.500% | 4/1/18 |
| 1,000 | 1,035 |
California Public Works Board Lease Rev. |
|
|
|
|
|
(Dept. of Corrections) | 5.000% | 9/1/11 | (2) | 1,535 | 1,554 |
California State Dept. of Water Resources |
|
|
|
|
|
Power Supply Rev. | 5.500% | 5/1/14 | (2) | 3,000 | 3,230 |
California State Dept. of Water Resources |
|
|
|
|
|
Power Supply Rev. | 5.500% | 5/1/15 | (2) | 3,000 | 3,199 |
California State Econ. Recovery Bonds | 5.000% | 7/1/15 |
| 500 | 518 |
California State Econ. Recovery Bonds PUT | 5.000% | 3/1/10 |
| 500 | 510 |
California State Econ. Recovery Bonds PUT | 5.000% | 7/1/10 |
| 500 | 516 |
Los Angeles CA USD GO | 5.000% | 7/1/21 | (4) | 1,825 | 1,885 |
Oakland CA Redev. Agency (Central Dist.) | 5.000% | 9/1/21 | (2) | 3,000 | 2,784 |
Orange County CA Sanitation Dist. COP | 5.000% | 2/1/29 | (4) | 2,500 | 2,509 |
Univ. of California Rev. | 5.000% | 5/15/21 |
| 500 | 522 |
Ventura County CA Community College Dist. GO | 0.000% | 8/1/27 |
| 8,000 | 2,503 |
|
|
|
|
| 22,841 |
Colorado (0.9%) |
|
|
|
|
|
Colorado Dept. of Transp. Rev. | 5.250% | 12/15/13 | (2)(Prere.) | 3,750 | 4,297 |
E-470 Public Highway Auth. Colorado Rev. | 5.250% | 9/1/18 | (1) | 1,500 | 1,379 |
|
|
|
|
| 5,676 |
Connecticut (0.7%) |
|
|
|
|
|
Connecticut GO | 5.500% | 12/15/13 |
| 3,000 | 3,465 |
Connecticut Special Tax Obligation Rev. |
|
|
|
|
|
(Transp. Infrastructure) | 6.500% | 10/1/12 |
| 500 | 574 |
|
|
|
|
| 4,039 |
Florida (2.1%) |
|
|
|
|
|
Florida Board of Educ. Rev. (Lottery Rev.) | 5.000% | 7/1/16 | (2) | 3,000 | 3,220 |
Florida Dept. of Transp. | 6.375% | 7/1/11 |
| 1,000 | 1,098 |
Florida Hurricane Catastrophe Fund |
|
|
|
|
|
Finance Corp. Rev. | 5.000% | 7/1/12 |
| 3,565 | 3,694 |
Florida Turnpike Auth. Rev. | 5.250% | 7/1/09 | (1) | 485 | 485 |
Florida Turnpike Auth. Rev. | 5.250% | 7/1/10 | (1) | 825 | 828 |
Seminole County FL Water & Sewer Rev. | 5.000% | 10/1/23 |
| 2,435 | 2,500 |
Tampa FL Health System Rev. |
|
|
|
|
|
(Catholic Healthcare East) | 5.000% | 11/15/09 | (1) | 1,000 | 1,007 |
|
|
|
|
| 12,832 |
Georgia (1.6%) |
|
|
|
|
|
Atlanta GA Airport Fac. Rev. | 5.750% | 1/1/13 | (1) | 3,370 | 3,456 |
Atlanta GA Water & Wastewater Rev. | 5.750% | 11/1/27 | (4) | 500 | 556 |
Georgia GO | 5.000% | 4/1/12 |
| 500 | 552 |
Georgia GO | 5.000% | 10/1/13 |
| 500 | 567 |
Georgia GO | 5.000% | 5/1/16 |
| 500 | 576 |
Georgia GO | 5.000% | 7/1/16 |
| 500 | 577 |
Georgia Muni. Electric Power Auth. Rev. | 6.250% | 1/1/12 | (1) | 3,000 | 3,253 |
Georgia Road & Tollway Auth. Rev. GAN | 5.000% | 6/1/14 |
| 500 | 558 |
|
|
|
|
| 10,095 |
17
Tax-Managed Balanced Fund
|
|
|
| Face | Market | ||
|
| Maturity |
| Amount | Value• | ||
| Coupon | Date |
| ($000) | ($000) | ||
Hawaii (1.4%) |
|
|
|
|
| ||
Hawaii GO | 5.875% | 10/1/10 | (1)(Prere.) | 1,870 | 1,989 | ||
Hawaii GO | 5.000% | 3/1/26 | (4) | 500 | 520 | ||
Honolulu HI City & County GO | 5.000% | 7/1/19 | (4) | 2,000 | 2,185 | ||
Honolulu HI City & County GO | 5.000% | 7/1/20 | (4) | 3,205 | 3,461 | ||
Univ. of Hawaii Rev. | 5.000% | 10/1/27 |
| 500 | 507 | ||
|
|
|
|
| 8,662 | ||
Illinois (1.2%) |
|
|
|
|
| ||
Chicago IL (City Colleges Improvement) GO | 0.000% | 1/1/12 | (1) | 2,380 | 2,254 | ||
Chicago IL Board of Educ. GO | 5.250% | 12/1/24 | (4) | 500 | 525 | ||
Illinois Sales Tax Rev. | 0.000% | 12/15/16 | (2) | 5,000 | 3,808 | ||
Illinois State Tollway Highway Auth. |
|
|
|
|
| ||
Toll Highway Rev. | 5.000% | 1/1/25 | (4) | 500 | 515 | ||
|
|
|
|
| 7,102 | ||
Indiana (1.3%) |
|
|
|
|
| ||
Indiana Health Fac. Auth. Finance Auth. Rev. |
|
|
|
|
| ||
(Clarian Health Obligation Group) | 5.000% | 2/15/25 |
| 3,290 | 3,015 | ||
Indiana Muni. Power Agency Rev. | 5.250% | 1/1/15 | (1) | 4,440 | 4,673 | ||
Indiana Transp. Finance Auth. Highway Rev. | 5.000% | 12/1/12 | (1) | 500 | 553 | ||
|
|
|
|
| 8,241 | ||
Kansas (0.5%) |
|
|
|
|
| ||
Kansas Dept. of Transp. Highway Rev. | 5.000% | 9/1/22 |
| 500 | 545 | ||
Univ. of Kansas Hosp. Auth. Health System | 5.000% | 9/1/16 |
| 1,250 | 1,332 | ||
Univ. of Kansas Hosp. Auth. Health System | 5.000% | 9/1/17 |
| 1,000 | 1,056 | ||
|
|
|
|
| 2,933 | ||
Louisiana (0.3%) |
|
|
|
|
| ||
Louisiana GO | 5.000% | 5/1/23 | (4) | 500 | 513 | ||
Louisiana Public Fac. Auth. Rev. (Ochsner Clinic) | 5.000% | 5/15/16 |
| 1,260 | 1,223 | ||
|
|
|
|
| 1,736 | ||
Maryland (1.0%) |
|
|
|
|
| ||
Baltimore MD Consolidated Public |
|
|
|
|
| ||
Improvement GO | 5.000% | 10/15/18 | (2) | 1,365 | 1,483 | ||
Baltimore MD Consolidated Public |
|
|
|
|
| ||
Improvement GO | 5.000% | 10/15/19 | (2) | 2,185 | 2,358 | ||
Maryland GO | 5.000% | 2/15/13 |
| 1,000 | 1,119 | ||
Maryland GO | 5.000% | 8/1/17 |
| 500 | 559 | ||
Maryland Transp. Auth. Rev. | 5.000% | 7/1/15 | (4) | 750 | 838 | ||
|
|
|
|
| 6,357 | ||
Massachusetts (3.1%) |
|
|
|
|
| ||
Massachusetts Bay Transp. Auth. Rev. | 5.500% | 7/1/26 | (1) | 1,500 | 1,710 | ||
Massachusetts GO | 6.000% | 11/1/11 |
| 1,210 | 1,338 | ||
Massachusetts GO | 5.500% | 11/1/13 | (1) | 2,000 | 2,289 | ||
Massachusetts GO | 5.000% | 3/1/25 |
| 1,000 | 1,064 | ||
Massachusetts GO | 5.000% | 3/1/26 |
| 1,000 | 1,056 | ||
Massachusetts Health & Educ. Fac. Auth. Rev. |
|
|
|
|
| ||
(Caregroup) | 5.000% | 7/1/28 |
| 2,000 | 1,785 | ||
Massachusetts Health & Educ. Fac. Auth. Rev. |
|
|
|
|
| ||
(Caritas Christi Obligated Group) | 6.500% | 7/1/12 |
| 1,880 | 1,930 | ||
Massachusetts Health & Educ. Fac. Auth. Rev. |
|
|
|
|
| ||
(Museum of Fine Arts) VRDO | 0.270% | 7/1/09 |
| 545 | 545 | ||
18
Tax-Managed Balanced Fund
|
|
|
| Face | Market | |
|
| Maturity |
| Amount | Value• | |
| Coupon | Date |
| ($000) | ($000) | |
Massachusetts Housing Finance Agency |
|
|
|
|
| |
Housing Rev. VRDO | 0.750% | 7/8/09 | (4) | 3,100 | 3,100 | |
Massachusetts Water Pollution Abatement Trust | 5.250% | 8/1/21 |
| 1,805 | 2,093 | |
Massachusetts Water Resources Auth. Rev. | 5.000% | 8/1/21 | (2) | 2,135 | 2,311 | |
|
|
|
|
| 19,221 | |
Michigan (1.5%) |
|
|
|
|
| |
Mason MI Public School Dist. |
|
|
|
|
| |
(School Building & Site) GO | 5.250% | 5/1/17 | (4) | 1,850 | 2,047 | |
Michigan Hosp. Finance Auth. Rev. |
|
|
|
|
| |
(Ascension Health) PUT | 5.000% | 11/1/12 |
| 4,735 | 5,004 | |
Michigan Muni. Bond Auth. Rev. |
|
|
|
|
| |
(Clean Water Revolving Fund) | 5.875% | 10/1/10 | (Prere.) | 2,110 | 2,270 | |
|
|
|
|
| 9,321 | |
Minnesota (0.1%) |
|
|
|
|
| |
Minnesota GO | 5.000% | 11/1/14 |
| 500 | 572 | |
|
|
|
|
|
| |
Mississippi (0.5%) |
|
|
|
|
| |
Mississippi GO | 5.500% | 12/1/18 |
| 2,750 | 3,188 | |
|
|
|
|
|
| |
Missouri (1.9%) |
|
|
|
|
| |
Curators of the Univ. of Missouri System Fac. Rev. | 5.000% | 11/1/26 |
| 4,410 | 4,557 | |
Missouri Health & Educ. Fac. Auth. |
|
|
|
|
| |
(Washington Univ.) | 6.000% | 3/1/10 | (Prere.) | 4,000 | 4,190 | |
Missouri Health & Educ. Fac. Auth. |
|
|
|
|
| |
Health Fac. Rev. |
|
|
|
|
| |
(St. Luke’s Episcopal–Presbyterian Hosp.) | 5.500% | 12/1/15 | (4) | 2,965 | 3,082 | |
|
|
|
|
| 11,829 | |
Nevada (0.9%) |
|
|
|
|
| |
Clark County NV School Dist. GO | 5.000% | 6/15/18 |
| 5,190 | 5,351 | |
|
|
|
|
|
| |
New Jersey (2.4%) |
|
|
|
|
| |
New Jersey Econ. Dev. Auth. Rev. (School Fac.) | 5.000% | 9/1/14 |
| 500 | 539 | |
New Jersey Econ. Dev. Auth. Rev. |
|
|
|
|
| |
(School Fac.) PUT | 5.000% | 9/1/14 | (4) | 500 | 541 | |
New Jersey GO | 5.250% | 7/15/15 | (2) | 500 | 570 | |
New Jersey Health Care Fac. Financing Auth. |
|
|
|
|
| |
Rev. (Meridian Health Systems) VRDO | 0.300% | 7/2/09 | LOC | 2,000 | 2,000 | |
New Jersey Transp. Corp. COP | 5.500% | 9/15/11 | (2) | 3,000 | 3,177 | |
New Jersey Transp. Trust Fund Auth. Rev. | 6.000% | 12/15/11 | (1)(Prere.) | 625 | 699 | |
New Jersey Transp. Trust Fund Auth. Rev. | 6.000% | 12/15/11 | (1)(Prere.) | 330 | 369 | |
New Jersey Transp. Trust Fund Auth. Rev. | 6.000% | 12/15/11 | (1)(Prere.) | 1,440 | 1,611 | |
New Jersey Transp. Trust Fund Auth. Rev. | 5.500% | 12/15/20 | (1) | 4,000 | 4,283 | |
New Jersey Transp. Trust Fund Auth. Rev. | 0.000% | 12/15/26 | (2) | 2,000 | 708 | |
|
|
|
|
| 14,497 | |
New Mexico (0.1%) |
|
|
|
|
| |
New Mexico Finance Auth. Transp. Rev. | 5.000% | 6/15/13 | (2) | 500 | 554 | |
|
|
|
|
|
| |
New York (8.4%) |
|
|
|
|
| |
Erie County NY GO | 6.125% | 1/15/11 | (1) | 610 | 642 | |
Long Island NY Power Auth. Electric System Rev. | 5.500% | 12/1/11 | (2) | 3,000 | 3,235 | |
Long Island NY Power Auth. Electric System Rev. | 5.500% | 12/1/12 | (4)(ETM) | 2,000 | 2,265 | |
19
Tax-Managed Balanced Fund
|
|
|
| Face | Market |
|
| Maturity |
| Amount | Value• |
| Coupon | Date |
| ($000) | ($000) |
Metro. New York Transp. Auth. Rev. |
|
|
|
|
|
(Dedicated Petroleum Tax) | 6.125% | 4/1/10 | (3)(Prere.) | 2,110 | 2,199 |
Metro. New York Transp. Auth. Rev. |
|
|
|
|
|
(Service Contract) | 5.500% | 7/1/15 |
| 500 | 552 |
New York City NY GO | 5.250% | 8/1/11 |
| 500 | 535 |
New York City NY GO | 5.250% | 8/1/13 |
| 500 | 550 |
New York City NY GO | 5.750% | 8/1/13 |
| 500 | 546 |
New York City NY GO | 5.000% | 1/1/14 |
| 500 | 543 |
New York City NY GO | 5.000% | 8/1/19 |
| 500 | 522 |
New York City NY GO | 5.250% | 8/15/24 |
| 500 | 517 |
New York City NY GO | 5.625% | 4/1/29 |
| 840 | 885 |
New York City NY GO VRDO | 0.350% | 7/1/09 | (4) | 1,200 | 1,200 |
New York City NY Housing Dev. Corp. |
|
|
|
|
|
Multi-Family Rev. | 5.000% | 5/1/12 |
| 500 | 520 |
New York City NY IDA (Yankee Stadium) | 0.000% | 3/1/35 | (12) | 1,000 | 204 |
New York City NY Muni. Water Finance Auth. |
|
|
|
|
|
Water & Sewer System Rev. | 5.375% | 6/15/19 |
| 500 | 530 |
New York City NY Sales Tax Asset Receivable Corp. | 5.000% | 10/15/26 | (1) | 500 | 517 |
New York City NY Transitional Finance Auth. Rev. | 5.375% | 2/1/13 |
| 2,000 | 2,199 |
New York City NY Transitional Finance Auth. Rev. | 5.250% | 8/1/18 | (2) | 500 | 530 |
New York City NY Transitional Finance Auth. Rev. | 5.125% | 1/15/29 |
| 1,070 | 1,069 |
New York City NY Transitional Finance Auth. Rev. | 5.000% | 1/15/30 |
| 500 | 495 |
New York City NY Transitional Finance Auth. Rev. | 5.000% | 1/15/32 |
| 500 | 489 |
New York City NY Transitional Finance Auth. Rev. | 4.750% | 1/15/38 |
| 500 | 454 |
New York State Dormitory Auth. Rev. |
|
|
|
|
|
(Personal Income Tax) | 5.000% | 3/15/28 |
| 500 | 509 |
New York State Dormitory Auth. Rev. |
|
|
|
|
|
(Vassar Brothers Hosp.) | 5.100% | 7/1/10 | (4) | 1,500 | 1,520 |
New York State Dormitory Auth. Rev. Non State |
|
|
|
|
|
Supported Debt (Mount Sinai School of |
|
|
|
|
|
Medicine of New York Univ.) | 5.000% | 7/1/23 | (1) | 4,000 | 4,050 |
New York State Dormitory Auth. Rev. Non State |
|
|
|
|
|
Supported Debt (Mount Sinai School of |
|
|
|
|
|
Medicine of New York Univ.) | 5.000% | 7/1/24 | (1) | 3,800 | 3,835 |
New York State Thruway Auth. Rev. | 5.000% | 1/1/20 | (1) | 500 | 531 |
New York State Thruway Auth. Rev. | 5.000% | 1/1/21 | (1) | 8,490 | 8,934 |
New York State Thruway Auth. Rev. |
|
|
|
|
|
(Highway & Bridge Trust Fund) | 5.000% | 4/1/13 |
| 500 | 550 |
New York State Thruway Auth. Rev. |
|
|
|
|
|
(Service Contract) | 5.500% | 4/1/14 |
| 4,000 | 4,313 |
New York State Urban Dev. Corp. Rev. | 5.000% | 1/1/15 |
| 500 | 540 |
New York State Urban Dev. Corp. Rev. |
|
|
|
|
|
(Personal Income Tax) | 5.000% | 12/15/25 |
| 2,500 | 2,584 |
New York State Urban Dev. Corp. Rev. |
|
|
|
|
|
(Personal Income Tax) GO | 5.500% | 3/15/22 | (1) | 2,030 | 2,327 |
Triborough Bridge & Tunnel Auth. New York Rev. | 5.000% | 11/15/25 |
| 500 | 515 |
|
|
|
|
| 51,406 |
North Carolina (0.8%) |
|
|
|
|
|
North Carolina Eastern Muni. Power Agency Rev. | 5.125% | 1/1/14 |
| 2,400 | 2,504 |
North Carolina Infrastructure Financial Corp. COP |
|
|
|
|
|
Capital Improvements | 5.000% | 2/1/21 | (4) | 2,000 | 2,093 |
|
|
|
|
| 4,597 |
20
Tax-Managed Balanced Fund
|
|
|
| Face | Market | |
|
| Maturity |
| Amount | Value• | |
| Coupon | Date |
| ($000) | ($000) | |
Ohio (2.4%) |
|
|
|
|
| |
Allen County OH Hosp. Fac. Rev. |
|
|
|
|
| |
(Catholic Healthcare) VRDO | 0.250% | 7/1/09 | LOC | 800 | 800 | |
Buckeye OH Tobacco Settlement |
|
|
|
|
| |
Financing Corp. Rev. | 5.125% | 6/1/24 |
| 1,440 | 1,159 | |
Cleveland OH Public Power System Rev. | 5.000% | 11/15/20 | (1) | 5,000 | 5,143 | |
Cuyahoga County OH Hosp. Rev. |
|
|
|
|
| |
(Cleveland Clinic Foundation) VRDO | 0.180% | 7/1/09 |
| 200 | 200 | |
Lorain County OH Hosp. Fac. Rev. |
|
|
|
|
| |
(Catholic Healthcare Partners) | 5.625% | 9/1/13 | (1) | 1,775 | 1,784 | |
Ohio Common Schools GO VRDO | 0.170% | 7/8/09 |
| 300 | 300 | |
Ohio State Conservation Projects GO | 5.000% | 3/1/17 |
| 1,885 | 2,060 | |
Ohio Water Dev. Auth. PCR | 5.000% | 6/1/17 |
| 3,000 | 3,320 | |
|
|
|
|
| 14,766 | |
Pennsylvania (1.3%) |
|
|
|
|
| |
Commonwealth Financing Auth. Pennsylvania Rev. | 5.000% | 6/1/25 | (1) | 500 | 506 | |
Pennsylvania GO | 5.000% | 9/1/14 | (4) | 500 | 566 | |
Pennsylvania GO | 5.250% | 7/1/15 |
| 500 | 574 | |
Pennsylvania GO | 5.375% | 7/1/21 |
| 500 | 578 | |
Pennsylvania Turnpike Comm. |
|
|
|
|
| |
Oil Franchise Tax Rev. | 5.250% | 12/1/09 | (2) | 195 | 198 | |
Pennsylvania Turnpike Comm. |
|
|
|
|
| |
Oil Franchise Tax Rev. | 5.250% | 12/1/09 | (2)(ETM) | 420 | 426 | |
Pennsylvania Turnpike Comm. |
|
|
|
|
| |
Oil Franchise Tax Rev. | 5.250% | 12/1/11 | (2) | 30 | 31 | |
Pennsylvania Turnpike Comm. |
|
|
|
|
| |
Oil Franchise Tax Rev. | 5.250% | 12/1/11 | (2)(ETM) | 310 | 314 | |
Philadelphia PA School Dist. GO | 5.000% | 8/1/20 | (2) | 3,500 | 3,562 | |
Philadelphia PA Water & Waste Water Rev. | 6.250% | 8/1/09 | (1) | 1,000 | 1,004 | |
|
|
|
|
| 7,759 | |
Puerto Rico (1.0%) |
|
|
|
|
| |
Puerto Rico Public Buildings Auth. Govt. Fac. Rev. | 5.250% | 7/1/14 | (3) | 2,425 | 2,408 | |
Puerto Rico Public Finance Corp. | 6.000% | 8/1/26 | (4)(ETM) | 3,000 | 3,541 | |
|
|
|
|
| 5,949 | |
South Carolina (1.4%) |
|
|
|
|
| |
Piedmont SC Muni. Power Agency Rev. | 0.000% | 1/1/24 | (1) | 1,600 | 676 | |
South Carolina Jobs Econ. Dev. Auth. |
|
|
|
|
| |
Hosp. Facs. Rev. (Palmetto Health) | 5.250% | 8/1/24 | (4) | 1,700 | 1,739 | |
South Carolina Transp. Infrastructure Rev. | 5.250% | 10/1/13 | (2) | 5,700 | 6,215 | |
|
|
|
|
| 8,630 | |
Tennessee (1.1%) |
|
|
|
|
| |
Tennessee Energy Acquisition Corp. Gas Rev. | 5.000% | 9/1/16 |
| 7,500 | 6,978 | |
|
|
|
|
|
| |
Texas (3.5%) |
|
|
|
|
| |
Austin TX Water & Wastewater System Rev. | 5.750% | 5/15/10 | (1)(Prere.) | 2,200 | 2,302 | |
North Harris County TX Regional Water Auth. Rev. | 5.125% | 12/15/25 |
| 3,000 | 3,062 | |
San Antonio TX Electric & Gas Rev. | 5.000% | 2/1/21 |
| 3,405 | 3,589 | |
San Antonio TX Muni. Drain Util. System Rev. | 5.250% | 2/1/27 | (1) | 3,635 | 3,743 | |
San Antonio TX Water Rev. | 6.500% | 5/15/10 | (1)(ETM) | 25 | 25 | |
Southwest Texas Higher Educ. Auth. Inc. Rev. |
|
|
|
|
| |
(Southern Methodist Univ.) | 5.000% | 10/1/16 | (2) | 2,260 | 2,523 | |
Texas A & M Univ. Rev. Financing System | 5.000% | 5/15/26 |
| 2,000 | 2,120 |
21
Tax-Managed Balanced Fund
|
|
|
| Face | Market |
|
| Maturity |
| Amount | Value• |
| Coupon | Date |
| ($000) | ($000) |
Texas GO Public Finance Auth. | 5.500% | 10/1/12 |
| 500 | 543 |
Texas Muni. Power Agency Rev. | 0.000% | 9/1/15 | (1) | 3,000 | 2,298 |
Texas State Transp. Comm. First Tier | 4.750% | 4/1/24 |
| 500 | 513 |
Texas State Transp. Comm. First Tier | 5.000% | 4/1/26 |
| 500 | 520 |
Texas Tech Univ. Rev. Refunding & Improvement | 5.000% | 2/15/28 |
| 500 | 508 |
|
|
|
|
| 21,746 |
Virginia (1.3%) |
|
|
|
|
|
Virginia Public Building Auth. Rev. | 5.000% | 8/1/24 |
| 1,090 | 1,170 |
Virginia Public School Auth. Rev. | 5.000% | 8/1/13 |
| 4,000 | 4,494 |
Virginia Public School Auth. Rev. | 5.000% | 8/1/20 |
| 2,000 | 2,213 |
|
|
|
|
| 7,877 |
Washington (0.8%) |
|
|
|
|
|
Energy Northwest Washington Electric |
|
|
|
|
|
Refunding Rev. (Project No. 1) | 5.250% | 7/1/16 |
| 500 | 561 |
Port of Seattle WA Rev. | 5.000% | 3/1/20 | (1) | 3,000 | 3,069 |
Washington GO | 5.700% | 10/1/15 | (4) | 500 | 553 |
Washington GO | 0.000% | 6/1/20 | (1) | 500 | 307 |
Washington GO | 5.000% | 7/1/21 | (4) | 500 | 533 |
|
|
|
|
| 5,023 |
Wisconsin (0.8%) |
|
|
|
|
|
Wisconsin GO | 5.750% | 5/1/11 | (Prere.) | 1,340 | 1,456 |
Wisconsin GO | 5.750% | 5/1/11 | (Prere.) | 1,355 | 1,472 |
Wisconsin GO | 5.000% | 5/1/22 |
| 1,560 | 1,656 |
|
|
|
|
| 4,584 |
Total Tax-Exempt Municipal Bonds (Cost $313,239) |
|
|
|
| 315,646 |
Total Investments (99.3%) (Cost $549,165) |
|
|
|
| 609,498 |
Other Assets and Liabilities (0.7%) |
|
|
|
|
|
Other Assets |
|
|
|
| 9,646 |
Liabilities |
|
|
|
| (5,339) |
|
|
|
|
| 4,307 |
Net Assets (100%) |
|
|
|
|
|
Applicable to 36,450,693 outstanding $.001 par value shares of |
|
|
| ||
beneficial interest (unlimited authorization) |
|
|
|
| 613,805 |
Net Asset Value Per Share |
|
|
|
| $16.84 |
|
|
|
|
|
|
|
|
|
|
|
|
|
|
|
|
|
|
At June 30, 2009, net assets consisted of: |
|
|
|
|
|
|
|
| Amount |
|
|
|
| ($000) |
Paid-in Capital |
|
|
| 606,539 |
Overdistributed Net Investment Income |
|
|
| (875) |
Accumulated Net Realized Losses |
|
|
| (52,192) |
Unrealized Appreciation (Depreciation) |
|
|
| 60,333 |
Net Assets |
|
|
| 613,805 |
• See Note A in Notes to Financial Statements.
* Non-income-producing security.
1 Securities representing up to 5% of the market value of unaffiliated securities are permitted to be combined and reported as “miscellaneous securities,” provided that they have been held for less than one year and not previously reported by name. REIT—Real Estate Investment Trust.
See accompanying Notes, which are an integral part of the Financial Statements. A key to abbreviations and other references follows the Statement of Net Assets.
22
Tax-Managed Balanced Fund
Key to Abbreviations
ARS—Auction Rate Security.
BAN—Bond Anticipation Note.
COP—Certificate of Participation.
CP—Commercial Paper.
FR—Floating Rate.
GAN—Grant Anticipation Note.
GO—General Obligation Bond.
IDA—Industrial Development Authority Bond.
IDR—Industrial Development Revenue Bond.
PCR—Pollution Control Revenue Bond.
PUT—Put Option Obligation.
RAN—Revenue Anticipation Note.
TAN—Tax Anticipation Note.
TOB—Tender Option Bond.
TRAN—Tax Revenue Anticipation Note.
UFSD—Union Free School District.
USD—United School District.
VRDO—Variable Rate Demand Obligation.
(ETM)—Escrowed to Maturity.
(Prere.)—Prerefunded.
Scheduled principal and interest payments are guaranteed by:
(1) MBIA (Municipal Bond Insurance Association).
(2) AMBAC (Ambac Assurance Corporation).
(3) FGIC (Financial Guaranty Insurance Company).
(4) FSA (Financial Security Assurance).
(5) BIGI (Bond Investors Guaranty Insurance).
(6) Connie Lee Inc.
(7) FHA (Federal Housing Authority).
(8) CapMAC (Capital Markets Assurance Corporation).
(9) American Capital Access Financial Guaranty Corporation.
(10) XL Capital Assurance Inc.
(11) CIFG (CDC IXIS Financial Guaranty).
(12) Assured Guaranty Corp.
(13) National Indemnity Co. (Berkshire Hathaway).
The insurance does not guarantee the market value of the municipal bonds.
LOC—Scheduled principal and interest payments are guaranteed by bank letter of credit.
23
Tax-Managed Balanced Fund
Statement of Operations
| Six Months Ended |
| June 30, 2009 |
| ($000) |
Investment Income |
|
Income |
|
Dividends | 2,897 |
Interest | 6,367 |
Total Income | 9,264 |
Expenses |
|
The Vanguard Group—Note B |
|
Investment Advisory Services | 47 |
Management and Administrative | 299 |
Marketing and Distribution | 76 |
Custodian Fees | 4 |
Shareholders’ Reports and Proxies | 9 |
Total Expenses | 435 |
Net Investment Income | 8,829 |
Realized Net Gain (Loss) on Investment Securities Sold | (14,433) |
Change in Unrealized Appreciation (Depreciation) of Investment Securities | 37,017 |
Net Increase (Decrease) in Net Assets Resulting from Operations | 31,413 |
See accompanying Notes, which are an integral part of the Financial Statements.
24
Tax-Managed Balanced Fund
Statement of Changes in Net Assets
| Six Months Ended |
| Year Ended |
| June 30, |
| December 31, |
| 2009 |
| 2008 |
| ($000) |
| ($000) |
Increase (Decrease) in Net Assets |
|
|
|
Operations |
|
|
|
Net Investment Income | 8,829 |
| 20,278 |
Realized Net Gain (Loss) | (14,433) |
| (21,093) |
Change in Unrealized Appreciation (Depreciation) | 37,017 |
| (133,875) |
Net Increase (Decrease) in Net Assets Resulting from Operations | 31,413 |
| (134,690) |
Distributions |
|
|
|
Net Investment Income | (8,605) |
| (20,382) |
Realized Capital Gain | — |
| — |
Total Distributions | (8,605) |
| (20,382) |
Capital Share Transactions |
|
|
|
Issued | 25,485 |
| 74,123 |
Issued in Lieu of Cash Distributions | 7,228 |
| 17,178 |
Redeemed1 | (28,995) |
| (70,789) |
Net Increase (Decrease) from Capital Share Transactions | 3,718 |
| 20,512 |
Total Increase (Decrease) | 26,526 |
| (134,560) |
Net Assets |
|
|
|
Beginning of Period | 587,279 |
| 721,839 |
End of Period2 | 613,805 |
| 587,279 |
1 Net of redemption fees for fiscal 2009 and 2008 of $102,000 and $266,000, respectively.
2 Net Assets—End of Period includes undistributed (overdistributed) net investment income of ($875,000) and ($1,099,000).
See accompanying Notes, which are an integral part of the Financial Statements.
25
Tax-Managed Balanced Fund
Financial Highlights
|
|
|
|
|
|
|
| Six Months |
|
|
|
|
|
| Ended |
|
|
| ||
For a Share Outstanding | June 30, | Year Ended December 31, | ||||
Throughout Each Period | 2009 | 2008 | 2007 | 2006 | 2005 | 2004 |
Net Asset Value, Beginning of Period | $16.19 | $20.45 | $20.02 | $18.88 | $18.49 | $17.72 |
Investment Operations |
|
|
|
|
|
|
Net Investment Income | .245 | .565 | .588 | .540 | .496 | .480 |
Net Realized and Unrealized Gain (Loss) |
|
|
|
|
|
|
on Investments | .644 | (4.260) | .430 | 1.150 | .380 | .770 |
Total from Investment Operations | .889 | (3.695) | 1.018 | 1.690 | .876 | 1.250 |
Distributions |
|
|
|
|
|
|
Dividends from Net Investment Income1 | (.239) | (.565) | (.588) | (.550) | (.486) | (.480) |
Distributions from Realized Capital Gains | — | — | — | — | — | — |
Total Distributions | (.239) | (.565) | (.588) | (.550) | (.486) | (.480) |
Net Asset Value, End of Period | $16.84 | $16.19 | $20.45 | $20.02 | $18.88 | $18.49 |
|
|
|
|
|
|
|
|
|
|
|
|
|
|
Total Return2 | 5.54% | –18.32% | 5.11% | 9.09% | 4.80% | 7.16% |
|
|
|
|
|
|
|
|
|
|
|
|
|
|
Ratios/Supplemental Data |
|
|
|
|
|
|
Net Assets, End of Period (Millions) | $614 | $587 | $722 | $662 | $606 | $561 |
Ratio of Total Expenses to |
|
|
|
|
|
|
Average Net Assets | 0.15%3 | 0.13% | 0.12% | 0.12% | 0.12% | 0.12% |
Ratio of Net Investment Income to |
|
|
|
|
|
|
Average Net Assets | 3.04%3 | 3.01% | 2.86% | 2.84% | 2.64% | 2.70% |
Portfolio Turnover Rate | 20%3 | 19% | 10% | 4% | 10% | 15% |
1 For tax purposes, nontaxable dividends represent 69%, 72%, 73%, 74%, 76%, and 73% of dividends from net investment income.
2 Total returns do not reflect the 1% redemption fee on shares held less than five years; the 2% redemption fee assessed prior to September 14, 2005, on shares held less than one year; or the account service fee that may be applicable to certain accounts with balances below $10,000.
3 Annualized.
See accompanying Notes, which are an integral part of the Financial Statements.
26
Tax-Managed Balanced Fund
Notes to Financial Statements
Vanguard Tax-Managed Balanced Fund is registered under the Investment Company Act of 1940 as an open-end investment company, or mutual fund. The fund invests in debt instruments of many municipal issuers; the issuers’ abilities to meet their obligations may be affected by economic and political developments in a specific state or region.
A. The following significant accounting policies conform to generally accepted accounting principles for U.S. mutual funds. The fund consistently follows such policies in preparing its financial statements.
1. Security Valuation: Securities are valued as of the close of trading on the New York Stock Exchange (generally 4 p.m., Eastern time) on the valuation date. Equity securities are valued at the latest quoted sales prices or official closing prices taken from the primary market in which each security trades; such securities not traded on the valuation date are valued at the mean of the latest quoted bid and asked prices. Bonds, and temporary cash investments acquired over 60 days to maturity, are valued using the latest bid prices or using valuations based on a matrix system (which considers such factors as security prices, yields, maturities, and ratings), both as furnished by independent pricing services. Other temporary cash investments are valued at amortized cost, which approximates market value. Securities for which market quotations are not readily available, or whose values have been materially affected by events occurring before the fund’s pricing time but after the close of the securities’ primary markets, are valued by methods deemed by the board of trustees to represent fair value.
2. Federal Income Taxes: The fund intends to continue to qualify as a regulated investment company and distribute all of its income. Management has analyzed the fund’s tax positions taken on federal income tax returns for all open tax years (tax years ended December 31, 2005–2008) and for the period ended June 30, 2009, and has concluded that no provision for federal income tax is required in the fund’s financial statements.
3. Distributions: Distributions to shareholders are recorded on the ex-dividend date.
4. Other: Dividend income is recorded on the ex-dividend date. Interest income is accrued daily.
Premiums and discounts on debt securities purchased are amortized and accreted, respectively, to interest income over the lives of the respective securities. Security transactions are accounted for on the date securities are bought or sold. Costs used to determine realized gains (losses) on the sale of investment securities are those of the specific securities sold. Fees assessed on redemptions of capital shares are credited to paid-in-capital.
B. The Vanguard Group furnishes at cost investment advisory, corporate management, administrative, marketing, and distribution services. The costs of such services are allocated to the fund under methods approved by the board of trustees. The fund has committed to provide up to 0.40% of its net assets in capital contributions to Vanguard. At June 30, 2009, the fund had contributed capital of $145,000 to Vanguard (included in Other Assets), representing 0.02% of the fund’s net assets and 0.06% of Vanguard’s capitalization. The fund’s trustees and officers are also directors and officers of Vanguard.
C. Various inputs may be used to determine the value of the fund’s investments. These inputs are summarized in three broad levels for financial statement purposes. The inputs or methodologies used to value securities are not necessarily an indication of the risk associated with investing in those securities.
Level 1—Quoted prices in active markets for identical securities.
Level 2—Other significant observable inputs (including quoted prices for similar securities, interest rates, prepayment speeds, credit risk, etc.).
Level 3—Significant unobservable inputs (including the fund’s own assumptions used to determine the fair value of investments).
27
Tax-Managed Balanced Fund
The following table summarizes the fund’s investments as of June 30, 2009, based on the inputs used to value them:
| Level 1 | Level 2 | Level 3 |
Investments | ($000) | ($000) | ($000) |
Common Stocks | 293,852 | — | — |
Tax-Exempt Municipal Bonds | — | 315,646 | — |
Total | 293,852 | 315,646 | — |
D. Distributions are determined on a tax basis and may differ from net investment income and realized capital gains for financial reporting purposes. Differences may be permanent or temporary. Permanent differences are reclassified among capital accounts in the financial statements to reflect their tax character. Temporary differences arise when certain items of income, expense, gain, or loss are recognized in different periods for financial statement and tax purposes; these differences will reverse at some time in the future. Differences in classification may also result from the treatment of short-term gains as ordinary income for tax purposes.
The fund’s tax-basis capital gains and losses are determined only at the end of each fiscal year. For tax purposes, at December 31, 2008, the fund had available realized losses of $36,440,000 to offset future net capital gains of $7,309,000 through December 31, 2010, $9,343,000 through December 31, 2011, $7,026,000 through December 31, 2016, and $12,762,000 through December 31, 2017. The fund will use these capital losses to offset net taxable capital gains, if any, realized during the year ending December 31, 2009; should the fund realize net capital losses for the year, the losses will be added to the loss carryforward balances above.
At June 30, 2009, the cost of investment securities for tax purposes was $549,165,000. Net unrealized appreciation of investment securities for tax purposes was $60,333,000, consisting of unrealized gains of $82,404,000 on securities that had risen in value since their purchase and $22,071,000 in unrealized losses on securities that had fallen in value since their purchase.
E. During the six months ended June 30, 2009, the fund purchased $112,732,000 of investment securities and sold $57,666,000 of investment securities, other than temporary cash investments.
F. Capital shares issued and redeemed were:
| Six Months Ended |
| Year Ended |
| June 30, 2009 |
| December 31, 2008 |
| Shares |
| Shares |
| (000) |
| (000) |
Issued | 1,573 |
| 4,011 |
Issued in Lieu of Cash Distributions | 443 |
| 952 |
Redeemed | (1,830) |
| (3,987) |
Net Increase (Decrease) in Shares Outstanding | 186 |
| 976 |
G. In preparing the financial statements as of June 30, 2009, management considered the impact of subsequent events occurring through August 5, 2009, for potential recognition or disclosure in these financial statements.
28
Tax-Managed Growth and Income Fund
Fund Profile
As of June 30, 2009
Portfolio Characteristics |
|
| |
|
| Comparative | Broad |
| Fund | Index1 | Index2 |
Number of Stocks | 509 | 500 | 4,399 |
Median Market Cap | $39.8B | $39.8B | $24.2B |
Price/Earnings Ratio | 16.6x | 16.6x | 18.6x |
Price/Book Ratio | 2.0x | 2.0x | 1.9x |
Yield3 |
| 2.4% | 2.2% |
Investor Shares | 2.2% |
|
|
Admiral Shares | 2.3% |
|
|
Institutional Shares | 2.3% |
|
|
Return on Equity | 21.1% | 21.1% | 19.7% |
Earnings Growth Rate | 14.2% | 14.2% | 13.5% |
Foreign Holdings | 0.0% | 0.0% | 0.0% |
Turnover Rate4 | 8% | — | — |
Expense Ratio5 |
| — | — |
Investor Shares | 0.21% |
|
|
Admiral Shares | 0.15% |
|
|
Institutional Shares | 0.09% |
|
|
Short-Term Reserves | 0.1% | — | — |
Volatility Measures6 | ||
| Fund Versus | Fund Versus |
| Comparative Index1 | Broad Index2 |
R-Squared | 1.00 | 0.99 |
Beta | 1.00 | 0.97 |
Investment Focus

Sector Diversification (% of equity exposure) | |||
|
| Comparative | Broad |
| Fund | Index1 | Index2 |
Consumer Discretionary | 9.0% | 9.0% | 9.7% |
Consumer Staples | 12.0 | 12.0 | 10.4 |
Energy | 12.4 | 12.4 | 11.8 |
Financials | 13.6 | 13.6 | 15.0 |
Health Care | 14.0 | 14.0 | 13.6 |
Industrials | 9.8 | 9.9 | 10.3 |
Information Technology | 18.4 | 18.3 | 18.2 |
Materials | 3.2 | 3.2 | 3.6 |
Telecommunication |
|
|
|
Services | 3.5 | 3.5 | 3.2 |
Utilities | 4.1 | 4.1 | 4.2 |
Ten Largest Holdings7 (% of total net assets) | ||
|
|
|
ExxonMobil Corp. | integrated oil |
|
| and gas | 4.2% |
Microsoft Corp. | systems software | 2.3 |
Johnson & Johnson | pharmaceuticals | 1.9 |
The Procter & Gamble Co. | household products | 1.9 |
AT&T Inc. | integrated |
|
| telecommunication |
|
| services | 1.8 |
International Business |
|
|
Machines Corp. | computer hardware | 1.7 |
JPMorgan Chase & Co. | diversified financial |
|
| services | 1.7 |
Chevron Corp. | integrated oil |
|
| and gas | 1.7 |
Apple Inc. | computer hardware | 1.6 |
General Electric Co. | industrial |
|
| conglomerates | 1.5 |
Top Ten |
| 20.3% |
1 S&P 500 Index.
2 Dow Jones U.S. Total Stock Market Index.
3 30-day SEC yield for the fund; annualized dividend yield for the indexes. See the Glossary.
4 Annualized.
5 The expense ratios shown are from the prospectuses dated April 24, 2009, and represent estimated costs for the current fiscal year based on the fund’s net assets as of the prospectus date. For the six months ended June 30, 2009, the annualized expense ratios were 0.21% for Investor Shares, 0.15% for Admiral Shares, and 0.09% for Institutional Shares.
6 For an explanation of R-squared, beta, and other terms used here, see the Glossary.
7 The holdings listed exclude any temporary cash investments and equity index products.
29
Tax-Managed Growth and Income Fund
Performance Summary
All of the returns in this report represent past performance, which is not a guarantee of future results that may be achieved by the fund. (Current performance may be lower or higher than the performance data cited. For performance data current to the most recent month-end, visit our website at www.vanguard.com/performance.) Note, too, that both investment returns and principal value can fluctuate widely, so an investor’s shares, when sold, could be worth more or less than their original cost. The returns shown do not reflect taxes that a shareholder would pay on fund distributions or on the sale of fund shares.
Fiscal-Year Total Returns (%): December 31, 1998–June 30, 2009
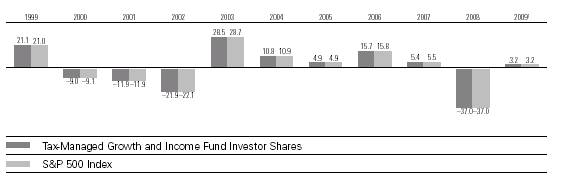
Average Annual Total Returns: Periods Ended June 30, 2009 | ||||
|
|
|
|
|
| Inception Date | One Year | Five Years | Ten Years |
Tax-Managed Growth and Income Fund |
|
|
|
|
Investor Shares2 | 9/6/1994 | –26.21% | –2.29% | –2.23% |
Fee-Adjusted Returns3 |
| –26.93 | –2.29 | –2.23 |
Admiral Shares | 11/12/2001 | –26.16 | –2.24 | –0.614 |
Fee-Adjusted Returns3 |
| –26.88 | –2.24 | –0.614 |
Institutional Shares | 3/4/1999 | –26.13 | –2.21 | –2.14 |
Fee-Adjusted Returns3 |
| –26.85 | –2.21 | –2.14 |
1 Six months ended June 30, 2009.
2 Total returns do not include the account service fee that may be applicable to certain accounts with balances below $10,000.
3 Reflective of the 1% fee assessed on redemptions of shares held in the fund for less than five years.
4 Return since inception.
Note: See Financial Highlights tables for dividend and capital gains information.
30
Tax-Managed Growth and Income Fund
Financial Statements (unaudited)
Statement of Net Assets
As of June 30, 2009
The fund provides a complete list of its holdings four times in each fiscal year, at the quarter-ends. For the second and fourth fiscal quarters, the lists appear in the fund’s semiannual and annual reports to shareholders. For the first and third fiscal quarters, the fund files the lists with the Securities and Exchange Commission on Form N-Q. Shareholders can look up the fund’s Forms N-Q on the SEC’s website at www.sec.gov. Forms N-Q may also be reviewed and copied at the SEC’s Public Reference Room (see the back cover of this report for further information).
|
|
| Market |
|
|
| Value• |
|
| Shares | ($000) |
Common Stocks (100.0%) |
|
| |
Consumer Discretionary (9.0%) |
|
| |
| McDonald’s Corp. | 255,005 | 14,660 |
| The Walt Disney Co. | 429,072 | 10,010 |
| Home Depot, Inc. | 392,392 | 9,272 |
| Comcast Corp. Class A | 632,990 | 9,172 |
| Time Warner Inc. | 276,657 | 6,969 |
| Target Corp. | 174,036 | 6,869 |
| Lowe’s Cos., Inc. | 341,238 | 6,624 |
* | Amazon.com, Inc. | 74,421 | 6,226 |
| News Corp., Class A | 531,844 | 4,845 |
| NIKE, Inc. Class B | 89,572 | 4,638 |
* | Ford Motor Co. | 743,437 | 4,513 |
| Yum! Brands, Inc. | 106,760 | 3,559 |
| Staples, Inc. | 165,640 | 3,341 |
* | Viacom Inc. Class B | 140,353 | 3,186 |
* | Kohl’s Corp. | 70,701 | 3,023 |
| TJX Cos., Inc. | 95,668 | 3,010 |
* | DIRECTV Group, Inc. | 121,300 | 2,997 |
| Johnson Controls, Inc. | 137,227 | 2,981 |
| Best Buy Co., Inc. | 78,718 | 2,636 |
| Carnival Corp. | 101,367 | 2,612 |
| Time Warner Cable Inc. | 81,431 | 2,579 |
* | Starbucks Corp. | 170,441 | 2,368 |
| Omnicom Group Inc. | 71,922 | 2,271 |
| The McGraw-Hill Cos., Inc. | 72,679 | 2,188 |
| Coach, Inc. | 73,509 | 1,976 |
* | Bed Bath & Beyond, Inc. | 59,914 | 1,842 |
* | Apollo Group, Inc. Class A | 24,985 | 1,777 |
| The Gap, Inc. | 106,410 | 1,745 |
| Marriott International, Inc. |
|
|
| Class A | 68,327 | 1,508 |
| J.C. Penney Co., Inc. |
|
|
| (Holding Co.) | 51,575 | 1,481 |
| H & R Block, Inc. | 78,498 | 1,353 |
| Mattel, Inc. | 83,116 | 1,334 |
* | AutoZone Inc. | 8,282 | 1,252 |
| Genuine Parts Co. | 36,718 | 1,232 |
| Sherwin-Williams Co. | 22,734 | 1,222 |
| Fortune Brands, Inc. | 34,720 | 1,206 |
* | O’Reilly Automotive, Inc. | 31,448 | 1,198 |
| Macy’s Inc. | 97,479 | 1,146 |
| VF Corp. | 20,402 | 1,129 |
| International Game |
|
|
| Technology | 68,278 | 1,086 |
| CBS Corp. | 155,628 | 1,077 |
| Darden Restaurants Inc. | 31,511 | 1,039 |
| Starwood Hotels & |
|
|
| Resorts Worldwide, Inc. | 43,308 | 962 |
| Family Dollar Stores, Inc. | 32,276 | 913 |
| Harley-Davidson, Inc. | 54,427 | 882 |
* | GameStop Corp. Class A | 37,941 | 835 |
* | Sears Holdings Corp. | 12,488 | 831 |
| Limited Brands, Inc. | 62,468 | 748 |
| Nordstrom, Inc. | 37,036 | 737 |
* | Expedia, Inc. | 48,526 | 733 |
| Tiffany & Co. | 28,683 | 727 |
| Whirlpool Corp. | 16,992 | 723 |
| DeVry, Inc. | 14,289 | 715 |
| Polo Ralph Lauren Corp. | 13,135 | 703 |
| Hasbro, Inc. | 28,605 | 693 |
| Newell Rubbermaid, Inc. | 63,909 | 665 |
* | The Goodyear Tire & |
|
|
| Rubber Co. | 55,543 | 625 |
| The Stanley Works | 18,166 | 615 |
| D. R. Horton, Inc. | 64,215 | 601 |
| Scripps Networks Interactive | 20,761 | 578 |
* | Interpublic Group |
|
|
| of Cos., Inc. | 111,089 | 561 |
| Leggett & Platt, Inc. | 36,481 | 556 |
* | Wynn Resorts Ltd. | 15,553 | 549 |
| Abercrombie & Fitch Co. | 20,208 | 513 |
| Wyndham Worldwide Corp. | 40,996 | 497 |
| Washington Post Co. |
|
|
| Class B | 1,388 | 489 |
| Comcast Corp. Special |
|
|
| Class A | 33,914 | 478 |
| Pulte Homes, Inc. | 49,824 | 440 |
* | AutoNation, Inc. | 24,749 | 429 |
| RadioShack Corp. | 29,156 | 407 |
* | Big Lots Inc. | 19,252 | 405 |
31
Tax-Managed Growth and Income Fund
|
|
| Market | |
|
|
| Value• | |
|
| Shares | ($000) | |
| Black & Decker Corp. | 13,986 | 401 | |
| Snap-On Inc. | 13,367 | 384 | |
| Lennar Corp. Class A | 33,169 | 321 | |
| Harman International |
|
| |
| Industries, Inc. | 16,081 | 302 | |
* | Office Depot, Inc. | 64,497 | 294 | |
| Centex Corp. | 28,906 | 245 | |
| KB Home | 17,022 | 233 | |
| Meredith Corp. | 8,325 | 213 | |
| Gannett Co., Inc. | 52,125 | 186 | |
| Eastman Kodak Co. | 62,216 | 184 | |
| New York Times Co. |
|
| |
| Class A | 27,902 | 154 | |
| CBS Corp. Class A | 1,900 | 13 | |
* | Viacom Inc. Class A | 82 | 2 | |
|
|
| 166,694 | |
Consumer Staples (12.0%) |
|
| ||
| The Procter & Gamble Co. | 673,778 | 34,430 | |
| Wal-Mart Stores, Inc. | 515,879 | 24,989 | |
| The Coca-Cola Co. | 460,157 | 22,083 | |
| PepsiCo, Inc. | 359,864 | 19,778 | |
| Philip Morris |
|
| |
| International Inc. | 453,405 | 19,778 | |
| CVS Caremark Corp. | 336,379 | 10,720 | |
| Kraft Foods Inc. | 340,543 | 8,629 | |
| Colgate-Palmolive Co. | 115,448 | 8,167 | |
| Altria Group, Inc. | 478,141 | 7,837 | |
| Walgreen Co. | 229,294 | 6,741 | |
| Kimberly-Clark Corp. | 95,832 | 5,024 | |
| Costco Wholesale Corp. | 100,202 | 4,579 | |
| General Mills, Inc. | 75,955 | 4,255 | |
| Archer-Daniels-Midland Co. | 148,514 | 3,976 | |
| The Kroger Co. | 151,047 | 3,331 | |
| Sysco Corp. | 136,355 | 3,065 | |
| Kellogg Co. | 58,373 | 2,718 | |
| Lorillard, Inc. | 38,906 | 2,637 | |
| H.J. Heinz Co. | 72,923 | 2,603 | |
| Avon Products, Inc. | 98,721 | 2,545 | |
| Safeway, Inc. | 98,575 | 2,008 | |
| ConAgra Foods, Inc. | 103,457 | 1,972 | |
| The Clorox Co. | 32,258 | 1,801 | |
| Sara Lee Corp. | 160,958 | 1,571 | |
| Reynolds American Inc. | 39,200 | 1,514 | |
| Molson Coors Brewing Co. |
|
| |
| Class B | 34,450 | 1,458 | |
| The Hershey Co. | 38,435 | 1,384 | |
| Campbell Soup Co. | 46,222 | 1,360 | |
| J.M. Smucker Co. | 27,358 | 1,331 | |
* | Dr. Pepper Snapple |
|
| |
| Group, Inc. | 58,814 | 1,246 | |
| Coca-Cola Enterprises, Inc. | 73,560 | 1,225 | |
| The Pepsi Bottling |
|
| |
| Group, Inc. | 31,486 | 1,066 | |
| McCormick & Co., Inc. | 29,943 | 974 | |
| Brown-Forman Corp. |
|
| |
| Class B | 22,630 | 973 | |
| Tyson Foods, Inc. | 69,851 | 881 |
| The Estee Lauder Cos. Inc. |
|
|
| Class A | 26,937 | 880 |
* | Dean Foods Co. | 40,700 | 781 |
| SUPERVALU Inc. | 48,846 | 633 |
| Whole Foods Market, Inc. | 32,756 | 622 |
* | Constellation Brands, Inc. |
|
|
| Class A | 45,295 | 574 |
| Hormel Foods Corp. | 16,100 | 556 |
|
|
| 222,695 |
Energy (12.4%) |
|
| |
| ExxonMobil Corp. | 1,127,991 | 78,858 |
| Chevron Corp. | 463,408 | 30,701 |
| Schlumberger Ltd. | 276,512 | 14,962 |
| ConocoPhillips Co. | 342,422 | 14,402 |
| Occidental Petroleum Corp. | 187,480 | 12,338 |
| Apache Corp. | 77,570 | 5,597 |
| Devon Energy Corp. | 102,606 | 5,592 |
| Anadarko Petroleum Corp. | 115,286 | 5,233 |
| XTO Energy, Inc. | 133,938 | 5,108 |
| Marathon Oil Corp. | 163,478 | 4,925 |
| Halliburton Co. | 207,528 | 4,296 |
| EOG Resources, Inc. | 57,761 | 3,923 |
| Hess Corp. | 65,751 | 3,534 |
* | National Oilwell Varco Inc. | 96,493 | 3,151 |
* | Southwestern Energy Co. | 79,600 | 3,092 |
| Baker Hughes Inc. | 71,710 | 2,613 |
| Chesapeake Energy Corp. | 130,491 | 2,588 |
| Spectra Energy Corp. | 149,236 | 2,525 |
| Murphy Oil Corp. | 44,156 | 2,398 |
| Noble Energy, Inc. | 40,055 | 2,362 |
| Valero Energy Corp. | 128,960 | 2,178 |
| Williams Cos., Inc. | 134,035 | 2,092 |
| Peabody Energy Corp. | 61,980 | 1,869 |
| Range Resources Corp. | 36,336 | 1,505 |
| El Paso Corp. | 161,720 | 1,493 |
* | Cameron |
|
|
| International Corp. | 50,100 | 1,418 |
| CONSOL Energy, Inc. | 41,719 | 1,417 |
| Diamond Offshore |
|
|
| Drilling, Inc. | 16,051 | 1,333 |
| Smith International, Inc. | 50,786 | 1,308 |
| ENSCO International, Inc. | 32,800 | 1,144 |
* | FMC Technologies Inc. | 28,558 | 1,073 |
* | Nabors Industries, Inc. | 65,702 | 1,024 |
| BJ Services Co. | 67,560 | 921 |
* | Denbury Resources, Inc. | 57,893 | 853 |
| Cabot Oil & Gas Corp. | 24,089 | 738 |
| Pioneer Natural |
|
|
| Resources Co. | 26,370 | 672 |
| Sunoco, Inc. | 27,288 | 633 |
| Rowan Cos., Inc. | 26,286 | 508 |
32
Tax-Managed Growth and Income Fund
|
|
| Market |
|
|
| Value• |
|
| Shares | ($000) |
| Tesoro Corp. | 32,334 | 412 |
| Massey Energy Co. | 19,584 | 383 |
|
|
| 231,172 |
Financials (13.5%) |
|
| |
| JPMorgan Chase & Co. | 901,790 | 30,760 |
| Wells Fargo & Co. | 1,076,300 | 26,111 |
| Bank of America Corp. | 1,869,528 | 24,678 |
| The Goldman Sachs |
|
|
| Group, Inc. | 116,376 | 17,158 |
| Morgan Stanley | 312,614 | 8,913 |
| Bank of New York |
|
|
| Mellon Corp. | 276,347 | 8,100 |
| U.S. Bancorp | 438,976 | 7,866 |
| American Express Co. | 274,494 | 6,379 |
| MetLife, Inc. | 189,218 | 5,678 |
| The Travelers Cos., Inc. | 135,246 | 5,550 |
| State Street Corp. | 114,060 | 5,384 |
| CME Group, Inc. | 15,331 | 4,770 |
| PNC Financial |
|
|
| Services Group | 106,287 | 4,125 |
| Prudential Financial, Inc. | 106,941 | 3,980 |
| Charles Schwab Corp. | 217,114 | 3,808 |
| AFLAC Inc. | 107,949 | 3,356 |
| BB&T Corp. | 149,848 | 3,294 |
| Simon Property |
|
|
| Group, Inc. REIT | 63,630 | 3,272 |
| The Chubb Corp. | 81,417 | 3,247 |
| The Allstate Corp. | 123,982 | 3,025 |
| Northern Trust Corp. | 55,648 | 2,987 |
| Franklin Resources, Inc. | 34,826 | 2,508 |
| T. Rowe Price Group Inc. | 59,080 | 2,462 |
| Marsh & |
|
|
| McLennan Cos., Inc. | 121,050 | 2,437 |
| Aon Corp. | 64,129 | 2,428 |
* | Progressive Corp. of Ohio | 156,693 | 2,368 |
| Loews Corp. | 83,383 | 2,285 |
| Capital One Financial Corp. | 103,986 | 2,275 |
| Citigroup Inc. | 700,898 | 2,082 |
* | Intercontinental- |
|
|
| Exchange Inc. | 16,834 | 1,923 |
| Public Storage, Inc. REIT | 29,053 | 1,902 |
| SunTrust Banks, Inc. | 107,199 | 1,763 |
| Invesco, Ltd. | 95,286 | 1,698 |
| Vornado Realty Trust REIT | 36,770 | 1,656 |
| NYSE Euronext | 59,897 | 1,632 |
| Hudson City Bancorp, Inc. | 120,300 | 1,599 |
| Boston Properties, Inc. |
|
|
| REIT | 32,103 | 1,531 |
| Ameriprise Financial, Inc. | 59,142 | 1,435 |
| Equity Residential REIT | 63,155 | 1,404 |
| The Principal Financial |
|
|
| Group, Inc. | 71,918 | 1,355 |
| HCP , Inc. REIT | 63,046 | 1,336 |
| Unum Group | 76,920 | 1,220 |
| People’s United |
|
|
| Financial Inc. | 80,812 | 1,215 |
| Fifth Third Bancorp | 170,239 | 1,209 |
| Lincoln National Corp. | 68,725 | 1,183 |
| Moody’s Corp. | 44,360 | 1,169 |
| Host Hotels & |
|
|
| Resorts Inc. REIT | 139,248 | 1,168 |
| Discover Financial Services | 111,288 | 1,143 |
| Plum Creek Timber Co. Inc. |
|
|
| REIT | 37,635 | 1,121 |
* | SLM Corp. | 107,804 | 1,107 |
| Ventas, Inc. REIT | 36,408 | 1,087 |
| Regions Financial Corp. | 267,513 | 1,081 |
| Avalonbay |
|
|
| Communities, Inc. REIT | 18,503 | 1,035 |
| M & T Bank Corp. | 19,019 | 969 |
| XL Capital Ltd. Class A | 79,220 | 908 |
| The Hartford Financial |
|
|
| Services Group Inc. | 75,524 | 896 |
* | Leucadia National Corp. | 41,794 | 881 |
| Health Care Inc. REIT | 25,772 | 879 |
| KeyCorp | 163,940 | 859 |
| Cincinnati Financial Corp. | 37,495 | 838 |
| ProLogis REIT | 102,818 | 829 |
| Legg Mason Inc. | 33,167 | 809 |
| Kimco Realty Corp. REIT | 75,023 | 754 |
| Comerica, Inc. | 35,213 | 745 |
| American International |
|
|
| Group, Inc. | 623,854 | 724 |
| Torchmark Corp. | 19,046 | 705 |
| Genworth Financial Inc. | 100,226 | 701 |
* | Nasdaq OMX Group, Inc. | 31,835 | 678 |
| Assurant, Inc. | 27,009 | 651 |
| First Horizon National Corp. | 50,072 | 601 |
| Huntington Bancshares Inc. | 125,923 | 526 |
* | CB Richard Ellis Group, Inc. | 54,821 | 513 |
| Federated Investors, Inc. | 20,495 | 494 |
| Janus Capital Group Inc. | 36,389 | 415 |
| Marshall & Ilsley Corp. | 81,808 | 393 |
| Zions Bancorp | 26,833 | 310 |
* | E*TRADE Financial Corp. | 230,185 | 295 |
| Apartment Investment & |
|
|
| Management Co. |
|
|
| Class A REIT | 26,792 | 237 |
| CIT Group Inc. | 89,782 | 193 |
* | MBIA, Inc. | 40,085 | 174 |
|
|
| 251,235 |
Health Care (14.0%) |
|
| |
| Johnson & Johnson | 636,937 | 36,178 |
| Pfizer Inc. 1 | ,559,867 | 23,398 |
| Abbott Laboratories | 357,187 | 16,802 |
| Wyeth | 308,247 | 13,991 |
| Merck & Co., Inc. | 487,377 | 13,627 |
* | Amgen Inc. | 234,023 | 12,389 |
* | Gilead Sciences, Inc. | 209,460 | 9,811 |
33
Tax-Managed Growth and Income Fund
|
|
| Market |
|
|
| Value• |
|
| Shares | ($000) |
| Schering-Plough Corp. | 376,429 | 9,456 |
| Bristol-Myers Squibb Co. | 458,249 | 9,307 |
| Medtronic, Inc. | 258,414 | 9,016 |
| Eli Lilly & Co. | 233,847 | 8,100 |
| Baxter International, Inc. | 139,808 | 7,404 |
| UnitedHealth Group Inc. | 274,921 | 6,868 |
* | WellPoint Inc. | 111,888 | 5,694 |
* | Medco Health |
|
|
| Solutions, Inc. | 111,602 | 5,090 |
* | Celgene Corp. | 106,379 | 5,089 |
* | Express Scripts Inc. | 62,686 | 4,310 |
| Becton, Dickinson & Co. | 55,472 | 3,956 |
* | Thermo Fisher |
|
|
| Scientific, Inc. | 96,794 | 3,946 |
* | Boston Scientific Corp. | 348,034 | 3,529 |
* | Genzyme Corp. | 62,420 | 3,475 |
| Allergan, Inc. | 71,098 | 3,383 |
* | St. Jude Medical, Inc. | 80,105 | 3,292 |
* | Biogen Idec Inc. | 66,808 | 3,016 |
| McKesson Corp. | 62,805 | 2,763 |
| Aetna Inc. | 103,448 | 2,591 |
| Cardinal Health, Inc. | 83,159 | 2,541 |
| Stryker Corp. | 55,098 | 2,190 |
* | Zimmer Holdings, Inc. | 49,728 | 2,118 |
| Quest Diagnostics, Inc. | 34,754 | 1,961 |
* | Forest Laboratories, Inc. | 69,517 | 1,746 |
| C.R. Bard, Inc. | 23,014 | 1,713 |
* | Laboratory Corp. of |
|
|
| America Holdings | 25,000 | 1,695 |
* | Life Technologies Corp. | 40,419 | 1,686 |
| CIGNA Corp. | 63,110 | 1,520 |
* | Intuitive Surgical, Inc. | 8,759 | 1,434 |
* | Hospira, Inc. | 36,994 | 1,425 |
* | Humana Inc. | 39,059 | 1,260 |
| AmerisourceBergen Corp. | 69,844 | 1,239 |
* | DaVita, Inc. | 23,991 | 1,187 |
* | Waters Corp. | 22,258 | 1,146 |
| DENTSPLY |
|
|
| International Inc. | 34,453 | 1,052 |
* | Varian Medical |
|
|
| Systems, Inc. | 28,749 | 1,010 |
* | Cephalon, Inc. | 16,992 | 963 |
* | Mylan Inc. | 70,519 | 920 |
* | Millipore Corp. | 12,874 | 904 |
* | Watson |
|
|
| Pharmaceuticals, Inc. | 24,077 | 811 |
* | Coventry Health Care Inc. | 34,280 | 641 |
* | King Pharmaceuticals, Inc. | 57,432 | 553 |
| IMS Health, Inc. | 42,504 | 540 |
| PerkinElmer, Inc. | 26,837 | 467 |
* | Patterson Companies, Inc. | 21,040 | 457 |
* | Tenet Healthcare Corp. | 96,817 | 273 |
|
|
| 259,933 |
Industrials (9.8%) |
|
| |
| General Electric Co. | 2,448,023 | 28,691 |
| United Parcel Service, Inc. | 229,877 | 11,492 |
| United Technologies Corp. | 217,859 | 11,320 |
| 3M Co. | 160,483 | 9,645 |
| The Boeing Co. | 167,923 | 7,137 |
| Lockheed Martin Corp. | 75,414 | 6,082 |
| Union Pacific Corp. | 116,620 | 6,071 |
| Emerson Electric Co. | 173,560 | 5,623 |
| Honeywell |
|
|
| International Inc. | 171,914 | 5,398 |
| General Dynamics Corp. | 89,022 | 4,931 |
| Burlington Northern |
|
|
| Santa Fe Corp. | 64,284 | 4,728 |
| Caterpillar, Inc. | 139,083 | 4,595 |
| FedEx Corp. | 72,097 | 4,010 |
| Raytheon Co. | 88,955 | 3,952 |
| Deere & Co. | 97,800 | 3,907 |
| Danaher Corp. | 59,046 | 3,646 |
| Northrop Grumman Corp. | 74,854 | 3,419 |
| Illinois Tool Works, Inc. | 88,939 | 3,321 |
| Norfolk Southern Corp. | 85,024 | 3,203 |
| Waste Management, Inc. | 113,630 | 3,200 |
| CSX Corp. | 90,546 | 3,136 |
| PACCAR, Inc. | 83,999 | 2,731 |
| Precision Castparts Corp. | 32,403 | 2,366 |
| Fluor Corp. | 41,608 | 2,134 |
| C.H. Robinson |
|
|
| Worldwide Inc. | 39,122 | 2,040 |
| ITT Industries, Inc. | 42,202 | 1,878 |
| L-3 Communications |
|
|
| Holdings, Inc. | 26,897 | 1,866 |
| Republic Services, Inc. |
|
|
| Class A | 74,636 | 1,822 |
| Eaton Corp. | 38,259 | 1,707 |
| Cummins Inc. | 46,684 | 1,644 |
| Expeditors International of |
|
|
| Washington, Inc. | 49,120 | 1,638 |
| Parker Hannifin Corp. | 37,120 | 1,595 |
| Rockwell Collins, Inc. | 36,692 | 1,531 |
| Dover Corp. | 43,106 | 1,426 |
| Goodrich Corp. | 28,478 | 1,423 |
* | Jacobs Engineering |
|
|
| Group Inc. | 28,385 | 1,195 |
* | Iron Mountain, Inc. | 41,555 | 1,195 |
| Cooper Industries, Inc. |
|
|
| Class A | 38,466 | 1,194 |
| W.W. Grainger, Inc. | 14,403 | 1,179 |
| Southwest Airlines Co. | 171,686 | 1,156 |
| Rockwell Automation, Inc. | 32,633 | 1,048 |
| Pitney Bowes, Inc. | 47,701 | 1,046 |
* | Quanta Services, Inc. | 45,049 | 1,042 |
* | Stericycle, Inc. | 19,474 | 1,004 |
| The Dun & |
|
|
| Bradstreet Corp. | 12,339 | 1,002 |
| Fastenal Co. | 29,941 | 993 |
| Flowserve Corp. | 12,868 | 898 |
| Robert Half |
|
|
| International, Inc. | 35,001 | 827 |
34
Tax-Managed Growth and Income Fund
|
|
| Market |
|
|
| Value• |
|
| Shares | ($000) |
| Masco Corp. | 83,219 | 797 |
| Equifax, Inc. | 29,087 | 759 |
| Pall Corp. | 27,195 | 722 |
| Cintas Corp. | 30,602 | 699 |
| Avery Dennison Corp. | 26,087 | 670 |
| Textron, Inc. | 60,808 | 587 |
| R.R. Donnelley & Sons Co. | 47,708 | 554 |
| Ryder System, Inc. | 12,904 | 360 |
* | Monster Worldwide Inc. | 29,482 | 348 |
| The Manitowoc Co., Inc. | 31,000 | 163 |
| Ingersoll-Rand Co. | 2,767 | 58 |
* | Raytheon Co. |
|
|
| Warrants Exp. 6/16/11 | 2,287 | 22 |
|
|
| 182,826 |
Information Technology (18.4%) |
| ||
| Microsoft Corp. | 1,769,276 | 42,056 |
| International Business |
|
|
| Machines Corp. | 305,414 | 31,891 |
* | Apple Inc. | 206,209 | 29,370 |
* | Cisco Systems, Inc. | 1,333,382 | 24,854 |
* | Google Inc. | 55,507 | 23,401 |
| Intel Corp. | 1,291,045 | 21,367 |
| Hewlett-Packard Co. | 551,605 | 21,320 |
| Oracle Corp. | 875,455 | 18,752 |
| QUALCOMM Inc. | 382,542 | 17,291 |
| Texas Instruments, Inc. | 294,352 | 6,270 |
* | EMC Corp. | 465,601 | 6,099 |
| Corning, Inc. | 359,483 | 5,773 |
* | Dell Inc. | 401,912 | 5,518 |
* | Yahoo! Inc. | 322,400 | 5,049 |
* | eBay Inc. | 250,000 | 4,283 |
| Automatic Data |
|
|
| Processing, Inc. | 116,103 | 4,115 |
| Motorola, Inc. | 530,809 | 3,519 |
* | Adobe Systems, Inc. | 121,090 | 3,427 |
| Applied Materials, Inc. | 307,755 | 3,376 |
* | Symantec Corp. | 189,355 | 2,946 |
* | Juniper Networks, Inc. | 121,189 | 2,860 |
| MasterCard, Inc. Class A | 16,773 | 2,806 |
| Western Union Co. | 162,322 | 2,662 |
* | Broadcom Corp. | 98,645 | 2,445 |
* | Intuit, Inc. | 74,444 | 2,096 |
| Paychex, Inc. | 74,275 | 1,872 |
* | Cognizant Technology |
|
|
| Solutions Corp. | 67,710 | 1,808 |
| Analog Devices, Inc. | 67,117 | 1,663 |
* | Fiserv, Inc. | 35,991 | 1,645 |
* | Electronic Arts Inc. | 74,555 | 1,619 |
* | Agilent Technologies, Inc. | 79,447 | 1,614 |
| CA, Inc. | 91,535 | 1,595 |
* | Sun Microsystems, Inc. | 172,407 | 1,590 |
* | Computer Sciences Corp. | 35,114 | 1,556 |
* | NetApp, Inc. | 76,618 | 1,511 |
* | McAfee Inc. | 35,700 | 1,506 |
* | BMC Software, Inc. | 42,685 | 1,442 |
* | NVIDIA Corp. | 126,481 | 1,428 |
* | Citrix Systems, Inc. | 41,900 | 1,336 |
| Xerox Corp. | 200,735 | 1,301 |
| Xilinx, Inc. | 63,486 | 1,299 |
| Amphenol Corp. Class A | 39,703 | 1,256 |
* | Western Digital Corp. | 46,112 | 1,222 |
| Linear Technology Corp. | 51,397 | 1,200 |
| Altera Corp. | 67,591 | 1,100 |
* | Affiliated Computer |
|
|
| Services, Inc. Class A | 22,500 | 999 |
| KLA-Tencor Corp. | 39,459 | 996 |
* | Micron Technology, Inc. | 196,109 | 992 |
* | Autodesk, Inc. | 52,233 | 991 |
| Microchip Technology, Inc. | 42,039 | 948 |
* | salesforce.com, inc. | 24,533 | 936 |
* | Teradata Corp. | 39,779 | 932 |
* | MEMC Electronic |
|
|
| Materials, Inc. | 51,904 | 924 |
| Fidelity National Information |
|
|
| Services, Inc. | 44,401 | 886 |
| Harris Corp. | 30,600 | 868 |
* | VeriSign, Inc. | 44,831 | 829 |
* | FLIR Systems, Inc. | 34,996 | 790 |
* | SanDisk Corp. | 52,185 | 767 |
* | Akamai Technologies, Inc. | 39,573 | 759 |
* | LSI Corp. | 150,952 | 688 |
| Total System Services, Inc. | 46,044 | 617 |
| National |
|
|
| Semiconductor Corp. | 45,216 | 568 |
* | Tellabs, Inc. | 91,115 | 522 |
* | Advanced Micro |
|
|
| Devices, Inc. | 130,445 | 505 |
| Molex, Inc. | 32,122 | 500 |
* | Compuware Corp. | 56,676 | 389 |
* | Novellus Systems, Inc. | 22,548 | 377 |
| Jabil Circuit, Inc. | 49,520 | 367 |
* | Novell, Inc. | 80,781 | 366 |
* | QLogic Corp. | 27,280 | 346 |
* | Tyco Electronics Ltd. | 18,487 | 344 |
* | Lexmark International, Inc. | 18,108 | 287 |
* | JDS Uniphase Corp. | 50,091 | 287 |
* | Teradyne, Inc. | 40,200 | 276 |
* | Convergys Corp. | 28,600 | 265 |
* | Ciena Corp. | 20,565 | 213 |
|
|
| 342,643 |
Materials (3.2%) |
|
| |
| Monsanto Co. | 126,139 | 9,377 |
| E.I. du Pont de |
|
|
| Nemours & Co. | 208,731 | 5,348 |
| Praxair, Inc. | 71,084 | 5,052 |
| Freeport-McMoRan |
|
|
| Copper & Gold, Inc. |
|
|
| Class B | 95,115 | 4,766 |
| Newmont Mining Corp. |
|
|
| (Holding Co.) | 113,148 | 4,624 |
| Dow Chemical Co. | 248,509 | 4,011 |
| Nucor Corp. | 72,540 | 3,223 |
35
Tax-Managed Growth and Income Fund
|
|
| Market | |
|
|
| Value• | |
|
| Shares | ($000) | |
| Air Products & |
|
| |
| Chemicals, Inc. | 48,462 | 3,130 | |
| Alcoa Inc. | 225,596 | 2,330 | |
| PPG Industries, Inc. | 38,104 | 1,673 | |
| Ecolab, Inc. | 38,860 | 1,515 | |
| International Paper Co. | 99,263 | 1,502 | |
| Weyerhaeuser Co. | 49,028 | 1,492 | |
| Sigma-Aldrich Corp. | 28,320 | 1,404 | |
| Vulcan Materials Co. | 28,060 | 1,209 | |
| United States Steel Corp. | 33,260 | 1,189 | |
* | Owens-Illinois, Inc. | 38,645 | 1,083 | |
| Ball Corp. | 21,787 | 984 | |
| CF Industries Holdings, Inc. | 11,289 | 837 | |
| Allegheny Technologies Inc. | 22,600 | 789 | |
| Sealed Air Corp. | 36,392 | 671 | |
* | Pactiv Corp. | 30,377 | 659 | |
| MeadWestvaco Corp. | 39,899 | 655 | |
| Eastman Chemical Co. | 16,962 | 643 | |
| International Flavors & |
|
| |
| Fragrances, Inc. | 18,234 | 597 | |
| Bemis Co., Inc. | 23,250 | 586 | |
| AK Steel Holding Corp. | 25,100 | 482 | |
| Titanium Metals Corp. | 19,400 | 178 | |
|
|
| 60,009 | |
Other (0.1%) |
|
| ||
1 | Miscellaneous Securities |
| 1,472 | |
|
|
|
| |
Telecommunication Services (3.5%) |
| |||
| AT&T Inc. | 1,363,914 | 33,879 | |
| Verizon |
|
| |
| Communications Inc. | 656,591 | 20,177 | |
* | Sprint Nextel Corp. | 664,908 | 3,198 | |
* | American Tower Corp. |
|
| |
| Class A | 92,113 | 2,904 | |
| Qwest Communications |
|
| |
| International Inc. | 340,399 | 1,413 | |
| Embarq Corp. | 32,885 | 1,383 | |
| Windstream Corp. | 101,038 | 845 | |
* | MetroPCS |
|
| |
| Communications Inc. | 58,528 | 779 | |
| CenturyTel, Inc. | 23,353 | 717 | |
| Frontier |
|
| |
| Communications Corp. | 72,359 | 517 | |
|
|
| 65,812 | |
Utilities (4.1%) |
|
| ||
| Exelon Corp. | 152,283 | 7,798 | |
| Southern Co. | 180,808 | 5,634 | |
| FPL Group, Inc. | 94,995 | 5,401 | |
| Dominion Resources, Inc. | 136,228 | 4,553 | |
| Duke Energy Corp. | 296,850 | 4,331 | |
| Public Service Enterprise |
|
| |
| Group, Inc. | 116,990 | 3,817 | |
| Entergy Corp. | 45,245 | 3,507 | |
| PG&E Corp. | 84,898 | 3,263 | |
| American Electric |
|
| |
| Power Co., Inc. | 110,398 | 3,189 | |
| PPL Corp. | 86,989 | 2,867 | |
| Sempra Energy | 56,432 | 2,801 |
| FirstEnergy Corp. | 70,440 | 2,730 |
| Progress Energy, Inc. | 64,390 | 2,436 |
| Consolidated Edison Inc. | 63,482 | 2,376 |
| Edison International | 75,479 | 2,375 |
| Xcel Energy, Inc. | 105,274 | 1,938 |
* | AES Corp. | 154,135 | 1,790 |
| Questar Corp. | 40,268 | 1,251 |
| Ameren Corp. | 49,461 | 1,231 |
| Constellation Energy |
|
|
| Group, Inc. | 46,076 | 1,225 |
| DTE Energy Co. | 37,679 | 1,206 |
| Wisconsin Energy Corp. | 27,006 | 1,099 |
| EQT Corp. | 30,284 | 1,057 |
| Allegheny Energy, Inc. | 39,100 | 1,003 |
| SCANA Corp. | 28,088 | 912 |
| CenterPoint Energy Inc. | 80,488 | 892 |
| Northeast Utilities | 39,959 | 892 |
| NiSource, Inc. | 63,143 | 736 |
| Pinnacle West Capital Corp. | 23,540 | 710 |
| Pepco Holdings, Inc. | 50,555 | 679 |
| CMS Energy Corp. | 52,881 | 639 |
| TECO Energy, Inc. | 49,610 | 592 |
| Integrys Energy Group, Inc. | 17,753 | 532 |
| Nicor Inc. | 10,480 | 363 |
* | Dynegy, Inc. | 117,202 | 266 |
|
|
| 76,091 |
Total Common Stocks |
|
| |
(Cost $1,781,171) |
| 1,860,582 | |
Temporary Cash Investment (0.1%) |
| ||
Money Market Fund (0.1%) |
|
| |
2 | Vanguard Market |
|
|
| Liquidity Fund, 0.395% |
|
|
| (Cost $2,110) 2,109,955 | 2,110 | |
Total Investments (100.1%) |
|
| |
(Cost $1,783,281) |
| 1,862,692 | |
Other Assets and Liabilities (–0.1%) |
| ||
Other Assets |
| 6,006 | |
Liabilities |
| (8,309) | |
|
|
| (2,303) |
Net Assets (100%) |
| 1,860,389 | |
36
Tax-Managed Growth and Income Fund
At June 30, 2009, net assets consisted of: | |
| Amount |
| ($000) |
Paid-in Capital | 2,286,785 |
Overdistributed Net Investment Income | (4,369) |
Accumulated Net Realized Losses | (501,438) |
Unrealized Appreciation (Depreciation) | 79,411 |
Net Assets | 1,860,389 |
|
|
|
|
Investor Shares—Net Assets |
|
Applicable to 20,661,615 outstanding |
|
$.001 par value shares of beneficial |
|
interest (unlimited authorization) | 414,116 |
Net Asset Value Per Share— |
|
Investor Shares | $20.04 |
|
|
|
|
Admiral Shares—Net Assets |
|
Applicable to 29,834,919 outstanding |
|
$.001 par value shares of beneficial |
|
interest (unlimited authorization) | 1,228,901 |
Net Asset Value Per Share— |
|
Admiral Shares | $41.19 |
|
|
|
|
Institutional Shares—Net Assets |
|
Applicable to 10,844,838 outstanding |
|
$.001 par value shares of beneficial |
|
interest (unlimited authorization) | 217,372 |
Net Asset Value Per Share— |
|
Institutional Shares | $20.04 |
• See Note A in Notes to Financial Statements.
* Non-income-producing security.
1 Securities representing up to 5% of the market value of unaffiliated securities are permitted to be combined and reported as “miscellaneous securities” provided that they have been held for less than one year and not previously reported by name.
2 Affiliated money market fund available only to Vanguard funds and certain trusts and accounts managed by Vanguard. Rate shown is the 7-day yield.
REIT—Real Estate Investment Trust.
See accompanying Notes, which are an integral part of the Financial Statements.
37
Tax-Managed Growth and Income Fund
Statement of Operations
| Six Months Ended |
| June 30, 2009 |
| ($000) |
Investment Income |
|
Income |
|
Dividends | 22,727 |
Interest1 | 5 |
Total Income | 22,732 |
Expenses |
|
The Vanguard Group—Note B |
|
Investment Advisory Services | 81 |
Management and Administrative—Investor Shares | 301 |
Management and Administrative—Admiral Shares | 581 |
Management and Administrative—Institutional Shares | 40 |
Marketing and Distribution—Investor Shares | 54 |
Marketing and Distribution—Admiral Shares | 151 |
Marketing and Distribution—Institutional Shares | 35 |
Custodian Fees | 72 |
Shareholders’ Reports and Proxies—Investor Shares | 17 |
Shareholders’ Reports and Proxies—Admiral Shares | 6 |
Shareholders’ Reports and Proxies—Institutional Shares | — |
Trustees’ Fees and Expenses | 1 |
Total Expenses | 1,339 |
Net Investment Income | 21,393 |
Realized Net Gain (Loss) on Investment Securities Sold | 33,699 |
Change in Unrealized Appreciation (Depreciation) of Investment Securities | (7,640) |
Net Increase (Decrease) in Net Assets Resulting from Operations | 47,452 |
1 Interest income from an affiliated company of the fund was $5,000.
See accompanying Notes, which are an integral part of the Financial Statements.
38
Tax-Managed Growth and Income Fund
Statement of Changes in Net Assets
| Six Months Ended |
| Year Ended |
| June 30, |
| December 31, |
| 2009 |
| 2008 |
| ($000) |
| ($000) |
Increase (Decrease) in Net Assets |
|
|
|
Operations |
|
|
|
Net Investment Income | 21,393 |
| 60,077 |
Realized Net Gain (Loss) | 33,699 |
| (128,307) |
Change in Unrealized Appreciation (Depreciation) | (7,640) |
| (1,150,385) |
Net Increase (Decrease) in Net Assets Resulting from Operations | 47,452 |
| (1,218,615) |
Distributions |
|
|
|
Net Investment Income |
|
|
|
Investor Shares | (4,622) |
| (13,020) |
Admiral Shares | (14,093) |
| (39,092) |
Institutional Shares | (2,550) |
| (8,873) |
Realized Capital Gain |
|
|
|
Investor Shares | — |
| — |
Admiral Shares | — |
| — |
Institutional Shares | — |
| — |
Total Distributions | (21,265) |
| (60,985) |
Capital Share Transactions |
|
|
|
Investor Shares | (12,244) |
| (42,518) |
Admiral Shares | 4,335 |
| (91,349) |
Institutional Shares | (43,491) |
| (22,548) |
Net Increase (Decrease) from Capital Share Transactions | (51,400) |
| (156,415) |
Total Increase (Decrease) | (25,213) |
| (1,436,015) |
Net Assets |
|
|
|
Beginning of Period | 1,885,602 |
| 3,321,617 |
End of Period1 | 1,860,389 |
| 1,885,602 |
1 Net Assets—End of Period includes undistributed (overdistributed) net investment income of ($4,369,000) and ($4,497,000).
See accompanying Notes, which are an integral part of the Financial Statements.
39
Tax-Managed Growth and Income Fund
Financial Highlights
Investor Shares |
|
|
|
|
|
|
|
|
|
|
|
|
|
| Six Months |
|
|
|
|
|
| Ended |
|
|
| ||
For a Share Outstanding | June 30, | Year Ended December 31, | ||||
Throughout Each Period | 2009 | 2008 | 2007 | 2006 | 2005 | 2004 |
Net Asset Value, Beginning of Period | $19.65 | $31.96 | $30.87 | $27.15 | $26.36 | $24.23 |
Investment Operations |
|
|
|
|
|
|
Net Investment Income | .225 | .572 | .578 | .504 | .467 | .470 |
Net Realized and Unrealized Gain (Loss) |
|
|
|
|
|
|
on Investments | .389 | (12.295) | 1.089 | 3.727 | .801 | 2.130 |
Total from Investment Operations | .614 | (11.723) | 1.667 | 4.231 | 1.268 | 2.600 |
Distributions |
|
|
|
|
|
|
Dividends from Net Investment Income | (.224) | (.587) | (.577) | (.511) | (.478) | (.470) |
Distributions from Realized Capital Gains | — | — | — | — | — | — |
Total Distributions | (.224) | (.587) | (.577) | (.511) | (.478) | (.470) |
Net Asset Value, End of Period | $20.04 | $19.65 | $31.96 | $30.87 | $27.15 | $26.36 |
|
|
|
|
|
|
|
|
|
|
|
|
|
|
Total Return1 | 3.19% | –37.04% | 5.39% | 15.73% | 4.87% | 10.83% |
|
|
|
|
|
|
|
|
|
|
|
|
|
|
Ratios/Supplemental Data |
|
|
|
|
|
|
Net Assets, End of Period (Millions) | $414 | $420 | $740 | $784 | $806 | $1,395 |
Ratio of Total Expenses to |
|
|
|
|
|
|
Average Net Assets | 0.21%2 | 0.16% | 0.15% | 0.15% | 0.14% | 0.14% |
Ratio of Net Investment Income to |
|
|
|
|
|
|
Average Net Assets | 2.41%2 | 2.13% | 1.80% | 1.77% | 1.78% | 1.89% |
Portfolio Turnover Rate | 8%2 | 8% | 5% | 6% | 10% | 8% |
1 Total returns do not reflect the 1% redemption fee on shares held less than five years; the 2% redemption fee assessed prior to September 14, 2005, on shares held less than one year; or the account service fee that may be applicable to certain accounts with balances below $10,000.
2 Annualized.
See accompanying Notes, which are an integral part of the Financial Statements.
40
Tax-Managed Growth and Income Fund
Financial Highlights
Admiral Shares |
|
|
|
|
|
|
|
|
|
|
|
|
|
| Six Months |
|
|
|
|
|
| Ended |
|
|
| ||
For a Share Outstanding | June 30, | Year Ended December 31, | ||||
Throughout Each Period | 2009 | 2008 | 2007 | 2006 | 2005 | 2004 |
Net Asset Value, Beginning of Period | $40.39 | $65.69 | $63.44 | $55.80 | $54.17 | $49.80 |
Investment Operations |
|
|
|
|
|
|
Net Investment Income | .474 | 1.212 | 1.230 | 1.069 | .989 | .990 |
Net Realized and Unrealized Gain (Loss) |
|
|
|
|
|
|
on Investments | .801 | (25.276) | 2.245 | 7.648 | 1.645 | 4.370 |
Total from Investment Operations | 1.275 | (24.064) | 3.475 | 8.717 | 2.634 | 5.360 |
Distributions |
|
|
|
|
|
|
Dividends from Net Investment Income | (.475) | (1.236) | (1.225) | (1.077) | (1.004) | (.990) |
Distributions from Realized Capital Gains | — | — | — | — | — | — |
Total Distributions | (.475) | (1.236) | (1.225) | (1.077) | (1.004) | (.990) |
Net Asset Value, End of Period | $41.19 | $40.39 | $65.69 | $63.44 | $55.80 | $54.17 |
|
|
|
|
|
|
|
|
|
|
|
|
|
|
Total Return1 | 3.23% | –37.00% | 5.47% | 15.77% | 4.93% | 10.87% |
|
|
|
|
|
|
|
|
|
|
|
|
|
|
Ratios/Supplemental Data |
|
|
|
|
|
|
Net Assets, End of Period (Millions) | $1,229 | $1,203 | $2,113 | $1,935 | $1,575 | $954 |
Ratio of Total Expenses to |
|
|
|
|
|
|
Average Net Assets | 0.15%2 | 0.10% | 0.09% | 0.10% | 0.10% | 0.10% |
Ratio of Net Investment Income to |
|
|
|
|
|
|
Average Net Assets | 2.47%2 | 2.19% | 1.86% | 1.82% | 1.82% | 1.96% |
Portfolio Turnover Rate | 8%2 | 8% | 5% | 6% | 10% | 8% |
1 Total returns do not reflect the 1% redemption fee on shares held less than five years or the 2% redemption fee assessed prior to September 14, 2005, on shares held less than one year.
2 Annualized.
See accompanying Notes, which are an integral part of the Financial Statements.
41
Tax-Managed Growth and Income Fund
Financial Highlights
Institutional Shares |
|
|
|
|
|
|
|
|
|
|
|
|
|
| Six Months |
|
|
|
|
|
| Ended |
|
|
| ||
For a Share Outstanding | June 30, | Year Ended December 31, | ||||
Throughout Each Period | 2009 | 2008 | 2007 | 2006 | 2005 | 2004 |
Net Asset Value, Beginning of Period | $19.65 | $31.96 | $30.87 | $27.15 | $26.36 | $24.24 |
Investment Operations |
|
|
|
|
|
|
Net Investment Income | .236 | .598 | .604 | .527 | .485 | .479 |
Net Realized and Unrealized Gain (Loss) |
|
|
|
|
|
|
on Investments | .390 | (12.299) | 1.089 | 3.727 | .801 | 2.130 |
Total from Investment Operations | .626 | (11.701) | 1.693 | 4.254 | 1.286 | 2.609 |
Distributions |
|
|
|
|
|
|
Dividends from Net Investment Income | (.236) | (.609) | (.603) | (.534) | (.496) | (.489) |
Distributions from Realized Capital Gains | — | — | — | — | — | — |
Total Distributions | (.236) | (.609) | (.603) | (.534) | (.496) | (.489) |
Net Asset Value, End of Period | $20.04 | $19.65 | $31.96 | $30.87 | $27.15 | $26.36 |
|
|
|
|
|
|
|
|
|
|
|
|
|
|
Total Return1 | 3.26% | –36.98% | 5.47% | 15.82% | 4.94% | 10.87% |
|
|
|
|
|
|
|
|
|
|
|
|
|
|
Ratios/Supplemental Data |
|
|
|
|
|
|
Net Assets, End of Period (Millions) | $217 | $263 | $469 | $389 | $303 | $266 |
Ratio of Total Expenses to |
|
|
|
|
|
|
Average Net Assets | 0.09%2 | 0.07% | 0.07% | 0.07% | 0.07% | 0.07% |
Ratio of Net Investment Income to |
|
|
|
|
|
|
Average Net Assets | 2.53%2 | 2.22% | 1.88% | 1.85% | 1.85% | 1.97% |
Portfolio Turnover Rate | 8%2 | 8% | 5% | 6% | 10% | 8% |
1 Total returns do not reflect the 1% redemption fee on shares held less then five years or the 2% redemption fee assessed prior to September 14, 2005, on shares held less than one year.
2 Annualized.
See accompanying Notes, which are an integral part of the Financial Statements.
42
Tax-Managed Growth and Income Fund
Notes to Financial Statements
Vanguard Tax-Managed Growth and Income Fund is registered under the Investment Company Act of 1940 as an open-end investment company, or mutual fund. The fund offers three classes of shares: Investor Shares, Admiral Shares, and Institutional Shares. Investor Shares are available to any investor who meets the fund’s minimum purchase requirements. Admiral Shares are designed for investors who meet certain administrative, service, tenure, and account-size criteria. Institutional Shares are designed for investors who meet certain administrative and service criteria and invest a minimum of $5 million.
A. The following significant accounting policies conform to generally accepted accounting principles for U.S. mutual funds. The fund consistently follows such policies in preparing its financial statements.
1. Security Valuation: Securities are valued as of the close of trading on the New York Stock Exchange (generally 4 p.m., Eastern time) on the valuation date. Equity securities are valued at the latest quoted sales prices or official closing prices taken from the primary market in which each security trades; such securities not traded on the valuation date are valued at the mean of the latest quoted bid and asked prices. Securities for which market quotations are not readily available, or whose values have been materially affected by events occurring before the fund’s pricing time but after the close of the securities’ primary markets, are valued by methods deemed by the board of trustees to represent fair value. Investments in Vanguard Market Liquidity Fund are valued at that fund’s net asset value.
2. Federal Income Taxes: The fund intends to continue to qualify as a regulated investment company and distribute all of its taxable income. Management has analyzed the fund’s tax positions taken on federal income tax returns for all open tax years (tax years ended December 31, 2005–2008) and for the period ended June 30, 2009, and has concluded that no provision for federal income tax is required in the fund’s financial statements.
3. Distributions: Distributions to shareholders are recorded on the ex-dividend date.
4. Other: Dividend income is recorded on the ex-dividend date. Interest income includes income distributions received from Vanguard Market Liquidity Fund and is accrued daily. Security transactions are accounted for on the date securities are bought or sold. Costs used to determine realized gains (losses) on the sale of investment securities are those of the specific securities sold. Fees assessed on redemptions of capital shares are credited to paid-in capital.
Each class of shares has equal rights as to assets and earnings, except that each class separately bears certain class-specific expenses related to maintenance of shareholder accounts (included in Management and Administrative expenses), shareholder reporting, and proxies. Marketing and distribution expenses are allocated to each class of shares based on a method approved by the board of trustees. Income, other non-class-specific expenses, and gains and losses on investments are allocated to each class of shares based on its relative net assets.
B. The Vanguard Group furnishes at cost investment advisory, corporate management, administrative, marketing, and distribution services. The costs of such services are allocated to the fund under methods approved by the board of trustees. The fund has committed to provide up to 0.40% of its net assets in capital contributions to Vanguard. At June 30, 2009, the fund had contributed capital of $438,000 to Vanguard (included in Other Assets), representing 0.02% of the fund’s net assets and 0.18% of Vanguard’s capitalization. The fund’s trustees and officers are also directors and officers of Vanguard.
43
Tax-Managed Growth and Income Fund
C. Various inputs may be used to determine the value of the fund’s investments. These inputs are summarized in three broad levels for financial statement purposes. The inputs or methodologies used to value securities are not necessarily an indication of the risk associated with investing in those securities.
Level 1—Quoted prices in active markets for identical securities.
Level 2—Other significant observable inputs (including quoted prices for similar securities, interest rates, prepayment speeds, credit risk, etc.).
Level 3—Significant unobservable inputs (including the fund’s own assumptions used to determine the fair value of investments).
At June 30, 2009, 100% of the fund’s investments were valued based on Level 1 inputs.
D. Distributions are determined on a tax basis and may differ from net investment income and realized capital gains for financial reporting purposes. Differences may be permanent or temporary. Permanent differences are reclassified among capital accounts in the financial statements to reflect their tax character. Temporary differences arise when certain items of income, expense, gain, or loss are recognized in different periods for financial statement and tax purposes; these differences will reverse at some time in the future. Differences in classification may also result from the treatment of short-term gains as ordinary income for tax purposes.
The fund’s tax-basis capital gains and losses are determined only at the end of each fiscal year. For tax purposes, at December 31, 2008, the fund had available realized losses of $529,451,000 to offset future net capital gains of $78,029,000 through December 31, 2009, $201,652,000 through December 31, 2010, $92,868,000 through December 31, 2011, $31,345,000 through December 31, 2013, $1,431,000 through December 31, 2014, $67,505,000 through December 31, 2016, and $56,621,000 through December 31, 2017. The fund will use these capital losses to offset net taxable capital gains, if any, realized during the year ending December 31, 2009; should the fund realize net capital losses for the year, the losses will be added to the loss carryforward balances above.
At June 30, 2009, the cost of investment securities for tax purposes was $1,783,281,000. Net unrealized appreciation of investment securities for tax purposes was $79,411,000, consisting of unrealized gains of $490,764,000 on securities that had risen in value since their purchase and $411,353,000 in unrealized losses on securities that had fallen in value since their purchase.
E. During the six months ended June 30, 2009, the fund purchased $70,022,000 of investment securities and sold $119,257,000 of investment securities, other than temporary cash investments.
44
Tax-Managed Growth and Income Fund
F. Capital share transactions for each class of shares were:
| Six Months Ended | Year Ended | |||
| June 30, 2009 | December 31, 2008 | |||
| Amount | Shares |
| Amount | Shares |
| ($000) | (000) |
| ($000) | (000) |
Investor Shares |
|
|
|
|
|
Issued | 21,076 | 1,145 |
| 70,052 | 2,859 |
Issued in Lieu of Cash Distributions | 4,122 | 217 |
| 11,463 | 465 |
Redeemed1 | (37,442) | (2,079) |
| (124,033) | (5,082) |
Net Increase (Decrease)—Investor Shares | (12,244) | (717) |
| (42,518) | (1,758) |
Admiral Shares |
|
|
|
|
|
Issued | 65,396 | 1,762 |
| 171,689 | 3,394 |
Issued in Lieu of Cash Distributions | 10,945 | 281 |
| 30,918 | 607 |
Redeemed1 | (72,006) | (1,979) |
| (293,956) | (6,401) |
Net Increase (Decrease)—Admiral Shares | 4,335 | 64 |
| (91,349) | (2,400) |
Institutional Shares |
|
|
|
|
|
Issued | 1,575 | 89 |
| 48,307 | 1,970 |
Issued in Lieu of Cash Distributions | 1,632 | 86 |
| 5,473 | 222 |
Redeemed1 | (46,698) | (2,706) |
| (76,328) | (3,483) |
Net Increase (Decrease)—Institutional Shares | (43,491) | (2,531) |
| (22,548) | (1,291) |
1 Net of redemption fees for fiscal 2009 and 2008 of $318,000 and $1,146,000, respectively (fund totals). | |||||
G. In preparing the financial statements as of June 30, 2009, management considered the impact of subsequent events occurring through August 5, 2009, for potential recognition or disclosure in these financial statements.
45
Tax-Managed Capital Appreciation Fund
Fund Profile
As of June 30, 2009
Portfolio Characteristics |
|
| |
|
| Comparative | Broad |
| Fund | Index1 | Index2 |
Number of Stocks | 621 | 970 | 4,399 |
Median Market Cap | $26.2B | $29.7B | $24.2B |
Price/Earnings Ratio | 17.9x | 17.6x | 18.6x |
Price/Book Ratio | 2.0x | 2.0x | 1.9x |
Yield3 |
| 2.3% | 2.2% |
Investor Shares | 1.8% |
|
|
Admiral Shares | 1.9% |
|
|
Institutional Shares | 1.9% |
|
|
Return on Equity | 20.5% | 20.5% | 19.7% |
Earnings Growth Rate | 15.0% | 14.1% | 13.5% |
Foreign Holdings | 0.0% | 0.0% | 0.0% |
Turnover Rate4 | 8% | — | — |
Expense Ratio5 |
| — | — |
Investor Shares | 0.21% |
|
|
Admiral Shares | 0.15% |
|
|
Institutional Shares | 0.09% |
|
|
Short-Term Reserves | 0.1% | — | — |
Volatility Measures6 | ||
| Fund Versus | Fund Versus |
| Comparative Index1 | Broad Index2 |
R-Squared | 1.00 | 1.00 |
Beta | 1.01 | 1.00 |
Investment Focus
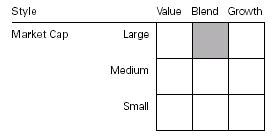
Sector Diversification (% of equity exposure) | |||
|
| Comparative | Broad |
| Fund | Index1 | Index2 |
Consumer Discretionary | 9.7% | 9.7% | 9.7% |
Consumer Staples | 11.3 | 11.2 | 10.4 |
Energy | 11.8 | 11.8 | 11.8 |
Financials | 13.4 | 13.7 | 15.0 |
Health Care | 13.8 | 13.7 | 13.6 |
Industrials | 10.2 | 10.0 | 10.3 |
Information Technology | 18.6 | 18.4 | 18.2 |
Materials | 3.7 | 3.8 | 3.6 |
Telecommunication |
|
|
|
Services | 3.4 | 3.4 | 3.2 |
Utilities | 4.1 | 4.3 | 4.2 |
Ten Largest Holdings7 (% of total net assets) | ||
|
|
|
ExxonMobil Corp. | integrated oil |
|
| and gas | 3.8% |
Microsoft Corp. | systems software | 2.0 |
The Procter & Gamble Co. | household products | 1.7 |
Johnson & Johnson | pharmaceuticals | 1.7 |
AT&T Inc. | integrated |
|
| telecommunication |
|
| services | 1.6 |
International Business |
|
|
Machines Corp. | computer hardware | 1.5 |
Apple Inc. | computer hardware | 1.4 |
Chevron Corp. | integrated oil |
|
| and gas | 1.4 |
JPMorgan Chase & Co. | diversified financial |
|
| services | 1.3 |
Cisco Systems, Inc. | communications |
|
| equipment | 1.2 |
Top Ten |
| 17.6% |
1 Russell 1000 Index.
2 Dow Jones U.S. Total Stock Market Index.
3 30-day SEC yield for the fund; annualized dividend yield for the indexes. See the Glossary.
4 Annualized.
5 The expense ratios shown are from the prospectuses dated April 24, 2009, and represent estimated costs for the current fiscal year based on the fund’s net assets as of the prospectus date. For the six months ended June 30, 2009, the annualized expense ratios were 0.21% for Investor Shares, 0.15% for Admiral Shares, and 0.09% for Institutional Shares.
6 For an explanation of R-squared, beta, and other terms used here, see the Glossary.
7 The holdings listed exclude any temporary cash investments and equity index products.
46
Tax-Managed Capital Appreciation Fund
Performance Summary
All of the returns in this report represent past performance, which is not a guarantee of future results that may be achieved by the fund. (Current performance may be lower or higher than the performance data cited. For performance data current to the most recent month-end, visit our website at www.vanguard.com/performance.) Note, too, that both investment returns and principal value can fluctuate widely, so an investor’s shares, when sold, could be worth more or less than their original cost. The returns shown do not reflect taxes that a shareholder would pay on fund distributions or on the sale of fund shares.
Fiscal-Year Total Returns (%): December 31, 1998–June 30, 2009
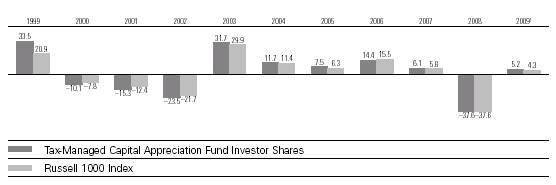
Average Annual Total Returns: Periods Ended June 30, 2009 | ||||
|
|
|
|
|
| Inception Date | One Year | Five Years | Ten Years |
Tax-Managed Capital Appreciation Fund |
|
|
|
|
Investor Shares2 | 9/6/1994 | –26.53% | –1.63% | –1.64% |
Fee-Adjusted Returns3 |
| –27.25 | –1.63 | –1.64 |
Admiral Shares | 11/12/2001 | –26.49 | –1.58 | 0.134 |
Fee-Adjusted Returns3 |
| –27.20 | –1.58 | 0.134 |
Institutional Shares | 2/24/1999 | –26.43 | –1.55 | –1.56 |
Fee-Adjusted Returns3 |
| –27.15 | –1.55 | –1.56 |
1 Six months ended June 30, 2009.
2 Total returns do not include the account service fee that may be applicable to certain accounts with balances below $10,000.
3 Reflective of the 1% fee assessed on redemptions of shares held in the fund for less than five years.
4 Return since inception.
Note: See Financial Highlights tables for dividend and capital gains information.
47
Tax-Managed Capital Appreciation Fund
Financial Statements (unaudited)
Statement of Net Assets
As of June 30, 2009
The fund provides a complete list of its holdings four times in each fiscal year, at the quarter-ends. For the second and fourth fiscal quarters, the lists appear in the fund’s semiannual and annual reports to shareholders. For the first and third fiscal quarters, the fund files the lists with the Securities and Exchange Commission on Form N-Q. Shareholders can look up the fund’s Forms N-Q on the SEC’s website at www.sec.gov. Forms N-Q may also be reviewed and copied at the SEC’s Public Reference Room (see the back cover of this report for further information).
|
|
| Market |
|
|
| Value• |
|
| Shares | ($000) |
Common Stocks (99.9%) |
|
| |
Consumer Discretionary (9.7%) |
|
| |
| McDonald’s Corp. | 358,560 | 20,614 |
| The Walt Disney Co. | 637,436 | 14,871 |
| Home Depot, Inc. | 480,000 | 11,342 |
| Comcast Corp. Class A | 755,371 | 10,945 |
| Target Corp. | 270,600 | 10,681 |
* | Amazon.com, Inc. | 121,100 | 10,131 |
| Lowe’s Cos., Inc. | 498,600 | 9,678 |
| Time Warner Inc. | 376,649 | 9,488 |
| News Corp., Class A | 831,630 | 7,576 |
| NIKE, Inc. Class B | 127,200 | 6,586 |
| Yum! Brands, Inc. | 189,760 | 6,327 |
* | Kohl’s Corp. | 129,950 | 5,555 |
| Johnson Controls, Inc. | 237,600 | 5,161 |
* | DIRECTV Group, Inc. | 207,202 | 5,120 |
| Best Buy Co., Inc. | 141,084 | 4,725 |
* | Starbucks Corp. | 322,352 | 4,477 |
* | Liberty Media Corp. | 163,924 | 4,385 |
| Coach, Inc. | 159,400 | 4,285 |
* | Ford Motor Co. | 684,000 | 4,152 |
| The Gap, Inc. | 246,487 | 4,042 |
* | Apollo Group, Inc. Class A | 56,729 | 4,035 |
* | Bed Bath & Beyond, Inc. | 129,817 | 3,992 |
* | Viacom Inc. Class B | 171,033 | 3,882 |
| The McGraw-Hill Cos., Inc. | 122,900 | 3,701 |
| Marriott International, Inc. |
|
|
| Class A | 144,832 | 3,196 |
* | O’Reilly Automotive, Inc. | 79,848 | 3,041 |
* | AutoZone Inc. | 20,100 | 3,037 |
| Time Warner Cable Inc. | 94,542 | 2,994 |
| BorgWarner, Inc. | 84,800 | 2,896 |
| Darden Restaurants Inc. | 83,850 | 2,765 |
* | Liberty Media Corp.– |
|
|
| Interactive Series A | 519,723 | 2,604 |
| Advance Auto Parts, Inc. | 62,402 | 2,589 |
* | Dollar Tree, Inc. | 61,234 | 2,578 |
| DeVry, Inc. | 50,459 | 2,525 |
| Polo Ralph Lauren Corp. | 46,900 | 2,511 |
* | CarMax, Inc. | 169,146 | 2,486 |
| PetSmart, Inc. | 112,600 | 2,416 |
| Hasbro, Inc. | 96,600 | 2,342 |
| Ross Stores, Inc. | 60,296 | 2,327 |
| International Game |
|
|
| Technology | 129,600 | 2,061 |
* | AutoNation, Inc. | 118,580 | 2,057 |
* | NVR, Inc. | 3,980 | 1,999 |
| Starwood Hotels & |
|
|
| Resorts Worldwide, Inc. | 88,624 | 1,967 |
| John Wiley & Sons Class A | 58,700 | 1,952 |
| Staples, Inc. | 94,495 | 1,906 |
* | Office Depot, Inc. | 407,400 | 1,858 |
* | Discovery |
|
|
| Communications Inc. |
|
|
| Class C | 90,137 | 1,850 |
| Brinker International, Inc. | 102,750 | 1,750 |
| Scripps Networks Interactive | 62,170 | 1,730 |
| Centex Corp. | 190,300 | 1,610 |
| Omnicom Group Inc. | 50,600 | 1,598 |
| International |
|
|
| Speedway Corp. | 62,378 | 1,597 |
* | Career Education Corp. | 60,400 | 1,503 |
| Gentex Corp. | 116,252 | 1,349 |
| Phillips-Van Heusen Corp. | 44,000 | 1,262 |
* | Mohawk Industries, Inc. | 34,700 | 1,238 |
* | Expedia, Inc. | 81,125 | 1,226 |
* | Liberty Global, Inc. Series C | 75,207 | 1,189 |
| D. R. Horton, Inc. | 126,366 | 1,183 |
| Barnes & Noble, Inc. | 57,300 | 1,182 |
| Weight Watchers |
|
|
| International, Inc. | 45,200 | 1,165 |
* | Toll Brothers, Inc. | 64,600 | 1,096 |
| Foot Locker, Inc. | 103,900 | 1,088 |
| American Eagle |
|
|
| Outfitters, Inc. | 75,991 | 1,077 |
* | Liberty Global, Inc. Class A | 67,398 | 1,071 |
| Cablevision Systems |
|
|
| NY Group Class A | 54,344 | 1,055 |
* | Brink’s Home Security |
|
|
| Holdings, Inc. | 36,800 | 1,042 |
48
Tax-Managed Capital Appreciation Fund
|
|
| Market |
|
|
| Value• |
|
| Shares | ($000) |
| Washington Post Co. |
|
|
| Class B | 2,720 | 958 |
| Harley-Davidson, Inc. | 56,800 | 921 |
| Pulte Homes, Inc. | 100,800 | 890 |
* | Lamar Advertising Co. |
|
|
| Class A | 56,186 | 858 |
| CBS Corp. | 120,331 | 833 |
| RadioShack Corp. | 58,000 | 810 |
| WABCO Holdings Inc. | 44,400 | 786 |
| Macy’s Inc. | 56,800 | 668 |
| Nordstrom, Inc. | 32,300 | 642 |
| Black & Decker Corp. | 20,977 | 601 |
| Abercrombie & Fitch Co. | 23,300 | 592 |
| Virgin Media Inc. | 62,269 | 582 |
| Mattel, Inc. | 36,032 | 578 |
* | Boyd Gaming Corp. | 67,200 | 571 |
| Lennar Corp. Class A | 54,600 | 529 |
| Harman International |
|
|
| Industries, Inc. | 28,000 | 526 |
* | Sears Holdings Corp. | 7,200 | 479 |
| Comcast Corp. Special |
|
|
| Class A | 26,219 | 370 |
* | MGM Mirage, Inc. | 56,746 | 363 |
* | Liberty Media Corp.– |
|
|
| Capital Series A | 16,431 | 223 |
* | Hanesbrands Inc. | 5,575 | 84 |
* | Wynn Resorts Ltd. | 2,000 | 71 |
| Lennar Corp. Class B | 8,300 | 63 |
| CBS Corp. Class A | 6,844 | 48 |
* | Viacom Inc. Class A | 295 | 7 |
|
|
| 270,772 |
Consumer Staples (11.3%) |
|
| |
| The Procter & Gamble Co. | 923,278 | 47,179 |
| Wal-Mart Stores, Inc. | 696,528 | 33,740 |
| The Coca-Cola Co. | 690,000 | 33,113 |
| PepsiCo, Inc. | 506,500 | 27,837 |
| Philip Morris |
|
|
| International Inc. | 550,672 | 24,020 |
| CVS Caremark Corp. | 495,554 | 15,793 |
| Walgreen Co. | 307,300 | 9,035 |
| Colgate-Palmolive Co. | 115,900 | 8,199 |
| Kraft Foods Inc. | 321,031 | 8,135 |
| Costco Wholesale Corp. | 156,100 | 7,1 34 |
| Archer-Daniels-Midland Co. | 249,273 | 6,673 |
| Altria Group, Inc. | 399,978 | 6,556 |
| The Kroger Co. | 263,700 | 5,815 |
| The Clorox Co. | 69,120 | 3,859 |
| Bunge Ltd. | 62,800 | 3,784 |
| Safeway, Inc. | 170,462 | 3,472 |
* | Dr. Pepper Snapple |
|
|
| Group, Inc. | 156,200 | 3,310 |
| Campbell Soup Co. | 110,900 | 3,263 |
| Coca-Cola Enterprises, Inc. | 191,800 | 3,193 |
| The Pepsi Bottling |
|
|
| Group, Inc. | 92,479 | 3,129 |
| Molson Coors Brewing Co. |
|
|
| Class B | 71,900 | 3,044 |
| The Hershey Co. | 81,300 | 2,927 |
| Kimberly-Clark Corp. | 55,096 | 2,889 |
| Tyson Foods, Inc. | 222,444 | 2,805 |
| Brown-Forman Corp. |
|
|
| Class B | 64,646 | 2,778 |
| The Estee Lauder Cos. Inc. |
|
|
| Class A | 82,900 | 2,708 |
* | Dean Foods Co. | 137,200 | 2,633 |
| Church & Dwight, Inc. | 47,100 | 2,558 |
| General Mills, Inc. | 44,400 | 2,487 |
| McCormick & Co., Inc. | 76,100 | 2,476 |
| J.M. Smucker Co. | 49,024 | 2,386 |
* | Constellation Brands, Inc. |
|
|
| Class A | 183,300 | 2,324 |
* | Hansen Natural Corp. | 75,200 | 2,318 |
* | Energizer Holdings, Inc. | 44,128 | 2,305 |
| Del Monte Foods Co. | 239,900 | 2,250 |
| Hormel Foods Corp. | 62,600 | 2,162 |
| PepsiAmericas, Inc. | 80,030 | 2,146 |
| Alberto-Culver Co. | 82,614 | 2,101 |
| Kellogg Co. | 44,300 | 2,063 |
* | Smithfield Foods, Inc. | 141,335 | 1,974 |
| Corn Products |
|
|
| International, Inc. | 72,200 | 1,934 |
| Avon Products, Inc. | 59,300 | 1,529 |
* | NBTY, Inc. | 37,300 | 1,049 |
| Whole Foods Market, Inc. | 32,840 | 623 |
| Sara Lee Corp. | 44,600 | 435 |
| Sysco Corp. | 17,111 | 385 |
* | Central European |
|
|
| Distribution Corp. | 11,600 | 308 |
* | Mead Johnson |
|
|
| Nutrition Co. | 9,500 | 302 |
* | BJ’s Wholesale Club, Inc. | 9,300 | 300 |
| ConAgra Foods, Inc. | 11,200 | 213 |
| Reynolds American Inc. | 106 | 4 |
|
|
| 313,655 |
Energy (11.8%) |
|
| |
| ExxonMobil Corp. | 1,516,284 | 106,003 |
| Chevron Corp. | 605,838 | 40,137 |
| ConocoPhillips Co. | 434,630 | 18,281 |
| Schlumberger Ltd. | 312,000 | 16,882 |
| Occidental Petroleum Corp. | 190,339 | 12,526 |
| Apache Corp. | 124,162 | 8,958 |
| Devon Energy Corp. | 158,022 | 8,612 |
| Anadarko Petroleum Corp. | 179,316 | 8,139 |
| XTO Energy, Inc. | 205,241 | 7,828 |
| EOG Resources, Inc. | 100,300 | 6,812 |
| Hess Corp. | 109,600 | 5,891 |
* | National Oilwell Varco Inc. | 176,541 | 5,766 |
* | Southwestern Energy Co. | 134,200 | 5,214 |
| Noble Energy, Inc. | 79,600 | 4,694 |
| Baker Hughes Inc. | 124,580 | 4,540 |
| Peabody Energy Corp. | 133,900 | 4,038 |
49
Tax-Managed Capital Appreciation Fund
|
|
| Market |
|
|
| Value• |
|
| Shares | ($000) |
| Williams Cos., Inc. | 247,700 | 3,867 |
| Range Resources Corp. | 82,500 | 3,416 |
| Diamond Offshore |
|
|
| Drilling, Inc. | 39,700 | 3,297 |
| Halliburton Co. | 158,200 | 3,275 |
* | Cameron |
|
|
| International Corp. | 114,200 | 3,232 |
| ENSCO International, Inc. | 89,710 | 3,128 |
| Valero Energy Corp. | 182,480 | 3,082 |
* | FMC Technologies Inc. | 76,250 | 2,866 |
| Chesapeake Energy Corp. | 143,311 | 2,842 |
* | Newfield Exploration Co. | 82,300 | 2,689 |
* | Pride International, Inc. | 106,400 | 2,666 |
| Helmerich & Payne, Inc. | 81,480 | 2,515 |
| Pioneer Natural |
|
|
| Resources Co. | 96,400 | 2,458 |
| Marathon Oil Corp. | 81,100 | 2,444 |
| Cabot Oil & Gas Corp. | 79,535 | 2,437 |
| Smith International, Inc. | 91,300 | 2,351 |
| Cimarex Energy Co. | 79,300 | 2,247 |
| St. Mary Land & |
|
|
| Exploration Co. | 96,500 | 2,014 |
| BJ Services Co. | 147,100 | 2,005 |
| Southern Union Co. | 105,700 | 1,944 |
* | Plains Exploration & |
|
|
| Production Co. | 66,760 | 1,827 |
* | Mariner Energy Inc. | 137,652 | 1,617 |
| Rowan Cos., Inc. | 80,600 | 1,557 |
| CONSOL Energy, Inc. | 33,900 | 1,151 |
| Arch Coal, Inc. | 73,400 | 1,128 |
* | Forest Oil Corp. | 65,300 | 974 |
* | Continental Resources, Inc. | 32,700 | 908 |
* | Unit Corp. | 12,800 | 353 |
| Patterson-UTI Energy, Inc. | 21,200 | 273 |
| Tesoro Corp. | 7,100 | 90 |
* | Denbury Resources, Inc. | 2,300 | 34 |
* | Superior Energy |
|
|
| Services, Inc. | 1,048 | 18 |
|
|
| 329,026 |
Financials (13.4%) |
|
| |
| JPMorgan Chase & Co. | 1,079,621 | 36,826 |
| Wells Fargo & Co. | 1,285,108 | 31,177 |
| Bank of America Corp. | 2,014,966 | 26,598 |
| The Goldman Sachs |
|
|
| Group, Inc. | 139,830 | 20,617 |
| CME Group, Inc. | 25,501 | 7,934 |
| American Express Co. | 331,300 | 7,699 |
| State Street Corp. | 161,878 | 7,641 |
| Morgan Stanley | 264,800 | 7,549 |
| U.S. Bancorp | 392,700 | 7,037 |
| Charles Schwab Corp. | 377,200 | 6,616 |
| Bank of New York |
|
|
| Mellon Corp. | 224,606 | 6,583 |
| Prudential Financial, Inc. | 166,404 | 6,194 |
| AFLAC Inc. | 186,400 | 5,795 |
| MetLife, Inc. | 175,820 | 5,276 |
| Citigroup Inc. | 1,691,802 | 5,025 |
| Franklin Resources, Inc. | 69,000 | 4,969 |
* | Progressive Corp. of Ohio | 317,400 | 4,796 |
| Loews Corp. | 159,508 | 4,370 |
| The Travelers Cos., Inc. | 101,877 | 4,181 |
| Public Storage, Inc. REIT | 61,200 | 4,007 |
| T. Rowe Price Group Inc. | 92,978 | 3,874 |
| Hudson City Bancorp, Inc. | 263,902 | 3,507 |
| Capital One Financial Corp. | 158,900 | 3,477 |
* | SLM Corp. | 319,300 | 3,279 |
| Unum Group | 204,000 | 3,235 |
| PNC Financial |
|
|
| Services Group | 82,831 | 3,215 |
| Moody’s Corp. | 121,000 | 3,188 |
| Host Hotels & |
|
|
| Resorts Inc. REIT | 375,449 | 3,150 |
| Plum Creek Timber Co. Inc. |
|
|
| REIT | 100,900 | 3,005 |
* | TD Ameritrade |
|
|
| Holding Corp. | 170,900 | 2,998 |
| Ameriprise Financial, Inc. | 123,360 | 2,994 |
| Discover Financial Services | 287,700 | 2,955 |
| Fifth Third Bancorp | 403,300 | 2,863 |
| BlackRock, Inc. | 15,450 | 2,710 |
| People’s United |
|
|
| Financial Inc. | 174,014 | 2,617 |
| Torchmark Corp. | 68,100 | 2,522 |
| The Allstate Corp. | 102,300 | 2,496 |
* | Leucadia National Corp. | 117,400 | 2,476 |
| Boston Properties, Inc. REIT | 51,900 | 2,476 |
* | Markel Corp. | 8,620 | 2,428 |
* | The St. Joe Co. | 89,800 | 2,379 |
| Brown & Brown, Inc. | 118,600 | 2,364 |
| SEI Investments Co. | 129,770 | 2,341 |
| First Horizon National Corp. | 194,242 | 2,331 |
| Eaton Vance Corp. | 86,202 | 2,306 |
* | CB Richard Ellis Group, Inc. | 245,924 | 2,302 |
| The Principal Financial |
|
|
| Group, Inc. | 120,400 | 2,268 |
* | Arch Capital Group Ltd. | 38,300 | 2,244 |
| Janus Capital Group Inc. | 194,000 | 2,212 |
| HCC Insurance |
|
|
| Holdings, Inc. | 91,600 | 2,199 |
| W.R. Berkley Corp. | 102,297 | 2,196 |
| Cullen/Frost Bankers, Inc. | 47,600 | 2,195 |
| M & T Bank Corp. | 42,600 | 2,170 |
| Avalonbay Communities, Inc. |
|
|
| REIT | 38,375 | 2,147 |
* | Affiliated Managers |
|
|
| Group, Inc. | 36,800 | 2,141 |
| The Hanover Insurance |
|
|
| Group Inc. | 55,800 | 2,127 |
* | AmeriCredit Corp. | 153,500 | 2,080 |
| Reinsurance Group of |
|
|
| America, Inc. | 58,819 | 2,053 |
50
Tax-Managed Capital Appreciation Fund
|
|
| Market |
|
|
| Value• |
|
| Shares | ($000) |
| Hospitality Properties Trust |
|
|
| REIT | 171,670 | 2,041 |
| Apartment Investment & |
|
|
| Management Co. |
|
|
| Class A REIT | 223,003 | 1,974 |
| Jones Lang LaSalle Inc. | 59,100 | 1,934 |
| Transatlantic Holdings, Inc. | 44,114 | 1,911 |
| Northern Trust Corp. | 34,773 | 1,867 |
| Commerce |
|
|
| Bancshares, Inc. | 57,767 | 1,839 |
| AMB Property Corp. REIT | 97,504 | 1,834 |
| Assurant, Inc. | 75,300 | 1,814 |
| Forest City Enterprise |
|
|
| Class A | 273,739 | 1,807 |
| First Citizens BancShares |
|
|
| Class A | 13,442 | 1,796 |
| Whitney Holdings Corp. | 194,616 | 1,783 |
| Wesco Financial Corp. | 6,090 | 1,772 |
| Legg Mason Inc. | 72,200 | 1,760 |
* | Alleghany Corp. | 6,467 | 1,753 |
| BOK Financial Corp. | 44,171 | 1,664 |
| Federated Investors, Inc. | 68,250 | 1,644 |
| StanCorp Financial |
|
|
| Group, Inc. | 56,500 | 1,620 |
| Popular, Inc. | 729,600 | 1,605 |
| City National Corp. | 42,000 | 1,547 |
| Raymond James |
|
|
| Financial, Inc. | 89,650 | 1,543 |
| Lazard Ltd. Class A | 55,686 | 1,499 |
| TFS Financial Corp. | 132,654 | 1,409 |
| American International |
|
|
| Group, Inc. | 1,206,431 | 1,399 |
| The Chubb Corp. | 30,900 | 1,232 |
| Genworth Financial Inc. | 171,900 | 1,202 |
| Camden Property Trust |
|
|
| REIT | 42,400 | 1,170 |
| Kimco Realty Corp. REIT | 112,300 | 1,129 |
| Douglas Emmett, Inc. REIT | 121,273 | 1,090 |
| CNA Financial Corp. | 69,500 | 1,075 |
| Digital Realty Trust, Inc. |
|
|
| REIT | 28,440 | 1,020 |
| BB&T Corp. | 46,300 | 1,018 |
| New York Community |
|
|
| Bancorp, Inc. | 86,400 | 924 |
| White Mountains |
|
|
| Insurance Group Inc. | 3,828 | 876 |
| Marshall & Ilsley Corp. | 169,300 | 813 |
| Bank of Hawaii Corp. | 20,100 | 720 |
| SL Green Realty Corp. |
|
|
| REIT | 30,400 | 697 |
| American Financial |
|
|
| Group, Inc. | 32,200 | 695 |
| Lincoln National Corp. | 39,834 | 686 |
| Zions Bancorp | 58,100 | 672 |
| ProLogis REIT | 80,068 | 645 |
| CapitalSource Inc. | 130,938 | 639 |
| Aon Corp. | 16,400 | 621 |
| The Hartford Financial |
|
|
| Services Group Inc. | 49,200 | 584 |
| Simon Property Group, Inc. |
|
|
| REIT | 10,905 | 561 |
| SunTrust Banks, Inc. | 33,800 | 556 |
| BRE Properties Inc. |
|
|
| Class A |
|
|
| REIT | 21,500 | 511 |
| Synovus Financial Corp. | 161,056 | 482 |
| Federal Realty |
|
|
| Investment Trust REIT | 8,200 | 422 |
| GLG Partners, Inc. | 75,400 | 308 |
| Taubman Co. REIT | 11,300 | 303 |
* | MBIA, Inc. | 57,000 | 247 |
| Invesco, Ltd. | 12,010 | 214 |
| KeyCorp | 39,369 | 206 |
| Regions Financial Corp. | 49,934 | 202 |
| BancorpSouth, Inc. | 4,000 | 82 |
| Wilmington Trust Corp. | 3,100 | 42 |
| Essex Property Trust, Inc. |
|
|
| REIT | 300 | 19 |
|
|
| 371,888 |
Health Care (13.8%) |
|
| |
| Johnson & Johnson | 810,598 | 46,042 |
| Pfizer Inc. | 1,820,760 | 27,311 |
| Abbott Laboratories | 407,600 | 19,174 |
| Wyeth | 411,700 | 18,687 |
* | Amgen Inc. | 341,125 | 18,059 |
| Merck & Co., Inc. | 537,200 | 15,020 |
* | Gilead Sciences, Inc. | 311,400 | 14,586 |
| Schering-Plough Corp. | 555,100 | 13,944 |
| Medtronic, Inc. | 263,600 | 9,197 |
| UnitedHealth Group Inc. | 367,662 | 9,184 |
* | WellPoint Inc. | 180,416 | 9,181 |
| Bristol-Myers Squibb Co. | 436,534 | 8,866 |
* | Celgene Corp. | 174,800 | 8,362 |
* | Medco Health |
|
|
| Solutions, Inc. | 183,242 | 8,358 |
| Eli Lilly & Co. | 201,035 | 6,964 |
* | Thermo Fisher |
|
|
| Scientific, Inc. | 167,106 | 6,813 |
| Baxter International, Inc. | 127,341 | 6,744 |
* | Express Scripts Inc. | 90,862 | 6,247 |
* | Genzyme Corp. | 111,500 | 6,207 |
| Allergan, Inc. | 125,750 | 5,983 |
| Becton, Dickinson & Co. | 80,600 | 5,748 |
* | St. Jude Medical, Inc. | 139,832 | 5,747 |
* | Biogen Idec Inc. | 119,161 | 5,380 |
| Aetna Inc. | 197,988 | 4,960 |
| Cardinal Health, Inc. | 145,512 | 4,445 |
| Stryker Corp. | 109,200 | 4,340 |
| Quest Diagnostics, Inc. | 76,800 | 4,334 |
* | Forest Laboratories, Inc. | 156,600 | 3,932 |
* | Laboratory Corp. of |
|
|
| America Holdings | 57,100 | 3,871 |
51
Tax-Managed Capital Appreciation Fund
|
|
| Market |
|
|
| Value• |
|
| Shares | ($000) |
* | Hospira, Inc. | 91,740 | 3,534 |
* | Zimmer Holdings, Inc. | 81,170 | 3,458 |
* | Life Technologies Corp. | 79,935 | 3,335 |
| McKesson Corp. | 73,424 | 3,231 |
| AmerisourceBergen Corp. | 179,200 | 3,179 |
* | Waters Corp. | 61,400 | 3,160 |
| CIGNA Corp. | 129,300 | 3,115 |
| DENTSPLY |
|
|
| International Inc. | 98,300 | 3,000 |
* | Henry Schein, Inc. | 62,400 | 2,992 |
* | Mylan Inc. | 215,837 | 2,817 |
* | Millipore Corp. | 39,800 | 2,794 |
| Beckman Coulter, Inc. | 47,600 | 2,720 |
* | Watson |
|
|
| Pharmaceuticals, Inc. | 78,500 | 2,645 |
* | Humana Inc. | 79,300 | 2,558 |
* | Mettler-Toledo |
|
|
| International Inc. | 30,700 | 2,368 |
* | King Pharmaceuticals, Inc. | 232,962 | 2,243 |
| C.R. Bard, Inc. | 29,300 | 2,181 |
| PerkinElmer, Inc. | 124,804 | 2,172 |
* | Boston Scientific Corp. | 207,945 | 2,109 |
* | Endo Pharmaceuticals |
|
|
| Holdings, Inc. | 115,700 | 2,073 |
| Universal Health Services |
|
|
| Class B | 40,800 | 1,993 |
| Pharmaceutical Product |
|
|
| Development, Inc. | 84,803 | 1,969 |
* | Warner Chilcott Ltd. | 137,283 | 1,805 |
| Perrigo Co. (U.S.Shares) | 64,840 | 1,801 |
| IMS Health, Inc. | 135,552 | 1,722 |
| Teleflex Inc. | 37,000 | 1,659 |
* | Patterson Companies, Inc. | 73,530 | 1,596 |
* | Lincare Holdings, Inc. | 66,500 | 1,564 |
* | Coventry Health Care Inc. | 81,025 | 1,516 |
* | Health Net Inc. | 74,200 | 1,154 |
| Omnicare, Inc. | 40,900 | 1,054 |
* | Sepracor Inc. | 58,700 | 1,017 |
* | Varian Medical |
|
|
| Systems, Inc. | 26,500 | 931 |
* | Kinetic Concepts, Inc. | 31,000 | 845 |
* | Amylin |
|
|
| Pharmaceuticals, Inc. | 47,800 | 645 |
* | Abraxis BioScience | 14,415 | 531 |
* | DaVita, Inc. | 2,200 | 109 |
|
|
| 385,281 |
Industrials (10.2%) |
|
| |
| General Electric Co. | 2,935,972 | 34,410 |
| United Technologies Corp. | 287,300 | 14,928 |
| The Boeing Co. | 236,770 | 10,063 |
| Lockheed Martin Corp. | 116,800 | 9,420 |
| 3M Co. | 154,200 | 9,267 |
| General Dynamics Corp. | 135,000 | 7,478 |
| United Parcel Service, Inc. | 147,300 | 7,364 |
| Illinois Tool Works, Inc. | 175,200 | 6,542 |
| Danaher Corp. | 105,100 | 6,489 |
| Union Pacific Corp. | 123,914 | 6,451 |
| FedEx Corp. | 110,700 | 6,157 |
| CSX Corp. | 166,100 | 5,752 |
| Norfolk Southern Corp. | 148,200 | 5,583 |
| PACCAR, Inc. | 149,110 | 4,848 |
| Precision Castparts Corp. | 64,900 | 4,740 |
| Emerson Electric Co. | 142,400 | 4,614 |
| Fluor Corp. | 86,200 | 4,421 |
| C.H. Robinson |
|
|
| Worldwide Inc. | 83,200 | 4,339 |
| Waste Management, Inc. | 149,097 | 4,199 |
| Deere & Co. | 104,800 | 4,187 |
| Honeywell |
|
|
| International Inc. | 131,400 | 4,126 |
| ITT Industries, Inc. | 92,700 | 4,125 |
| Caterpillar, Inc. | 123,902 | 4,094 |
| Burlington Northern |
|
|
| Santa Fe Corp. | 54,898 | 4,037 |
| L-3 Communications |
|
|
| Holdings, Inc. | 57,200 | 3,969 |
| Raytheon Co. | 85,833 | 3,814 |
| Expeditors International of |
|
|
| Washington, Inc. | 112,361 | 3,746 |
| Parker Hannifin Corp. | 85,200 | 3,660 |
| Rockwell Collins, Inc. | 85,600 | 3,572 |
| Cummins Inc. | 101,200 | 3,563 |
| Northrop Grumman Corp. | 72,268 | 3,301 |
* | Iron Mountain, Inc. | 111,100 | 3,194 |
| W.W. Grainger, Inc. | 38,500 | 3,152 |
* | Jacobs Engineering |
|
|
| Group Inc. | 70,300 | 2,959 |
| The Dun & |
|
|
| Bradstreet Corp. | 36,200 | 2,940 |
* | Quanta Services, Inc. | 122,500 | 2,833 |
| Fastenal Co. | 84,100 | 2,790 |
| Flowserve Corp. | 39,900 | 2,785 |
| Southwest Airlines Co. | 413,387 | 2,782 |
| AMETEK, Inc. | 80,000 | 2,766 |
* | Stericycle, Inc. | 53,300 | 2,747 |
| Roper Industries Inc. | 59,000 | 2,673 |
| Joy Global Inc. | 69,800 | 2,493 |
| Donaldson Co., Inc. | 71,300 | 2,470 |
| Pall Corp. | 92,500 | 2,457 |
| Equifax, Inc. | 93,200 | 2,433 |
| J.B. Hunt Transport |
|
|
| Services, Inc. | 79,500 | 2,427 |
* | Alliant Techsystems, Inc. | 28,600 | 2,355 |
| Manpower Inc. | 54,600 | 2,312 |
| Bucyrus International, Inc. | 80,239 | 2,292 |
| Con-way, Inc. | 61,200 | 2,161 |
| Landstar System, Inc. | 59,289 | 2,129 |
| Valmont Industries, Inc. | 29,537 | 2,129 |
| IDEX Corp. | 86,400 | 2,123 |
| MSC Industrial |
|
|
| Direct Co., Inc. Class A | 59,200 | 2,100 |
52
Tax-Managed Capital Appreciation Fund
|
|
| Market |
|
|
| Value• |
|
| Shares | ($000) |
| Robert Half |
|
|
| International, Inc. | 87,500 | 2,067 |
| SPX Corp. | 37,400 | 1,831 |
| The Toro Co. | 57,400 | 1,716 |
| KBR Inc. | 89,249 | 1,646 |
| Cintas Corp. | 70,766 | 1,616 |
| Carlisle Co., Inc. | 65,200 | 1,567 |
| Lennox International Inc. | 35,090 | 1,127 |
| The Manitowoc Co., Inc. | 208,774 | 1,098 |
| The Brink’s Co. | 36,800 | 1,068 |
* | UTI Worldwide, Inc. | 77,587 | 884 |
* | Terex Corp. | 69,400 | 838 |
| Graco, Inc. | 33,700 | 742 |
| Textron, Inc. | 61,020 | 589 |
* | Gardner Denver Inc. | 19,846 | 500 |
| Republic Services, Inc. |
|
|
| Class A | 19,512 | 476 |
* | Hertz Global Holdings Inc. | 22,000 | 176 |
* | AGCO Corp. | 3,600 | 105 |
| Ryder System, Inc. | 3,600 | 100 |
* | Raytheon Co. |
|
|
| Warrants Exp. 6/16/11 | 2,285 | 21 |
* | Owens Corning Inc. | 1,100 | 14 |
* | AMR Corp. | 3,100 | 12 |
|
|
| 282,954 |
Information Technology (18.5%) |
| ||
| Microsoft Corp. | 2,376,500 | 56,489 |
| International Business |
|
|
| Machines Corp. | 394,058 | 41,148 |
* | Apple Inc. | 283,000 | 40,308 |
* | Cisco Systems, Inc. | 1,850,400 | 34,491 |
* | Google Inc. | 77,050 | 32,483 |
| Hewlett-Packard Co. | 774,458 | 29,933 |
| Oracle Corp. | 1,244,934 | 26,666 |
| Intel Corp. | 1,539,200 | 25,474 |
| QUALCOMM Inc. | 415,720 | 18,791 |
| Visa Inc. | 162,298 | 10,105 |
| Texas Instruments, Inc. | 466,100 | 9,928 |
* | EMC Corp. | 737,000 | 9,655 |
* | Dell Inc. | 643,800 | 8,839 |
| Corning, Inc. | 504,200 | 8,097 |
* | eBay Inc. | 430,569 | 7,376 |
* | Yahoo! Inc. | 468,600 | 7,338 |
| Applied Materials, Inc. | 553,100 | 6,067 |
* | Adobe Systems, Inc. | 210,000 | 5,943 |
* | Symantec Corp. | 354,353 | 5,514 |
| MasterCard, Inc. Class A | 31,020 | 5,190 |
| Western Union Co. | 309,895 | 5,082 |
* | Broadcom Corp. | 175,950 | 4,362 |
* | Intuit, Inc. | 142,600 | 4,016 |
* | Fiserv, Inc. | 83,350 | 3,809 |
| CA, Inc. | 201,266 | 3,508 |
* | Western Digital Corp. | 132,100 | 3,501 |
* | Computer Sciences Corp. | 78,900 | 3,495 |
| Automatic Data |
|
|
| Processing, Inc. | 98,100 | 3,477 |
* | Agilent Technologies, Inc. | 166,306 | 3,378 |
| Amphenol Corp. Class A | 104,000 | 3,291 |
* | BMC Software, Inc. | 95,000 | 3,210 |
| Analog Devices, Inc. | 118,166 | 2,928 |
| Linear Technology Corp. | 124,200 | 2,900 |
* | NetApp, Inc. | 144,963 | 2,859 |
* | Juniper Networks, Inc. | 119,000 | 2,808 |
| Altera Corp. | 170,147 | 2,770 |
| Fidelity National Information |
|
|
| Services, Inc. | 134,759 | 2,690 |
* | NVIDIA Corp. | 234,750 | 2,650 |
* | Affiliated Computer |
|
|
| Services, Inc. Class A | 58,400 | 2,594 |
| KLA-Tencor Corp. | 100,800 | 2,545 |
| Global Payments Inc. | 67,700 | 2,536 |
* | LSI Corp. | 544,328 | 2,482 |
* | Teradata Corp. | 99,574 | 2,333 |
| Motorola, Inc. | 347,230 | 2,302 |
* | Citrix Systems, Inc. | 71,356 | 2,276 |
* | Avnet, Inc. | 105,400 | 2,217 |
| Accenture Ltd. | 66,200 | 2,215 |
* | Ingram Micro, Inc. Class A | 125,000 | 2,187 |
* | LAM Research Corp. | 82,108 | 2,135 |
* | Autodesk, Inc. | 109,588 | 2,080 |
* | Compuware Corp. | 294,562 | 2,021 |
| Xerox Corp. | 305,400 | 1,979 |
* | Electronic Arts Inc. | 90,200 | 1,959 |
* | Arrow Electronics, Inc. | 91,500 | 1,943 |
* | QLogic Corp. | 150,000 | 1,902 |
* | Tech Data Corp. | 55,510 | 1,816 |
* | Synopsys, Inc. | 89,121 | 1,739 |
| Lender Processing |
|
|
| Services, Inc. | 61,250 | 1,701 |
| Molex, Inc. | 104,756 | 1,629 |
* | DST Systems, Inc. | 42,800 | 1,581 |
* | Fairchild Semiconductor |
|
|
| International, Inc. | 224,958 | 1,572 |
* | Tellabs, Inc. | 266,900 | 1,529 |
| Microchip Technology, Inc. | 65,100 | 1,468 |
| Xilinx, Inc. | 71,336 | 1,460 |
| Total System Services, Inc. | 104,059 | 1,393 |
| National |
|
|
| Semiconductor Corp. | 96,600 | 1,212 |
* | NCR Corp. | 99,574 | 1,178 |
| Intersil Corp. | 85,600 | 1,076 |
* | Metavante Technologies | 39,866 | 1,031 |
| Broadridge Financial |
|
|
| Solutions LLC | 58,725 | 974 |
* | Atmel Corp. | 248,700 | 928 |
* | Lexmark International, Inc. | 50,300 | 797 |
* | Teradyne, Inc. | 110,200 | 756 |
* | Zebra Technologies Corp. |
|
|
| Class A | 27,257 | 645 |
| Paychex, Inc. | 17,685 | 446 |
* | IAC/InterActiveCorp | 24,515 | 393 |
* | Activision Blizzard, Inc. | 23,800 | 301 |
53
Tax-Managed Capital Appreciation Fund
|
|
| Market |
|
|
| Value• |
|
| Shares | ($000) |
* | Sun Microsystems, Inc. | 30,475 | 281 |
* | Novellus Systems, Inc. | 13,100 | 219 |
| Harris Corp. | 4,300 | 122 |
|
|
| 514,522 |
| Materials (3.7%) |
|
|
| Monsanto Co. | 187,534 | 13,941 |
| Praxair, Inc. | 117,000 | 8,315 |
| Freeport-McMoRan |
|
|
| Copper & Gold, Inc. |
|
|
| Class B | 158,754 | 7,955 |
| Newmont Mining Corp. |
|
|
| (Holding Co.) | 175,086 | 7,156 |
| Nucor Corp. | 129,600 | 5,758 |
| E.I. du Pont de |
|
|
| Nemours & Co. | 160,300 | 4,107 |
| Ecolab, Inc. | 97,200 | 3,790 |
| The Mosaic Co. | 79,300 | 3,513 |
| Sigma-Aldrich Corp. | 70,000 | 3,469 |
* | Owens-Illinois, Inc. | 108,200 | 3,031 |
| Ball Corp. | 65,600 | 2,963 |
| Celanese Corp. Series A | 116,311 | 2,762 |
| Airgas, Inc. | 64,900 | 2,630 |
| CF Industries Holdings, Inc. | 35,000 | 2,595 |
| FMC Corp. | 53,700 | 2,540 |
| Martin Marietta |
|
|
| Materials, Inc. | 30,600 | 2,414 |
| Nalco Holding Co. | 142,300 | 2,396 |
* | Pactiv Corp. | 108,140 | 2,347 |
| Albemarle Corp. | 87,100 | 2,227 |
| Allegheny Technologies Inc. | 60,900 | 2,127 |
| Sealed Air Corp. | 106,072 | 1,957 |
| Scotts Miracle-Gro Co. | 55,099 | 1,931 |
| Schnitzer Steel |
|
|
| Industries, Inc. Class A | 33,724 | 1,783 |
| Reliance Steel & |
|
|
| Aluminum Co. | 46,300 | 1,777 |
| United States Steel Corp. | 47,600 | 1,701 |
| Titanium Metals Corp. | 174,835 | 1,607 |
* | Intrepid Potash, Inc. | 53,300 | 1,497 |
| Dow Chemical Co. | 87,700 | 1,416 |
| Cytec Industries, Inc. | 51,800 | 965 |
| Cliffs Natural |
|
|
| Resources Inc. | 29,461 | 721 |
| International Paper Co. | 35,900 | 543 |
| Valspar Corp. | 23,400 | 527 |
| Packaging Corp. of America | 26,600 | 431 |
| Southern Copper Corp. |
|
|
| (U.S. Shares) | 21,000 | 429 |
| Air Products & |
|
|
| Chemicals, Inc. | 5,700 | 368 |
| Vulcan Materials Co. | 7,638 | 329 | |
* | Crown Holdings, Inc. | 11,800 | 285 | |
|
|
| 104,303 | |
Other (0.0%) |
|
| ||
1 | Miscellaneous Securities |
| 1,221 | |
|
|
|
| |
Telecommunication Services (3.4%) |
|
| ||
| AT&T Inc. | 1,749,979 | 43,470 | |
| Verizon |
|
| |
| Communications Inc. | 756,842 | 23,258 | |
* | Sprint Nextel Corp. | 1,093,856 | 5,261 | |
* | American Tower Corp. |
|
| |
| Class A | 166,400 | 5,247 | |
* | Crown Castle |
|
| |
| International Corp. | 148,800 | 3,574 | |
| Qwest Communications |
|
| |
| International Inc. | 846,721 | 3,514 | |
| Embarq Corp. | 80,743 | 3,396 | |
| CenturyTel, Inc. | 47,014 | 1,443 | |
* | SBA |
|
| |
| Communications Corp. | 52,823 | 1,296 | |
* | U.S. Cellular Corp. | 32,300 | 1,242 | |
| Telephone & |
|
| |
| Data Systems, Inc. | 43,601 | 1,234 | |
| Telephone & |
|
| |
| Data Systems, Inc.– |
|
| |
| Special Common Shares | 33,200 | 862 | |
| Frontier |
|
| |
| Communications Corp. | 52,351 | 374 | |
* | Level 3 |
|
| |
| Communications, Inc. | 119,100 | 180 | |
| Windstream Corp. | 20,957 | 175 | |
|
|
| 94,526 | |
Utilities (4.1%) |
|
| ||
| Exelon Corp. | 229,000 | 11,727 | |
| FPL Group, Inc. | 122,451 | 6,962 | |
| Entergy Corp. | 77,000 | 5,969 | |
| PG&E Corp. | 145,600 | 5,597 | |
| Sempra Energy | 107,736 | 5,347 | |
| Edison International | 142,500 | 4,483 | |
* | AES Corp. | 350,948 | 4,074 | |
* | NRG Energy, Inc. | 149,800 | 3,889 | |
| Southern Co. | 121,500 | 3,786 | |
| Questar Corp. | 101,700 | 3,159 | |
| Wisconsin Energy Corp. | 73,200 | 2,980 | |
| EQT Corp. | 84,700 | 2,957 | |
* | Calpine Corp. | 244,080 | 2,721 | |
| MDU Resources |
|
| |
| Group, Inc. | 137,050 | 2,600 | |
| Allegheny Energy, Inc. | 101,089 | 2,593 | |
| Energen Corp. | 62,400 | 2,490 | |
| CenterPoint Energy Inc. | 223,800 | 2,480 | |
| Northeast Utilities | 110,600 | 2,467 | |
| NSTAR | 76,600 | 2,460 | |
| NV Energy Inc. | 224,483 | 2,422 | |
| SCANA Corp. | 74,200 | 2,409 | |
| Duke Energy Corp. | 163,592 | 2,387 | |
54
Tax-Managed Capital Appreciation Fund
|
|
| Market |
|
|
| Value• |
|
| Shares | ($000) |
* | Mirant Corp. | 149,598 | 2,355 |
| CMS Energy Corp. | 193,086 | 2,332 |
| Public Service Enterprise |
|
|
| Group, Inc. | 69,800 | 2,278 |
| Dominion Resources, Inc. | 67,086 | 2,242 |
| Constellation Energy |
|
|
| Group, Inc. | 83,300 | 2,214 |
* | RRI Energy, Inc. | 436,272 | 2,186 |
| FirstEnergy Corp. | 55,900 | 2,166 |
* | Dynegy, Inc. | 934,535 | 2,121 |
| Aqua America, Inc. | 107,583 | 1,926 |
| Integrys Energy Group, Inc. | 61,481 | 1,844 |
| Ormat Technologies Inc. | 43,800 | 1,766 |
| DPL Inc. | 75,000 | 1,738 |
| American |
|
|
| Water Works Co., Inc. | 87,200 | 1,666 |
| UGI Corp. Holding Co. | 34,466 | 878 |
| NiSource, Inc. | 35,920 | 419 |
| American Electric |
|
|
| Power Co., Inc. | 9,300 | 269 |
|
|
| 114,359 |
Total Common Stocks |
|
| |
(Cost $2,471,575) |
| 2,782,507 | |
Temporary Cash Investment (0.1%) |
|
| |
Money Market Fund (0.1%) |
|
| |
2 | Vanguard Market |
|
|
| Liquidity Fund, 0.395% |
|
|
| (Cost $3,151) | 3,151,109 | 3,151 |
Total Investments (100.0%) |
|
| |
(Cost $2,474,726) |
| 2,785,658 | |
Other Assets and Liabilities (0.0%) |
|
| |
Other Assets |
| 40,705 | |
Liabilities |
| (42,077) | |
|
|
| (1,372) |
Net Assets (100%) |
| 2,784,286 | |
At June 30, 2009, net assets consisted of: | |
| Amount |
| ($000) |
Paid-in Capital | 3,015,723 |
Undistributed Net Investment Income | 18,981 |
Accumulated Net Realized Losses | (561,350) |
Unrealized Appreciation (Depreciation) | 310,932 |
Net Assets | 2,784,286 |
|
|
|
|
Investor Shares—Net Assets |
|
Applicable to 21,287,827 outstanding |
|
$.001 par value shares of beneficial |
|
interest (unlimited authorization) | 478,785 |
Net Asset Value Per Share— |
|
Investor Shares | $22.49 |
|
|
|
|
Admiral Shares—Net Assets |
|
Applicable to 46,582,206 outstanding |
|
$.001 par value shares of beneficial |
|
interest (unlimited authorization) | 2,108,953 |
Net Asset Value Per Share— |
|
Admiral Shares | $45.27 |
|
|
|
|
Institutional Shares—Net Assets |
|
Applicable to 8,735,610 outstanding |
|
$.001 par value shares of beneficial |
|
interest (unlimited authorization) | 196,548 |
Net Asset Value Per Share— |
|
Institutional Shares | $22.50 |
• See Note A in Notes to Financial Statements.
* Non-income-producing security.
1 Securities representing up to 5% of the market value of unaffiliated securities are permitted to be combined and reported as “miscellaneous securities” provided that they have been held for less than one year and not previously reported by name.
2 Affiliated money market fund available only to Vanguard funds and certain trusts and accounts managed by Vanguard. Rate shown is the 7-day yield.
REIT—Real Estate Investment Trust.
See accompanying Notes, which are an integral part of the Financial Statements.
55
Tax-Managed Capital Appreciation Fund
Statement of Operations
| Six Months Ended |
| June 30, 2009 |
| ($000) |
Investment Income |
|
Income |
|
Dividends | 27,104 |
Interest1 | 5 |
Total Income | 27,109 |
Expenses |
|
The Vanguard Group—Note B |
|
Investment Advisory Services | 96 |
Management and Administrative—Investor Shares | 360 |
Management and Administrative—Admiral Shares | 1,078 |
Management and Administrative—Institutional Shares | 45 |
Marketing and Distribution—Investor Shares | 63 |
Marketing and Distribution—Admiral Shares | 254 |
Marketing and Distribution—Institutional Shares | 24 |
Custodian Fees | 21 |
Shareholders’ Reports and Proxies—Investor Shares | 19 |
Shareholders’ Reports and Proxies—Admiral Shares | 9 |
Shareholders’ Reports and Proxies—Institutional Shares | — |
Trustees’ Fees and Expenses | 2 |
Total Expenses | 1,971 |
Net Investment Income | 25,138 |
Realized Net Gain (Loss) on Investment Securities Sold | 5,809 |
Change in Unrealized Appreciation (Depreciation) of Investment Securities | 97,550 |
Net Increase (Decrease) in Net Assets Resulting from Operations | 128,497 |
1 Interest income from an affiliated company of the fund was $5,000.
See accompanying Notes, which are an integral part of the Financial Statements.
56
Tax-Managed Capital Appreciation Fund
Statement of Changes in Net Assets
| Six Months Ended |
| Year Ended |
| June 30, |
| December 31, |
| 2009 |
| 2008 |
| ($000) |
| ($000) |
Increase (Decrease) in Net Assets |
|
|
|
Operations |
|
|
|
Net Investment Income | 25,138 |
| 63,900 |
Realized Net Gain (Loss) | 5,809 |
| (156,072) |
Change in Unrealized Appreciation (Depreciation) | 97,550 |
| (1,592,772) |
Net Increase (Decrease) in Net Assets Resulting from Operations | 128,497 |
| (1,684,944) |
Distributions |
|
|
|
Net Investment Income |
|
|
|
Investor Shares | (237) |
| (10,850) |
Admiral Shares | (979) |
| (48,923) |
Institutional Shares | (85) |
| (4,486) |
Realized Capital Gain |
|
|
|
Investor Shares | — |
| — |
Admiral Shares | — |
| — |
Institutional Shares | — |
| — |
Total Distributions | (1,301) |
| (64,259) |
Capital Share Transactions |
|
|
|
Investor Shares | (16,110) |
| (5,543) |
Admiral Shares | (32,662) |
| 86,970 |
Institutional Shares | 2,923 |
| 14,935 |
Net Increase (Decrease) from Capital Share Transactions | (45,849) |
| 96,362 |
Total Increase (Decrease) | 81,347 |
| (1,652,841) |
Net Assets |
|
|
|
Beginning of Period | 2,702,939 |
| 4,355,780 |
End of Period1 | 2,784,286 |
| 2,702,939 |
1 Net Assets—End of Period includes undistributed (overdistributed) net investment income of $18,981,000 and ($4,856,000).
See accompanying Notes, which are an integral part of the Financial Statements.
57
Tax-Managed Capital Appreciation Fund
Financial Highlights
Investor Shares |
|
|
|
|
|
|
|
|
|
|
|
|
|
| Six Months |
|
|
|
|
|
| Ended |
|
|
| ||
For a Share Outstanding | June 30, | Year Ended December 31, | ||||
Throughout Each Period | 2009 | 2008 | 2007 | 2006 | 2005 | 2004 |
Net Asset Value, Beginning of Period | $21.39 | $35.13 | $33.62 | $29.80 | $28.05 | $25.43 |
Investment Operations |
|
|
|
|
|
|
Net Investment Income | .197 | .498 | .530 | .471 | .352 | .365 |
Net Realized and Unrealized Gain (Loss) |
|
|
|
|
|
|
on Investments | .914 | (13.738) | 1.513 | 3.821 | 1.752 | 2.622 |
Total from Investment Operations | 1.111 | (13.240) | 2.043 | 4.292 | 2.104 | 2.987 |
Distributions |
|
|
|
|
|
|
Dividends from Net Investment Income | (.011) | (.500) | (.533) | (.472) | (.354) | (.367) |
Distributions from Realized Capital Gains | — | — | — | — | — | — |
Total Distributions | (.011) | (.500) | (.533) | (.472) | (.354) | (.367) |
Net Asset Value, End of Period | $22.49 | $21.39 | $35.13 | $33.62 | $29.80 | $28.05 |
|
|
|
|
|
|
|
|
|
|
|
|
|
|
Total Return1 | 5.21% | –37.63% | 6.07% | 14.40% | 7.49% | 11.75% |
|
|
|
|
|
|
|
|
|
|
|
|
|
|
Ratios/Supplemental Data |
|
|
|
|
|
|
Net Assets, End of Period (Millions) | $479 | $473 | $782 | $832 | $857 | $1,596 |
Ratio of Total Expenses to |
|
|
|
|
|
|
Average Net Assets | 0.21%2 | 0.16% | 0.15% | 0.15% | 0.14% | 0.14% |
Ratio of Net Investment Income to |
|
|
|
|
|
|
Average Net Assets | 1.92%2 | 1.66% | 1.51% | 1.51% | 1.25% | 1.4 0% |
Portfolio Turnover Rate | 8%2 | 8% | 5% | 5% | 8% | 5% |
1 Total returns do not reflect the 1% redemption fee on shares held less than five years; the 2% redemption fee assessed prior to September 14, 2005, on shares held less than one year; or the account service fee that may be applicable to certain accounts with balances below $10,000.
2 Annualized.
See accompanying Notes, which are an integral part of the Financial Statements.
58
Tax-Managed Capital Appreciation Fund
Financial Highlights
Admiral Shares |
|
|
|
|
|
|
|
|
|
|
|
|
|
| Six Months |
|
|
|
|
|
| Ended |
|
|
| ||
For a Share Outstanding | June 30, | Year Ended December 31, | ||||
Throughout Each Period | 2009 | 2008 | 2007 | 2006 | 2005 | 2004 |
Net Asset Value, Beginning of Period | $43.04 | $70.70 | $67.68 | $60.00 | $56.46 | $51.20 |
Investment Operations |
|
|
|
|
|
|
Net Investment Income | .408 | 1.040 | 1.113 | .990 | .729 | .762 |
Net Realized and Unrealized Gain (Loss) |
|
|
|
|
|
|
on Investments | 1.843 | (27.656) | 3.026 | 7.680 | 3.543 | 5.263 |
Total from Investment Operations | 2.251 | (26.616) | 4.139 | 8.670 | 4.272 | 6.025 |
Distributions |
|
|
|
|
|
|
Dividends from Net Investment Income | (.021) | (1.044) | (1.119) | (.990) | (.732) | (.765) |
Distributions from Realized Capital Gains | — | — | — | — | — | — |
Total Distributions | (.021) | (1.044) | (1.119) | (.990) | (.732) | (.765) |
Net Asset Value, End of Period | $45.27 | $43.04 | $70.70 | $67.68 | $60.00 | $56.46 |
|
|
|
|
|
|
|
|
|
|
|
|
|
|
Total Return1 | 5.24% | –37.58% | 6.11% | 14.44% | 7.56% | 11.77% |
|
|
|
|
|
|
|
|
|
|
|
|
|
|
Ratios/Supplemental Data |
|
|
|
|
|
|
Net Assets, End of Period (Millions) | $2,109 | $2,045 | $3,283 | $2,941 | $2,360 | $1,397 |
Ratio of Total Expenses to |
|
|
|
|
|
|
Average Net Assets | 0.15%2 | 0.10% | 0.09% | 0.10% | 0.10% | 0.10% |
Ratio of Net Investment Income to |
|
|
|
|
|
|
Average Net Assets | 1.98%2 | 1.72% | 1.57% | 1.56% | 1.29% | 1.47% |
Portfolio Turnover Rate | 8%2 | 8% | 5% | 5% | 8% | 5% |
1 Total returns do not reflect the 1% redemption fee on shares held less than five years or the 2% redemption fee assessed prior to September 14, 2005, on shares held less than one year.
2 Annualized.
See accompanying Notes, which are an integral part of the Financial Statements.
59
Tax-Managed Capital Appreciation Fund
Financial Highlights
Institutional Shares |
|
|
|
|
|
|
|
|
|
|
|
|
|
| Six Months |
|
|
|
|
|
| Ended |
|
|
| ||
For a Share Outstanding | June 30, | Year Ended December 31, | ||||
Throughout Each Period | 2009 | 2008 | 2007 | 2006 | 2005 | 2004 |
Net Asset Value, Beginning of Period | $21.38 | $35.13 | $33.63 | $29.81 | $28.05 | $25.44 |
Investment Operations |
|
|
|
|
|
|
Net Investment Income | .209 | .525 | .551 | .500 | .384 | .375 |
Net Realized and Unrealized Gain (Loss) |
|
|
|
|
|
|
on Investments | .921 | (13.748) | 1.513 | 3.820 | 1.752 | 2.622 |
Total from Investment Operations | 1.130 | (13.223) | 2.064 | 4.320 | 2.136 | 2.997 |
Distributions |
|
|
|
|
|
|
Dividends from Net Investment Income | (.010) | (.527) | (.564) | (.500) | (.376) | (.387) |
Distributions from Realized Capital Gains | — | — | — | — | — | — |
Total Distributions | (.010) | (.527) | (.564) | (.500) | (.376) | (.387) |
Net Asset Value, End of Period | $22.50 | $21.38 | $35.13 | $33.63 | $29.81 | $28.05 |
|
|
|
|
|
|
|
|
|
|
|
|
|
|
Total Return1 | 5.30% | –37.57% | 6.13% | 14.49% | 7.61% | 11.78% |
|
|
|
|
|
|
|
|
|
|
|
|
|
|
Ratios/Supplemental Data |
|
|
|
|
|
|
Net Assets, End of Period (Millions) | $197 | $185 | $291 | $218 | $204 | $102 |
Ratio of Total Expenses to |
|
|
|
|
|
|
Average Net Assets | 0.09%2 | 0.07% | 0.07% | 0.07% | 0.07% | 0.07% |
Ratio of Net Investment Income to |
|
|
|
|
|
|
Average Net Assets | 2.04%2 | 1.75% | 1.59% | 1.59% | 1.32% | 1.47% |
Portfolio Turnover Rate | 8%2 | 8% | 5% | 5% | 8% | 5% |
1 Total returns do not reflect the 1% redemption fee on shares held less then five years or the 2% redemption fee assessed prior to September 14, 2005, on shares held less than one year.
2 Annualized.
See accompanying Notes, which are an integral part of the Financial Statements.
60
Tax-Managed Capital Appreciation Fund
Notes to Financial Statements
Vanguard Tax-Managed Capital Appreciation Fund is registered under the Investment Company Act of 1940 as an open-end investment company, or mutual fund. The fund offers three classes of shares: Investor Shares, Admiral Shares, and Institutional Shares. Investor Shares are available to any investor who meets the fund’s minimum purchase requirements. Admiral Shares are designed for investors who meet certain administrative, service, tenure, and account-size criteria. Institutional Shares are designed for investors who meet certain administrative and service criteria and invest a minimum of $5 million.
A. The following significant accounting policies conform to generally accepted accounting principles for U.S. mutual funds. The fund consistently follows such policies in preparing its financial statements.
1. Security Valuation: Securities are valued as of the close of trading on the New York Stock Exchange (generally 4 p.m., Eastern time) on the valuation date. Equity securities are valued at the latest quoted sales prices or official closing prices taken from the primary market in which each security trades; such securities not traded on the valuation date are valued at the mean of the latest quoted bid and asked prices. Securities for which market quotations are not readily available, or whose values have been materially affected by events occurring before the fund’s pricing time but after the close of the securities’ primary markets, are valued by methods deemed by the board of trustees to represent fair value. Investments in Vanguard Market Liquidity Fund are valued at that fund’s net asset value.
2. Federal Income Taxes: The fund intends to continue to qualify as a regulated investment company and distribute all of its taxable income. Management has analyzed the fund’s tax positions taken on federal income tax returns for all open tax years (tax years ended December 31, 2005–2008) and for the period ended June 30, 2009, and has concluded that no provision for federal income tax is required in the fund’s financial statements.
3. Distributions: Distributions to shareholders are recorded on the ex-dividend date.
4. Other: Dividend income is recorded on the ex-dividend date. Interest income includes income distributions received from Vanguard Market Liquidity Fund and is accrued daily. Security transactions are accounted for on the date securities are bought or sold. Costs used to determine realized gains (losses) on the sale of investment securities are those of the specific securities sold. Fees assessed on redemptions of capital shares are credited to paid-in capital.
Each class of shares has equal rights as to assets and earnings, except that each class separately bears certain class-specific expenses related to maintenance of shareholder accounts (included in Management and Administrative expenses), shareholder reporting, and proxies. Marketing and distribution expenses are allocated to each class of shares based on a method approved by the board of trustees. Income, other non-class-specific expenses, and gains and losses on investments are allocated to each class of shares based on its relative net assets.
B. The Vanguard Group furnishes at cost investment advisory, corporate management, administrative, marketing, and distribution services. The costs of such services are allocated to the fund under methods approved by the board of trustees. The fund has committed to provide up to 0.40% of its net assets in capital contributions to Vanguard. At June 30, 2009, the fund had contributed capital of $652,000 to Vanguard (included in Other Assets), representing 0.02% of the fund’s net assets and 0.26% of Vanguard’s capitalization. The fund’s trustees and officers are also directors and officers of Vanguard.
61
Tax-Managed Capital Appreciation Fund
C. Various inputs may be used to determine the value of the fund’s investments. These inputs are summarized in three broad levels for financial statement purposes. The inputs or methodologies used to value securities are not necessarily an indication of the risk associated with investing in those securities.
Level 1—Quoted prices in active markets for identical securities.
Level 2—Other significant observable inputs (including quoted prices for similar securities, interest rates, prepayment speeds, credit risk, etc.).
Level 3—Significant unobservable inputs (including the fund’s own assumptions used to determine the fair value of investments).
At June 30, 2009, 100% of the fund’s investments were valued based on Level 1 inputs.
D. Distributions are determined on a tax basis and may differ from net investment income and realized capital gains for financial reporting purposes. Differences may be permanent or temporary. Permanent differences are reclassified among capital accounts in the financial statements to reflect their tax character. Temporary differences arise when certain items of income, expense, gain, or loss are recognized in different periods for financial statement and tax purposes; these differences will reverse at some time in the future. Differences in classification may also result from the treatment of short-term gains as ordinary income for tax purposes.
The fund’s tax-basis capital gains and losses are determined only at the end of each fiscal year. For tax purposes, at December 31, 2008, the fund had available realized losses of $555,088,000 to offset future net capital gains of $139,756,000 through December 31, 2009, $106,018,000 through December 31, 2010, $163,808,000 through December 31, 2011, $62,756,000 through December 31, 2016, and $82,750,000 through December 31, 2017. The fund will use these capital losses to offset net taxable capital gains, if any, realized during the year ending December 31, 2009; should the fund realize net capital losses for the year, the losses will be added to the loss carryforward balances above.
At June 30, 2009, the cost of investment securities for tax purposes was $2,474,726,000. Net unrealized appreciation of investment securities for tax purposes was $310,932,000, consisting of unrealized gains of $753,692,000 on securities that had risen in value since their purchase and $442,760,000 in unrealized losses on securities that had fallen in value since their purchase.
E. During the six months ended June 30, 2009, the fund purchased $100,907,000 of investment securities and sold $122,187,000 of investment securities, other than temporary cash investments.
62
Tax-Managed Capital Appreciation Fund
F. Capital share transactions for each class of shares were:
| Six Months Ended | Year Ended | |||
| June 30, 2009 | December 31, 2008 | |||
| Amount | Shares |
| Amount | Shares |
| ($000) | (000) |
| ($000) | (000) |
Investor Shares |
|
|
|
|
|
Issued | 24,888 | 1,219 |
| 110,694 | 3,916 |
Issued in Lieu of Cash Distributions | 210 | 11 |
| 9,530 | 465 |
Redeemed1 | (41,208) | (2,060) |
| (125,767) | (4,531) |
Net Increase (Decrease)—Investor Shares | (16,110) | (830) |
| (5,543) | (150) |
Admiral Shares |
|
|
|
|
|
Issued | 83,712 | 2,028 |
| 356,002 | 6,182 |
Issued in Lieu of Cash Distributions | 765 | 21 |
| 38,125 | 925 |
Redeemed1 | (117,139) | (2,988) |
| (307,157) | (6,013) |
Net Increase (Decrease)—Admiral Shares | (32,662) | (939) |
| 86,970 | 1,094 |
Institutional Shares |
|
|
|
|
|
Issued | 12,035 | 549 |
| 49,845 | 1,689 |
Issued in Lieu of Cash Distributions | 48 | 3 |
| 2,591 | 127 |
Redeemed1 | (9,160) | (448) |
| (37,501) | (1,471) |
Net Increase (Decrease)—Institutional Shares | 2,923 | 104 |
| 14,935 | 345 |
1 Net of redemption fees for fiscal 2009 and 2008 of $401,000 and $1,036,000, respectively (fund totals). | |||||
G. In preparing the financial statements as of June 30, 2009, management considered the impact of subsequent events occurring through August 5, 2009, for potential recognition or disclosure in these financial statements.
63
Tax-Managed Small-Cap Fund
Fund Profile
As of June 30, 2009
Portfolio Characteristics |
|
| |
|
| Comparative | Broad |
| Fund | Index1 | Index2 |
Number of Stocks | 600 | 600 | 4,399 |
Median Market Cap | $0.8B | $0.8B | $24.2B |
Price/Earnings Ratio | 25.7x | 25.5x | 18.6x |
Price/Book Ratio | 1.5x | 1.4x | 1.9x |
Yield3 |
|
| 2.2% |
Investor Shares | 1.2% |
|
|
Institutional Shares | 1.3% |
|
|
Return on Equity | 13.1% | 12.9% | 19.7% |
Earnings Growth Rate | 11.1% | 11.2% | 13.5% |
Foreign Holdings | 0.0% | 0.0% | 0.0 % |
Turnover Rate4 | 32% | — | — |
Expense Ratio5 |
| — | — |
Investor Shares | 0.19% |
|
|
Institutional Shares | 0.09% |
|
|
Short-Term Reserves | 0.1% | — | — |
Volatility Measures6 |
| |
| Fund Versus | Fund Versus |
| Comparative Index1 | Broad Index2 |
R-Squared | 1.00 | 0.90 |
Beta | 0.99 | 1.14 |
Investment Focus
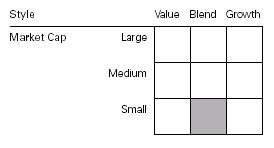
Sector Diversification (% of equity exposure) | |||
|
| Comparative | Broad |
| Fund | Index1 | Index2 |
Consumer Discretionary | 14.5% | 14.4% | 9.7% |
Consumer Staples | 4.2 | 4.2 | 10.4 |
Energy | 4.9 | 4.9 | 11.8 |
Financials | 17.6 | 17.9 | 15.0 |
Health Care | 13.8 | 13.7 | 13.6 |
Industrials | 17.4 | 17.7 | 10.3 |
Information Technology | 18.2 | 17.8 | 18.2 |
Materials | 4.2 | 4.2 | 3.6 |
Telecommunication |
|
|
|
Services | 0.5 | 0.5 | 3.2 |
Utilities | 4.7 | 4.7 | 4.2 |
Ten Largest Holdings7 (% of total net assets) | ||
|
|
|
Atmos Energy Corp. | gas utilities | 0.7% |
MEDNAX, Inc. | health care services | 0.6 |
Piedmont Natural Gas, Inc. | gas utilities | 0.5 |
Varian Semiconductor | semiconductor |
|
Equipment Associates, Inc. | equipment | 0.5 |
Tetra Tech, Inc. | environmental and |
|
| facilities services | 0.5 |
Kirby Corp. | marine | 0.5 |
Skyworks Solutions, Inc. | semiconductors | 0.5 |
Green Mountain | packaged foods |
|
Coffee Roasters, Inc. | and meats | 0.5 |
New Jersey |
|
|
Resources Corp. | gas utilities | 0.5 |
ProAssurance Corp. | property and |
|
| casualty insurance | 0.5 |
Top Ten |
| 5.3% |
1 S&P SmallCap 600 Index.
2 Dow Jones U.S. Total Stock Market Index.
3 30-day SEC yield for the fund; annualized dividend yield for the indexes. See the Glossary.
4 Annualized.
5 The expense ratios shown are from the prospectuses dated April 24, 2009, and represent estimated costs for the current fiscal year based on the fund’s net assets as of the prospectus date. For the six months ended June 30, 2009, the annualized expense ratios were 0.19% for Investor Shares and 0.09% for Institutional Shares.
6 For an explanation of R-squared, beta, and other terms used here, see the Glossary.
7 The holdings listed exclude any temporary cash investments and equity index products.
64
Tax-Managed Small-Cap Fund
Performance Summary
All of the returns in this report represent past performance, which is not a guarantee of future results that may be achieved by the fund. (Current performance may be lower or higher than the performance data cited. For performance data current to the most recent month-end, visit our website at www.vanguard.com/performance.) Note, too, that both investment returns and principal value can fluctuate widely, so an investor’s shares, when sold, could be worth more or less than their original cost. The returns shown do not reflect taxes that a shareholder would pay on fund distributions or on the sale of fund shares.
Fiscal-Year Total Returns (%): March 25, 1999–June 30, 2009
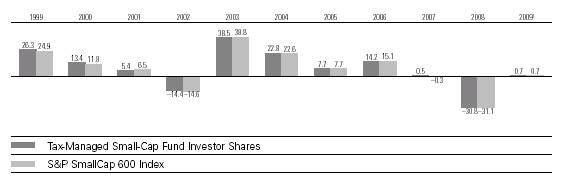
Average Annual Total Returns: Periods Ended June 30, 2009 | ||||
|
|
|
|
|
| Inception Date | One Year | Five Years | Ten Years |
Tax-Managed Small-Cap Fund |
|
|
|
|
Investor Shares2 | 3/25/1999 | –25.11% | –0.79% | 4.89% |
Fee-Adjusted Returns3 |
| –25.84 | –0.79 | 4.89 |
Institutional Shares | 4/21/1999 | –25.02 | –0.74 | 4.97 |
Fee-Adjusted Returns3 |
| –25.76 | –0.74 | 4.97 |
1 Six months ended June 30, 2009.
2 Total returns do not include the account service fee that may be applicable to certain accounts with balances below $10,000.
3 Reflective of the 1% fee assessed on redemptions of shares held in the fund for less than five years. Note: See Financial Highlights tables for dividend and capital gains information.
65
Tax-Managed Small-Cap Fund
Financial Statements (unaudited)
Statement of Net Assets
As of June 30, 2009
The fund provides a complete list of its holdings four times in each fiscal year, at the quarter-ends. For the second and fourth fiscal quarters, the lists appear in the fund’s semiannual and annual reports to shareholders. For the first and third fiscal quarters, the fund files the lists with the Securities and Exchange Commission on Form N-Q. Shareholders can look up the fund’s Forms N-Q on the SEC’s website at www.sec.gov. Forms N-Q may also be reviewed and copied at the SEC’s Public Reference Room (see the back cover of this report for further information).
|
|
| Market |
|
|
| Value• |
|
| Shares | ($000) |
Common Stocks (99.6%) |
|
| |
Consumer Discretionary (14.4%) |
|
| |
* | Carter’s, Inc. | 237,666 | 5,849 |
* | Tractor Supply Co. | 132,524 | 5,476 |
* | Jack in the Box Inc. | 239,336 | 5,373 |
| Wolverine World Wide, Inc. | 206,437 | 4,554 |
* | Iconix Brand Group Inc. | 289,247 | 4,449 |
| Polaris Industries, Inc. | 136,668 | 4,390 |
* | The Gymboree Corp. | 122,113 | 4,333 |
| Hillenbrand Inc. | 259,339 | 4,315 |
| Men’s Wearhouse, Inc. | 218,416 | 4,189 |
* | Deckers Outdoor Corp. | 55,003 | 3,865 |
* | Capella Education Co. | 59,522 | 3,568 |
* | Coinstar, Inc. | 126,628 | 3,381 |
| Pool Corp. | 202,772 | 3,358 |
* | P.F. Chang’s |
|
|
| China Bistro, Inc. | 99,629 | 3,194 |
| The Buckle, Inc. | 98,680 | 3,135 |
* | CEC Entertainment Inc. | 96,635 | 2,849 |
* | The Dress Barn, Inc. | 189,472 | 2,709 |
* | American Public |
|
|
| Education, Inc. | 67,858 | 2,688 |
* | The Children’s Place Retail |
|
|
| Stores, Inc. | 101,551 | 2,684 |
* | Jos. A. Bank Clothiers, Inc. | 76,927 | 2,651 |
| Cracker Barrel Old Country |
|
|
| Store Inc. | 94,959 | 2,649 |
| Group 1 Automotive, Inc. | 101,138 | 2,632 |
* | Blue Nile Inc. | 60,963 | 2,621 |
* | Sonic Corp. | 255,257 | 2,560 |
* | Meritage Corp. | 132,207 | 2,493 |
* | Buffalo Wild Wings Inc. | 75,517 | 2,456 |
* | Pinnacle Entertainment, Inc. | 253,420 | 2,354 |
* | Texas Roadhouse, Inc. | 214,357 | 2,339 |
* | Jo-Ann Stores, Inc. | 111,078 | 2,296 |
* | Papa John’s |
|
|
| International, Inc. | 90,387 | 2,241 |
| UniFirst Corp. | 60,156 | 2,236 |
* | Hibbett Sports Inc. | 120,156 | 2,163 |
| Cato Corp. Class A | 123,704 | 2,157 |
| Fred’s, Inc. | 168,410 | 2,122 |
* | Helen of Troy Ltd. | 125,334 | 2,104 |
* | Cabela’s Inc. | 166,309 | 2,046 |
| DineEquity, Inc. | 65,435 | 2,041 |
| OfficeMax, Inc. | 320,656 | 2,014 |
| CKE Restaurants Inc. | 229,827 | 1,949 |
| NutriSystem, Inc. | 129,115 | 1,872 |
| The Pep Boys |
|
|
| (Manny, Moe & Jack) | 181,214 | 1,837 |
| Arbitron Inc. | 112,130 | 1,782 |
| Stage Stores, Inc. | 160,147 | 1,778 |
* | True Religion Apparel, Inc. | 79,412 | 1,771 |
* | HSN, Inc. | 167,064 | 1,766 |
* | Live Nation, Inc. | 354,013 | 1,720 |
| Finish Line, Inc. | 230,807 | 1,713 |
| Brunswick Corp. | 373,679 | 1,614 |
* | Interval Leisure Group, Inc. | 167,111 | 1,557 |
| Spartan Motors, Inc. | 136,826 | 1,550 |
| National Presto |
|
|
| Industries, Inc. | 20,306 | 1,545 |
* | Genesco, Inc. | 80,879 | 1,518 |
* | JAKKS Pacific, Inc. | 118,241 | 1,517 |
* | Shuffle Master, Inc. | 227,477 | 1,504 |
* | Ruby Tuesday, Inc. | 223,845 | 1,491 |
* | PetMed Express, Inc. | 95,710 | 1,439 |
| Superior Industries |
|
|
| International, Inc. | 98,098 | 1,383 |
* | Skechers U.S.A., Inc. | 140,927 | 1,377 |
* | Hot Topic, Inc. | 186,067 | 1,360 |
* | California Pizza Kitchen, Inc. | 101,850 | 1,354 |
* | Pre-Paid Legal Services, Inc. | 30,352 | 1,323 |
| Brown Shoe Co., Inc. | 181,618 | 1,315 |
* | Universal Technical |
|
|
| Institute Inc. | 85,799 | 1,281 |
| Ethan Allen Interiors, Inc. | 122,525 | 1,269 |
* | Red Robin Gourmet |
|
|
| Burgers, Inc. | 66,191 | 1,241 |
* | Peet’s Coffee & Tea Inc. | 48,512 | 1,222 |
| Sonic Automotive, Inc. | 119,286 | 1,212 |
* | Crocs, Inc. | 354,054 | 1,204 |
* | Universal Electronics, Inc. | 57,864 | 1,167 |
66
Tax-Managed Small-Cap Fund
|
|
| Market |
|
|
| Value• |
|
| Shares | ($000) |
| Liz Claiborne, Inc. | 403,194 | 1,161 |
* | Charlotte Russe Holding Inc. | 89,356 | 1,151 |
* | Ticketmaster |
|
|
| Entertainment Inc. | 170,103 | 1,092 |
* | Steak n Shake Co. | 121,681 | 1,063 |
| La-Z-Boy Inc. | 218,130 | 1,030 |
| Christopher & Banks Corp. | 151,663 | 1,018 |
| Big 5 Sporting Goods Corp. | 91,567 | 1,013 |
| Sturm, Ruger & Co., Inc. | 80,671 | 1,004 |
* | Quiksilver, Inc. | 541,014 | 1,001 |
* | Drew Industries, Inc. | 82,006 | 998 |
* | RC2 Corp. | 73,784 | 976 |
| K-Swiss, Inc. | 113,667 | 966 |
* | Stein Mart, Inc. | 108,048 | 957 |
| The Marcus Corp. | 89,560 | 942 |
* | Maidenform Brands, Inc. | 80,587 | 924 |
| Winnebago Industries, Inc. | 123,884 | 920 |
* | Volcom, Inc. | 67,530 | 844 |
| O’Charley’s Inc. | 90,363 | 836 |
* | Standard Pacific Corp. | 401,118 | 814 |
| Movado Group, Inc. | 77,132 | 813 |
| M/I Homes, Inc. | 78,194 | 766 |
| Haverty Furniture Cos., Inc. | 78,632 | 719 |
* | Tween Brands, Inc. | 104,996 | 701 |
* | Zumiez Inc. | 86,411 | 692 |
| Oxford Industries, Inc. | 57,756 | 673 |
| Lithia Motors, Inc. | 70,786 | 654 |
| Skyline Corp. | 28,594 | 622 |
* | Midas Inc. | 59,340 | 622 |
* | Multimedia Games Inc. | 98,148 | 487 |
* | Stamps.com Inc. | 56,040 | 475 |
* | Zale Corp. | 135,374 | 466 |
* | Audiovox Corp. | 79,351 | 465 |
* | Landry’s Restaurants, Inc. | 52,515 | 452 |
| Standard Motor |
|
|
| Products, Inc. | 53,951 | 446 |
* | Tuesday Morning Corp. | 130,801 | 441 |
* | Monarch Casino & |
|
|
| Resort, Inc. | 48,024 | 351 |
* | Perry Ellis International Corp. | 44,379 | 323 |
* | Ruth’s Hospitality Group Inc. | 83,367 | 306 |
* | Russ Berrie and Co., Inc. | 71,748 | 281 |
* | MarineMax, Inc. | 76,710 | 264 |
| Arctic Cat, Inc. | 50,485 | 204 |
| E.W. Scripps Co. Class A | 97,009 | 203 |
* | Nautilus Inc. | 104,540 | 118 |
|
|
| 195,419 |
Consumer Staples (4.2%) |
|
| |
* | Green Mountain Coffee |
|
|
| Roasters, Inc. | 113,452 | 6,707 |
* | Chattem, Inc. | 81,517 | 5,551 |
| Casey’s General Stores, Inc. | 213,197 | 5,477 |
* | United Natural Foods, Inc. | 180,124 | 4,728 |
* | TreeHouse Foods Inc. | 132,276 | 3,806 |
| Sanderson Farms, Inc. | 73,292 | 3,298 |
| Lance, Inc. | 133,944 | 3,098 |
* | Central Garden & |
|
|
| Pet Co. Class A | 293,496 | 2,891 |
* | Hain Celestial Group, Inc. | 170,934 | 2,668 |
| The Andersons, Inc. | 76,786 | 2,299 |
* | Darling International, Inc. | 345,513 | 2,280 |
| J & J Snack Foods Corp. | 58,734 | 2,109 |
| WD-40 Co. | 69,666 | 2,020 |
| Diamond Foods, Inc. | 69,254 | 1,932 |
| Nash-Finch Co. | 54,249 | 1,468 |
* | Alliance One |
|
|
| International, Inc. | 376,813 | 1,432 |
| Cal-Maine Foods, Inc. | 53,144 | 1,327 |
* | Boston Beer Co., Inc. |
|
|
| Class A | 42,812 | 1,267 |
| Spartan Stores, Inc. | 94,055 | 1,167 |
* | The Great Atlantic & |
|
|
| Pacific Tea Co., Inc. | 128,166 | 545 |
| Mannatech, Inc. | 64,275 | 212 |
|
|
| 56,282 |
Energy (4.9%) |
|
| |
* | SEACOR Holdings Inc. | 84,630 | 6,368 |
* | Atwood Oceanics, Inc. | 234,171 | 5,833 |
| St. Mary Land & |
|
|
| Exploration Co. | 261,692 | 5,462 |
| World Fuel Services Corp. | 123,534 | 5,093 |
* | Oil States |
|
|
| International, Inc. | 207,897 | 5,033 |
* | Dril-Quip, Inc. | 126,012 | 4,801 |
* | Bristow Group, Inc. | 122,240 | 3,622 |
| Penn Virginia Corp. | 190,597 | 3,120 |
| Holly Corp. | 172,325 | 3,098 |
| CARBO Ceramics Inc. | 81,195 | 2,777 |
* | NATCO Group Inc. | 83,557 | 2,751 |
| Lufkin Industries, Inc. | 62,649 | 2,634 |
* | TETRA Technologies, Inc. | 317,330 | 2,526 |
* | Swift Energy Co. | 130,968 | 2,181 |
* | Hornbeck Offshore |
|
|
| Services, Inc. | 97,540 | 2,086 |
* | Stone Energy Corp. | 168,123 | 1,248 |
* | Matrix Service Co. | 108,616 | 1,247 |
* | Pioneer Drilling Co. | 212,369 | 1,017 |
* | Petroleum |
|
|
| Development Corp. | 63,287 | 993 |
* | ION Geophysical Corp. | 379,905 | 976 |
| Gulf Island Fabrication, Inc. | 61,206 | 969 |
* | PetroQuest Energy, Inc. | 185,059 | 683 |
* | Basic Energy Services Inc. | 96,374 | 658 |
* | Superior Well Services, Inc. | 70,103 | 417 |
|
|
| 65,593 |
Exchange-Traded Fund (2.6%) |
|
| |
1 | Vanguard REIT ETF | 1,143,000 | 35,444 |
|
|
|
|
Financials (14.9%) |
|
| |
* | ProAssurance Corp. | 138,918 | 6,419 |
| Greenhill & Co., Inc. | 77,376 | 5,587 |
* | Stifel Financial Corp. | 114,719 | 5,517 |
67
Tax-Managed Small-Cap Fund
|
|
| Market | |
|
|
| Value• | |
|
| Shares | ($000) | |
| Prosperity Bancshares, Inc. | 172,066 | 5,133 | |
| UMB Financial Corp. | 123,008 | 4,676 | |
* | Signature Bank | 167,698 | 4,548 | |
| First Financial |
|
| |
| Bankshares, Inc. | 87,213 | 4,392 | |
| Senior Housing |
|
| |
| Properties Trust REIT | 252,608 | 4,123 | |
| Glacier Bancorp, Inc. | 257,987 | 3,810 | |
* | Investment Technology |
|
| |
| Group, Inc. | 181,924 | 3,709 | |
| Tower Group, Inc. | 147,487 | 3,655 | |
| Delphi Financial Group, Inc. | 184,514 | 3,585 | |
| PrivateBancorp, Inc. | 156,252 | 3,475 | |
| Zenith National |
|
| |
| Insurance Corp. | 156,591 | 3,404 | |
| R.L.I. Corp. | 75,167 | 3,368 | |
| Hancock Holding Co. | 100,014 | 3,249 | |
| NBT Bancorp, Inc. | 142,629 | 3,096 | |
| United Bankshares, Inc. | 158,312 | 3,093 | |
* | Piper Jaffray Cos., Inc. | 68,210 | 2,979 | |
| Cash America |
|
| |
| International Inc. | 124,459 | 2,911 | |
| National Retail Properties |
|
| |
| REIT | 167,712 | 2,910 | |
| Selective Insurance Group | 222,607 | 2,843 | |
| Old National Bancorp | 279,873 | 2,748 | |
| BioMed Realty Trust, Inc. |
|
| |
| REIT | 262,445 | 2,685 | |
| optionsXpress Holdings Inc. | 172,517 | 2,679 | |
| Employers Holdings, Inc. | 196,160 | 2,658 | |
| Whitney Holdings Corp. | 280,308 | 2,568 | |
| Tanger Factory Outlet |
|
| |
| Centers, Inc. REIT | 77,644 | 2,518 | |
* | Portfolio Recovery |
|
| |
| Associates, Inc. | 64,696 | 2,506 | |
* | Navigators Group, Inc. | 56,193 | 2,497 | |
| Home Properties, Inc. REIT | 68,952 | 2,351 | |
| Franklin Street |
|
| |
| Properties Corp. REIT | 176,493 | 2,339 | |
| Brookline Bancorp, Inc. | 247,798 | 2,309 | |
| Financial Federal Corp. | 108,806 | 2,236 | |
| Sterling Bancshares, Inc. | 344,157 | 2,179 | |
| Mid-America Apartment |
|
| |
| Communities, Inc. REIT | 59,337 | 2,178 | |
| Infinity Property & |
|
| |
| Casualty Corp. | 57,693 | 2,104 | |
| Safety Insurance Group, Inc. | 66,404 | 2,029 | |
| Community Bank |
|
| |
| System, Inc. | 137,532 | 2,002 | |
| First Commonwealth |
|
| |
| Financial Corp. | 314,644 | 1,995 | |
| Umpqua Holdings Corp. | 253,150 | 1,964 | |
* | First Cash Financial |
|
| |
| Services, Inc. | 108,420 | 1,900 | |
| TrustCo Bank NY | 320,243 | 1,893 | |
* | eHealth, Inc. | 104,004 | 1,837 | |
| Kilroy Realty Corp. REIT | 89,019 | 1,828 | |
* | Forestar Real Estate |
|
| |
| Group, Inc. | 152,188 | 1,808 | |
| Susquehanna |
|
| |
| Bancshares, Inc. | 363,171 | 1,776 | |
| EastGroup Properties, Inc. |
|
| |
| REIT | 53,382 | 1,763 | |
| East West Bancorp, Inc. | 270,812 | 1,758 | |
| Independent |
|
| |
| Bank Corp. (MA) | 88,597 | 1,745 | |
| Bank Mutual Corp. | 197,023 | 1,718 | |
* | Pinnacle Financial |
|
| |
| Partners, Inc. | 125,387 | 1,670 | |
| Wintrust Financial Corp. | 101,570 | 1,633 | |
| SWS Group, Inc. | 116,202 | 1,623 | |
| National Penn |
|
| |
| Bancshares Inc. | 350,912 | 1,618 | |
| United Fire & Casualty Co. | 94,086 | 1,614 | |
| LaSalle Hotel Properties |
|
| |
| REIT | 129,386 | 1,597 | |
| PS Business Parks, Inc. |
|
| |
| REIT | 31,505 | 1,526 | |
| Entertainment |
|
| |
| Properties Trust REIT | 73,949 | 1,523 | |
| Extra Space Storage Inc. |
|
| |
| REIT | 181,114 | 1,512 | |
| DiamondRock |
|
| |
| Hospitality Co. REIT | 227,314 | 1,423 | |
| Simmons First |
|
| |
| National Corp. | 52,740 | 1,409 | |
* | World Acceptance Corp. | 68,103 | 1,356 | |
| Tompkins Trustco, Inc. | 28,263 | 1,355 | |
| National Financial |
|
| |
| Partners Corp. | 172,953 | 1,266 | |
| Post Properties, Inc. REIT | 94,066 | 1,264 | |
| First BanCorp Puerto Rico | 319,893 | 1,264 | |
* | Amerisafe Inc. | 80,332 | 1,250 | |
| Boston Private Financial |
|
| |
| Holdings, Inc. | 270,425 | 1,212 | |
| S & T Bancorp, Inc. | 99,068 | 1,205 | |
| American Physicians |
|
| |
| Capital, Inc. | 30,657 | 1,201 | |
| First Financial Bancorp | 156,679 | 1,178 | |
| Sovran Self Storage, Inc. |
|
| |
| REIT | 47,566 | 1,170 | |
| Bank of the Ozarks, Inc. | 53,303 | 1,153 | |
* | TradeStation Group, Inc. | 132,901 | 1,124 | |
| Stewart Information |
|
| |
| Services Corp. | 77,069 | 1,098 | |
| Acadia Realty Trust REIT | 83,709 | 1,092 | |
| Home Bancshares Inc. | 56,454 | 1,075 | |
| Inland Real Estate Corp. |
|
| |
| REIT | 151,629 | 1,061 | |
| United Community |
|
| |
| Banks, Inc. | 175,926 | 1,054 | |
68
Tax-Managed Small-Cap Fund
|
|
| Market |
|
|
| Value• |
|
| Shares | ($000) |
| Dime Community |
|
|
| Bancshares | 112,006 | 1,020 |
| Medical Properties Trust Inc. |
|
|
| REIT | 166,283 | 1,009 |
| LTC Properties, Inc. REIT | 48,908 | 1,000 |
| First Midwest Bancorp, Inc. | 131,273 | 960 |
* | LaBranche & Co. Inc. | 204,498 | 879 |
| Columbia Banking |
|
|
| System, Inc. | 76,975 | 787 |
| Colonial Properties Trust |
|
|
| REIT | 103,118 | 763 |
| Urstadt Biddle Properties |
|
|
| Class A REIT | 51,941 | 731 |
| Presidential Life Corp. | 91,107 | 690 |
| Sterling Financial Corp. | 220,853 | 643 |
| Sterling Bancorp | 76,301 | 637 |
| UCBH Holdings, Inc. | 503,967 | 635 |
| Lexington Realty Trust REIT | 175,543 | 597 |
| Parkway Properties Inc. REIT | 45,836 | 596 |
| Nara Bancorp, Inc. | 93,239 | 483 |
| Wilshire Bancorp Inc. | 81,977 | 471 |
| Central Pacific Financial Co. | 120,877 | 453 |
* | Rewards Network Inc. | 115,404 | 436 |
| Cedar Shopping |
|
|
| Centers, Inc. REIT | 95,863 | 433 |
| Pennsylvania REIT | 83,955 | 420 |
| The South Financial |
|
|
| Group, Inc. | 328,573 | 391 |
| Kite Realty Group Trust REIT | 129,658 | 379 |
| Cascade Bancorp | 23,858 | 34 |
| Hanmi Financial Corp. | 16,430 | 29 |
| Frontier Financial Corp. | 23,662 | 29 |
| Independent Bank Corp. (MI) | 6,798 | 9 |
|
|
| 202,093 |
Health Care (13.7%) |
|
| |
* | MEDNAX, Inc. | 191,961 | 8,087 |
* | Haemonetics Corp. | 107,437 | 6,124 |
* | AMERIGROUP Corp. | 221,955 | 5,959 |
* | American Medical Systems |
|
|
| Holdings, Inc. | 309,514 | 4,890 |
* | Magellan Health |
|
|
| Services, Inc. | 148,834 | 4,885 |
| West Pharmaceutical |
|
|
| Services, Inc. | 137,398 | 4,788 |
* | Regeneron |
|
|
| Pharmaceuticals, Inc. | 265,364 | 4,755 |
| The Cooper Companies, Inc. | 189,385 | 4,683 |
* | PSS World Medical, Inc. | 250,043 | 4,628 |
* | Dionex Corp. | 74,174 | 4,527 |
* | Cubist Pharmaceuticals, Inc. | 241,690 | 4,430 |
* | HMS Holdings Corp. | 108,383 | 4,413 |
| Quality Systems, Inc. | 76,488 | 4,357 |
* | Eclipsys Corp. | 235,508 | 4,187 |
* | Catalyst Health |
|
|
| Solutions, Inc. | 161,617 | 4,031 |
| Meridian Bioscience Inc. | 169,847 | 3,835 |
* | Amedisys Inc. | 114,617 | 3,785 |
| Chemed Corp. | 94,704 | 3,739 |
* | Centene Corp. | 180,528 | 3,607 |
* | PAREXEL International Corp. | 241,287 | 3,470 |
* | Savient |
|
|
| Pharmaceuticals Inc. | 221,834 | 3,075 |
* | Align Technology, Inc. | 279,783 | 2,966 |
| Martek Biosciences Corp. | 140,032 | 2,962 |
* | AmSurg Corp. | 129,118 | 2,768 |
* | Phase Forward Inc. | 180,817 | 2,732 |
* | PharMerica Corp. | 128,201 | 2,517 |
| Landauer, Inc. | 39,399 | 2,417 |
| Invacare Corp. | 135,520 | 2,392 |
* | Integra |
|
|
| LifeSciences Holdings | 85,132 | 2,257 |
* | ICU Medical, Inc. | 54,633 | 2,248 |
* | Healthspring, Inc. | 205,643 | 2,233 |
* | Par Pharmaceutical Cos. Inc. | 146,792 | 2,224 |
* | Greatbatch, Inc. | 97,456 | 2,203 |
* | Gentiva Health |
|
|
| Services, Inc. | 121,603 | 2,002 |
* | Salix Pharmaceuticals, Ltd. | 202,680 | 2,000 |
| Analogic Corp. | 53,965 | 1,994 |
* | ViroPharma Inc. | 325,450 | 1,930 |
* | Merit Medical Systems, Inc. | 118,146 | 1,926 |
* | Healthways, Inc. | 142,196 | 1,913 |
* | inVentiv Health, Inc. | 140,692 | 1,904 |
* | CONMED Corp. | 122,264 | 1,898 |
* | Abaxis, Inc. | 92,245 | 1,895 |
* | RehabCare Group, Inc. | 77,884 | 1,864 |
* | Neogen Corp. | 62,227 | 1,803 |
* | Hanger Orthopedic |
|
|
| Group, Inc. | 130,986 | 1,780 |
* | MWI Veterinary Supply Inc. | 50,992 | 1,778 |
* | Zoll Medical Corp. | 89,362 | 1,728 |
* | Cyberonics, Inc. | 97,884 | 1,628 |
* | Bio-Reference |
|
|
| Laboratories, Inc. | 49,097 | 1,552 |
* | Res-Care, Inc. | 107,790 | 1,541 |
| Computer Programs and |
|
|
| Systems, Inc. | 39,904 | 1,529 |
* | Noven Pharmaceuticals, Inc. | 105,379 | 1,507 |
* | Omnicell, Inc. | 133,547 | 1,436 |
* | Odyssey Healthcare, Inc. | 139,414 | 1,433 |
* | Symmetry Medical Inc. | 151,848 | 1,415 |
* | SurModics, Inc. | 61,776 | 1,398 |
* | LHC Group Inc. | 62,846 | 1,396 |
* | Natus Medical Inc. | 117,998 | 1,362 |
* | Molina Healthcare Inc. | 56,906 | 1,361 |
* | Genoptix, Inc. | 40,550 | 1,297 |
* | Kensey Nash Corp. | 48,083 | 1,260 |
* | Air Methods Corp. | 45,454 | 1,244 |
* | Palomar Medical |
|
|
| Technologies, Inc. | 77,045 | 1,129 |
69
Tax-Managed Small-Cap Fund
|
|
| Market |
|
|
| Value• |
|
| Shares | ($000) |
* | eResearch Technology, Inc. | 176,229 | 1,094 |
* | MedCath Corp. | 83,527 | 982 |
* | IPC The Hospitalist Co. | 36,119 | 964 |
* | Cross Country |
|
|
| Healthcare, Inc. | 129,972 | 893 |
* | AMN Healthcare |
|
|
| Services, Inc. | 137,808 | 879 |
* | ArQule, Inc. | 121,840 | 748 |
* | CorVel Corp. | 32,571 | 742 |
* | Almost Family Inc. | 26,856 | 701 |
* | Kendle International Inc. | 56,358 | 690 |
* | CryoLife Inc. | 119,394 | 661 |
* | Enzo Biochem, Inc. | 137,592 | 610 |
* | Cambrex Corp. | 125,506 | 517 |
* | Osteotech, Inc. | 77,845 | 342 |
* | LCA-Vision Inc. | 77,900 | 329 |
* | Theragenics Corp. | 145,390 | 188 |
|
|
| 185,417 |
Industrials (17.3%) |
|
| |
* | Tetra Tech, Inc. | 252,605 | 7,237 |
* | Kirby Corp. | 225,536 | 7,170 |
| CLARCOR Inc. | 213,458 | 6,231 |
| Regal-Beloit Corp. | 150,113 | 5,962 |
| Watsco, Inc. | 119,647 | 5,854 |
| Curtiss-Wright Corp. | 189,651 | 5,638 |
* | EMCOR Group, Inc. | 275,985 | 5,553 |
* | Gardner Denver Inc. | 217,723 | 5,480 |
| Brady Corp. Class A | 215,063 | 5,402 |
* | Teledyne Technologies, Inc. | 151,068 | 4,947 |
* | ESCO Technologies Inc. | 109,905 | 4,924 |
| Acuity Brands, Inc. | 171,694 | 4,816 |
| Baldor Electric Co. | 195,153 | 4,643 |
* | Moog Inc. | 178,466 | 4,606 |
| Kaydon Corp. | 139,659 | 4,547 |
| The Toro Co. | 150,123 | 4,489 |
* | Geo Group Inc. | 214,453 | 3,985 |
| Knight Transportation, Inc. | 237,142 | 3,925 |
* | Old Dominion |
|
|
| Freight Line, Inc. | 115,699 | 3,884 |
* | Orbital Sciences Corp. | 237,138 | 3,597 |
* | United Stationers, Inc. | 99,410 | 3,467 |
| Simpson Manufacturing Co. | 158,408 | 3,425 |
| ABM Industries Inc. | 187,248 | 3,384 |
* | Esterline Technologies Corp. | 124,623 | 3,374 |
* | Hub Group, Inc. | 158,623 | 3,274 |
| Belden Inc. | 195,265 | 3,261 |
| Heartland Express, Inc. | 221,306 | 3,258 |
| Healthcare Services |
|
|
| Group, Inc. | 181,462 | 3,245 |
| Mueller Industries Inc. | 155,749 | 3,240 |
| A.O. Smith Corp. | 94,607 | 3,081 |
| Applied Industrial |
|
|
| Technology, Inc. | 152,385 | 3,002 |
| Actuant Corp. | 240,338 | 2,932 |
| Triumph Group, Inc. | 70,236 | 2,809 |
| Briggs & Stratton Corp. | 209,942 | 2,801 |
| Arkansas Best Corp. | 106,074 | 2,795 |
* | Insituform Technologies Inc. |
|
|
| Class A | 163,219 | 2,770 |
| Robbins & Myers, Inc. | 138,280 | 2,662 |
| Watts Water |
|
|
| Technologies, Inc. | 122,913 | 2,648 |
| American Science & |
|
|
| Engineering, Inc. | 38,186 | 2,639 |
* | AAR Corp. | 163,149 | 2,619 |
| Forward Air Corp. | 122,050 | 2,602 |
| Badger Meter, Inc. | 62,267 | 2,553 |
* | Sykes Enterprises, Inc. | 140,928 | 2,549 |
* | Astec Industries, Inc. | 83,569 | 2,481 |
| Skywest, Inc. | 234,158 | 2,388 |
| Universal Forest |
|
|
| Products, Inc. | 70,925 | 2,347 |
| Cubic Corp. | 65,391 | 2,340 |
* | II-VI, Inc. | 102,152 | 2,265 |
* | Mobile Mini, Inc. | 149,248 | 2,189 |
| Administaff, Inc. | 93,526 | 2,176 |
* | Axsys Technologies, Inc. | 40,019 | 2,147 |
| Barnes Group, Inc. | 179,105 | 2,130 |
* | Aerovironment Inc. | 66,472 | 2,051 |
* | Ceradyne, Inc. | 108,788 | 1,921 |
* | Stanley Inc. | 57,658 | 1,896 |
| Kaman Corp. Class A | 108,382 | 1,810 |
| Quanex Building |
|
|
| Products Corp. | 158,310 | 1,776 |
* | AZZ Inc. | 51,229 | 1,763 |
* | Griffon Corp. | 206,629 | 1,719 |
| Lindsay Manufacturing Co. | 51,736 | 1,712 |
| CIRCOR International, Inc. | 71,876 | 1,697 |
| G & K Services, Inc. Class A | 77,918 | 1,648 |
* | TrueBlue, Inc. | 185,040 | 1,554 |
* | EnPro Industries, Inc. | 84,512 | 1,522 |
| Viad Corp. | 86,509 | 1,490 |
| Interface, Inc. | 237,094 | 1,470 |
| John Bean |
|
|
| Technologies Corp. | 116,676 | 1,461 |
| Apogee Enterprises, Inc. | 118,191 | 1,454 |
| Applied Signal |
|
|
| Technology, Inc. | 55,336 | 1,412 |
* | School Specialty, Inc. | 67,345 | 1,361 |
| Albany International Corp. | 114,190 | 1,299 |
| Heidrick & Struggles |
|
|
| International, Inc. | 71,053 | 1,297 |
* | ATC Technology Corp. | 83,782 | 1,215 |
| Tredegar Corp. | 82,591 | 1,100 |
* | Spherion Corp. | 221,448 | 912 |
* | Consolidated Graphics, Inc. | 47,227 | 823 |
| Gibraltar Industries Inc. | 114,157 | 784 |
| Bowne & Co., Inc. | 118,425 | 771 |
| Standex International Corp. | 52,545 | 610 |
| CDI Corp. | 54,379 | 606 |
| Vicor Corp. | 83,746 | 605 |
* | On Assignment, Inc. | 152,287 | 595 |
70
Tax-Managed Small-Cap Fund
|
|
| Market |
|
|
| Value• |
|
| Shares | ($000) |
| Cascade Corp. | 35,723 | 562 |
* | Volt Information |
|
|
| Sciences Inc. | 50,969 | 320 |
| Lawson Products, Inc. | 17,914 | 255 |
* | Lydall, Inc. | 71,117 | 242 |
* | C & D Technologies, Inc. | 115,589 | 231 |
* | Magnatek, Inc. | 133,016 | 185 |
| The Standard Register Co. | 53,624 | 175 |
* | GenCorp, Inc. | 33,037 | 63 |
* | NCI Building Systems, Inc. | 3,205 | 8 |
| Wabash National Corp. | 4,555 | 3 |
|
|
| 234,121 |
Information Technology (18.2%) |
|
| |
* | Varian Semiconductor |
|
|
| Equipment Associates, Inc. | 306,787 | 7,360 |
* | Skyworks Solutions, Inc. | 701,884 | 6,864 |
* | Arris Group Inc. | 519,373 | 6,316 |
* | Informatica Corp. | 365,479 | 6,283 |
* | Synaptics Inc. | 143,796 | 5,558 |
* | Cypress |
|
|
| Semiconductor Corp. | 599,766 | 5,518 |
* | Concur Technologies, Inc. | 176,976 | 5,500 |
* | CACI International, Inc. | 125,619 | 5,365 |
* | Anixter International Inc. | 125,758 | 4,727 |
* | Tekelec | 279,142 | 4,698 |
* | Microsemi Corp. | 340,401 | 4,698 |
* | CyberSource Corp. | 289,739 | 4,433 |
* | j2 Global |
|
|
| Communications, Inc. | 187,146 | 4,222 |
* | Wright Express Corp. | 162,147 | 4,130 |
* | Benchmark Electronics, Inc. | 273,730 | 3,942 |
* | Comtech |
|
|
| Telecommunications Corp. | 118,063 | 3,764 |
* | Cymer, Inc. | 124,491 | 3,701 |
* | FEI Co. | 156,694 | 3,588 |
* | Progress Software Corp. | 167,331 | 3,542 |
* | Plexus Corp. | 165,428 | 3,385 |
* | Websense, Inc. | 186,102 | 3,320 |
* | TriQuint Semiconductor, Inc. | 618,282 | 3,283 |
| Take-Two Interactive |
|
|
| Software, Inc. | 336,152 | 3,183 |
| MAXIMUS, Inc. | 73,733 | 3,042 |
* | ViaSat, Inc. | 115,094 | 2,951 |
* | Commvault Systems, Inc. | 174,500 | 2,893 |
| Blackbaud, Inc. | 184,650 | 2,871 |
* | DealerTrack Holdings Inc. | 168,643 | 2,867 |
* | Cabot Microelectronics Corp. | 98,163 | 2,777 |
* | Hittite Microwave Corp. | 79,040 | 2,747 |
* | Blue Coat Systems, Inc. | 165,780 | 2,742 |
* | ScanSource, Inc. | 111,814 | 2,742 |
* | MKS Instruments, Inc. | 206,950 | 2,730 |
* | Intermec, Inc. | 205,745 | 2,654 |
* | SPSS, Inc. | 77,042 | 2,571 |
* | Checkpoint Systems, Inc. | 163,316 | 2,562 |
| Black Box Corp. | 73,945 | 2,475 |
* | Taleo Corp. Class A | 132,109 | 2,414 |
* | Harmonic, Inc. | 402,082 | 2,368 |
| Cognex Corp. | 166,645 | 2,355 |
* | EPIQ Systems, Inc. | 151,310 | 2,323 |
| United Online, Inc. | 352,244 | 2,293 |
* | Diodes Inc. | 137,994 | 2,158 |
* | NETGEAR, Inc. | 145,150 | 2,092 |
* | ATMI, Inc. | 131,873 | 2,048 |
* | THQ Inc. | 283,942 | 2,033 |
* | SYNNEX Corp. | 80,120 | 2,002 |
* | DTS Inc. | 73,052 | 1,978 |
* | TeleTech Holdings, Inc. | 129,617 | 1,964 |
* | CSG Systems |
|
|
| International, Inc. | 147,677 | 1,955 |
* | Standard Microsystem Corp. | 92,270 | 1,887 |
* | Tyler Technologies, Inc. | 120,736 | 1,886 |
* | Insight Enterprises, Inc. | 192,721 | 1,862 |
| Park Electrochemical Corp. | 86,181 | 1,855 |
* | Littelfuse, Inc. | 91,447 | 1,825 |
* | Manhattan Associates, Inc. | 96,938 | 1,766 |
* | JDA Software Group, Inc. | 116,767 | 1,747 |
* | Avid Technology, Inc. | 129,584 | 1,738 |
* | Veeco Instruments, Inc. | 135,244 | 1,568 |
* | Forrester Research, Inc. | 63,224 | 1,552 |
* | Bankrate, Inc. | 58,576 | 1,478 |
| MTS Systems Corp. | 70,509 | 1,456 |
* | TTM Technologies, Inc. | 182,273 | 1,451 |
| Micrel, Inc. | 194,185 | 1,421 |
* | Supertex, Inc. | 54,292 | 1,363 |
* | Brightpoint, Inc. | 217,420 | 1,363 |
* | Adaptec, Inc. | 513,407 | 1,361 |
* | Epicor Software Corp. | 255,573 | 1,355 |
* | EMS Technologies, Inc. | 64,397 | 1,346 |
* | Rogers Corp. | 66,183 | 1,339 |
* | Exar Corp. | 182,214 | 1,310 |
* | Electro Scientific |
|
|
| Industries, Inc. | 115,061 | 1,286 |
* | Advanced Energy |
|
|
| Industries, Inc. | 138,383 | 1,244 |
* | Ultratech, Inc. | 99,946 | 1,230 |
* | Brooks Automation, Inc. | 271,924 | 1,218 |
* | Ebix, Inc. | 38,005 | 1,190 |
* | Actel Corp. | 110,568 | 1,186 |
* | Smith Micro Software, Inc. | 120,196 | 1,180 |
* | Novatel Wireless, Inc. | 128,824 | 1,162 |
| Methode Electronics, Inc. |
|
|
| Class A | 160,272 | 1,125 |
| Technitrol, Inc. | 173,345 | 1,122 |
| Daktronics, Inc. | 144,039 | 1,109 |
* | FARO Technologies, Inc. | 70,919 | 1,101 |
* | Symmetricom Inc. | 186,175 | 1,074 |
* | Kopin Corp. | 288,565 | 1,059 |
* | ComScore Inc. | 79,172 | 1,055 |
* | Digi International, Inc. | 104,331 | 1,017 |
| Heartland Payment |
|
|
| Systems, Inc. | 103,647 | 992 |
* | The Knot, Inc. | 125,763 | 991 |
71
Tax-Managed Small-Cap Fund
|
|
| Market |
|
|
| Value• |
|
| Shares | ($000) |
* | InfoSpace, Inc. | 148,171 | 982 |
* | Radiant Systems, Inc. | 117,927 | 979 |
* | Perficient, Inc. | 136,153 | 952 |
| CTS Corp. | 144,418 | 946 |
* | Stratasys, Inc. | 85,594 | 941 |
* | Pericom |
|
|
| Semiconductor Corp. | 108,013 | 909 |
* | Mercury Computer |
|
|
| Systems, Inc. | 97,004 | 897 |
* | RadiSys Corp. | 98,760 | 890 |
| Cohu, Inc. | 99,047 | 889 |
* | Kulicke & |
|
|
| Soffa Industries, Inc. | 258,260 | 886 |
* | Newport Corp. | 152,588 | 884 |
* | Intevac, Inc. | 93,814 | 817 |
* | Ciber, Inc. | 257,429 | 798 |
| Bel Fuse, Inc. Class B | 48,743 | 782 |
* | Rudolph Technologies, Inc. | 129,960 | 717 |
* | DSP Group Inc. | 98,905 | 669 |
* | Integral Systems, Inc. | 72,883 | 606 |
* | Network Equipment |
|
|
| Technologies, Inc. | 125,075 | 533 |
| Agilysys, Inc. | 95,741 | 448 |
* | PC-Tel, Inc. | 78,617 | 421 |
* | Startek, Inc. | 51,025 | 409 |
* | Phoenix Technologies Ltd. | 125,393 | 340 |
* | Sonic Solutions, Inc. | 111,157 | 328 |
* | LoJack Corp. | 74,512 | 312 |
* | Tollgrade |
|
|
| Communications, Inc. | 54,855 | 287 |
* | Gerber Scientific, Inc. | 101,565 | 254 |
| Keithley Instruments Inc. | 57,293 | 229 |
* | Hutchinson Technology, Inc. | 96,232 | 188 |
|
|
| 245,550 |
Materials (4.2%) |
|
| |
| Rock-Tenn Co. | 160,811 | 6,137 |
| Eagle Materials, Inc. | 182,945 | 4,618 |
| H.B. Fuller Co. | 203,831 | 3,826 |
* | OM Group, Inc. | 128,151 | 3,719 |
| Texas Industries, Inc. | 116,170 | 3,643 |
| NewMarket Corp. | 51,635 | 3,477 |
* | Calgon Carbon Corp. | 229,643 | 3,190 |
| Arch Chemicals, Inc. | 105,185 | 2,586 |
| AMCOL International Corp. | 95,065 | 2,052 |
| Balchem Corp. | 77,393 | 1,898 |
| Schweitzer-Mauduit |
|
|
| International, Inc. | 64,306 | 1,750 |
* | RTI International |
|
|
| Metals, Inc. | 98,024 | 1,732 |
| A. Schulman Inc. | 110,315 | 1,667 |
| Deltic Timber Corp. | 44,420 | 1,576 |
* | Brush Engineered |
|
|
| Materials Inc. | 85,396 | 1,430 |
| Wausau Paper Corp. | 207,190 | 1,392 |
| Stepan Co. | 30,506 | 1,347 |
* | Clearwater Paper Corp. | 48,288 | 1,221 |
| Zep, Inc. | 91,148 | 1,098 |
* | PolyOne Corp. | 391,536 | 1,061 |
* | Century Aluminum Co. | 169,395 | 1,055 |
| Myers Industries, Inc. | 119,990 | 998 |
| American Vanguard Corp. | 85,766 | 969 |
| Olympic Steel, Inc. | 38,460 | 941 |
| A.M. Castle & Co. | 70,565 | 852 |
* | Buckeye Technology, Inc. | 165,637 | 744 |
| Quaker Chemical Corp. | 46,710 | 621 |
* | Headwaters Inc. | 178,491 | 600 |
| Neenah Paper Inc. | 61,805 | 544 |
| Penford Corp. | 47,160 | 273 |
|
|
| 57,017 |
Telecommunication Services (0.5%) |
| ||
* | Neutral Tandem, Inc. | 76,143 | 2,248 |
| Iowa Telecommunications |
|
|
| Services Inc. | 137,858 | 1,724 |
* | Cbeyond Inc. | 108,360 | 1,555 |
* | General |
|
|
| Communication, Inc. | 185,674 | 1,287 |
| FairPoint |
|
|
| Communications, Inc. | 5,396 | 3 |
|
|
| 6,817 |
Utilities (4.7%) |
|
| |
| Atmos Energy Corp. | 385,840 | 9,661 |
| Piedmont Natural Gas, Inc. | 308,328 | 7,434 |
| New Jersey |
|
|
| Resources Corp. | 176,859 | 6,551 |
| Northwest Natural Gas Co. | 111,154 | 4,926 |
| South Jersey Industries, Inc. | 124,977 | 4,361 |
| Southwest Gas Corp. | 187,388 | 4,162 |
| Avista Corp. | 229,114 | 4,081 |
| UniSource Energy Corp. | 149,365 | 3,964 |
| ALLETE, Inc. | 116,743 | 3,356 |
| CH Energy Group, Inc. | 66,148 | 3,089 |
| The Laclede Group, Inc. | 92,868 | 3,077 |
| UIL Holdings Corp. | 125,271 | 2,812 |
| American States Water Co. | 77,244 | 2,676 |
* | El Paso Electric Co. | 188,863 | 2,637 |
| Central Vermont Public |
|
|
| Service Corp. | 49,245 | 891 |
|
|
| 63,678 |
Total Common Stocks |
|
| |
(Cost $1,468,462) |
| 1,347,431 | |
72
Tax-Managed Small-Cap Fund
|
| Market |
|
| Value• |
| Shares | ($000) |
Temporary Cash Investment (0.1%) |
| |
Money Market Fund (0.1%) |
|
|
2 Vanguard Market |
|
|
Liquidity Fund, 0.395% |
|
|
(Cost $1,359) | 1,358,950 | 1,359 |
Total Investments (99.7%) |
|
|
(Cost $1,469,821) |
| 1,348,790 |
Other Assets and Liabilities (0.3%) |
| |
Other Assets |
| 19,758 |
Liabilities |
| (16,065) |
|
| 3,693 |
Net Assets (100%) |
| 1,352,483 |
At June 30, 2009, net assets consisted of: | |
| Amount |
| ($000) |
Paid-in Capital | 1,645,431 |
Undistributed Net Investment Income | 1,604 |
Accumulated Net Realized Losses | (173,521) |
Unrealized Appreciation (Depreciation) | (121,031) |
Net Assets | 1,352,483 |
|
|
|
|
Investor Shares—Net Assets |
|
Applicable to 70,733,964 outstanding |
|
$.001 par value shares of beneficial |
|
interest (unlimited authorization) | 1,242,311 |
Net Asset Value Per Share— |
|
Investor Shares | $17.56 |
|
|
|
|
Institutional Shares—Net Assets |
|
Applicable to 6,259,346 outstanding |
|
$.001 par value shares of beneficial |
|
interest (unlimited authorization) | 110,172 |
Net Asset Value Per Share— |
|
Institutional Shares | $17.60 |
• See Note A in Notes to Financial Statements.
* Non-income-producing security.
1 Considered an affiliated company of the fund as the issuer is another member of The Vanguard Group.
2 Affiliated money market fund available only to Vanguard funds and certain trusts and accounts managed by Vanguard. Rate shown is the 7-day yield.
REIT—Real Estate Investment Trust.
See accompanying Notes, which are an integral part of the Financial Statements.
73
Tax-Managed Small-Cap Fund
Statement of Operations
| Six Months Ended |
| June 30, 2009 |
| ($000) |
Investment Income |
|
Income |
|
Dividends1 | 5,466 |
Interest1 | 5 |
Total Income | 5,471 |
Expenses |
|
The Vanguard Group—Note B |
|
Investment Advisory Services | 68 |
Management and Administrative—Investor Shares | 778 |
Management and Administrative—Institutional Shares | 21 |
Marketing and Distribution—Investor Shares | 190 |
Marketing and Distribution—Institutional Shares | 15 |
Custodian Fees | 20 |
Shareholders’ Reports and Proxies—Investor Shares | 21 |
Shareholders’ Reports and Proxies—Institutional Shares | — |
Trustees’ Fees and Expenses | 1 |
Total Expenses | 1,114 |
Net Investment Income | 4,357 |
Realized Net Gain (Loss) on Investment Securities Sold1 | (33,788) |
Change in Unrealized Appreciation (Depreciation) of Investment Securities | 33,163 |
Net Increase (Decrease) in Net Assets Resulting from Operations | 3,732 |
1 Dividend income, interest income, and realized net gain (loss) from affiliated companies of the fund were $0, $5,000, and ($1,396,000), respectively.
See accompanying Notes, which are an integral part of the Financial Statements.
74
Tax-Managed Small-Cap Fund
Statement of Changes in Net Assets
| Six Months Ended |
| Year Ended |
| June 30, |
| December 31, |
| 2009 |
| 2008 |
| ($000) |
| ($000) |
Increase (Decrease) in Net Assets |
|
|
|
Operations |
|
|
|
Net Investment Income | 4,357 |
| 20,498 |
Realized Net Gain (Loss) | (33,788) |
| 96,895 |
Change in Unrealized Appreciation (Depreciation) | 33,163 |
| (747,423) |
Net Increase (Decrease) in Net Assets Resulting from Operations | 3,732 |
| (630,030) |
Distributions |
|
|
|
Net Investment Income |
|
|
|
Investor Shares | (283) |
| (19,336) |
Institutional Shares | (30) |
| (1,688) |
Realized Capital Gain |
|
|
|
Investor Shares | — |
| — |
Institutional Shares | — |
| — |
Total Distributions | (313) |
| (21,024) |
Capital Share Transactions |
|
|
|
Investor Shares | (18,175) |
| 53,676 |
Institutional Shares | 6,827 |
| (6,279) |
Net Increase (Decrease) from Capital Share Transactions | (11,348) |
| 47,397 |
Total Increase (Decrease) | (7,929) |
| (603,657) |
Net Assets |
|
|
|
Beginning of Period | 1,360,412 |
| 1,964,069 |
End of Period1 | 1,352,483 |
| 1,360,412 |
1 Net Assets—End of Period includes undistributed (overdistributed) net investment income of $1,604,000 and ($2,440,000).
See accompanying Notes, which are an integral part of the Financial Statements.
75
Tax-Managed Small-Cap Fund
Financial Highlights
Investor Shares |
|
|
|
|
|
|
|
|
|
|
|
|
|
| Six Months |
|
|
|
|
|
| Ended |
|
|
| ||
For a Share Outstanding | June 30, | Year Ended December 31, | ||||
Throughout Each Period | 2009 | 2008 | 2007 | 2006 | 2005 | 2004 |
Net Asset Value, Beginning of Period | $17.44 | $25.62 | $25.72 | $22.70 | $21.25 | $17.44 |
Investment Operations |
|
|
|
|
|
|
Net Investment Income | .055 | .266 | .229 | .191 | .193 | .172 |
Net Realized and Unrealized Gain (Loss) |
|
|
|
|
|
|
on Investments1 | .069 | (8.174) | (.097) | 3.023 | 1.454 | 3.811 |
Total from Investment Operations | .124 | (7.908) | .132 | 3.214 | 1.647 | 3.983 |
Distributions |
|
|
|
|
|
|
Dividends from Net Investment Income | (.004) | (.272) | (.232) | (.194) | (.197) | (.173) |
Distributions from Realized Capital Gains | — | — | — | — | — | — |
Total Distributions | (.004) | (.272) | (.232) | (.194) | (.197) | (.173) |
Net Asset Value, End of Period | $17.56 | $17.44 | $25.62 | $25.72 | $22.70 | $21.25 |
|
|
|
|
|
|
|
|
|
|
|
|
|
|
Total Return2 | 0.72% | –30.82% | 0.51% | 14.15% | 7.74% | 22.84% |
|
|
|
|
|
|
|
|
|
|
|
|
|
|
Ratios/Supplemental Data |
|
|
|
|
|
|
Net Assets, End of Period (Millions) | $1,242 | $1,258 | $1,793 | $1,756 | $1,458 | $1,282 |
Ratio of Total Expenses to |
|
|
|
|
|
|
Average Net Assets | 0.19%3 | 0.14% | 0.13% | 0.14% | 0.14% | 0.14% |
Ratio of Net Investment Income to |
|
|
|
|
|
|
Average Net Assets | 0.99%3 | 1.16% | 0.86% | 0.78% | 0.92% | 0.96% |
Portfolio Turnover Rate4 | 32%3 | 32% | 53% | 42% | 20% | 19% |
1 Includes increases from redemption fees of $.00, $.01, $.01, $.01, $.01, and $.01.
2 Total returns do not reflect the 1% redemption fee on shares held less than five years; the 2% redemption fee assessed prior to September 14, 2005, on shares held less than one year; or the account service fee that may be applicable to certain accounts with balances below $10,000.
3 Annualized.
4 Excludes the value of portfolio securities received or delivered as a result of in-kind purchases or redemptions of the fund’s capital shares. See accompanying Notes, which are an integral part of the Financial Statements.
76
Tax-Managed Small-Cap Fund
Financial Highlights
Institutional Shares |
|
|
|
|
|
|
|
|
|
|
|
|
|
| Six Months |
|
|
|
|
|
| Ended |
|
|
| ||
For a Share Outstanding | June 30, | Year Ended December 31, | ||||
Throughout Each Period | 2009 | 2008 | 2007 | 2006 | 2005 | 2004 |
Net Asset Value, Beginning of Period | $17.47 | $25.66 | $25.77 | $22.74 | $21.28 | $17.47 |
Investment Operations |
|
|
|
|
|
|
Net Investment Income | .064 | .275 | .242 | .209 | .213 | .178 |
Net Realized and Unrealized Gain (Loss) |
|
|
|
|
|
|
on Investments1 | .071 | (8.184) | (.108) | 3.028 | 1.454 | 3.811 |
Total from Investment Operations | .135 | (7.909) | .134 | 3.237 | 1.667 | 3.989 |
Distributions |
|
|
|
|
|
|
Dividends from Net Investment Income | (.005) | (.281) | (.244) | (.207) | (.207) | (.179) |
Distributions from Realized Capital Gains | — | — | — | — | — | — |
Total Distributions | (.005) | (.281) | (.244) | (.207) | (.207) | (.179) |
Net Asset Value, End of Period | $17.60 | $17.47 | $25.66 | $25.77 | $22.74 | $21.28 |
|
|
|
|
|
|
|
|
|
|
|
|
|
|
Total Return2 | 0.78% | –30.77% | 0.51% | 14.23% | 7.82% | 22.83% |
|
|
|
|
|
|
|
|
|
|
|
|
|
|
Ratios/Supplemental Data |
|
|
|
|
|
|
Net Assets, End of Period (Millions) | $110 | $102 | $171 | $128 | $94 | $15 |
Ratio of Total Expenses to |
|
|
|
|
|
|
Average Net Assets | 0.09%3 | 0.09% | 0.09% | 0.09% | 0.09% | 0.09% |
Ratio of Net Investment Income to |
|
|
|
|
|
|
Average Net Assets | 1.09%3 | 1.21% | 0.90% | 0.83% | 0.97% | 1.01% |
Portfolio Turnover Rate4 | 32%3 | 32% | 53% | 42% | 20% | 19% |
1 Includes increases from redemption fees of $.00, $.01, $.01, $.01, $.00, and $.01.
2 Total returns do not reflect the 1% redemption fee on shares held less then five years or the 2% redemption fee assessed prior to September 14, 2005, on shares held for less than one year.
3 Annualized.
4 Excludes the value of portfolio securities received or delivered as a result of in-kind purchases or redemptions of the fund’s capital shares. See accompanying Notes, which are an integral part of the Financial Statements.
77
Tax-Managed Small-Cap Fund
Notes to Financial Statements
Vanguard Tax-Managed Small-Cap Fund is registered under the Investment Company Act of 1940 as an open-end investment company, or mutual fund. The fund offers two classes of shares: Investor Shares and Institutional Shares. Investor Shares are available to any investor who meets the fund’s minimum purchase requirements. Institutional Shares are designed for investors who meet certain administrative and service criteria and invest a minimum of $5 million.
A. The following significant accounting policies conform to generally accepted accounting principles for U.S. mutual funds. The fund consistently follows such policies in preparing its financial statements.
1. Security Valuation: Securities are valued as of the close of trading on the New York Stock Exchange (generally 4 p.m., Eastern time) on the valuation date. Equity securities are valued at the latest quoted sales prices or official closing prices taken from the primary market in which each security trades; such securities not traded on the valuation date are valued at the mean of the latest quoted bid and asked prices. Securities for which market quotations are not readily available, or whose values have been materially affected by events occurring before the fund’s pricing time but after the close of the securities’ primary markets, are valued by methods deemed by the board of trustees to represent fair value. Investments in Vanguard Market Liquidity Fund are valued at that fund’s net asset value.
2. Federal Income Taxes: The fund intends to continue to qualify as a regulated investment company and distribute all of its taxable income. Management has analyzed the fund’s tax positions taken on federal income tax returns for all open tax years (tax years ended December 31, 2005–2008) and for the period ended June 30, 2009, and has concluded that no provision for federal income tax is required in the fund’s financial statements.
3. Distributions: Distributions to shareholders are recorded on the ex-dividend date.
4. Other: Dividend income is recorded on the ex-dividend date. Interest income includes income distributions received from Vanguard Market Liquidity Fund and is accrued daily. Security transactions are accounted for on the date securities are bought or sold. Costs used to determine realized gains (losses) on the sale of investment securities are those of the specific securities sold. Fees assessed on redemptions of capital shares are credited to paid-in capital.
Each class of shares has equal rights as to assets and earnings, except that each class separately bears certain class-specific expenses related to maintenance of shareholder accounts (included in Management and Administrative expenses), shareholder reporting, and proxies. Marketing and distribution expenses are allocated to each class of shares based on a method approved by the board of trustees. Income, other non-class-specific expenses, and gains and losses on investments are allocated to each class of shares based on its relative net assets.
B. The Vanguard Group furnishes at cost investment advisory, corporate management, administrative, marketing, and distribution services. The costs of such services are allocated to the fund under methods approved by the board of trustees. The fund has committed to provide up to 0.40% of its net assets in capital contributions to Vanguard. At June 30, 2009, the fund had contributed capital of $313,000 to Vanguard (included in Other Assets), representing 0.02% of the fund’s net assets and 0.13% of Vanguard’s capitalization. The fund’s trustees and officers are also directors and officers of Vanguard.
78
Tax-Managed Small-Cap Fund
C. Various inputs may be used to determine the value of the fund’s investments. These inputs are summarized in three broad levels for financial statement purposes. The inputs or methodologies used to value securities are not necessarily an indication of the risk associated with investing in those securities.
Level 1—Quoted prices in active markets for identical securities.
Level 2—Other significant observable inputs (including quoted prices for similar securities, interest rates, prepayment speeds, credit risk, etc.).
Level 3—Significant unobservable inputs (including the fund’s own assumptions used to determine the fair value of investments).
At June 30, 2009, 100% of the fund’s investments were valued based on Level 1 inputs.
D. Distributions are determined on a tax basis and may differ from net investment income and realized capital gains for financial reporting purposes. Differences may be permanent or temporary. Permanent differences are reclassified among capital accounts in the financial statements to reflect their tax character. Temporary differences arise when certain items of income, expense, gain, or loss are recognized in different periods for financial statement and tax purposes; these differences will reverse at some time in the future. Differences in classification may also result from the treatment of short-term gains as ordinary income for tax purposes.
The fund’s tax-basis capital gains and losses are determined only at the end of each fiscal year. For tax purposes, at December 31, 2008, the fund had available realized losses of $123,667,000 to offset future net capital gains of $2,167,000 through December 31, 2011, $9,132,000 through December 31, 2015, $86,306,000 through December 31, 2016, and $26,062,000 through December 31, 2017. The fund will use these capital losses to offset net taxable capital gains, if any, realized during the year ending December 31, 2009; should the fund realize net capital losses for the year, the losses will be added to the loss carryforward balances above.
At June 30, 2009, the cost of investment securities for tax purposes was $1,469,821,000. Net unrealized depreciation of investment securities for tax purposes was $121,031,000, consisting of unrealized gains of $151,778,000 on securities that had risen in value since their purchase and $272,809,000 in unrealized losses on securities that had fallen in value since their purchase.
E. During the six months ended June 30, 2009, the fund purchased $197,749,000 of investment securities and sold $207,487,000 of investment securities, other than temporary cash investments.
79
Tax-Managed Small-Cap Fund
F. Capital share transactions for each class of shares were:
| Six Months Ended | Year Ended | |||
| June 30, 2009 | December 31, 2008 | |||
| Amount | Shares |
| Amount | Shares |
| ($000) | (000) |
| ($000) | (000) |
Investor Shares |
|
|
|
|
|
Issued | 60,889 | 3,854 |
| 520,702 | 22,445 |
Issued in Lieu of Cash Distributions | 232 | 17 |
| 15,709 | 940 |
Redeemed1 | (79,296) | (5,300) |
| (482,735) | (21,216) |
Net Increase (Decrease)—Investor Shares | (18,175) | (1,429) |
| 53,676 | 2,169 |
Institutional Shares |
|
|
|
|
|
Issued | 7,263 | 446 |
| 35,129 | 1,461 |
Issued in Lieu of Cash Distributions | 19 | 1 |
| 1,126 | 67 |
Redeemed1 | (455) | (30) |
| (42,534) | (2,347) |
Net Increase (Decrease)—Institutional Shares | 6,827 | 417 |
| (6,279) | (819) |
1 Net of redemption fees for fiscal 2009 and 2008 of $284,000 and $881,000, respectively (fund totals). | |||||
G. In preparing the financial statements as of June 30, 2009, management considered the impact of subsequent events occurring through August 5, 2009, for potential recognition or disclosure in these financial statements.
80
About Your Fund’s Expenses
As a shareholder of the fund, you incur ongoing costs, which include costs for portfolio management, administrative services, and shareholder reports (like this one), among others. Operating expenses, which are deducted from a fund’s gross income, directly reduce the investment return of the fund.
A fund’s expenses are expressed as a percentage of its average net assets. This figure is known as the expense ratio. The following examples are intended to help you understand the ongoing costs (in dollars) of investing in your fund and to compare these costs with those of other mutual funds. The examples are based on an investment of $1,000 made at the beginning of the period shown and held for the entire period.
The accompanying table illustrates your fund’s costs in two ways:
• Based on actual fund return. This section helps you to estimate the actual expenses that you paid over the period. The “Ending Account Value” shown is derived from the fund’s actual return, and the third column shows the dollar amount that would have been paid by an investor who started with $1,000 in the fund. You may use the information here, together with the amount you invested, to estimate the expenses that you paid over the period.
To do so, simply divide your account value by $1,000 (for example, an $8,600 account value divided by $1,000 = 8.6), then multiply the result by the number given for your fund under the heading “Expenses Paid During Period.”
• Based on hypothetical 5% yearly return. This section is intended to help you compare your fund’s costs with those of other mutual funds. It assumes that the fund had a yearly return of 5% before expenses, but that the expense ratio is unchanged. In this case—because the return used is not the fund’s actual return—the results do not apply to your investment. The example is useful in making comparisons because the Securities and Exchange Commission requires all mutual funds to calculate expenses based on a 5% return. You can assess your fund’s costs by comparing this hypothetical example with the hypothetical examples that appear in shareholder reports of other funds.
Note that the expenses shown in the table are meant to highlight and help you compare ongoing costs only and do not reflect transaction costs incurred by the fund for buying and selling securities. Further, the expenses do not include the 1% fee on redemptions of shares held for less than five years, nor do they include the account service fee described in the prospectus. If such fees were applied to your account, your costs would be higher. Your fund does not carry a “sales load.”
The calculations assume no shares were bought or sold during the period. Your actual costs may have been higher or lower, depending on the amount of your investment and the timing of any purchases or redemptions.
You can find more information about the fund’s expenses, including annual expense ratios, in the Financial Statements section of this report. For additional information on operating expenses and other shareholder costs, please refer to your fund’s current prospectus.
81
Six Months Ended June 30, 2009 |
|
|
|
| Beginning | Ending | Expenses |
| Account Value | Account Value | Paid During |
Tax-Managed Fund | 12/31/2008 | 6/30/2009 | Period1 |
Based on Actual Fund Return |
|
|
|
Balanced | $1,000.00 | $1,055.44 | $0.76 |
Growth and Income |
|
|
|
Investor Shares | $1,000.00 | $1,031.93 | $1.06 |
Admiral Shares | 1,000.00 | 1,032.28 | 0.76 |
Institutional Shares | 1,000.00 | 1,032.58 | 0.45 |
Capital Appreciation |
|
|
|
Investor Shares | $1,000.00 | $1,052.05 | $1.07 |
Admiral Shares | 1,000.00 | 1,052.41 | 0.76 |
Institutional Shares | 1,000.00 | 1,052.95 | 0.46 |
Small-Cap |
|
|
|
Investor Shares | $1,000.00 | $1,007.17 | $0.95 |
Institutional Shares | 1,000.00 | 1,007.81 | 0.45 |
Based on Hypothetical 5% Yearly Return |
|
|
|
Balanced | $1,000.00 | $1,024.05 | $0.75 |
Growth and Income |
|
|
|
Investor Shares | $1,000.00 | $1,023.75 | $1.05 |
Admiral Shares | 1,000.00 | 1,024.05 | 0.75 |
Institutional Shares | 1,000.00 | 1,024.35 | 0.45 |
Capital Appreciation |
|
|
|
Investor Shares | $1,000.00 | $1,023.75 | $1.05 |
Admiral Shares | 1,000.00 | 1,024.05 | 0.75 |
Institutional Shares | 1,000.00 | 1,024.35 | 0.45 |
Small-Cap |
|
|
|
Investor Shares | $1,000.00 | $1,023.85 | $0.95 |
Institutional Shares | 1,000.00 | 1,024.35 | 0.45 |
1 The calculations are based on expenses incurred during the most recent six-month period. The fund’s annualized six-month expense ratios for that period are: for the Tax-Managed Balanced Fund, 0.15%; for the Tax-Managed Growth and Income Fund, 0.21% for Investor Shares, 0.15% for Admiral Shares, and 0.09% for Institutional Shares; for the Tax-Managed Capital Appreciation Fund, 0.21% for Investor Shares, 0.15% for Admiral Shares, and 0.09% for Institutional Shares; for the Tax-Managed Small-Cap Fund, 0.19% for Investor Shares and 0.09% for Institutional Shares. The dollar amounts shown as “Expenses Paid” are equal to the annualized expense ratio multiplied by the average account value over the period, multiplied by the number of days in the most recent six-month period, then divided by the number of days in the most recent 12-month period.
82
Trustees Approve Advisory Arrangement
The board of trustees of the Vanguard Tax-Managed Balanced Fund, Tax-Managed Growth and Income Fund, Tax-Managed Capital Appreciation Fund, and Tax-Managed Small-Cap Fund has renewed the funds’ investment advisory arrangement with The Vanguard Group, Inc. Vanguard—through its Quantitative Equity and Fixed Income Groups—serves as the investment advisor for the funds. The board determined that continuing the funds’ internalized management structure was in the best interests of the funds and their shareholders.
The board based its decision upon an evaluation of the advisor’s investment staff, portfolio management process, and performance. The trustees considered the factors discussed below, among others. However, no single factor determined whether the board approved the arrangement. Rather, it was the totality of the circumstances that drove the board’s decision.
Nature, extent, and quality of services
The board considered the quality of the funds’ investment management over both the short and long term, and took into account the organizational depth and stability of the advisor. The board noted that Vanguard has been managing investments for more than three decades. Both the Quantitative Equity Group and the Fixed Income Group adhere to sound, disciplined investment management processes; each group’s team has considerable experience, stability, and depth.
The board concluded that Vanguard’s experience, stability, depth, and performance, among other factors, warranted continuation of the advisory arrangement.
Investment performance
The board considered the short- and long-term performance of the funds, including any periods of outperformance or underperformance of relevant benchmarks and peer groups. The board concluded that the funds have performed in line with expectations, and that their results have been consistent with their investment strategies. Information about the funds’ most recent performance can be found in the Performance Summary sections of this report.
Cost
The board concluded that the funds’ expense ratios were far below the average expense ratios charged by funds in their peer groups. The board noted that the funds’ advisory expense ratios were also well below their peer-group averages. Information about the funds’ expense ratios appears in the About Your Fund’s Expenses section of this report as well as in the Financial Statements section.
The board does not conduct a profitability analysis of Vanguard, because of Vanguard’s unique “at-cost” structure. Unlike most other mutual fund management companies, Vanguard is owned by the funds it oversees, and produces “profits” only in the form of reduced expenses for fund shareholders.
The benefit of economies of scale
The board concluded that the funds’ low-cost arrangement with Vanguard ensures that the funds will realize economies of scale as they grow, with the cost to shareholders declining as fund assets increase.
The board will consider whether to renew the advisory arrangement again after a one-year period.
83
Glossary
Average Coupon. The average interest rate paid on the fixed income securities held by a fund. It is expressed as a percentage of face value.
Average Duration. An estimate of how much the value of the bonds held by a fund will fluctuate in response to a change in interest rates. To see how the value could change, multiply the average duration by the change in rates. If interest rates rise by 1 percentage point, the value of the bonds in a fund with an average duration of five years would decline by about 5%. If rates decrease by a percentage point, the value would rise by 5%.
Average Effective Maturity. The average length of time until fixed income securities held by a fund reach maturity and are repaid, taking into consideration the possibility that the issuer may call the bond before its maturity date. The figure reflects the proportion of fund assets represented by each security; it also reflects any futures contracts held. In general, the longer the average effective maturity, the more a fund’s share price will fluctuate in response to changes in market interest rates.
Average Quality. An indicator of credit risk, this figure is the average of the ratings assigned to a fund’s fixed income holdings by credit-rating agencies. The agencies make their judgment after appraising an issuer’s ability to meet its obligations. Quality is graded on a scale, with Aaa or AAA indicating the most creditworthy bond issuers. U.S. Treasury securities are considered to have the highest credit quality.
Beta. A measure of the magnitude of a fund’s past share-price fluctuations in relation to the ups and downs of a given market index. The index is assigned a beta of 1.00. Compared with a given index, a fund with a beta of 1.20 typically would have seen its share price rise or fall by 12% when the index rose or fell by 10%. For this report, beta is based on returns over the past 36 months for both the fund and the index. Note that a fund’s beta should be reviewed in conjunction with its R-squared (see definition). The lower the R-squared, the less correlation there is between the fund and the index, and the less reliable beta is as an indicator of volatility.
Dividend Yield. The current, annualized rate of dividends paid on a share of stock, divided by its current share price. For a fund, the weighted average yield for stocks it holds. The index yield is based on the current annualized rate of dividends paid on stocks in the index.
Earnings Growth Rate. The average annual rate of growth in earnings over the past five years for the stocks now in a fund.
Equity Exposure. A measure that reflects a fund’s investments in stocks and stock futures. Any holdings in short-term reserves are excluded.
Expense Ratio. The percentage of a fund’s average net assets used to pay its annual administrative and advisory expenses. These expenses directly reduce returns to investors.
Foreign Holdings. The percentage of a fund represented by stocks or depositary receipts of companies based outside the United States.
Inception Date. The date on which the assets of a fund (or one of its share classes) are first invested in accordance with the fund’s investment objective. For funds with a subscription period, the inception date is the day after that period ends. Investment performance is measured from the inception date.
Largest State Concentrations. An indicator of diversification. The less concentrated a fund’s holdings of bonds, the less the fund will be hurt by any financial problems in a single state or region.
84
Median Market Cap. An indicator of the size of companies in which a fund invests; the midpoint of market capitalization (market price x shares outstanding) of a fund’s stocks, weighted by the proportion of the fund’s assets invested in each stock. Stocks representing half of the fund’s assets have market capitalizations above the median, and the rest are below it.
Price/Book Ratio. The share price of a stock divided by its net worth, or book value, per share. For a fund, the weighted average price/book ratio of the stocks it holds.
Price/Earnings Ratio. The ratio of a stock’s current price to its per-share earnings over the past year. For a fund, the weighted average P/E of the stocks it holds. P/E is an indicator of market expectations about corporate prospects; the higher the P/E, the greater the expectations for a company’s future growth.
R-Squared. A measure of how much of a fund’s past returns can be explained by the returns from the market in general, as measured by a given index. If a fund’s total returns were precisely synchronized with an index’s returns, its R-squared would be 1.00. If the fund’s returns bore no relationship to the index’s returns, its R-squared would be 0. For this report, R-squared is based on returns over the past 36 months for both the fund and the index.
Return on Equity. The annual average rate of return generated by a company during the past five years for each dollar of shareholder’s equity (net income divided by shareholder’s equity). For a fund, the weighted average return on equity for the companies whose stocks it holds.
Short-Term Reserves. The percentage of a fund invested in highly liquid, short-term securities that can be readily converted to cash.
Turnover Rate. An indication of the fund’s trading activity. Funds with high turnover rates incur higher transaction costs and may be more likely to distribute capital gains (which may be taxable to investors). The turnover rate excludes in-kind transactions, which have minimal impact on costs.
Yield. A fund’s 30-day SEC yield is derived using a formula specified by the U.S. Securities and Exchange Commission. Under the formula, data related to the fund’s security holdings in the previous 30 days are used to calculate the fund’s hypothetical net income for that period, which is then annualized and divided by the fund’s estimated average net assets over the calculation period. For the purposes of this calculation, a security’s income is based on its current market yield to maturity (in the case of bonds) or its projected dividend yield (for stocks). Because the SEC yield represents hypothetical annualized income, it will differ—at times significantly—from the fund’s actual experience. As a result, the fund’s income distributions may be higher or lower than implied by the SEC yield.
Yield to Maturity. The rate of return an investor would receive if the fixed income securities held by a fund were held to their maturity dates.
85
This page intentionally left blank.
This page intentionally left blank.
The People Who Govern Your Fund
The trustees of your mutual fund are there to see that the fund is operated and managed in your best interests since, as a shareholder, you are a part owner of the fund. Your fund’s trustees also serve on the board of directors of The Vanguard Group, Inc., which is owned by the Vanguard funds and provides services to them on an at-cost basis.
A majority of Vanguard’s board members are independent, meaning that they have no affiliation with Vanguard or the funds they oversee, apart from the sizable personal investments they have made as private individuals. The independent board members have distinguished backgrounds in business, academia, and public service. Each of the trustees and executive officers oversees 157 Vanguard funds.
The following table provides information for each trustee and executive officer of the fund. More information about the trustees is in the Statement of Additional Information, which can be obtained, without charge, by contacting Vanguard at 800-662-7447, or online at www.vanguard.com.
Interested Trustees
John J. Brennan1
Born 1954. Trustee Since May 1987. Chairman of the Board. Principal Occupation(s) During the Past Five Years: Chairman of the Board and Director/Trustee of The Vanguard Group, Inc., and of each of the investment companies served by The Vanguard Group; Chief Executive Officer and President of The Vanguard Group and of each of the investment companies served by The Vanguard Group (1996–2008); Chairman of the Financial Accounting Foundation; Governor of the Financial Industry Regulatory Authority (FINRA); Director of United Way of Southeastern Pennsylvania.
F. William McNabb III1
Born 1957. Trustee Since July 2009. Principal Occupation(s) During the Past Five Years: Director of The Vanguard Group, Inc., since 2008; Chief Executive Officer and President of The Vanguard Group and of each of the investment companies served by The Vanguard Group since 2008; Director of Vanguard Marketing Corporation; Managing Director of The Vanguard Group (1995–2008).
Independent Trustees
Charles D. Ellis
Born 1937. Trustee Since January 2001. Principal Occupation(s) During the Past Five Years: Applecore Partners (pro bono ventures in education); Senior Advisor to Greenwich Associates (international business strategy consulting); Successor Trustee of Yale University; Overseer of the Stern School of Business at New York University; Trustee of the Whitehead Institute for Biomedical Research.
Emerson U. Fullwood
Born 1948. Trustee Since January 2008. Principal Occupation(s) During the Past Five Years: Retired Executive Chief Staff and Marketing Officer for North America and Corporate Vice President of Xerox Corporation (photocopiers and printers); Director of SPX Corporation (multi-industry manufacturing), the United Way of Rochester, the Boy Scouts of America, Amerigroup Corporation (direct health and medical insurance carriers), and Monroe Community College Foundation.
Rajiv L. Gupta
Born 1945. Trustee Since December 2001.2 Principal Occupation(s) During the Past Five Years: Retired Chairman and Chief Executive Officer of Rohm and Haas Co. (chemicals); President of Rohm and Haas Co. (2006–2008); Board Member of American Chemistry Council; Director of Tyco International, Ltd. (diversified manufacturing and services) and Hewlett-Packard Co. (electronic computer manufacturing); Trustee of The Conference Board.
Amy Gutmann
Born 1949. Trustee Since June 2006. Principal Occupation(s) During the Past Five Years: President of the University of Pennsylvania; Christopher H. Browne Distinguished Professor of Political Science in the School of Arts and Sciences with Secondary Appointments at the Annenberg School for Communication and the Graduate School of Education of the University of Pennsylvania; Director of Carnegie Corporation of New York, Schuylkill River Development Corporation, and Greater Philadelphia Chamber of Commerce; Trustee of the National Constitution Center.
JoAnn Heffernan Heisen
Born 1950. Trustee Since July 1998. Principal Occupation(s) During the Past Five Years: Retired Corporate Vice President, Chief Global Diversity Officer, and Member of the Executive Committee of Johnson
& Johnson (pharmaceuticals/consumer products); Vice President and Chief Information Officer of Johnson
& Johnson (1997–2005); Director of the University Medical Center at Princeton and Women’s Research and Education Institute.
André F. Perold
Born 1952. Trustee Since December 2004. Principal Occupation(s) During the Past Five Years: George Gund Professor of Finance and Banking, Harvard Business School; Director and Chairman of UNX, Inc. (equities trading firm); Chair of the Investment Committee of HighVista Strategies LLC (private investment firm).
Alfred M. Rankin, Jr.
Born 1941. Trustee Since January 1993. Principal Occupation(s) During the Past Five Years: Chairman, President, Chief Executive Officer, and Director of NACCO Industries, Inc. (forklift trucks/housewares/ lignite); Director of Goodrich Corporation (industrial products/aircraft systems and services).
Peter F. Volanakis
Born 1955. Trustee Since July 2009. Principal Occupations During the Past Five Years: President since 2007 and Chief Operating Officer since 2005 of Corning Incorporated (communications equipment); President of Corning Technologies (2001–2005); Director of Corning Incorporated and Dow Corning; Trustee of the Corning Incorporated Foundation and the Corning Museum of Glass; Overseer of the Amos Tuck School of Business Administration at Dartmouth College.
Executive Officers
Thomas J. Higgins1
Born 1957. Chief Financial Officer Since September 2008. Principal Occupation(s) During the Past Five Years: Principal of The Vanguard Group, Inc.; Chief Financial Officer of each of the investment companies served by The Vanguard Group since 2008; Treasurer of each of the investment companies served by The Vanguard Group (1998–2008).
Kathryn J. Hyatt1
Born 1955. Treasurer Since November 2008. Principal Occupation(s) During the Past Five Years: Principal of The Vanguard Group, Inc.; Treasurer of each of the investment companies served by The Vanguard Group since 2008; Assistant Treasurer of each of the investment companies served by The Vanguard Group (1988–2008).
Heidi Stam1
Born 1956. Secretary Since July 2005. Principal Occupation(s) During the Past Five Years: Managing Director of The Vanguard Group, Inc., since 2006; General Counsel of The Vanguard Group since 2005; Secretary of The Vanguard Group and of each of the investment companies served by The Vanguard Group since 2005; Director and Senior Vice President of Vanguard Marketing Corporation since 2005; Principal of The Vanguard Group (1997–2006).
Vanguard Senior Management Team | |
|
|
R. Gregory Barton | Michael S. Miller |
Mortimer J. Buckley | James M. Norris |
Kathleen C. Gubanich | Glenn W. Reed |
Paul A. Heller | George U. Sauter |
Founder
John C. Bogle
Chairman and Chief Executive Officer, 1974–1996
1 These individuals are “interested persons” as defined in the Investment Company Act of 1940.
2 December 2002 for Vanguard Equity Income Fund, Vanguard Growth Equity Fund, the Vanguard Municipal Bond Funds, and the Vanguard State Tax-Exempt Funds.

P.O. Box 2600
Valley Forge, PA 19482-2600
Connect with Vanguard® > www.vanguard.com
Fund Information > 800-662-7447 | All comparative mutual fund data are from Lipper Inc. |
| or Morningstar, Inc., unless otherwise noted. |
Direct Investor Account Services > 800-662-2739 |
|
| You can obtain a free copy of Vanguard’s proxy voting |
Institutional Investor Services > 800-523-1036 | guidelines by visiting our website, www.vanguard.com, |
| and searching for “proxy voting guidelines,” or by |
Text Telephone for People | calling Vanguard at 800-662-2739. The guidelines are |
With Hearing Impairment > 800-952-3335 | also available from the SEC’s website, www.sec.gov. |
| In addition, you may obtain a free report on how your |
| fund voted the proxies for securities it owned during |
| the 12 months ended June 30. To get the report, visit |
This material may be used in conjunction | either www.vanguard.com or www.sec.gov. |
with the offering of shares of any Vanguard |
|
fund only if preceded or accompanied by |
|
the fund’s current prospectus. |
|
|
|
| You can review and copy information about your fund |
| at the SEC’s Public Reference Room in Washington, D.C. |
| To find out more about this public service, call the SEC |
| at 202-551-8090. Information about your fund is also |
| available on the SEC’s website, and you can receive |
| copies of this information, for a fee, by sending a |
| request in either of two ways: via e-mail addressed to |
| publicinfo@sec.gov or via regular mail addressed to the |
| Public Reference Section, Securities and Exchange |
| Commission, Washington, DC 20549-0102. |
|
|
|
|
|
|
|
|
|
|
|
|
|
|
|
|
|
|
|
|
|
|
|
|
|
|
| © 2009 The Vanguard Group, Inc. |
| All rights reserved. |
| Vanguard Marketing Corporation, Distributor. |
|
|
| Q872 082009 |
> The net asset values of Vanguard Tax-Managed International Fund’s shares (including the Europe Pacific ETF) rose more than 5%, as global stock markets sank and then bounced back during the six-month period.
> Among major markets, stocks in the United Kingdom and Australia did particularly well, while French, German, and Japanese stocks rose more modestly.
> The financial sector recovered from a disastrous run to post the best return for the fiscal half-year. Materials and consumer discretionary holdings also performed well.
Contents |
|
|
|
Your Fund’s Total Returns | 1 |
President’s Letter | 2 |
Fund Profile | 7 |
Performance Summary | 9 |
Financial Statements | 10 |
About Your Fund’s Expenses | 31 |
Trustees Approve Advisory Arrangement | 33 |
Glossary | 34 |
Please note: The opinions expressed in this report are just that—informed opinions. They should not be considered promises or advice. Also, please keep in mind that the information and opinions cover the period through the date on the front of this report. Of course, the risks of investing in your fund are spelled out in the prospectus.
Your Fund’s Total Returns
Six Months Ended June 30, 2009 |
|
|
| Ticker | Total |
| Symbol | Returns |
Vanguard Tax-Managed International Fund |
|
|
Investor Shares | VTMGX | 5.69% |
Institutional Shares1 | VTMNX | 5.81 |
Vanguard Europe Pacific ETF Shares2 | VEA |
|
Market Price |
| 4.65 |
Net Asset Value |
| 5.75 |
MSCI EAFE Index |
| 7.95 |
Average International Fund3 |
| 8.81 |
Your Fund’s Performance at a Glance | ||||
December 31, 2008–June 30, 2009 |
|
|
|
|
|
|
| Distributions Per Share | |
| Starting | Ending | Income | Capital |
| Share Price | Share Price | Dividends | Gains |
Vanguard Tax-Managed International Fund |
|
|
|
|
Investor Shares | $8.74 | $9.23 | $0.006 | $0.000 |
Institutional Shares | 8.74 | 9.24 | 0.006 | 0.000 |
Europe Pacific ETF Shares | 27.18 | 28.72 | 0.019 | 0.000 |
1 This class of shares carries lower expenses and is available for a minimum investment of $5 million.
2 Vanguard ETF™ Shares are traded on the NYSE Arca exchange and are available only through brokers. The table shows ETF returns based on both the NYSE Arca market price and the net asset value for a share. U.S. Pat. No. 6,879,964 B2; 7,337,138.
3 Derived from data provided by Lipper Inc.
1
President’s Letter

Dear Shareholder,
During the past six months, global stock markets continued to sink, only to suddenly turn around in March and end up in positive territory. Vanguard Tax-Managed International Fund (including the net asset value of its exchange-traded counterpart, the Europe Pacific ETF) returned more than 5%. Because of temporary price differences arising from fair-value pricing policies (see page 5 for an explanation), the fund trailed the return of its benchmark index, the MSCI EAFE Index, by more than the usual small amount of the expense ratio. Meanwhile, the fund’s peer group registered an average return of almost 9%.
Stock gains petered out by the end of the period
For the six months ended June 30, the broad U.S. stock market returned 5%. The stock market began the period in negative territory, rallied through much of the spring, but then lost steam in June. While the second quarter was the strongest quarter for U.S. stocks since 2003, equity gains fizzled as investors were taken aback by a drop in consumer confidence, falling home prices, and a larger-than-expected rise in the unemployment rate.
International stocks registered a stronger showing, returning about 14% for the half-year. Emerging markets posted the best results as investors poured money into countries with strong growth prospects.
2
Higher commodity prices and a slight rebound in manufacturing orders helped reverse steep declines in international stocks from earlier in the period.
Still, pockets of the developed and developing markets, particularly in Europe, continued to struggle amid the global recession. After three consecutive monthly gains, the MSCI All Country World Index ex USA declined slightly for June.
Bond investors grew confident, sought out higher yields
As the fiscal half-year began, investors panicked by the credit-market crisis sought shelter in U.S. Treasury bonds, considered the safest of all securities. The difference between the yields of Treasuries and those of corporate bonds surged to levels not seen since the 1930s.
By mid-March, investors had gained confidence from the federal government’s efforts to thaw the credit market and stimulate the economy. Bond investors were more optimistic and more willing to take on risk; they shifted their focus away from Treasuries to higher-yielding corporate bonds. For the six months, the Barclays Capital U.S. Aggregate Bond Index returned about 2%, while high-yield bonds, as measured by the Barclays Capital U.S. Corporate High Yield Bond Index, returned about 30%.
Market Barometer |
|
|
|
|
|
| Total Returns |
|
| Periods Ended June 30, 2009 | |
| Six Months | One Year | Five Years1 |
Stocks |
|
|
|
MSCI All Country World Index ex USA (International) | 14.35% | –30.54% | 4.95% |
Russell 1000 Index (Large-caps) | 4.32 | –26.69 | –1.85 |
Russell 2000 Index (Small-caps) | 2.64 | –25.01 | –1.71 |
Dow Jones U.S. Total Stock Market Index | 5.00 | –26.11 | –1.47 |
|
|
|
|
|
|
|
|
Bonds |
|
|
|
Barclays Capital U.S. Aggregate Bond Index |
|
|
|
(Broad taxable market) | 1.90% | 6.05% | 5.01% |
Barclays Capital Municipal Bond Index | 6.43 | 3.77 | 4.14 |
Citigroup 3-Month Treasury Bill Index | 0.10 | 0.78 | 3.02 |
|
|
|
|
|
|
|
|
CPI |
|
|
|
Consumer Price Index | 2.60% | –1.43% | 2.60% |
1 Annualized.
3
Despite some murmurs in the market about longer-term inflation risks, the Federal Reserve in recent months unveiled plans to purchase Treasury and mortgage-backed securities. The Fed hoped to drive up the securities’ prices and push down yields, and thus keep borrowing costs, such as mortgage rates, low. Government initiatives also helped bring down municipal bond yields, which earlier in the period were higher than those of Treasuries, a reversal in the traditional relationship between taxable and tax-exempt yields. For the six months, the tax-exempt bond market returned more than 6%.
The Fed kept the target for short-term interest rates at an all-time low of 0% to 0.25% throughout the period.
A period of strength in both Europe and Asia
Although the first months of 2009 seemed initially to represent the latest chapter in the brutal market saga that prevailed through much of 2008, the gloom cleared in early March. Stock markets rebounded around the globe, and by the end of June, Vanguard Tax-Managed International Fund’s holdings in the developed markets of Europe and the Pacific region had gained more than 5%.
European stocks, which accounted for almost two-thirds of the fund’s assets, returned more than 7%. Stocks in the United Kingdom, the largest European market, advanced more than 13%. The second-leading European contributor was
Expense Ratios1 |
|
Your Fund Compared With Its Peer Group |
|
| Expense |
| Ratio |
Vanguard Tax-Managed International Fund |
|
Investor Shares | 0.20% |
Institutional Shares | 0.10 |
Europe Pacific ETF Shares | 0.16 |
Average International Fund | 1.44 |
1 The fund expense ratios shown are from the prospectuses dated April 24, 2009, and represent estimated costs for the current fiscal year based on the fund’s net assets as of the prospectus date. For the six months ended June 30, 2009, the fund’s annualized expense ratios were 0.20% for Investor Shares, 0.10% for Institutional Shares, and 0.16% for Europe Pacific ETF Shares. The peer-group expense ratio is derived from data provided by Lipper Inc. and captures information through year-end 2008.
4
Sweden (+28%). Fresh optimism about the recovery prospects for beaten-down European financial companies gave that sector a strong bounce, while the materials sector looked to benefit from the early stages of an economic recovery. Bolstered by a rebound in energy prices, European energy-related firms also helped the fund’s bottom line.
In the Pacific region’s developed markets, which accounted for about a third of fund assets, the portfolio gained about 10% thanks to big jumps in Australia (+28%) and Hong Kong (+35%). Australia’s reliance on commodity exports boded well for its prospects as commodity prices rose from their winter lows, while Hong Kong profited from its close access to China’s still-growing economy. At the other end of the spectrum, a deep recession in Japan limited that market’s rise to only 3%.
As in Europe, financials in the Pacific region hit bottom in the winter and then bounced back strongly, while materials advanced smartly, as investors remained optimistic that massive industrialization in China, India, and other fast-growing economies would stoke demand for raw materials. Investors bid up shares of Asian automakers and electronics firms in anticipation of a turnaround in sales, boosting the consumer discretionary sector. In both Europe and Asia, the good news was spoiled only by negative returns in the utilities, health care, and telecommunication services sectors.
A note on fair-value pricing
The return of a fund that tracks an index sometimes may appear to diverge from the index’s return a bit more than would be expected. This may be the result of a fair-value pricing adjustment.
These adjustments address pricing discrepancies that may arise because of time-zone differences among global stock markets. Foreign stocks may trade on exchanges that close many hours before a fund’s closing share price is calculated in the United States, generally at 4 p.m., Eastern time. In the hours between the foreign close and the U.S. close, the value of these foreign securities may change—because of company-specific announcements or market-wide developments, for example. Such price changes are not immediately reflected in international index values.
Fair-value pricing takes such changes into account in calculating the fund’s daily net asset value, thus ensuring that the NAV doesn’t include “stale” prices. The result can be a temporary divergence between the return of the fund and that of its benchmark index—a difference that usually corrects itself when the foreign markets reopen.
5
A reminder that perseverance is often rewarded over time
The recent rally in global markets can serve as a reminder not to overreact to the market’s short-term swings, even in tumultuous periods such as 2008. International stocks badly trailed U.S. stocks in 2008, and in fact, the Tax-Managed International Fund declined for six straight quarters starting with the last quarter of 2007 (after advancing for nine consecutive quarters). It would have been easy to decide to do without international stocks. But such a hasty reaction could have been costly, keeping a portfolio that experienced the downturn from participating in the recovery.
Vanguard Tax-Managed International Fund will no doubt undergo sharp highs and lows in the future, but our experience suggests that the best way to benefit from its ability to diversify a mix of all U.S. assets is to stick with such a fund through good times and bad. With its broad exposure to more than 20 developed countries, proven tax efficiency, and low costs, the Tax-Managed International Fund is designed to be a long-term core international equity holding.
Thank you, as always, for entrusting your assets to Vanguard.
Sincerely,

F. William McNabb III
President and Chief Executive Officer
July 21, 2009
Vanguard Europe Pacific ETF | ||||||||
Premium/Discount: July 20, 2007 1–June 30, 2009 |
|
| ||||||
|
|
|
|
|
| |||
| Market Price Above or | Market Price Below | ||||||
| Equal to Net Asset Value | Net Asset Value | ||||||
| Number | Percentage |
| Number | Percentage | |||
Basis Point Differential2 | of Days | of Total Days |
| of Days | of Total Days | |||
0–24.9 | 172 | 35.04% | 48 | 9.77% | ||||
25–49.9 | 167 | 34.01 | 13 | 2.65 | ||||
50–74.9 | 47 | 9.57 | 2 | 0.41 | ||||
75–100.0 | 15 | 3.05 | 3 | 0.61 | ||||
>100.0 | 21 | 4.28 | 3 | 0.61 | ||||
Total | 422 | 85.95% | 69 | 14.05% | ||||
1 Inception.
2 One basis point equals 1/100 of a percentage point.
6
Tax-Managed International Fund
Fund Profile
As of June 30, 2009
Portfolio Characteristics |
|
| |
|
| Comparative | Broad |
| Fund | Index1 | Index2 |
Number of Stocks | 946 | 957 | 1,791 |
Turnover Rate3 | 13% | — | — |
Expense Ratio4 |
| — | — |
Investor Shares | 0.20% |
|
|
Institutional Shares | 0.10% |
|
|
Europe Pacific |
|
|
|
ETF Shares | 0.16% |
|
|
Short-Term Reserves | 0.0% | — | — |
Volatility Measures5 |
| |
| Fund Versus | Fund Versus |
| Comparative Index1 | Broad Index2 |
R-Squared | 0.98 | 0.96 |
Beta | 1.02 | 0.94 |
Sector Diversification (% of equity exposure) | |||
|
| Comparative | Broad |
| Fund | Index1 | Index2 |
Consumer Discretionary | 10.1% | 10.0% | 8.5% |
Consumer Staples | 10.1 | 10.0 | 8.5 |
Energy | 8.7 | 8.7 | 11.5 |
Financials | 23.8 | 24.5 | 25.3 |
Health Care | 8.4 | 8.4 | 6.5 |
Industrials | 11.6 | 11.4 | 10.0 |
Information Technology | 5.3 | 5.2 | 6.6 |
Materials | 9.4 | 9.4 | 10.9 |
Telecommunication |
|
|
|
Services | 6.1 | 6.0 | 6.7 |
Utilities | 6.5 | 6.4 | 5.5 |
Ten Largest Holdings6 | (% of total net assets) | |
|
|
|
Royal Dutch Shell PLC | integrated oil |
|
| and gas | 1.9% |
BP PLC | integrated oil |
|
| and gas | 1.8 |
HSBC Holdings PLC | diversified banks | 1.7 |
BHP Billiton | diversified metals |
|
| and mining | 1.7 |
Nestle SA (Registered) | packaged foods |
|
| and meats | 1.7 |
Total SA | integrated oil |
|
| and gas | 1.4 |
Toyota Motor Corp. | automobile |
|
| manufacturers | 1.3 |
Vodafone Group PLC | wireless |
|
| telecommunication |
|
| services | 1.2 |
Banco Santander SA | diversified banks | 1.2 |
Telefonica SA | integrated |
|
| telecommunication |
|
| services | 1.2 |
Top Ten |
| 15.1% |
Fund Allocation by Region
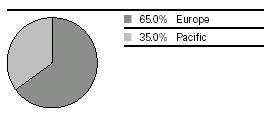
1 MSCI EAFE Index.
2 MSCI All Country World Index ex USA.
3 Annualized.
4 The expense ratios shown are from the prospectuses dated April 24, 2009, and represent estimated costs for the current fiscal year based on the fund’s net assets as of the prospectus date. For the six months ended June 30, 2009, the fund’s annualized expense ratios were 0.20% for Investor Shares, 0.10% for Institutional Shares, and 0.16% for Europe Pacific ETF Shares.
5 For an explanation of R-squared, beta, and other terms used here, see the Glossary.
6 The holdings listed exclude any temporary cash investments and equity index products.
7
Tax-Managed International Fund
Market Diversification (% of equity exposure) | |||
|
| Comparative | Broad |
| Fund | Index1 | Index2 |
Europe |
|
|
|
United Kingdom | 21.0% | 21.0% | 15.1% |
France | 10.4 | 10.4 | 7.4 |
Germany | 7.8 | 7.8 | 5.6 |
Switzerland | 7.5 | 7.4 | 5.3 |
Spain | 4.5 | 4.5 | 3.2 |
Italy | 3.6 | 3.5 | 2.5 |
Sweden | 2.4 | 2.4 | 1.7 |
Netherlands | 2.3 | 2.3 | 1.7 |
Finland | 1.3 | 1.3 | 0.9 |
Other European |
|
|
|
Markets | 4.2 | 4.0 | 2.9 |
Subtotal | 65.0% | 64.6% | 46.3% |
Pacific |
|
|
|
Japan | 24.1% | 24.1% | 17.4% |
Australia | 7.1 | 7.4 | 5.3 |
Hong Kong | 2.4 | 2.4 | 1.7 |
Singapore | 1.3 | 1.4 | 1.0 |
Other Pacific |
|
|
|
Markets | 0.1 | 0.1 | 0.1 |
Subtotal | 35.0% | 35.4% | 25.5% |
Emerging Markets |
|
|
|
Combined | — | — | 21.0% |
North America |
|
|
|
Canada | — | — | 7.2% |
1 MSCI EAFE Index.
2 MSCI All Country World Index ex USA.
8
Tax-Managed International Fund
Performance Summary
All of the returns in this report represent past performance, which is not a guarantee of future results that may be achieved by the fund. (Current performance may be lower or higher than the performance data cited. For performance data current to the most recent month-end, visit our website at www.vanguard.com/performance.) Note, too, that both investment returns and principal value can fluctuate widely, so an investor’s shares, when sold, could be worth more or less than their original cost. The returns shown do not reflect taxes that a shareholder would pay on fund distributions or on the sale of fund shares.
Fiscal-Year Total Returns (%): August 17, 1999–June 30, 2009
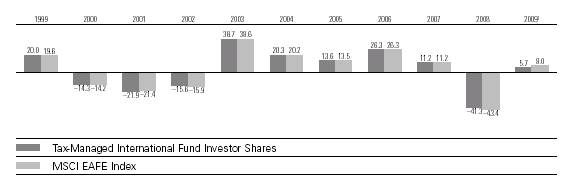
Average Annual Total Returns: Periods Ended June 30, 2009 | ||||
|
|
|
| Since |
| Inception Date | One Year | Five Years | Inception |
Tax-Managed International Fund |
|
|
|
|
Investor Shares2 | 8/17/1999 | –30.55% | 2.55% | 1.14% |
Fee-Adjusted Returns2,3 |
| –31.23 | 2.55 | 1.14 |
Institutional Shares | 1/4/2001 | –30.48 | 2.63 | 1.08 |
Fee-Adjusted Returns3 |
| –31.16 | 2.63 | 1.08 |
Europe Pacific ETF Shares | 7/20/2007 |
|
|
|
Market Price |
| –30.61 | –22.554 | — |
Net Asset Value |
| –30.51 | –22.524 | — |
1 Six months ended June 30, 2009.
2 Total returns do not include the account service fee that may be applicable to certain accounts with balances below $10,000.
3 Reflects the 1% fee assessed on redemptions of shares held in the fund for less than five years.
4 Return since inception.
Note: See Financial Highlights tables for dividend and capital gains information.
9
Tax-Managed International Fund
Financial Statements (unaudited)
Statement of Net Assets
As of June 30, 2009
The fund provides a complete list of its holdings four times in each fiscal year, at the quarter-ends. For the second and fourth fiscal quarters, the lists appear in the fund’s semiannual and annual reports to shareholders. For the first and third fiscal quarters, the fund files the lists with the Securities and Exchange Commission on Form N-Q. Shareholders can look up the fund’s Forms N-Q on the SEC’s website at www.sec.gov. Forms N-Q may also be reviewed and copied at the SEC’s Public Reference Room (see the back cover of this report for further information).
|
|
| Market |
|
|
| Value• |
|
| Shares | ($000) |
Common Stocks (100.0%) |
|
| |
Australia (7.1%) |
|
| |
| BHP Billiton Ltd. | 1,817,881 | 49,803 |
| Westpac Banking |
|
|
| Corp., Ltd. | 1,579,652 | 25,700 |
| Commonwealth Bank |
|
|
| of Australia | 807,030 | 25,297 |
| National Australia |
|
|
| Bank Ltd. | 1,042,733 | 18,786 |
| Australia & New Zealand |
|
|
| Bank Group Ltd. | 1,267,896 | 16,803 |
| Woolworths Ltd. | 668,966 | 14,193 |
| Wesfarmers Ltd. | 555,111 | 10,107 |
| Woodside Petroleum Ltd. | 266,834 | 9,218 |
| QBE Insurance Group Ltd. | 542,704 | 8,684 |
| CSL Ltd. | 331,567 | 8,573 |
| Telstra Corp. Ltd. | 2,502,263 | 6,828 |
| Newcrest Mining Ltd. | 267,469 | 6,537 |
| Rio Tinto Ltd. | 156,223 | 6,526 |
| Origin Energy Ltd. | 479,757 | 5,649 |
| Macquarie Group, Ltd. | 170,265 | 5,330 |
| Santos Ltd. | 450,746 | 5,281 |
| Foster’s Group Ltd. | 1,061,154 | 4,397 |
| AMP Ltd. | 1,103,173 | 4,322 |
| Suncorp-Metway Ltd. | 729,371 | 3,921 |
| Brambles Ltd. | 768,048 | 3,677 |
| Orica Ltd. | 205,713 | 3,580 |
* | Rio Tinto Ltd. Assimilation |
|
|
| Line Exp. 7/10/09 | 82,017 | 3,450 |
| Insurance Australia |
|
|
| Group Ltd. | 1,132,351 | 3,197 |
| Australian Stock |
|
|
| Exchange Ltd. | 95,823 | 2,847 |
| AGL Energy Ltd. | 248,439 | 2,688 |
* | Fortescue Metals |
|
|
| Group Ltd. | 730,105 | 2,213 |
| Transurban Group | 650,487 | 2,186 |
| Coca-Cola Amatil Ltd. | 311,733 | 2,160 |
| BlueScope Steel Ltd. | 1,054,412 | 2,138 |
| Tabcorp Holdings Ltd. | 367,608 | 2,116 |
| Sonic Healthcare Ltd. | 211,128 | 2,094 |
| Toll Holdings Ltd. | 411,909 | 2,067 |
| Amcor Ltd. | 486,162 | 1,955 |
| AXA Asia Pacific |
|
|
| Holdings Ltd. | 589,672 | 1,842 |
| Computershare Ltd. | 252,536 | 1,830 |
| Leighton Holdings Ltd. | 95,520 | 1,802 |
| WorleyParsons Ltd. | 93,251 | 1,777 |
| Incitec Pivot Ltd. | 914,912 | 1,741 |
| Sims Metal |
|
|
| Management Ltd. | 82,351 | 1,715 |
| Wesfarmers, Ltd. Price |
|
|
| Protected Shares | 89,092 | 1,684 |
| Lend Lease Corp. | 292,060 | 1,644 |
| Alumina Ltd. | 1,429,514 | 1,643 |
| OneSteel Ltd. | 792,860 | 1,639 |
| Lion Nathan Ltd. | 173,130 | 1,613 |
| Tatt’s Group, Ltd. | 780,472 | 1,599 |
| Crown Ltd. | 272,374 | 1,587 |
| Metcash Ltd. | 439,832 | 1,527 |
| Cochlear Ltd. | 32,311 | 1,500 |
| OZ Minerals Ltd. | 1,836,070 | 1,346 |
| John Fairfax |
|
|
| Holdings Ltd. | 1,331,301 | 1,305 |
* | Paladin Resources Ltd. | 331,448 | 1,303 |
| CSR Ltd. | 913,977 | 1,243 |
| Qantas Airways Ltd. | 756,688 | 1,225 |
| Boral Ltd. | 342,576 | 1,118 |
| James Hardie |
|
|
| Industries NV | 314,399 | 1,061 |
| Bendigo Bank Ltd. | 179,420 | 1,003 |
| Caltex Australia Ltd. | 87,967 | 977 |
* | Arrow Energy, Ltd. | 342,156 | 972 |
| Harvey Norman |
|
|
| Holdings Ltd. | 318,112 | 843 |
| Macquarie Airports Group | 448,081 | 833 |
| Aristocrat Leisure Ltd. | 271,968 | 829 |
| Goodman Fielder Ltd. | 764,091 | 802 |
| Energy Resources of |
|
|
| Australia Ltd. | 41,822 | 785 |
| Nufarm Ltd. | 105,067 | 775 |
10
Tax-Managed International Fund
|
|
| Market |
|
|
| Value• |
|
| Shares | ($000) |
| Perpetual Trustees |
|
|
| Australia Ltd. | 31,080 | 713 |
| Billabong International Ltd. | 96,767 | 680 |
| SP Ausnet | 761,512 | 472 |
| Sims Metal |
|
|
| Management Ltd. ADR | 3,072 | 63 |
|
|
| 315,814 |
Austria (0.3%) |
|
| |
| OMV AG | 83,351 | 3,134 |
| Telekom Austria AG | 179,724 | 2,814 |
| Erste Bank der |
|
|
| Oesterreichischen |
|
|
| Sparkassen AG | 101,745 | 2,762 |
| Oesterreichische |
|
|
| Elektrizitaetswirtschafts |
|
|
| AG Class A | 44,973 | 2,294 |
| Voestalpine AG | 59,370 | 1,635 |
| Raiffeisen International |
|
|
| Bank-Holding AG | 34,899 | 1,218 |
| Vienna Insurance Group | 25,433 | 1,109 |
|
|
| 14,966 |
Belgium (0.9%) |
|
| |
| Anheuser-Busch InBev NV | 393,088 | 14,253 |
* | Fortis | 1,240,403 | 4,247 |
| Delhaize Group | 56,182 | 3,955 |
| Solvay SA | 33,499 | 2,834 |
| Belgacom SA | 84,990 | 2,718 |
* | Dexia | 298,244 | 2,277 |
| Colruyt NV | 8,671 | 1,981 |
| UCB SA | 58,614 | 1,882 |
* | KBC Bank & |
|
|
| Verzekerings Holding | 90,623 | 1,667 |
| Umicore | 67,294 | 1,534 |
| Mobistar SA | 19,455 | 1,201 |
|
|
| 38,549 |
Denmark (0.9%) |
|
| |
| Novo Nordisk A/S B Shares | 247,288 | 13,469 |
* | Vestas Wind Systems A/S | 108,849 | 7,812 |
* | Danske Bank A/S | 250,280 | 4,318 |
| AP Moller-Maersk A/S |
|
|
| B Shares | 636 | 3,811 |
| Carlsberg A/S B Shares | 56,461 | 3,622 |
| Novozymes A/S | 24,024 | 1,954 |
| AP Moller-Maersk A/S |
|
|
| A Shares | 286 | 1,676 |
* | DSV A/S | 91,750 | 1,138 |
* | Topdanmark A/S | 8,260 | 965 |
| Coloplast A/S B Shares | 10,725 | 737 |
* | William Demant A/S | 14,200 | 735 |
| Trygvesta A/S | 9,805 | 578 |
| H. Lundbeck A/S | 28,600 | 544 |
|
|
| 41,359 |
Finland (1.3%) |
|
| |
| Nokia Oyj | 2,056,107 | 30,116 |
| Fortum Oyj | 243,179 | 5,543 |
| Sampo Oyj A Shares | 235,810 | 4,459 |
| Kone Oyj | 93,346 | 2,866 |
| UPM-Kymmene Oyj | 296,061 | 2,584 |
* | Stora Enso Oyj R Shares | 336,005 | 1,777 |
| Wartsila Oyj B Shares | 47,275 | 1,526 |
| Outokumpu Oyj A Shares | 71,000 | 1,227 |
| Metso Oyj | 64,740 | 1,212 |
| Nokian Renkaat Oyj | 64,248 | 1,209 |
| Neste Oil Oyj | 86,058 | 1,198 |
| Kesko Oyj | 39,860 | 1,056 |
| Elisa Oyj Class A | 62,893 | 1,036 |
| Rautaruuki Oyj | 50,770 | 1,018 |
| Sanoma Oyj | 49,950 | 775 |
| Pohjola Bank PLC | 91,130 | 730 |
| Orion Oyj | 31,800 | 499 |
|
|
| 58,831 |
France (10.5%) |
|
| |
| Total SA | 1,151,775 | 62,427 |
| Sanofi-Aventis | 567,929 | 33,559 |
| BNP Paribas SA | 451,989 | 29,475 |
| GDF Suez | 650,548 | 24,352 |
| France Telecom SA | 982,960 | 22,366 |
| Axa | 841,888 | 15,934 |
| ArcelorMittal |
|
|
| (Amsterdam Shares) | 465,267 | 15,397 |
| Vivendi SA | 628,243 | 15,080 |
| Groupe Danone | 294,645 | 14,610 |
| Carrefour SA | 340,597 | 14,607 |
| Societe Generale Class A | 251,866 | 13,825 |
| Air Liquide SA | 134,006 | 12,296 |
| Vinci SA | 228,726 | 10,321 |
| LVMH Louis Vuitton |
|
|
| Moet Hennessy | 132,094 | 10,131 |
| L’Oreal SA | 130,212 | 9,774 |
| Schneider Electric SA | 124,844 | 9,555 |
| Cie. de St. Gobain SA | 200,983 | 6,763 |
| Pernod Ricard SA | 105,923 | 6,697 |
| Unibail Co. | 44,290 | 6,622 |
| Alstom | 109,216 | 6,485 |
| Electricite de France | 127,250 | 6,213 |
| Veolia Environnement | 205,923 | 6,088 |
| Credit Agricole SA | 484,975 | 6,081 |
* | Lafarge SA | 79,167 | 5,386 |
| Essilor International SA | 109,922 | 5,257 |
| Bouygues SA | 122,437 | 4,630 |
| Compagnie Generale |
|
|
| des Etablissements |
|
|
| Michelin SA | 79,648 | 4,562 |
| Hermes International | 27,839 | 3,876 |
* | Renault SA | 101,901 | 3,765 |
| Vallourec SA | 29,591 | 3,617 |
| European Aeronautic |
|
|
| Defence and Space Co. | 214,982 | 3,491 |
| PPR | 41,989 | 3,442 |
* | Alcatel-Lucent | 1,282,299 | 3,216 |
| Accor SA | 79,011 | 3,148 |
11
Tax-Managed International Fund
|
|
| Market |
|
|
| Value• |
|
| Shares | ($000) |
| Cap Gemini SA | 80,718 | 2,987 |
| STMicroelectronics NV | 379,640 | 2,862 |
| SES Global Fiduciary |
|
|
| Depositary Receipts | 148,861 | 2,847 |
| Technip SA | 57,672 | 2,844 |
| Suez Environnement SA | 150,280 | 2,634 |
| Sodexho Alliance SA | 49,308 | 2,539 |
| Christian Dior SA | 33,416 | 2,503 |
| Thales SA | 50,156 | 2,252 |
* | PSA Peugeot Citroen | 83,926 | 2,216 |
| Lagardere S.C.A. | 66,387 | 2,213 |
| Publicis Groupe SA | 65,868 | 2,017 |
| CNP Assurances | 20,954 | 2,005 |
* | Lafarge SA Assimilation |
|
|
| Line Exp. 7/1/09 | 29,568 | 1,936 |
| SCOR SA | 91,445 | 1,879 |
| Casino Guichard-Perrachon |
|
|
| SA | 27,698 | 1,876 |
| Dassault Systemes SA | 37,152 | 1,645 |
* | Compagnie Generale de |
|
|
| Geophysique SA | 81,727 | 1,479 |
| Safran SA | 108,100 | 1,432 |
| Neopost SA | 15,874 | 1,429 |
| Bureau Veritas SA | 27,740 | 1,366 |
| Klepierre | 51,062 | 1,323 |
| Eutelsat Communications | 50,173 | 1,299 |
| Eiffage SA | 20,978 | 1,226 |
| Legrand SA | 53,072 | 1,161 |
| Aeroports de Paris (ADP) | 14,824 | 1,090 |
| Fonciere Des Regions | 13,505 | 1,018 |
| Air France | 78,294 | 1,004 |
* | Natixis | 502,167 | 977 |
| ICADE | 11,641 | 958 |
| Atos Origin SA | 26,536 | 904 |
| Eramet SLN | 3,106 | 816 |
�� | Societe Television |
|
|
| Francaise 1 | 69,220 | 780 |
* | Iliad SA | 8,006 | 779 |
| M6 Metropole Television | 39,238 | 744 |
| Societe des Autoroutes |
|
|
| Paris-Rhin-Rhone | 10,817 | 738 |
| Societe BIC SA | 12,790 | 736 |
| Biomerieux SA | 8,270 | 727 |
| PagesJaunes SA | 73,296 | 715 |
| Gecina SA | 10,981 | 681 |
| Ipsen Promesses | 14,062 | 616 |
* | Imerys SA | 14,077 | 592 |
* | JCDecaux SA | 32,125 | 511 |
* | Imerys SA Assimilation |
|
|
| Line Exp. 7/2/09 | 2,236 | 85 |
|
|
| 465,489 |
Germany (7.9%) |
|
| |
| E.On AG | 1,018,600 | 36,158 |
| Siemens AG | 444,569 | 30,743 |
| Allianz AG | 245,087 | 22,608 |
| Bayer AG | 408,373 | 21,946 |
| BASF AG | 499,475 | 19,900 |
| SAP AG | 464,530 | 18,729 |
| Deutsche Bank AG | 302,515 | 18,390 |
| Deutsche Telekom AG | 1,522,350 | 17,998 |
| RWE AG | 226,732 | 17,880 |
| Daimler AG (Registered) | 488,392 | 17,736 |
| Volkswagen AG | 47,911 | 16,232 |
| Muenchener |
|
|
| Rueckversicherungs- |
|
|
| Gesellschaft |
|
|
| AG (Registered) | 111,904 | 15,119 |
| Deutsche Boerse AG | 106,229 | 8,267 |
| Bayerische Motoren Werke |
|
|
| AG | 180,706 | 6,826 |
| Linde AG | 82,745 | 6,798 |
| Deutsche Post AG | 461,112 | 6,021 |
| Fresenius Medical Care AG | 105,027 | 4,720 |
| K&S AG | 81,297 | 4,586 |
| ThyssenKrupp AG | 182,408 | 4,544 |
| Adidas AG | 106,680 | 4,065 |
| Volkswagen AG Pfd. | 57,973 | 4,057 |
| Merck KGaA | 35,697 | 3,632 |
| Man AG | 58,401 | 3,593 |
| Porsche AG | 48,533 | 3,267 |
| Henkel AG & Co. KGaA | 98,894 | 3,088 |
| Metro AG | 61,983 | 2,961 |
* | Commerzbank AG | 392,944 | 2,450 |
| Fresenius AG Pfd. | 44,899 | 2,429 |
| Beiersdorf AG | 49,187 | 2,317 |
* | Qiagen NV | 110,769 | 2,057 |
| Henkel KGaA | 73,315 | 1,978 |
| Salzgitter AG | 22,068 | 1,945 |
| Deutsche Lufthansa AG | 112,909 | 1,418 |
* | Deutsche Postbank AG | 50,711 | 1,293 |
* | Hannover |
|
|
| Rueckversicherung AG | 34,350 | 1,270 |
| RWE AG Pfd. | 18,989 | 1,268 |
| GEA Group AG | 79,400 | 1,206 |
| Solarworld AG | 48,462 | 1,147 |
| Celesio AG | 49,891 | 1,146 |
| Wacker Chemie AG | 8,832 | 1,020 |
| Fraport AG | 21,984 | 943 |
| Hochtief AG | 17,177 | 867 |
* | United Internet AG | 72,469 | 851 |
| Suedzucker AG | 38,094 | 772 |
| Bayerische Motoren Werke |
|
|
| (BMW) | 31,763 | 767 |
| Fresenius AS | 16,240 | 760 |
| Puma AG | 2,945 | 645 |
* | TUI AG | 83,695 | 618 |
| Hamburger Hafen |
|
|
| und Logistik AG | 15,444 | 597 |
|
|
| 349,628 |
12
Tax-Managed International Fund
|
|
| Market |
|
|
| Value• |
|
| Shares | ($000) |
Greece (0.6%) |
|
| |
* | National Bank of Greece |
|
|
| SA ADR | 1,232,339 | 6,766 |
| Greek Organization of |
|
|
| Football Prognostics | 112,472 | 2,999 |
| Hellenic |
|
|
| Telecommunications |
|
|
| Organization SA ADR | 289,218 | 2,212 |
* | Alpha Credit Bank SA | 188,348 | 2,062 |
| Coca-Cola Hellenic |
|
|
| Bottling Co. SA | 94,980 | 1,958 |
| Bank of Cyprus |
|
|
| Public Co. Ltd. | 289,417 | 1,635 |
* | EFG Eurobank Ergasias | 152,971 | 1,609 |
* | Bank of Piraeus | 157,753 | 1,571 |
| Marfin Financial Group SA | 338,142 | 1,451 |
| Public Power Corp. | 58,860 | 1,214 |
* | National Bank of Greece SA | 24,024 | 666 |
| Titan Cement Co. SA | 22,380 | 591 |
| Hellenic Petroleum SA | 43,410 | 420 |
| Hellenic |
|
|
| Telecommunications |
|
|
| Organization SA | 21,242 | 325 |
|
|
| 25,479 |
Hong Kong (2.4%) |
|
| |
| Sun Hung Kai |
|
|
| Properties Ltd. | 770,064 | 9,562 |
| Cheung Kong Holdings Ltd. | 758,500 | 8,673 |
| Hong Kong Exchanges |
|
|
| & Clearing Ltd. | 558,100 | 8,626 |
| Hutchison Whampoa Ltd. | 1,176,512 | 7,653 |
| CLP Holdings Ltd. | 1,137,432 | 7,537 |
| Hang Seng Bank Ltd. | 421,743 | 5,903 |
| Hong Kong |
|
|
| & China Gas Co., Ltd. | 2,249,433 | 4,722 |
| Hong Kong Electric |
|
|
| Holdings Ltd. | 788,600 | 4,381 |
| Swire Pacific Ltd. |
|
|
| A Shares | 424,088 | 4,257 |
| Hang Lung Properties Ltd. | 1,147,810 | 3,780 |
| Boc Hong Kong |
|
|
| Holdings Ltd. | 2,093,500 | 3,642 |
| Henderson Land |
|
|
| Development Co. Ltd. | 624,006 | 3,561 |
| Esprit Holdings Ltd. | 618,472 | 3,436 |
| Wharf Holdings Ltd. | 765,741 | 3,229 |
| Li & Fung Ltd. | 1,206,835 | 3,222 |
| New World |
|
|
| Development Co., Ltd. | 1,416,750 | 2,550 |
| Bank of East Asia Ltd. | 823,063 | 2,494 |
| MTR Corp. | 738,000 | 2,205 |
| Hang Lung |
|
|
| Development Co., Ltd. | 457,000 | 2,138 |
| Kerry Properties Ltd. | 406,500 | 1,771 |
| Sino Land Co. | 973,000 | 1,602 |
| Wheelock and Co. Ltd. | 542,000 | 1,393 |
| Shangri-La Asia Ltd. | 758,510 | 1,120 |
| Hopewell Holdings Ltd. | 348,000 | 1,087 |
| Hysan Development |
|
|
| Co., Ltd. | 385,000 | 986 |
| Wing Hang Bank Ltd. | 109,500 | 956 |
* | Foxconn International |
|
|
| Holdings Ltd. | 1,268,000 | 824 |
| Cathay Pacific Airways Ltd. | 575,770 | 790 |
| Cheung Kong |
|
|
| Infrastructure |
|
|
| Holdings Ltd. | 220,000 | 771 |
| Yue Yuen Industrial |
|
|
| (Holdings) Ltd. | 318,000 | 748 |
| NWS Holdings Ltd. | 404,000 | 727 |
| PCCW Ltd. | 2,400,000 | 625 |
| Television Broadcasts Ltd. | 133,000 | 533 |
| ASM Pacific |
|
|
| Technology Ltd. | 90,300 | 462 |
| Orient Overseas |
|
|
| International Ltd. | 96,800 | 411 |
| Lifestyle International |
|
|
| Holdings, Ltd. | 247,000 | 341 |
| Hong Kong Aircraft |
|
|
| & Engineering Co., Ltd. | 28,800 | 335 |
|
|
| 107,053 |
Ireland (0.3%) |
|
| |
| CRH PLC | 367,242 | 8,441 |
| Kerry Group PLC A Shares | 89,234 | 2,034 |
* | Elan Corp. PLC | 297,780 | 1,955 |
* | Ryanair Holdings PLC | 132,767 | 614 |
| Anglo Irish Bank Corp. PLC | 257,065 | 78 |
|
|
| 13,122 |
Italy (3.6%) |
|
| |
| Eni SpA | 1,406,422 | 33,356 |
* | UniCredit SpA | 7,799,456 | 19,727 |
| Enel SpA | 3,564,222 | 17,400 |
* | Intesa Sanpaolo SpA | 4,176,261 | 13,496 |
| Assicurazioni Generali |
|
|
| SpA | 574,072 | 11,956 |
| Telecom Italia SpA | 5,475,680 | 7,592 |
* | Fiat SpA | 420,548 | 4,241 |
| Unione di Banche Italiane |
|
|
| SpA | 313,159 | 4,081 |
| Saipem SpA | 146,122 | 3,570 |
| Tenaris S.A. | 259,936 | 3,546 |
| Snam Rete Gas SpA | 795,983 | 3,497 |
| Telecom Italia SpA RNC | 3,345,279 | 3,296 |
| Finmeccanica SpA | 224,914 | 3,172 |
| Mediobanca Banca di |
|
|
| Credito Finanziaria SpA | 249,997 | 2,979 |
| Atlantia SpA | 143,311 | 2,903 |
* | Banco Popolare SpA | 355,148 | 2,656 |
| Terna SpA | 726,542 | 2,423 |
| Parmalat SpA | 928,001 | 2,241 |
| Mediaset SpA | 391,387 | 2,197 |
13
Tax-Managed International Fund
|
|
| Market |
|
|
| Value• |
|
| Shares | ($000) |
| Banca Monte dei Paschi |
|
|
| di Siena SpA | 1,231,397 | 1,990 |
| Alleanza Assicurazioni |
|
|
| SpA | 238,074 | 1,636 |
| Banca Popolare di Milano |
|
|
| SpA | 226,615 | 1,352 |
| Intesa Sanpaolo SpA |
|
|
| Non Convertible Risp. | 529,860 | 1,310 |
* | Luxottica Group SpA | 52,123 | 1,084 |
| Banca Carige SpA | 368,005 | 1,011 |
| A2A SpA | 469,279 | 858 |
| Mediolanum SpA | 134,176 | 717 |
| Exor SpA | 43,385 | 624 |
| Fondiari-Sai SpA | 38,602 | 623 |
* | Pirelli & C. Accomandita |
|
|
| per Azioni SpA | 1,579,415 | 554 |
| Lottomatica SpA | 28,531 | 551 |
| Autogrill SpA | 63,112 | 533 |
* | Unipol Gruppo |
|
|
| Finanziario SpA | 451,536 | 530 |
| Prysmian SpA | 34,079 | 514 |
| Italcementi SpA | 44,378 | 508 |
| ACEA SpA | 40,659 | 497 |
| Saras SpA Raffinerie Sarde | 168,945 | 482 |
* | Unione di Banche Italiane |
|
|
| SpA Warrants Exp. 6/30/11 | 83,809 | 6 |
|
|
| 159,709 |
Japan (24.1%) |
|
| |
| Toyota Motor Corp. | 1,488,487 | 56,291 |
| Mitsubishi UFJ |
|
|
| Financial Group | 5,045,039 | 31,152 |
| Honda Motor Co., Ltd. | 890,900 | 24,509 |
| Sumitomo Mitsui |
|
|
| Financial Group, Inc. | 487,940 | 19,745 |
| Canon, Inc. | 577,233 | 18,855 |
| Tokyo Electric Power Co. | 655,570 | 16,856 |
| Takeda |
|
|
| Pharmaceutical Co. Ltd. | 407,694 | 15,851 |
| Nintendo Co. | 54,200 | 15,000 |
| Matsushita Electric |
|
|
| Industrial Co., Ltd. | 1,055,153 | 14,216 |
| Sony Corp. | 543,800 | 14,187 |
| Mitsubishi Corp. | 728,650 | 13,446 |
| NTT DoCoMo, Inc. | 8,571 | 12,536 |
| Mizuho |
|
|
| Financial Group, Inc. | 5,167,000 | 12,005 |
| Nippon Telegraph and |
|
|
| Telephone Corp. | 278,700 | 11,350 |
| Nomura Holdings Inc. | 1,340,300 | 11,313 |
| Mitsui & Co., Ltd. | 939,000 | 11,127 |
| East Japan Railway Co. | 183,100 | 11,024 |
| Nippon Steel Corp. | 2,842,970 | 10,884 |
| Millea Holdings, Inc. | 388,700 | 10,672 |
| Mitsubishi |
|
|
| Estate Co., Ltd. | 634,935 | 10,541 |
Shin-Etsu Chemical |
|
|
Co., Ltd. | 218,000 | 10,111 |
Seven and I Holdings |
|
|
Co., Ltd. | 420,020 | 9,851 |
Kansai Electric Power |
|
|
Co., Inc. | 419,550 | 9,255 |
JFE Holdings, Inc. | 268,500 | 9,021 |
Astellas Pharma Inc. | 247,614 | 8,744 |
Fanuc Co., Ltd. | 105,600 | 8,462 |
KDDI Corp. | 1,586 | 8,415 |
Chubu Electric Power Co. | 363,200 | 8,388 |
Fuji Photo Film Co., Ltd. | 259,200 | 8,249 |
Softbank Corp. | 420,800 | 8,198 |
Mitsui Fudosan Co., Ltd. | 472,000 | 8,186 |
Nissan Motor Co., Ltd. | 1,330,500 | 8,075 |
Komatsu Ltd. | 507,300 | 7,832 |
Japan Tobacco, Inc. | 2,451 | 7,661 |
Toshiba Corp. | 2,099,000 | 7,605 |
Mitsubishi Electric Corp. | 1,092,000 | 6,902 |
Mitsubishi Heavy |
|
|
Industries Ltd. | 1,666,000 | 6,894 |
Kyocera Corp. | 89,300 | 6,704 |
Denso Corp. | 261,100 | 6,693 |
Daiichi Sankyo Co., Ltd. | 366,363 | 6,539 |
Sumitomo Corp. | 620,300 | 6,305 |
Kirin Brewery Co., Ltd. | 449,000 | 6,264 |
Kao Corp. | 281,401 | 6,123 |
Mitsui Sumitomo |
|
|
Insurance Group |
|
|
Holdings, Inc. | 226,464 | 5,924 |
Itochu Corp. | 842,000 | 5,843 |
Sharp Corp. | 556,000 | 5,768 |
Hitachi Ltd. | 1,827,000 | 5,686 |
Fujitsu Ltd. | 1,018,000 | 5,530 |
Central Japan Railway Co. | 873 | 5,367 |
Bridgestone Corp. | 339,031 | 5,311 |
Kubota Corp. | 626,000 | 5,155 |
Sumitomo Metal |
|
|
Industries Ltd. | 1,915,000 | 5,091 |
Murata Manufacturing |
|
|
Co., Ltd. | 117,700 | 5,023 |
Eisai Co., Ltd. | 141,400 | 5,020 |
Tohoku Electric Power Co. | 235,100 | 4,911 |
Keyence Corp. | 23,608 | 4,810 |
Secom Co., Ltd. | 117,000 | 4,749 |
Ricoh Co. | 367,000 | 4,728 |
Sumitomo Electric |
|
|
Industries Ltd. | 419,300 | 4,701 |
Tokyo Electron Ltd. | 96,500 | 4,657 |
Hoya Corp. | 230,500 | 4,617 |
Kyushu Electric Power |
|
|
Co., Inc. | 208,500 | 4,487 |
Tokyo Gas Co., Ltd. | 1,256,000 | 4,487 |
Asahi Glass Co., Ltd. | 559,035 | 4,478 |
Suzuki Motor Corp. | 194,600 | 4,363 |
14
Tax-Managed International Fund
|
|
| Market |
|
|
| Value• |
|
| Shares | ($000) |
| Sumitomo Trust & |
|
|
| Banking Co., Ltd. | 811,000 | 4,352 |
* | NEC Corp. | 1,088,400 | 4,257 |
| Terumo Corp. | 96,100 | 4,237 |
| Nippon Oil Corp. | 719,000 | 4,234 |
| Dai-Nippon Printing |
|
|
| Co., Ltd. | 308,200 | 4,220 |
| Marubeni Corp. | 947,000 | 4,188 |
| Mitsui OSK Lines Ltd. | 646,000 | 4,175 |
| Daikin Industries Ltd. | 129,600 | 4,171 |
| Daiwa Securities Group Inc. | 696,000 | 4,136 |
| Rohm Co., Ltd. | 56,400 | 4,114 |
| Sumitomo Chemical Co. | 914,000 | 4,110 |
| Sumitomo Metal |
|
|
| Mining Co. | 289,000 | 4,060 |
| Resona Holdings Inc. | 283,500 | 3,974 |
| Kintetsu Corp. | 896,190 | 3,950 |
| Toray Industries, Inc. | 772,000 | 3,930 |
| Inpex Holdings, Inc. | 489 | 3,899 |
| Sumitomo Realty & |
|
|
| Development Co. | 211,000 | 3,853 |
| Nidec Corp. | 60,200 | 3,664 |
| Aeon Co., Ltd. | 362,573 | 3,577 |
| Bank of Yokohama Ltd. | 668,000 | 3,576 |
| Osaka Gas Co., Ltd. | 1,100,000 | 3,506 |
| Fast Retailing Co., Ltd. | 26,700 | 3,480 |
| T & D Holdings, Inc. | 119,840 | 3,424 |
* | Mitsubishi Motors Corp. | 1,808,000 | 3,388 |
| Shiseido Co., Ltd. | 204,000 | 3,337 |
| Shizuoka Bank Ltd. | 333,000 | 3,296 |
| Asahi Kasei Corp. | 649,000 | 3,293 |
| Sompo Japan Insurance Inc. | 494,000 | 3,292 |
| Toppan Printing Co., Ltd. | 323,000 | 3,254 |
| Daiwa House Industry |
|
|
| Co., Ltd. | 302,000 | 3,247 |
| Tokyu Corp. | 643,000 | 3,244 |
| West Japan Railway Co. | 979 | 3,238 |
| SMC Corp. | 29,900 | 3,210 |
| Odakyu Electric Railway Co. | 374,000 | 3,197 |
| TDK Corp. | 68,000 | 3,192 |
| Shionogi & Co., Ltd. | 164,000 | 3,169 |
| Yamato Holdings Co., Ltd. | 234,000 | 3,111 |
| Nikon Corp. | 178,000 | 3,079 |
| Chugoku Electric Power |
|
|
| Co., Ltd. | 146,600 | 3,061 |
| Yamada Denki Co., Ltd. | 52,200 | 3,037 |
| Chiba Bank Ltd. | 460,000 | 3,002 |
| Hankyu Corp. | 634,304 | 2,970 |
| Asahi Breweries Ltd. | 204,400 | 2,929 |
| Ajinomoto Co., Inc. | 369,000 | 2,919 |
| Mitsubishi Chemical |
|
|
| Holdings Corp. | 682,000 | 2,885 |
| Shikoku Electric Power | 96,300 | 2,872 |
| Nitto Denko Corp. | 93,800 | 2,860 |
| NGK Insulators Ltd. | 140,000 | 2,853 |
| Konica Minolta |
|
|
| Holdings, Inc. | 271,000 | 2,832 |
| Olympus Corp. | 120,000 | 2,826 |
| Tobu Railway Co., Ltd. | 478,000 | 2,806 |
| Yahoo Japan Corp. | 8,743 | 2,781 |
| Nippon Yusen Kabushiki |
|
|
| Kaisha Co. | 634,000 | 2,730 |
| Nippon Mining |
|
|
| Holdings Inc. | 507,000 | 2,620 |
* | Sanyo Electric Co., Ltd. | 1,006,000 | 2,605 |
| Kobe Steel Ltd. | 1,387,000 | 2,583 |
| Sekisui House Ltd. | 251,859 | 2,551 |
| Aisin Seiki Co., Ltd. | 118,000 | 2,549 |
| Chugai Pharmaceutical |
|
|
| Co., Ltd. | 131,200 | 2,497 |
| NTT Data Corp. | 764 | 2,466 |
| JS Group Corp. | 158,512 | 2,446 |
| Kawasaki Heavy |
|
|
| Industries Ltd. | 887,000 | 2,443 |
| Nippon Electric Glass |
|
|
| Co., Ltd. | 209,500 | 2,342 |
| Nippon Express Co., Ltd. | 515,000 | 2,338 |
| Japan Steel Works Ltd. | 186,513 | 2,299 |
| Kuraray Co., Ltd. | 206,000 | 2,284 |
| Rakuten, Inc. | 3,763 | 2,267 |
| Hokuriku Electric Power Co. | 98,400 | 2,250 |
| Daito Trust Construction |
|
|
| Co., Ltd. | 47,500 | 2,240 |
| Mitsui Trust Holding Inc. | 580,100 | 2,210 |
| Electric Power |
|
|
| Development Co., Ltd. | 75,640 | 2,146 |
| OJI Paper Co., Ltd. | 494,000 | 2,122 |
| Toyota Tsusho Corp. | 138,493 | 2,051 |
| SBI Holdings, Inc. | 10,093 | 2,050 |
| Isetan Mitsukoshi |
|
|
| Holdings Ltd. | 198,240 | 2,017 |
| Nipponkoa Insurance |
|
|
| Co., Ltd. | 342,000 | 1,990 |
| Mitsubishi Materials Corp. | 637,000 | 1,983 |
| Dentsu Inc. | 94,500 | 1,983 |
| Ono Pharmaceutical |
|
|
| Co., Ltd. | 44,500 | 1,974 |
| Ibiden Co., Ltd. | 70,200 | 1,968 |
| JSR Corp. | 114,500 | 1,961 |
| Hokuhoku Financial |
|
|
| Group, Inc. | 776,100 | 1,945 |
| Hokkaido Electric Power |
|
|
| Co., Ltd. | 103,400 | 1,936 |
| Ohbayashi Corp. | 394,000 | 1,929 |
| Keihin Electric Express |
|
|
| Railway Co., Ltd. | 247,000 | 1,915 |
| Stanley Electric Co. | 94,200 | 1,910 |
| Joyo Bank Ltd. | 371,000 | 1,893 |
| Keio Electric Railway |
|
|
| Co., Ltd. | 325,000 | 1,888 |
| Trend Micro Inc. | 59,000 | 1,884 |
15
Tax-Managed International Fund
|
|
| Market |
|
|
| Value• |
|
| Shares | ($000) |
| JGC Corp. | 116,000 | 1,867 |
| Kurita Water Industries Ltd. | 57,600 | 1,860 |
| Benesse Holdings, Inc. | 46,100 | 1,849 |
| Bank of Kyoto Ltd. | 199,000 | 1,844 |
| Toyo Seikan Kaisha Ltd. | 86,400 | 1,828 |
| Oriental Land Co., Ltd. | 27,000 | 1,810 |
| Hirose Electric Co., Ltd. | 16,900 | 1,803 |
| Teijin Ltd. | 558,000 | 1,794 |
| Furukawa Electric Co. | 398,000 | 1,790 |
| Omron Corp. | 123,500 | 1,789 |
| Fukuoka Financial |
|
|
| Group, Inc. | 398,800 | 1,784 |
| Matsushita Electric |
|
|
| Works, Ltd. | 184,000 | 1,739 |
| Sekisui Chemical Co. | 274,000 | 1,718 |
| Kajima Corp. | 541,000 | 1,684 |
| Shimizu Corp. | 385,000 | 1,671 |
| Advantest Corp. | 91,100 | 1,659 |
| Kyowa Hakko Kogyo Co. | 147,000 | 1,658 |
| TonenGeneral Sekiyu K.K. | 160,000 | 1,628 |
| Sankyo Co., Ltd. | 30,500 | 1,627 |
| Lawson Inc. | 36,900 | 1,624 |
| Uni-Charm Corp. | 21,200 | 1,620 |
| Makita Corp. | 65,600 | 1,587 |
| Takashimaya Co. | 186,860 | 1,471 |
| Tanabe Seiyaku Co., Ltd. | 128,000 | 1,471 |
| Yamaha Motor Co., Ltd. | 131,600 | 1,462 |
| Casio Computer Co. | 162,500 | 1,455 |
| Sega Sammy Holdings Inc. | 114,188 | 1,447 |
| NSK Ltd. | 285,000 | 1,443 |
* | IHI Corp. | 834,000 | 1,441 |
| Ube Industries Ltd. | 511,000 | 1,426 |
| Yamaguchi Financial |
|
|
| Group, Inc. | 108,000 | 1,424 |
| Taisei Corp. | 590,000 | 1,422 |
| Sumitomo Heavy |
|
|
| Industries Ltd. | 319,000 | 1,419 |
| Mazda Motor Corp. | 551,000 | 1,409 |
| The Hiroshima Bank, Ltd. | 337,200 | 1,405 |
| Nippon Paper Group, Inc. | 54,100 | 1,400 |
| Kawasaki Kisen Kaisha Ltd. | 341,000 | 1,399 |
* | GS Yuasa Corp. | 158,000 | 1,386 |
| Nippon Sanso Corp. | 144,000 | 1,376 |
| Nitori Co., Ltd. | 19,300 | 1,367 |
| Amada Co., Ltd. | 218,000 | 1,351 |
| 77 Bank Ltd. | 230,000 | 1,339 |
| Namco Bandai Holdings Inc. | 122,000 | 1,338 |
| All Nippon Airways Co., Ltd. | 380,000 | 1,328 |
| Nomura Research |
|
|
| Institute, Ltd. | 59,700 | 1,323 |
| JTEKT Corp. | 130,200 | 1,316 |
| Shimano, Inc. | 34,200 | 1,314 |
| Sojitz Holdings Corp. | 591,700 | 1,298 |
| The Hachijuni Bank Ltd. | 229,600 | 1,297 |
| Nippon Sheet Glass |
|
|
| Co., Ltd. | 444,000 | 1,294 |
| Gunma Bank Ltd. | 228,000 | 1,268 |
| Fuji Heavy Industries Ltd. | 312,000 | 1,261 |
| The Iyo Bank, Ltd. | 123,000 | 1,254 |
* | MEIJI Holdings Co., Ltd. | 30,654 | 1,235 |
| The Chugoku Bank, Ltd. | 89,000 | 1,234 |
| Nissin Food Products |
|
|
| Co., Ltd. | 40,600 | 1,228 |
| Tokyo Tatemono Co., Ltd. | 219,000 | 1,220 |
| Mitsubishi Gas |
|
|
| Chemical Co. | 223,000 | 1,216 |
| Tokyu Land Corp. | 264,000 | 1,199 |
| Toho Co., Ltd. | 73,600 | 1,197 |
| Toto Ltd. | 170,000 | 1,186 |
| The Suruga Bank, Ltd. | 122,000 | 1,167 |
| Seiko Epson Corp. | 71,500 | 1,167 |
| J. Front Retailing Co., Ltd. | 244,200 | 1,165 |
| Marui Co., Ltd. | 166,100 | 1,163 |
| Nippon Meat Packers, Inc. | 92,000 | 1,158 |
| Showa Denko K.K. | 647,000 | 1,154 |
| Yamaha Corp. | 92,000 | 1,147 |
| NTN Corp. | 285,000 | 1,142 |
| Aioi Insurance Co., Ltd. | 250,000 | 1,139 |
| Santen Pharmaceutical |
|
|
| Co., Ltd. | 37,400 | 1,139 |
| Credit Saison Co., Ltd. | 89,300 | 1,133 |
| THK Co., Inc. | 75,700 | 1,128 |
| Nisshin Seifun Group Inc. | 94,900 | 1,128 |
| Kamigumi Co., Ltd. | 131,000 | 1,107 |
| Mitsui Chemicals, Inc. | 345,000 | 1,100 |
| Sony Financial |
|
|
| Holdings, Inc. | 393 | 1,084 |
| Kaneka Corp. | 150,000 | 1,066 |
| Konami Corp. | 54,900 | 1,051 |
| Taiheiyo Cement Corp. | 605,000 | 1,037 |
| Yokogawa Electric Corp. | 152,200 | 1,026 |
| Sumco Corp. | 72,060 | 1,024 |
| Cosmo Oil Co., Ltd. | 298,000 | 1,009 |
| Susuken Co., Ltd. | 34,760 | 1,007 |
| The Nishi-Nippon City |
|
|
| Bank, Ltd. | 398,000 | 1,005 |
| Brother Industries Ltd. | 113,000 | 999 |
| Showa Shell Sekiyu K.K. | 92,900 | 983 |
| Shimadzu Corp. | 123,000 | 983 |
| Isuzu Motors Ltd. | 612,000 | 982 |
| Shinko Securities Co., Ltd. | 312,000 | 976 |
| Nisshin Steel Co. | 435,000 | 971 |
| Mitsubishi Rayon Co., Ltd. | 332,000 | 965 |
* | Mizuho Trust & Banking |
|
|
| Co., Ltd. | 741,000 | 958 |
| Toyo Suisan Kaisha, Ltd. | 45,000 | 927 |
| Idemitsu Kosan Co. Ltd. | 10,809 | 926 |
| Leopalace21 Corp. | 103,600 | 926 |
| Tsumura & Co. | 29,600 | 924 |
* | Shinsei Bank, Ltd. | 578,014 | 923 |
| Hisamitsu Pharmaceutical |
|
|
| Co. Inc. | 29,500 | 917 |
16
Tax-Managed International Fund
|
|
| Market |
|
|
| Value• |
|
| Shares | ($000) |
| Yakult Honsha Co., Ltd. | 47,600 | 909 |
| FamilyMart Co., Ltd. | 28,800 | 905 |
| Jupiter Telecommunications |
|
|
| Co., Ltd. | 1,193 | 905 |
| Daihatsu Motor Co., Ltd. | 95,000 | 883 |
* | Mitsui Mining & Smelting |
|
|
| Co., Ltd. | 339,000 | 875 |
| Citizen Watch Co., Ltd. | 169,800 | 870 |
| Ushio Inc. | 54,300 | 866 |
| Mitsumi Electric Co., Ltd. | 40,200 | 859 |
| Hitachi Construction |
|
|
| Machinery Co. | 52,800 | 858 |
* | Japan Airlines System Co. | 443,000 | 855 |
| Mitsui Engineering & |
|
|
| Shipbuilding Co., Ltd. | 363,000 | 853 |
| Shimamura Co., Ltd. | 10,700 | 852 |
| Tokuyama Corp. | 116,000 | 851 |
| Toho Gas Co., Ltd. | 207,000 | 841 |
| Kikkoman Corp. | 83,000 | 831 |
| Rinnai Corp. | 18,800 | 831 |
| Mediceo Paltac |
|
|
| Holdings Co., Ltd. | 72,000 | 822 |
| Hitachi Chemical Co., Ltd. | 50,500 | 813 |
| Keisei Electric Railway |
|
|
| Co., Ltd. | 131,000 | 781 |
| Nomura Real Estate |
|
|
| Holdings Inc. | 45,271 | 779 |
| Toyoda Gosei Co., Ltd. | 28,700 | 775 |
| Acom Co., Ltd. | 30,994 | 772 |
| Fuji Electric Holdings |
|
|
| Co., Ltd. | 466,000 | 769 |
| Mitsubishi UFJ Lease & |
|
|
| Finance Company Ltd. | 23,460 | 765 |
| Nissan Chemical |
|
|
| Industries, Ltd. | 67,000 | 753 |
| Kansai Paint Co., Ltd. | 104,000 | 745 |
| AEON Mall Co., Ltd. | 39,000 | 740 |
| Minebea Co., Ltd. | 172,000 | 732 |
| Square Enix Co., Ltd. | 30,400 | 714 |
* | Elpida Memory Inc. | 65,700 | 708 |
| Tosoh Corp. | 245,000 | 693 |
| Hitachi Metals Ltd. | 81,000 | 689 |
| JAFCO Co., Ltd. | 20,500 | 688 |
| Nisshinbo Industries, Inc. | 61,000 | 688 |
| Asics Corp. | 74,596 | 680 |
| Daicel Chemical |
|
|
| Industries Ltd. | 112,000 | 679 |
| Oracle Corp. Japan | 18,200 | 667 |
| Dai Nippon |
|
|
| Pharmaceutical Co., Ltd. | 76,000 | 663 |
| Dowa Mining Co., Ltd. | 158,000 | 656 |
| NGK Spark Plug Co. | 67,000 | 640 |
* | Sapporo Hokuyo |
|
|
| Holdings, Inc. | 221,000 | 634 |
| Uny Co., Ltd. | 74,000 | 632 |
| Denki Kagaku Kogyo K.K. | 227,000 | 630 |
| Sapporo Holdings Ltd. | 104,000 | 595 |
* | McDonald’s Holdings |
|
|
| Company (Japan), Ltd. | 31,800 | 590 |
| Yamato Kogyo Co., Ltd. | 20,000 | 589 |
| Sumitomo Rubber |
|
|
| Industries Ltd. | 71,000 | 571 |
| NOK Corp. | 48,200 | 560 |
| Yaskawa Electric Corp. | 83,000 | 551 |
| Yamazaki Baking Co., Ltd. | 48,000 | 542 |
| Daido Steel Co., Ltd. | 132,000 | 540 |
* | Aozora Bank, Ltd. | 346,000 | 534 |
| Mabuchi Motor Co. | 10,900 | 526 |
| Promise Co., Ltd. | 41,117 | 525 |
| Hakuhodo DY Holdings Inc. | 9,260 | 499 |
| Alfresa Holdings Corp. | 10,700 | 494 |
| Aeon Credit Service Co. Ltd. | 37,510 | 491 |
| NHK Spring Co. | 72,000 | 483 |
| USS Co., Ltd. | 8,810 | 454 |
| Mitsubishi Logistics Corp. | 41,000 | 453 |
| Tokyo Steel |
|
|
| Manufacturing Co. | 36,900 | 449 |
| Coca-Cola West Japan |
|
|
| Co., Ltd. | 23,200 | 444 |
| Toyota Boshoku Corp. | 28,400 | 423 |
| Kinden Corp. | 48,000 | 422 |
| Hitachi |
|
|
| High-Technologies Corp. | 24,451 | 415 |
| Ito En, Ltd. | 28,100 | 400 |
| Obic Co., Ltd. | 2,450 | 397 |
| Matsui Securities Co., Ltd. | 40,100 | 364 |
| Canon Sales Co. Inc. | 25,600 | 358 |
| Fuji Television Network, Inc. | 228 | 343 |
| DeNA Co., Ltd. | 101 | 337 |
| Dai-Nippon Ink & |
|
|
| Chemicals, Inc. | 205,000 | 320 |
| Shinko Electric Industries |
|
|
| Co., Ltd. | 25,173 | 311 |
| Itochu Techno-Science Corp. | 9,900 | 294 |
| Dowa Fire & Marine |
|
|
| Insurance Co. | 59,000 | 285 |
| Maruichi Steel Tube Ltd. | 15,100 | 285 |
| Onward Kashiyama Co., Ltd. | 42,000 | 270 |
| Otsuka Corp. | 4,860 | 260 |
| Tokyo Broadcasting |
|
|
| System Holdings, Inc. | 16,200 | 255 |
| ABC-Mart Inc. | 8,600 | 221 |
| Hino Motors, Ltd. | 69,000 | 215 |
| Hikari Tsushin, Inc. | 8,500 | 192 |
| Osaka Titanium |
|
|
| Technologies Co. | 4,514 | 165 |
* | Dowa Mining Co., Ltd. |
|
|
| Rights Exp. 1/29/10 | 32,000 | 7 |
|
|
| 1,074,213 |
Netherlands (2.3%) |
|
| |
| Unilever NV | 876,522 | 21,200 |
| Koninklijke KPN NV | 933,695 | 12,883 |
17
Tax-Managed International Fund
|
|
| Market |
|
|
| Value• |
|
| Shares | ($000) |
| ING Groep NV | 1,064,680 | 10,786 |
| Koninklijke (Royal) |
|
|
| Philips Electronics NV | 532,118 | 9,825 |
| Koninklijke Ahold NV | 651,015 | 7,505 |
| Akzo Nobel NV | 126,969 | 5,612 |
| ASML Holding NV | 237,072 | 5,139 |
| Heineken NV | 130,857 | 4,877 |
| Aegon NV | 781,666 | 4,839 |
| TNT NV | 212,539 | 4,154 |
| Reed Elsevier NV | 352,143 | 3,894 |
| Koninklijke DSM NV | 81,484 | 2,562 |
| Wolters Kluwer NV | 143,391 | 2,515 |
| Heineken Holding NV | 57,001 | 1,821 |
* | Randstad Holding NV | 57,573 | 1,600 |
| Fugro NV | 33,219 | 1,383 |
| Corio NV | 26,974 | 1,316 |
| SBM Offshore NV | 76,266 | 1,310 |
| Koninklijke Boskalis |
|
|
| Westminster NV | 20,103 | 458 |
|
|
| 103,679 |
New Zealand (0.1%) |
|
| |
| Telecom Corp. of |
|
|
| New Zealand Ltd. | 1,043,901 | 1,833 |
| Fletcher Building Ltd. | 308,985 | 1,311 |
| Sky City Entertainment |
|
|
| Group Ltd. | 334,235 | 577 |
| Contact Energy Ltd. | 134,882 | 508 |
| Auckland International |
|
|
| Airport Ltd. | 388,576 | 403 |
|
|
| 4,632 |
Norway (0.7%) |
|
| |
| StatoilHydro ASA | 611,591 | 12,081 |
* | Telenor ASA | 484,126 | 3,736 |
| Orkla ASA | 427,589 | 3,109 |
| Yara International ASA | 109,802 | 3,091 |
* | DnB NOR ASA | 387,280 | 2,959 |
| Seadrill Ltd. | 156,759 | 2,258 |
* | Norsk Hydro ASA | 408,840 | 2,107 |
* | Renewable Energy Corp. |
|
|
| AS | 125,674 | 981 |
* | Renewable Energy Corp. |
|
|
| AS Rights Exp. 7/13/09 | 43,335 | 155 |
|
|
| 30,477 |
Portugal (0.3%) |
|
| |
| Electricidade de Portugal |
|
|
| SA | 1,007,776 | 3,959 |
| Portugal Telecom |
|
|
| SGPS SA | 323,968 | 3,178 |
| Banco Comercial |
|
|
| Portugues SA | 1,542,792 | 1,571 |
| Banco Espirito Santo SA | 255,527 | 1,378 |
| Galp Energia, |
|
|
| SGPS, SA B Shares | 93,528 | 1,318 |
* | EDP Renovaveis SA | 108,752 | 1,116 |
| Brisa-Auto Estradas |
|
|
| de Portugal SA | 143,985 | 1,035 |
| Cimpor-Cimento |
|
|
| de Portugal SA | 114,790 | 838 |
| Jeronimo Martins, |
|
|
| SGPS, SA | 85,852 | 586 |
|
|
| 14,979 |
Singapore (1.3%) |
|
| |
| Singapore |
|
|
| Telecommunications Ltd. | 4,420,290 | 9,120 |
| DBS Group Holdings Ltd. | 940,123 | 7,622 |
| United Overseas Bank Ltd. | 671,504 | 6,776 |
| Oversea-Chinese |
|
|
| Banking Corp., Ltd. | 1,369,300 | 6,287 |
| Capitaland Ltd. | 1,405,000 | 3,572 |
| Keppel Corp., Ltd. | 673,276 | 3,191 |
| Singapore Airlines Ltd. | 296,710 | 2,716 |
| Singapore Exchange Ltd. | 489,000 | 2,381 |
| Singapore Press |
|
|
| Holdings Ltd. | 997,250 | 2,170 |
| City Developments Ltd. | 289,000 | 1,703 |
| Fraser & Neave Ltd. | 554,650 | 1,486 |
| Wilmar International Ltd. | 425,000 | 1,466 |
| Olam International Ltd. | 732,200 | 1,221 |
* | Genting Singapore PLC | 2,600,000 | 1,217 |
| Singapore Technologies |
|
|
| Engineering Ltd. | 677,906 | 1,142 |
| Sembcorp Industries Ltd. | 490,660 | 1,018 |
| ComfortDelGro Corp. Ltd. | 1,106,000 | 974 |
| Golden |
|
|
| Agri-Resources Ltd. | 3,473,360 | 905 |
| Jardine Cycle |
|
|
| N Carriage Ltd. | 60,037 | 792 |
| Noble Group Ltd. | 634,400 | 791 |
| United Overseas Land Ltd. | 334,750 | 760 |
| SembCorp Marine Ltd. | 404,600 | 746 |
| StarHub Ltd. | 297,000 | 438 |
| Cosco Corp. Singapore Ltd. | 439,000 | 376 |
| Neptune Orient Lines Ltd. | 191,000 | 194 |
* | Golden Agri-Resources Ltd. |
|
|
| Rights Exp. 7/16/09 | 590,471 | 82 |
* | Neptune Orient Lines Ltd. |
|
|
| Rights Exp. 7/8/09 | 143,250 | 17 |
|
|
| 59,163 |
Spain (4.5%) |
|
| |
| Banco Santander SA | 4,348,900 | 52,570 |
| Telefonica SA | 2,286,416 | 51,924 |
| Banco Bilbao Vizcaya |
|
|
| Argentaria SA | 1,907,286 | 24,016 |
| Iberdrola SA | 1,969,287 | 16,059 |
| Repsol YPF SA | 408,459 | 9,143 |
| Industria de Diseno |
|
|
| Textil SA | 116,750 | 5,619 |
| ACS, Actividades de |
|
|
| Contruccion y Servisios, |
|
|
| SA | 79,784 | 4,050 |
18
Tax-Managed International Fund
|
|
| Market |
|
|
| Value• |
|
| Shares | ($000) |
| Banco Popular Espanol SA | 410,072 | 3,588 |
| Banco de Sabadell SA | 476,121 | 2,978 |
| Abertis Infraestructuras SA | 156,745 | 2,960 |
| Red Electrica de Espana SA | 63,343 | 2,871 |
| Gas Natural SDG SA | 125,661 | 2,295 |
| Criteria Caixacorp SA | 444,912 | 2,062 |
* | Iberdrola Renovables | 438,392 | 2,010 |
| Gamesa Corporacion |
|
|
| Tecnologica SA | 102,276 | 1,950 |
| Acciona SA | 14,404 | 1,779 |
| Bankinter SA | 149,575 | 1,775 |
| Enagas SA | 88,125 | 1,739 |
| Acerinox SA | 80,290 | 1,492 |
| Zardoya Otis SA | 64,927 | 1,359 |
| Indra Sistemas, SA | 58,997 | 1,280 |
| Mapfre SA | 362,957 | 1,186 |
| Grifols SA | 64,821 | 1,150 |
| Grupo Ferrovial SA | 32,755 | 1,056 |
| Banco de Valencia SA | 105,969 | 1,030 |
| Fomento de Construc y |
|
|
| Contra SA | 22,704 | 934 |
| Cintra Concesiones de |
|
|
| Infraestructuras de |
|
|
| Transport SA | 120,206 | 749 |
| Sacyr Vallehermoso SA | 43,995 | 612 |
| Banco Santander SA ADR | 41,998 | 508 |
| Gestevision Telecinco SA | 43,919 | 411 |
* | Iberia Lineas Aereas |
|
|
| de Espana SA | 166,184 | 354 |
* | Zardoya Otis SA Rights |
|
|
| Exp. 7/1/09 | 64,927 | 66 |
|
|
| 201,575 |
Sweden (2.4%) |
|
| |
| Telefonaktiebolaget |
|
|
| LM Ericsson AB Class B | 1,623,503 | 15,994 |
| Hennes & Mauritz |
|
|
| AB B Shares | 281,696 | 14,066 |
| Nordea Bank AB | 1,767,574 | 14,048 |
| TeliaSonera AB | 1,258,097 | 6,622 |
| Svenska Handelsbanken |
|
|
| AB A Shares | 271,370 | 5,146 |
| Sandvik AB | 555,516 | 4,140 |
* | Skandinaviska Enskilda |
|
|
| Banken AB A Shares | 864,076 | 3,822 |
| Atlas Copco AB A Shares | 370,714 | 3,733 |
| Volvo AB B Shares | 600,250 | 3,718 |
| Svenska Cellulosa |
|
|
| AB B Shares | 317,330 | 3,341 |
| SKF AB B Shares | 215,680 | 2,666 |
| Skanska AB B Shares | 206,768 | 2,320 |
| Assa Abloy AB | 163,400 | 2,285 |
* | Millicom International |
|
|
| Cellular SA | 39,567 | 2,232 |
| Swedish Match AB | 133,731 | 2,179 |
| Atlas Copco AB B Shares | 219,480 | 1,994 |
* | Electrolux AB Series B | 135,036 | 1,889 |
| Alfa Laval AB | 194,200 | 1,861 |
| Scania AB B Shares | 166,086 | 1,652 |
| Tele2 AB B Shares | 157,138 | 1,591 |
| Getinge AB B Shares | 115,400 | 1,515 |
| Securitas AB B Shares | 177,840 | 1,514 |
| Volvo AB A Shares | 227,000 | 1,403 |
| SSAB Svenskt Stal |
|
|
| AB Series A | 107,389 | 1,254 |
* | Swedbank AB A Shares | 199,100 | 1,164 |
* | Husqvarna AB B Shares | 207,404 | 1,132 |
* | Lundin Petroleum AB | 129,900 | 1,010 |
| Holmen AB | 33,496 | 733 |
| SSAB Svenskt Stal |
|
|
| AB Series B | 53,708 | 580 |
|
|
| 105,604 |
Switzerland (7.5%) |
|
| |
| Nestle SA (Registered) | 1,970,280 | 74,395 |
| Roche Holdings AG | 379,387 | 51,692 |
| Novartis AG (Registered) | 1,145,761 | 46,641 |
| Credit Suisse Group |
|
|
| (Registered) | 606,709 | 27,797 |
* | UBS AG | 1,729,758 | 21,239 |
| ABB Ltd. | 1,205,567 | 19,037 |
| Zurich Financial |
|
|
| Services AG | 78,593 | 13,892 |
| Syngenta AG | 53,478 | 12,442 |
| Holcim Ltd. (Registered) | 113,683 | 6,472 |
| Swiss Re (Registered) | 190,621 | 6,334 |
* | Compagnie Financiere |
|
|
| Richemont SA | 286,051 | 5,964 |
| Julius Baer Holding, Ltd. | 117,531 | 4,571 |
| Swisscom AG | 13,601 | 4,185 |
| SGS Societe Generale de |
|
|
| Surveillance Holding SA |
|
|
| (Registered) | 2,484 | 3,085 |
| Synthes, Inc. | 31,477 | 3,044 |
| Swatch Group AG (Bearer) | 17,132 | 2,757 |
* | Actelion Ltd. | 52,590 | 2,756 |
| Adecco SA (Registered) | 64,967 | 2,715 |
| Geberit AG | 21,389 | 2,635 |
| Lonza AG (Registered) | 25,290 | 2,516 |
| Givaudan SA | 4,014 | 2,464 |
| Kuehne & Nagel |
|
|
| International AG | 28,235 | 2,218 |
| Sonova Holding AG | 23,868 | 1,943 |
| Baloise Holdings AG | 25,968 | 1,931 |
| Schindler Holding AG |
|
|
| (Bearer Participation |
|
|
| Certificates) | 27,954 | 1,739 |
| Nobel Biocare Holding AG | 72,424 | 1,585 |
| Swiss Life Holding | 17,558 | 1,520 |
* | Logitech International SA | 93,086 | 1,294 |
| Lindt & Spruengli AG Regular | 58 | 1,284 |
* | Aryzta AG |
|
|
| (Switzerland Shares) | 26,993 | 871 |
19
Tax-Managed International Fund
|
|
| Market |
|
|
| Value• |
|
| Shares | ($000) |
| Swatch Group AG |
|
|
| (Registered) | 25,657 | 843 |
| Straumann Holding AG | 4,560 | 832 |
| Lindt & Spruengli AG | 401 | 749 |
| Schindler Holding AG |
|
|
| (Registered) | 10,395 | 644 |
| BKW FMB Energie AG | 6,468 | 476 |
* | Aryzta AG (Ireland Shares) | 14,448 | 463 |
|
|
| 335,025 |
United Kingdom (21.0%) |
|
| |
| BP PLC | 10,126,895 | 80,021 |
| HSBC Holdings PLC | 9,300,064 | 77,480 |
| Vodafone Group PLC | 28,338,671 | 55,117 |
| GlaxoSmithKline PLC | 2,801,363 | 49,481 |
| Royal Dutch Shell PLC |
|
|
| Class A | 1,569,759 | 39,376 |
| Royal Dutch Shell PLC |
|
|
| Class B | 1,454,780 | 36,625 |
| AstraZeneca Group PLC | 775,387 | 34,189 |
| BG Group PLC | 1,811,385 | 30,503 |
| British American Tobacco |
|
|
| PLC | 1,077,157 | 29,734 |
| BHP Billiton PLC | 1,187,115 | 26,756 |
| Tesco PLC | 4,214,948 | 24,615 |
| Barclays PLC | 5,203,513 | 24,181 |
| Anglo American PLC | 705,579 | 20,630 |
| Diageo PLC | 1,342,153 | 19,277 |
| Standard Chartered PLC | 1,016,576 | 19,115 |
| Rio Tinto PLC | 487,814 | 16,894 |
| Unilever PLC | 691,054 | 16,241 |
| Reckitt Benckiser Group |
|
|
| PLC | 323,198 | 14,760 |
| Imperial Tobacco Group |
|
|
| PLC | 545,479 | 14,197 |
| National Grid Transco |
|
|
| PLC | 1,313,384 | 11,852 |
| Xstrata PLC | 1,024,215 | 11,131 |
| BAE Systems PLC | 1,924,620 | 10,755 |
| Centrica PLC | 2,755,169 | 10,131 |
| SABMiller PLC | 494,555 | 10,098 |
| Lloyds Banking Group |
|
|
| PLC | 8,629,004 | 9,947 |
| Scottish & Southern |
|
|
| Energy PLC | 493,237 | 9,280 |
| Prudential PLC | 1,344,267 | 9,189 |
| Royal Dutch Shell PLC |
|
|
| Class A |
|
|
| (Amsterdam Shares) | 344,841 | 8,641 |
| Aviva PLC | 1,449,468 | 8,161 |
| BT Group PLC | 4,231,012 | 7,089 |
| Tullow Oil PLC | 426,372 | 6,604 |
| Cadbury PLC | 731,873 | 6,256 |
| Rolls-Royce Group PLC | 1,034,596 | 6,186 |
* | Royal Bank of |
|
|
| Scotland Group PLC | 9,263,211 | 5,888 |
| Compass Group PLC | 990,504 | 5,591 |
| British Sky Broadcasting |
|
|
| Group PLC | 635,698 | 4,772 |
| Morrison Supermarkets |
|
|
| PLC | 1,199,292 | 4,684 |
| Reed Elsevier PLC | 621,533 | 4,643 |
| Marks & Spencer |
|
|
| Group PLC | 889,606 | 4,486 |
| Pearson PLC | 441,774 | 4,449 |
| WPP PLC | 666,031 | 4,429 |
| Man Group PLC | 938,915 | 4,304 |
| Experian Group Ltd. | 567,118 | 4,253 |
| Kingfisher PLC | 1,380,601 | 4,050 |
| Shire Ltd. | 289,642 | 3,998 |
| Capita Group PLC | 338,701 | 3,994 |
| Old Mutual PLC | 2,882,442 | 3,849 |
| Smith & Nephew PLC | 483,981 | 3,593 |
| Standard Life PLC | 1,115,524 | 3,426 |
| International Power PLC | 871,766 | 3,424 |
| Land Securities Group PLC | 430,469 | 3,348 |
| Royal & Sun Alliance |
|
|
| Insurance Group PLC | 1,675,682 | 3,327 |
| Legal & General Group |
|
|
| PLC | 3,375,497 | 3,157 |
| United Utilities Group |
|
|
| PLC | 380,515 | 3,120 |
| J. Sainsbury PLC | 598,378 | 3,090 |
| British Land Co., PLC | 488,910 | 3,079 |
| Thomson Reuters PLC | 102,986 | 2,946 |
* | Rio Tinto PLC Rights |
|
|
| Exp. 7/2/09 | 256,102 | 2,941 |
| Next PLC | 116,680 | 2,827 |
* | Cairn Energy PLC | 72,088 | 2,787 |
| Cable and Wireless PLC | 1,265,297 | 2,777 |
* | Wolseley PLC | 138,443 | 2,650 |
| Carnival PLC | 98,247 | 2,617 |
| Smiths Group PLC | 226,067 | 2,616 |
| Randgold Resources Ltd. | 40,422 | 2,605 |
| Severn Trent PLC | 138,150 | 2,491 |
* | Autonomy Corp.PLC | 104,873 | 2,485 |
| Johnson Matthey PLC | 127,208 | 2,416 |
| Associated British Foods |
|
|
| PLC | 186,581 | 2,351 |
| ICAP PLC | 314,622 | 2,343 |
| Group 4 Securicor PLC | 664,555 | 2,289 |
| The Sage Group PLC | 763,381 | 2,243 |
| 3i Group PLC | 545,744 | 2,183 |
| Amec PLC | 197,238 | 2,125 |
| Antofagasta PLC | 205,040 | 1,991 |
| Hammerson PLC | 389,843 | 1,977 |
| Home Retail Group | 452,016 | 1,940 |
| Burberry Group PLC | 270,027 | 1,882 |
| Cobham PLC | 651,951 | 1,857 |
| Rexam PLC | 369,584 | 1,737 |
| Eurasian Natural |
|
|
| Resources Corp. | 157,376 | 1,703 |
| Bunzl PLC | 203,084 | 1,684 |
20
Tax-Managed International Fund
|
|
| Market |
|
|
| Value• |
|
| Shares | ($000) |
| Invensys PLC | 454,583 | 1,678 |
| Lonmin PLC | 83,492 | 1,618 |
| Friends Provident Group |
|
|
| PLC | 1,414,200 | 1,529 |
| Serco Group PLC | 219,421 | 1,527 |
| Liberty International PLC | 229,496 | 1,504 |
| Vedanta Resources PLC | 69,922 | 1,489 |
| Tomkins PLC | 572,426 | 1,396 |
| FirstGroup PLC | 233,664 | 1,380 |
| Drax Group PLC | 184,515 | 1,336 |
| Admiral Group PLC | 90,011 | 1,291 |
| InterContinental |
|
|
| Hotels Group PLC | 124,790 | 1,285 |
| Whitbread PLC | 88,006 | 1,187 |
| Segro PLC | 2,957,370 | 1,183 |
| Balfour Beatty PLC | 231,755 | 1,181 |
| Schroders PLC | 80,444 | 1,088 |
| Thomas Cook Group PLC | 318,253 | 1,078 |
| Kazakhmys PLC | 100,309 | 1,046 |
| TUI Travel PLC | 268,067 | 1,025 |
| Investec PLC | 166,926 | 899 |
| Ladbrokes PLC | 253,326 | 768 |
| Fresnillo PLC | 88,460 | 760 |
| London Stock Exchange PLC | 64,194 | 743 |
| British Airways PLC | 319,761 | 659 |
* | The Berkeley Group |
|
|
| Holdings PLC | 28,303 | 375 |
| Carphone Warehouse PLC | 143,241 | 373 |
|
|
| 936,327 |
Total Common Stocks |
|
| |
(Cost $5,012,399) |
| 4,455,673 | |
Other Assets and Liabilities (0.0%) |
| ||
Other Assets |
| 17,143 | |
Liabilities |
| (19,124) | |
|
|
| (1,981) |
Net Assets (100%) |
| 4,453,692 | |
At June 30, 2009, net assets consisted of: | |
| Amount |
| ($000) |
Paid-in Capital | 5,392,574 |
Undistributed Net Investment Income | 83,308 |
Accumulated Net Realized Losses | (465,949) |
Unrealized Appreciation (Depreciation) |
|
Investment Securities | (556,726) |
Foreign Currencies | 485 |
Net Assets | 4,453,692 |
|
|
|
|
Investor Shares—Net Assets |
|
Applicable to 127,445,913 outstanding |
|
$.001 par value shares of beneficial |
|
interest (unlimited authorization) | 1,176,511 |
Net Asset Value Per Share— |
|
Investor Shares | $9.23 |
|
|
|
|
Institutional Shares—Net Assets |
|
Applicable to 22,560,808 outstanding |
|
$.001 par value shares of beneficial |
|
interest (unlimited authorization) | 208,496 |
Net Asset Value Per Share— |
|
Institutional Shares | $9.24 |
|
|
|
|
ETF Shares—Net Assets |
|
Applicable to 106,847,751 outstanding |
|
$.001 par value shares of beneficial |
|
interest (unlimited authorization) | 3,068,685 |
Net Asset Value Per Share— |
|
ETF Shares | $28.72 |
• See Note A in Notes to Financial Statements.
* Non-income-producing security.
ADR—American Depositary Receipt.
See accompanying Notes, which are an integral part of the Financial Statements.
21
Tax-Managed International Fund
Statement of Operations
| Six Months Ended |
| June 30, 2009 |
| ($000) |
Investment Income |
|
Income |
|
Dividends1 | 87,130 |
Interest2 | 12 |
Total Income | 87,142 |
Expenses |
|
The Vanguard Group—Note B |
|
Investment Advisory Services | 101 |
Management and Administrative—Investor Shares | 790 |
Management and Administrative—Institutional Shares | 46 |
Management and Administrative—ETF Shares | 1,323 |
Marketing and Distribution—Investor Shares | 145 |
Marketing and Distribution—Institutional Shares | 37 |
Marketing and Distribution—ETF Shares | 318 |
Custodian Fees | 193 |
Shareholders’ Reports and Proxies—Investor Shares | 19 |
Shareholders’ Reports and Proxies—Institutional Shares | — |
Shareholders’ Reports and Proxies—ETF Shares | 68 |
Trustees’ Fees and Expenses | 3 |
Total Expenses | 3,043 |
Net Investment Income | 84,099 |
Realized Net Gain (Loss) |
|
Investment Securities Sold | (155,334) |
Foreign Currencies | 1,981 |
Realized Net Gain (Loss) | (153,353) |
Change in Unrealized Appreciation (Depreciation) |
|
Investment Securities | 353,724 |
Foreign Currencies | 507 |
Change in Unrealized Appreciation (Depreciation) | 354,231 |
Net Increase (Decrease) in Net Assets Resulting from Operations | 284,977 |
1 Dividends are net of foreign withholding taxes of $9,554,000.
2 Interest income from an affiliated company of the fund was $12,000.
See accompanying Notes, which are an integral part of the Financial Statements.
22
Tax-Managed International Fund
Statement of Changes in Net Assets
| Six Months Ended |
| Year Ended |
| June 30, |
| December 31, |
| 2009 |
| 2008 |
| ($000) |
| ($000) |
Increase (Decrease) in Net Assets |
|
|
|
Operations |
|
|
|
Net Investment Income | 84,099 |
| 118,513 |
Realized Net Gain (Loss) | (153,353) |
| (249,218) |
Change in Unrealized Appreciation (Depreciation) | 354,231 |
| (1,665,734) |
Net Increase (Decrease) in Net Assets Resulting from Operations | 284,977 |
| (1,796,439) |
Distributions |
|
|
|
Net Investment Income |
|
|
|
Investor Shares | (769) |
| (36,506) |
Institutional Shares | (152) |
| (8,403) |
ETF Shares | (1,716) |
| (73,729) |
Realized Capital Gain |
|
|
|
Investor Shares | — |
| — |
Institutional Shares | — |
| — |
ETF Shares | — |
| — |
Total Distributions | (2,637) |
| (118,638) |
Capital Share Transactions |
|
|
|
Investor Shares | (14,532) |
| 79,651 |
Institutional Shares | (36,518) |
| (77,177) |
ETF Shares | 557,237 |
| 2,441,432 |
Net Increase (Decrease) from Capital Share Transactions | 506,187 |
| 2,443,906 |
Total Increase (Decrease) | 788,527 |
| 528,829 |
Net Assets |
|
|
|
Beginning of Period | 3,665,165 |
| 3,136,336 |
End of Period1 | 4,453,692 |
| 3,665,165 |
1 Net Assets—End of Period includes undistributed (overdistributed) net investment income of $83,308,000 and ($135,000).
See accompanying Notes, which are an integral part of the Financial Statements.
23
Tax-Managed International Fund
Financial Highlights
Investor Shares |
|
|
|
|
|
|
|
|
|
|
|
|
|
| Six Months |
|
|
|
|
|
| Ended |
|
|
| ||
For a Share Outstanding | June 30, | Year Ended December 31, | ||||
Throughout Each Period | 2009 | 2008 | 2007 | 2006 | 2005 | 2004 |
Net Asset Value, Beginning of Period | $8.74 | $15.40 | $14.16 | $11.48 | $10.33 | $8.76 |
Investment Operations |
|
|
|
|
|
|
Net Investment Income | .173 | .290 | .332 | .331 | .246 | .201 |
Net Realized and Unrealized Gain (Loss) |
|
|
|
|
|
|
on Investments | .323 | (6.661) | 1.244 | 2.685 | 1.161 | 1.571 |
Total from Investment Operations | .496 | (6.371) | 1.576 | 3.016 | 1.407 | 1.772 |
Distributions |
|
|
|
|
|
|
Dividends from Net Investment Income | (.006) | (.289) | (.336) | (.336) | (.257) | (.202) |
Distributions from Realized Capital Gains | — | — | — | — | — | — |
Total Distributions | (.006) | (.289) | (.336) | (.336) | (.257) | (.202) |
Net Asset Value, End of Period | $9.23 | $8.74 | $15.40 | $14.16 | $11.48 | $10.33 |
|
|
|
|
|
|
|
|
|
|
|
|
|
|
Total Return1 | 5.69% | –41.27% | 11.15% | 26.27% | 13.60% | 20.25% |
|
|
|
|
|
|
|
|
|
|
|
|
|
|
Ratios/Supplemental Data |
|
|
|
|
|
|
Net Assets, End of Period (Millions) | $1,177 | $1,131 | $1,915 | $1,624 | $1,119 | $825 |
Ratio of Total Expenses to |
|
|
|
|
|
|
Average Net Assets | 0.20%2 | 0.15% | 0.15% | 0.20% | 0.20% | 0.23% |
Ratio of Net Investment Income to |
|
|
|
|
|
|
Average Net Assets | 3.50%2 | 3.47% | 2.71% | 2.70% | 2.50% | 2.34% |
Portfolio Turnover Rate3 | 13%2 | 16% | 6% | 4% | 5% | 5% |
1 Total returns do not reflect the 1% redemption fee on shares held for less than five years; the 2% redemption fee assessed prior to September 14, 2005, on shares held for less than one year; or the account service fee that may be applicable to certain accounts with balances below $10,000.
2 Annualized.
3 Excludes the value of portfolio securities received or delivered as a result of in-kind purchases or redemptions of the fund’s capital shares, including ETF Creation Units.
See accompanying Notes, which are an integral part of the Financial Statements.
24
Tax-Managed International Fund
Financial Highlights
Institutional Shares |
|
|
|
|
|
|
|
|
|
|
|
|
|
| Six Months |
|
|
|
|
|
| Ended |
|
|
| ||
For a Share Outstanding | June 30, | Year Ended December 31, | ||||
Throughout Each Period | 2009 | 2008 | 2007 | 2006 | 2005 | 2004 |
Net Asset Value, Beginning of Period | $8.74 | $15.41 | $14.17 | $11.48 | $10.33 | $8.77 |
Investment Operations |
|
|
|
|
|
|
Net Investment Income | .177 | .296 | .341 | .348 | .253 | .198 |
Net Realized and Unrealized Gain (Loss) |
|
|
|
|
|
|
on Investments | .329 | (6.671) | 1.244 | 2.685 | 1.161 | 1.571 |
Total from Investment Operations | .506 | (6.375) | 1.585 | 3.033 | 1.414 | 1.769 |
Distributions |
|
|
|
|
|
|
Dividends from Net Investment Income | (.006) | (.295) | (.345) | (.343) | (.264) | (.209) |
Distributions from Realized Capital Gains | — | — | — | — | — | — |
Total Distributions | (.006) | (.295) | (.345) | (.343) | (.264) | (.209) |
Net Asset Value, End of Period | $9.24 | $8.74 | $15.41 | $14.17 | $11.48 | $10.33 |
|
|
|
|
|
|
|
|
|
|
|
|
|
|
Total Return1 | 5.81% | –41.27% | 11.21% | 26.42% | 13.66% | 20.19% |
|
|
|
|
|
|
|
|
|
|
|
|
|
|
Ratios/Supplemental Data |
|
|
|
|
|
|
Net Assets, End of Period (Millions) | $208 | $242 | $568 | $258 | $193 | $143 |
Ratio of Total Expenses to |
|
|
|
|
|
|
Average Net Assets | 0.10%2 | 0.09% | 0.09% | 0.14% | 0.14% | 0.15% |
Ratio of Net Investment Income to |
|
|
|
|
|
|
Average Net Assets | 3.60%2 | 3.53% | 2.77% | 2.76% | 2.56% | 2.42% |
Portfolio Turnover Rate3 | 13%2 | 16% | 6% | 4% | 5% | 5% |
1 Total returns do not reflect the 1% redemption fee on shares held for less than five years or the 2% redemption fee assessed prior to September 14, 2005, on shares held for less than one year.
2 Annualized.
3 Excludes the value of portfolio securities received or delivered as a result of in-kind purchases or redemptions of the fund’s capital shares, including ETF Creation Units.
See accompanying Notes, which are an integral part of the Financial Statements.
25
Tax-Managed International Fund
Financial Highlights
Europe Pacific ETF Shares |
|
|
|
| Six Months | Year | July 20, |
| Ended | Ended | 20071 to |
| June 30, | Dec. 31, | Dec. 31, |
For a Share Outstanding Throughout Each Period | 2009 | 2008 | 2007 |
Net Asset Value, Beginning of Period | $27.18 | $47.92 | $49.99 |
Investment Operations |
|
|
|
Net Investment Income | .546 | .934 | .204 |
Net Realized and Unrealized Gain (Loss) on Investments | 1.013 | (20.744) | (1.219) |
Total from Investment Operations | 1.559 | (19.810) | (1.015) |
Distributions |
|
|
|
Dividends from Net Investment Income | (.019) | (.930) | (1.055) |
Distributions from Realized Capital Gains | — | — | — |
Total Distributions | (.019) | (.930) | (1.055) |
Net Asset Value, End of Period | $28.72 | $27.18 | $47.92 |
|
|
|
|
|
|
|
|
Total Return | 5.75% | –41.25% | –2.02% |
|
|
|
|
|
|
|
|
Ratios/Supplemental Data |
|
|
|
Net Assets, End of Period (Millions) | $3,069 | $2,292 | $653 |
Ratio of Total Expenses to Average Net Assets | 0.16%2 | 0.11% | 0.12%2 |
Ratio of Net Investment Income to Average Net Assets | 3.54%2 | 3.51% | 2.74%2 |
Portfolio Turnover Rate3 | 13%2 | 16% | 6% |
1 Inception.
2 Annualized.
3 Excludes the value of portfolio securities received or delivered as a result of in-kind purchases or redemptions of the fund’s capital shares, including ETF Creation Units.
See accompanying Notes, which are an integral part of the Financial Statements.
26
Tax-Managed International Fund
Notes to Financial Statements
Vanguard Tax-Managed International Fund is registered under the Investment Company Act of 1940 as an open-end investment company, or mutual fund. The fund invests in securities of foreign issuers, which may subject it to investment risks not normally associated with investing in securities of U.S. corporations. The fund offers three classes of shares: Investor Shares, Institutional Shares, and ETF Shares. Investor Shares are available to any investor who meets the fund’s minimum purchase requirements. Institutional Shares are designed for investors who meet certain administrative and service criteria and invest a minimum of $5 million. ETF Shares, known as Vanguard Europe Pacific ETF Shares, are listed for trading on the NYSE Arca, Inc.; they can be purchased and sold through a broker.
A. The following significant accounting policies conform to generally accepted accounting principles for U.S. mutual funds. The fund consistently follows such policies in preparing its financial statements.
1. Security Valuation: Securities are valued as of the close of trading on the New York Stock Exchange (generally 4 p.m., Eastern time) on the valuation date. Equity securities are valued at the latest quoted sales prices or official closing prices taken from the primary market in which each security trades; such securities not traded on the valuation date are valued at the mean of the latest quoted bid and asked prices. Securities for which market quotations are not readily available, or whose values have been affected by events occurring before the fund’s pricing time but after the close of the securities’ primary markets, are valued at their fair values calculated according to procedures adopted by the board of trustees. These procedures include obtaining quotations from an independent pricing service, monitoring news to identify significant market- or security-specific events, and evaluating changes in the values of foreign market proxies (for example, ADRs, futures contracts, or exchange-traded funds), between the time the foreign markets close and the fund’s pricing time. When fair-value pricing is employed, the prices of securities used by a fund to calculate its net asset value may differ from quoted or published prices for the same securities. Investments in Vanguard Market Liquidity Fund are valued at that fund’s net asset value.
2. Foreign Currency: Securities and other assets and liabilities denominated in foreign currencies are translated into U.S. dollars using exchange rates obtained from an independent third party as of the fund’s pricing time on the valuation date. Realized gains (losses) and unrealized appreciation (depreciation) on investment securities include the effects of changes in exchange rates since the securities were purchased, combined with the effects of changes in security prices. Fluctuations in the value of other assets and liabilities resulting from changes in exchange rates are recorded as unrealized foreign currency gains (losses) until the assets or liabilities are settled in cash, at which time they are recorded as realized foreign currency gains (losses).
3. Federal Income Taxes: The fund intends to continue to qualify as a regulated investment company and distribute all of its taxable income. Management has analyzed the fund’s tax positions taken on federal income tax returns for all open tax years (tax years ended December 31, 2005–2008) and for the period ended June 30, 2009, and has concluded that no provision for federal income tax is required in the fund’s financial statements.
4. Distributions: Distributions to shareholders are recorded on the ex-dividend date.
5. Other: Dividend income is recorded on the ex-dividend date. Interest income includes income distributions received from Vanguard Market Liquidity Fund and is accrued daily. Security transactions are accounted for on the date securities are bought or sold. Costs used to determine realized gains (losses) on the sale of investment securities are those of the specific securities sold. Fees assessed on redemptions of capital shares are credited to paid-in capital.
27
Tax-Managed International Fund
Each class of shares has equal rights as to assets and earnings, except that each class separately bears certain class-specific expenses related to maintenance of shareholder accounts (included in Management and Administrative expenses), shareholder reporting, and proxies. Marketing and distribution expenses are allocated to each class of shares based on a method approved by the board of trustees. Income, other non-class-specific expenses, and gains and losses on investments are allocated to each class of shares based on its relative net assets.
B. The Vanguard Group furnishes at cost investment advisory, corporate management, administrative, marketing, and distribution services. The costs of such services are allocated to the fund under methods approved by the board of trustees. The fund has committed to provide up to 0.40% of its net assets in capital contributions to Vanguard. At June 30, 2009, the fund had contributed capital of $1,060,000 to Vanguard (included in Other Assets), representing 0.02% of the fund’s net assets and 0.42% of Vanguard’s capitalization. The fund’s trustees and officers are also directors and officers of Vanguard.
C. Various inputs may be used to determine the value of the fund’s investments. These inputs are summarized in three broad levels for financial statement purposes. The inputs or methodologies used to value securities are not necessarily an indication of the risk associated with investing in those securities.
Level 1—Quoted prices in active markets for identical securities.
Level 2—Other significant observable inputs (including quoted prices for similar securities, interest rates, prepayment speeds, credit risk, etc.).
Level 3—Significant unobservable inputs (including the fund’s own assumptions used to determine the fair value of investments).
The following table summarizes the fund’s investments as of June 30, 2009, based on the inputs used to value them:
| Level 1 | Level 2 | Level 3 |
Investments | ($000) | ($000) | ($000) |
Common Stocks | 9,549 | 4,446,046 | 78 |
Total | 9,549 | 4,446,046 | 78 |
The following table summarizes changes in investments valued based on Level 3 inputs during the six months ended June 30, 2009:
| Investments in |
| Common Stocks |
| ($000) |
Amount valued based on Level 3 Inputs |
|
Balance as of December 31, 2008 | — |
Transfers in and/or out of Level 3 | 72 |
Change in Unrealized Appreciation (Depreciation) | 6 |
Balance as of June 30, 2009 | 78 |
28
Tax-Managed International Fund
D. Distributions are determined on a tax basis and may differ from net investment income and realized capital gains for financial reporting purposes. Differences may be permanent or temporary. Permanent differences are reclassified among capital accounts in the financial statements to reflect their tax character. Temporary differences arise when certain items of income, expense, gain, or loss are recognized in different periods for financial statement and tax purposes; these differences will reverse at some time in the future. Differences in classification may also result from the treatment of short-term gains as ordinary income for tax purposes.
During the six months ended June 30, 2009, the fund realized net foreign currency gains of $1,981,000, which increased distributable net income for tax purposes; accordingly, such gains have been reclassified from accumulated net realized losses to undistributed net investment income.
During the six months ended June 30, 2009, the fund realized $13,620,000 of net capital gains resulting from in-kind redemptions—in which shareholders exchanged fund shares for securities held by the fund rather than for cash. Because such gains are not taxable to the fund, and are not distributed to shareholders, they have been reclassified from accumulated net realized losses to paid-in capital.
The fund’s tax-basis capital gains and losses are determined only at the end of each fiscal year. For tax purposes, at December 31, 2008, the fund had available realized losses of $296,961,000 to offset future net capital gains of $12,748,000 through December 31, 2010, $27,239,000 through December 31, 2011, $5,174,000 through December 31, 2012, $99,680,000 through December 31, 2016, and $152,120,000 through December 31, 2017. The fund will use these capital losses to offset net taxable capital gains, if any, realized during the year ending December 31, 2009; should the fund realize net capital losses for the year, the losses will be added to the loss carryforward balances above.
At June 30, 2009, the cost of investment securities for tax purposes was $5,012,399,000. Net unrealized depreciation of investment securities for tax purposes was $556,726,000, consisting of unrealized gains of $178,255,000 on securities that had risen in value since their purchase and $734,981,000 in unrealized losses on securities that had fallen in value since their purchase.
E. During the six months ended June 30, 2009, the fund purchased $851,363,000 of investment securities and sold $264,196,000 of investment securities, other than temporary cash investments.
29
Tax-Managed International Fund
F. Capital share transactions for each class of shares were:
| Six Months Ended | Year Ended | |||
| June 30, 2009 | December 31, 2008 | |||
| Amount | Shares |
| Amount | Shares |
| ($000) | (000) |
| ($000) | (000) |
Investor Shares |
|
|
|
|
|
Issued | 69,920 | 8,927 |
| 305,754 | 26,025 |
Issued in Lieu of Cash Distributions | 614 | 85 |
| 28,971 | 3,486 |
Redeemed1 | (85,066) | (11,008) |
| (255,074) | (24,427) |
Net Increase (Decrease)—Investor Shares | (14,532) | (1,996) |
| 79,651 | 5,084 |
Institutional Shares |
|
|
|
|
|
Issued | 13,311 | 1,547 |
| 80,348 | 5,969 |
Issued in Lieu of Cash Distributions | 106 | 15 |
| 6,027 | 723 |
Redeemed1 | (49,935) | (6,641) |
| (163,552) | (15,951) |
Net Increase (Decrease)—Institutional Shares | (36,518) | (5,079) |
| (77,177) | (9,259) |
ETF Shares |
|
|
|
|
|
Issued | 586,177 | 23,527 |
| 2,441,432 | 70,686 |
Issued in Lieu of Cash Distributions | — | — |
| — | — |
Redeemed1 | (28,940) | (1,000) |
| — | — |
Net Increase (Decrease)—ETF Shares | 557,237 | 22,527 |
| 2,441,432 | 70,686 |
1 Net of redemption fees for fiscal 2009 and 2008 of $499,000 and $1,382,000, respectively (fund totals). | |||||
G. In preparing the financial statements as of June 30, 2009, management considered the impact of subsequent events occurring through August 5, 2009, for potential recognition or disclosure in these financial statements.
30
About Your Fund’s Expenses
As a shareholder of the fund, you incur ongoing costs, which include costs for portfolio management, administrative services, and shareholder reports (like this one), among others. Operating expenses, which are deducted from a fund’s gross income, directly reduce the investment return of the fund.
A fund’s expenses are expressed as a percentage of its average net assets. This figure is known as the expense ratio. The following examples are intended to help you understand the ongoing costs (in dollars) of investing in your fund and to compare these costs with those of other mutual funds. The examples are based on an investment of $1,000 made at the beginning of the period shown and held for the entire period.
The accompanying table illustrates your fund’s costs in two ways:
• Based on actual fund return. This section helps you to estimate the actual expenses that you paid over the period. The “Ending Account Value” shown is derived from the fund’s actual return, and the third column shows the dollar amount that would have been paid by an investor who started with $1,000 in the fund. You may use the information here, together with the amount you invested, to estimate the expenses that you paid over the period.
To do so, simply divide your account value by $1,000 (for example, an $8,600 account value divided by $1,000 = 8.6), then multiply the result by the number given for your fund under the heading “Expenses Paid During Period.”
• Based on hypothetical 5% yearly return. This section is intended to help you compare your fund’s costs with those of other mutual funds. It assumes that the fund had a yearly return of 5% before expenses, but that the expense ratio is unchanged. In this case—because the return used is not the fund’s actual return—the results do not apply to your investment. The example is useful in making comparisons because the Securities and Exchange Commission requires all mutual funds to calculate expenses based on a 5% return. You can assess your fund’s costs by comparing this hypothetical example with the hypothetical examples that appear in shareholder reports of other funds.
Six Months Ended June 30, 2009 |
|
|
|
| Beginning | Ending | Expenses |
| Account Value | Account Value | Paid During |
Tax-Managed International Fund | 12/31/2008 | 6/30/2009 | Period1 |
Based on Actual Fund Return |
|
|
|
Investor Shares | $1,000.00 | $1,056.94 | $1.02 |
Institutional Shares | 1,000.00 | 1,058.08 | 0.51 |
Europe Pacific ETF Shares | 1,000.00 | 1,057.50 | 0.82 |
Based on Hypothetical 5% Yearly Return |
|
|
|
Investor Shares | $1,000.00 | $1,023.80 | $1.00 |
Institutional Shares | 1,000.00 | 1,024.30 | 0.50 |
Europe Pacific ETF Shares | 1,000.00 | 1,024.00 | 0.80 |
1 The calculations are based on expenses incurred during the most recent six-month period. The fund’s annualized six-month expense ratios for that period are: 0.20% for Investor Shares, 0.10% for Institutional Shares, and 0.16% for Europe Pacific ETF Shares. The dollar amounts shown as “Expenses Paid” are equal to the annualized expense ratio multiplied by the average account value over the period, multiplied by the number of days in the most recent six-month period, then divided by the number of days in the most recent 12-month period.
31
Note that the expenses shown in the table are meant to highlight and help you compare ongoing costs only and do not reflect transaction costs incurred by the fund for buying and selling securities. Further, the expenses do not include the 1% fee on redemptions of shares held for less than five years, nor do they include the account service fee described in the prospectus. If such fees were applied to your account, your costs would be higher. Your fund does not carry a “sales load.”
The calculations assume no shares were bought or sold during the period. Your actual costs may have been higher or lower, depending on the amount of your investment and the timing of any purchases or redemptions.
You can find more information about the fund’s expenses, including annual expense ratios, in the Financial Statements section of this report. For additional information on operating expenses and other shareholder costs, please refer to your fund’s current prospectus.
32
Trustees Approve Advisory Arrangement
The board of trustees of Vanguard Tax-Managed International Fund has renewed the fund’s investment advisory arrangement with The Vanguard Group, Inc. Vanguard—through its Quantitative Equity Group—serves as the investment advisor for the fund. The board determined that continuing the fund’s internalized management structure was in the best interests of the fund and its shareholders.
The board based its decision upon an evaluation of the advisor’s investment staff, portfolio management process, and performance. The trustees considered the factors discussed below, among others. However, no single factor determined whether the board approved the arrangement. Rather, it was the totality of the circumstances that drove the board’s decision.
Nature, extent, and quality of services
The board considered the quality of the fund’s investment management over both the short and long term, and took into account the organizational depth and stability of the advisor. The board noted that Vanguard has been managing investments for more than three decades. The Quantitative Equity Group adheres to a sound, disciplined investment management process; the team has considerable experience, stability, and depth.
The board concluded that Vanguard’s experience, stability, depth, and performance, among other factors, warranted continuation of the advisory arrangement.
Investment performance
The board considered the short- and long-term performance of the fund, including any periods of outperformance or underperformance of a relevant benchmark and peer group. The board concluded that the fund has performed in line with expectations, and that its results have been consistent with its investment strategies. Information about the fund’s most recent performance can be found in the Performance Summary section of this report.
Cost
The board concluded that the fund’s expense ratio was far below the average expense ratio charged by funds in its peer group. The board noted that the fund’s advisory expense ratio was also well below its peer-group average. Information about the fund’s expense ratio appears in the About Your Fund’s Expenses section of this report as well as in the Financial Statements section.
The board does not conduct a profitability analysis of Vanguard, because of Vanguard’s unique “at-cost” structure. Unlike most other mutual fund management companies, Vanguard is owned by the funds it oversees, and produces “profits” only in the form of reduced expenses for fund shareholders.
The benefit of economies of scale
The board of trustees concluded that the fund’s low-cost arrangement with Vanguard ensures that the fund will realize economies of scale as it grows, with the cost to shareholders declining as fund assets increase.
The board will consider whether to renew the advisory arrangement again after a one-year period.
33
Glossary
Beta. A measure of the magnitude of a fund’s past share-price fluctuations in relation to the ups and downs of a given market index. The index is assigned a beta of 1.00. Compared with a given index, a fund with a beta of 1.20 typically would have seen its share price rise or fall by 12% when the index rose or fell by 10%. For this report, beta is based on returns over the past 36 months for both the fund and the index. Note that a fund’s beta should be reviewed in conjunction with its R-squared (see definition). The lower the R-squared, the less correlation there is between the fund and the index, and the less reliable beta is as an indicator of volatility.
Equity Exposure. A measure that reflects a fund’s investments in stocks and stock futures. Any holdings in short-term reserves are excluded.
Expense Ratio. The percentage of a fund’s average net assets used to pay its annual administrative and advisory expenses. These expenses directly reduce returns to investors.
Inception Date. The date on which the assets of a fund (or one of its share classes) are first invested in accordance with the fund’s investment objective. For funds with a subscription period, the inception date is the day after that period ends. Investment performance is measured from the inception date.
R-Squared. A measure of how much of a fund’s past returns can be explained by the returns from the market in general, as measured by a given index. If a fund’s total returns were precisely synchronized with an index’s returns, its R-squared would be 1.00. If the fund’s returns bore no relationship to the index’s returns, its R-squared would be 0. For this report, R-squared is based on returns over the past 36 months for both the fund and the index.
Short-Term Reserves. The percentage of a fund invested in highly liquid, short-term securities that can be readily converted to cash.
Turnover Rate. An indication of the fund’s trading activity. Funds with high turnover rates incur higher transaction costs and may be more likely to distribute capital gains (which may be taxable to investors). The turnover rate excludes in-kind transactions, which have minimal impact on costs.
34
This page intentionally left blank.
The People Who Govern Your Fund
The trustees of your mutual fund are there to see that the fund is operated and managed in your best interests since, as a shareholder, you are a part owner of the fund. Your fund’s trustees also serve on the board of directors of The Vanguard Group, Inc., which is owned by the Vanguard funds and provides services to them on an at-cost basis.
A majority of Vanguard’s board members are independent, meaning that they have no affiliation with Vanguard or the funds they oversee, apart from the sizable personal investments they have made as private individuals. The independent board members have distinguished backgrounds in business, academia, and public service. Each of the trustees and executive officers oversees 157 Vanguard funds.
The following table provides information for each trustee and executive officer of the fund. More information about the trustees is in the Statement of Additional Information, which can be obtained, without charge, by contacting Vanguard at 800-662-7447, or online at www.vanguard.com.
Interested Trustees
John J. Brennan1
Born 1954. Trustee Since May 1987. Chairman of the Board. Principal Occupation(s) During the Past Five Years: Chairman of the Board and Director/Trustee of The Vanguard Group, Inc., and of each of the investment companies served by The Vanguard Group; Chief Executive Officer and President of The Vanguard Group and of each of the investment companies served by The Vanguard Group (1996–2008); Chairman of the Financial Accounting Foundation; Governor of the Financial Industry Regulatory Authority (FINRA); Director of United Way of Southeastern Pennsylvania.
F. William McNabb III1
Born 1957. Trustee Since July 2009. Principal Occupation(s) During the Past Five Years: Director of The Vanguard Group, Inc., since 2008; Chief Executive Officer and President of The Vanguard Group and of each of the investment companies served by The Vanguard Group since 2008; Director of Vanguard Marketing Corporation; Managing Director of The Vanguard Group (1995–2008).
Independent Trustees
Charles D. Ellis
Born 1937. Trustee Since January 2001. Principal Occupation(s) During the Past Five Years: Applecore Partners (pro bono ventures in education); Senior Advisor to Greenwich Associates (international business strategy consulting); Successor Trustee of Yale University; Overseer of the Stern School of Business at New York University; Trustee of the Whitehead Institute for Biomedical Research.
Emerson U. Fullwood
Born 1948. Trustee Since January 2008. Principal Occupation(s) During the Past Five Years: Retired Executive Chief Staff and Marketing Officer for North America and Corporate Vice President of Xerox Corporation (photocopiers and printers); Director of SPX Corporation (multi-industry manufacturing), the United Way of Rochester, the Boy Scouts of America, Amerigroup Corporation (direct health and medical insurance carriers), and Monroe Community College Foundation.
Rajiv L. Gupta
Born 1945. Trustee Since December 2001.2 Principal Occupation(s) During the Past Five Years: Retired Chairman and Chief Executive Officer of Rohm and Haas Co. (chemicals); President of Rohm and Haas Co. (2006–2008); Board Member of American Chemistry Council; Director of Tyco International, Ltd. (diversified manufacturing and services) and Hewlett-Packard Co. (electronic computer manufacturing); Trustee of The Conference Board.
Amy Gutmann
Born 1949. Trustee Since June 2006. Principal
Occupation(s) During the Past Five Years: President of the University of Pennsylvania; Christopher H. Browne Distinguished Professor of Political Science in the School of Arts and Sciences with Secondary Appointments at the Annenberg School for Communication and the Graduate School of Education of the University of Pennsylvania; Director of Carnegie Corporation of New York, Schuylkill River Development Corporation, and Greater Philadelphia Chamber of Commerce; Trustee of the National Constitution Center.
JoAnn Heffernan Heisen
Born 1950. Trustee Since July 1998. Principal Occupation(s) During the Past Five Years: Retired Corporate Vice President, Chief Global Diversity Officer, and Member of the Executive Committee of Johnson & Johnson (pharmaceuticals/consumer products); Vice President and Chief Information Officer of Johnson & Johnson (1997–2005); Director of the University Medical Center at Princeton and Women’s Research and Education Institute.
André F. Perold
Born 1952. Trustee Since December 2004. Principal Occupation(s) During the Past Five Years: George Gund Professor of Finance and Banking, Harvard Business School; Director and Chairman of UNX, Inc. (equities trading firm); Chair of the Investment Committee of HighVista Strategies LLC (private investment firm).
Alfred M. Rankin, Jr.
Born 1941. Trustee Since January 1993. Principal Occupation(s) During the Past Five Years: Chairman, President, Chief Executive Officer, and Director of NACCO Industries, Inc. (forklift trucks/housewares/ lignite); Director of Goodrich Corporation (industrial products/aircraft systems and services).
Peter F. Volanakis
Born 1955. Trustee Since July 2009. Principal Occupations During the Past Five Years: President since 2007 and Chief Operating Officer since 2005 of Corning Incorporated (communications equipment); President of Corning Technologies (2001–2005); Director of Corning Incorporated and Dow Corning; Trustee of the Corning Incorporated Foundation and the Corning Museum of Glass; Overseer of the Amos Tuck School of Business Administration at Dartmouth College.
Executive Officers
Thomas J. Higgins1
Born 1957. Chief Financial Officer Since September 2008. Principal Occupation(s) During the Past Five Years: Principal of The Vanguard Group, Inc.; Chief Financial Officer of each of the investment companies served by The Vanguard Group since 2008; Treasurer of each of the investment companies served by The Vanguard Group (1998–2008).
Kathryn J. Hyatt1
Born 1955. Treasurer Since November 2008. Principal Occupation(s) During the Past Five Years: Principal of The Vanguard Group, Inc.; Treasurer of each of the investment companies served by The Vanguard Group since 2008; Assistant Treasurer of each of the investment companies served by The Vanguard Group (1988–2008).
Heidi Stam1
Born 1956. Secretary Since July 2005. Principal Occupation(s) During the Past Five Years: Managing Director of The Vanguard Group, Inc., since 2006; General Counsel of The Vanguard Group since 2005; Secretary of The Vanguard Group and of each of the investment companies served by The Vanguard Group since 2005; Director and Senior Vice President of Vanguard Marketing Corporation since 2005; Principal of The Vanguard Group (1997–2006).
Vanguard Senior Management Team | |
|
|
R. Gregory Barton | Michael S. Miller |
Mortimer J. Buckley | James M. Norris |
Kathleen C. Gubanich | Glenn W. Reed |
Paul A. Heller | George U. Sauter |
Founder
John C. Bogle
Chairman and Chief Executive Officer, 1974–1996
1 These individuals are “interested persons” as defined in the Investment Company Act of 1940.
2 December 2002 for Vanguard Equity Income Fund, Vanguard Growth Equity Fund, the Vanguard Municipal Bond Funds, and the Vanguard State Tax-Exempt Funds.

P.O. Box 2600
Valley Forge, PA 19482-2600
Connect with Vanguard® > www.vanguard.com
Fund Information > 800-662-7447 | All comparative mutual fund data are from Lipper Inc. |
| or Morningstar, Inc., unless otherwise noted. |
Direct Investor Account Services > 800-662-2739 |
|
| You can obtain a free copy of Vanguard’s proxy voting |
Institutional Investor Services > 800-523-1036 | guidelines by visiting our website, www.vanguard.com, |
| and searching for “proxy voting guidelines,” or by |
Text Telephone for People | calling Vanguard at 800-662-2739. The guidelines are |
With Hearing Impairment > 800-952-3335 | also available from the SEC’s website, www.sec.gov. |
| In addition, you may obtain a free report on how your |
| fund voted the proxies for securities it owned during |
| the 12 months ended June 30. To get the report, visit |
This material may be used in conjunction | either www.vanguard.com or www.sec.gov. |
with the offering of shares of any Vanguard |
|
fund only if preceded or accompanied by |
|
the fund’s current prospectus |
|
|
|
| You can review and copy information about your fund |
. | at the SEC’s Public Reference Room in Washington, D.C. |
| To find out more about this public service, call the SEC |
| at 202-551-8090. Information about your fund is also |
| available on the SEC’s website, and you can receive |
| copies of this information, for a fee, by sending a |
| request in either of two ways: via e-mail addressed to |
| publicinfo@sec.gov or via regular mail addressed to the |
| Public Reference Section, Securities and Exchange |
| Commission, Washington, DC 20549-0102. |
|
|
|
|
|
|
|
|
|
|
|
|
|
|
|
|
|
|
|
|
|
|
|
|
|
|
| © 2009 The Vanguard Group, Inc. |
| All rights reserved. |
| Vanguard Marketing Corporation, Distributor. |
|
|
| Q1272 082009 |
Item 2: Not Applicable.
Item 3: Not Applicable.
Item 4: Not Applicable.
Item 5: Not Applicable.
Item 6: Not Applicable.
Item 7: Not Applicable.
Item 8: Not Applicable.
Item 9: Not Applicable.
Item 10: Not Applicable.
Item 11: Controls and Procedures.
(a) Disclosure Controls and Procedures. The Principal Executive and Financial Officers concluded that the Registrant's Disclosure Controls and Procedures are effective based on their evaluation of the Disclosure Controls and Procedures as of a date within 90 days of the filing date of this report.
(b) Internal Control Over Financial Reporting. There were no significant changes in Registrant’s Internal Control Over Financial Reporting or in other factors that could significantly affect this control subsequent to the date of the evaluation, including any corrective actions with regard to significant deficiencies and material weaknesses.
Item 12: Exhibits.
(a) Code of Ethics.
(b) Certifications.
Pursuant to the requirements of the Securities Exchange Act of 1934 and the Investment Company Act of 1940, the registrant has duly caused this report to be signed on its behalf by the undersigned, thereunto duly authorized.
VANGUARD TAX-MANAGED FUNDS | |
BY: | /s/ F. WILLIAM MCNABB III* |
F. WILLIAM MCNABB III | |
CHIEF EXECUTIVE OFFICER | |
Date: August 12, 2009
Pursuant to the requirements of the Securities Exchange Act of 1934 and the Investment Company Act of 1940, this report has been signed below by the following persons on behalf of the registrant and in the capacities and on the dates indicated.
VANGUARD TAX-MANAGED FUNDS | |
BY: | /s/ F. WILLIAM MCNABB III* |
F. WILLIAM MCNABB III | |
CHIEF EXECUTIVE OFFICER | |
Date: August 12, 2009
VANGUARD TAX-MANAGED FUNDS | |
BY: | /s/ THOMAS J. HIGGINS* |
THOMAS J. HIGGINS | |
CHIEF FINANCIAL OFFICER | |
Date: August 12, 2009
* By: /s/ Heidi Stam
Heidi Stam, pursuant to a Power of Attorney filed on July 24, 2009, see file Number 2-88373, Incorporated by Reference.