Gemstar TV Guide International (GMST) Inactive
Filed: 7 Jan 08, 12:00am
Filed by Macrovision Corporation Pursuant to
Rule 425 under the Securities Act of 1933
and deemed filed pursuant to Rule 14a-12
under the Securities Exchange Act of 1934
Subject Companies:
Macrovision Corporation (Commission File No. 000-22023, and
Gemstar-TV Guide International, Inc. (Commission File No. 0-24218)
On and after Monday, January 7, 2008, Macrovision Corporation will use the following materials in connection with certain investor presentations:

Plus
Enabling Digital Home Entertainment
The Combined Opportunity
Forward Looking Statement
Statements contained in this document regarding the consummation and potential timing and benefits of the pending acquisition are forward-looking statements within the meaning of Section 27A of the Securities Act of 1933, as amended, Section 21E of the Securities and Exchange Act of 1934, as amended, and the Private Securities Litigation Reform Act of 1995, and are made under its safe-harbor provisions. Such forward-looking statements include risks and uncertainties; consequently, actual results may differ materially from those expressed or implied thereby. Factors that could cause actual results to differ materially include, but are not limited to: failure to satisfy any of the conditions to complete the acquisition, inability to successfully integrate the businesses and operations of Macrovision and Gemstar-TV Guide, failure to achieve anticipated benefits and cost savings, failure to obtain financing to complete the transaction, and the increased leverage of the combined business, as well as the risk factors relating to each business as disclosed in Macrovision’s and Gemstar-TV Guide’s respective filings with the Securities and Exchange Commission. Readers are cautioned not to place undue reliance on these forward-looking statements, which reflect management’s analysis only as of the date hereof. Except as required by law, Macrovision and Gemstar-TV Guide undertakes no obligation to publicly release the results of any revision to these forward-looking statements that may be made to reflect events or circumstances after the date hereof or to reflect the occurrence of unanticipated events.
Additional Information
MACROVISION AND GEMSTAR-TV GUIDE STOCKHOLDERS ARE URGED TO READ THE JOINT PROXY STATEMENT/PROSPECTUS AND REGISTRATION STATEMENT REGARDING THE PROPOSED TRANSACTION WHEN IT BECOMES AVAILABLE BECAUSE IT WILL CONTAIN IMPORTANT INFORMATION ABOUT THE PROPOSED TRANSACTION. Stockholders may obtain a free copy of the joint proxy statement/prospectus and registration statement (when available), as well as other documents filed by Macrovision and Gemstar-TV Guide with the Securities and Exchange Commission, at the Securities and Exchange Commission’s Web site at http://www.sec.gov. Stockholders may also obtain a free copy of the joint proxy statement/prospectus and registration statement and the filings with the SEC that will be incorporated by reference in the joint proxy statement/prospectus directly from Macrovision by directing a request to Macrovision Investor Relations at 408-969-5475 and directly from Gemstar-TV Guide by directing a request to Gemstar-TV Guide Investor Relations at 323-817-4600.
Each company’s directors and executive officers and other persons may be deemed, under Securities and Exchange Commission rules, to be participants in the solicitation of proxies in connection with the proposed transaction. Information regarding Macrovision’s directors and officers can be found in its proxy statement filed with the Securities and Exchange Commission on March 20, 2007 and information regarding Gemstar-TV Guide’s directors and officers can be found in its proxy statement filed with the Securities and Exchange Commission on April 10, 2007. Additional information regarding the participants in the proxy solicitation and a description of their direct and indirect interests in the transaction, by security holdings or otherwise, will be contained in the joint proxy statement/prospectus and other relevant materials to be filed with the Securities and Exchange Commission when they become available.
Combined Company Focus
Overview
Digital Media Infrastructure Leaders to Combine
Gemstar-TV Guide – leader in video guidance and entertainment
IPGs operating in 24M North American households
13M using i-Guide or Passport, 11M using Guideworks i-Guide
Over 25 million CE IPGs shipped worldwide to-date
Products and Services reach over 73 million unique consumers per week
Macrovision – leader in content security, management, and recognition
Technology on over 9B DVDs, over 500M devices, over 500M PC’s
Empowering customers to enable consumers to enjoy digital media on their terms
Content owners seeking to securely distribute media amid shift from analog to digital
Service providers seeking to reduce churn through enhanced services
Device manufacturers seeking independent third party solutions
Discover, acquire, manage and enjoy digital content across platforms and channels
Key Combined Company Highlights
Overview
Poised for opportunities across evolving digital media value chain
Leading IP licensing technology provider
Approximately 450 U.S. and 1,900 international patents issued at closing
Proprietary databases of music, movies, TV, and games metadata
Gemstar-TV Guide - 1M TV series episodes, 190K movies
Macrovision - 11M songs, 1M albums, 500K cover images
Core technologies include protection, distribution, and enhancement
Industry standard technologies include BD+, ACP
Leadership position in IPG’s
DLNA standards-based connected platform
Customer footprint extends across the content value chain
Movie studios, system operators, Internet content distributors, device manufacturers
Compelling Financial Model
Predictable revenue streams
Predominantly royalty-based, recurring revenue streams
Driven by growth in shipments of media & devices
Significant leverage in operating model
Low variable costs
Diversified market, customers, and technology footprint
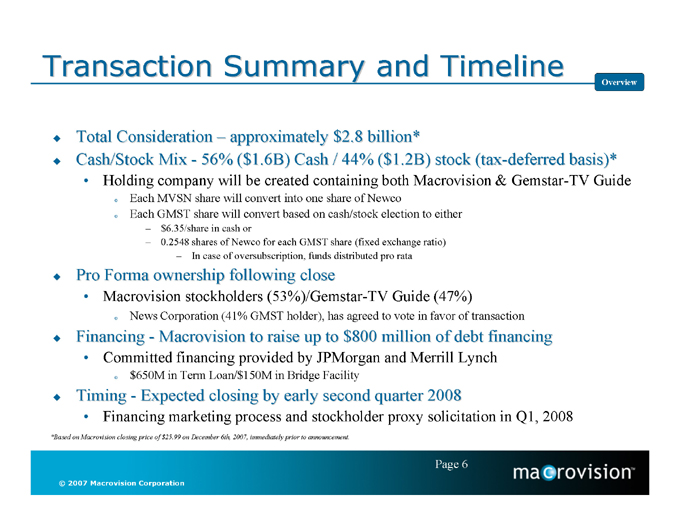
Transaction Summary and Timeline
Overview
Total Consideration – approximately $2.8 billion*
Cash/Stock Mix - 56% ($1.6B) Cash / 44% ($1.2B) stock (tax-deferred basis)*
Holding company will be created containing both Macrovision & Gemstar-TV Guide
Each MVSN share will convert into one share of Newco
Each GMST share will convert based on cash/stock election to either
$6.35/share in cash or
0.2548 shares of Newco for each GMST share (fixed exchange ratio)
In case of oversubscription, funds distributed pro rata
Pro Forma ownership following close
Macrovision stockholders (53%)/Gemstar-TV Guide (47%)
News Corporation (41% GMST holder), has agreed to vote in favor of transaction
Financing - Macrovision to raise up to $800 million of debt financing
Committed financing provided by JPMorgan and Merrill Lynch
$650M in Term Loan/$150M in Bridge Facility
Timing - Expected closing by early second quarter 2008
Financing marketing process and stockholder proxy solicitation in Q1, 2008
*Based on Macrovision closing price of $25.99 on December 6th, 2007, immediately prior to announcement.
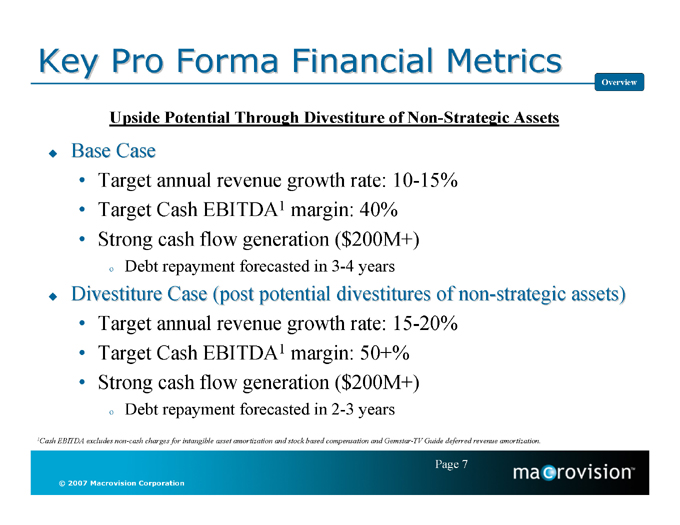
Key Pro Forma Financial Metrics
Overview
Upside Potential Through Divestiture of Non-Strategic Assets
Base Case
Target annual revenue growth rate: 10-15%
Target Cash EBITDA1 margin: 40%
Strong cash flow generation ($200M+)
Debt repayment forecasted in 3-4 years
Divestiture Case (post potential divestitures of non-strategic assets)
Target annual revenue growth rate: 15-20%
Target Cash EBITDA1 margin: 50+%
Strong cash flow generation ($200M+)
Debt repayment forecasted in 2-3 years
1Cash EBITDA excludes non-cash charges for intangible asset amortization and stock based compensation and Gemstar-TV Guide deferred revenue amortization.
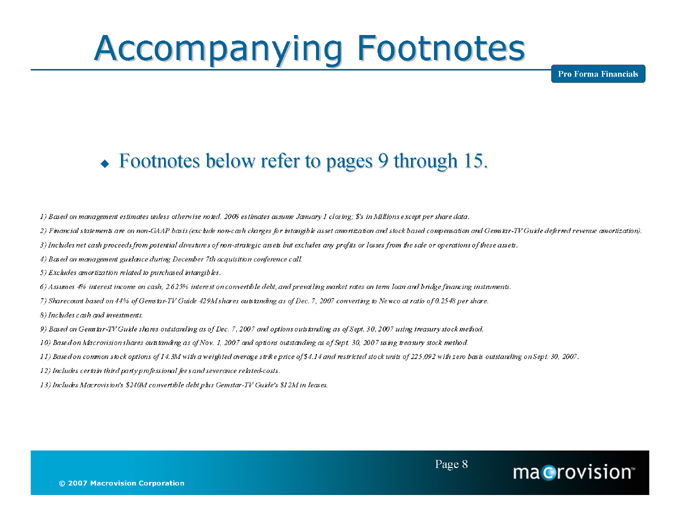
Accompanying Footnotes
Pro Forma Financials
Footnotes below refer to pages 9 through 15.
1) Based on management estimates unless otherwise noted. 2008 estimates assume January 1 closing; $’s in Millions except per share data.
2) Financial statements are on non-GAAP basis (exclude non-cash charges for intangible asset amortization and stock based compensation and Gemstar-TV Guide deferred revenue amortization).
3) Includes net cash proceeds from potential divestures of non-strategic assets but excludes any profits or losses from the sale or operations of these assets.
4) Based on management guidance during December 7th acquisition conference call.
5) Excludes amortization related to purchased intangibles.
6) Assumes 4% interest income on cash, 2.625% interest on convertible debt, and prevailing market rates on term loan and bridge financing instruments.
7) Sharecount based on 44% of Gemstar-TV Guide 429M shares outstanding as of Dec. 7, 2007 converting to Newco at ratio of 0.2548 per share.
8) Includes cash and investments.
9) Based on Gemstar-TV Guide shares outstanding as of Dec. 7, 2007 and options outstanding as of Sept. 30, 2007 using treasury stock method.
10) Based on Macrovision shares outstanding as of Nov. 1, 2007 and options outstanding as of Sept. 30, 2007 using treasury stock method.
11) Based on common stock options of 14.3M with a weighted average strike price of $4.14 and restricted stock units of 225,092 with zero basis outstanding on Sept. 30, 2007.
12) Includes certain third party professional fees and severance related-costs.
13) Includes Macrovision’s $240M convertible debt plus Gemstar-TV Guide’s $12M in leases.
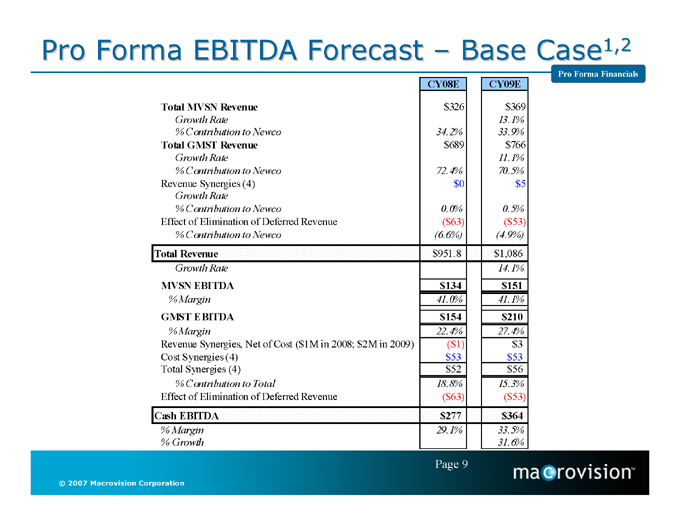
Pro Forma EBITDA Forecast – Base Case1,2
Pro Forma Financials
CY08E | CY09E | |||
Total MVSN Revenue | $326 | $369 | ||
Growth Rate | 13.1% | |||
% Contribution to Newco | 34.2% | 33.9% | ||
Total GMST Revenue | $689 | $766 | ||
Growth Rate | 11.1% | |||
% Contribution to Newco | 72.4% | 70.5% | ||
Revenue Synergies (4) | $0 | $5 | ||
Growth Rate | ||||
% Contribution to Newco | 0.0% | 0.5% | ||
Effect of Elimination of Deferred Revenue | ($63) | ($53) | ||
% Contribution to Newco | (6.6%) | (4.9%) | ||
Total Revenue | $951.8 | $1,086 | ||
Growth Rate | 14.1% | |||
MVSN EBITDA | $134 | $151 | ||
% Margin | 41.0% | 41.1% | ||
GMST EBITDA | $154 | $210 | ||
% Margin | 22.4% | 27.4% | ||
Revenue Synergies, Net of Cost ($1M in 2008; $2M in 2009) | ($1) | $3 | ||
Cost Synergies (4) | $53 | $53 | ||
Total Synergies (4) | $52 | $56 | ||
% Contribution to Total | 18.8% | 15.3% | ||
Effect of Elimination of Deferred Revenue | ($63) | ($53) | ||
Cash EBITDA | $277 | $364 | ||
% Margin | 29.1% | 33.5% | ||
% Growth | 31.6% |
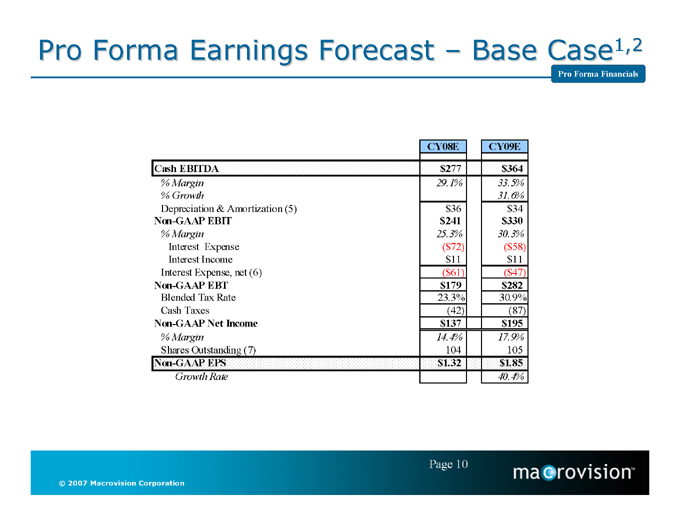
Pro Forma Earnings Forecast – Base Case1,2
Pro Forma Financials
CY08E | CY09E | |||
Cash EBITDA | $277 | $364 | ||
% Margin | 29.1% | 35.5% | ||
% Growth | 31.6% | |||
Depreciation & Amortization (5) | $36 | $34 | ||
Non-GAAP EBIT | $241 | $330 | ||
% Margin | 25.3% | 30.3% | ||
Interest Expense | ($72) | ($58) | ||
Interest Income | $11 | $11 | ||
Interest Expense, net (6) | ($61) | ($47) | ||
Non-GAAP EBT | $179 | $282 | ||
Blended Tax Rate | 23.3% | 30.9% | ||
Cash Taxes | (42) | (87) | ||
Non-GAAP Net Income | $137 | $195 | ||
% Margin | 14.4% | 17.9% | ||
Shares Outstanding (7) | 104 | 105 | ||
|Non-GAAP EPS | $1.32 | $1.85 | ||
Growth Rate | 40.4% |
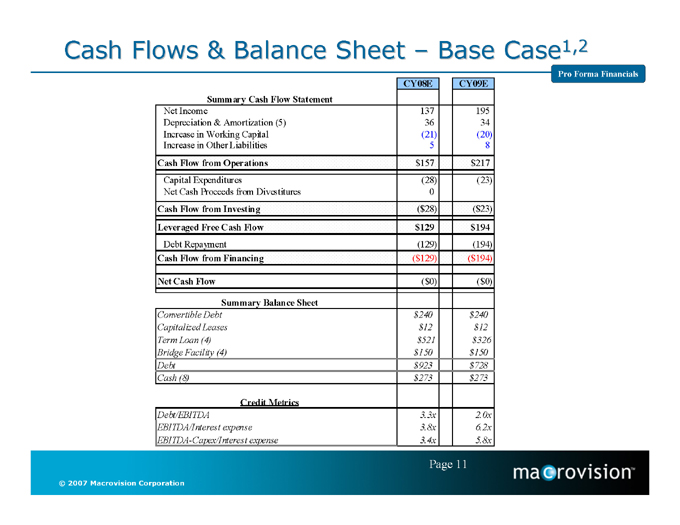
Cash Flows & Balance Sheet – Base Case1,2
Pro Forma Financials
Summary Cash Flow Statement |
| CY08E |
|
| CY09E |
| ||
Net Income Depreciation & Amortization (5) Increase in Working Capital Increase in Other Liabilities |
| 137 36 (21 5 |
)
|
| 195 34 (20 8 |
)
| ||
Cash Flow from Operations | $ | 157 |
| $ | 217 |
| ||
Capital Expenditures Net Cash Proceeds from Divestitures |
| (28 0 | )
|
| (23 | ) | ||
Cash Flow from Investing | ($ | 28 | ) | ($ | 23 | ) | ||
Leveraged Free Cash Flow | $ | 129 |
| $ | 194 |
| ||
Debt Repayment |
| (129 | ) |
| (194 | ) | ||
Cash Flow from Financing | ($ | 129 | ) | ($ | 194 | ) | ||
Net Cash Flow | ($ | 0 | ) | ($ | 0 | ) | ||
Summary Balance Sheet | ||||||||
Convertible Debt Capitalized Leases Term Loan (4) Bridge Facility (4) | $ $ $ $ | 240 12 521 150 |
| $ $ $ $ | 240 12 326 150 |
| ||
Debt | $ | 923 |
| $ | 728 |
| ||
Cash (8) | $ | 273 |
| $ | 273 |
| ||
Credit Metrics | ||||||||
Debt/EBITDA EBITDA/Interest expense EBITDA-Capex/Interest expense |
| 3.3x 3.8x 3.4x |
|
| 2.0x 6.2x 5.8x |
|
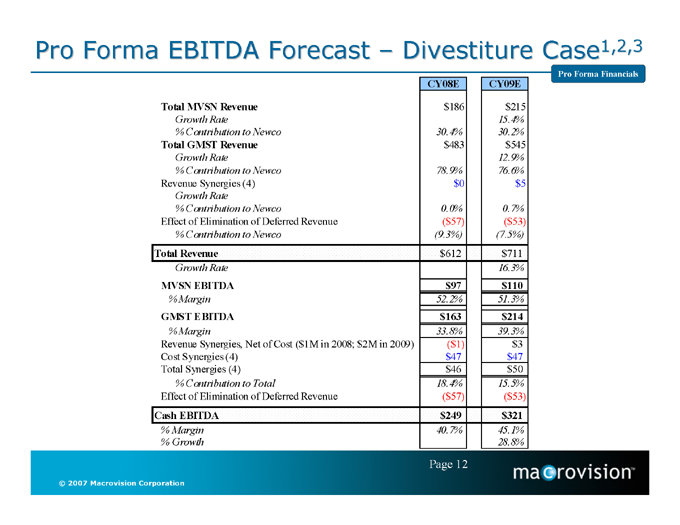
Pro Forma EBITDA Forecast – Divestiture Case1,2,3
Pro Forma Financials
CY08E | CY09E | |||||
Total MVSN Revenue | $186 | $215 | ||||
Growth Rate | 15.4% | |||||
% Contribution to Newco | 30.4% | 30.2% | ||||
Total GMST Revenue | $483 | $545 | ||||
Growth Rate | 12.9% | |||||
% Contribution to Newco | 78.9% | 76.6% | ||||
Revenue Synergies (4) | $0 | $5 | ||||
Growth Rate | ||||||
% Contribution to Newco | 0.0% | 0.7% | ||||
Effect of Elimination of Deferred Revenue | ($57) | ($53) | ||||
% Contribution to Newco | (9.3%) | (7.5%) | ||||
Total Revenue | $612 | $711 | ||||
Growth Rate | — | 16.3% | ||||
MVSN EBITDA | $97 | $110 | ||||
% Margin | 52.2% | 51.3% | ||||
GMST EBITDA | $163 | $214 | ||||
% Margin | 33.8% | 39.3% | ||||
Revenue Synergies, Net of Cost ($1M in 2008; $2M in 2009) | ($1) | $3 | ||||
Cost Synergies (4) | $47 | $47 | ||||
Total Synergies (4) | $46 | $50 | ||||
% Contribution to Total | 18.4% | 15.5% | ||||
Effect of Elimination of Deferred Revenue | ($57) | ($53) | ||||
Cash EBITDA | $249 | $321 | ||||
% Margin | 40.7% | 45.1% | ||||
% Growth | 28.8% |
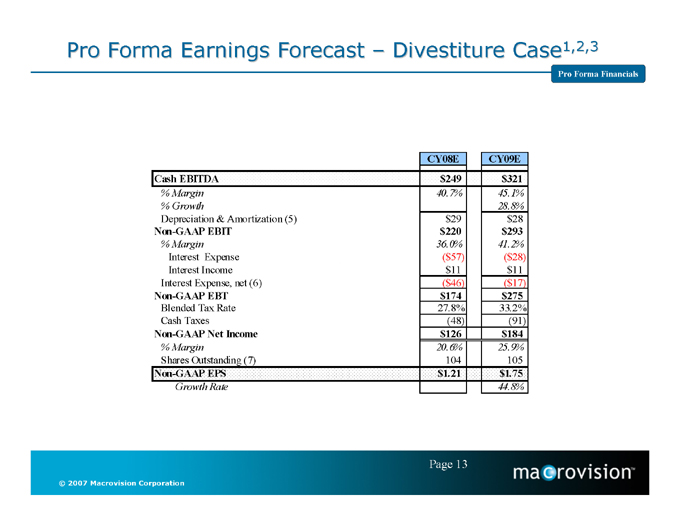
Pro Forma Earnings Forecast – Divestiture Case1,2,3
Pro Forma Financials
| CY08E |
|
| CY09E |
| |||
Cash EBITDA | $ | 249 |
| $ | 321 |
| ||
% Margin |
| 40.7 | % |
| 45.1 | % | ||
% Growth |
| 28.8 | % | |||||
Depreciation & Amortization (5) | $ | 29 |
| $ | 28 |
| ||
Non-GAAP EBIT | $ | 220 |
| $ | 293 |
| ||
% Margin |
| 36.0 | % |
| 41.2 | % | ||
Interest Expense | ($ | 57 | ) | ($ | 28 | ) | ||
Interest Income | $ | 11 |
| $ | 11 |
| ||
Interest Expense, net (6) | ($ | 46 | ) | ($ | 17 | ) | ||
Non-GAAP EBT | $ | 174 |
| $ | 275 |
| ||
Blended Tax Rate |
| 27.8 | % |
| 33.2 | % | ||
Cash Taxes |
| (48 | ) |
| (91 | ) | ||
Non-GAAP Net Income | $ | 126 |
| $ | 184 |
| ||
% Margin Shares Outstanding (7) |
| 20.6 104 | %
|
| 25.9 105 | %
| ||
Non-GAAP EPS | $ | 1.21 |
| $ | 1.75 |
| ||
Growth Rate |
| 44.8 | % |
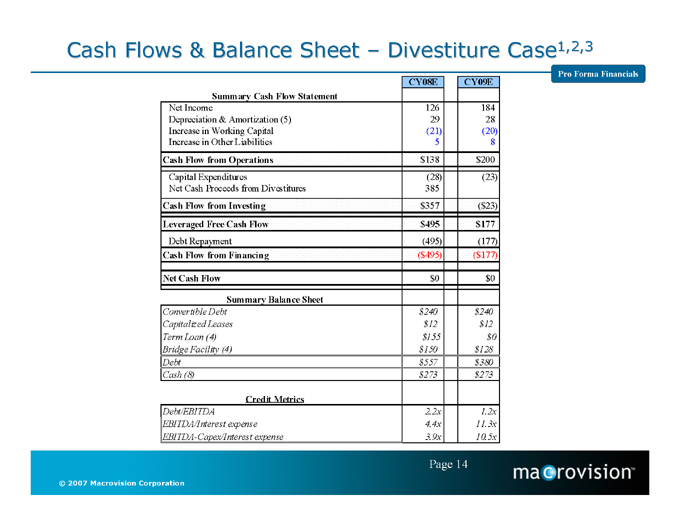
Cash Flows & Balance Sheet – Divestiture Case1,2,3
Pro Forma Financials
Summary Cash Flow Statement | CY08E | CY09E | ||
Net Income Depreciation & Amortization (5) Increase in Working Capital Increase in Other Liabilities | 126 29 (21) 5 | 184 28 (20) 8 | ||
Cash Flow from Operations | $138 | $200 | ||
Capital Expenditures Net Cash Proceeds from Divestitures | (28) 385 | (23) | ||
Cash Flow from Investing | $357 | ($23) | ||
Leveraged Free Cash Flow | $495 | $177 | ||
Debt Repayment | (495) | (177) | ||
Cash Flow from Financing | ($495) | ($177) | ||
Net Cash Flow | $0 | $0 | ||
Summary Balance Sheet | ||||
Convertible Debt Capitalized Leases Term Loan (4) Bridge Facility (4) | $240 $12 $155 $150 | $240 $12 $0 $128 | ||
Debt | $557 | $380 | ||
Cash (8) | $273 | $273 | ||
Credit Metrics | ||||
Debt/EBITDA EBITDA/Interest expense EBITDA-Capex/Interest expense | 2.2x 4.4x 3.9x | 1.2x |
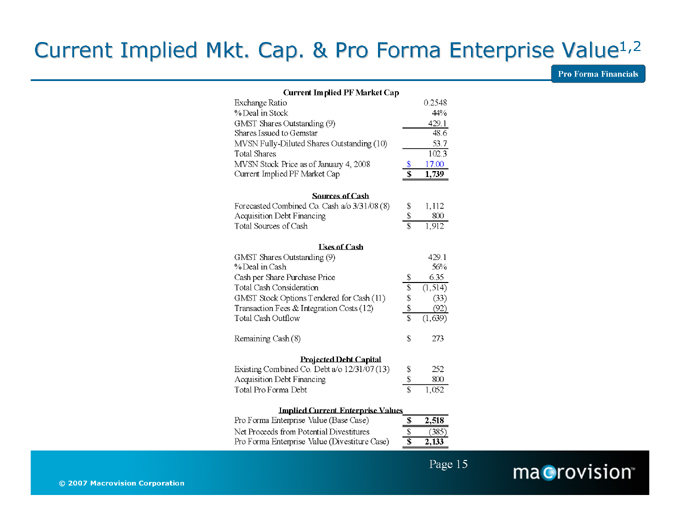
Current Implied Mkt. Cap. & Pro Forma Enterprise Value1,2
Pro Forma Financials
Current Implied PF Market Cap | ||
Exchange Ratio % Deal in Stock GMST Shares Outstanding (9) | 0.2548 44% 429.1 | |
Shares Issued to Gemstar | 48.6 | |
MVSN Fully-Diluted Shares Outstanding (10) | 53.7 | |
Total Shares MVSN Stock Price as of January 4, 2008 | 102.3 $17.00 | |
Current Implied PF Market Cap | $1,739 | |
Sources of Cash | ||
Forecasted Combined Co. Cash a/o 3/31/08 (8) | $1,112 | |
Acquisition Debt Financing | $800 | |
Total Sources of Cash Uses of Cash GMST Shares Outstanding (9) % Deal in Cash Cash per Share Purchase Price | $1,912 429.1 56% $6.35 | |
Total Cash Consideration GMST Stock Options Tendered for Cash (11) Transaction Fees & Integration Costs (12) | $(1,514) $(33) $(92) | |
Total Cash Outflow Remaining Cash (8) | $(1,639) $273 | |
Projected Debt Capital | ||
Existing Combined Co. Debt a/o 12/31/07 (13) Acquisition Debt Financing | $252 $800 | |
Total Pro Forma Debt | $1,052 | |
Implied Current Enterprise Values | ||
Pro Forma Enterprise Value (Base Case) | $2,518 | |
Net Proceeds from Potential Divestitures | $(385) | |
Pro Forma Enterprise Value (Divestiture Case) | $2,133 |