


Searchable text section of graphics shown above
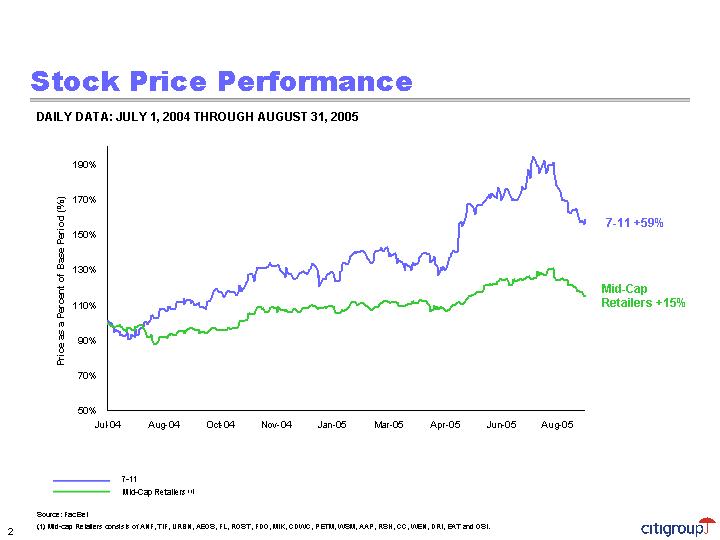
Stock Price Performance
DAILY DATA: JULY 1, 2004 THROUGH AUGUST 31, 2005
[CHART]
Source: FactSet
(1) Mid-cap Retailers consists of ANF, TIF, URBN, AEOS, FL, ROST, FDO, MIK, CDWC, PETM, WSM, AAP, RSH, CC, WEN, DRI, EAT and OSI.
[LOGO]
2
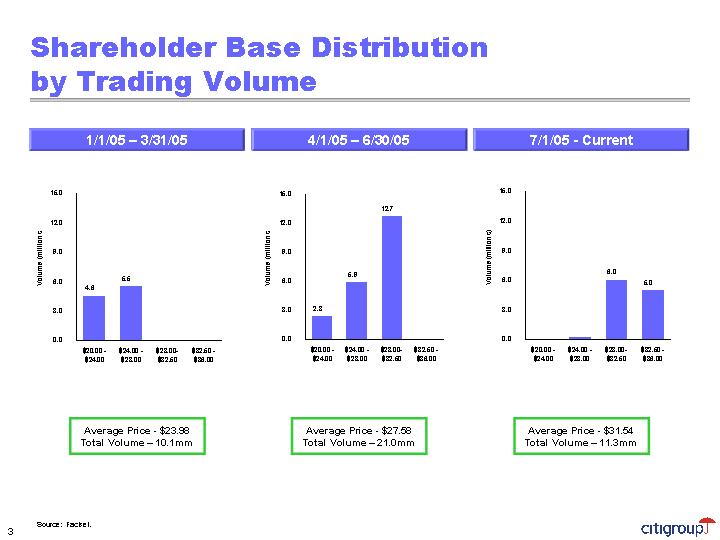
Shareholder Base Distribution by Trading Volume
1/1/05 – 3/31/05 |
| 4/1/05 – 6/30/05 |
| 7/1/05 – Current |
|
|
|
|
|
[CHART] |
| [CHART] |
| [CHART] |
|
|
|
|
|
Average Price - $23.98 |
| Average Price - $27.58 |
| Average Price - $31.54 |
Total Volume – 10.1mm |
| Total Volume – 21.0mm |
| Total Volume – 11.3mm |
Source: Factset.
3
Changes in EPS and P/E Multiples
Based on Wall Street Expectations on June 30, 2004 vs. Today
1-Year Forward EPS |
| 1-Year Forward P/E Multiple |
|
|
|
[CHART] |
| [CHART] |
|
|
|
1-Year Forward P/E Multiple |
| 1-Year Forward P/E Multiple |
(June 30, 2004) |
| (Current) |
|
|
|
[CHART] |
| [CHART] |
Source: Facset.
4
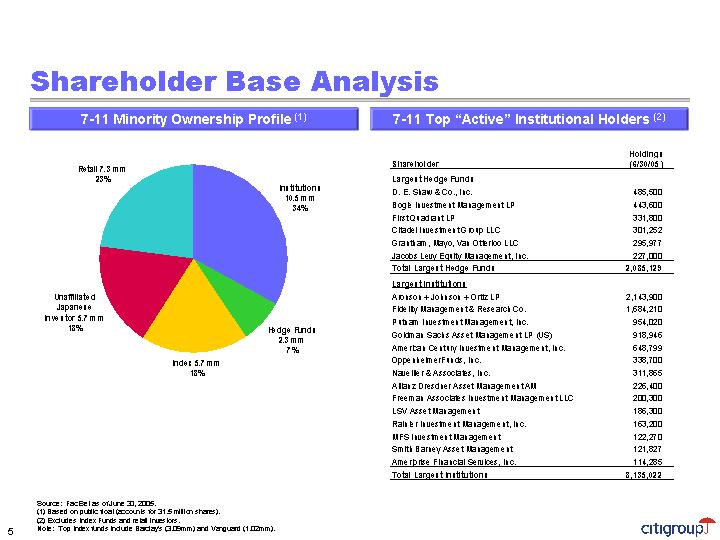
Shareholder Base Analysis
7-11 Minority Ownership Profile (1)
[CHART]
7-11 Top “Active” Institutional Holders (2)
Shareholder |
| Holdings |
|
|
|
|
|
Largest Hedge Funds |
|
|
|
D. E. Shaw & Co., Inc. |
| 485,500 |
|
Bogle Investment Management LP |
| 443,600 |
|
First Quadrant LP |
| 331,800 |
|
Citadel Investment Group LLC |
| 301,252 |
|
Grantham, Mayo, Van Otterloo LLC |
| 295,977 |
|
Jacobs Levy Equity Management, Inc. |
| 227,000 |
|
Total Largest Hedge Funds |
| 2,085,129 |
|
|
|
|
|
Largest Institutions |
|
|
|
Aronson + Johnson + Ortiz LP |
| 2,143,900 |
|
Fidelity Management & Research Co. |
| 1,684,210 |
|
Putnam Investment Management, Inc. |
| 954,020 |
|
Goldman Sachs Asset Management LP (US) |
| 918,946 |
|
American Century Investment Management, Inc. |
| 648,799 |
|
OppenheimerFunds, Inc. |
| 338,700 |
|
Navellier & Associates, Inc. |
| 311,865 |
|
Allianz Dresdner Asset Management AM |
| 226,400 |
|
Freeman Associates Investment Management LLC |
| 200,300 |
|
LSV Asset Management |
| 186,300 |
|
Rainier Investment Management, Inc. |
| 163,200 |
|
MFS Investment Management |
| 122,270 |
|
Smith Barney Asset Management |
| 121,827 |
|
Ameriprise Financial Services, Inc. |
| 114,285 |
|
Total Largest Institutions |
| 8,135,022 |
|
Source: FactSet as of June 30, 2005.
(1) Based on public float (accounts for 31.5 million shares).
(2) Excludes Index Funds and retail investors.
Note: Top Index funds include Barclay’s (3.09mm) and Vanguard (1.02mm).
5
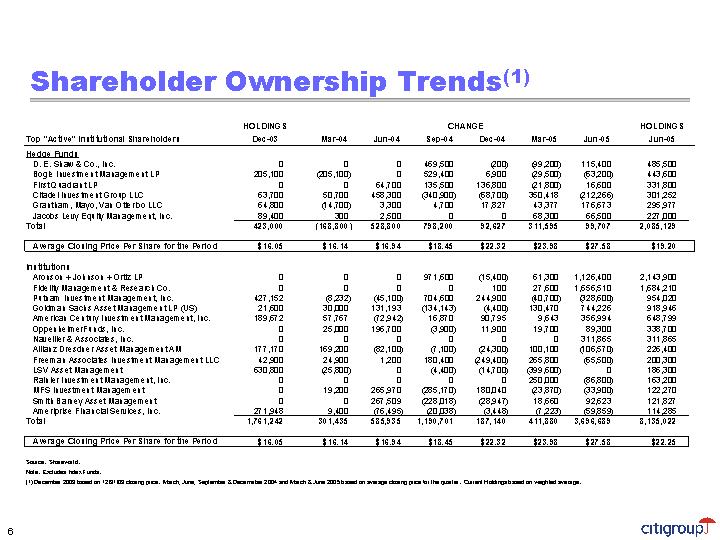
Shareholder Ownership Trends(1)
|
| HOLDINGS |
| CHANGE |
| HOLDINGS |
| ||||||||||||||||||
Top “Active” Institutional Shareholders |
| Dec-03 |
| Mar-04 |
| Jun-04 |
| Sep-04 |
| Dec-04 |
| Mar-05 |
| Jun-05 |
| Jun-05 |
| ||||||||
|
|
|
|
|
|
|
|
|
|
|
|
|
|
|
|
|
| ||||||||
Hedge Funds |
|
|
|
|
|
|
|
|
|
|
|
|
|
|
|
|
| ||||||||
D. E. Shaw & Co., Inc. |
| 0 |
| 0 |
| 0 |
| 469,500 |
| (200 | ) | (99,200 | ) | 115,400 |
| 485,500 |
| ||||||||
Bogle Investment Management LP |
| 205,100 |
| (205,100 | ) | 0 |
| 529,400 |
| 6,900 |
| (29,500 | ) | (63,200 | ) | 443,600 |
| ||||||||
First Quadrant LP |
| 0 |
| 0 |
| 64,700 |
| 135,500 |
| 136,800 |
| (21,800 | ) | 16,600 |
| 331,800 |
| ||||||||
Citadel Investment Group LLC |
| 63,700 |
| 50,700 |
| 458,300 |
| (340,900 | ) | (68,700 | ) | 350,418 |
| (212,266 | ) | 301,252 |
| ||||||||
Grantham, Mayo, Van Otterloo LLC |
| 64,800 |
| (14,700 | ) | 3,300 |
| 4,700 |
| 17,827 |
| 43,377 |
| 176,673 |
| 295,977 |
| ||||||||
Jacobs Levy Equity Management, Inc. |
| 89,400 |
| 300 |
| 2,500 |
| 0 |
| 0 |
| 68,300 |
| 66,500 |
| 227,000 |
| ||||||||
Total |
| 423,000 |
| (168,800 | ) | 528,800 |
| 798,200 |
| 92,627 |
| 311,595 |
| 99,707 |
| 2,085,129 |
| ||||||||
|
|
|
|
|
|
|
|
|
|
|
|
|
|
|
|
|
| ||||||||
Average Closing Price Per Share for the Period |
| $ | 16.05 |
| $ | 16.14 |
| $ | 16.94 |
| $ | 18.45 |
| $ | 22.32 |
| $ | 23.98 |
| $ | 27.58 |
| $ | 19.20 |
|
|
|
|
|
|
|
|
|
|
|
|
|
|
|
|
|
|
| ||||||||
Institutions |
|
|
|
|
|
|
|
|
|
|
|
|
|
|
|
|
| ||||||||
Aronson + Johnson + Ortiz LP |
| 0 |
| 0 |
| 0 |
| 971,600 |
| (15,400 | ) | 61,300 |
| 1,126,400 |
| 2,143,900 |
| ||||||||
Fidelity Management & Research Co. |
| 0 |
| 0 |
| 0 |
| 0 |
| 100 |
| 27,600 |
| 1,656,510 |
| 1,684,210 |
| ||||||||
Putnam Investment Management, Inc. |
| 427,152 |
| (8,232 | ) | (45,100 | ) | 704,600 |
| 244,900 |
| (40,700 | ) | (328,600 | ) | 954,020 |
| ||||||||
Goldman Sachs Asset Management LP (US) |
| 21,600 |
| 30,000 |
| 131,193 |
| (134,143 | ) | (4,400 | ) | 130,470 |
| 744,226 |
| 918,946 |
| ||||||||
American Century Investment Management, Inc. |
| 189,672 |
| 57,767 |
| (72,942 | ) | 16,870 |
| 90,795 |
| 9,643 |
| 356,994 |
| 648,799 |
| ||||||||
OppenheimerFunds, Inc. |
| 0 |
| 25,000 |
| 196,700 |
| (3,900 | ) | 11,900 |
| 19,700 |
| 89,300 |
| 338,700 |
| ||||||||
Navellier & Associates, Inc. |
| 0 |
| 0 |
| 0 |
| 0 |
| 0 |
| 0 |
| 311,865 |
| 311,865 |
| ||||||||
Allianz Dresdner Asset Management AM |
| 177,170 |
| 169,200 |
| (82,100 | ) | (7,100 | ) | (24,300 | ) | 100,100 |
| (106,570 | ) | 226,400 |
| ||||||||
Freeman Associates Investment Management LLC |
| 42,900 |
| 24,900 |
| 1,200 |
| 180,400 |
| (249,400 | ) | 265,800 |
| (65,500 | ) | 200,300 |
| ||||||||
LSV Asset Management |
| 630,800 |
| (25,800 | ) | 0 |
| (4,400 | ) | (14,700 | ) | (399,600 | ) | 0 |
| 186,300 |
| ||||||||
Rainier Investment Management, Inc. |
| 0 |
| 0 |
| 0 |
| 0 |
| 0 |
| 250,000 |
| (86,800 | ) | 163,200 |
| ||||||||
MFS Investment Management |
| 0 |
| 19,200 |
| 265,970 |
| (285,170 | ) | 180,040 |
| (23,870 | ) | (33,900 | ) | 122,270 |
| ||||||||
Smith Barney Asset Management |
| 0 |
| 0 |
| 267,509 |
| (228,018 | ) | (28,947 | ) | 18,660 |
| 92,623 |
| 121,827 |
| ||||||||
Ameriprise Financial Services, Inc. |
| 271,948 |
| 9,400 |
| (76,495 | ) | (20,038 | ) | (3,448 | ) | (7,223 | ) | (59,859 | ) | 114,285 |
| ||||||||
Total |
| 1,761,242 |
| 301,435 |
| 585,935 |
| 1,190,701 |
| 187,140 |
| 411,880 |
| 3,696,689 |
| 8,135,022 |
| ||||||||
|
|
|
|
|
|
|
|
|
|
|
|
|
|
|
|
|
| ||||||||
Average Closing Price Per Share for the Period |
| $ | 16.05 |
| $ | 16.14 |
| $ | 16.94 |
| $ | 18.45 |
| $ | 22.32 |
| $ | 23.98 |
| $ | 27.58 |
| $ | 22.25 |
|
Source: Shareworld.
Note: Excludes Index Funds.
(1) December 2003 based on 12/31/03 closing price. March, June, September & Decemeber 2004 and March & June 2005 based on average closing price for the quarter. Current Holdings based on weighted average.
6
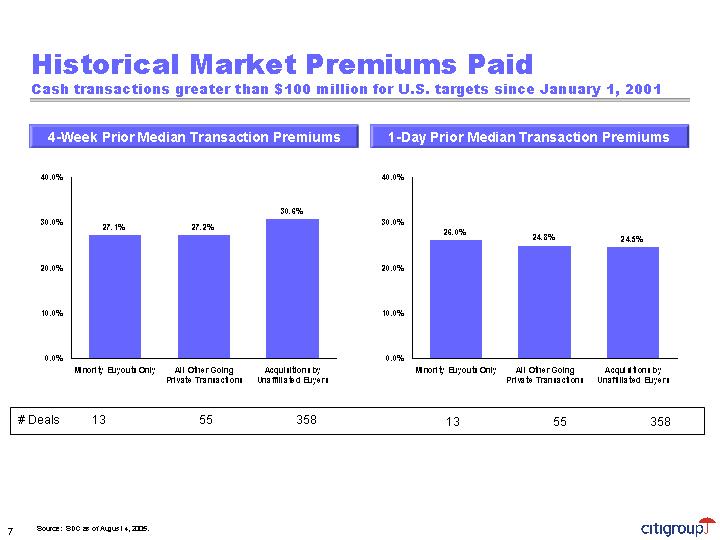
Historical Market Premiums Paid
Cash transactions greater than $100 million for U.S. targets since January 1, 2001
4-Week Prior Median Transaction Premiums |
| 1-Day Prior Median Transaction Premiums | ||||||||||
|
|
| ||||||||||
|
| [CHART] |
| [CHART] | ||||||||
|
|
|
|
|
|
|
|
|
|
|
|
|
# Deals |
| 13 |
| 55 |
| 358 |
| 13 |
| 55 |
| 358 |
Source: SDC as of August 4, 2005.
7
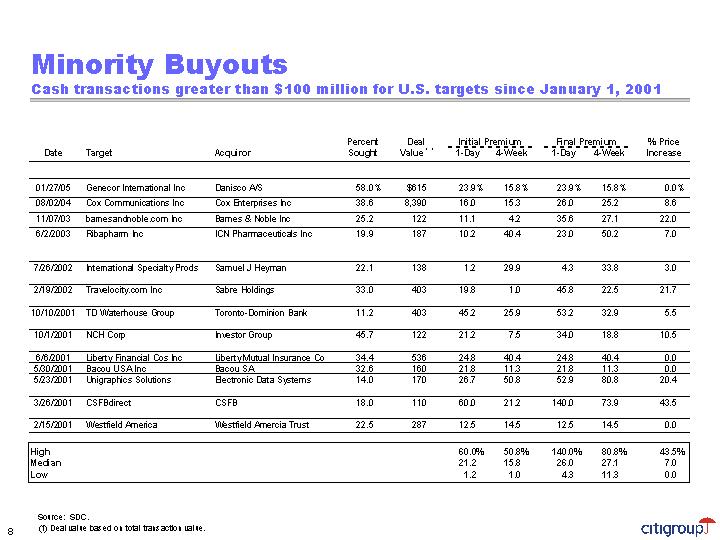
Minority Buyouts
Cash transactions greater than $100 million for U.S. targets since January 1, 2001
|
|
|
|
|
| Percent |
| Deal |
| Initial Premium |
| Final Premium |
| % Price |
| |||||
Date |
| Target |
| Acquiror |
| Sought |
| Value (1) |
| 1-Day |
| 4-Week |
| 1-Day |
| 4-Week |
| Increase |
| |
|
|
|
|
|
|
|
|
|
|
|
|
|
|
|
|
|
|
|
| |
01/27/05 |
| Genecor International Inc |
| Danisco A/S |
| 58.0 | % | $ | 615 |
| 23.9 | % | 15.8 | % | 23.9 | % | 15.8 | % | 0.0 | % |
08/02/04 |
| Cox Communications Inc |
| Cox Enterprises Inc |
| 38.6 |
| 8,390 |
| 16.0 |
| 15.3 |
| 26.0 |
| 25.2 |
| 8.6 |
| |
11/07/03 |
| barnesandnoble.com Inc |
| Barnes & Noble Inc |
| 25.2 |
| 122 |
| 11.1 |
| 4.2 |
| 35.6 |
| 27.1 |
| 22.0 |
| |
6/2/2003 |
| Ribapharm Inc |
| ICN Pharmaceuticals Inc |
| 19.9 |
| 187 |
| 10.2 |
| 40.4 |
| 23.0 |
| 50.2 |
| 7.0 |
| |
|
|
|
|
|
|
|
|
|
|
|
|
|
|
|
|
|
|
|
| |
7/26/2002 |
| International Specialty Prods |
| Samuel J Heyman |
| 22.1 |
| 138 |
| 1.2 |
| 29.9 |
| 4.3 |
| 33.8 |
| 3.0 |
| |
|
|
|
|
|
|
|
|
|
|
|
|
|
|
|
|
|
|
|
| |
2/19/2002 |
| Travelocity.com Inc |
| Sabre Holdings |
| 33.0 |
| 403 |
| 19.8 |
| 1.0 |
| 45.8 |
| 22.5 |
| 21.7 |
| |
|
|
|
|
|
|
|
|
|
|
|
|
|
|
|
|
|
|
|
| |
10/10/2001 |
| TD Waterhouse Group |
| Toronto-Dominion Bank |
| 11.2 |
| 403 |
| 45.2 |
| 25.9 |
| 53.2 |
| 32.9 |
| 5.5 |
| |
|
|
|
|
|
|
|
|
|
|
|
|
|
|
|
|
|
|
|
| |
10/1/2001 |
| NCH Corp |
| Investor Group |
| 45.7 |
| 122 |
| 21.2 |
| 7.5 |
| 34.0 |
| 18.8 |
| 10.5 |
| |
|
|
|
|
|
|
|
|
|
|
|
|
|
|
|
|
|
|
|
| |
6/6/2001 |
| Liberty Financial Cos Inc |
| Liberty Mutual Insurance Co |
| 34.4 |
| 536 |
| 24.8 |
| 40.4 |
| 24.8 |
| 40.4 |
| 0.0 |
| |
5/30/2001 |
| Bacou USA Inc |
| Bacou SA |
| 32.6 |
| 160 |
| 21.8 |
| 11.3 |
| 21.8 |
| 11.3 |
| 0.0 |
| |
5/23/2001 |
| Unigraphics Solutions |
| Electronic Data Systems |
| 14.0 |
| 170 |
| 26.7 |
| 50.8 |
| 52.9 |
| 80.8 |
| 20.4 |
| |
|
|
|
|
|
|
|
|
|
|
|
|
|
|
|
|
|
|
|
| |
3/26/2001 |
| CSFBdirect |
| CSFB |
| 18.0 |
| 110 |
| 60.0 |
| 21.2 |
| 140.0 |
| 73.9 |
| 43.5 |
| |
|
|
|
|
|
|
|
|
|
|
|
|
|
|
|
|
|
|
|
| |
2/15/2001 |
| Westfield America |
| Westfield Amercia Trust |
| 22.5 |
| 287 |
| 12.5 |
| 14.5 |
| 12.5 |
| 14.5 |
| 0.0 |
| |
|
|
|
|
|
|
|
|
|
|
|
|
|
|
|
|
|
|
|
| |
High |
|
|
|
|
|
|
|
|
| 60.0 | % | 50.8 | % | 140.0 | % | 80.8 | % | 43.5 | % | |
Median |
|
|
|
|
|
|
|
|
| 21.2 |
| 15.8 |
| 26.0 |
| 27.1 |
| 7.0 |
| |
Low |
|
|
|
|
|
|
|
|
| 1.2 |
| 1.0 |
| 4.3 |
| 11.3 |
| 0.0 |
| |
Source: SDC.
(1) Deal value based on total transaction value.
8
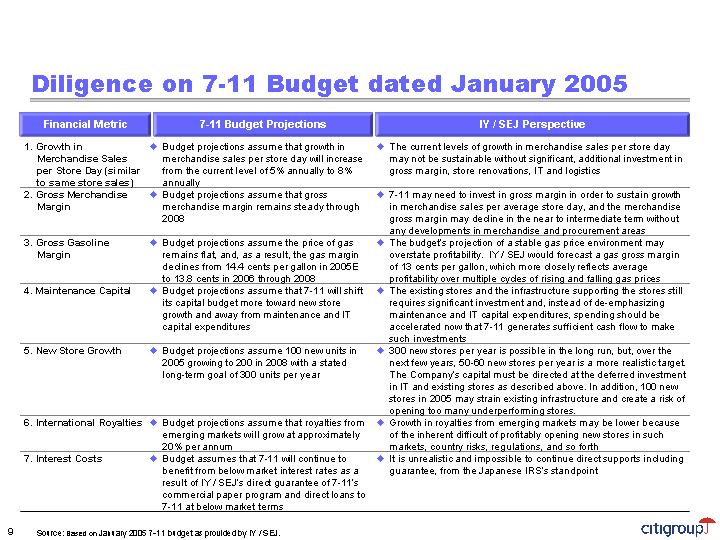
Diligence on 7-11 Budget dated January 2005
Financial Metric |
| 7-11 Budget Projections |
| IY / SEJ Perspective |
1. Growth in Merchandise Sales per Store Day (similar to same store sales) |
| • Budget projections assume that growth in merchandise sales per store day will increase from the current level of 5% annually to 8% annually |
| • The current levels of growth in merchandise sales per store day may not be sustainable without significant, additional investment in gross margin, store renovations, IT and logistics |
|
|
|
|
|
2. Gross Merchandise Margin |
| • Budget projections assume that gross merchandise margin remains steady through 2008 |
| • 7-11 may need to invest in gross margin in order to sustain growth in merchandise sales per average store day, and the merchandise gross margin may decline in the near to intermediate term without any developments in merchandise and procurement areas |
|
|
|
|
|
3. Gross Gasoline Margin |
| • Budget projections assume the price of gas remains flat, and, as a result, the gas margin declines from 14.4 cents per gallon in 2005E to 13.8 cents in 2006 through 2008 |
| • The budget’s projection of a stable gas price environment may overstate profitability. IY / SEJ would forecast a gas gross margin of 13 cents per gallon, which more closely reflects average profitability over multiple cycles of rising and falling gas prices |
|
|
|
|
|
4. Maintenance Capital |
| • Budget projections assume that 7-11 will shift its capital budget more toward new store growth and away from maintenance and IT capital expenditures |
| • The existing stores and the infrastructure supporting the stores still requires significant investment and, instead of de-emphasizing maintenance and IT capital expenditures, spending should be accelerated now that 7-11 generates sufficient cash flow to make such investments |
|
|
|
|
|
5. New Store Growth |
| • Budget projections assume 100 new units in 2005 growing to 200 in 2008 with a stated long-term goal of 300 units per year |
| • 300 new stores per year is possible in the long run, but, over the next few years, 50-60 new stores per year is a more realistic target. The Company’s capital must be directed at the deferred investment in IT and existing stores as described above. In addition, 100 new stores in 2005 may strain existing infrastructure and create a risk of opening too many underperforming stores. |
|
|
|
|
|
6. International Royalties |
| • Budget projections assume that royalties from emerging markets will grow at approximately 20% per annum |
| • Growth in royalties from emerging markets may be lower because of the inherent difficult of profitably opening new stores in such markets, country risks, regulations, and so forth |
|
|
|
|
|
7. Interest Costs |
| • Budget assumes that 7-11 will continue to benefit from below market interest rates as a result of IY /SEJ’s direct guarantee of 7-11’s commercial paper program and direct loans to 7-11 at below market terms |
| • It is unrealistic and impossible to continue direct supports including guarantee, from the Japanese IRS’s standpoint |
Source: Based on January 2005 7-11 budget as provided by IY / SEJ.
9
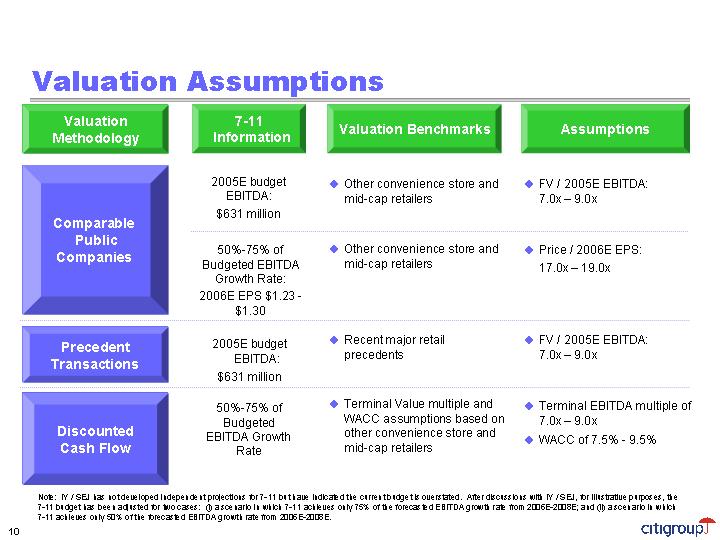
Valuation Assumptions
Valuation |
| 7-11 |
| Valuation Benchmarks |
| Assumptions | ||
|
|
|
|
|
|
| ||
|
| 2005E budget |
| • | Other convenience store and |
| • | FV / 2005E EBITDA: |
|
| EBITDA: |
|
| mid-cap retailers |
|
| 7.0x – 9.0x |
|
| $631 million |
|
|
|
|
|
|
|
|
|
|
|
|
|
|
|
Comparable |
|
|
|
|
|
|
|
|
Public |
| 50%-75% of |
| • | Other convenience store and |
| • | Price / 2006E EPS: |
Companies |
| Budgeted EBITDA |
|
| mid-cap retailers |
|
| 17.0x – 19.0x |
|
| Growth Rate: |
|
|
|
|
|
|
|
| 2006E EPS $1.23 - |
|
|
|
|
|
|
|
| $1.30 |
|
|
|
|
|
|
|
|
|
|
|
|
|
|
|
Precedent |
| 2005E budget |
| • | Recent major retail precedents |
| • | FV / 2005E EBITDA: |
Transactions |
| EBITDA: |
|
|
|
|
| 7.0x – 9.0x |
|
| $631 million |
|
|
|
|
|
|
|
|
|
|
|
|
|
|
|
|
| 50%-75% of |
| • | Terminal Value multiple and |
| • | Terminal EBITDA multiple of |
Discounted |
| Budgeted |
|
| WACC assumptions based on |
|
| 7.0x – 9.0x |
Cash Flow |
| EBITDA Growth Rate |
|
| other convenience store and mid-cap retailers |
| • | WACC of 7.5% - 9.5% |
Note: IY / SEJ has not developed independent projections for 7-11 but have indicated the current budget is overstated. After discussions with IY / SEJ, for illustrative purposes, the 7-11 budget has been adjusted for two cases: (i) a scenario in which 7-11 achieves only 75% of the forecasted EBITDA growth rate from 2006E-2008E; and (ii) a scenario in which 7-11 achieves only 50% of the forecasted EBITDA growth rate from 2006E-2008E.
10
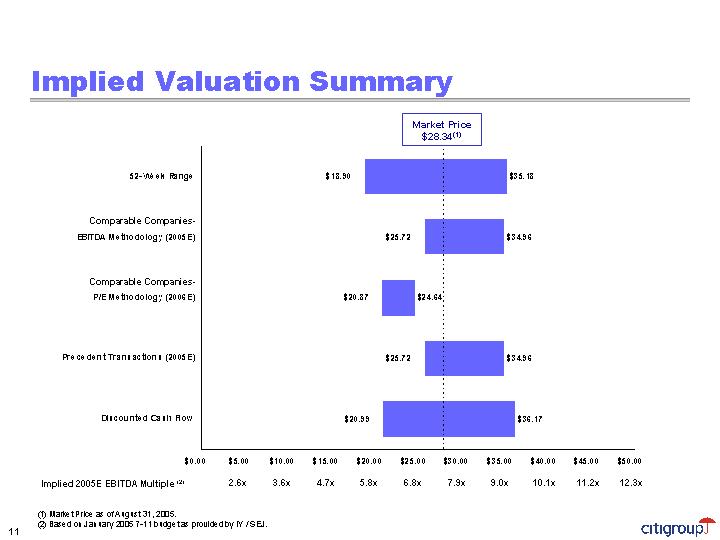
Implied Valuation Summary
[CHART]
Implied 2005E EBITDA Multiple (2) |
| 2.6 | x | 3.6 | x | 4.7 | x | 5.8 | x | 6.8 | x | 7.9 | x | 9.0 | x | 10.1 | x | 11.2 | x | 12.3 | x |
(1) Market Price as of August 31, 2005.
(2) Based on January 2005 7-11 budget as provided by IY / SEJ.
11
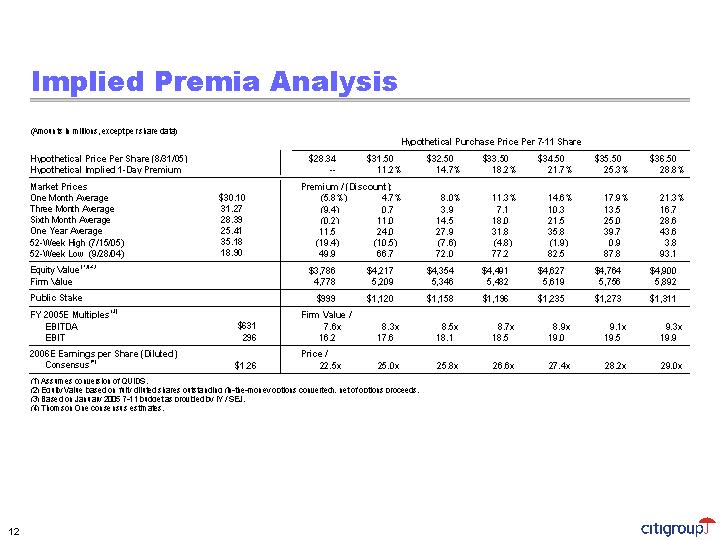
Implied Premia Analysis
(Amounts in millions, except per share data)
|
|
|
| Hypothetical Purchase Price Per 7-11 Share |
| ||||||||||||||||||||
Hypothetical Price Per Share (8/31/05) |
|
|
| $ | 28.34 |
| $ | 31.50 |
| $ | 32.50 |
| $ | 33.50 |
| $ | 34.50 |
| $ | 35.50 |
| $ | 36.50 |
| |
Hypothetical Implied 1-Day Premium |
|
|
| — |
| 11.2 | % | 14.7 | % | 18.2 | % | 21.7 | % | 25.3 | % | 28.8 | % | ||||||||
Market Prices |
|
|
| Premium / (Discount): |
|
|
|
|
|
|
|
|
|
|
| ||||||||||
One Month Average |
| $ | 30.10 |
| (5.8 | )% | 4.7 | % | 8.0 | % | 11.3 | % | 14.6 | % | 17.9 | % | 21.3 | % | |||||||
Three Month Average |
| 31.27 |
| (9.4 | ) | 0.7 |
| 3.9 |
| 7.1 |
| 10.3 |
| 13.5 |
| 16.7 |
| ||||||||
Sixth Month Average |
| 28.39 |
| (0.2 | ) | 11.0 |
| 14.5 |
| 18.0 |
| 21.5 |
| 25.0 |
| 28.6 |
| ||||||||
One Year Average |
| 25.41 |
| 11.5 |
| 24.0 |
| 27.9 |
| 31.8 |
| 35.8 |
| 39.7 |
| 43.6 |
| ||||||||
52-Week High (7/15/05) |
| 35.18 |
| (19.4 | ) | (10.5 | ) | (7.6 | ) | (4.8 | ) | (1.9 | ) | 0.9 |
| 3.8 |
| ||||||||
52-Week Low (9/28/04) |
| 18.90 |
| 49.9 |
| 66.7 |
| 72.0 |
| 77.2 |
| 82.5 |
| 87.8 |
| 93.1 |
| ||||||||
Equity Value (1)(2) |
|
|
| $ | 3,786 |
| $ | 4,217 |
| $ | 4,354 |
| $ | 4,491 |
| $ | 4,627 |
| $ | 4,764 |
| $ | 4,900 |
| |
Firm Value |
|
|
| 4,778 |
| 5,209 |
| 5,346 |
| 5,482 |
| 5,619 |
| 5,756 |
| 5,892 |
| ||||||||
Public Stake |
|
|
| $ | 999 |
| $ | 1,120 |
| $ | 1,158 |
| $ | 1,196 |
| $ | 1,235 |
| $ | 1,273 |
| $ | 1,311 |
| |
FY 2005E Multiples (3) |
|
|
| Firm Value / |
|
|
|
|
|
|
|
|
|
|
|
| |||||||||
EBITDA |
| $ | 631 |
| 7.6 | x | 8.3 | x | 8.5 | x | 8.7 | x | 8.9 | x | 9.1 | x | 9.3 | x | |||||||
EBIT |
| 296 |
| 16.2 |
| 17.6 |
| 18.1 |
| 18.5 |
| 19.0 |
| 19.5 |
| 19.9 |
| ||||||||
2006E Earnings per Share (Diluted) |
|
|
| Price / |
|
|
|
|
|
|
|
|
|
|
|
| |||||||||
Consensus (4) |
| $ | 1.26 |
| 22.5 | x | 25.0 | x | 25.8 | x | 26.6 | x | 27.4 | x | 28.2 | x | 29.0 | x | |||||||
(1) Assumes conversion of QUIDS.
(2) Equity Value based on fully diluted shares outstanding (in-the-money options converted), net of options proceeds.
(3) Based on January 2005 7-11 budget as provided by IY / SEJ.
(4) Thomson One consensus estimates.
12
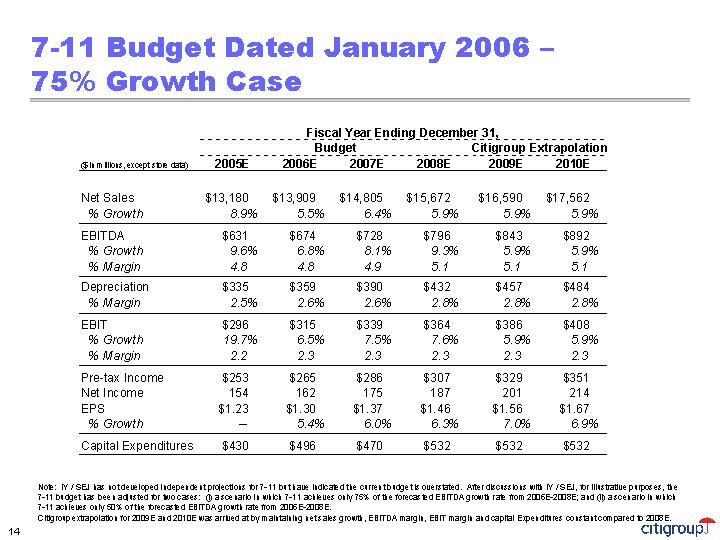
7-11 Budget Dated January 2006 – 75% Growth Case
|
| Fiscal Year Ending December 31, |
| ||||||||||||||||
|
| Budget |
| Citigroup Extrapolation |
| ||||||||||||||
($ in millions, except store data) |
| 2005E |
| 2006E |
| 2007E |
| 2008E |
| 2009E |
| 2010E |
| ||||||
|
|
|
|
|
|
|
|
|
|
|
|
|
| ||||||
Net Sales |
| $ | 13,180 |
| $ | 13,909 |
| $ | 14,805 |
| $ | 15,672 |
| $ | 16,590 |
| $ | 17,562 |
|
% Growth |
| 8.9 | % | 5.5 | % | 6.4 | % | 5.9 | % | 5.9 | % | 5.9 | % | ||||||
EBITDA |
| $ | 631 |
| $ | 674 |
| $ | 728 |
| $ | 796 |
| $ | 843 |
| $ | 892 |
|
% Growth |
| 9.6 | % | 6.8 | % | 8.1 | % | 9.3 | % | 5.9 | % | 5.9 | % | ||||||
% Margin |
| 4.8 |
| 4.8 |
| 4.9 |
| 5.1 |
| 5.1 |
| 5.1 |
| ||||||
Depreciation |
| $ | 335 |
| $ | 359 |
| $ | 390 |
| $ | 432 |
| $ | 457 |
| $ | 484 |
|
% Margin |
| 2.5 | % | 2.6 | % | 2.6 | % | 2.8 | % | 2.8 | % | 2.8 | % | ||||||
EBIT |
| $ | 296 |
| $ | 315 |
| $ | 339 |
| $ | 364 |
| $ | 386 |
| $ | 408 |
|
% Growth |
| 19.7 | % | 6.5 | % | 7.5 | % | 7.6 | % | 5.9 | % | 5.9 | % | ||||||
% Margin |
| 2.2 |
| 2.3 |
| 2.3 |
| 2.3 |
| 2.3 |
| 2.3 |
| ||||||
Pre-tax Income |
| $ | 253 |
| $ | 265 |
| $ | 286 |
| $ | 307 |
| $ | 329 |
| $ | 351 |
|
Net Income |
| 154 |
| 162 |
| 175 |
| 187 |
| 201 |
| 214 |
| ||||||
EPS |
| $ | 1.23 |
| $ | 1.30 |
| $ | 1.37 |
| $ | 1.46 |
| $ | 1.56 |
| $ | 1.67 |
|
% Growth |
| — |
| 5.4 | % | 6.0 | % | 6.3 | % | 7.0 | % | 6.9 | % | ||||||
Capital Expenditures |
| $ | 430 |
| $ | 496 |
| $ | 470 |
| $ | 532 |
| $ | 532 |
| $ | 532 |
|
Note: IY / SEJ has not developed independent projections for 7-11 but have indicated the current budget is overstated. After discussions with IY / SEJ, for illustrative purposes, the 7-11 budget has been adjusted for two cases: (i) a scenario in which 7-11 achieves only 75% of the forecasted EBITDA growth rate from 2006E-2008E; and (ii) a scenario in which 7-11 achieves only 50% of the forecasted EBITDA growth rate from 2006E-2008E.
Citigroup extrapolation for 2009E and 2010E was arrived at by maintaining net sales growth, EBITDA margin, EBIT margin and capital Expenditures constant compared to 2008E.
14
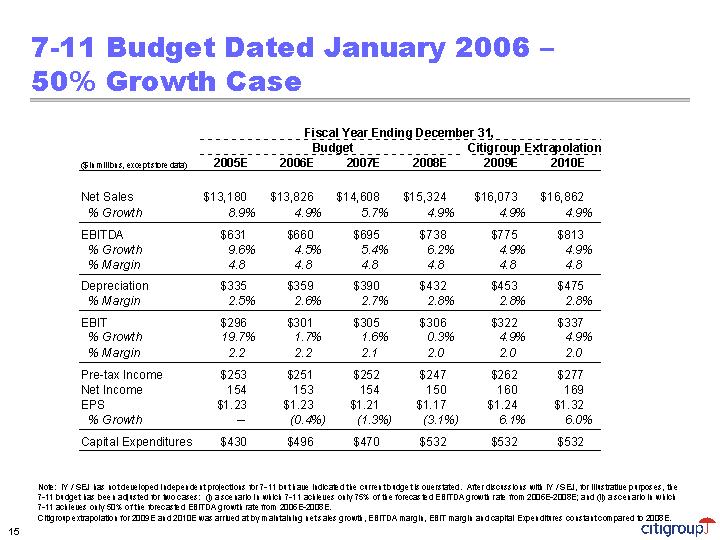
7-11 Budget Dated January 2006 – 50% Growth Case
|
| Fiscal Year Ending December 31, |
| ||||||||||||||||
|
| Budget |
| Citigroup Extrapolation |
| ||||||||||||||
($ in millions, except store data) |
| 2005E |
| 2006E |
| 2007E |
| 2008E |
| 2009E |
| 2010E |
| ||||||
|
|
|
|
|
|
|
|
|
|
|
|
|
| ||||||
Net Sales |
| $ | 13,180 |
| $ | 13,826 |
| $ | 14,608 |
| $ | 15,324 |
| $ | 16,073 |
| $ | 16,862 |
|
% Growth |
| 8.9 | % | 4.9 | % | 5.7 | % | 4.9 | % | 4.9 | % | 4.9 | % | ||||||
EBITDA |
| $ | 631 |
| $ | 660 |
| $ | 695 |
| $ | 738 |
| $ | 775 |
| $ | 813 |
|
% Growth |
| 9.6 | % | 4.5 | % | 5.4 | % | 6.2 | % | 4.9 | % | 4.9 | % | ||||||
% Margin |
| 4.8 |
| 4.8 |
| 4.8 |
| 4.8 |
| 4.8 |
| 4.8 |
| ||||||
Depreciation |
| $ | 335 |
| $ | 359 |
| $ | 390 |
| $ | 432 |
| $ | 453 |
| $ | 475 |
|
% Margin |
| 2.5 | % | 2.6 | % | 2.7 | % | 2.8 | % | 2.8 | % | 2.8 | % | ||||||
EBIT |
| $ | 296 |
| $ | 301 |
| $ | 305 |
| $ | 306 |
| $ | 322 |
| $ | 337 |
|
% Growth |
| 19.7 | % | 1.7 | % | 1.6 | % | 0.3 | % | 4.9 | % | 4.9 | % | ||||||
% Margin |
| 2.2 |
| 2.2 |
| 2.1 |
| 2.0 |
| 2.0 |
| 2.0 |
| ||||||
Pre-tax Income |
| $ | 253 |
| $ | 251 |
| $ | 252 |
| $ | 247 |
| $ | 262 |
| $ | 277 |
|
Net Income |
| 154 |
| 153 |
| 154 |
| 150 |
| 160 |
| 169 |
| ||||||
EPS |
| $ | 1.23 |
| $ | 1.23 |
| $ | 1.21 |
| $ | 1.17 |
| $ | 1.24 |
| $ | 1.32 |
|
% Growth |
| — |
| (0.4 | )% | (1.3 | )% | (3.1 | )% | 6.1 | % | 6.0 | % | ||||||
Capital Expenditures |
| $ | 430 |
| $ | 496 |
| $ | 470 |
| $ | 532 |
| $ | 532 |
| $ | 532 |
|
Note: IY / SEJ has not developed independent projections for 7-11 but have indicated the current budget is overstated. After discussions with IY / SEJ, for illustrative purposes, the 7-11 budget has been adjusted for two cases: (i) a scenario in which 7-11 achieves only 75% of the forecasted EBITDA growth rate from 2006E-2008E; and (ii) a scenario in which 7-11 achieves only 50% of the forecasted EBITDA growth rate from 2006E-2008E.
Citigroup extrapolation for 2009E and 2010E was arrived at by maintaining net sales growth, EBITDA margin, EBIT margin and capital Expenditures constant compared to 2008E.
15
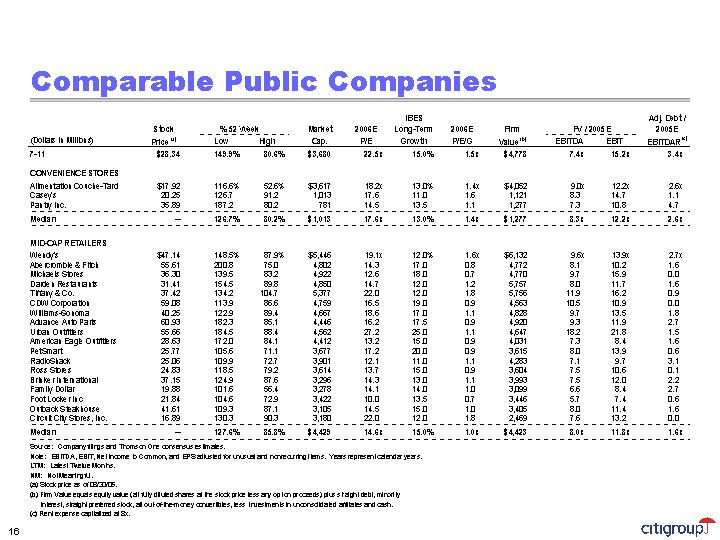
Comparable Public Companies
|
|
|
|
|
|
|
|
|
|
|
| IBES |
|
|
|
|
|
|
|
|
| Adj. Debt / |
| |||
|
| Stock |
| % 52 Week |
| Market |
| 2006E |
| Long-Term |
| 2006E |
| Firm |
| FV / 2005E |
| 2005E |
| |||||||
(Dollars in Millions) |
| Price (a) |
| Low |
| High |
| Cap. |
| P/E |
| Growth |
| P/E/G |
| Value (b) |
| EBITDA |
| EBIT |
| EBITDAR (c) |
| |||
7-11 |
| $ | 28.34 |
| 149.9 | % | 80.6 | % | $ | 3,680 |
| 22.5 | x | 15.0 | % | 1.5 | x | $ | 4,778 |
| 7.4 | x | 15.2 | x | 3.4 | x |
|
|
|
|
|
|
|
|
|
|
|
|
|
|
|
|
|
|
|
|
|
|
|
| |||
CONVENIENCE STORES |
|
|
|
|
|
|
|
|
|
|
|
|
|
|
|
|
|
|
|
|
|
|
| |||
Alimentation Couche-Tard |
| $ | 17.92 |
| 116.6 | % | 52.6 | % | $ | 3,617 |
| 18.2 | x | 13.0 | % | 1.4 | x | $ | 4,052 |
| 9.0 | x | 12.2 | x | 2.6 | x |
Casey’s |
| 20.25 |
| 126.7 |
| 91.2 |
| 1,013 |
| 17.6 |
| 11.0 |
| 1.6 |
| 1,121 |
| 8.3 |
| 14.7 |
| 1.1 |
| |||
Pantry Inc. |
| 35.89 |
| 187.2 |
| 80.2 |
| 781 |
| 14.5 |
| 13.5 |
| 1.1 |
| 1,277 |
| 7.3 |
| 10.8 |
| 4.7 |
| |||
Median |
| — |
| 126.7 | % | 80.2 | % | $ | 1,013 |
| 17.6 | x | 13.0 | % | 1.4 | x | $ | 1,277 |
| 8.3 | x | 12.2 | x | 2.6 | x | |
|
|
|
|
|
|
|
|
|
|
|
|
|
|
|
|
|
|
|
|
|
|
|
| |||
MID-CAP RETAILERS |
|
|
|
|
|
|
|
|
|
|
|
|
|
|
|
|
|
|
|
|
|
|
| |||
Wendy’s |
| $ | 47.14 |
| 148.5 | % | 87.9 | % | $ | 5,446 |
| 19.1 | x | 12.0 | % | 1.6 | x | $ | 6,132 |
| 9.6 | x | 13.9 | x | 2.7 | x |
Abercrombie & Fitch |
| 55.61 |
| 200.8 |
| 75.0 |
| 4,802 |
| 14.3 |
| 17.0 |
| 0.8 |
| 4,772 |
| 8.1 |
| 10.2 |
| 1.6 |
| |||
Michaels Stores |
| 36.30 |
| 139.5 |
| 83.2 |
| 4,922 |
| 12.6 |
| 18.0 |
| 0.7 |
| 4,770 |
| 9.7 |
| 15.9 |
| 0.0 |
| |||
Darden Restaurants |
| 31.41 |
| 154.5 |
| 89.8 |
| 4,850 |
| 14.7 |
| 12.0 |
| 1.2 |
| 5,757 |
| 8.0 |
| 11.7 |
| 1.6 |
| |||
Tiffany & Co. |
| 37.42 |
| 134.2 |
| 104.7 |
| 5,377 |
| 22.0 |
| 12.0 |
| 1.8 |
| 5,756 |
| 11.9 |
| 16.2 |
| 0.9 |
| |||
CDW Corporation |
| 59.08 |
| 113.9 |
| 86.6 |
| 4,759 |
| 16.5 |
| 19.0 |
| 0.9 |
| 4,563 |
| 10.5 |
| 10.9 |
| 0.0 |
| |||
Williams-Sonoma |
| 40.25 |
| 122.9 |
| 89.4 |
| 4,667 |
| 18.6 |
| 17.0 |
| 1.1 |
| 4,828 |
| 9.7 |
| 13.5 |
| 1.8 |
| |||
Advance Auto Parts |
| 60.93 |
| 182.3 |
| 85.1 |
| 4,446 |
| 16.2 |
| 17.5 |
| 0.9 |
| 4,920 |
| 9.3 |
| 11.9 |
| 2.7 |
| |||
Urban Outfitters |
| 55.66 |
| 184.5 |
| 88.4 |
| 4,562 |
| 27.2 |
| 25.0 |
| 1.1 |
| 4,647 |
| 18.2 |
| 21.8 |
| 1.5 |
| |||
American Eagle Outfitters |
| 28.63 |
| 172.0 |
| 84.1 |
| 4,412 |
| 13.2 |
| 15.0 |
| 0.9 |
| 4,031 |
| 7.3 |
| 8.4 |
| 1.6 |
| |||
PetSmart |
| 25.77 |
| 105.6 |
| 71.1 |
| 3,677 |
| 17.2 |
| 20.0 |
| 0.9 |
| 3,615 |
| 8.0 |
| 13.9 |
| 0.6 |
| |||
RadioShack |
| 25.06 |
| 109.9 |
| 72.7 |
| 3,901 |
| 12.1 |
| 11.0 |
| 1.1 |
| 4,283 |
| 7.1 |
| 9.7 |
| 3.1 |
| |||
Ross Stores |
| 24.83 |
| 118.5 |
| 79.2 |
| 3,614 |
| 13.7 |
| 15.0 |
| 0.9 |
| 3,604 |
| 7.5 |
| 10.6 |
| 0.1 |
| |||
Brinker International |
| 37.15 |
| 124.9 |
| 87.6 |
| 3,296 |
| 14.3 |
| 13.0 |
| 1.1 |
| 3,993 |
| 7.5 |
| 12.0 |
| 2.2 |
| |||
Family Dollar |
| 19.88 |
| 101.6 |
| 56.4 |
| 3,278 |
| 14.1 |
| 14.0 |
| 1.0 |
| 3,099 |
| 6.6 |
| 8.4 |
| 2.7 |
| |||
Foot Locker Inc |
| 21.84 |
| 104.6 |
| 72.9 |
| 3,422 |
| 10.0 |
| 13.5 |
| 0.7 |
| 3,446 |
| 5.7 |
| 7.4 |
| 0.6 |
| |||
Outback Steakhouse |
| 41.61 |
| 109.3 |
| 87.1 |
| 3,105 |
| 14.5 |
| 15.0 |
| 1.0 |
| 3,405 |
| 8.0 |
| 11.4 |
| 1.6 |
| |||
Circuit City Stores, Inc. |
| 16.89 |
| 130.3 |
| 90.3 |
| 3,180 |
| 22.0 |
| 12.0 |
| 1.8 |
| 2,469 |
| 7.6 |
| 13.2 |
| 0.0 |
| |||
Median |
| — |
| 127.6 | % | 85.8 | % | $ | 4,429 |
| 14.6 | x | 15.0 | % | 1.0 | x | $ | 4,423 |
| 8.0 | x | 11.8 | x | 1.6 | x | |
Source: Company filings and Thomson One consensus estimates.
Note: EBITDA, EBIT, Net Income to Common, and EPS adjusted for unusual and nonrecurring items. Years represent calendar years.
LTM: Latest Twelve Months.
NM: Not Meaningful.
(a) Stock price as of 08/30/05.
(b) Firm Value equals equity value (all fully diluted shares at the stock price less any option proceeds) plus straight debt, minority interest, straight preferred stock, all out-of-the-money convertibles, less investments in unconsolidated affiliates and cash.
(c) Rent expense capitalized at 8x.
16
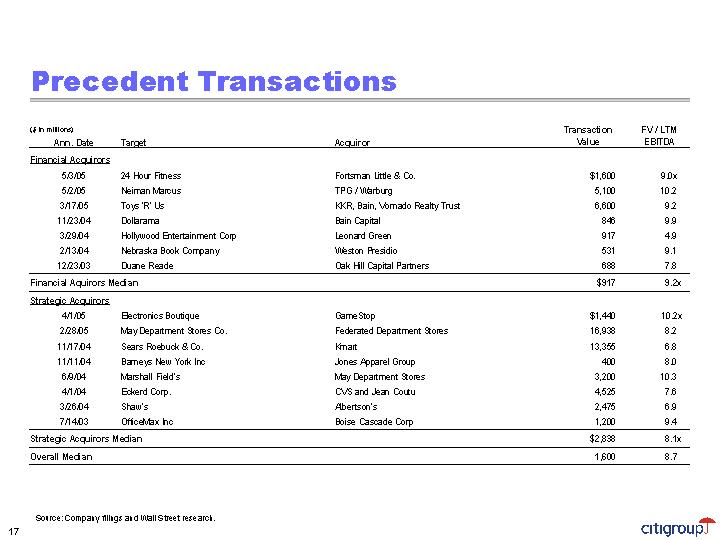
Precedent Transactions
($ in millions)
|
|
|
|
|
| Transaction |
| FV / LTM |
| |
Ann. Date |
| Target |
| Acquiror |
| Value |
| EBITDA |
| |
Financial Acquirors |
|
|
|
|
|
|
|
|
| |
5/3/05 |
| 24 Hour Fitness |
| Fortsman Little & Co. |
| $ | 1,600 |
| 9.0 | x |
5/2/05 |
| Neiman Marcus |
| TPG / Warburg |
| 5,100 |
| 10.2 |
| |
3/17/05 |
| Toys ‘R’ Us |
| KKR, Bain, Vornado Realty Trust |
| 6,600 |
| 9.2 |
| |
11/23/04 |
| Dollarama |
| Bain Capital |
| 846 |
| 9.9 |
| |
3/29/04 |
| Hollywood Entertainment Corp |
| Leonard Green |
| 917 |
| 4.9 |
| |
2/13/04 |
| Nebraska Book Company |
| Weston Presidio |
| 531 |
| 9.1 |
| |
12/23/03 |
| Duane Reade |
| Oak Hill Capital Partners |
| 688 |
| 7.8 |
| |
Financial Aquirors Median |
|
|
|
|
| $ | 917 |
| 9.2 | x |
Strategic Acquirors |
|
|
|
|
|
|
|
|
| |
4/1/05 |
| Electronics Boutique |
| GameStop |
| $ | 1,440 |
| 10.2 | x |
2/28/05 |
| May Department Stores Co. |
| Federated Department Stores |
| 16,938 |
| 8.2 |
| |
11/17/04 |
| Sears Roebuck & Co. |
| Kmart |
| 13,355 |
| 6.8 |
| |
11/11/04 |
| Barneys New York Inc |
| Jones Apparel Group |
| 400 |
| 8.0 |
| |
6/9/04 |
| Marshall Field’s |
| May Department Stores |
| 3,200 |
| 10.3 |
| |
4/1/04 |
| Eckerd Corp. |
| CVS and Jean Coutu |
| 4,525 |
| 7.6 |
| |
3/26/04 |
| Shaw’s |
| Albertson’s |
| 2,475 |
| 6.9 |
| |
7/14/03 |
| OfficeMax Inc |
| Boise Cascade Corp |
| 1,200 |
| 9.4 |
| |
Strategic Acquirors Median |
|
|
|
|
| $ | 2,838 |
| 8.1 | x |
Overall Median |
|
|
|
|
| 1,600 |
| 8.7 |
| |
Source: Company filings and Wall Street research.
17
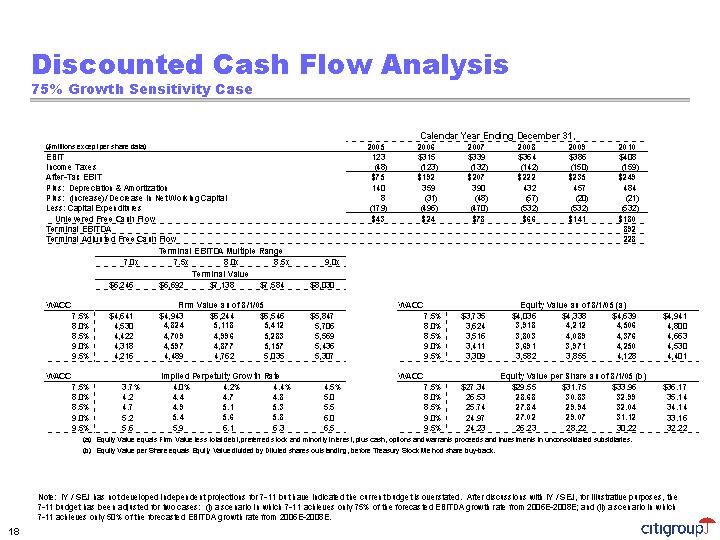
Discounted Cash Flow Analysis
75% Growth Sensitivity Case
|
| Calendar Year Ending December 31, |
| ||||||||||||||||
($ millions except per share data) |
| 2005 |
| 2006 |
| 2007 |
| 2008 |
| 2009 |
| 2010 |
| ||||||
EBIT |
| 123 |
| $ | 315 |
| $ | 339 |
| $ | 364 |
| $ | 386 |
| $ | 408 |
| |
Income Taxes |
| (48 | ) | (123 | ) | (132 | ) | (142 | ) | (150 | ) | (159 | ) | ||||||
After-Tax EBIT |
| $ | 75 |
| $ | 192 |
| $ | 207 |
| $ | 222 |
| $ | 235 |
| $ | 249 |
|
Plus: Depreciation & Amortization |
| 140 |
| 359 |
| 390 |
| 432 |
| 457 |
| 484 |
| ||||||
Plus: (Increase)/ Decrease in Net Working Capital |
| 8 |
| (31 | ) | (48 | ) | (57 | ) | (20 | ) | (21 | ) | ||||||
Less: Capital Expenditures |
| (179 | ) | (496 | ) | (470 | ) | (532 | ) | (532 | ) | (532 | ) | ||||||
Unlevered Free Cash Flow |
| $ | 43 |
| $ | 24 |
| $ | 78 |
| $ | 66 |
| $ | 141 |
| $ | 180 |
|
Terminal EBITDA |
|
|
|
|
|
|
|
|
|
|
| 892 |
| ||||||
Terminal Adjusted Free Cash Flow |
|
|
|
|
|
|
|
|
|
|
| 228 |
| ||||||
Terminal EBITDA Multiple Range |
| |||||||||||||
7.0 | x | 7.5 | x | 8.0 | x | 8.5 | x | 9.0 | x | |||||
Terminal Value |
| |||||||||||||
$ | 6,246 |
| $ | 6,692 |
| $ | 7,138 |
| $ | 7,584 |
| $ | 8,030 |
|
WACC |
| Firm Value as of 8/1/05 |
| |||||||||||||
7.5 | % | $ | 4,641 |
| $ | 4,943 |
| $ | 5,244 |
| $ | 5,546 |
| $ | 5,847 |
|
8.0 | % | 4,530 |
| 4,824 |
| 5,118 |
| 5,412 |
| 5,706 |
| |||||
8.5 | % | 4,422 |
| 4,709 |
| 4,996 |
| 5,283 |
| 5,569 |
| |||||
9.0 | % | 4,318 |
| 4,597 |
| 4,877 |
| 5,157 |
| 5,436 |
| |||||
9.5 | % | 4,216 |
| 4,489 |
| 4,762 |
| 5,035 |
| 5,307 |
| |||||
|
|
|
|
|
|
|
|
|
|
|
| |||||
WACC |
| Implied Perpetuity Growth Rate |
| |||||||||||||
7.5 | % | 3.7 | % | 4.0 | % | 4.2 | % | 4.4 | % | 4.5 | % | |||||
8.0 | % | 4.2 |
| 4.4 |
| 4.7 |
| 4.8 |
| 5.0 |
| |||||
8.5 | % | 4.7 |
| 4.9 |
| 5.1 |
| 5.3 |
| 5.5 |
| |||||
9.0 | % | 5.2 |
| 5.4 |
| 5.6 |
| 5.8 |
| 6.0 |
| |||||
9.5 | % | 5.6 |
| 5.9 |
| 6.1 |
| 6.3 |
| 6.5 |
| |||||
|
|
|
|
|
|
|
|
|
|
|
| |||||
WACC |
| Equity Value as of 8/1/05 (a) |
| |||||||||||||
7.5 | % | $ | 3,735 |
| $ | 4,036 |
| $ | 4,338 |
| $ | 4,639 |
| $ | 4,941 |
|
8.0 | % | 3,624 |
| 3,918 |
| 4,212 |
| 4,506 |
| 4,800 |
| |||||
8.5 | % | 3,516 |
| 3,803 |
| 4,089 |
| 4,376 |
| 4,663 |
| |||||
9.0 | % | 3,411 |
| 3,691 |
| 3,971 |
| 4,250 |
| 4,530 |
| |||||
9.5 | % | 3,309 |
| 3,582 |
| 3,855 |
| 4,128 |
| 4,401 |
| |||||
|
|
|
|
|
|
|
|
|
|
|
| |||||
WACC |
| Equity Value per Share as of 8/1/05 (b) |
| |||||||||||||
7.5 | % | $ | 27.34 |
| $ | 29.55 |
| $ | 31.75 |
| $ | 33.96 |
| $ | 36.17 |
|
8.0 | % | 26.53 |
| 28.68 |
| 30.83 |
| 32.99 |
| 35.14 |
| |||||
8.5 | % | 25.74 |
| 27.84 |
| 29.94 |
| 32.04 |
| 34.14 |
| |||||
9.0 | % | 24.97 |
| 27.02 |
| 29.07 |
| 31.12 |
| 33.16 |
| |||||
9.5 | % | 24.23 |
| 26.23 |
| 28.22 |
| 30.22 |
| 32.22 |
| |||||
(a) Equity Value equals Firm Value less total debt, preferred stock and minority interest, plus cash, options and warrants proceeds and investments in unconsolidated subsidiaries.
(b) Equity Value per Share equals Equity Value divided by Diluted shares outstanding, before Treasury Stock Method share buy-back.
Note: IY / SEJ has not developed independent projections for 7-11 but have indicated the current budget is overstated. After discussions with IY / SEJ, for illustrative purposes, the 7-11 budget has been adjusted for two cases: (i) a scenario in which 7-11 achieves only 75% of the forecasted EBITDA growth rate from 2006E-2008E; and (ii) a scenario in which 7-11 achieves only 50% of the forecasted EBITDA growth rate from 2006E-2008E.
18
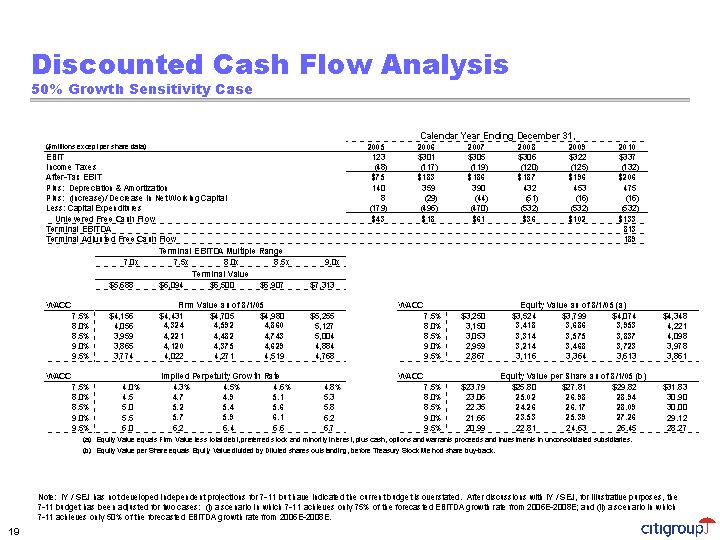
Discounted Cash Flow Analysis
50% Growth Sensitivity Case
|
| Calendar Year Ending December 31, |
| ||||||||||||||||
($ millions except per share data) |
| 2005 |
| 2006 |
| 2007 |
| 2008 |
| 2009 |
| 2010 |
| ||||||
EBIT |
| 123 |
| $ | 301 |
| $ | 305 |
| $ | 306 |
| $ | 322 |
| $ | 337 |
| |
Income Taxes |
| (48 | ) | (117 | ) | (119 | ) | (120 | ) | (125 | ) | (132 | ) | ||||||
After-Tax EBIT |
| $ | 75 |
| $ | 183 |
| $ | 186 |
| $ | 187 |
| $ | 196 |
| $ | 206 |
|
Plus: Depreciation & Amortization |
| 140 |
| 359 |
| 390 |
| 432 |
| 453 |
| 475 |
| ||||||
Plus: (Increase)/ Decrease in Net Working Capital |
| 8 |
| (29 | ) | (44 | ) | (51 | ) | (16 | ) | (16 | ) | ||||||
Less: Capital Expenditures |
| (179 | ) | (496 | ) | (470 | ) | (532 | ) | (532 | ) | (532 | ) | ||||||
Unlevered Free Cash Flow |
| $ | 43 |
| $ | 18 |
| $ | 61 |
| $ | 36 |
| $ | 102 |
| $ | 133 |
|
Terminal EBITDA |
|
|
|
|
|
|
|
|
|
|
| 813 |
| ||||||
Terminal Adjusted Free Cash Flow |
|
|
|
|
|
|
|
|
|
|
| 189 |
| ||||||
Terminal EBITDA Multiple Range |
| |||||||||||||
7.0 | x | 7.5 | x | 8.0 | x | 8.5 | x | 9.0 | x | |||||
Terminal Value |
| |||||||||||||
$ | 5,688 |
| $ | 6,094 |
| $ | 6,500 |
| $ | 6,907 |
| $ | 7,313 |
|
WACC |
| Firm Value as of 8/1/05 |
| |||||||||||||
7.5 | % | $ | 4,156 |
| $ | 4,431 |
| $ | 4,705 |
| $ | 4,980 |
| $ | 5,255 |
|
8.0 | % | 4,056 |
| 4,324 |
| 4,592 |
| 4,860 |
| 5,127 |
| |||||
8.5 | % | 3,959 |
| 4,221 |
| 4,482 |
| 4,743 |
| 5,004 |
| |||||
9.0 | % | 3,865 |
| 4,120 |
| 4,375 |
| 4,629 |
| 4,884 |
| |||||
9.5 | % | 3,774 |
| 4,022 |
| 4,271 |
| 4,519 |
| 4,768 |
| |||||
|
|
|
|
|
|
|
|
|
|
|
| |||||
WACC |
| Implied Perpetuity Growth Rate |
| |||||||||||||
7.5 | % | 4.0 | % | 4.3 | % | 4.5 | % | 4.6 | % | 4.8 |
| |||||
8.0 | % | 4.5 |
| 4.7 |
| 4.9 |
| 5.1 |
| 5.3 |
| |||||
8.5 | % | 5.0 |
| 5.2 |
| 5.4 |
| 5.6 |
| 5.8 |
| |||||
9.0 | % | 5.5 |
| 5.7 |
| 5.9 |
| 6.1 |
| 6.2 |
| |||||
9.5 | % | 6.0 |
| 6.2 |
| 6.4 |
| 6.6 |
| 6.7 |
| |||||
|
|
|
|
|
|
|
|
|
|
|
| |||||
WACC |
| Equity Value as of 8/1/05 (a) |
| |||||||||||||
7.5 | % | $ | 3,250 |
| $ | 3,524 |
| $ | 3,799 |
| $ | 4,074 |
| $ | 4,348 |
|
8.0 | % | 3,150 |
| 3,418 |
| 3,686 |
| 3,953 |
| 4,221 |
| |||||
8.5 | % | 3,053 |
| 3,314 |
| 3,575 |
| 3,837 |
| 4,098 |
| |||||
9.0 | % | 2,959 |
| 3,214 |
| 3,468 |
| 3,723 |
| 3,978 |
| |||||
9.5 | % | 2,867 |
| 3,116 |
| 3,364 |
| 3,613 |
| 3,861 |
| |||||
|
|
|
|
|
|
|
|
|
|
|
| |||||
WACC |
| Equity Value per Share as of 8/1/05 (b) |
| |||||||||||||
7.5 | % | $ | 23.79 |
| $ | 25.80 |
| $ | 27.81 |
| $ | 29.82 |
| $ | 31.83 |
|
8.0 | % | 23.06 |
| 25.02 |
| 26.98 |
| 28.94 |
| 30.90 |
| |||||
8.5 | % | 22.35 |
| 24.26 |
| 26.17 |
| 28.09 |
| 30.00 |
| |||||
9.0 | % | 21.66 |
| 23.53 |
| 25.39 |
| 27.26 |
| 29.12 |
| |||||
9.5 | % | 20.99 |
| 22.81 |
| 24.63 |
| 26.45 |
| 28.27 |
| |||||
(a) Equity Value equals Firm Value less total debt, preferred stock and minority interest, plus cash, options and warrants proceeds and investments in unconsolidated subsidiaries.
(b) Equity Value per Share equals Equity Value divided by Diluted shares outstanding, before Treasury Stock Method share buy-back.
Note: IY / SEJ has not developed independent projections for 7-11 but have indicated the current budget is overstated. After discussions with IY / SEJ, for illustrative purposes, the 7-11 budget has been adjusted for two cases: (i) a scenario in which 7-11 achieves only 75% of the forecasted EBITDA growth rate from 2006E-2008E; and (ii) a scenario in which 7-11 achieves only 50% of the forecasted EBITDA growth rate from 2006E-2008E.
19