Table of Contents
UNITED STATES
SECURITIES AND EXCHANGE COMMISSION
Washington, D.C. 20549
FORM N-CSR
CERTIFIED SHAREHOLDER REPORT OF REGISTERED MANAGEMENT
INVESTMENT COMPANIES
Investment Company Act file number File No. 811-08520
TIAA SEPARATE ACCOUNT VA-1
(Exact name of registrant as specified in charter)
| 730 Third Avenue, New York, New York | 10017 | |
| (Address of principal executive offices) | (Zip code) |
Lisa Snow, Esq.
c/o TIAA-CREF
730 Third Avenue,
New York, New York 10017-3206
(Name and address of agent for service)
Registrant’s telephone number, including area code: 212-490-9000
Date of fiscal year end: December 31, 2004
Date of reporting period: December 31, 2004
Table of Contents
| Item 1. | Reports to Stockholders. |
Table of Contents
2004 ANNUAL REPORT
TIAA SEPARATE
ACCOUNT VA-1
DECEMBER 31, 2004
Audited financial statements including summary portfolio of investments
Stock Index Account
Sign up for electronic delivery at
www.tiaa-cref.org/howto/edelivery.html

Table of Contents
PERFORMANCE OVERVIEW AS OF 12/31/2004
| Average annual compound rates of total return | ||||||||||||||
| Inception date | 1 year | 5 years | 10 years | Since inception | ||||||||||
| EQUITIES | ||||||||||||||
Stock Index Account | 11/1/1994 | 11.22 | % | –1.57 | % | 11.56 | % | 11.12 | % | |||||
The returns quoted represent past performance, which is no guarantee of future results. Returns and the principal value of your investment will fluctuate. Current performance may be higher or lower than that shown above, and you may have a gain or a loss when you redeem your accumulation units. For current performance information, including performance to the most recent month-end, please visit www.tiaa-cref.org, or call 800 223-1200.
Table of Contents
A better way to keep track of your investments
If you received this report by e-delivery, it has reached you faster than ever before. In addition, you now have the option of saving it electronically. That way, if you want to refer to it a month or a year from now, you can access it quickly on your computer.
If you did not receive this report electronically, you can sign up for e-delivery at www.tiaa-cref.org/howto/edelivery.html. It takes only a few minutes and will enable you to get future reports as soon as they are completed, rather than waiting for them to be printed, bound and delivered by mail.
We want to remind you that, beginning with the 2004 Semiannual Report, which was published at the end of August, our financial reports list the account’s 50 largest holdings or any holding that constitutes more than 1% of the account’s investment portfolio. A complete list of the account’s holdings is on file with the Securities and Exchange Commission. To obtain this information, please see details on page four.
As always, you should carefully consider the investment objectives, risks, charges and expenses of any account before investing. Please visit the Web Center at www.tiaa-cref.org, or call 800 223-1200 for a prospectus that contains this and other important information. We urge you to read it carefully before investing.
| Report to policyholders | 2 | |
| More information for policyholders | 4 | |
| Special terms | 5 | |
| Important information about expenses | 6 | |
| Account performance | ||
| 8 | ||
| Report of management responsibility | 11 | |
| Report of the audit committee | 12 | |
| Summary portfolio of investments | 14 | |
| Financial statements | ||
Statement of assets and liabilities | 19 | |
Statement of operations | 20 | |
Statements of changes in net assets | 21 | |
Notes to financial statements | 22 | |
Report of independent registered public accounting firm | 26 | |
| Additional information | 27 | |
| Management | 30 | |
| How to reach us | Inside back cover | |
Table of Contents
Both U.S. and foreign stocks posted double-digit returns during 2004, with most of their advance occurring during a year-end rally. The Russell 3000® Index, which tracks the broad U.S. market, was up 11.95%. The MSCI EAFE® Index, which tracks stocks in 21 developed nations, excluding the United States, gained 20.25% in dollar terms.
During the first three quarters of 2004, lofty stock valuations were making investors cautious, while higher interest rates and the rising price of oil threatened the pace of economic growth in the United States and among its chief trading partners. Inflation fears during the second quarter caused the largest single-quarter decline in the return of 10-year Treasury notes in a decade. As of September 30, 2004, the Russell 3000 had gained only 1.62% and the EAFE 4.27%.
During the fourth quarter, the utilization rate of the nation’s productive capacity improved in each month, according to data compiled by the Federal Reserve. At year’s end, the rate was 79.2%, 2.4 percentage points above that of December 2003, but still 1.9 percentage points below its 1972–2003 average.
Initial data from the Department of Commerce showed that the nation’s real Gross Domestic Product increased at an annual rate of 3.1% in the fourth quarter, versus a rate of 4.0% in the third. The major contributors to growth were outlays for equipment and software, and consumer spending. The slowing rate of growth during the quarter resulted largely from decreased exports and increased imports.
Despite slower growth, good news about earnings and lower oil prices set off a vigorous rally in the fourth quarter. Driven by strong performance in the financial, technology and health care sectors, the Russell 3000 Index returned 10.16% for the fourth quarter and 11.95% for the year, producing gains in consecutive years for the first time since 1999.
Bonds rallied too, and 10-year Treasuries ended the year with a return of 5.1%. The Lehman Brothers U.S. Aggregate Index returned 4.34%.
According to the Investment Company Institute, long-term U.S. stock funds posted a net inflow of more than $209 billion in 2004, while taxable bond funds had a net inflow of more than $3 billion.
The stocks of the Russell 3000 have now produced an average annual return of 12.00% over the last ten years. But, as the most recent year demonstrated, underlying market movements are far from smooth. In 2004, 85% of the Russell 3000’s return occurred in the fourth quarter.
The Stock Index Account, the underlying investment of the TIAA Separate Account VA-1, uses an
2 | 2004 Annual Report TIAA Separate Account VA-1
Table of Contents

Scott C. Evans
Executive Vice President and
Chief Investment Officer
indexed approach designed to capture as much of the market’s gains as possible, less the effect of expenses. During 2004, the account returned 11.22%, far surpassing the 8.78% return of similar variable annuities, as measured by the Morningstar Large Blend (VA) category.
During the past year, we have enhanced the methods we use to achieve our investment objectives. We conducted a comprehensive strategic review to evaluate the organizational structure of our investment operations. As a result, we made a number of changes to improve the collaboration among our investment managers and with other parts of TIAA-CREF.
We also made several key appointments within the investment area, including the choice of Susan Ulick as head of Equity Investments. She now oversees the management of all equity investments, including research, analysis and trading. Her depth of experience, as previous head of equity research at CREF, enabled us to make further improvements in our investment management process.
In our efforts to add value in each of our investment offerings, we will continue to ensure that our investment group has the structure and resources to help meet the demands of today’s complex marketplace.
 |
| Scott C. Evans |
| Executive Vice President and |
| Chief Investment Officer |
TIAA Separate Account VA-1 2004 Annual Report | 3
Table of Contents
More information for policyholders
Portfolio listings
SEC rules intended to provide investors with more meaningful information about account performance allow investment companies to list the top holdings of each account in their annual and semiannual reports instead of providing complete portfolio listings as they did previously. Companies will continue to file complete listings with the SEC, and these will remain available to investors.
You can obtain a complete list of TIAA Separate Account VA-1’s holdings (called “TIAA Separate Account VA-1 Statement of Investments”) as of the most recently completed fiscal quarter (currently for the period ended December 31, 2004) in the following ways:
| • | by visiting the TIAA-CREF Web Center at www.tiaa-cref.org; or |
| • | by calling TIAA-CREF at 800 842-2776 to request a copy, which will be provided free of charge. |
For the period ended December 31, 2004, and for other reporting periods, you can also obtain a complete listing of TIAA Separate Account VA-1’s holdings on Form N-CSR (for periods ended either June 30 or December 31) or on Form N-Q (for the most recently completed fiscal quarter, either March 31 or September 30):
| • | through the Electronic Data Gathering and Retrieval System (EDGAR) on the SEC’s Web site at www.sec.gov; or |
| • | at the SEC’s Public Reference Room (call 800 SEC-0330 for more information). |
Proxy voting
The Separate Account’s ownership of stock gives it the right to vote on proxy issues of companies in which it invests. A description of our proxy voting policies and procedures can be found at our Web Center at www.tiaa-cref.org, or on the SEC Web site at www.sec.gov. You may also call us at 800 223-1200 to request a free copy. A report of how the account voted during the twelve months ended June 30, 2004, can be found at our Web Center or at www.sec.gov.
Contacting TIAA-CREF
There are three easy ways to contact us: by e-mail, using the Contact/Help link at the top of our home page; by mail at TIAA-CREF, 730 Third Avenue, New York NY 10017–3206; or by phone at 800 223-1200.
Account management
TIAA Separate Account VA-1 is managed by the portfolio management teams of Teachers Advisors, Inc., whose members are responsible for the day-to-day operations of the account.
4 | 2004 Annual Report TIAA Separate Account VA-1
Table of Contents
Annuities are designed for retirement savings or for other long-term goals. They offer several payment options, including lifetime income. Payments from variable annuities are not guaranteed, and the payment amounts will rise or fall depending on investment returns.
Benchmarks (benchmark idexes) are groups of securities, such as the Russell 3000® Index, used to compare the performance of an investment.*
Expense ratio is the amount that investors pay for the operation of a variable annuity. The amount is expressed as a percentage of the account’s average net assets. Expense ratios do not include front-end or back-end sales charges, if any, or trading costs. See “Total return.”
Market capitalization is the total value of a company’s outstanding stock. It is calculated by multiplying the total number of a company’s outstanding shares by the current market price per share.
Peer groups are groupings of variable annuities with a similar objective whose performance is compared with the performance of a single mutual fund or variable annuity.
Relative performance is the return of a variable annuity in relationship to the return of its benchmark index.
Securities is a general name for stocks (also known as “equities”), bonds (also known as “fixed income”) or other investments.
Separate account is an account established by a life insurance company, separate from its general account, for the investments in nonguaranteed insurance and annuity products. In contrast, a life insurer’s general account supports products with principal and interest guarantees. Separate accounts are registered with the SEC as investment companies.
Total return is the amount an investment provides to investors after expenses are deducted. Total return is expressed as a percentage. It includes any interest or dividends, as well as any change in the market value of the account’s holdings.
| * | Russell 3000 is a trademark and service mark of the Frank Russell Company. |
TIAA Separate Account VA-1 2004 Annual Report | 5
Table of Contents
Important information about expenses
As a TIAA Separate Account VA-1 contract owner, you incur only one of two potential types of costs.
| • | You incur no transaction costs, including sales charges (loads) on contributions, on reinvested dividends or on other distributions. There are also no redemption fees or exchange fees. |
| • | However, you do incur ongoing costs, including investment advisory fees, administrative expenses, and mortality and expense risk charges. |
The example that appears on this page is intended to help you understand your ongoing costs (in dollars) of investing in the account. It is also designed to help you compare these costs with the ongoing costs of investing in other variable annuity accounts and mutual funds. (The costs shown do not reflect any separate account fees or expenses deducted under the variable annuity contracts using the TIAA Separate Account VA-1. If those fees or expenses were included, the costs would be higher.)
The examples assume $1,000 was invested on July 1, 2004, and held for six months until December 31, 2004.
Actual expenses
The first line in the table uses the account’s actual expenses and its actual rate of return. You may use the information in this line, together with the amount you invested at the beginning of the period, to estimate the expenses that you paid over the six-month period.
Simply divide your beginning accumulation by $1,000 (for example, an $8,600 accumulation divided by $1,000 = 8.6), then multiply the result by the number in the first line under the heading “Expenses paid” to estimate the expenses you paid during the six-month period.
| Stock Index Account expense example | |||||||||
| Starting account value (7/1/04) | Ending account value (12/31/04) | Expenses paid† (7/1/04–12/31/04) | |||||||
Actual return | $ | 1,000.00 | $ | 1,032.68 | $ | 3.42 | |||
5% annual hypothetical return | $ | 1,000.00 | 1,021.58 | 3.41 | |||||
| † | “Expenses paid” is based on the account’s actual expense ratio for the most recent fiscal half year. The account’s annualized six-month expense ratio for that period is 0.67%. |
6 | 2004 Annual Report TIAA Separate Account VA-1
Table of Contents
DISCLOSURE
Hypothetical example for comparison purposes
The second line in the table shows hypothetical account values and hypothetical expenses based on the account’s actual expense ratio for the six-month period and an assumed rate of return of 5% per year before expenses—which is not the account’s actual return.
Do not use the hypothetical account values and hypothetical expenses to estimate the actual expenses you paid for the period. Instead, you can use this information to compare the ongoing costs of investing in an individual account with ongoing costs of other variable annuity accounts and mutual funds. To do so, compare this 5% hypothetical example with the 5% hypothetical examples that appear in the shareholder reports of the other accounts or funds.
TIAA Separate Account VA-1 2004 Annual Report | 7
Table of Contents
Stock Index Account | U.S. stocks
DISCUSSION
Performance in the twelve months ended December 31, 2004
The Stock Index Account returned 11.22% for the year. The account’s benchmark, the Russell 3000® Index, returned 11.95% for the period, versus the 8.78% average return of similar accounts, as measured by the Morningstar Large Blend (VA) category, which tracked 2,896 variable annuities during 2004.
Late rally rescues stocks from disappointing year
After posting a 31.06% gain in 2003, the stocks of the Russell 3000 delivered lackluster returns for most of 2004. Mixed economic signals, along with concerns about terrorism and the war in Iraq, constrained equity performance during the first two quarters of the year, and the index was up just 3.59% at mid-year. During the third quarter, soaring oil prices eroded those gains. The Russell 3000 lost 1.90% in the quarter, and, by late October, the market was barely in positive territory year-to-date.
Upward movement returned with a strong rally in November and December that propelled the Russell 3000 to a 10.16% fourth-quarter return and a double-digit gain for the year as a whole. The late surge came as oil prices plunged after topping $55 a barrel in late October.
Small and mid-size value companies perform best
The market’s advance was driven by the 18.33% gain of the small-cap Russell 2000® Index and the 20.22% rise in the Russell Midcap® Index. The predominantly large-cap Russell 1000® Index returned 11.40% for the year.
Value stocks as a group strongly outperformed growth issues during the twelve-month period. The Russell 3000 Value Index, which tracks value stocks of all sizes, climbed 16.94%—more than double the 6.93% return of the Russell 3000 Growth Index.
All industry sectors in the benchmark Russell 3000 had positive returns, led by integrated oils (28.5%) and other energy (41.6%). The strong fourth-quarter rebound enabled technology, the worst-performing sector, to eke out a 1.2% gain for the year.
Among the benchmark’s five largest companies, in terms of market capitalization, the year’s largest returns were by ExxonMobil, General Electric and Microsoft, which were up 28.0%, 20.7% and 9.1%, respectively. The weakest performers in the group were Pfizer, which returned –22.3%, and Citigroup, which returned 2.7%.
For the period, the account’s returns were comparable to those of the benchmark, minus the effect of expenses and of some cash holdings for liquidity. The account also had a risk profile similar to that of the benchmark.
8 | 2004 Annual Report TIAA Separate Account VA-1
Table of Contents
Stock Index Account | U.S. stocks
PERFORMANCE
Investment objective
This account seeks a favorable long-term return from a diversified portfolio selected to track the overall market for common stocks publicly traded in the United States, as represented by a broad stock market index.
Special investment risks
Although this account attempts to closely track the investment performance of its benchmark index, it does not duplicate the composition of this index. In addition, the account’s performance, unlike that of its index, is affected by investment and other operating expenses. There is no guarantee that the performance of the account will match that of its index for any period of time.
The account’s benchmark
The Russell 3000® Index is an unmanaged index of stocks of the 3,000 largest publicly traded U.S. companies, based on total market capitalization, and represents about 98% of the total market capitalization of the publicly traded U.S. equity market. You cannot invest directly in this index.
Performance as of 12/31/2004
| Average annual compound rates of total return* | Cumulative rates of total return* | ||||||||||||||
| 1 year | 5 years | 10 years | 5 years | 10 years | |||||||||||
Stock Index Account | 11.22 | % | –1.57 | % | 11.56 | % | –7.62 | % | 198.84 | % | |||||
Benchmark: | |||||||||||||||
Russell 3000 Index1 | 11.95 | –1.16 | 12.00 | –5.68 | 210.89 | ||||||||||
| * | The returns quoted represent past performance, which is no guarantee of future results. Returns and the principal value of your investment will fluctuate. Current performance may be higher or lower than that shown above, and you may have a gain or a loss when you redeem your accumulation units. For current performance information, including performance to the most recent month-end, please visit www.tiaa-cref.org, or call 800 223-1200. |
| 1 | Russell 3000 is a trademark and service mark of the Frank Russell Company. |
Account facts
Inception date | 11/1/1994 | |
Net assets (12/31/2004) | $915.48 million | |
Total annual expense ratio* | 0.67% |
| * | The total annual expense ratio reflects a voluntary agreement by the account’s investment adviser to waive a portion of its fee. Without this waiver, the account’s total annual expense ratio would have been 0.90%. Although TIAA reserves the right to increase the account’s mortality and expense risk charge to a maximum of 1.00% per year, the total annual expense ratio will never exceed 1.50%. |
Portfolio breakdown by company size
Capitalization as of 12/31/2004 | Percent of net assets | |
Large: over $5 billion | 80.77 | |
Middle: $1 billion–$5 billion | 14.73 | |
Small: under $1 billion | 4.50 | |
Total | 100.00 |
TIAA Separate Account VA-1 2004 Annual Report | 9
Table of Contents
Stock Index Account | U.S. stocks
PERFORMANCE
$10,000 over 10 years

An investment of $10,000 in this account on January 1, 1995, would have grown to $29,884 as of December 31, 2004. For the purpose of comparison, the graph also shows the change in the account’s benchmark during the same period.
Calendar year total returns
Best quarter: 21.46%, for the quarter ended December 31, 1998
Worst quarter: –17.24%, for the quarter ended September 30, 2002
10 | 2004 Annual Report TIAA Separate Account VA-1
Table of Contents
Report of management responsibility
To the Contractowners of TIAA Separate Account VA-1:
The accompanying financial statements of the Stock Index Account of TIAA Separate Account VA-1 (“VA-1”) are the responsibility of management. They have been prepared in accordance with U.S. generally accepted accounting principles and have been presented fairly and objectively in accordance with such principles.
Teachers Insurance and Annuity Association of America (“TIAA”) has established and maintains a strong system of internal controls and disclosure controls designed to provide reasonable assurance that assets are properly safeguarded and transactions are properly executed in accordance with management’s authorization, and to carry out the ongoing responsibilities of management for reliable financial statements. In addition, TIAA’s internal audit personnel provide a continuing review of the internal controls and operations of VA-1, and the chief audit executive regularly reports to the Audit Committee of VA-1’s Management Committee.
The accompanying financial statements have been audited by the independent registered public accounting firm of Ernst & Young LLP. To maintain auditor independence and avoid any conflict of interest, it continues to be VA-1’s policy that any management advisory or consulting services be obtained from a firm other than the external financial audit firm. The report of the independent registered public accounting firm, which follows the notes to financial statements, expresses an independent opinion on the fairness of presentation of these financial statements.
The Audit Committee of VA-1’s Management Committee, consisting entirely of members who are not officers of VA-1, meets regularly with management, representatives of Ernst & Young LLP and internal audit personnel to review matters relating to financial reporting, internal controls and auditing. In addition to the annual audit of the financial statements of VA-1 by the independent registered public accounting firm, the New York State Insurance Department, other state insurance departments and the Securities and Exchange Commission perform periodic examinations of VA-1’s operations.
/s/ Bertram L. Scott
- ---------------------------------------
Bertram L. Scott President | /s/ Elizabeth A. Monrad - --------------------------------------- Elizabeth A. Monrad Executive Vice President and |
| TIAA Separate Account VA-1 2004 Annual Report | 11 |
Table of Contents
Report of the audit committee
To the Contractowners of TIAA Separate Account VA-1:
The Audit Committee (“Committee”) oversees the financial reporting process of the Stock Index Account of TIAA Separate Account VA-1 (“VA-1”) on behalf of VA-1’s Management Committee. The Committee operates in accordance with a formal written charter (copies of which are available upon request), which describes the Committee’s responsibilities. All members of the Committee are independent, as defined under the listing standards of the New York Stock Exchange.
Management has the primary responsibility for VA-1’s financial statements, development and maintenance of a strong system of internal controls and disclosure controls, and compliance with applicable laws and regulations. In fulfilling its oversight responsibilities, the Committee reviewed and approved the audit plans of the internal auditing group and the independent auditing firm in connection with their respective audits of VA-1. The Committee also meets regularly with the internal and independent auditors, both with and without management present, to discuss the results of their examinations, their evaluation of internal controls, and the overall quality of financial reporting. As required by its charter, the Committee will evaluate rotation of the external financial audit firm whenever circumstances warrant, but in no event will the evaluation be later than between their fifth and tenth year of service.
The Committee reviewed and discussed the accompanying audited financial statements with management, including a discussion of the quality and appropriateness of the accounting principles and financial reporting practices followed, the reasonableness of significant judgments, and the clarity and completeness of disclosures in the financial statements. The Committee has also discussed the audited financial statements with Ernst & Young LLP, the independent registered public accounting firm responsible for expressing an opinion on the conformity of these audited financial statements with U.S. generally accepted accounting principles.
The discussion with Ernst & Young LLP focused on their judgments concerning the quality and appropriateness of the accounting principles and financial reporting practices followed by VA-1, the clarity and completeness of the financial statements and related disclosures, and other significant matters, such as any significant changes in accounting policies, internal controls, management judgments and estimates, and the nature of any uncertainties or unusual transactions. In addition, the Committee discussed with Ernst & Young LLP the auditors’ independence from management and VA-1, and has received a written disclosure regarding such independence.
| 12 | 2004 Annual Report TIAA Separate Account VA-1 |
Table of Contents
Report of the audit committee
continued
Based on the review and discussions referred to above, the Committee has approved the release of the accompanying audited financial statements for publication and filing with appropriate regulatory authorities.
Maceo K. Sloan, Audit Committee Chair
Willard T. Carleton, Audit Committee Member
Martin J. Gruber, Audit Committee Member
Bridget A. Macaskill, Audit Committee Member
February 14, 2005
| SEE NOTES TO FINANCIAL STATEMENTS | TIAA Separate Account VA-1 2004 Annual Report | 13 |
Table of Contents
| Stock Index Account | Summary portfolio of investments December 31, 2004 |
ISSUER | PRINCIPAL | VALUE (000) | % OF NET ASSETS | |||||||||
| CORPORATE BOND | ||||||||||||
HEALTH SERVICES | $10,000 | $ | 42 | 0.01 | % | |||||||
| TOTAL CORPORATE BOND | (Cost $10) | 42 | 0.01 | |||||||||
COMPANY | SHARES | |||||||||||
| PREFERRED STOCKS | ||||||||||||
| HEALTH SERVICES OFFICES | 9 | 0.00 | ||||||||||
| PRIMARY METAL INDUSTRIES | — | 0.00 | ||||||||||
| TOTAL PREFERRED STOCKS | (Cost $27) | 9 | 0.00 | |||||||||
| COMMON STOCKS | ||||||||||||
| AGRICULTURAL PRODUCTION-CROPS | 90 | 0.01 | ||||||||||
| AGRICULTURAL PRODUCTION-LIVESTOCK | 26 | 0.00 | ||||||||||
| AMUSEMENT AND RECREATION SERVICES | 1,909 | 0.21 | ||||||||||
| APPAREL AND ACCESSORY STORES | 5,543 | 0.61 | ||||||||||
| APPAREL AND OTHER TEXTILE PRODUCTS | 1,497 | 0.16 | ||||||||||
| AUTO REPAIR, SERVICES AND PARKING | 376 | 0.04 | ||||||||||
| AUTOMOTIVE DEALERS AND SERVICE STATIONS | 1,652 | 0.18 | ||||||||||
| BUILDING MATERIALS AND GARDEN SUPPLIES | ||||||||||||
Home Depot, Inc | 155,833 | 6,660 | 0.73 | |||||||||
Other | 3,834 | 0.42 | ||||||||||
| 10,494 | 1.15 | |||||||||||
| BUSINESS SERVICES | ||||||||||||
| d | Microsoft Corp | 635,274 | 16,968 | 1.85 | ||||||||
| * | Oracle Corp | 262,518 | 3,602 | 0.39 | ||||||||
Other | 42,609 | 4.65 | ||||||||||
| 63,179 | 6.89 | |||||||||||
| CHEMICALS AND ALLIED PRODUCTS | ||||||||||||
Abbott Laboratories | 108,411 | 5,057 | 0.55 | |||||||||
| * | Amgen, Inc | 89,694 | 5,754 | 0.63 | ||||||||
Bristol-Myers Squibb Co | 135,150 | 3,463 | 0.38 | |||||||||
Du Pont (E.I.) de Nemours & Co | 69,526 | 3,410 | 0.37 | |||||||||
Lilly (Eli) & Co | 67,753 | 3,845 | 0.42 | |||||||||
Merck & Co, Inc | 154,456 | 4,964 | 0.54 | |||||||||
Pfizer, Inc | 528,690 | 14,216 | 1.56 | |||||||||
Procter & Gamble Co | 177,979 | 9,803 | 1.07 | |||||||||
Wyeth | 92,689 | 3,948 | 0.43 | |||||||||
Other | 37,135 | 4.06 | ||||||||||
| 91,595 | 10.01 | |||||||||||
| COAL MINING | 936 | 0.10 | ||||||||||
| 14 | 2004 Annual Report TIAA Separate Account VA-1 | SEE NOTES TO FINANCIAL STATEMENTS |
Table of Contents
| Stock Index Account | Summary portfolio of investments December 31, 2004 | continued |
COMPANY | SHARES | VALUE (000) | % OF NET ASSETS | |||||||||
| COMMUNICATIONS | ||||||||||||
BellSouth Corp | 127,504 | $ | 3,543 | 0.39 | % | |||||||
SBC Communications, Inc | 230,205 | 5,932 | 0.65 | |||||||||
Verizon Communications, Inc | 191,961 | 7,776 | 0.85 | |||||||||
Viacom, Inc (Class B) | 97,477 | 3,547 | 0.39 | |||||||||
Other | 24,034 | 2.62 | ||||||||||
| 44,832 | 4.90 | |||||||||||
| DEPOSITORY INSTITUTIONS | ||||||||||||
Bank of America Corp | 281,828 | 13,243 | 1.45 | |||||||||
Citigroup, Inc | 358,003 | 17,249 | 1.89 | |||||||||
JPMorgan Chase & Co | 246,280 | 9,607 | 1.05 | |||||||||
U.S. Bancorp | 132,433 | 4,148 | 0.45 | |||||||||
Wachovia Corp | 111,924 | 5,887 | 0.64 | |||||||||
Wells Fargo & Co | 116,800 | 7,259 | 0.79 | |||||||||
Other | 35,704 | 3.90 | ||||||||||
| 93,097 | 10.17 | |||||||||||
| EATING AND DRINKING PLACES | 6,733 | 0.74 | ||||||||||
| EDUCATIONAL SERVICES | 1,893 | 0.21 | ||||||||||
| ELECTRIC, GAS, AND SANITARY SERVICES | 33,776 | 3.69 | ||||||||||
| ELECTRONIC AND OTHER ELECTRIC EQUIPMENT | ||||||||||||
General Electric Co | 732,326 | 26,730 | 2.92 | |||||||||
Intel Corp | 448,084 | 10,481 | 1.14 | |||||||||
Qualcomm, Inc | 111,718 | 4,737 | 0.52 | |||||||||
Other | 29,749 | 3.25 | ||||||||||
| 71,697 | 7.83 | |||||||||||
| ENGINEERING AND MANAGEMENT SERVICES | 8,422 | 0.92 | ||||||||||
| FABRICATED METAL PRODUCTS | 6,694 | 0.73 | ||||||||||
| FOOD AND KINDRED PRODUCTS | ||||||||||||
Coca-Cola Co | 145,615 | 6,062 | 0.66 | |||||||||
PepsiCo, Inc | 118,153 | 6,168 | 0.67 | |||||||||
Other | 15,316 | 1.68 | ||||||||||
| 27,546 | 3.01 | |||||||||||
| FOOD STORES | 4,521 | 0.49 | ||||||||||
| FORESTRY | 1,048 | 0.11 | ||||||||||
| FURNITURE AND FIXTURES | 2,905 | 0.32 | ||||||||||
| FURNITURE AND HOMEFURNISHINGS STORES | 3,580 | 0.39 | ||||||||||
| GENERAL BUILDING CONTRACTORS | 4,123 | 0.45 | ||||||||||
| GENERAL MERCHANDISE STORES | ||||||||||||
Wal-Mart Stores, Inc | 176,568 | 9,326 | 1.02 | |||||||||
Other | 11,030 | 1.20 | ||||||||||
| 20,356 | 2.22 | |||||||||||
| HEALTH SERVICES | 7,654 | 0.84 | ||||||||||
| HEAVY CONSTRUCTION, EXCEPT BUILDING | 99 | 0.01 | ||||||||||
| SEE NOTES TO FINANCIAL STATEMENTS | TIAA Separate Account VA-1 2004 Annual Report | 15 |
Table of Contents
| Stock Index Account | Summary portfolio of investments December 31, 2004 | continued |
COMPANY | SHARES | VALUE (000) | % OF NET ASSETS | |||||||||
| HOLDING AND OTHER INVESTMENT OFFICES | $ | 24,862 | 2.71 | % | ||||||||
| HOTELS AND OTHER LODGING PLACES | 3,420 | 0.37 | ||||||||||
| INDUSTRIAL MACHINERY AND EQUIPMENT | ||||||||||||
3M Co | 54,364 | 4,462 | 0.49 | |||||||||
| * | Cisco Systems, Inc | 469,984 | 9,071 | 0.99 | ||||||||
| * | Dell, Inc | 174,759 | 7,364 | 0.80 | ||||||||
Hewlett-Packard Co | 214,146 | 4,491 | 0.49 | |||||||||
International Business Machines Corp | 116,676 | 11,502 | 1.26 | |||||||||
Other | 27,532 | 3.01 | ||||||||||
| 64,422 | 7.04 | |||||||||||
| INSTRUMENTS AND RELATED PRODUCTS | ||||||||||||
Medtronic, Inc | 84,259 | 4,185 | 0.46 | |||||||||
Other | 23,636 | 2.58 | ||||||||||
| 27,821 | 3.04 | |||||||||||
| INSURANCE AGENTS, BROKERS AND SERVICE | 3,102 | 0.34 | ||||||||||
| INSURANCE CARRIERS | ||||||||||||
American International Group, Inc | 159,721 | 10,489 | 1.15 | |||||||||
UnitedHealth Group, Inc | 45,949 | 4,045 | 0.44 | |||||||||
Other | 30,473 | 3.33 | ||||||||||
| 45,007 | 4.92 | |||||||||||
| JUSTICE, PUBLIC ORDER AND SAFETY | 16 | 0.00 | ||||||||||
| LEATHER AND LEATHER PRODUCTS | 1,013 | 0.11 | ||||||||||
| LEGAL SERVICES | 32 | 0.00 | ||||||||||
| LOCAL AND INTERURBAN PASSENGER TRANSIT | 154 | 0.02 | ||||||||||
| LUMBER AND WOOD PRODUCTS | 1,216 | 0.13 | ||||||||||
| METAL MINING | 2,596 | 0.28 | ||||||||||
| MISCELLANEOUS MANUFACTURING INDUSTRIES | 1,410 | 0.15 | ||||||||||
| MISCELLANEOUS RETAIL | ||||||||||||
| * | eBay, Inc | 35,609 | 4,141 | 0.45 | ||||||||
Other | 9,392 | 1.03 | ||||||||||
| 13,533 | 1.48 | |||||||||||
| MOTION PICTURES | ||||||||||||
| * | Time Warner, Inc | 305,477 | 5,938 | 0.65 | ||||||||
Walt Disney Co | 143,033 | 3,976 | 0.43 | |||||||||
Other | 2,640 | 0.29 | ||||||||||
| 12,554 | 1.37 | |||||||||||
| NONDEPOSITORY INSTITUTIONS | ||||||||||||
American Express Co | 78,431 | 4,421 | 0.48 | |||||||||
Fannie Mae | 67,559 | 4,811 | 0.53 | |||||||||
Freddie Mac | 48,547 | 3,578 | 0.39 | |||||||||
Other | 9,013 | 0.98 | ||||||||||
| 21,823 | 2.38 | |||||||||||
| 16 | 2004 Annual Report TIAA Separate Account VA-1 | SEE NOTES TO FINANCIAL STATEMENTS |
Table of Contents
| Stock Index Account | Summary portfolio of investments December 31, 2004 | continued |
COMPANY | SHARES | VALUE (000) | % OF NET ASSETS | |||||||||
| NONMETALLIC MINERALS, EXCEPT FUELS | $ | 409 | 0.04 | % | ||||||||
| OIL AND GAS EXTRACTION | 16,509 | 1.80 | ||||||||||
| PAPER AND ALLIED PRODUCTS | 6,457 | 0.71 | ||||||||||
| PERSONAL SERVICES | 1,586 | 0.17 | ||||||||||
| PETROLEUM AND COAL PRODUCTS | ||||||||||||
ChevronTexaco Corp | 148,156 | 7,780 | 0.85 | |||||||||
ConocoPhillips | 48,023 | 4,170 | 0.45 | |||||||||
ExxonMobil Corp | 452,891 | 23,215 | 2.54 | |||||||||
Other | 3,445 | 0.38 | ||||||||||
| 38,610 | 4.22 | |||||||||||
| PRIMARY METAL INDUSTRIES | 5,298 | 0.58 | ||||||||||
| PRINTING AND PUBLISHING | 7,290 | 0.80 | ||||||||||
| RAILROAD TRANSPORTATION | 4,387 | 0.48 | ||||||||||
| REAL ESTATE | 856 | 0.09 | ||||||||||
| RUBBER AND MISCELLANEOUS PLASTIC PRODUCTS | 2,347 | 0.26 | ||||||||||
| SECURITY AND COMMODITY BROKERS | ||||||||||||
Merrill Lynch & Co, Inc | 65,812 | 3,934 | 0.43 | |||||||||
Morgan Stanley | 75,589 | 4,197 | 0.46 | |||||||||
Other | 10,959 | 1.19 | ||||||||||
| 19,090 | 2.08 | |||||||||||
| SOCIAL SERVICES | 77 | 0.01 | ||||||||||
| SPECIAL TRADE CONTRACTORS | 331 | 0.04 | ||||||||||
| STONE, CLAY, AND GLASS PRODUCTS | 1,565 | 0.17 | ||||||||||
| TOBACCO PRODUCTS | ||||||||||||
Altria Group, Inc | 141,549 | 8,649 | 0.95 | |||||||||
Other | 1,598 | 0.17 | ||||||||||
| 10,247 | 1.12 | |||||||||||
| TRANSPORTATION BY AIR | 3,810 | 0.42 | ||||||||||
| TRANSPORTATION EQUIPMENT | ||||||||||||
United Technologies Corp | 36,209 | 3,742 | 0.41 | |||||||||
Other | 19,652 | 2.15 | ||||||||||
| 23,394 | 2.56 | |||||||||||
| TRANSPORTATION SERVICES | 1,182 | 0.13 | ||||||||||
| TRUCKING AND WAREHOUSING | 4,631 | 0.51 | ||||||||||
| WATER TRANSPORTATION | 327 | 0.04 | ||||||||||
| WHOLESALE TRADE-DURABLE GOODS | ||||||||||||
Johnson & Johnson | 205,244 | 13,017 | 1.42 | |||||||||
Other | 4,048 | 0.44 | ||||||||||
| 17,065 | 1.86 | |||||||||||
| SEE NOTES TO FINANCIAL STATEMENTS | TIAA Separate Account VA-1 2004 Annual Report | 17 |
Table of Contents
| Stock Index Account | Summary portfolio of investments December 31, 2004 | concluded |
COMPANY | VALUE (000) | % OF NET ASSETS | |||||||||||
| WHOLESALE TRADE-NONDURABLE GOODS | $ | 6,668 | 0.73 | % | |||||||||
| TOTAL COMMON STOCKS | (Cost $709,275) | 911,390 | 99.55 | ||||||||||
ISSUER | PRINCIPAL | ||||||||||||
| SHORT-TERM INVESTMENTS | |||||||||||||
| U.S. GOVERNMENT AND AGENCIES DISCOUNT NOTES | |||||||||||||
Federal Home Loan Bank (FHLB) 1.900%, 01/12/05 | $ | 2,500,000 | $ | 2,498 | 0.27 | % | |||||||
TOTAL U.S. GOVERNMENT AND AGENCIES DISCOUNT NOTES | 2,498 | 0.27 | |||||||||||
| TOTAL SHORT-TERM INVESTMENTS | (Cost $2,498) | 2,498 | 0.27 | ||||||||||
| TOTAL PORTFOLIO | (Cost $711,810) | 913,939 | 99.83 | % | |||||||||
OTHER ASSETS AND LIABILITIES, NET | 1,539 | 0.17 | |||||||||||
| NET ASSETS | $ | 915,478 | 100.00 | % | |||||||||
| * | Non-income producing |
| d | All or a portion of these securities have been segregated by the custodian to cover margin or other requirements on open futures contracts. |
For ease of presentation, we have grouped a number of classification categories together in the Summary Portfolio of Investments. Note that the Account uses more specific industry categories in following its investment limitations on industry concentration.
Restricted securities held by the Account are as follows:
SECURITY | ACQUISITION DATE | ACQUISITION COST | VALUE | ||||
| McLeod (Escrow) | 05/14/02 | $ — | $ | — | |||
| National Health Investors, Inc. | 01/10/01 | 10,000 | 42,000 | ||||
| Priority Healthcare Corp (Class A) | 01/04/99 | 1,148 | 2,000 | ||||
| Wiltel Communications Group (Rts) | 12/04/03 | — | — | ||||
| $11,148 | $ | 44,000 | |||||
| 18 | 2004 Annual Report TIAA Separate Account VA-1 | SEE NOTES TO FINANCIAL STATEMENTS |
Table of Contents
| Statement of assets and liabilities | TIAA Separate Account VA-1 December 31, 2004 |
| (amounts in thousands, except amount per accumulation unit) | Stock Index Account | ||
ASSETS | |||
Investments, at cost | $ | 711,810 | |
Net unrealized appreciation of investments | 202,129 | ||
Investments, at value | 913,939 | ||
Cash | 73 | ||
Dividends and interest receivable | 1,147 | ||
Receivable from securities transactions | 100 | ||
Amounts due to TIAA and related entities | 266 | ||
Total assets | 915,525 | ||
LIABILITIES | |||
Due to custodian | 44 | ||
Payable for variation margin on open futures contracts | 3 | ||
Total liabilities | 47 | ||
NET ASSETS | |||
Accumulation Fund | $ | 915,478 | |
Accumulation units outstanding—Notes 4 and 5 | 12,123 | ||
Net asset value per accumulation unit—Note 4 | $75.52 | ||
| SEE NOTES TO FINANCIAL STATEMENTS | TIAA Separate Account VA-1 2004 Annual Report | 19 |
Table of Contents
| Statement of operations | TIAA Separate Account VA-1 Year Ended December 31, 2004 |
| (amounts in thousands) | Stock Index Account | |||
INVESTMENT INCOME | ||||
Income: | ||||
Interest | $ | 181 | ||
Dividends | 16,444 | |||
Total income | 16,625 | |||
EXPENSES—Note 2: | ||||
Investment advisory charges | 2,563 | |||
Administrative expenses | 1,708 | |||
Mortality and expense risk charges | 3,417 | |||
Total expenses before waiver | 7,688 | |||
Investment advisory charges waived | (1,965 | ) | ||
Net expenses | 5,723 | |||
Investment income—net | 10,902 | |||
REALIZED AND UNREALIZED GAIN ON TOTAL INVESTMENTS—Note 3 | ||||
Net realized gain on: | ||||
Portfolio investments | 213 | |||
Futures transactions | 46 | |||
Net realized gain on total investments | 259 | |||
Net change in unrealized appreciation on: | ||||
Portfolio investments | 81,121 | |||
Futures transactions | 9 | |||
Net change in unrealized appreciation on total investments | 81,130 | |||
Net realized and unrealized gain on total investments | 81,389 | |||
Net increase in net assets resulting from operations | $ | 92,291 | ||
| 20 | 2004 Annual Report TIAA Separate Account VA-1 | SEE NOTES TO FINANCIAL STATEMENTS |
Table of Contents
| Statements of changes in net assets | TIAA Separate Account VA-1
|
| Stock Index Account | ||||||||
| Years Ended December 31, | ||||||||
| (amounts in thousands) | 2004 | 2003 | ||||||
FROM OPERATIONS | ||||||||
Investment income—net | $ | 10,902 | $ | 8,638 | ||||
Net realized gain (loss) on investments | 259 | (5,659 | ) | |||||
Net change in unrealized appreciation on investments | 81,130 | 183,380 | ||||||
Net increase in net assets resulting from operations | 92,291 | 186,359 | ||||||
FROM CONTRACTOWNER TRANSACTIONS | ||||||||
Premiums | 34,942 | 33,152 | ||||||
Net contractowner transfers from (to) fixed account | (1,800 | ) | 15,657 | |||||
Withdrawals and death benefits | (36,702 | ) | (23,274 | ) | ||||
Net increase (decrease) in net assets | (3,560 | ) | 25,535 | |||||
Net increase in net assets | 88,731 | 211,894 | ||||||
NET ASSETS | ||||||||
Beginning of year | 826,747 | 614,853 | ||||||
End of year | $ | 915,478 | $ | 826,747 | ||||
| SEE NOTES TO FINANCIAL STATEMENTS | TIAA Separate Account VA-1 2004 Annual Report | 21 |
Table of Contents
| Notes to financial statements | TIAA Separate Account VA-1 Stock Index Account |
Note 1—significant accounting policies
TIAA Separate Account VA-1 (“VA-1”) is a segregated investment account of Teachers Insurance and Annuity Association of America (“TIAA”) and was organized on February 16, 1994 under the insurance laws of the State of New York for the purpose of issuing and funding variable annuity contracts. VA-1 is registered with the Securities and Exchange Commission as an open-end management investment company under the Investment Company Act of 1940. VA-1 consists of a single investment portfolio, the Stock Index Account (“Account”), which invests in a diversified portfolio of equity securities selected to track the overall United States stock market. The accompanying financial statements were prepared in accordance with U.S. generally accepted accounting principles, which may require the use of estimates made by management. Actual results may differ from those estimates. The following is a summary of the significant accounting policies consistently followed by the Account.
Valuation of investments: Securities listed or traded on any United States national securities exchange are valued at the last sale price as of the close of the principal securities exchange on which such securities are traded or, if there is no sale, at the mean of the last bid and asked prices on such exchange. Securities traded only in the over-the-counter market and quoted in the NASDAQ National Market System are valued based on last sale price on the date of valuation, or at the mean of the closing bid and asked prices if no sale is reported. All other over-the-counter securities are valued at the mean of the last bid and asked prices. Money market instruments are valued based on the most recent bid price or the equivalent quoted yield for such securities, or derived from a pricing matrix that has various types of money market instruments along one axis and various maturities along the other. Portfolio securities for which market quotations are not readily available are valued at fair value as determined in good faith under the direction of and in accordance with the responsibilities of the Management Committee. Portfolio securities may also be valued at fair value as determined in good faith under the direction of the Management Committee if events materially affecting their value occur between the time their price is determined and the time the Account’s net asset value is calculated. The fair value of securities may be determined with the assistance of a pricing service, which attempts to calculate a fair value for securities based on numerous factors including correlations of a security’s price with securities’ indices and other appropriate indicators, such as ADRs and futures contracts. Other factors may also be considered in determining fair value, such as fundamental analytical data, market and trading trends, and public trading of similar securities of the issuer or comparable issuers.
Accounting for investments: Securities transactions are accounted for as of the trade date. Interest income is recorded as earned and includes amortization of discounts and premiums. Dividend income is recorded on the ex-dividend date. Realized gains and losses on securities transactions are accounted for on the specific identification method.
| 22 | 2004 Annual Report TIAA Separate Account VA-1 |
Table of Contents
| Notes to financial statements | continued |
Securities lending: The Account may lend portfolio securities to qualified institutions. Such loans are secured by collateral at least equal to 102% of the market value of the securities loaned. The Account continues to receive income on the securities loaned and receives additional income from the lending transaction. Additionally, any change in the market value of the securities loaned is recognized by the Account. Although each transaction is collateralized, the Account would bear the risk of delay in recovery of, or loss of rights in, the securities loaned should a borrower fail to return the securities in a timely manner.
Futures contracts: The Account may use futures contracts to manage exposure to the equity markets or for cash management purposes to remain highly invested in the equity markets while minimizing transaction costs. Buying futures contracts tends to increase exposure to the underlying instrument/index, while selling futures contracts tends to decrease exposure to the underlying instrument/index or hedge other investments. Initial margin deposits are made upon entering into a futures contract and variation margin payments are made or received reflecting changes in the value of the futures contracts. Futures contracts are valued at the last sales price as of the close of the board of trade or exchange on which they are traded. Daily changes in the value of such contracts are reflected in net unrealized gains and losses. Gains or losses are realized upon the expiration or closing of the futures contracts, or if the counterparties do not perform in accordance with contractual provisions.
Federal income taxes: Based on provisions of the Internal Revenue Code, no federal taxes are attributable to the net investment experience of the Account.
Note 2—management agreements
Teachers Advisors, Inc. (“Advisors”), a wholly-owned subsidiary of TIAA and a registered investment adviser, provides investment advisory services for VA-1 pursuant to an Investment Management Agreement among TIAA, Advisors and VA-1. TIAA provides all administrative services for VA-1 pursuant to an Administrative Services Agreement with VA-1. The contracts are distributed primarily by Teachers Personal Investors Services, Inc. (“TPIS”), also a wholly-owned subsidiary of TIAA, which is a registered broker-dealer and a member of the National Association of Securities Dealers, Inc. The Investment Management Agreement sets the investment advisory charge at an annual rate of 0.30% of the net assets of the Account. Advisors has agreed to waive a portion of such fee, so that the daily deduction is equivalent to an annual charge of 0.07% of the net assets of the Account. The Administrative Services Agreement sets the administrative expense charge at an annual rate of 0.20% of the net assets of the Account. TIAA also imposes a daily charge for bearing certain mortality and expense risks in connection with the contracts equivalent to an annual rate of 0.40% of the net assets of the Account (prior to July 1, 2003, this daily charge was at an annual rate of 0.10%).
| TIAA Separate Account VA-1 2004 Annual Report | 23 |
Table of Contents
| Notes to financial statements | continued |
Note 3—investments
At December 31, 2004, the net unrealized appreciation on investments was $202,129,000, consisting of gross unrealized appreciation of $292,696,520 and gross unrealized depreciation of $90,567,520.
Purchases and sales of securities, other than short-term money market instruments, for the year ended December 31, 2004, were $46,077,995 and $41,733,131 respectively.
At December 31, 2004, the Account held open futures contracts as follows:
| Number of Contracts | Market Value | Expiration Date | Unrealized Gain | |||||||
E-mini S&P 500 Index | 31 | $ | 1,881,235 | March 2005 | $ | 6,621 | ||||
E-mini Russell 2000 Index | 5 | 326,975 | March 2005 | 2,255 | ||||||
| $ | 8,876 | |||||||||
Note 4—condensed financial information
Selected condensed financial information for an Accumulation Unit of the Account is presented below.
| Years Ended December 31, | ||||||||||||||||||
| 2004 | 2003 | 2002 | 2001 | 2000 | ||||||||||||||
Per Accumulation Unit data: | ||||||||||||||||||
Investment income | $ | 1.359 | $ | 1.041 | $ | .965 | $ | .916 | $ | .966 | ||||||||
Expenses | .468 | .310 | .218 | .253 | .301 | |||||||||||||
Investment income—net | .891 | .731 | .747 | .663 | .665 | |||||||||||||
Net realized and unrealized | 6.727 | 15.066 | (15.200 | ) | (9.499 | ) | (7.024 | ) | ||||||||||
Net increase (decrease) in | 7.618 | 15.797 | (14.453 | ) | (8.836 | ) | (6.359 | ) | ||||||||||
Accumulation Unit Value: | ||||||||||||||||||
Beginning of year | 67.900 | 52.103 | 66.556 | 75.392 | 81.751 | |||||||||||||
End of year | $ | 75.518 | $ | 67.900 | $ | 52.103 | $ | 66.556 | $ | 75.392 | ||||||||
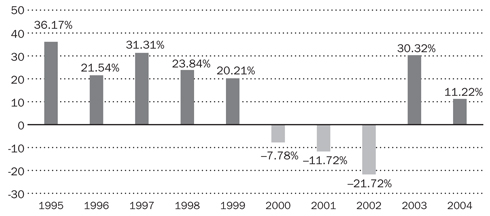
Total return | 11.22% | 30.32% | (21.72% | ) | (11.72% | ) | (7.78% | ) | ||||||||||
Ratio of expenses to average net | 0.90% | 0.76% | 0.60% | 0.60% | 0.60% | |||||||||||||
Ratio of expenses to average net | 0.67% | 0.53% | 0.37% | 0.37% | 0.37% | |||||||||||||
Ratio of net investment income | 1.28% | 1.26% | 1.27% | 0.97% | 0.82% | |||||||||||||
Portfolio turnover rate | 4.90% | 4.14% | 5.33% | 9.86% | 20.68% | |||||||||||||
Thousands of Accumulation | 12,123 | 12,176 | 11,801 | 12,517 | 13,147 | |||||||||||||
| 24 | 2004 Annual Report TIAA Separate Account VA-1 |
Table of Contents
| Notes to financial statements | continued |
Note 5—accumulation units
Changes in the number of Accumulation Units outstanding were as follows:
| Years Ended December 31, | ||||||
| 2004 | 2003 | |||||
Accumulation Units: | ||||||
Credited for premiums | 487,871 | 559,438 | ||||
Cancelled for transfers and disbursements | (540,253 | ) | (184,337 | ) | ||
Outstanding: | ||||||
Beginning of year | 12,175,875 | 11,800,774 | ||||
End of year | 12,123,493 | 12,175,875 | ||||
Note 6—line of credit
The Account participates in a $2.25 billion unsecured revolving credit facility to be used for temporary purposes, including the funding of contractowner withdrawals. Certain affiliated accounts and mutual funds, each of which is managed by Advisors, or an affiliate of Advisors, also participate in this facility. Interest associated with any borrowing under the facility is charged to the borrowing accounts and mutual funds at rates which are based on the Federal Funds Rate in effect during the time of the borrowing. The Account is not liable for borrowings under the facility by affiliated accounts or mutual funds. During the year ended December 31, 2004, the Account did not borrow under this facility.
| TIAA Separate Account VA-1 2004 Annual Report | 25 |
Table of Contents
Report of independent registered public accounting firm
To the Contractowners and Management Committee of TIAA Separate Account VA-1:
We have audited the accompanying statement of assets and liabilities, including the summary portfolio of investments, of the Stock Index Account of TIAA Separate Account VA-1 (“VA-1”) as of December 31, 2004, and the related statement of operations for the year then ended and the statements of changes in net assets for each of the two years in the period then ended. These financial statements are the responsibility of VA-1’s management. Our responsibility is to express an opinion on these financial statements based on our audits.
We conducted our audits in accordance with the standards of the Public Company Accounting Oversight Board (United States). Those standards require that we plan and perform the audit to obtain reasonable assurance about whether the financial statements are free of material misstatement. An audit includes examining, on a test basis, evidence supporting the amounts and disclosures in the financial statements. Our procedures included confirmation of securities owned as of December 31, 2004 by correspondence with the custodian and others. An audit also includes assessing the accounting principles used and significant estimates made by management, as well as evaluating the overall financial statement presentation. We believe that our audits provide a reasonable basis for our opinion.
In our opinion, the financial statements referred to above present fairly, in all material respects, the financial position of the Stock Index Account of VA-1 at December 31, 2004, the results of its operations for the year then ended and the changes in its net assets for each of the two years in the period then ended, in conformity with U.S. generally accepted accounting principles.
/s/ Ernst & Young LLP
- ---------------------------------------
New York, New York
February 25, 2005
| 26 | 2004 Annual Report TIAA Separate Account VA-1 |
Table of Contents
Additional information
Mr. William H. Waltrip, a trustee of TIAA, and Professor Stephen A. Ross, a management committee member of the Separate Account and a trustee of the other TIAA-CREF registered investment companies (together with the Separate Account, the “TIAA-CREF Funds”), resigned from their respective boards on November 30, 2004.
On August 1, 2003, the valuation practice, a non-auditing practice of Ernst & Young, LLP (“E&Y”), the independent auditor to TIAA and the TIAA-CREF Funds, entered into an agreement with a company owned by the two trustees among others, a majority of which was owned by Professor Ross. The business relationship was created to develop intellectual property and related services to value corporate stock options. The aggregate amount paid by E&Y to the company under this agreement was approximately $1.33 million of which Professor Ross received, or will receive, approximately $335,000 (of which $60,000 represented reimbursement of expenses and $25,000 represented repayment of a loan he made to the company). Mr. Waltrip has not received any payment from the company. The agreement and business activity thereunder was terminated on August 20, 2004 and a dissolution agreement was signed as of November 17, 2004.
E&Y informed TIAA and the TIAA-CREF Funds that the business relationship between E&Y and the company owned by the trustees was not in accordance with the auditor independence standards of Regulation S-X and the Public Company Accounting Oversight Board. E&Y also notified the SEC and the Audit Committees of TIAA and the TIAA-CREF Funds of this business relationship. The Audit Committees consist entirely of independent trustees having no business relationships with TIAA, the TIAA-CREF Funds or E&Y.
The Audit Committees of TIAA and the TIAA-CREF Funds, and E&Y, each determined that the trustee’s business relationship with E&Y did not compromise E&Y’s independence from either TIAA or the TIAA-CREF Funds or the integrity or objectivity of the respective audits for 2003 and 2004. This determination was based on, among other things, the fact that the E&Y audit team was not aware of the business relationship when they issued the 2003 audit opinions on the financial statements of TIAA and the TIAA-CREF Funds and the business activity under the agreement was ceased in 2004 upon identification of the matter. Professor Ross and Mr. Waltrip had no other functions or responsibilities as Board members that would have caused them to have direct dealings with the E&Y audit team. Professor Ross and Mr. Waltrip were not members of the Audit Committees.
TIAA and/or the TIAA-CREF Funds have taken steps to ensure that their respective trustees will identify promptly any business relationships that may bring the independence of the outside auditors into question. These steps include revising their officers and trustees questionnaires, improving the questionnaire review process, receiving quarterly auditor independence certifications, and enhancing continuing education for all trustees regarding SEC matters.
In November 2004, TIAA and the TIAA-CREF Funds initiated a request for proposal process to seek accounting firms with the requisite capacity and expertise to perform their respective 2005 audits, which was recently completed. In con - -
continued
| TIAA Separate Account VA-1 2004 Annual Report | 27 |
Table of Contents
| Additional information | concluded |
nection with this process, Professor Martin J. Gruber, the Chairman of the TIAA-CREF Funds, informed the Boards of CREF and the TIAA-CREF Funds that in 1999, he entered into a one-year contract to participate in an academic advisory program sponsored by a non-auditing practice of E&Y. The purpose of the program was to organize conferences, develop publications, and consult on engagements as an expert in his field. Professor Gruber advised the Boards of CREF and the TIAA-CREF Funds that the program was ended before it was launched and the contract expired in 2000.
Based on the facts described above, the Audit Committees of TIAA, CREF and the TIAA-CREF Funds, and E&Y, determined that Professor Gruber’s contract did not impair the independence of E&Y’s audit work for TIAA-CREF or the integrity or objectivity of the respective audits. But in keeping with TIAA-CREF’s current standards of auditor independence, Professor Gruber resigned from the Boards of CREF and the TIAA-CREF Funds.
On February 28, 2005, TIAA, CREF and the TIAA-CREF Funds determined and E&Y agreed that the audit relationship between E&Y and TIAA, CREF and the TIAA-CREF Funds will cease. E&Y will complete its audit work for TIAA, CREF and the TIAA-CREF Funds for their respective 2004 audits.
At a meeting held on February 28, 2005, the Audit Committees of TIAA, CREF and the TIAA-CREF Funds, along with the respective Boards of Trustees, approved the appointment of PricewaterhouseCoopers LLP as the independent registered public accounting firm for these entities for their 2005 audits, effective upon completion of PricewaterhouseCoopers’ customary client acceptance procedures and execution of an engagement letter.
On December 6, 2004, the staff of the SEC informed TIAA and the TIAA-CREF Funds that it is conducting an informal inquiry into the E&Y auditor independence matter. TIAA and the TIAA-CREF Funds are fully cooperating with the SEC staff in connection with the informal inquiry.
| 28 | 2004 Annual Report TIAA Separate Account VA-1 |
Table of Contents
[This page intentionally left blank.]
| SEE NOTES TO FINANCIAL STATEMENTS | TIAA Separate Account VA-1 2004 Annual Report | 29 |
Table of Contents
| Management | Members and officers of TIAA Separate Account VA-1 |
Current TIAA Separate Account VA-1 management committee members and executive officers
DISINTERESTED MEMBERS
| Name, address and age | Position(s) held with account | Term of office and length of time served | Principal occupation(s) during past 5 years | Number of portfolios in fund complex overseen by member | Other directorships held by member | |||||
| Willard T. Carleton 4911 E. Parade Ground Loop Tucson, AZ 85712-6623 Age: 70 | Member | Indefinite term. Member since 2001. | Professor of Finance Emeritus, University of Arizona, College of Business and Public Administration, 2001–present. Formerly, Donald R. Diamond Professor of Finance, University of Arizona, 1999–2001, and Karl L. Eller Professor of Finance, University of Arizona, 1984–1999. Trustee of TIAA, 1984–2003. | 60 | None | |||||
Nancy L. Jacob Windermere Investment Associates 121 S.W. Morrison Street Portland, OR 97204 Age: 61 | Member | Indefinite term. Member since 2001. | President and Managing Principal, Windermere Investment Associates, 1997–present. Formerly, Chairman and Chief Executive Officer, CTC Consulting, Inc., 1994–1997 and Executive Vice President, U.S. Trust of the Pacific Northwest, 1993–1998. | 60 | Director and Chairman of the Investment Committee of the Okabena Company (financial services). | |||||
| Bevis Longstreth Debevoise & Plimpton 919 Third Avenue New York, NY 10022-6225 Age: 70 | Member | Indefinite term. Member since 2001. | Retired Partner, Debevoise & Plimpton. Formerly, Partner (1970–1981, 1984–1997) and Of Counsel (1998–2001) of Debevoise & Plimpton, Adjunct Professor at Columbia University School of Law, 1994–1999 and Commissioner of the U.S. Securities and Exchange Commission, 1981–1984. | 60 | Member of the Board of Directors of AMVESCAP, PLC and Chairman of the Finance Committee of the Rockefeller Family Fund. |
| 30 | 2004 Annual Report TIAA Separate Account VA-1 |
Table of Contents
| TIAA Separate Account VA-1 2004 Annual Report | 31 |
| Bridget A. Macaskill 160 East 81st Street New York, NY 10028 Age: 56 | Member | Indefinite term. Member since 2003. | Independent Consultant for Merrill Lynch, 2003–present. Formerly, Chairman, Oppenheimer Funds, Inc., 2000–2001. Chief Executive Officer, 1995–2001; President, 1991–2000; and Chief Operating Officer, 1989–1995 of that firm. | 60 | Director, J Sainsbury plc (food retailer) and Prudential plc. International Advisory Board, British-American Business Council. | |||||
Maceo K. Sloan NCM Capital Management Group, Inc. 2634 Durham-Chapel Hill Boulevard Suite 206 Durham, NC 27707 Age: 55 | Member | Indefinite term. Member since 2001. | Chairman, President and Chief Executive Officer, Sloan Financial Group, Inc., 1991–present; Chairman and Chief Executive Officer, NCM Capital Management Group, Inc., since 1999; and Chairman, CEO and CIO, NCM Capital Advisers Inc., 2003–present. | 60 | Director, SCANA Corporation (energy holding company) and M&F Bancorp, Inc. | |||||
Ahmed H. Zewall California Institute of Technology Arthur Amos Noyes Laboratory of Chemical Physics Mail Code 127-72 1200 East California Boulevard Pasadena, CA 91125 Age: 58 | Member | Indefinite term. Member since 2004. | Linus Pauling Chair Professor of Chemistry and Professor of Physics, Caltech, 1996–present; and Director, NSF Laboratory for Molecular Sciences (LMS), Caltech, 1995–present. | 60 | None |
Table of Contents
| Management | Members and officers of TIAA Separate Account VA-1 | continued |
EXECUTIVE OFFICERS
| Name, address and age | Position(s) held with account | Term of office and length of time served | Principal occupation(s) during past 5 years | |||
Herbert M. Allison, Jr. TIAA-CREF 730 Third Avenue New York, NY 10017-3206 | President and Chief Executive Officer | Indefinite term. President and Chief Executive Officer since 2002. | Chairman, President and Chief Executive Officer of TIAA since 2002. President and Chief Executive Officer of CREF, TIAA-CREF Mutual Funds, TIAA-CREF Institutional Mutual Funds, TIAA-CREF Life Funds and TIAA Separate Account VA-1 (these funds are collectively referred to as the “TIAA-CREF Funds”) since 2002. Formerly, President and Chief Executive Officer of Alliance for LifeLong Learning, Inc., 2000–2002. President, Chief Operating Officer and Member of the Board of Directors of Merrill Lynch & Co., Inc., 1997–1999. Member of the Board of Directors, New York Stock Exchange. | |||
Gary Chinery TIAA-CREF 730 Third Avenue New York, NY 10017-3206 | Vice President and Treasurer | Indefinite term. Vice President and Treasurer since 2004. | Vice President and Treasurer of TIAA and the TIAA-CREF Funds since 2004. Vice President and Treasurer of Advisors, TIAA-CREF Investment Management, LLC (“Investment Management”), TIAA-CREF Individual and Institutional Services, LLC (“Services”), Teachers Personal Investors Services, Inc. (“TPIS”), TIAA-CREF Tuition Financing, Inc. (“Tuition Financing”) and TIAA-CREF Life Insurance Company (“TIAA-CREF Life”). | |||
| Scott C. Evans TIAA-CREF 730 Third Avenue New York, NY 10017-3206 Age: 45 | Executive Vice President and Chief Investment Officer | Indefinite term. Executive Vice President since 1998. Chief Investment Officer since 2004. | Executive Vice President since 1998 and Chief Investment Officer since 2004 of TIAA and the TIAA-CREF Funds since 2003. President and Chief Executive Officer of Investment Management and Advisors and Director of Advisors and TIAA-CREF Life. Formerly, Executive Vice President, CREF Investments. | |||
| I. Steven Goldstein TIAA-CREF 730 Third Avenue New York, NY 10017-3206 Age: 52 | Executive Vice President | Indefinite term. Executive Vice President since 2003. | Executive Vice President, Public Affairs, of TIAA and the TIAA-CREF Funds since 2003. Formerly, Advisor for McKinsey & Company, 2003; Vice President, Corporate Communications for Dow Jones & Co. and The Wall Street Journal, 2001–2002; and Senior Vice President and Chief Communications Officer for Insurance Information Institute, 1993–2001. |
| 32 | 2004 Annual Report TIAA Separate Account VA-1 |
Table of Contents
| TIAA Separate Account VA-1 2004 Annual Report | 33 |
| E. Laverne Jones TIAA-CREF 730 Third Avenue New York, NY 10017-3206 Age: 55 | Vice President and Corporate Secretary | Indefinite term. Vice President and Corporate Secretary since 2001. | Vice President and Corporate Secretary of TIAA and the TIAA-CREF Funds since 2001. | |||
| Susan S. Kozik TIAA-CREF 730 Third Avenue New York, NY 10017-3206 Age: 47 | Executive Vice President | Indefinite term. Executive Vice President since 2003. | Executive Vice President and Chief Technology Officer of TIAA and the TIAA-CREF Funds since 2003. Formerly, Vice President of IT Operations and Services, Lucent Technologies, 2000–2003; and Senior Vice President and Chief Technology Officer, Penn Mutual Life Insurance Company, 1997–2000. | |||
| George W. Madison TIAA-CREF 730 Third Avenue New York, NY 10017-3206 Age: 51 | Executive Vice President | Indefinite term. Executive Vice President since 2003. | Executive Vice President and General Counsel of TIAA and the TIAA-CREF Funds since 2003. Formerly, Executive Vice President, Corporate Secretary, and General Counsel of Comerica Incorporated, 1997–2000. | |||
| Erwin W. Martens TIAA-CREF 730 Third Avenue New York, NY 10017-3206 Age: 48 | Executive Vice President | Indefinite term. Executive Vice President since 2003. | Executive Vice President, Risk Management, of TIAA and the TIAA-CREF Funds since 2003. Director of Advisors, Services, TPIS, Tuition Financing and TIAA-CREF Life and Manager of Investment Management. Formerly, Managing Director and Chief Risk Officer, Putnam Investments, 1999–2003; and Head and Deputy Head of Global Market Risk Management, 1997–1999. | |||
| Elizabeth A. Monrad TIAA-CREF 730 Third Avenue New York, NY 10017-3206 Age: 50 | Executive Vice President | Indefinite term. Executive Vice President since 2003. | Executive Vice President and Chief Financial Officer of TIAA and the TIAA-CREF Funds since 2003. Executive Vice President of TPIS, Services, Advisors, Investment Management and Tuition Financing. Director of Investment Management, Executive Vice President of TPIS, Services and Tuition Financing. Director of Advisors, TPIS, Tuition Financing and TIAA-CREF Life. Manager of Investment Management and Services. Executive Vice President, Finance, Actuarial and Facilities of TIAA-CREF Life. Formerly, Chief Financial Officer and Senior Vice President of General Re (2000–2003), Chief Financial Officer of its North American Reinsurance Operations (1997–2000) and Corporate Treasurer. Director, Colgate-Palmolive Company | |||
| Frances Nolan TIAA-CREF 730 Third Avenue New York, NY 10017-3206 Age: 47 | Executive Vice President | Indefinite term. Executive Vice President since 2001. | Executive Vice President, Client Services, of TIAA and the TIAA-CREF Funds since 2001. President, Chief Executive Officer and Manager of Services. Director of TPIS, Tuition Financing and TIAA-CREF Life. Formerly, Executive Vice President, Retirement Services, CREF and TIAA, 2000–2003; Vice President, Eastern Division, 1994–2000. |
Table of Contents
| Management | Members and officers of TIAA Separate Account VA-1 | continued |
EXECUTIVE OFFICERS—continued
| Name, address and age | Position(s) held with account | Term of office and length of time served | Principal occupation(s) during past 5 years | |||
| Dermot J. O’Brien TIAA-CREF 730 Third Avenue New York, NY 10017-3206 Age: 38 | Executive Vice President | Indefinite term. Executive Vice President since 2003. | Executive Vice President, Human Resources, of TIAA and the TIAA-CREF Funds since 2003. Director, TIAA-CREF Life. Formerly, First Vice President and Head of Human Resources, International Private Client Division, Merrill Lynch & Co., 1999–Feb. 2003; and Vice President and Head of Human Resources—Japan Morgan Stanley, 1998–1999. | |||
| Bertram L. Scott TIAA-CREF 730 Third Avenue New York, NY 10017-3206 Age: 53 | Executive Vice President | Indefinite term. Executive Vice President since 2001. | Executive Vice President, Product Management, of TIAA and the TIAA-CREF Funds since 2001. Chairman of the Board, President and Chief Executive Officer of TIAA-CREF Life. Director of TPIS; Manager of Services; President and Director of Tuition Financing. Formerly, President and Chief Executive Officer, Horizon Mercy, 1996–2000. |
| 34 | 2004 Annual Report TIAA Separate Account VA-1 |
Table of Contents
HOW TO REACH US
TIAA-CREF WEB CENTER
Account performance, personal account information and transactions, product descriptions and information about investment choices and income options
www.tiaa-cref.org
24 hours a day, 7 days a week
AUTOMATED TELEPHONE SERVICE
Check account performance and accumulation balances, change allocations, transfer funds and verify credited premiums.
800 842-2252
24 hours a day, 7 days a week
TELEPHONE COUNSELING CENTER
Retirement saving and planning, income options and payments and tax reporting
800 842-2776
8 a.m. to 10 p.m. ET, Monday–Friday
9 a.m. to 6 p.m. ET, Saturday
PLANNING AND SERVICE CENTER
TIAA-CREF Mutual Funds, after-tax annuities and life insurance
800 223-1200
8 a.m. to 10 p.m. ET, Monday–Friday
FOR HEARING- OR SPEECH-IMPAIRED PARTICIPANTS
800 842-2755
8 a.m. to 10 p.m. ET, Monday–Friday
9 a.m. to 6 p.m. ET, Saturday
TIAA-CREF TRUST COMPANY, FSB
Asset management, trust administration, estate planning, planned giving and endowment management
888 842-9001
8 a.m. to 5 p.m. CT, Monday–Friday
TIAA-CREF TUITION FINANCING, INC.
Tuition financing programs
888 381-8283
8 a.m. to 11 p.m. ET, Monday–Friday
TIAA-CREF Individual & Institutional Services, LLC, and Teachers Personal Investors Services, Inc., distribute securities products. You should consider the investment objectives, risks, charges and expenses carefully before investing. Please call 800 223-1200 for a prospectus that contains this and other information. Please read the prospectus carefully before investing. Teachers Insurance and Annuity Association (TIAA), New York, NY, and TIAA-CREF Life Insurance Co., New York, NY, issue insurance and annuities. TIAA-CREF Trust Company, FSB, provides trust services. Investment products are not FDIC insured, may lose value and are not bank guaranteed.
©2005 Teachers Insurance and Annuity Association–College Retirement Equities Fund (TIAA-CREF), New York, NY 10017
Table of Contents
 | PRST STD U.S. POSTAGE PAID TIAA-CREF | |
730 Third Avenue New York, NY 10017-3206 | ||
 | A10845 02/05 | |
| C32974 |
Table of Contents
| Item 2. | Code of Ethics. |
The Management Committee of TIAA Separate Account VA-1 (the “Registrant”) has a code of ethics for senior financial officers, including its principal executive officer, principal financial officer, principal accounting officer, or controller, and persons performing similar functions, in conformity with rules promulgated under the Sarbanes-Oxley Act of 2002. The code of ethics is filed as an exhibit to this annual report.
During the reporting period, there were no implicit or explicit waivers granted by the Registrant from any provision of the code of ethics.
| Item 3. | Audit Committee Financial Expert. |
The Management Committee of the Registrant has determined that Maceo K. Sloan is qualified and will continue to serve as the audit committee financial expert on the Registrant’s audit committee. Mr. Sloan is an independent trustee – i.e., he is not an interested person of the Registrant as defined in the Investment Company Act of 1940, nor has he accepted directly or indirectly any consulting, advisory or other compensatory fee from the Registrant, other than in his capacity as member of the management committee.
| Item 4. | Principal Accountant Fees and Services. |
Ernst & Young performs independent audits of the Registrant’s financial statements. To maintain auditor independence and avoid even the appearance of conflicts of interest, the Registrant, as a policy, does not engage Ernst & Young for management advisory or consulting services.
Audit Fees. Ernst & Young’s fees for professional services rendered for the audit of the Registrant’s annual financial statements for the fiscal years ended December 31, 2004 and December 31, 2003 were $50,500 and $46,400, respectively.
Tax Fees. Ernst & Young fees for tax services rendered to the Registrant for the fiscal years ended December 31, 2004 and 2003, were $0.
Other than as set forth above, Ernst & Young had no additional fees with respect to Registrant.
Preapproval Policy. In June of 2003, the Registrant’s audit committee (“Audit Committee”) adopted a Preapproval Policy for External Audit Firm Services (the “Policy”). The Policy describes the types of services that may be provided by the independent auditor to the Registrant without impairing the auditor’s independence. Under the Policy, the Audit Committee is required to preapprove services to be performed by the Registrant’s independent auditor in order to ensure that such services do not impair the auditor’s independence.
The Policy requires the Audit Committee to: (i) appoint the independent auditor to perform the financial statement audit for the Registrant and certain of its affiliates, including approving the terms of the engagement and (ii) preapprove the audit, audit-related and tax services to be provided by the independent auditor and the fees to be charged for provision of such services from year to year.
Auditor Fees for Related Entities. The aggregate non-audit fees billed by Ernst & Young for services rendered to the Registrant and its adviser or affiliates of the adviser performing on-going services to the Registrant, including TIAA (Service Providers), for the year ended December 31, 2004 are $204,800 and for the year ended December 31, 2003 were $171,000.
Ernst & Young’s aggregate fees for professional services rendered in connection with the audit of financial statements for Teachers Insurance and Annuity Association of America (“TIAA”) and the College Retirement Equities Fund (“CREF”) and their affiliated entities for the year ended December 31, 2004 are $7,703,700 and for the year ended December 31, 2003 were $3,955,300. Ernst & Young’s aggregate fees for audit related-services provided to TIAA and CREF and their affiliated entities for the year ended December 31, 2004 are $204,800 and for the year ended December 31, 2003 were $171,000. Ernst & Young’s aggregate fees for tax services provided to TIAA and CREF and their affiliated entities for the year ended December 31, 2004 are $250,600 and for the year ended December 31, 2003 were $229,900.
| Item 6. | Statements of Investments |
Table of Contents
Report of Independent Registered Public Accounting Firm
To the Contractowners and Management Committee of
TIAA Separate Account VA-1
We have audited the statement of assets and liabilities, including the summary portfolio of investments, of the Stock Index Account of TIAA Separate Account VA-1 (“VA-1”) as of December 31, 2004, and the related statement of operations for the year then ended and the statements of changes in net assets for each of the two years in the period then ended, and have issued our report thereon dated February 25, 2005 (included in Item 1 of this Form N-CSR). Our audits also included the statement of investments filed under Item 6 of this Form N-CSR. This statement is the responsibility of VA-1’s management. Our responsibility is to express an opinion based on our audits.
In our opinion, the statement of investments referred to above, when considered in relation to the financial statements taken as a whole, presents fairly in all material respects the information set forth therein.

New York, New York
February 25, 2005
Table of Contents
TIAA Stock Index Account
TIAA STOCK INDEX ACCOUNT
STATEMENT OF INVESTMENTS
December 31, 2004
| SHARES/PRINCIPAL | VALUE (000) | ||||||
| CORPORATE BOND - 0.01% | |||||||
| HEALTH SERVICES - 0.01% | |||||||
| $10,000 | f* | National Health Investors, Inc (Sr Sub Deb) | $ | 42 | |||
9.000%, 01/01/06 | |||||||
TOTAL HEALTH SERVICES | 42 | ||||||
TOTAL CORPORATE BOND (Cost $10) | 42 | ||||||
| PREFERRED STOCKS - 0.00% | |||||||
| HEALTH SERVICES - 0.00% | |||||||
| 535 | * | Bio-Reference Labs, Inc | 9 | ||||
TOTAL HEALTH SERVICES | 9 | ||||||
| PRIMARY METAL INDUSTRIES - 0.00% | |||||||
| 25,150 | v* | Superior Trust I | 0 | ||||
TOTAL PRIMARY METAL INDUSTRIES | 0 | ||||||
TOTAL PREFERRED STOCKS (Cost $27) | 9 | ||||||
| COMMON STOCKS - 99.55% | |||||||
| AGRICULTURAL PRODUCTION-CROPS - 0.01% | |||||||
| 246 | * | Alico, Inc | 14 | ||||
| 2,443 | Delta & Pine Land Co | 67 | |||||
| 360 | * | John B. Sanfilippo & Son | 9 | ||||
TOTAL AGRICULTURAL PRODUCTION-CROPS | 90 | ||||||
| AGRICULTURAL PRODUCTION-LIVESTOCK - 0.00% | |||||||
| 26 | Seaboard Corp | 26 | |||||
TOTAL AGRICULTURAL PRODUCTION-LIVESTOCK | 26 | ||||||
| AMUSEMENT AND RECREATION SERVICES - 0.21% | |||||||
| 3,321 | * | Alliance Gaming Corp | 46 | ||||
| 1,792 | * | Argosy Gaming Co | 84 | ||||
| 2,464 | * | Aztar Corp | 86 | ||||
| 20,455 | * | Caesars Entertainment, Inc | 412 | ||||
| 433 | Churchill Downs, Inc | 19 | |||||
| 685 | Dover Downs Gaming & Entertainment, Inc | 9 | |||||
| 1,000 | Dover Motorsport, Inc | 6 | |||||
| 2,119 | * | Gaylord Entertainment Co | 88 | ||||
| 7,708 | Harrah’s Entertainment, Inc | 516 | |||||
| 2,182 | International Speedway Corp (Class A) | 115 | |||||
| 1,142 | * | Isle of Capri Casinos, Inc | 29 | ||||
| 1,065 | * | Lakes Entertainment, Inc | 17 | ||||
| 3,185 | * | Magna Entertainment Corp (Class A) | 19 | ||||
| 1,437 | * | MTR Gaming Group, Inc | 15 | ||||
| 1,472 | * | Multimedia Games, Inc | 23 | ||||
| 519 | * | Nevada Gold & Casinos, Inc | 6 | ||||
| 2,071 | * | Penn National Gaming, Inc | 125 | ||||
1
Table of Contents
TIAA Stock Index Account
| SHARES/PRINCIPAL | VALUE (000) | |||||
| 6,211 | * | Six Flags, Inc | 33 | |||
| 1,000 | Speedway Motorsports, Inc | 39 | ||||
| 2,946 | Station Casinos, Inc | 161 | ||||
| 1,562 | * | WMS Industries, Inc | 52 | |||
| 717 | World Wrestling Federation Entertainment, Inc | 9 | ||||
TOTAL AMUSEMENT AND RECREATION SERVICES | 1,909 | |||||
| APPAREL AND ACCESSORY STORES - 0.61% | ||||||
| 6,633 | Abercrombie & Fitch Co (Class A) | 311 | ||||
| 3,853 | * | Aeropostale, Inc | 113 | |||
| 3,634 | American Eagle Outfitters, Inc | 171 | ||||
| 4,599 | * | AnnTaylor Stores Corp | 99 | |||
| 675 | Bebe Stores, Inc | 18 | ||||
| 500 | Buckle, Inc | 15 | ||||
| 1,286 | Burlington Coat Factory Warehouse Corp | 29 | ||||
| 664 | * | Cache, Inc | 12 | |||
| 457 | * | Carter’s, Inc | 16 | |||
| 2,400 | * | Casual Male Retail Group, Inc | 13 | |||
| 1,052 | Cato Corp (Class A) | 30 | ||||
| 806 | * | Charlotte Russe Holding, Inc | 8 | |||
| 7,700 | * | Charming Shoppes, Inc | 72 | |||
| 6,171 | * | Chico’s FAS, Inc | 281 | |||
| 1,177 | * | Children’s Place Retail Stores, Inc | 44 | |||
| 2,493 | Christopher & Banks Corp | 46 | ||||
| 6,119 | Claire’s Stores, Inc | 130 | ||||
| 1,500 | * | Dress Barn, Inc | 26 | |||
| 2,704 | Finish Line, Inc (Class A) | 49 | ||||
| 10,006 | Foot Locker, Inc | 269 | ||||
| 44,894 | Gap, Inc | 948 | ||||
| 1,554 | * | Genesco, Inc | 48 | |||
| 1,138 | Goody’s Family Clothing, Inc | 10 | ||||
| 2,122 | * | Gymboree Corp | 27 | |||
| 3,354 | * | Hot Topic, Inc | 58 | |||
| 1,184 | * | Jo-Ann Stores, Inc | 33 | |||
| 560 | * | JOS A. Bank Clothiers, Inc | 16 | |||
| 26,342 | Limited Brands, Inc | 606 | ||||
| 6,514 | Nordstrom, Inc | 304 | ||||
| 739 | Oshkosh B’gosh, Inc (Class A) | 16 | ||||
| 5,329 | * | Pacific Sunwear of California, Inc | 119 | |||
| 4,638 | * | Payless Shoesource, Inc | 57 | |||
| 10,792 | Ross Stores, Inc | 312 | ||||
| 517 | * | Shoe Carnival, Inc | 7 | |||
| 1,437 | * | Stage Stores, Inc | 60 | |||
| 1,800 | Talbots, Inc | 49 | ||||
| 36,263 | TJX Cos, Inc | 911 | ||||
| 2,439 | * | Too, Inc | 60 | |||
| 3,382 | * | Urban Outfitters, Inc | 150 | |||
TOTAL APPAREL AND ACCESSORY STORES | 5,543 | |||||
| APPAREL AND OTHER TEXTILE PRODUCTS - 0.16% | ||||||
| 2,663 | * | Collins & Aikman Corp | 12 | |||
| 904 | * | Columbia Sportswear Co | 54 | |||
| 1,418 | * | DHB Industries, Inc | 27 | |||
| 1,036 | * | Guess?, Inc | 13 | |||
| 1,589 | * | Hartmarx Corp | 12 | |||
2
Table of Contents
TIAA Stock Index Account
| SHARES/PRINCIPAL | VALUE (000) | |||||
| 8,460 | Jones Apparel Group, Inc | 309 | ||||
| 2,000 | Kellwood Co | 69 | ||||
| 7,265 | Liz Claiborne, Inc | 307 | ||||
| 874 | Oxford Industries, Inc | 36 | ||||
| 1,700 | Phillips-Van Heusen Corp | 46 | ||||
| 2,909 | Polo Ralph Lauren Corp | 124 | ||||
| 3,806 | * | Quiksilver, Inc | 113 | |||
| 5,532 | VF Corp | 306 | ||||
| 3,191 | * | Warnaco Group, Inc | 69 | |||
TOTAL APPAREL AND OTHER TEXTILE PRODUCTS | 1,497 | |||||
| AUTO REPAIR, SERVICES AND PARKING - 0.04% | ||||||
| 646 | * | Amerco, Inc | 30 | |||
| 1,250 | Central Parking Corp | 19 | ||||
| 1,736 | * | Dollar Thrifty Automotive Group, Inc | 52 | |||
| 1,626 | * | Exide Technologies | 22 | |||
| 1,073 | * | Midas, Inc | 21 | |||
| 582 | * | Monro Muffler Brake, Inc | 15 | |||
| 4,547 | Ryder System, Inc | 217 | ||||
TOTAL AUTO REPAIR, SERVICES AND PARKING | 376 | |||||
| AUTOMOTIVE DEALERS AND SERVICE STATIONS - 0.18% | ||||||
| 5,154 | * | Advance Auto Parts | 225 | |||
| 273 | * | America’s Car Mart, Inc | 10 | |||
| 1,053 | * | Asbury Automotive Group, Inc | 15 | |||
| 12,420 | * | Autonation, Inc | 239 | |||
| 4,556 | * | Autozone, Inc | 416 | |||
| 7,418 | * | Carmax, Inc | 230 | |||
| 4,822 | * | Copart, Inc | 127 | |||
| 3,233 | * | CSK Auto Corp | 54 | |||
| 1,297 | * | Group 1 Automotive, Inc | 41 | |||
| 1,061 | Lithia Motors, Inc (Class A) | 28 | ||||
| 809 | * | MarineMax, Inc | 24 | |||
| 3,061 | * | O’Reilly Automotive, Inc | 138 | |||
| 405 | * | Rush Enterprises, Inc | 7 | |||
| 1,793 | Sonic Automotive, Inc | 44 | ||||
| 1,214 | United Auto Group, Inc | 36 | ||||
| 744 | * | West Marine, Inc | 18 | |||
TOTAL AUTOMOTIVE DEALERS AND SERVICE STATIONS | 1,652 | |||||
| BUILDING MATERIALS AND GARDEN SUPPLIES - 1.15% | ||||||
| 878 | Building Materials Holding Corp | 34 | ||||
| 1,029 | * | Central Garden & Pet Co | 43 | |||
| 4,181 | Fastenal Co | 257 | ||||
| 155,833 | Home Depot, Inc | 6,660 | ||||
| 2,284 | Lafarge North America, Inc | 117 | ||||
| 53,849 | Lowe’s Cos | 3,101 | ||||
| 7,657 | * | Owens-Illinois, Inc | 173 | |||
| 2,700 | b* | USG Corp | 109 | |||
TOTAL BUILDING MATERIALS AND GARDEN SUPPLIES | 10,494 | |||||
| BUSINESS SERVICES - 6.89% | ||||||
| 2,373 | * | @Road, Inc | 16 | |||
| 1,510 | * | 24/7 Real Media, Inc | 7 | |||
| 27,132 | * | 3Com Corp | 113 | |||
3
Table of Contents
TIAA Stock Index Account
| SHARES/PRINCIPAL | VALUE (000) | |||||
| 2,635 | Aaron Rents, Inc | 66 | ||||
| 2,600 | ABM Industries, Inc | 51 | ||||
| 2,500 | * | ActivCard Corp | 22 | |||
| 9,084 | * | Activision, Inc | 183 | |||
| 3,595 | * | Actuate Corp | 9 | |||
| 5,409 | Acxiom Corp | 142 | ||||
| 1,377 | * | Administaff, Inc | 17 | |||
| 16,467 | Adobe Systems, Inc | 1,033 | ||||
| 2,172 | * | Advent Software, Inc | 44 | |||
| 2,039 | Advo, Inc | 73 | ||||
| 7,880 | * | Affiliated Computer Services, Inc (Class A) | 474 | |||
| 3,625 | * | Agile Software Corp | 30 | |||
| 7,418 | * | Akamai Technologies, Inc | 97 | |||
| 3,113 | * | Alliance Data Systems Corp | 148 | |||
| 1,445 | * | Altiris, Inc | 51 | |||
| 1,337 | * | AMN Healthcare Services, Inc | 21 | |||
| 436 | * | Ansoft Corp | 9 | |||
| 2,094 | * | Ansys, Inc | 67 | |||
| 1,874 | * | Anteon International Corp | 78 | |||
| 3,300 | * | Aquantive, Inc | 30 | |||
| 2,100 | * | Arbitron, Inc | 82 | |||
| 4,191 | * | Ariba, Inc | 70 | |||
| 1,984 | * | Armor Holdings, Inc | 93 | |||
| 4,096 | * | Ascential Software Corp | 67 | |||
| 2,453 | * | Asiainfo Holdings, Inc | 15 | |||
| 4,122 | * | Ask Jeeves, Inc | 110 | |||
| 4,000 | * | Aspect Communications Corp | 45 | |||
| 5,855 | * | Aspen Technology, Inc | 36 | |||
| 546 | * | Asset Acceptance Capital Corp | 12 | |||
| 403 | * | Atari, Inc | 1 | |||
| 2,886 | * | Autobytel, Inc | 17 | |||
| 16,334 | Autodesk, Inc | 620 | ||||
| 42,019 | Automatic Data Processing, Inc | 1,864 | ||||
| 25,646 | * | BEA Systems, Inc | 227 | |||
| 8,366 | * | Bisys Group, Inc | 138 | |||
| 1,200 | * | Blackboard, Inc | 18 | |||
| 623 | * | Blue Coat Systems, Inc | 12 | |||
| 16,380 | * | BMC Software, Inc | 305 | |||
| 5,613 | * | Borland Software Corp | 66 | |||
| 1,224 | Brady Corp (Class A) | 77 | ||||
| 3,945 | Brink’s Co | 156 | ||||
| 18,512 | * | Brocade Communications Systems, Inc | 141 | |||
| 2,196 | * | CACI International, Inc (Class A) | 150 | |||
| 19,038 | * | Cadence Design Systems, Inc | 263 | |||
| 2,233 | * | Captaris, Inc | 12 | |||
| 1,406 | * | Carreker Corp | 12 | |||
| 3,624 | Catalina Marketing Corp | 107 | ||||
| 493 | * | CCC Information Services Group, Inc | 11 | |||
| 900 | CDI Corp | 19 | ||||
| 71,673 | Cendant Corp | 1,676 | ||||
| 10,128 | * | Ceridian Corp | 185 | |||
| 1,892 | * | Cerner Corp | 101 | |||
| 4,279 | Certegy, Inc | 152 | ||||
| 5,652 | * | Checkfree Corp | 215 |
4
Table of Contents
TIAA Stock Index Account
| SHARES/PRINCIPAL | VALUE (000) | |||||
| 5,808 | * | ChoicePoint, Inc | 267 | |||
| 4,981 | * | Chordiant Software, Inc | 11 | |||
| 3,700 | * | Ciber, Inc | 36 | |||
| 11,523 | * | Citrix Systems, Inc | 283 | |||
| 26,192 | * | CMGI, Inc | 67 | |||
| 8,863 | * | CNET Networks, Inc | 100 | |||
| 1,300 | * | Cogent, Inc | 43 | |||
| 10,080 | * | Cognizant Technology Solutions Corp | 427 | |||
| 32,833 | Computer Associates International, Inc | 1,020 | ||||
| 416 | Computer Programs & Systems, Inc | 10 | ||||
| 12,477 | * | Computer Sciences Corp | 703 | |||
| 26,775 | * | Compuware Corp | 173 | |||
| 1,145 | * | Concord Communications, Inc | 13 | |||
| 1,542 | * | Concur Technologies, Inc | 14 | |||
| 11,750 | * | Convergys Corp | 176 | |||
| 2,255 | * | Corillian Corp | 11 | |||
| 1,115 | * | CoStar Group, Inc | 51 | |||
| 1,394 | * | Covansys Corp | 21 | |||
| 3,793 | * | CSG Systems International, Inc | 71 | |||
| 3,587 | * | Cyberguard Corp | 23 | |||
| 1,899 | * | Cybersource Corp | 14 | |||
| 4,324 | Deluxe Corp | 161 | ||||
| 2,509 | * | Dendrite International, Inc | 49 | |||
| 703 | * | Digimarc Corp | 7 | |||
| 2,438 | * | Digital Insight Corp | 45 | |||
| 2,215 | * | Digital River, Inc | 92 | |||
| 8,500 | * | DoubleClick, Inc | 66 | |||
| 5,522 | * | DST Systems, Inc | 288 | |||
| 5,244 | * | Dun & Bradstreet Corp | 313 | |||
| 5,279 | * | E.piphany, Inc | 25 | |||
| 9,627 | * | Earthlink, Inc | 111 | |||
| 1,800 | * | Echelon Corp | 15 | |||
| 2,488 | * | Eclipsys Corp | 51 | |||
| 1,105 | * | eCollege.com, Inc | 13 | |||
| 869 | * | Education Lending Group, Inc | 13 | |||
| 3,401 | * | eFunds Corp | 82 | |||
| 1,000 | Electro Rent Corp | 14 | ||||
| 19,942 | * | Electronic Arts, Inc | 1,230 | |||
| 31,960 | Electronic Data Systems Corp | 738 | ||||
| 1,475 | * | Embarcadero Technologies, Inc | 14 | |||
| 14,227 | * | Enterasys Networks, Inc | 26 | |||
| 4,419 | * | Entrust, Inc | 17 | |||
| 2,600 | * | Epicor Software Corp | 37 | |||
| 857 | * | EPIQ Systems, Inc | 13 | |||
| 9,789 | Equifax, Inc | 275 | ||||
| 1,075 | * | Equinix, Inc | 46 | |||
| 1,565 | * | eSpeed, Inc (Class A) | 19 | |||
| 7,347 | * | Extreme Networks, Inc | 48 | |||
| 2,395 | * | F5 Networks, Inc | 117 | |||
| 1,500 | Factset Research Systems, Inc | 88 | ||||
| 4,904 | Fair Isaac Corp | 180 | ||||
| 2,707 | * | Filenet Corp | 70 | |||
| 1,351 | * | FindWhat.com | 24 | |||
| 61,611 | First Data Corp | 2,621 |
5
Table of Contents
TIAA Stock Index Account
| SHARES/PRINCIPAL | VALUE (000) | |||||
| 12,787 | * | Fiserv, Inc | 514 | |||
| 2,998 | * | Getty Images, Inc | 206 | |||
| 1,647 | Gevity HR, Inc | 34 | ||||
| 1,350 | * | Google, Inc (Class A) | 261 | |||
| 351 | * | Greg Manning Auctions, Inc | 4 | |||
| 52 | Grey Global Group, Inc | 57 | ||||
| 1,332 | * | GSI Commerce, Inc | 24 | |||
| 8,248 | GTECH Holdings Corp | 214 | ||||
| 3,404 | * | Harris Interactive, Inc | 27 | |||
| 1,000 | Healthcare Services Group | 21 | ||||
| 1,400 | * | Heidrick & Struggles International, Inc | 48 | |||
| 4,697 | Henry (Jack) & Associates, Inc | 94 | ||||
| 6,619 | * | Homestore, Inc | 20 | |||
| 692 | * | Hudson Highland Group, Inc | 20 | |||
| 2,853 | * | Hyperion Solutions Corp | 133 | |||
| 230 | * | IAC/InterActiveCorp Wts 02/04/09 | 7 | |||
| 1,441 | * | IDX Systems Corp | 50 | |||
| 1,449 | * | iGate Corp | 6 | |||
| 2,423 | Imation Corp | 77 | ||||
| 17,181 | IMS Health, Inc | 399 | ||||
| 1,090 | * | Infocrossing, Inc | 18 | |||
| 5,959 | * | Informatica Corp | 48 | |||
| 2,218 | * | Infospace, Inc | 105 | |||
| 1,967 | * | infoUSA, Inc | 22 | |||
| 485 | * | Innovative Solutions & Support, Inc | 16 | |||
| 2,541 | * | Interactive Data Corp | 55 | |||
| 3,359 | * | Intergraph Corp | 90 | |||
| 2,646 | * | Internet Capital Group, Inc | 24 | |||
| 2,744 | * | Internet Security Systems, Inc | 64 | |||
| 27,452 | * | Interpublic Group of Cos, Inc | 368 | |||
| 492 | * | Intersections, Inc | 8 | |||
| 596 | * | Intervideo, Inc | 8 | |||
| 3,184 | * | Interwoven, Inc | 35 | |||
| 1,058 | * | Intrado, Inc | 13 | |||
| 13,097 | * | Intuit, Inc | 576 | |||
| 3,071 | * | Ipass, Inc | 23 | |||
| 729 | * | iPayment, Inc | 36 | |||
| 6,838 | * | Iron Mountain, Inc | 208 | |||
| 3,649 | * | iVillage, Inc | 23 | |||
| 1,953 | * | JDA Software Group, Inc | 27 | |||
| 36,836 | * | Juniper Networks, Inc | 1,002 | |||
| 1,087 | * | Jupitermedia Corp | 26 | |||
| 3,727 | * | Keane, Inc | 55 | |||
| 1,200 | Kelly Services, Inc (Class A) | 36 | ||||
| 1,631 | * | Keynote Systems, Inc | 23 | |||
| 1,774 | * | Kforce, Inc | 20 | |||
| 2,918 | * | KFX, Inc | 42 | |||
| 1,718 | * | Kinetic Concepts, Inc | 131 | |||
| 2,200 | * | Kintera, Inc | 20 | |||
| 2,700 | * | Korn/Ferry International | 56 | |||
| 2,052 | * | Kronos, Inc | 105 | |||
| 2,950 | * | Labor Ready, Inc | 50 | |||
| 5,772 | * | Lamar Advertising Co | 247 | |||
| 3,863 | * | Lawson Software, Inc | 27 |
6
Table of Contents
TIAA Stock Index Account
| SHARES/PRINCIPAL | VALUE (000) | ||||||
| 3,238 | * | Lionbridge Technologies | 22 | ||||
| 6,635 | * | Looksmart Ltd | 15 | ||||
| 4,803 | * | Macromedia, Inc | 149 | ||||
| 3,427 | * | Macrovision Corp | 88 | ||||
| 1,711 | * | Magma Design Automation, Inc | 21 | ||||
| 2,098 | * | Manhattan Associates, Inc | 50 | ||||
| 5,823 | Manpower, Inc | 281 | |||||
| 919 | * | Mantech International Corp (Class A) | 22 | ||||
| 4,273 | * | Manugistics Group, Inc | 12 | ||||
| 1,033 | * | MAPICS, Inc | 11 | ||||
| 1,404 | * | Mapinfo Corp | 17 | ||||
| 402 | * | MarketWatch, Inc | 7 | ||||
| 412 | * | Marlin Business Services, Inc | 8 | ||||
| 3,375 | * | Matrixone, Inc | 22 | ||||
| 11,492 | * | McAfee, Inc | 332 | ||||
| 658 | McGrath RentCorp | 29 | |||||
| 562 | * | Medical Staffing Network Holdings, Inc | 5 | ||||
| 4,700 | * | Mentor Graphics Corp | 72 | ||||
| 6,409 | * | Mercury Interactive Corp | 292 | ||||
| 5,400 | * | Micromuse, Inc | 30 | ||||
| 635,274 | d | Microsoft Corp | 16,968 | ||||
| 939 | * | MicroStrategy, Inc | 57 | ||||
| 3,498 | * | Midway Games, Inc | 37 | ||||
| 6,915 | * | Mindspeed Technologies, Inc | 19 | ||||
| 6,076 | MoneyGram International, Inc | 128 | |||||
| 7,014 | * | Monster Worldwide, Inc | 236 | ||||
| 7,306 | * | MPS Group, Inc | 90 | ||||
| 1,100 | * | MRO Software, Inc | 14 | ||||
| 1,833 | * | MSC.Software Corp | 19 | ||||
| 3,262 | National Instruments Corp | 89 | |||||
| 2,800 | * | NAVTEQ Corp | 130 | ||||
| 1,879 | * | NCO Group, Inc | 49 | ||||
| 4,200 | * | NCP Litigation Trust | (0 | ) | |||
| 5,970 | * | NCR Corp | 413 | ||||
| 2,331 | NDCHealth Corp | 43 | |||||
| 538 | * | Neoforma, Inc | 4 | ||||
| 3,593 | * | NETIQ Corp | 44 | ||||
| 679 | * | Netratings, Inc | 13 | ||||
| 1,000 | * | Netscout Systems, Inc | 7 | ||||
| 1,700 | * | Network Equipment Technologies, Inc | 17 | ||||
| 1,732 | * | NIC, Inc | 9 | ||||
| 26,305 | * | Novell, Inc | 178 | ||||
| 13,472 | Omnicom Group, Inc | 1,136 | |||||
| 827 | * | Open Solutions, Inc | 21 | ||||
| 600 | * | Opnet Technologies, Inc | 5 | ||||
| 3,218 | * | Opsware, Inc | 24 | ||||
| 262,518 | * | Oracle Corp | 3,602 | ||||
| 2,281 | * | Packeteer, Inc | 33 | ||||
| 1,017 | * | PalmSource, Inc | 13 | ||||
| 18,633 | * | Parametric Technology Corp | 110 | ||||
| 1,347 | * | PC-Tel, Inc | 11 | ||||
| 860 | * | PDF Solutions, Inc | 14 | ||||
| 552 | * | PDI, Inc | 12 | ||||
| 603 | * | PEC Solutions, Inc | 9 |
7
Table of Contents
TIAA Stock Index Account
| SHARES/PRINCIPAL | VALUE (000) | |||||
| 1,800 | * | Pegasus Solutions, Inc | 23 | |||
| 438 | * | Pegasystems, Inc | 4 | |||
| 4,935 | * | Perot Systems Corp (Class A) | 79 | |||
| 1,658 | * | Pixar | 142 | |||
| 1,598 | * | PLATO Learning, Inc | 12 | |||
| 2,060 | * | Portal Software, Inc | 5 | |||
| 800 | * | Portfolio Recovery Associates, Inc | 33 | |||
| 6,300 | * | ProcureNet, Inc | 1 | |||
| 2,052 | * | Progress Software Corp | 48 | |||
| 417 | * | Proxymed, Inc | 4 | |||
| 1,000 | QAD, Inc | 9 | ||||
| 221 | * | Quality Systems, Inc | 13 | |||
| 3,456 | * | Quest Software, Inc | 55 | |||
| 1,871 | * | R.H. Donnelley Corp | 110 | |||
| 1,200 | * | Radisys Corp | 23 | |||
| 7,819 | * | RealNetworks, Inc | 52 | |||
| 11,250 | * | Red Hat, Inc | 150 | |||
| 2,170 | * | Redback Networks, Inc | 12 | |||
| 781 | Renaissance Learning, Inc | 14 | ||||
| 4,908 | * | Rent-A-Center, Inc | 130 | |||
| 1,839 | * | Rent-Way, Inc | 15 | |||
| 3,716 | * | Retek, Inc | 23 | |||
| 1,608 | * | Rewards Network, Inc | 11 | |||
| 4,760 | Reynolds & Reynolds Co (Class A) | 126 | ||||
| 10,282 | Robert Half International, Inc | 303 | ||||
| 1,421 | Rollins, Inc | 37 | ||||
| 4,293 | * | RSA Security, Inc | 86 | |||
| 5,099 | * | SI Corp | 46 | |||
| 1,510 | * | SafeNet, Inc | 55 | |||
| 5,900 | * | Sapient Corp | 47 | |||
| 10,064 | * | Scansoft, Inc | 42 | |||
| 2,400 | * | Secure Computing Corp | 24 | |||
| 3,749 | * | Seebeyond Technology Corp | 13 | |||
| 1,706 | * | Serena Software, Inc | 37 | |||
| 349 | * | SI International, Inc | 11 | |||
| 29,162 | * | Siebel Systems, Inc | 306 | |||
| 4,049 | * | Sitel Corp | 10 | |||
| 588 | * | SoftBrands, Inc | 1 | |||
| 1,534 | * | Sohu.com, Inc | 27 | |||
| 4,132 | * | SonicWALL, Inc | 26 | |||
| 3,230 | * | Sotheby’s Holdings, Inc (Class A) | 59 | |||
| 1,366 | * | Source Interlink Cos, Inc | 18 | |||
| 4,207 | * | Spherion Corp | 35 | |||
| 900 | * | SPSS, Inc | 14 | |||
| 905 | * | SRA International, Inc (Class A) | 58 | |||
| 849 | SS&C Technologies, Inc | 18 | ||||
| 746 | Startek, Inc | 21 | ||||
| 1,182 | * | Stellent, Inc | 10 | |||
| 466 | * | Stratasys, Inc | 16 | |||
| 227,353 | * | Sun Microsystems, Inc | 1,223 | |||
| 19,970 | * | SunGard Data Systems, Inc | 566 | |||
| 2,522 | * | SupportSoft, Inc | 17 | |||
| 6,736 | * | Sybase, Inc | 134 | |||
| 1,700 | * | Sykes Enterprises, Inc | 12 |
8
Table of Contents
TIAA Stock Index Account
| SHARES/PRINCIPAL | VALUE (000) | |||||
| 43,164 | * | Symantec Corp | 1,112 | |||
| 455 | * | SYNNEX Corp | 11 | |||
| 10,114 | * | Synopsys, Inc | 198 | |||
| 403 | Syntel, Inc | 7 | ||||
| 3,100 | * | Take-Two Interactive Software, Inc | 108 | |||
| 835 | Talx Corp | 22 | ||||
| 2,768 | * | TeleTech Holdings, Inc | 27 | |||
| 2,833 | * | THQ, Inc | 65 | |||
| 13,792 | * | TIBCO Software, Inc | 184 | |||
| 1,039 | * | Tier Technologies, Inc (Class B) | 10 | |||
| 227 | * | TippingPoint Technologies, Inc | 11 | |||
| 5,832 | * | Titan Corp | 94 | |||
| 309 | * | TNS, Inc | 7 | |||
| 2,517 | Total System Services, Inc | 61 | ||||
| 1,168 | * | TradeStation Group, Inc | 8 | |||
| 2,585 | * | Transaction Systems Architects, Inc (Class A) | 51 | |||
| 300 | * | Travelzoo, Inc | 29 | |||
| 2,119 | * | Trizetto Group, Inc | 20 | |||
| 3,314 | * | Tumbleweed Communications Corp | 11 | |||
| 3,517 | * | Tyler Technologies, Inc | 29 | |||
| 1,063 | * | Ultimate Software Group, Inc | 13 | |||
| 21,677 | * | Unisys Corp | 221 | |||
| 3,701 | * | United Online, Inc | 43 | |||
| 3,755 | * | United Rentals, Inc | 71 | |||
| 1,098 | * | Universal Compression Holdings, Inc | 38 | |||
| 5,496 | * | Valueclick, Inc | 73 | |||
| 812 | * | Verint Systems, Inc | 29 | |||
| 17,237 | * | VeriSign, Inc | 578 | |||
| 29,446 | * | Veritas Software Corp | 841 | |||
| 2,069 | * | Verity, Inc | 27 | |||
| 667 | * | Vertrue, Inc | 25 | |||
| 1,519 | Viad Corp | 43 | ||||
| 16,948 | * | Vignette Corp | 24 | |||
| 572 | * | Volt Information Sciences, Inc | 17 | |||
| 2,210 | * | WatchGuard Technologies, Inc | 10 | |||
| 2,094 | * | WebEx Communications, Inc | 50 | |||
| 21,702 | * | WebMD Corp | 177 | |||
| 3,244 | * | webMethods, Inc | 23 | |||
| 1,479 | * | Websense, Inc | 75 | |||
| 6,001 | * | Westwood One, Inc | 162 | |||
| 4,910 | * | Wind River Systems, Inc | 67 | |||
| 1,427 | * | Witness Systems, Inc | 25 | |||
| 78,261 | * | Yahoo!, Inc | 2,949 | |||
| 1,449 | * | Zix Corp | 7 | |||
TOTAL BUSINESS SERVICES | 63,179 | |||||
| CHEMICALS AND ALLIED PRODUCTS - 10.01% | ||||||
| 108,411 | Abbott Laboratories | 5,057 | ||||
| 5,917 | * | Abgenix, Inc | 61 | |||
| 1,183 | * | Able Laboratories, Inc | 27 | |||
| 897 | Aceto Corp | 17 | ||||
| 2,849 | * | Adolor Corp | 28 | |||
| 656 | * | Advancis Pharmaceutical Corp | 3 | |||
| 15,826 | Air Products & Chemicals, Inc | 917 | ||||
9
Table of Contents
TIAA Stock Index Account
| SHARES/PRINCIPAL | VALUE (000) | |||||
| 1,600 | * | Albany Molecular Research, Inc | 18 | |||
| 1,874 | Albemarle Corp | 73 | ||||
| 4,371 | Alberto-Culver Co | 212 | ||||
| 2,605 | * | Alexion Pharmaceuticals, Inc | 66 | |||
| 6,230 | * | Alkermes, Inc | 88 | |||
| 9,267 | Allergan, Inc | 751 | ||||
| 2,624 | Alpharma, Inc (Class A) | 44 | ||||
| 1,431 | * | American Pharmaceutical Partners, Inc | 54 | |||
| 348 | American Vanguard Corp | 13 | ||||
| 89,694 | * | Amgen, Inc | 5,754 | |||
| 6,644 | * | Amylin Pharmaceuticals, Inc | 155 | |||
| 5,037 | * | Andrx Corp | 110 | |||
| 1,500 | Arch Chemicals, Inc | 43 | ||||
| 1,660 | * | Array Biopharma, Inc | 16 | |||
| 2,452 | * | Atherogenics, Inc | 58 | |||
| 4,070 | * | Avant Immunotherapeutics, Inc | 8 | |||
| 7,783 | Avery Dennison Corp | 467 | ||||
| 33,204 | Avon Products, Inc | 1,285 | ||||
| 6,129 | * | Barr Pharmaceuticals, Inc | 279 | |||
| 454 | * | Barrier Therapeutics, Inc | 8 | |||
| 872 | * | Benthley Pharmaceuticals, Inc | 9 | |||
| 1,137 | * | BioCryst Pharmaceuticals, Inc | 7 | |||
| 2,648 | * | Bioenvision, Inc | 24 | |||
| 22,886 | * | Biogen Idec, Inc | 1,524 | |||
| 4,266 | * | BioMarin Pharmaceutical, Inc | 27 | |||
| 842 | * | Biosite, Inc | 52 | |||
| 1,087 | * | Bone Care International, Inc | 30 | |||
| 940 | * | Bradley Pharmaceuticals, Inc | 18 | |||
| 135,150 | Bristol-Myers Squibb Co | 3,463 | ||||
| 4,244 | Cabot Corp | 164 | ||||
| 2,400 | Calgon Carbon Corp | 22 | ||||
| 1,815 | Cambrex Corp | 49 | ||||
| 1,149 | * | CancerVax Corp | 12 | |||
| 631 | * | Caraco Pharmaceutical Laboratories Ltd | 6 | |||
| 3,105 | * | Cell Genesys, Inc | 25 | |||
| 3,499 | * | Cell Therapeutics, Inc | 28 | |||
| 3,899 | * | Cephalon, Inc | 198 | |||
| 4,243 | * | Charles River Laboratories International, Inc | 195 | |||
| 1,163 | * | Chattem, Inc | 38 | |||
| 6,618 | * | Chiron Corp | 221 | |||
| 4,279 | Church & Dwight Co, Inc | 144 | ||||
| 10,642 | Clorox Co | 627 | ||||
| 36,810 | Colgate-Palmolive Co | 1,883 | ||||
| 2,200 | * | Connetics Corp | 53 | |||
| 428 | * | Corgentech, Inc | 4 | |||
| 3,871 | * | Corixa Corp | 14 | |||
| 7,909 | Crompton Corp | 93 | ||||
| 2,851 | * | Cubist Pharmaceuticals, Inc | 34 | |||
| 2,881 | * | Curis, Inc | 15 | |||
| 3,041 | * | Cypress Bioscience, Inc | 43 | |||
| 2,754 | Cytec Industries, Inc | 142 | ||||
| 1,078 | * | Cytogen Corp | 12 | |||
| 525 | * | Cytokinetics, Inc | 5 | |||
| 2,958 | * | Dade Behring Holdings, Inc | 166 |
10
Table of Contents
TIAA Stock Index Account
| SHARES/PRINCIPAL | VALUE (000) | |||||
| 315 | * | DEL Laboratories, Inc | 11 | |||
| 4,015 | * | Dendreon Corp | 43 | |||
| 1,474 | Diagnostic Products Corp | 81 | ||||
| 900 | * | Digene Corp | 24 | |||
| 4,949 | * | Discovery Laboratories, Inc | 39 | |||
| 700 | * | Dov Pharmaceutical, Inc | 13 | |||
| 65,653 | Dow Chemical Co | 3,250 | ||||
| 69,526 | Du Pont (E.I.) de Nemours & Co | 3,410 | ||||
| 1,775 | * | Durect Corp | 6 | |||
| 1,041 | * | Dusa Pharmaceuticals, Inc | 15 | |||
| 5,382 | Eastman Chemical Co | 311 | ||||
| 13,776 | Ecolab, Inc | 484 | ||||
| 1,399 | * | Elizabeth Arden, Inc | 33 | |||
| 4,500 | * | Encysive Pharmaceuticals, Inc | 45 | |||
| 3,094 | * | Enzon, Inc | 42 | |||
| 1,950 | * | Eon Labs, Inc | 53 | |||
| 1,584 | * | EPIX Pharmaceuticals, Inc | 28 | |||
| 7,158 | Estee Lauder Cos (Class A) | 328 | ||||
| 474 | * | Eyetech Pharmaceuticals, Inc | 22 | |||
| 2,913 | Ferro Corp | 68 | ||||
| 1,824 | * | First Horizon Pharmaceutical | 42 | |||
| 2,528 | * | FMC Corp | 122 | |||
| 24,815 | * | Forest Laboratories, Inc | 1,113 | |||
| 3,645 | * | Genaera Corp | 12 | |||
| 6,116 | * | Genelabs Technologies | 7 | |||
| 30,022 | * | Genentech, Inc | 1,634 | |||
| 4,216 | * | Genta, Inc | 7 | |||
| 16,053 | * | Genzyme Corp | 932 | |||
| 1,978 | Georgia Gulf Corp | 99 | ||||
| 3,135 | * | Geron Corp | 25 | |||
| 28,440 | * | Gilead Sciences, Inc | 995 | |||
| 69,545 | Gillette Co | 3,114 | ||||
| 3,527 | Great Lakes Chemical Corp | 100 | ||||
| 6,360 | * | Guilford Pharmaceuticals, Inc | 31 | |||
| 1,996 | H.B. Fuller Co | 57 | ||||
| 956 | * | Hollis-Eden Pharmaceuticals | 9 | |||
| 11,025 | * | Hospira, Inc | 369 | |||
| 8,974 | * | Human Genome Sciences, Inc | 108 | |||
| 3,632 | * | ICOS Corp | 103 | |||
| 2,414 | * | Idexx Laboratories, Inc | 132 | |||
| 4,293 | * | ImClone Systems, Inc | 198 | |||
| 2,898 | * | Immucor, Inc | 68 | |||
| 2,900 | * | Immunogen, Inc | 26 | |||
| 6,300 | * | Immunomedics, Inc | 19 | |||
| 3,380 | * | Impax Laboratories, Inc | 54 | |||
| 4,319 | * | Indevus Pharmaceuticals, Inc | 26 | |||
| 3,383 | * | Inkine Pharmaceutical Co | 18 | |||
| 2,221 | * | Inspire Pharmaceuticals, Inc | 37 | |||
| 236 | Inter Parfums, Inc | 4 | ||||
| 1,694 | * | InterMune, Inc | 22 | |||
| 4,926 | International Flavors & Fragrances, Inc | 211 | ||||
| 933 | * | Inverness Medical Innovations, Inc | 23 | |||
| 3,641 | * | Invitrogen Corp | 244 | |||
| 3,357 | * | Isis Pharmaceuticals, Inc | 20 |
11
Table of Contents
TIAA Stock Index Account
| SHARES/PRINCIPAL | VALUE (000) | |||||
| 1,537 | * | Isolagen, Inc | 12 | |||
| 13,042 | * | IVAX Corp | 206 | |||
| 16,832 | * | King Pharmaceuticals, Inc | 209 | |||
| 1,301 | * | Kos Pharmaceuticals, Inc | 49 | |||
| 353 | Kronos Worldwide, Inc | 14 | ||||
| 2,481 | * | KV Pharmaceutical Co (Class A) | 55 | |||
| 400 | * | Lannett Co, Inc | 4 | |||
| 5,135 | * | Ligand Pharmaceuticals, Inc (Class B) | 60 | |||
| 67,753 | Lilly (Eli) & Co | 3,845 | ||||
| 1,876 | MacDermid, Inc | 68 | ||||
| 987 | Mannatech, Inc | 19 | ||||
| 1,000 | * | MannKind Corp | 16 | |||
| 1,805 | * | Martek Biosciences Corp | 92 | |||
| 6,813 | * | Medarex, Inc | 73 | |||
| 3,315 | * | Medicines Co | 95 | |||
| 4,254 | Medicis Pharmaceutical Corp (Class A) | 149 | ||||
| 17,962 | * | MedImmune, Inc | 487 | |||
| 154,456 | Merck & Co, Inc | 4,964 | ||||
| 4,800 | * | MGI Pharma, Inc | 134 | |||
| 21,183 | * | Millennium Pharmaceuticals, Inc | 257 | |||
| 1,370 | Minerals Technologies, Inc | 91 | ||||
| 8,050 | * | Mosaic Co | 131 | |||
| 19,174 | Mylan Laboratories, Inc | 339 | ||||
| 970 | * | Myogen, Inc | 8 | |||
| 4,000 | * | Nabi Biopharmaceuticals | 59 | |||
| 3,300 | * | Nalco Holding Co | 64 | |||
| 810 | Nature's Sunshine Products, Inc | 16 | ||||
| 3,790 | * | NBTY, Inc | 91 | |||
| 5,807 | * | Nektar Therapeutics | 118 | |||
| 800 | * | Neose Technologies, Inc | 5 | |||
| 2,526 | * | Neurocrine Biosciences, Inc | 125 | |||
| 1,736 | * | Neurogen Corp | 16 | |||
| 954 | * | NewMarket Corp | 19 | |||
| 685 | * | NitroMed, Inc | 18 | |||
| 964 | * | NL Industries, Inc | 21 | |||
| 1,322 | * | Northfield Laboratories, Inc | 30 | |||
| 1,495 | * | Noven Pharmaceuticals, Inc | 26 | |||
| 2,588 | * | NPS Pharmaceuticals, Inc | 47 | |||
| 547 | * | Nutraceutical International Corp | 8 | |||
| 1,969 | * | Nuvelo, Inc | 19 | |||
| 730 | Octel Corp | 15 | ||||
| 4,620 | Olin Corp | 102 | ||||
| 1,900 | * | OM Group, Inc | 62 | |||
| 2,700 | * | Omnova Solutions, Inc | 15 | |||
| 2,409 | * | Onyx Pharmaceuticals, Inc | 78 | |||
| 2,301 | * | OraSure Technologies, Inc | 15 | |||
| 3,532 | * | OSI Pharmaceuticals, Inc | 264 | |||
| 1,792 | * | Pain Therapeutics, Inc | 13 | |||
| 3,661 | * | Palatin Technologies, Inc | 10 | |||
| 2,340 | * | Par Pharmaceutical Cos, Inc | 97 | |||
| 1,019 | * | Penwest Pharmaceuticals Co | 12 | |||
| 8,739 | * | Peregrine Pharmaceuticals, Inc | 10 | |||
| 650 | * | PetMed Express, Inc | 5 | |||
| 528,690 | Pfizer, Inc | 14,216 |
12
Table of Contents
TIAA Stock Index Account
| SHARES/PRINCIPAL | VALUE (000) | |||||
| 1,363 | * | Pharmacyclics, Inc | 14 | |||
| 1,354 | * | Pharmion Corp | 57 | |||
| 1,825 | PolyMedica Corp | 68 | ||||
| 6,365 | * | PolyOne Corp | 58 | |||
| 1,425 | * | Pozen, Inc | 10 | |||
| 12,260 | PPG Industries, Inc | 836 | ||||
| 3,663 | * | Praecis Pharmaceuticals, Inc | 7 | |||
| 23,126 | Praxair, Inc | 1,021 | ||||
| 177,979 | Procter & Gamble Co | 9,803 | ||||
| 2,083 | * | Progenics Pharmaceuticals | 36 | |||
| 6,891 | * | Protein Design Labs, Inc | 142 | |||
| 564 | Quaker Chemical Corp | 14 | ||||
| 1,846 | * | Quidel Corp | 9 | |||
| 10,143 | * | Revlon, Inc (Class A) | 23 | |||
| 11,196 | Rohm & Haas Co | 495 | ||||
| 8,531 | RPM International, Inc | 168 | ||||
| 2,502 | * | Salix Pharmaceuticals Ltd | 44 | |||
| 482 | * | Santarus, Inc | 4 | |||
| 101,961 | Schering-Plough Corp | 2,129 | ||||
| 3,627 | * | Sciclone Pharmaceuticals, Inc | 13 | |||
| 1,491 | * | Scotts Co (Class A) | 110 | |||
| 7,449 | * | Sepracor, Inc | 442 | |||
| 1,524 | * | Serologicals Corp | 34 | |||
| 8,310 | Sherwin-Williams Co | 371 | ||||
| 4,902 | Sigma-Aldrich Corp | 296 | ||||
| 500 | Stepan Co | 12 | ||||
| 3,078 | * | SuperGen, Inc | 22 | |||
| 900 | * | SurModics, Inc | 29 | |||
| 1,732 | * | Tanox, Inc | 26 | |||
| 2,712 | * | Terra Industries, Inc | 24 | |||
| 1,614 | * | Third Wave Technologies, Inc | 14 | |||
| 1,125 | * | United Therapeutics Corp | 51 | |||
| 594 | * | USANA Health Sciences, Inc | 20 | |||
| 5,847 | USEC, Inc | 57 | ||||
| 5,951 | Valeant Pharmaceuticals International | 157 | ||||
| 3,402 | Valspar Corp | 170 | ||||
| 4,480 | * | VCA Antech, Inc | 88 | |||
| 5,476 | * | Vertex Pharmaceuticals, Inc | 58 | |||
| 3,097 | * | Vicuron Pharmaceuticals, Inc | 54 | |||
| 3,847 | * | Vion Pharmaceuticals, Inc | 18 | |||
| 7,448 | * | Watson Pharmaceuticals, Inc | 244 | |||
| 2,293 | Wellman, Inc | 25 | ||||
| 1,884 | West Pharmaceutical Services, Inc | 47 | ||||
| 4,714 | b* | WR Grace & Co | 64 | |||
| 92,689 | Wyeth | 3,948 | ||||
| 3,151 | * | Zila, Inc | 13 | |||
| 1,349 | * | Zymogenetics, Inc | 31 | |||
TOTAL CHEMICALS AND ALLIED PRODUCTS | 91,595 | |||||
| COAL MINING - 0.10% | ||||||
| 3,797 | Arch Coal, Inc | 135 | ||||
| 6,258 | Consol Energy, Inc | 257 | ||||
13
Table of Contents
TIAA Stock Index Account
| SHARES/PRINCIPAL | VALUE (000) | |||||
| 5,274 | Massey Energy Co | 184 | ||||
| 4,445 | Peabody Energy Corp | 360 | ||||
TOTAL COAL MINING | 936 | |||||
| COMMUNICATIONS - 4.90% | ||||||
| 821 | * | AirGate PCS, Inc | 29 | |||
| 2,139 | * | Airspan Networks, Inc | 12 | |||
| 6,220 | * | Alamosa Holdings, Inc | 78 | |||
| 683 | Alaska Communications Systems Group, Inc | 6 | ||||
| 21,931 | Alltel Corp | 1,289 | ||||
| 14,842 | * | American Tower Corp (Class A) | 273 | |||
| 55,400 | AT&T Corp | 1,056 | ||||
| 30,016 | * | Avaya, Inc | 516 | |||
| 465 | * | Beasley Broadcast Group, Inc (Class A) | 8 | |||
| 127,504 | BellSouth Corp | 3,543 | ||||
| 1,076 | * | Boston Communications Group | 10 | |||
| 11,967 | * | Cablevision Systems Corp (Class A) | 298 | |||
| 600 | * | Centennial Communications Corp | 5 | |||
| 10,223 | CenturyTel, Inc | 363 | ||||
| 18,720 | * | Charter Communications, Inc (Class A) | 42 | |||
| 13,787 | * | Cincinnati Bell, Inc | 57 | |||
| 3,758 | * | Citadel Broadcasting Corp | 61 | |||
| 34,293 | Clear Channel Communications, Inc | 1,148 | ||||
| 85,280 | * | Comcast Corp (Class A) | 2,838 | |||
| 63,897 | * | Comcast Corp (Special Class A) | 2,098 | |||
| 1,582 | * | Commonwealth Telephone Enterprises, Inc | 79 | |||
| 2,400 | * | Cox Radio, Inc (Class A) | 40 | |||
| 13,275 | * | Crown Castle International Corp | 221 | |||
| 1,802 | * | Crown Media Holdings, Inc (Class A) | 15 | |||
| 1,200 | CT Communications, Inc | 15 | ||||
| 3,424 | * | Cumulus Media, Inc (Class A) | 52 | |||
| 866 | D&E Communications, Inc | 10 | ||||
| 47,125 | * | DIRECTV Group, Inc | 789 | |||
| 7,652 | * | Dobson Communications Corp (Class A) | 13 | |||
| 16,099 | EchoStar Communications Corp (Class A) | 535 | ||||
| 3,406 | * | Emmis Communications Corp (Class A) | 65 | |||
| 2,805 | * | Entercom Communications Corp | 101 | |||
| 3,129 | * | Entravision Communications Corp (Class A) | 26 | |||
| 354 | * | Fisher Communications, Inc | 17 | |||
| 8,259 | * | Foundry Networks, Inc | 109 | |||
| 12,196 | * | Fox Entertainment Group, Inc (Class A) | 381 | |||
| 3,022 | * | General Communication, Inc (Class A) | 33 | |||
| 2,524 | Global Payments, Inc | 148 | ||||
| 824 | Golden Telecom, Inc | 22 | ||||
| 3,118 | Gray Television, Inc | 48 | ||||
| 2,141 | Hearst-Argyle Television, Inc | 56 | ||||
| 24,646 | * | IAC/InterActiveCorp | 681 | |||
| 2,397 | * | IDT Corp | 35 | |||
| 1,600 | * | IDT Corp (Class B) | 25 | |||
| 4,516 | * | Infonet Services Corp (Class B) | 9 | |||
| 2,972 | * | Insight Communications Co, Inc | 28 | |||
| 16,435 | * | Internap Network Services Corp | 15 | |||
| 872 | * | ITC Deltacom, Inc | 1 | |||
| 1,116 | * | j2 Global Communications, Inc | 39 | |||
14
Table of Contents
TIAA Stock Index Account
| SHARES/PRINCIPAL | VALUE (000) | |||||
| 47,202 | * | Level 3 Communications, Inc | 160 | |||
| 1,093 | Liberty Corp | 48 | ||||
| 11,403 | * | Liberty Media International, Inc | 527 | |||
| 1,798 | * | Lin TV Corp (Class A) | 34 | |||
| 791 | * | Lodgenet Entertainment Corp | 14 | |||
| 9,285 | * | Lucent Technologies Inc Wts 12/10/07 | 15 | |||
| 291,241 | * | Lucent Technologies, Inc | 1,095 | |||
| 1,446 | * | Mastec, Inc | 15 | |||
| 39,967 | f,v* | McLeod (Escrow) | 0 | |||
| 4,583 | * | Mediacom Communications Corp | 29 | |||
| 2,479 | * | Net2Phone, Inc | 8 | |||
| 700 | * | Nexstar Broadcasting Group, Inc | 6 | |||
| 69,717 | * | Nextel Communications, Inc (Class A) | 2,092 | |||
| 8,520 | * | Nextel Partners, Inc (Class A) | 166 | |||
| 3,959 | * | NII Holdings, Inc (Class B) | 188 | |||
| 1,200 | North Pittsburgh Systems, Inc | 30 | ||||
| 1,281 | * | Novatel Wireless, Inc | 25 | |||
| 5,162 | * | NTL, Inc | 377 | |||
| 2,900 | * | Paxson Communications Corp | 4 | |||
| 3,675 | * | Price Communications Corp | 68 | |||
| 5,905 | * | Primus Telecommunications Group | 19 | |||
| 3,398 | * | PTEK Holdings, Inc | 36 | |||
| 97,298 | * | Qwest Communications International, Inc | 432 | |||
| 3,960 | * | Radio One, Inc (Class A) | 64 | |||
| 1,831 | * | Radio One, Inc (Class D) | 30 | |||
| 4,225 | b* | RCN Corp | 0 | |||
| 2,346 | * | Regent Communications, Inc | 12 | |||
| 1,057 | * | Saga Communications, Inc (Class A) | 18 | |||
| 695 | * | Salem Communications Corp (Class A) | 17 | |||
| 230,205 | SBC Communications, Inc | 5,932 | ||||
| 468 | Shenandoah Telecom Co | 14 | ||||
| 3,111 | Sinclair Broadcast Group, Inc (Class A) | 29 | ||||
| 2,599 | * | Spanish Broadcasting System, Inc (Class A) | 27 | |||
| 2,718 | * | Spectrasite, Inc | 157 | |||
| 96,642 | Sprint Corp | 2,402 | ||||
| 956 | SureWest Communications | 27 | ||||
| 1,652 | * | Talk America Holdings, Inc | 11 | |||
| 3,663 | Telephone & Data Systems, Inc | 282 | ||||
| 20,864 | * | Terremark Worldwide, Inc | 13 | |||
| 3,067 | * | Time Warner Telecom, Inc (Class A) | 13 | |||
| 3,172 | * | Tivo, Inc | 19 | |||
| 2,652 | * | Triton PCS Holdings, Inc (Class A) | 9 | |||
| 1,032 | * | U.S. Cellular Corp | 46 | |||
| 4,890 | * | Ubiquitel, Inc | 35 | |||
| 24,150 | * | UnitedGlobalcom, Inc (Class A) | 233 | |||
| 14,670 | * | Univision Communications, Inc (Class A) | 429 | |||
| 1,642 | * | USA Mobility, Inc | 58 | |||
| 191,961 | Verizon Communications, Inc | 7,776 | ||||
| 7,400 | Viacom, Inc (Class A) | 274 | ||||
| 97,477 | Viacom, Inc (Class B) | 3,547 | ||||
| 1,307 | * | West Corp | 43 | |||
| 5,266 | * | Western Wireless Corp (Class A) | 154 | |||
| 1,900 | f,v* | Wiltel Communications Group (Rts) | 0 | |||
| 3,292 | * | Wireless Facilities, Inc | 31 |
15
Table of Contents
TIAA Stock Index Account
| SHARES/PRINCIPAL | VALUE (000) | |||||
| 10,451 | * | XM Satellite Radio Holdings, Inc | 393 | |||
| 1,003 | * | Young Broadcasting, Inc (Class A) | 11 | |||
TOTAL COMMUNICATIONS | 44,832 | |||||
| DEPOSITORY INSTITUTIONS - 10.17% | ||||||
| 1,016 | 1st Source Corp | 26 | ||||
| 711 | ABC Bancorp | 15 | ||||
| 626 | * | ACE Cash Express, Inc | 19 | |||
| 59 | * | AmericanWest Bancorp | 1 | |||
| 24,854 | AmSouth Bancorp | 644 | ||||
| 1,467 | Anchor Bancorp Wisconsin, Inc | 43 | ||||
| 628 | Arrow Financial Corp | 19 | ||||
| 8,938 | Associated Banc-Corp | 297 | ||||
| 5,726 | Astoria Financial Corp | 229 | ||||
| 283 | Bancfirst Corp | 22 | ||||
| 5,600 | Bancorpsouth, Inc | 136 | ||||
| 500 | BancTrust Financial Group, Inc | 12 | ||||
| 5,476 | Bank Mutual Corp | 67 | ||||
| 281,828 | Bank of America Corp | 13,243 | ||||
| 1,000 | Bank of Granite Corp | 21 | ||||
| 4,703 | Bank of Hawaii Corp | 239 | ||||
| 53,622 | Bank of New York Co, Inc | 1,792 | ||||
| 638 | Bank of The Ozarks, Inc | 22 | ||||
| 2,977 | BankAtlantic Bancorp, Inc (Class A) | 59 | ||||
| 12,200 | Banknorth Group, Inc | 447 | ||||
| 2,181 | * | BankUnited Financial Corp (Class A) | 70 | |||
| 777 | Banner Corp | 24 | ||||
| 38,379 | BB&T Corp | 1,614 | ||||
| 449 | Berkshire Hills Bancorp, Inc | 17 | ||||
| 480 | * | BFC Financial Corp | 6 | |||
| 1,341 | * | BOK Financial Corp | 65 | |||
| 1,898 | Boston Private Financial Holdings, Inc | 53 | ||||
| 534 | Bryn Mawr Bank Corp | 12 | ||||
| 580 | Camden National Corp | 23 | ||||
| 500 | Capital City Bank Group, Inc | 21 | ||||
| 333 | Capital Corp of the West | 16 | ||||
| 294 | * | Capital Crossing Bank | 9 | |||
| 1,624 | Capitol Federal Financial | 58 | ||||
| 1,121 | Cascade Bancorp | 23 | ||||
| 3,046 | Cathay General Bancorp | 114 | ||||
| 622 | Center Financial Corp | 12 | ||||
| 650 | * | Central Coast Bancorp | 15 | |||
| 1,887 | Central Pacific Financial Corp | 68 | ||||
| 229 | Century Bancorp, Inc (Class A) | 7 | ||||
| 285 | Charter Financial Corp | 13 | ||||
| 1,640 | Chemical Financial Corp | 70 | ||||
| 3,197 | Chittenden Corp | 92 | ||||
| 358,003 | Citigroup, Inc | 17,249 | ||||
| 3,400 | * | Citigroup, Inc (Litigation Wts) | 5 | |||
| 3,061 | Citizens Banking Corp | 105 | ||||
| 651 | Citizens First Bancorp, Inc | 16 | ||||
| 550 | City Bank | 20 | ||||
| 1,237 | City Holding Co | 45 | ||||
| 2,882 | City National Corp | 204 | ||||
16
Table of Contents
TIAA Stock Index Account
| SHARES/PRINCIPAL | VALUE (000) | |||||
| 873 | Coastal Financial Corp | 17 | ||||
| 675 | CoBiz, Inc | 14 | ||||
| 8,530 | Colonial Bancgroup, Inc | 181 | ||||
| 416 | Columbia Bancorp | 14 | ||||
| 1,059 | Columbia Banking System, Inc | 26 | ||||
| 12,537 | Comerica, Inc | 765 | ||||
| 4,827 | Commerce Bancorp, Inc | 311 | ||||
| 4,597 | Commerce Bancshares, Inc | 231 | ||||
| 2,474 | Commercial Capital Bancorp, Inc | 57 | ||||
| 3,124 | Commercial Federal Corp | 93 | ||||
| 1,636 | Community Bank System, Inc | 46 | ||||
| 1,094 | Community Trust Bancorp, Inc | 35 | ||||
| 8,852 | Compass Bancshares, Inc | 431 | ||||
| 1,170 | Corus Bankshares, Inc | 56 | ||||
| 3,532 | Cullen/Frost Bankers, Inc | 172 | ||||
| 2,577 | CVB Financial Corp | 68 | ||||
| 2,409 | Dime Community Bancshares | 43 | ||||
| 1,439 | Downey Financial Corp | 82 | ||||
| 3,493 | East West Bancorp, Inc | 147 | ||||
| 1,563 | * | Euronet Worldwide, Inc | 41 | |||
| 447 | Farmers Capital Bank Corp | 18 | ||||
| 1,153 | Fidelity Bankshares, Inc | 49 | ||||
| 33,789 | Fifth Third Bancorp | 1,598 | ||||
| 559 | Financial Institutions, Inc | 13 | ||||
| 720 | First Bancorp (North Carolina) | 20 | ||||
| 2,338 | First Bancorp (Puerto Rico) | 148 | ||||
| 900 | First Busey Corp (Class A) | 19 | ||||
| 2,100 | First Charter Corp | 55 | ||||
| 436 | First Citizens Bancshares, Inc (Class A) | 65 | ||||
| 4,204 | First Commonwealth Financial Corp | 65 | ||||
| 831 | First Community Bancorp | 35 | ||||
| 710 | First Community Bancshares, Inc | 26 | ||||
| 2,593 | First Financial Bancorp | 45 | ||||
| 1,093 | First Financial Bankshares, Inc | 49 | ||||
| 1,000 | First Financial Corp (Indiana) | 35 | ||||
| 1,000 | First Financial Holdings, Inc | 33 | ||||
| 9,046 | First Horizon National Corp | 390 | ||||
| 1,295 | First Merchants Corp | 37 | ||||
| 3,362 | First Midwest Bancorp, Inc | 122 | ||||
| 3,189 | First National Bankshares of Florida, Inc | 76 | ||||
| 465 | First Oak Brook Bancshares, Inc | 15 | ||||
| 200 | First of Long Island Corp | 10 | ||||
| 904 | First Republic Bank | 48 | ||||
| 499 | First State Bancorp | 18 | ||||
| 1,200 | * | FirstFed Financial Corp | 62 | |||
| 5,818 | FirstMerit Corp | 166 | ||||
| 1,967 | Flagstar Bancorp, Inc | 44 | ||||
| 1,105 | Flushing Financial Corp | 22 | ||||
| 154 | FMS Financial Corp | 3 | ||||
| 3,097 | FNB Corp | 63 | ||||
| 419 | FNB Corp (Virginia) | 12 | ||||
| 739 | * | Franklin Bank Corp | 13 | |||
| 1,064 | Frontier Financial Corp | 41 | ||||
| 8,101 | Fulton Financial Corp | 189 |
17
Table of Contents
TIAA Stock Index Account
| SHARES/PRINCIPAL | VALUE (000) | |||||
| 375 | GB&T Bancshares, Inc | 9 | ||||
| 1,530 | Glacier Bancorp, Inc | 52 | ||||
| 2,600 | Gold Banc Corp, Inc | 38 | ||||
| 17,720 | Golden West Financial Corp | 1,088 | ||||
| 832 | Great Southern Bancorp, Inc | 29 | ||||
| 1,914 | Hancock Holding Co | 64 | ||||
| 1,510 | Hanmi Financial Corp | 54 | ||||
| 1,557 | Harbor Florida Bancshares, Inc | 54 | ||||
| 1,734 | Harleysville National Corp | 46 | ||||
| 928 | Heartland Financial U.S.A., Inc | 19 | ||||
| 11,351 | Hibernia Corp (Class A) | 335 | ||||
| 707 | Horizon Financial Corp | 15 | ||||
| 5,161 | Hudson City Bancorp, Inc | 190 | ||||
| 2,240 | Hudson River Bancorp, Inc | 44 | ||||
| 3,093 | Hudson United Bancorp | 122 | ||||
| 16,187 | Huntington Bancshares, Inc | 401 | ||||
| 409 | IberiaBank Corp | 27 | ||||
| 930 | Independent Bank Corp (Massachusetts) | 31 | ||||
| 1,527 | Independent Bank Corp (Michigan) | 46 | ||||
| 3,878 | IndyMac Bancorp, Inc | 134 | ||||
| 1,112 | Integra Bank Corp | 26 | ||||
| 616 | Interchange Financial Services Corp | 16 | ||||
| 2,441 | International Bancshares Corp | 96 | ||||
| 1,234 | Irwin Financial Corp | 35 | ||||
| 332 | * | Itla Capital Corp | 20 | |||
| 246,280 | JPMorgan Chase & Co | 9,607 | ||||
| 29,870 | KeyCorp | 1,013 | ||||
| 2,123 | KNBT Bancorp, Inc | 36 | ||||
| 887 | Lakeland Bancorp, Inc | 16 | ||||
| 367 | Lakeland Financial Corp | 15 | ||||
| 4,803 | M & T Bank Corp | 518 | ||||
| 529 | Macatawa Bank Corp | 17 | ||||
| 1,974 | MAF Bancorp, Inc | 88 | ||||
| 944 | Main Street Banks, Inc | 33 | ||||
| 697 | MainSource Financial Group, Inc | 17 | ||||
| 16,106 | Marshall & Ilsley Corp | 712 | ||||
| 1,219 | MB Financial, Inc | 51 | ||||
| 1,138 | MBT Financial Corp | 26 | ||||
| 30,438 | Mellon Financial Corp | 947 | ||||
| 498 | Mercantile Bank Corp | 20 | ||||
| 5,608 | Mercantile Bankshares Corp | 293 | ||||
| 1,600 | Mid-State Bancshares | 46 | ||||
| 600 | Midwest Banc Holdings, Inc | 13 | ||||
| 1,144 | Nara Bancorp, Inc | 24 | ||||
| 219 | NASB Financial, Inc | 9 | ||||
| 41,859 | National City Corp | 1,572 | ||||
| 2,081 | National Penn Bancshares, Inc | 58 | ||||
| 514 | NBC Capital Corp | 14 | ||||
| 2,152 | NBT Bancorp, Inc | 55 | ||||
| 3,228 | NetBank, Inc | 34 | ||||
| 18,040 | New York Community Bancorp, Inc | 371 | ||||
| 3,283 | NewAlliance Bancshares, Inc | 50 | ||||
| 29,866 | North Fork Bancorp, Inc | 862 | ||||
| 13,854 | Northern Trust Corp | 673 |
18
Table of Contents
TIAA Stock Index Account
| SHARES/PRINCIPAL | VALUE (000) | |||||
| 792 | Northwest Bancorp, Inc | 20 | ||||
| 221 | Oak Hill Financial, Inc | 9 | ||||
| 786 | OceanFirst Financial Corp | 19 | ||||
| 2,600 | * | Ocwen Financial Corp | 25 | |||
| 4,960 | Old National Bancorp | 128 | ||||
| 1,064 | Old Second Bancorp, Inc | 34 | ||||
| 593 | Omega Financial Corp | 20 | ||||
| 3,244 | Pacific Capital Bancorp | 110 | ||||
| 806 | Park National Corp | 109 | ||||
| 1,431 | Partners Trust Financial Group, Inc | 17 | ||||
| 520 | Peapack Gladstone Financial Corp | 16 | ||||
| 762 | Pennfed Financial Services, Inc | 12 | ||||
| 550 | Pennrock Financial Services Corp | 21 | ||||
| 795 | Peoples Bancorp, Inc | 22 | ||||
| 2,611 | People’s Bank | 102 | ||||
| 513 | Peoples Holding Co | 17 | ||||
| 1,085 | PFF Bancorp, Inc | 50 | ||||
| 20,122 | PNC Financial Services Group, Inc | 1,156 | ||||
| 2,753 | Provident Bancorp, Inc | 36 | ||||
| 2,140 | Provident Bankshares Corp | 78 | ||||
| 349 | Provident Financial Holdings | 10 | ||||
| 4,876 | Provident Financial Services, Inc | 94 | ||||
| 1,974 | R & G Financial Corp (Class B) | 77 | ||||
| 33,644 | Regions Financial Corp | 1,197 | ||||
| 531 | Republic Bancorp, Inc (Class A) (Kentucky) | 14 | ||||
| 4,893 | Republic Bancorp, Inc (Michigan) | 75 | ||||
| 997 | * | Riggs National Corp | 21 | |||
| 298 | Royal Bancshares of Pennsylvania (Class A) | 8 | ||||
| 1,811 | S & T Bancorp, Inc | 68 | ||||
| 806 | S.Y. Bancorp, Inc | 19 | ||||
| 357 | Santander Bancorp | 11 | ||||
| 577 | SCBT Financial Corp | 19 | ||||
| 940 | Seacoast Banking Corp of Florida | 21 | ||||
| 253 | Security Bank Corp | 10 | ||||
| 388 | * | Signature Bank | 13 | |||
| 2,887 | * | Silicon Valley Bancshares | 129 | |||
| 1,066 | Simmons First National Corp (Class A) | 31 | ||||
| 7,276 | Sky Financial Group, Inc | 209 | ||||
| 362 | Smithtown Bancorp, Inc | 11 | ||||
| 4,243 | South Financial Group, Inc | 138 | ||||
| 624 | Southside Bancshares, Inc | 14 | ||||
| 4,770 | Southwest Bancorp of Texas, Inc | 111 | ||||
| 740 | Southwest Bancorp, Inc | 18 | ||||
| 21,993 | Sovereign Bancorp, Inc | 496 | ||||
| 580 | State Bancorp, Inc | 16 | ||||
| 345 | State Financial Services Corp (Class A) | 10 | ||||
| 23,503 | State Street Corp | 1,154 | ||||
| 1,142 | Sterling Bancorp | 32 | ||||
| 2,600 | Sterling Bancshares, Inc | 37 | ||||
| 1,423 | Sterling Financial Corp (Pennsylvania) | 41 | ||||
| 1,570 | * | Sterling Financial Corp (Spokane) | 62 | |||
| 507 | * | Sun Bancorp, Inc (New Jersey) | 13 | |||
| 22,733 | SunTrust Banks, Inc | 1,680 | ||||
| 21,261 | Synovus Financial Corp | 608 |
19
Table of Contents
TIAA Stock Index Account
| SHARES/PRINCIPAL | VALUE (000) | |||||
| 300 | Taylor Capital Group, Inc | 10 | ||||
| 10,386 | TCF Financial Corp | 334 | ||||
| 1,482 | * | Texas Capital Bancshares, Inc | 32 | |||
| 2,604 | Texas Regional Bancshares, Inc (Class A) | 85 | ||||
| 1,572 | TierOne Corp | 39 | ||||
| 726 | Trico Bancshares | 17 | ||||
| 5,202 | Trustco Bank Corp NY | 72 | ||||
| 3,402 | Trustmark Corp | 106 | ||||
| 132,433 | U.S. Bancorp | 4,148 | ||||
| 1,058 | U.S.B. Holding Co, Inc | 26 | ||||
| 3,139 | UCBH Holdings, Inc | 144 | ||||
| 1,144 | UMB Financial Corp | 65 | ||||
| 3,040 | Umpqua Holdings Corp | 77 | ||||
| 543 | Union Bankshares Corp | 21 | ||||
| 3,734 | UnionBanCal Corp | 241 | ||||
| 2,534 | United Bankshares, Inc | 97 | ||||
| 1,791 | United Community Banks, Inc | 48 | ||||
| 1,981 | United Community Financial Corp | 22 | ||||
| 528 | Univest Corp of Pennsylvania | 24 | ||||
| 1,587 | Unizan Financial Corp | 42 | ||||
| 7,192 | Valley National Bancorp | 199 | ||||
| 402 | * | Virginia Commerce Bancorp | 11 | |||
| 524 | Virginia Financial Group, Inc | 19 | ||||
| 5,292 | W Holding Co, Inc | 121 | ||||
| 111,924 | Wachovia Corp | 5,887 | ||||
| 5,341 | Washington Federal, Inc | 142 | ||||
| 881 | Washington Trust Bancorp, Inc | 26 | ||||
| 3,532 | Webster Financial Corp | 179 | ||||
| 116,800 | Wells Fargo & Co | 7,259 | ||||
| 1,533 | Wesbanco, Inc | 49 | ||||
| 1,260 | West Bancorporation | 22 | ||||
| 1,194 | West Coast Bancorp | 30 | ||||
| 2,316 | Westamerica Bancorp | 135 | ||||
| 354 | * | Western Sierra Bancorp | 14 | |||
| 2,764 | Whitney Holding Corp | 124 | ||||
| 4,525 | Wilmington Trust Corp | 164 | ||||
| 980 | * | Wilshire Bancorp, Inc | 16 | |||
| 1,371 | Wintrust Financial Corp | 78 | ||||
| 620 | WSFS Financial Corp | 37 | ||||
| 558 | Yardville National Bancorp | 19 | ||||
| 6,385 | Zions Bancorp | 434 | ||||
TOTAL DEPOSITORY INSTITUTIONS | 93,097 | |||||
| EATING AND DRINKING PLACES - 0.74% | ||||||
| 6,027 | Applebee's International, Inc | 159 | ||||
| 5,554 | Aramark Corp (Class B) | 147 | ||||
| 758 | * | BJ's Restaurants, Inc | 11 | |||
| 2,400 | Bob Evans Farms, Inc | 63 | ||||
| 6,702 | * | Brinker International, Inc | 235 | |||
| 395 | * | Buffalo Wild Wings, Inc | 14 | |||
| 1,020 | * | California Pizza Kitchen, Inc | 23 | |||
| 3,340 | CBRI Group, Inc | 140 | ||||
| 2,674 | * | CEC Entertainment, Inc | 107 | |||
| 3,658 | * | CKE Restaurants, Inc | 53 | |||
20
Table of Contents
TIAA Stock Index Account
| SHARES/PRINCIPAL | VALUE (000) | |||||
| 1,430 | * | Cosi, Inc | 9 | |||
| 11,718 | Darden Restaurants, Inc | 325 | ||||
| 790 | * | Dave & Buster’s, Inc | 16 | |||
| 1,384 | IHOP Corp | 58 | ||||
| 2,536 | * | Jack In The Box, Inc | 94 | |||
| 4,363 | * | Krispy Kreme Doughnuts, Inc | 55 | |||
| 1,378 | Landry’s Restaurants, Inc | 40 | ||||
| 1,175 | Lone Star Steakhouse & Saloon, Inc | 33 | ||||
| 89,122 | McDonald’s Corp | 2,857 | ||||
| 1,720 | * | O'Charley’s, Inc | 34 | |||
| 4,319 | Outback Steakhouse, Inc | 198 | ||||
| 1,702 | * | P.F. Chang’s China Bistro, Inc | 96 | |||
| 875 | * | Papa John’s International, Inc | 30 | |||
| 2,362 | * | Rare Hospitality International, Inc | 75 | |||
| 832 | * | Red Robin Gourmet Burgers, Inc | 44 | |||
| 4,500 | Ruby Tuesday, Inc | 117 | ||||
| 3,096 | * | Ryan’s Restaurant Group, Inc | 48 | |||
| 4,074 | * | Sonic Corp | 124 | |||
| 5,401 | * | The Cheesecake Factory, Inc | 175 | |||
| 1,689 | * | The Steak N Shake Co | 34 | |||
| 955 | Triarc Cos (Class A) | 12 | ||||
| 1,910 | Triarc Cos (Class B) | 23 | ||||
| 7,905 | Wendy’s International, Inc | 310 | ||||
| 20,653 | Yum! Brands, Inc | 974 | ||||
TOTAL EATING AND DRINKING PLACES | 6,733 | |||||
| EDUCATIONAL SERVICES - 0.21% | ||||||
| 10,477 | * | Apollo Group, Inc (Class A) | 846 | |||
| 7,039 | * | Career Education Corp | 282 | |||
| 6,096 | * | Corinthian Colleges, Inc | 115 | |||
| 4,016 | * | DeVry, Inc | 70 | |||
| 4,955 | * | Education Management Corp | 164 | |||
| 3,070 | * | ITT Educational Services, Inc | 146 | |||
| 2,500 | * | Laureate Education, Inc | 110 | |||
| 753 | * | Learning Tree International, Inc | 10 | |||
| 1,157 | * | Princeton Review, Inc | 7 | |||
| 968 | Strayer Education, Inc | 106 | ||||
| 982 | * | Universal Technical Institute, Inc | 37 | |||
TOTAL EDUCATIONAL SERVICES | 1,893 | |||||
| ELECTRIC, GAS, AND SANITARY SERVICES - 3.69% | ||||||
| 43,022 | * | AES Corp | 588 | |||
| 4,464 | AGL Resources, Inc | 148 | ||||
| 8,638 | * | Allegheny Energy, Inc | 170 | |||
| 1,993 | Allete, Inc | 73 | ||||
| 7,401 | Alliant Energy Corp | 212 | ||||
| 16,153 | * | Allied Waste Industries, Inc | 150 | |||
| 13,593 | Ameren Corp | 682 | ||||
| 28,407 | American Electric Power Co, Inc | 975 | ||||
| 1,100 | American States Water Co | 29 | ||||
| 6,491 | Aqua America, Inc | 160 | ||||
| 13,555 | * | Aquila, Inc | 50 | |||
| 3,559 | Atmos Energy Corp | 97 | ||||
| 3,500 | Avista Corp | 62 | ||||
21
Table of Contents
TIAA Stock Index Account
| SHARES/PRINCIPAL | VALUE (000) | |||||
| 2,253 | Black Hills Corp | 69 | ||||
| 1,000 | California Water Service Group | 38 | ||||
| 28,919 | * | Calpine Corp | 114 | |||
| 800 | Cascade Natural Gas Corp | 17 | ||||
| 1,195 | * | Casella Waste Systems, Inc (Class A) | 17 | |||
| 19,443 | Centerpoint Energy, Inc | 220 | ||||
| 846 | Central Vermont Public Service Corp | 20 | ||||
| 1,183 | CH Energy Group, Inc | 57 | ||||
| 12,513 | Cinergy Corp | 521 | ||||
| 23,101 | Citizens Communications Co | 319 | ||||
| 3,305 | Cleco Corp | 67 | ||||
| 11,368 | * | CMS Energy Corp | 119 | |||
| 556 | Connecticut Water Service, Inc | 15 | ||||
| 15,657 | Consolidated Edison, Inc | 685 | ||||
| 11,749 | Constellation Energy Group, Inc | 514 | ||||
| 165 | Crosstex Energy, Inc | 7 | ||||
| 22,667 | Dominion Resources, Inc | 1,535 | ||||
| 8,774 | DPL, Inc | 220 | ||||
| 11,808 | DTE Energy Co | 509 | ||||
| 64,647 | Duke Energy Corp | 1,638 | ||||
| 5,400 | Duquesne Light Holdings, Inc | 102 | ||||
| 513 | * | Duratek, Inc | 13 | |||
| 19,348 | * | Dynegy, Inc (Class A) | 89 | |||
| 22,619 | Edison International | 724 | ||||
| 44,364 | El Paso Corp | 461 | ||||
| 3,388 | * | El Paso Electric Co | 64 | |||
| 1,602 | Empire District Electric Co | 36 | ||||
| 2,526 | Energen Corp | 149 | ||||
| 10,424 | Energy East Corp | 278 | ||||
| 453 | EnergySouth, Inc | 13 | ||||
| 16,050 | Entergy Corp | 1,085 | ||||
| 4,306 | Equitable Resources, Inc | 261 | ||||
| 45,770 | Exelon Corp | 2,017 | ||||
| 21,807 | FirstEnergy Corp | 862 | ||||
| 12,927 | FPL Group, Inc | 966 | ||||
| 4,858 | Great Plains Energy, Inc | 147 | ||||
| 5,200 | Hawaiian Electric Industries, Inc | 152 | ||||
| 2,558 | Idacorp, Inc | 78 | ||||
| 11,533 | KeySpan Corp | 455 | ||||
| 6,443 | Kinder Morgan, Inc | 471 | ||||
| 1,400 | Laclede Group, Inc | 44 | ||||
| 7,850 | MDU Resources Group, Inc | 209 | ||||
| 1,200 | MGE Energy, Inc | 43 | ||||
| 740 | Middlesex Water Co | 14 | ||||
| 4,958 | National Fuel Gas Co | 141 | ||||
| 1,850 | New Jersey Resources Corp | 80 | ||||
| 3,050 | Nicor, Inc | 113 | ||||
| 18,072 | NiSource, Inc | 412 | ||||
| 8,777 | Northeast Utilities | 165 | ||||
| 1,750 | Northwest Natural Gas Co | 59 | ||||
| 5,450 | * | NRG Energy, Inc | 196 | |||
| 3,639 | NSTAR | 198 | ||||
| 6,121 | OGE Energy Corp | 162 | ||||
| 6,261 | Oneok, Inc | 178 |
22
Table of Contents
TIAA Stock Index Account
| SHARES/PRINCIPAL | VALUE (000) | |||||
| 1,700 | Otter Tail Corp | 43 | ||||
| 2,462 | Peoples Energy Corp | 108 | ||||
| 10,872 | Pepco Holdings, Inc | 232 | ||||
| 28,864 | * | PG&E Corp | 961 | |||
| 4,755 | Piedmont Natural Gas Co, Inc | 111 | ||||
| 5,818 | Pinnacle West Capital Corp | 258 | ||||
| 4,199 | PNM Resources, Inc | 106 | ||||
| 12,049 | PPL Corp | 642 | ||||
| 16,108 | Progress Energy, Inc | 729 | ||||
| 5,000 | v* | Progress Energy, Inc (Cvo) | 0 | |||
| 16,050 | Public Service Enterprise Group, Inc | 831 | ||||
| 6,554 | Puget Energy, Inc | 162 | ||||
| 5,255 | Questar Corp | 268 | ||||
| 20,600 | * | Reliant Resources, Inc | 281 | |||
| 10,488 | Republic Services, Inc | 352 | ||||
| 1,126 | Resource America, Inc (Class A) | 37 | ||||
| 7,241 | SCANA Corp | 285 | ||||
| 14,197 | Sempra Energy | 521 | ||||
| 8,800 | * | Sierra Pacific Resources | 92 | |||
| 447 | SJW Corp | 16 | ||||
| 954 | South Jersey Industries, Inc | 50 | ||||
| 50,834 | Southern Co | 1,704 | ||||
| 4,318 | * | Southern Union Co | 104 | |||
| 2,332 | Southwest Gas Corp | 59 | ||||
| 977 | Southwest Water Co | 13 | ||||
| 3,019 | * | Stericycle, Inc | 139 | |||
| 13,093 | TECO Energy, Inc | 201 | ||||
| 20,590 | TXU Corp | 1,329 | ||||
| 2,868 | UGI Corp | 117 | ||||
| 892 | UIL Holdings Corp | 46 | ||||
| 2,373 | Unisource Energy Corp | 57 | ||||
| 5,260 | Vectren Corp | 141 | ||||
| 3,033 | * | Waste Connections, Inc | 104 | |||
| 41,709 | Waste Management, Inc | 1,249 | ||||
| 5,944 | Westar Energy, Inc | 136 | ||||
| 3,691 | Western Gas Resources, Inc | 108 | ||||
| 3,300 | WGL Holdings, Inc | 102 | ||||
| 38,656 | Williams Cos, Inc | 630 | ||||
| 8,100 | Wisconsin Energy Corp | 273 | ||||
| 2,680 | WPS Resources Corp | 134 | ||||
| 28,092 | Xcel Energy, Inc | 511 | ||||
TOTAL ELECTRIC, GAS, AND SANITARY SERVICES | 33,776 | |||||
| ELECTRONIC AND OTHER ELECTRIC EQUIPMENT - 7.83% | ||||||
| 1,556 | * | Actel Corp | 27 | |||
| 4,420 | Adtran, Inc | 85 | ||||
| 1,193 | * | Advanced Energy Industries, Inc | 11 | |||
| 24,577 | * | Advanced Micro Devices, Inc | 541 | |||
| 4,300 | * | Aeroflex, Inc | 52 | |||
| 46,506 | * | Agere Systems, Inc (Class A) | 64 | |||
| 70,211 | * | Agere Systems, Inc (Class B) | 95 | |||
| 1,895 | * | Alliance Semiconductor Corp | 7 | |||
| 26,842 | * | Altera Corp | 556 | |||
| 11,805 | American Power Conversion Corp | 253 | ||||
23
Table of Contents
TIAA Stock Index Account
| SHARES/PRINCIPAL | VALUE (000) | |||||
| 1,695 | * | American Superconductor Corp | 25 | |||
| 4,556 | Ametek, Inc | 163 | ||||
| 2,169 | * | AMIS Holdings, Inc | 36 | |||
| 6,298 | * | Amkor Technology, Inc | 42 | |||
| 4,718 | * | Amphenol Corp (Class A) | 173 | |||
| 25,778 | Analog Devices, Inc | 952 | ||||
| 1,600 | * | Anaren Microwave, Inc | 21 | |||
| 1,164 | * | Applica, Inc | 7 | |||
| 21,599 | * | Applied Micro Circuits Corp | 91 | |||
| 589 | Applied Signal Technology, Inc | 21 | ||||
| 6,045 | * | Arris Group, Inc | 43 | |||
| 2,137 | * | Artesyn Technologies, Inc | 24 | |||
| 645 | * | Atheros Communications, Inc | 7 | |||
| 29,484 | * | Atmel Corp | 116 | |||
| 2,169 | * | ATMI, Inc | 49 | |||
| 5,536 | * | Avanex Corp | 18 | |||
| 3,547 | AVX Corp | 45 | ||||
| 2,164 | Baldor Electric Co | 60 | ||||
| 674 | Bel Fuse, Inc (Class B) | 23 | ||||
| 2,853 | * | Benchmark Electronics, Inc | 97 | |||
| 16,321 | * | Broadcom Corp (Class A) | 527 | |||
| 2,704 | * | Broadwing Corp | 25 | |||
| 1,800 | C&D Technologies, Inc | 31 | ||||
| 1,465 | * | California Micro Devices Corp | 10 | |||
| 5,785 | * | Capstone Turbine Corp | 11 | |||
| 2,890 | * | Carrier Access Corp | 31 | |||
| 300 | * | Catapult Communications Corp | 7 | |||
| 2,989 | * | C-COR, Inc | 28 | |||
| 1,109 | * | Ceradyne, Inc | 63 | |||
| 2,612 | * | Checkpoint Systems, Inc | 47 | |||
| 493 | * | Cherokee International Corp | 5 | |||
| 39,460 | * | CIENA Corp | 132 | |||
| 1,163 | * | Comtech Telecommunications | 44 | |||
| 13,590 | * | Comverse Technology, Inc | 332 | |||
| 32,205 | * | Conexant Systems, Inc | 64 | |||
| 5,399 | * | Cree, Inc | 216 | |||
| 2,100 | CTS Corp | 28 | ||||
| 1,000 | Cubic Corp | 25 | ||||
| 8,434 | * | Cypress Semiconductor Corp | 99 | |||
| 1,813 | * | DDi Corp | 6 | |||
| 1,168 | * | Digital Theater Systems, Inc | 24 | |||
| 417 | * | Diodes, Inc | 9 | |||
| 2,576 | * | Ditech Communications Corp | 39 | |||
| 1,939 | * | DSP Group, Inc | 43 | |||
| 859 | * | Dupont Photomasks, Inc | 23 | |||
| 13,311 | * | Eagle Broadband, Inc | 9 | |||
| 2,000 | * | Electro Scientific Industries, Inc | 40 | |||
| 30,030 | Emerson Electric Co | 2,105 | ||||
| 756 | * | EMS Technologies, Inc | 13 | |||
| 6,202 | * | Energizer Holdings, Inc | 308 | |||
| 934 | * | Energy Conversion Devices, Inc | 18 | |||
| 4,002 | * | Entegris, Inc | 40 | |||
| 2,200 | * | ESS Technology, Inc | 16 | |||
| 2,800 | * | Exar Corp | 40 |
24
Table of Contents
TIAA Stock Index Account
| SHARES/PRINCIPAL | VALUE (000) | |||||
| 8,286 | * | Fairchild Semiconductor International, Inc | 135 | |||
| 11,493 | * | Finisar Corp | 26 | |||
| 924 | Franklin Electric Co. Inc | 39 | ||||
| 2,669 | * | Freescale Semiconductor, Inc | 48 | |||
| 24,508 | * | Freescale Semiconductor, Inc (Class B) | 450 | |||
| 2,934 | * | FuelCell Energy, Inc | 29 | |||
| 15,290 | * | Gemstar-TV Guide International, Inc | 91 | |||
| 732,326 | General Electric Co | 26,730 | ||||
| 2,198 | * | Genesis Microchip, Inc | 36 | |||
| 870 | * | Genlyte Group, Inc | 75 | |||
| 6,759 | * | GrafTech International Ltd | 64 | |||
| 4,090 | Harman International Industries, Inc | 519 | ||||
| 5,636 | * | Harmonic, Inc | 47 | |||
| 4,775 | Harris Corp | 295 | ||||
| 1,700 | Helix Technology Corp | 30 | ||||
| 1,700 | * | Hexcel Corp | 25 | |||
| 3,520 | Hubbell, Inc (Class B) | 184 | ||||
| 1,800 | * | Hutchinson Technology, Inc | 62 | |||
| 5,045 | * | Integrated Circuit Systems, Inc | 106 | |||
| 7,233 | * | Integrated Device Technology, Inc | 84 | |||
| 2,100 | * | Integrated Silicon Solution, Inc | 17 | |||
| 448,084 | Intel Corp | 10,481 | ||||
| 3,915 | * | Interdigital Communications Corp | 87 | |||
| 4,594 | * | International Rectifier Corp | 205 | |||
| 9,742 | Intersil Corp (Class A) | 163 | ||||
| 1,400 | Inter-Tel, Inc | 38 | ||||
| 2,296 | * | InterVoice, Inc | 31 | |||
| 1,160 | * | IXYS Corp | 12 | |||
| 10,780 | * | Jabil Circuit, Inc | 276 | |||
| 93,458 | * | JDS Uniphase Corp | 296 | |||
| 6,007 | * | Kemet Corp | 54 | |||
| 4,991 | * | Kopin Corp | 19 | |||
| 6,353 | L-3 Communications Holdings, Inc | 465 | ||||
| 607 | * | LaserCard Corp | 6 | |||
| 7,863 | * | Lattice Semiconductor Corp | 45 | |||
| 1,074 | * | Lifeline Systems, Inc | 28 | |||
| 22,260 | Linear Technology Corp | 863 | ||||
| 1,534 | * | Littelfuse, Inc | 52 | |||
| 1,293 | LSI Industries, Inc | 15 | ||||
| 26,560 | * | LSI Logic Corp | 146 | |||
| 1,646 | * | Magnetek, Inc | 11 | |||
| 3,108 | * | Mattson Technology, Inc | 35 | |||
| 23,050 | Maxim Integrated Products, Inc | 977 | ||||
| 5,338 | Maytag Corp | 113 | ||||
| 8,165 | * | McData Corp (Class A) | 49 | |||
| 943 | * | Medis Technologies Ltd | 17 | |||
| 2,262 | * | MEMC Electronic Materials, Inc | 30 | |||
| 1,540 | * | Mercury Computer Systems, Inc | 46 | |||
| 1,251 | * | Merix Corp | 14 | |||
| 2,500 | Methode Electronics, Inc | 32 | ||||
| 400 | * | Metrologic Instruments, Inc | 9 | |||
| 4,755 | * | Micrel, Inc | 52 | |||
| 14,149 | Microchip Technology, Inc | 377 | ||||
| 39,886 | * | Micron Technology, Inc | 493 |
25
Table of Contents
TIAA Stock Index Account
| SHARES/PRINCIPAL | VALUE (000) | |||||
| 4,228 | * | Microsemi Corp | 73 | |||
| 4,100 | * | Microtune, Inc | 25 | |||
| 1,295 | * | Microvision, Inc | 9 | |||
| 2,847 | * | MIPS Technologies, Inc | 28 | |||
| 1,718 | * | Mobility Electronics, Inc | 15 | |||
| 8,643 | Molex, Inc | 259 | ||||
| 1,515 | * | Monolithic System Technology, Inc | 9 | |||
| 1,809 | * | Moog, Inc (Class A) | 82 | |||
| 163,563 | Motorola, Inc | 2,813 | ||||
| 7,339 | * | MRV Communications, Inc | 27 | |||
| 2,855 | * | Mykrolis Corp | 40 | |||
| 300 | National Presto Industries, Inc | 14 | ||||
| 25,542 | National Semiconductor Corp | 458 | ||||
| 3,233 | * | NMS Communications Corp | 20 | |||
| 10,695 | * | Novellus Systems, Inc | 298 | |||
| 11,534 | * | Nvidia Corp | 272 | |||
| 3,866 | * | Omnivision Technologies, Inc | 71 | |||
| 8,363 | * | ON Semiconductor Corp | 38 | |||
| 4,212 | * | Openwave Systems, Inc | 65 | |||
| 8,470 | * | Oplink Communications, Inc | 17 | |||
| 1,276 | * | Optical Communication Products, Inc | 3 | |||
| 869 | * | OSI Systems, Inc | 20 | |||
| 6,137 | * | Paradyne Networks, Inc | 22 | |||
| 1,250 | Park Electrochemical Corp | 27 | ||||
| 1,447 | * | Pericom Semiconductor Corp | 14 | |||
| 2,260 | * | Photronics, Inc | 37 | |||
| 2,814 | * | Pixelworks, Inc | 32 | |||
| 3,309 | Plantronics, Inc | 137 | ||||
| 3,100 | * | Plexus Corp | 40 | |||
| 3,483 | * | Plug Power, Inc | 21 | |||
| 2,974 | * | PLX Technology, Inc | 31 | |||
| 11,897 | * | PMC-Sierra, Inc | 134 | |||
| 7,006 | * | Polycom, Inc | 163 | |||
| 458 | * | Powell Industries, Inc | 8 | |||
| 1,813 | * | Power Integrations, Inc | 36 | |||
| 4,438 | * | Power-One, Inc | 40 | |||
| 7,309 | * | Powerwave Technologies, Inc | 62 | |||
| 6,815 | * | QLogic Corp | 250 | |||
| 111,718 | Qualcomm, Inc | 4,737 | ||||
| 6,100 | * | Rambus, Inc | 140 | |||
| 2,306 | * | Rayovac Corp | 70 | |||
| 1,663 | Regal-Beloit Corp | 48 | ||||
| 4,091 | * | Remec, Inc | 29 | |||
| 12,915 | * | RF Micro Devices, Inc | 88 | |||
| 12,762 | Rockwell Collins, Inc | 503 | ||||
| 1,100 | * | Rogers Corp | 47 | |||
| 36,135 | * | Sanmina-SCI Corp | 306 | |||
| 2,915 | * | SBA Communications Corp | 27 | |||
| 1,000 | * | SBS Technologies, Inc | 14 | |||
| 10,570 | Scientific-Atlanta, Inc | 349 | ||||
| 1,500 | * | Seachange International, Inc | 26 | |||
| 5,166 | * | Semtech Corp | 113 | |||
| 1,709 | * | Sigmatel, Inc | 61 | |||
| 5,145 | * | Silicon Image, Inc | 85 |
26
Table of Contents
TIAA Stock Index Account
| SHARES/PRINCIPAL | VALUE (000) | |||||
| 2,561 | * | Silicon Laboratories, Inc | 90 | |||
| 5,900 | * | Silicon Storage Technology, Inc | 35 | |||
| 500 | * | Siliconix, Inc | 18 | |||
| 1,800 | * | Sipex Corp | 8 | |||
| 85,893 | * | Sirius Satellite Radio, Inc | 657 | |||
| 10,341 | * | Skyworks Solutions, Inc | 98 | |||
| 1,197 | Smith (A.O.) Corp | 36 | ||||
| 1,632 | * | Spatialight, Inc | 15 | |||
| 1,100 | Spectralink Corp | 16 | ||||
| 710 | * | Staktek Holdings, Inc | 3 | |||
| 1,279 | * | Standard Microsystems Corp | 23 | |||
| 700 | * | Stoneridge, Inc | 11 | |||
| 6,000 | * | Stratex Networks, Inc | 14 | |||
| 745 | * | Supertex, Inc | 16 | |||
| 12,134 | * | Sycamore Networks, Inc | 49 | |||
| 2,907 | * | Symmetricom, Inc | 28 | |||
| 1,530 | * | Synaptics, Inc | 47 | |||
| 2,804 | * | Technitrol, Inc | 51 | |||
| 3,400 | * | Tekelec | 69 | |||
| 32,508 | * | Tellabs, Inc | 279 | |||
| 4,400 | * | Terayon Communication Systems, Inc | 12 | |||
| 1,675 | * | Tessera Technologies, Inc | 62 | |||
| 119,977 | Texas Instruments, Inc | 2,954 | ||||
| 4,084 | * | Thomas & Betts Corp | 126 | |||
| 10,352 | * | Transmeta Corp | 17 | |||
| 1,302 | * | Trident Microsystems, Inc | 22 | |||
| 2,378 | * | Tripath Technology, Inc | 3 | |||
| 9,492 | * | Triquint Semiconductor, Inc | 42 | |||
| 2,833 | * | TTM Technologies, Inc | 33 | |||
| 640 | * | Ulticom, Inc | 10 | |||
| 976 | * | Ultralife Batteries, Inc | 19 | |||
| 3,500 | * | Universal Display Corp | 32 | |||
| 1,000 | * | Universal Electronics, Inc | 18 | |||
| 6,265 | * | Utstarcom, Inc | 139 | |||
| 3,331 | * | Valence Technology, Inc | 10 | |||
| 2,523 | * | Varian Semiconductor Equipment Associates, Inc | 93 | |||
| 9,239 | * | Verso Technologies, Inc | 7 | |||
| 1,399 | * | Viasat, Inc | 34 | |||
| 1,471 | Vicor Corp | 19 | ||||
| 11,380 | * | Vishay Intertechnology, Inc | 171 | |||
| 14,636 | * | Vitesse Semiconductor Corp | 52 | |||
| 2,980 | * | Westell Technologies, Inc | 20 | |||
| 4,823 | Whirlpool Corp | 334 | ||||
| 1,507 | * | Wilson Greatbatch Technologies, Inc | 34 | |||
| 800 | Woodhead Industries, Inc | 13 | ||||
| 23,957 | Xilinx, Inc | 710 | ||||
| 1,399 | * | Zhone Technologies, Inc | 4 | |||
TOTAL ELECTRONIC AND OTHER ELECTRIC EQUIPMENT | 71,697 | |||||
| ENGINEERING AND MANAGEMENT SERVICES - 0.92% | ||||||
| 1,600 | * | Accelrys, Inc | 12 | |||
| 1,230 | * | Advisory Board Co | 45 | |||
| 4,200 | * | Affymetrix, Inc | 154 | |||
| 3,126 | * | Answerthink, Inc | 15 | |||
27
Table of Contents
TIAA Stock Index Account
| SHARES/PRINCIPAL | VALUE (000) | |||||
| 1,368 | * | Antigenics, Inc | 14 | |||
| 4,841 | * | Applera Corp (Celera Genomics Group) | 67 | |||
| 5,800 | * | Ariad Pharmaceuticals, Inc | 43 | |||
| 3,562 | * | Axonyx, Inc | 22 | |||
| 10,858 | * | BearingPoint, Inc | 87 | |||
| 11,272 | * | Celgene Corp | 299 | |||
| 5,421 | * | Century Business Services, Inc | 24 | |||
| 706 | * | Charles River Associates, Inc | 33 | |||
| 1,445 | * | Ciphergen Biosystems, Inc | 6 | |||
| 942 | * | Cornell Cos, Inc | 14 | |||
| 2,561 | Corporate Executive Board Co | 171 | ||||
| 2,443 | * | Corrections Corp of America | 99 | |||
| 4,280 | * | Covance, Inc | 166 | |||
| 4,974 | * | CuraGen Corp | 36 | |||
| 1,903 | * | CV Therapeutics, Inc | 44 | |||
| 3,808 | * | Decode Genetics, Inc | 30 | |||
| 1,618 | * | DiamondCluster International, Inc | 23 | |||
| 3,731 | * | Digitas, Inc | 36 | |||
| 1,742 | * | Diversa Corp | 15 | |||
| 1,820 | * | Dyax Corp | 13 | |||
| 3,090 | * | eResearch Technology, Inc | 49 | |||
| 4,377 | * | Exelixis, Inc | 42 | |||
| 5,722 | Fluor Corp | 312 | ||||
| 1,000 | * | Forrester Research, Inc | 18 | |||
| 2,772 | * | FTI Consulting, Inc | 58 | |||
| 2,686 | * | Gartner, Inc (Class A) | 33 | |||
| 2,272 | * | Gartner, Inc (Class B) | 28 | |||
| 724 | * | Genencor International, Inc | 12 | |||
| 3,419 | * | Gen-Probe, Inc | 155 | |||
| 30,479 | Halliburton Co | 1,196 | ||||
| 2,802 | * | Hewitt Associates, Inc | 90 | |||
| 4,807 | * | Incyte Corp | 48 | |||
| 599 | * | Infrasource Services, Inc | 8 | |||
| 3,395 | * | Jacobs Engineering Group, Inc | 162 | |||
| 1,504 | * | Keryx Biopharmaceuticals, Inc | 17 | |||
| 1,236 | * | Kosan Biosciences, Inc | 9 | |||
| 584 | Landauer, Inc | 27 | ||||
| 907 | * | LECG Corp | 17 | |||
| 4,403 | * | Lexicon Genetics, Inc | 34 | |||
| 1,975 | * | Lifecell Corp | 20 | |||
| 1,864 | * | Luminex Corp | 17 | |||
| 3,668 | * | Maxim Pharmaceuticals, Inc | 11 | |||
| 1,221 | * | MAXIMUS, Inc | 38 | |||
| 2,143 | * | Maxygen, Inc | 27 | |||
| 18,593 | Monsanto Co | 1,033 | ||||
| 8,767 | Moody’s Corp | 761 | ||||
| 400 | * | MTC Technologies, Inc | 13 | |||
| 1,780 | * | Myriad Genetics, Inc | 40 | |||
| 3,190 | * | Navigant Consulting, Inc | 85 | |||
| 951 | * | Neopharm, Inc | 12 | |||
| 4,219 | * | Oscient Pharmaceuticals Corp | 15 | |||
| 1,703 | * | Parexel International Corp | 35 | |||
| 23,418 | Paychex, Inc | 798 | ||||
| 2,266 | * | Per-Se Technologies, Inc | 36 |
28
Table of Contents
TIAA Stock Index Account
| SHARES/PRINCIPAL | VALUE (000) | |||||
| 3,516 | * | Pharmaceutical Product Development, Inc | 145 | |||
| 6,113 | * | Pharmos Corp | 9 | |||
| 2,566 | * | PRG-Schultz International, Inc | 13 | |||
| 5,338 | Quest Diagnostics, Inc | 510 | ||||
| 1,565 | * | Regeneration Technologies, Inc | 16 | |||
| 4,561 | * | Regeneron Pharmaceuticals, Inc | 42 | |||
| 1,607 | * | Resources Connection, Inc | 87 | |||
| 695 | * | Rigel Pharmaceuticals, Inc | 17 | |||
| 3,182 | * | Seattle Genetics, Inc | 21 | |||
| 20,732 | Servicemaster Co | 286 | ||||
| 867 | * | SFBC International, Inc | 34 | |||
| 1,062 | * | Sourcecorp | 20 | |||
| 1,956 | * | Symyx Technologies, Inc | 59 | |||
| 500 | * | Tejon Ranch Co | 20 | |||
| 2,861 | * | Telik, Inc | 55 | |||
| 3,591 | * | Tetra Tech, Inc | 60 | |||
| 2,015 | * | Transkaryotic Therapies, Inc | 51 | |||
| 791 | * | TRC Cos, Inc | 13 | |||
| 953 | * | Trimeris, Inc | 14 | |||
| 2,180 | * | URS Corp | 70 | |||
| 1,284 | * | Ventiv Health, Inc | 26 | |||
| 1,753 | * | Washington Group International, Inc | 72 | |||
| 2,145 | Watson Wyatt & Co Holdings | 58 | ||||
TOTAL ENGINEERING AND MANAGEMENT SERVICES | 8,422 | |||||
| FABRICATED METAL PRODUCTS - 0.73% | ||||||
| 2,586 | * | Alliant Techsystems, Inc | 169 | |||
| 7,953 | Ball Corp | 350 | ||||
| 714 | CIRCOR International, Inc | 17 | ||||
| 2,018 | Commercial Metals Co | 102 | ||||
| 3,558 | Crane Co | 103 | ||||
| 11,261 | * | Crown Holdings, Inc | 155 | |||
| 16,086 | Danaher Corp | 923 | ||||
| 376 | * | Drew Industries, Inc | 14 | |||
| 10,213 | Fortune Brands, Inc | 788 | ||||
| 1,746 | * | Griffon Corp | 47 | |||
| 546 | Gulf Island Fabrication, Inc | 12 | ||||
| 2,800 | Harsco Corp | 156 | ||||
| 18,296 | Illinois Tool Works, Inc | 1,696 | ||||
| 1,755 | * | Intermagnetics General Corp | 45 | |||
| 5,881 | * | Jacuzzi Brands, Inc | 51 | |||
| 496 | Lifetime Hoan Corp | 8 | ||||
| 31,853 | Masco Corp | 1,164 | ||||
| 933 | * | Mobile Mini, Inc | 31 | |||
| 1,321 | * | NCI Building Systems, Inc | 50 | |||
| 4,275 | * | Shaw Group, Inc | 76 | |||
| 711 | Silgan Holdings, Inc | 43 | ||||
| 2,552 | Simpson Manufacturing Co, Inc | 89 | ||||
| 4,037 | Snap-On, Inc | 139 | ||||
| 4,636 | Stanley Works | 227 | ||||
| 1,400 | Sturm Ruger & Co, Inc | 13 | ||||
| 3,948 | * | Taser International, Inc | 125 | |||
| 4,033 | * | Tower Automotive, Inc | 10 | |||
| 1,000 | Valmont Industries, Inc | 25 | ||||
29
Table of Contents
TIAA Stock Index Account
| SHARES/PRINCIPAL | VALUE (000) | |||||
| 690 | * | Water Pik Technologies, Inc | 12 | |||
| 1,666 | Watts Water Technologies, Inc (Class A) | 54 | ||||
TOTAL FABRICATED METAL PRODUCTS | 6,694 | |||||
| FOOD AND KINDRED PRODUCTS - 3.01% | ||||||
| 1,106 | American Italian Pasta Co (Class A) | 26 | ||||
| 55,500 | Anheuser-Busch Cos, Inc | 2,816 | ||||
| 37,913 | Archer Daniels Midland Co | 846 | ||||
| 700 | * | Boston Beer Co, Inc (Class A) | 15 | |||
| 1,041 | Cal-Maine Foods, Inc | 13 | ||||
| 15,985 | Campbell Soup Co | 478 | ||||
| 263 | Coca-Cola Bottling Co Consolidated | 15 | ||||
| 145,615 | Coca-Cola Co | 6,062 | ||||
| 15,688 | Coca-Cola Enterprises, Inc | 327 | ||||
| 37,888 | Conagra Foods, Inc | 1,116 | ||||
| 6,233 | * | Constellation Brands, Inc (Class A) | 290 | |||
| 1,894 | Coors (Adolph) Co (Class B) | 143 | ||||
| 2,534 | Corn Products International, Inc | 136 | ||||
| 4,436 | * | Darling International, Inc | 19 | |||
| 10,783 | * | Dean Foods Co | 355 | |||
| 12,588 | * | Del Monte Foods Co | 139 | |||
| 650 | Farmer Brothers Co | 16 | ||||
| 2,383 | Flowers Foods, Inc | 75 | ||||
| 21,077 | General Mills, Inc | 1,048 | ||||
| 24,878 | H.J. Heinz Co | 970 | ||||
| 417 | * | Hansen Natural Corp | 15 | |||
| 5,544 | * | Hercules, Inc | 82 | |||
| 12,744 | Hershey Foods Corp | 708 | ||||
| 5,077 | Hormel Foods Corp | 159 | ||||
| 400 | J & J Snack Foods Corp | 20 | ||||
| 3,989 | J.M. Smucker Co | 188 | ||||
| 17,499 | Kellogg Co | 782 | ||||
| 19,337 | Kraft Foods, Inc (Class A) | 689 | ||||
| 1,829 | Lancaster Colony Corp | 78 | ||||
| 1,746 | Lance, Inc | 33 | ||||
| 686 | * | M&F Worldwide Corp | 9 | |||
| 9,489 | McCormick & Co, Inc (Non-Vote) | 366 | ||||
| 550 | MGP Ingredients, Inc | 5 | ||||
| 518 | National Beverage Corp | 4 | ||||
| 624 | * | Peets Coffee & Tea, Inc | 17 | |||
| 11,947 | Pepsi Bottling Group, Inc | 323 | ||||
| 3,934 | PepsiAmericas Inc | 84 | ||||
| 118,153 | PepsiCo, Inc | 6,168 | ||||
| 1,099 | Pilgrim’s Pride Corp | 34 | ||||
| 2,056 | Ralcorp Holdings, Inc | 86 | ||||
| 716 | Sanderson Farms, Inc | 31 | ||||
| 54,701 | Sara Lee Corp | 1,320 | ||||
| 3,076 | Sensient Technologies Corp | 74 | ||||
| 6,771 | * | Smithfield Foods, Inc | 200 | |||
| 1,735 | Tootsie Roll Industries, Inc | 60 | ||||
| 2,585 | Topps Co, Inc | 25 | ||||
| 15,485 | Tyson Foods, Inc (Class A) | 285 | ||||
| 11,505 | Wrigley (Wm.) Jr Co | 796 | ||||
TOTAL FOOD AND KINDRED PRODUCTS | 27,546 | |||||
30
Table of Contents
TIAA Stock Index Account
| SHARES/PRINCIPAL | VALUE (000) | |||||
| FOOD STORES - 0.49% | ||||||
| 1,696 | * | 7-Eleven, Inc | 41 | |||
| 23,819 | Albertson’s, Inc | 569 | ||||
| 97 | Arden Group, Inc (Class A) | 10 | ||||
| 1,203 | * | Great Atlantic & Pacific Tea Co, Inc | 12 | |||
| 700 | Ingles Markets, Inc (Class A) | 9 | ||||
| 53,429 | * | Kroger Co | 937 | |||
| 2,088 | * | Panera Bread Co (Class A) | 84 | |||
| 806 | * | Pantry, Inc | 24 | |||
| 2,206 | * | Pathmark Stores, Inc | 13 | |||
| 2,200 | Ruddick Corp | 48 | ||||
| 31,297 | * | Safeway, Inc | 618 | |||
| 27,620 | * | Starbucks Corp | 1,722 | |||
| 779 | Weis Markets, Inc | 30 | ||||
| 3,830 | Whole Foods Market, Inc | 365 | ||||
| 2,108 | * | Wild Oats Markets, Inc | 19 | |||
| 4,470 | * | Winn-Dixie Stores, Inc | 20 | |||
TOTAL FOOD STORES | 4,521 | |||||
| FORESTRY - 0.11% | ||||||
| 15,586 | Weyerhaeuser Co | 1,048 | ||||
TOTAL FORESTRY | 1,048 | |||||
| FURNITURE AND FIXTURES - 0.32% | ||||||
| 845 | Bassett Furniture Industries, Inc | 17 | ||||
| 2,243 | Ethan Allen Interiors, Inc | 90 | ||||
| 3,459 | Furniture Brands International, Inc | 87 | ||||
| 5,200 | Herman Miller, Inc | 144 | ||||
| 3,609 | Hillenbrand Industries, Inc | 200 | ||||
| 4,114 | HNI Corp | 177 | ||||
| 380 | Hooker Furniture Corp | 9 | ||||
| 3,257 | * | Interface, Inc (Class A) | 32 | |||
| 12,860 | Johnson Controls, Inc | 816 | ||||
| 2,436 | Kimball International, Inc (Class B) | 36 | ||||
| 3,952 | La-Z-Boy, Inc | 61 | ||||
| 4,399 | Lear Corp | 268 | ||||
| 13,681 | Leggett & Platt, Inc | 389 | ||||
| 19,520 | Newell Rubbermaid, Inc | 472 | ||||
| 2,530 | * | Select Comfort Corp | 45 | |||
| 389 | Stanley Furniture Co, Inc | 17 | ||||
| 3,267 | Steelcase, Inc (Class A) | 45 | ||||
TOTAL FURNITURE AND FIXTURES | 2,905 | |||||
| FURNITURE AND HOMEFURNISHINGS STORES - 0.39% | ||||||
| 20,930 | * | Bed Bath & Beyond, Inc | 834 | |||
| 18,471 | Best Buy Co, Inc | 1,098 | ||||
| 13,817 | Circuit City Stores, Inc (Circuit City Group) | 216 | ||||
| 1,370 | * | Cost Plus, Inc | 44 | |||
| 1,100 | * | Electronics Boutique Holdings Corp | 47 | |||
| 2,570 | * | GameStop Corp (Class B) | 58 | |||
| 1,692 | * | Guitar Center, Inc | 89 | |||
| 1,232 | Haverty Furniture Cos, Inc | 23 | ||||
| 700 | * | Kirkland’s, Inc | 9 | |||
| 3,107 | * | Linens’n Things, Inc | 77 | |||
31
Table of Contents
TIAA Stock Index Account
| SHARES/PRINCIPAL | VALUE (000) | |||||
| 3,500 | * | Mohawk Industries, Inc | 319 | |||
| 6,500 | Pier 1 Imports, Inc | 128 | ||||
| 11,717 | RadioShack Corp | 385 | ||||
| 1,828 | * | Restoration Hardware, Inc | 10 | |||
| 2,382 | * | The Bombay Co, Inc | 13 | |||
| 1,215 | * | Trans World Entertainment Corp | 15 | |||
| 6,132 | * | Williams-Sonoma, Inc | 215 | |||
TOTAL FURNITURE AND HOMEFURNISHINGS STORES | 3,580 | |||||
| GENERAL BUILDING CONTRACTORS - 0.45% | ||||||
| 952 | Beazer Homes U.S.A., Inc | 139 | ||||
| 997 | Brookfield Homes Corp | 34 | ||||
| 8,698 | Centex Corp | 518 | ||||
| 16,198 | D.R. Horton, Inc | 653 | ||||
| 147 | * | Dominion Homes, Inc | 4 | |||
| 2,166 | * | Hovnanian Enterprises, Inc (Class A) | 107 | |||
| 2,824 | KB Home | 295 | ||||
| 7,518 | Lennar Corp (Class A) | 426 | ||||
| 720 | Lennar Corp (Class B) | 38 | ||||
| 1,065 | Levitt Corp (Class A) | 33 | ||||
| 862 | M/I Homes, Inc | 48 | ||||
| 1,563 | MDC Holdings, Inc | 135 | ||||
| 736 | * | Meritage Homes Corp | 83 | |||
| 420 | * | NVR, Inc | 323 | |||
| 1,250 | * | Palm Harbor Homes, Inc | 21 | |||
| 900 | * | Perini Corp | 15 | |||
| 7,323 | Pulte Homes, Inc | 467 | ||||
| 3,920 | Ryland Group, Inc | 226 | ||||
| 2,279 | Standard-Pacific Corp | 146 | ||||
| 639 | Technical Olympic U.S.A., Inc | 16 | ||||
| 3,407 | * | Toll Brothers, Inc | 234 | |||
| 2,013 | Walter Industries, Inc | 68 | ||||
| 2,352 | * | WCI Communities, Inc | 69 | |||
| 356 | * | William Lyon Homes, Inc | 25 | |||
TOTAL GENERAL BUILDING CONTRACTORS | 4,123 | |||||
| GENERAL MERCHANDISE STORES - 2.22% | ||||||
| 2,874 | * | 99 Cents Only Stores | 46 | |||
| 8,000 | * | Big Lots, Inc | 97 | |||
| 4,983 | * | BJ's Wholesale Club, Inc | 145 | |||
| 360 | Bon-Ton Stores, Inc | 6 | ||||
| 1,372 | * | Brookstone, Inc | 27 | |||
| 2,822 | Casey’s General Stores, Inc | 51 | ||||
| 481 | * | Conn’s, Inc | 8 | |||
| 32,294 | Costco Wholesale Corp | 1,563 | ||||
| 4,851 | Dillard’s, Inc (Class A) | 130 | ||||
| 20,065 | Dollar General Corp | 417 | ||||
| 8,180 | * | Dollar Tree Stores, Inc | 235 | |||
| 10,790 | Family Dollar Stores, Inc | 337 | ||||
| 13,181 | Federated Department Stores, Inc | 762 | ||||
| 2,720 | Fred’s, Inc | 47 | ||||
| 398 | * | Gander Mountain Co | 5 | |||
| 16,843 | J.C. Penney Co, Inc | 697 | ||||
| 3,283 | * | Kmart Holding Corp | 325 | |||
32
Table of Contents
TIAA Stock Index Account
| SHARES/PRINCIPAL | VALUE (000) | |||||
| 20,377 | * | Kohl's Corp | 1,002 | |||
| 20,021 | May Department Stores Co | 589 | ||||
| 1,723 | Neiman Marcus Group, Inc (Class A) | 123 | ||||
| 723 | Neiman Marcus Group, Inc (Class B) | 48 | ||||
| 919 | * | Retail Ventures, Inc | 7 | |||
| 9,017 | Saks, Inc | 131 | ||||
| 15,893 | Sears Roebuck & Co | 811 | ||||
| 2,069 | * | ShopKo Stores, Inc | 39 | |||
| 1,757 | * | Stein Mart, Inc | 30 | |||
| 63,487 | Target Corp | 3,297 | ||||
| 1,789 | * | Tuesday Morning Corp | 55 | |||
| 176,568 | Wal-Mart Stores, Inc | 9,326 | ||||
TOTAL GENERAL MERCHANDISE STORES | 20,356 | |||||
| HEALTH SERVICES - 0.84% | ||||||
| 3,370 | * | Accredo Health, Inc | 93 | |||
| 716 | Sanderson Farms, Inc | 31 | ||||
| 1,457 | * | Amedisys, Inc | 47 | |||
| 739 | * | America Service Group, Inc | 20 | |||
| 2,010 | * | American Healthways, Inc | 66 | |||
| 2,139 | * | Amsurg Corp | 63 | |||
| 3,761 | * | Apria Healthcare Group, Inc | 124 | |||
| 7,127 | * | Beverly Enterprises, Inc | 65 | |||
| 32,111 | * | Caremark Rx, Inc | 1,266 | |||
| 3,492 | * | Community Health Systems, Inc | 97 | |||
| 500 | * | Corvel Corp | 13 | |||
| 6,161 | * | Coventry Health Care, Inc | 327 | |||
| 2,321 | * | Cross Country Healthcare, Inc | 42 | |||
| 6,902 | * | DaVita, Inc | 273 | |||
| 1,864 | * | Enzo Biochem, Inc | 36 | |||
| 4,446 | * | Express Scripts, Inc | 340 | |||
| 6,878 | * | First Health Group Corp | 129 | |||
| 1,379 | * | Genesis HealthCare Corp | 48 | |||
| 1,525 | * | Gentiva Health Services, Inc | 25 | |||
| 29,026 | HCA, Inc | 1,160 | ||||
| 16,770 | Health Management Associates, Inc (Class A) | 381 | ||||
| 3,932 | Hooper Holmes, Inc | 23 | ||||
| 1,831 | * | Kindred Healthcare, Inc | 55 | |||
| 1,185 | * | LabOne, Inc | 38 | |||
| 10,565 | * | Laboratory Corp of America Holdings | 526 | |||
| 1,072 | LCA-Vision, Inc | 25 | ||||
| 2,695 | * | LifePoint Hospitals, Inc | 94 | |||
| 7,330 | * | Lincare Holdings, Inc | 313 | |||
| 1,871 | * | Magellan Health Services, Inc | 64 | |||
| 6,895 | Manor Care, Inc | 244 | ||||
| 624 | * | Matria Healthcare, Inc | 24 | |||
| 419 | * | Medcath Corp | 10 | |||
| 600 | National Healthcare Corp | 21 | ||||
| 2,611 | * | NeighborCare, Inc | 80 | |||
| 3,260 | * | OCA, Inc | 21 | |||
| 2,544 | * | Odyssey HealthCare, Inc | 35 | |||
| 859 | Option Care, Inc | 15 | ||||
| 1,764 | * | Pediatrix Medical Group, Inc | 113 | |||
| 6,600 | b,v* | Physician Resource Group, Inc | 0 | |||
33
Table of Contents
TIAA Stock Index Account
| SHARES/PRINCIPAL | VALUE (000) | |||||
| 3,350 | * | Province Healthcare Co | 75 | |||
| 1,389 | * | Psychiatric Solutions, Inc | 51 | |||
| 1,200 | * | RehabCare Group, Inc | 34 | |||
| 5,098 | * | Renal Care Group, Inc | 183 | |||
| 6,397 | Select Medical Corp | 113 | ||||
| 366 | * | Specialty Laboratories, Inc | 4 | |||
| 1,300 | * | Sunrise Senior Living, Inc | 60 | |||
| 575 | * | Symbion, Inc | 13 | |||
| 33,103 | * | Tenet Healthcare Corp | 363 | |||
| 5,249 | * | Triad Hospitals, Inc | 195 | |||
| 1,954 | * | United Surgical Partners International, Inc | 81 | |||
| 3,448 | Universal Health Services, Inc (Class B) | 153 | ||||
| 774 | * | VistaCare, Inc (Class A) | 13 | |||
TOTAL HEALTH SERVICES | 7,654 | |||||
| HEAVY CONSTRUCTION, EXCEPT BUILDING - 0.01% | ||||||
| 2,325 | Granite Construction, Inc | 62 | ||||
| 1,632 | * | Insituform Technologies, Inc (Class A) | 37 | |||
TOTAL HEAVY CONSTRUCTION, EXCEPT BUILDING | 99 | |||||
| HOLDING AND OTHER INVESTMENT OFFICES - 2.71% | ||||||
| 816 | * | 4Kids Entertainment, Inc | 17 | |||
| 1,704 | Acadia Realty Trust | 28 | ||||
| 1,716 | Affordable Residential Communities | 25 | ||||
| 700 | Alabama National Bancorp | 45 | ||||
| 142 | * | Alexander’s, Inc | 31 | |||
| 1,279 | Alexandria Real Estate Equities, Inc | 95 | ||||
| 7,895 | Allied Capital Corp | 204 | ||||
| 5,726 | AMB Property Corp | 231 | ||||
| 1,700 | Amcore Financial, Inc | 55 | ||||
| 1,100 | American Campus Communities, Inc | 25 | ||||
| 7,622 | American Financial Realty Trust | 123 | ||||
| 2,412 | American Home Mortgage Investment Corp | 83 | ||||
| 1,759 | AMLI Residential Properties Trust | 56 | ||||
| 8,195 | Annaly Mortgage Management, Inc | 161 | ||||
| 3,218 | Anthracite Capital, Inc | 40 | ||||
| 3,102 | Anworth Mortgage Asset Corp | 33 | ||||
| 6,524 | Apartment Investment & Management Co (Class A) | 251 | ||||
| 4,309 | Apollo Investment Corp | 65 | ||||
| 487 | Arbor Realty Trust, Inc | 12 | ||||
| 12,972 | Archstone-Smith Trust | 497 | ||||
| 4,553 | Arden Realty, Inc | 172 | ||||
| 1,391 | Ashford Hospitality Trust, Inc | 15 | ||||
| 4,303 | AvalonBay Communities, Inc | 324 | ||||
| 996 | Bedford Property Investors | 28 | ||||
| 2,300 | BioMed Realty Trust, Inc | 51 | ||||
| 5,058 | Boston Properties, Inc | 327 | ||||
| 2,844 | Brandywine Realty Trust | 84 | ||||
| 3,459 | BRE Properties, Inc (Class A) | 139 | ||||
| 3,927 | Brookline Bancorp, Inc | 64 | ||||
| 2,767 | Camden Property Trust | 141 | ||||
| 2,163 | Capital Automotive REIT | 77 | ||||
| 1,573 | Capital Lease Funding, Inc | 20 | ||||
| 190 | Capital Southwest Corp | 15 | ||||
34
Table of Contents
TIAA Stock Index Account
| SHARES/PRINCIPAL | VALUE (000) | |||||
| 800 | Capital Trust, Inc | 25 | ||||
| 554 | Capitol Bancorp Ltd | 20 | ||||
| 1,032 | Capstead Mortgage Corp | 11 | ||||
| 3,778 | CarrAmerica Realty Corp | 125 | ||||
| 1,601 | CBL & Associates Properties, Inc | 122 | ||||
| 1,144 | Cedar Shopping Centers, Inc | 16 | ||||
| 3,200 | Centerpoint Properties Trust | 153 | ||||
| 342 | Cherokee, Inc | 12 | ||||
| 1,222 | Colonial Properties Trust | 48 | ||||
| 3,720 | Commercial Net Lease Realty, Inc | 77 | ||||
| 706 | Community Banks, Inc | 20 | ||||
| 3,454 | * | Cornerstone Realty Income Trust, Inc | 34 | |||
| 2,361 | Corporate Office Properties Trust | 69 | ||||
| 916 | Correctional Properties Trust | 26 | ||||
| 2,543 | Cousins Properties, Inc | 77 | ||||
| 5,712 | Crescent Real Estate Equities Co | 104 | ||||
| 1,865 | CRT Properties, Inc | 44 | ||||
| 6,195 | Developers Diversified Realty Corp | 275 | ||||
| 10,594 | Duke Realty Corp | 362 | ||||
| 1,377 | Eastgroup Properties, Inc | 53 | ||||
| 204 | * | Enstar Group, Inc | 13 | |||
| 1,500 | Entertainment Properties Trust | 67 | ||||
| 2,800 | Equity Inns, Inc | 33 | ||||
| 1,295 | Equity Lifestyle Properties, Inc | 46 | ||||
| 28,532 | Equity Office Properties Trust | 831 | ||||
| 2,360 | Equity One, Inc | 56 | ||||
| 19,383 | Equity Residential | 701 | ||||
| 1,591 | Essex Property Trust, Inc | 133 | ||||
| 2,000 | Extra Space Storage, Inc | 27 | ||||
| 3,584 | Federal Realty Investment Trust | 185 | ||||
| 5,000 | * | FelCor Lodging Trust, Inc | 73 | |||
| 750 | First Indiana Corp | 17 | ||||
| 2,865 | First Industrial Realty Trust, Inc | 117 | ||||
| 5,807 | First Niagara Financial Group, Inc | 81 | ||||
| 987 | First Place Financial Corp | 22 | ||||
| 4,200 | Fremont General Corp | 106 | ||||
| 9,588 | Friedman Billings Ramsey Group, Inc | 186 | ||||
| 2,100 | Gables Residential Trust | 75 | ||||
| 16,861 | General Growth Properties, Inc | 610 | ||||
| 760 | German American Bancorp | 12 | ||||
| 638 | Gladstone Capital Corp | 15 | ||||
| 1,935 | Glenborough Realty Trust, Inc | 41 | ||||
| 2,871 | Glimcher Realty Trust | 80 | ||||
| 1,341 | Government Properties Trust, Inc | 13 | ||||
| 1,300 | Gramercy Capital Corp | 27 | ||||
| 3,669 | Greater Bay Bancorp | 102 | ||||
| 2,863 | Harris & Harris Group, Inc | 47 | ||||
| 9,378 | Health Care Property Investors, Inc | 260 | ||||
| 3,772 | Health Care REIT, Inc | 144 | ||||
| 2,992 | Healthcare Realty Trust, Inc | 122 | ||||
| 1,887 | Heritage Property Investment Trust | 61 | ||||
| 2,403 | Highland Hospitality Corp | 27 | ||||
| 3,647 | Highwoods Properties, Inc | 101 | ||||
| 2,435 | Home Properties, Inc | 105 |
35
Table of Contents
TIAA Stock Index Account
| SHARES/PRINCIPAL | VALUE (000) | |||||
| 3,200 | HomeBanc Corp | 31 | ||||
| 4,670 | Hospitality Properties Trust | 215 | ||||
| 23,213 | Host Marriott Corp | 402 | ||||
| 12,322 | HRPT Properties Trust | 158 | ||||
| 5,156 | IMPAC Mortgage Holdings, Inc | 117 | ||||
| 4,582 | Independence Community Bank Corp | 195 | ||||
| 3,494 | Innkeepers U.S.A. Trust | 50 | ||||
| 2,415 | Investors Real Estate Trust | 25 | ||||
| 1,800 | iShares Russell 2000 Index Fund | 233 | ||||
| 6,923 | iStar Financial, Inc | 313 | ||||
| 1,973 | Kilroy Realty Corp | 84 | ||||
| 6,825 | Kimco Realty Corp | 396 | ||||
| 1,600 | Kite Realty Group Trust | 24 | ||||
| 1,672 | Kramont Realty Trust | 39 | ||||
| 13,056 | * | La Quinta Corp | 119 | |||
| 1,927 | LaSalle Hotel Properties | 61 | ||||
| 3,346 | Lexington Corporate Properties Trust | 76 | ||||
| 5,400 | Liberty Property Trust | 233 | ||||
| 1,014 | LTC Properties, Inc | 20 | ||||
| 2,536 | Luminent Mortgage Capital, Inc | 30 | ||||
| 4,337 | Macerich Co | 272 | ||||
| 4,122 | Mack-Cali Realty Corp | 190 | ||||
| 2,360 | Maguire Properties, Inc | 65 | ||||
| 6,043 | * | Meristar Hospitality Corp | 50 | |||
| 5,284 | MFA Mortgage Investments, Inc | 47 | ||||
| 1,237 | Mid-America Apartment Communities, Inc | 51 | ||||
| 3,728 | Mills Corp | 238 | ||||
| 1,041 | Mission West Properties, Inc | 11 | ||||
| 1,400 | MortgageIT Holdings, Inc | 25 | ||||
| 800 | National Health Investors, Inc | 23 | ||||
| 4,621 | Nationwide Health Properties, Inc | 110 | ||||
| 2,803 | New Century Financial Corp | 179 | ||||
| 7,567 | New Plan Excel Realty Trust | 205 | ||||
| 3,061 | Newcastle Investment Corp | 97 | ||||
| 1,737 | Novastar Financial, Inc | 86 | ||||
| 3,221 | Omega Healthcare Investors, Inc | 38 | ||||
| 1,295 | Oriental Financial Group, Inc | 37 | ||||
| 573 | Origen Financial, Inc | 4 | ||||
| 2,862 | Pan Pacific Retail Properties, Inc | 179 | ||||
| 764 | Parkway Properties, Inc | 39 | ||||
| 2,046 | Pennsylvania Real Estate Investment Trust | 88 | ||||
| 13,020 | Plum Creek Timber Co, Inc | 500 | ||||
| 19,167 | Popular, Inc | 553 | ||||
| 2,764 | Post Properties, Inc | 96 | ||||
| 3,092 | Prentiss Properties Trust | 118 | ||||
| 1,141 | PrivateBancorp, Inc | 37 | ||||
| 11,632 | Prologis | 504 | ||||
| 1,084 | Prosperity Bancshares, Inc | 32 | ||||
| 1,073 | PS Business Parks, Inc | 48 | ||||
| 6,600 | Public Storage, Inc | 368 | ||||
| 1,730 | RAIT Investment Trust | 48 | ||||
| 992 | Ramco-Gershenson Properties | 32 | ||||
| 2,700 | Realty Income Corp | 137 | ||||
| 4,644 | Reckson Associates Realty Corp | 152 |
36
Table of Contents
TIAA Stock Index Account
| SHARES/PRINCIPAL | VALUE (000) | |||||
| 1,683 | Redwood Trust, Inc | 104 | ||||
| 3,218 | Regency Centers Corp | 178 | ||||
| 1,000 | Sandy Spring Bancorp, Inc | 38 | ||||
| 800 | Saul Centers, Inc | 31 | ||||
| 3,400 | Saxon Capital, Inc | 82 | ||||
| 3,728 | Senior Housing Properties Trust | 71 | ||||
| 3,170 | Shurgard Storage Centers, Inc (Class A) | 140 | ||||
| 10,802 | Simon Property Group, Inc | 699 | ||||
| 776 | * | Simon Property Group L.P. | 46 | |||
| 2,684 | SL Green Realty Corp | 163 | ||||
| 902 | Sovran Self Storage, Inc | 38 | ||||
| 11,500 | SPDR Trust Series I | 1,390 | ||||
| 1,700 | Strategic Hotel Capital, Inc | 28 | ||||
| 868 | Suffolk Bancorp | 30 | ||||
| 1,970 | Summit Properties, Inc | 64 | ||||
| 1,069 | Sun Communities, Inc | 43 | ||||
| 3,131 | Susquehanna Bancshares, Inc | 78 | ||||
| 1,890 | Tanger Factory Outlet Centers, Inc | 50 | ||||
| 458 | * | Tarragon Realty Investors, Inc | 8 | |||
| 3,455 | Taubman Centers, Inc | 103 | ||||
| 5,913 | Thornburg Mortgage, Inc | 171 | ||||
| 587 | Tompkins Trustco, Inc | 31 | ||||
| 1,937 | Town & Country Trust | 54 | ||||
| 5,482 | Trizec Properties, Inc | 104 | ||||
| 1,311 | U.S. Restaurant Properties, Inc | 24 | ||||
| 8,889 | United Dominion Realty Trust, Inc | 220 | ||||
| 795 | Universal Health Realty Income Trust | 26 | ||||
| 1,607 | Urstadt Biddle Properties, Inc (Class A) | 27 | ||||
| 5,831 | Ventas, Inc | 160 | ||||
| 5,860 | Vornado Realty Trust | 446 | ||||
| 61,591 | Washington Mutual, Inc | 2,604 | ||||
| 2,550 | Washington Real Estate Investment Trust | 86 | ||||
| 2,859 | Waypoint Financial Corp | 81 | ||||
| 4,941 | Weingarten Realty Investors | 198 | ||||
| 358 | Westfield Financial, Inc | 9 | ||||
| 1,215 | Winston Hotels, Inc | 14 | ||||
TOTAL HOLDING AND OTHER INVESTMENT OFFICES | 24,862 | |||||
| HOTELS AND OTHER LODGING PLACES - 0.37% | ||||||
| 709 | Ameristar Casinos, Inc | 31 | ||||
| 1,131 | * | Bluegreen Corp | 22 | |||
| 2,248 | Boyd Gaming Corp | 94 | ||||
| 1,590 | Choice Hotels International, Inc | 92 | ||||
| 596 | * | Empire Resorts, Inc | 7 | |||
| 24,303 | Hilton Hotels Corp | 553 | ||||
| 4,689 | * | Mandalay Resort Group | 330 | |||
| 1,242 | Marcus Corp | 31 | ||||
| 14,035 | Marriott International, Inc (Class A) | 884 | ||||
| 4,788 | * | MGM Mirage | 348 | |||
| 2,469 | * | Pinnacle Entertainment, Inc | 49 | |||
| 13,596 | Starwood Hotels & Resorts Worldwide, Inc | 794 | ||||
| 1,382 | * | Vail Resorts, Inc | 31 | |||
| 2,299 | * | Wynn Resorts Ltd | 154 | |||
TOTAL HOTELS AND OTHER LODGING PLACES | 3,420 | |||||
37
Table of Contents
TIAA Stock Index Account
| SHARES/PRINCIPAL | VALUE (000) | |||||
| INDUSTRIAL MACHINERY AND EQUIPMENT - 7.04% | ||||||
| 54,364 | 3M Co | 4,462 | ||||
| 676 | * | Aaon, Inc | 11 | |||
| 1,648 | * | Actuant Corp | 86 | |||
| 7,209 | * | Adaptec, Inc | 55 | |||
| 4,600 | * | Advanced Digital Information Corp | 46 | |||
| 6,268 | * | AGCO Corp | 137 | |||
| 1,703 | Albany International Corp (Class A) | 60 | ||||
| 13,350 | * | American Standard Cos, Inc | 552 | |||
| 26,331 | * | Apple Computer, Inc | 1,696 | |||
| 116,966 | * | Applied Materials, Inc | 2,000 | |||
| 1,200 | * | Astec Industries, Inc | 21 | |||
| 444 | * | ASV, Inc | 21 | |||
| 3,264 | * | Asyst Technologies, Inc | 17 | |||
| 2,010 | * | Authentidate Holding Corp | 12 | |||
| 3,409 | * | Avocent Corp | 138 | |||
| 7,081 | * | Axcelis Technologies, Inc | 58 | |||
| 24,375 | Baker Hughes, Inc | 1,040 | ||||
| 5,538 | Black & Decker Corp | 489 | ||||
| 1,400 | Black Box Corp | 67 | ||||
| 3,120 | Briggs & Stratton Corp | 130 | ||||
| 3,284 | * | Brooks Automation, Inc | 57 | |||
| 500 | Bucyrus International, Inc (Class A) | 20 | ||||
| 674 | Cascade Corp | 27 | ||||
| 24,320 | Caterpillar, Inc | 2,371 | ||||
| 5,864 | * | Cirrus Logic, Inc | 32 | |||
| 469,984 | * | Cisco Systems, Inc | 9,071 | |||
| 3,734 | * | Cooper Cameron Corp | 201 | |||
| 5,956 | * | Cray, Inc | 28 | |||
| 2,669 | Cummins, Inc | 224 | ||||
| 1,000 | * | Cuno, Inc | 59 | |||
| 2,481 | * | Cymer, Inc | 73 | |||
| 17,052 | Deere & Co | 1,269 | ||||
| 174,759 | * | Dell, Inc | 7,364 | |||
| 5,272 | Diebold, Inc | 294 | ||||
| 5,426 | Donaldson Co, Inc | 177 | ||||
| 3,015 | * | Dot Hill Systems Corp | 24 | |||
| 14,330 | Dover Corp | 601 | ||||
| 463 | * | Dril-Quip, Inc | 11 | |||
| 9,902 | Eaton Corp | 717 | ||||
| 3,700 | * | Electronics For Imaging, Inc | 64 | |||
| 166,395 | * | EMC Corp | 2,474 | |||
| 5,823 | * | Emulex Corp | 98 | |||
| 1,548 | Engineered Support Systems, Inc | 92 | ||||
| 1,375 | * | EnPro Industries, Inc | 41 | |||
| 1,492 | * | Esterline Technologies Corp | 49 | |||
| 2,479 | * | FalconStor Software, Inc | 24 | |||
| 909 | * | Flanders Corp | 9 | |||
| 3,771 | * | Flowserve Corp | 104 | |||
| 3,959 | * | FMC Technologies, Inc | 127 | |||
| 2,076 | * | FSI International, Inc | 10 | |||
| 1,373 | * | Gardner Denver, Inc | 50 | |||
| 15,479 | * | Gateway, Inc | 93 | |||
| 428 | * | General Binding Corp | 6 | |||
38
Table of Contents
TIAA Stock Index Account
| SHARES/PRINCIPAL | VALUE (000) | |||||
| 1,604 | * | Global Power Equipment Group, Inc | 16 | |||
| 673 | Gorman-Rupp Co | 15 | ||||
| 4,828 | Graco, Inc | 180 | ||||
| 8,494 | * | Grant Prideco, Inc | 170 | |||
| 214,146 | Hewlett-Packard Co | 4,491 | ||||
| 835 | * | Hydril | 38 | |||
| 3,542 | * | Hypercom Corp | 21 | |||
| 2,839 | IDEX Corp | 115 | ||||
| 2,671 | * | InFocus Corp | 24 | |||
| 116,676 | International Business Machines Corp | 11,502 | ||||
| 24,248 | International Game Technology | 834 | ||||
| 1,163 | * | Intevac, Inc | 9 | |||
| 3,555 | * | Iomega Corp | 20 | |||
| 6,433 | ITT Industries, Inc | 543 | ||||
| 3,200 | JLG Industries, Inc | 63 | ||||
| 3,534 | Joy Global, Inc | 153 | ||||
| 993 | * | Kadant, Inc | 20 | |||
| 1,979 | Kaydon Corp | 65 | ||||
| 2,554 | Kennametal, Inc | 127 | ||||
| 3,183 | * | Komag, Inc | 60 | |||
| 3,600 | * | Kulicke & Soffa Industries, Inc | 31 | |||
| 9,315 | * | Lam Research Corp | 269 | |||
| 3,073 | Lennox International, Inc | 63 | ||||
| 8,576 | * | Lexmark International, Inc | 729 | |||
| 2,211 | Lincoln Electric Holdings, Inc | 76 | ||||
| 700 | Lindsay Manufacturing Co | 18 | ||||
| 400 | Lufkin Industries, Inc | 16 | ||||
| 1,857 | Manitowoc Co, Inc | 70 | ||||
| 17,191 | * | Maxtor Corp | 91 | |||
| 1,115 | * | Micros Systems, Inc | 87 | |||
| 310 | Middleby Corp | 16 | ||||
| 1,670 | * | Milacron, Inc | 6 | |||
| 2,000 | Modine Manufacturing Co | 68 | ||||
| 413 | Nacco Industries, Inc (Class A) | 44 | ||||
| 5,964 | * | National-Oilwell, Inc | 210 | |||
| 1,504 | * | Netgear, Inc | 27 | |||
| 21,173 | * | Network Appliance, Inc | 703 | |||
| 1,903 | Nordson Corp | 76 | ||||
| 2,019 | * | Oil States International, Inc | 39 | |||
| 1,512 | * | Omnicell, Inc | 17 | |||
| 547 | * | Overland Storage, Inc | 9 | |||
| 8,166 | Pall Corp | 236 | ||||
| 2,905 | * | PalmOne, Inc | 92 | |||
| 8,479 | Parker Hannifin Corp | 642 | ||||
| 2,314 | * | Paxar Corp | 51 | |||
| 6,972 | Pentair, Inc | 304 | ||||
| 16,663 | Pitney Bowes, Inc | 771 | ||||
| 904 | * | Planar Systems, Inc | 10 | |||
| 2,200 | * | Presstek, Inc | 21 | |||
| 1,773 | * | ProQuest Co | 53 | |||
| 12,525 | * | Quantum Corp | 33 | |||
| 600 | Robbins & Myers, Inc | 14 | ||||
| 11,224 | * | Sandisk Corp | 280 | |||
| 744 | Sauer-Danfoss, Inc | 16 |
39
Table of Contents
TIAA Stock Index Account
| SHARES/PRINCIPAL | VALUE (000) | ||||||
| 600 | Schawk, Inc | 11 | |||||
| 3,855 | * | Scientific Games Corp (Class A) | 92 | ||||
| 16,448 | * | Seagate Tech (Escrow) | (0 | ) | |||
| 1,100 | * | Semitool, Inc | 10 | ||||
| 18,144 | * | Silicon Graphics, Inc | 31 | ||||
| 517 | * | Simpletech, Inc | 2 | ||||
| 7,256 | * | Smith International, Inc | 395 | ||||
| 61,597 | * | Solectron Corp | 328 | ||||
| 5,466 | SPX Corp | 219 | |||||
| 800 | Standex International Corp | 23 | |||||
| 2,032 | Stewart & Stevenson Services, Inc | 41 | |||||
| 7,539 | * | Storage Technology Corp | 238 | ||||
| 16,219 | Symbol Technologies, Inc | 281 | |||||
| 1,000 | Tecumseh Products Co (Class A) | 48 | |||||
| 600 | Tennant Co | 24 | |||||
| 3,427 | * | Terex Corp | 163 | ||||
| 1,000 | Thomas Industries, Inc | 40 | |||||
| 4,711 | Timken Co | 123 | |||||
| 1,683 | Toro Co | 137 | |||||
| 594 | * | Transact Technologies, Inc | 13 | ||||
| 1,608 | * | Ultratech, Inc | 30 | ||||
| 3,395 | * | UNOVA, Inc | 86 | ||||
| 1,820 | * | Veeco Instruments, Inc | 38 | ||||
| 14,492 | * | Western Digital Corp | 157 | ||||
| 675 | Woodward Governor Co | 48 | |||||
| 52,726 | * | Xerox Corp | 897 | ||||
| 12,291 | * | Xybernaut Corp | 15 | ||||
| 2,873 | York International Corp | 99 | |||||
| 3,907 | * | Zebra Technologies Corp (Class A) | 220 | ||||
TOTAL INDUSTRIAL MACHINERY AND EQUIPMENT | 64,422 | ||||||
| INSTRUMENTS AND RELATED PRODUCTS - 3.04% | |||||||
| 1,214 | * | Abaxis, Inc | 18 | ||||
| 1,059 | * | Abiomed, Inc | 16 | ||||
| 657 | * | ADE Corp | 12 | ||||
| 2,148 | * | Advanced Medical Optics, Inc | 88 | ||||
| 1,396 | * | Advanced Neuromodulation Systems, Inc | 55 | ||||
| 33,422 | * | Agilent Technologies, Inc | 805 | ||||
| 1,853 | * | Aksys Ltd | 10 | ||||
| 3,618 | * | Align Technology, Inc | 39 | ||||
| 1,754 | * | American Medical Systems Holdings, Inc | 73 | ||||
| 477 | Analogic Corp | 21 | |||||
| 295 | * | Animas Corp | 5 | ||||
| 15,663 | Applera Corp (Applied Biosystems Group) | 328 | |||||
| 1,344 | Arrow International, Inc | 42 | |||||
| 1,500 | * | Arthrocare Corp | 48 | ||||
| 624 | * | Aspect Medical Systems, Inc | 15 | ||||
| 1,234 | * | August Technology Corp | 13 | ||||
| 7,568 | Bard (C.R.), Inc | 484 | |||||
| 3,695 | Bausch & Lomb, Inc | 238 | |||||
| 42,079 | Baxter International, Inc | 1,453 | |||||
| 4,485 | Beckman Coulter, Inc | 300 | |||||
| 18,042 | Becton Dickinson & Co | 1,025 | |||||
| 786 | BEI Technologies, Inc | 24 | |||||
40
Table of Contents
TIAA Stock Index Account
| SHARES/PRINCIPAL | VALUE (000) | |||||
| 1,268 | Biolase Technology, Inc | 14 | ||||
| 18,144 | Biomet, Inc | 787 | ||||
| 1,200 | * | Bio-Rad Laboratories, Inc (Class A) | 69 | |||
| 45,388 | * | Boston Scientific Corp | 1,614 | |||
| 1,542 | * | Bruker BioSciences Corp | 6 | |||
| 1,038 | * | Candela Corp | 12 | |||
| 4,771 | * | Cardiac Science, Inc | 10 | |||
| 2,300 | * | Cardiodynamics International Corp | 12 | |||
| 2,899 | * | Cepheid, Inc | 29 | |||
| 400 | * | Closure Medical Corp | 8 | |||
| 2,776 | Cognex Corp | 77 | ||||
| 2,100 | * | Coherent, Inc | 64 | |||
| 1,500 | Cohu, Inc | 28 | ||||
| 1,773 | * | Conceptus, Inc | 14 | |||
| 1,940 | * | Conmed Corp | 55 | |||
| 2,252 | Cooper Cos, Inc | 159 | ||||
| 6,689 | * | Credence Systems Corp | 61 | |||
| 2,061 | * | CTI Molecular Imaging, Inc | 29 | |||
| 1,543 | * | Cyberonics, Inc | 32 | |||
| 515 | * | Cyberoptics Corp | 8 | |||
| 8,521 | * | Cytyc Corp | 235 | |||
| 800 | Datascope Corp | 32 | ||||
| 5,500 | Dentsply International, Inc | 309 | ||||
| 1,465 | * | Depomed, Inc | 8 | |||
| 1,255 | * | Dionex Corp | 71 | |||
| 1,242 | * | DJ Orthopedics, Inc | 27 | |||
| 1,645 | * | DRS Technologies, Inc | 70 | |||
| 20,264 | Eastman Kodak Co | 654 | ||||
| 1,002 | EDO Corp | 32 | ||||
| 4,390 | * | Edwards Lifesciences Corp | 181 | |||
| 2,138 | * | Encore Medical Corp | 15 | |||
| 1,525 | * | Endocardial Solutions, Inc | 18 | |||
| 859 | * | ESCO Technologies, Inc | 66 | |||
| 399 | * | Exactech, Inc | 7 | |||
| 833 | * | Excel Technology, Inc | 22 | |||
| 458 | E-Z-Em-Inc | 7 | ||||
| 735 | * | Faro Technologies, Inc | 23 | |||
| 1,709 | * | FEI Co | 36 | |||
| 8,328 | * | Fisher Scientific International, Inc | 520 | |||
| 2,442 | * | Flir Systems, Inc | 156 | |||
| 1,927 | * | Formfactor, Inc | 52 | |||
| 2,767 | * | Fossil, Inc | 71 | |||
| 21,910 | Guidant Corp | 1,580 | ||||
| 1,357 | * | Haemonetics Corp | 49 | |||
| 1,390 | * | Hanger Orthopedic Group, Inc | 11 | |||
| 859 | * | Herley Industries, Inc | 17 | |||
| 1,387 | * | Hologic, Inc | 38 | |||
| 701 | * | ICU Medical, Inc | 19 | |||
| 1,260 | * | I-Flow Corp | 23 | |||
| 700 | II-VI, Inc | 30 | ||||
| 2,022 | * | Illumina, Inc | 19 | |||
| 2,466 | * | Inamed Corp | 156 | |||
| 4,300 | * | Input/Output, Inc | 38 | |||
| 1,332 | * | Integra LifeSciences Holding | 49 |
41
Table of Contents
TIAA Stock Index Account
| SHARES/PRINCIPAL | VALUE (000) | |||||
| 2,329 | * | Intuitive Surgical, Inc | 93 | |||
| 1,790 | Invacare Corp | 83 | ||||
| 1,262 | * | Ionics, Inc | 55 | |||
| 512 | * | Ista Pharmaceuticals, Inc | 5 | |||
| 1,441 | * | Itron, Inc | 34 | |||
| 1,548 | * | Ixia | 26 | |||
| 900 | Keithley Instruments, Inc | 18 | ||||
| 520 | * | Kensey Nash Corp | 18 | |||
| 13,534 | * | KLA-Tencor Corp | 630 | |||
| 653 | * | KVH Industries, Inc | 6 | |||
| 1,433 | * | Kyphon, Inc | 37 | |||
| 1,257 | * | Laserscope | 45 | |||
| 542 | * | LeCroy Corp | 13 | |||
| 4,789 | * | Lexar Media, Inc | 38 | |||
| 4,233 | * | LTX Corp | 33 | |||
| 742 | * | Measurement Specialties, Inc | 19 | |||
| 522 | * | Medical Action Industries, Inc | 10 | |||
| 84,259 | Medtronic, Inc | 4,185 | ||||
| 3,043 | Mentor Corp | 103 | ||||
| 1,469 | * | Merit Medical Systems, Inc | 22 | |||
| 2,475 | * | Mettler-Toledo International, Inc | 127 | |||
| 670 | * | Micro Therapeutics, Inc | 3 | |||
| 3,429 | * | Millipore Corp | 171 | |||
| 1,695 | Mine Safety Appliances Co | 86 | ||||
| 2,254 | * | MKS Instruments, Inc | 42 | |||
| 1,101 | * | Molecular Devices Corp | 22 | |||
| 1,178 | Movado Group, Inc | 22 | ||||
| 1,508 | MTS Systems Corp | 51 | ||||
| 2,364 | * | Nanogen, Inc | 17 | |||
| 2,716 | * | Newport Corp | 38 | |||
| 451 | * | NuVasive, Inc | 5 | |||
| 1,667 | Oakley, Inc | 21 | ||||
| 1,353 | * | Ocular Sciences, Inc | 66 | |||
| 3,100 | * | Orbital Sciences Corp | 37 | |||
| 2,298 | * | Orthologic Corp | 14 | |||
| 2,820 | * | Orthovita, Inc | 12 | |||
| 834 | * | Palomar Medical Technologies, Inc | 22 | |||
| 8,877 | PerkinElmer, Inc | 200 | ||||
| 1,200 | * | Photon Dynamics, Inc | 29 | |||
| 4,783 | * | Pinnacle Systems, Inc | 29 | |||
| 1,227 | * | Possis Medical, Inc | 17 | |||
| 2,399 | * | RAE Systems, Inc | 18 | |||
| 31,170 | Raytheon Co | 1,210 | ||||
| 2,350 | * | Resmed, Inc | 120 | |||
| 2,421 | * | Respironics, Inc | 132 | |||
| 11,858 | Rockwell Automation, Inc | 588 | ||||
| 1,037 | * | Rofin-Sinar Technologies, Inc | 44 | |||
| 2,558 | Roper Industries, Inc | 155 | ||||
| 688 | * | Rudolph Technologies, Inc | 12 | |||
| 762 | * | Sirf Technology Holdings, Inc | 10 | |||
| 2,167 | * | Sola International, Inc | 60 | |||
| 1,281 | * | Sonic Innovations, Inc | 5 | |||
| 1,305 | * | Sonic Solutions, Inc | 29 | |||
| 957 | * | SonoSite, Inc | 32 |
42
Table of Contents
TIAA Stock Index Account
| SHARES/PRINCIPAL | VALUE (000) | |||||
| 25,064 | * | St. Jude Medical, Inc | 1,051 | |||
| 5,147 | * | Star Scientific, Inc | 26 | |||
| 4,798 | * | Steris Corp | 114 | |||
| 19,736 | Stryker Corp | 952 | ||||
| 2,566 | * | Sybron Dental Specialties, Inc | 91 | |||
| 358 | Sypris Solutions, Inc | 5 | ||||
| 2,800 | * | Techne Corp | 109 | |||
| 6,000 | Tektronix, Inc | 181 | ||||
| 2,389 | Teleflex, Inc | 124 | ||||
| 13,483 | * | Teradyne, Inc | 230 | |||
| 11,386 | * | Thermo Electron Corp | 344 | |||
| 3,100 | * | Thermogenesis | 20 | |||
| 3,489 | * | Thoratec Corp | 36 | |||
| 3,521 | * | Trimble Navigation Ltd | 116 | |||
| 1,583 | * | TriPath Imaging, Inc | 14 | |||
| 688 | United Industrial Corp | 27 | ||||
| 977 | * | Urologix, Inc | 6 | |||
| 9,212 | * | Varian Medical Systems, Inc | 398 | |||
| 2,410 | * | Varian, Inc | 99 | |||
| 951 | * | Ventana Medical Systems, Inc | 61 | |||
| 1,897 | * | Viasys Healthcare, Inc | 36 | |||
| 1,589 | * | Viisage Technology, Inc | 14 | |||
| 3,466 | * | Visx, Inc | 90 | |||
| 400 | Vital Signs, Inc | 16 | ||||
| 8,959 | * | Waters Corp | 419 | |||
| 1,846 | * | Wright Medical Group, Inc | 53 | |||
| 1,200 | X-Rite, Inc | 19 | ||||
| 311 | Young Innovations, Inc | 10 | ||||
| 17,036 | * | Zimmer Holdings, Inc | 1,365 | |||
| 600 | * | Zoll Medical Corp | 21 | |||
| 1,200 | * | Zygo Corp | 14 | |||
TOTAL INSTRUMENTS AND RELATED PRODUCTS | 27,821 | |||||
| INSURANCE AGENTS, BROKERS AND SERVICE- 0.34% | ||||||
| 20,397 | AON Corp | 487 | ||||
| 3,654 | Brown & Brown, Inc | 159 | ||||
| 1,019 | * | Clark, Inc | 16 | |||
| 2,076 | Crawford & Co (Class B) | 16 | ||||
| 6,200 | Gallagher (Arthur J.) & Co | 202 | ||||
| 2,140 | Hilb, Rogal & Hamilton Co | 78 | ||||
| 37,347 | Marsh & McLennan Cos, Inc | 1,229 | ||||
| 19,156 | * | Medco Health Solutions, Inc | 797 | |||
| 2,320 | National Financial Partners Corp | 90 | ||||
| 2,450 | * | USI Holdings Corp | 28 | |||
TOTAL INSURANCE AGENTS, BROKERS AND SERVICE | 3,102 | |||||
| INSURANCE CARRIERS - 4.92% | ||||||
| 1,552 | 21st Century Insurance Group | 21 | ||||
| 10,081 | Aetna, Inc | 1,258 | ||||
| 36,249 | Aflac, Inc | 1,444 | ||||
| 2,273 | Alfa Corp | 35 | ||||
| 291 | * | Alleghany Corp | 83 | |||
| 3,675 | * | Allmerica Financial Corp | 121 | |||
| 49,574 | Allstate Corp | 2,564 | ||||
43
Table of Contents
TIAA Stock Index Account
| SHARES/PRINCIPAL | VALUE (000) | |||||
| 6,939 | Ambac Financial Group, Inc | 570 | ||||
| 845 | American Equity Investment Life Holding Co | 9 | ||||
| 2,572 | American Financial Group, Inc | 81 | ||||
| 159,721 | American International Group, Inc | 10,489 | ||||
| 693 | American National Insurance Co | 72 | ||||
| 652 | * | American Physicians Capital, Inc | 23 | |||
| 1,720 | * | AMERIGROUP Corp | 130 | |||
| 2,774 | AmerUs Group Co | 126 | ||||
| 1,958 | * | Argonaut Group, Inc | 41 | |||
| 3,874 | Assurant, Inc | 118 | ||||
| 625 | Baldwin & Lyons, Inc (Class B) | 17 | ||||
| 4,524 | Berkley (W.R.) Corp | 213 | ||||
| 1,052 | Bristol West Holdings, Inc | 21 | ||||
| 2,570 | * | Centene Corp | 73 | |||
| 2,096 | * | Ceres Group, Inc | 11 | |||
| 13,197 | Chubb Corp | 1,015 | ||||
| 9,861 | Cigna Corp | 804 | ||||
| 9,946 | Cincinnati Financial Corp | 440 | ||||
| 1,975 | * | Citizens, Inc | 13 | |||
| 1,505 | * | CNA Financial Corp | 40 | |||
| 1,100 | * | CNA Surety Corp | 15 | |||
| 1,558 | Commerce Group, Inc | 95 | ||||
| 10,017 | * | Conseco, Inc | 200 | |||
| 3,187 | * | Danielson Holdings Corp | 27 | |||
| 1,728 | Delphi Financial Group, Inc (Class A) | 80 | ||||
| 900 | Direct General Corp | 29 | ||||
| 220 | Donegal Group, Inc | 5 | ||||
| 168 | EMC Insurance Group, Inc | 4 | ||||
| 1,854 | Erie Indemnity Co (Class A) | 97 | ||||
| 881 | FBL Financial Group, Inc (Class A) | 25 | ||||
| 10,788 | Fidelity National Financial, Inc | 493 | ||||
| 4,830 | First American Corp | 170 | ||||
| 558 | * | FPIC Insurance Group, Inc | 20 | |||
| 8,092 | Genworth Financial, Inc | 218 | ||||
| 500 | Great American Financial Resources, Inc | 9 | ||||
| 2,039 | Harleysville Group, Inc | 49 | ||||
| 20,015 | Hartford Financial Services Group, Inc | 1,387 | ||||
| 4,539 | HCC Insurance Holdings, Inc | 150 | ||||
| 7,373 | * | Health Net, Inc | 213 | |||
| 900 | * | HealthExtras, Inc | 15 | |||
| 2,970 | Horace Mann Educators Corp | 57 | ||||
| 11,571 | * | Humana, Inc | 344 | |||
| 423 | Independence Holding Co | 8 | ||||
| 1,436 | Infinity Property & Casualty Corp | 51 | ||||
| 10,164 | Jefferson-Pilot Corp | 528 | ||||
| 314 | Kansas City Life Insurance Co | 15 | ||||
| 1,329 | Landamerica Financial Group, Inc | 72 | ||||
| 3,293 | Leucadia National Corp | 229 | ||||
| 12,485 | Lincoln National Corp | 583 | ||||
| 9,608 | Loews Corp | 675 | ||||
| 600 | * | Markel Corp | 218 | |||
| 10,256 | MBIA, Inc | 649 | ||||
| 1,767 | Mercury General Corp | 106 | ||||
| 26,751 | MetLife, Inc | 1,084 |
44
Table of Contents
TIAA Stock Index Account
| SHARES/PRINCIPAL | VALUE (000) | |||||
| 6,300 | MGIC Investment Corp | 434 | ||||
| 578 | Midland Co | 18 | ||||
| 720 | * | Molina Healthcare, Inc | 33 | |||
| 154 | * | National Western Life Insurance Co (Class A) | 26 | |||
| 3,921 | Nationwide Financial Services, Inc (Class A) | 150 | ||||
| 290 | * | Navigators Group, Inc | 9 | |||
| 103 | NYMAGIC, Inc | 3 | ||||
| 1,205 | Odyssey Re Holdings Corp | 30 | ||||
| 4,060 | * | Ohio Casualty Corp | 94 | |||
| 12,799 | Old Republic International Corp | 324 | ||||
| 5,987 | * | Pacificare Health Systems, Inc | 338 | |||
| 700 | Penn-America Group, Inc | 11 | ||||
| 1,212 | * | Philadelphia Consolidated Holding Corp | 80 | |||
| 6,516 | Phoenix Cos, Inc | 81 | ||||
| 591 | * | Pico Holdings, Inc | 12 | |||
| 1,846 | * | PMA Capital Corp (Class A) | 19 | |||
| 6,589 | PMI Group, Inc | 275 | ||||
| 1,502 | Presidential Life Corp | 25 | ||||
| 20,955 | Principal Financial Group | 858 | ||||
| 1,820 | * | ProAssurance Corp | 71 | |||
| 13,755 | Progressive Corp | 1,167 | ||||
| 4,643 | Protective Life Corp | 198 | ||||
| 37,631 | Prudential Financial, Inc | 2,068 | ||||
| 6,568 | Radian Group, Inc | 350 | ||||
| 1,878 | Reinsurance Group of America, Inc | 91 | ||||
| 1,557 | RLI Corp | 65 | ||||
| 9,116 | Safeco Corp | 476 | ||||
| 530 | Safety Insurance Group, Inc | 17 | ||||
| 1,800 | Selective Insurance Group, Inc | 80 | ||||
| 1,748 | * | Sierra Health Services, Inc | 96 | |||
| 45,330 | St. Paul Travelers Cos, Inc | 1,680 | ||||
| 2,065 | Stancorp Financial Group, Inc | 170 | ||||
| 913 | State Auto Financial Corp | 24 | ||||
| 1,214 | Stewart Information Services Corp | 51 | ||||
| 8,212 | Torchmark Corp | 469 | ||||
| 1,780 | Transatlantic Holdings, Inc | 110 | ||||
| 648 | * | Triad Guaranty, Inc | 39 | |||
| 2,600 | UICI | 88 | ||||
| 1,036 | United Fire & Casualty Co | 35 | ||||
| 45,949 | UnitedHealth Group, Inc | 4,045 | ||||
| 3,350 | Unitrin, Inc | 152 | ||||
| 1,679 | * | Universal American Financial Corp | 26 | |||
| 19,988 | UnumProvident Corp | 359 | ||||
| 2,507 | * | Vesta Insurance Group, Inc | 9 | |||
| 500 | * | WellCare Health Plans, Inc | 16 | |||
| 1,564 | * | WellChoice, Inc | 84 | |||
| 20,256 | * | WellPoint, Inc | 2,329 | |||
| 95 | Wesco Financial Corp | 37 | ||||
| 655 | Zenith National Insurance Corp | 33 | ||||
TOTAL INSURANCE CARRIERS | 45,007 | |||||
| JUSTICE, PUBLIC ORDER AND SAFETY - 0.00% | ||||||
| 600 | * | Geo Group, Inc | 16 | |||
TOTAL JUSTICE, PUBLIC ORDER AND SAFETY | 16 | |||||
45
Table of Contents
TIAA Stock Index Account
| SHARES/PRINCIPAL | VALUE (000) | |||||
| LEATHER AND LEATHER PRODUCTS - 0.11% | ||||||
| 1,264 | Brown Shoe Co, Inc | 38 | ||||
| 12,856 | * | Coach, Inc | 725 | |||
| 1,830 | K-Swiss, Inc (Class A) | 53 | ||||
| 600 | * | Steven Madden Ltd | 11 | |||
| 1,396 | * | Timberland Co (Class A) | 87 | |||
| 189 | Weyco Group, Inc | 8 | ||||
| 2,882 | Wolverine World Wide, Inc | 91 | ||||
TOTAL LEATHER AND LEATHER PRODUCTS | 1,013 | |||||
| LEGAL SERVICES - 0.00% | ||||||
| 852 | Pre-Paid Legal Services, Inc | 32 | ||||
TOTAL LEGAL SERVICES | 32 | |||||
| LOCAL AND INTERURBAN PASSENGER TRANSIT - 0.02% | ||||||
| 7,215 | * | Laidlaw International, Inc | 154 | |||
TOTAL LOCAL AND INTERURBAN PASSENGER TRANSIT | 154 | |||||
| LUMBER AND WOOD PRODUCTS - 0.13% | ||||||
| 660 | American Woodmark Corp | 29 | ||||
| 4,900 | * | Champion Enterprises, Inc | 58 | |||
| 742 | Deltic Timber Corp | 31 | ||||
| 17,910 | Georgia-Pacific Corp | 671 | ||||
| 7,563 | Louisiana-Pacific Corp | 202 | ||||
| 3,382 | Rayonier, Inc | 165 | ||||
| 442 | Skyline Corp | 18 | ||||
| 979 | Universal Forest Products, Inc | 42 | ||||
TOTAL LUMBER AND WOOD PRODUCTS | 1,216 | |||||
| METAL MINING - 0.28% | ||||||
| 741 | Cleveland-Cliffs, Inc | 77 | ||||
| 15,276 | * | Coeur D’alene Mines Corp | 60 | |||
| 10,694 | Freeport-McMoRan Copper & Gold, Inc (Class A) | 409 | ||||
| 8,220 | * | Hecla Mining Co | 48 | |||
| 27,443 | Newmont Mining Corp | 1,219 | ||||
| 6,499 | Phelps Dodge Corp | 643 | ||||
| 2,376 | Royal Gold, Inc | 43 | ||||
| 1,033 | Southern Peru Copper Corp | 49 | ||||
| 4,305 | * | Stillwater Mining Co | 48 | |||
TOTAL METAL MINING | 2,596 | |||||
| MISCELLANEOUS MANUFACTURING INDUSTRIES - 0.15% | ||||||
| 2,039 | Blyth, Inc | 60 | ||||
| 4,691 | Callaway Golf Co | 63 | ||||
| 1,000 | * | Daktronics, Inc | 25 | |||
| 546 | Escalade, Inc | 7 | ||||
| 9,648 | Hasbro, Inc | 187 | ||||
| 5,789 | * | Identix, Inc | 43 | |||
| 1,657 | * | Jakks Pacific, Inc | 37 | |||
| 1,914 | * | K2, Inc | 30 | |||
| 1,909 | * | Leapfrog Enterprises, Inc | 26 | |||
| 30,831 | Mattel, Inc | 601 | ||||
| 2,137 | Nautilus Group, Inc | 52 | ||||
| 800 | Penn Engineering & Manufacturing Corp | 14 | ||||
46
Table of Contents
TIAA Stock Index Account
| SHARES/PRINCIPAL | VALUE (000) | |||||
| 1,010 | * | RC2 Corp | 33 | |||
| 700 | Russ Berrie & Co, Inc | 16 | ||||
| 1,845 | * | Shuffle Master, Inc | 87 | |||
| 467 | * | Steinway Musical Instruments, Inc | 14 | |||
| 3,455 | * | Yankee Candle Co, Inc | 115 | |||
TOTAL MISCELLANEOUS MANUFACTURING INDUSTRIES | 1,410 | |||||
| MISCELLANEOUS RETAIL - 1.48% | ||||||
| 1,264 | * | 1-800-Flowers.com, Inc (Class A) | 11 | |||
| 872 | * | AC Moore Arts & Crafts, Inc | 25 | |||
| 2,156 | * | Alloy, Inc | 17 | |||
| 19,768 | * | Amazon.com, Inc | 876 | |||
| 3,696 | * | Barnes & Noble, Inc | 119 | |||
| 1,412 | Big 5 Sporting Goods Corp | 41 | ||||
| 574 | Blair Corp | 20 | ||||
| 517 | Blockbuster, Inc (Class B) | 5 | ||||
| 260 | * | Blue Nile, Inc | 7 | |||
| 5,623 | Borders Group, Inc | 143 | ||||
| 2,000 | Cash America International, Inc | 59 | ||||
| 1,525 | * | Coldwater Creek, Inc | 47 | |||
| 27,868 | CVS Corp | 1,256 | ||||
| 2,094 | * | Dick’s Sporting Goods, Inc | 74 | |||
| 3,077 | * | Drugstore.com, Inc | 10 | |||
| 35,609 | * | eBay, Inc | 4,141 | |||
| 1,144 | Hancock Fabrics, Inc | 12 | ||||
| 1,626 | * | Hibbett Sporting Goods, Inc | 43 | |||
| 1,216 | * | Jill (J.) Group, Inc | 18 | |||
| 2,200 | Longs Drug Stores Corp | 61 | ||||
| 4,946 | * | Marvel Enterprises, Inc | 101 | |||
| 9,554 | Michaels Stores, Inc | 286 | ||||
| 2,246 | MSC Industrial Direct Co (Class A) | 81 | ||||
| 21,801 | * | Office Depot, Inc | 378 | |||
| 7,218 | Omnicare, Inc | 250 | ||||
| 1,001 | * | Overstock.com, Inc | 69 | |||
| 425 | * | Party City Corp | 5 | |||
| 400 | * | PC Connection, Inc | 4 | |||
| 541 | * | PC Mall, Inc | 12 | |||
| 2,833 | * | Petco Animal Supplies, Inc | 112 | |||
| 10,034 | Petsmart, Inc | 357 | ||||
| 1,516 | * | Priceline.com, Inc | 36 | |||
| 30,040 | * | Rite Aid Corp | 110 | |||
| 814 | * | Sharper Image Corp | 15 | |||
| 1,548 | * | Sports Authority, Inc | 40 | |||
| 1,250 | Stamps.com, Inc | 20 | ||||
| 33,469 | Staples, Inc | 1,128 | ||||
| 9,058 | Tiffany & Co | 290 | ||||
| 14,715 | * | Toys ‘R’ Us, Inc | 301 | |||
| 1,504 | * | Valuevision International, Inc (Class A) | 21 | |||
| 72,476 | Walgreen Co | 2,781 | ||||
| 779 | World Fuel Services Corp | 39 | ||||
| 3,748 | * | Zale Corp | 112 | |||
TOTAL MISCELLANEOUS RETAIL | 13,533 | |||||
47
Table of Contents
TIAA Stock Index Account
| SHARES/PRINCIPAL | VALUE (000) | |||||
| MOTION PICTURES - 1.37% | ||||||
| 2,197 | * | Avid Technology, Inc | 136 | |||
| 12,560 | Blockbuster, Inc (Class A) | 120 | ||||
| 533 | Carmike Cinemas, Inc | 19 | ||||
| 2,200 | * | DreamWorks Animation SKG, Inc (Class A) | 83 | |||
| 3,398 | * | Hollywood Entertainment Corp | 44 | |||
| 187,493 | * | Liberty Media Corp (Class A) | 2,059 | |||
| 3,935 | Metro-Goldwyn-Mayer, Inc | 47 | ||||
| 1,849 | Movie Gallery, Inc | 35 | ||||
| 2,427 | * | NetFlix, Inc | 30 | |||
| 929 | * | Reading International, Inc | 8 | |||
| 2,864 | Regal Entertainment Group (Class A) | 59 | ||||
| 305,477 | * | Time Warner, Inc | 5,938 | |||
| 143,033 | Walt Disney Co | 3,976 | ||||
TOTAL MOTION PICTURES | 12,554 | |||||
| NONDEPOSITORY INSTITUTIONS - 2.38% | ||||||
| 1,136 | * | Accredited Home Lenders Holding Co | 56 | |||
| 1,625 | Advanta Corp (Class A) | 37 | ||||
| 4,692 | American Capital Strategies Ltd | 156 | ||||
| 78,431 | American Express Co | 4,421 | ||||
| 10,952 | * | AmeriCredit Corp | 268 | |||
| 645 | Asta Funding, Inc | 17 | ||||
| 919 | Beverly Hills Bancorp, Inc | 9 | ||||
| 16,064 | Capital One Financial Corp | 1,353 | ||||
| 4,471 | * | CapitalSource, Inc | 115 | |||
| 2,774 | CharterMac | 68 | ||||
| 13,962 | CIT Group, Inc | 640 | ||||
| 1,233 | * | CompuCredit Corp | 34 | |||
| 37,899 | Countrywide Financial Corp | 1,403 | ||||
| 962 | * | Credit Acceptance Corp | 24 | |||
| 5,925 | Doral Financial Corp | 292 | ||||
| 843 | * | Encore Capital Group, Inc | 20 | |||
| 67,559 | Fannie Mae | 4,811 | ||||
| 591 | Federal Agricultural Mortgage Corp (Class C) | 14 | ||||
| 1,081 | Financial Federal Corp | 42 | ||||
| 815 | * | First Cash Financial Services, Inc | 22 | |||
| 1,222 | * | First Marblehead Corp | 69 | |||
| 48,547 | Freddie Mac | 3,578 | ||||
| 77,256 | MBNA Corp | 2,178 | ||||
| 1,954 | MCG Capital Corp | 33 | ||||
| 2,453 | * | Metris Cos, Inc | 31 | |||
| 563 | * | Nelnet, Inc | 15 | |||
| 20,239 | * | Providian Financial Corp | 333 | |||
| 29,446 | SLM Corp | 1,572 | ||||
| 300 | Student Loan Corp | 55 | ||||
| 265 | * | United PanAm Financial Corp | 5 | |||
| 1,585 | Westcorp | 73 | ||||
| 825 | * | WFS Financial, Inc | 42 | |||
| 1,332 | * | World Acceptance Corp | 37 | |||
TOTAL NONDEPOSITORY INSTITUTIONS | 21,823 | |||||
48
Table of Contents
TIAA Stock Index Account
| SHARES/PRINCIPAL | VALUE (000) | |||||
| NONMETALLIC MINERALS, EXCEPT FUELS - 0.04% | ||||||
| 1,482 | Amcol International Corp | 30 | ||||
| 1,049 | Compass Minerals International, Inc | 25 | ||||
| 6,476 | Vulcan Materials Co | 354 | ||||
TOTAL NONMETALLIC MINERALS, EXCEPT FUELS | 409 | |||||
| OIL AND GAS EXTRACTION - 1.80% | ||||||
| 17,689 | Anadarko Petroleum Corp | 1,146 | ||||
| 22,928 | Apache Corp | 1,159 | ||||
| 673 | * | Atwood Oceanics, Inc | 35 | |||
| 1,300 | Berry Petroleum Co (Class A) | 62 | ||||
| 10,560 | BJ Services Co | 491 | ||||
| 3,742 | * | Brigham Exploration Co | 34 | |||
| 28,520 | Burlington Resources, Inc | 1,241 | ||||
| 2,286 | Cabot Oil & Gas Corp (Class A) | 101 | ||||
| 2,656 | * | Cal Dive International, Inc | 108 | |||
| 871 | * | Callon Petroleum Co | 13 | |||
| 1,312 | * | Cheniere Energy, Inc | 84 | |||
| 18,535 | Chesapeake Energy Corp | 306 | ||||
| 2,899 | * | Cimarex Energy Co | 110 | |||
| 1,132 | * | Clayton Williams Energy, Inc | 26 | |||
| 2,411 | * | Comstock Resources, Inc | 53 | |||
| 2,903 | * | Delta Petroleum Corp | 46 | |||
| 3,800 | * | Denbury Resources, Inc | 104 | |||
| 32,264 | Devon Energy Corp | 1,256 | ||||
| 3,430 | Diamond Offshore Drilling, Inc | 137 | ||||
| 900 | * | Edge Petroleum Corp | 13 | |||
| 1,558 | * | Encore Acquisition Co | 54 | |||
| 2,680 | * | Energy Partners Ltd | 54 | |||
| 10,449 | ENSCO International, Inc | 332 | ||||
| 7,854 | EOG Resources, Inc | 560 | ||||
| 3,190 | * | Forest Oil Corp | 101 | |||
| 14 | * | Forest Oil Corp Wts 02/15/05 | 0 | |||
| 4,058 | * | FX Energy, Inc | 47 | |||
| 4,627 | * | Global Industries Ltd | 38 | |||
| 12,950 | * | Grey Wolf, Inc | 68 | |||
| 5,339 | * | Hanover Compressor Co | 75 | |||
| 2,496 | * | Harvest Natural Resources, Inc | 43 | |||
| 3,449 | Helmerich & Payne, Inc | 117 | ||||
| 997 | * | Houston Exploration Co | 56 | |||
| 3,398 | b* | KCS Energy, Inc | 50 | |||
| 9,284 | Kerr-McGee Corp | 537 | ||||
| 8,798 | * | Key Energy Services, Inc | 104 | |||
| 5,999 | * | Magnum Hunter Resources, Inc | 77 | |||
| 422 | * | Magnum Hunter Resources, Inc Wts 03/21/05 | 0 | |||
| 22,845 | Marathon Oil Corp | 859 | ||||
| 2,192 | * | McMoRan Exploration Co | 41 | |||
| 6,041 | * | Meridian Resource Corp | 37 | |||
| 2,820 | * | Mission Resources Corp | 16 | |||
| 3,919 | * | Newfield Exploration Co | 231 | |||
| 5,171 | * | Newpark Resources, Inc | 27 | |||
| 4,239 | Noble Energy, Inc | 261 | ||||
| 27,296 | Occidental Petroleum Corp | 1,593 | ||||
| 1,600 | * | Oceaneering International, Inc | 60 | |||
49
Table of Contents
TIAA Stock Index Account
| SHARES/PRINCIPAL | VALUE (000) | |||||
| 6,555 | * | Parker Drilling Co | 26 | |||
| 4,903 | Patina Oil & Gas Corp | 184 | ||||
| 11,748 | Patterson-UTI Energy, Inc | 228 | ||||
| 1,148 | Penn Virginia Corp | 47 | ||||
| 361 | v* | PetroCorp, Inc (Escrow) | 0 | |||
| 1,700 | * | Petroleum Development Corp | 66 | |||
| 9,524 | Pioneer Natural Resources Co | 334 | ||||
| 5,352 | * | Plains Exploration & Production Co | 139 | |||
| 4,439 | Pogo Producing Co | 215 | ||||
| 7,574 | * | Pride International, Inc | 156 | |||
| 2,300 | * | Quicksilver Resources, Inc | 85 | |||
| 4,695 | Range Resources Corp | 96 | ||||
| 1,410 | * | Remington Oil & Gas Corp | 38 | |||
| 7,354 | Rowan Cos, Inc | 190 | ||||
| 700 | RPC, Inc | 18 | ||||
| 1,290 | * | Seacor Smit, Inc | 69 | |||
| 2,600 | * | Southwestern Energy Co | 132 | |||
| 1,665 | * | Spinnaker Exploration Co | 58 | |||
| 1,900 | St. Mary Land & Exploration Co | 79 | ||||
| 1,545 | * | Stone Energy Corp | 70 | |||
| 3,300 | * | Superior Energy Services, Inc | 51 | |||
| 2,600 | * | Swift Energy Co | 75 | |||
| 1,951 | * | Syntroleum Corp | 16 | |||
| 1,410 | * | Tetra Technologies, Inc | 40 | |||
| 4,219 | Tidewater, Inc | 150 | ||||
| 838 | * | Todco | 15 | |||
| 1,143 | * | Transmontaigne, Inc | 7 | |||
| 2,600 | * | Unit Corp | 99 | |||
| 19,069 | Unocal Corp | 825 | ||||
| 6,742 | * | Varco International, Inc | 197 | |||
| 2,260 | * | Veritas DGC, Inc | 51 | |||
| 3,500 | Vintage Petroleum, Inc | 79 | ||||
| 1,475 | * | W-H Energy Services, Inc | 33 | |||
| 1,935 | * | Whiting Petroleum Corp | 59 | |||
| 17,506 | XTO Energy, Inc | 619 | ||||
TOTAL OIL AND GAS EXTRACTION | 16,509 | |||||
| PAPER AND ALLIED PRODUCTS - 0.71% | ||||||
| 6,800 | Bemis Co | 198 | ||||
| 3,865 | Bowater, Inc | 170 | ||||
| 1,676 | * | Buckeye Technologies, Inc | 22 | |||
| 1,977 | * | Caraustar Industries, Inc | 33 | |||
| 1,356 | Chesapeake Corp | 37 | ||||
| 1,270 | Glatfelter | 19 | ||||
| 4,634 | * | Graphic Packaging Corp | 33 | |||
| 900 | Greif, Inc (Class A) | 50 | ||||
| 33,895 | International Paper Co | 1,424 | ||||
| 35,489 | Kimberly-Clark Corp | 2,336 | ||||
| 3,700 | Longview Fibre Co | 67 | ||||
| 14,155 | MeadWestvaco Corp | 480 | ||||
| 1,075 | Neenah Paper, Inc | 35 | ||||
| 6,093 | OfficeMax, Inc | 191 | ||||
| 3,866 | Packaging Corp of America | 91 | ||||
| 10,687 | * | Pactiv Corp | 270 | |||
50
Table of Contents
TIAA Stock Index Account
| SHARES/PRINCIPAL | VALUE (000) | |||||
| 1,900 | * | Playtex Products, Inc | 15 | |||
| 1,124 | Pope & Talbot, Inc | 19 | ||||
| 1,966 | Potlatch Corp | 99 | ||||
| 1,110 | Rock-Tenn Co (Class A) | 17 | ||||
| 1,040 | Schweitzer-Mauduit International, Inc | 35 | ||||
| 16,753 | * | Smurfit-Stone Container Corp | 313 | |||
| 6,175 | Sonoco Products Co | 183 | ||||
| 3,848 | Temple-Inland, Inc | 263 | ||||
| 3,174 | Wausau-Mosinee Paper Corp | 57 | ||||
TOTAL PAPER AND ALLIED PRODUCTS | 6,457 | |||||
| PERSONAL SERVICES - 0.17% | ||||||
| 2,872 | b* | Alderwoods Group, Inc | 33 | |||
| 620 | Angelica Corp | 17 | ||||
| 8,436 | Cintas Corp | 370 | ||||
| 1,567 | * | Coinstar, Inc | 42 | |||
| 1,405 | G & K Services, Inc (Class A) | 61 | ||||
| 11,391 | H & R Block, Inc | 558 | ||||
| 2,700 | Jackson Hewitt Tax Service, Inc | 68 | ||||
| 3,015 | Regis Corp | 139 | ||||
| 22,000 | * | Service Corp International | 164 | |||
| 587 | Unifirst Corp | 17 | ||||
| 2,838 | * | Weight Watchers International, Inc | 117 | |||
TOTAL PERSONAL SERVICES | 1,586 | |||||
| PETROLEUM AND COAL PRODUCTS - 4.22% | ||||||
| 5,381 | Amerada Hess Corp | 443 | ||||
| 4,892 | Ashland, Inc | 286 | ||||
| 148,156 | ChevronTexaco Corp | 7,780 | ||||
| 48,023 | ConocoPhillips | 4,170 | ||||
| 1,450 | ElkCorp | 50 | ||||
| 452,891 | ExxonMobil Corp | 23,215 | ||||
| 1,879 | Frontier Oil Corp | 50 | ||||
| 738 | * | Giant Industries, Inc | 20 | |||
| 2,333 | * | Headwaters, Inc | 66 | |||
| 1,378 | Holly Corp | 38 | ||||
| 3,500 | Lubrizol Corp | 129 | ||||
| 14,067 | Lyondell Chemical Co | 407 | ||||
| 5,282 | Murphy Oil Corp | 425 | ||||
| 2,701 | Premcor, Inc | 114 | ||||
| 5,253 | Sunoco, Inc | 429 | ||||
| 4,554 | * | Tesoro Corp | 145 | |||
| 17,896 | Valero Energy Corp | 812 | ||||
| 1,100 | WD-40 Co | 31 | ||||
TOTAL PETROLEUM AND COAL PRODUCTS | 38,610 | |||||
| PRIMARY METAL INDUSTRIES - 0.58% | ||||||
| 7,555 | * | AK Steel Holding Corp | 109 | |||
| 60,359 | Alcoa, Inc | 1,896 | ||||
| 948 | * | Aleris International, Inc | 16 | |||
| 6,601 | Allegheny Technologies, Inc | 143 | ||||
| 11,167 | * | Andrew Corp | 152 | |||
| 3,299 | Belden CDT, Inc | 77 | ||||
| 1,200 | * | Brush Engineered Materials, Inc | 22 | |||
51
Table of Contents
TIAA Stock Index Account
| SHARES/PRINCIPAL | VALUE (000) | |||||
| 1,463 | Carpenter Technology Corp | 86 | ||||
| 1,235 | * | Century Aluminum Co | 32 | |||
| 3,800 | * | CommScope, Inc | 72 | |||
| 978 | Curtiss-Wright Corp | 56 | ||||
| 1,440 | * | Encore Wire Corp | 19 | |||
| 7,713 | Engelhard Corp | 237 | ||||
| 2,400 | * | General Cable Corp | 33 | |||
| 1,633 | Gibraltar Industries, Inc | 39 | ||||
| 1,183 | * | International Steel Group, Inc | 48 | |||
| 2,054 | * | Lone Star Technologies, Inc | 69 | |||
| 1,977 | Matthews International Corp (Class A) | 73 | ||||
| 2,942 | * | Maverick Tube Corp | 89 | |||
| 2,431 | Mueller Industries, Inc | 78 | ||||
| 1,000 | NN, Inc | 13 | ||||
| 1,100 | * | NS Group, Inc | 31 | |||
| 11,218 | Nucor Corp | 587 | ||||
| 2,945 | * | Oregon Steel Mills, Inc | 60 | |||
| 4,370 | Precision Castparts Corp | 287 | ||||
| 1,142 | Quanex Corp | 78 | ||||
| 1,496 | * | RTI International Metals, Inc | 31 | |||
| 1,661 | Ryerson Tull, Inc | 26 | ||||
| 1,362 | Schnitzer Steel Industries, Inc (Class A) | 46 | ||||
| 2,601 | Steel Dynamics, Inc | 99 | ||||
| 697 | Steel Technologies, Inc | 19 | ||||
| 1,500 | Texas Industries, Inc | 94 | ||||
| 455 | * | Titanium Metals Corp | 11 | |||
| 1,864 | Tredegar Corp | 38 | ||||
| 7,875 | United States Steel Corp | 404 | ||||
| 917 | * | Wheeling-Pittsburgh Corp | 35 | |||
| 4,742 | Worthington Industries, Inc | 93 | ||||
TOTAL PRIMARY METAL INDUSTRIES | 5,298 | |||||
| PRINTING AND PUBLISHING - 0.80% | ||||||
| 4,531 | American Greetings Corp (Class A) | 115 | ||||
| 1,700 | Banta Corp | 76 | ||||
| 5,892 | Belo (A.H.) Corp Series A | 155 | ||||
| 2,400 | Bowne & Co, Inc | 39 | ||||
| 734 | * | Consolidated Graphics, Inc | 34 | |||
| 396 | Courier Corp | 21 | ||||
| 300 | CSS Industries, Inc | 10 | ||||
| 3,200 | Dex Media, Inc | 80 | ||||
| 3,382 | Dow Jones & Co, Inc | 146 | ||||
| 1,171 | Ennis, Inc | 23 | ||||
| 4,604 | EW Scripps Co | 222 | ||||
| 17,815 | Gannett Co, Inc | 1,455 | ||||
| 2,000 | Harland (John H.) Co | 72 | ||||
| 3,853 | Harte-Hanks, Inc | 100 | ||||
| 3,730 | Hollinger International, Inc | 58 | ||||
| 1,403 | Journal Communications, Inc | 25 | ||||
| 1,919 | * | Journal Register Co | 37 | |||
| 5,619 | Knight Ridder, Inc | 376 | ||||
| 3,200 | Lee Enterprises, Inc | 147 | ||||
| 600 | * | Martha Stewart Living Omnimedia, Inc (Class A) | 17 | |||
| 1,222 | McClatchy Co (Class A) | 88 | ||||
52
Table of Contents
TIAA Stock Index Account
| SHARES/PRINCIPAL | VALUE (000) | |||||
| 13,349 | McGraw-Hill Cos, Inc | 1,222 | ||||
| 1,658 | Media General, Inc (Class A) | 107 | ||||
| 2,746 | Meredith Corp | 149 | ||||
| 10,201 | New York Times Co (Class A) | 416 | ||||
| 945 | * | Playboy Enterprises, Inc (Class B) | 12 | |||
| 9,402 | * | Primedia, Inc | 36 | |||
| 639 | Pulitzer, Inc | 41 | ||||
| 13,789 | R.R. Donnelley & Sons Co | 487 | ||||
| 6,850 | Reader’s Digest Association, Inc (Class A) | 95 | ||||
| 2,073 | * | Scholastic Corp | 77 | |||
| 1,179 | Standard Register Co | 17 | ||||
| 576 | Thomas Nelson, Inc | 13 | ||||
| 16,370 | Tribune Co | 690 | ||||
| 3,622 | * | Valassis Communications, Inc | 127 | |||
| 397 | Washington Post Co (Class B) | 390 | ||||
| 3,300 | Wiley (John) & Sons, Inc (Class A) | 115 | ||||
TOTAL PRINTING AND PUBLISHING | 7,290 | |||||
| RAILROAD TRANSPORTATION - 0.48% | ||||||
| 56,113 | * | ADC Telecommunications, Inc | 150 | |||
| 26,279 | Burlington Northern Santa Fe Corp | 1,243 | ||||
| 14,970 | CSX Corp | 600 | ||||
| 1,594 | Florida East Coast Industries | 72 | ||||
| 1,252 | * | Genesee & Wyoming, Inc (Class A) | 35 | |||
| 4,150 | * | Kansas City Southern Industries, Inc | 74 | |||
| 27,643 | Norfolk Southern Corp | 1,000 | ||||
| 18,043 | Union Pacific Corp | 1,213 | ||||
TOTAL RAILROAD TRANSPORTATION | 4,387 | |||||
| REAL ESTATE - 0.09% | ||||||
| 310 | * | Avatar Holdings, Inc | 15 | |||
| 6,147 | Catellus Development Corp | 188 | ||||
| 800 | * | CB Richard Ellis Group, Inc | 27 | |||
| 378 | Consolidated-Tomoka Land Co | 16 | ||||
| 400 | b* | Crescent Operating, Inc | 0 | |||
| 2,193 | Forest City Enterprises, Inc (Class A) | 126 | ||||
| 2,179 | * | Jones Lang LaSalle, Inc | 82 | |||
| 1,600 | LNR Property Corp | 101 | ||||
| 900 | * | Orleans Homebuilders, Inc | 18 | |||
| 2,754 | St. Joe Co | 177 | ||||
| 9,700 | * | Stewart Enterprises, Inc (Class A) | 68 | |||
| 2,118 | * | Trammell Crow Co | 38 | |||
TOTAL REAL ESTATE | 856 | |||||
| RUBBER AND MISCELLANEOUS PLASTIC PRODUCTS - 0.26% | ||||||
| 1,193 | * | Applied Films Corp | 26 | |||
| 2,487 | Aptargroup, Inc | 131 | ||||
| 700 | Bandag, Inc | 35 | ||||
| 4,500 | Cooper Tire & Rubber Co | 97 | ||||
| 623 | * | Deckers Outdoor Corp | 29 | |||
| 10,579 | * | Goodyear Tire & Rubber Co | 155 | |||
| 1,946 | * | Jarden Corp | 85 | |||
| 1,570 | Myers Industries, Inc | 20 | ||||
| 11,774 | Nike, Inc (Class B) | 1,068 | ||||
53
Table of Contents
TIAA Stock Index Account
| SHARES/PRINCIPAL | VALUE (000) | |||||
| 449 | Quixote Corp | 9 | ||||
| 3,656 | Reebok International Ltd | 161 | ||||
| 2,068 | Schulman (A.), Inc | 44 | ||||
| 5,876 | * | Sealed Air Corp | 313 | |||
| 1,100 | * | Skechers U.S.A., Inc (Class A) | 14 | |||
| 1,743 | Spartech Corp | 47 | ||||
| 714 | * | Trex Co, Inc | 37 | |||
| 3,650 | Tupperware Corp | 76 | ||||
TOTAL RUBBER AND MISCELLANEOUS PLASTIC PRODUCTS | 2,347 | |||||
| SECURITY AND COMMODITY BROKERS - 2.08% | ||||||
| 5,277 | A.G. Edwards, Inc | 228 | ||||
| 2,250 | * | Affiliated Managers Group, Inc | 152 | |||
| 15,965 | * | Ameritrade Holding Corp | 227 | |||
| 7,093 | Bear Stearns Cos, Inc | 726 | ||||
| 1,430 | Blackrock, Inc | 110 | ||||
| 73,755 | Charles Schwab Corp | 882 | ||||
| 2,296 | Chicago Mercantile Exchange | 525 | ||||
| 25,401 | * | E*Trade Financial Corp | 380 | |||
| 4,854 | Eaton Vance Corp | 253 | ||||
| 5,631 | Federated Investors, Inc (Class B) | 171 | ||||
| 11,554 | Franklin Resources, Inc | 805 | ||||
| 448 | Gabelli Asset Management, Inc (Class A) | 22 | ||||
| 22,273 | Goldman Sachs Group, Inc | 2,317 | ||||
| 8,390 | * | Instinet Group, Inc | 51 | |||
| 3,414 | * | Investment Technology Group, Inc | 68 | |||
| 4,737 | Investors Financial Services Corp | 237 | ||||
| 16,547 | Janus Capital Group, Inc | 278 | ||||
| 3,529 | Jefferies Group, Inc | 142 | ||||
| 8,064 | * | Knight Trading Group, Inc | 88 | |||
| 3,465 | * | LaBranche & Co, Inc | 31 | |||
| 6,813 | Legg Mason, Inc | 499 | ||||
| 19,038 | Lehman Brothers Holdings, Inc | 1,665 | ||||
| 65,812 | Merrill Lynch & Co, Inc | 3,934 | ||||
| 75,589 | Morgan Stanley | 4,197 | ||||
| 1,526 | Nuveen Investments, Inc | 60 | ||||
| 1,356 | * | Piper Jaffray Cos | 65 | |||
| 3,996 | Raymond James Financial, Inc | 124 | ||||
| 5,241 | SEI Investments Co | 220 | ||||
| 501 | * | Stifel Financial Corp | 10 | |||
| 1,151 | SWS Group, Inc | 25 | ||||
| 7,482 | T Rowe Price Group, Inc | 465 | ||||
| 98 | Value Line, Inc | 4 | ||||
| 5,415 | Waddell & Reed Financial, Inc (Class A) | 129 | ||||
TOTAL SECURITY AND COMMODITY BROKERS | 19,090 | |||||
| SOCIAL SERVICES - 0.01% | ||||||
| 917 | * | Bright Horizons Family Solutions, Inc | 59 | |||
| 1,211 | * | Res-Care, Inc | 18 | |||
TOTAL SOCIAL SERVICES | 77 | |||||
| SPECIAL TRADE CONTRACTORS - 0.04% | ||||||
| 843 | Chemed Corp | 57 | ||||
| 2,673 | * | Comfort Systems U.S.A., Inc | 21 | |||
54
Table of Contents
TIAA Stock Index Account
| SHARES/PRINCIPAL | VALUE (000) | |||||
| 3,450 | * | Dycom Industries, Inc | 105 | |||
| 1,050 | * | EMCOR Group, Inc | 47 | |||
| 2,100 | * | Integrated Electrical Services, Inc | 10 | |||
| 685 | * | Layne Christensen Co | 12 | |||
| 4,974 | * | Matrix Service Co | 40 | |||
| 4,926 | * | Quanta Services, Inc | 39 | |||
TOTAL SPECIAL TRADE CONTRACTORS | 331 | |||||
| STONE, CLAY, AND GLASS PRODUCTS - 0.17% | ||||||
| 532 | Ameron International Corp | 20 | ||||
| 684 | * | Anchor Glass Container Corp | 5 | |||
| 2,068 | Apogee Enterprises, Inc | 28 | ||||
| 1,725 | * | Cabot Microelectronics Corp | 69 | |||
| 962 | CARBO Ceramics, Inc | 66 | ||||
| 93,696 | * | Corning, Inc | 1,103 | |||
| 679 | Eagle Materials, Inc | 59 | ||||
| 648 | Eagle Materials, Inc (Class B) | 55 | ||||
| 2,125 | Florida Rock Industries, Inc | 127 | ||||
| 1,000 | Libbey, Inc | 22 | ||||
| 1,470 | * | U.S. Concrete, Inc | 11 | |||
TOTAL STONE, CLAY, AND GLASS PRODUCTS | 1,565 | |||||
| TOBACCO PRODUCTS - 1.12% | ||||||
| 141,549 | Altria Group, Inc | 8,649 | ||||
| 4,025 | Loews Corp (Carolina Group) | 117 | ||||
| 10,290 | Reynolds American, Inc | 809 | ||||
| 1,760 | Universal Corp (Virginia) | 84 | ||||
| 11,669 | UST, Inc | 561 | ||||
| 1,645 | Vector Group Ltd | 27 | ||||
TOTAL TOBACCO PRODUCTS | 10,247 | |||||
| TRANSPORTATION BY AIR - 0.42% | ||||||
| 5,873 | * | Airtran Holdings, Inc | 63 | |||
| 1,734 | * | Alaska Air Group, Inc | 58 | |||
| 2,003 | * | America West Holdings Corp (Class B) | 13 | |||
| 10,953 | * | AMR Corp | 120 | |||
| 4,581 | * | Continental Airlines, Inc (Class B) | 62 | |||
| 8,490 | * | Delta Air Lines, Inc | 64 | |||
| 2,603 | * | ExpressJet Holdings, Inc | 34 | |||
| 21,136 | FedEx Corp | 2,082 | ||||
| 2,900 | * | FLYi, Inc | 5 | |||
| 1,495 | * | Forward Air Corp | 67 | |||
| 2,150 | * | Frontier Airlines, Inc | 25 | |||
| 6,297 | * | JetBlue Airways Corp | 146 | |||
| 2,151 | * | Mesa Air Group, Inc | 17 | |||
| 5,197 | * | Northwest Airlines Corp | 57 | |||
| 1,365 | * | Offshore Logistics, Inc | 44 | |||
| 347 | * | Republic Airways Holdings, Inc | 5 | |||
| 4,035 | Skywest, Inc | 81 | ||||
| 53,247 | Southwest Airlines Co | 867 | ||||
TOTAL TRANSPORTATION BY AIR | 3,810 | |||||
| TRANSPORTATION EQUIPMENT - 2.56% | ||||||
| 2,761 | * | AAR Corp | 38 | |||
55
Table of Contents
TIAA Stock Index Account
| SHARES/PRINCIPAL | VALUE (000) | |||||
| 545 | * | Aftermarket Technology Corp | 9 | |||
| 2,936 | American Axle & Manufacturing Holdings, Inc | 90 | ||||
| 1,100 | Arctic Cat, Inc | 29 | ||||
| 4,699 | ArvinMeritor, Inc | 105 | ||||
| 6,789 | Autoliv, Inc | 328 | ||||
| 4,473 | * | BE Aerospace, Inc | 52 | |||
| 57,749 | Boeing Co | 2,990 | ||||
| 6,584 | Brunswick Corp | 326 | ||||
| 1,687 | Clarcor, Inc | 92 | ||||
| 1,035 | Coachmen Industries, Inc | 18 | ||||
| 440 | Curtiss-Wright Corp (Class B) | 25 | ||||
| 10,224 | Dana Corp | 177 | ||||
| 35,314 | Delphi Corp | 319 | ||||
| 496 | * | Ducommun, Inc | 10 | |||
| 3,359 | Federal Signal Corp | 59 | ||||
| 3,728 | * | Fleetwood Enterprises, Inc | 50 | |||
| 123,796 | Ford Motor Co | 1,812 | ||||
| 2,751 | * | GenCorp, Inc | 51 | |||
| 13,407 | General Dynamics Corp | 1,402 | ||||
| 32,768 | General Motors Corp | 1,313 | ||||
| 5,539 | Gentex Corp | 205 | ||||
| 12,200 | Genuine Parts Co | 538 | ||||
| 8,131 | Goodrich Corp | 265 | ||||
| 394 | Greenbrier Cos, Inc | 13 | ||||
| 21,206 | Harley-Davidson, Inc | 1,288 | ||||
| 2,622 | * | Hayes Lemmerz International, Inc | 23 | |||
| 785 | Heico Corp | 18 | ||||
| 78 | Heico Corp (Class A) | 1 | ||||
| 58,968 | Honeywell International, Inc | 2,088 | ||||
| 1,612 | Kaman Corp (Class A) | 20 | ||||
| 26,153 | Lockheed Martin Corp | 1,453 | ||||
| 711 | Marine Products Corp | 19 | ||||
| 4,500 | * | Mascotech (Escrow) | 0 | |||
| 1,720 | Monaco Coach Corp | 35 | ||||
| 4,275 | * | Navistar International Corp | 188 | |||
| 441 | Noble International Ltd | 9 | ||||
| 24,744 | Northrop Grumman Corp | 1,345 | ||||
| 2,450 | Oshkosh Truck Corp | 168 | ||||
| 11,908 | Paccar, Inc | 958 | ||||
| 3,200 | Polaris Industries, Inc | 218 | ||||
| 433 | * | Sequa Corp (Class A) | 26 | |||
| 1,755 | * | Sports Resorts International, Inc | 5 | |||
| 500 | Standard Motor Products, Inc | 8 | ||||
| 255 | * | Strattec Security Corp | 16 | |||
| 1,631 | Superior Industries International, Inc | 47 | ||||
| 2,183 | * | Teledyne Technologies, Inc | 64 | |||
| 2,719 | * | Tenneco Automotive, Inc | 47 | |||
| 8,002 | Textron, Inc | 591 | ||||
| 2,800 | Thor Industries, Inc | 104 | ||||
| 2,420 | Trinity Industries, Inc | 82 | ||||
| 1,552 | * | Triumph Group, Inc | 61 | |||
| 1,678 | * | TRW Automotive Holdings Corp | 35 | |||
| 3,244 | * | United Defense Industries, Inc | 153 | |||
| 36,209 | United Technologies Corp | 3,742 |
56
Table of Contents
TIAA Stock Index Account
| SHARES/PRINCIPAL | VALUE (000) | |||||
| 9,045 | Visteon Corp | 88 | ||||
| 1,883 | * | Wabash National Corp | 51 | |||
| 2,761 | Westinghouse Air Brake Technologies Corp | 59 | ||||
| 1,734 | Winnebago Industries, Inc | 68 | ||||
TOTAL TRANSPORTATION EQUIPMENT | 23,394 | |||||
| TRANSPORTATION SERVICES - 0.13% | ||||||
| 400 | Ambassadors Group, Inc | 14 | ||||
| 4,924 | C.H. Robinson Worldwide, Inc | 273 | ||||
| 2,500 | * | EGL, Inc | 75 | |||
| 6,794 | Expeditors International of Washington, Inc | 380 | ||||
| 3,426 | GATX Corp | 101 | ||||
| 905 | * | HUB Group, Inc | 47 | |||
| 872 | * | Navigant International, Inc | 11 | |||
| 1,700 | * | Pacer International, Inc | 36 | |||
| 2,021 | * | RailAmerica, Inc | 26 | |||
| 9,902 | Sabre Holdings Corp | 219 | ||||
TOTAL TRANSPORTATION SERVICES | 1,182 | |||||
| TRUCKING AND WAREHOUSING - 0.51% | ||||||
| 1,500 | Arkansas Best Corp | 67 | ||||
| 3,458 | CNF, Inc | 173 | ||||
| 424 | * | Covenant Transport, Inc (Class A) | 9 | |||
| 3,217 | Heartland Express, Inc | 72 | ||||
| 4,000 | Hunt (J.B.) Transport Services, Inc | 179 | ||||
| 2,128 | * | Landstar System, Inc | 157 | |||
| 635 | * | Marten Transport Ltd | 14 | |||
| 1,145 | * | Old Dominion Freight Line | 40 | |||
| 1,947 | Overnite Corp | 73 | ||||
| 421 | * | P.A.M. Transportation Services | 8 | |||
| 579 | * | Quality Distribution, Inc | 5 | |||
| 900 | * | SCS Transportation, Inc | 21 | |||
| 1,500 | * | Sirva, Inc | 29 | |||
| 4,341 | * | Swift Transportation Co, Inc | 93 | |||
| 400 | * | U.S. Xpress Enterprises, Inc (Class A) | 12 | |||
| 39,148 | United Parcel Service, Inc (Class B) | 3,346 | ||||
| 1,835 | USF Corp | 70 | ||||
| 3,416 | Werner Enterprises, Inc | 77 | ||||
| 3,338 | * | Yellow Roadway Corp | 186 | |||
TOTAL TRUCKING AND WAREHOUSING | 4,631 | |||||
| WATER TRANSPORTATION - 0.04% | ||||||
| 2,785 | Alexander & Baldwin, Inc | 118 | ||||
| 844 | * | Gulfmark Offshore, Inc | 19 | |||
| 421 | * | Hornbeck Offshore Services, Inc | 8 | |||
| 1,507 | * | Kirby Corp | 67 | |||
| 1,962 | Overseas Shipholding Group, Inc | 108 | ||||
| 600 | * | Seabulk International, Inc | 7 | |||
TOTAL WATER TRANSPORTATION | 327 | |||||
| WHOLESALE TRADE-DURABLE GOODS - 1.86% | ||||||
| 384 | * | 1-800 Contacts, Inc | 8 | |||
| 1,100 | Action Performance Cos, Inc | 12 | ||||
57
Table of Contents
TIAA Stock Index Account
| SHARES/PRINCIPAL | VALUE (000) | |||||
| 5,979 | Adesa, Inc | 127 | ||||
| 2,158 | Agilysys, Inc | 37 | ||||
| 839 | * | Alliance Imaging, Inc | 9 | |||
| 2,198 | Anixter International, Inc | 79 | ||||
| 2,071 | Applied Industrial Technologies, Inc | 57 | ||||
| 8,011 | * | Arrow Electronics, Inc | 195 | |||
| 1,206 | * | Audiovox Corp (Class A) | 19 | |||
| 2,154 | * | Aviall, Inc | 49 | |||
| 8,446 | * | Avnet, Inc | 154 | |||
| 1,038 | Barnes Group, Inc | 28 | ||||
| 1,208 | * | BioVeris Corp | 9 | |||
| 3,872 | BorgWarner, Inc | 210 | ||||
| 1,342 | * | Brightpoint, Inc | 26 | |||
| 2,100 | Carlisle Cos, Inc | 136 | ||||
| 4,002 | CDW Corp | 266 | ||||
| 794 | * | Department 56, Inc | 13 | |||
| 1,490 | * | Digi International, Inc | 26 | |||
| 1,525 | * | Global Imaging Systems, Inc | 60 | |||
| 1,800 | Handleman Co | 39 | ||||
| 4,258 | Hughes Supply, Inc | 138 | ||||
| 9,909 | IKON Office Solutions, Inc | 115 | ||||
| 1,091 | * | Imagistics International, Inc | 37 | |||
| 8,393 | * | Ingram Micro, Inc (Class A) | 175 | |||
| 3,362 | * | Insight Enterprises, Inc | 69 | |||
| 715 | * | Insurance Auto Auctions, Inc | 16 | |||
| 547 | * | INTAC International | 7 | |||
| 205,244 | Johnson & Johnson | 13,017 | ||||
| 739 | * | Keystone Automotive Industries, Inc | 17 | |||
| 2,533 | Knight Transportation, Inc | 63 | ||||
| 300 | Lawson Products, Inc | 15 | ||||
| 1,014 | * | LKQ Corp | 20 | |||
| 3,352 | Martin Marietta Materials, Inc | 180 | ||||
| 763 | * | Merge Technologies, Inc | 17 | |||
| 1,224 | Metal Management, Inc | 33 | ||||
| 2,986 | * | Microtek Medical Holdings, Inc | 12 | |||
| 1,454 | * | Navarre Corp | 26 | |||
| 2,729 | Owens & Minor, Inc | 77 | ||||
| 8,950 | * | Patterson Cos, Inc | 388 | |||
| 4,013 | Pep Boys-Manny Moe & Jack | 69 | ||||
| 4,800 | * | PSS World Medical, Inc | 60 | |||
| 1,959 | Reliance Steel & Aluminum Co | 76 | ||||
| 9,000 | * | Safeguard Scientifics, Inc | 19 | |||
| 871 | * | Scansource, Inc | 54 | |||
| 3,706 | SCP Pool Corp | 118 | ||||
| 1,219 | * | TBC Corp | 34 | |||
| 4,029 | * | Tech Data Corp | 183 | |||
| 5,318 | W.W. Grainger, Inc | 354 | ||||
| 1,547 | Watsco, Inc | 54 | ||||
| 1,000 | * | WESCO International, Inc | 30 | |||
| 2,884 | * | Zoran Corp | 33 | |||
TOTAL WHOLESALE TRADE-DURABLE GOODS | 17,065 | |||||
58
Table of Contents
TIAA Stock Index Account
| SHARES/PRINCIPAL | VALUE (000) | ||||||
| WHOLESALE TRADE-NONDURABLE GOODS - 0.73% | |||||||
| 3,000 | Acuity Brands, Inc | 95 | |||||
| 833 | Advanced Marketing Services, Inc | 8 | |||||
| 4,181 | Airgas, Inc | 111 | |||||
| 1,800 | * | Allscripts Healthcare Solutions, Inc | 19 | ||||
| 7,751 | AmerisourceBergen Corp | 455 | |||||
| 4,795 | Brown-Forman Corp (Class B) | 233 | |||||
| 30,538 | Cardinal Health, Inc | 1,776 | |||||
| 702 | * | Central European Distribution Corp | 21 | ||||
| 2,584 | Chiquita Brands International, Inc | 57 | |||||
| 3,045 | DIMON, Inc | 20 | |||||
| 3,261 | * | Endo Pharmaceuticals Holdings, Inc | 69 | ||||
| 793 | Getty Realty Corp | 23 | |||||
| 1,696 | * | Hain Celestial Group, Inc | 35 | ||||
| 3,050 | * | Henry Schein, Inc | 212 | ||||
| 500 | Kenneth Cole Productions, Inc (Class A) | 15 | |||||
| 19,200 | McKesson Corp | 604 | |||||
| 2,069 | * | Men’s Wearhouse, Inc | 66 | ||||
| 1,402 | * | Metals USA, Inc | 26 | ||||
| 785 | Nash Finch Co | 30 | |||||
| 3,652 | Nu Skin Enterprises, Inc (Class A) | 93 | |||||
| 438 | * | Nuco2, Inc | 10 | ||||
| 3,222 | * | Performance Food Group Co | 87 | ||||
| 4,300 | Perrigo Co | 74 | |||||
| 193 | * | Perry Ellis International, Inc | 4 | ||||
| 84 | f.v* | Priority Healthcare Corp (Class A) | 2 | ||||
| 2,341 | * | Priority Healthcare Corp (Class B) | 51 | ||||
| 303 | * | Provide Commerce, Inc | 11 | ||||
| 1,702 | Russell Corp | 33 | |||||
| 1,320 | * | School Specialty, Inc | 51 | ||||
| 900 | * | Smart & Final, Inc | 13 | ||||
| 803 | Standard Commercial Corp | 16 | |||||
| 2,696 | Stride Rite Corp | 30 | |||||
| 9,074 | Supervalu, Inc | 313 | |||||
| 45,584 | Sysco Corp | 1,750 | |||||
| 2,162 | * | Tractor Supply Co | 80 | ||||
| 2,582 | * | United Natural Foods, Inc | 80 | ||||
| 2,061 | * | United Stationers, Inc | 95 | ||||
TOTAL WHOLESALE TRADE-NONDURABLE GOODS | 6,668 | ||||||
TOTAL COMMON STOCKS (Cost $709,275) | 911,390 | ||||||
| SHORT TERM INVESTMENTS - 0.27% | |||||||
| U.S. GOVERNMENT AND AGENCIES DISCOUNT NOTES - 0.27% | |||||||
| $2,500,000 | d | Federal Home Loan Bank (FHLB) 1.900%, 01/12/05 | |||||
TOTAL U.S. GOVERNMENT AND AGENCIES DISCOUNT NOTES | 2,498 | ||||||
TOTAL SHORT TERM INVESTMENTS | |||||||
(Cost $2,498) | 2,498 | ||||||
TOTAL PORTFOLIO - 99.83% | |||||||
(Cost $711,810) | 913,939 | ||||||
OTHER ASSETS AND LIABILITIES, NET - 0.17% | 1,539 | ||||||
NET ASSETS - 100.00% | $ | 915,478 | |||||
59
Table of Contents
TIAA Stock Index Account
| * | Non-income producing |
| b | In bankruptcy |
| d | All or a portion of these securities have been segregated by the custodian to cover margin or other requirements on open futures contracts. |
| f | Restricted securities - Investment in securities not registered under the Securities Act of 1933 or not publicly traded in foreign markets. At December 31, 2004, the value of these securities amounted to $44,000 or 0.01% of net assets. |
| v | Security valued at fair value. |
For ease of presentation, we have grouped a number of classification categories together in the Statement of Investments. Note that the Account uses more specific industry categories in following its investment limitations on industry concentration.
Restricted securities held by the Account are as follows:
SECURITY | ACQUISITION DATE | ACQUISITION COST | VALUE | |||||
McLeod (Escrow) | 05/14/02 | $ | — | $ | — | |||
National Health Investors, Inc | 01/10/01 | 10,000 | 42,000 | |||||
Priority Healthcare Corp (Class A) | 01/04/99 | 1,148 | 2,000 | |||||
Wiltel Communications Group (Rts) | 12/04/03 | — | 0 | |||||
| $ | 11,148 | $ | 44,000 | |||||
60
Table of Contents
| Item 11. | Controls and Procedures. |
(a) Evaluation of disclosure controls and procedures. An evaluation was performed within 90 days from the date hereof under the supervision of the registrant’s management, including the principal executive officer and principal financial officer, of the effectiveness of the design and operation of the registrant’s disclosure controls and procedures. Based on that evaluation, the registrant’s management, including the principal executive officer and principal financial officer, concluded that the registrant’s disclosure controls and procedures were effective for this annual reporting period.
(b) Changes in internal controls. During the fourth quarter of 2004, certain policies, procedures and controls were implemented in TIAA-CREF’s information technology areas. These changes involved improved documentation, communication, training, and compliance monitoring over IT general controls and are intended to enhance IT processes, including those that support preparation of the financial statements. Efforts to ensure compliance with these policies are currently underway.
| Item 12. | Exhibits. |
12(a)(1) Code of Ethics (EX-99.CODE ETH)
12(a)(2)(i) Section 302 certification of the principal executive officer (EX-99.CERT)
12(a)(2)(ii) Section 302 certification of the principal financial officer (EX-99.CERT)
12(b) Section 906 certification.(EX-99.906CERT)
Table of Contents
SIGNATURES
Pursuant to the requirements of the Securities Exchange Act of 1934 and the Investment Company Act of 1940, the registrant has duly caused this report to be signed on its behalf by the undersigned, thereunto duly authorized.
TIAA SEPARATE ACCOUNT VA-1 | ||||||||
| Date: March 7, 2005 | By: | /s/ Bertram L. Scott | ||||||
Bertram L. Scott Executive Vice President | ||||||||
Pursuant to the requirements of the Securities Exchange Act of 1934 and the Investment Company Act of 1940, this report has been signed below by the following persons on behalf of the registrant and in the capacities and on the dates indicated.
| Date: March 7, 2005 | By: | /s/ Bertram L. Scott | ||||||
Bertram L. Scott Executive Vice President (principal executive officer) | ||||||||
| Date: March 7, 2005 | By: | /s/ Elizabeth A. Monrad | ||||||
Elizabeth A. Monrad Executive Vice President (principal financial officer) | ||||||||
Table of Contents
EXHIBIT LIST
| Item 12. | Exhibits. |
12(a)(1) Code of Ethics (EX-99.CODE ETH)
12(a)(2)(i) Section 302 certification of the principal executive officer (EX-99.CERT)
12(a)(2)(ii) Section 302 certification of the principal financial officer (EX-99.CERT)
12(b) Section 906 certification (EX-99.906CERT)