 Analyst Presentation May 2006 100 years Exhibit 99.1 |
Safe Harbor Statement
THIS PRESENTATION, INCLUDING ALL DOCUMENTS INCORPORATED HEREIN BY REFERENCE, CONTAINS FORWARD-LOOKING STATEMENTS. ADDITIONAL WRITTEN OR ORAL FORWARD-LOOKING STATEMENTS MAY BE MADE BY THE COMPANY FROM TIME TO TIME IN FILINGS WITH THE SECURITIES AND EXCHANGE COMMISSION OR OTHERWISE. THE WORDS “BELIEVE”, “EXPECT”, “SEEK”, AND “INTEND” AND SIMILAR EXPRESSIONS IDENTIFY FORWARD-LOOKING STATEMENTS, WHICH SPEAK ONLY AS OF THE DATE THE STATEMENT IS MADE. SUCH FORWARD-LOOKING STATEMENTS ARE WITHIN THE MEANING OF THAT TERM IN SECTION 27A OF THE SECURITIES ACT OF 1933, AS AMENDED, AND SECTION 21E OF THE SECURITIES EXCHANGE ACT OF 1934, AS AMENDED. SUCH STATEMENTS MAY INCLUDE, BUT ARE NOT LIMITED TO, PROJECTIONS OF INCOME OR LOSS, EXPENDITURES, ACQUISITIONS, PLANS FOR FUTURE OPERATIONS, FINANCING NEEDS OR PLANS RELATING TO SERVICES OF THE COMPANY, AS WELL AS ASSUMPTIONS RELATING TO THE FOREGOING. FORWARD-LOOKING STATEMENTS ARE INHERENTLY SUBJECT TO RISKS AND UNCERTAINTIES, SOME OF WHICH CANNOT BE PREDICTED OR QUANTIFIED. FUTURE EVENTS AND ACTUAL RESULTS COULD DIFFER MATERIALLY FROM THOSE SET FORTH IN, CONTEMPLATED BY OR UNDERLYING THE FORWARD-LOOKING STATEMENTS. A DISCUSSION OF FACTORS THAT COULD CAUSE ACTUAL RESULTS TO DIFFER MATERIALLY FROM THOSE EXPRESSED IN THE FORWARD-LOOKING STATEMENTS IS INCLUDED IN FILINGS WITH THE SECURITIES AND EXCHANGE COMMISSION.

2
Agenda
| • | Overview of Cooperative Bankshares |
| • | Market Area |
| • | Financial Highlights |
| • | Trading Data |
| • | Summary |
3
Overview of Cooperative
Bankshares
 5 $746 million bank holding company headquartered in Wilmington, NC Subsidiaries: Cooperative Bank, Lumina Mortgage Company, CS&L Holdings, Inc., and CS&L Real Estate Trust, Inc. and Cooperative Bankshares Capital Trust I 108-year operating history in Eastern NC Traded on NASDAQ National Market under the symbol “COOP” 20 financial centers and 6 loan offices from Myrtle Beach, SC to Virginia Beach, VA (including Lumina) Who We Are Today |
 6 Cooperative Bank formed in 1898 as a mutual thrift Converted to stock savings bank in 1991 Formed holding company in 1994 Acquired Lumina Mortgage in 2002 Adopted a North Carolina commercial bank charter in 2002 Opened four new financial centers in 2003 (two in December) Issued $15 million of trust preferred securities in 2005 History |
Executive Management
Name | Title | Age | Experience | |||
Frederick Willetts, III | Chairman, President & CEO | 57 | 33 Years | |||
O.C. Burrell, Jr. | Chief Operating Officer | 57 | 35 Years | |||
Todd L. Sammons, CPA | Chief Financial Officer | 44 | 20 Years | |||
Dickson B. Bridger | Mortgage Lending | 45 | 21 Years | |||
7
Market Analysis
Footprint
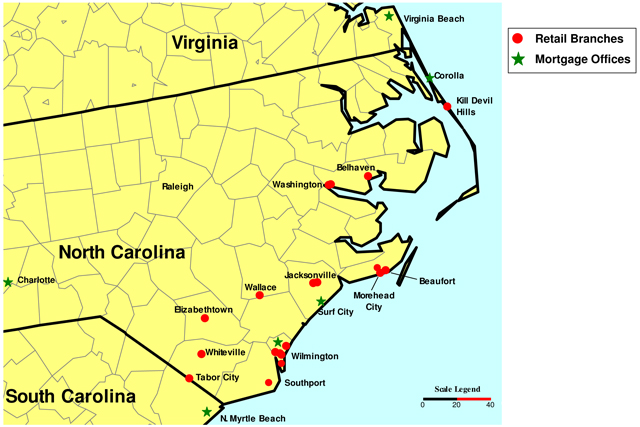
9
 10 Wilmington, NC Southeastern coastal metropolitan area Significant economic benefit of the 1990 expansion of Interstate I-40 to Wilmington Growth in tourism, retirees and housing Attraction of major employers such as PPD, GE, Dupont, Verizon and Corning Largest employer – New Hanover Regional Medical Center (4,600 employees) Nicknamed “Hollywood of the East” the film and TV industry is a major factor in Wilmington’s economic growth Education – UNC-Wilmington is a public university with over 12,000 students Market Analysis Sources: Wilmington Regional Film Commission, Inc. and Wilmingtontoday.com |
Market Analysis
Wilmington, NC
| • | 2005 MSA population of 310,400 |
| • | Ranked among top 5% of MSAs for population growth by percentage (37.2%) from 1990 to 2000 |
| • | Population growth expected to nearly double the national average over the next five years |
| • | Household income up 68% since 1989 |
| • | Total deposits have increased 54% since 2003 |
MSA region includes New Hanover, Brunswick and Pender counties.
Source: U.S. Census data, 2005 and SNL Financial.
11
Financial Highlights
Financial Snapshot
In thousands except per share data, as of December 31, 2005
Total Assets | $ | 746,266 | ||
Total Deposits | $ | 564,990 | ||
Total Equity | $ | 51,096 | ||
LTM Net Income | $ | 5,502 | ||
LTM EPS | $ | 1.26 | ||
Tangible BV/Share | $ | 11.53 | ||
LTM ROA | 0.84 | % | ||
LTM ROE | 11.28 | % | ||
Shares Outstanding (000) | 4,313 | |||
Shareholders | 512 | |||
Insider Control as of 3/1/2006* | 27.37 | % | ||
| * | Includes 214,556 stock options that are immediately exercisable. |
13
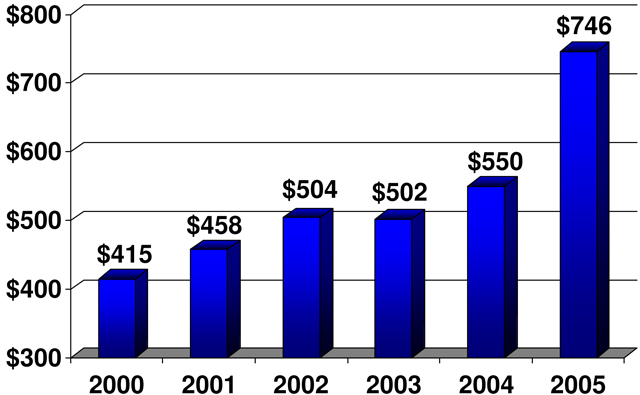
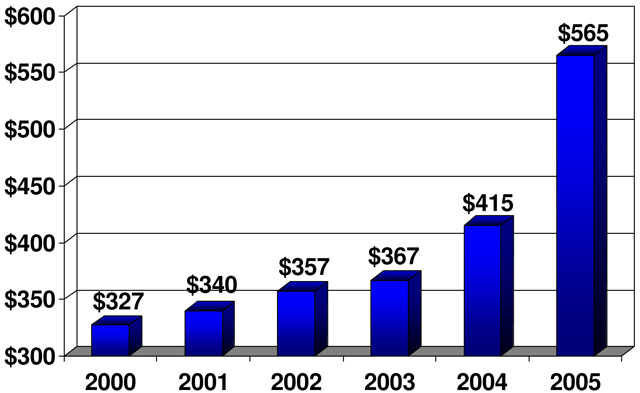
Assets ($Millions)
12.4% compound annual growth
14
Loans ($Millions)
13.1% compound annual growth
15
Loan Composition
| Dec. 2000 | Dec. 2005* | |
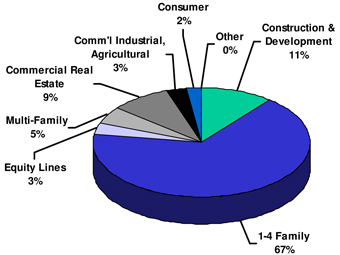 | 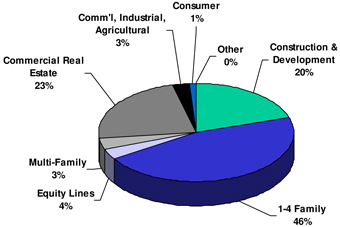 | |
Source: Annual Report data as of December 31, 2000 and December 31, 2005.
| * | Excludes Loans Held for Sale |
16
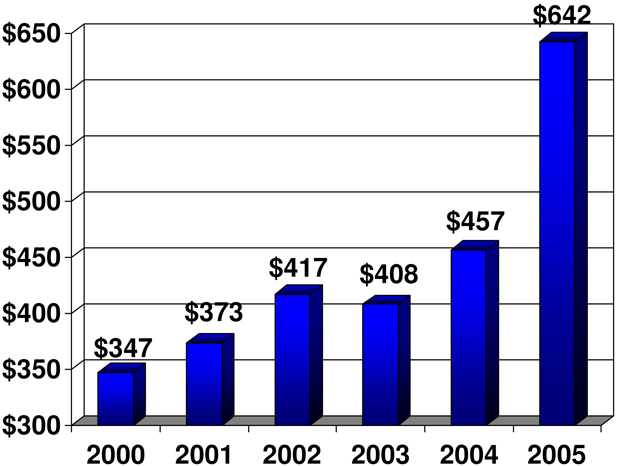
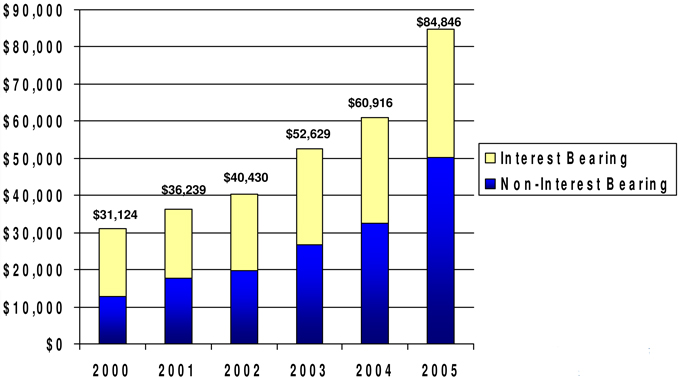
Deposits ($Millions)
11.6% compound annual growth
17
Transaction Accounts ($000s)
22.2% compound annual growth (thru 2005)
18
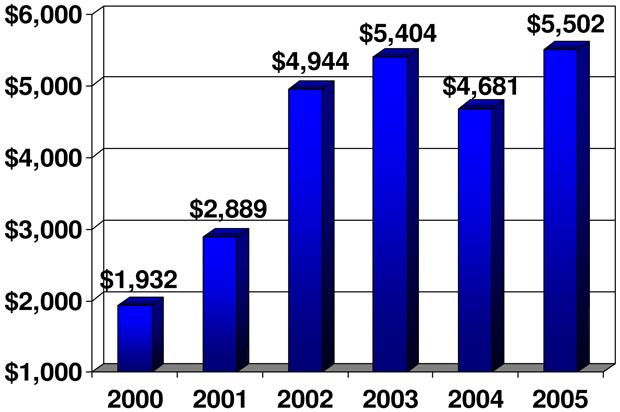
Net Income ($000s)
19
Earnings Per Share*
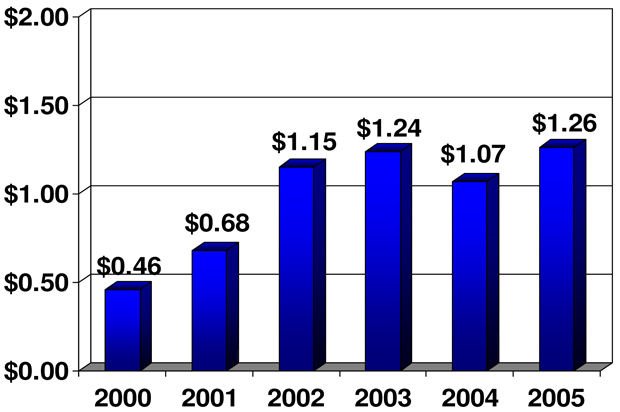
| * | Per share information is computed based on the weighted average number of dilutive shares outstanding, after giving the retroactive effect for the 3-for-2 stock split in the form of a 50% stock dividend announced on January 19, 2005. |
20
 21 Asset Quality 1. Gross Loans do not include Loans Held For Sale. 21,256.0% 2,103.0% 1,290.7% 502.9% 82.2% 312.6% Loan Loss Reserves / Non-Performing Loans 1.04% 0.94% 0.84% 0.70% 0.67% 0.62% Loan Loss Reserves / Total Loans 0.01% 0.01% 0.06% 0.08% 0.03% 0.03% Net Charge Offs / Average Loans 0.00% 0.05% 0.07% 0.15% 0.81% 0.20% Non-Performing Loans / Gross Loans¹ 0.01% 0.04% 0.05% 0.24% 0.84% 0.22% Non-Performing Assets / Total Assets 2005 2004 2003 2002 2001 2000 |
Trading Data
Trading Data
In thousands except per share data, as of December 31, 2005
Stock Price | $ | 20.35 | ||
Market Capitalization | $ | 87,613 | ||
LTM P/E | 16.15 | x | ||
Dividend Yield | 0.98 | % |
23
Stock Performance
COOP - 11/01/2004 - 10/31/2005 Stock Price Performance
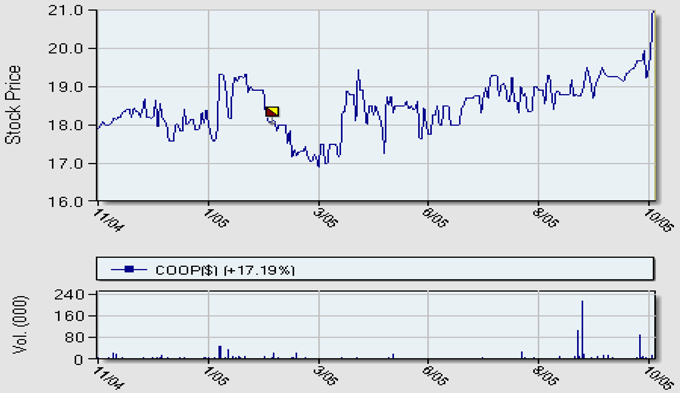
Source: SNL Interactive
24
Summary
Long-Term Strategy
| • | Continue transition to community bank |
| • | Explore acquisitions in existing and adjoining markets |
| • | Continue to increase profitability |
| • | Maintain high asset quality |
26
Reasons to Invest
| • | Experienced management team with knowledge of local markets |
| • | Largest community bank based in Wilmington, NC MSA |
| • | Improved financial performance |
| • | Outstanding asset quality |
| • | LTM P/E multiple of 16.15x represents a discount to median North Carolina banks (18.5x)¹ |
1 - Source: SNL Financial; Pricing data as of 11/2/05.
27