SECURITIES AND EXCHANGE COMMISSION
Washington, D.C. 20549
FORM 6-K
Report of Foreign Private Issuer
Pursuant to Rule 13a -16 or 15d -16 of
the Securities Exchange Act of 1934
Report on Form 6-K dated February 2, 2017
(Commission File No. 1-13202)
Nokia Corporation
Karaportti 3
FI-02610 Espoo
Finland
(Name and address of registrant’s principal executive office)
Indicate by check mark whether the registrant files or will file annual reports under cover of Form 20-F or Form 40-F:
Form 20-F: x |
| Form 40-F: o |
Indicate by check mark if the registrant is submitting the Form 6-K in paper as permitted by Regulation S-T Rule 101(b)(1):
Yes: o |
| No: x |
Indicate by check mark if the registrant is submitting the Form 6-K in paper as permitted by Regulation S-T Rule 101(b)(7):
Yes: o |
| No: x |
Indicate by check mark whether the registrant by furnishing the information contained in this form is also thereby furnishing the information to the Commission pursuant to Rule 12g3-2(b) under the Securities Exchange Act of 1934.
Yes: o |
| No: x |
Enclosures:
Nokia stock exchange release dated February 2, 2017: Nokia Corporation Report for Q4 2016 and Full Year 2016
|
| FINANCIAL STATEMENT RELEASE |
|
|
|
|
| February 2, 2017 |
Nokia Corporation Report for Q4 2016 and Full Year 2016
Operating margin for Nokia’s Networks business at the high end of our guidance range for full year 2016
Nokia Corporation
Financial Statement Release
February 2, 2017 at 08:00 (CET +1)
This is a summary of the Nokia Corporation report for fourth quarter 2016 and full year 2016 published today. The complete fourth quarter 2016 and full year 2016 report with tables is available at www.nokia.com/financials. Investors should not rely on summaries of our interim reports only, but should review the complete reports with tables.
FINANCIAL HIGHLIGHTS
· Non-IFRS net sales in Q4 2016 of EUR 6.7bn (reported: EUR 6.6bn). In the year-ago quarter, non-IFRS net sales would have been EUR 7.7bn on a comparable combined company basis (reported: EUR 3.6bn on a Nokia stand-alone basis).
· Non-IFRS diluted EPS in Q4 2016 of EUR 0.12 (reported: EUR 0.11) benefited by approximately EUR 0.02-0.03 due to the Q4 2016 non-IFRS tax rate coming in at 23% compared to our guidance.
· Non-IFRS diluted EPS in full year 2016 of EUR 0.22 (reported: negative EUR 0.13).
· Nokia’s Board of Directors will propose a dividend of EUR 0.17 per share for 2016 (EUR 0.16 per share for 2015).
Nokia’s Networks business
· 14% year-on-year net sales decrease in Q4 2016, reflecting challenging market conditions in Q4 2016 and the difficult comparison against the strong performance by Alcatel-Lucent in Q4 2015.
· Strong Q4 2016 gross margin of 40.6% and operating margin of 14.1%, supported by continued focus on operational excellence and cost controls.
· Operating margin of 8.9% in full year 2016, at the high end of our guidance range of 7-9%.
Nokia Technologies
· 25% year-on-year net sales decrease and 49% operating profit decrease in Q4 2016, primarily due to the absence of the Samsung arbitration award, which benefited Q4 2015. The declines were partially offset by the expanded intellectual property rights (“IPR”) license agreement with Samsung announced in Q3 2016 and divested IPR. In addition, the acquisition of Withings helped to offset the decline in net sales.
Group Common and Other
· 34% year-on-year net sales increase in Q4 2016, with particularly strong growth in Alcatel Submarine Networks.
Q4 and January-December 2016 non-IFRS results. Refer to note 1 in the Financial statement information for further details (1),(2)
|
|
|
| Combined |
|
|
|
|
|
|
|
|
| Combined |
|
|
|
EUR million |
| Q4’16 |
| historicals(2)Q4’15 |
| YoY |
| Q3’16 |
| QoQ |
| Q1- |
| Q1- |
| YoY |
|
Net sales — constant currency (non-IFRS) |
|
|
|
|
| (13 | )% |
|
| 11 | % |
|
|
|
| (10 | )% |
Net sales (non-IFRS) |
| 6 715 |
| 7 719 |
| (13 | )% | 5 950 |
| 13 | % | 23 945 |
| 26 606 |
| (10 | )% |
Nokia’s Networks business |
| 6 069 |
| 7 057 |
| (14 | )% | 5 322 |
| 14 | % | 21 799 |
| 24 634 |
| (12 | )% |
Ultra Broadband Networks |
| 4 332 |
| 5 081 |
| (15 | )% | 3 903 |
| 11 | % | 15 770 |
| 18 079 |
| (13 | )% |
IP Networks and Applications |
| 1 737 |
| 1 976 |
| (12 | )% | 1 419 |
| 22 | % | 6 029 |
| 6 555 |
| (8 | )% |
Nokia Technologies |
| 309 |
| 413 |
| (25 | )% | 353 |
| (12 | )% | 1 053 |
| 1 074 |
| (2 | )% |
Group Common and Other |
| 341 |
| 254 |
| 34 | % | 298 |
| 14 | % | 1 145 |
| 921 |
| 24 | % |
Gross profit (non-IFRS) |
| 2 818 |
| 3 272 |
| (14 | )% | 2 365 |
| 19 | % | 9 589 |
| 10 441 |
| (8 | )% |
Gross margin % (non-IFRS) |
| 42.0 | % | 42.4 | % | (40 | )bps | 39.7 | % | 230 | bps | 40.0 | % | 39.2 | % | 80 | bps |
Operating profit (non-IFRS) |
| 940 |
| 1 279 |
| (27 | )% | 556 |
| 69 | % | 2 172 |
| 2 887 |
| (25 | )% |
Nokia’s Networks business |
| 854 |
| 1 097 |
| (22 | )% | 432 |
| 98 | % | 1 935 |
| 2 496 |
| (22 | )% |
Ultra Broadband Networks |
| 574 |
| 702 |
| (18 | )% | 326 |
| 76 | % | 1 362 |
| 1 656 |
| (18 | )% |
IP Networks and Applications |
| 280 |
| 396 |
| (29 | )% | 106 |
| 164 | % | 573 |
| 840 |
| (32 | )% |
Nokia Technologies |
| 158 |
| 311 |
| (49 | )% | 225 |
| (30 | )% | 579 |
| 692 |
| (16 | )% |
Group Common and Other |
| (73 | ) | (129 | ) |
|
| (101 | ) |
|
| (341 | ) | (301 | ) |
|
|
Operating margin % (non-IFRS) |
| 14.0 | % | 16.6 | % | (260 | )bps | 9.3 | % | 470 | bps | 9.1 | % | 10.9 | % | (180 | )bps |
Q4 and January-December 2016 reported results, unless otherwise specified. Refer to note 1 in the Financial statement information for further details (1),(3)
EUR million |
|
|
| Nokia |
|
|
|
|
|
|
|
|
| Nokia |
|
|
|
(except for EPS |
| Q4’16 |
| historicals(3)Q4’15 |
| YoY |
| Q3’16 |
| QoQ |
| Q1- |
| Q1- |
| YoY |
|
Net Sales - constant currency |
|
|
|
|
| 84 | % |
|
| 10 | % |
|
|
|
| 89 | % |
Net sales |
| 6 641 |
| 3 609 |
| 84 | % | 5 890 |
| 13 | % | 23 614 |
| 12 499 |
| 89 | % |
Nokia’s Networks business |
| 6 069 |
| 3 210 |
| 89 | % | 5 322 |
| 14 | % | 21 799 |
| 11 486 |
| 90 | % |
Ultra Broadband Networks |
| 4 332 |
| 2 815 |
| 54 | % | 3 903 |
| 11 | % | 15 770 |
| 10 158 |
| 55 | % |
IP Networks and Applications |
| 1 737 |
| 395 |
| 340 | % | 1 419 |
| 22 | % | 6 029 |
| 1 328 |
| 354 | % |
Nokia Technologies |
| 309 |
| 403 |
| (23 | )% | 353 |
| (12 | )% | 1 053 |
| 1 027 |
| 3 | % |
Group Common and Other |
| 341 |
| 0 |
|
|
| 298 |
| 14 | % | 1 145 |
| 0 |
|
|
|
Non-IFRS exclusions |
| (74 | ) | 0 |
|
|
| (60 | ) | 23 | % | (331 | ) | 0 |
|
|
|
Gross profit |
| 2 659 |
| 1 693 |
| 57 | % | 2 216 |
| 20 | % | 8 456 |
| 5 536 |
| 53 | % |
Gross margin % |
| 40.0 | % | 46.9 | % | (690 | )bps | 37.6 | % | 240 | bps | 35.8 | % | 44.3 | % | (850 | )bps |
Operating profit |
| 317 |
| 643 |
| (51 | )% | 55 |
| 476 | % | (1 100 | ) | 1 697 |
|
|
|
Nokia’s Networks business |
| 854 |
| 495 |
| 73 | % | 432 |
| 98 | % | 1 935 |
| 1 349 |
| 43 | % |
Ultra Broadband Networks |
| 574 |
| 405 |
| 42 | % | 326 |
| 76 | % | 1 362 |
| 1 210 |
| 13 | % |
IP Networks and Applications |
| 280 |
| 90 |
| 211 | % | 106 |
| 164 | % | 573 |
| 138 |
| 315 | % |
Nokia Technologies |
| 158 |
| 316 |
| (50 | )% | 225 |
| (30 | )% | 579 |
| 698 |
| (17 | )% |
Group Common and Other |
| (73 | ) | (74 | ) |
|
| (101 | ) |
|
| (341 | ) | (89 | ) |
|
|
Non-IFRS exclusions |
| (622 | ) | (93 | ) | 569 | % | (501 | ) | 24 | % | (3 272 | ) | (261 | ) | 1 154 | % |
Operating margin % |
| 4.8 | % | 17.8 | % | (1 300 | )bps | 0.9 | % | 390 | bps | (4.7 | )% | 13.6 | % | (1 830 | )bps |
Profit (non-IFRS) |
| 676 |
| 575 |
| 18 | % | 264 |
| 156 | % | 1 250 |
| 1 392 |
| (10 | )% |
Profit/(Loss) (4) |
| 658 |
| 499 |
| 32 | % | (133 | ) | (595 | )% | (912 | ) | 1 194 |
|
|
|
EPS, diluted (non-IFRS) |
| 0.12 |
| 0.15 |
| (20 | )% | 0.04 |
| 200 | % | 0.22 |
| 0.36 |
| (39 | )% |
EPS, diluted (4) |
| 0.11 |
| 0.13 |
| (15 | )% | (0.02 | ) | (650 | )% | (0.13 | ) | 0.31 |
|
|
|
Net cash and other liquid assets |
| 5 299 |
| 7 775 |
| (32 | )% | 5 539 |
| (4 | )% | 5 299 |
| 7 775 |
| (32 | )% |
(1)Results are as reported unless otherwise specified. The results information in this report is unaudited. Non-IFRS results exclude costs related to the Alcatel-Lucent transaction and related integration, goodwill impairment charges, intangible asset amortization and purchase price related items, restructuring and associated charges, and certain other items that may not be indicative of Nokia’s underlying business performance. For details, please refer to the Non-IFRS Exclusions section included in discussions of both the quarterly and year to date performance and note 2, “Non-IFRS to reported reconciliation”, in the notes in the Financial statement information in this report. A reconciliation of the Q4 2015 non-IFRS combined company results to the reported results can be found in the “Nokia provides recast segment results for 2015 reflecting new financial reporting structure” stock exchange release published on April 22, 2016. Change in net sales at constant currency excludes the impact of changes
in exchange rates in comparison to Euro, our reporting currency. For more information on currency exposures, please refer to note 1, “Basis of Preparation”, in the Financial statement information section in this report.
(2)Combined company historicals reflect Nokia’s new operating and financial reporting structure, including Alcatel-Lucent, and are presented as additional information as described in the stock exchange release published on April 22, 2016. For more information on the combined company historicals, please refer to note 1, “Basis of Preparation”, in the Financial statement information section in this report.
(3)Nokia standalone historicals are the recasting of Nokia’s historical standalone financial results, reflecting Nokia’s updated segment reporting structure, excluding Alcatel-Lucent. Beginning from the first quarter 2016, Nokia results include those of Alcatel-Lucent on a consolidated basis. Accordingly, Nokia results beginning from the first quarter 2016 are not directly comparable to prior period Nokia standalone results.
(4)Reported Q1-Q4’16 result is not comparable to the reported results published previously due to an update to the Alcatel-Lucent purchase price allocation in Q3’16 which resulted in an adjustment to the reported Q1’16 income tax benefit. Refer to note 6, “Acquisitions”, in the Financial statement information section in this report.
Nokia and Apple patent license renewal
In December 2016, Nokia announced that it had begun filing complaints against Apple, alleging that Apple products infringe Nokia patents. As of today, in actions across 11 countries in Asia, Europe and the US, there are now more than 50 Nokia patents in suit, covering technologies such as display, user interface, software, antenna, chipsets, video coding, as well as 3G & 4G cellular standards. Apple has also filed certain complaints against Nokia.
As one of the world’s leading innovators, and following the acquisition of full ownership of Nokia Siemens Networks in 2013 and Alcatel-Lucent in 2016, Nokia now owns three valuable portfolios of intellectual property. Built on more than EUR 115 billion invested in research and development (“R&D”) over the past twenty years, the tens of thousands of patents cover many important technologies used in smartphones, tablets, personal computers and similar devices.
The previous license agreement between Nokia and Apple, covering some patents from the Nokia Technologies portfolio, expired at the end of 2016 and Apple currently has no license under Nokia patents. Despite sustained efforts by Nokia, Apple has not accepted any licensing offers Nokia has made for the previously licensed patents, as well as for other patented inventions used by many of Apple’s products.
Non-IFRS results provide meaningful supplemental information regarding underlying business performance
In addition to information on our reported IFRS results, we provide certain information on a non-IFRS, or underlying business performance, basis. We believe that our non-IFRS results provide meaningful supplemental information to both management and investors regarding Nokia’s underlying business performance by excluding the below-described items that may not be indicative of Nokia’s business operating results. These non-IFRS financial measures should not be viewed in isolation or as substitutes to the equivalent IFRS measure(s), but should be used in conjunction with the most directly comparable IFRS measure(s) in the reported results.
Non-IFRS results exclude costs related to the Alcatel-Lucent transaction and related integration, goodwill impairment charges, intangible asset amortization and purchase price related items,
restructuring and associated charges, and certain other items that may not be indicative of Nokia’s underlying business performance. The non-IFRS exclusions are not allocated to the segments, and hence they are reported only at the Nokia consolidated level.
Financial discussion
The financial discussion included in this financial report of Nokia’s results comprises the results of Nokia’s businesses — Nokia’s Networks business and Nokia Technologies, as well as Group Common and Other. For more information on the changes to our reportable segments, please refer to note 3, “Segment information and eliminations”, in the Financial statement information section in this financial report.
In the discussion of Nokia’s results in the fourth quarter 2016 comparisons are given to the fourth quarter 2015 and third quarter 2016 results on a combined company basis, unless otherwise indicated. This data has been prepared to reflect the financial results of the continuing operations of Nokia as if the new financial reporting structure had been in operation for the full year 2015. Certain accounting policy alignments, adjustments and reclassifications have been necessary, and these are explained in the “Basis of preparation” section of Nokia’s stock exchange release published on April 22, 2016. These adjustments also include reallocation of items of costs and expenses based on their nature and changes to the definition of the line items in the combined company accounting policies, which also affect numbers presented in this financial report for 2015.
In the discussion of Nokia’s reported results for the fourth quarter 2016 and full year 2016 comparisons are given to the fourth quarter 2015 and full year 2015 Nokia standalone historical results, which have been recast to reflect Nokia’s updated segment reporting structure excluding Alcatel-Lucent, unless otherwise indicated. From the beginning of 2016, Nokia’s results include those of Alcatel-Lucent on a consolidated basis and, accordingly, are not directly comparable to Nokia standalone historical results.
CEO STATEMENT
2016 was a time of transition for Nokia, a year in which we moved forward deliberately and successfully to execute our strategy and broaden our scope.
At the start of the year, Nokia was focused primarily on mobile networks. We ended the year as a company with a complete portfolio spanning mobile, fixed, routing, optical, stand-alone software and more; with solid opportunities to drive higher returns through expansion into new customer segments; with emerging businesses in digital health and digital media; and with greatly expanded patent and brand licensing activities.
Pleasingly, we saw growing customer support for Nokia’s strategy. Our sales pipeline with customers beyond our traditional communication service provider base accelerated over the course of the year, we saw an increasing share of our Networks pipeline coming from opportunities covering products and services from two or more of our business groups, and the potential of cross-selling started to become a reality.
We also ended the year having successfully concluded the integration of Alcatel-Lucent faster than anticipated, allowing us to shift our full focus to cost savings, continuous improvement programs and the execution of our strategy. In terms of financial performance, we were able to deliver solid results for the full year, with profitability in our Networks business coming in at the high end of our guidance range. Our ongoing intense focus on execution, cost management and pricing discipline was critical to offset the impact of challenging market conditions over the course of the year. While I remain disappointed with our topline development in 2016, we continue to expect our performance to improve in 2017 and see the potential for margin expansion in 2017 and beyond, as market conditions improve and our sales transformation programs gain further traction.
In short, we ended 2016 positioned well for the future, with well-integrated operations, a powerful end-to-end portfolio and our disciplined operating model still delivering robust results. In addition, we remain in a position of financial strength, with a strong balance sheet and the flexibility to invest in opportunities that we believe will create shareholder value.
Rajeev Suri
President and CEO
NOKIA IN Q4 2016 — NON-IFRS
Non-IFRS net sales and non-IFRS operating profit
Nokia non-IFRS net sales decreased 13% year-on-year and increased 13% sequentially. On a constant currency basis, Nokia non-IFRS net sales would have decreased 13% year-on-year and increased 11% sequentially.
Year-on-year changes
EUR million, |
| Net |
| % |
| Gross |
| (R&D) |
| (SG&A) |
| Other |
| Operating |
| Change |
|
Networks business |
| (988 | ) | (14 | )% | (364 | ) | 79 |
| 72 |
| (30 | ) | (243 | ) | (140 | )bps |
Nokia Technologies |
| (104 | ) | (25 | )% | (122 | ) | 3 |
| (30 | ) | (3 | ) | (152 | ) | (2 410 | )bps |
Group Common and Other |
| 87 |
| 34 | % | 33 |
| 4 |
| 0 |
| 19 |
| 56 |
| 2 940 | bps |
Eliminations |
| 1 |
|
|
| 0 |
| 0 |
| 0 |
| 0 |
| 0 |
|
|
|
Nokia |
| (1 003 | ) | (13 | )% | (454 | ) | 86 |
| 42 |
| (14 | ) | (340 | ) | (260 | )bps |
Sequential changes
EUR million, |
| Net |
| % |
| Gross |
| (R&D) |
| (SG&A) |
| Other |
| Operating |
| Change |
|
Networks business |
| 747 |
| 14 | % | 484 |
| (50 | ) | (19 | ) | 7 |
| 422 |
| 600 | bps |
Nokia Technologies |
| (45 | ) | (12 | )% | (54 | ) | (4 | ) | (13 | ) | 4 |
| (67 | ) | (1 260 | )bps |
Group Common and Other |
| 43 |
| 14 | % | 23 |
| (3 | ) | 3 |
| 5 |
| 29 |
| 1 250 | bps |
Eliminations |
| 19 |
|
|
| 0 |
| 0 |
| 0 |
| 0 |
| 0 |
|
|
|
Nokia |
| 765 |
| 13 | % | 453 |
| (58 | ) | (29 | ) | 16 |
| 384 |
| 470 | bps |
Non-IFRS financial income and expenses
In the fourth quarter 2016, non-IFRS financial income and expenses was an expense of EUR 72 million. This includes an impairment charge of EUR 63 million related to the performance of certain private funds investing in IPR, which was largely offset by foreign exchange gains mainly resulting from US dollar appreciation against Chinese yuan, as well as gains from venture fund distributions.
Non-IFRS taxes
In the fourth quarter 2016, non-IFRS income taxes were an expense of EUR 204 million. In the fourth quarter 2016, Nokia’s non-IFRS tax rate of 23% was lower than the approximately 40% outlook we previously provided. This was primarily related to two factors. First, there was a favorable change in Nokia’s regional profitability mix, the majority of which was non-recurring in nature and related to a change of estimate in Q4 2016. Second, compared to the expected profitability underlying Nokia’s non-IFRS tax rate guidance, the level of realized profitability was higher, resulting in a lower non-IFRS tax rate due to a relatively larger portion of taxable profit being attributable to tax jurisdictions with lower tax rates.
NOKIA IN Q4 2016 — REPORTED
FINANCIAL DISCUSSION
Net sales
Nokia net sales increased 84% year-on-year, compared to Nokia standalone net sales, and increased 13% sequentially. On a constant currency basis, Nokia net sales would have increased 84% year-on-year, compared to Nokia standalone net sales, and 10% sequentially.
Year-on-year discussion
The year-on-year increase in Nokia net sales in the fourth quarter 2016, compared to Nokia standalone net sales, was primarily due to growth in Nokia’s Networks business and Group Common and Other, both of which primarily related to the acquisition of Alcatel-Lucent. This was partially offset by Nokia Technologies and a purchase price allocation adjustment related to a reduced valuation of deferred revenue that existed on Alcatel-Lucent’s balance sheet at the time of the acquisition.
Sequential discussion
The sequential increase in Nokia net sales in the fourth quarter 2016 was primarily due to growth in Nokia’s Networks business and Group Common and Other. This was partially offset by Nokia Technologies and the negative impact related to a purchase price allocation adjustment associated with a reduced valuation of deferred revenue that existed on Alcatel-Lucent’s balance sheet at the time of the acquisition.
Operating profit
Year-on-year discussion
The year-on-year decrease in Nokia operating profit, compared to Nokia standalone operating profit, was primarily due to higher research and development (“R&D”) expenses, higher selling, general and administrative (“SG&A”) expenses and a net negative fluctuation in other income and expenses, partially offset by higher gross profit, all of which primarily related to the acquisition of Alcatel-Lucent.
The increase in gross profit was primarily due to Nokia’s Networks business and, to a lesser extent, Group Common and Other, partially offset by non-IFRS exclusions related to both product portfolio integration costs and deferred revenue, as well as Nokia Technologies.
The increase in R&D expenses was primarily due to Nokia’s Networks business, non-IFRS exclusions related to both amortization of intangible assets and product portfolio integration costs and, to a lesser extent, Group Common and Other and Nokia Technologies.
The increase in SG&A expenses was primarily due to Nokia’s Networks business, non-IFRS exclusions related to both amortization of intangible assets and transaction and integration related costs and, to a lesser extent, Nokia Technologies and Group Common and Other.
Nokia’s other income and expenses was an expense of EUR 110 million in the fourth quarter 2016, compared to an expense of EUR 3 million in the year-ago period. The net negative fluctuation was primarily related to non-IFRS exclusions attributable to higher restructuring and associated charges, partially offset by the absence of an approximately EUR 20 million loss recorded in the fourth quarter 2015, which related to certain of Nokia’s investments made through its venture funds.
Sequential discussion
Nokia operating profit increased primarily due to higher gross profit, partially offset by a net negative fluctuation in other income and expenses, as well as higher R&D and SG&A expenses.
The increase in gross profit was primarily due to Nokia’s Networks business and, to a lesser extent, Group Common and Other, partially offset by Nokia Technologies and non-IFRS exclusions.
The increase in R&D expenses was primarily due to Nokia’s Networks business.
The increase in SG&A expenses was primarily due to Nokia’s Networks business, non-IFRS exclusions and Nokia Technologies.
Nokia’s other income and expenses was an expense of EUR 110 million in the fourth quarter 2016, compared to an expense of EUR 39 million in the third quarter 2016. The net negative fluctuation was primarily due to higher restructuring and associated charges.
Description of non-IFRS exclusions in Q4 2016
Non-IFRS exclusions consist of costs related to the Alcatel-Lucent transaction and related integration, goodwill impairment charges, intangible asset amortization and purchase price related items, restructuring and associated charges, and certain other items that may not be indicative of Nokia’s underlying business performance. For additional details, please refer to note 2, “Non-IFRS to reported reconciliation, Continuing Operations (unaudited)”, in the Financial statement information section in this financial report.
|
|
|
| Nokia |
| YoY |
|
|
| QoQ |
|
EUR million |
| Q4’16 |
| Q4’15 |
| change |
| Q3’16 |
| change |
|
Net sales |
| (74 | ) | 0 |
|
|
| (60 | ) | 23 | % |
Gross profit |
| (159 | ) | 0 |
|
|
| (149 | ) | 7 | % |
R&D |
| (185 | ) | (9 | ) | 1 956 | % | (179 | ) | 3 | % |
SG&A |
| (162 | ) | (70 | ) | 131 | % | (145 | ) | 12 | % |
Other income and expenses |
| (116 | ) | (14 | ) | 729 | % | (29 | ) | 300 | % |
Operating profit/(loss) |
| (622 | ) | (93 | ) | 569 | % | (501 | ) | 24 | % |
Financial income and expenses |
| 0 |
| 0 |
|
|
| (1 | ) | (100 | )% |
Taxes |
| 605 |
| 17 |
| 3 459 | % | 105 |
| 476 | % |
Profit/(loss) |
| (17 | ) | (76 | ) | (78 | )% | (397 | ) | (96 | )% |
Profit/(loss) attributable to the shareholders of the parent |
| (13 | ) | (76 | ) | (83 | )% | (378 | ) | (97 | )% |
Non-controlling interests |
| (5 | ) | 0 |
|
|
| (20 | ) | (75 | )% |
(1)Nokia standalone historicals are the recasting of Nokia’s historical standalone financial results, reflecting Nokia’s updated segment reporting structure, excluding Alcatel-Lucent. Beginning from the first quarter 2016, Nokia results include those of Alcatel-Lucent on a consolidated basis. Accordingly, Nokia results beginning from the first quarter 2016 are not directly comparable to prior period Nokia standalone results.
Non-IFRS exclusions in net sales
In the fourth quarter 2016, non-IFRS exclusions in net sales amounted to EUR 74 million, and related to a purchase price allocation adjustment related to a reduced valuation of deferred revenue that existed on Alcatel-Lucent’s balance sheet at the time of the acquisition.
Non-IFRS exclusions in operating profit
In the fourth quarter 2016, non-IFRS exclusions in operating profit amounted to EUR 622 million, and were primarily due to non-IFRS exclusions that negatively affected gross profit, R&D, SG&A and other income and expenses as follows:
In the fourth quarter 2016, non-IFRS exclusions in gross profit amounted to EUR 159 million, and were primarily due to product portfolio integration costs related to the acquisition of Alcatel-Lucent, and the deferred revenue.
In the fourth quarter 2016, non-IFRS exclusions in R&D expenses amounted to EUR 185 million, and were primarily due to the amortization of intangible assets resulting from the acquisition of Alcatel-Lucent and, to a lesser extent, product portfolio integration costs related to the acquisition of Alcatel-Lucent.
In the fourth quarter 2016, non-IFRS exclusions in SG&A expenses amounted to EUR 162 million, and were primarily due to the amortization of intangible assets resulting from the acquisition of Alcatel-Lucent, as well as integration and transaction related costs.
In the fourth quarter 2016, non-IFRS exclusions in other income and expenses amounted to EUR 116 million, and were primarily due to EUR 107 million of restructuring and associated charges for Nokia’s cost reduction and efficiency improvement initiatives.
Financial income and expenses
In the fourth quarter 2016, financial income and expenses was an expense of EUR 72 million. This includes an impairment charge of EUR 63 million related to the performance of certain private funds investing in IPR, which was largely offset by foreign exchange gains mainly resulting from US dollar appreciation against Chinese yuan, as well as gains from venture fund distributions.
Taxes
In the fourth quarter 2016, income taxes were a benefit of EUR 401 million. This was primarily related to two factors. First, following the completion of the squeeze-out of the remaining Alcatel-Lucent shares, Nokia has launched actions to integrate the former Alcatel-Lucent and Nokia operating models. In the fourth quarter 2016, in connection with these integration activities, Nokia transferred certain intellectual property to its US operations, recording a tax benefit and additional deferred tax assets of EUR 348 million. Second, for US tax purposes Nokia elected to treat the acquisition of Alcatel-Lucent’s US operations as an asset purchase. The impact of this election was to utilize or forfeit existing deferred tax assets and record new deferred tax assets with a longer amortization period than the life of those forfeited assets. As a result of this, we recorded EUR 91 million of additional deferred tax assets in the fourth quarter 2016. In addition, there was a favorable change in Nokia’s regional profitability mix, the majority of which was non-recurring in nature and related to a change of estimate in the fourth quarter 2016.
Nokia will continue to make changes in its operating model in 2017. Due to this, in full year 2017, Nokia expects to record a reduction in deferred tax assets of approximately EUR 250 million, which
will have a negative non-recurring impact on tax expenses of approximately EUR 250 million, partly offsetting the recorded non-recurring tax benefit of EUR 348 million in the fourth quarter 2016. The operating model changes, including the transfers of intellectual property and certain tax elections that Nokia has made, resulted in non-recurring cash outflows of approximately EUR 90 million in the fourth quarter 2016 and are expected to result in additional non-recurring cash outflows in 2017 of approximately EUR 150 million. The changes are expected to create more future cash tax savings than the additional non-recurring cash tax outflows in 2016 and 2017.
Cost savings program
The following table summarizes the financial information related to our cost savings program, as of the end of the fourth quarter 2016. Balances related to previous Nokia and Alcatel-Lucent restructuring and cost savings programs have been included as part of this overall cost savings program as of the second quarter 2016.
In EUR million, approximately |
| Q4’16 |
|
Opening balance of restructuring and associated liabilities |
| 810 |
|
+ Charges in the quarter |
| 110 |
|
- Cash outflows in the quarter |
| 130 |
|
= Ending balance of restructuring and associated liabilities |
| 790 |
|
of which restructuring provisions |
| 710 |
|
of which other associated liabilities |
| 80 |
|
|
|
|
|
Total expected restructuring and associated charges |
| 1 700 |
|
- Cumulative recorded |
| 750 |
|
= Charges remaining to be recorded |
| 950 |
|
|
|
|
|
Total expected restructuring and associated cash outflows |
| 2 150 |
|
- Cumulative recorded |
| 410 |
|
= Cash outflows remaining to be recorded |
| 1 740 |
|
The following table summarizes our full year 2016 results and future expectations related to our cost savings program and network equipment swaps.
In EUR |
| 2016 |
| 2017 |
| 2018 |
| 2019 |
| Total |
| ||||||
nearest EUR |
| Previous |
| Actual |
| Previous |
| Current |
| Previous |
| Current |
| Current |
| Current |
|
Total cost savings |
| 400 |
| 550 |
| 400 |
| 250 |
| 400 |
| 400 |
| 0 |
| 1 200 |
|
- operating expenses |
| 250 |
| 350 |
| 200 |
| 100 |
| 350 |
| 350 |
| 0 |
| 800 |
|
- cost of sales |
| 150 |
| 200 |
| 200 |
| 150 |
| 50 |
| 50 |
| 0 |
| 400 |
|
Restructuring and associated charges |
| 700 |
| 750 |
| 800 |
| 750 |
| 200 |
| 200 |
| 0 |
| 1 700 |
|
Restructuring and associated cash outflows |
| 500 |
| 400 |
| 700 |
| 750 |
| 500 |
| 550 |
| 450 |
| 2 150 |
|
Charges and cash outflows related to network equipment swaps |
| 300 |
| 150 |
| 300 |
| 450 |
| 300 |
| 300 |
| 0 |
| 900 |
|
In full year 2016, the actual total cost savings benefitted from lower incentive accruals, related to the financial performance in full year 2016. Lower incentive accruals drove more than half of the higher than previously expected decrease in total costs in 2016, and this is expected to reverse in 2017, assuming full year 2017 financial performance in-line with our expectations. On a cumulative basis, Nokia continues to be well on track to achieve the targeted EUR 1.2 billion of total cost savings in full year 2018. To the extent that our actual full year 2016 charges and cash flows deviated from our previous expectations, future expectations have been adjusted accordingly.
OUTLOOK
|
| Metric |
| Guidance |
| Commentary |
Nokia |
| Annual cost savings for Nokia, excluding Nokia Technologies |
| Approximately EUR 1.2 billion of total annual cost savings to be achieved in full year 2018(1) |
| Compared to the combined non-IFRS operating costs of Nokia and Alcatel-Lucent for full year 2015, excluding Nokia Technologies. Nokia expects approximately EUR 800 million of the cost savings to come from operating expenses and approximately EUR 400 million from cost of sales.
Restructuring and associated charges are expected to total approximately EUR 1.7 billion. Restructuring and associated cash outflows are expected to total approximately EUR 2.15 billion. |
|
| Network equipment swaps |
| Approximately EUR 900 million in total(1) |
| The charges related to network equipment swaps are being recorded as non-IFRS exclusions, and therefore do not affect Nokia’s non-IFRS operating profit. |
|
| Non-IFRS financial income and expenses |
| Expense of approximately EUR 300 million in full year 2017 |
| Primarily includes net interest expenses related to interest-bearing liabilities, interest costs related to the defined benefit pension and other post-employment benefit plans, as well as the impact of foreign exchange rate fluctuations on certain balance sheet items. |
|
|
|
|
|
| Nokia expects cash outflows related to financial income and expenses to be approximately EUR 200 million in full year 2017. |
|
| Non-IFRS tax rate |
| Between 30% and 35% for full year 2017(2) |
| Nokia expects its non-IFRS tax rate for full year 2017 to be around the midpoint of the guidance range, with the non-IFRS tax rate for Q1 2017 between 35% and 40%. (This is an update to earlier commentary for the non-IFRS tax rate for full year 2017 to be at the high end of the guidance range.)
Nokia expects cash outflows related to taxes to be approximately EUR 600 million for full year 2017. (This is an update to earlier commentary for cash outflows related to taxes to be approximately EUR 400 million for full year 2017.) |
|
| Capital expenditures |
| Approximately EUR 500 million in full year 2017 |
| Primarily attributable to Nokia’s Networks business. |
|
|
|
|
|
|
|
Nokia’s Networks business |
| Net sales |
| Decline in line with the primary addressable market in full year 2017 |
| Nokia’s outlook for net sales and operating margin for Nokia’s Networks business in full year 2017 are expected to be influenced by factors including: · A low single digit percentage decline in the primary addressable market for Nokia’s Networks business; · Competitive industry dynamics; · Product and regional mix; · The timing of major network deployments; and · Execution of cost savings and reinvestment plans, with operating expenses down on a year-on-year basis. The 2017 outlook for Nokia’s Networks business was provided on November 15, 2016 assuming constant foreign exchange rates. |
|
| Operating margin |
| 8-10% in full year 2017 |
| |
|
|
|
|
| ||
|
|
|
|
|
| |
|
|
|
|
|
| |
|
|
|
|
|
| |
|
|
|
|
|
| |
|
|
|
|
|
| |
|
|
|
|
|
| |
|
|
|
|
|
|
|
Nokia Technologies |
| Net sales |
| Not provided |
| Due to risks and uncertainties in determining the timing and value of significant licensing agreements, Nokia believes it is not appropriate to provide an annual outlook for full year 2017. If no new licensing agreements are signed, the annualized net sales run rate for patent and brand licensing would be approximately EUR 800 million in 2017, representing approximately 30% of the global smartphone market, by value, under license.
Nokia expects total net sales from Digital Health and Digital Media to grow year-on-year in full year 2017, primarily influenced by increased consumer adoption of our Digital Health and Digital Media products. |
(1) For further details related to the cost savings and network equipment swaps guidance, please refer to the “Cost savings program” section above.
(2) For further details related to the tax guidance, please refer to the “Taxes” section above.
RISKS AND FORWARD-LOOKING STATEMENTS
It should be noted that Nokia and its businesses are exposed to various risks and uncertainties and certain statements herein that are not historical facts are forward-looking statements, including, without limitation, those regarding: A) our ability to integrate Alcatel-Lucent into our operations and achieve the targeted business plans and benefits, including targeted synergies in relation to the
acquisition of Alcatel-Lucent; B) expectations, plans or benefits related to our strategies and growth management; C) expectations, plans or benefits related to future performance of our businesses; D) expectations, plans or benefits related to changes in organizational and operational structure; E) expectations regarding market developments, general economic conditions and structural changes; F) expectations and targets regarding financial performance, results, operating expenses, taxes, currency exchange rates, hedging, cost savings and competitiveness, as well as results of operations including targeted synergies and those related to market share, prices, net sales, income and margins; G) timing of the deliveries of our products and services; H) expectations and targets regarding collaboration and partnering arrangements, joint ventures or the creation of joint ventures, as well as our expected customer reach; I) outcome of pending and threatened litigation, arbitration, disputes, regulatory proceedings or investigations by authorities; J) expectations regarding restructurings, investments, uses of proceeds from transactions, acquisitions and divestments and our ability to achieve the financial and operational targets set in connection with any such restructurings, investments, divestments and acquisitions; and K) statements preceded by or including “believe,” “expect,” “anticipate,” “foresee,” “sees,” “target,” “estimate,” “designed,” “aim,” “plans,” “intends,” “focus,” “continue,” “project,” “should,” “will” or similar expressions.
These statements are based on management’s best assumptions and beliefs in light of the information currently available to it. Because they involve risks and uncertainties, actual results may differ materially from the results that we currently expect. Factors, including risks and uncertainties that could cause these differences include, but are not limited to: 1) our ability to execute our strategy, sustain or improve the operational and financial performance of our business and correctly identify and successfully pursue business opportunities or growth; 2) our ability to achieve the anticipated benefits, synergies, cost savings and efficiencies of the Alcatel-Lucent acquisition, and our ability to implement our organizational and operational structure efficiently; 3) general economic and market conditions and other developments in the economies where we operate; 4) competition and our ability to effectively and profitably compete and invest in new competitive high-quality products, services, upgrades and technologies and bring them to market in a timely manner; 5) our dependence on the development of the industries in which we operate, including the cyclicality and variability of the information technology and telecommunications industries; 6) our global business and exposure to regulatory, political or other developments in various countries or regions, including emerging markets and the associated risks in relation to tax matters and exchange controls, among others; 7) our ability to manage and improve our financial and operating performance, cost savings, competitiveness and synergies after the acquisition of Alcatel-Lucent; 8) our dependence on a limited number of customers and large multi-year agreements; 9) exchange rate fluctuations, as well as hedging activities; 10) Nokia Technologies’ ability protect its IPR and to maintain and establish new sources of patent licensing income and IPR-related revenues, particularly in the smartphone market; 11) our dependence on IPR technologies, including those that we have developed and those that are licensed to us, and the risk of associated IPR-related legal claims, licensing costs and restrictions on use; 12) our exposure to direct and indirect regulation, including economic or trade policies, and the reliability of our governance, internal controls and compliance processes to prevent regulatory penalties in our business or in our joint ventures; 13) our reliance on third-party solutions for data storage and service distribution, which expose us to risks relating to security, regulation and cybersecurity breaches; 14) inefficiencies, breaches, malfunctions or disruptions of information technology systems; 15) Nokia Technologies’ ability to generate net sales and profitability through licensing of the Nokia brand, particularly in digital media and digital health, and the development and sales of products and services, as well as other business ventures which may not materialize as
planned; 16) our exposure to various legislative frameworks and jurisdictions that regulate fraud and enforce economic trade sanctions and policies, and the possibility of proceedings or investigation that result in fines, penalties or sanctions; 17) adverse developments with respect to customer financing or extended payment terms we provide to customers; 18) the potential complex tax issues, tax disputes and tax obligations we may face in various jurisdictions, including the risk of obligations to pay additional taxes; 19) our actual or anticipated performance, among other factors, which could reduce our ability to utilize deferred tax assets; 20) our ability to retain, motivate, develop and recruit appropriately skilled employees; 21) disruptions to our manufacturing, service creation, delivery, logistics and supply chain processes, and the risks related to our geographically-concentrated production sites; 22) the impact of litigation, arbitration, agreement-related disputes or product liability allegations associated with our business; 23) our ability to optimize our capital structure as planned and re-establish our investment grade credit rating or otherwise improve our credit ratings; 24) our ability to achieve targeted benefits from or successfully implement planned transactions, as well as the liabilities related thereto; 25) our involvement in joint ventures and jointly-managed companies; 26) the carrying amount of our goodwill may not be recoverable; 27) uncertainty related to the amount of dividends and equity return we are able to distribute to shareholders for each financial period; 28) pension costs, employee fund-related costs, and healthcare costs; and 29) risks related to undersea infrastructure, as well as the risk factors specified on pages 69 to 87 of our annual report on Form 20-F filed on April 1, 2016 under “Operating and financial review and prospects—Risk factors”, and in Nokia’s other filings with the U.S. Securities and Exchange Commission. Other unknown or unpredictable factors or underlying assumptions subsequently proven to be incorrect could cause actual results to differ materially from those in the forward-looking statements. We do not undertake any obligation to publicly update or revise forward-looking statements, whether as a result of new information, future events or otherwise, except to the extent legally required.
The financial statements were authorized for issue by management on February 1, 2017.
Media and Investor Contacts:
Communications, tel. +358 10 448 4900 email: press.services@nokia.com
Investor Relations, tel. +358 4080 3 4080 email: investor.relations@nokia.com
· Nokia plans to publish its “Nokia in 2016” annual report, which includes the review by the Board of Directors and the audited annual accounts, in week 12 of 2017. The annual report will be available at www.nokia.com/financials.
· Nokia plans to publish its first quarter 2017 results on April 27, 2017.
· Nokia’s Annual General Meeting 2017 is planned to be held on May 23, 2017.
· Nokia plans to publish its second quarter and half year 2017 results on July 27, 2017.
· Nokia plans to publish its third quarter 2017 results on October 26, 2017.
![]()
Report for Q4 and Full Year 2016
Operating margin for Nokia’s Networks business at the high end of our guidance range for full year 2016
Financial highlights
· Non-IFRS net sales in Q4 2016 of EUR 6.7bn (reported: EUR 6.6bn). In the year-ago quarter, non-IFRS net sales would have been EUR 7.7bn on a comparable combined company basis (reported: EUR 3.6bn on a Nokia stand-alone basis).
· Non-IFRS diluted EPS in Q4 2016 of EUR 0.12 (reported: EUR 0.11) benefited by approximately EUR 0.02-0.03 due to the Q4 2016 non-IFRS tax rate coming in at 23% compared to our guidance.
· Non-IFRS diluted EPS in full year 2016 of EUR 0.22 (reported: negative EUR 0.13).
· Nokia’s Board of Directors will propose a dividend of EUR 0.17 per share for 2016 (EUR 0.16 per share for 2015).
Nokia’s Networks business
· 14% year-on-year net sales decrease in Q4 2016, reflecting challenging market conditions in Q4 2016 and the difficult comparison against the strong performance by Alcatel-Lucent in Q4 2015.
· Strong Q4 2016 gross margin of 40.6% and operating margin of 14.1%, supported by continued focus on operational excellence and cost controls.
· Operating margin of 8.9% in full year 2016, at the high end of our guidance range of 7-9%.
Nokia Technologies
· 25% year-on-year net sales decrease and 49% operating profit decrease in Q4 2016, primarily due to the absence of the Samsung arbitration award, which benefited Q4 2015. The declines were partially offset by the expanded intellectual property rights (“IPR”) license agreement with Samsung announced in Q3 2016 and divested IPR. In addition, the acquisition of Withings helped to offset the decline in net sales.
Group Common and Other
· 34% year-on-year net sales increase in Q4 2016, with particularly strong growth in Alcatel Submarine Networks.
![]()
February 2, 2017
Q4 and January-December 2016 non-IFRS results. Refer to note 1 in the Financial statement information for further details (1),(2)
EUR million |
| Q4’16 |
| Combined |
| YoY |
| Q3’16 |
| QoQ |
| Q1- |
| Combined |
| YoY |
|
Net sales — constant currency (non-IFRS) |
|
|
|
|
| (13 | )% |
|
| 11 | % |
|
|
|
| (10 | )% |
Net sales (non-IFRS) |
| 6 715 |
| 7 719 |
| (13 | )% | 5 950 |
| 13 | % | 23 945 |
| 26 606 |
| (10 | )% |
Nokia’s Networks business |
| 6 069 |
| 7 057 |
| (14 | )% | 5 322 |
| 14 | % | 21 799 |
| 24 634 |
| (12 | )% |
Ultra Broadband Networks |
| 4 332 |
| 5 081 |
| (15 | )% | 3 903 |
| 11 | % | 15 770 |
| 18 079 |
| (13 | )% |
IP Networks and Applications |
| 1 737 |
| 1 976 |
| (12 | )% | 1 419 |
| 22 | % | 6 029 |
| 6 555 |
| (8 | )% |
Nokia Technologies |
| 309 |
| 413 |
| (25 | )% | 353 |
| (12 | )% | 1 053 |
| 1 074 |
| (2 | )% |
Group Common and Other |
| 341 |
| 254 |
| 34 | % | 298 |
| 14 | % | 1 145 |
| 921 |
| 24 | % |
Gross profit (non-IFRS) |
| 2 818 |
| 3 272 |
| (14 | )% | 2 365 |
| 19 | % | 9 589 |
| 10 441 |
| (8 | )% |
Gross margin % (non-IFRS) |
| 42.0 | % | 42.4 | % | (40 | )bps | 39.7 | % | 230 | bps | 40.0 | % | 39.2 | % | 80 | bps |
Operating profit (non-IFRS) |
| 940 |
| 1 279 |
| (27 | )% | 556 |
| 69 | % | 2 172 |
| 2 887 |
| (25 | )% |
Nokia’s Networks business |
| 854 |
| 1 097 |
| (22 | )% | 432 |
| 98 | % | 1 935 |
| 2 496 |
| (22 | )% |
Ultra Broadband Networks |
| 574 |
| 702 |
| (18 | )% | 326 |
| 76 | % | 1 362 |
| 1 656 |
| (18 | )% |
IP Networks and Applications |
| 280 |
| 396 |
| (29 | )% | 106 |
| 164 | % | 573 |
| 840 |
| (32 | )% |
Nokia Technologies |
| 158 |
| 311 |
| (49 | )% | 225 |
| (30 | )% | 579 |
| 692 |
| (16 | )% |
Group Common and Other |
| (73 | ) | (129 | ) |
|
| (101 | ) |
|
| (341 | ) | (301 | ) |
|
|
Operating margin % (non-IFRS) |
| 14.0 | % | 16.6 | % | (260 | )bps | 9.3 | % | 470 | bps | 9.1 | % | 10.9 | % | (180 | )bps |
Q4 and January-December 2016 reported results, unless otherwise specified. Refer to note 1 in the Financial statement information for further details (1),(3)
EUR million (except for EPS |
| Q4’16 |
| Nokia |
| YoY |
| Q3’16 |
| QoQ |
| Q1- |
| Nokia |
| YoY |
|
Net Sales - constant currency |
|
|
|
|
| 84 | % |
|
| 10 | % |
|
|
|
| 89 | % |
Net sales |
| 6 641 |
| 3 609 |
| 84 | % | 5 890 |
| 13 | % | 23 614 |
| 12 499 |
| 89 | % |
Nokia’s Networks business |
| 6 069 |
| 3 210 |
| 89 | % | 5 322 |
| 14 | % | 21 799 |
| 11 486 |
| 90 | % |
Ultra Broadband Networks |
| 4 332 |
| 2 815 |
| 54 | % | 3 903 |
| 11 | % | 15 770 |
| 10 158 |
| 55 | % |
IP Networks and Applications |
| 1 737 |
| 395 |
| 340 | % | 1 419 |
| 22 | % | 6 029 |
| 1 328 |
| 354 | % |
Nokia Technologies |
| 309 |
| 403 |
| (23 | )% | 353 |
| (12 | )% | 1 053 |
| 1 027 |
| 3 | % |
Group Common and Other |
| 341 |
| 0 |
|
|
| 298 |
| 14 | % | 1 145 |
| 0 |
|
|
|
Non-IFRS exclusions |
| (74 | ) | 0 |
|
|
| (60 | ) | 23 | % | (331 | ) | 0 |
|
|
|
Gross profit |
| 2 659 |
| 1 693 |
| 57 | % | 2 216 |
| 20 | % | 8 456 |
| 5 536 |
| 53 | % |
Gross margin % |
| 40.0 | % | 46.9 | % | (690 | )bps | 37.6 | % | 240 | bps | 35.8 | % | 44.3 | % | (850 | )bps |
Operating profit |
| 317 |
| 643 |
| (51 | )% | 55 |
| 476 | % | (1 100 | ) | 1 697 |
|
|
|
Nokia’s Networks business |
| 854 |
| 495 |
| 73 | % | 432 |
| 98 | % | 1 935 |
| 1 349 |
| 43 | % |
Ultra Broadband Networks |
| 574 |
| 405 |
| 42 | % | 326 |
| 76 | % | 1 362 |
| 1 210 |
| 13 | % |
IP Networks and Applications |
| 280 |
| 90 |
| 211 | % | 106 |
| 164 | % | 573 |
| 138 |
| 315 | % |
Nokia Technologies |
| 158 |
| 316 |
| (50 | )% | 225 |
| (30 | )% | 579 |
| 698 |
| (17 | )% |
Group Common and Other |
| (73 | ) | (74 | ) |
|
| (101 | ) |
|
| (341 | ) | (89 | ) |
|
|
Non-IFRS exclusions |
| (622 | ) | (93 | ) | 569 | % | (501 | ) | 24 | % | (3 272 | ) | (261 | ) | 1 154 | % |
Operating margin % |
| 4.8 | % | 17.8 | % | (1 300 | )bps | 0.9 | % | 390 | bps | (4.7 | )% | 13.6 | % | (1 830 | )bps |
Profit (non-IFRS) |
| 676 |
| 575 |
| 18 | % | 264 |
| 156 | % | 1 250 |
| 1 392 |
| (10 | )% |
Profit/(Loss) (4) |
| 658 |
| 499 |
| 32 | % | (133 | ) | (595 | )% | (912 | ) | 1 194 |
|
|
|
EPS, diluted (non-IFRS) |
| 0.12 |
| 0.15 |
| (20 | )% | 0.04 |
| 200 | % | 0.22 |
| 0.36 |
| (39 | )% |
EPS, diluted (4) |
| 0.11 |
| 0.13 |
| (15 | )% | (0.02 | ) | (650 | )% | (0.13 | ) | 0.31 |
|
|
|
Net cash and other liquid assets |
| 5 299 |
| 7 775 |
| (32 | )% | 5 539 |
| (4 | )% | 5 299 |
| 7 775 |
| (32 | )% |
(1)Results are as reported unless otherwise specified. The results information in this report is unaudited. Non-IFRS results exclude costs related to the Alcatel-Lucent transaction and related integration, goodwill impairment charges, intangible asset amortization and purchase price related items, restructuring and associated charges, and certain other items that may not be indicative of Nokia’s underlying business performance. For details, please refer to the Non-IFRS Exclusions section included in discussions of both the quarterly and year to date performance and note 2, “Non-IFRS to reported reconciliation”, in the notes in the Financial statement information in this report. A reconciliation of the Q4 2015 non-IFRS combined company results to the reported results can be found in the “Nokia provides recast segment results for 2015 reflecting new financial reporting structure” stock exchange release published on April 22, 2016. Change in net sales at constant currency excludes the impact of changes in exchange rates in comparison to Euro, our reporting currency. For more information on currency exposures, please refer to note 1, “Basis of Preparation”, in the Financial statement information section in this report.
(2)Combined company historicals reflect Nokia’s new operating and financial reporting structure, including Alcatel-Lucent, and are presented as additional information as described in the stock exchange release published on April 22, 2016. For more information on the combined company historicals, please refer to note 1, “Basis of Preparation”, in the Financial statement information section in this report.
(3)Nokia standalone historicals are the recasting of Nokia’s historical standalone financial results, reflecting Nokia’s updated segment reporting structure, excluding Alcatel-Lucent. Beginning from the first quarter 2016, Nokia results include those of Alcatel-Lucent on a consolidated basis. Accordingly, Nokia results beginning from the first quarter 2016 are not directly comparable to prior period Nokia standalone results.
(4)Reported Q1-Q4’16 result is not comparable to the reported results published previously due to an update to the Alcatel-Lucent purchase price allocation in Q3’16 which resulted in an adjustment to the reported Q1’16 income tax benefit. Refer to note 6, “Acquisitions”, in the Financial statement information section in this report.
Nokia and Apple patent license renewal
In December 2016, Nokia announced that it had begun filing complaints against Apple, alleging that Apple products infringe Nokia patents. As of today, in actions across 11 countries in Asia, Europe and the US, there are now more than 50 Nokia patents in suit, covering technologies such as display, user interface, software, antenna, chipsets, video coding, as well as 3G & 4G cellular standards. Apple has also filed certain complaints against Nokia.
As one of the world’s leading innovators, and following the acquisition of full ownership of Nokia Siemens Networks in 2013 and Alcatel-Lucent in 2016, Nokia now owns three valuable portfolios of intellectual property. Built on more than EUR 115 billion invested in research and development (“R&D”) over the past twenty years, the tens of thousands of patents cover many important technologies used in smartphones, tablets, personal computers and similar devices.
The previous license agreement between Nokia and Apple, covering some patents from the Nokia Technologies portfolio, expired at the end of 2016 and Apple currently has no license under Nokia patents. Despite sustained efforts by Nokia, Apple has not accepted any licensing offers Nokia has made for the previously licensed patents, as well as for other patented inventions used by many of Apple’s products.
Non-IFRS results provide meaningful supplemental information regarding underlying business performance
In addition to information on our reported IFRS results, we provide certain information on a non-IFRS, or underlying business performance, basis. We believe that our non-IFRS results provide meaningful supplemental information to both management and investors regarding Nokia’s underlying business performance by excluding the below-described items that may not be indicative of Nokia’s business operating results. These non-IFRS financial measures should not be viewed in isolation or as substitutes to the equivalent IFRS measure(s), but should be used in conjunction with the most directly comparable IFRS measure(s) in the reported results.
Non-IFRS results exclude costs related to the Alcatel-Lucent transaction and related integration, goodwill impairment charges, intangible asset amortization and purchase price related items, restructuring and associated charges, and certain other items that may not be indicative of Nokia’s underlying business performance. The non-IFRS exclusions are not allocated to the segments, and hence they are reported only at the Nokia consolidated level.
Financial discussion
The financial discussion included in this financial report of Nokia’s results comprises the results of Nokia’s businesses — Nokia’s Networks business and Nokia Technologies, as well as Group Common and Other. For more information on the changes to our reportable segments, please refer to note 3, “Segment information and eliminations”, in the Financial statement information section in this financial report.
In the discussion of Nokia’s results in the fourth quarter 2016 comparisons are given to the fourth quarter 2015 and third quarter 2016 results on a combined company basis, unless otherwise indicated. This data has been prepared to reflect the financial results of the continuing operations of Nokia as if the new financial reporting structure had been in operation for the full year 2015. Certain accounting policy alignments, adjustments and reclassifications have been necessary, and these are explained in the “Basis of preparation” section of Nokia’s stock exchange release published on April 22, 2016. These adjustments also include reallocation of items of costs and expenses based on their nature and changes to the definition of the line items in the combined company accounting policies, which also affect numbers presented in this financial report for 2015.
In the discussion of Nokia’s reported results for the fourth quarter 2016 and full year 2016 comparisons are given to the fourth quarter 2015 and full year 2015 Nokia standalone historical results, which have been recast to reflect Nokia’s updated segment reporting structure excluding Alcatel-Lucent, unless otherwise indicated. From the beginning of 2016, Nokia’s results include those of Alcatel-Lucent on a consolidated basis and, accordingly, are not directly comparable to Nokia standalone historical results.
CEO statement
2016 was a time of transition for Nokia, a year in which we moved forward deliberately and successfully to execute our strategy and broaden our scope.
At the start of the year, Nokia was focused primarily on mobile networks. We ended the year as a company with a complete portfolio spanning mobile, fixed, routing, optical, stand-alone software and more; with solid opportunities to drive higher returns through expansion into new customer segments; with emerging businesses in digital health and digital media; and with greatly expanded patent and brand licensing activities.
Pleasingly, we saw growing customer support for Nokia’s strategy. Our sales pipeline with customers beyond our traditional communication service provider base accelerated over the course of the year, we saw an increasing share of our Networks pipeline coming from opportunities covering products and services from two or more of our business groups, and the potential of cross-selling started to become a reality.
We also ended the year having successfully concluded the integration of Alcatel-Lucent faster than anticipated, allowing us to shift our full focus to cost savings, continuous improvement programs and the execution of our strategy. In terms of financial performance, we were able to deliver solid results for the full year, with profitability in our Networks business coming in at the high end of our guidance range. Our ongoing intense focus on execution, cost management and pricing discipline was critical to offset the impact of challenging market conditions over the course of the year. While I remain disappointed with our topline development in 2016, we continue to expect our performance to improve in 2017 and see the potential for margin expansion in 2017 and beyond, as market conditions improve and our sales transformation programs gain further traction.
In short, we ended 2016 positioned well for the future, with well-integrated operations, a powerful end-to-end portfolio and our disciplined operating model still delivering robust results. In addition, we remain in a position of financial strength, with a strong balance sheet and the flexibility to invest in opportunities that we believe will create shareholder value.
Rajeev Suri
President and CEO
Nokia in Q4 2016 — Non-IFRS
Net sales (non-IFRS) | Margin (non-IFRS) |
| Components of operating profit (non-IFRS) |
|
|
|
|
|
|
| |
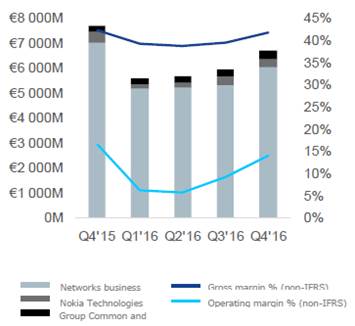
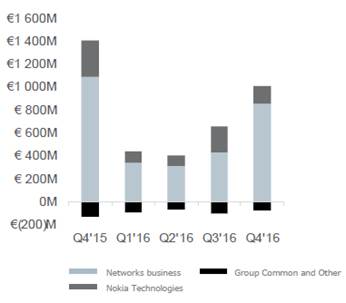
Non-IFRS net sales and non-IFRS operating profit
Nokia non-IFRS net sales decreased 13% year-on-year and increased 13% sequentially. On a constant currency basis, Nokia non-IFRS net sales would have decreased 13% year-on-year and increased 11% sequentially.
Year-on-year changes
EUR million, non- |
| Net |
| % |
| Gross |
| (R&D) |
| (SG&A) |
| Other |
| Operating |
| Change in |
|
Networks business |
| (988 | ) | (14 | )% | (364 | ) | 79 |
| 72 |
| (30 | ) | (243 | ) | (140 | )bps |
Nokia Technologies |
| (104 | ) | (25 | )% | (122 | ) | 3 |
| (30 | ) | (3 | ) | (152 | ) | (2 410 | )bps |
Group Common and Other |
| 87 |
| 34 | % | 33 |
| 4 |
| 0 |
| 19 |
| 56 |
| 2 940 | bps |
Eliminations |
| 1 |
|
|
| 0 |
| 0 |
| 0 |
| 0 |
| 0 |
|
|
|
Nokia |
| (1 003 | ) | (13 | )% | (454 | ) | 86 |
| 42 |
| (14 | ) | (340 | ) | (260 | )bps |
Sequential changes
EUR million, non- |
| Net |
| % |
| Gross |
| (R&D) |
| (SG&A) |
| Other |
| Operating |
| Change in |
|
Networks business |
| 747 |
| 14 | % | 484 |
| (50 | ) | (19 | ) | 7 |
| 422 |
| 600 | bps |
Nokia Technologies |
| (45 | ) | (12 | )% | (54 | ) | (4 | ) | (13 | ) | 4 |
| (67 | ) | (1 260 | )bps |
Group Common and Other |
| 43 |
| 14 | % | 23 |
| (3 | ) | 3 |
| 5 |
| 29 |
| 1 250 | bps |
Eliminations |
| 19 |
|
|
| 0 |
| 0 |
| 0 |
| 0 |
| 0 |
|
|
|
Nokia |
| 765 |
| 13 | % | 453 |
| (58 | ) | (29 | ) | 16 |
| 384 |
| 470 | bps |
Non-IFRS financial income and expenses
In the fourth quarter 2016, non-IFRS financial income and expenses was an expense of EUR 72 million. This includes an impairment charge of EUR 63 million related to the performance of certain private funds investing in IPR, which was largely offset by foreign exchange gains mainly resulting from US dollar appreciation against Chinese yuan, as well as gains from venture fund distributions.
Non-IFRS taxes
In the fourth quarter 2016, non-IFRS income taxes were an expense of EUR 204 million. In the fourth quarter 2016, Nokia’s non-IFRS tax rate of 23% was lower than the approximately 40% outlook we previously provided. This was primarily related to two factors. First, there was a favorable change in Nokia’s regional profitability mix, the majority of which was non-recurring in nature and related to a change of estimate in Q4 2016. Second, compared to the expected profitability underlying Nokia’s non-IFRS tax rate guidance, the level of realized profitability was higher, resulting in a lower non-IFRS tax rate due to a relatively larger portion of taxable profit being attributable to tax jurisdictions with lower tax rates.
Nokia in Q4 2016 — Reported
Components of net sales | Margin |
| Components of operating profit |
|
|
|
|
|
|
| |
Financial discussion
Net sales
Nokia net sales increased 84% year-on-year, compared to Nokia standalone net sales, and increased 13% sequentially. On a constant currency basis, Nokia net sales would have increased 84% year-on-year, compared to Nokia standalone net sales, and 10% sequentially.
Year-on-year discussion
The year-on-year increase in Nokia net sales in the fourth quarter 2016, compared to Nokia standalone net sales, was primarily due to growth in Nokia’s Networks business and Group Common and Other, both of which primarily related to the acquisition of Alcatel-Lucent. This was partially offset by Nokia Technologies and a purchase price allocation adjustment related to a reduced valuation of deferred revenue that existed on Alcatel-Lucent’s balance sheet at the time of the acquisition.
Sequential discussion
The sequential increase in Nokia net sales in the fourth quarter 2016 was primarily due to growth in Nokia’s Networks business and Group Common and Other. This was partially offset by Nokia Technologies and the negative impact related to a purchase price allocation adjustment associated with a reduced valuation of deferred revenue that existed on Alcatel-Lucent’s balance sheet at the time of the acquisition.
Operating profit
Year-on-year discussion
The year-on-year decrease in Nokia operating profit, compared to Nokia standalone operating profit, was primarily due to higher research and development (“R&D”) expenses, higher selling, general and administrative (“SG&A”) expenses and a net negative fluctuation in other income and expenses, partially offset by higher gross profit, all of which primarily related to the acquisition of Alcatel-Lucent.
The increase in gross profit was primarily due to Nokia’s Networks business and, to a lesser extent, Group Common and Other, partially offset by non-IFRS exclusions related to both product portfolio integration costs and deferred revenue, as well as Nokia Technologies.
The increase in R&D expenses was primarily due to Nokia’s Networks business, non-IFRS exclusions related to both amortization of intangible assets and product portfolio integration costs and, to a lesser extent, Group Common and Other and Nokia Technologies.
The increase in SG&A expenses was primarily due to Nokia’s Networks business, non-IFRS exclusions related to both amortization of intangible assets and transaction and integration related costs and, to a lesser extent, Nokia Technologies and Group Common and Other.
Nokia’s other income and expenses was an expense of EUR 110 million in the fourth quarter 2016, compared to an expense of EUR 3 million in the year-ago period. The net negative fluctuation was primarily related to non-IFRS exclusions attributable to higher restructuring and associated charges, partially offset by the absence of an approximately EUR 20 million loss recorded in the fourth quarter 2015, which related to certain of Nokia’s investments made through its venture funds.
Sequential discussion
Nokia operating profit increased primarily due to higher gross profit, partially offset by a net negative fluctuation in other income and expenses, as well as higher R&D and SG&A expenses.
The increase in gross profit was primarily due to Nokia’s Networks business and, to a lesser extent, Group Common and Other, partially offset by Nokia Technologies and non-IFRS exclusions.
The increase in R&D expenses was primarily due to Nokia’s Networks business.
The increase in SG&A expenses was primarily due to Nokia’s Networks business, non-IFRS exclusions and Nokia Technologies.
Nokia’s other income and expenses was an expense of EUR 110 million in the fourth quarter 2016, compared to an expense of EUR 39 million in the third quarter 2016. The net negative fluctuation was primarily due to higher restructuring and associated charges.
Description of non-IFRS exclusions in Q4 2016
Non-IFRS exclusions consist of costs related to the Alcatel-Lucent transaction and related integration, goodwill impairment charges, intangible asset amortization and purchase price related items, restructuring and
associated charges, and certain other items that may not be indicative of Nokia’s underlying business performance. For additional details, please refer to note 2, “Non-IFRS to reported reconciliation, Continuing Operations (unaudited)”, in the Financial statement information section in this financial report.
EUR million |
| Q4’16 |
| Nokia |
| YoY change |
| Q3’16 |
| QoQ change |
|
Net sales |
| (74 | ) | 0 |
|
|
| (60 | ) | 23 | % |
Gross profit |
| (159 | ) | 0 |
|
|
| (149 | ) | 7 | % |
R&D |
| (185 | ) | (9 | ) | 1 956 | % | (179 | ) | 3 | % |
SG&A |
| (162 | ) | (70 | ) | 131 | % | (145 | ) | 12 | % |
Other income and expenses |
| (116 | ) | (14 | ) | 729 | % | (29 | ) | 300 | % |
Operating profit/(loss) |
| (622 | ) | (93 | ) | 569 | % | (501 | ) | 24 | % |
Financial income and expenses |
| 0 |
| 0 |
|
|
| (1 | ) | (100 | )% |
Taxes |
| 605 |
| 17 |
| 3 459 | % | 105 |
| 476 | % |
Profit/(loss) |
| (17 | ) | (76 | ) | (78 | )% | (397 | ) | (96 | )% |
Profit/(loss) attributable to the shareholders of the parent |
| (13 | ) | (76 | ) | (83 | )% | (378 | ) | (97 | )% |
Non-controlling interests |
| (5 | ) | 0 |
|
|
| (20 | ) | (75 | )% |
(1)Nokia standalone historicals are the recasting of Nokia’s historical standalone financial results, reflecting Nokia’s updated segment reporting structure, excluding Alcatel-Lucent. Beginning from the first quarter 2016, Nokia results include those of Alcatel-Lucent on a consolidated basis. Accordingly, Nokia results beginning from the first quarter 2016 are not directly comparable to prior period Nokia standalone results.
Non-IFRS exclusions in net sales
In the fourth quarter 2016, non-IFRS exclusions in net sales amounted to EUR 74 million, and related to a purchase price allocation adjustment related to a reduced valuation of deferred revenue that existed on Alcatel-Lucent’s balance sheet at the time of the acquisition.
Non-IFRS exclusions in operating profit
In the fourth quarter 2016, non-IFRS exclusions in operating profit amounted to EUR 622 million, and were primarily due to non-IFRS exclusions that negatively affected gross profit, R&D, SG&A and other income and expenses as follows:
In the fourth quarter 2016, non-IFRS exclusions in gross profit amounted to EUR 159 million, and were primarily due to product portfolio integration costs related to the acquisition of Alcatel-Lucent, and the deferred revenue.
In the fourth quarter 2016, non-IFRS exclusions in R&D expenses amounted to EUR 185 million, and were primarily due to the amortization of intangible assets resulting from the acquisition of Alcatel-Lucent and, to a lesser extent, product portfolio integration costs related to the acquisition of Alcatel-Lucent.
In the fourth quarter 2016, non-IFRS exclusions in SG&A expenses amounted to EUR 162 million, and were primarily due to the amortization of intangible assets resulting from the acquisition of Alcatel-Lucent, as well as integration and transaction related costs.
In the fourth quarter 2016, non-IFRS exclusions in other income and expenses amounted to EUR 116 million, and were primarily due to EUR 107 million of restructuring and associated charges for Nokia’s cost reduction and efficiency improvement initiatives.
Financial income and expenses
In the fourth quarter 2016, financial income and expenses was an expense of EUR 72 million. This includes an impairment charge of EUR 63 million related to the performance of certain private funds investing in IPR, which was largely offset by foreign exchange gains mainly resulting from US dollar appreciation against Chinese yuan, as well as gains from venture fund distributions.
Taxes
In the fourth quarter 2016, income taxes were a benefit of EUR 401 million. This was primarily related to two factors. First, following the completion of the squeeze-out of the remaining Alcatel-Lucent shares, Nokia has launched actions to integrate the former Alcatel-Lucent and Nokia operating models. In the fourth quarter 2016, in connection with these integration activities, Nokia transferred certain intellectual property to its US operations, recording a tax benefit and additional deferred tax assets of EUR 348 million. Second, for US tax purposes Nokia elected to treat the acquisition of Alcatel-Lucent’s US operations as an asset purchase. The impact of this election was to utilize or forfeit existing deferred tax assets and record new deferred tax assets with a longer amortization period than the life of those forfeited assets. As a result of this, we recorded EUR 91 million of additional deferred tax assets in the fourth quarter 2016. In addition, there was a favorable change in Nokia’s regional profitability mix, the majority of which was non-recurring in nature and related to a change of estimate in the fourth quarter 2016.
Nokia will continue to make changes in its operating model in 2017. Due to this, in full year 2017, Nokia expects to record a reduction in deferred tax assets of approximately EUR 250 million, which will have a negative non-recurring impact on tax expenses of approximately EUR 250 million, partly offsetting the recorded non-recurring tax benefit of EUR 348 million in the fourth quarter 2016. The operating model changes, including the transfers of intellectual property and certain tax elections that Nokia has made, resulted in non-recurring cash outflows of approximately EUR 90 million in the fourth quarter 2016 and are expected to result in additional non-recurring cash outflows in 2017 of approximately EUR 150 million. The changes are expected to create more future cash tax savings than the additional non-recurring cash tax outflows in 2016 and 2017.
Cost savings program
The following table summarizes the financial information related to our cost savings program, as of the end of the fourth quarter 2016. Balances related to previous Nokia and Alcatel-Lucent restructuring and cost savings programs have been included as part of this overall cost savings program as of the second quarter 2016.
In EUR million, approximately |
| Q4’16 |
|
Opening balance of restructuring and associated liabilities |
| 810 |
|
+ Charges in the quarter |
| 110 |
|
- Cash outflows in the quarter |
| 130 |
|
= Ending balance of restructuring and associated liabilities |
| 790 |
|
of which restructuring provisions |
| 710 |
|
of which other associated liabilities |
| 80 |
|
|
|
|
|
Total expected restructuring and associated charges |
| 1 700 |
|
- Cumulative recorded |
| 750 |
|
= Charges remaining to be recorded |
| 950 |
|
|
|
|
|
Total expected restructuring and associated cash outflows |
| 2 150 |
|
- Cumulative recorded |
| 410 |
|
= Cash outflows remaining to be recorded |
| 1 740 |
|
The following table summarizes our full year 2016 results and future expectations related to our cost savings program and network equipment swaps.
In EUR million, |
| 2016 |
| 2017 |
| 2018 |
| 2019 |
| Total |
| ||||||
nearest EUR |
| Previous |
| Actual |
| Previous |
| Current |
| Previous |
| Current |
| Current |
| Current |
|
Total cost savings |
| 400 |
| 550 |
| 400 |
| 250 |
| 400 |
| 400 |
| 0 |
| 1 200 |
|
- operating expenses |
| 250 |
| 350 |
| 200 |
| 100 |
| 350 |
| 350 |
| 0 |
| 800 |
|
- cost of sales |
| 150 |
| 200 |
| 200 |
| 150 |
| 50 |
| 50 |
| 0 |
| 400 |
|
Restructuring and associated charges |
| 700 |
| 750 |
| 800 |
| 750 |
| 200 |
| 200 |
| 0 |
| 1 700 |
|
Restructuring and associated cash outflows |
| 500 |
| 400 |
| 700 |
| 750 |
| 500 |
| 550 |
| 450 |
| 2 150 |
|
Charges and cash outflows related to network equipment swaps |
| 300 |
| 150 |
| 300 |
| 450 |
| 300 |
| 300 |
| 0 |
| 900 |
|
In full year 2016, the actual total cost savings benefitted from lower incentive accruals, related to the financial performance in full year 2016. Lower incentive accruals drove more than half of the higher than previously expected decrease in total costs in 2016, and this is expected to reverse in 2017, assuming full year 2017 financial performance in-line with our expectations. On a cumulative basis, Nokia continues to be well on track to achieve the targeted EUR 1.2 billion of total cost savings in full year 2018. To the extent that our actual full year 2016 charges and cash flows deviated from our previous expectations, future expectations have been adjusted accordingly.
Outlook
|
| Metric |
| Guidance |
| Commentary |
|
|
|
|
|
|
|
Nokia |
| Annual cost savings for Nokia, excluding Nokia Technologies |
| Approximately EUR 1.2 billion of total annual cost savings to be achieved in full year 2018(1) |
| Compared to the combined non-IFRS operating costs of Nokia and Alcatel-Lucent for full year 2015, excluding Nokia Technologies. Nokia expects approximately EUR 800 million of the cost savings to come from operating expenses and approximately EUR 400 million from cost of sales.
Restructuring and associated charges are expected to total approximately EUR 1.7 billion. Restructuring and associated cash outflows are expected to total approximately EUR 2.15 billion. |
|
|
|
|
|
|
|
|
| Network equipment swaps |
| Approximately EUR 900 million in total(1) |
| The charges related to network equipment swaps are being recorded as non-IFRS exclusions, and therefore do not affect Nokia’s non-IFRS operating profit. |
|
|
|
|
|
|
|
|
| Non-IFRS financial income and expenses |
| Expense of approximately EUR 300 million in full year 2017 |
| Primarily includes net interest expenses related to interest-bearing liabilities, interest costs related to the defined benefit pension and other post-employment benefit plans, as well as the impact of foreign exchange rate fluctuations on certain balance sheet items.
Nokia expects cash outflows related to financial income and expenses to be approximately EUR 200 million in full year 2017. |
|
|
|
|
|
|
|
|
| Non-IFRS tax rate |
| Between 30% and 35% for full year 2017(2) |
| Nokia expects its non-IFRS tax rate for full year 2017 to be around the midpoint of the guidance range, with the non-IFRS tax rate for Q1 2017 between 35% and 40%. (This is an update to earlier commentary for the non-IFRS tax rate for full year 2017 to be at the high end of the guidance range.)
Nokia expects cash outflows related to taxes to be approximately EUR 600 million for full year 2017. (This is an update to earlier commentary for cash outflows related to taxes to be approximately EUR 400 million for full year 2017.) |
|
|
|
|
|
|
|
|
| Capital expenditures |
| Approximately EUR 500 million in full year 2017 |
| Primarily attributable to Nokia’s Networks business. |
|
|
|
|
|
|
|
Nokia’s Networks business |
| Net sales |
| Decline in line with the primary addressable market in full year 2017 |
| Nokia’s outlook for net sales and operating margin for Nokia’s Networks business in full year 2017 are expected to be influenced by factors including: · A low single digit percentage decline in the primary addressable market for Nokia’s Networks business; |
![]()
|
| Operating margin |
| 8-10% in full year 2017 |
| · Competitive industry dynamics; · Product and regional mix; · The timing of major network deployments; and · Execution of cost savings and reinvestment plans, with operating expenses down on a year-on-year basis. The 2017 outlook for Nokia’s Networks business was provided on November 15, 2016 assuming constant foreign exchange rates. |
|
|
|
|
|
|
|
Nokia Technologies |
| Net sales |
| Not provided |
| Due to risks and uncertainties in determining the timing and value of significant licensing agreements, Nokia believes it is not appropriate to provide an annual outlook for full year 2017. If no new licensing agreements are signed, the annualized net sales run rate for patent and brand licensing would be approximately EUR 800 million in 2017, representing approximately 30% of the global smartphone market, by value, under license.
Nokia expects total net sales from Digital Health and Digital Media to grow year-on-year in full year 2017, primarily influenced by increased consumer adoption of our Digital Health and Digital Media products. |
(1)For further details related to the cost savings and network equipment swaps guidance, please refer to the “Cost savings program” section above.
(2)For further details related to the tax guidance, please refer to the “Taxes” section above.
Ultra Broadband Networks — Mobile Networks
Nokia utilized the 5G-ready AirScale platform in demos with Smart Philippines, Ooredoo Qatar, StarHub Singapore, du UAE and US Cellular. Nokia also showcased 5G in Dallas with Verizon, a major partner for our pre-5G trials. Nokia’s significant base of 4G and 4.5G customers — with 110 4.5G customers alone — is a foundation for upgrades to 4.5G Pro, 4.9G and, eventually, 5G.
STC of Saudi Arabia signed on to roll out Nokia’s 4.5G mobile technology platform to expand high-speed mobile broadband capacity and coverage in the Middle East’s biggest economy. Nokia’s 4.5G technology will help meet increasing connectivity demands across Saudi Arabia, including during the Hajj and Ramadan seasons.
Nokia and Bharti Airtel agreed to expand the deployment of 4G technology in several regions of India, including Gujarat, Madhya Pradesh, Odisha and Mumbai. The agreement will address fast-rising growth in mobile traffic from news, video and social media consumption on mobile devices.
Nokia introduced Nokia Group Communications, a new mission-critical LTE public safety portfolio to enable first responder teams to securely and reliably communicate through new applications, like instant video connectivity, alongside traditional features on a single device.
Nokia, together with Deutsche Telekom, Thales and Inmarsat, successfully conducted a program of test flights in the UK under the newly formed European Aviation Network (EAN). The network is the world’s first integrated satellite and air-to-ground network dedicated to providing in-flight broadband for millions of European passengers. The EAN is expected to be formally introduced in mid-2017.
Ultra Broadband Networks — Fixed Networks
Nokia expanded its portfolio of G.fast micro-nodes to help operators accelerate ultra-broadband deployments and deliver faster data speeds to customers using copper networks. The portfolio extension comes at a time when service providers are increasingly turning to G.fast, which uses existing copper networks to deliver fiber-like speeds to customers over short distance.
Nokia announced Gigabit Smart Build portfolio to help service providers build ultra-broadband networks more easily and cost efficiently. The portfolio consists of a set of services, processes and automated tools to simplify the introduction and commercialization of new technology and products.
Using Nokia’s next generation Passive Optical Network fiber technology, SK Broadband provided the fastest fiber access speeds ever to a set of apartment buildings in Seoul, South Korea, at a rate of 52 gigabits per second.
Nokia’s next generation fiber solution (XGS and TWDM-PON) was installed with multiple customers and is involved in numerous trials around the world, with particular interest in the Middle East, with projects with the Ministry of Communications in Kuwait, Du in the United Arab Emirates and Ooredoo in Qatar.
Nokia customers Telefonica and Du in the United Arab Emirates conducted 5G-related tests with XGS-PON, demonstrating the rising role of fixed network assets as a complement to mobile telephony.
IP Networks and Applications — IP/Optical Networks
BT Global Services selected Nuage Networks for its software-defined WAN (SD-WAN) service as part of their global investment in Dynamic Network Services. Nuage SD-WAN enables large organizations around the world to rapidly increase their use of cloud services and seeks to maximize the opportunities of their digital future by being able to access specific network services with maximum flexibility and agility.
dtac, Thailand’s second biggest mobile operator, selected Nokia’s IP/Optical portfolio to bolster its backbone network. The deployment of Nokia’s IP/Optical portfolio will help deliver ultra-broadband mobile access to roughly 40% of Thailand’s population.
Nokia announced plans to acquire Deepfield to boost Nokia’s analytics’ product offering to communication service providers, cable operators, cloud, webscale and large technology companies. The acquisition of Deepfield, based in the US state of Michigan, is expected to close in Q1 2017, and is subject to customary closing conditions.
Telefonica deployed Nokia Virtualized Service Router in its network, a step that enables Telefonica to deploy future VPN services quickly and accelerate the introduction of new points of presence.
IP Networks and Applications — Applications & Analytics
Saudi Arabia’s Zain KSA selected Nokia Netguard Endpoint security to protect its millions of subscribers from the rising threat of malware. The deal followed an initial pilot project to ensure the highest levels of network security as Zain aims to transform Jeddah, Saudi Arabia’s second biggest city, into a model for smart cities in the country.
Nokia announced major updates to its Motive Customer eXperience Solutions (CXS) software portfolio, providing communication service providers with new advanced machine learning capabilities to improve customer experiences and to reduce costs. Through machine-learning capabilities developed through Nokia Bell Labs, the new products, among other things, reduce help desk call volumes and shorten average call handling times.
Nokia announced that Japanese communications service provider KDDI has deployed the Nokia Motive Service Management Platform to deliver superior care by streamlining and improving resolution of issues for its millions of subscribers.
Nokia published the industry’s first complete templating system for Virtualized Network Function (VNF) lifecycle management, based on the European Telecommunications Standards Institute’s Network Functions Virtualization (ETSI NFV) specifications. The templating system for VNF lifecycle management is designed to allow service providers to streamline and automate VNF onboarding, integration and lifecycle management processes in a more time and cost-efficient way.
Nokia and Hewlett Packard Enterprise announced a strategic collaboration on Internet of Things (IoT) solutions for enterprise customers. The companies will jointly market and sell solutions for two IoT vertical enterprise segments, including industrial/manufacturing and smart city applications.
Services
At the Global Telecoms Awards ceremony, Nokia won a GLOTEL Award in the category “Best sustainability project” for its partnership and PSTN Transformation project with CenturyLink, reducing the customer’s network power consumption by approximately 22,000 megawatt-hours a year.
Nokia celebrated the 10th anniversary of its global service delivery model, while introducing a new strategy that takes service delivery to a new era through extreme automation.
Net sales Margin |
| Services — Net sales |
|
|
|
|
|
|
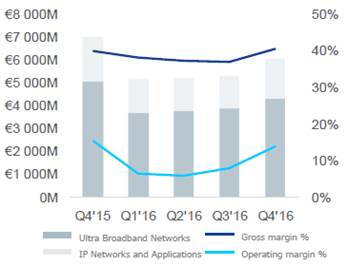
Financial highlights
|
|
|
| Combined |
|
|
|
|
|
|
|
EUR million |
| Q4’16 |
| Q4’15 |
| YoY change |
| Q3’16 |
| QoQ change |
|
Net sales - constant currency |
|
|
|
|
| (14 | )% |
|
| 12 | % |
Net sales |
| 6 069 |
| 7 057 |
| (14 | )% | 5 322 |
| 14 | % |
Gross profit |
| 2 466 |
| 2 830 |
| (13 | )% | 1 982 |
| 24 | % |
Gross margin % |
| 40.6 | % | 40.1 | % | 50 | bps | 37.2 | % | 340 | bps |
R&D |
| (932 | ) | (1 011 | ) | (8 | )% | (882 | ) | 6 | % |
SG&A |
| (688 | ) | (761 | ) | (10 | )% | (669 | ) | 3 | % |
Other income and expenses |
| 8 |
| 39 |
| (79 | )% | 1 |
| 700 | % |
Operating profit |
| 854 |
| 1 097 |
| (22 | )% | 432 |
| 98 | % |
Operating margin % |
| 14.1 | % | 15.5 | % | (140 | )bps | 8.1 | % | 600 | bps |
(1)Combined company historicals reflect Nokia’s new operating and financial reporting structure, including Alcatel-Lucent, and are presented as additional information as described in the stock exchange release published on April 22, 2016. For more information on the combined company historicals, please refer to note 1, “Basis of Preparation”, in the Financial statement information section in this report.
Net sales by region
|
|
|
| Combined |
|
|
|
|
|
|
|
EUR million |
| Q4’16 |
| Q4’15 |
| YoY change |
| Q3’16 |
| QoQ change |
|
Asia-Pacific |
| 1 176 |
| 1 198 |
| (2 | )% | 975 |
| 21 | % |
Europe |
| 1 347 |
| 1 617 |
| (17 | )% | 1 125 |
| 20 | % |
Greater China |
| 612 |
| 916 |
| (33 | )% | 783 |
| (22 | )% |
Latin America |
| 413 |
| 594 |
| (30 | )% | 337 |
| 23 | % |
Middle East & Africa |
| 615 |
| 596 |
| 3 | % | 469 |
| 31 | % |
North America |
| 1 907 |
| 2 136 |
| (11 | )% | 1 632 |
| 17 | % |
Total |
| 6 069 |
| 7 057 |
| (14 | )% | 5 322 |
| 14 | % |
(1)Combined company historicals reflect Nokia’s new operating and financial reporting structure, including Alcatel-Lucent, and are presented as additional information as described in the stock exchange release published on April 22, 2016. For more information on the combined company historicals, please refer to note 1, “Basis of Preparation”, in the Financial statement information section in this report.
Net sales by region — Q4’16 |
|
| Net sales — Q4’15-Q4’16 |
|
|
|
|
|
|
| |
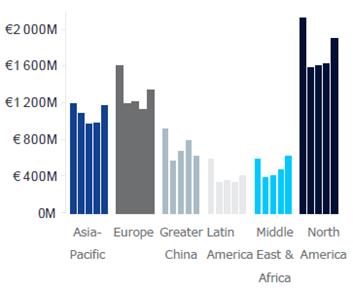
Financial discussion
Net sales and operating profit
Nokia’s Networks business net sales decreased 14% year-on-year and increased 14% sequentially. On a constant currency basis, Nokia’s Networks business net sales would have decreased 14% year-on-year and increased 12% sequentially.
A discussion of our results within Ultra Broadband Networks and IP Networks and Applications is included in the sections “Ultra Broadband Networks” and “IP Networks and Applications” below.
Year-on-year changes
EUR million |
| Net |
| % |
| Gross |
| (R&D) |
| (SG&A) |
| Other |
| Operating |
| Change in |
|
Ultra Broadband Networks |
| (749 | ) | (15 | )% | (269 | ) | 86 |
| 64 |
| (8) |
| (128 | ) | (50 | )bps |
IP Networks and Applications |
| (239 | ) | (12 | )% | (95 | ) | (7 | ) | 9 |
| (23 | ) | (116 | ) | (390 | )bps |
Networks business |
| (988 | ) | (14 | )% | (364 | ) | 79 |
| 72 |
| (30 | ) | (243 | ) | (140 | )bps |
Sequential changes
EUR million |
| Net |
| % |
| Gross |
| (R&D) |
| (SG&A) |
| Other |
| Operating |
| Change in |
|
Ultra Broadband Networks |
| 429 |
| 11 | % | 264 |
| (19 | ) | (10 | ) | 12 |
| 248 |
| 490 | bps |
IP Networks and Applications |
| 318 |
| 22 | % | 220 |
| (31 | ) | (9 | ) | (5 | ) | 174 |
| 860 | bps |
Networks business |
| 747 |
| 14 | % | 484 |
| (50 | ) | (19 | ) | 7 |
| 422 |
| 600 | bps |
Ultra Broadband Networks
Net sales Margin |
|
| |
|
|
|
|
|
|
| |
Financial highlights
|
|
|
| Combined |
|
|
|
|
|
|
|
EUR million |
| Q4’16 |
| Q4’15 |
| YoY change |
| Q3’16 |
| QoQ change |
|
Net sales - constant currency |
|
|
|
|
| (15 | )% |
|
| 9 | % |
Net sales |
| 4 332 |
| 5 081 |
| (15 | )% | 3 903 |
| 11 | % |
Mobile Networks |
| 3 787 |
| 4 382 |
| (14 | )% | 3 318 |
| 14 | % |
Fixed Networks |
| 544 |
| 698 |
| (22 | )% | 585 |
| (7 | )% |
Gross profit |
| 1 650 |
| 1 920 |
| (14 | )% | 1 386 |
| 19 | % |
Gross margin % |
| 38.1 | % | 37.8 | % | 30 | bps | 35.5 | % | 260 | bps |
R&D |
| (596 | ) | (682 | ) | (13 | )% | (577 | ) | 3 | % |
SG&A |
| (488 | ) | (552 | ) | (12 | )% | (479 | ) | 2 | % |
Other income and expenses |
| 8 |
| 16 |
| (50 | )% | (4 | ) |
|
|
Operating profit |
| 574 |
| 702 |
| (18 | )% | 326 |
| 76 | % |
Operating margin % |
| 13.3 | % | 13.8 | % | (50 | )bps | 8.4 | % | 490 | bps |
(1)Combined company historicals reflect Nokia’s new operating and financial reporting structure, including Alcatel-Lucent, and are presented as additional information as described in the stock exchange release published on April 22, 2016. For more information on the combined company historicals, please refer to note 1, “Basis of Preparation”, in the Financial statement information section in this report.
Net sales by region
|
|
|
| Combined |
|
|
|
|
|
|
|
EUR million |
| Q4’16 |
| Q4’15 |
| YoY change |
| Q3’16 |
| QoQ change |
|
Asia-Pacific |
| 853 |
| 879 |
| (3 | )% | 735 |
| 16 | % |
Europe |
| 863 |
| 1 062 |
| (19 | )% | 730 |
| 18 | % |
Greater China |
| 477 |
| 745 |
| (36 | )% | 668 |
| (29 | )% |
Latin America |
| 266 |
| 355 |
| (25 | )% | 226 |
| 18 | % |
Middle East & Africa |
| 483 |
| 449 |
| 8 | % | 370 |
| 31 | % |
North America |
| 1 389 |
| 1 590 |
| (13 | )% | 1 173 |
| 18 | % |
Total |
| 4 332 |
| 5 081 |
| (15 | )% | 3 903 |
| 11 | % |
(1)Combined company historicals reflect Nokia’s new operating and financial reporting structure, including Alcatel-Lucent, and are presented as additional information as described in the stock exchange release published on April 22, 2016. For more information on the combined company historicals, please refer to note 1, “Basis of Preparation”, in the Financial statement information section in this report.
Financial discussion
Net sales
Ultra Broadband Networks net sales decreased 15% year-on-year and increased 11% sequentially. On a constant currency basis, Ultra Broadband Networks net sales would have decreased 15% year-on-year and increased 9% sequentially.
Year-on-year discussion
The year-on-year decrease in Ultra Broadband Networks net sales in the fourth quarter 2016 was due to Mobile Networks and Fixed Networks.
The decrease in Mobile Networks net sales was primarily due to radio networks and, to a lesser extent, services and converged core networks, partially offset by advanced mobile networks solutions. For radio networks, the decrease was primarily related to Greater China and, to a lesser extent, North America, Europe, Latin America and Middle East and Africa. For services, the decrease was related to North America, Europe and Latin America, partially offset by growth in Middle East and Africa, Asia-Pacific and Greater China. For converged core networks,
the decrease was primarily related to Europe, Asia-Pacific and North America. For advanced mobile networks solutions, the increase was primarily related to North America and Greater China.
The decrease in Fixed Networks net sales was primarily due to broadband access, services and digital home. Approximately 50% of the year-on-year decrease was related to two specific customers, with one customer completing a large project in Asia-Pacific and another customer reducing its level of spending in Latin America. For broadband access, the decrease was primarily related to major customers in Latin America, Asia-Pacific and Europe. For services, the decrease was primarily related to Europe and North America. For digital home, the decrease was primarily related to Asia-Pacific, Latin America and Greater China.
Sequential discussion
The sequential increase in Ultra Broadband Networks net sales in the fourth quarter 2016 was due to Mobile Networks, partially offset by Fixed Networks.
The increase in Mobile Networks net sales was primarily due to services and converged core networks, partially offset by radio networks. For services, the increase was across all regions. For converged core networks, the increase was primarily related to North America and, to a lesser extent, Europe and Middle East and Africa. For radio networks, the decrease was primarily related to Greater China and, to a lesser extent, Middle East and Africa, partially offset by growth in Asia-Pacific, North America, Europe and Latin America.
The decrease in Fixed Networks net sales was primarily due to broadband access and digital home, partially offset by services. The sequential decrease was primarily related to two specific customers, with one customer completing a large project in Asia-Pacific and another customer reducing its level of spending in Latin America. For broadband access, the decrease was primarily related to Asia-Pacific, and to a lesser extent, Latin America, North America and Europe.
Operating profit
Year-on-year discussion
On a year-on-year basis, in the fourth quarter 2016, Ultra Broadband Networks operating profit decreased primarily due to lower gross profit, partially offset by lower R&D and SG&A expenses.
The decrease in Ultra Broadband Networks gross profit was primarily due to lower gross profit in both Mobile Networks and Fixed Networks. The decrease in gross profit in both Mobile Networks and Fixed Networks was primarily due to lower net sales, with gross margin remaining solid on a year-on-year basis.
The decrease in Ultra Broadband Networks R&D expenses was primarily due to Mobile Networks. The decrease in Mobile Networks R&D expenses was primarily due to lower personnel expenses, primarily reflecting progress related to Nokia’s cost savings program and, to a lesser extent, lower incentive accruals.
The decrease in Ultra Broadband Networks SG&A expenses was primarily due to Mobile Networks. The decrease in Mobile Networks SG&A expenses was primarily due to lower personnel expenses, primarily reflecting progress related to Nokia’s cost savings program and, to a lesser extent, lower incentive accruals.
Ultra Broadband Networks other income and expenses was an income of EUR 8 million in the fourth quarter 2016, compared to an income of EUR 16 million in the year-ago quarter. On a year-on-year basis, the change was primarily due to Mobile Networks.
Sequential discussion
On a sequential basis, in the fourth quarter 2016, Ultra Broadband Networks operating profit increased primarily due to higher gross profit.
The increase in Ultra Broadband Networks gross profit was primarily due to Mobile Networks, partially offset by Fixed Networks. The increase in Mobile Networks gross profit was due to higher net sales and higher gross margin due to lower fixed production overhead and other cost variances. The decrease in Fixed Networks gross profit was primarily due to lower net sales.
The increase in Ultra Broadband Networks R&D expenses was due to both Mobile Networks and Fixed Networks. The increase in Mobile Networks and Fixed Networks R&D expenses was primarily due to seasonally higher spending.
Ultra Broadband Networks other income and expenses was an income of EUR 8 million in the fourth quarter 2016, compared to an expense of EUR 4 million in the third quarter 2016. On a sequential basis, the change was primarily due to Mobile Networks.
IP Networks and Applications
Net sales Margin |
|
|
|
|
|
|
|
|
Financial highlights
|
|
|
| Combined |
|
|
|
|
|
|
|
EUR million |
| Q4’16 |
| Q4’15 |
| YoY change |
| Q3’16 |
| QoQ change |
|
Net sales - constant currency |
|
|
|
|
| (12 | )% |
|
| 20 | % |
Net sales |
| 1 737 |
| 1 976 |
| (12 | )% | 1 419 |
| 22 | % |
IP/Optical Networks |
| 1 274 |
| 1 441 |
| (12 | )% | 1 048 |
| 22 | % |
IP Routing |
| 814 |
| 930 |
| (12 | )% | 697 |
| 17 | % |
Optical Networks |
| 459 |
| 512 |
| (10 | )% | 351 |
| 31 | % |
Applications & Analytics |
| 464 |
| 535 |
| (13 | )% | 372 |
| 25 | % |
Gross profit |
| 816 |
| 911 |
| (10 | )% | 596 |
| 37 | % |
Gross margin % |
| 47.0 | % | 46.1 | % | 90 | bps | 42.0 | % | 500 | bps |
R&D |
| (336 | ) | (329 | ) | 2 | % | (305 | ) | 10 | % |
SG&A |
| (200 | ) | (209 | ) | (4 | )% | (191 | ) | 5 | % |
Other income and expenses |
| 0 |
| 23 |
| (100 | )% | 5 |
| (100 | )% |
Operating profit |
| 280 |
| 396 |
| (29 | )% | 106 |
| 164 | % |
Operating margin % |
| 16.1 | % | 20.0 | % | (390 | )bps | 7.5 | % | 860 | bps |
(1)Combined company historicals reflect Nokia’s new operating and financial reporting structure, including Alcatel-Lucent, and are presented as additional information as described in the stock exchange release published on April 22, 2016. For more information on the combined company historicals, please refer to note 1, “Basis of Preparation”, in the Financial statement information section in this report.
Net sales by region
|
|
|
| Combined |
|
|
|
|
|
|
|
EUR million |
| Q4’16 |
| Q4’15 |
| YoY change |
| Q3’16 |
| QoQ change |
|
Asia-Pacific |
| 322 |
| 319 |
| 1 | % | 240 |
| 34 | % |
Europe |
| 484 |
| 554 |
| (13 | )% | 395 |
| 23 | % |
Greater China |
| 135 |
| 171 |
| (21 | )% | 115 |
| 17 | % |
Latin America |
| 146 |
| 239 |
| (39 | )% | 112 |
| 30 | % |
Middle East & Africa |
| 131 |
| 147 |
| (11 | )% | 99 |
| 32 | % |
North America |
| 518 |
| 546 |
| (5 | )% | 459 |
| 13 | % |
Total |
| 1 737 |
| 1 976 |
| (12 | )% | 1 419 |
| 22 | % |
(1)Combined company historicals reflect Nokia’s new operating and financial reporting structure, including Alcatel-Lucent, and are presented as additional information as described in the stock exchange release published on April 22, 2016. For more information on the combined company historicals, please refer to note 1, “Basis of Preparation”, in the Financial statement information section in this report.
Financial discussion
Net sales
IP Networks and Applications net sales decreased 12% year-on-year and increased 22% sequentially. On a constant currency basis, IP Networks and Applications net sales would have decreased 12% year-on-year and increased 20% sequentially.
Year-on-year discussion
The year-on-year decrease in IP Networks and Applications net sales in the fourth quarter 2016 was due to both IP/Optical Networks and Applications & Analytics.
The decrease in IP/Optical Networks net sales was due to both IP routing and optical networks. For IP routing, the decrease was primarily related to Latin America, Europe and Greater China. In addition, IP routing net sales were negatively affected by lower resale of third party IP routers. For optical networks, the decrease was primarily related to Latin America, Europe and Greater China, partially offset by growth in Asia-Pacific and North America.
In the fourth quarter 2016, Applications & Analytics net sales declined year-on-year primarily in Europe and North America, where the spending environment remained challenging and large projects signed in 2015 neared completion. To drive growth and higher returns, building a standalone software business at scale is a key priority for Nokia. Thus, Applications & Analytics has started a significant transformation, enabled by investments in sales, R&D and services capabilities. These efforts resulted in several major wins in emerging businesses in the fourth quarter 2016, as well as slight year-on-year growth in Latin America and the Middle East & Africa.
Sequential discussion
The sequential increase in IP Networks and Applications net sales in the fourth quarter 2016 was due to IP/Optical Networks and Applications & Analytics.
The increase in IP/Optical Networks net sales was due to both IP routing and optical networks. For IP routing, the increase was primarily related to Europe, Asia-Pacific, North America and Middle East and Africa. For optical networks, the increase was primarily related to Asia-Pacific, Europe, Latin America, North America and Middle East and Africa.
Applications & Analytics net sales increased across all business lines with particularly strong sequential performance in services and emerging businesses where we signed four new cloud contracts, announced a strategic security win, and continued to see strong customer interest in our analytics capabilities. Other areas with strong sequential growth included: network and service operations primarily related to Asia-Pacific, as well as customer experience management.
Operating profit
Year-on-year discussion
On a year-on-year basis, in the fourth quarter 2016, IP Networks and Applications operating profit decreased primarily due to lower gross profit and, to a lesser extent, due to a net negative fluctuation in other income and expenses.
The decrease in IP Networks and Applications gross profit was due to both IP/Optical Networks and Applications & Analytics. The decrease in gross profit in IP/Optical Networks was primarily due to lower net sales. The decrease in gross profit in Applications & Analytics was due to lower net sales. This was partially offset by higher gross margin, primarily due to tight control of other direct cost and inventory variances.
IP Networks and Applications other income and expenses was approximately zero in the fourth quarter 2016, compared to an income of EUR 23 million in the year-ago quarter. On a year-on-year basis, the change was primarily related to doubtful account allowances in IP/Optical Networks.
Sequential discussion
On a sequential basis, in the fourth quarter 2016, IP Networks and Applications operating profit increased due to higher gross profit, partially offset by higher R&D expenses.
The increase in IP Networks and Applications gross profit was due to both IP/Optical Networks and Applications & Analytics. The increase in gross profit in IP/Optical Networks was primarily due to seasonally higher net sales and
seasonally higher gross margin. The increase in gross profit in Applications & Analytics was primarily due to higher net sales and higher gross margin related to tight control of other direct costs and inventory variances.
The increase in IP Networks and Applications R&D expenses was primarily due to IP/Optical Networks. The increase in IP/Optical Networks R&D expenses was primarily due to seasonally higher spending.
Nokia Technologies
Operational highlights
Licensing
Nokia’s exclusive brand licensee for mobile phones and tablets, HMD Global Oy, began operations as the new home of Nokia phones. HMD announced new Nokia branded feature phones and plans to launch Nokia branded smartphones during the first half of 2017. Nokia receives royalty payments from HMD for sales of every Nokia branded mobile phone and tablet, covering both brand and intellectual property rights.
Nokia began litigation against Apple for patent infringement in Asia, Europe and the US, for patents covering technologies such as display, user interface, software, antenna, chipsets and video coding. Since agreeing a license in 2011 covering some patents from the Nokia Technologies portfolio, Apple declined subsequent offers made by Nokia to license other patented inventions used by many Apple products, including the iPhone, iPad, iPod, and Apple Watch. The 2011 license agreement expired at the end of 2016.
Digital Media and Digital Health
In a multi-year global agreement, Sony Pictures agreed to use Nokia OZO hardware and software to explore the creative potential of virtual reality production and distribution. Sony Pictures will also integrate the OZO Player SDK into the studios’ Privilege Plus app, which is available through Google Play.
Net sales | Margin |
|
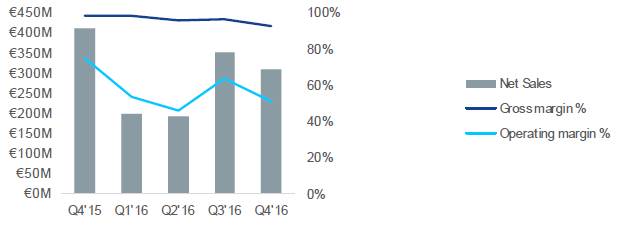
![]()
Financial highlights
|
|
|
| Combined |
|
|
|
|
|
|
|
EUR million |
| Q4’16 |
| Q4’15 |
| YoY change |
| Q3’16 |
| QoQ change |
|
Net sales - constant currency |
|
|
|
|
| (25 | )% |
|
| (13 | )% |
Net sales |
| 309 |
| 413 |
| (25 | )% | 353 |
| (12 | )% |
Gross profit |
| 287 |
| 409 |
| (30 | )% | 341 |
| (16 | )% |
Gross margin % |
| 92.9 | % | 99.0 | % | (610 | )bps | 96.6 | % | (370 | )bps |
R&D |
| (70 | ) | (73 | ) | (4 | )% | (65 | ) | 8 | % |
SG&A |
| (63 | ) | (33 | ) | 91 | % | (50 | ) | 26 | % |
Other income and expenses |
| 4 |
| 7 |
| (43 | )% | 0 |
|
|
|
Operating profit |
| 158 |
| 311 |
| (49 | )% | 225 |
| (30 | )% |
Operating margin % |
| 51.1 | % | 75.2 | % | (2 410 | )bps | 63.7 | % | (1 260 | )bps |
(1)Combined company historicals reflect Nokia’s new operating and financial reporting structure, including Alcatel-Lucent, and are presented as additional information as described in the stock exchange release published on April 22, 2016. For more information on the combined company historicals, please refer to note 1, “Basis of Preparation”, in the Financial statement information section in this report.
Financial discussion
Net sales
In the fourth quarter 2016, Nokia Technologies net sales decreased 25% year-on-year and 12% sequentially. On a constant currency basis, Nokia Technologies net sales would have decreased 25% year-on-year and decreased 13% sequentially.
Year-on-year discussion
The year-on-year decrease in Nokia Technologies net sales in the fourth quarter 2016 was primarily related to the absence of non-recurring adjustments totaling approximately EUR 200 million resulting from the settled arbitration which benefitted the year-ago quarter and, to a lesser extent, lower licensing income from certain existing licensees that experienced decreases in handset sales. This was partially offset by higher net sales related to an expanded IPR license agreement, divested IPR and the acquisition of Withings.
Sequential discussion
The sequential decrease in Nokia Technologies net sales in the fourth quarter 2016 was primarily related to the absence of approximately EUR 100 million of non-recurring net sales related to an expanded IPR license agreement and, to a lesser extent, lower licensing income from certain existing licensees that experienced decreases in handset sales. This was partially offset by higher net sales related to divested IPR and the acquisition of Withings.
Operating profit
Year-on-year discussion
The year-on-year decrease in Nokia Technologies operating profit was primarily due to lower gross profit and higher SG&A expenses, partially offset by lower R&D expenses.
The decrease in Nokia Technologies gross profit was due to lower net sales and lower gross margin. The lower gross margin was primarily due to a higher proportion of digital health and digital media net sales, both of which carry a lower gross margin than patent and brand licensing.
The decrease in Nokia Technologies R&D expenses was primarily due to lower patent portfolio costs, partially offset by higher investments in the areas of digital media and digital health.
The increase in Nokia Technologies SG&A expenses was primarily due to higher marketing costs in digital health, as well as increased licensing activities.
Sequential discussion
The sequential decrease in Nokia Technologies operating profit was primarily due to lower gross profit and higher SG&A expenses.
The decrease in Nokia Technologies gross profit was primarily due to lower net sales and lower gross margin. The lower gross margin was primarily due to a higher proportion of digital health and digital media net sales, both of which carry a lower gross margin than patent and brand licensing.
The increase in Nokia Technologies SG&A expenses was primarily due to higher marketing costs in digital health.
Group Common and Other
Net sales | Margin |
|
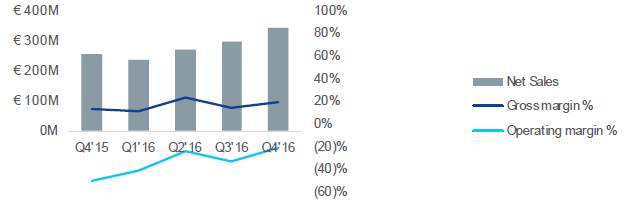
Financial highlights
|
|
|
| Combined |
|
|
|
|
|
|
|
EUR million |
| Q4’16 |
| Q4’15 |
| YoY change |
| Q3’16 |
| QoQ change |
|
Net sales - constant currency |
|
|
|
|
| 29 | % |
|
| 10 | % |
Net sales |
| 341 |
| 254 |
| 34 | % | 298 |
| 14 | % |
Gross profit |
| 64 |
| 32 |
| 100 | % | 41 |
| 56 | % |
Gross margin % |
| 18.8 | % | 12.6 | % | 620 | bps | 13.8 | % | 500 | bps |
R&D |
| (73 | ) | (77 | ) | (5 | )% | (70 | ) | 4 | % |
SG&A |
| (58 | ) | (58 | ) | 0 | % | (61 | ) | (5 | )% |
Other income and expenses |
| (6 | ) | (25 | ) | (76 | )% | (11 | ) | (45 | )% |
Operating loss |
| (73 | ) | (129 | ) | (43 | )% | (101 | ) | (28 | )% |
Operating margin % |
| (21.4 | )% | (50.8 | )% | 2 940 | bps | (33.9 | )% | 1 250 | bps |
(1)Combined company historicals reflect Nokia’s new operating and financial reporting structure, including Alcatel-Lucent, and are presented as additional information as described in the stock exchange release published on April 22, 2016. For more information on the combined company historicals, please refer to note 1, “Basis of Preparation”, in the Financial statement information section in this report.
![]()
Financial discussion
Net sales
Group Common and Other net sales increased 34% year-on-year and 14% sequentially. On a constant currency basis, Group Common and Other net sales would have increased 29% year-on-year and 10% sequentially.
Year-on-year discussion
The year-on-year increase in Group Common and Other net sales in the fourth quarter 2016 was primarily due to Alcatel Submarine Networks and, to a lesser extent, Radio Frequency Systems.
Sequential discussion
The sequential increase in Group Common and Other net sales in the fourth quarter 2016 was primarily due to Alcatel Submarine Networks.
Operating profit
Year-on-year discussion
On a year-on-year basis, in the fourth quarter 2016, Group Common and Other operating loss decreased primarily due to higher gross profit and a net positive fluctuation in other income and expenses.
The increase in Group Common and Other gross profit was primarily due to Alcatel Submarine Networks and, to a lesser extent, Radio Frequency Systems.
Group Common and Other other income and expenses was an expense of EUR 6 million in the fourth quarter 2016, compared to an expense of EUR 25 million in the year-ago quarter. On a year-on-year basis, the change was primarily due to the absence of an approximately EUR 20 million loss recorded in the fourth quarter 2015, which related to certain of Nokia’s investments made through its venture funds.
Sequential discussion
On a sequential basis, in the fourth quarter 2016, Group Common and Other operating loss decreased primarily due to higher gross profit.
The increase in Group Common and Other gross profit was primarily due to Alcatel Submarine Networks.
Group Common and Other other income and expenses was an expense of EUR 6 million in the fourth quarter 2016, compared to an expense of EUR 11 million in the third quarter 2016.
Cash and cash flow
Nokia change in net cash and other liquid assets (EUR billion)
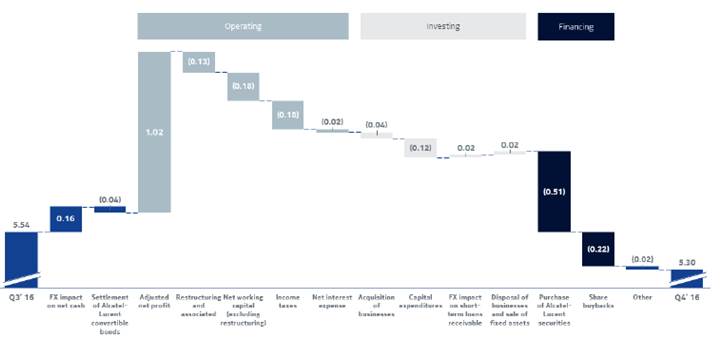
|
|
|
| Nokia |
|
|
|
|
| QoQ |
|
EUR million, at end of period |
| Q4’16 |
| Q4’15 |
| YoY change |
| Q3’16 |
| change |
|
Total cash and other liquid assets(1) |
| 9 327 |
| 9 849 |
| (5 | )% | 9 392 |
| (1 | )% |
Net cash and other liquid assets(1) |
| 5 299 |
| 7 775 |
| (32 | )% | 5 539 |
| (4 | )% |
(1)Total cash and other liquid assets consist of the following line items from our consolidated statement of financial position: Cash and cash equivalents (bank and cash as well as available-for-sale investments, cash equivalents), available-for sale investments, liquid assets and investments at fair value through profit and loss, liquid assets. Net cash and other liquid assets equals total cash and other liquid assets less long-term interest-bearing liabilities and less short-term interest-bearing liabilities. For details, please refer to note 15, “Notes to the consolidated statement of cash flows”, in the Financial statement information section in this report.
(2)Beginning from the first quarter 2016, Nokia results include those of Alcatel-Lucent on a consolidated basis. Accordingly, Nokia results beginning from the first quarter 2016 are not directly comparable to prior period Nokia standalone results.
In the fourth quarter 2016, Nokia’s total cash and other liquid assets decreased by EUR 65 million and Nokia’s net cash and other liquid assets decreased by EUR 240 million.
Foreign exchange rates had an approximately EUR 160 million positive impact on net cash.
During the fourth quarter 2016, the remaining unsettled Alcatel-Lucent convertible bonds were settled. These bonds were reclassified from interest-bearing liabilities to other liabilities in Q3 2016, and therefore, the settlement resulted in an approximately EUR 40 million negative impact to net cash in the fourth quarter 2016.
On a sequential basis, net cash and other liquid assets were affected by the following factors:
![]()
In the fourth quarter 2016, Nokia’s net cash from operating activities was approximately positive EUR 510 million:
· Nokia’s adjusted net profit before changes in net working capital was EUR 1 021 million in the fourth quarter 2016.
· Total cash outflows related to working capital were approximately EUR 310 million.
· Nokia had approximately EUR 130 million of restructuring and associated cash outflows in the fourth quarter 2016. Excluding this, net working capital generated a decrease in net cash of approximately EUR 180 million, primarily due to an increase in receivables, partially offset by decrease in inventories and an increase in short-term liabilities.
· The cash outflows related to the increase in receivables were approximately EUR 420 million.
· The cash inflows related to the decrease in inventories were approximately EUR 220 million.
· The cash inflows related to the increase in short-term liabilities were approximately EUR 20 million.
· In addition, Nokia’s cash outflows related to income taxes were approximately EUR 180 million and cash outflows of approximately EUR 20 million related to net interest. In the fourth quarter 2016, the cash outflows related to income taxes included a non-recurring tax payment of approximately EUR 90 million primarily due to the integration of the former Alcatel-Lucent and former Nokia operating models into one combined operating model.
In the fourth quarter 2016, Nokia’s net cash outflows from investing activities primarily related to decreases in net cash of approximately EUR 40 million due to the acquisition of businesses and approximately EUR 120 million due to capital expenditures, partially offset by cash inflows of approximately EUR 20 million related to the foreign exchange impact on short-term loans receivable and cash inflows of approximately EUR 20 million related to the disposal of businesses and sale of fixed assets.
In the fourth quarter 2016, Nokia’s net cash outflows from financing activities primarily related to the purchase of Alcatel-Lucent securities of approximately EUR 510 million and approximately EUR 220 million due to the commencement of Nokia’s share repurchasing program.
Nokia’s year to date performance
Components of net sales | Margin |
| Components of operating profit |
|
|
|
|
|
|
|
|
| ||
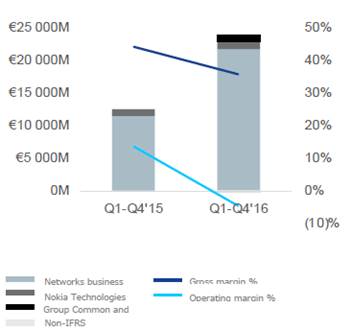

Financial highlights(1)
|
|
|
| Nokia |
|
|
|
EUR million (except EPS in EUR) |
| Q1-Q4’16 |
| Q1-Q4’15 |
| YoY change |
|
Net sales - constant currency |
|
|
|
|
| 89 | % |
Net sales |
| 23 614 |
| 12 499 |
| 89 | % |
Nokia’s Networks business |
| 21 799 |
| 11 486 |
| 90 | % |
Ultra Broadband Networks |
| 15 770 |
| 10 158 |
| 55 | % |
IP Networks and Applications |
| 6 029 |
| 1 328 |
| 354 | % |
Nokia Technologies |
| 1 053 |
| 1 027 |
| 3 | % |
Group Common and Other |
| 1 145 |
| 0 |
|
|
|
Non-IFRS exclusions |
| (331 | ) | 0 |
|
|
|
Eliminations |
| (53 | ) | (15 | ) | 253 | % |
Gross profit |
| 8 456 |
| 5 536 |
| 53 | % |
Gross margin % |
| 35.8 | % | 44.3 | % | (850 | )bps |
Operating (loss)/profit |
| (1 100 | ) | 1 697 |
|
|
|
Nokia’s Networks business |
| 1 935 |
| 1 349 |
| 43 | % |
Ultra Broadband Networks |
| 1 362 |
| 1 210 |
| 13 | % |
IP Networks and Applications |
| 573 |
| 138 |
| 315 | % |
Nokia Technologies |
| 579 |
| 698 |
| (17 | )% |
Group Common and Other |
| (341 | ) | (89 | ) | 283 | % |
Non-IFRS exclusions |
| (3 272 | ) | (261 | ) | 1 154 | % |
Operating margin % |
| (4.7 | )% | 13.6 | % | (1 830 | )bps |
Share of results from associated companies |
| 18 |
| 29 |
| (38 | )% |
Financial income and expenses |
| (287 | ) | (186 | ) | 54 | % |
Taxes (3) |
| 457 |
| (346 | ) |
|
|
(Loss)/Profit (3) |
| (912 | ) | 1 194 |
|
|
|
(Loss)/Profit attributable to the shareholders of the parent (3) |
| (751 | ) | 1 192 |
|
|
|
Non-controlling interests (3) |
| (161 | ) | 2 |
|
|
|
EPS, EUR diluted (3) |
| (0.13 | ) | 0.31 |
|
|
|
![]()
(1)Results are reported unless otherwise specified.
(2)Nokia standalone historicals are the recasting of Nokia’s historical standalone financial results, reflecting Nokia’s updated segment reporting structure, excluding Alcatel-Lucent. Beginning from the first quarter 2016, Nokia results include those of Alcatel-Lucent on a consolidated basis. Accordingly, Nokia results beginning from the first quarter 2016 are not directly comparable to prior period Nokia standalone results.
(3)Reported Q1-Q4’16 result is not comparable to the reported results published previously due to an update to the Alcatel-Lucent purchase price allocation in Q3’16 which resulted in an adjustment to the reported Q1’16 income tax benefit. Refer to note 6, “Acquisitions”, in the Financial statement information section in this report for further details.
Financial discussion
Net sales
In full year 2016, Nokia net sales increased 89% year-on-year on both a reported and constant currency basis.
The year-on-year increase in Nokia net sales in full year 2016 was primarily due to growth in Nokia’s Networks business and Group Common and Other, primarily related to the acquisition of Alcatel-Lucent and, to a lesser extent, growth in Nokia Technologies. The growth was partially offset by non-IFRS exclusions related to a reduced valuation of deferred revenue that existed on Alcatel-Lucent’s balance sheet at the time of acquisition.
Operating profit
In full year 2016, Nokia generated an operating loss, compared to an operating profit in the year-ago period, primarily due to higher R&D expenses and SG&A expenses and a net negative fluctuation in other income and expenses, partially offset by higher gross profit.
The increase in gross profit was primarily due to Nokia’s Networks business and, to a lesser extent, Group Common and Other, partially offset by non-IFRS exclusions related to valuation of inventory and deferred revenue and product portfolio integration costs, all of which primarily related to the acquisition of Alcatel-Lucent.
The increase in R&D expenses was primarily due to Nokia’s Networks business, non-IFRS exclusions related to amortization of intangible assets and, to a lesser extent, product portfolio integration costs, as well as Group Common and Other, all of which primarily related to the acquisition of Alcatel-Lucent, in addition to Nokia Technologies.
The increase in SG&A expenses was primarily due to Nokia’s Networks business, non-IFRS exclusions related to amortization of intangible assets and transaction and integration related costs and Group Common and Other, all of which primarily related to the acquisition of Alcatel-Lucent, as well as Nokia Technologies.
Nokia’s other income and expenses was an expense of EUR 833 million in full year 2016, compared to an income of EUR 12 million in the year-ago period. The change was primarily related to non-IFRS exclusions attributable to higher restructuring and associated charges and, to a lesser the extent, the absence of realized gains related to certain of Nokia’s investments made through its venture funds.
Following the acquisition of Alcatel-Lucent, our foreign exchange hedging activities were reviewed in order to develop harmonized hedging practices and simplify financial reporting. As of the first quarter 2017, all results from hedging operative forecasted net foreign exchange exposures will be recorded in other income and expenses, regardless of whether hedge accounting is applied or not. Previously, these hedging results were recorded primarily as an adjustment to net sales if cash flow hedge accounting was applied.
(Loss)/profit attributable to the shareholders of the parent
In full year 2016, Nokia generated a loss attributable to the shareholders of the parent, compared to a profit in the year-ago period, primarily due to the operating loss in full year 2016, compared to an operating profit in full year 2015 and, to a lesser extent, a net negative fluctuation in financial income and expenses, both of which primarily related to the acquisition of Alcatel-Lucent. This was partially offset by an income tax benefit, resulting from the acquisition of Alcatel-Lucent, compared to an income tax expense in full year 2015. In addition, the loss attributable to the non-controlling interests was higher, as a result of the acquisition of Alcatel-Lucent.
The net negative fluctuation in financial income and expenses in full year 2016 was primarily due to higher interest expenses and non-IFRS exclusions related to the early redemption of Alcatel-Lucent high yield bonds and, to a lesser extent, a non-cash impairment of a financial asset. This was partially offset by realized gains related to certain of Nokia’s investments made through its venture funds.
The income tax benefit was primarily related to non-IFRS exclusions, which included an approximately EUR 700 million positive impact to income taxes as a result of non-IFRS exclusions in operating profit and a non-recurring tax benefit of EUR 439 million resulting from the integration of the former Alcatel-Lucent and former Nokia operating models into one combined operating model during the fourth quarter 2016.
Descriptions of non-IFRS exclusions in full year 2016
Non-IFRS exclusions consist of costs related to the Alcatel-Lucent transaction and related integration, goodwill impairment charges, intangible asset amortization and purchase price related items, restructuring and associated charges, and certain other items that may not be indicative of Nokia’s underlying business performance. For additional details, please refer to note 2, “Non-IFRS to reported reconciliation, Continuing Operations (unaudited)”, in the Financial statement information section in this financial report.
(1)Nokia standalone historicals are the recasting of Nokia’s historical standalone financial results, reflecting Nokia’s updated segment reporting structure, excluding Alcatel-Lucent. Beginning from the first quarter 2016, Nokia results include those of Alcatel-Lucent on a consolidated basis. Accordingly, Nokia results beginning from the first quarter 2016 are not directly comparable to prior period Nokia standalone results.
(2)Reported Q1-Q4’16 result is not comparable to the reported results published previously due to an update to the Alcatel-Lucent purchase price allocation in Q3’16 which resulted in an adjustment to the reported Q1’16 income tax benefit. Refer to note 6, “Acquisitions”, in the Financial statement information section in this report for further details.
Non-IFRS exclusions in net sales
In full year 2016, non-IFRS exclusions in net sales amounted to EUR 331 million, and related to a purchase price allocation adjustment related to a reduced valuation of deferred revenue that existed on Alcatel-Lucent’s balance sheet at the time of the acquisition.
Non-IFRS exclusions in operating profit
In full year 2016, non-IFRS exclusions in operating profit amounted to EUR 3 272 million, and were attributable to non-IFRS exclusions that negatively affected gross profit, R&D, SG&A and other income and expenses as follows:
In full year 2016, non-IFRS exclusions in gross profit amounted to EUR 1 133 million, and primarily related to the increased valuation of inventory that existed on Alcatel-Lucent’s balance sheet at the time of the acquisition and the deferred revenue. The increased valuation of inventory resulted in non-recurring higher cost of sales and lower gross profit when the inventory was sold. In addition, the non-IFRS exclusions from gross profit included product portfolio integration related costs resulting from the acquisition of Alcatel-Lucent.
In full year 2016, non-IFRS exclusions in R&D expenses amounted to EUR 683 million, and primarily related to the amortization of intangible assets and, to a lesser extent, product portfolio integration costs resulting from the acquisition of Alcatel-Lucent.
In full year 2016, non-IFRS exclusions in SG&A expenses amounted to EUR 685 million, and primarily related to the amortization of intangible assets resulting from the acquisition of Alcatel-Lucent transaction, as well as transaction and integration related costs.
In full year 2016, non-IFRS exclusions in other income and expenses amounted to an expense of EUR 772 million, and primarily related to EUR 759 million of restructuring and associated charges.
Non-IFRS exclusions in profit attributable to the shareholders of the parent
In full year 2016, non-IFRS exclusions in profit attributable to the shareholders of the parent amounted to EUR 2 027 million, and was primarily related to the non-IFRS exclusions in operating profit. In addition, non-IFRS exclusions affected financial income and expenses and income taxes as follows:
In full year 2016, non-IFRS exclusions in financial income and expenses amounted to an expense of EUR 41 million, and primarily related to the early redemption of the Alcatel-Lucent 2017 and 2020 high yield bonds in February 2016.
In full year 2016, non-IFRS exclusions in income taxes amounted to a benefit of EUR 1 151 million. The benefit was primarily due to an approximately EUR 700 million positive impact to income taxes as a result of non-IFRS exclusions in operating profit and a non-recurring tax benefit of EUR 439 million resulting from the integration of the former Alcatel-Lucent and former Nokia operating models into one combined operating model during the fourth quarter 2016.
Nokia’s Networks business
Net sales | Margin |
| Services — Net sales |
|
|
|
| ||
|
|
| ||
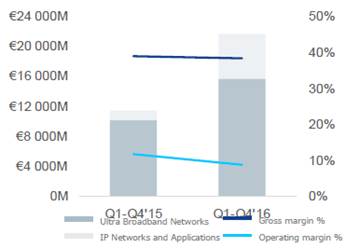
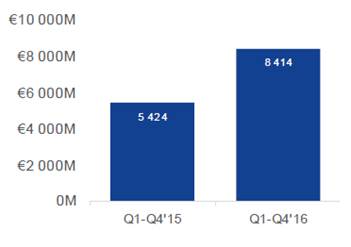
Financial highlights(1)
|
|
|
| Nokia standalone |
|
|
|
EUR million |
| Q1-Q4’16 |
| Q1-Q4’15 |
| YoY change |
|
Net sales - constant currency |
|
|
|
|
| 90 | % |
Net sales |
| 21 799 |
| 11 486 |
| 90 | % |
Gross profit |
| 8 386 |
| 4 481 |
| 87 | % |
Gross margin % |
| 38.5 | % | 39.0 | % | (50 | )bps |
R&D |
| (3 691 | ) | (1 739 | ) | 112 | % |
SG&A |
| (2 720 | ) | (1 421 | ) | 91 | % |
Other income and expenses |
| (40 | ) | 26 |
|
|
|
Operating profit |
| 1 935 |
| 1 349 |
| 43 | % |
Operating margin % |
| 8.9 | % | 11.7 | % | (280 | )bps |
(1)Results are reported unless otherwise specified.
(2)Nokia standalone historicals are the recasting of Nokia’s historical standalone financial results, reflecting Nokia’s updated segment reporting structure, excluding Alcatel-Lucent. Beginning from the first quarter 2016, Nokia results include those of Alcatel-Lucent on a consolidated basis. Accordingly, Nokia results beginning from the first quarter 2016 are not directly comparable to prior period Nokia standalone results.
Net sales by region
|
|
|
| Nokia standalone |
|
|
|
EUR million |
| Q1-Q4’16 |
| Q1-Q4’15 |
| YoY change |
|
Asia-Pacific |
| 4 215 |
| 3 231 |
| 30 | % |
Europe |
| 4 881 |
| 2 805 |
| 74 | % |
Greater China |
| 2 640 |
| 1 710 |
| 54 | % |
Latin America |
| 1 444 |
| 970 |
| 49 | % |
Middle East & Africa |
| 1 889 |
| 1 177 |
| 60 | % |
North America |
| 6 730 |
| 1 594 |
| 322 | % |
Total |
| 21 799 |
| 11 486 |
| 90 | % |
(1)Nokia standalone historicals are the recasting of Nokia’s historical standalone financial results, reflecting Nokia’s updated segment reporting structure, excluding Alcatel-Lucent. Beginning from the first quarter 2016, Nokia results include those of Alcatel-Lucent on a consolidated basis. Accordingly, Nokia results beginning from the first quarter 2016 are not directly comparable to prior period Nokia standalone results.
Net sales by region – Q1-Q4’16 |
| Net sales – Q1-Q4’15 vs Q1-Q4’16 |
|
|
|
|
|
|
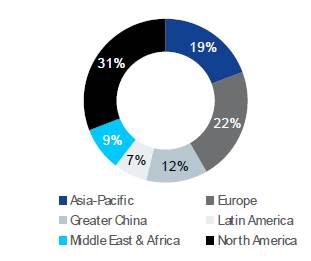
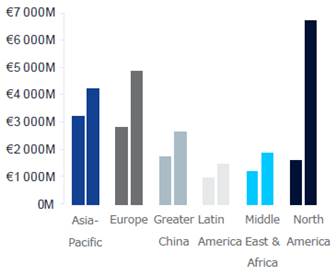
Financial discussion
Net sales by segment
In full year 2016, Nokia’s Networks business net sales increased 90% year-on-year on both a reported and constant currency basis.
The year-on-year increase in Nokia’s Networks business net sales in full year 2016 was driven by growth in both Ultra Broadband Networks and IP Networks and Applications, primarily related to the acquisition of Alcatel-Lucent.
On a regional basis, in full year 2016, Nokia’s Networks business net sales increased across all regions, with particularly strong growth in North America and Europe, primarily due to the acquisition of Alcatel-Lucent.
Operating profit
On a year-on-year basis, in full year 2016, Nokia’s Networks business operating profit increased primarily due to higher gross profit, partially offset by higher R&D expenses and SG&A expenses.
The higher gross profit was due to both IP Networks and Applications and Ultra Broadband Networks, primarily related to the acquisition of Alcatel-Lucent.
The higher R&D expenses were due to both IP Networks and Applications and Ultra Broadband Networks, primarily related to the acquisition of Alcatel-Lucent.
The higher SG&A expenses were due to both Ultra Broadband Networks and IP Networks and Applications, primarily related to the acquisition of Alcatel-Lucent.
Nokia’s Networks business other income and expenses was an expense of EUR 40 million in full year 2016, compared to an income of EUR 26 million in full year 2015. On a year-on-year basis, the change was due to both Ultra Broadband Networks and IP Networks and Applications, primarily related to doubtful accounts allowances.
Ultra Broadband Networks
Net sales Margin |
|
|
|
|
|
| ||
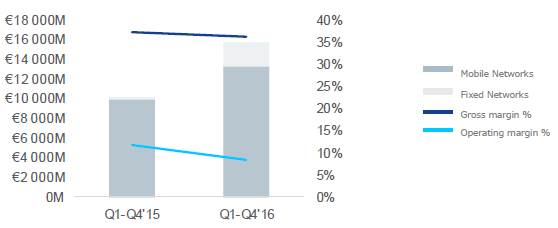
Financial highlights(1)
|
|
|
| Nokia |
|
|
|
EUR million |
| Q1-Q4’16 |
| Q1-Q4’15 |
| YoY change |
|
Net sales - constant currency |
|
|
|
|
| 55 | % |
Net sales |
| 15 770 |
| 10 158 |
| 55 | % |
Mobile Networks |
| 13 405 |
| 10 022 |
| 34 | % |
Fixed Networks |
| 2 365 |
| 136 |
| 1 639 | % |
Gross profit |
| 5 727 |
| 3 805 |
| 51 | % |
Gross margin % |
| 36.3 | % | 37.5 | % | (120 | )bps |
R&D |
| (2 405 | ) | (1 470 | ) | 64 | % |
SG&A |
| (1 936 | ) | (1 147 | ) | 69 | % |
Other income and expenses |
| (24 | ) | 22 |
|
|
|
Operating profit |
| 1 362 |
| 1 210 |
| 13 | % |
Operating margin % |
| 8.6 | % | 11.9 | % | (330 | )bps |
(1)Results are reported unless otherwise specified.
(2)Nokia standalone historicals are the recasting of Nokia’s historical standalone financial results, reflecting Nokia’s updated segment reporting structure, excluding Alcatel-Lucent. Beginning from the first quarter 2016, Nokia results include those of Alcatel-Lucent on a consolidated basis. Accordingly, Nokia results beginning from the first quarter 2016 are not directly comparable to prior period Nokia standalone results.
Net sales by region
|
|
|
| Nokia standalone |
|
|
|
EUR million |
| Q1-Q4’16 |
| Q1-Q4’15 |
| YoY change |
|
Asia-Pacific |
| 3 186 |
| 2 889 |
| 10 | % |
Europe |
| 3 156 |
| 2 456 |
| 29 | % |
Greater China |
| 2 187 |
| 1 485 |
| 47 | % |
Latin America |
| 936 |
| 847 |
| 11 | % |
Middle East & Africa |
| 1 469 |
| 1 050 |
| 40 | % |
North America |
| 4 836 |
| 1 431 |
| 238 | % |
Total |
| 15 770 |
| 10 158 |
| 55 | % |
(1)Nokia standalone historicals are the recasting of Nokia’s historical standalone financial results, reflecting Nokia’s updated segment reporting structure, excluding Alcatel-Lucent. Beginning from the first quarter 2016, Nokia results include those of Alcatel-Lucent on a consolidated basis. Accordingly, Nokia results beginning from the first quarter 2016 are not directly comparable to prior period Nokia standalone results.
Financial discussion
Net sales
In full year 2016, Ultra Broadband Networks net sales increased 55% year-on-year on both a reported and constant currency basis.
The year-on-year increase in Ultra Broadband Networks net sales in full year 2016 was due to both Mobile Networks and Fixed Networks, primarily related to the acquisition of Alcatel-Lucent.
Operating profit
On a year-on-year basis, in full year 2016, Ultra Broadband Networks operating profit increased, primarily due to higher gross profit, partially offset by higher R&D and SG&A expenses and, to a lesser extent, a net negative fluctuation in other income and expenses.
The increases in Ultra Broadband Networks gross profit, R&D expenses and SG&A expenses were all primarily due to the acquisition of Alcatel-Lucent.
Ultra Broadband Networks other income and expenses was an expense of EUR 24 million in full year 2016, compared to an income of EUR 22 million in full year 2015. On a year-on-year basis, the change was primarily due to doubtful accounts allowances.
IP Networks and Applications
Net sales Margin |
|
|
|
|
|
| ||
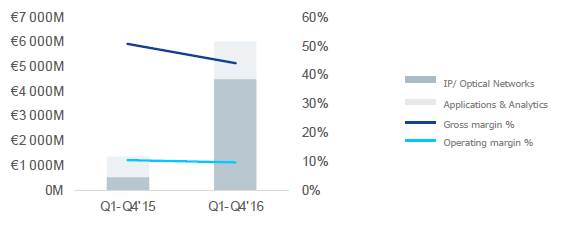
Financial highlights(1)
|
|
|
| Nokia |
|
|
|
EUR million |
| Q1-Q4’16 |
| Q1-Q4’15 |
| YoY change |
|
Net sales - constant currency |
|
|
|
|
| 353 | % |
Net sales |
| 6 029 |
| 1 328 |
| 354 | % |
IP/Optical Networks |
| 4 502 |
| 515 |
| 774 | % |
IP Routing |
| 2 941 |
| 515 |
| 471 | % |
Optical Networks |
| 1 562 |
| 0 |
|
|
|
Applications & Analytics |
| 1 527 |
| 813 |
| 88 | % |
Gross profit |
| 2 659 |
| 676 |
| 293 | % |
Gross margin % |
| 44.1 | % | 50.9 | % | (680 | )bps |
R&D |
| (1 285 | ) | (269 | ) | 378 | % |
SG&A |
| (784 | ) | (274 | ) | 186 | % |
Other income and expenses |
| (16 | ) | 4 |
|
|
|
Operating profit |
| 573 |
| 138 |
| 315 | % |
Operating margin % |
| 9.5 | % | 10.4 | % | (90 | )bps |
(1)Results are reported unless otherwise specified.
(2)Nokia standalone historicals are the recasting of Nokia’s historical standalone financial results, reflecting Nokia’s updated segment reporting structure, excluding Alcatel-Lucent. Beginning from the first quarter 2016, Nokia results include those of Alcatel-Lucent on a consolidated basis. Accordingly, Nokia results beginning from the first quarter 2016 are not directly comparable to prior period Nokia standalone results.
Net sales by region
|
|
|
| Nokia standalone |
|
|
|
EUR million |
| Q1-Q4’16 |
| Q1-Q4’15 |
| YoY change |
|
Asia-Pacific |
| 1 029 |
| 342 |
| 201 | % |
Europe |
| 1 725 |
| 349 |
| 394 | % |
Greater China |
| 453 |
| 224 |
| 102 | % |
Latin America |
| 508 |
| 123 |
| 313 | % |
Middle East & Africa |
| 419 |
| 127 |
| 230 | % |
North America |
| 1 894 |
| 163 |
| 1 062 | % |
Total |
| 6 029 |
| 1 328 |
| 354 | % |
(1)Nokia standalone historicals are the recasting of Nokia’s historical standalone financial results, reflecting Nokia’s updated segment reporting structure, excluding Alcatel-Lucent. Beginning from the first quarter 2016, Nokia results include those of Alcatel-Lucent on a consolidated basis. Accordingly, Nokia results beginning from the first quarter 2016 are not directly comparable to prior period Nokia standalone results.
Financial discussion
Net sales
In full year 2016, IP Networks and Applications net sales increased 354% year-on-year. On a constant currency basis, IP Networks and Applications net sales would have increased 353% year-on-year.
The year-on-year increase in IP Networks and Applications net sales in full year 2016 was primarily due to IP/Optical Networks and, to a lesser extent, Applications & Analytics, primarily related to the acquisition of Alcatel-Lucent.
Operating profit
On a year-on-year basis, in full year 2016, IP Networks and Applications operating profit increased, primarily due to higher gross profit, partially offset by higher R&D and SG&A expenses.
The increases in IP Networks and Applications gross profit, R&D expenses and SG&A expenses were all primarily due to the acquisition of Alcatel-Lucent.
IP Networks and Applications other income and expenses was an expense of EUR 16 million in full year 2016, compared to an income of EUR 4 million in full year 2015. On a year-on-year basis, the change was primarily due to doubtful accounts allowances.
Nokia Technologies
Net sales Margin |
|
|
|
|
|
| ||
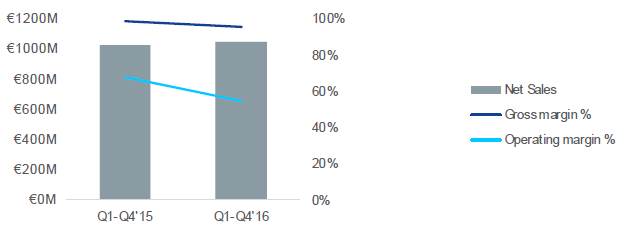
Financial highlights(1)
|
|
|
| Nokia standalone |
|
|
|
EUR million |
| Q1-Q4’16 |
| Q1-Q4’15 |
| YoY change |
|
Net sales - constant currency |
|
|
|
|
| 3 | % |
Net sales |
| 1 053 |
| 1 027 |
| 3 | % |
Gross profit |
| 1 011 |
| 1 020 |
| (1 | )% |
Gross margin % |
| 96.0 | % | 99.3 | % | (330 | )bps |
R&D |
| (250 | ) | (220 | ) | 14 | % |
SG&A |
| (184 | ) | (108 | ) | 70 | % |
Other income and expenses |
| 1 |
| 7 |
| (86 | )% |
Operating profit |
| 579 |
| 698 |
| (17 | )% |
Operating margin % |
| 55.0 | % | 68.0 | % | (1 300 | )bps |
(1)Results are reported unless otherwise specified.
(2)Nokia standalone historicals are the recasting of Nokia’s historical standalone financial results, reflecting Nokia’s updated segment reporting structure, excluding Alcatel-Lucent. Beginning from the first quarter 2016, Nokia results include those of Alcatel-Lucent on a consolidated basis. Accordingly, Nokia results beginning from the first quarter 2016 are not directly comparable to prior period Nokia standalone results.
Financial discussion
Net sales
In full year 2016, Nokia Technologies net sales increased 3% year-on-year on both a reported and constant currency basis.
The year-on-year increase in Nokia Technologies net sales in full year 2016 was primarily due to higher IPR licensing income and the acquisition of Withings. This was partially offset by the absence of non-recurring
adjustments to accrued net sales from existing and new agreements, and lower licensing income from certain existing licensees.
Operating profit
The year-on-year decrease in Nokia Technologies operating profit for full year 2016 was primarily due to higher SG&A and R&D expenses.
The increase in R&D expenses in Nokia Technologies was primarily due to the inclusion of Bell Labs’ patent portfolio costs, resulting from the acquisition of Alcatel-Lucent, and higher investments in the areas of digital media and digital health. The higher R&D expenses in digital health was primarily due to the acquisition of Withings. This was partially offset by the focusing of general research investments towards more specific opportunities.
The increase in Nokia Technologies SG&A expenses was primarily due to the ramp-up of digital health and digital media, higher business support costs and increased licensing activity. The higher SG&A expenses in digital health was primarily due to the acquisition of Withings.
Group Common and Other
Net sales Margin
|
|
|
Financial highlights(1)
|
|
|
| Nokia standalone |
|
|
|
EUR million |
| Q1-Q4’16 |
| Q1-Q4’15 |
| YoY change |
|
Net sales - constant currency |
|
|
|
|
|
|
|
Net sales |
| 1 145 |
| 0 |
|
|
|
Gross profit |
| 192 |
| 0 |
|
|
|
Gross margin % |
| 16.8 | % | 0.0 | % | 1 680 | bps |
R&D |
| (282 | ) | (84 | ) | 236 | % |
SG&A |
| (230 | ) | (97 | ) | 137 | % |
Other income and expenses |
| (21 | ) | 92 |
|
|
|
Operating loss |
| (341 | ) | (89 | ) | 283 | % |
Operating margin % |
| (29.8 | )% |
|
|
|
|
(1)Results are reported unless otherwise specified.
(2)Nokia standalone historicals are the recasting of Nokia’s historical standalone financial results, reflecting Nokia’s updated segment reporting structure, excluding Alcatel-Lucent. Beginning from the first quarter 2016, Nokia results include those of Alcatel-Lucent on a consolidated basis. Accordingly, Nokia results beginning from the first quarter 2016 are not directly comparable to prior period Nokia standalone results.
Financial discussion
Net sales
Group Common and Other net sales increased to EUR 1 145 million in full year 2016, compared to approximately zero in full year 2015.
The year-on-year increase in Group Common and Other net sales in full year 2016 was primarily due Alcatel Submarine Networks and Radio Frequency Systems net sales, both of which related to the acquisition of Alcatel-Lucent.
Operating profit
On a year-on-year basis, in full year 2016, Group Common and Other operating loss increased, primarily due to higher R&D and SG&A expenses and a net negative fluctuation in other income and expenses, partially offset by higher gross profit.
The increase in Group Common and Other gross profit was primarily due to higher gross profit in Alcatel Submarine Networks and Radio Frequency Systems, both of which related to the acquisition of Alcatel-Lucent.
Group Common and Other R&D expenses increased on a year-on-year basis, primarily due to Bell Labs, related to the acquisition of Alcatel-Lucent.
The increase in Group Common and Other SG&A expenses was primarily due to higher central function costs, related to the acquisition of Alcatel-Lucent.
Group Common and Other other income and expenses was an expense of EUR 21 million in full year 2016, compared to an income of EUR 92 million in full year 2015. On a year-on-year basis, the change was primarily due to the absence of realized gains related to certain of Nokia’s investments made through its venture funds and, to a lesser extent, the non-cash impairment of a financial asset.
Cash and cash flow
Nokia change in net cash and other liquid assets
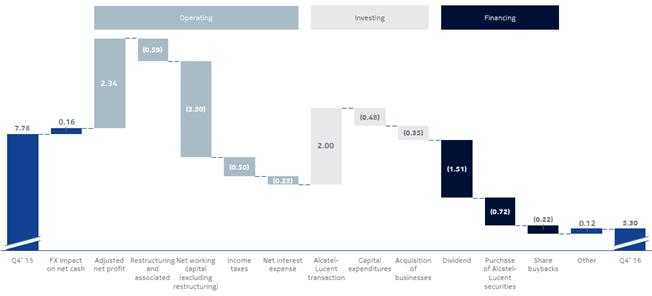
|
|
|
| Nokia standalone |
|
|
|
EUR million, at end of period |
| Q4’16 |
| Q4’15 |
| YTD change |
|
Total cash and other liquid assets(1) |
| 9 327 |
| 9 849 |
| (5 | )% |
Net cash and other liquid assets(1) |
| 5 299 |
| 7 775 |
| (32 | )% |
(1)Total cash and other liquid assets consist of the following line items from our consolidated statement of financial position: Cash and cash equivalents (bank and cash as well as available-for-sale investments, cash equivalents), available-for sale investments, liquid assets and investments at fair value through profit and loss, liquid assets. Net cash and other liquid assets equals total cash and other liquid assets less long-term interest-bearing liabilities and less short-term interest-bearing liabilities. For details, please refer to note 15, “Notes to the consolidated statement of cash flows”, in the Financial statement information section in this report.
(2)Beginning from the first quarter 2016, Nokia results include those of Alcatel-Lucent on a consolidated basis. Accordingly, Nokia results beginning from the first quarter 2016 are not directly comparable to prior period Nokia standalone results.
In full year 2016, Nokia’s total cash and other liquid assets decreased by EUR 522 million and Nokia’s net cash and other liquid assets decreased by EUR 2 476 million. Nokia’s total cash and other liquid assets decreased EUR 1 954 million less than Nokia’s net cash and other liquid assets, primarily due to the acquisition of Alcatel-Lucent, partially offset by the redemption of Alcatel-Lucent notes and convertible bonds.
Foreign exchange rates had an approximately EUR 160 million positive impact on net cash.
Compared to the end of 2015, net cash and other liquid assets were affected by the following factors:
In full year 2016, Nokia’s net cash from operating activities was negative EUR 1.5 billion:
· Nokia’s adjusted net profit before changes in net working capital was EUR 2 334 million in full year 2016.
· Total cash outflows related to working capital of approximately EUR 3.1 billion.
· Nokia had approximately EUR 590 million of restructuring and associated cash outflows in full year 2016. Excluding this, net working capital generated a decrease in net cash of approximately EUR 2.5 billion, primarily due to a decrease in short-term liabilities, partially offset by a decrease in inventories and decrease in receivables.
· The cash outflows related to short-term liabilities of approximately EUR 2.5 billion were negatively affected by amounts presented as separate adjustments to net profit in relation to restructuring charges and working capital charges related to the Alcatel-Lucent purchase price allocation. The remaining cash outflows were primarily impacted by a decline in accounts payable of approximately EUR 430 million (of which approximately EUR 350 million related to our actions to harmonize working capital processes and practices, particularly in the area of payables), the payment of incentives related to Alcatel-Lucent’s and Nokia’s strong business performance in 2015, the termination of Alcatel-Lucent’s license agreement with Qualcomm which resulted in approximately EUR 280 million of cash outflows and a negative impact of foreign exchange fluctuations on certain balance sheet items.
· The cash inflows related to the decrease in inventories were approximately EUR 20 million.
· The cash inflows related to the decrease in receivables were approximately EUR 20 million. There were offsetting large items. First, an increase in receivables resulting from the approximately EUR 1.0 billion reduction in the sale of receivables (debt-like items), in accordance with our Capital Structure Optimization Program. This was offset by cash inflows related to an overall decline in receivables and cash inflows related to the catch-up payment from the Samsung arbitration award, announced on February 1, 2016.
· In addition, Nokia’s cash outflows related to income taxes were approximately EUR 500 million and cash outflows related to net interest were approximately EUR 220 million. In the fourth quarter 2016, the cash outflows related to income taxes included a non-recurring tax payment of approximately EUR 90 million primarily due to the integration of the former Alcatel-Lucent and former Nokia operating models into one combined operating model.
In full year 2016, Nokia’s net cash inflows from investing activities primarily related to an increase in net cash of approximately EUR 2.0 billion related to the acquired net cash and other liquid assets of Alcatel-Lucent. This was partially offset by decreases of net cash of approximately EUR 480 million due to capital expenditures and approximately EUR 350 million due to acquisition of businesses.
In full year 2016, Nokia’s net cash outflows from financing activities primarily related to the payment of the ordinary and special dividends, amounting to approximately EUR 1.5 billion, a decrease in net cash of approximately EUR 720 million related to the purchase of Alcatel-Lucent shares and the equity component of
the purchased Alcatel-Lucent convertible bonds and a decrease in net cash of approximately EUR 220 million due to the commencement of Nokia’s share repurchasing program.
Shares
On November 15, 2016, in line with its previously announced EUR 7 billion capital structure optimization program, the Nokia Board of Directors resolved to commence a share repurchase program under the authorization granted by the Nokia Annual General Meeting on June 16, 2016. The Board resolved to repurchase a maximum of 575 million Nokia shares up to an equivalent of EUR 1 billion. The program and the authorization granted by the Nokia Annual General Meeting on June 16, 2016 are valid until December 16, 2017.
The total number of Nokia shares on December 31, 2016, equaled 5 836 055 012. On December 31, 2016, Nokia and its subsidiary companies owned 115 551 878 Nokia shares, representing approximately 2.0% of the total number of Nokia shares and voting rights.
Dividend
Nokia’s Board of Director’s will propose a dividend of EUR 0.17 for the year ended December 31, 2016. The distributable funds on the balance sheet of the parent company as at December 31, 2016 amounted to EUR 19 628 million.
Consolidated income statement (condensed, unaudited)
|
| Reported |
| Reported |
| Reported |
| Reported |
| Reported |
| Non- |
| Non- |
| Non- |
| Non- |
| Non- |
|
EUR million |
| Q4’16 |
| Q4’15 |
| Q3’16 |
| Q4’16 |
| Q4’15 |
| Q4’16 |
| Q4’15 |
| Q3’16 |
| Q4’16 |
| Q4’15 |
|
Net sales (notes 2, 3, 4) |
| 6 641 |
| 3 609 |
| 5 890 |
| 23 614 |
| 12 499 |
| 6 715 |
| 3 609 |
| 5 950 |
| 23 945 |
| 12 499 |
|
Cost of sales |
| (3 983 | ) | (1 916 | ) | (3 674 | ) | (15 157 | ) | (6 962 | ) | (3 897 | ) | (1 916 | ) | (3 586 | ) | (14 356 | ) | (6 998 | ) |
Gross profit (notes 2, 3) |
| 2 659 |
| 1 693 |
| 2 216 |
| 8 456 |
| 5 536 |
| 2 818 |
| 1 693 |
| 2 365 |
| 9 589 |
| 5 501 |
|
Research and development expenses |
| (1 260 | ) | (540 | ) | (1 196 | ) | (4 904 | ) | (2 080 | ) | (1 075 | ) | (531 | ) | (1 017 | ) | (4 222 | ) | (2 042 | ) |
Selling, general and administrative expenses |
| (971 | ) | (507 | ) | (925 | ) | (3 819 | ) | (1 771 | ) | (809 | ) | (437 | ) | (781 | ) | (3 134 | ) | (1 626 | ) |
Other income and expenses (note 10) |
| (110 | ) | (3 | ) | (39 | ) | (833 | ) | 12 |
| 6 |
| 11 |
| (11 | ) | (61 | ) | 126 |
|
Operating profit/(loss) (notes 2, 3) |
| 317 |
| 643 |
| 55 |
| (1 100 | ) | 1 697 |
| 940 |
| 736 |
| 556 |
| 2 172 |
| 1 958 |
|
Share of results of associated companies and joint ventures (note 13) |
| 11 |
| 17 |
| 3 |
| 18 |
| 29 |
| 11 |
| 17 |
| 3 |
| 18 |
| 29 |
|
Financial income and expenses (note 10) |
| (72 | ) | (46 | ) | (80 | ) | (287 | ) | (186 | ) | (72 | ) | (46 | ) | (78 | ) | (246 | ) | (186 | ) |
Profit/(loss) before tax (note 2) |
| 257 |
| 615 |
| (22 | ) | (1 369 | ) | 1 540 |
| 879 |
| 707 |
| 480 |
| 1 944 |
| 1 800 |
|
Income tax benefit/(expense) (1) |
| 401 |
| (115 | ) | (111 | ) | 457 |
| (346 | ) | (204 | ) | (132 | ) | (216 | ) | (695 | ) | (409 | ) |
Profit/(loss) from continuing operations (note 2) (1) |
| 658 |
| 499 |
| (133 | ) | (912 | ) | 1 194 |
| 676 |
| 575 |
| 264 |
| 1 250 |
| 1 392 |
|
Profit/(loss) attributable to equity holders of the parent (1) |
| 659 |
| 498 |
| (119 | ) | (751 | ) | 1 192 |
| 672 |
| 574 |
| 258 |
| 1 276 |
| 1 390 |
|
Non-controlling interests (1) |
| 0 |
| 1 |
| (14 | ) | (161 | ) | 2 |
| 4 |
| 1 |
| 6 |
| (26 | ) | 2 |
|
(Loss)/Profit from discontinued operations (note 7) |
| (26 | ) | 1 292 |
| (6 | ) | (15 | ) | 1 274 |
| (1 | ) | 59 |
| 0 |
| (1 | ) | 127 |
|
(Loss)/Profit attributable to equity holders of the parent |
| (26 | ) | 1 292 |
| (6 | ) | (15 | ) | 1 274 |
| (1 | ) | 59 |
| 0 |
| (1 | ) | 127 |
|
Non-controlling interests |
| 0 |
| 0 |
| 0 |
| 0 |
| 0 |
| 0 |
| 0 |
| 0 |
| 0 |
| 0 |
|
Profit/(loss) for the period (1) |
| 633 |
| 1 791 |
| (139 | ) | (927 | ) | 2 468 |
| 674 |
| 634 |
| 264 |
| 1 248 |
| 1 518 |
|
Profit/(loss) attributable to equity holders of the parent (1) |
| 633 |
| 1 790 |
| (125 | ) | (766 | ) | 2 466 |
| 670 |
| 633 |
| 258 |
| 1 275 |
| 1 516 |
|
Non-controlling interests (1) |
| 0 |
| 1 |
| (14 | ) | (161 | ) | 2 |
| 4 |
| 1 |
| 6 |
| (26 | ) | 2 |
|
Earnings per share, EUR (for profit/(loss) attributable to equity holders of the parent) |
|
|
|
|
|
|
|
|
|
|
|
|
|
|
|
|
|
|
|
|
|
Basic earnings per share |
|
|
|
|
|
|
|
|
|
|
|
|
|
|
|
|
|
|
|
|
|
Continuing operations (1) |
| 0.11 |
| 0.13 |
| (0.02 | ) | (0.13 | ) | 0.32 |
| 0.12 |
| 0.15 |
| 0.04 |
| 0.22 |
| 0.38 |
|
Discontinued operations |
| 0.00 |
| 0.34 |
| 0.00 |
| 0.00 |
| 0.35 |
| 0.00 |
| 0.02 |
| 0.00 |
| 0.00 |
| 0.03 |
|
Profit/(loss) for the period (1) |
| 0.11 |
| 0.47 |
| (0.02 | ) | (0.13 | ) | 0.67 |
| 0.12 |
| 0.17 |
| 0.04 |
| 0.22 |
| 0.41 |
|
Diluted earnings per share |
|
|
|
|
|
|
|
|
|
|
|
|
|
|
|
|
|
|
|
|
|
Continuing operations (1) |
| 0.11 |
| 0.13 |
| (0.02 | ) | (0.13 | ) | 0.31 |
| 0.12 |
| 0.15 |
| 0.04 |
| 0.22 |
| 0.36 |
|
Discontinued operations |
| 0.00 |
| 0.33 |
| 0.00 |
| 0.00 |
| 0.32 |
| 0.00 |
| 0.01 |
| 0.00 |
| 0.00 |
| 0.03 |
|
Profit/(loss) for the period (1) |
| 0.11 |
| 0.45 |
| (0.02 | ) | (0.13 | ) | 0.63 |
| 0.12 |
| 0.16 |
| 0.04 |
| 0.22 |
| 0.39 |
|
Average number of shares (‘000 shares) |
|
|
|
|
|
|
|
|
|
|
|
|
|
|
|
|
|
|
|
|
|
Basic |
| 5 759 667 |
| 3 793 985 |
| 5 773 119 |
| 5 732 371 |
| 3 670 934 |
| 5 759 667 |
| 3 793 985 |
| 5 773 119 |
| 5 732 371 |
| 3 670 934 |
|
Diluted |
| 5 778 332 |
| 3 947 477 |
| 5 773 119 |
| 5 741 117 |
| 3 949 312 |
| 5 778 332 |
| 3 947 477 |
| 5 791 792 |
| 5 756 308 |
| 3 949 312 |
|
Interest expense, net of tax, on convertible bonds |
| 0 |
| (3 | ) | 0 |
| 0 |
| (36 | ) | 0 |
| (3 | ) | 0 |
| 0 |
| (36 | ) |
From continuing operations: |
|
|
|
|
|
|
|
|
|
|
|
|
|
|
|
|
|
|
|
|
|
Depreciation and amortization (notes 2, 3) |
| (402 | ) | (75 | ) | (375 | ) | (1 594 | ) | (286 | ) | (119 | ) | (54 | ) | (135 | ) | (552 | ) | (207 | ) |
(1) Reported Q1-Q4’16 result is not comparable to the reported results published previously due to an update to the Alcatel-Lucent purchase price allocation in Q3’16 which resulted in an adjustment to the Reported Q1’16 income tax benefit. Refer to note 6, “Acquisitions”, for further details.
The notes are an integral part of these consolidated financial statements. Beginning from the first quarter 2016, Nokia results include those of Alcatel-Lucent on a consolidated basis. Accordingly, Nokia results beginning from the first quarter 2016 are not directly comparable to prior period Nokia standalone results.
Consolidated statement of comprehensive income (condensed, unaudited)
|
| Reported |
| Reported |
| Reported |
| Reported |
| Reported |
|
EUR million |
| Q4’16 |
| Q4’15 |
| Q3’16 |
| Q1-Q4’16 |
| Q1-Q4’15 |
|
|
|
|
|
|
|
|
|
|
|
|
|
Profit/(loss) for the period (1) |
| 633 |
| 1 791 |
| (139 | ) | (927 | ) | 2 468 |
|
|
|
|
|
|
|
|
|
|
|
|
|
Other comprehensive income |
|
|
|
|
|
|
|
|
|
|
|
Items that will not be reclassified to profit or loss: |
|
|
|
|
|
|
|
|
|
|
|
Remeasurements on defined benefit pensions |
| 708 |
| 17 |
| 278 |
| 613 |
| 112 |
|
Income tax related to items that will not be reclassified to profit or loss |
| (263 | ) | (7 | ) | (107 | ) | (270 | ) | (28 | ) |
Items that may be reclassified subsequently to profit or loss: |
|
|
|
|
|
|
|
|
|
|
|
Translation differences |
| 711 |
| (1 497 | ) | (94 | ) | 251 |
| (1 054 | ) |
Net investment hedges |
| (141 | ) | 474 |
| 19 |
| (103 | ) | 323 |
|
Cash flow hedges |
| 33 |
| (23 | ) | (3 | ) | 14 |
| (5 | ) |
Available-for-sale investments (note 10) |
| 16 |
| 91 |
| 18 |
| (75 | ) | 113 |
|
Other (decrease)/increase, net |
| (4 | ) | (1 | ) | 0 |
| (5 | ) | 1 |
|
Income tax related to items that may be reclassified subsequently to profit or loss |
| 20 |
| (111 | ) | (5 | ) | 20 |
| (88 | ) |
|
|
|
|
|
|
|
|
|
|
|
|
Other comprehensive income/(expense), net of tax |
| 1 080 |
| (1 057 | ) | 106 |
| 445 |
| (626 | ) |
|
|
|
|
|
|
|
|
|
|
|
|
Total comprehensive income/(expense) (1) |
| 1 713 |
| 734 |
| (33 | ) | (482 | ) | 1 842 |
|
|
|
|
|
|
|
|
|
|
|
|
|
Attributable to: |
|
|
|
|
|
|
|
|
|
|
|
Equity holders of the parent (1) |
| 1 697 |
| 732 |
| (19 | ) | (277 | ) | 1 837 |
|
Non-controlling interests (1) |
| 15 |
| 2 |
| (14 | ) | (205 | ) | 5 |
|
|
| 1 713 |
| 734 |
| (33 | ) | (482 | ) | 1 842 |
|
|
|
|
|
|
|
|
|
|
|
|
|
Attributable to equity holders of the parent: |
|
|
|
|
|
|
|
|
|
|
|
Continuing operations (1) |
| 1 723 |
| 584 |
| (13 | ) | (262 | ) | 1 513 |
|
Discontinued operations (note 7) |
| (26 | ) | 148 |
| (6 | ) | (15 | ) | 324 |
|
|
| 1 697 |
| 732 |
| (19 | ) | (277 | ) | 1 837 |
|
Attributable to non-controlling interest: |
|
|
|
|
|
|
|
|
|
|
|
Continuing operations (1) |
| 15 |
| 2 |
| (14 | ) | (205 | ) | 5 |
|
Discontinued operations (note 7) |
| 0 |
| 0 |
| 0 |
| 0 |
| 0 |
|
|
| 15 |
| 2 |
| (14 | ) | (205 | ) | 5 |
|
(1) Reported Q1-Q4’16 result is not comparable to the reported results published previously due to an update to the Alcatel-Lucent purchase price allocation in Q3’16 which resulted in an adjustment to the Reported Q1’16 income tax benefit. Refer to note 6, “Acquisitions”, for further details.
The notes are an integral part of these consolidated financial statements. Beginning from the first quarter 2016, Nokia results include those of Alcatel-Lucent on a consolidated basis. Accordingly, Nokia results beginning from the first quarter 2016 are not directly comparable to prior period Nokia standalone results.
Consolidated statement of financial position, reported (condensed, unaudited) |
EUR million |
| December |
| December |
|
ASSETS |
|
|
|
|
|
Goodwill (note 6) |
| 5 724 |
| 237 |
|
Other intangible assets (note 6) |
| 5 236 |
| 323 |
|
Property, plant and equipment |
| 1 981 |
| 695 |
|
Investments in associated companies and joint ventures |
| 116 |
| 84 |
|
Available-for-sale investments (note 10) |
| 1 040 |
| 1 004 |
|
Deferred tax assets (note 9) |
| 5 701 |
| 2 634 |
|
Other non-current financial assets (note 10) |
| 254 |
| 49 |
|
Defined benefit pension assets (note 8) |
| 3 802 |
| 25 |
|
Other non-current assets |
| 327 |
| 51 |
|
Non-current assets |
| 24 182 |
| 5 102 |
|
Inventories |
| 2 506 |
| 1 014 |
|
Accounts receivable, net of allowances for doubtful accounts (note 10) |
| 6 972 |
| 3 913 |
|
Prepaid expenses and accrued income |
| 1 296 |
| 749 |
|
Social security, VAT and other indirect taxes |
| 560 |
| 258 |
|
Divestment related receivables |
| 90 |
| 160 |
|
Other |
| 645 |
| 331 |
|
Current income tax assets |
| 279 |
| 171 |
|
Other financial assets (note 10) |
| 296 |
| 128 |
|
Investments at fair value through profit and loss, liquid assets (note 10) |
| 327 |
| 687 |
|
Available-for-sale investments, liquid assets (note 10) |
| 1 502 |
| 2 167 |
|
Cash and cash equivalents (note 10) |
| 7 497 |
| 6 995 |
|
Current assets |
| 20 674 |
| 15 824 |
|
Assets held for sale |
| 44 |
| 0 |
|
Total assets |
| 44 901 |
| 20 926 |
|
|
| December |
| December |
|
SHAREHOLDERS’ EQUITY AND LIABILITIES |
|
|
|
|
|
Share capital |
| 246 |
| 246 |
|
Share issue premium |
| 439 |
| 380 |
|
Treasury shares at cost |
| (881 | ) | (718 | ) |
Translation differences |
| 483 |
| 292 |
|
Fair value and other reserves |
| 488 |
| 204 |
|
Reserve for invested non-restricted equity |
| 15 731 |
| 3 820 |
|
Retained earnings |
| 3 588 |
| 6 279 |
|
Capital and reserves attributable to equity holders of the parent |
| 20 093 |
| 10 502 |
|
Non-controlling interests |
| 881 |
| 21 |
|
Total equity |
| 20 975 |
| 10 523 |
|
Long-term interest-bearing liabilities (notes 10, 14) |
| 3 657 |
| 2 023 |
|
Deferred tax liabilities (note 9) |
| 403 |
| 62 |
|
Defined benefit pension and post-retirement liabilities (note 8) |
| 5 000 |
| 423 |
|
Deferred revenue and other long-term liabilities |
| 1 453 |
| 1 254 |
|
Advance payments and deferred revenue |
| 1 171 |
| 1 235 |
|
Other (note 10) |
| 282 |
| 20 |
|
Provisions (note 11) |
| 808 |
| 250 |
|
Non-current liabilities |
| 11 321 |
| 4 011 |
|
Short-term interest bearing liabilities (notes 10, 14) |
| 371 |
| 51 |
|
Other financial liabilities (note 10) |
| 236 |
| 113 |
|
Current income tax liabilities |
| 634 |
| 446 |
|
Accounts payable (note 10) |
| 3 781 |
| 1 910 |
|
Accrued expenses, deferred revenue and other liabilities |
| 6 412 |
| 3 395 |
|
Advance payments and deferred revenue |
| 3 178 |
| 1 857 |
|
Salaries, wages and social charges |
| 1 576 |
| 891 |
|
Other |
| 1 659 |
| 647 |
|
Provisions (note 11) |
| 1 172 |
| 476 |
|
Current liabilities |
| 12 605 |
| 6 391 |
|
Total shareholders’ equity and liabilities |
| 44 901 |
| 20 926 |
|
|
|
|
|
|
|
Interest-bearing liabilities, EUR million |
| 4 027 |
| 2 074 |
|
Shareholders’ equity per share, EUR |
| 3.51 |
| 2.67 |
|
Number of shares (1 000 shares, shares owned by Group companies are excluded) |
| 5 720 503 |
| 3 939 195 |
|
The notes are an integral part of these consolidated financial statements. Beginning from the first quarter 2016, Nokia results include those of Alcatel-Lucent on a consolidated basis. Accordingly, Nokia results beginning from the first quarter 2016 are not directly comparable to prior period Nokia standalone results.
Consolidated statement of cash flows, reported (condensed, unaudited)
EUR million |
| Q4’16 |
| Q4’15 |
| Q3’16 |
| Q1-Q4’16 |
| Q1-Q4’15 |
|
Cash flow from operating activities |
|
|
|
|
|
|
|
|
|
|
|
Profit/(loss) for the period (1) |
| 633 |
| 1 791 |
| (139 | ) | (927 | ) | 2 468 |
|
Adjustments, total (note 15) (1) |
| 388 |
| (982 | ) | 765 |
| 3 261 |
| (261 | ) |
Change in net working capital (note 15) |
| (310 | ) | (268 | ) | (280 | ) | (3 062 | ) | (1 377 | ) |
Cash used in operations (note 15) |
| 711 |
| 541 |
| 346 |
| (728 | ) | 830 |
|
Interest received |
| 14 |
| 7 |
| 16 |
| 85 |
| 62 |
|
Interest paid |
| (31 | ) | (49 | ) | (61 | ) | (309 | ) | (99 | ) |
Income taxes, net paid |
| (184 | ) | (41 | ) | (67 | ) | (503 | ) | (290 | ) |
Net cash from/(used in) operating activities |
| 510 |
| 458 |
| 234 |
| (1 455 | ) | 503 |
|
Cash flow from investing activities |
|
|
|
|
|
|
|
|
|
|
|
Acquisition of businesses, net of cash acquired |
| (36 | ) | 0 |
| (121 | ) | 5 819 |
| (98 | ) |
Purchase of current available-for-sale investments, liquid assets |
| (819 | ) | (871 | ) | (1 419 | ) | (4 131 | ) | (3 133 | ) |
Purchase of investments at fair value through profit and loss, liquid assets |
| 0 |
| (99 | ) | 0 |
| 0 |
| (311 | ) |
Purchase of non-current available-for-sale investments |
| (21 | ) | (31 | ) | (16 | ) | (73 | ) | (88 | ) |
(Payment of)/Proceeds from other long-term loans receivable |
| (7 | ) | 0 |
| (1 | ) | 11 |
| (2 | ) |
Proceeds from/(Payment of) short-term loans receivable |
| 23 |
| 27 |
| 46 |
| 19 |
| (17 | ) |
Capital expenditures (note 15) |
| (124 | ) | (92 | ) | (166 | ) | (477 | ) | (314 | ) |
Proceeds from disposal of businesses, net of disposed cash |
| 0 |
| 2 540 |
| 28 |
| 6 |
| 2 586 |
|
Proceeds from disposal of shares in associated companies |
| 0 |
| 0 |
| 0 |
| 10 |
| 0 |
|
Proceeds from maturities and sale of current available-for-sale investments, liquid assets |
| 1 333 |
| 455 |
| 1 190 |
| 5 121 |
| 3 074 |
|
Proceeds from maturities and sale of investments at fair value through profit and loss, liquid assets |
| 113 |
| 0 |
| 250 |
| 368 |
| 48 |
|
Proceeds from sale of non-current available-for-sale investments |
| 7 |
| 74 |
| 15 |
| 134 |
| 149 |
|
Proceeds from sale of property, plant and equipment and intangible assets |
| 15 |
| (1 | ) | 10 |
| 28 |
| 0 |
|
Dividends received |
| 0 |
| 0 |
| 1 |
| 1 |
| 2 |
|
Net cash from/(used in) investing activities |
| 484 |
| 2 002 |
| (183 | ) | 6 836 |
| 1 896 |
|
Cash flow from financing activities |
|
|
|
|
|
|
|
|
|
|
|
Proceeds from stock option exercises |
| 1 |
| 2 |
| 1 |
| 6 |
| 4 |
|
Purchase of treasury shares |
| (216 | ) | 0 |
| 0 |
| (216 | ) | (173 | ) |
Purchase of equity instruments of subsidiaries |
| (512 | ) | (27 | ) | (73 | ) | (724 | ) | (52 | ) |
Proceeds from long-term borrowings |
| 225 |
| 19 |
| 0 |
| 225 |
| 232 |
|
Repayment of long-term borrowings |
| (40 | ) | 0 |
| (34 | ) | (2 599 | ) | (24 | ) |
Proceeds from/(payment of) short-term borrowings |
| 32 |
| (24 | ) | 21 |
| (100 | ) | (55 | ) |
Dividends paid and other contributions to shareholders |
| 0 |
| 0 |
| (1 514 | ) | (1 514 | ) | (512 | ) |
Net cash used in financing activities |
| (510 | ) | (30 | ) | (1 599 | ) | (4 922 | ) | (580 | ) |
Foreign exchange adjustment |
| 126 |
| 14 |
| (14 | ) | 43 |
| 6 |
|
Net increase/(decrease) in cash and cash equivalents |
| 610 |
| 2 444 |
| (1 562 | ) | 502 |
| 1 825 |
|
Cash and cash equivalents at beginning of period |
| 6 887 |
| 4 551 |
| 8 449 |
| 6 995 |
| 5 170 |
|
Cash and cash equivalents at end of period |
| 7 497 |
| 6 995 |
| 6 887 |
| 7 497 |
| 6 995 |
|
(1) Reported Q1-Q4’16 result is not comparable to the reported results published previously due to an update to the Alcatel-Lucent purchase price allocation in Q3’16 which resulted in an adjustment to the Reported Q1’16 income tax benefit. Refer to note 6, “Acquisitions”, for further details.
Consolidated statement of cash flows combines cash flows from both the continuing and the discontinued operations. The figures in the consolidated statement of cash flows cannot be directly traced from the statement of financial position without additional information as a result of acquisitions and disposals of subsidiaries and net foreign exchange differences arising on consolidation.
Alcatel-Lucent ordinary shares and ADS’s and OCEANEs acquired in cash by Nokia subsequent to the closing of the reopened exchange offer are presented within cash flow from financing activities as purchases of equity instruments of subsidiaries and repayment of long-term borrowings, respectively. In relation to the Public Buy-Out Offer and Squeeze-Out, Nokia’s pledged cash asset of EUR 46 million in Q4 and EUR 678 million in Q3 to cover the purchase of the remaining Alcatel-Lucent securities was recorded within cash flow from investing activities as purchase of current available-for-sale investments, liquid assets. The amount of pledged cash released upon acquisition of Alcatel-Lucent securities of EUR 643 million in Q4 and EUR 81 million in Q3 was recorded within cash flow from investing activities as proceeds from maturities and sale of current available-for-sale investments, liquid assets with offsetting amounts recorded within cash flow from financing activities as purchases of equity instruments of subsidiaries and repayment of long-term borrowings.
The notes are an integral part of these consolidated financial statements. Beginning from the first quarter 2016, Nokia results include those of Alcatel-Lucent on a consolidated basis. Accordingly, Nokia results beginning from the first quarter 2016 are not directly comparable to prior period Nokia standalone results.
Consolidated statement of changes in shareholders’ equity, reported (condensed, unaudited) |
|
|
|
|
|
|
|
|
|
|
|
| Reserve for |
|
|
|
|
|
|
|
|
|
|
|
|
| Share |
|
|
|
|
| Fair value |
| invested non- |
|
|
| Equity |
| Non- |
|
|
|
|
| Share |
| issue |
| Treasury |
| Translation |
| and other |
| restricted |
| Retained |
| holders of |
| controlling |
| Total |
|
EUR million |
| capital |
| premium |
| shares |
| difference |
| reserves |
| equity |
| earnings |
| the parent |
| interest |
| equity |
|
January 1, 2015 |
| 246 |
| 439 |
| (988 | ) | 1 099 |
| 22 |
| 3 083 |
| 4 710 |
| 8 611 |
| 58 |
| 8 669 |
|
Remeasurements on defined benefit pension plans, net of tax |
| 0 |
| 0 |
| 0 |
| 0 |
| 85 |
| 0 |
| (8 | ) | 78 |
| 0 |
| 78 |
|
Translation differences |
| 0 |
| 0 |
| 0 |
| (1 057 | ) | 0 |
| 0 |
| 0 |
| (1 057 | ) | 4 |
| (1 053 | ) |
Net investment hedges, net of tax |
| 0 |
| 0 |
| 0 |
| 252 |
| 0 |
| 0 |
| 0 |
| 252 |
| 0 |
| 252 |
|
Cash flow hedges, net of tax |
| 0 |
| 0 |
| 0 |
| 0 |
| (4 | ) | 0 |
| 0 |
| (4 | ) | 0 |
| (4 | ) |
Available-for-sale investments, net of tax (note 10) |
| 0 |
| 0 |
| 0 |
| 0 |
| 95 |
| 0 |
| 0 |
| 95 |
| 0 |
| 95 |
|
Other increase/decrease, net |
| 0 |
| 0 |
| 0 |
| 0 |
| 6 |
| 0 |
| 1 |
| 7 |
| (1 | ) | 7 |
|
Profit for the period |
| 0 |
| 0 |
| 0 |
| 0 |
| 0 |
| 0 |
| 2 466 |
| 2 466 |
| 2 |
| 2 468 |
|
Total comprehensive income |
| 0 |
| 0 |
| 0 |
| (805 | ) | 182 |
| 0 |
| 2 460 |
| 1 837 |
| 5 |
| 1 841 |
|
Share-based payment |
| 0 |
| 34 |
| 0 |
| 0 |
| 0 |
| 0 |
| 0 |
| 34 |
| 0 |
| 34 |
|
Excess tax benefit on share-based payment |
| 0 |
| (2 | ) | 0 |
| 0 |
| 0 |
| 0 |
| 0 |
| (2 | ) | 0 |
| (2 | ) |
Settlement of performance and restricted shares |
| 0 |
| (13 | ) | 24 |
| 0 |
| 0 |
| (16 | ) | 0 |
| (5 | ) | 0 |
| (5 | ) |
Acquisition of treasury shares |
| 0 |
| 0 |
| (173 | ) | 0 |
| 0 |
| 0 |
| 0 |
| (173 | ) | 0 |
| (173 | ) |
Cancellation of treasury shares |
| 0 |
| 0 |
| 427 |
| 0 |
| 0 |
| 0 |
| (427 | ) | 0 |
| 0 |
| 0 |
|
Stock options exercise |
| 0 |
| 0 |
| 0 |
| 0 |
| 0 |
| 4 |
| 0 |
| 4 |
| 0 |
| 4 |
|
Dividends |
| 0 |
| 0 |
| 0 |
| 0 |
| 0 |
| 0 |
| (507 | ) | (507 | ) | (5 | ) | (512 | ) |
Acquisition of non-controlling interests |
| 0 |
| 0 |
| 0 |
| 0 |
| 0 |
| 0 |
| (15 | ) | (15 | ) | (37 | ) | (52 | ) |
Convertible bond - equity component |
| 0 |
| (57 | ) | 0 |
| 0 |
| 0 |
| 0 |
| 57 |
| 0 |
| 0 |
| 0 |
|
Convertible bond conversion |
| 0 |
| (30 | ) | 0 |
| 0 |
| 0 |
| 750 |
| 0 |
| 720 |
| 0 |
| 720 |
|
Other movements |
| 0 |
| 8 |
| (7 | ) | (3 | ) | 0 |
| 0 |
| 2 |
| 0 |
| 0 |
| 0 |
|
Total of other equity movements |
| 0 |
| (59 | ) | 270 |
| (3 | ) | 0 |
| 738 |
| (890 | ) | 55 |
| (42 | ) | 13 |
|
December 31, 2015 |
| 246 |
| 380 |
| (718 | ) | 292 |
| 204 |
| 3 820 |
| 6 279 |
| 10 502 |
| 21 |
| 10 523 |
|
|
|
|
|
|
|
|
|
|
|
|
|
|
|
|
|
|
|
|
|
|
|
January 1, 2016 |
| 246 |
| 380 |
| (718 | ) | 292 |
| 204 |
| 3 820 |
| 6 279 |
| 10 502 |
| 21 |
| 10 523 |
|
Remeasurements on defined benefit pension plans, net of tax |
| 0 |
| 0 |
| 0 |
| 0 |
| 348 |
| 0 |
| 0 |
| 348 |
| (4 | ) | 344 |
|
Translation differences |
| 0 |
| 0 |
| 0 |
| 289 |
| 0 |
| 0 |
| 0 |
| 289 |
| (39 | ) | 251 |
|
Net investment hedges, net of tax |
| 0 |
| 0 |
| 0 |
| (83 | ) | 0 |
| 0 |
| 0 |
| (83 | ) | 0 |
| (83 | ) |
Cash flow hedges, net of tax |
| 0 |
| 0 |
| 0 |
| 0 |
| 11 |
| 0 |
| 0 |
| 11 |
| 0 |
| 11 |
|
Available-for-sale investments, net of tax (note 10) |
| 0 |
| 0 |
| 0 |
| 0 |
| (72 | ) | 0 |
| 0 |
| (72 | ) | 0 |
| (72 | ) |
Other increase/decrease, net |
| 0 |
| 0 |
| 0 |
| 0 |
| (1 | ) | 0 |
| (4 | ) | (4 | ) | (1 | ) | (6 | ) |
(Loss) for the period |
| 0 |
| 0 |
| 0 |
| 0 |
| 0 |
| 0 |
| (766 | ) | (766 | ) | (161 | ) | (927 | ) |
Total comprehensive income |
| 0 |
| 0 |
| 0 |
| 206 |
| 286 |
| 0 |
| (770 | ) | (277 | ) | (205 | ) | (482 | ) |
Share-based payment |
| 0 |
| 117 |
| 0 |
| 0 |
| 0 |
| 0 |
| 0 |
| 117 |
| 0 |
| 117 |
|
Excess tax benefit on share-based payment |
| 0 |
| (6 | ) | 0 |
| 0 |
| 0 |
| 0 |
| 0 |
| (6 | ) | 0 |
| (6 | ) |
Settlement of performance and restricted shares |
| 0 |
| (22 | ) | 68 |
| 0 |
| 0 |
| (52 | ) | 0 |
| (6 | ) | 0 |
| (6 | ) |
Acquisition of treasury shares |
| 0 |
| 0 |
| (231 | ) | 0 |
| 0 |
| 0 |
| 0 |
| (231 | ) | 0 |
| (231 | ) |
Stock options exercise |
| 0 |
| 3 |
| 0 |
| 0 |
| 0 |
| 3 |
| 0 |
| 6 |
| 0 |
| 6 |
|
Dividends |
| 0 |
| 0 |
| 0 |
| 0 |
| 0 |
| 0 |
| (1 501 | ) | (1 501 | ) | (14 | ) | (1 515 | ) |
Acquisitions through business combinations |
| 0 |
| 0 |
| 0 |
| 0 |
| 0 |
| 11 616 |
| 0 |
| 11 616 |
| 1 714 |
| 13 330 |
|
Equity issuance costs related to acquisitions |
| 0 |
| 0 |
| 0 |
| 0 |
| 0 |
| (16 | ) | 0 |
| (16 | ) | 0 |
| (16 | ) |
Acquisition of non-controlling interests |
| 0 |
| 0 |
| 0 |
| (15 | ) | (2 | ) | 359 |
| (459 | ) | (117 | ) | (635 | ) | (752 | ) |
Vested portion of share-based payment awards related to acquisitions |
| 0 |
| 6 |
| 0 |
| 0 |
| 0 |
| 0 |
| 0 |
| 6 |
| 0 |
| 6 |
|
Convertible bond - equity component |
| 0 |
| (38 | ) | 0 |
| 0 |
| 0 |
| 0 |
| 38 |
| 0 |
| 0 |
| 0 |
|
Total of other equity movements |
| 0 |
| 60 |
| (163 | ) | (15 | ) | (2 | ) | 11 910 |
| (1 922 | ) | 9 868 |
| 1 065 |
| 10 933 |
|
December 31, 2016 |
| 246 |
| 439 |
| (881 | ) | 483 |
| 488 |
| 15 731 |
| 3 588 |
| 20 093 |
| 881 |
| 20 975 |
|
The notes are an integral part of these consolidated financial statements. Beginning from the first quarter 2016, Nokia results include those of Alcatel-Lucent on a consolidated basis. Accordingly, Nokia results beginning from the first quarter 2016 are not directly comparable to prior period Nokia standalone results.
Notes to Financial statements
1. Basis of preparation
This unaudited, consolidated, condensed financial statement information of Nokia has been prepared in accordance with International Accounting Standard 34 (“IAS 34, Interim Financial Reporting”). This condensed financial statement information should be read in conjunction with the financial statements for 2015, which have been prepared in accordance with IFRS as published by the IASB and adopted by the EU. The same accounting policies, methods of computation and applications of judgment are followed in this financial statement information as was followed in the financial statements for 2015, except as described below in relation to the new segment reporting structure.
This financial report was authorized for issue by management on February 1, 2017.
Non-IFRS measures presented in this document exclude costs related to the Alcatel-Lucent transaction and related integration, goodwill impairment charges, intangible asset amortization and purchase price related items, restructuring and associated charges, and certain other items that may not be indicative of Nokia’s underlying business performance. Non-IFRS financial measures should not be considered in isolation from, or as a substitute for, financial information presented in compliance with IFRS, and non-IFRS financial measures as used by Nokia may not be comparable to similarly titled amounts used by other companies or persons. As of the second quarter 2016, certain additional information and disclosure has been included in this financial statement information to implement the recent guidance issued by ESMA (European Securities and Markets Authority) on alternative performance measures.
Percentages and figures presented herein may include rounding differences and therefore may not add up precisely to the totals presented and may vary from previously published financial information.
As of the first quarter 2016, following the acquisition of Alcatel-Lucent on January 4, 2016 (refer to note 6 “Acquisitions” for more details), Nokia has revised its financial reporting structure. We now have two businesses: Nokia’s Networks business and Nokia Technologies, and three reportable segments for financial reporting purposes: Ultra Broadband Networks and IP Networks and Applications within Nokia’s Networks business and Nokia Technologies. We also present certain segment data for Group Common and Other as well as discontinued operations. Numbers are always presented for the continuing operations of Nokia, unless otherwise indicated. More details regarding the revised financial reporting structure and reportable segments are presented in note 3 “Segment information and eliminations”.
Additionally, as a result of the sale of the HERE business on December 4, 2015, and of the transaction where Nokia sold substantially all of its Devices & Services business on April 25, 2014, the HERE and the Devices & Services businesses have been presented as discontinued operations on which we report certain separate information.
The comparative financial information presented in this financial statement information has been prepared to reflect the financial results of the continuing operations of Nokia as if the new financial reporting structure had been in operation for the full year 2015. Certain accounting policy alignments, adjustments and reclassifications have been necessary, and these are explained in the “Basis of preparation” section of the stock exchange release published on April 22, 2016. These adjustments include also reallocation of items of costs and expenses based on their nature and changes to the definition of the line items in the combined company accounting policies, which affect also numbers presented in this financial statement information for 2015.
Nokia has engaged in the re-organization and integration of its current business activities in China — including the operations in Alcatel-Lucent Shanghai Bell (“ASB”). ASB is owned by Alcatel-Lucent (50% plus one share) and China Huaxin Post & Telecommunication Economy Development Center (“China Huaxin”, 50% minus one share). In August 2015, Nokia and China Huaxin signed a memorandum of understanding (“MoU”) confirming their intention to combine Nokia’s telecommunications infrastructure businesses in China (“Nokia China”) and ASB into a new joint venture. As agreed under the MoU, Nokia expects to hold 50% plus one share in the new joint venture, with China Huaxin holding the remaining shares. Fair value compensation would be received for the contribution of relevant assets to the joint venture. The new joint venture is planned to operate under the English name of Nokia Shanghai Bell and would be registered in the China (Shanghai) Pilot Free Trade Zone.
Amendments to IAS 1 and Improvements to IFRSs 2012-2014 cycle
On January 1, 2016, Nokia adopted amendments to multiple IFRS standards, which resulted from the amendments to IAS 1 and the IASB’s annual improvement project for the 2012-2014 cycles. They comprise amendments that result in accounting changes for presentation, recognition or measurement purposes, most visibly through additional guidance on use of judgment in applying materiality in aggregation and disaggregation of line items and more generally in the presentation in the financial statements.
Currency exposures, Continuing Operations, approximately (unaudited)
|
| Q4’16 |
| Q4’15 |
| Q3’16 |
| ||||||
|
| Net sales |
| Total costs |
| Net sales |
| Total costs |
| Net sales |
| Total costs |
|
EUR |
| ~25 | % | ~25 | % | ~35 | % | ~30 | % | ~25 | % | ~25 | % |
USD |
| ~50 | % | ~45 | % | ~35 | % | ~35 | % | ~50 | % | ~45 | % |
CNY |
| ~10 | % | ~10 | % | ~10 | % | ~10 | % | ~10 | % | ~10 | % |
Other |
| ~15 | % | ~20 | % | ~20 | % | ~25 | % | ~15 | % | ~20 | % |
Total |
| 100 | % | 100 | % | 100 | % | 100 | % | 100 | % | 100 | % |
End of Q4’16 balance sheet rate 1 EUR = 1.05 USD
End of Q3’16 balance sheet rate 1 EUR = 1.12 USD
End of Q4’15 balance sheet rate 1 EUR = 1.09 USD
Exchange rates
Nokia is a company with global operations and net sales derived from various countries and invoiced in various currencies. Therefore, our business and results from operations are exposed to changes in exchange rates between the euro, our reporting currency, and other currencies, such as the US dollar and the Chinese yuan. To mitigate the impact of changes in exchange rates on our results, we hedge operative forecasted net foreign exchange exposures, typically within a 12-month horizon, and apply hedge accounting in the majority of cases.
2. Non-IFRS to reported reconciliation, Continuing Operations (unaudited)
In addition to information on our reported IFRS results, we provide certain information on a non-IFRS, or underlying business performance, basis. Non-IFRS results exclude costs related to the Alcatel-Lucent transaction and related integration, goodwill impairment charges, intangible asset amortization and purchase price related items, restructuring and associated charges, and certain other items that may not be indicative of Nokia’s underlying business performance. We believe that our non-IFRS results provide meaningful supplemental information to both management and investors regarding Nokia’s underlying business performance by excluding the above-described items. These non-IFRS financial measures should not be viewed in isolation or as substitutes to the equivalent IFRS measure(s), but should be used in conjunction with the most directly comparable IFRS measure(s) in the reported results.
|
| Non- |
| Non-IFRS |
|
|
| Non- |
| Non-IFRS |
|
|
| Non- |
| Non-IFRS |
| Reported |
| Non- |
| Non-IFRS |
| Reported |
|
|
| IFRS |
| exclusions |
| Reported |
| IFRS |
| exclusions |
| Reported |
| Q1- |
| exclusions |
| Q1- |
| Q1- |
| exclusions |
| Q1- |
|
EUR million |
| Q4’16 |
| Q4’16 |
| Q4’16 |
| Q4’15 |
| Q4’15 |
| Q4’15 |
| Q4’16 |
| Q1-Q4’16 |
| Q4’16 |
| Q4’15 |
| Q1-Q4’15 |
| Q4’15 |
|
Net sales |
| 6 715 |
| (74 | ) | 6 641 |
| 3 609 |
| 0 |
| 3 609 |
| 23 945 |
| (331 | ) | 23 614 |
| 12 499 |
| 0 |
| 12 499 |
|
Cost of sales |
| (3 897 | ) | (85 | ) | (3 983 | ) | (1 916 | ) | 0 |
| (1 916 | ) | (14 356 | ) | (801 | ) | (15 157 | ) | (6 998 | ) | 36 |
| (6 962 | ) |
Gross profit |
| 2 818 |
| (159 | ) | 2 659 |
| 1 693 |
| 0 |
| 1 693 |
| 9 589 |
| (1 133 | ) | 8 456 |
| 5 501 |
| 35 |
| 5 536 |
|
% of net sales |
| 42.0 | % |
|
| 40.0 | % | 46.9 | % |
|
| 46.9 | % | 40.0 | % |
|
| 35.8 | % | 44.0 | % |
|
| 44.3 | % |
Research and development expenses |
| (1 075 | ) | (185 | ) | (1 260 | ) | (531 | ) | (9 | ) | (540 | ) | (4 222 | ) | (683 | ) | (4 904 | ) | (2 042 | ) | (38 | ) | (2 080 | ) |
% of net sales |
| 16 | % |
|
| 19 | % | 15 | % |
|
| 15 | % | 18 | % |
|
| 21 | % | 16 | % |
|
| 17 | % |
Selling, general and administrative expenses |
| (809 | ) | (162 | ) | (971 | ) | (437 | ) | (70 | ) | (507 | ) | (3 134 | ) | (685 | ) | (3 819 | ) | (1 626 | ) | (145 | ) | (1 771 | ) |
% of net sales |
| 12 | % |
|
| 15 | % | 12 | % |
|
| 14 | % | 13 | % |
|
| 16 | % | 13 | % |
|
| 14 | % |
Other income and expenses |
| 6 |
| (116 | ) | (110 | ) | 11 |
| (14 | ) | (3 | ) | (61 | ) | (772 | ) | (833 | ) | 126 |
| (114 | ) | 12 |
|
Operating profit/(loss) |
| 940 |
| (622 | ) | 317 |
| 736 |
| (93 | ) | 643 |
| 2 172 |
| (3 272 | ) | (1 100 | ) | 1 958 |
| (261 | ) | 1 697 |
|
% of net sales |
| 14.0 | % |
|
| 4.8 | % | 20.4 | % |
|
| 17.8 | % | 9.1 | % |
|
| (4.7 | )% | 15.7 | % |
|
| 13.6 | % |
Share of results of associated companies and joint ventures |
| 11 |
| 0 |
| 11 |
| 17 |
| 0 |
| 17 |
| 18 |
| 0 |
| 18 |
| 29 |
| 0 |
| 29 |
|
Financial income and expenses |
| (72 | ) | 0 |
| (72 | ) | (46 | ) | 0 |
| (46 | ) | (246 | ) | (41 | ) | (287 | ) | (186 | ) | 0 |
| (186 | ) |
Profit/(loss) before tax |
| 879 |
| (622 | ) | 257 |
| 707 |
| (92 | ) | 615 |
| 1 944 |
| (3 313 | ) | (1 369 | ) | 1 800 |
| (260 | ) | 1 540 |
|
Income tax (expense)/benefit |
| (204 | ) | 605 |
| 401 |
| (132 | ) | 17 |
| (115 | ) | (695 | ) | 1 151 |
| 457 |
| (409 | ) | 63 |
| (346 | ) |
Profit/(loss) from continuing operations |
| 676 |
| (17 | ) | 658 |
| 575 |
| (76 | ) | 499 |
| 1 250 |
| (2 162 | ) | (912 | ) | 1 392 |
| (197 | ) | 1 194 |
|
Equity holders of the parent |
| 672 |
| (13 | ) | 659 |
| 574 |
| (76 | ) | 498 |
| 1 276 |
| (2 027 | ) | (751 | ) | 1 390 |
| (197 | ) | 1 192 |
|
Non-controlling interests |
| 4 |
| (5 | ) | 0 |
| 1 |
| 0 |
| 1 |
| (26 | ) | (134 | ) | (161 | ) | 2 |
| 0 |
| 2 |
|
Depreciation and amortization |
| (119 | ) | (283 | ) | (402 | ) | (54 | ) | (21 | ) | (75 | ) | (552 | ) | (1 042 | ) | (1 594 | ) | (207 | ) | (79 | ) | (286 | ) |
EBITDA |
| 1 070 |
| (339 | ) | 731 |
| 807 |
| (72 | ) | 735 |
| 2 742 |
| (2 230 | ) | 512 |
| 2 194 |
| (182 | ) | 2 012 |
|
Share-based payment |
| 32 |
| 0 |
| 32 |
| 20 |
| 0 |
| 20 |
| 130 |
| 0 |
| 130 |
| 67 |
| 0 |
| 67 |
|
Q4’16 |
|
|
| Cost of |
| Research |
| Selling, |
| Other |
| Operating |
| Financial |
| Income |
| Profit/(loss) |
|
EUR million |
| Net sales |
| sales |
| expenses |
| expenses |
| expenses |
| profit |
| expenses |
| benefit |
| operations |
|
Non-IFRS |
| 6 715 |
| (3 897 | ) | (1 075 | ) | (809 | ) | 6 |
| 940 |
| (72 | ) | (204 | ) | 676 |
|
Working capital related purchase price allocation adjustments |
| (74 | ) |
|
|
|
|
|
|
|
| (74 | ) |
|
|
|
| (74 | ) |
Amortization of acquired intangible assets |
|
|
| (2 | ) | (159 | ) | (98 | ) | (9 | ) | (268 | ) |
|
|
|
| (268 | ) |
Transaction and related costs, including integration costs related to Alcatel-Lucent |
|
|
| (1 | ) | (1 | ) | (60 | ) |
|
| (62 | ) |
|
|
|
| (62 | ) |
Restructuring and associated charges |
|
|
|
|
|
|
|
|
| (107 | ) | (107 | ) |
|
|
|
| (107 | ) |
Product portfolio integration costs |
|
|
| (82 | ) | (25 | ) | (4 | ) |
|
| (111 | ) |
|
|
|
| (111 | ) |
Tax impact on the above non-IFRS exclusions |
|
|
|
|
|
|
|
|
|
|
| 0 |
|
|
| 155 |
| 155 |
|
Operating model integration |
|
|
|
|
|
|
|
|
|
|
| 0 |
|
|
| 439 |
| 439 |
|
Deferred tax income due to tax rate change |
|
|
|
|
|
|
|
|
|
|
| 0 |
|
|
| 11 |
| 11 |
|
Total non-IFRS exclusions |
| (74 | ) | (85 | ) | (185 | ) | (162 | ) | (116 | ) | (622 | ) | 0 |
| 605 |
| (17 | ) |
Reported |
| 6 641 |
| (3 983 | ) | (1 260 | ) | (971 | ) | (110 | ) | 317 |
| (72 | ) | 401 |
| 658 |
|
Q4’15 |
|
|
| Cost of |
| Research |
| Selling, |
| Other |
| Operating |
| Financial |
| Income |
| Profit/(loss) |
|
EUR million |
| Net sales |
| sales |
| expenses |
| expenses |
| expenses |
| profit |
| expenses |
| benefit |
| operations |
|
Non-IFRS |
| 3 609 |
| (1 916 | ) | (531 | ) | (437 | ) | 11 |
| 736 |
| (46 | ) | (132 | ) | 575 |
|
Amortization of acquired intangible assets |
|
|
|
|
| (9 | ) | (11 | ) |
|
| (21 | ) |
|
|
|
| (21 | ) |
Transaction and related costs, including integration costs related to Alcatel-Lucent |
|
|
|
|
|
|
| (59 | ) |
|
| (59 | ) |
|
|
|
| (59 | ) |
Restructuring and associated charges |
|
|
|
|
|
|
|
|
| (16 | ) | (16 | ) |
|
|
|
| (16 | ) |
Contractual remediation charges and project losses |
|
|
|
|
|
|
|
|
| 1 |
| 1 |
|
|
|
|
| 1 |
|
Divestment of businesses |
|
|
|
|
|
|
|
|
| 2 |
| 2 |
|
|
|
|
| 2 |
|
Tax impact on the above non-IFRS exclusions |
|
|
|
|
|
|
|
|
|
|
| 0 |
|
|
| 17 |
| 17 |
|
Total non-IFRS exclusions |
| 0 |
| 0 |
| (9 | ) | (70 | ) | (14 | ) | (93 | ) | 0 |
| 17 |
| (76 | ) |
Reported |
| 3 609 |
| (1 916 | ) | (540 | ) | (507 | ) | (3 | ) | 643 |
| (46 | ) | (115 | ) | 499 |
|
Q1-Q4’16 EUR million |
| Net sales |
| Cost of |
| Research |
| Selling, |
| Other |
| Operating |
| Financial |
| Income |
| Profit/(loss) |
|
Non-IFRS |
| 23 945 |
| (14 356 | ) | (4 222 | ) | (3 134 | ) | (61 | ) | 2 172 |
| (246 | ) | (695 | ) | 1 250 |
|
Working capital related purchase price allocation adjustments |
| (331 | ) | (509 | ) |
|
|
|
|
|
| (840 | ) |
|
|
|
| (840 | ) |
Amortization of acquired intangible assets |
|
|
| (11 | ) | (619 | ) | (386 | ) | (9 | ) | (1 026 | ) |
|
|
|
| (1 026 | ) |
Transaction and related costs, including integration costs related to Alcatel-Lucent |
|
|
| (2 | ) | (2 | ) | (294 | ) | 3 |
| (295 | ) |
|
|
|
| (295 | ) |
Restructuring and associated charges |
|
|
| (7 | ) | (3 | ) | (4 | ) | (759 | ) | (774 | ) |
|
|
|
| (774 | ) |
Product portfolio integration costs |
|
|
| (274 | ) | (61 | ) | (8 | ) | (6 | ) | (348 | ) |
|
|
|
| (348 | ) |
Other non-IFRS exclusions in operating profit |
|
|
| 1 |
| 3 |
| 7 |
|
|
| 11 |
|
|
|
|
| 11 |
|
Early redemption cost of debt |
|
|
|
|
|
|
|
|
|
|
| 0 |
| (41 | ) |
|
| (41 | ) |
Tax impact on the above non-IFRS exclusions |
|
|
|
|
|
|
|
|
|
|
| 0 |
|
|
| 736 |
| 736 |
|
Operating model integration |
|
|
|
|
|
|
|
|
|
|
| 0 |
|
|
| 439 |
| 439 |
|
Legal entity integration |
|
|
|
|
|
|
|
|
|
|
| 0 |
|
|
| (25) |
| (25 | ) |
Deferred tax income due to tax rate change |
|
|
|
|
|
|
|
|
|
|
| 0 |
|
|
| 1 |
| 1 |
|
Total non-IFRS exclusions |
| (331 | ) | (801 | ) | (683 | ) | (685 | ) | (772 | ) | (3 272 | ) | (41 | ) | 1 151 |
| (2 161 | ) |
Reported |
| 23 614 |
| (15 157 | ) | (4 904 | ) | (3 819 | ) | (833 | ) | (1 100 | ) | (287 | ) | 457 |
| (912 | ) |
Q1-Q4’15 EUR million |
| Net sales |
| Cost of |
| Research |
| Selling, |
| Other |
| Operating |
| Financial |
| Income |
| Profit/(loss) |
|
Non-IFRS |
| 12 499 |
| (6 998 | ) | (2 042 | ) | (1 626 | ) | 126 |
| 1 958 |
| (186 | ) | (409 | ) | 1 392 |
|
Amortization of acquired intangible assets |
|
|
| (2 | ) | (35 | ) | (44 | ) |
|
| (81 | ) |
|
|
|
| (81 | ) |
Transaction and related costs, including integration costs related to Alcatel-Lucent |
|
|
|
|
|
|
| (100 | ) |
|
| (100 | ) |
|
|
|
| (100 | ) |
Restructuring and associated charges |
|
|
|
|
| (3 | ) |
|
| (120 | ) | (123 | ) |
|
|
|
| (123 | ) |
Contractual remediation charges and project losses |
|
|
|
|
|
|
|
|
| 5 |
| 5 |
|
|
|
|
| 5 |
|
Divestment related cost of sales correction |
|
|
| 37 |
|
|
|
|
|
|
| 37 |
|
|
|
|
| 37 |
|
Divestment of businesses |
|
|
|
|
|
|
|
|
| 2 |
| 2 |
|
|
|
|
| 2 |
|
Tax impact on the above non-IFRS exclusions |
|
|
|
|
|
|
|
|
|
|
| 0 |
|
|
| 63 |
| 63 |
|
Total non-IFRS exclusions |
| 0 |
| 36 |
| (38 | ) | (145 | ) | (114 | ) | (261 | ) | 0 |
| 63 |
| (197 | ) |
Reported |
| 12 499 |
| (6 962 | ) | (2 080 | ) | (1 771 | ) | 12 |
| 1 697 |
| (186 | ) | (346 | ) | 1 194 |
|
3. Segment information and eliminations, Continuing Operations (unaudited)
We have two businesses: Nokia’s Networks business and Nokia Technologies, and three reportable segments for financial reporting purposes: Ultra Broadband Networks and IP Networks and Applications within Nokia’s Networks business and Nokia Technologies. We also present certain segment data for Group Common and Other as well as discontinued operations. Numbers are always presented for the continuing operations of Nokia, unless otherwise indicated.
We have aggregated Fixed Networks and Mobile Networks operating segments to one reportable segment Ultra Broadband Networks and IP/Optical Networks and Applications & Analytics operating segments to one reportable segment IP Networks and Applications. The aggregated operating segments have similar economic characteristics and have similar products, production processes, distribution methods and customers, as well as operate in a similar regulatory environment.
The chief operating decision maker receives monthly financial information for the Nokia’s operating and reportable segments. Key financial performance measures of the reportable segments include primarily net sales and operating profit. The chief operating decision maker evaluates the performance of the segments and allocates resources to them based on operating profit.
Ultra Broadband Networks
Ultra Broadband Networks is composed of the Mobile Networks and Fixed Networks business groups.
The Mobile Networks business group offers an industry-leading portfolio of end-to-end mobile networking solutions comprising hardware, software and services for telecommunications operators, enterprises and related markets/verticals such as public safety and Internet of Things (“IoT”). The Mobile Networks business group consists of the following:
· Radio Networks, which includes macro radio access network (“RAN”) offerings for mobile data and voice communication using existing 2G, 3G and LTE technology, as well as evolution to the future 5G standard.
· Converged Core is the cloud computing powerhouse for Mobile Networks. This group is responsible for a market leading portfolio in the areas of 3G Core, IMS / VoLTE, SDM, Cloud and virtualized software / infrastructure.
· Advanced Mobile Networks Solutions, which creates end-to-end innovative solutions, and is responsible for the portfolios for IoT Connectivity, Public Sector solutions, such as public safety and Microwaves. It is also responsible for Nokia’s award winning Small cells portfolio and unlicensed solutions such as Wi-Fi and MulteFire. The unit is targeting mobile operators as well as vertical businesses.
· Global Services, which supports customers with the design, deployment, optimization, operation and maintenance of mobile networks, adding value to customers through the breadth, quality, efficiency and innovation of its services across five business areas: Network Planning & Optimization, Network Implementation, Systems Integration, Managed Services and Care.
The Fixed Networks business group provides copper and fiber access products, solutions and services. The portfolio allows for a customized combination of technologies that brings fiber to the most economical point for the customer. The Fixed Networks business group consists of the following business units:
· Broadband Access, which consists of advanced copper based solutions such as very high rate digital subscriber line (VDSL2), and innovative vectoring technology to reduce cross-talk interference and improve performance. The Fixed Networks business group is also developing fiber to the home solutions, such as Gigabit Passive Optical Networks (“GPON”) and leading in next-generation fiber access technologies like TWDM-PON.
· The Digital Home unit is responsible for development of the broadband network termination equipment located at the users’ premises. The main focus is on devices that enable connectivity of users in fiber based network. Recently, the scope is expanding towards specialized models for businesses and enterprises, including Residential Gateway (RGW) and IoT functions.
· Access Management Solutions provides features required to operate end-to-end fixed networks. The solution also includes value added applications that streamline operations and significantly reduce the operational costs.
· Fixed Networks Services, which is comprised of deployment, maintenance and professional services such as copper and fiber broadband evolution, public switched telephone network transformation, site implementation and outside plant, as well as multi-vendor maintenance.
IP Networks and Applications
IP Networks and Applications is composed of the IP/Optical Networks and Applications & Analytics business groups.
The IP/Optical Networks business group provides the key IP routing and optical transport systems, software and services to build high capacity network infrastructure for the internet and global connectivity. The IP/Optical Networks business group consists of the following business units:
· IP Routing, which includes solutions for advanced residential, business and mobile services spanning the IP core, IP edge, Mobile Packet Core and IP/Ethernet metro and access. It also includes Nuage Networks, which makes datacenter and branch network resources as readily consumable and efficient as cloud computing and storage. It also includes Video, which leverages the latest in cloud and streaming technologies to efficiently deliver an exceptional video experience.
· Optics includes Wavelength Division Multiplexing and wavelength routing, allowing for high data capacity by multiplexing many wavelengths over each fiber and programmability by dynamically routing wavelengths across the network.
The Applications & Analytics business group offers software solutions spanning customer experience management, network operations and management, communications and collaboration, policy and charging, as well as Cloud, IoT, security, and analytics platforms that enable digital service providers and enterprises to accelerate innovation, monetize services, and optimize their customer experience. The Applications & Analytics business group consists of the following:
· Customer Experience Management which includes software for multi-channel customer care and connected device management for fixed, mobile and enterprise, including workflows and service assurance.
· Emerging Businesses, which includes software that spans across communications and collaboration, analytics, security, Cloud and IoT.
· Network and services operations software that lets customers manage and automate multivendor networks.
· Policy and charging software that helps hundreds of service providers around the world generate revenue from innovative service offers and introduce new business models.
· Application & Analytics Services includes service and consulting expertise that transforms our customers’ network solutions and helps them achieve real value.
Nokia Technologies
The Nokia Technologies business group has two main objectives: To drive growth and renewal in its existing patent licensing business; and to build new businesses for Nokia, based on breakthrough innovation in key technologies and products, in the areas of Digital Media and Digital Health.
· As of the first quarter 2016, the majority of net sales and the related costs and expenses attributable to licensing and patenting the separate patent portfolios of Nokia Technologies, Nokia’s Networks business, and Nokia Bell Labs will be recorded in Nokia Technologies. Each reportable segment will continue to separately record its research and development expenses.
Group Common and Other
Nokia also reports segment-level data for Group Common and Other.
· As of the first quarter 2016, Group Common and Other includes the Alcatel Submarine Networks and Radio Frequency Systems businesses, both of which are being managed as separate entities. In addition, Group Common and Other includes Nokia Bell Labs’ operating expenses, as well as certain corporate-level and centrally-managed operating expenses.
Accounting policies of the segments are the same as those described in note 1, “Accounting principles” of our Annual Report on Form 20-F for 2015. The Group accounts for inter-segment revenues and transfers as if the revenues were to third parties, that is, at current market prices. Non-IFRS exclusions are not allocated to the segments.
Q4’16 |
| Ultra |
| IP Networks |
| Nokia’s |
| Nokia |
| Group |
| Eliminations |
| Non-IFRS |
| Non-IFRS |
| Nokia Total |
|
Net sales |
| 4 332 |
| 1 737 |
| 6 069 |
| 309 |
| 341 |
| (3 | ) | 6 715 |
| (74 | ) | 6 641 |
|
Cost of sales |
| (2 682 | ) | (921 | ) | (3 603 | ) | (21 | ) | (276 | ) | 3 |
| (3 897 | ) | (85 | ) | (3 983 | ) |
Gross profit |
| 1 650 |
| 816 |
| 2 466 |
| 287 |
| 64 |
| 0 |
| 2 818 |
| (159 | ) | 2 659 |
|
% of net sales |
| 38.1 | % | 47.0 | % | 40.6 | % | 92.9 | % | 18.8 | % |
|
| 42.0 | % |
|
| 40.0 | % |
|
|
|
|
|
|
|
|
|
|
|
|
|
|
|
|
|
|
|
|
Research and development expenses |
| (596 | ) | (336 | ) | (932 | ) | (70 | ) | (73 | ) | 0 |
| (1 075 | ) | (185 | ) | (1 260 | ) |
% of net sales |
| 14 | % | 19 | % | 15 | % | 23 | % | 21 | % |
|
| 16 | % |
|
| 19 | % |
|
|
|
|
|
|
|
|
|
|
|
|
|
|
|
|
|
|
|
|
Selling, general and administrative expenses |
| (488 | ) | (200 | ) | (688 | ) | (63 | ) | (58 | ) | 0 |
| (809 | ) | (162 | ) | (971 | ) |
% of net sales |
| 11 | % | 12 | % | 11 | % | 20 | % | 17 | % |
|
| 12 | % |
|
| 15 | % |
|
|
|
|
|
|
|
|
|
|
|
|
|
|
|
|
|
|
|
|
Other income and expenses |
| 8 |
| 0 |
| 8 |
| 4 |
| (6 | ) | 0 |
| 6 |
| (116 | ) | (110 | ) |
Operating profit/(loss) |
| 574 |
| 280 |
| 854 |
| 158 |
| (73 | ) | 0 |
| 940 |
| (622 | ) | 317 |
|
% of net sales |
| 13.3 | % | 16.1 | % | 14.1 | % | 51.1 | % | (21.4 | )% |
|
| 14.0 | % |
|
| 4.8 | % |
Depreciation and amortization |
| (61 | ) | (43 | ) | (104 | ) | (3 | ) | (12 | ) | 0 |
| (119 | ) | (283 | ) | (402 | ) |
Share of results of associated companies and joint ventures |
| 11 |
| 0 |
| 11 |
| 0 |
| 0 |
| 0 |
| 11 |
| 0 |
| 11 |
|
EBITDA |
| 646 |
| 324 |
| 970 |
| 162 |
| (61 | ) | 0 |
| 1 070 |
| (339 | ) | 731 |
|
(1) Mobile Networks net sales of EUR 3 787 million, Fixed Networks net sales of EUR 544 million.
(2) IP Routing net sales of EUR 814 million, Optical Networks net sales of EUR 459 million and Applications & Analytics net sales of EUR 464 million.
(3) Includes services net sales of EUR 2 484 million.
(4) Non-IFRS results exclude costs related to the Alcatel-Lucent transaction and related integration, goodwill impairment charges, intangible asset amortization and purchase price related items, restructuring and associated charges, and certain other items that may not be indicative of Nokia’s underlying business performance.
Q4’15 |
| Ultra |
| IP Networks |
| Nokia’s |
| Nokia |
| Group |
| Eliminations |
| Non-IFRS |
| Non-IFRS |
| Nokia Total |
|
Net sales |
| 2 815 |
| 395 |
| 3 210 |
| 403 |
| 0 |
| (4 | ) | 3 609 |
| 0 |
| 3 609 |
|
Cost of sales |
| (1 748 | ) | (170 | ) | (1 918 | ) | (2 | ) | 0 |
| 4 |
| (1 916 | ) | 0 |
| (1 916 | ) |
Gross profit |
| 1 067 |
| 224 |
| 1 292 |
| 401 |
| 0 |
| 0 |
| 1 693 |
| 0 |
| 1 693 |
|
% of net sales |
| 37.9 | % | 56.7 | % | 40.2 | % | 99.5 | % | 0.0 | % |
|
| 46.9 | % |
|
| 46.9 | % |
|
|
|
|
|
|
|
|
|
|
|
|
|
|
|
|
|
|
|
|
Research and development expenses |
| (380 | ) | (67 | ) | (447 | ) | (60 | ) | (24 | ) | 0 |
| (531 | ) | (9 | ) | (540 | ) |
% of net sales |
| 13 | % | 17 | % | 14 | % | 15 | % | 0 | % |
|
| 15 | % |
|
| 15 | % |
|
|
|
|
|
|
|
|
|
|
|
|
|
|
|
|
|
|
|
|
Selling, general and administrative expenses |
| (303 | ) | (73 | ) | (376 | ) | (33 | ) | (29 | ) | 0 |
| (437 | ) | (70 | ) | (507 | ) |
% of net sales |
| 11 | % | 18 | % | 12 | % | 8 | % | 0 | % |
|
| 12 | % |
|
| 14 | % |
|
|
|
|
|
|
|
|
|
|
|
|
|
|
|
|
|
|
|
|
Other income and expenses |
| 21 |
| 5 |
| 26 |
| 7 |
| (22 | ) | 0 |
| 11 |
| (14 | ) | (3 | ) |
Operating profit/(loss) |
| 405 |
| 90 |
| 495 |
| 316 |
| (74 | ) | 0 |
| 736 |
| (93 | ) | 643 |
|
% of net sales |
| 14.4 | % | 22.8 | % | 15.4 | % | 78.4 | % | 0.0 | % |
|
| 20.4 | % |
|
| 17.8 | % |
Depreciation and amortization |
| (41 | ) | (9 | ) | (51 | ) | (1 | ) | (2 | ) | 0 |
| (54 | ) | (21 | ) | (75 | ) |
Share of results of associated companies and joint ventures |
| 17 |
| 0 |
| 17 |
| 0 |
| 0 |
| 0 |
| 17 |
| 0 |
| 17 |
|
EBITDA |
| 463 |
| 99 |
| 562 |
| 317 |
| (72 | ) | 0 |
| 807 |
| (72 | ) | 735 |
|
(1) Mobile Networks net sales of EUR 2 776 million, Fixed Networks net sales of EUR 39 million.
(2) IP Routing net sales of EUR 147 million, Applications & Analytics net sales of EUR 247 million.
(3) Includes services net sales of EUR 1 495 million.
(4) Non-IFRS results exclude costs related to the Alcatel-Lucent transaction and related integration, goodwill impairment charges, intangible asset amortization and purchase price related items, restructuring and associated charges, and certain other items that may not be indicative of Nokia’s underlying business performance.
Q3’16 |
| Ultra |
| IP Networks |
| Nokia’s |
| Nokia |
| Group |
| Eliminations |
| Non-IFRS |
| Non-IFRS |
| Nokia Total |
|
Net sales |
| 3 903 |
| 1 419 |
| 5 322 |
| 353 |
| 298 |
| (22 | ) | 5 950 |
| (60 | ) | 5 890 |
|
Cost of sales |
| (2 516 | ) | (823 | ) | (3 340 | ) | (12 | ) | (256 | ) | 22 |
| (3 586 | ) | (88 | ) | (3 674 | ) |
Gross profit |
| 1 386 |
| 596 |
| 1 982 |
| 341 |
| 41 |
| 0 |
| 2 365 |
| (149 | ) | 2 216 |
|
% of net sales |
| 35.5 | % | 42.0 | % | 37.2 | % | 96.6 | % | 13.8 | % |
|
| 39.7 | % |
|
| 37.6 | % |
|
|
|
|
|
|
|
|
|
|
|
|
|
|
|
|
|
|
|
|
Research and development expenses |
| (577 | ) | (305 | ) | (882 | ) | (65 | ) | (70 | ) | 0 |
| (1 017 | ) | (179 | ) | (1 196 | ) |
% of net sales |
| 15 | % | 21 | % | 17 | % | 18 | % | 23 | % |
|
| 17 | % |
|
| 20 | % |
|
|
|
|
|
|
|
|
|
|
|
|
|
|
|
|
|
|
|
|
Selling, general and administrative expenses |
| (479 | ) | (191 | ) | (669 | ) | (50 | ) | (61 | ) | 0 |
| (781 | ) | (145 | ) | (925 | ) |
% of net sales |
| 12 | % | 13 | % | 13 | % | 14 | % | 20 | % |
|
| 13 | % |
|
| 16 | % |
|
|
|
|
|
|
|
|
|
|
|
|
|
|
|
|
|
|
|
|
Other income and expenses |
| (4 | ) | 5 |
| 1 |
| 0 |
| (11 | ) | 0 |
| (11 | ) | (29 | ) | (39 | ) |
Operating profit/(loss) |
| 326 |
| 106 |
| 432 |
| 225 |
| (101 | ) | 0 |
| 556 |
| (501 | ) | 55 |
|
% of net sales |
| 8.4 | % | 7.5 | % | 8.1 | % | 63.7 | % | (33.9 | )% |
|
| 9.3 | % |
|
| 0.9 | % |
Depreciation and amortization |
| (86 | ) | (36 | ) | (122 | ) | (2 | ) | (11 | ) | 0 |
| (135 | ) | (240 | ) | (375 | ) |
Share of results of associated companies and joint ventures |
| 3 |
| 0 |
| 3 |
| 0 |
| 0 |
| 0 |
| 3 |
| 0 |
| 3 |
|
EBITDA |
| 415 |
| 142 |
| 557 |
| 227 |
| (91 | ) | 0 |
| 693 |
| (261 | ) | 432 |
|
(1) Mobile Networks net sales of EUR 3 318 million, Fixed Networks net sales of EUR 585 million.
(2) IP Routing net sales of EUR 697 million, Optical Networks net sales of EUR 351 million and Applications & Analytics net sales of EUR 372 million.
(3) Includes services net sales of EUR 1 972 million.
(4) Non-IFRS results exclude costs related to the Alcatel-Lucent transaction and related integration, goodwill impairment charges, intangible asset amortization and purchase price related items, restructuring and associated charges, and certain other items that may not be indicative of Nokia’s underlying business performance.
Q1-Q4’16 |
| Ultra |
| IP Networks |
| Nokia’s |
| Nokia |
| Group |
| Eliminations |
| Non-IFRS |
| Non-IFRS |
| Nokia Total |
|
Net sales |
| 15 770 |
| 6 029 |
| 21 799 |
| 1 053 |
| 1 145 |
| (53 | ) | 23 945 |
| (331 | ) | 23 614 |
|
Cost of sales |
| (10 043 | ) | (3 371 | ) | (13 413 | ) | (42 | ) | (953 | ) | 53 |
| (14 356 | ) | (801 | ) | (15 157 | ) |
Gross profit |
| 5 727 |
| 2 659 |
| 8 386 |
| 1 011 |
| 192 |
| 0 |
| 9 589 |
| (1 133 | ) | 8 456 |
|
% of net sales |
| 36.3 | % | 44.1 | % | 38.5 | % | 96.0 | % | 16.8 | % |
|
| 40.0 | % |
|
| 35.8 | % |
|
|
|
|
|
|
|
|
|
|
|
|
|
|
|
|
|
|
|
|
Research and development expenses |
| (2 405 | ) | (1 285 | ) | (3 691 | ) | (250 | ) | (282 | ) | 0 |
| (4 222 | ) | (683 | ) | (4 904 | ) |
% of net sales |
| 15 | % | 21 | % | 17 | % | 24 | % | 25 | % |
|
| 18 | % |
|
| 21 | % |
|
|
|
|
|
|
|
|
|
|
|
|
|
|
|
|
|
|
|
|
Selling, general and administrative expenses |
| (1 936 | ) | (784 | ) | (2 720 | ) | (184 | ) | (230 | ) | 0 |
| (3 134 | ) | (685 | ) | (3 819 | ) |
% of net sales |
| 12 | % | 13 | % | 12 | % | 17 | % | 20 | % |
|
| 13 | % |
|
| 16 | % |
|
|
|
|
|
|
|
|
|
|
|
|
|
|
|
|
|
|
|
|
Other income and expenses |
| (24 | ) | (16 | ) | (40 | ) | 1 |
| (21 | ) | 0 |
| (61 | ) | (772 | ) | (833 | ) |
Operating profit/(loss) |
| 1 362 |
| 573 |
| 1 935 |
| 579 |
| (341 | ) | 0 |
| 2 172 |
| (3 272 | ) | (1 100 | ) |
% of net sales |
| 8.6 | % | 9.5 | % | 8.9 | % | 55.0 | % | (29.8 | )% |
|
| 9.1 | % |
|
| (4.7 | )% |
Depreciation and amortization |
| (347 | ) | (151 | ) | (498 | ) | (8 | ) | (45 | ) | 0 |
| (552 | ) | (1 042 | ) | (1 594 | ) |
Share of results of associated companies and joint ventures |
| 18 |
| 0 |
| 18 |
| 0 |
| 0 |
| 0 |
| 18 |
| 0 |
| 18 |
|
EBITDA |
| 1 727 |
| 723 |
| 2 451 |
| 587 |
| (296 | ) | 0 |
| 2 742 |
| (2 230 | ) | 512 |
|
(1) Mobile Networks net sales of EUR 13 405 million, Fixed Networks net sales of EUR 2 365 million.
(2) IP Routing net sales of EUR 2 941 million, Optical Networks net sales of EUR 1 562 million and Applications & Analytics net sales of EUR 1 527 million.
(3) Includes services net sales of EUR 8 414 million.
(4) Non-IFRS results exclude costs related to the Alcatel-Lucent transaction and related integration, goodwill impairment charges, intangible asset amortization and purchase price related items, restructuring and associated charges, and certain other items that may not be indicative of Nokia’s underlying business performance.
Q1-Q4’15 |
| Ultra |
| IP Networks |
| Nokia’s |
| Nokia |
| Group |
| Eliminations |
| Non-IFRS |
| Non-IFRS |
| Nokia Total |
|
Net sales |
| 10 158 |
| 1 328 |
| 11 486 |
| 1 027 |
| 0 |
| (15 | ) | 12 499 |
| 0 |
| 12 499 |
|
Cost of sales |
| (6 353 | ) | (652 | ) | (7 005 | ) | (7 | ) | 0 |
| 15 |
| (6 998 | ) | 36 |
| (6 962 | ) |
Gross profit |
| 3 805 |
| 676 |
| 4 481 |
| 1 020 |
| 0 |
| 0 |
| 5 501 |
| 35 |
| 5 536 |
|
% of net sales |
| 37.5 | % | 50.9 | % | 39.0 | % | 99.3 | % | 0.0 | % |
|
| 44.0 | % |
|
| 44.3 | % |
|
|
|
|
|
|
|
|
|
|
|
|
|
|
|
|
|
|
|
|
Research and development expenses |
| (1 470 | ) | (269 | ) | (1 739 | ) | (220 | ) | (84 | ) | 0 |
| (2 042 | ) | (38 | ) | (2 080 | ) |
% of net sales |
| 14 | % | 20 | % | 15 | % | 21 | % | 0 | % |
|
| 16 | % |
|
| 17 | % |
|
|
|
|
|
|
|
|
|
|
|
|
|
|
|
|
|
|
|
|
Selling, general and administrative expenses |
| (1 147 | ) | (274 | ) | (1 421 | ) | (108 | ) | (97 | ) | 0 |
| (1 626 | ) | (145 | ) | (1 771 | ) |
% of net sales |
| 11 | % | 21 | % | 12 | % | 11 | % | 0 | % |
|
| 13 | % |
|
| 14 | % |
|
|
|
|
|
|
|
|
|
|
|
|
|
|
|
|
|
|
|
|
Other income and expenses |
| 22 |
| 4 |
| 26 |
| 7 |
| 92 |
| 0 |
| 126 |
| (114 | ) | 12 |
|
Operating profit/(loss) |
| 1 210 |
| 138 |
| 1 349 |
| 698 |
| (89 | ) | 0 |
| 1 958 |
| (261 | ) | 1 697 |
|
% of net sales |
| 11.9 | % | 10.4 | % | 11.7 | % | 68.0 | % | 0.0 | % |
|
| 15.7 | % |
|
| 13.6 | % |
Depreciation and amortization |
| (158 | ) | (35 | ) | (193 | ) | (6 | ) | (8 | ) | 0 |
| (207 | ) | (79 | ) | (286 | ) |
Share of results of associated companies and joint ventures |
| 29 |
| 0 |
| 29 |
| 0 |
| 0 |
| 0 |
| 29 |
| 0 |
| 29 |
|
EBITDA |
| 1 397 |
| 173 |
| 1 571 |
| 704 |
| (80 | ) | 0 |
| 2 194 |
| (182 | ) | 2 012 |
|
(1) Mobile Networks net sales of EUR 10 022 million, Fixed Networks net sales of EUR 136 million.
(2) IP Routing net sales of EUR 514 million, Applications & Analytics net sales of EUR 813 million.
(3) Includes services net sales of EUR 5 424 million.
(4) Non-IFRS results exclude costs related to the Alcatel-Lucent transaction and related integration, goodwill impairment charges, intangible asset amortization and purchase price related items, restructuring and associated charges, and certain other items that may not be indicative of Nokia’s underlying business performance.
4. NET SALES BY GEOGRAPHIC AREA, Continuing Operations, reported (unaudited)
EUR million |
| Q4’16 |
| Q4’15 |
| YoY |
| Q3’16 |
| QoQ |
| Q1- |
| Q1- |
| YoY |
|
Asia-Pacific |
| 1 135 |
| 806 |
| 41 | % | 993 |
| 14 | % | 4 206 |
| 3 230 |
| 30 | % |
Europe |
| 1 836 |
| 1 200 |
| 53 | % | 1 541 |
| 19 | % | 6 393 |
| 3 812 |
| 68 | % |
Greater China |
| 608 |
| 482 |
| 26 | % | 780 |
| (22 | )% | 2 656 |
| 1 712 |
| 55 | % |
Latin America |
| 416 |
| 281 |
| 48 | % | 341 |
| 22 | % | 1 457 |
| 973 |
| 50 | % |
Middle East & Africa |
| 614 |
| 356 |
| 72 | % | 465 |
| 32 | % | 1 871 |
| 1 177 |
| 59 | % |
North America |
| 2 032 |
| 484 |
| 320 | % | 1 769 |
| 15 | % | 7 031 |
| 1 594 |
| 341 | % |
Total |
| 6 641 |
| 3 609 |
| 84 | % | 5 890 |
| 13 | % | 23 614 |
| 12 499 |
| 89 | % |
5. PERSONNEL BY GEOGRAPHIC AREA, Continuing Operations (unaudited)
|
| December |
| December |
| YoY |
| September |
| QoQ |
|
Asia-Pacific |
| 22 217 |
| 16 663 |
| 33 | % | 22 025 |
| 1 | % |
Europe |
| 37 616 |
| 22 171 |
| 70 | % | 37 790 |
| 0 | % |
Greater China |
| 18 092 |
| 8 485 |
| 113 | % | 18 598 |
| (3 | )% |
Latin America |
| 3 927 |
| 2 459 |
| 60 | % | 3 967 |
| (1 | )% |
Middle East & Africa |
| 3 890 |
| 2 275 |
| 71 | % | 3 985 |
| (2 | )% |
North America |
| 15 133 |
| 3 665 |
| 313 | % | 15 422 |
| (2 | )% |
Total |
| 100 875 |
| 55 718 |
| 81 | % | 101 787 |
| (1 | )% |
6. ACQUISITIONS, reported (unaudited)
Alcatel-Lucent acquisition
On April 15, 2015, Nokia and Alcatel-Lucent announced their intention to combine through a public exchange offer in France and the United States. Alcatel-Lucent is a global leader in IP networking, ultra-broadband access and cloud applications. The combined company will leverage the combined scale of operations, complementary technologies, portfolios and geographical presence; and unparalleled innovation capabilities to lead in the next generation network technology and services and to create access to an expanded addressable market with improved long-term growth opportunities.
Nokia obtained control of Alcatel-Lucent on January 4, 2016 when the interim results of the successful initial exchange offer were announced by the French stock market authority, Autorité des Marchés Financiers (“AMF”). In accordance with the AMF General Regulation Nokia reopened its exchange offer for the outstanding Alcatel-Lucent Securities not tendered during the initial exchange offer period on January 14, 2016 and closed the reopened offer on February 3, 2016. Nokia has determined that the initial and the reopened exchange offers are linked transactions that are to be considered together as a single arrangement given that the reopened exchange offer is required by AMF General Regulation and is based on the same terms and conditions as the initial exchange offer.
As part of the exchange offers, holders of Alcatel-Lucent ordinary shares, Alcatel-Lucent American Depositary Shares (“ALU ADS”) and OCEANE convertible bonds (collectively “Alcatel-Lucent Securities”) could exchange their Alcatel-Lucent Securities for Nokia shares and Nokia American Depositary Shares (“Nokia ADS”) on the basis of 0.55 Nokia share or Nokia ADS for every Alcatel-Lucent share or ALU ADS.
Following the initial and reopened exchange offers, Nokia held 90.34% of the share capital and at least 90.25% of the voting rights of Alcatel-Lucent. Nokia issued a total of 1 776 379 756 new Nokia shares as consideration for the Alcatel-Lucent securities tendered in the exchange offer.
Alcatel-Lucent ordinary shares and ALU ADS’s acquired by Nokia subsequent to the closing of the reopened exchange offer (including through the Public Buy-Out Offer and the Squeeze-Out) were accounted for as equity transactions with the remaining non-controlling interests in Alcatel-Lucent. As such, any new Nokia shares or cash consideration paid for these instruments were recorded directly within equity against the carrying amount of non-controlling interests. The acquisition of OCEANEs subsequent to the transactions linked to the exchange offer was treated both as extinguishment of debt and equity transaction with remaining non-controlling interests in Alcatel-Lucent, with the redemption consideration allocated to the liability and equity components.
Subsequent to the exchange offer Nokia has carried out the following transactions relating to the acquisition of the remaining outstanding equity interests in Alcatel-Lucent not held by Nokia:
· On February 12, 2016, Nokia converted the OCEANE convertible bonds (the “OCEANEs”) acquired as part of the initial and reopened exchange offers to Alcatel-Lucent shares.
· On February 19, 2016, Nokia announced the issue of 6 501 503 new Nokia shares in exchange for Alcatel-Lucent shares in a private transaction at the 0.55 exchange offer provided in the initial and reopened exchange offers. This transaction was based on a resolution by the Board of Directors on February 18, 2016.
· On May 9, 2016, Nokia closed the acquisition of 107 775 949 Alcatel-Lucent shares in exchange for 59 276 772 new Nokia shares from JPMorgan Chase Bank N.A., as depositary (the “Alcatel Depositary”), pursuant to the share purchase agreement announced on March 17, 2016. These shares represent Alcatel-Lucent shares that remained in the Alcatel-Lucent American depositary receipts program after the cancellation period and following the program’s termination on April 25, 2016.
· On May 12, 2016, Nokia agreed to acquire 72 994 133 of 2019 OCEANEs and 19 943 533 of 2020 OCEANEs through a privately negotiated transaction in consideration for an aggregate cash payment of EUR 419 million.
· On June 17, 2016, Nokia acquired 24 392 270 Alcatel-Lucent shares, 9 614 661 of 2019 OCEANEs and 2 290 001 of 2020 OCEANEs through privately negotiated transactions in consideration for an aggregate cash payment of EUR 85 million for the Alcatel-Lucent shares (corresponding to a unit price of EUR 3.50 per share) and EUR 54 million for the OCEANEs (corresponding to a unit price of EUR 4.51 per 2019 OCEANE and EUR 4.50 per 2020 OCEANE).
Following these transactions, Nokia owned 95.32% of the share capital and 95.25% of the voting rights of Alcatel-Lucent, corresponding to 95.15% of the Alcatel-Lucent shares on a fully diluted basis.
On September 6, 2016, Nokia filed Nokia and Alcatel-Lucent’s draft joint offer document with the AMF relating to Nokia’s proposed public buy-out offer in cash for the remaining Alcatel-Lucent shares (the “Shares”) and OCEANEs it does not already own (the “Public Buy-Out Offer”). The Public Buy-Out Offer was followed by a squeeze-out in cash of the Shares and OCEANEs not tendered into the Public Buy-Out Offer (the “Squeeze-Out”, and together with the Public Buy-Out Offer, the “Offer”) in accordance with the General Regulation of the AMF.
Following the clearance decision of the Offer by the AMF on September 20, 2016, Nokia commenced the public buy-out offer on September 22, 2016 pursuant to which it proposed to all holders of the Shares and OCEANEs to acquire their securities. The financial terms of the Public Buy-Out Offer were as follows:
· EUR 3.50 per Alcatel-Lucent Share;
· EUR 4.51 per 2019 OCEANE; and
· EUR 4.50 per 2020 OCEANE.
In the Squeeze-Out, the Shares and OCEANEs not tendered into the Public Buy-Out Offer were to be transferred to Nokia for the same consideration as the above-mentioned consideration of the Public-Buy-Out Offer, net of all costs. The remaining outstanding Alcatel-Lucent stock options and performance shares were modified to settle in cash or Nokia shares.
On October 4, 2016, the AMF announced that a legal action was filed before the Paris Court of Appeal on September 30, 2016 for annulment of the AMF’s clearance decision regarding the Offer. In relation to the Offer, Nokia pledged EUR 678 million covering the purchase of the remaining Alcatel-Lucent securities. The pledge was constituted in connection with the obligation of Nokia’s presenting bank to guarantee the content and the irrevocable nature of Nokia’s commitments in relation to the Offer, pursuant to General Regulation of the AMF. The pledged amount was partially released upon the acquisition of Alcatel-Lucent securities of equivalent amount in the Public Buy-out Offer.
On October 25, 2016, the AMF announced the continuation of the timetable of the Offer. Accordingly, the Public Buy-Out Offer period ended on October 31, 2016 and the Squeeze-Out was implemented on November 2, 2016, in accordance with the General Regulation of the AMF.
On November 2, 2016, as a result of the Public Buy-Out Offer and the Squeeze-Out, Nokia holds 100% of the share capital and the voting rights of Alcatel-Lucent. Alcatel-Lucent’s
Shares and OCEANEs were delisted from the regulated market of Euronext Paris on the same date.
On December 15, 2016, the plaintiffs withdrew their complaint. As a result of this settlement, the earlier commitments made by Nokia as a precautionary measure to the AMF in connection with its decision to proceed with the squeeze-out are no longer in force. Consequently, the funds and Alcatel-Lucent securities deposited into escrow accounts were released to Nokia and Nokia no longer has an obligation to maintain the integrity of the entity Alcatel Lucent S.A.
Purchase consideration
The purchase consideration comprises of the fair value of Alcatel-Lucent Securities obtained through the exchange offer, and the fair value of the portion of Alcatel-Lucent stock options and performance shares attributable to pre-combination services that will be settled with Nokia shares. The fair value of the purchase consideration is based on the closing price of Nokia share of EUR 6.58 on NASDAQ Helsinki on January 4, 2016, and the exchange offer ratio of 0.55 Nokia share for every Alcatel-Lucent share.
Fair value of the purchase consideration
EUR million |
|
|
|
Alcatel-Lucent shares or ADS |
| 10 046 |
|
OCEANE convertible bonds |
| 1 570 |
|
Consideration attributable to the vested portion of replacement share-based payment awards |
| 6 |
|
Fair value of the purchase consideration |
| 11 622 |
|
Fair value of the purchase consideration is based on the results of the initial and the reopened exchange offers.
Purchase accounting
Nokia has completed the analyses related to the purchase accounting for the Alcatel-Lucent acquisition, including purchase price allocation. In connection with the purchase price allocation, Nokia recorded intangible assets, deferred tax assets and deferred tax liabilities of EUR 5 711 million, EUR 2 328 million and EUR 425 million, respectively, to the Alcatel-Lucent opening statement of financial position. In comparison to the provisional purchase price allocation reported in Nokia’s third quarter 2016 financial statements, the additional adjustments recorded to complete the Alcatel-Lucent opening statement of financial position resulted in a decrease in goodwill of EUR 69 million. These adjustments relate to additional information and analysis conducted by Nokia that reflect facts and circumstances existing on the acquisition date.
In connection with Nokia’s third quarter 2016 earnings release, Nokia determined that certain adjustments to the fair value of deferred tax assets and deferred tax liabilities had a significant subsequent impact on the income tax benefit recognized in Nokia’s first quarter 2016 income statement. Therefore, Nokia recorded a EUR 99 million adjustment to income tax benefit within its first quarter 2016 income statement. The impact from adjustments recorded in the fourth quarter 2016 to complete the purchase price allocation did not have a material subsequent impact to previous quarter financial statements and the subsequent impact of these adjustments was recorded cumulatively in Nokia’s fourth quarter 2016 financial statements.
Opening statement of financial position for major classes of assets and liabilities
EUR million |
|
|
|
|
|
|
|
Non-current assets |
|
|
|
|
|
|
|
Intangible assets |
|
|
|
|
| 5 711 |
|
Property, plant and equipment |
|
|
|
|
| 1 412 |
|
Deferred tax assets |
|
|
|
|
| 2 328 |
|
Defined benefit pension assets |
|
|
|
|
| 3 201 |
|
Other non-current assets |
|
|
|
|
| 687 |
|
|
|
|
|
|
| 13 339 |
|
Current assets |
|
|
|
|
|
|
|
Accounts receivable |
|
|
|
|
| 2 813 |
|
Inventories |
|
|
|
|
| 1 992 |
|
Other current assets |
|
|
|
|
| 1 359 |
|
Cash and cash equivalents |
|
|
|
|
| 6 198 |
|
|
|
|
|
|
| 12 363 |
|
Assets acquired |
|
|
|
|
| 25 702 |
|
Non-current liabilities |
|
|
|
|
|
|
|
Long-term interest-bearing liabilities |
|
|
|
|
| 4 037 |
|
Deferred tax liabilities |
|
|
|
|
| 425 |
|
Pensions and other post-retirement benefits |
|
|
|
|
| 4 464 |
|
Other non-current liabilities |
|
|
|
|
| 548 |
|
|
|
|
|
|
| 9 473 |
|
Current liabilities |
|
|
|
|
|
|
|
Current borrowings and other financial liabilities |
|
|
|
|
| 671 |
|
Other current liabilities |
|
|
|
|
| 7 307 |
|
|
|
|
|
|
| 7 978 |
|
Liabilities assumed |
|
|
|
|
| 17 450 |
|
Net identifiable assets acquired |
|
|
|
|
| 8 252 |
|
Non-controlling interest |
|
|
|
|
| 1 714 |
|
Net identifiable assets acquired attributable to equity holders of the parent |
|
|
|
|
| 6 538 |
|
Goodwill |
|
|
|
|
| 5 084 |
|
Purchase consideration |
|
|
|
|
| 11 622 |
|
The goodwill arising from the acquisition of Alcatel-Lucent amounts to EUR 5.1 billion and is primarily attributable to synergies arising from the significant economies of scale and scope that Nokia is expecting to benefit from as part of the new combined entity. Goodwill arising from the acquisition of Alcatel-Lucent was allocated to the four operating segments within Nokia’s Networks business.
Nokia elected to measure the components of non-controlling interests in Alcatel-Lucent (that are present ownership interests and entitle their holders to a proportionate share of the entity’s net assets in the event of liquidation) based on the non-controlling interests’ proportionate share of the fair value of the acquired identifiable net assets. As such, the goodwill excludes the goodwill related to the non-controlling interests. The equity component of the remaining outstanding OCEANEs as well as the outstanding stock options and performance shares that will be settled in Alcatel-Lucent ordinary shares are measured at fair value within non-controlling interests.
Fair values of other intangible assets acquired
|
| Fair value |
| Amortization |
|
|
| EUR million |
| years |
|
Customer relationships |
| 2 902 |
| 10 |
|
Technologies |
| 2 170 |
| 4 |
|
Other |
| 639 |
| 8 |
|
Other intangible assets acquired |
| 5 711 |
|
|
|
Acquisition-related costs not directly attributable to the issue of shares included in selling, general and administrative as well as other expenses in the consolidated income statement and in operating cash flows in the consolidated statement of cash flows total to EUR 125 million of which EUR 93 million is recognized in 2016.
The acquired business contributed revenues of EUR 12 151 million and net loss of EUR 508 million to Nokia for the period from 4 January to 31 December 2016.
These amounts have been calculated using the subsidiary’s results and adjusting them for the accounting policy alignments and these are explained in the “Basis of preparation” section of the stock exchange release published on April 22, 2016.
Other acquisitions
On March 31, 2016, Nokia completed the acquisition of assets of Nakina Systems Inc, a Canadian security and operational systems software company. The acquisition complements Nokia’s existing security portfolio and helps its customers meet the growing requirements of network security. The goodwill arising from the acquisition was allocated to Applications and Analytics.
On May 31, 2016, Nokia closed its acquisition of Withings S.A., a provider of digital health products and services, to accelerate entry to Digital Health. The goodwill arising from the acquisition was allocated to Nokia Technologies.
On July 29, 2016, Nokia completed the acquisition of Gainspeed, a US-based start-up specializing in DAA (Distributed Access Architecture) solutions for the cable industry via its Virtual CCAP (Converged Cable Access Platform) product line. The transaction complements Nokia’s current fiber access technologies for cable multiple-system operators and provides the end-to-end technology capabilities needed to support growing capacity requirements. The goodwill arising from the acquisition was allocated to Fixed Networks.
On October 4, 2016, Nokia completed the acquisition of ETA Devices, a US-based start-up specializing in power amplifier efficiency solutions for base stations, access points and devices. The acquisition enhances Nokia’s base station energy efficiency, an increasingly important area for operators on the path to 4.9G and 5G. The goodwill arising from the acquisition was allocated to Mobile Networks.
Other acquisitions completed in 2016 did not have a material impact, individually and in aggregate, to Nokia’s statement of financial position, comprehensive income or cash flows. The estimated aggregate purchase consideration paid, aggregate goodwill and fair value of intangible assets arising from these acquisitions amount to EUR 359 million, EUR 273 million and EUR 70 million, respectively. The purchase accounting for these acquisitions is partially provisional and Nokia will conduct additional analysis that may result in adjustments in the first quarter of 2017.
7. DISCONTINUED OPERATIONS, reported (unaudited)
On August 3, 2015 Nokia announced the sale of the HERE business to a consortium of leading automotive companies, comprising AUDI AG, BMW Group and Daimler AG. Subsequent to that date, Nokia has presented the HERE business as discontinued operations excluding items outside the final transaction scope until completion of the sale on December 4, 2015. Accordingly, Nokia has also reclassified the comparative periods on the consolidated condensed income statement. Discontinued operations include also the continuing financial effects of the Sale of the Devices & Services Business in 2014.
Results of discontinued operations
EUR million |
| Q4’16 |
| Q4’15 |
| Q3’16 |
| Q1- |
| Q1- |
|
Net sales |
| (2 | ) | 242 |
| 2 |
| 2 |
| 1 075 |
|
Cost of sales |
| 4 |
| (44 | ) | (3 | ) | 0 |
| (245 | ) |
Gross profit |
| 1 |
| 198 |
| (1 | ) | 2 |
| 831 |
|
Research and development expenses |
| 0 |
| (98 | ) | 0 |
| 0 |
| (498 | ) |
Selling, general and administrative expenses |
| (2 | ) | (46 | ) | (2 | ) | (11 | ) | (212 | ) |
Other income and expenses |
| (4 | ) | 5 |
| 5 |
| (6 | ) | (23 | ) |
Operating (loss)/profit |
| (5 | ) | 60 |
| 2 |
| (14 | ) | 98 |
|
Financial income and expense |
| (3 | ) | 24 |
| (3 | ) | 14 |
| (9 | ) |
(Loss)/profit before tax |
| (7 | ) | 84 |
| (1 | ) | (1 | ) | 89 |
|
Income tax (expense)/benefit |
| (18 | ) | 18 |
| (6 | ) | (28 | ) | 7 |
|
(Loss)/profit for the period, ordinary activities |
| (26 | ) | 101 |
| (6 | ) | (28 | ) | 96 |
|
Gain on the sale of businesses, net of tax |
| 0 |
| 1 191 |
| 0 |
| 14 |
| 1 178 |
|
(Loss)/Profit from discontinued operations |
| (26 | ) | 1 292 |
| (6 | ) | (15 | ) | 1 274 |
|
Costs and expenses include: |
|
|
|
|
|
|
|
|
|
|
|
Depreciation and amortization |
| 0 |
| 0 |
| 0 |
| 0 |
| (33 | ) |
Cash flows from discontinued operations
|
|
|
|
|
|
|
| Reported |
| Reported |
|
|
| Reported |
| Reported |
| Reported |
| Q1- |
| Q1- |
|
EUR million |
| Q4’16 |
| Q4’15 |
| Q3’16 |
| Q4’16 |
| Q4’15 |
|
Net cash (used in)/from operating activities |
| (2 | ) | (47 | ) | (2 | ) | (10 | ) | 6 |
|
Net cash from investing activities |
| 0 |
| 2 532 |
| 28 |
| 3 |
| 2 553 |
|
Net cash flow for the period |
| (2 | ) | 2 485 |
| 26 |
| (7 | ) | 2 559 |
|
8. PENSIONS AND OTHER POST-EMPLOYMENT BENEFITS, reported (unaudited)
Nokia operates a number of post-employment plans, group life plans and retiree healthcare plans in various countries. Defined benefit plans expose Nokia to actuarial risks such as interest rate risk and life expectancy risk, as well as investment risk. The characteristics and associated risks of the defined benefit plans vary depending on legal, fiscal and economic requirements in each country.
100% of Nokia’s defined benefit obligation and plan assets fair values were remeasured as of December 31, 2016. The remeasurement was provided by external actuaries through annual valuations as of December 31, 2016 for all of Nokia’s existing defined benefit obligations.
The weighted average discount rates used to measure Nokia’s pension and post-retirement obligations as of December 31, 2016 have been updated and were as follows:
Discount rates
|
| December 31, 2016 |
| December 31, 2015 |
|
|
|
|
|
|
|
U.S. Pension |
| 3.7 |
| 4.5 |
|
|
|
|
|
|
|
U.S. Post-retirement healthcare and other |
| 3.6 |
| — |
|
|
|
|
|
|
|
U.S. Post-retirement group life |
| 3.7 |
| — |
|
|
|
|
|
|
|
Euro - Pension (1) |
| 1.5 |
| 2.5 |
|
|
|
|
|
|
|
U.K. - Pension |
| 2.7 |
| 3.6 |
|
(1) Includes pensions, retirement indemnities and end-of service gratuities.
Change in pension and post-retirement net asset/(liability) recognized:
|
| December 31, 2016 |
| December 31, 2015 |
| ||||||||
EUR million |
| Pension |
| Post- |
| Total |
| Pension benefits (1) |
| Post-retirement |
| Total |
|
|
|
|
|
|
|
|
|
|
|
|
|
|
|
Net liability recognized at January 1 |
| (398 | ) | 0 |
| (398 | ) | (500 | ) | 0 |
| (500 | ) |
Current service cost |
| (155 | ) | 0 |
| (155 | ) | (46 | ) | 0 |
| (46 | ) |
Net interest income/(expense) |
| 27 |
| (92 | ) | (65 | ) | (9 | ) | 0 |
| (9 | ) |
Curtailment |
| (2 | ) | 0 |
| (2 | ) | 5 |
| 0 |
| 5 |
|
Pension and healthcare plan amendments |
| 0 |
| 0 |
| 0 |
| (1 | ) | 0 |
| (1 | ) |
Total expense recognized in the income statement |
| (130 | ) | (92 | ) | (222 | ) | (51 | ) | 0 |
| (51 | ) |
Actuarial gains for the period |
| 679 |
| 179 |
| 858 |
| 116 |
| 0 |
| 116 |
|
Change in asset ceiling, excluding amounts included in net interest (expense) |
| (245 | ) | 0 |
| (245 | ) | (6 | ) | 0 |
| (6 | ) |
Total recognized in other comprehensive income |
| 434 |
| 179 |
| 613 |
| 110 |
| 0 |
| 110 |
|
Exchange differences |
| 7 |
| (89 | ) | (82 | ) | (7 | ) | 0 |
| (7 | ) |
Contributions and benefits paid |
| 186 |
| 10 |
| 196 |
| 39 |
| 0 |
| 39 |
|
Transfers |
| (199 | ) | 154 |
| (45 | ) | 0 |
| 0 |
| 0 |
|
Business combinations |
| 1 384 |
| (2 644 | ) | (1 260 | ) | 11 |
| 0 |
| 11 |
|
Net (liability)/asset recognized at the end of the period |
| 1 284 |
| (2 482 | ) | (1 198 | ) | (398 | ) | 0 |
| (398 | ) |
of which: |
|
|
|
|
|
|
|
|
|
|
|
|
|
- Defined benefit pension assets |
| 3 802 |
| 0 |
| 3 802 |
| 25 |
| 0 |
| 25 |
|
- Pension, retirements indemnities and post-employment benefits liabilities |
| (2 518 | ) | (2 482 | ) | (5 000 | ) | (423 | ) | 0 |
| (423 | ) |
(1) Includes pensions, retirement indemnities and end-of-service gratuities.
Funded status
|
| December 31, 2016 |
| December 31, 2015 |
|
Benefit obligation |
| (28 663 | ) | (1 840 | ) |
Fair value of plan assets |
| 27 770 |
| 1 451 |
|
(Unfunded) status |
| (893 | ) | (389 | ) |
Impact of the minimum funding / asset ceiling |
| (305 | ) | (9 | ) |
Net liability recognized at end of period |
| (1 198 | ) | (398 | ) |
9. DEFERRED TAXES, reported (unaudited)
At December 31, 2016, Nokia had recognized deferred tax assets of EUR 5.7 billion. The recognition of deferred tax assets is based on offsetting deferred tax liabilities, earnings history and profit projections in the relevant jurisdictions. The majority of Nokia’s recognized deferred tax assets relate to unused tax losses, tax credits and deductible temporary differences in the United States (EUR 2.5 billion) and Finland (EUR 2.2 billion). Based on the recent years’ profitability in the United States and Finland and the latest forecasts of future financial performance, Nokia has been able to establish a pattern of sufficient tax profitability in the United States and Finland to conclude that it is probable that Nokia will be able to utilize the tax losses, tax credits and deductible temporary differences in the foreseeable future. In 2016, Finland incurred an accounting loss due to significant integration and restructuring costs following the acquisition of Alcatel-Lucent, which may delay the utilization of the tax attributes in Finland.
At December 31, 2016, primarily due to the acquisition of Alcatel-Lucent, Nokia had unrecognized deferred tax assets of approximately EUR 6 billion related to unused tax losses, tax credits and deductible temporary differences. The majority of the unrecognized deferred tax assets relate to France (approximately EUR 5 billion). These deferred tax assets have not been recognized due to uncertainty regarding their utilization. A significant portion of the French unrecognized deferred tax assets are indefinite in nature and available against future French tax liabilities, subject to a limitation of 50% of annual taxable profits.
At December 31, 2016, Nokia had deferred tax liabilities of EUR 0.4 billion. The majority of the deferred tax liabilities relate to the fair value adjustments on the purchase accounting of Alcatel-Lucent acquisition (refer to note 6 “Acquisitions”).
Following the completion of the squeeze-out of the remaining Alcatel-Lucent shares, Nokia has launched actions to integrate the former Alcatel-Lucent and Nokia operating models. In the fourth quarter of 2016, in connection with these integration activities, Nokia transferred certain intellectual property to its US operations, recording a tax benefit and additional deferred tax assets of EUR 348 million. Second, for US tax purposes Nokia elected to treat the acquisition of Alcatel-Lucent’s US operations as an asset purchase. The impact of this election was to utilize or forfeit existing deferred tax assets and record new deferred tax assets with a longer amortization period than the life of those forfeited assets. As a result of this, Nokia recorded EUR 91 million of additional deferred tax assets in the fourth quarter of 2016.
10. FAIR VALUE OF FINANCIAL INSTRUMENTS, reported (unaudited)
Financial assets and liabilities recorded at fair value are categorized based on the amount of unobservable inputs used to measure their fair value. Three hierarchical levels are based on an increasing amount of judgment associated with the inputs used to derive fair valuation for these assets and liabilities; Level 1 being market values for exchange traded products, Level 2 being primarily based on quotes from third-party pricing services and Level 3 requiring most management judgment. At the end of each reporting period Nokia categorizes its financial assets and liabilities to appropriate level of fair value hierarchy.
|
| Carrying amounts |
| Fair |
| ||||||||||
At December 31, 2016, EUR million |
| Current available- |
| Non-current |
| Financial |
| Loans and |
| Financial |
| Total |
| Total |
|
Available-for-sale investments, carried at fair value |
| 0 |
| 838 |
| 0 |
| 0 |
| 0 |
| 838 |
| 838 |
|
Available-for-sale investments, carried at cost less impairment |
| 0 |
| 202 |
| 0 |
| 0 |
| 0 |
| 202 |
| 202 |
|
Other non-current financial assets |
| 0 |
| 0 |
| 111 |
| 144 |
| 0 |
| 254 |
| 228 |
|
Accounts receivable |
| 0 |
| 0 |
| 0 |
| 6 972 |
| 0 |
| 6 972 |
| 6 972 |
|
Other current financial assets |
| 0 |
| 0 |
| 235 |
| 60 |
| 0 |
| 296 |
| 296 |
|
Investments at fair value through profit and loss, liquid assets |
| 0 |
| 0 |
| 327 |
| 0 |
| 0 |
| 327 |
| 327 |
|
Available-for-sale investments, liquid assets carried at fair value |
| 1 502 |
| 0 |
| 0 |
| 0 |
| 0 |
| 1 502 |
| 1 502 |
|
Cash and cash equivalents carried at fair value |
| 7 497 |
| 0 |
| 0 |
| 0 |
| 0 |
| 7 497 |
| 7 497 |
|
Total financial assets |
| 8 999 |
| 1 040 |
| 673 |
| 7 176 |
| 0 |
| 17 889 |
| 17 863 |
|
Long-term interest-bearing liabilities |
| 0 |
| 0 |
| 0 |
| 0 |
| 3 657 |
| 3 657 |
| 3 821 |
|
Short-term interest bearing liabilities |
| 0 |
| 0 |
| 0 |
| 0 |
| 370 |
| 370 |
| 370 |
|
Other financial liabilities |
| 0 |
| 0 |
| 250 |
| 0 |
| 34 |
| 284 |
| 284 |
|
Accounts payable |
| 0 |
| 0 |
| 0 |
| 0 |
| 3 781 |
| 3 781 |
| 3 781 |
|
Total financial liabilities |
| 0 |
| 0 |
| 250 |
| 0 |
| 7 842 |
| 8 091 |
| 8 255 |
|
Items included in the following table are measured at fair value on a recurring basis.
|
| Instruments with |
| Valuation |
| Valuation |
|
|
|
At December 31, 2016, EUR million |
| (Level 1) |
| (Level 2) |
| (Level 3) |
| Total |
|
Available-for-sale investments, carried at fair value |
| 0 |
| 164 |
| 674 |
| 838 |
|
Other current financial assets, derivatives |
| 0 |
| 235 |
| 0 |
| 235 |
|
Investments at fair value through profit and loss |
| 0 |
| 438 |
| 0 |
| 438 |
|
Available-for-sale investments, liquid assets carried at fair value |
| 0 |
| 1 502 |
| 0 |
| 1 502 |
|
Total assets |
| 0 |
| 2 340 |
| 674 |
| 3 014 |
|
Other financial liabilities, derivatives |
| 0 |
| 236 |
| 14 |
| 250 |
|
Total liabilities |
| 0 |
| 236 |
| 14 |
| 250 |
|
|
| Carrying amounts |
| Fair |
| ||||||||||
At December 31, 2015, EUR million |
| Current |
| Non-current |
| Financial |
| Loans and |
| Financial |
| Total |
| Total |
|
Available-for-sale investments, carried at fair value |
| 0 |
| 703 |
| 0 |
| 0 |
| 0 |
| 703 |
| 703 |
|
Available-for-sale investments, carried at cost less impairment |
| 0 |
| 285 |
| 0 |
| 0 |
| 0 |
| 285 |
| 285 |
|
Other non-current financial assets |
| 0 |
| 0 |
| 0 |
| 49 |
| 0 |
| 49 |
| 39 |
|
Accounts receivable |
| 0 |
| 0 |
| 0 |
| 3 913 |
| 0 |
| 3 913 |
| 3 913 |
|
Other current financial assets |
| 0 |
| 0 |
| 96 |
| 32 |
| 0 |
| 128 |
| 128 |
|
Investments at fair value through profit and loss, liquid assets |
| 0 |
| 0 |
| 687 |
| 0 |
| 0 |
| 687 |
| 687 |
|
Available-for-sale investments, publicly quoted equity shares |
| 0 |
| 16 |
| 0 |
| 0 |
| 0 |
| 16 |
| 16 |
|
Available-for-sale investments, liquid assets carried at fair value |
| 2 167 |
| 0 |
| 0 |
| 0 |
| 0 |
| 2 167 |
| 2 167 |
|
Cash and cash equivalents carried at fair value |
| 6 995 |
| 0 |
| 0 |
| 0 |
| 0 |
| 6 995 |
| 6 995 |
|
Total financial assets |
| 9 162 |
| 1 004 |
| 783 |
| 3 994 |
| 0 |
| 14 943 |
| 14 933 |
|
Long-term interest-bearing liabilities |
| 0 |
| 0 |
| 0 |
| 0 |
| 2 023 |
| 2 023 |
| 2 100 |
|
Short-term interest bearing liabilities |
| 0 |
| 0 |
| 0 |
| 0 |
| 51 |
| 51 |
| 51 |
|
Other financial liabilities |
| 0 |
| 0 |
| 113 |
| 0 |
| 8 |
| 121 |
| 121 |
|
Accounts payable |
| 0 |
| 0 |
| 0 |
| 0 |
| 1 910 |
| 1 910 |
| 1 910 |
|
Total financial liabilities |
| 0 |
| 0 |
| 113 |
| 0 |
| 3 992 |
| 4 105 |
| 4 182 |
|
(1) For items not carried at fair value the following fair value measurement methods are used. The fair value is set to carrying amount for available-for-sale investments carried at cost less impairment for which no reliable fair value has been possible to estimate. The carrying amounts of these assets are tested for impairment using a discounted cash flow analysis if events or changes in circumstances indicate that such carrying amounts may not be recoverable. The fair values of long-term interest bearing liabilities are primarily based on quotes from third-party pricing services (level 2). The fair values of other assets and liabilities including loans receivable and loans payable are primarily based on discounted cash flow calculations (level 2). The fair value is estimated to equal the carrying amount for short-term financial assets and financial liabilities due to limited credit risk and short time to maturity.
Items included in the following table are measured at fair value on a recurring basis.
At December 31, 2015, EUR million |
| Instruments |
| Valuation |
| Valuation |
| Total |
|
Available-for-sale investments, carried at fair value |
| 0 |
| 15 |
| 688 |
| 703 |
|
Other current financial assets, derivatives |
| 0 |
| 96 |
| 0 |
| 96 |
|
Investments at fair value through profit and loss |
| 0 |
| 687 |
| 0 |
| 687 |
|
Available-for-sale investments, publicly quoted equity shares |
| 16 |
| 0 |
| 0 |
| 16 |
|
Available-for-sale investments, liquid assets carried at fair value |
| 0 |
| 2 167 |
| 0 |
| 2 167 |
|
Total assets |
| 16 |
| 2 965 |
| 688 |
| 3 669 |
|
Other financial liabilities, derivatives |
| 0 |
| 113 |
| 0 |
| 113 |
|
Total liabilities |
| 0 |
| 113 |
| 0 |
| 113 |
|
Level 3 includes a large number of investments in unlisted equities and unlisted venture funds, including investments managed by Nokia Growth Partners (“NGP”) specializing in growth-stage investing and by BlueRun Ventures focusing on early stage opportunities. Within level 3 fair value is determined by using one or more valuation techniques, where the use of the market approach generally consists of using comparable market transactions, while the use of the income approach generally consists of calculating the net present value of estimated future cash flows. For unlisted venture funds the selection of appropriate valuation techniques by the fund managing partner may be affected by the availability and reliability of relevant inputs. In some cases, one valuation technique may provide the best indication of fair value while in other circumstances, multiple valuation techniques may be appropriate.
The inputs generally considered in determining the fair value include the original transaction price, recent transactions in the same or similar instruments, completed or pending third-party transactions in the underlying investment or comparable issuers, subsequent rounds of financing, recapitalizations or other transactions undertaken by the issuer, offerings in the equity or debt capital markets, and changes in financial ratios or cash flows, adjusted as appropriate for liquidity, credit, market and/or other risk factors. Level 3 investments are valued on a quarterly basis taking into consideration any changes, projections and assumptions, as well as any changes in economic and other relevant conditions. The fair value may be adjusted to reflect illiquidity and/or non-transferability, with the amount of such discount estimated by the managing partner in the absence of market information. Assumptions used by the managing partner due to the lack of observable inputs may impact the resulting fair value of individual investments, but no individual input has a significant impact on the total fair value of Nokia’s level 3 investments. The following table shows a reconciliation of the opening and closing balances of Level 3 financial assets and liabilities:
EUR million |
| Level 3 Financial Assets and Liabilities |
|
Balance at December 31, 2015 |
| 688 |
|
Net gains in income statement |
| 52 |
|
Net loss recorded in other comprehensive income |
| (48 | ) |
Acquisitions through business combination |
| (14 | ) |
Purchases |
| 72 |
|
Sales |
| (101 | ) |
Other movements |
| 11 |
|
Balance at December 31, 2016 |
| 660 |
|
The gains and losses from financial assets and liabilities categorized in level 3 are included in other operating income and expenses in cases where the investment and disposal objectives for these investments are business driven. In other cases the gains and losses are included in financial income and expenses. A net gain of EUR 6 million (net gain of EUR 4 million in 2015) related to level 3 financial instruments held at December 31, 2016, was included in the profit and loss during 2016.
11. PROVISIONS, reported (unaudited)
EUR million |
| Restructuring |
| Divestment |
| Warranty |
| Project |
| Litigation |
| Environmental |
| Material |
| Other |
| Total |
|
At January 1, 2015 |
| 247 |
| 137 |
| 117 |
| 107 |
| 68 |
| 16 |
| 24 |
| 157 |
| 873 |
|
Disposal of businesses |
| 0 |
| 0 |
| 0 |
| 0 |
| (3 | ) | 0 |
| 0 |
| (2 | ) | (5 | ) |
Translation differences |
| (4 | ) | (12 | ) | 2 |
| 0 |
| (11 | ) | 0 |
| 0 |
| 7 |
| (18 | ) |
Reclassification |
| (33 | ) | (6 | ) | 0 |
| 0 |
| 15 |
| 0 |
| 0 |
| (9 | ) | (33 | ) |
Charged to income statement |
| 91 |
| 27 |
| 10 |
| (20 | ) | 13 |
| 0 |
| 26 |
| 24 |
| 171 |
|
Additional provisions |
| 105 |
| 49 |
| 31 |
| 5 |
| 24 |
| 0 |
| 46 |
| 42 |
| 302 |
|
Changes in estimates |
| (14 | ) | (22 | ) | (21 | ) | (25 | ) | (11 | ) | 0 |
| (20 | ) | (18 | ) | (131 | ) |
Utilized during period |
| (107 | ) | (17 | ) | (35 | ) | (25 | ) | (13 | ) | 0 |
| (21 | ) | (45 | ) | (263 | ) |
At December 31, 2015 |
| 194 |
| 129 |
| 94 |
| 62 |
| 69 |
| 16 |
| 29 |
| 132 |
| 725 |
|
|
|
|
|
|
|
|
|
|
|
|
|
|
|
|
|
|
|
|
|
At January 1, 2016 |
| 194 |
| 129 |
| 94 |
| 62 |
| 69 |
| 16 |
| 29 |
| 132 |
| 725 |
|
Acquisitions through business combinations |
| 291 |
| 26 |
| 135 |
| 180 |
| 100 |
| 114 |
| 31 |
| 366 |
| 1 243 |
|
Translation differences |
| 2 |
| 9 |
| 1 |
| 0 |
| 22 |
| 4 |
| 2 |
| 1 |
| 41 |
|
Reclassification (1) |
| (87 | ) | (2 | ) | 5 |
| (7 | ) | 8 |
| 0 |
| 1 |
| (39 | ) | (121 | ) |
Charged to income statement |
| 751 |
| (8 | ) | 121 |
| 51 |
| 44 |
| 26 |
| 36 |
| 183 |
| 1 204 |
|
Additional provisions |
| 874 |
| 16 |
| 159 |
| 89 |
| 75 |
| 28 |
| 57 |
| 287 |
| 1 585 |
|
Changes in estimates |
| (123 | ) | (24 | ) | (38 | ) | (38 | ) | (31 | ) | (2 | ) | (21 | ) | (104 | ) | (381 | ) |
Utilized during period |
| (438 | ) | (44 | ) | (149 | ) | (155 | ) | (60 | ) | (26 | ) | (22 | ) | (218 | ) | (1 112 | ) |
At December 31, 2016 |
| 713 |
| 110 |
| 207 |
| 131 |
| 183 |
| 134 |
| 77 |
| 425 |
| 1 980 |
|
(1) The reclassification from restructuring consists of EUR 87 million to accrued expenses. The reclassification from divestment consists of EUR 2 million to litigation. The reclassification from project losses consists of EUR 7 million to project inventory write-downs. The reclassification of EUR 39 million from other provisions consists of EUR 5 million to warranty, EUR 9 million to litigation, EUR 1 million to material liability and EUR 24 million to accrued expenses to better reflect the nature of these items.
As of December 31, 2016 Nokia restructuring provision amounted to EUR 713 million including personnel and other restructuring related costs, such as real estate exit costs. On April 6, 2016, Nokia announced that it was beginning actions to reduce company personnel globally as part of its previously announced synergy and transformation program. As a result of the announcement and subsequent consultations taken place, Nokia recognized in the second quarter 2016 a provision of EUR 593 million, of which EUR 45 million have been transferred to accrued expenses and EUR 15 million were used by end of the second quarter 2016. During the third quarter the usage of the provision was EUR 36 million. During the fourth quarter the usage of the provision was EUR 62 million and EUR 42 was transferred to accrued expenses. In addition, the total amount of restructuring provision includes EUR 257 million relating to the restructuring provisions recognized due to previously announced restructuring programs. The majority of the restructuring related outflows is expected to occur over the next two years.
Divestment related provisions relate to sale of businesses and include certain liabilities for which the Group is required to indemnify the buyer. Outflows related to the indemnifications are inherently uncertain. The warranty provisions relate to products sold. Outflows of warranty provisions are generally expected to occur within the next 18 months. Provisions for project losses relate to Networks onerous contracts. Utilization of provisions for project losses is generally expected to occur over the next 12 months. The litigation provision includes estimated potential future settlements for litigation. Outflows related to litigations are inherently uncertain and generally occur over several periods. The material liability provision relates to non-cancellable purchase commitments with suppliers. Outflows are expected to occur over the next 12 months. Other provisions include provisions for various contractual obligations and other obligations. Outflows related to other provisions are generally expected to occur over the next two years.
12. COMMITMENTS AND CONTINGENCIES, reported (unaudited)
EUR million |
| December 31, |
| December 31, |
|
Collateral for own commitments |
|
|
|
|
|
Assets pledged |
| 5 |
| 7 |
|
Contingent liabilities on behalf of Group companies (1) |
|
|
|
|
|
Guarantees issued by financial institutions |
| 1 805 |
| 398 |
|
Other guarantees |
| 794 |
| 129 |
|
Contingent liabilities on behalf of associated companies and joint ventures |
|
|
|
|
|
Financial guarantees |
| 11 |
| 15 |
|
Contingent liabilities on behalf of other companies |
|
|
|
|
|
Financial guarantees |
| 0 |
| 6 |
|
Other guarantees |
| 135 |
| 137 |
|
Leasing obligations |
| 1 141 |
| 476 |
|
Financing commitments |
|
|
|
|
|
Customer finance commitments |
| 223 |
| 180 |
|
Venture fund commitments (2) |
| 525 |
| 230 |
|
The amounts above represent the maximum principal amount of commitments and contingencies.
(1) In contingent liabilities on behalf of Group companies Nokia reports guarantees that have been given to third parties in the normal course of business. These are mainly guarantees given by financial institutions to Nokia’s customers for the performance of Nokia’s obligations under supply agreements, including tender bonds, performance bonds, and warranty bonds issued by financial institutions on behalf of Nokia. Additionally Nokia has issued corporate guarantees with primary obligation given directly to customers. These guarantees have been issued by Nokia Corporation for EUR 88 million (EUR 74 million at December 31, 2015) as well as by certain Alcatel-Lucent entities for EUR 1 520 million. In Other guarantees Nokia reports guarantees related to non-commercial contracts that support Nokia’s business activities. As a result of internal policies and active management of outstanding guarantee exposure, Nokia has not been subject to any material guarantee claims during recent years.
(2) On February 21, 2016, NGP announced the closing of a new USD 350 million fund for investments in IoT companies. The fund is sponsored by Nokia and will serve to identify new opportunities to grow the ecosystem in IoT solutions. The fund IV commitment brings NGP’s total assets under management to over USD 1 billion, including USD 500 million available for new investments.
13. RELATED PARTY TRANSACTIONS, reported (unaudited)
Significant related party transactions with associated companies, joint ventures and other entities where the Group has significant influence in 2016 include share of results of associated companies and joint ventures of EUR 18 million income (EUR 29 million income in 2015), sales to associated companies, joint ventures and other entities where the Group has significant influence of EUR 62 million (EUR 0 million in 2015) and purchases from associated companies and joint ventures of EUR 246 million (EUR 233 million in 2015).
Transactions and balances with companies over which Nokia exercises control are eliminated on consolidation. Refer to note 1, “Accounting principles” and note 33, “Principal Group companies”, of our Annual Report on Form 20-F for 2015.
Nokia has related party transactions with a pension fund, the management and the Board of Directors. There have been no significant changes to related party transactions with the pension fund.
On January 8, 2016, Nokia confirmed the composition of the new Board of Directors and Group Leadership Team (“GLT”). The GLT continues to be chaired by Nokia’s President and CEO, Rajeev Suri, and comprises 12 members: the President and CEO, five business group leaders and six unit leaders. During Q3 2016, one member of the GLT left Nokia reducing the total members of the GLT from 13 to 12 at the end of September 2016. No additional changes were made during Q4, 2016. Total GLT compensation has increased from 2015 following the increase in the number of GLT members.
14. INTEREST-BEARING LIABILITIES, reported (unaudited)
|
|
|
|
|
|
|
|
|
| Carrying amount |
| Carrying |
|
Issuer/Borrower |
| Instrument |
| Currency |
| Nominal |
| Final maturity |
| December 31, |
| December 31, |
|
Nokia Corporation |
| Revolving credit facility (1) |
| EUR |
| 1579 |
| June 2019 |
| 0 |
| 0 |
|
Nokia Corporation |
| 6.625% senior notes |
| USD |
| 500 |
| May 2039 |
| 482 |
| 467 |
|
Alcatel-Lucent USA Inc. |
| 6.45% senior notes |
| USD |
| 1360 |
| March 2029 |
| 1 306 |
| 0 |
|
Alcatel-Lucent USA Inc. |
| 6.5% senior notes |
| USD |
| 300 |
| January 2028 |
| 287 |
| 0 |
|
Alcatel-Lucent S.A. |
| 0.125% OCEANE convertible bond |
| EUR |
| 0 |
| January 2020 |
| 0 |
| 0 |
|
Nokia Corporation |
| 5.375% senior notes |
| USD |
| 1000 |
| May 2019 |
| 961 |
| 940 |
|
Nokia Corporation |
| 6.75% senior notes |
| EUR |
| 500 |
| February 2019 |
| 527 |
| 539 |
|
Alcatel-Lucent S.A. |
| 0% OCEANE convertible bond |
| EUR |
| 0 |
| January 2019 |
| 0 |
| 0 |
|
Nokia Corporation and various subsidiaries |
| Other liabilities (2) |
|
|
|
|
|
|
| 464 |
| 128 |
|
Total |
|
|
|
|
|
|
|
|
| 4 027 |
| 2 074 |
|
(1) In June 2016 Nokia exercised its options to increase the size of the EUR 1 500 million revolving credit facility to EUR 1 579 million and to extend the maturity date from June 2018 to June 2019. The facility has a one-year extension option remaining, no financial covenants and it remains undrawn.
(2) This line includes liabilities related to French R&D tax credits (i.e. “Crédits d’Impôt Recherche”) of EUR 132 million (EUR 0 million December 31, 2015) that have been sold to banks on a recourse basis and hence not derecognized from the consolidated statement of financial position.
In January 2016, Alcatel-Lucent S.A. repaid its EUR 190 million 8.50% senior notes. In February, 2016, Alcatel-Lucent USA Inc. redeemed its USD 650 million 4.625% notes due July 2017, USD 500 million 8.875% notes due January 2020 and USD 700 million 6.750% notes due November 2020 in accordance with their respective terms and conditions. In February 2016, Alcatel-Lucent S.A. terminated its EUR 504 million revolving credit facility. In March 2016, the Alcatel-Lucent Submarine Networks’ credit facility of EUR 74 million was repaid.
In total 211 579 445 of 2018 OCEANE convertible bonds, 57 852 372 of 2019 OCEANE convertible bonds and 72 783 038 of 2020 OCEANE convertible bonds, with nominal amounts of EUR 381 million, EUR 238 million and EUR 293 million respectively, were tendered in the French and U.S. offers for exchange into Nokia shares and converted to Alcatel-Lucent shares by Nokia following the settlement of reopened offer in February 2016. As a result of conversion, less than 15% of the 2018 OCEANE convertible bonds remained outstanding and Nokia caused Alcatel-Lucent S.A. to redeem at par value, plus accrued interest all of the outstanding 2018 OCEANE convertible bonds pursuant to the terms and conditions of the bonds.
During January and February 2016 other bondholders have converted 19 981 014 of 2018 OCEANE convertible bonds, 1 014 828 of 2019 OCEANE convertible bonds and 5 010 000 of 2020 OCEANE convertible bonds, with nominal amounts of EUR 36 million, EUR 4 million and EUR 20 million, respectively. Additionally certain bondholders exercised their right to put back 7 393 369 of 2019 OCEANE convertible bonds and 1 751 000 of 2020 OCEANE convertible bonds at par plus accrued interest for a cash consideration of EUR 30 million and EUR 7 million, respectively.
During May and June 2016 Nokia acquired in privately negotiated transactions in total 82 608 794 of 2019 OCEANE convertible bonds and 22 233 534 of 2020 OCEANE convertible bonds in consideration for an aggregate cash payment of EUR 473 million. Transactions corresponded to a unit price of EUR 4.51 per 2019 OCEANE and EUR 4.50 per 2020 OCEANE.
In September 2016 Nokia launched its Public Buy-Out Offer for all the securities of Alcatel-Lucent that it does not own. On October 4, 2016 the AMF announced that a legal action was filed before the Paris Court of Appeal on September 30, 2016 for annulment of the AMF’s clearance decision regarding the Offer. On October 25, 2016, the AMF announced the continuation of the timetable of the Offer. Accordingly, the Public Buy-Out Offer period ended on October 31, 2016 and the Squeeze-Out was implemented on November 2, 2016, in accordance with the General Regulation of the AMF.
All of the remaining Nokia borrowings are senior unsecured and have no financial covenants.
15. NOTES TO THE CONSOLIDATED STATEMENT OF CASH FLOWS, reported (unaudited)
EUR million |
| Q4’16 |
| Q4’15 |
| Q3’16 |
| Q1-Q4’16 |
| Q1-Q4’15 |
|
Adjustments for (1) |
|
|
|
|
|
|
|
|
|
|
|
Depreciation and amortization |
| 403 |
| 76 |
| 374 |
| 1 594 |
| 320 |
|
(Profit)/loss on sale of property, plant and equipment and available-for-sale investments |
| (4 | ) | 12 |
| (12 | ) | (82 | ) | (132 | ) |
Income tax (benefit)/expense |
| (383 | ) | 97 |
| 116 |
| (429 | ) | 338 |
|
Share of results of associated companies and joint ventures |
| (12 | ) | (17 | ) | (2 | ) | (18 | ) | (29 | ) |
Financial income and expenses |
| 75 |
| 33 |
| 110 |
| 308 |
| 211 |
|
Transfer from hedging reserve to sales and cost of sales |
| 16 |
| 8 |
| 6 |
| 27 |
| 61 |
|
Impairment charges |
| 88 |
| 7 |
| 26 |
| 145 |
| 11 |
|
Loss/(gain) on the sale of businesses |
| 1 |
| (1 191 | ) | 0 |
| (13 | ) | (1 178 | ) |
Asset retirements |
| 1 |
| 2 |
| 1 |
| 3 |
| 6 |
|
Share-based payment |
| 22 |
| 13 |
| 51 |
| 113 |
| 49 |
|
Restructuring charges (2) |
| 110 |
| (18 | ) | 28 |
| 751 |
| 48 |
|
Working capital charges related to the Alcatel-Lucent purchase price allocation |
| 74 |
| 0 |
| 60 |
| 840 |
| 0 |
|
Other income and expenses |
| (3 | ) | (4 | ) | 7 |
| 22 |
| 34 |
|
Total |
| 388 |
| (982 | ) | 765 |
| 3 261 |
| (261 | ) |
Change in net working capital |
|
|
|
|
|
|
|
|
|
|
|
(Increase)/decrease in short-term receivables |
| (417 | ) | (537 | ) | 249 |
| 18 |
| (728 | ) |
Decrease/(Increase) in inventories |
| 220 |
| 168 |
| 123 |
| 24 |
| 341 |
|
(Decrease)/increase in interest-free short-term liabilities |
| (113 | ) | 101 |
| (652 | ) | (3 104 | ) | (990 | ) |
Total |
| (310 | ) | (268 | ) | (280 | ) | (3 062 | ) | (1 377 | ) |
(1) | Adjustments for continuing and discontinued operations. |
(2) | The adjustments for restructuring charges represent the non-cash portion of the restructuring charges recognized in the consolidated income statement. |
Net cash and other liquid assets
|
| December |
| December |
| September |
|
Investments at fair value through profit and loss, liquid assets |
| 327 |
| 687 |
| 481 |
|
Available-for-sale investments, liquid assets |
| 1 502 |
| 2 167 |
| 2 023 |
|
Cash and cash equivalents |
| 7 497 |
| 6 995 |
| 6 887 |
|
Total cash and other liquid assets |
| 9 327 |
| 9 849 |
| 9 392 |
|
|
|
|
|
|
|
|
|
Long-term interest-bearing liabilities |
| 3 657 |
| 2 023 |
| 3 518 |
|
Short-term interest-bearing liabilities |
| 371 |
| 51 |
| 335 |
|
Interest-bearing liabilities |
| 4 027 |
| 2 074 |
| 3 853 |
|
|
|
|
|
|
|
|
|
Net cash and other liquid assets |
| 5 299 |
| 7 775 |
| 5 539 |
|
RISKS AND FORWARD-LOOKING STATEMENTS
It should be noted that Nokia and its businesses are exposed to various risks and uncertainties and certain statements herein that are not historical facts are forward-looking statements, including, without limitation, those regarding: A) our ability to integrate Alcatel-Lucent into our operations and achieve the targeted business plans and benefits, including targeted synergies in relation to the acquisition of Alcatel-Lucent; B) expectations, plans or benefits related to our strategies and growth management; C) expectations, plans or benefits related to future performance of our businesses; D) expectations, plans or benefits related to changes in organizational and operational structure; E) expectations regarding market developments, general economic conditions and structural changes; F) expectations and targets regarding financial performance, results, operating expenses, taxes, currency exchange rates, hedging, cost savings and competitiveness, as well as results of operations including targeted synergies and those related to market share, prices, net sales, income and margins; G) timing of the deliveries of our products and services; H) expectations and targets regarding collaboration and partnering arrangements, joint ventures or the creation of joint ventures, as well as our expected customer reach; I) outcome of pending and threatened litigation, arbitration, disputes, regulatory proceedings or investigations by authorities; J) expectations regarding restructurings, investments, uses of proceeds from transactions, acquisitions and divestments and our ability to achieve the financial and operational targets set in connection with any such restructurings, investments, divestments and acquisitions; and K) statements preceded by or including “believe,” “expect,” “anticipate,” “foresee,” “sees,” “target,” “estimate,” “designed,” “aim,” “plans,” “intends,” “focus,” “continue,” “project,” “should,” “will” or similar expressions.
These statements are based on management’s best assumptions and beliefs in light of the information currently available to it. Because they involve risks and uncertainties, actual results may differ materially from the results that we currently expect. Factors, including risks and uncertainties that could cause these differences include, but are not limited to: 1) our ability to execute our strategy, sustain or improve the operational and financial performance of our business and correctly identify and successfully pursue business opportunities or growth; 2) our ability to achieve the anticipated benefits, synergies, cost savings and efficiencies of the Alcatel-Lucent acquisition, and our ability to implement our organizational and operational structure efficiently; 3) general economic and market conditions and other developments in the economies where we operate; 4) competition and our ability to effectively and profitably compete and invest in new competitive high-quality products, services, upgrades and technologies and bring them to market in a timely manner; 5) our dependence on the development of the industries in which we operate, including the cyclicality and variability of the information technology and telecommunications industries; 6) our global business and exposure to regulatory, political or other developments in various countries or regions, including emerging markets and the associated risks in relation to tax matters and exchange controls, among others; 7) our ability to manage and improve our financial and operating performance, cost savings, competitiveness and synergies after the acquisition of Alcatel-Lucent; 8) our dependence on a limited number of customers and large multi-year agreements; 9) exchange rate fluctuations, as well as hedging activities; 10) Nokia Technologies’ ability protect its IPR and to maintain and establish new sources of patent licensing income and IPR-related revenues, particularly in the smartphone market; 11) our dependence on IPR technologies, including those that we have developed and those that are
licensed to us, and the risk of associated IPR-related legal claims, licensing costs and restrictions on use; 12) our exposure to direct and indirect regulation, including economic or trade policies, and the reliability of our governance, internal controls and compliance processes to prevent regulatory penalties in our business or in our joint ventures; 13) our reliance on third-party solutions for data storage and service distribution, which expose us to risks relating to security, regulation and cybersecurity breaches; 14) inefficiencies, breaches, malfunctions or disruptions of information technology systems; 15) Nokia Technologies’ ability to generate net sales and profitability through licensing of the Nokia brand, particularly in digital media and digital health, and the development and sales of products and services, as well as other business ventures which may not materialize as planned; 16) our exposure to various legislative frameworks and jurisdictions that regulate fraud and enforce economic trade sanctions and policies, and the possibility of proceedings or investigation that result in fines, penalties or sanctions; 17) adverse developments with respect to customer financing or extended payment terms we provide to customers; 18) the potential complex tax issues, tax disputes and tax obligations we may face in various jurisdictions, including the risk of obligations to pay additional taxes; 19) our actual or anticipated performance, among other factors, which could reduce our ability to utilize deferred tax assets; 20) our ability to retain, motivate, develop and recruit appropriately skilled employees; 21) disruptions to our manufacturing, service creation, delivery, logistics and supply chain processes, and the risks related to our geographically-concentrated production sites; 22) the impact of litigation, arbitration, agreement-related disputes or product liability allegations associated with our business; 23) our ability to optimize our capital structure as planned and re-establish our investment grade credit rating or otherwise improve our credit ratings; 24) our ability to achieve targeted benefits from or successfully implement planned transactions, as well as the liabilities related thereto; 25) our involvement in joint ventures and jointly-managed companies; 26) the carrying amount of our goodwill may not be recoverable; 27) uncertainty related to the amount of dividends and equity return we are able to distribute to shareholders for each financial period; 28) pension costs, employee fund-related costs, and healthcare costs; and 29) risks related to undersea infrastructure, as well as the risk factors specified on pages 69 to 87 of our annual report on Form 20-F filed on April 1, 2016 under “Operating and financial review and prospects—Risk factors”, and in Nokia’s other filings with the U.S. Securities and Exchange Commission. Other unknown or unpredictable factors or underlying assumptions subsequently proven to be incorrect could cause actual results to differ materially from those in the forward-looking statements. We do not undertake any obligation to publicly update or revise forward-looking statements, whether as a result of new information, future events or otherwise, except to the extent legally required.
This financial report was authorized for issue by management on February 1, 2017.
Media and Investor Contacts:
Communications, tel. +358 10 448 4900 email: press.services@nokia.com
Investor Relations, tel. +358 4080 3 4080 email: investor.relations@nokia.com
· Nokia plans to publish its “Nokia in 2016” annual report, which includes the review by the Board of Directors and the audited annual accounts, in week 12 of 2017. The annual report will be available at www.nokia.com/financials.
· Nokia plans to publish its first quarter 2017 results on April 27, 2017.
· Nokia’s Annual General Meeting 2017 is planned to be held on May 23, 2017.
· Nokia plans to publish its second quarter and half year 2017 results on July 27, 2017.
· Nokia plans to publish its third quarter 2017 results on October 26, 2017.
SIGNATURE
Pursuant to the requirements of the Securities Exchange Act of 1934, the registrant, Nokia Corporation, has duly caused this report to be signed on its behalf by the undersigned, thereunto duly authorized.
Date: February 2, 2017 | Nokia Corporation | ||
|
| ||
|
| ||
| By: | /s/ Riikka Tieaho | |
|
| Name: | Riikka Tieaho |
|
| Title: | Vice President, Corporate Legal |