SECURITIES AND EXCHANGE COMMISSION
Washington, D.C. 20549
FORM 6-K
Report of Foreign Private Issuer
Pursuant to Rule 13a -16 or 15d -16 of
the Securities Exchange Act of 1934
Report on Form 6-K dated July 31, 2020
(Commission File No. 1-13202)
Nokia Corporation
Karakaari 7A
FI-02610 Espoo
Finland
(Name and address of registrant’s principal executive office)
Indicate by check mark whether the registrant files or will file annual reports under cover of Form 20-F or Form 40-F: | ||
|
|
|
Form 20-F: x |
| Form 40-F: o |
|
|
|
Indicate by check mark if the registrant is submitting the Form 6-K in paper as permitted by Regulation S-T Rule 101(b)(1): | ||
|
|
|
Yes: o |
| No: x |
|
|
|
Indicate by check mark if the registrant is submitting the Form 6-K in paper as permitted by Regulation S-T Rule 101(b)(7): | ||
|
|
|
Yes: o |
| No: x |
|
|
|
Indicate by check mark whether the registrant by furnishing the information contained in this form is also thereby furnishing the information to the Commission pursuant to Rule 12g3-2(b) under the Securities Exchange Act of 1934. | ||
|
|
|
Yes: o |
| No: x |
Enclosures:
· Stock Exchange Release: Nokia Corporation Financial Report for Q2 and Half Year 2020
· Report for Q2 and Half Year 2020 attached to the stock exchange release
| STOCK EXCHANGE RELEASE |
|
|
| July 31, 2020 |
Nokia Corporation
Half year report
July 31, 2020 at 08:00 (CET +1)
Nokia Corporation Financial Report for Q2 and Half Year 2020
Continued improved execution drives strong margin and cash performance
· Strong margin expansion, primarily driven by Mobile Access
· Clear roadmap progress, particularly related to our 5G mid-band portfolio
· Confidence in resilient customer base and strong liquidity position
· 11% decrease in net sales, largely driven by COVID-19 and China
· Strong growth in Nokia Enterprise
· Positive operating profit, on a reported basis, in both Q2 and half year 2020
· Within previously provided Outlook ranges for full year 2020, adjusted the non-IFRS mid-points for EPS to EUR 0.25 and operating margin to 9.5%
· Delivered strong free cash flow year-to-date and raised 2020 recurring free cash flow guidance to be clearly positive
This is a summary of the Nokia Corporation financial report for Q2 and half year 2020 published today. The complete financial report for Q2 and half year 2020 with tables is available at www.nokia.com/financials. Investors should not rely on summaries of our financial reports only, but should review the complete financial reports with tables.
RAJEEV SURI, PRESIDENT AND CEO, ON Q2 2020 RESULTS
Nokia delivered a strong improvement in Q2, with better-than-expected profitability, significant improvement in cash generation, clear indications of a return to strength in mobile radio, and a year-on-year increase in earnings-per-share, despite the challenges of COVID-19. These results show that our execution has improved as planned and that we are well positioned to end the year with a significantly stronger financial position. As a result, we are adjusting upward both the midpoint of our full-year 2020 non-IFRS EPS and operating margin guidance within our previously disclosed outlook ranges.
Profitability gains in the quarter were supported by a 4.5 percentage point year-on-year improvement in Networks gross margin, building on a 3.5 percentage point gain in the first quarter, and driving Nokia non-IFRS gross margin to 39.6%. Nokia Enterprise also grew year-on-year constant currency sales by 18% compared to one year ago and expanded margins.
Nokia-level revenue was down in the quarter, with the majority of that the result of COVID-19 as well as a sharp decline in China based on the prudent approach we have taken in that market. We also saw a reduction driven by our proactive steps to reduce the volume of low margin services business. We expect that the majority of sales missed in the quarter due to COVID-19 will shift to future periods.
At the start of the year, we said we would have a sharp focus on our Mobile Access business and improving cash generation. In both areas we continue to make good progress. Free cash flow in the quarter was positive €265 million, versus negative €1.0 billion one year ago, and Nokia ended Q2 with €1.6 billion of net cash, and €7.5 billion in total cash. Given our strong first-half improvement, we now expect free cash flow for full-year 2020 to be “clearly positive” compared to our earlier guidance of “positive”.
In Mobile Access, we saw healthy improvements in our radio portfolio, where roadmaps are strengthening, costs are coming down, and product performance is rising. We have a particularly powerful portfolio in mid-band mobile radio, with proven products deployed with 55 customers, and the first live C-Band network demonstrated in the U.S. during the quarter. Pleasingly, our “5G Powered by ReefShark” shipments continue to increase and we believe we remain on track to reach 35% or better by year end. And, we now have 83 5G deals.
Our continued momentum was demonstrated by the progress we announced after the quarter ended. These included the availability of a software upgrade that allows millions of Nokia 4G/LTE radios deployed to more than 350 customers to be migrated seamlessly to 5G; and plans to accelerate leadership in Open RAN. Nokia is the only global supplier fully committed to O-RAN with commercial 5G Cloud-RAN networks. We also announced an expansion of our IP routing business into the data center market and highlighted that Apple was deploying our technology at its data centers.
This is my last quarterly announcement as CEO of Nokia and I want to close with a note of thanks: thanks to our shareholders, thanks to our customers, thanks to our many other stakeholders, and a particular thanks to the great employees of Nokia. You have constantly made me proud and I expect that you will continue to do so in the many years to come. Thank you all. It has been a pleasure and an honor.
NOKIA FINANCIAL RESULTS
EUR million (except for EPS in EUR) |
| Q2’20 |
| Q2’19 |
| YoY |
| Constant |
| Q1-Q2’20 |
| Q1-Q2’19 |
| YoY |
| Constant |
|
Net sales |
| 5 092 |
| 5 694 |
| (11 | )% | (11 | )% | 10 005 |
| 10 726 |
| (7 | )% | (7 | )% |
Networks |
| 3 955 |
| 4 393 |
| (10 | )% | (10 | )% | 7 713 |
| 8 336 |
| (7 | )% | (8 | )% |
Nokia Software |
| 597 |
| 678 |
| (12 | )% | (12 | )% | 1 210 |
| 1 221 |
| (1 | )% | (1 | )% |
Nokia Technologies |
| 341 |
| 383 |
| (11 | )% | (11 | )% | 689 |
| 753 |
| (8 | )% | (9 | )% |
Group Common and Other |
| 210 |
| 263 |
| (20 | )% | (21 | )% | 415 |
| 484 |
| (14 | )% | (15 | )% |
Non-IFRS exclusions |
| (1 | ) | (2 | ) |
|
|
|
| (1 | ) | (27 | ) |
|
|
|
|
Eliminations |
| (11 | ) | (21 | ) |
|
|
|
| (20 | ) | (41 | ) |
|
|
|
|
Gross profit |
| 2 006 |
| 2 065 |
| (3 | )% |
|
| 3 784 |
| 3 646 |
| 4 | % |
|
|
Operating profit/(loss) |
| 170 |
| (57 | ) |
|
|
|
| 94 |
| (581 | ) |
|
|
|
|
Networks |
| 249 |
| 119 |
| 109 | % |
|
| 169 |
| (135 | ) |
|
|
|
|
Nokia Software |
| 88 |
| 137 |
| (36 | )% |
|
| 159 |
| 130 |
| 22 | % |
|
|
Nokia Technologies |
| 282 |
| 324 |
| (13 | )% |
|
| 572 |
| 626 |
| (9 | )% |
|
|
Group Common and Other |
| (197 | ) | (129 | ) |
|
|
|
| (361 | ) | (230 | ) |
|
|
|
|
Non-IFRS exclusions |
| (253 | ) | (508 | ) |
|
|
|
| (445 | ) | (972 | ) |
|
|
|
|
Operating margin % |
| 3.3 | % | (1.0 | )% | 430bps |
|
|
| 0.9 | % | (5.4 | )% | 630bps |
|
|
|
Net sales (non-IFRS) |
| 5 093 |
| 5 696 |
| (11 | )% | (11 | )% | 10 007 |
| 10 753 |
| (7 | )% | (7 | )% |
Gross profit (non-IFRS) |
| 2 017 |
| 2 117 |
| (5 | )% |
|
| 3 804 |
| 3 758 |
| 1 | % |
|
|
Operating profit/(loss) (non-IFRS) |
| 423 |
| 451 |
| (6 | )% |
|
| 539 |
| 391 |
| 38 | % |
|
|
Operating margin % (non-IFRS) |
| 8.3 | % | 7.9 | % | 40bps |
|
|
| 5.4 | % | 3.6 | % | 180bps |
|
|
|
Financial income and expenses |
| (11 | ) | (173 | ) | (94 | )% |
|
| (61 | ) | (228 | ) | (73 | )% |
|
|
Income taxes |
| (80 | ) | 46 |
|
|
|
|
| (51 | ) | 188 |
|
|
|
|
|
Profit/(loss) for the period |
| 85 |
| (191 | ) |
|
|
|
| (16 | ) | (632 | ) |
|
|
|
|
EPS, diluted |
| 0.01 |
| (0.03 | ) |
|
|
|
| 0.00 |
| (0.11 | ) |
|
|
|
|
Financial income and expenses (non-IFRS) |
| (27 | ) | (86 | ) | (69 | )% |
|
| (93 | ) | (178 | ) | (48 | )% |
|
|
Income taxes (non-IFRS) |
| (87 | ) | (101 | ) | (14 | )% |
|
| (100 | ) | (60 | ) | 67 | % |
|
|
Profit/(loss) for the period (non-IFRS) |
| 316 |
| 258 |
| 22 | % |
|
| 348 |
| 142 |
| 145 | % |
|
|
EPS, diluted (non-IFRS) |
| 0.06 |
| 0.05 |
| 20 | % |
|
| 0.06 |
| 0.02 |
| 200 | % |
|
|
The financial information in this report is unaudited. Non-IFRS results exclude costs related to the acquisition of Alcatel-Lucent and related integration, goodwill impairment charges, intangible asset amortization and other purchase price fair value adjustments, restructuring and associated charges and certain other items that may not be indicative of Nokia’s underlying business performance. For details, please refer to note 2, “Non-IFRS to reported reconciliation”, in the notes to the Financial statement information included in Nokia Corporation interim report for Q2 and Half Year 2020. Change in net sales at constant currency excludes the effect of changes in exchange rates in comparison to euro, our reporting currency. For more information on currency exposures, please refer to note 1, “Basis of Preparation”, in the “Financial statement information” section included in Nokia Corporation interim report for Q2 and Half Year 2020.
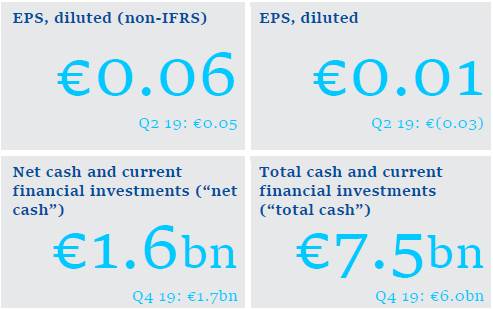
· Both non-IFRS and reported net sales in Q2 2020 were EUR 5.1bn, compared to EUR 5.7bn in Q2 2019. On a constant currency basis, both non-IFRS and reported net sales decreased 11%. Excluding one-time licensing net sales in Q2 2020 and Q2 2019, net sales decreased 10% on both a non-IFRS and reported basis.
· Q2 2020 net sales were impacted by COVID-19 and unique dynamics in China. In Q2 2020, we estimate that COVID-19 had an approximately EUR 300 million negative net impact on our net sales; with the majority of these net sales expected to be shifted to future periods, rather than being lost.
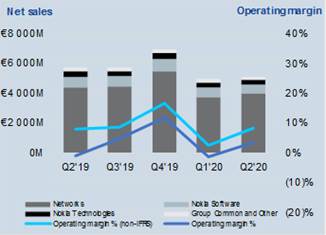
· In Q2 2020, Nokia’s gross and operating margin both expanded year-on-year, primarily driven by broad based strength in Networks, particularly in Mobile Access, with IP Routing and Fixed Access also contributing positively. In addition, reported operating margin benefitted significantly from lower amortization of acquired intangible assets, as well as lower restructuring and associated charges. Non-IFRS gross margin was 39.6% (reported 39.4%) and non-IFRS operating margin was 8.3% (reported 3.3%).
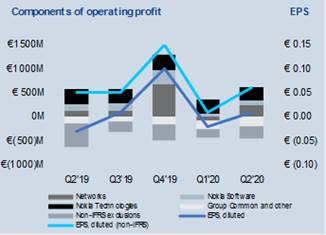
· Non-IFRS diluted EPS in Q2 2020 was EUR 0.06, compared to EUR 0.05 in Q2 2019, primarily driven by higher gross profit in Mobile Access within Networks, continued progress related to our cost savings program and a net positive fluctuation in financial income and expenses. This was partially offset by higher investments in 5G R&D to accelerate our product roadmaps and cost competitiveness in Mobile Access and a net negative fluctuation in Nokia’s venture fund investments.
· Reported diluted EPS in the first six months of 2020 was EUR 0.00, compared to negative EUR 0.11 in the first six months of 2019. The change was primarily driven by lower amortization of acquired intangible assets, lower restructuring and associated charges, continued progress related to our cost savings program, a net positive fluctuation in financial income and expenses and higher gross profit, partially offset by higher investments in 5G R&D to accelerate our product roadmaps and cost competitiveness in Mobile Access and a net negative fluctuation in Nokia’s venture fund investments.
· Q2 2020 was the fourth quarter in a row of solid cash performance. Since establishing a program in 2019 to focus on free cash flow, we have made great progress driving sustainable operational improvements, particularly in net working capital management. During Q2 2020, net cash increased by approximately EUR 0.2 billion, resulting in an end-of-quarter net cash
balance of approximately EUR 1.6 billion. During Q2 2020, total cash increased by approximately EUR 1.2 billion, primarily driven by the successful issuance of EUR 1.0 billion of debt, resulting in an end-of-quarter total cash balance of approximately EUR 7.5 billion.
COVID-19
The COVID-19 crisis has made vividly clear the critical importance of connectivity to keep society functioning. We believe we have a resilient customer base, and we feel a sense of duty to our customers and the communities they serve.
We believe the impact of COVID-19 on Nokia’s financial performance and financial position was primarily related to a net sales impact of approximately EUR 500 million in the first half of 2020, with the majority of these net sales expected to be shifted to future periods, rather than being lost. In Q1 2020, the estimated COVID-19 impact was approximately EUR 200 million, and related primarily to supply chain disruptions. In Q2 2020, the estimated COVID-19 net impact was approximately EUR 300 million, composed of a negative impact of approximately EUR 400 million related to delivery and implementation challenges, partially offset by a positive impact of approximately EUR 100 million related to capturing a part of the negative net sales impact from Q1 2020. To a much lesser extent, COVID-19 also affected our operational costs (for example, lower travel), capital expenditures (temporary delays), cash outflows related to taxes (tax relief), and net working capital (for example, lower inventories due to temporary disruptions).
In addition, and in accordance with our prudent management of our capital structure, we took further proactive steps to strengthen our liquidity position by raising EUR 1.0 billion of debt in Q2 2020, on a net basis. As a result, we ended Q2 2020 with approximately EUR 7.5 billion of total cash.
Potential risks and uncertainties continue to exist related to the scope and duration of the COVID-19 impact and the pace and shape of the economic recovery following the pandemic.
During the COVID-19 pandemic, we have continued to advance our 5G roadmap and product evolution, as planned, and our COVID-19 mitigation actions in R&D have been very successful. We believe we remain on track with our plans to drive progressive improvement over the course of 2020.
Health and safety
Naturally, Nokia’s first focus during the COVID-19 crisis is to our employees. We have in place strict protocols for Nokia facilities and provided clear advice to our employees about how they can mitigate the risks of COVID-19 in situations where they have to go about critical work.
We took already early on a range of steps, including banning international travel for Nokia employees, except for strictly-defined ‘critical’ reasons; closing all our facilities to all visitors, with the exception of people engaged in essential maintenance and services, and asking our staff to work from home wherever possible. We started implementing these measures in some regions in January already and have updated guidance as the situation has developed.
As the overwhelming majority of Nokia employees continue working remotely, we are providing guidance on how staff can maintain a healthy work-life balance and look after their physical and mental well-being.
Supporting the essential services our customers provide
The products and services that we provide have never been more critical in enabling the world to continue to function in an orderly way. We continue to work closely with all our customers, to ensure that the changing needs and requirements at this time are well understood and that we respond appropriately to them.
In Q2 2020, connectivity continued to bring together people isolated from each other by the COVID-19 pandemic. Remote working and schooling, robust delivery of basic services and smart deliveries are just some examples that have been enabled by connectivity solutions. We announced new deals that bring connectivity to the most rural areas of, for example, California and Ireland, making sure small businesses, farms and schools are connected.
Nokia has a global manufacturing footprint designed for optimized global supply, and to mitigate against risks such as local disruptive events, transportation capacity problems, and political risks. Our supply network consists of 25 factories around the globe and six hubs for customer fulfillment. As a result, we are not dependent on one location or entity. We have also established a global command center to manage the supply chain challenges arising from the outbreak; and we are ready to activate relevant business continuity plans should the situation in any part of our organization require this.
Impact on asset valuations
COVID-19 has affected the valuations of certain assets, including investments in non-publicly quoted assets through Nokia’s venture fund investments and pension plans, the valuation of which is inherently challenging in fast-moving market conditions (for details, please refer to note 5, “Pensions and other post-employment benefits” and note 8, “Fair value of financial instruments” in the “Financial statement information” section included in Nokia Corporation interim report for Q2 and Half Year 2020).
In relation to its financial statements as of June 30, 2020, Nokia has considered also the indicators of impairment of goodwill and other intangible assets, recoverability of deferred tax assets, valuation of inventories, and collectability of trade receivables and contract assets. Based on these assessments, COVID-19 is currently not expected to have such long-term effects on Nokia’s financial performance that it would require adjustments to the carrying amounts of goodwill and other intangible assets or deferred tax assets. Also, Nokia has not identified any significant increase in the amount of bad debt or need to adjust the valuation of inventories.
Doing our part to fight the pandemic
We also feel another sense of duty — to the societies where Nokia operates. As a global company, we have a duty to be part of the global fight against this pandemic. Therefore, Nokia has launched a Coronavirus Global Donation Fund.
In Q2 2020, we engaged with local organizations such as hospitals, community groups and NGOs in nearly 50 countries, helping them fight the pandemic and mitigate its impacts.
These actions demonstrate our strong commitment to supporting global efforts to end the pandemic and overcoming the disruption and challenges we currently face.
OUTLOOK
Full Year 2020
Non-IFRS diluted earnings per share |
| EUR 0.25 (adjusted from EUR 0.23) plus or minus 5 cents |
Non-IFRS operating margin |
| 9.5% (adjusted from 9.0%) plus or minus 1.5 percentage points |
Recurring free cash flow(1) |
| Clearly positive (This is an update from positive) |
Long term (3 to 5 years)
Non-IFRS operating margin |
| 12 – 14% |
Annual distribution to shareholders |
| An earnings-based growing dividend of approximately 40% to 70% of non-IFRS diluted EPS, taking into account Nokia’s cash position and expected cash flow generation. The annual distribution would be paid as quarterly dividends. |
(1) Free cash flow = net cash from/(used in) operating activities - capital expenditures + proceeds from sale of property, plant and equipment and intangible assets — purchase of non-current financial investments + proceeds from sale of non-current financial investments.
KEY DRIVERS OF NOKIA’S OUTLOOK
Networks and Nokia Software are expected to be influenced by factors including:
· Our expectation that we will slightly underperform our primary addressable market, which is expected to be flattish on a constant currency basis in full year 2020, excluding China (This is an update to our earlier commentary to perform in-line with our primary addressable market, which is expected to decline on a constant currency basis in full year 2020, excluding China). Our updated expectation is primarily due to lower network deployment services within Mobile Access and a slightly improved market outlook, given the lower than expected market impact from COVID-19 in Q2 2020;
· Our expectation for operating profit seasonality in 2020 to be similar to 2019, with the majority of operating profit to be generated in the fourth quarter. Due to our strong free cash flow performance in the first six months of 2020, we no longer expect our free cash flow seasonality in 2020 to be similar to 2019. (This is an update to earlier commentary for both operating profit and free cash flow seasonality in 2020 to be similar to 2019);
· Potential risks and uncertainties related to the scope and duration of the COVID-19 impact and the pace and shape of the economic recovery following the pandemic;
· Competitive intensity, which is particularly impacting Mobile Access and is expected to continue at a high level in full year 2020, as some competitors seek to take share in the early stage of 5G;
· Our expectation that we will accelerate our product roadmaps and cost competitiveness through additional 5G investments in 2020, thereby enabling us to drive product cost reductions and maintain the necessary scale to be competitive;
· Our expectation that we will drive improvements in automation and productivity through additional digitalization investments in 2020;
· Customer demand could weaken and risk could increase further in India, after the country’s Supreme Court upheld a ruling that telecoms companies must pay retroactive license and spectrum fees;
· Opportunities and risks in North America following the completion of a merger, and, more broadly, the potential for temporary capital expenditure constraints due to potential mergers or acquisitions by our customers;
· The timing of completions and acceptances of certain projects;
· Some customers are reassessing their vendors in light of security concerns, creating near-term pressure to invest in order to secure long-term benefits;
· Our expectation that we will improve our R&D productivity and reduce support function costs through the successful execution of our cost savings program, which is explained in more detail in the Cost savings program section of Nokia Corporation interim report for Q2 and half year 2020;
· Our product and regional mix, including the impact of the high cost level associated with our first generation 5G products; and
· Macroeconomic, industry and competitive dynamics.
Nokia Technologies is expected to be influenced by factors including:
· The timing and value of new and existing patent licensing agreements with smartphone vendors, automotive companies and consumer electronics companies;
· Results in brand and technology licensing;
· Costs to protect and enforce our intellectual property rights; and
· The regulatory landscape.
Additionally, our outlook is based on the following assumptions:
· Nokia’s outlook for recurring free cash flow is expected to be supported by an improvement in net working capital performance and improved operational results, partially offset by a more substantial difference in 2020 between profit and free cash flow in Nokia Technologies;
· Non-IFRS financial income and expenses are expected to be an expense of approximately EUR 300 million in full year 2020 and over the longer-term. (This is an update to earlier commentary for an expense of EUR 350 million in full year 2020 and per annum over the longer-term). Our updated commentary is primarily due to our expectation for lower costs related to the sale of receivables and improved FX results;
· Non-IFRS income taxes are expected at a rate of approximately 26% in full year 2020 and approximately 25% over the longer-term, subject to the absolute level of profits, regional profit mix and changes to our operating model;
· Cash outflows related to income taxes are expected to be approximately EUR 400 million in full year 2020 and approximately EUR 450 million per annum over the longer term until our US or Finnish deferred tax assets are fully utilized (This is an update to earlier commentary for EUR 450 million in full year 2020.) Our updated commentary is primarily due to our expectation for lower cash taxes in 2020, driven by COVID-19-related tax relief; and
· Capital expenditures are expected to be approximately EUR 550 million in full year 2020 and approximately EUR 600 million per annum over the longer-term. (This is an update to earlier commentary for EUR 600 million in full year 2020.) Our updated commentary is primarily due to temporary delays related to COVID-19.
ANALYST CONFERENCE CALL
Nokia’s analyst conference call will begin on July 31, 2020 at 3 p.m. Finnish time. A link to the
webcast of the conference call will be available at www.nokia.com/financials. Media representatives can listen in via the link, or call +1-412-717-9224.
Media Inquiries:
Nokia Communications
Tel. +358 10 448 4900
Email: press.services@nokia.com
Katja Antila, Head of Media Relations
Investor Inquiries:
Nokia Investor Relations
Tel. +358 40 803 4080
Email: investor.relations@nokia.com
About Nokia
We create the technology to connect the world. Only Nokia offers a comprehensive portfolio of network equipment, software, services and licensing opportunities across the globe. With our commitment to innovation, driven by the award-winning Nokia Bell Labs, we are a leader in the development and deployment of 5G networks.
Our communications service provider customers support more than 6.4 billion subscriptions with our radio networks, and our enterprise customers have deployed over 1,300 industrial networks worldwide. Adhering to the highest ethical standards, we transform how people live, work and communicate. For our latest updates, please visit us online www.nokia.com and follow us on Twitter @nokia.
RISKS AND FORWARD-LOOKING STATEMENTS
It should be noted that Nokia and its businesses are exposed to various risks and uncertainties and certain statements herein that are not historical facts are forward-looking statements. These forward-looking statements reflect Nokia’s current expectations and views of future developments and include statements regarding: A) expectations, plans or benefits related to our strategies, growth management and operational key performance indicators; B) expectations, plans or benefits related to future performance of our businesses (including the expected impact and timing of that impact of COVID-19 on our businesses and our customers’ businesses) and any expected future dividends including timing and qualitative and quantitative thresholds associated therewith; C) expectations and targets regarding financial performance, cash generation, results, the timing of receivables, operating expenses, taxes, currency exchange rates, hedging, cost savings, product cost reductions and competitiveness, as well as results of operations including targeted synergies, better commercial management and those results related to market share, prices, net sales, income and margins; D) expectations, plans or benefits related to changes in organizational and operational structure; E) expectations regarding competition within our market, market developments, general economic conditions and structural and legal change globally and in national and regional markets, such as China; F) our ability to integrate acquired businesses into our operations and achieve the targeted business plans and benefits, including targeted benefits, synergies, cost savings and efficiencies; G)
expectations, plans or benefits related to any future collaboration or to business collaboration agreements or patent license agreements or arbitration awards, including income to be received under any collaboration or partnership, agreement or award; H) timing of the deliveries of our products and services, including our short term and longer term expectations around the rollout of 5G, investment requirements with such rollout, and our ability to capitalize on such rollout; as well as the overall readiness of the 5G ecosystem; I) expectations and targets regarding collaboration and partnering arrangements, joint ventures or the creation of joint ventures, and the related administrative, legal, regulatory and other conditions, as well as our expected customer reach; J) outcome of pending and threatened litigation, arbitration, disputes, regulatory proceedings or investigations by authorities; K) expectations regarding restructurings, investments, capital structure optimization efforts, uses of proceeds from transactions, acquisitions and divestments and our ability to achieve the financial and operational targets set in connection with any such restructurings, investments, capital structure optimization efforts, divestments and acquisitions, including our current cost savings program; L) expectations, plans or benefits related to future capital expenditures, reduction of support function costs, temporary incremental expenditures or other R&D expenditures to develop or rollout software and other new products, including 5G and increased digitalization; M) expectations regarding our customers’ future actions, including our customers’ capital expenditure constraints and our ability to satisfy customer’s needs and retain their business; and N) statements preceded by or including “believe”, “expect”, “expectations”, “consistent”, “deliver”, “maintain”, “strengthen”, “target”, “estimate”, “plan”, “intend”, “assumption”, “focus”, “continue”, “should”, “will” or similar expressions. These forward-looking statements are subject to a number of risks and uncertainties, many of which are beyond our control, which could cause our actual results to differ materially from such statements. These statements are based on management’s best assumptions and beliefs in light of the information currently available to them. These forward-looking statements are only predictions based upon our current expectations and views of future events and developments and are subject to risks and uncertainties that are difficult to predict because they relate to events and depend on circumstances that will occur in the future. Factors, including risks and uncertainties that could cause these differences include, but are not limited to: 1) our strategy is subject to various risks and uncertainties and we may be unable to successfully implement our strategic plans, sustain or improve the operational and financial performance of our business groups, correctly identify or successfully pursue business opportunities or otherwise grow our business; 2) general economic and market conditions, general public health conditions (including its impact on our supply chains) and other developments in the economies where we operate, including the timeline for the deployment of 5G and our ability to successfully capitalize on that deployment ; 3) competition and our ability to effectively and profitably invest in existing and new high-quality products, services, upgrades and technologies and bring them to market in a timely manner; 4) our dependence on the development of the industries in which we operate, including the cyclicality and variability of the information technology and telecommunications industries and our own R&D capabilities and investments; 5) our dependence on a limited number of customers and large multi-year agreements, as well as external events impacting our customers including mergers and acquisitions and the possibility of our customers awarding business to our competitors; 6) our ability to maintain our existing sources of intellectual property-related revenue through our intellectual property, including through licensing, establishing new sources of revenue and protecting our intellectual property from infringement; 7) our ability to manage and improve our financial and operating performance, cost savings, competitiveness and synergies generally, expectations and timing around our ability to recognize any net sales and our ability to implement changes to our organizational and operational structure efficiently; 8) our global business and exposure to regulatory, political or other
developments in various countries or regions, including emerging markets and the associated risks in relation to tax matters and exchange controls, among others; 9) our ability to achieve the anticipated benefits, synergies, cost savings and efficiencies of acquisitions; 10) exchange rate fluctuations, as well as hedging activities; 11) our ability to successfully realize the expectations, plans or benefits related to any future collaboration or business collaboration agreements and patent license agreements or arbitration awards, including income to be received under any collaboration, partnership, agreement or arbitration award; 12) Nokia Technologies’ ability to protect its IPR and to maintain and establish new sources of patent, brand and technology licensing income and IPR-related revenues, particularly in the smartphone market, which may not materialize as planned, 13) our dependence on IPR technologies, including those that we have developed and those that are licensed to us, and the risk of associated IPR-related legal claims, licensing costs and restrictions on use; 14) our exposure to direct and indirect regulation, including economic or trade policies, and the reliability of our governance, internal controls and compliance processes to prevent regulatory penalties in our business or in our joint ventures; 15) our reliance on third-party solutions for data storage and service distribution, which expose us to risks relating to security, regulation and cybersecurity breaches; 16) inefficiencies, breaches, malfunctions or disruptions of information technology systems, or our customers’ security concerns; 17) our exposure to various legal frameworks regulating corruption, fraud, trade policies, and other risk areas, and the possibility of proceedings or investigations that result in fines, penalties or sanctions; 18) adverse developments with respect to customer financing or extended payment terms we provide to customers; 19) the potential complex tax issues, tax disputes and tax obligations we may face in various jurisdictions, including the risk of obligations to pay additional taxes; 20) our actual or anticipated performance, among other factors, which could reduce our ability to utilize deferred tax assets; 21) our ability to retain, motivate, develop and recruit appropriately skilled employees; 22) disruptions to our manufacturing, service creation, delivery, logistics and supply chain processes, and the risks related to our geographically-concentrated production sites; 23) the impact of litigation, arbitration, agreement-related disputes or product liability allegations associated with our business; 24) our ability to re-establish investment grade rating or maintain our credit ratings; 25) our ability to achieve targeted benefits from, or successfully implement planned transactions, as well as the liabilities related thereto; 26) our involvement in joint ventures and jointly-managed companies; 27) the carrying amount of our goodwill may not be recoverable; 28) uncertainty related to the amount of dividends and equity return we are able to distribute to shareholders for each financial period; 29) pension costs, employee fund-related costs, and healthcare costs; 30) our ability to successfully complete and capitalize on our order backlogs and continue converting our sales pipeline into net sales; 31) risks related to undersea infrastructure; and 32) the impact of the COVID-19 virus on the global economy and financial markets as well as our customers, supply chain, product development, service delivery, other operations and our financial, tax, pension and other assets, as well as the risk factors specified in our 2019 annual report on Form 20-F published on March 5, 2020 under “Operating and financial review and prospects-Risk factors” as supplemented by the form 6-K published on April 30, 2020 under the header “Risk Factors” and in our other filings or documents furnished with the U.S. Securities and Exchange Commission. Other unknown or unpredictable factors or underlying assumptions subsequently proven to be incorrect could cause actual results to differ materially from those in the forward-looking statements. We do not undertake any obligation to publicly update or revise forward-looking statements, whether as a result of new information, future events or otherwise, except to the extent legally required.
| Summary |
Report for Q2 and Half Year 2020
Continued improved execution drives strong margin and cash performance

Rajeev Suri
President and CEO
· Strong margin expansion, primarily driven by Mobile Access
· Clear roadmap progress, particularly related to our 5G mid-band portfolio
· Confidence in resilient customer base and strong liquidity position
· 11% decrease in net sales, largely driven by COVID-19 and China
· Strong growth in Nokia Enterprise
· Positive operating profit, on a reported basis, in both Q2 and half year 2020
· Within previously provided Outlook ranges for full year 2020, adjusted the non-IFRS mid-points for EPS to EUR 0.25 and operating margin to 9.5%
· Delivered strong free cash flow year-to-date and raised 2020 recurring free cash flow guidance to be clearly positive
Rajeev Suri, President and CEO,
on Q2 2020 results
Nokia delivered a strong improvement in Q2, with better-than-expected profitability, significant improvement in cash generation, clear indications of a return to strength in mobile radio, and a year-on-year increase in earnings-per-share, despite the challenges of COVID-19. These results show that our execution has improved as planned and that we are well positioned to end the year with a significantly stronger financial position. As a result, we are adjusting upward both the midpoint of our full-year 2020 non-IFRS EPS and operating margin guidance within our previously disclosed outlook ranges.
Profitability gains in the quarter were supported by a 4.5 percentage point year-on-year improvement in Networks gross margin, building on a 3.5 percentage point gain in the first quarter, and driving Nokia non-IFRS gross margin to 39.6%. Nokia Enterprise also grew year-on-year constant currency sales by 18% compared to one year ago and expanded margins.
Nokia-level revenue was down in the quarter, with the majority of that the result of COVID-19 as well as a sharp decline in China based on the prudent approach we have taken in that market. We also saw a reduction driven by our proactive steps to reduce the volume of low margin services business. We expect that the majority of sales missed in the quarter due to COVID-19 will shift to future periods.
At the start of the year, we said we would have a sharp focus on our Mobile Access business and improving cash generation. In both areas we continue to make good progress. Free cash flow in the quarter was positive €265 million, versus negative €1.0 billion one year ago, and Nokia ended Q2 with €1.6 billion of net cash, and €7.5 billion in total cash. Given our strong first-half improvement, we now expect free cash flow for full-year 2020 to be “clearly positive” compared to our earlier guidance of “positive”.
July 31, 2020
In Mobile Access, we saw healthy improvements in our radio portfolio, where roadmaps are strengthening, costs are coming down, and product performance is rising. We have a particularly powerful portfolio in mid-band mobile radio, with proven products deployed with 55 customers, and the first live C-Band network demonstrated in the U.S. during the quarter. Pleasingly, our “5G Powered by ReefShark” shipments continue to increase and we believe we remain on track to reach 35% or better by year end. And, we now have 83 5G deals.
Our continued momentum was demonstrated by the progress we announced after the quarter ended. These included the availability of a software upgrade that allows millions of Nokia 4G/LTE radios deployed to more than 350 customers to be migrated seamlessly to 5G; and plans to accelerate leadership in Open RAN. Nokia is the only global supplier fully committed to O-RAN with commercial 5G Cloud-RAN networks. We also announced an expansion of our IP routing business into the data center market and highlighted that Apple was deploying our technology at its data centers.
This is my last quarterly announcement as CEO of Nokia and I want to close with a note of thanks: thanks to our shareholders, thanks to our customers, thanks to our many other stakeholders, and a particular thanks to the great employees of Nokia. You have constantly made me proud and I expect that you will continue to do so in the many years to come. Thank you all. It has been a pleasure and an honor.
Q2 2020 and January-June 2020 reported and non-IFRS results. Refer to note 1, “Basis of Preparation”, note 2, “Non-IFRS to reported reconciliation” and note 12, “Performance measures”, in the “Financial statement information” section for details.
EUR million (except for EPS in EUR) |
| Q2’20 |
| Q2’19 |
| YoY |
| Constant |
| Q1- |
| Q1-Q2’19 |
| YoY |
| Constant |
|
Net sales |
| 5 092 |
| 5 694 |
| (11 | )% | (11 | )% | 10 005 |
| 10 726 |
| (7 | )% | (7 | )% |
Operating profit/(loss) |
| 170 |
| (57 | ) |
|
|
|
| 94 |
| (581 | ) |
|
|
|
|
Operating margin % |
| 3.3 | % | (1.0 | )% | 430 | bps |
|
| 0.9 | % | (5.4 | )% | 630 | bps |
|
|
EPS, diluted |
| 0.01 |
| (0.03 | ) |
|
|
|
| 0.00 |
| (0.11 | ) |
|
|
|
|
Net sales (non-IFRS) |
| 5 093 |
| 5 696 |
| (11 | )% | (11 | )% | 10 007 |
| 10 753 |
| (7 | )% | (7 | )% |
Operating profit/(loss) (non-IFRS) |
| 423 |
| 451 |
| (6 | )% |
|
| 539 |
| 391 |
| 38 | % |
|
|
Operating margin % (non-IFRS) |
| 8.3 | % | 7.9 | % | 40 | bps |
|
| 5.4 | % | 3.6 | % | 180 | bps |
|
|
EPS, diluted (non-IFRS) |
| 0.06 |
| 0.05 |
| 20 | % |
|
| 0.06 |
| 0.02 |
| 200 | % |
|
|
Net cash and current financial investments(1) |
| 1 550 |
| 502 |
| 209 | % |
|
| 1 550 |
| 502 |
| 209 | % |
|
|
(1)Net cash and current financial investments does not include lease liabilities.
· Both non-IFRS and reported net sales in Q2 2020 were EUR 5.1bn, compared to EUR 5.7bn in Q2 2019. On a constant currency basis, both non-IFRS and reported net sales decreased 11%. Excluding one-time licensing net sales in Q2 2020 and Q2 2019, net sales decreased 10% on both a non-IFRS and reported basis.
· Q2 2020 net sales were impacted by COVID-19 and unique dynamics in China. In Q2 2020, we estimate that COVID-19 had an approximately EUR 300 million negative net impact on our net sales; with the majority of these net sales expected to be shifted to future periods, rather than being lost.
· In Q2 2020, Nokia’s gross and operating margin both expanded year-on-year, primarily driven by broad based strength in Networks, particularly in Mobile
Access, with IP Routing and Fixed Access also contributing positively. In addition, reported operating margin benefitted significantly from lower amortization of acquired intangible assets, as well as lower restructuring and associated charges. Non-IFRS gross margin was 39.6% (reported 39.4%) and non-IFRS operating margin was 8.3% (reported 3.3%).
· Non-IFRS diluted EPS in Q2 2020 was EUR 0.06, compared to EUR 0.05 in Q2 2019, primarily driven by higher gross profit in Mobile Access within Networks, continued progress related to our cost savings program and a net positive fluctuation in financial income and expenses. This was partially offset by higher investments in 5G R&D to accelerate our product roadmaps and cost competitiveness in Mobile Access and a net negative fluctuation in Nokia’s venture fund investments.
· Reported diluted EPS in the first six months of 2020 was EUR 0.00, compared to negative EUR 0.11 in the first six months of 2019. The change was primarily driven by lower amortization of acquired intangible assets, lower restructuring and associated charges, continued progress related to our cost savings program, a net positive fluctuation in financial income and expenses and higher gross profit, partially offset by higher investments in 5G R&D to accelerate our product roadmaps and cost competitiveness in Mobile Access and a net negative fluctuation in Nokia’s venture fund investments.
· Q2 2020 was the fourth quarter in a row of solid cash performance. Since establishing a program in 2019 to focus on free cash flow, we have made great progress driving sustainable operational improvements, particularly in net working capital management. During Q2 2020, net cash increased by approximately EUR 0.2 billion, resulting in an end-of-quarter net cash balance of approximately EUR 1.6 billion. During Q2 2020, total cash increased by approximately EUR 1.2 billion, primarily driven by the successful issuance of EUR 1.0 billion of debt, resulting in an end-of-quarter total cash balance of approximately EUR 7.5 billion.
COVID-19
The COVID-19 crisis has made vividly clear the critical importance of connectivity to keep society functioning. We believe we have a resilient customer base, and we feel a sense of duty to our customers and the communities they serve.
We believe the impact of COVID-19 on Nokia’s financial performance and financial position was primarily related to a net sales impact of approximately EUR 500 million in the first half of 2020, with the majority of these net sales expected to be shifted to future periods, rather than being lost. In Q1 2020, the estimated COVID-19 impact was approximately EUR 200 million, and related primarily to supply chain disruptions. In Q2 2020, the estimated COVID-19 net impact was approximately EUR 300 million, composed of a negative impact of approximately EUR 400 million related to delivery and implementation challenges, partially offset by a positive impact of approximately EUR 100 million related to capturing a part of the negative net sales impact from Q1 2020. To a much lesser extent, COVID-19 also affected our operational costs (for example, lower travel), capital expenditures (temporary delays), cash outflows related to taxes (tax relief), and net working capital (for example, lower inventories due to temporary disruptions).
In addition, and in accordance with our prudent management of our capital structure, we took further proactive steps to strengthen our liquidity position by raising EUR 1.0 billion of debt in Q2 2020, on a net basis. As a result, we ended Q2 2020 with approximately EUR 7.5 billion of total cash.
Potential risks and uncertainties continue to exist related to the scope and duration of the COVID-19 impact and the pace and shape of the economic recovery following the pandemic.
During the COVID-19 pandemic, we have continued to advance our 5G roadmap and product evolution, as planned, and our COVID-19 mitigation actions in R&D have been very successful. We believe we remain on track with our plans to drive progressive improvement over the course of 2020.
Health and safety
Naturally, Nokia’s first focus during the COVID-19 crisis is to our employees. We have in place strict protocols for Nokia facilities and provided clear advice to our employees about how they can mitigate the risks of COVID-19 in situations where they have to go about critical work.
We took already early on a range of steps, including banning international travel for Nokia employees, except for strictly-defined ‘critical’ reasons; closing all our facilities to all visitors, with the exception of people engaged in essential maintenance and services, and asking our staff to work from home wherever possible. We started implementing these measures in some regions in January already and have updated guidance as the situation has developed.
As the overwhelming majority of Nokia employees continue working remotely, we are providing guidance on how staff can maintain a healthy work-life balance and look after their physical and mental well-being.
Supporting the essential services our customers provide
The products and services that we provide have never been more critical in enabling the world to continue to function in an orderly way. We continue to work closely with all our customers, to ensure that the changing needs and requirements at this time are well understood and that we respond appropriately to them.
In Q2 2020, connectivity continued to bring together people isolated from each other by the COVID-19 pandemic. Remote working and schooling, robust delivery of basic services and smart deliveries are just some examples that have been enabled by connectivity solutions. We announced new deals that bring connectivity to the most rural areas of, for example, California and Ireland, making sure small businesses, farms and schools are connected.
Nokia has a global manufacturing footprint designed for optimized global supply, and to mitigate against risks such as local disruptive events, transportation capacity problems, and political risks. Our supply network consists of 25 factories around the globe and six hubs for customer fulfillment. As a result, we are not dependent on one location or entity. We have also established a global command center to manage the supply chain challenges arising from the outbreak; and we are ready to activate relevant business continuity plans should the situation in any part of our organization require this.
Impact on asset valuations
COVID-19 has affected the valuations of certain assets, including investments in non-publicly quoted assets through Nokia’s venture fund investments and pension plans, the valuation of which is inherently challenging in fast-moving market conditions (for details, please refer to note 5, “Pensions and other post-employment benefits” and note 8, “Fair value of financial instruments”).
In relation to its financial statements as of June 30, 2020, Nokia has considered also the indicators of impairment of goodwill and other intangible assets, recoverability of deferred tax assets, valuation of inventories, and collectability of trade receivables and contract assets. Based on these assessments, COVID-19 is currently not expected to have such long-term effects on Nokia’s financial performance that it would require adjustments to the carrying amounts of goodwill and other intangible assets or deferred tax assets. Also, Nokia has not identified any significant increase in the amount of bad debt or need to adjust the valuation of inventories.
Doing our part to fight the pandemic
We also feel another sense of duty — to the societies where Nokia operates. As a global company, we have a duty to be part of the global fight against this pandemic. Therefore, Nokia has launched a Coronavirus Global Donation Fund.
In Q2 2020, we engaged with local organizations such as hospitals, community groups and NGOs in nearly 50 countries, helping them fight the pandemic and mitigate its impacts.
These actions demonstrate our strong commitment to supporting global efforts to end the pandemic and overcoming the disruption and challenges we currently face.
Operational key performance indicators for Mobile Access within Networks
During 2020, Nokia is providing operational key performance indicators (“KPIs”) for Mobile Access, which is within our Networks reportable segment. Mobile Access includes our product-focused Mobile Networks operating segment and our Global Services operating segment. While these operational KPIs are not measures of Nokia’s financial performance, they provide greater transparency regarding our operational progress in Mobile Access.
Within Mobile Access, our focus is on addressing profitability through four key actions:
· Reduce product cost
· Maintain scale
· Improve commercial management and deal discipline
· Further strengthen operational performance in services
The proportion of our 5G shipments that are “5G Powered by ReefShark”
This KPI tracks shipments of our System-on-Chip (SoC) based 5G Powered by ReefShark (“5G PBR”) product portfolio. Increased 5G PBR shipments are expected to have a significant impact on reducing our product costs. We typically see an approximate six-month delay between shipments and impact on financial performance. We finished 2019 with 5G PBR shipments standing at approximately 10% and at Q4 2019 set a target of reaching more than 35% of shipments by the end of 2020. In Q2 2020, 5G PBR products accounted for approximately 25% of our 5G shipments. This is in-line with our expectations, which allows for non-linear progress over the course of 2020 as new products start shipping. We are executing on our R&D roadmap and driving 5G product evolution as planned. We believe we remain on track to deliver on our shipment target for the end of 2020.

Our weighted 5G win rate
This KPI measures how we are doing in converting our end of 2018 4G footprint into 5G footprint. It factors in customer size, as well as new 5G footprint where we did not previously have a 4G installed base (meaning it can be over 100%). At the end of Q2 2020, our 5G win rate remained strong at over 100% outside of China. Our 5G win rate including China moved to the low 90% range from the mid 90% range, following our prudent approach to pursuing market share in China.

Update on 4G plus 5G mobile radio market share, excluding China, on a rolling four quarter basis
We finished 2019 with our 4G+5G mobile radio market share standing at ~27% excluding China. We are excluding China, given the profitability challenges and unique market dynamics in that region. At Q4 2019, we stated that we expected our market share, excluding China, to end 2020 at ~27%. During Q2 2020, our competitive performance was in-line with our expectations. We believe we remain on track to deliver on our market share target for the end of 2020.

Outlook
Full Year 2020
Non-IFRS diluted earnings per share | EUR 0.25 (adjusted from EUR 0.23) plus or minus 5 cents |
Non-IFRS operating margin | 9.5% (adjusted from 9.0%) plus or minus 1.5 percentage points |
Recurring free cash flow(1) | Clearly positive (This is an update from positive) |
Long term (3 to 5 years)
Non-IFRS operating margin | 12 – 14% |
Annual distribution to shareholders | An earnings-based growing dividend of approximately 40% to 70% of non-IFRS diluted EPS, taking into account Nokia’s cash position and expected cash flow generation. The annual distribution would be paid as quarterly dividends. |
(1) Free cash flow = net cash from/(used in) operating activities - capital expenditures + proceeds from sale of property, plant and equipment and intangible assets — purchase of non-current financial investments + proceeds from sale of non-current financial investments.
Key drivers of Nokia’s outlook
Networks and Nokia Software are expected to be influenced by factors including:
· Our expectation that we will slightly underperform our primary addressable market, which is expected to be flattish on a constant currency basis in full year 2020, excluding China (This is an update to our earlier commentary to perform in-line with our primary addressable market, which is expected to decline on a constant currency basis in full year 2020, excluding China). Our updated expectation is primarily due to lower network deployment services within Mobile Access and a slightly improved market outlook, given the lower than expected market impact from COVID-19 in Q2 2020;
· Our expectation for operating profit seasonality in 2020 to be similar to 2019, with the majority of operating profit to be generated in the fourth quarter. Due to our strong free cash flow performance in the first six months of 2020, we no longer expect our free cash flow seasonality in 2020 to be similar to 2019. (This is an update to earlier commentary for both operating profit and free cash flow seasonality in 2020 to be similar to 2019);
· Potential risks and uncertainties related to the scope and duration of the COVID-19 impact and the pace and shape of the economic recovery following the pandemic;
· Competitive intensity, which is particularly impacting Mobile Access and is expected to continue at a high level in full year 2020, as some competitors seek to take share in the early stage of 5G;
· Our expectation that we will accelerate our product roadmaps and cost competitiveness through additional 5G investments in 2020, thereby enabling us to drive product cost reductions and maintain the necessary scale to be competitive;
· Our expectation that we will drive improvements in automation and productivity through additional digitalization investments in 2020;
· Customer demand could weaken and risk could increase further in India, after the country’s Supreme Court upheld a ruling that telecoms companies must pay retroactive license and spectrum fees;
· Opportunities and risks in North America following the completion of a merger, and, more broadly, the potential for temporary capital expenditure constraints due to potential mergers or acquisitions by our customers;
· The timing of completions and acceptances of certain projects;
· Some customers are reassessing their vendors in light of security concerns, creating near-term pressure to invest in order to secure long-term benefits;
· Our expectation that we will improve our R&D productivity and reduce support function costs through the successful execution of our cost savings program, which is explained in more detail in the Cost savings program section of this report;
· Our product and regional mix, including the impact of the high cost level associated with our first generation 5G products; and
· Macroeconomic, industry and competitive dynamics.
Nokia Technologies is expected to be influenced by factors including:
· The timing and value of new and existing patent licensing agreements with smartphone vendors, automotive companies and consumer electronics companies;
· Results in brand and technology licensing;
· Costs to protect and enforce our intellectual property rights; and
· The regulatory landscape.
Additionally, our outlook is based on the following assumptions:
· Nokia’s outlook for recurring free cash flow is expected to be supported by an improvement in net working capital performance and improved operational results, partially offset by a more substantial difference in 2020 between profit and free cash flow in Nokia Technologies;
· Non-IFRS financial income and expenses are expected to be an expense of approximately EUR 300 million in full year 2020 and over the longer-term. (This is an update to earlier commentary for an expense of EUR 350 million in full year 2020 and per annum over the longer-term). Our updated commentary is primarily due to our expectation for lower costs related to the sale of receivables and improved FX results;
· Non-IFRS income taxes are expected at a rate of approximately 26% in full year 2020 and approximately 25% over the longer-term, subject to the absolute level of profits, regional profit mix and changes to our operating model;
· Cash outflows related to income taxes are expected to be approximately EUR 400 million in full year 2020 and approximately EUR 450 million per annum over the longer term until our US or Finnish deferred tax assets are fully utilized (This is an update to earlier commentary for EUR 450 million in full year 2020.) Our updated commentary is primarily due to our expectation for lower cash taxes in 2020, driven by COVID-19-related tax relief; and
· Capital expenditures are expected to be approximately EUR 550 million in full year 2020 and approximately EUR 600 million per annum over the longer-term. (This is an update to earlier commentary for EUR 600 million in full year 2020.) Our updated commentary is primarily due to temporary delays related to COVID-19.
Financial results
Our financial results
|
|
EUR million (except for EPS in EUR) |
| Q2’20 |
| Q2’19 |
| YoY |
| Constant |
| Q1- |
| Q1-Q2’19 |
| YoY |
| Constant |
|
Net sales |
| 5 092 |
| 5 694 |
| (11 | )% | (11 | )% | 10 005 |
| 10 726 |
| (7 | )% | (7 | )% |
Networks |
| 3 955 |
| 4 393 |
| (10 | )% | (10 | )% | 7 713 |
| 8 336 |
| (7 | )% | (8 | )% |
Nokia Software |
| 597 |
| 678 |
| (12 | )% | (12 | )% | 1 210 |
| 1 221 |
| (1 | )% | (1 | )% |
Nokia Technologies |
| 341 |
| 383 |
| (11 | )% | (11 | )% | 689 |
| 753 |
| (8 | )% | (9 | )% |
Group Common and Other |
| 210 |
| 263 |
| (20 | )% | (21 | )% | 415 |
| 484 |
| (14 | )% | (15 | )% |
Non-IFRS exclusions |
| (1 | ) | (2 | ) |
|
|
|
| (1 | ) | (27 | ) |
|
|
|
|
Eliminations |
| (11 | ) | (21 | ) |
|
|
|
| (20 | ) | (41 | ) |
|
|
|
|
Gross profit |
| 2 006 |
| 2 065 |
| (3 | )% |
|
| 3 784 |
| 3 646 |
| 4 | % |
|
|
Operating profit/(loss) |
| 170 |
| (57 | ) |
|
|
|
| 94 |
| (581 | ) |
|
|
|
|
Networks |
| 249 |
| 119 |
| 109 | % |
|
| 169 |
| (135 | ) |
|
|
|
|
Nokia Software |
| 88 |
| 137 |
| (36 | )% |
|
| 159 |
| 130 |
| 22 | % |
|
|
Nokia Technologies |
| 282 |
| 324 |
| (13 | )% |
|
| 572 |
| 626 |
| (9 | )% |
|
|
Group Common and Other |
| (197 | ) | (129 | ) |
|
|
|
| (361 | ) | (230 | ) |
|
|
|
|
Non-IFRS exclusions |
| (253 | ) | (508 | ) |
|
|
|
| (445 | ) | (972 | ) |
|
|
|
|
Operating margin % |
| 3.3 | % | (1.0 | )% | 430 | bps |
|
| 0.9 | % | (5.4 | )% | 630 | bps |
|
|
Net sales (non-IFRS) |
| 5 093 |
| 5 696 |
| (11 | )% | (11 | )% | 10 007 |
| 10 753 |
| (7 | )% | (7 | )% |
Gross profit (non-IFRS) |
| 2 017 |
| 2 117 |
| (5 | )% |
|
| 3 804 |
| 3 758 |
| 1 | % |
|
|
Operating profit/(loss) (non-IFRS) |
| 423 |
| 451 |
| (6 | )% |
|
| 539 |
| 391 |
| 38 | % |
|
|
Operating margin % (non-IFRS) |
| 8.3 | % | 7.9 | % | 40 | bps |
|
| 5.4 | % | 3.6 | % | 180 | bps |
|
|
Financial income and expenses |
| (11 | ) | (173 | ) | (94 | )% |
|
| (61 | ) | (228 | ) | (73 | )% |
|
|
Income taxes |
| (80 | ) | 46 |
|
|
|
|
| (51 | ) | 188 |
|
|
|
|
|
Profit/(loss) for the period |
| 85 |
| (191 | ) |
|
|
|
| (16 | ) | (632 | ) |
|
|
|
|
EPS, diluted |
| 0.01 |
| (0.03 | ) |
|
|
|
| 0.00 |
| (0.11 | ) |
|
|
|
|
Financial income and expenses (non-IFRS) |
| (27 | ) | (86 | ) | (69 | )% |
|
| (93 | ) | (178 | ) | (48 | )% |
|
|
Income taxes (non-IFRS) |
| (87 | ) | (101 | ) | (14 | )% |
|
| (100 | ) | (60 | ) | 67 | % |
|
|
Profit/(loss) for the period (non-IFRS) |
| 316 |
| 258 |
| 22 | % |
|
| 348 |
| 142 |
| 145 | % |
|
|
EPS, diluted (non-IFRS) |
| 0.06 |
| 0.05 |
| 20 | % |
|
| 0.06 |
| 0.02 |
| 200 | % |
|
|
Results are as reported and relate to continuing operations unless otherwise specified. The financial information in this report is unaudited. Non-IFRS results exclude costs related to the acquisition of Alcatel-Lucent and related integration, goodwill impairment charges, intangible asset amortization and other purchase price fair value adjustments, restructuring and associated charges and certain other items that may not be indicative of Nokia’s underlying business performance. For details, please refer to note 2, “Non-IFRS to reported reconciliation”, in the notes to the Financial statement information in this report. Change in net sales at constant currency excludes the effect of changes in exchange rates
in comparison to euro, our reporting currency. For more information on currency exposures, please refer to note 1, “Basis of Preparation”, in the “Financial statement information” section in this report.
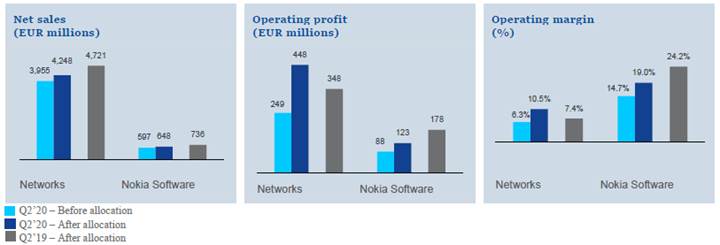
Amounts related to licensing and Nokia Bell Labs allocated 85% to Networks and 15% to Nokia Software
Nokia is providing additional adjusted financial disclosure for its Networks and Nokia Software reportable segments, with amounts related to licensing and Nokia Bell Labs allocated 85% to Networks and 15% to Nokia Software. In addition to Nokia’s primary financial disclosures, this reflects Nokia’s strategy, organizational structure and the way it evaluates operational performance and allocates resources, is in accordance with industry practice and improves comparability with peer companies.
Allocation details
|
| Q2’20 |
| Allocations |
| Q2’20 |
| Q2’19 |
| ||
|
| Before |
| Licensing |
| Nokia Bell |
| After |
| After |
|
Net sales (EUR million) |
|
|
|
|
|
|
|
|
|
|
|
Networks |
| 3 955 |
| 290 |
| 2 |
| 4 248 |
| 4 721 |
|
Nokia Software |
| 597 |
| 51 |
| 0 |
| 648 |
| 736 |
|
Operating profit (EUR million) |
|
|
|
|
|
|
|
|
|
|
|
Networks |
| 249 |
| 240 |
| (41 | ) | 448 |
| 348 |
|
Nokia Software |
| 88 |
| 42 |
| (7 | ) | 123 |
| 178 |
|
Operating margin % |
|
|
|
|
|
|
|
|
|
|
|
Networks |
| 6.3 | % | N/A |
| N/A |
| 10.5 | % | 7.4 | % |
Nokia Software |
| 14.7 | % | N/A |
| N/A |
| 19.0 | % | 24.2 | % |
Cost savings program
We expect our most recent cost savings program to result in a net EUR 500 million reduction of non-IFRS operating expenses and production overheads (“fixed costs”) in full year 2020 compared to full year 2018, of which EUR 350 million is expected to come from operating expenses and EUR 150 million is expected to come from cost of sales.
Note that, since the announcement of our most recent cost savings program on October 25, 2018, net foreign exchange fluctuations have resulted in an increase in estimated full year 2020 fixed costs of approximately EUR 70 million, creating an additional headwind to achieve the earlier net reduction.
In EUR million, approximately |
| Total |
| Recorded |
| To be |
| To be |
|
Restructuring and associated charges related to our most recent cost savings program |
| 900 |
| 660 |
| 240 |
| 0 |
|
Restructuring and associated cash outflows |
| 1 550 |
| 670 |
| 330 |
| 550 |
|
Net sales by region
EUR million |
| Q2’20 |
| Q2’19 |
| YoY |
| Constant |
| Q1- |
| Q1-Q2’19 |
| YoY |
| Constant |
|
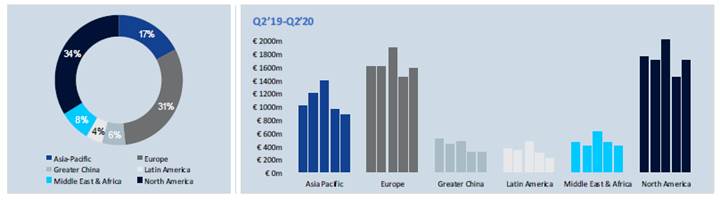
Asia-Pacific |
| 877 |
| 1 012 |
| (13 | )% | (13 | )% | 1 833 |
| 1 975 |
| (7 | )% | (7 | )% |
Europe |
| 1 585 |
| 1 611 |
| (2 | )% | (2 | )% | 3 035 |
| 3 111 |
| (2 | )% | (3 | )% |
Greater China |
| 302 |
| 515 |
| (41 | )% | (41 | )% | 610 |
| 949 |
| (36 | )% | (36 | )% |
Latin America |
| 212 |
| 359 |
| (41 | )% | (36 | )% | 497 |
| 664 |
| (25 | )% | (20 | )% |
Middle East & Africa |
| 400 |
| 441 |
| (9 | )% | (9 | )% | 852 |
| 855 |
| 0 | % | (1 | )% |
North America |
| 1 717 |
| 1 755 |
| (2 | )% | (4 | )% | 3 179 |
| 3 172 |
| 0 | % | (2 | )% |
Total |
| 5 092 |
| 5 694 |
| (11 | )% | (11 | )% | 10 005 |
| 10 726 |
| (7 | )% | (7 | )% |
Net sales by customer type

EUR million |
| Q2’20 |
| Q2’19 |
| YoY |
| Constant |
| Q1- |
| Q1-Q2’19 |
| YoY |
| Constant |
|
Communication service providers |
| 4 180 |
| 4 755 |
| (12 | )% | (12 | )% | 8 245 |
| 8 962 |
| (8 | )% | (8 | )% |
Enterprise |
| 376 |
| 318 |
| 18 | % | 18 | % | 687 |
| 577 |
| 19 | % | 19 | % |
Licensees |
| 341 |
| 383 |
| (11 | )% | (11 | )% | 689 |
| 753 |
| (8 | )% | (9 | )% |
Other(1) |
| 195 |
| 238 |
| (18 | )% | (19 | )% | 384 |
| 433 |
| (11 | )% | (12 | )% |
Total |
| 5 092 |
| 5 694 |
| (11 | )% | (11 | )% | 10 005 |
| 10 726 |
| (7 | )% | (7 | )% |
(1) Includes net sales of Alcatel Submarine Networks (ASN) and Radio Frequency Systems (RFS), both of which are being managed as separate entities, and certain other items, such as eliminations of inter-segment revenues and certain items related to purchase price allocation. ASN and RFS net sales include also revenue from communication service providers and enterprise customers.
Nokia, Q2 2020 compared to Q2 2019, non-IFRS
The following table summarizes the year-on-year changes between Q2 2020 and Q2 2019.
EUR million |
| Net |
| % |
| % |
| Gross |
| (R&D) |
| (SG&A) |
| Other |
| Operating |
| Financial |
| Income |
| Profit/(loss) |
|
Networks |
| (438 | ) | (10 | )% | (10 | )% | 42 |
| 22 |
| 56 |
| 10 |
| 130 |
|
|
|
|
|
|
|
Nokia Software |
| (81 | ) | (12 | )% | (12 | )% | (56 | ) | 3 |
| 7 |
| (3 | ) | (49 | ) |
|
|
|
|
|
|
Nokia Technologies |
| (42 | ) | (11 | )% | (11 | )% | (39 | ) | (8 | ) | 6 |
| 0 |
| (42 | ) |
|
|
|
|
|
|
Group Common and Other |
| (53 | ) | (20 | )% | (21 | )% | (47 | ) | 7 |
| 10 |
| (37 | ) | (68 | ) |
|
|
|
|
|
|
Eliminations |
| 10 |
|
|
|
|
| 0 |
| 0 |
| 0 |
| 0 |
| 0 |
|
|
|
|
|
|
|
Nokia non-IFRS |
| (603 | ) | (11 | )% | (11 | )% | (100 | ) | 25 |
| 79 |
| (30 | ) | (28 | ) | 59 |
| 14 |
| 58 |
|
Nokia non-IFRS net sales decreased 11%. On a constant currency basis, Nokia non-IFRS net sales decreased 11%. Excluding one-time licensing net sales of approximately EUR 10 million in Q2 2020 and EUR 30 million in Q2 2019, Nokia non-IFRS net sales decreased 10%. Additionally, Q2 2020 non-IFRS net sales were impacted by COVID-19 and unique dynamics in China.
In Q2 2020, we estimate that COVID-19 had an approximately EUR 300 million negative net impact on our net sales. In the first six months of 2020, we estimate that COVID-19 had an approximately EUR 500 million negative net impact on our net sales, with the majority of these net sales expected to be shifted to future periods, rather than being lost. In China, a high level of competitive intensity, combined with our prudent approach towards deal-making, had a particularly negative impact on Networks.
More importantly, Nokia delivered strong improvements in margin and cash performance, as well as clear indications of a return to strength in Mobile Access, within Networks. In Mobile Access, we drove strong improvements in our portfolio, by strengthening our roadmaps, reducing costs and improving our product performance.
We also continued to make great progress with our strategy to grow Nokia Enterprise and delivered 18% year-on-year growth in net sales. The strong growth in net sales to enterprise customers was primarily driven by increased demand for mission-critical networking solutions in industries including utilities and the public sector, with continued momentum in private wireless solutions. Net sales also benefitted from the timing of completions and acceptances of certain projects.
The financial performance in Nokia Software was in comparison to a particularly strong Q2 2019, which significantly benefitted from the timing of completions and acceptances of certain projects. In Q2 2020, we continued to progress against our strategy to strengthen Nokia Software, underpinned by strong execution and the comprehensiveness of our portfolio. Nokia Software offers the industry’s leading cloud-native, multi-vendor and multi-network solutions combined with a robust partner ecosystem.
The decrease in Nokia non-IFRS gross profit was attributable to lower gross profit in Nokia Software, a gross loss compared to a gross profit in Group Common and Other, and lower gross profit in Nokia Technologies. This was partially offset by higher gross profit in Networks, which was driven by broad-based gross margin performance. The lower gross profit in Nokia Software and Nokia Technologies was primarily due to lower net sales. The gross loss compared to a gross profit in Group Common and Other was primarily due to a change in gross margin. The higher gross profit and gross margin in Networks was primarily due to Mobile Access, with IP Routing and Fixed Access also contributing positively.
The slight decrease in Nokia non-IFRS operating profit was driven by lower non-IFRS gross profit and a net negative fluctuation in Nokia’s venture fund investments, partially offset by lower operating expenses. The lower operating expenses were primarily due to continued progress related to Nokia’s cost savings program and lower travel expenses due to COVID-19, partially offset by higher investments in 5G R&D to accelerate our product roadmaps and cost competitiveness in Mobile Access.
In Q2 2020, Nokia generated a non-IFRS profit of EUR 316 million, compared to EUR 258 million in Q2 2019. The change was primarily due to a net positive fluctuation in non-IFRS financial income and expenses and lower non-IFRS income taxes, partially offset by lower non-IFRS operating profit.
Nokia, Q2 2020 compared to Q2 2019, reported
The following table summarizes the year-on-year changes between Q2 2020 and Q2 2019.
EUR million |
| Net |
| % |
| % |
| Gross |
| (R&D) |
| (SG&A) |
| Other |
| Operating |
| Financial |
| Income |
| Profit/(loss) |
|
Networks |
| (438 | ) | (10 | )% | (10 | )% | 42 |
| 22 |
| 56 |
| 10 |
| 130 |
|
|
|
|
|
|
|
Nokia Software |
| (81 | ) | (12 | )% | (12 | )% | (56 | ) | 3 |
| 7 |
| (3 | ) | (49 | ) |
|
|
|
|
|
|
Nokia Technologies |
| (42 | ) | (11 | )% | (11 | )% | (39 | ) | (8 | ) | 6 |
| 0 |
| (42 | ) |
|
|
|
|
|
|
Group Common and Other |
| (53 | ) | (20 | )% | (21 | )% | (47 | ) | 7 |
| 10 |
| (37 | ) | (68 | ) |
|
|
|
|
|
|
Eliminations |
| 10 |
|
|
|
|
| 0 |
| 0 |
| 0 |
| 0 |
| 0 |
|
|
|
|
|
|
|
Nokia non-IFRS |
| (603 | ) | (11 | )% | (11 | )% | (100 | ) | 25 |
| 79 |
| (30 | ) | (28 | ) | 59 |
| 14 |
| 58 |
|
Non-IFRS exclusions |
| 1 |
|
|
|
|
| 41 |
| 131 |
| 5 |
| 77 |
| 255 |
| 103 |
| (140 | ) | 217 |
|
Nokia reported |
| (602 | ) | (11 | )% | (11 | )% | (59 | ) | 157 |
| 83 |
| 47 |
| 227 |
| 162 |
| (126 | ) | 276 |
|
Nokia net sales decreased 11%, on both a reported and constant currency basis. Excluding one-time licensing net sales of approximately EUR 10 million in Q2 2020 and EUR 30 million in Q2 2019, Nokia net sales decreased 10%. Additionally, Q2 2020 net sales were impacted by COVID-19 and unique dynamics in China.
In Q2 2020, we estimate that COVID-19 had an approximately EUR 300 million negative net impact on our net sales. In the first six months of 2020, we estimate that COVID-19 had an approximately EUR 500 million negative net impact on our net sales, with the majority of these net sales expected to be shifted to future periods, rather than being lost. In China, a high level of competitive intensity, combined with our prudent approach towards deal-making, had a particularly negative impact on Networks.
More importantly, Nokia delivered strong improvements in margin and cash performance, as well as clear indications of a return to strength in Mobile Access, within Networks. In Mobile Access, we drove strong improvements in our portfolio, by strengthening our roadmaps, reducing costs and improving our product performance.
We also continued to make great progress with our strategy to grow Nokia Enterprise and delivered 18% year-on-year growth in net sales. The strong growth in net sales to enterprise customers was primarily driven by increased demand for mission-critical networking solutions in industries including utilities and the public sector, with continued momentum in private wireless solutions. Net sales also benefitted from the timing of completions and acceptances of certain projects.
The financial performance in Nokia Software was in comparison to a particularly strong Q2 2019, which significantly benefitted from the timing of completions and acceptances of certain projects. In Q2 2020, we continued to progress against our strategy to strengthen Nokia Software, underpinned by strong execution and the comprehensiveness of our portfolio. Nokia Software offers the industry’s leading cloud-native, multi-vendor and multi-network solutions combined with a robust partner ecosystem.
The decrease in Nokia gross profit was attributable to lower gross profit in Nokia Software, a gross loss compared to a gross profit in Group Common and Other, and lower gross profit in Nokia Technologies. This was partially offset by higher gross profit in Networks, which was driven by broad-based gross margin performance, as well as lower costs related to network equipment swaps. The lower gross profit in Nokia Software and Nokia Technologies was primarily due to lower net sales. The gross loss compared to a gross profit in Group Common and Other was primarily due to a change in gross margin. The higher gross profit and gross margin in Networks was primarily due to Mobile Access, with IP Routing and Fixed Access also contributing positively.
In Q2 2020, Nokia generated an operating profit, compared to an operating loss in Q2 2019. The year-on-year improvement was primarily driven by lower amortization of acquired intangible assets, lower restructuring and associated charges, lower operating expenses, partially offset by a lower gross profit and net negative fluctuation in Nokia’s venture fund investments. The lower operating expenses were primarily due to continued progress related to Nokia’s cost savings program and lower travel expenses due to COVID-19, partially offset by higher investments in 5G R&D to accelerate our product roadmaps and cost competitiveness in Mobile Access.
In Q2 2020, Nokia generated a profit of EUR 85 million, compared to a loss of EUR 191 million in Q2 2019. The change was primarily due to the higher operating profit, a net positive fluctuation in financial income and expenses, partially offset by a net negative fluctuation in income taxes.
Nokia, January-June 2020 compared to January-June 2019, reported
EUR million |
| Net |
| % |
| % |
| Gross |
| (R&D) |
| (SG&A) |
| Other |
| Operating |
| Financial |
| Income |
| Profit/(loss) |
|
Networks |
| (623 | ) | (7 | )% | (8 | )% | 124 |
| 66 |
| 96 |
| 17 |
| 304 |
|
|
|
|
|
|
|
Nokia Software |
| (11 | ) | (1 | )% | (1 | )% | 33 |
| (2 | ) | (1 | ) | (1 | ) | 29 |
|
|
|
|
|
|
|
Nokia Technologies |
| (64 | ) | (8 | )% | (9 | )% | (51 | ) | (13 | ) | 10 |
| 0 |
| (54 | ) |
|
|
|
|
|
|
Group Common and Other |
| (69 | ) | (14 | )% | (15 | )% | (60 | ) | 9 |
| 10 |
| (90 | ) | (131 | ) |
|
|
|
|
|
|
Eliminations |
| 21 |
|
|
|
|
| 0 |
| 0 |
| 0 |
| 0 |
| 0 |
|
|
|
|
|
|
|
Nokia non-IFRS |
| (746 | ) | (7 | )% | (7 | )% | 46 |
| 59 |
| 115 |
| (72 | ) | 148 |
| 85 |
| (40 | ) | 206 |
|
Non-IFRS exclusions |
| 26 |
|
|
|
|
| 93 |
| 267 |
| 30 |
| 138 |
| 527 |
| 82 |
| (199 | ) | 410 |
|
Nokia reported |
| (721 | ) | (7 | )% | (7 | )% | 138 |
| 326 |
| 145 |
| 66 |
| 675 |
| 167 |
| (239 | ) | 616 |
|
Nokia net sales decreased 7% on both a reported and constant currency basis. Excluding one-time licensing net sales of approximately EUR 20 million in the first six months of 2020 and EUR 50 million in the first six months of 2019, Nokia net sales decreased 6%. Additionally, the first six months of 2020 net sales were impacted by COVID-19 and unique dynamics in China.
In the first six months of 2020, we estimate that COVID-19 had an approximately EUR 500 million negative net impact on our net sales; with the majority of these net sales expected to be shifted to future periods, rather than being lost. In China, a high level of competitive intensity, combined with our prudent approach towards deal-making, had a particularly negative impact on Networks.
More importantly, Nokia delivered strong improvements in margin and cash performance, as well as clear indications of a return to strength in Mobile Access, within Networks. In Mobile Access, we drove strong improvements in our portfolio, by strengthening our roadmaps, reducing costs and improving our product performance.
We also continued to make great progress with our strategy to grow Nokia Enterprise and delivered 19% year-on-year growth in net sales. The strong growth in net sales to enterprise customers was primarily driven by increased demand for mission-critical networking solutions in industries including utilities and the public sector, with continued momentum in private wireless solutions. Net sales also benefitted from the timing of completions and acceptances of certain projects.
In the first six months of 2020, we continued to progress against our strategy to strengthen Nokia Software, underpinned by strong execution and the comprehensiveness of our portfolio. Nokia Software offers the industry’s leading cloud-native, multi-vendor and multi-network solutions combined with a robust partner ecosystem.
The increase in Nokia gross profit was primarily attributable to higher gross profit in Networks, lower costs related to network equipment swaps and higher gross profit in Nokia Software, partially offset by a gross loss compared to a gross profit in Group Common and Other and lower gross profit in Nokia Technologies. In both Networks and Nokia Software, the higher gross profit was driven by strong gross margin performance. The higher gross profit and gross margin in Networks was primarily due to Mobile Access. The gross loss compared to a gross profit in Group Common and Other was primarily due to a change in gross margin. The lower gross profit in Nokia Technologies was primarily due to lower net sales, partially offset by higher gross margin.
In the first six months of 2020, Nokia generated an operating profit, compared to an operating loss in first six months of 2019. The year-on-year improvement was primarily driven by lower amortization of acquired intangible assets, lower restructuring and associated charges, lower operating expenses and higher gross profit, partially offset by a net negative fluctuation in Nokia’s venture fund investments. The lower operating expenses were primarily due to continued progress related to Nokia’s cost savings program and lower travel expenses due to COVID-19, partially offset by higher investments in 5G R&D to accelerate our product roadmaps and cost competitiveness in Mobile Access.
In the first six months of 2020, Nokia generated a loss of EUR 16 million, compared to a loss of EUR 632 million in the first six months of 2019. The year-on-year improvement was primarily due to generating an operating profit, compared to generating an operating loss in the year-ago period, and a net positive fluctuation in financial income and expenses, partially offset by a net negative fluctuation in income taxes.
Cash and cash flow in Q2 2020
During Q2 2020 Nokia’s free cash flow was EUR 265 million driven by solid adjusted profit, partially offset by cash outflows related to net working capital, capital expenditures, restructuring and income taxes.
In 2019, Nokia established a free cash flow program to ensure company-wide focus on free cash flow and release of net working capital, including project asset optimization, review of contract terms and conditions, as well as supply chain and inventory optimization in order to rapidly align with changes in demand. We have made great progress and we are confident that we have driven sustainable operational improvements, particularly in net working capital, which is clear in our year-on-year free cash flow improvement to positive EUR 259 million in the first six months of 2020 from negative EUR 1 954 million in the year-ago period.
EUR million, at end of period |
| Q2’20 |
| Q1’20 |
| QoQ change |
| Q4’19 |
| YTD change |
|
Total cash and current financial investments |
| 7 487 |
| 6 315 |
| 19 | % | 6 007 |
| 25 | % |
Net cash and current financial investments(1) |
| 1 550 |
| 1 320 |
| 17 | % | 1 730 |
| (10 | )% |
(1) Net cash and current financial investments does not include lease liabilities. For details, please refer to note 7, “Cash position and free cash flow”, and note 12, “Performance measures”, in the “Financial statement information” section in this report.
EUR billion
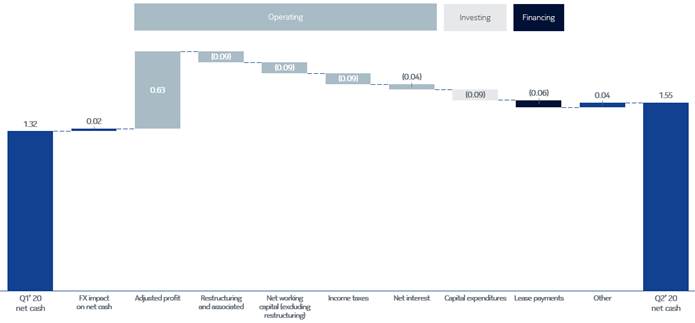
In Q2 2020, the approximately EUR 1.0 billion difference between the change in total cash and net cash was primarily due to the issuance of EUR 1.0 billion of debt.
In Q2 2020, net cash from operating activities was driven by:
· Nokia’s adjusted profit of EUR 634 million.
· Approximately EUR 90 million of restructuring and associated cash outflows, primarily related to our cost savings program.
· Excluding the restructuring and associated cash outflows, Nokia generated an approximately EUR 90 million decrease in net cash related to net working capital as follows:
· The decrease in receivables was approximately EUR 220 million, primarily due to improved collections, partially offset by a seasonal increase in receivables, as well as a sequentially lower balance sheet impact related to the sale of receivables. Nokia sells trade receivables to various financial institutions without recourse in the normal course of business, in order to manage our credit risk and working capital cycle.
· The increase in inventories was approximately EUR 80 million, primarily due to a seasonal increase in inventories, partially offset by temporary COVID-19 disruptions.
· The decrease in liabilities was approximately EUR 230 million, primarily due to the payment of 2019 performance-related incentives to employees. This was partially offset by a seasonal increase in accounts payable.
· An outflow related to cash taxes of approximately EUR 90 million.
· An outflow related to net interest of approximately EUR 40 million.
In Q2 2020, net cash was also impacted by:
· Net cash used in investing activities, relating
primarily to capital expenditures of approximately EUR 90 million. Our Q2 spending was affected by the timing of capital expenditures due to temporary COVID-19 disruptions.
· Net cash used in financing activities, relating primarily to lease payments of approximately EUR 60 million.
Our sustainability performance
Our strategy and focus areas
The purpose of technology is to improve people’s lives. We strongly believe that connectivity and technology will play a key role in helping to solve many future challenges. Our sustainability strategy is focused on the areas we believe will have the greatest impact on sustainable development and our profitability. To improve people’s lives, we need to focus on climate, integrity and culture. Since Q1 2020, we provide quarterly commentary on these topics, as well as other relevant sustainability topics.
Improving lives with technology
Improving lives with technology is at the heart of our business. Our technology connects people to the services, places, opportunities and people that matter to them. In Q2 2020, connectivity continued to bring together people isolated from each other by the COVID-19 pandemic. Remote working and schooling, robust delivery of basic services and smart deliveries are just some examples that have been enabled by our connectivity solutions. We announced new deals that bring connectivity to the most rural areas of, for example, California and Ireland, making sure small businesses, farms and schools are connected.
Climate
The importance of combatting climate change through connectivity solutions will only increase. We recognize our responsibility in the fight against climate change. In Q2 2020, we continued our project to recalibrate our existing science-based targets (SBT) according to the 1.5° Celsius warming scenario. As part of our climate program, we have been updating our climate impact assessment, and we intend to provide this data through our CDP Climate Change disclosure during Q3. We are also seeing progress in commercializing solutions that decrease network-related emissions. For example, in June 2020, we announced that we have demonstrated the world’s first liquid-cooled 5G base station in commercial operations with our AirScale platform.
Integrity
Maintaining Nokia’s commitment to unyielding integrity amidst the situation created by COVID-19 and continuing geopolitical turmoil remains a top priority. To counter the fact that the overwhelming majority of Nokia employees are working remotely, we have strengthened our compliance communications to ensure our values remain top of mind. We have created new automated tools to ensure employees receive answers to compliance questions quickly. We have redoubled our efforts to ensure employees know how to report concerns, that they feel comfortable doing so knowing there will be no retaliation, and making sure that reported concerns are investigated promptly, thoroughly and objectively. We have also enhanced our continuous efforts to mitigate the risks of potential misuse of our products. Beyond our well-established processes to mitigate such risks, this quarter we launched new training covering our human rights policy, available for all employees. We also continue to arrange more in-depth training concerning human rights targeted for specific employees.
Culture
We believe our people are our greatest asset and we aim to enable a culture that encourages high performance, integrity and inclusion. In Q2 2020, debate about social justice and equality was increasing globally. Nokia remains committed to promoting a culture of inclusion and diversity, and we are doing our part to support equality. Our performance against culture-related targets is mixed. Our first-half results for employee engagement were better than we expected as we scored well above the mean compared to benchmark data. With respect to gender balance, we continue to focus on accelerating our progress on increasing the share of women in leadership.
Other topics
After the unexpected crisis due to COVID-19, which emerged in Q1 2020, we launched our COVID-19 donation fund in March. In Q2 2020, we engaged with local organizations such as hospitals, community groups and NGOs in nearly 50 countries, helping them fight the pandemic and mitigate its impacts. We published our annual sustainability report, “People & Planet”, in April 2020, Conflict Minerals report in May 2020 and Modern Slavery statement in June 2020.
Networks
Q2 2020 compared to Q2 2019
|
|
|
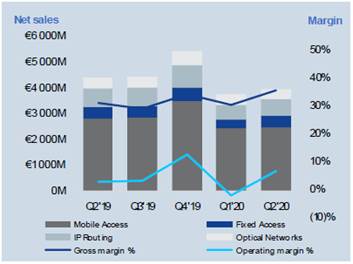
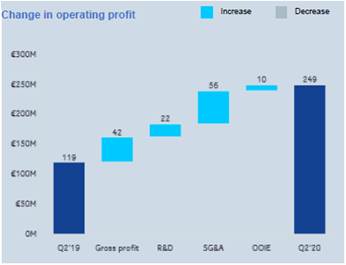
EUR million |
| Q2’20 |
| Q2’19 |
| YoY |
| Constant |
| Q1-Q2’20 |
| Q1-Q2’19 |
| YoY change |
| Constant |
|
Net sales |
| 3 955 |
| 4 393 |
| (10 | )% | (10 | )% | 7 713 |
| 8 336 |
| (7 | )% | (8 | )% |
Mobile Access |
| 2 494 |
| 2 824 |
| (12 | )% | (12 | )% | 4 926 |
| 5 297 |
| (7 | )% | (7 | )% |
Fixed Access |
| 439 |
| 447 |
| (2 | )% | (2 | )% | 789 |
| 872 |
| (10 | )% | (10 | )% |
IP Routing |
| 659 |
| 715 |
| (8 | )% | (8 | )% | 1 241 |
| 1 360 |
| (9 | )% | (9 | )% |
Optical Networks |
| 363 |
| 407 |
| (11 | )% | (11 | )% | 758 |
| 807 |
| (6 | )% | (6 | )% |
Gross profit |
| 1 409 |
| 1 367 |
| 3 | % |
|
| 2 552 |
| 2 428 |
| 5 | % |
|
|
Gross margin % |
| 35.6 | % | 31.1 | % | 450 | bps |
|
| 33.1 | % | 29.1 | % | 400 | bps |
|
|
R&D |
| (724 | ) | (746 | ) | (3 | )% |
|
| (1 459 | ) | (1 525 | ) | (4 | )% |
|
|
SG&A |
| (418 | ) | (474 | ) | (12 | )% |
|
| (896 | ) | (992 | ) | (10 | )% |
|
|
Other operating income and expenses |
| (18 | ) | (28 | ) |
|
|
|
| (29 | ) | (46 | ) |
|
|
|
|
Operating profit/(loss) |
| 249 |
| 119 |
| 109 | % |
|
| 169 |
| (135 | ) |
|
|
|
|
Operating margin % |
| 6.3 | % | 2.7 | % | 360 | bps |
|
| 2.2 | % | (1.6 | )% | 380 | bps |
|
|
Networks net sales decreased 10% on both a reported and constant currency basis. We estimate that COVID-19 had an approximately EUR 150 million negative net impact on our Q2 2020 net sales, composed of a negative impact of approximately EUR 250 million related to delivery and implementation challenges, partially offset by a positive impact of approximately EUR 100 million related to capturing a part of the negative net sales impact from Q1 2020. Therefore, the cumulative negative net impact on our net sales as of the end of Q2 2020 was approximately EUR 300 million, and we expect the majority of these net sales to be shifted to future periods, rather than being lost.
The decrease in Networks net sales was primarily due to Mobile Access and, to a lesser extent, IP Routing, Optical Networks and Fixed Access. The decrease in Mobile Access was primarily due to decreases in network deployment services and legacy radio technologies, partially offset by strong growth in 5G. IP Routing continued its technology leadership in Q2 2020, with underlying business fundamentals continuing to show broad-based momentum. The year-on-year decrease in IP Routing was primarily due to a particularly strong Q2 2019, which benefitted from pent-up demand for some of its newly introduced FP4 products. The decrease in Optical Networks was primarily due to temporary supply chain constraints as a result of COVID-19. The decrease in Fixed Access was primarily due to Greater China, partially offset by growth in fiber access technologies.
The increase in gross profit was primarily due to improved gross profit in Mobile Access and, to a lesser extent, in IP Routing and Fixed Access. This was partially offset by lower gross profit in Optical Networks.
The increase in Mobile Access gross profit was primarily due to higher gross margin, partially offset by lower net sales. The increase in IP Routing gross profit was primarily due to higher gross margin, partially offset by lower net sales. The increase in Fixed Access gross profit was primarily due to higher gross margin. The decrease in Optical Networks gross profit was primarily due to lower net sales.
The higher gross margin in Mobile Access was primarily driven by favorable product mix and regional mix. The favorable product mix was primarily due to a higher proportion of 4G capacity net sales, and a lower proportion of network deployment net sales. The favorable regional mix was primarily due to a higher proportion of net sales in North America, and a lower proportion of net sales in Greater China. In addition, to a lesser extent, the higher gross margin in Mobile Access benefitted from an improved 5G product cost position and continued improvement in services execution, particularly in digitalization and automation. The higher gross margin in IP Routing was primarily due to favorable regional mix, with a larger proportion of net sales in North America, and improved profitability driven by our market leading FP4 platform. The higher gross margin in Fixed Access was primarily due to favorable regional mix, with a higher proportion of net sales in Europe and lower proportion of net sales in Greater China, and improved performance in broadband access and digital home.
The decrease in Networks R&D expenses was primarily due to progress related to Nokia’s cost savings program, partially offset by higher investments in 5G R&D to accelerate our product roadmaps and cost competitiveness in Mobile Access.
The decrease in Networks SG&A expenses was primarily due to Mobile Access, reflecting continued progress related to Nokia’s cost savings program, lower travel and personnel related expenses due to COVID-19 and lower costs related to 5G customer trials as we are now in the commercial phase of 5G deployments.
The net positive fluctuation in Networks other operating income and expenses was primarily due to foreign exchange hedging.
Nokia Software
Q2 2020 compared to Q2 2019
|
|
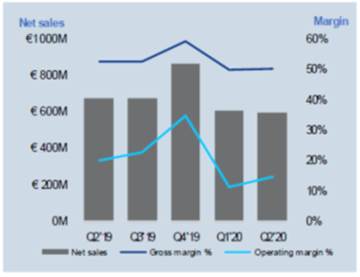
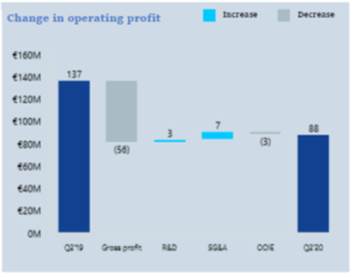
EUR million |
| Q2’20 |
| Q2’19 |
| YoY |
| Constant |
| Q1- |
| Q1-Q2’19 |
| YoY |
| Constant |
|
Net sales |
| 597 |
| 678 |
| (12 | )% | (12 | )% | 1 210 |
| 1 221 |
| (1 | )% | (1 | )% |
Gross profit |
| 301 |
| 357 |
| (16 | )% |
|
| 609 |
| 576 |
| 6 | % |
|
|
Gross margin % |
| 50.4 | % | 52.7 | % | (230 | )bps |
|
| 50.3 | % | 47.2 | % | 310 | bps |
|
|
R&D |
| (114 | ) | (117 | ) | (3 | )% |
|
| (238 | ) | (236 | ) | 1 | % |
|
|
SG&A |
| (93 | ) | (100 | ) | (7 | )% |
|
| (202 | ) | (201 | ) | 0 | % |
|
|
Other operating income and expenses |
| (6 | ) | (3 | ) |
|
|
|
| (11 | ) | (10 | ) |
|
|
|
|
Operating profit/(loss) |
| 88 |
| 137 |
| (36 | )% |
|
| 159 |
| 130 |
| 22 | % |
|
|
Operating margin % |
| 14.7 | % | 20.2 | % | (550 | )bps |
|
| 13.1 | % | 10.6 | % | 250 | bps |
|
|
Nokia Software net sales decreased 12% on both a reported and constant currency basis. The net sales performance in Nokia Software was in comparison to a particularly strong Q2 2019, which significantly benefitted from the timing of completions and acceptances of certain projects. In Q2 2020, we continued to progress against our strategy to strengthen Nokia Software, underpinned by strong execution and the comprehensiveness of our portfolio. Nokia Software offers the industry’s leading cloud-native, multi-vendor and multi-network solutions combined with a robust partner ecosystem.
The decrease in Nokia Software gross profit was primarily due to lower net sales and, to a lesser extent, lower gross margin. The lower gross margin was primarily due to North America, and was in comparison to a particularly strong Q2 2019, which significantly benefitted from the timing of completions and acceptances of certain projects.
The slight decrease in Nokia Software operating expenses was primarily due to operational efficiency and disciplined cost control.
Nokia Technologies
Q2 2020 compared to Q2 2019
|
|


EUR million |
| Q2’20 |
| Q2’19 |
| YoY |
| Constant |
| Q1- |
| Q1-Q2’19 |
| YoY |
| Constant |
|
Net sales |
| 341 |
| 383 |
| (11 | )% | (11 | )% | 689 |
| 753 |
| (8 | )% | (9 | )% |
Gross profit |
| 339 |
| 378 |
| (10 | )% |
|
| 684 |
| 735 |
| (7 | )% |
|
|
Gross margin % |
| 99.4 | % | 98.7 | % | 70 | bps |
|
| 99.3 | % | 97.6 | % | 170 | bps |
|
|
R&D |
| (38 | ) | (30 | ) | 27 | % |
|
| (72 | ) | (59 | ) | 22 | % |
|
|
SG&A |
| (19 | ) | (25 | ) | (24 | )% |
|
| (40 | ) | (50 | ) | (20 | )% |
|
|
Other operating income and expenses |
| 0 |
| 0 |
|
|
|
|
| (1 | ) | (1 | ) |
|
|
|
|
Operating profit/(loss) |
| 282 |
| 324 |
| (13 | )% |
|
| 572 |
| 626 |
| (9 | )% |
|
|
Operating margin % |
| 82.7 | % | 84.6 | % | (190 | )bps |
|
| 83.0 | % | 83.1 | % | (10 | )bps |
|
|
Nokia Technologies net sales decreased 11% on both a reported and constant currency basis.
The decrease in Nokia Technologies net sales was due to lower one-time net sales, lower brand licensing net sales, as well as lower patent licensing net sales due to the expiration of some small patent licensing agreements. One-time net sales amounted to approximately EUR 10 million in Q2 2020 and approximately EUR 30 million in Q2 2019.
The change in Nokia Technologies gross profit was primarily due to lower net sales.
The approximately flat operating expenses in Nokia Technologies was primarily due to higher investments to drive creation of intellectual property and higher costs to maintain our patent portfolio, offset by lower licensing related costs.
Group Common and Other
Q2 2020 compared to Q2 2019
|
|
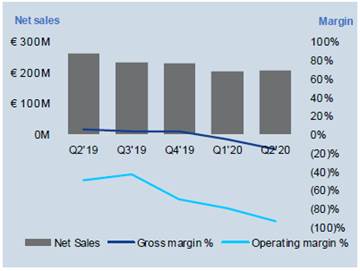
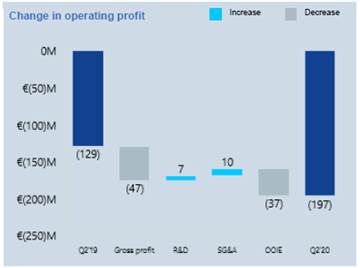
EUR million |
| Q2’20 |
| Q2’19 |
| YoY |
| Constant |
| Q1- |
| Q1-Q2’19 |
| YoY |
| Constant |
|
Net sales |
| 210 |
| 263 |
| (20 | )% | (21 | )% | 415 |
| 484 |
| (14 | )% | (15 | )% |
Gross profit/(loss) |
| (32 | ) | 15 |
|
|
|
|
| (42 | ) | 18 |
|
|
|
|
|
Gross margin % |
| (15.2 | )% | 5.7 | % | (2 090 | )bps |
|
| (10.1 | )% | 3.7 | % | (1 380 | )bps |
|
|
R&D |
| (78 | ) | (85 | ) | (8 | )% |
|
| (159 | ) | (168 | ) | (5 | )% |
|
|
SG&A |
| (60 | ) | (70 | ) | (14 | )% |
|
| (124 | ) | (134 | ) | (7 | )% |
|
|
Other operating income and expenses |
| (26 | ) | 11 |
|
|
|
|
| (36 | ) | 54 |
|
|
|
|
|
Operating profit/(loss) |
| (197 | ) | (129 | ) |
|
|
|
| (361 | ) | (230 | ) |
|
|
|
|
Operating margin % |
| (93.8 | )% | (49.0 | )% | (4 480 | )bps |
|
| (87.0 | )% | (47.5 | )% | (3 950 | )bps |
|
|
Group Common and Other net sales decreased 20%. On a constant currency basis, Group Common and Other net sales decreased 21%. We estimate that COVID-19 had an approximately EUR 150 million negative impact on our Q2 2020 net sales. The cumulative negative impact as of the end of Q2 2020 was approximately EUR 200 million, and we expect the majority of this to be shifted to future periods, rather than being lost. The vast majority of the COVID-19 impact on Group Common and Other related to Alcatel Submarine Networks.
The decrease in Group Common and Other net sales was primarily due to Radio Frequency Systems and, to a lesser extent, Alcatel Submarine Networks. The decrease in Radio Frequency Systems was primarily due to lower net sales of remote radio head cables, and lower net sales to a number of customers in North America. The decrease in Alcatel Submarine Networks was primarily due to factory closures as a result of COVID-19, almost entirely offset by the ramp-up of new projects.
The change in Group Common and Other to a gross loss from a gross profit in the year-ago quarter was primarily due to Alcatel Submarine Networks. The change in Alcatel Submarine Networks to a gross loss from a gross profit in the year-ago quarter was primarily due to a change in gross margin, driven by higher cost of sales.
The decrease in SG&A expenses was primarily due to cost reductions, including lower travel expenses.
The net negative fluctuation in other operating income and expenses was primarily due to a net negative fluctuation in Nokia’s venture fund investments.
Nokia, January-June 2020 significant events
On March 2, 2020, Nokia announced that its Board of Directors has appointed Pekka Lundmark as President and Chief Executive Officer of Nokia. Lundmark, who currently is President and CEO of Fortum, a leading energy company based in Espoo, Finland, will start in his new role as President and Chief Executive Officer of Nokia on August 1, 2020. Rajeev Suri will leave his current position as President and Chief Executive Officer of Nokia on July 31, 2020 and continue to serve as an advisor to the Nokia Board until January 1, 2021.
On May 5, 2020, Nokia announced that Kathrin Buvac, President of Nokia Enterprise, had decided to leave the company at the end of May. At the end of May, Buvac stepped down from her position on the company’s Group Leadership Team and left the company. Buvac was succeeded by Raghav Sahgal, formerly Senior Vice President of Nokia Software with responsibility for global sales and market services. Sahgal formally assumed his new position and joined the Group Leadership Team on June 1, 2020.
On May 6, 2020, Nokia announced it has commenced a tender offer to purchase for cash the EUR 500 million 1.000% notes due March 15, 2021 up to a maximum amount determined by Nokia and intention to issue new euro-denominated fixed-rate notes under its Euro Medium Term Note Programme. The purpose of the tender offer is to manage the overall indebtedness of Nokia.
On May 14, 2020, Nokia announced it had successfully completed an issue of EUR 500 million 2.375% notes due May 15, 2025 and EUR 500 million 3.125% notes due May 15, 2028 and that it has accepted for purchase EUR 150 million of 1.000% notes due March 15, 2021 validly tendered pursuant to the tender offer. The net proceeds of new notes shall be used to fund the tender offer and for general corporate purposes of the issuer.
On May 27, 2020, Nokia held its Annual General Meeting (“AGM”) at its headquarters in Espoo under special arrangements due to the COVID-19 pandemic. The following resolutions were made:
· No dividend is paid for the financial year 2019.
· Sari Baldauf, Bruce Brown, Jeanette Horan, Edward Kozel, Elizabeth Nelson, Søren Skou, Carla Smits-Nusteling and Kari Stadigh were re-elected as members of the Board and Thomas Dannenfeldt was elected as a new member of the Board for a term ending at the close of the next AGM. In an assembly meeting that took place after the AGM, the Board elected Sari Baldauf as Chair of the Board, and Kari Stadigh as Vice Chair of the Board.
· Remuneration Policy for the Company’s governing bodies was supported.
· Deloitte Oy was elected as the auditor for Nokia for the financial year 2021.
· Board was authorized to resolve to repurchase a maximum of 550 million Nokia shares. The authorization is effective until October 7, 2021 and it terminated the corresponding repurchase authorization granted by the Annual General Meeting on May 21, 2019.
· Board was authorized to issue a maximum of 550 million shares through issuance of shares or special rights entitling to shares in one or more issues. The authorization is effective until October 7, 2021 and it terminated the corresponding authorization granted by the Annual General Meeting on May 21, 2019.
On June 11, 2020, Nokia announced it has appointed Marco Wirén as Chief Financial Officer of Nokia and member of the Group Leadership Team, replacing current CFO Kristian Pullola. Wirén, who is currently President of Wärtsilä Energy and Executive Vice President of Wärtsilä Group, will join Nokia on September 1, 2020. Kristian Pullola, who has served as CFO since January 2017, will step down as CFO and leave the Group Leadership Team on August 31, 2020. He will remain with the company for a period of time to ensure a smooth transition.
Shares
The total number of Nokia shares on June 30, 2020 equaled 5 653 886 159. On June 30, 2020 Nokia and its subsidiary companies owned 43 460 608 Nokia shares, representing approximately 0.8% of the total number of Nokia shares and voting rights.
Consolidated income statement (condensed)
|
| Reported |
| Non-IFRS |
| ||||||||||||
EUR million |
| Q2’20 |
| Q2’19 |
| Q1-Q2’20 |
| Q1-Q2’19 |
| Q2’20 |
| Q2’19 |
| Q1-Q2’20 |
| Q1-Q2’19 |
|
Net sales (notes 2, 3, 4) |
| 5 092 |
| 5 694 |
| 10 005 |
| 10 726 |
| 5 093 |
| 5 696 |
| 10 007 |
| 10 753 |
|
Cost of sales |
| (3 086 | ) | (3 629 | ) | (6 222 | ) | (7 080 | ) | (3 076 | ) | (3 579 | ) | (6 203 | ) | (6 995 | ) |
Gross profit (notes 2, 3) |
| 2 006 |
| 2 065 |
| 3 784 |
| 3 646 |
| 2 017 |
| 2 117 |
| 3 804 |
| 3 758 |
|
Research and development expenses |
| (969 | ) | (1 126 | ) | (1 956 | ) | (2 282 | ) | (953 | ) | (978 | ) | (1 928 | ) | (1 987 | ) |
Selling, general and administrative expenses |
| (680 | ) | (763 | ) | (1 442 | ) | (1 587 | ) | (590 | ) | (669 | ) | (1 262 | ) | (1 377 | ) |
Other operating income and expenses |
| (187 | ) | (234 | ) | (292 | ) | (358 | ) | (50 | ) | (20 | ) | (75 | ) | (3 | ) |
Operating profit/(loss) (notes 2, 3) |
| 170 |
| (57 | ) | 94 |
| (581 | ) | 423 |
| 451 |
| 539 |
| 391 |
|
Share of results of associated companies and joint ventures |
| 6 |
| (6 | ) | 3 |
| (11 | ) | 6 |
| (6 | ) | 3 |
| (11 | ) |
Financial income and expenses |
| (11 | ) | (173 | ) | (61 | ) | (228 | ) | (27 | ) | (86 | ) | (93 | ) | (178 | ) |
Profit/(loss) before tax (note 2) |
| 165 |
| (237 | ) | 35 |
| (820 | ) | 403 |
| 359 |
| 448 |
| 202 |
|
Income tax (expense)/benefit |
| (80 | ) | 46 |
| (51 | ) | 188 |
| (87 | ) | (101 | ) | (100 | ) | (60 | ) |
Profit/(loss) from continuing operations (note 2) |
| 85 |
| (191 | ) | (16 | ) | (632 | ) | 316 |
| 258 |
| 348 |
| 142 |
|
Profit/(loss) from discontinued operations |
| 14 |
| (3 | ) | (1 | ) | (6 | ) | 0 |
| 0 |
| 0 |
| 0 |
|
Profit/(loss) for the period |
| 99 |
| (194 | ) | (17 | ) | (638 | ) | 316 |
| 258 |
| 348 |
| 142 |
|
Attributable to: |
|
|
|
|
|
|
|
|
|
|
|
|
|
|
|
|
|
Equity holders of the parent |
| 94 |
| (193 | ) | (23 | ) | (639 | ) | 311 |
| 258 |
| 342 |
| 140 |
|
Non-controlling interests |
| 5 |
| (1 | ) | 6 |
| 1 |
| 5 |
| (1 | ) | 6 |
| 1 |
|
|
|
|
|
|
|
|
|
|
|
|
|
|
|
|
|
|
|
Earnings per share, EUR (for profit/(loss) attributable to equity holders of the parent) |
|
|
|
|
|
|
|
|
|
|
|
|
|
|
|
|
|
Basic earnings per share |
|
|
|
|
|
|
|
|
|
|
|
|
|
|
|
|
|
Continuing operations |
| 0.01 |
| (0.03 | ) | 0.00 |
| (0.11 | ) | 0.06 |
| 0.05 |
| 0.06 |
| 0.03 |
|
Profit/(loss) for the period |
| 0.02 |
| (0.03 | ) | 0.00 |
| (0.11 | ) | 0.06 |
| 0.05 |
| 0.06 |
| 0.03 |
|
Diluted earnings per share |
|
|
|
|
|
|
|
|
|
|
|
|
|
|
|
|
|
Continuing operations |
| 0.01 |
| (0.03 | ) | 0.00 |
| (0.11 | ) | 0.06 |
| 0.05 |
| 0.06 |
| 0.02 |
|
Profit/(loss) for the period |
| 0.02 |
| (0.03 | ) | 0.00 |
| (0.11 | ) | 0.06 |
| 0.05 |
| 0.06 |
| 0.02 |
|
|
|
|
|
|
|
|
|
|
|
|
|
|
|
|
|
|
|
Average number of shares (‘000 shares) |
|
|
|
|
|
|
|
|
|
|
|
|
|
|
|
|
|
Basic |
|
|
|
|
|
|
|
|
|
|
|
|
|
|
|
|
|
Continuing operations |
| 5 610 426 |
| 5 598 710 |
| 5 609 281 |
| 5 597 426 |
| 5 610 426 |
| 5 598 710 |
| 5 609 281 |
| 5 597 426 |
|
Profit/(loss) for the period |
| 5 610 426 |
| 5 598 710 |
| 5 609 281 |
| 5 597 426 |
| 5 610 426 |
| 5 598 710 |
| 5 609 281 |
| 5 597 426 |
|
Diluted |
|
|
|
|
|
|
|
|
|
|
|
|
|
|
|
|
|
Continuing operations |
| 5 631 431 |
| 5 598 710 |
| 5 609 281 |
| 5 597 426 |
| 5 631 431 |
| 5 620 597 |
| 5 631 154 |
| 5 623 864 |
|
Profit/(loss) for the period |
| 5 631 431 |
| 5 598 710 |
| 5 609 281 |
| 5 597 426 |
| 5 631 431 |
| 5 620 597 |
| 5 631 154 |
| 5 623 864 |
|
The above condensed consolidated income statement should be read in conjunction with accompanying notes.
Consolidated statement of comprehensive income (condensed)
|
| Reported |
| ||||||
EUR million |
| Q2’20 |
| Q2’19 |
| Q1-Q2’20 |
| Q1-Q2’19 |
|
Profit/(loss) for the period |
| 99 |
| (194 | ) | (17 | ) | (638 | ) |
Other comprehensive income |
|
|
|
|
|
|
|
|
|
Items that will not be reclassified to profit or loss: |
|
|
|
|
|
|
|
|
|
Remeasurements of defined benefit plans |
| (548 | ) | (32 | ) | (26 | ) | (244 | ) |
Income tax related to items that will not be reclassified to profit or loss |
| 138 |
| 10 |
| 8 |
| 71 |
|
Items that may be reclassified subsequently to profit or loss: |
|
|
|
|
|
|
|
|
|
Translation differences |
| (550 | ) | (226 | ) | (160 | ) | 110 |
|
Net investment hedges |
| 157 |
| 58 |
| 49 |
| (37 | ) |
Cash flow and other hedges |
| 27 |
| 19 |
| 36 |
| 7 |
|
Financial assets at fair value through other comprehensive income |
| 18 |
| 10 |
| 35 |
| 0 |
|
Other changes, net |
| 4 |
| 0 |
| 3 |
| (1 | ) |
Income tax related to items that may be reclassified subsequently to profit or loss |
| (39 | ) | (17 | ) | (23 | ) | 6 |
|
Other comprehensive loss, net of tax |
| (793 | ) | (177 | ) | (78 | ) | (87 | ) |
Total comprehensive loss |
| (694 | ) | (371 | ) | (95 | ) | (725 | ) |
|
|
|
|
|
|
|
|
|
|
Attributable to: |
|
|
|
|
|
|
|
|
|
Equity holders of the parent |
| (697 | ) | (369 | ) | (101 | ) | (727 | ) |
Non-controlling interests |
| 3 |
| (2 | ) | 6 |
| 2 |
|
The above condensed consolidated statement of comprehensive income should be read in conjunction with accompanying notes.
Consolidated statement of financial position (condensed)
EUR million |
| June 30, 2020 |
| June 30, 2019 |
| December 31, 2019 |
|
ASSETS |
|
|
|
|
|
|
|
Goodwill |
| 5 609 |
| 5 477 |
| 5 527 |
|
Other intangible assets |
| 2 287 |
| 2 889 |
| 2 429 |
|
Property, plant and equipment |
| 1 770 |
| 1 782 |
| 1 856 |
|
Right-of-use assets |
| 857 |
| 874 |
| 912 |
|
Investments in associated companies and joint ventures |
| 166 |
| 142 |
| 165 |
|
Non-current financial investments (note 8) |
| 682 |
| 748 |
| 740 |
|
Deferred tax assets (note 6) |
| 5 009 |
| 5 266 |
| 5 124 |
|
Other non-current financial assets (note 8) |
| 448 |
| 409 |
| 445 |
|
Defined benefit pension assets (note 5) |
| 4 935 |
| 4 400 |
| 4 830 |
|
Other non-current assets |
| 225 |
| 265 |
| 292 |
|
Non-current assets |
| 21 988 |
| 22 251 |
| 22 320 |
|
Inventories |
| 2 865 |
| 3 606 |
| 2 936 |
|
Trade receivables (note 8) |
| 4 671 |
| 4 777 |
| 5 025 |
|
Contract assets |
| 1 196 |
| 1 712 |
| 1 489 |
|
Prepaid expenses and accrued income |
| 853 |
| 1 138 |
| 908 |
|
Current income tax assets |
| 304 |
| 364 |
| 279 |
|
Other current financial assets (note 8) |
| 206 |
| 287 |
| 164 |
|
Current financial investments (note 8) |
| 399 |
| 95 |
| 97 |
|
Cash and cash equivalents (note 8) |
| 7 088 |
| 4 693 |
| 5 910 |
|
Current assets |
| 17 582 |
| 16 673 |
| 16 808 |
|
Assets held for sale |
| 0 |
| 8 |
| 0 |
|
Total assets |
| 39 570 |
| 38 932 |
| 39 128 |
|
|
|
|
|
|
|
|
|
SHAREHOLDERS’ EQUITY AND LIABILITIES |
|
|
|
|
|
|
|
Share capital |
| 246 |
| 246 |
| 246 |
|
Share issue premium |
| 434 |
| 428 |
| 427 |
|
Treasury shares |
| (352 | ) | (368 | ) | (352 | ) |
Translation differences |
| (494 | ) | (506 | ) | (372 | ) |
Fair value and other reserves |
| 1 423 |
| 891 |
| 1 382 |
|
Reserve for invested unrestricted equity |
| 15 627 |
| 15 596 |
| 15 607 |
|
Accumulated deficit |
| (1 644 | ) | (1 979 | ) | (1 613 | ) |
Total capital and reserves attributable to equity holders of the parent |
| 15 241 |
| 14 307 |
| 15 325 |
|
Non-controlling interests |
| 78 |
| 79 |
| 76 |
|
Total equity |
| 15 319 |
| 14 386 |
| 15 401 |
|
Long-term interest-bearing liabilities (notes 8, 10) |
| 5 181 |
| 3 949 |
| 3 985 |
|
Long-term lease liabilities |
| 729 |
| 748 |
| 771 |
|
Deferred tax liabilities |
| 240 |
| 294 |
| 390 |
|
Defined benefit pension and post-retirement liabilities (note 5) |
| 4 537 |
| 4 755 |
| 4 343 |
|
Contract liabilities |
| 772 |
| 1 007 |
| 915 |
|
Deferred revenue and other long-term liabilities |
| 624 |
| 787 |
| 712 |
|
Provisions (note 9) |
| 477 |
| 592 |
| 556 |
|
Non-current liabilities |
| 12 560 |
| 12 133 |
| 11 672 |
|
Short-term interest-bearing liabilities (notes 8, 10) |
| 756 |
| 337 |
| 292 |
|
Short-term lease liabilities |
| 227 |
| 223 |
| 259 |
|
Other financial liabilities (note 8) |
| 763 |
| 819 |
| 803 |
|
Current income tax liabilities |
| 157 |
| 207 |
| 187 |
|
Trade payables (note 8) |
| 3 255 |
| 3 894 |
| 3 786 |
|
Contract liabilities |
| 2 817 |
| 2 606 |
| 2 752 |
|
Accrued expenses, deferred revenue and other liabilities |
| 2 986 |
| 3 488 |
| 3 323 |
|
Provisions (note 9) |
| 730 |
| 838 |
| 653 |
|
Current liabilities |
| 11 690 |
| 12 412 |
| 12 055 |
|
Total shareholders’ equity and liabilities |
| 39 570 |
| 38 932 |
| 39 128 |
|
|
|
|
|
|
|
|
|
Shareholders’ equity per share, EUR |
| 2.72 |
| 2.56 |
| 2.73 |
|
Number of shares (1 000 shares, excluding treasury shares) |
| 5 610 426 |
| 5 598 710 |
| 5 605 581 |
|
The above condensed consolidated statement of financial position should be read in conjunction with accompanying notes.
Consolidated statement of cash flows (condensed)
EUR million |
| Q2’20 |
| Q2’19 |
| Q1-Q2’20 |
| Q1-Q2’19 |
|
Cash flow from operating activities |
|
|
|
|
|
|
|
|
|
Profit/(loss) for the period |
| 99 |
| (194 | ) | (17 | ) | (638 | ) |
Adjustments |
| 535 |
| 747 |
| 958 |
| 1 198 |
|
Depreciation and amortization |
| 290 |
| 413 |
| 574 |
| 820 |
|
Restructuring charges |
| 98 |
| 193 |
| 177 |
| 319 |
|
Financial income and expenses |
| 10 |
| 174 |
| 65 |
| 228 |
|
Income tax expense/(benefit) |
| 79 |
| (46 | ) | 49 |
| (187 | ) |
Other |
| 58 |
| 13 |
| 93 |
| 18 |
|
Cash from operations before changes in net working capital |
| 634 |
| 553 |
| 941 |
| 560 |
|
Change in net working capital |
| (175 | ) | (1 300 | ) | (364 | ) | (1 833 | ) |
Decrease/(increase) in receivables |
| 219 |
| (255 | ) | 641 |
| 126 |
|
(Increase)/decrease in inventories |
| (82 | ) | (113 | ) | 19 |
| (392 | ) |
Decrease in non-interest-bearing liabilities |
| (312 | ) | (932 | ) | (1 024 | ) | (1 567 | ) |
Cash from/(used in) operations |
| 459 |
| (747 | ) | 577 |
| (1 273 | ) |
Interest received |
| 8 |
| 10 |
| 16 |
| 26 |
|
Interest paid |
| (49 | ) | (15 | ) | 39 |
| (75 | ) |
Income taxes paid, net |
| (85 | ) | (164 | ) | (165 | ) | (341 | ) |
Net cash from/(used in) operating activities |
| 333 |
| (916 | ) | 467 |
| (1 663 | ) |
Cash flow from investing activities |
|
|
|
|
|
|
|
|
|
Purchase of property, plant and equipment and intangible assets |
| (89 | ) | (131 | ) | (243 | ) | (306 | ) |
Proceeds from sale of property, plant and equipment and intangible assets |
| 1 |
| 11 |
| 2 |
| 11 |
|
Acquisition of businesses, net of cash acquired |
| 0 |
| 0 |
| (104 | ) | 0 |
|
Proceeds from disposal of businesses, net of disposed cash |
| 0 |
| 10 |
| 7 |
| 19 |
|
Purchase of current financial investments |
| (300 | ) | (44 | ) | (391 | ) | (349 | ) |
Proceeds from maturities and sale of current financial investments |
| 58 |
| 477 |
| 91 |
| 869 |
|
Purchase of non-current financial investments |
| (14 | ) | (57 | ) | (24 | ) | (77 | ) |
Proceeds from sale of non-current financial investments |
| 34 |
| 52 |
| 57 |
| 81 |
|
Proceeds from/(purchase of) other long-term loans receivable |
| 0 |
| (22 | ) | 9 |
| (22 | ) |
Other |
| 3 |
| 3 |
| 4 |
| 3 |
|
Net cash (used in)/from investing activities |
| (307 | ) | 299 |
| (592 | ) | 229 |
|
Cash flow from financing activities |
|
|
|
|
|
|
|
|
|
Purchase of equity instruments of subsidiaries |
| (2 | ) | 0 |
| (2 | ) | (1 | ) |
Proceeds from long-term borrowings |
| 1 093 |
| 250 |
| 1 593 |
| 999 |
|
Repayment of long-term borrowings |
| (172 | ) | (534 | ) | (211 | ) | (765 | ) |
Proceeds from short-term borrowings |
| 69 |
| 104 |
| 83 |
| 85 |
|
Payment of principal portion of lease liabilities |
| (56 | ) | (63 | ) | (123 | ) | (127 | ) |
Dividends paid |
| (1 | ) | (248 | ) | (16 | ) | (249 | ) |
Net cash from/(used in) financing activities |
| 931 |
| (491 | ) | 1 324 |
| (58 | ) |
Translation differences |
| (28 | ) | (61 | ) | (21 | ) | (76 | ) |
Net increase/(decrease) in cash and cash equivalents |
| 929 |
| (1 169 | ) | 1 178 |
| (1 568 | ) |
Cash and cash equivalents at beginning of period |
| 6 159 |
| 5 862 |
| 5 910 |
| 6 261 |
|
Cash and cash equivalents at end of period |
| 7 088 |
| 4 693 |
| 7 088 |
| 4 693 |
|
Consolidated statement of cash flows combines cash flows from both the continuing and the discontinued operations. The figures in the consolidated statement of cash flows cannot be directly traced from the statement of financial position without additional information as a result of acquisitions and disposals of subsidiaries and net foreign exchange differences arising on consolidation.
The above condensed consolidated statement of cash flows should be read in conjunction with accompanying notes.
Consolidated statement of changes in shareholders’ equity (condensed)
EUR million |
| Share |
| Share issue |
| Treasury |
| Translation |
| Fair value |
| Reserve for |
| Accumulated |
| Attributable |
| Non- |
| Total equity |
|
December 31, 2018 |
| 246 |
| 436 |
| (408 | ) | (592 | ) | 1 063 |
| 15 606 |
| (1 062 | ) | 15 289 |
| 82 |
| 15 371 |
|
Adoption of IFRS 16(1) |
| 0 |
| 0 |
| 0 |
| 0 |
| 0 |
| 0 |
| 4 |
| 4 |
| 0 |
| 4 |
|
January 1, 2019 |
| 246 |
| 436 |
| (408 | ) | (592 | ) | 1 063 |
| 15 606 |
| (1 058 | ) | 15 293 |
| 82 |
| 15 375 |
|
Loss for the period |
| 0 |
| 0 |
| 0 |
| 0 |
| 0 |
| 0 |
| (639 | ) | (639 | ) | 1 |
| (638 | ) |
Other comprehensive loss |
| 0 |
| 0 |
| 0 |
| 85 |
| (172 | ) | 0 |
| (1 | ) | (87 | ) | 0 |
| (87 | ) |
Total comprehensive loss |
| 0 |
| 0 |
| 0 |
| 85 |
| (172 | ) | 0 |
| (640 | ) | (727 | ) | 2 |
| (725 | ) |
Share-based payment |
| 0 |
| 40 |
| 0 |
| 0 |
| 0 |
| 0 |
| 0 |
| 40 |
| 0 |
| 40 |
|
Settlement of share-based payment |
| 0 |
| (48 | ) | 40 |
| 0 |
| 0 |
| (10 | ) | 0 |
| (17 | ) | 0 |
| (17 | ) |
Dividends |
| 0 |
| 0 |
| 0 |
| 0 |
| 0 |
| 0 |
| (280 | ) | (280 | ) | (5 | ) | (284 | ) |
Acquisition of non-controlling interests |
| 0 |
| 0 |
| 0 |
| 0 |
| 0 |
| 0 |
| (1 | ) | (1 | ) | 0 |
| 0 |
|
Other movements |
| 0 |
| 0 |
| 0 |
| 0 |
| 0 |
| 0 |
| (1 | ) | (1 | ) | 0 |
| (1 | ) |
Total transactions with owners |
| 0 |
| (8 | ) | 40 |
| 0 |
| 0 |
| (10 | ) | (282 | ) | (259 | ) | (4 | ) | (263 | ) |
June 30, 2019 |
| 246 |
| 428 |
| (368 | ) | (506 | ) | 891 |
| 15 596 |
| (1 979 | ) | 14 307 |
| 79 |
| 14 386 |
|
|
|
|
|
|
|
|
|
|
|
|
|
|
|
|
|
|
|
|
|
|
|
January 1, 2020 |
| 246 |
| 427 |
| (352 | ) | (372 | ) | 1 382 |
| 15 607 |
| (1 613 | ) | 15 325 |
| 76 |
| 15 401 |
|
Loss for the period |
| 0 |
| 0 |
| 0 |
| 0 |
| 0 |
| 0 |
| (23 | ) | (23 | ) | 6 |
| (17 | ) |
Other comprehensive loss |
| 0 |
| 0 |
| 0 |
| (122 | ) | 41 |
| 0 |
| 2 |
| (78 | ) | 0 |
| (78 | ) |
Total comprehensive loss |
| 0 |
| 0 |
| 0 |
| (122 | ) | 41 |
| 0 |
| (21 | ) | (101 | ) | 6 |
| (95 | ) |
Share-based payment |
| 0 |
| 34 |
| 0 |
| 0 |
| 0 |
| 0 |
| 0 |
| 34 |
| 0 |
| 34 |
|
Excess tax benefit on share-based payment |
| 0 |
| 4 |
| 0 |
| 0 |
| 0 |
| 0 |
| 0 |
| 4 |
| 0 |
| 4 |
|
Settlement of share-based payment |
| 0 |
| (31 | ) | 0 |
| 0 |
| 0 |
| 20 |
| 0 |
| (12 | ) | 0 |
| (12 | ) |
Dividends |
| 0 |
| 0 |
| 0 |
| 0 |
| 0 |
| 0 |
| 0 |
| 0 |
| (4 | ) | (4 | ) |
Acquisition of non-controlling interests |
| 0 |
| 0 |
| 0 |
| 0 |
| 0 |
| 0 |
| (10 | ) | (10 | ) | 0 |
| (10 | ) |
Total transactions with owners |
| 0 |
| 7 |
| 0 |
| 0 |
| 0 |
| 20 |
| (10 | ) | 17 |
| (4 | ) | 13 |
|
June 30, 2020 |
| 246 |
| 434 |
| (352 | ) | (494 | ) | 1 423 |
| 15 627 |
| (1 644 | ) | 15 241 |
| 78 |
| 15 319 |
|
(1)Equity impact mainly relating to opening balance of subleases arising from the difference between right-of-use assets and lease receivables on adoption of IFRS 16, Leases, as of January 1, 2019.
The above condensed consolidated statement of changes in shareholders’ equity should be read in conjunction with accompanying notes.
Notes to Financial statements
1. BASIS OF PREPARATION
This unaudited and condensed consolidated financial statement information of Nokia has been prepared in accordance with IAS 34, Interim Financial Reporting, and it should be read in conjunction with the consolidated financial statements for 2019 prepared in accordance with IFRS as published by the IASB and adopted by the EU. The same accounting policies, methods of computation and applications of judgment are followed in this financial statement information as was followed in the consolidated financial statements for 2019. This financial report was authorized for issue by management on July 31, 2020.
Nokia presents financial information on reported, non-IFRS and constant currency basis. Non-IFRS measures presented in this document exclude costs related to the acquisition of Alcatel-Lucent and related integration, goodwill impairment charges, intangible asset amortization and other purchase price fair value adjustments, restructuring and associated charges and certain other items that may not be indicative of Nokia’s underlying business performance. In order to allow full visibility on determining non-IFRS results, information on non-IFRS exclusions is presented separately for each of the components of profit or loss.
Constant currency reporting provides additional information on change in financial measures on a constant currency basis in order to better reflect the underlying business performance. Therefore, change in financial measures at constant currency excludes the impact of changes in exchange rates in comparison to euro, our reporting currency.
Non-IFRS or constant currency financial measures should not be considered in isolation from, or as a substitute for, financial information presented in compliance with IFRS, and either of these financial measures as used by Nokia may not be comparable to similarly titled measures used by other companies or persons.
Net sales and operating profit of the Nokia Group, particularly in Networks and Nokia Software segments, are subject to seasonal fluctuations being generally highest in the fourth quarter and lowest in the first quarter of the year. This is mainly due to the seasonality in the spending cycles of communication service providers.
Management has identified its geographic areas as the relevant category to present disaggregated revenue. Nokia’s primary customer base consists of companies that operate on a country specific or a regional basis and are subject to macroeconomic conditions specific to those geographic areas. Further, although Nokia’s technology cycle is similar around the world, each country or region is inherently in a different stage of that cycle, often influenced by macroeconomic conditions. Each reportable segment, as described in note 3, “Segment Information”, operates in every geographic area as described in note 4 “Net Sales”. No reportable segment has a specific revenue concentration in any geographic area other than Nokia Technologies, which is included within Europe. Each type of customer, as disclosed in note 4, “Net Sales”, operates in all geographic areas.
In 2017, Nokia and China Huaxin Post & Telecommunication Economy Development Center (China Huaxin) commenced operations of the joint venture Nokia Shanghai Bell (NSB). China Huaxin obtained the right to fully transfer its ownership interest in NSB to Nokia in exchange for a future cash settlement. To reflect this obligation, Nokia derecognized the non-controlling interest and records a financial liability within current liabilities in line with the option exercise period. Any changes in the estimated future cash settlement are recorded within financial income and expense.
Percentages and figures presented herein may include rounding differences and therefore may not add up precisely to the totals presented and may vary from previously published financial information.
COVID-19
The impact of COVID-19 on Nokia’s operations in the first six months of 2020 has primarily related to supply chain disruptions and delivery and implementation challenges. In addition, COVID-19 has affected the valuations of certain assets, including investments in non-publicly quoted assets through Nokia’s venture fund investments and pension plans, the valuation of which is inherently challenging in fast-moving market conditions (refer to note 5 Pensions and other post-employment benefits and note 8 Fair value of financial instruments).
In relation to its financial statements as of June 30, 2020, Nokia has considered also the indicators of impairment of goodwill and other intangible assets, recoverability of deferred tax assets, valuation of inventories, and collectability of trade receivables and contract assets. Based on these assessments, COVID-19 is currently not expected to have such long-term effects on Nokia’s financial performance that it would require adjustments to the carrying amounts of goodwill and other intangible assets or deferred tax assets. Also, Nokia has not identified any significant increase in the amount of bad debt or need to adjust the valuation of inventories.
In addition, and in accordance with our prudent management of our capital structure, we took proactive steps to strengthen our liquidity position by raising EUR 1.0 billion of debt in Q2 2020, on a net basis. As a result, we ended Q2 2020 with EUR 7.5 billion of total cash and current financial investments.
Potential risks and uncertainties continue to exist related to the scope and duration of the COVID-19 impact and the pace and shape of the economic recovery following the pandemic.
Foreign exchange rates
Nokia’s net sales are derived from various countries and invoiced in various currencies. Therefore, our business and results from operations are exposed to changes in foreign exchange rates between the euro, our reporting currency, and other currencies, such as the US dollar and the Chinese yuan. To mitigate the impact of changes in exchange rates on our results, we hedge operative forecasted net foreign exchange exposures, typically within a 12-month horizon, and apply hedge accounting in the majority of cases.
The below table shows the exposure to different currencies for net sales and total costs.
|
| Q2’20 |
| Q2’19 |
| Q4’19 |
| ||||||
|
| Net sales |
| Total costs |
| Net sales |
| Total costs |
| Net sales |
| Total costs |
|
EUR |
| ~25 | % | ~25 | % | ~25 | % | ~25 | % | ~20 | % | ~20 | % |
USD |
| ~50 | % | ~45 | % | ~50 | % | ~45 | % | ~50 | % | ~50 | % |
CNY |
| ~5 | % | ~10 | % | ~5 | % | ~10 | % | ~5 | % | ~10 | % |
Other |
| ~20 | % | ~20 | % | ~20 | % | ~20 | % | ~25 | % | ~20 | % |
Total |
| 100 | % | 100 | % | 100 | % | 100 | % | 100 | % | 100 | % |
End of Q2’20 balance sheet rate 1 EUR = 1.12 USD, end of Q2’19 balance sheet rate 1 EUR = 1.14 USD and end of Q4’19 balance sheet rate 1 EUR = 1.12 USD
New and amended standards and interpretations
The amendments to IFRS standards that became effective on January 1, 2020, did not have a material impact on Nokia’s consolidated financial statements. New standards and amendments to existing standards issued by the IASB that are not yet effective are not expected to have a material impact on Nokia’s consolidated financial statements when adopted.
2. NON-IFRS TO REPORTED RECONCILIATION
In addition to information on our reported IFRS results, Nokia provides certain information on a non-IFRS, or underlying business performance, basis. Non-IFRS measures presented in this document exclude costs related to the acquisition of Alcatel-Lucent and related integration, goodwill impairment charges, intangible asset amortization and other purchase price fair value adjustments, restructuring and associated charges and certain other items that may not be indicative of Nokia’s underlying business performance. Nokia believes that the non-IFRS results provide meaningful supplemental information to both management and investors regarding Nokia’s underlying business performance by excluding the above-described items. These non-IFRS financial measures should not be viewed in isolation or as substitutes to the equivalent IFRS measure(s), but should be used in conjunction with the most directly comparable IFRS measure(s) in the reported results.
Q2’20
EUR million |
| Net sales |
| Cost of sales |
| Research and |
| Selling, |
| Other |
| Operating |
| Financial |
| Income tax |
| Profit/(loss) |
|
Non-IFRS |
| 5 093 |
| (3 076 | ) | (953 | ) | (590 | ) | (50 | ) | 423 |
| (27 | ) | (87 | ) | 316 |
|
Release of acquisition-related fair value adjustments to deferred revenue and inventory |
| (1 | ) |
|
|
|
|
|
|
|
| (1 | ) |
|
|
|
| 0 |
|
Amortization of acquired intangible assets |
|
|
|
|
| (16 | ) | (90 | ) |
|
| (106 | ) |
|
| 23 |
| (83 | ) |
Restructuring and associated charges |
|
|
| (10 | ) |
|
|
|
| (119 | ) | (130 | ) |
|
| 25 |
| (105 | ) |
Impairment of assets, net of impairment reversals |
|
|
|
|
|
|
|
|
| (19 | ) | (19 | ) |
|
| 4 |
| (15 | ) |
Gain on sale of fixed assets |
|
|
|
|
|
|
|
|
| 2 |
| 2 |
|
|
|
|
| 1 |
|
Change in financial liability to acquire NSB non-controlling interest |
|
|
|
|
|
|
|
|
|
|
| 0 |
| 15 |
|
|
| 15 |
|
Legal entity restructuring |
|
|
|
|
|
|
|
|
|
|
| 0 |
|
|
| (45 | ) | (45 | ) |
Total non-IFRS exclusions |
| (1 | ) | (10 | ) | (16 | ) | (90 | ) | (137 | ) | (253 | ) | 15 |
| 7 |
| (231 | ) |
Reported |
| 5 092 |
| (3 086 | ) | (969 | ) | (680 | ) | (187 | ) | 170 |
| (11 | ) | (80 | ) | 85 |
|
Q2’19
EUR million |
| Net sales |
| Cost of sales |
| Research and |
| Selling, |
| Other |
| Operating |
| Financial |
| Income tax |
| Profit/(loss) |
|
Non-IFRS |
| 5 696 |
| (3 579 | ) | (978 | ) | (669 | ) | (20 | ) | 451 |
| (86 | ) | (101 | ) | 258 |
|
Release of acquisition-related fair value adjustments to deferred revenue and inventory |
| (2 | ) |
|
|
|
|
|
| 1 |
| (2 | ) |
|
| 1 |
| (1 | ) |
Amortization of acquired intangible assets |
|
|
|
|
| (142 | ) | (88 | ) |
|
| (230 | ) |
|
| 53 |
| (177 | ) |
Transaction and related costs, including integration costs |
|
|
|
|
|
|
| (6 | ) |
|
| (7 | ) |
|
| 1 |
| (6 | ) |
Restructuring and associated charges |
|
|
| (18 | ) |
|
|
|
| (211 | ) | (229 | ) |
|
| 45 |
| (184 | ) |
Product portfolio strategy costs |
|
|
| (32 | ) | (5 | ) |
|
|
|
| (37 | ) |
|
| 7 |
| (30 | ) |
Impairment of assets, net of impairment reversals |
|
|
|
|
|
|
|
|
| 9 |
| 9 |
|
|
| (3 | ) | 5 |
|
Costs associated with contract exit |
|
|
|
|
|
|
|
|
|
|
| 0 |
| (65 | ) | 13 |
| (52 | ) |
Change in financial liability to acquire NSB non-controlling interest |
|
|
|
|
|
|
|
|
|
|
| 0 |
| (23 | ) |
|
| (23 | ) |
Operating model integration |
|
|
|
|
|
|
|
|
| (12 | ) | (12 | ) |
|
| 30 |
| 19 |
|
Total non-IFRS exclusions |
| (2 | ) | (50 | ) | (147 | ) | (95 | ) | (214 | ) | (508 | ) | (88 | ) | 147 |
| (448 | ) |
Reported |
| 5 694 |
| (3 629 | ) | (1 126 | ) | (763 | ) | (234 | ) | (57 | ) | (173 | ) | 46 |
| (191 | ) |
Q1-Q2’20
EUR million |
| Net sales |
| Cost of sales |
| Research and |
| Selling, |
| Other |
| Operating |
| Financial |
| Income tax |
| Profit/(loss) |
|
Non-IFRS |
| 10 007 |
| (6 203 | ) | (1 928 | ) | (1 262 | ) | (75 | ) | 539 |
| (93 | ) | (100 | ) | 348 |
|
Release of acquisition-related fair value adjustments to deferred revenue and inventory |
| (1 | ) |
|
|
|
|
|
|
|
| (1 | ) |
|
|
|
| (1 | ) |
Amortization of acquired intangible assets |
|
|
|
|
| (28 | ) | (179 | ) |
|
| (207 | ) |
|
| 47 |
| (160 | ) |
Transaction and related costs, including integration costs |
|
|
|
|
|
|
| (1 | ) |
|
| (1 | ) |
|
|
|
| (1 | ) |
Restructuring and associated charges |
|
|
| (19 | ) |
|
|
|
| (198 | ) | (217 | ) |
|
| 42 |
| (175 | ) |
Impairment of assets, net of impairment reversals |
|
|
|
|
|
|
|
|
| (20 | ) | (20 | ) |
|
| 4 |
| (16 | ) |
Gain on sale of fixed assets |
|
|
|
|
|
|
|
|
| 2 |
| 2 |
|
|
|
|
| 1 |
|
Costs associated with contract exit |
|
|
| 1 |
|
|
|
|
|
|
| 1 |
|
|
|
|
| 1 |
|
Change in financial liability to acquire NSB non-controlling interest |
|
|
|
|
|
|
|
|
|
|
| 0 |
| 32 |
|
|
| 32 |
|
Legal entity restructuring |
|
|
|
|
|
|
|
|
|
|
| 0 |
|
|
| (45 | ) | (45 | ) |
Total non-IFRS exclusions |
| (1 | ) | (19 | ) | (28 | ) | (180 | ) | (217 | ) | (445 | ) | 32 |
| 49 |
| (364 | ) |
Reported |
| 10 005 |
| (6 222 | ) | (1 956 | ) | (1 442 | ) | (292 | ) | 94 |
| (61 | ) | (51 | ) | (16 | ) |
Q1-Q2’19
EUR million |
| Net sales |
| Cost of sales |
| Research and |
| Selling, |
| Other |
| Operating |
| Financial |
| Income tax |
| Profit/(loss) |
|
Non-IFRS |
| 10 753 |
| (6 995 | ) | (1 987 | ) | (1 377 | ) | (3 | ) | 391 |
| (178 | ) | (60 | ) | 142 |
|
Release of acquisition-related fair value adjustments to deferred revenue and inventory |
| (5 | ) |
|
|
|
|
|
| 3 |
| (2 | ) |
|
|
|
| (1 | ) |
Amortization of acquired intangible assets |
|
|
|
|
| (284 | ) | (175 | ) |
|
| (460 | ) |
|
| 107 |
| (353 | ) |
Transaction and related costs, including integration costs |
|
|
| (1 | ) |
|
| (33 | ) |
|
| (34 | ) |
|
| 7 |
| (27 | ) |
Restructuring and associated charges |
| (22 | ) | (21 | ) |
|
| (1 | ) | (348 | ) | (392 | ) |
|
| 78 |
| (314 | ) |
Product portfolio strategy costs |
|
|
| (65 | ) | (10 | ) |
|
|
|
| (75 | ) |
|
| 15 |
| (60 | ) |
Impairment of assets, net of impairment reversals |
|
|
|
|
|
|
|
|
| 3 |
| 3 |
|
|
| (2 | ) | 1 |
|
Divestment of businesses |
|
|
| (1 | ) |
|
|
|
| (1 | ) | (2 | ) |
|
|
|
| (2 | ) |
Costs associated with contract exit |
|
|
| 1 |
|
|
|
|
| (1 | ) | 0 |
| (65 | ) | 13 |
| (52 | ) |
Change in financial liability to acquire NSB non-controlling interest |
|
|
|
|
|
|
|
|
|
|
| 0 |
| 15 |
|
|
| 15 |
|
Operating model integration |
|
|
|
|
|
|
|
|
| (12 | ) | (12 | ) |
|
| 30 |
| 19 |
|
Total non-IFRS exclusions |
| (27 | ) | (86 | ) | (295 | ) | (210 | ) | (355 | ) | (972 | ) | (50 | ) | 248 |
| (774 | ) |
Reported |
| 10 726 |
| (7 080 | ) | (2 282 | ) | (1 587 | ) | (358 | ) | (581 | ) | (228 | ) | 188 |
| (632 | ) |
3. SEGMENT INFORMATION
Nokia has three reportable segments for financial reporting purposes: (1) Networks, (2) Nokia Software and (3) Nokia Technologies. Segment-level information for Group Common and Other is also presented.
Networks reportable segment consists of four aggregated operating segments: (1) Mobile Networks, (2) Global Services, (3) Fixed Networks and (4) IP/Optical Networks. The aggregated operating segments have similar economic characteristics, such as long-term margins; have similar products, production processes, distribution methods and customers; and operate in a similar regulatory environment.
In addition, Nokia provides net sales disclosure for the following businesses within Networks reportable segment: (i) Mobile Access (comprises Mobile Networks and Global Services operating segments), (ii) Fixed Access (comprises Fixed Networks operating segment), (iii) IP Routing (comprises part of IP/Optical Networks operating segment) and (iv) Optical Networks (comprises part of IP/Optical Networks operating segment).
Non-IFRS exclusions are not allocated to the segments. For more information on the segment reporting, refer to note 5, “Segment information”, of Nokia’s Annual Report for 2019.
Networks
Networks comprises Mobile Networks, Global Services, Fixed Networks and IP/Optical Networks operating segments.
The Mobile Networks operating segment focuses on mobile radio including macro radio base stations, small cells and cloud-based radio solutions, as well as microwave radio links and cloud computing HW, for communication service providers and enterprises.
Global Services operating segment provides a wide range of professional services with multi-vendor capabilities, covering network planning and optimization, network implementation, systems integration as well as company-wide managed services.
The Fixed Networks operating segment provides copper and fiber access products, solutions and services. The portfolio allows for a customized combination of technologies that brings fiber to the most economical point for the customer.
The IP/Optical Networks operating segment provides IP routing, packet core and optical transport systems, each with their own software and services to build high capacity network infrastructure for the internet and global connectivity.
Nokia Software
The Nokia Software operating segment offers the cloud core software portfolio in addition to software applications spanning customer experience management, network operations and management, communications and collaboration, policy and charging, as well as cloud, IoT, security, and analytics platforms that enable digital services providers and enterprises to accelerate innovation, monetize services, and optimize their customer experience.
Nokia Technologies
The Nokia Technologies operating segment, building on decades of innovation and R&D leadership in technologies used in virtually all mobile devices used today, is expanding Nokia patent licensing business, reintroducing the Nokia brand to smartphones through brand licensing, and establishing a technology licensing business. The majority of net sales and related costs and expenses attributable to licensing and patenting the separate patent portfolios of Nokia Technologies, Networks, Nokia Software and Nokia Bell Labs are recorded in Nokia Technologies. Each reportable segment continues to separately record its own research and development expenses.
Group Common and Other
Group Common and Other includes Alcatel-Lucent Submarine Networks and Radio Frequency Systems, both of which are managed as separate entities. In addition, Group Common and Other includes Nokia Bell Labs’ operating expenses, as well as certain corporate-level and centrally managed operating expenses.
Q2’20
EUR million |
| Networks(1) |
| Nokia |
| Nokia |
| Group |
| Eliminations |
| Non-IFRS |
| Non-IFRS |
| Nokia Total |
|
Net sales |
| 3 955 |
| 597 |
| 341 |
| 210 |
| (11 | ) | 5 093 |
| (1 | ) | 5 092 |
|
Cost of sales |
| (2 547 | ) | (296 | ) | (2 | ) | (242 | ) | 11 |
| (3 076 | ) | (10 | ) | (3 086 | ) |
Gross profit |
| 1 409 |
| 301 |
| 339 |
| (32 | ) | 0 |
| 2 017 |
| (11 | ) | 2 006 |
|
Gross margin % |
| 35.6 | % | 50.4 | % | 99.4 | % | (15.2 | )% |
|
| 39.6 | % |
|
| 39.4 | % |
Research and development expenses |
| (724 | ) | (114 | ) | (38 | ) | (78 | ) | 0 |
| (953 | ) | (16 | ) | (969 | ) |
Selling, general and administrative expenses |
| (418 | ) | (93 | ) | (19 | ) | (60 | ) | 0 |
| (590 | ) | (90 | ) | (680 | ) |
Other operating income and expenses |
| (18 | ) | (6 | ) | 0 |
| (26 | ) | 0 |
| (50 | ) | (137 | ) | (187 | ) |
Operating profit/(loss) |
| 249 |
| 88 |
| 282 |
| (197 | ) | 0 |
| 423 |
| (253 | ) | 170 |
|
Operating margin % |
| 6.3 | % | 14.7 | % | 82.7 | % | (93.8 | )% |
|
| 8.3 | % |
|
| 3.3 | % |
Depreciation and amortization |
| (141 | ) | (21 | ) | (8 | ) | (14 | ) | 0 |
| (184 | ) | (106 | ) | (290 | ) |
Share of results of associated companies and joint ventures |
| 6 |
| 0 |
| 0 |
| 0 |
| 0 |
| 6 |
| 0 |
| 6 |
|
EBITDA |
| 397 |
| 109 |
| 290 |
| (183 | ) | 0 |
| 613 |
| (148 | ) | 466 |
|
(1) Mobile Access net sales of EUR 2 494 million, Fixed Access net sales of EUR 439 million, IP Routing net sales of EUR 659 million and Optical Networks net sales of EUR 363 million.
Q2’19
EUR million |
| Networks(1) |
| Nokia |
| Nokia |
| Group |
| Eliminations |
| Non-IFRS |
| Non-IFRS |
| Nokia Total |
|
Net sales |
| 4 393 |
| 678 |
| 383 |
| 263 |
| (21 | ) | 5 696 |
| (2 | ) | 5 694 |
|
Cost of sales |
| (3 026 | ) | (321 | ) | (5 | ) | (249 | ) | 21 |
| (3 579 | ) | (50 | ) | (3 629 | ) |
Gross profit |
| 1 367 |
| 357 |
| 378 |
| 15 |
| 0 |
| 2 117 |
| (52 | ) | 2 065 |
|
Gross margin % |
| 31.1 | % | 52.7 | % | 98.7 | % | 5.7 | % |
|
| 37.2 | % |
|
| 36.3 | % |
Research and development expenses |
| (746 | ) | (117 | ) | (30 | ) | (85 | ) | 0 |
| (978 | ) | (147 | ) | (1 126 | ) |
Selling, general and administrative expenses |
| (474 | ) | (100 | ) | (25 | ) | (70 | ) | 0 |
| (669 | ) | (95 | ) | (763 | ) |
Other operating income and expenses |
| (28 | ) | (3 | ) | 0 |
| 11 |
| 0 |
| (20 | ) | (214 | ) | (234 | ) |
Operating profit/(loss) |
| 119 |
| 137 |
| 324 |
| (129 | ) | 0 |
| 451 |
| (508 | ) | (57 | ) |
Operating margin % |
| 2.7 | % | 20.2 | % | 84.6 | % | (49.0 | )% |
|
| 7.9 | % |
|
| (1.0 | )% |
Depreciation and amortization |
| (141 | ) | (21 | ) | (7 | ) | (13 | ) | 0 |
| (183 | ) | (230 | ) | (413 | ) |
Share of results of associated companies and joint ventures |
| (6 | ) | 0 |
| 0 |
| 0 |
| 0 |
| (6 | ) | 0 |
| (6 | ) |
EBITDA |
| 254 |
| 159 |
| 331 |
| (117 | ) | 0 |
| 627 |
| (278 | ) | 349 |
|
(1) Mobile Access net sales of EUR 2 824 million, Fixed Access net sales of EUR 447 million, IP Routing net sales of EUR 715 million and Optical Networks net sales of EUR 407 million.
Q1-Q2’20
EUR million |
| Networks(1) |
| Nokia |
| Nokia |
| Group |
| Eliminations |
| Non-IFRS |
| Non-IFRS |
| Nokia Total |
|
Net sales |
| 7 713 |
| 1 210 |
| 689 |
| 415 |
| (20 | ) | 10 007 |
| (1 | ) | 10 005 |
|
Cost of sales |
| (5 160 | ) | (601 | ) | (4 | ) | (457 | ) | 20 |
| (6 203 | ) | (19 | ) | (6 222 | ) |
Gross profit |
| 2 552 |
| 609 |
| 684 |
| (42 | ) | 0 |
| 3 804 |
| (20 | ) | 3 784 |
|
Gross margin % |
| 33.1 | % | 50.3 | % | 99.3 | % | (10.1 | )% |
|
| 38.0 | % |
|
| 37.8 | % |
Research and development expenses |
| (1 459 | ) | (238 | ) | (72 | ) | (159 | ) | 0 |
| (1 928 | ) | (28 | ) | (1 956 | ) |
Selling, general and administrative expenses |
| (896 | ) | (202 | ) | (40 | ) | (124 | ) | 0 |
| (1 262 | ) | (180 | ) | (1 442 | ) |
Other operating income and expenses |
| (29 | ) | (11 | ) | (1 | ) | (36 | ) | 0 |
| (75 | ) | (217 | ) | (292 | ) |
Operating profit/(loss) |
| 169 |
| 159 |
| 572 |
| (361 | ) | 0 |
| 539 |
| (445 | ) | 94 |
|
Operating margin % |
| 2.2 | % | 13.1 | % | 83.0 | % | (87.0 | )% |
|
| 5.4 | % |
|
| 0.9 | % |
Depreciation and amortization |
| (281 | ) | (42 | ) | (16 | ) | (28 | ) | 0 |
| (367 | ) | (207 | ) | (574 | ) |
Share of results of associated companies and joint ventures |
| 3 |
| 0 |
| 0 |
| 0 |
| 0 |
| 3 |
| 0 |
| 3 |
|
EBITDA |
| 453 |
| 201 |
| 588 |
| (333 | ) | 0 |
| 909 |
| (238 | ) | 671 |
|
(1) Mobile Access net sales of EUR 4 926 million, Fixed Access net sales of EUR 789 million, IP Routing net sales of EUR 1 241 million and Optical Networks net sales of EUR 758 million.
Q1-Q2’19
EUR million |
| Networks(1) |
| Nokia |
| Nokia |
| Group |
| Eliminations |
| Non-IFRS |
| Non-IFRS |
| Nokia Total |
|
Net sales |
| 8 336 |
| 1 221 |
| 753 |
| 484 |
| (41 | ) | 10 753 |
| (27 | ) | 10 726 |
|
Cost of sales |
| (5 908 | ) | (644 | ) | (18 | ) | (465 | ) | 41 |
| (6 995 | ) | (86 | ) | (7 080 | ) |
Gross profit |
| 2 428 |
| 576 |
| 735 |
| 18 |
| 0 |
| 3 758 |
| (113 | ) | 3 646 |
|
Gross margin % |
| 29.1 | % | 47.2 | % | 97.6 | % | 3.7 | % |
|
| 34.9 | % |
|
| 34.0 | % |
Research and development expenses |
| (1 525 | ) | (236 | ) | (59 | ) | (168 | ) | 0 |
| (1 987 | ) | (295 | ) | (2 282 | ) |
Selling, general and administrative expenses |
| (992 | ) | (201 | ) | (50 | ) | (134 | ) | 0 |
| (1 377 | ) | (210 | ) | (1 587 | ) |
Other operating income and expenses |
| (46 | ) | (10 | ) | (1 | ) | 54 |
| 0 |
| (3 | ) | (355 | ) | (358 | ) |
Operating (loss)/profit |
| (135 | ) | 130 |
| 626 |
| (230 | ) | 0 |
| 391 |
| (972 | ) | (581 | ) |
Operating margin % |
| (1.6 | )% | 10.6 | % | 83.1 | % | (47.5 | )% |
|
| 3.6 | % |
|
| (5.4 | )% |
Depreciation and amortization |
| (279 | ) | (41 | ) | (15 | ) | (25 | ) | 0 |
| (361 | ) | (460 | ) | (820 | ) |
Share of results of associated companies and joint ventures |
| (11 | ) | 0 |
| 0 |
| 0 |
| 0 |
| (11 | ) | 0 |
| (11 | ) |
EBITDA |
| 133 |
| 171 |
| 641 |
| (204 | ) | 0 |
| 741 |
| (513 | ) | 228 |
|
(1) Mobile Access net sales of EUR 5 297 million, Fixed Access net sales of EUR 872 million, IP Routing net sales of EUR 1 360 million and Optical Networks net sales of EUR 807 million.
4. NET SALES
Net sales by geographic area
EUR million |
| Q2’20 |
| Q2’19 |
| YoY change |
| Q1-Q2’20 |
| Q1-Q2’19 |
| YoY change |
|
Asia-Pacific |
| 877 |
| 1 012 |
| (13 | )% | 1 833 |
| 1 975 |
| (7 | )% |
Europe |
| 1 585 |
| 1 611 |
| (2 | )% | 3 035 |
| 3 111 |
| (2 | )% |
Greater China |
| 302 |
| 515 |
| (41 | )% | 610 |
| 949 |
| (36 | )% |
Latin America |
| 212 |
| 359 |
| (41 | )% | 497 |
| 664 |
| (25 | )% |
Middle East & Africa |
| 400 |
| 441 |
| (9 | )% | 852 |
| 855 |
| 0 | % |
North America |
| 1 717 |
| 1 755 |
| (2 | )% | 3 179 |
| 3 172 |
| 0 | % |
Total |
| 5 092 |
| 5 694 |
| (11 | )% | 10 005 |
| 10 726 |
| (7 | )% |
Net sales by customer type
EUR million |
| Q2’20 |
| Q2’19 |
| YoY change |
| Q1-Q2’20 |
| Q1-Q2’19 |
| YoY change |
|
Communication service providers |
| 4 180 |
| 4 755 |
| (12 | )% | 8 245 |
| 8 962 |
| (8 | )% |
Enterprise |
| 376 |
| 318 |
| 18 | % | 687 |
| 577 |
| 19 | % |
Licensees |
| 341 |
| 383 |
| (11 | )% | 689 |
| 753 |
| (8 | )% |
Other(1) |
| 195 |
| 238 |
| (18 | )% | 384 |
| 433 |
| (11 | )% |
Total |
| 5 092 |
| 5 694 |
| (11 | )% | 10 005 |
| 10 726 |
| (7 | )% |
(1) Includes net sales of Alcatel Submarine Networks (ASN) and Radio Frequency Systems (RFS), both of which are being managed as separate entities, and certain other items, such as eliminations of inter-segment revenues and certain items related to purchase price allocation. ASN and RFS net sales include also revenue from communication service providers and enterprise customers.
5. PENSIONS AND OTHER POST-EMPLOYMENT BENEFITS
Nokia operates a number of post-employment plans in various countries including both defined contribution and defined benefit plans. Defined benefit plans include pension plans and other post-employment benefit plans, providing retirement healthcare benefits and life insurance coverage. 96% of Nokia’s defined benefit liability and 98% of assets were remeasured as of June 30, 2020. Nokia’s pension and Opeb plans in the United States have been remeasured by an external actuary and the main pension plans outside of the United States have been remeasured based upon updated asset valuations and changes in the discount rates during the reporting period. The impact of not remeasuring other pension and post-employment plans is considered not material. As of June 30, 2020, the weighted average discount rates used in remeasurement of the most significant plans were as follows (comparatives as of December 31, 2019): U.S. Pension 2.10 % (2.83 %), U.S. Opeb 2.08 % (2.82 %), Germany 0.75 % (0.78 %) and U.K. 1.40 % (1.92 %).
The funded status of Nokia’s defined benefit plans (before the effect of the asset ceiling) declined from EUR 2 082 million, or 108.4 %, as of March 31, 2020 to EUR 1 443 million, or 105.7% as of June 30, 2020. The actuarial gains recognized in the first quarter of 2020 driven by increases in discount rates and positive asset returns were more than offset in the second quarter by a sharp decline in discount rates partially offset by positive asset returns. As of June 30, 2020, the global defined benefit plan asset portfolio was invested approximately 78% in fixed income, 4% in equities and 18% in other asset classes, mainly private equity and real estate. The valuation of private equity assets has a higher degree of uncertainty related to unobservable inputs in the current market conditions caused by COVID-19 outbreak and the monetary and fiscal measures taken to support the global economy. As a result, fair values of private equity assets may fluctuate in future quarters.
Change in pension and post-retirement net asset/(liability)
|
| June 30, 2020 |
| June 30, 2019 |
| December 31, 2019 |
| ||||||||||||
EUR million |
| Pensions(1) |
| US Opeb |
| Total |
| Pensions(1) |
| US Opeb |
| Total |
| Pensions(1) |
| US Opeb |
| Total |
|
Net asset/(liability) recognized at January 1 |
| 2 348 |
| (1 861 | ) | 487 |
| 1 884 |
| (1 987 | ) | (103 | ) | 1 884 |
| (1 987 | ) | (103 | ) |
Recognized in income statement |
| (87 | ) | (26 | ) | (113 | ) | (63 | ) | (37 | ) | (100 | ) | (130 | ) | 99 |
| (31 | ) |
Recognized in other comprehensive income |
| 96 |
| (122 | ) | (26 | ) | (107 | ) | (137 | ) | (244 | ) | 514 |
| (100 | ) | 414 |
|
Contributions and benefits paid |
| 82 |
| (4 | ) | 78 |
| 94 |
| 3 |
| 97 |
| 187 |
| 14 |
| 201 |
|
Exchange differences and other movements(2) |
| (19 | ) | (9 | ) | (28 | ) | 11 |
| (16 | ) | (5 | ) | (107 | ) | 113 |
| 6 |
|
Net asset/(liability) recognized at the end of the period |
| 2 420 |
| (2 022 | ) | 398 |
| 1 819 |
| (2 174 | ) | (355 | ) | 2 348 |
| (1 861 | ) | 487 |
|
(1) Includes pensions, retirement indemnities and other post-employment plans.
(2) Includes Section 420 transfers, medicare subsidies, and other transfers.
Funded status
EUR million |
| June 30, |
| March 31, |
| December 31, |
| September 30, |
| June 30, |
|
Defined benefit obligation |
| (25 499 | ) | (24 913 | ) | (24 663 | ) | (26 795 | ) | (25 455 | ) |
Fair value of plan assets |
| 26 942 |
| 26 995 |
| 26 180 |
| 27 241 |
| 25 772 |
|
Funded status |
| 1 443 |
| 2 082 |
| 1 517 |
| 446 |
| 317 |
|
Impact of the asset ceiling |
| (1 045 | ) | (1 042 | ) | (1 030 | ) | (862 | ) | (672 | ) |
Net asset/(liability) recognized at the end of the period |
| 398 |
| 1 040 |
| 487 |
| (416 | ) | (355 | ) |
6. DEFERRED TAXES
At June 30, 2020, Nokia has recognized deferred tax assets of EUR 5.0 billion (EUR 5.1 billion at December 31, 2019), majority of which relate to unused tax losses, unused tax credits and deductible temporary differences in Finland (EUR 2.8 billion) and the United States (EUR 1.1 billion).
Nokia continually evaluates the probability of utilizing its deferred tax assets. As it relates to Finland, Nokia has considered the following favorable and unfavorable factors in its assessment:
· The recent years’ cumulative profitability in Finland, excluding certain integration costs related to the acquisition of Alcatel Lucent, which are considered as non-recurring in nature,
· The historical and expected future positive impact on Finnish taxable income from the Nokia Technologies business,
· The risks and investments related to 5G roll-out and risks related to COVID-19, and
· The relevant attributes underlying the deferred tax assets are generally not subject to expiry.
Based on its assessment, Nokia has concluded that it is probable that it will be able to utilize the unused tax losses, unused tax credits and deductible temporary differences in Finland. Nokia will continue to monitor the above factors, including in particular its actual profit record, in the upcoming periods and it is possible that later assessments in respect of the utilization of Finnish deferred tax assets may differ from the current conclusion. We considered the risks and uncertainties related to COVID-19 in our assessment in the second quarter of 2020, however, should the risks and uncertainties related to the scope and duration of the COVID-19 impact be more significant or the pace and shape of the economic recovery following the pandemic be slower than expected, we may be required to reassess this conclusion.
As it relates to the United States, Nokia has an established pattern of sufficient profitability to conclude that it is probable that it will be able to utilize the deferred tax assets.
At June 30, 2020, Nokia has unrecognized deferred tax assets of approximately EUR 5 billion (EUR 5 billion at December 31, 2019), the majority of which relate to France (approximately EUR 4 billion). These deferred tax assets have not been recognized due to uncertainty regarding their utilization. A significant portion of the French unrecognized deferred tax assets are indefinite in nature and available against future French tax liabilities, subject to a limitation of 50% of annual taxable profits.
7. CASH POSITION AND FREE CASH FLOW
Net cash and current financial investments
EUR million |
| June 30, 2020 |
| March 31, 2020 |
| December 31, |
| September 30, |
| June 30, 2019 |
|
Current financial investments |
| 399 |
| 156 |
| 97 |
| 103 |
| 95 |
|
Cash and cash equivalents |
| 7 088 |
| 6 159 |
| 5 910 |
| 4 721 |
| 4 693 |
|
Total cash and current financial investments |
| 7 487 |
| 6 315 |
| 6 007 |
| 4 824 |
| 4 788 |
|
Long-term interest-bearing liabilities(1) |
| 5 181 |
| 4 157 |
| 3 985 |
| 4 063 |
| 3 949 |
|
Short-term interest-bearing liabilities(1) |
| 756 |
| 838 |
| 292 |
| 417 |
| 337 |
|
Total interest-bearing liabilities |
| 5 937 |
| 4 995 |
| 4 277 |
| 4 480 |
| 4 286 |
|
Net cash and current financial investments |
| 1 550 |
| 1 320 |
| 1 730 |
| 344 |
| 502 |
|
(1) Lease liabilities are not included in interest-bearing liabilities.
Free cash flow
EUR million |
| Q2’20 |
| Q2’19 |
| Q1-Q2’20 |
| Q1-Q2’19 |
|
Net cash from/(used in) operating activities |
| 333 |
| (916 | ) | 467 |
| (1 663 | ) |
Purchase of property, plant and equipment and intangible assets |
| (89 | ) | (131 | ) | (243 | ) | (306 | ) |
Proceeds from sale of property, plant and equipment and intangible assets |
| 1 |
| 11 |
| 2 |
| 11 |
|
Purchase of non-current financial investments |
| (14 | ) | (57 | ) | (24 | ) | (77 | ) |
Proceeds from sale of non-current financial investments |
| 34 |
| 52 |
| 57 |
| 81 |
|
Free cash flow |
| 265 |
| (1 041 | ) | 259 |
| (1 954 | ) |
8. FAIR VALUE OF FINANCIAL INSTRUMENTS
Financial assets and liabilities recorded at fair value are categorized based on the amount of unobservable inputs used to measure their fair value. Three hierarchical levels are based on an increasing amount of judgment associated with the inputs used to derive fair valuation for these assets and liabilities; Level 1 being market values for exchange traded products, Level 2 being primarily based on quotes from third-party pricing services and Level 3 requiring most management judgment. For more information about the valuation methods and principles, refer to note 2, “Significant accounting policies” and note 24, “Fair value of financial instruments”, of our Annual Report for 2019. Items carried at fair value in the following table are measured at fair value on a recurring basis.
|
| Carrying amounts |
| Fair value |
| ||||||||||||||
|
|
|
|
|
|
|
|
|
| Fair value through other |
|
|
|
|
| ||||
EUR million |
|
|
| Fair value through profit or loss |
| comprehensive income |
|
|
|
|
| ||||||||
At June 30, 2020 |
| Amortized cost |
| Level 1 |
| Level 2 |
| Level 3 |
| Level 1 |
| Level 2 |
| Level 3 |
| Total |
| Total |
|
Non-current financial investments |
| 0 |
| 0 |
| 0 |
| 682 |
| 0 |
| 0 |
| 0 |
| 682 |
| 682 |
|
Other non-current financial assets |
| 141 |
| 0 |
| 171 |
| 0 |
| 0 |
| 136 |
| 0 |
| 448 |
| 432 |
|
Other current financial assets including derivatives |
| 30 |
| 0 |
| 146 |
| 6 |
| 0 |
| 24 |
| 0 |
| 206 |
| 206 |
|
Trade receivables |
| 0 |
| 0 |
| 0 |
| 0 |
| 0 |
| 4 671 |
| 0 |
| 4 671 |
| 4 671 |
|
Current financial investments |
| 31 |
| 0 |
| 364 |
| 0 |
| 0 |
| 4 |
| 0 |
| 399 |
| 399 |
|
Cash and cash equivalents |
| 4 700 |
| 0 |
| 2 388 |
| 0 |
| 0 |
| 0 |
| 0 |
| 7 088 |
| 7 088 |
|
Total financial assets |
| 4 902 |
| 0 |
| 3 069 |
| 688 |
| 0 |
| 4 835 |
| 0 |
| 13 494 |
| 13 478 |
|
Long-term interest-bearing liabilities |
| 5 181 |
| 0 |
| 0 |
| 0 |
| 0 |
| 0 |
| 0 |
| 5 181 |
| 5 119 |
|
Other long-term financial liabilities |
| 0 |
| 0 |
| 10 |
| 15 |
| 0 |
| 0 |
| 0 |
| 25 |
| 25 |
|
Short-term interest-bearing liabilities |
| 756 |
| 0 |
| 0 |
| 0 |
| 0 |
| 0 |
| 0 |
| 756 |
| 757 |
|
Other short-term financial liabilities including derivatives |
| 0 |
| 0 |
| 163 |
| 600 |
| 0 |
| 0 |
| 0 |
| 763 |
| 763 |
|
Trade payables |
| 3 255 |
| 0 |
| 0 |
| 0 |
| 0 |
| 0 |
| 0 |
| 3 255 |
| 3 255 |
|
Total financial liabilities |
| 9 192 |
| 0 |
| 173 |
| 615 |
| 0 |
| 0 |
| 0 |
| 9 980 |
| 9 919 |
|
|
| Carrying amounts |
| Fair value |
| ||||||||||||||
|
|
|
|
|
|
|
|
|
| Fair value through other |
|
|
|
|
| ||||
EUR million |
|
|
| Fair value through profit or loss |
| comprehensive income |
|
|
|
|
| ||||||||
At December 31, 2019 |
| Amortized cost |
| Level 1 |
| Level 2 |
| Level 3 |
| Level 1 |
| Level 2 |
| Level 3 |
| Total |
| Total |
|
Non-current financial investments |
| 0 |
| 0 |
| 0 |
| 740 |
| 0 |
| 0 |
| 0 |
| 740 |
| 740 |
|
Other non-current financial assets |
| 165 |
| 0 |
| 171 |
| 6 |
| 0 |
| 103 |
| 0 |
| 445 |
| 430 |
|
Other current financial assets including derivatives |
| 46 |
| 0 |
| 81 |
| 0 |
| 0 |
| 37 |
| 0 |
| 164 |
| 164 |
|
Trade receivables |
| 0 |
| 0 |
| 0 |
| 0 |
| 0 |
| 5 025 |
| 0 |
| 5 025 |
| 5 025 |
|
Current financial investments |
| 42 |
| 0 |
| 51 |
| 0 |
| 0 |
| 4 |
| 0 |
| 97 |
| 97 |
|
Cash and cash equivalents |
| 4 090 |
| 0 |
| 1 820 |
| 0 |
| 0 |
| 0 |
| 0 |
| 5 910 |
| 5 910 |
|
Total financial assets |
| 4 343 |
| 0 |
| 2 123 |
| 746 |
| 0 |
| 5 169 |
| 0 |
| 12 381 |
| 12 366 |
|
Long-term interest-bearing liabilities |
| 3 985 |
| 0 |
| 0 |
| 0 |
| 0 |
| 0 |
| 0 |
| 3 985 |
| 4 056 |
|
Other long-term financial liabilities |
| 0 |
| 0 |
| 10 |
| 20 |
| 0 |
| 0 |
| 0 |
| 30 |
| 30 |
|
Short-term interest-bearing liabilities |
| 292 |
| 0 |
| 0 |
| 0 |
| 0 |
| 0 |
| 0 |
| 292 |
| 292 |
|
Other short-term financial liabilities including derivatives |
| 0 |
| 0 |
| 164 |
| 639 |
| 0 |
| 0 |
| 0 |
| 803 |
| 803 |
|
Trade payables |
| 3 786 |
| 0 |
| 0 |
| 0 |
| 0 |
| 0 |
| 0 |
| 3 786 |
| 3 786 |
|
Total financial liabilities |
| 8 063 |
| 0 |
| 174 |
| 659 |
| 0 |
| 0 |
| 0 |
| 8 896 |
| 8 967 |
|
Lease liabilities are not included in the fair value of financial instruments.
Level 3 Financial assets include a large number of investments in unlisted equities and unlisted venture funds, including investments managed by NGP Capital specializing in growth-stage investing. The fair value of level 3 investments is determined using one or more valuation techniques with unobservable inputs, where the use of the market approach generally consists of using comparable market transactions, while the use of the income approach generally consists of calculating the net present value of expected future cash flows. At June 30, 2020, the fair valuation of venture fund investments continues to have a higher degree of uncertainty related to unobservable inputs in the current market conditions caused by COVID-19 outbreak. As a result, fair values of venture fund investments may fluctuate significantly in future quarters.
Level 3 Financial liabilities include a conditional obligation to China Huaxin related to Nokia Shanghai Bell.
Reconciliation of the opening and closing balances on level 3 financial assets and liabilities:
EURm |
| Level 3 Financial |
| Level 3 |
|
Balance at December 31, 2019 |
| 746 |
| (659 | ) |
Net (losses)/gains in income statement |
| (40 | ) | 44 |
|
Additions |
| 23 |
| 0 |
|
Deductions |
| (42 | ) | 0 |
|
Other movements |
| 1 |
| 0 |
|
Balance at June 30, 2020 |
| 688 |
| (615 | ) |
The gains and losses from venture fund and similar investments categorized in level 3 are included in other operating income and expenses. The gains and losses from other level 3 financial assets and liabilities are recorded in financial income and expenses. A net loss of EUR 9 million (net gain of EUR 73 million in 2019) related to level 3 financial instruments held at June 30, 2020, was included in the profit and loss during 2020.
9. PROVISIONS
EUR million |
| Restructuring |
| Divestment |
| Warranty |
| Project losses |
| Litigation |
| Environmental |
| Material |
| Other(1) |
| Total |
|
At January 1, 2020 |
| 377 |
| 51 |
| 167 |
| 50 |
| 75 |
| 127 |
| 81 |
| 281 |
| 1 209 |
|
Translation differences |
| 0 |
| 0 |
| 0 |
| 0 |
| (5 | ) | 1 |
| 0 |
| (18 | ) | (22 | ) |
Reclassification |
| 0 |
| 0 |
| 0 |
| 0 |
| 0 |
| 0 |
| 0 |
| 7 |
| 7 |
|
Charged to income statement |
| 177 |
| (2 | ) | 51 |
| (2 | ) | 9 |
| 6 |
| 45 |
| 18 |
| 302 |
|
Additional provisions |
| 197 |
| 0 |
| 67 |
| 5 |
| 12 |
| 6 |
| 74 |
| 38 |
| 399 |
|
Changes in estimates |
| (20 | ) | (2 | ) | (16 | ) | (7 | ) | (3 | ) | 0 |
| (29 | ) | (20 | ) | (97 | ) |
Utilized during period(2) |
| (189 | ) | 0 |
| (51 | ) | (1 | ) | (10 | ) | (11 | ) | (19 | ) | (8 | ) | (289 | ) |
At June 30, 2020 |
| 365 |
| 49 |
| 167 |
| 47 |
| 69 |
| 123 |
| 107 |
| 280 |
| 1 207 |
|
(1)Other provisions include provisions for various obligations such as indirect tax provisions, employee-related provisions other than restructuring provisions and asset retirement obligations.
(2)The utilization of restructuring provision includes items transferred to accrued expenses, of which EUR 72 million remained in accrued expenses as of June 30, 2020.
10. INTEREST-BEARING LIABILITIES
|
|
|
|
|
| Nominal |
|
|
| Carrying amount (EUR million) |
| ||||
Issuer/Borrower |
| Instrument |
| Currency |
| (million) |
| Final maturity |
| June 30, 2020 |
| June 30, 2019 |
| December 31, 2019 |
|
Nokia Corporation |
| 1.00 % Senior Notes(1) |
| EUR |
| 350 |
| March 2021 |
| 350 |
| 499 |
| 499 |
|
Nokia Corporation |
| 3.375% Senior Notes |
| USD |
| 500 |
| June 2022 |
| 459 |
| 438 |
| 445 |
|
Nokia Corporation |
| 2.00% Senior Notes |
| EUR |
| 750 |
| March 2024 |
| 764 |
| 768 |
| 766 |
|
Nokia Corporation |
| EIB R&D Loan(2) |
| EUR |
| 500 |
| February 2025 |
| 500 |
| 0 |
| 0 |
|
Nokia Corporation |
| NIB R&D Loan(3) |
| EUR |
| 250 |
| May 2025 |
| 250 |
| 250 |
| 250 |
|
Nokia Corporation |
| 2.375% Senior Notes(1) |
| EUR |
| 500 |
| May 2025 |
| 496 |
| 0 |
| 0 |
|
Nokia Corporation |
| 2.00% Senior Notes |
| EUR |
| 750 |
| March 2026 |
| 763 |
| 766 |
| 765 |
|
Nokia Corporation |
| 4.375% Senior Notes |
| USD |
| 500 |
| June 2027 |
| 492 |
| 444 |
| 452 |
|
Nokia of America Corporation |
| 6.50% Senior Notes |
| USD |
| 74 |
| January 2028 |
| 66 |
| 65 |
| 66 |
|
Nokia Corporation |
| 3.125% Senior Notes(1) |
| EUR |
| 500 |
| May 2028 |
| 497 |
| 0 |
| 0 |
|
Nokia of America Corporation |
| 6.45% Senior Notes |
| USD |
| 206 |
| March 2029 |
| 186 |
| 183 |
| 185 |
|
Nokia Corporation |
| 6.625% Senior Notes |
| USD |
| 500 |
| May 2039 |
| 596 |
| 497 |
| 517 |
|
Nokia Corporation and various subsidiaries |
| Other liabilities |
|
|
|
|
|
|
| 518 |
| 376 |
| 332 |
|
Total |
|
|
|
|
|
|
|
|
| 5 937 |
| 4 286 |
| 4 277 |
|
(1)Nokia issued EUR 500 million 2.375% Senior Notes due 2025 and EUR 500 million 3.125% Senior Notes due 2028 under its EUR 5 billion Euro Medium-Term Note Programme in May 2020. The proceeds of the new notes were partially used to redeem EUR 150 million of the 1.00% Senior Notes due 2021.
(2)Nokia drew EUR 500 million loan from the European Investment Bank (EIB) in February 2020.
(3)The loan from the Nordic Investment Bank (NIB) is repayable in three equal annual installments in 2023, 2024 and 2025.
Significant credit facilities and funding programs:
|
|
|
|
|
|
|
| Utilized |
| ||||
Committed / Uncommited |
| Financing arrangement |
| Currency |
| Nominal (million) |
| June 30, 2020 |
| June 30, 2019 |
| December 31, |
|
Committed |
| Revolving Credit Facility(1) |
| EUR |
| 1 500 |
| 0 |
| 0 |
| 0 |
|
Uncommitted |
| Finnish Commercial Paper Programme |
| EUR |
| 750 |
| 20 |
| 0 |
| 0 |
|
Uncommitted |
| Euro Medium Term Note Programme(2) |
| EUR |
| 5 000 |
| 2 850 |
| 2 000 |
| 2 000 |
|
(1)Nokia exercised its option to extend the maturity date of the Revolving Credit Facility in June 2020. Subsequent to the extension, the facility has its maturity in June 2025 with a one-year extension option remaining, except for EUR 88 million having its maturity in June 2024.
(2)All euro-denominated bonds have been issued under the Euro Medium Term Note Programme.
All borrowings and credit facilities presented in the tables above are senior unsecured and have no financial covenants.
11. COMMITMENTS AND CONTINGENCIES
EUR million |
| June 30, 2020 |
| June 30, 2019 |
| December 31, 2019 |
|
Contingent liabilities on behalf of Group companies |
|
|
|
|
|
|
|
Guarantees issued by financial institutions |
|
|
|
|
|
|
|
Commercial guarantees(1) |
| 1 224 |
| 1 123 |
| 1 190 |
|
Non-commercial guarantees |
| 445 |
| 525 |
| 531 |
|
Corporate guarantees(2) |
|
|
|
|
|
|
|
Commercial guarantees(1) |
| 910 |
| 1 033 |
| 969 |
|
Non-commercial guarantees |
| 57 |
| 351 |
| 54 |
|
Financing commitments |
|
|
|
|
|
|
|
Customer finance commitments |
| 235 |
| 362 |
| 303 |
|
Venture fund commitments |
| 231 |
| 270 |
| 244 |
|
Other contingent liabilities and financing commitments(3) |
|
|
|
|
|
|
|
Other guarantees and financing commitments |
| 18 |
| 45 |
| 15 |
|
(1)In commercial guarantees, Nokia reports guarantees that are issued in the normal course of business to Nokia’s customers for the performance of Nokia’s obligations under supply agreements, including tender bonds, performance bonds and warranty bonds.
(2)In corporate guarantees, Nokia reports guarantees with primary obligation that have been issued to Nokia’s customers and other third parties.
(3)Other contingent liabilities and financing commitments exclude committed lease contracts that have not yet commenced and purchase obligations. Refer to note 30, Commitments and contingencies, of our Annual Report for 2019.
The amounts in the table above represent the maximum principal amount of commitments and contingencies, and these amounts do not reflect management’s expected outcomes.
12. PERFORMANCE MEASURES
In the reporting of financial information, Nokia has adopted various performance measures of historical or future financial performance, position or cash flows other than those defined or specified under International Financial Reporting Standards (IFRS). These measures are not defined by IFRS and therefore may not be directly comparable with financial measures used by other companies, including those in Nokia’s industry. The following table provides summarized information on the performance measures included in this interim report.
Performance measure |
| Definition |
| Purpose |
Key performance measures |
|
|
|
|
Non-IFRS measures |
| Non-IFRS measures exclude costs related to the acquisition of Alcatel-Lucent and related integration, goodwill impairment charges, intangible asset amortization and other purchase price fair value adjustments, restructuring and associated charges and certain other items that may not be indicative of Nokia’s underlying business performance. Refer to note 2, “Non-IFRS to reported reconciliation”. |
| We believe that our non-IFRS results provide meaningful supplemental information to both management and investors regarding Nokia’s underlying business performance by excluding the non-IFRS items that may not be indicative of Nokia’s business operating results. Non-IFRS operating profit is used in determining management remuneration. |
Constant currency measures |
| When financial measures are reported on a constant currency basis, exchange rates used to translate the amounts in local currencies to euro, our reporting currency, are the average actual periodic exchange rates for the comparative financial period. Therefore, the constant currency measures exclude the impact of changes in exchange rates during the current period in comparison to euro. |
| We provide additional information on a constant currency basis in order to better reflect the underlying business performance. |
Other performance measures |
|
|
|
|
Recurring/One-time measures |
| Recurring measures, such as recurring net sales, are based on revenues that are likely to continue in the future. Recurring measures exclude e.g. the impact of catch-up net sales relating to prior periods. One-time measures, such as one-time net sales, reflect the revenues that are not likely to continue in the future. |
| We use recurring/one-time measures to improve comparability between financial periods. |
Total cash and current financial investments (“Total cash”) |
| Total cash and current financial investments consist of cash and cash equivalents and current financial investments. |
| Total cash and current financial investments is used to indicate funds available to Nokia to run its current and invest in future business activities as well as provide return for security holders. |
Net cash and current financial investments (“Net cash”) |
| Net cash and current financial investments equals total cash and current financial investments less long-term and short-term interest-bearing liabilities. Lease liabilities are not included in interest-bearing liabilities. Refer to note 7, “Cash position and free cash flow”. |
| Net cash and current financial investments is used to indicate Nokia’s liquidity position after cash required to settle the interest-bearing liabilities. |
EBITDA |
| Operating profit/(loss) before depreciations and amortizations and adjusted for share of results of associated companies and joint ventures. |
| We use EBITDA as a measure of Nokia’s operating performance. |
Adjusted profit/(loss) |
| Adjusted profit/(loss) equals the cash from operations before changes in net working capital subtotal in the consolidated statement of cash flows. |
| We use adjusted profit/(loss) to provide a structured presentation when describing the cash flows. |
Free cash flow |
| Net cash from/(used in) operating activities - purchases of property, plant and equipment and intangible assets (capital expenditures) + proceeds from sale of property, plant and equipment and intangible assets — purchase of non-current financial investments + proceeds from sale of non-current financial investments. Refer to note 7, “Cash position and free cash flow”. |
| Free cash flow is the cash that Nokia generates after net investments to tangible, intangible and non-current financial investments and it represents the cash available for distribution among its security holders. It is a measure of cash generation, working capital efficiency and capital discipline of the business. |
Capital expenditure |
| Purchases of property, plant and equipment and intangible assets (excluding assets acquired under business combinations). |
| We use capital expenditure to describe investments in profit generating activities in the future. |
Recurring annual cost savings |
| Reduction in cost of sales and operating expenses resulting from the cost savings program and the impact of which is considered recurring in nature. |
| We use recurring annual cost savings measure to monitor the progress of our cost savings program established after the Alcatel-Lucent transaction against plan. |
Restructuring and associated charges, liabilities and cash outflows |
| Charges, liabilities and cash outflows related to activities that either meet the strict definition of restructuring under IFRS or are closely associated with such activities. |
| We use restructuring and associated charges, liabilities and cash outflows to measure the progress of our integration and transformation activities. |
Charges and cash outflows related to network equipment swaps |
| Charges and cash outflows related to product portfolio integration for key customers. |
| We use charges and cash outflows related to network equipment swaps to measure the progress of our integration and transformation activities. |
Risks and forward-looking statements
It should be noted that Nokia and its businesses are exposed to various risks and uncertainties and certain statements herein that are not historical facts are forward-looking statements. These forward-looking statements reflect Nokia’s current expectations and views of future developments and include statements regarding: A) expectations, plans or benefits related to our strategies, growth management and operational key performance indicators; B) expectations, plans or benefits related to future performance of our businesses (including the expected impact and timing of that impact of COVID-19 on our businesses and our customers’ businesses) and any expected future dividends including timing and qualitative and quantitative thresholds associated therewith; C) expectations and targets regarding financial performance, cash generation, results, the timing of receivables, operating expenses, taxes, currency exchange rates, hedging, cost savings, product cost reductions and competitiveness, as well as results of operations including targeted synergies, better commercial management and those results related to market share, prices, net sales, income and margins; D) expectations, plans or benefits related to changes in organizational and operational structure; E) expectations regarding competition within our market, market developments, general economic conditions and structural and legal change globally and in national and regional markets, such as China; F) our ability to integrate acquired businesses into our operations and achieve the targeted business plans and benefits, including targeted benefits, synergies, cost savings and efficiencies; G) expectations, plans or benefits related to any future collaboration or to business collaboration agreements or patent license agreements or arbitration awards, including income to be received under any collaboration or partnership, agreement or award; H) timing of the deliveries of our products and services, including our short term and longer term expectations around the rollout of 5G, investment requirements with such rollout, and our ability to capitalize on such rollout; as well as the overall readiness of the 5G ecosystem; I) expectations and targets regarding collaboration and partnering arrangements, joint ventures or the creation of joint ventures, and the related administrative, legal, regulatory and other conditions, as well as our expected customer reach; J) outcome of pending and threatened litigation, arbitration, disputes, regulatory proceedings or investigations by authorities; K) expectations regarding restructurings, investments, capital structure optimization efforts, uses of proceeds from transactions, acquisitions and divestments and our ability to achieve the financial and operational targets set in connection with any such restructurings, investments, capital structure optimization efforts, divestments and acquisitions, including our current cost savings program; L) expectations, plans or benefits related to future capital expenditures, reduction of support function costs, temporary incremental expenditures or other R&D expenditures to develop or rollout software and other new products, including 5G and increased digitalization; M) expectations regarding our customers’ future actions, including our customers’ capital expenditure constraints and our ability to satisfy customer’s needs and retain their business; and N) statements preceded by or including “believe”, “expect”, “expectations”, “consistent”, “deliver”, “maintain”, “strengthen”, “target”, “estimate”, “plan”, “intend”, “assumption”, “focus”, “continue”, “should”, “will” or similar expressions. These forward-looking statements are subject to a number of risks and uncertainties, many of which are beyond our control, which could cause our actual results to differ materially from such statements. These statements are based on management’s best assumptions and beliefs in light of the information currently available to them. These forward-looking statements are only predictions based upon our current expectations and views of future events and developments and are subject to risks and uncertainties that are difficult to predict because they relate to events and depend on circumstances that will occur in the future. Factors, including risks and uncertainties that could cause these differences include, but are not limited to: 1) our strategy is subject to various risks and uncertainties and we may be unable to successfully implement our strategic plans, sustain or improve the operational and financial performance of our business groups, correctly identify or successfully pursue business opportunities or otherwise grow our business; 2) general economic and market conditions, general public health conditions (including its impact on our supply chains) and other developments in the economies where we operate, including the timeline for the deployment of 5G and our ability to successfully capitalize on that deployment ; 3) competition and our ability to effectively and profitably invest in existing and new high-quality products, services, upgrades and technologies and bring them to market in a timely manner; 4) our dependence on the development of the industries in which we operate, including the cyclicality and variability of the information technology and telecommunications industries and our own R&D capabilities and investments; 5) our dependence on a limited number of customers and large multi-year agreements, as well as external events impacting our customers including mergers and acquisitions and the possibility of our customers awarding business to our competitors; 6) our ability to maintain our existing sources of intellectual property-related revenue through our intellectual property, including through licensing, establishing new sources of revenue and protecting our intellectual property from infringement; 7) our ability to manage and improve our financial and operating performance, cost savings, competitiveness and synergies generally, expectations and timing around our ability to recognize any net sales and our ability to implement changes to our organizational and operational structure efficiently; 8) our global business and exposure to regulatory, political or other developments in various countries or regions, including emerging markets and the associated risks in relation to tax matters and exchange controls, among others; 9) our ability to achieve the anticipated benefits, synergies, cost savings and efficiencies of acquisitions; 10) exchange rate fluctuations, as well as hedging activities; 11) our ability to successfully realize the expectations, plans or benefits related to any future collaboration or business collaboration agreements and patent license agreements or arbitration awards, including income to be received under any collaboration, partnership, agreement or arbitration award; 12) Nokia Technologies’ ability to protect its IPR and to maintain and establish new sources of patent, brand and technology licensing income and IPR-related revenues, particularly in the smartphone market, which may not materialize as
planned, 13) our dependence on IPR technologies, including those that we have developed and those that are licensed to us, and the risk of associated IPR-related legal claims, licensing costs and restrictions on use; 14) our exposure to direct and indirect regulation, including economic or trade policies, and the reliability of our governance, internal controls and compliance processes to prevent regulatory penalties in our business or in our joint ventures; 15) our reliance on third-party solutions for data storage and service distribution, which expose us to risks relating to security, regulation and cybersecurity breaches; 16) inefficiencies, breaches, malfunctions or disruptions of information technology systems, or our customers’ security concerns; 17) our exposure to various legal frameworks regulating corruption, fraud, trade policies, and other risk areas, and the possibility of proceedings or investigations that result in fines, penalties or sanctions; 18) adverse developments with respect to customer financing or extended payment terms we provide to customers; 19) the potential complex tax issues, tax disputes and tax obligations we may face in various jurisdictions, including the risk of obligations to pay additional taxes; 20) our actual or anticipated performance, among other factors, which could reduce our ability to utilize deferred tax assets; 21) our ability to retain, motivate, develop and recruit appropriately skilled employees; 22) disruptions to our manufacturing, service creation, delivery, logistics and supply chain processes, and the risks related to our geographically-concentrated production sites; 23) the impact of litigation, arbitration, agreement-related disputes or product liability allegations associated with our business; 24) our ability to re-establish investment grade rating or maintain our credit ratings; 25) our ability to achieve targeted benefits from, or successfully implement planned transactions, as well as the liabilities related thereto; 26) our involvement in joint ventures and jointly-managed companies; 27) the carrying amount of our goodwill may not be recoverable; 28) uncertainty related to the amount of dividends and equity return we are able to distribute to shareholders for each financial period; 29) pension costs, employee fund-related costs, and healthcare costs; 30) our ability to successfully complete and capitalize on our order backlogs and continue converting our sales pipeline into net sales; 31) risks related to undersea infrastructure; and 32) the impact of the COVID-19 virus on the global economy and financial markets as well as our customers, supply chain, product development, service delivery, other operations and our financial, tax, pension and other assets, as well as the risk factors specified in our 2019 annual report on Form 20-F published on March 5, 2020 under “Operating and financial review and prospects-Risk factors” as supplemented by the form 6-K published on April 30, 2020 under the header “Risk Factors” and in our other filings or documents furnished with the U.S. Securities and Exchange Commission. Other unknown or unpredictable factors or underlying assumptions subsequently proven to be incorrect could cause actual results to differ materially from those in the forward-looking statements. We do not undertake any obligation to publicly update or revise forward-looking statements, whether as a result of new information, future events or otherwise, except to the extent legally required.
This financial report was authorized for issue by management on July 31, 2020.
Media and Investor Contacts:
Communications, tel. +358 10 448 4900 email: press.services@nokia.com
Investor Relations, tel. +358 4080 3 4080 email: investor.relations@nokia.com
· Nokia plans to publish its third quarter and January-September 2020 results on October 29, 2020.
SIGNATURE
Pursuant to the requirements of the Securities Exchange Act of 1934, the registrant, Nokia Corporation, has duly caused this report to be signed on its behalf by the undersigned, thereunto duly authorized.
Date: July 31, 2020 |
| Nokia Corporation | |
|
|
| |
|
|
| |
|
| By: | /s/ Esa Niinimäki |
|
| Name: | Esa Niinimäki |
|
| Title: | Deputy Chief Legal Officer, Corporate |