
Table Of Contents
| Page(s) | |||||
| Key Financial Data | |||||
| Operating Portfolio | |||||
| Debt | |||||
| Reconciliations and Additional Details | |||||
Annex 1: Transaction Activity | |||||
Annex 2: Reconciliation of NOI | |||||
Annex 4: Unconsolidated Joint Ventures | |||||
Annex 5: Debt Profile Footnotes | |||||
Annex 6: Multifamily Property Information | |||||
V E R I S R E S I D E N T I A L, I N C.
NEWS RELEASE
For Immediate Release
Veris Residential, Inc.
Reports Fourth Quarter and Full Year 2024 Results
JERSEY CITY, N.J., February 24, 2025 –– Veris Residential, Inc. (NYSE: VRE) (the “Company”), a forward-thinking, Northeast-focused, Class A multifamily REIT, today reported results for the fourth quarter and full year 2024.
| Three Months Ended December 31, | Twelve Months Ended December 31, | |||||||||||||
| 2024 | 2023 | 2024 | 2023 | |||||||||||
| Net Income (loss) per Diluted Share | $(0.13) | $(0.06) | $(0.25) | $(1.22) | ||||||||||
| Core FFO per Diluted Share | $0.11 | $0.12 | $0.60 | $0.53 | ||||||||||
| Core AFFO per Diluted Share | $0.13 | $0.14 | $0.71 | $0.62 | ||||||||||
| Dividend per Diluted Share | $0.08 | $0.0525 | $0.2625 | $0.1025 | ||||||||||
FOURTH QUARTER 2024 AND FULL YEAR HIGHLIGHTS
–Net loss per share for 2024 was ($0.25), an increase of around $1 compared to full year 2023.
–Grew 2024 Core FFO per share by 13% year over year, surpassing original guidance.
–Normalized Same Store NOI growth of 7.9% for the full year and 7.3% for the fourth quarter.
–Further improved Normalized Same Store NOI margin by 160 basis points to 66.8% for the full year and 200 basis points to 66.5% for the fourth quarter compared to 2023.
–Blended Net Rental Growth Rate of 4.0% for full year and 0.5% for the quarter.
–Refinanced $526 million of mortgages, leaving no remaining consolidated debt maturities until 2026. All debt fixed or hedged.
–Raised the dividend by approximately 60% on an annualized basis.
–Completed $223 million of non-strategic asset sales during the year.
STRATEGIC UPDATE AND OUTLOOK
–Identified pipeline of $300 to $500 million of assets, comprising the majority of our land bank and select multifamily properties, to be sold during the next 12-24 months, with proceeds used to fund up to a $100 million share repurchase program and the balance used to repay debt.
–Targeting leverage below 9.0x Net Debt-to-EBITDA as these sales are completed.
Mahbod Nia, Chief Executive Officer, commented, “Since the reconstitution of our Board and establishment of the Strategic Review Committee over four years ago, we have successfully transformed Veris Residential into a top-performing pure-play multifamily REIT with core, Class A properties, while staying abreast of the state of the transaction market and related capital flows, as well as capital markets, as we evaluate all available avenues to maximize value for our shareholders.
"Despite our continued operational outperformance, we recognize that the intrinsic value of Veris Residential is not accurately reflected in our share price today. We are keenly focused on closing this valuation gap through measures, including but not limited to, the crystallization of assets where we believe we can achieve strong pricing at or near to their intrinsic value, despite broader challenges in the investment market amidst the backdrop of heightened economic and geopolitical uncertainty.
"Accordingly, over the next 12-24 months, we plan to pursue $300 to $500 million of sales for assets that fit this profile given their size, location and buyer interest. We intend to use proceeds from these sales to fund a share repurchase program of up to $100 million—taking advantage of the dislocation that exists between our public trading value and our intrinsic value today on behalf of our shareholders—with the balance being used to repay debt, further de-levering the Company to below 9.0x Net Debt-to-EBITDA. Looking ahead, as we monetize these assets, we will maintain our ability to be nimble and to continue exploring any and all paths to further crystallize value for all shareholders."
SAME STORE PORTFOLIO PERFORMANCE
| December 31, 2024 | September 30, 2024 | Change | |||||||||
| Same Store Units | 7,621 | 7,621 | —% | ||||||||
| Same Store Occupancy | 93.9% | 95.1% | (1.2)% | ||||||||
| Same Store Blended Rental Growth Rate (Quarter) | 0.5% | 4.6% | (4.1)% | ||||||||
| Average Rent per Home | $4,033 | $3,980 | 1.3% | ||||||||
As anticipated, due to the value-add renovation projects at Liberty Towers, Same Store occupancy ended the year at 93.9%, compared to 95.1% last quarter. Excluding Liberty Towers, occupancy for the Same Store portfolio would have been 94.6% in the fourth quarter, in line with the fourth quarter of 2023.
The following table shows Same Store performance:
| ($ in 000s) | Three Months Ended December 31, | Twelve Months Ended December 31, | ||||||||||||||||||
| 2024 | 2023 | % | 2024 | 2023 | % | |||||||||||||||
| Total Property Revenue | $76,375 | $73,371 | 4.1% | $300,679 | $285,247 | 5.4% | ||||||||||||||
| Controllable Expenses | 13,907 | 13,829 | 0.6% | 53,349 | 52,190 | 2.2% | ||||||||||||||
| Non-Controllable Expenses | 11,649 | 12,199 | (4.5)% | 46,589 | 45,263 | 2.9% | ||||||||||||||
| Total Property Expenses | 25,556 | 26,028 | (1.8)% | 99,938 | 97,453 | 2.5% | ||||||||||||||
| Same Store NOI | $50,819 | $47,343 | 7.3% | $200,741 | $187,794 | 6.9% | ||||||||||||||
| Less: Real Estate Tax Adjustments | — | — | — | 1,689 | ||||||||||||||||
| Normalized Same Store NOI | $50,819 | $47,343 | 7.3% | $200,741 | $186,105 | 7.9% | ||||||||||||||
In October, the Company's joint venture sold the Shops at 40 Park retail property. As a result, it has been removed from the Same Store pool.
FINANCING AND LIQUIDITY
All of the Company's debt is hedged or fixed. The Company's total debt portfolio has a weighted average effective interest rate of 4.95% and weighted average maturity of 3.1 years.
| Balance Sheet Metric ($ in 000s) | December 31, 2024 | September 30, 2024 | ||||||
| Weighted Average Interest Rate | 4.95% | 4.96% | ||||||
| Weighted Average Years to Maturity | 3.1 | 3.3 | ||||||
| TTM Interest Coverage Ratio | 1.7x | 1.7x | ||||||
| Net Debt | $1,647,892 | $1,645,447 | ||||||
| TTM EBITDA | $140,694 | $140,682 | ||||||
| TTM Net Debt to EBITDA | 11.7x | 11.7x | ||||||
As of February 21, 2025, the Company had liquidity of $158 million in addition to $45 million of land sales under binding contract to sell. All of the Company's debt portfolio is fixed or hedged. The Company has no consolidated debt maturities until 2026.
In the fourth quarter, the Company exercised one-year extension options relating to mortgages on two unconsolidated joint ventures, Capstone and Metropolitan at 40 Park, now maturing in the fourth quarter of 2025.
SALES
In 2024, the Company completed $223 million of non-strategic sales, releasing approximately $175 million in net proceeds. Subsequent to year end, the 65 Livingston land parcel sold for $7 million. The proceeds from these sales were used to repay debt.
Two land parcels, 1 Water and Wall Land, are under binding contract for approximately $45 million.
DIVIDEND
The Company paid a dividend of $0.08 per share on January 10, 2025, for shareholders of record as of December 31, 2024.
SHARE REPURCHASE PROGRAM
The Board of Directors approved a $100 million share repurchase program over the next two years, with share repurchases under the new program authorized to begin on March 26, 2025.
Repurchases may be made from time to time in the open market, private market, through forward, derivative, alternative, accelerated repurchase or automatic purchase transactions, or otherwise. The share repurchase program does not, however, obligate the Company to acquire any particular amount of shares and repurchases may be suspended or terminated at any time at the Company’s discretion. The amount and timing of repurchases are subject to a variety of factors, including liquidity, share price, market conditions and legal requirements.
GUIDANCE
The Company's 2025 Revenue Guidance range reflects continued strength in rental growth, albeit at a more moderate pace following the Company's extremely strong performance during the past three years.
Guidance provided includes the impact of assets currently under binding contract, with these proceeds utilized to repay debt.
The Company has identified a disposition pipeline of $300 to $500 million of assets, comprising the majority of its land bank, including approximately $45 million of land under binding contract, and select multifamily assets. Management expects that it may take 12 to 24 months to complete the sales and intends to use the proceeds to fund a share repurchase program of up to $100 million, taking advantage of the dislocation that exists between our public trading value and our intrinsic value today on behalf of our shareholders, with the balance being used to repay debt, further de-levering the Company to below 9.0x Net Debt-to-EBITDA .
| 2025 Guidance Ranges | Low | High | |||||||||
| Same Store Revenue Growth | 2.1% | — | 2.7% | ||||||||
| Same Store Expense Growth | 2.6% | — | 3.0% | ||||||||
| Same Store NOI Growth | 1.7% | — | 2.7% | ||||||||
| Core FFO per Share Guidance | Low | High | |||||||||
| Net Loss per Share | $(0.24) | — | $(0.22) | ||||||||
| Depreciation per Share | $0.85 | — | $0.85 | ||||||||
| Core FFO per Share | $0.61 | — | $0.63 | ||||||||
CONFERENCE CALL/SUPPLEMENTAL INFORMATION
An earnings conference call with management is scheduled for Tuesday, February 25, 2025, at 8:30 a.m. Eastern Time and will be broadcast live via the Internet at: http://investors.verisresidential.com.
The live conference call is also accessible by dialing (877) 451-6152 (domestic) or (201) 389-0879 (international) and requesting the Veris Residential fourth quarter 2024 earnings conference call.
The conference call will be rebroadcast on Veris Residential, Inc.'s website at:
http://investors.verisresidential.com beginning at 8:30 a.m. Eastern Time on Tuesday, February 25, 2024.
A replay of the call will also be accessible Tuesday, February 25, 2025, through Tuesday, March 25, 2025, by calling (844) 512-2921 (domestic) or +1(412) 317-6671 (international) and using the passcode, 13751046.
Copies of Veris Residential, Inc.’s 2024 Form 10-K and fourth quarter 2024 Supplemental Operating and Financial Data are available on Veris Residential, Inc.’s website under Financial Results.
In addition, once filed, these items will be available upon request from:
Veris Residential, Inc. Investor Relations Department
Harborside 3, 210 Hudson St., Ste. 400, Jersey City, New Jersey 07311
ABOUT THE COMPANY
Veris Residential, Inc. is a forward-thinking real estate investment trust (REIT) that primarily owns, operates, acquires and develops premier Class A multifamily properties in the Northeast. Our technology-enabled, vertically integrated operating platform delivers a contemporary living experience aligned with residents' preferences while positively impacting the communities we serve. We are guided by an experienced management team and Board of Directors, underpinned by leading corporate governance principles; a best-in-class approach to operations; and an inclusive culture based on meritocratic empowerment.
For additional information on Veris Residential, Inc. and our properties available for lease, please visit http:// www.verisresidential.com/.
The information in this press release must be read in conjunction with, and is modified in its entirety by, the Annual Report on Form 10-K (the “10-K”) filed by the Company for the same period with the Securities and Exchange Commission (the “SEC”) and all of the Company’s other public filings with the SEC (the “Public Filings”). In particular, the financial information contained herein is subject to and qualified by reference to the financial statements contained in the 10-K, the footnotes thereto and the limitations set forth therein. Investors may not rely on the press release without reference to the 10-K and the Public Filings, available at https://investors.verisresidential.com/financial-information.
We consider portions of this information, including the documents incorporated by reference, to be forward-looking statements within the meaning of Section 21E of the Securities Exchange Act of 1934, as amended. We intend such forward-looking statements to be covered by the safe harbor provisions for forward-looking statements contained in Section 21E of such act. Such forward-looking statements relate to, without limitation, our future economic performance, plans and objectives for future operations, and projections of revenue and other financial items. Forward-looking statements can be identified by the use of words such as “may,” “will,” “plan,” “potential,” “projected,” “should,” “expect,” “anticipate,” “estimate,” “target,” “continue” or comparable terminology. Forward-looking statements are inherently subject to certain risks, trends and uncertainties, many of which we cannot predict with accuracy and some of which we may not anticipate. Although we believe that the expectations reflected in such forward-looking statements are based upon reasonable assumptions at the time made, we can give no assurance that such expectations will be achieved. Future events and actual results, financial and otherwise, may differ materially from the results discussed in the forward-looking statements. Readers are cautioned not to place undue reliance on these forward-looking statements and are advised to consider the factors listed above together with the additional factors under the heading "Disclosure Regarding Forward-Looking Statements" and "Risk Factors" in the Company's Annual Report on Form 10-K, as may be supplemented or amended by the Company's Quarterly Reports on Form 10-Q, which are incorporated herein by reference. The Company assumes no obligation to update or supplement forward-looking statements that become untrue because of subsequent events, new information or otherwise, except as required under applicable law.
| Investors | Media | |||||||
| Mackenzie Rice | Amanda Shpiner/Grace Cartwright | |||||||
| Director, Investor Relations | Gasthalter & Co. | |||||||
| investors@verisresidential.com | veris-residential@gasthalter.com | |||||||
Additional details on Company Information page.
Consolidated Balance Sheet
(in thousands) (unaudited)
| December 31, 2024 | December 31, 2023 | |||||||
| ASSETS | ||||||||
| Rental property | ||||||||
| Land and leasehold interests | $458,946 | $474,499 | ||||||
| Buildings and improvements | 2,634,321 | 2,782,468 | ||||||
| Tenant improvements | 14,784 | 30,908 | ||||||
| Furniture, fixtures and equipment | 112,201 | 103,613 | ||||||
| 3,220,252 | 3,391,488 | |||||||
| Less – accumulated depreciation and amortization | (432,531) | (443,781) | ||||||
| 2,787,721 | 2,947,707 | |||||||
| Real estate held for sale, net | 7,291 | 58,608 | ||||||
| Net investment in rental property | 2,795,012 | 3,006,315 | ||||||
| Cash and cash equivalents | 7,251 | 28,007 | ||||||
| Restricted cash | 17,059 | 26,572 | ||||||
| Investments in unconsolidated joint ventures | 111,301 | 117,954 | ||||||
| Unbilled rents receivable, net | 2,253 | 5,500 | ||||||
| Deferred charges and other assets, net | 48,476 | 53,956 | ||||||
| Accounts receivable | 1,375 | 2,742 | ||||||
| Total Assets | $2,982,727 | $3,241,046 | ||||||
| LIABILITIES & EQUITY | ||||||||
| Revolving credit facility and term loans | 348,839 | — | ||||||
| Mortgages, loans payable and other obligations, net | 1,323,474 | 1,853,897 | ||||||
| Dividends and distributions payable | 8,533 | 5,540 | ||||||
| Accounts payable, accrued expenses and other liabilities | 42,744 | 55,492 | ||||||
| Rents received in advance and security deposits | 11,512 | 14,985 | ||||||
| Accrued interest payable | 5,262 | 6,580 | ||||||
| Total Liabilities | 1,740,364 | 1,936,494 | ||||||
| Redeemable noncontrolling interests | 9,294 | 24,999 | ||||||
| Total Stockholders’ Equity | 1,099,391 | 1,137,478 | ||||||
| Noncontrolling interests in subsidiaries: | ||||||||
| Operating Partnership | 102,588 | 107,206 | ||||||
| Consolidated joint ventures | 31,090 | 34,869 | ||||||
| Total Noncontrolling Interests in Subsidiaries | $133,678 | $142,075 | ||||||
| Total Equity | $1,233,069 | $1,279,553 | ||||||
| Total Liabilities and Equity | $2,982,727 | $3,241,046 | ||||||
7
Consolidated Statement of Operations
(In thousands, except per share amounts) (unaudited)
| Three Months Ended December 31, | Twelve Months Ended December 31, | ||||||||||||||||
| REVENUES | 2024 | 2023 | 2024 | 2023 | |||||||||||||
| Revenue from leases | $61,904 | $60,896 | $245,690 | $235,117 | |||||||||||||
| Management fees | 751 | 1,084 | 3,338 | 3,868 | |||||||||||||
| Parking income | 3,893 | 3,824 | 15,463 | 15,498 | |||||||||||||
| Other income | 1,535 | 1,216 | 6,583 | 5,812 | |||||||||||||
| Total revenues | 68,083 | 67,020 | 271,074 | 260,295 | |||||||||||||
| EXPENSES | |||||||||||||||||
| Real estate taxes | 10,173 | 9,529 | 37,424 | 34,687 | |||||||||||||
| Utilities | 1,955 | 1,836 | 8,151 | 7,700 | |||||||||||||
| Operating services | 12,885 | 13,570 | 48,239 | 50,769 | |||||||||||||
| Property management | 3,877 | 4,323 | 17,247 | 14,188 | |||||||||||||
| General and administrative | 10,040 | 9,992 | 39,059 | 44,443 | |||||||||||||
| Transaction-related costs | 159 | 576 | 1,565 | 7,627 | |||||||||||||
| Depreciation and amortization | 21,182 | 21,227 | 82,774 | 86,235 | |||||||||||||
| Land and other impairments, net | — | 5,928 | 2,619 | 9,324 | |||||||||||||
| Total expenses | 60,271 | 66,981 | 237,078 | 254,973 | |||||||||||||
| OTHER (EXPENSE) INCOME | |||||||||||||||||
| Interest expense | (23,293) | (21,933) | (87,976) | (89,355) | |||||||||||||
| Interest cost of mandatorily redeemable noncontrolling interests | — | — | — | (49,782) | |||||||||||||
| Interest and other investment income | 111 | 232 | 2,366 | 5,515 | |||||||||||||
| Equity in earnings (loss) of unconsolidated joint ventures | 1,015 | 260 | 3,934 | 3,102 | |||||||||||||
| Realized gains (losses) and unrealized gains (losses) on disposition of rental property and impairments, net | — | (3) | — | — | |||||||||||||
| Gain (loss) on disposition of developable land | — | 7,090 | 11,515 | 7,068 | |||||||||||||
| Gain (loss) on sale of unconsolidated joint venture interests | (154) | — | 6,946 | — | |||||||||||||
| Gain (loss) from extinguishment of debt, net | — | (1,903) | (777) | (5,606) | |||||||||||||
| Other income (expense), net | (396) | 77 | (701) | 2,871 | |||||||||||||
| Total other (expense) income, net | (22,717) | (16,180) | (64,693) | (126,187) | |||||||||||||
| Income (loss) from continuing operations before income tax expense | (14,905) | (16,141) | (30,697) | (120,865) | |||||||||||||
| Provision for income taxes | (2) | (199) | (276) | (492) | |||||||||||||
| Income (loss) from continuing operations after income tax expense | (14,907) | (16,340) | (30,973) | (121,357) | |||||||||||||
| Income (loss) from discontinued operations | (1,015) | (33,377) | 862 | (32,686) | |||||||||||||
| Realized gains (losses) and unrealized gains (losses) on disposition of rental property and impairments, net | 1,899 | 43,971 | 3,447 | 41,682 | |||||||||||||
| Total discontinued operations, net | 884 | 10,594 | 4,309 | 8,996 | |||||||||||||
| Net Income (loss) | (14,023) | (5,746) | (26,664) | (112,361) | |||||||||||||
| Noncontrolling interest in consolidated joint ventures | 495 | 504 | 1,924 | 2,319 | |||||||||||||
| Noncontrolling interests in Operating Partnership of loss (income) from continuing operations | 1,238 | 1,389 | 2,531 | 11,174 | |||||||||||||
| Noncontrolling interests in Operating Partnership in discontinued operations | (76) | (913) | (371) | (779) | |||||||||||||
| Redeemable noncontrolling interests | (81) | (285) | (540) | (7,618) | |||||||||||||
| Net income (loss) available to common shareholders | $(12,447) | $(5,051) | $(23,120) | $(107,265) | |||||||||||||
| Basic earnings per common share: | |||||||||||||||||
| Net income (loss) available to common shareholders | $(0.13) | $(0.06) | $(0.25) | $(1.22) | |||||||||||||
| Diluted earnings per common share: | |||||||||||||||||
| Net income (loss) available to common shareholders | $(0.13) | $(0.06) | $(0.25) | $(1.22) | |||||||||||||
| Basic weighted average shares outstanding | 92,934 | 92,240 | 92,695 | 91,883 | |||||||||||||
Diluted weighted average shares outstanding(1) | 101,611 | 100,936 | 101,381 | 100,812 | |||||||||||||
See Reconciliation to Net Income (Loss) to NOI page for more details.
8
FFO, Core FFO and Core AFFO
(in thousands, except per share/unit amounts)
| Three Months Ended December 31, | Twelve Months Ended December 31, | ||||||||||||||||
| 2024 | 2023 | 2024 | 2023 | ||||||||||||||
| Net loss available to common shareholders | $ | (12,447) | $ | (5,051) | $ | (23,120) | $ | (107,265) | |||||||||
| Add/(Deduct): | |||||||||||||||||
| Noncontrolling interests in Operating Partnership | (1,238) | (1,389) | (2,531) | (11,174) | |||||||||||||
| Noncontrolling interests in discontinued operations | 76 | 913 | 371 | 779 | |||||||||||||
Real estate-related depreciation and amortization on continuing operations(2) | 23,617 | 23,609 | 92,164 | 95,695 | |||||||||||||
| Real estate-related depreciation and amortization on discontinued operations | (33) | 1,819 | 635 | 12,689 | |||||||||||||
| Property impairments on discontinued operations | — | 32,516 | — | 32,516 | |||||||||||||
| Continuing operations: (Gain) loss on sale from unconsolidated joint ventures | 154 | — | (6,946) | — | |||||||||||||
| Continuing operations: Realized (gains) losses and unrealized (gains) losses on disposition of rental property, net | — | 3 | — | — | |||||||||||||
| Discontinued operations: Realized (gains) losses and unrealized (gains) losses on disposition of rental property, net | — | (4,700) | (1,548) | (2,411) | |||||||||||||
FFO(3) | $ | 10,129 | $ | 47,720 | $ | 59,025 | $ | 20,829 | |||||||||
| Add/(Deduct): | |||||||||||||||||
| (Gain) loss from extinguishment of debt, net | — | 1,903 | 777 | 5,618 | |||||||||||||
| Land and other impairments | — | 5,928 | 2,619 | 9,324 | |||||||||||||
| (Gain) loss on disposition of developable land | (1,899) | (46,361) | (13,414) | (46,339) | |||||||||||||
Rebranding and Severance/Compensation related costs (G&A)(4) | 32 | 129 | 2,111 | 7,987 | |||||||||||||
Rebranding and Severance/Compensation related costs (Property Management)(5) | 766 | 829 | 3,156 | 1,128 | |||||||||||||
| Severance/Compensation related costs (Operating Expenses) | — | — | — | 649 | |||||||||||||
| Rockpoint buyout premium | — | — | — | 34,775 | |||||||||||||
| Redemption value adjustments to mandatorily redeemable noncontrolling interests | — | — | — | 7,641 | |||||||||||||
Amortization of derivative premium(6) | 1,461 | 902 | 4,554 | 4,654 | |||||||||||||
| Derivative mark to market adjustment | 186 | — | 202 | — | |||||||||||||
| Transaction related costs | 578 | 576 | 1,984 | 7,627 | |||||||||||||
| Core FFO | $ | 11,253 | $ | 11,626 | $ | 61,014 | $ | 53,893 | |||||||||
| Add/(Deduct): | |||||||||||||||||
Straight-line rent adjustments(7) | (107) | 81 | (790) | 502 | |||||||||||||
| Amortization of market lease intangibles, net | (5) | — | (30) | (80) | |||||||||||||
| Amortization of lease inducements | — | 5 | 7 | 57 | |||||||||||||
| Amortization of stock compensation | 3,013 | 3,270 | 12,992 | 12,995 | |||||||||||||
| Non-real estate depreciation and amortization | 169 | 216 | 763 | 1,028 | |||||||||||||
| Amortization of deferred financing costs | 1,639 | 1,255 | 6,125 | 4,440 | |||||||||||||
| Add/(Deduct): | |||||||||||||||||
| Non-incremental revenue generating capital expenditures: | |||||||||||||||||
| Building improvements | (2,784) | (1,670) | (7,674) | (8,348) | |||||||||||||
Tenant improvements and leasing commissions(8) | (94) | (888) | (236) | (1,994) | |||||||||||||
Core AFFO(3) | $ | 13,084 | $ | 13,895 | $ | 72,171 | $ | 62,493 | |||||||||
| Funds from Operations per share/unit-diluted | $0.10 | $0.47 | $0.58 | $0.21 | |||||||||||||
| Core Funds from Operations per share/unit-diluted | $0.11 | $0.12 | $0.60 | $0.53 | |||||||||||||
| Core Adjusted Funds from Operations per share/unit-diluted | $0.13 | $0.14 | $0.71 | $0.62 | |||||||||||||
| Dividends declared per common share | $0.08 | $0.0525 | $0.2625 | $0.1025 | |||||||||||||
See Consolidated Statements of Operations page.
9
Adjusted EBITDA
($ in thousands) (unaudited)
| Three Months Ended December 31, | Twelve Months Ended December 31, | ||||||||||||||||
| 2024 | 2023 | 2024 | 2023 | ||||||||||||||
| Core FFO (calculated on a previous page) | $ | 11,253 | $ | 11,626 | $ | 61,014 | $ | 53,893 | |||||||||
| Deduct: | |||||||||||||||||
| Equity in (earnings) loss of unconsolidated joint ventures | (1,015) | (260) | (4,196) | (3,102) | |||||||||||||
| Equity in earnings share of depreciation and amortization | (2,605) | (2,597) | (10,154) | (10,337) | |||||||||||||
| Add: | |||||||||||||||||
| Interest expense | 23,294 | 21,933 | 87,977 | 90,177 | |||||||||||||
| Amortization of derivative premium | (1,461) | (902) | (4,554) | (4,654) | |||||||||||||
| Derivative mark to market adjustment | (186) | — | (202) | — | |||||||||||||
| Recurring joint venture distributions | 3,641 | 2,718 | 11,893 | 11,700 | |||||||||||||
| Noncontrolling interests in consolidated joint ventures1 | (495) | (504) | (1,924) | (2,319) | |||||||||||||
| Interest cost for mandatorily redeemable noncontrolling interests | — | — | — | 7,366 | |||||||||||||
| Redeemable noncontrolling interests | 81 | 285 | 540 | 7,618 | |||||||||||||
| Income tax expense | 3 | 199 | 300 | 492 | |||||||||||||
| Adjusted EBITDA | $ | 32,510 | $ | 32,498 | $ | 140,694 | $ | 150,834 | |||||||||
1See Annex 7 for breakout of Noncontrolling interests in consolidated joint ventures.
10
Components of Net Asset Value
($ in thousands)
| Real Estate Portfolio | Other Assets | ||||||||||||||||
| Operating Multifamily NOI1 | Total | At Share | Cash and Cash Equivalents2 | $6,493 | |||||||||||||
| New Jersey Waterfront | $169,888 | $145,446 | Restricted Cash | 17,059 | |||||||||||||
| Massachusetts | 26,100 | 26,100 | Other Assets | 52,104 | |||||||||||||
| Other | 31,832 | 24,132 | Subtotal Other Assets | $75,656 | |||||||||||||
| Total Multifamily NOI | $227,820 | $195,678 | |||||||||||||||
| Commercial NOI3 | 1,980 | 1,159 | Liabilities and Other Considerations | ||||||||||||||
Add Back: Non-recurring NOI Impact4 | 1,368 | 1,368 | |||||||||||||||
| Total NOI | $231,168 | $198,205 | Operating - Consolidated Debt at Share | $1,261,196 | |||||||||||||
| Operating - Unconsolidated Debt at Share | 293,450 | ||||||||||||||||
| Non-Strategic Assets | Other Liabilities | 68,051 | |||||||||||||||
| Revolving Credit Facility5 | 145,000 | ||||||||||||||||
| Estimated Value of Remaining Land | $134,819 | Term Loan | 200,000 | ||||||||||||||
| Estimated Value of Land Under Binding Contract for Sale | 45,250 | Preferred Units | 9,294 | ||||||||||||||
| Total Non-Strategic Assets6 | $180,069 | Subtotal Liabilities and Other Considerations | $1,976,991 | ||||||||||||||
| Outstanding Shares7 | |||||||||||||||||
| Diluted Weighted Average Shares Outstanding for 4Q 2024 (in 000s) | 102,587 | ||||||||||||||||
1 See Multifamily Operating Portfolio page for more details. The Real Estate Portfolio table is reflective of the quarterly NOI annualized.
2 Reflects the cash balance on February 21, 2025. Cash balance at quarter end was $7.3 million.
3 See Commercial Assets and Developable Land page for more details.
4In the fourth quarter, the Company had lower than normal NOI value, driven primarily by two non-recurring costs.
5 Revolver balance on 12/31 was $152 million, subsequent to the sale of 65 Livingston, the Company repaid $7 million of the Revolver bringing the balance to $145 million. See Debt Summary and Maturity Schedule page for more details.
6 The land values are VRE`s share of value. 65 Livingston was removed from the total as it closed on January 24, 2025. Land under binding contract reflects two land parcels (Wall Land and 1 Water Street) and the value VRE expects to receive upon completion of the sale. For more details on unit change see Commercial Assets and Developable Land page.
7 Outstanding shares for the quarter ended December 31, 2024 is comprised of the following (in 000s): 92,934 weighted average common shares outstanding, 8,677 weighted average Operating Partnership common and vested LTIP units outstanding, and 976 shares representing the dilutive effect of stock-based compensation awards.
11
Multifamily Operating Portfolio
(in thousands, except Revenue per home)
| Operating Highlights | |||||||||||||||||||||||||||||
Percentage Occupied | Average Revenue per Home | NOI | Debt Balance | ||||||||||||||||||||||||||
| Ownership | Apartments | 4Q 2024 | 3Q 2024 | 4Q 2024 | 3Q 2024 | 4Q 2024 | 3Q 2024 | ||||||||||||||||||||||
| NJ Waterfront | |||||||||||||||||||||||||||||
| Haus25 | 100.0% | 750 | 95.3% | 95.8% | $4,986 | $4,950 | $7,803 | $7,931 | $343,061 | ||||||||||||||||||||
| Liberty Towers* | 100.0% | 648 | 85.6% | 91.7% | 4,319 | 4,237 | 4,543 | 5,506 | — | ||||||||||||||||||||
| BLVD 401 | 74.3% | 311 | 95.7% | 94.7% | 4,309 | 4,304 | 2,428 | 2,592 | 115,515 | ||||||||||||||||||||
| BLVD 425 | 74.3% | 412 | 95.6% | 95.2% | 4,175 | 4,147 | 3,246 | 3,413 | 131,000 | ||||||||||||||||||||
| BLVD 475 | 100.0% | 523 | 94.4% | 96.8% | 4,201 | 4,241 | 4,100 | 4,319 | 164,712 | ||||||||||||||||||||
| Soho Lofts* | 100.0% | 377 | 94.7% | 95.6% | 4,860 | 4,832 | 3,258 | 3,375 | — | ||||||||||||||||||||
| Urby Harborside | 85.0% | 762 | 94.4% | 96.5% | 4,322 | 4,094 | 6,455 | 5,866 | 182,604 | ||||||||||||||||||||
| RiverHouse 9 at Port Imperial | 100.0% | 313 | 95.4% | 96.2% | 4,516 | 4,392 | 2,674 | 2,661 | 110,000 | ||||||||||||||||||||
| RiverHouse 11 at Port Imperial | 100.0% | 295 | 96.3% | 96.3% | 4,405 | 4,363 | 2,479 | 2,500 | 100,000 | ||||||||||||||||||||
| RiverTrace | 22.5% | 316 | 94.4% | 95.3% | 3,851 | 3,829 | 2,243 | 2,113 | 82,000 | ||||||||||||||||||||
| Capstone | 40.0% | 360 | 95.1% | 94.4% | 4,590 | 4,471 | 3,243 | 3,154 | 135,000 | ||||||||||||||||||||
| NJ Waterfront Subtotal | 85.0% | 5,067 | 93.8% | 95.3% | $4,441 | $4,371 | $42,472 | $43,430 | $1,363,892 | ||||||||||||||||||||
| Massachusetts | |||||||||||||||||||||||||||||
| Portside at East Pier | 100.0% | 180 | 95.2% | 95.9% | $3,265 | $3,269 | $1,207 | $1,245 | $56,500 | ||||||||||||||||||||
| Portside 2 at East Pier | 100.0% | 296 | 93.9% | 94.8% | 3,425 | 3,446 | 2,070 | 2,108 | 95,427 | ||||||||||||||||||||
| 145 Front at City Square* | 100.0% | 365 | 94.0% | 95.1% | 2,524 | 2,475 | 1,549 | 1,467 | — | ||||||||||||||||||||
| The Emery at Overlook Ridge | 100.0% | 326 | 92.9% | 94.0% | 2,865 | 2,840 | 1,699 | 1,688 | 70,653 | ||||||||||||||||||||
| Massachusetts Subtotal | 100.0% | 1,167 | 93.9% | 94.8% | $2,962 | $2,946 | $6,525 | $6,508 | $222,580 | ||||||||||||||||||||
| Other | |||||||||||||||||||||||||||||
| The Upton | 100.0% | 193 | 91.4% | 88.8% | $4,411 | $4,525 | $1,238 | $1,392 | $75,000 | ||||||||||||||||||||
| The James* | 100.0% | 240 | 95.8% | 93.8% | 3,168 | 3,148 | 1,447 | 1,535 | — | ||||||||||||||||||||
| Signature Place* | 100.0% | 197 | 96.5% | 96.1% | 3,312 | 3,201 | 1,050 | 1,022 | — | ||||||||||||||||||||
| Quarry Place at Tuckahoe | 100.0% | 108 | 95.8% | 98.1% | 4,368 | 4,293 | 821 | 723 | 41,000 | ||||||||||||||||||||
| Riverpark at Harrison | 45.0% | 141 | 95.7% | 97.2% | 2,995 | 2,823 | 626 | 570 | 30,192 | ||||||||||||||||||||
| Metropolitan at 40 Park | 25.0% | 130 | 93.7% | 95.6% | 3,741 | 3,722 | 771 | 731 | 34,100 | ||||||||||||||||||||
| Station House | 50.0% | 378 | 91.8% | 94.7% | 2,989 | 3,017 | 2,005 | 1,705 | 87,350 | ||||||||||||||||||||
| Other Subtotal | 73.8% | 1,387 | 94.0% | 94.5% | $3,442 | $3,421 | $7,958 | $7,678 | $267,642 | ||||||||||||||||||||
Operating Portfolio1,2 | 85.2% | 7,621 | 93.9% | 95.1% | $4,033 | $3,980 | $56,955 | $57,616 | $1,854,114 | ||||||||||||||||||||
1 Rental revenue associated with retail leases is included in the NOI disclosure above.
2 See Unconsolidated Joint Ventures and Annex 6: Multifamily Operating Portfolio for more details.
*Properties that are currently in the collateral pool for the Term Loan and Revolving Credit Facility.
12
Commercial Assets and Developable Land
($ in thousands)
| Commercial | Location | Ownership | Rentable SF1 | Percentage Leased 4Q 2024 | Percentage Leased 3Q 2024 | NOI 4Q 2024 | NOI 3Q 2024 | Debt Balance | ||||||||||||||||||
| Port Imperial South - Garage | Weehawken, NJ | 70.0% | Fn 1 | N/A | N/A | $537 | $590 | $31,098 | ||||||||||||||||||
| Port Imperial South - Retail | Weehawken, NJ | 70.0% | 18,064 | 92.0% | 92.0% | 147 | 115 | — | ||||||||||||||||||
| Port Imperial North - Garage | Weehawken, NJ | 70.0% | Fn 1 | N/A | N/A | 25 | 12 | — | ||||||||||||||||||
| Port Imperial North - Retail | Weehawken, NJ | 100.0% | 8,400 | 100.0% | 100.0% | (275) | 46 | — | ||||||||||||||||||
| Riverwalk at Port Imperial | West New York, NJ | 100.0% | 29,923 | 80.0% | 80.0% | 61 | 164 | — | ||||||||||||||||||
| Commercial Total | 85.1% | 56,387 | 86.8% | 86.8% | $495 | $927 | $31,098 | |||||||||||||||||||
| Shops at 40 Park2 | Morristown, NJ | 25.0% | 50,973 | 69.0% | 69.0% | 68 | (46) | — | ||||||||||||||||||
| Commercial Total with Shops at 40 Park | 80.9% | 107,360 | 78.4% | 78.4% | $563 | $881 | $31,098 | |||||||||||||||||||
| Developable Land Parcel Units3 | ||||||||
| Total Units | VRE Share | |||||||
| NJ Waterfront | 2,351 | 1,565 | ||||||
| Massachusetts | 849 | 849 | ||||||
| Other | 939 | 939 | ||||||
| Developable Land Parcel Units Total at December 31, 2024 | 4,139 | 3,353 | ||||||
| Less: One land parcel rezoned from hotel to retail use | 112 | 112 | ||||||
| Less: 65 Livingston sold in January 2025 | 252 | 252 | ||||||
| Less: Two land parcels under binding contract for sale | 527 | 527 | ||||||
| Developable Land Parcel Units Remaining4 | 3,248 | 2,462 | ||||||
1 Port Imperial South - Garage and Port Imperial North - Garage include approximately 850 and 686 parking spaces, respectively.
2 The Company`s joint venture sold the Shops at 40 Park retail property on October 22, 2024.
3 The Company has an additional 34,375 SF of developable retail space within land developments that is not represented in this table.
4The unit count reduced subsequently when the Company sold 65 Livingston in January 2025. Wall Land and 1 Water Street are represented in the under binding contract bucket. One land parcel in Malden, MA was rezoned for retail use, reducing the total unit count by 112.
13
Same Store Market Information1
Sequential Quarter Comparison
(NOI in thousands)
| NOI at Share | Occupancy | Blended Lease Rate2 | ||||||||||||||||||||||||||||||
| Apartments | 4Q 2024 | 3Q 2024 | Change | 4Q 2024 | 3Q 2024 | Change | 4Q 2024 | 3Q 2024 | Change | |||||||||||||||||||||||
| New Jersey Waterfront | 5,067 | $37,733 | $38,836 | (2.8)% | 93.8% | 95.3% | (1.5)% | 1.2% | 6.6% | (5.4)% | ||||||||||||||||||||||
| Massachusetts | 1,167 | 6,787 | 6,765 | 0.3% | 93.9% | 94.8% | (0.9)% | —% | 0.7% | (0.7)% | ||||||||||||||||||||||
| Other3 | 1,387 | 6,299 | 6,226 | 1.2% | 94.0% | 94.5% | (0.5)% | (1.7)% | 0.5% | (2.2)% | ||||||||||||||||||||||
| Total | 7,621 | $50,819 | $51,827 | (1.9)% | 93.9% | 95.1% | (1.2)% | 0.5% | 4.6% | (4.1)% | ||||||||||||||||||||||
Year-over-Year Fourth Quarter Comparison
(NOI in thousands)
| NOI at Share | Occupancy | Blended Lease Rate2 | ||||||||||||||||||||||||||||||
| Apartments | 4Q 2024 | 4Q 2023 | Change | 4Q 2024 | 4Q 2023 | Change | 4Q 2024 | 4Q 2023 | Change | |||||||||||||||||||||||
| New Jersey Waterfront | 5,067 | $37,733 | $34,756 | 8.6% | 93.8% | 94.6% | (0.8)% | 1.2% | 7.8% | (6.6)% | ||||||||||||||||||||||
| Massachusetts | 1,167 | 6,787 | 6,570 | 3.3% | 93.9% | 93.9% | —% | —% | 0.5% | (0.5)% | ||||||||||||||||||||||
Other3 | 1,387 | 6,299 | 6,017 | 4.7% | 94.0% | 94.0% | —% | (1.7)% | 5.0% | (6.7)% | ||||||||||||||||||||||
| Total | 7,621 | $50,819 | $47,343 | 7.3% | 93.9% | 94.4% | (0.5)% | 0.5% | 6.2% | (5.7)% | ||||||||||||||||||||||
Average Revenue per Home
| Apartments | 4Q 2024 | 3Q 2024 | 2Q 2024 | 1Q 2024 | 4Q 2023 | |||||||||||||||
| New Jersey Waterfront | 5,067 | $4,441 | $4,371 | $4,291 | $4,274 | $4,219 | ||||||||||||||
| Massachusetts | 1,167 | 2,962 | 2,946 | 2,931 | 2,893 | 2,925 | ||||||||||||||
Other3 | 1,387 | 3,442 | 3,421 | 3,411 | 3,374 | 3,307 | ||||||||||||||
| Total | 7,621 | $4,033 | $3,980 | $3,923 | $3,899 | $3,855 | ||||||||||||||
1 All statistics are based off the current 7,621 Same Store pool.
2 Blended lease rates exclude properties not managed by Veris.
3 "Other" includes properties in Suburban NJ, New York, and Washington, DC. See Multifamily Operating Portfolio page for breakout.
14
Same Store Performance
($ in thousands)
| Multifamily Same Store1 | ||||||||||||||||||||||||||||||||||||||||||||
| Three Months Ended December 31, | Twelve Months Ended December 31, | Sequential | ||||||||||||||||||||||||||||||||||||||||||
| 2024 | 2023 | Change | % | 2024 | 2023 | Change | % | 4Q24 | 3Q24 | Change | % | |||||||||||||||||||||||||||||||||
| Apartment Rental Income | $69,149 | $66,603 | $2,546 | 3.8% | $272,198 | $258,816 | $13,382 | 5.2% | $69,149 | $68,862 | $287 | 0.4% | ||||||||||||||||||||||||||||||||
| Parking/Other Income | 7,226 | 6,768 | 458 | 6.8% | 28,481 | 26,431 | 2,050 | 7.8% | 7,226 | 6,930 | 296 | 4.3% | ||||||||||||||||||||||||||||||||
| Total Property Revenues2 | $76,375 | $73,371 | $3,004 | 4.1% | $300,679 | $285,247 | $15,432 | 5.4% | $76,375 | $75,792 | $583 | 0.8% | ||||||||||||||||||||||||||||||||
| Marketing & Administration | 2,618 | 2,559 | 59 | 2.3% | 9,733 | 9,741 | (8) | (0.1)% | 2,618 | 2,444 | 174 | 7.1% | ||||||||||||||||||||||||||||||||
| Utilities | 2,278 | 2,181 | 97 | 4.4% | 9,521 | 9,057 | 464 | 5.1% | 2,278 | 2,491 | (213) | (8.6)% | ||||||||||||||||||||||||||||||||
| Payroll | 4,525 | 4,666 | (141) | (3.0)% | 17,531 | 17,956 | (425) | (2.4)% | 4,525 | 4,398 | 127 | 2.9% | ||||||||||||||||||||||||||||||||
| Repairs & Maintenance | 4,486 | 4,423 | 63 | 1.4% | 16,564 | 15,436 | 1,128 | 7.3% | 4,486 | 4,095 | 391 | 9.5% | ||||||||||||||||||||||||||||||||
| Controllable Expenses | $13,907 | $13,829 | $78 | 0.6% | $53,349 | $52,190 | $1,159 | 2.2% | $13,907 | $13,428 | $479 | 3.6% | ||||||||||||||||||||||||||||||||
| Other Fixed Fees | 719 | 728 | (9) | (1.2)% | 2,879 | 2,918 | (39) | (1.3)% | 719 | 745 | (26) | (3.5)% | ||||||||||||||||||||||||||||||||
| Insurance | 1,388 | 1,743 | (355) | (20.4)% | 5,649 | 6,464 | (815) | (12.6)% | 1,388 | 702 | 686 | 97.7% | ||||||||||||||||||||||||||||||||
| Real Estate Taxes | 9,542 | 9,728 | (186) | (1.9)% | 38,061 | 35,881 | 2,180 | 6.1% | 9,542 | 9,090 | 452 | 5.0% | ||||||||||||||||||||||||||||||||
| Non-Controllable Expenses | $11,649 | $12,199 | $(550) | (4.5)% | $46,589 | $45,263 | $1,326 | 2.9% | $11,649 | $10,537 | $1,112 | 10.6% | ||||||||||||||||||||||||||||||||
| Total Property Expenses | $25,556 | $26,028 | $(472) | (1.8)% | $99,938 | $97,453 | $2,485 | 2.5% | $25,556 | $23,965 | $1,591 | 6.6% | ||||||||||||||||||||||||||||||||
| Same Store GAAP NOI | $50,819 | $47,343 | $3,476 | 7.3% | $200,741 | $187,794 | $12,947 | 6.9% | $50,819 | $51,827 | $(1,008) | (1.9)% | ||||||||||||||||||||||||||||||||
| Real Estate Tax Adjustments3 | — | — | — | — | 1,689 | (1,689) | — | — | — | |||||||||||||||||||||||||||||||||||
| Normalized Same Store NOI | $50,819 | $47,343 | $3,476 | 7.3% | $200,741 | $186,105 | $14,636 | 7.9% | $50,819 | $51,827 | $(1,008) | (1.9)% | ||||||||||||||||||||||||||||||||
| Normalized SS NOI Margin | 66.5% | 64.5% | 2.0% | 66.8% | 65.2% | 1.6% | 66.5% | 68.4% | (1.9)% | |||||||||||||||||||||||||||||||||||
| Total Units | 7,621 | 7,621 | 7,621 | 7,621 | 7,621 | 7,621 | ||||||||||||||||||||||||||||||||||||||
| % Ownership | 85.2% | 85.2% | 85.2% | 85.2% | 85.2% | 85.2% | ||||||||||||||||||||||||||||||||||||||
| % Occupied | 93.9% | 94.4% | (0.5)% | 93.9% | 94.4% | (0.5)% | 93.9% | 95.1% | (1.2)% | |||||||||||||||||||||||||||||||||||
1 Values represent the Company's pro rata ownership of the operating portfolio. The James and Haus25 were added to the Same Store pool in 1Q 2024. All periods displayed have an adjusted Same Store pool to reflect the sales of both Met Lofts and Shops at 40 Park.
2 Revenues reported based on Generally Accepted Accounting Principals or "GAAP".
3 Represents tax settlements and final tax rate adjustments recognized that are applicable to prior periods.
15
Debt Profile
($ in thousands)
| Lender | Effective Interest Rate(1) | December 31, 2024 | December 31, 2023 | Date of Maturity | |||||||||||||
| Permanent Loans Repaid in 2024 | |||||||||||||||||
Soho Lofts(2) | Flagstar Bank | 3.77% | — | 158,777 | 07/01/29 | ||||||||||||
145 Front at City Square(3) | US Bank | SOFR+1.84% | — | 63,000 | 12/10/26 | ||||||||||||
Signature Place(4) | Nationwide Life Insurance Company | 3.74% | — | 43,000 | 08/01/24 | ||||||||||||
Liberty Towers(5) | American General Life Insurance Company | 3.37% | — | 265,000 | 10/01/24 | ||||||||||||
| Permanent Loans Repaid in 2024 | $— | $529,777 | |||||||||||||||
| Secured Permanent Loans | |||||||||||||||||
| Portside 2 at East Pier | New York Life Insurance Co. | 4.56% | 95,427 | 97,000 | 03/10/26 | ||||||||||||
| BLVD 425 | New York Life Insurance Co. | 4.17% | 131,000 | 131,000 | 08/10/26 | ||||||||||||
| BLVD 401 | New York Life Insurance Co. | 4.29% | 115,515 | 117,000 | 08/10/26 | ||||||||||||
Portside at East Pier(6) | KKR | SOFR + 2.75% | 56,500 | 56,500 | 09/07/26 | ||||||||||||
The Upton(7) | Bank of New York Mellon | SOFR + 1.58% | 75,000 | 75,000 | 10/27/26 | ||||||||||||
RiverHouse 9 at Port Imperial(8) | JP Morgan | SOFR + 1.41% | 110,000 | 110,000 | 06/21/27 | ||||||||||||
| Quarry Place at Tuckahoe | Natixis Real Estate Capital, LLC | 4.48% | 41,000 | 41,000 | 08/05/27 | ||||||||||||
| BLVD 475 | The Northwestern Mutual Life Insurance Co. | 2.91% | 164,712 | 165,000 | 11/10/27 | ||||||||||||
| Haus25 | Freddie Mac | 6.04% | 343,061 | 343,061 | 09/01/28 | ||||||||||||
| RiverHouse 11 at Port Imperial | The Northwestern Mutual Life Insurance Co. | 4.52% | 100,000 | 100,000 | 01/10/29 | ||||||||||||
| Port Imperial Garage South | American General Life & A/G PC | 4.85% | 31,098 | 31,645 | 12/01/29 | ||||||||||||
The Emery at Overlook Ridge(9) | Flagstar Bank | 3.21% | 70,653 | 72,000 | 01/01/31 | ||||||||||||
| Secured Permanent Loans Outstanding | $1,333,966 | $1,339,206 | |||||||||||||||
| Secured and/or Repaid Permanent Loans | $1,333,966 | $1,868,983 | |||||||||||||||
| Unamortized Deferred Financing Costs | (10,492) | (15,086) | |||||||||||||||
| Secured Permanent Loans | $1,323,474 | $1,853,897 | |||||||||||||||
| Secured RCF & Term Loans: | |||||||||||||||||
Revolving Credit Facility(10) | Various Lenders | SOFR + 2.72% | $152,000 | $— | 04/22/27 | ||||||||||||
Term Loan(10) | Various Lenders | SOFR + 2.73% | 200,000 | — | 04/22/27 | ||||||||||||
| RCF & Term Loan Balances | $352,000 | $— | |||||||||||||||
| Unamortized Deferred Financing Costs | (3,161) | — | |||||||||||||||
| Total RCF & Term Loan Debt | $348,839 | $— | |||||||||||||||
| Total Debt | $1,672,313 | $1,853,897 | |||||||||||||||
See to Debt Profile Footnotes page.
16
Debt Summary and Maturity Schedule
100% of the Company's total pro forma debt portfolio (consolidated and unconsolidated) is hedged or fixed. The Company's total pro rata debt portfolio has a weighted average interest rate of 4.95% and a weighted average maturity of 3.1 years.
($ in thousands)
Debt Maturity Schedule as of December 31, 20243,4 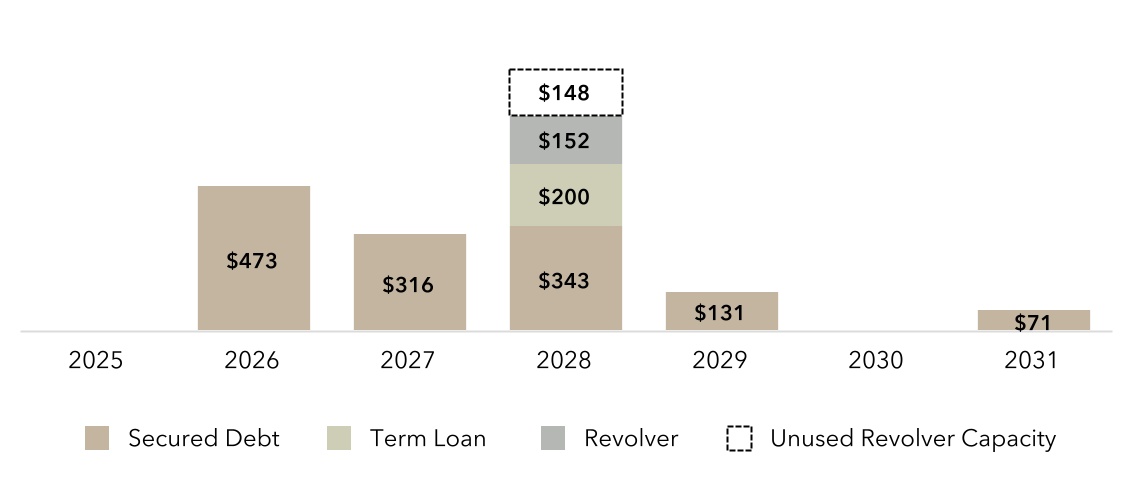
| Balance | % of Total | Weighted Average Interest Rate | Weighted Average Maturity in Years | |||||||||||
| Fixed Rate & Hedged Debt | ||||||||||||||
| Fixed Rate & Hedged Secured Debt | $1,683,966 | 99.9% | 5.05% | 2.76 | ||||||||||
| Variable Rate Debt | ||||||||||||||
| Variable Rate Debt1 | 2,000 | 0.1% | 7.08% | 2.31 | ||||||||||
| Totals / Weighted Average | $1,685,966 | 100.0% | 5.05% | 2.76 | ||||||||||
| Unamortized Deferred Financing Costs | (13,654) | |||||||||||||
| Total Consolidated Debt, net | $1,672,312 | |||||||||||||
| Partners’ Share | (72,770) | |||||||||||||
| VRE Share of Total Consolidated Debt, net2 | $1,599,542 | |||||||||||||
| Unconsolidated Secured Debt | ||||||||||||||
| VRE Share | $293,450 | 53.2% | 4.72% | 4.00 | ||||||||||
| Partners’ Share | 257,796 | 46.8% | 4.72% | 4.00 | ||||||||||
| Total Unconsolidated Secured Debt | $551,246 | 100.0% | 4.72% | 4.00 | ||||||||||
| Pro Rata Debt Portfolio | ||||||||||||||
| Fixed Rate & Hedged Secured Debt | $1,899,646 | 100.0% | 4.95% | 3.10 | ||||||||||
| Variable Rate Secured Debt | — | —% | —% | — | ||||||||||
| Total Pro Rata Debt Portfolio | $1,899,646 | 100.0% | 4.95% | 3.10 | ||||||||||
| Pro Forma | |||||
| Total Consolidated Debt, net on 12/31/24 | 1,685,966 | ||||
| Partners' Share | (72,770) | ||||
| VRE Share of Total Consolidated Debt, net as of 12/31/24 | 1,613,196 | ||||
| Repayment of outstanding Revolver borrowings from sale of 65 Livingston in January 2025 | (7,000) | ||||
| VRE Share of Total Consolidated Debt, net on 2/20/25 | 1,606,196 | ||||
| VRE Share of Total Unconsolidated Debt, net on 12/31/24 | 293,450 | ||||
| Total Pro Rata Debt Portfolio | 1,899,646 | ||||
1 Variable rate debt includes the unhedged balance on the Revolver at year end.
2 Minority interest share of consolidated debt is comprised of $33.7 million at BLVD 425, $29.7 million at BLVD 401 and $9.3 million at Port Imperial South Garage.
3 The Term Loan, Revolver and Unused Revolver Capacity are are shown with the one-year extension option utilized on the facilities. At quarter end, the Term Loan was fully drawn and hedged at a strike of 3.5%, expiring July 2026. The Revolver is partially capped with $150 million notional capped at a strike rate of 3.5%, expiring in June 2025.
4 The graphic reflects consolidated debt balances only. Dollars are shown in millions.
17
Annex 1: Transaction Activity
| $ in thousands except per SF | |||||||||||||||||
| Location | Transaction Date | Number of Buildings | SF | Gross Asset Value | |||||||||||||
| 2024 Dispositions | |||||||||||||||||
| Land | |||||||||||||||||
| 2 Campus Drive | Parsippany-Troy Hills, NJ | 1/3/2024 | N/A | N/A | $9,700 | ||||||||||||
| 107 Morgan | Jersey City, NJ | 4/16/2024 | N/A | N/A | 54,000 | ||||||||||||
| 6 Becker/85 Livingston | Roseland, NJ | 4/30/2024 | N/A | N/A | 27,900 | ||||||||||||
| Subtotal Land | $91,600 | ||||||||||||||||
| Multifamily | |||||||||||||||||
| Metropolitan Lofts1 | Morristown, NJ | 1/12/2024 | 1 | 54,683 | $30,300 | ||||||||||||
| Subtotal Multifamily | 1 | 54,683 | $30,300 | ||||||||||||||
| Office | |||||||||||||||||
| Harborside 5 | Jersey City, NJ | 3/20/2024 | 1 | 977,225 | $85,000 | ||||||||||||
| Subtotal Office | 1 | 977,225 | $85,000 | ||||||||||||||
| Retail | |||||||||||||||||
| Shops at 40 Park2 | Morristown, NJ | 10/22/2024 | 1 | 50,973 | $15,700 | ||||||||||||
| Subtotal Retail | 1 | 50,973 | $15,700 | ||||||||||||||
| 2024 Dispositions Total | $222,600 | ||||||||||||||||
| 2025 Dispositions-to-Date | |||||||||||||||||
| Land | |||||||||||||||||
| 65 Livingston | Roseland, NJ | 1/24/2025 | N/A | N/A | $7,300 | ||||||||||||
| 2025 Dispositions-to-Date | $7,300 | ||||||||||||||||
| Under Binding Contract | |||||||||||||||||
| Wall Land | Wall Township, NJ | N/A | N/A | ||||||||||||||
| 1 Water Street | White Plains, NY | N/A | N/A | ||||||||||||||
1 The joint venture sold the property; releasing approximately $6 million of net proceeds to the Company.
2 The Company`s joint venture sold the Shops at 40 Park retail for $15.7 million, of which the Company did not receive any net proceeds after repayment of property-level debt, selling expenses, and preferred return distributions to its joint venture partner.
18
Annex 2: Reconciliation of Net Income (loss) to NOI (three months ended)
| 4Q 2024 | 3Q 2024 | ||||||||||
| Total | Total | ||||||||||
| Net Income (loss) | $ | (14,023) | $ | (10,907) | |||||||
| Deduct: | |||||||||||
| Loss (income) from discontinued operations | 1,015 | (206) | |||||||||
| Realized gains (losses) and unrealized gains (losses) on disposition of rental property and impairments, net | (1,899) | — | |||||||||
| Management fees | (751) | (794) | |||||||||
| Interest and other investment income | (111) | (181) | |||||||||
| Equity in (earnings) loss of unconsolidated joint ventures | (1,015) | 268 | |||||||||
| (Gain) loss from extinguishment of debt, net | — | (8) | |||||||||
| (Gain) loss on sale of unconsolidated joint venture interests | 154 | — | |||||||||
| Other (income) expense, net | 396 | 310 | |||||||||
| Add: | |||||||||||
| Property management | 3,877 | 3,762 | |||||||||
| General and administrative | 10,040 | 8,956 | |||||||||
| Transaction-related costs | 159 | — | |||||||||
| Depreciation and amortization | 21,182 | 21,159 | |||||||||
| Interest expense | 23,293 | 21,507 | |||||||||
| Provision for income taxes | 2 | 39 | |||||||||
| Land and other impairments, net | — | 2,619 | |||||||||
| Net operating income (NOI) | $ | 42,319 | $ | 46,524 | |||||||
| Summary of Consolidated Multifamily NOI by Type (unaudited): | 4Q 2024 | 3Q 2024 | |||||||||
| Total Consolidated Multifamily - Operating Portfolio | $ | 41,612 | $ | 43,477 | |||||||
| Total Consolidated Commercial | 495 | 927 | |||||||||
| Total NOI from Consolidated Properties (excl. unconsolidated JVs/subordinated interests) | $ | 42,107 | $ | 44,404 | |||||||
| NOI (loss) from services, land/development/repurposing & other assets | 398 | 427 | |||||||||
| Total Consolidated Multifamily NOI | $ | 42,505 | $ | 44,831 | |||||||
See Consolidated Statement of Operations page.
19
Annex 3: Consolidated Statement of Operations and Non-GAAP Financial Footnotes
FFO, Core FFO, AFFO, NOI, & Adjusted EBITDA
1.Calculated based on weighted average common shares outstanding, assuming redemption of Operating Partnership common units into common shares 9,653 and 8,696 shares for the three months ended December 31, 2024 and 2023, respectively, and 9,472 and 8,929 for the twelve months ended December 31, 2024 and 2023, respectively, plus dilutive Common Stock Equivalents (i.e. stock options).
2.Includes the Company’s share from unconsolidated joint ventures, and adjustments for noncontrolling interest of $2.6 million and $2.6 million for the three months ended December 31, 2024 and 2023, respectively, and $10.2 million and $10.3 million for the twelve months ended December 31, 2024 and 2023, respectively. Excludes non-real estate-related depreciation and amortization of $0.2 million and $0.2 million for the three months ended December 31, 2024 and 2023, respectively, and $0.8 million and $1.0 million for the twelve months ended December 31, 2024 and 2023, respectively.
3.Funds from operations is calculated in accordance with the definition of FFO of the National Association of Real Estate Investment Trusts (Nareit). See Non-GAAP Financial Definitions for information About FFO, Core FFO, AFFO, NOI & Adjusted EBITDA.
4.Accounting for the impact of Severance/Compensation related costs, General and Administrative expense was $10.0 million and $9.9 million for the three months ended December 31, 2024 and 2023, respectively, and $37.0 million and $36.5 million for the twelve months ended December 31, 2024 and 2023, respectively.
5.Accounting for the impact of Severance/Compensation related costs, Property Management expense was $3.1 million and $3.5 million for the three months ended December 31, 2024 and 2023, respectively, and $14.1 million and $13.1 million for the twelve months ended December 31, 2024 and 2023, respectively.
6.Includes the Company's share from unconsolidated joint ventures of $20 thousand and $92 thousand for the three months and twelve months ended December 31, 2024.
7.Includes the Company's share from unconsolidated joint ventures of $59 thousand and $23 thousand for the three months ended December 31, 2024 and 2023, respectively, and $94 thousand and ($4) thousand for the twelve months ended December 31, 2024 and 2023, respectively.
8.Excludes expenditures for tenant spaces in properties that have not been owned by the Company for at least a year.
Back to Consolidated Statement of Operations page.
Back to FFO, Core FFO and Core AFFO page.
Back to Adjusted EBITDA page
20
Annex 4: Unconsolidated Joint Ventures
($ in thousands)
| Property | Units | Percentage Occupied | VRE's Nominal Ownership1 | 4Q 2024 NOI2 | Total Debt | VRE Share of 4Q NOI | VRE Share of Debt | ||||||||||||||||
| Multifamily | |||||||||||||||||||||||
| Urby Harborside | 762 | 94.4% | 85.0% | $6,455 | $182,604 | $5,487 | $155,213 | ||||||||||||||||
| RiverTrace at Port Imperial | 316 | 94.4% | 22.5% | 2,243 | 82,000 | 505 | 18,450 | ||||||||||||||||
| Capstone at Port Imperial | 360 | 95.1% | 40.0% | 3,243 | 135,000 | 1,297 | 54,000 | ||||||||||||||||
| Riverpark at Harrison | 141 | 95.7% | 45.0% | 626 | 30,192 | 282 | 13,586 | ||||||||||||||||
| Metropolitan at 40 Park | 130 | 93.7% | 25.0% | 771 | 34,100 | 193 | 8,525 | ||||||||||||||||
| Station House | 378 | 91.8% | 50.0% | 2,005 | 87,350 | 1,003 | 43,675 | ||||||||||||||||
| Total Multifamily | 2,087 | 94.1% | 55.0% | $15,343 | $551,246 | $8,766 | $293,450 | ||||||||||||||||
| Total UJV | 2,087 | 94.1% | 55.0% | $15,343 | $551,246 | $8,766 | $293,450 | ||||||||||||||||
| Retail Sold in 4Q | |||||||||||||||||||||||
| Shops at 40 Park3 | N/A | 69.0% | 25.0% | 68 | — | 17 | — | ||||||||||||||||
| Total Retail Sold in 4Q | N/A | 69.0% | 25.0% | $68 | $— | $17 | $— | ||||||||||||||||
1 Amounts represent the Company's share based on ownership percentage.
2 The sum of property level revenue, straight line and ASC 805 adjustments; less: operating expenses, real estate taxes and utilities.
3 The Company`s joint venture sold the Shops at 40 Park retail for $15.7 million, of which the Company did not receive any net proceeds after repayment of property-level debt, selling expenses, and preferred return distributions to its joint venture partner.
21
Annex 5: Debt Profile Footnotes
1.Effective rate of debt, including deferred financing costs, comprised of the cost of terminated treasury lock agreements (if any), debt initiation costs, mark-to-market adjustment of acquired debt and other transaction costs, as applicable.
2.The loan on Soho Lofts was prepaid in full on June 28, 2024, through a $55 million Term Loan draw.
3.The loan on 145 Front Street was prepaid in full on May 22, 2024, using cash on hand.
4.The loan on Signature Place was repaid on August 1, 2024, through a $43 million Term Loan draw.
5.The loan on Liberty Towers was repaid on September 30, 2024, through a combination of a $102 million Term Loan draw, $157 million Revolver draw and cash on hand.
6.The loan on Portside at East Pier is hedged with a 3-year cap at a strike rate of 3.5%, expiring in September 2026.
7.The loan on Upton was hedged with an interest rate cap at a strike rate of 1.0% that expired in October 2024. The Company elected to place a new interest rate cap at a strike of 3.5%, expiring in November 2026.
8.The loan on RiverHouse 9 is hedged with an interest rate cap at a strike rate of 3.5%, expiring in July 2026.
9.Effective rate reflects the fixed rate period, which ends on January 1, 2026. After that period ends, the Company must make a one-time interest rate election of either: (a) the floating-rate option, the sum of the highest prime rate as published in the New York Times on each applicable Rate Change Date plus 2.75% annually or (b) the fixed-rate option, the sum of the Five Year Fixed Rate Advance of the Federal Home Loan Bank of New York in effects as of the first business day of the month which is three months prior to the Rate Change Date plus 3.00% annually.
10.The Company's facilities consist of a $300 million Revolver and $200 million delayed-draw Term Loan and are supported by a group of eight lenders. The eight lenders consists of JP Morgan Chase and Bank of New York Mellon as Joint Bookrunners; Bank of America Securities, Capital One, Goldman Sachs Bank USA, and RBC Capital Markets as Joint Lead Arrangers; and Associated Bank and Eastern Bank as participants. The facilities have a three-year term ending April 22, 2027, with a one-year extension option. The Term Loan was accessed three times ($55 million in June, $43 million in August and $102 million in September) and was fully drawn as of December 31, 2024. The three Term Loan tranches are hedged with interest rate caps at strike rates of 3.5%, expiring in July 2026. As of December 31, 2024, the balance outstanding under the Revolver was $152 million, of which $150 million was hedged with an interest rate cap at a strike rate of 3.5%, expiring in June 2025.
| Balance as of December 31, 2024 | Initial Spread | Deferred Financing Costs | 5 bps reduction KPI | Updated Spread | SOFR or SOFR Cap | All In Rate | |||||||||||||||||
| Secured Revolving Credit Facility (Unhedged) | $2,000,000 | 2.10% | 0.67% | (0.05)% | 2.72% | 4.36% | 7.08% | ||||||||||||||||
| Secured Revolving Credit Facility | $150,000,000 | 2.10% | 0.67% | (0.05)% | 2.72% | 3.50% | 6.22% | ||||||||||||||||
| Secured Term Loan | $200,000,000 | 2.10% | 0.68% | (0.05)% | 2.73% | 3.50% | 6.23% | ||||||||||||||||
Back to Debt Profile page.
22
Annex 6: Multifamily Property Information
| Location | Ownership | Apartments | Rentable SF1 | Average Size | Year Complete | |||||||||||||||
| NJ Waterfront | ||||||||||||||||||||
| Haus25 | Jersey City, NJ | 100.0% | 750 | 617,787 | 824 | 2022 | ||||||||||||||
| Liberty Towers | Jersey City, NJ | 100.0% | 648 | 602,210 | 929 | 2003 | ||||||||||||||
| BLVD 401 | Jersey City, NJ | 74.3% | 311 | 273,132 | 878 | 2016 | ||||||||||||||
| BLVD 425 | Jersey City, NJ | 74.3% | 412 | 369,515 | 897 | 2003 | ||||||||||||||
| BLVD 475 | Jersey City, NJ | 100.0% | 523 | 475,459 | 909 | 2011 | ||||||||||||||
| Soho Lofts | Jersey City, NJ | 100.0% | 377 | 449,067 | 1,191 | 2017 | ||||||||||||||
| Urby Harborside | Jersey City, NJ | 85.0% | 762 | 474,476 | 623 | 2017 | ||||||||||||||
| RiverHouse 9 at Port Imperial | Weehawken, NJ | 100.0% | 313 | 245,127 | 783 | 2021 | ||||||||||||||
| RiverHouse 11 at Port Imperial | Weehawken, NJ | 100.0% | 295 | 250,591 | 849 | 2018 | ||||||||||||||
| RiverTrace | West New York, NJ | 22.5% | 316 | 295,767 | 936 | 2014 | ||||||||||||||
| Capstone | West New York, NJ | 40.0% | 360 | 337,991 | 939 | 2021 | ||||||||||||||
| NJ Waterfront Subtotal | 85.0% | 5,067 | 4,391,122 | 867 | ||||||||||||||||
| Massachusetts | ||||||||||||||||||||
| Portside at East Pier | East Boston, MA | 100.0% | 180 | 154,859 | 862 | 2015 | ||||||||||||||
| Portside 2 at East Pier | East Boston, MA | 100.0% | 296 | 230,614 | 779 | 2018 | ||||||||||||||
| 145 Front at City Square | Worcester, MA | 100.0% | 365 | 304,936 | 835 | 2018 | ||||||||||||||
| The Emery at Overlook Ridge | Revere, MA | 100.0% | 326 | 273,140 | 838 | 2020 | ||||||||||||||
| Massachusetts Subtotal | 100.0% | 1,167 | 963,549 | 826 | ||||||||||||||||
| Other | ||||||||||||||||||||
| The Upton | Short Hills, NJ | 100.0% | 193 | 217,030 | 1,125 | 2021 | ||||||||||||||
| The James | Park Ridge, NJ | 100.0% | 240 | 215,283 | 897 | 2021 | ||||||||||||||
| Signature Place | Morris Plains, NJ | 100.0% | 197 | 203,716 | 1,034 | 2018 | ||||||||||||||
| Quarry Place at Tuckahoe | Eastchester, NY | 100.0% | 108 | 105,551 | 977 | 2016 | ||||||||||||||
| Riverpark at Harrison | Harrison, NJ | 45.0% | 141 | 124,774 | 885 | 2014 | ||||||||||||||
| Metropolitan at 40 Park | Morristown, NJ | 25.0% | 130 | 124,237 | 956 | 2010 | ||||||||||||||
| Station House | Washington, DC | 50.0% | 378 | 290,348 | 768 | 2015 | ||||||||||||||
| Other Subtotal | 73.8% | 1,387 | 1,280,939 | 924 | ||||||||||||||||
Operating Portfolio2 | 85.2% | 7,621 | 6,635,610 | 871 | ||||||||||||||||
Back to Multifamily Operating Portfolio page.
1 Total sf outlined above excludes approximately 189,367 sqft of ground floor retail, of which 142,739 sf was leased as of December 31, 2024.
2 Rental revenue associated with retail leases is included in the NOI disclosure on the Multifamily Operating Portfolio page.
23
Annex 7: Noncontrolling Interests in Consolidated Joint Ventures
| Three Months Ended December 31, | Twelve Months Ended December 31, | ||||||||||||||||
| 2024 | 2023 | 2024 | 2023 | ||||||||||||||
| BLVD 425 | $ | 96 | $ | 72 | $ | 423 | $ | 202 | |||||||||
| BLVD 401 | (571) | (568) | (2,258) | (2,487) | |||||||||||||
| Port Imperial Garage South | (2) | (12) | (5) | (52) | |||||||||||||
| Port Imperial Retail South | 18 | 29 | 52 | 113 | |||||||||||||
| Other consolidated joint ventures | (36) | (25) | (136) | (95) | |||||||||||||
| Net losses in noncontrolling interests | $ | (495) | $ | (504) | $ | (1,924) | $ | (2,319) | |||||||||
| Depreciation in noncontrolling interests | 744 | 712 | 2,923 | 2,853 | |||||||||||||
| Funds from operations - noncontrolling interest in consolidated joint ventures | $ | 249 | $ | 208 | $ | 999 | $ | 534 | |||||||||
| Interest expense in noncontrolling interest in consolidated joint ventures | 786 | 789 | 3,146 | 3,163 | |||||||||||||
| Net operating income before debt service in consolidated joint ventures | $ | 1,035 | $ | 997 | $ | 4,145 | $ | 3,697 | |||||||||
Back to Adjusted EBITDA page.
24
Non-GAAP Financial Definitions
NON-GAAP FINANCIAL MEASURES
Included in this financial package are Funds from Operations, or FFO, Core Funds from Operations, or Core FFO, net operating income, or NOI and Adjusted Earnings Before Interest, Taxes, Depreciation, and Amortization, or Adjusted EBITDA, each a “non-GAAP financial measure,” measuring Veris Residential, Inc.’s historical or future financial performance that is different from measures calculated and presented in accordance with generally accepted accounting principles (“U.S. GAAP”), within the meaning of the applicable Securities and Exchange Commission rules. Veris Residential, Inc. believes these metrics can be a useful measure of its performance which is further defined.
Adjusted Earnings Before Interest, Tax, Depreciation and Amortization (Adjusted "EBITDA")
The Company defines Adjusted EBITDA as Core FFO, plus interest expense, plus income tax expense, plus income (loss) in noncontrolling interest in consolidated joint ventures, and plus adjustments to reflect the entity's share of Adjusted EBITDA of unconsolidated joint ventures. The Company presents Adjusted EBITDA because the Company believes that Adjusted EBITDA, along with cash flow from operating activities, investing activities and financing activities, provides investors with an additional indicator of the Company’s ability to incur and service debt. Adjusted EBITDA should not be considered as an alternative to net income (determined in accordance with GAAP), as an indication of the Company’s financial performance, as an alternative to net cash flows from operating activities (determined in accordance with GAAP), or as a measure of the Company’s liquidity.
Blended Net Rental Growth Rate or Blended Lease Rate
Weighted average of the net effective change in rent (inclusive of concessions) for a lease with a new resident or for a renewed lease compared to the rent for the prior lease of the identical apartment unit.
Core FFO and Adjusted FFO ("AFFO")
Core FFO is defined as FFO, as adjusted for certain items to facilitate comparative measurement of the Company's performance over time. Adjusted FFO ("AFFO") is defined as Core FFO less (i) recurring tenant improvements, leasing commissions, and capital expenditures, (ii) straight-line rents and amortization of acquired above/below market leases, net, and (iii) other non-cash income, plus (iv) other non-cash charges. Core FFO and Adjusted AFFO are presented solely as supplemental disclosure that the Company's management believes provides useful information to investors and analysts of its results, after adjusting for certain items to facilitate comparability of its performance from period to period. Core FFO and Adjusted FFO are non-GAAP financial measures that are not intended to represent cash flow and are not indicative of cash flows provided by operating activities as determined in accordance with GAAP. As there is not a generally accepted definition established for Core FFO and Adjusted FFO, the Company's measures of Core FFO may not be comparable to the Core FFO and Adjusted FFO reported by other REITs. A reconciliation of net income per share to Core FFO and Adjusted FFO in dollars and per share are included in the financial tables accompanying this press release.
Funds From Operations ("FFO")
FFO is defined as net income (loss) before noncontrolling interests in Operating Partnership, computed in accordance with U.S. GAAP, excluding gains or losses from depreciable rental property transactions (including both acquisitions and dispositions), and impairments related to depreciable rental property, plus real estate-related depreciation and amortization. The Company believes that FFO per share is helpful to investors as one of several measures of the performance of an equity REIT. The Company further believes that as FFO per share excludes the effect of depreciation, gains (or losses) from property transactions and impairments related to depreciable rental property (all of which are based on historical costs which may be of limited relevance in evaluating current performance), FFO per share can facilitate comparison of operating performance between equity REITs.
FFO per share should not be considered as an alternative to net income available to common shareholders per share as an indication of the Company’s performance or to cash flows as a measure of liquidity. FFO per share presented herein is not necessarily comparable to FFO per share presented by other real estate companies due to the fact that not all real estate companies use the same definition. However, the Company’s FFO per share is comparable to the FFO per share of real estate companies that use the current definition of the National Association of Real Estate Investment Trusts (“Nareit”). A reconciliation of net income per share to FFO per share is included in the financial tables accompanying this press release.
NOI and Same Store NOI
NOI represents total revenues less total operating expenses, as reconciled to net income above. The Company considers NOI to be a meaningful non-GAAP financial measure for making decisions and assessing unlevered performance of its property types and markets, as it relates to total return on assets, as opposed to levered return on equity. As properties are considered for sale and acquisition based on NOI estimates and projections, the Company utilizes this measure to make investment decisions, as well as compare the performance of its assets to those of its peers. NOI should not be considered a substitute for net income, and the Company’s use of NOI may not be comparable to similarly titled measures used by other companies. The Company calculates NOI before any allocations to noncontrolling interests, as those interests do not affect the overall performance of the individual assets being measured and assessed.
Same Store NOI is presented for the same store portfolio, which comprises all properties that were owned by the Company throughout both of the reporting periods.
25
Company Information
| Company Information | ||||||||
| Corporate Headquarters | Stock Exchange Listing | Contact Information | ||||||
| Veris Residential, Inc. | New York Stock Exchange | Veris Residential, Inc. | ||||||
| 210 Hudson St., Suite 400 | Investor Relations Department | |||||||
| Jersey City, New Jersey 07311 | Trading Symbol | 210 Hudson St., Suite 400 | ||||||
| (732) 590-1010 | Common Shares: VRE | Jersey City, New Jersey 07311 | ||||||
| Mackenzie Rice | ||||||||
| Director, Investor Relations | ||||||||
| E-Mail: investors@verisresidential.com | ||||||||
| Web: www.verisresidential.com | ||||||||
| Executive Officers | ||||||||
| Mahbod Nia | Amanda Lombard | Taryn Fielder | ||||||
| Chief Executive Officer | Chief Financial Officer | General Counsel and Secretary | ||||||
| Anna Malhari | Jeff Turkanis | |||||||
| Chief Operating Officer | EVP & Chief Investment Officer | |||||||
| Equity Research Coverage | ||||||||
| Bank of America Merrill Lynch | BTIG, LLC | Citigroup | ||||||
| Josh Dennerlein | Thomas Catherwood | Nicholas Joseph | ||||||
| Evercore ISI | Green Street Advisors | JP Morgan | ||||||
| Steve Sakwa | John Pawlowski | Anthony Paolone | ||||||
| Truist | ||||||||
| Michael R. Lewis | ||||||||
26