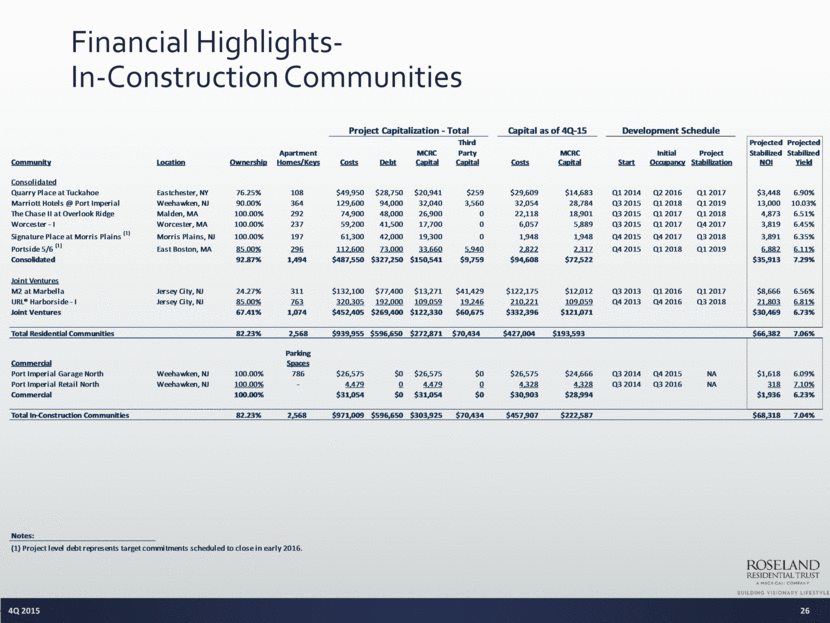
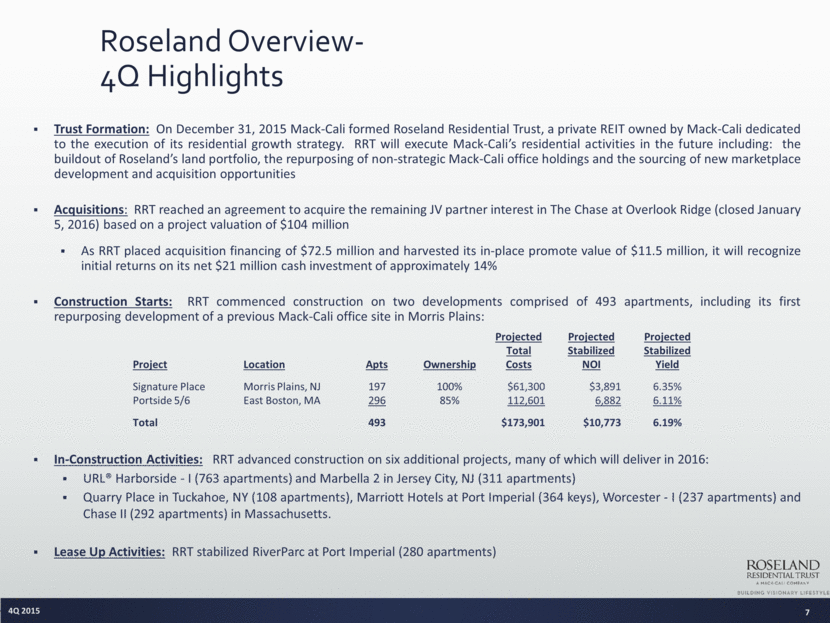
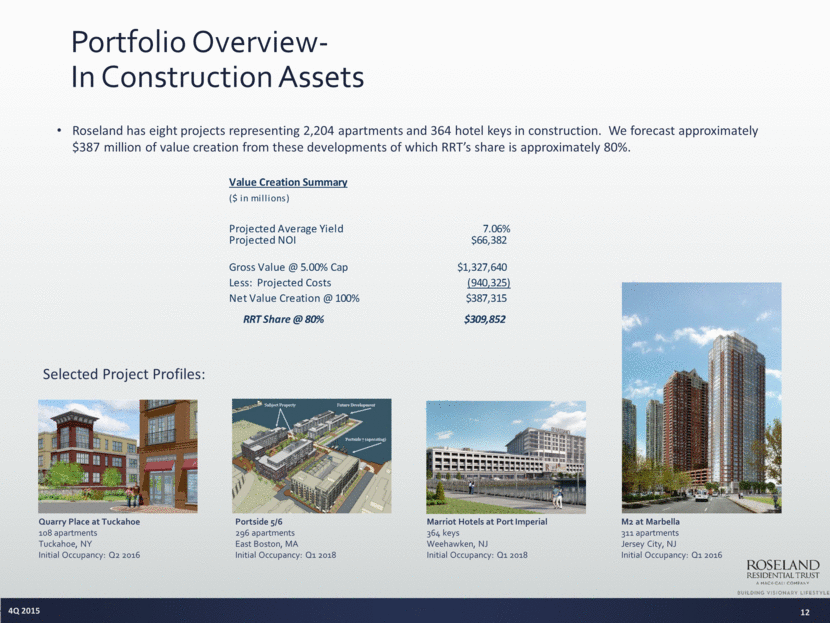
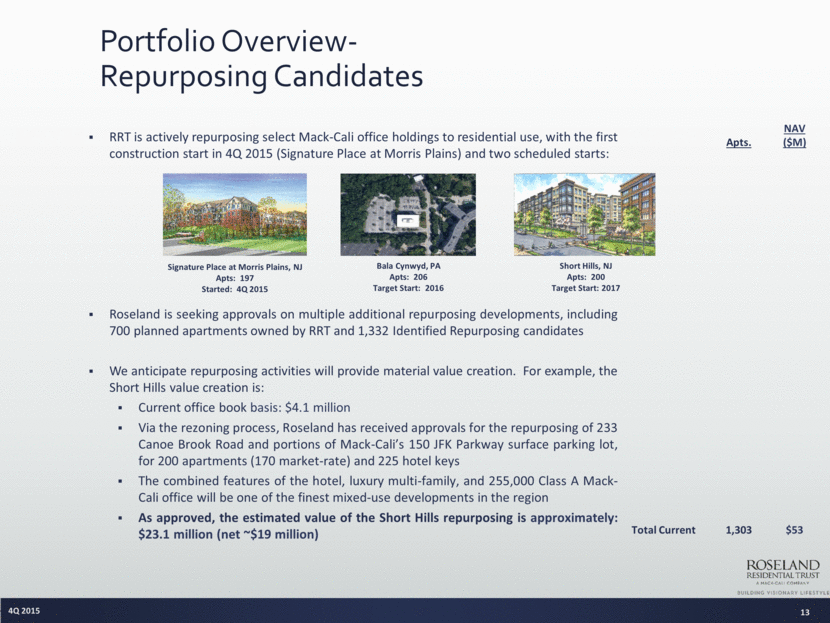
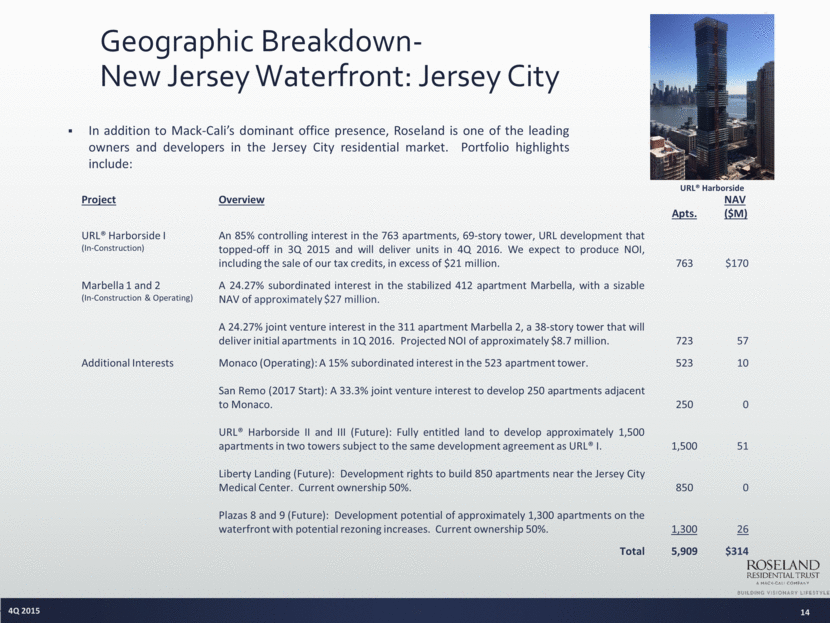
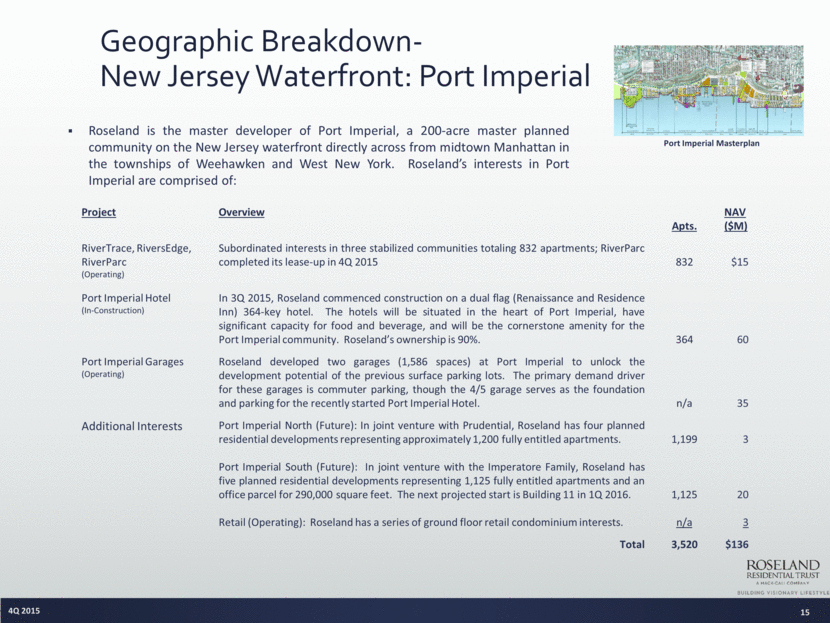
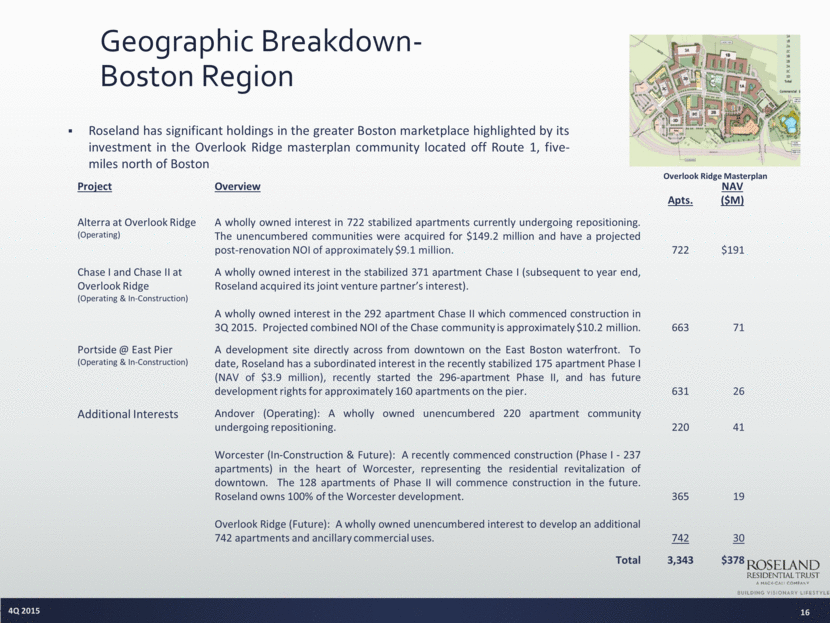
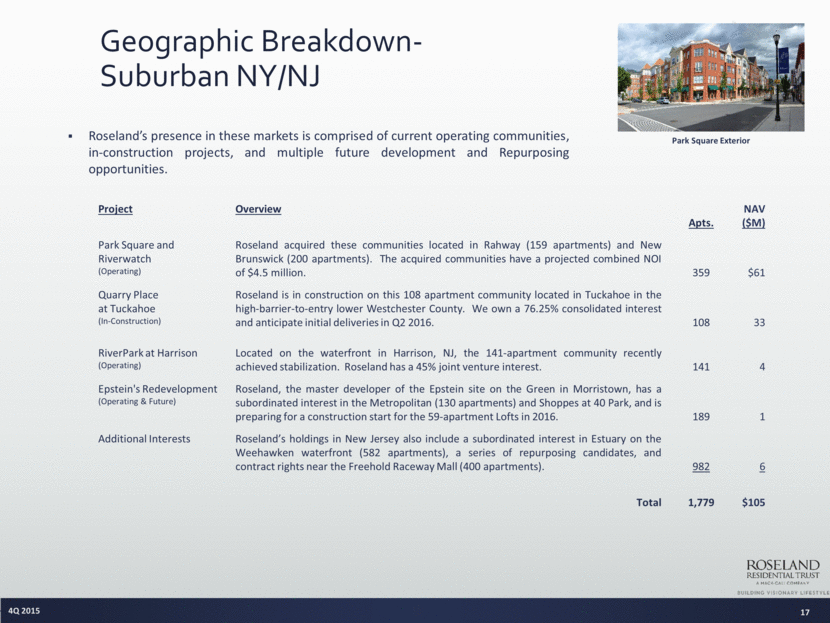
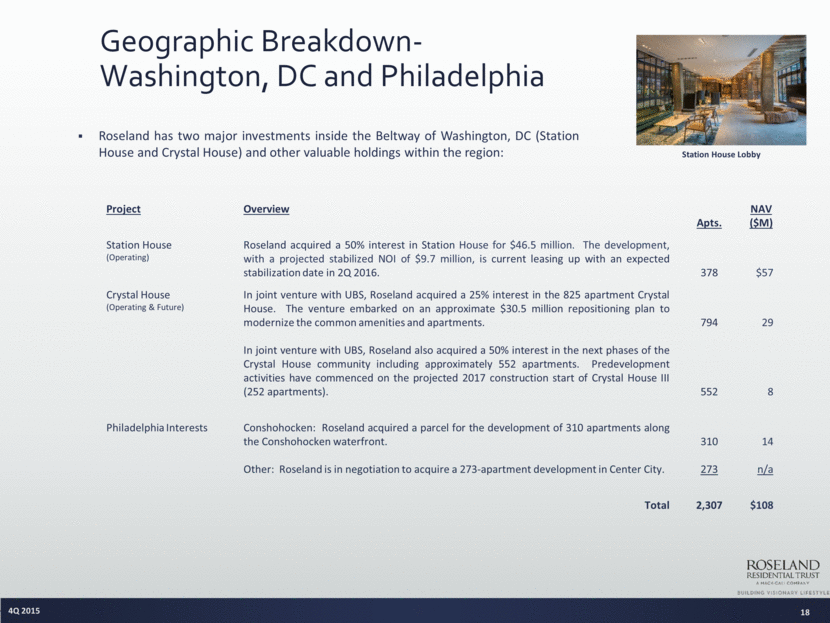
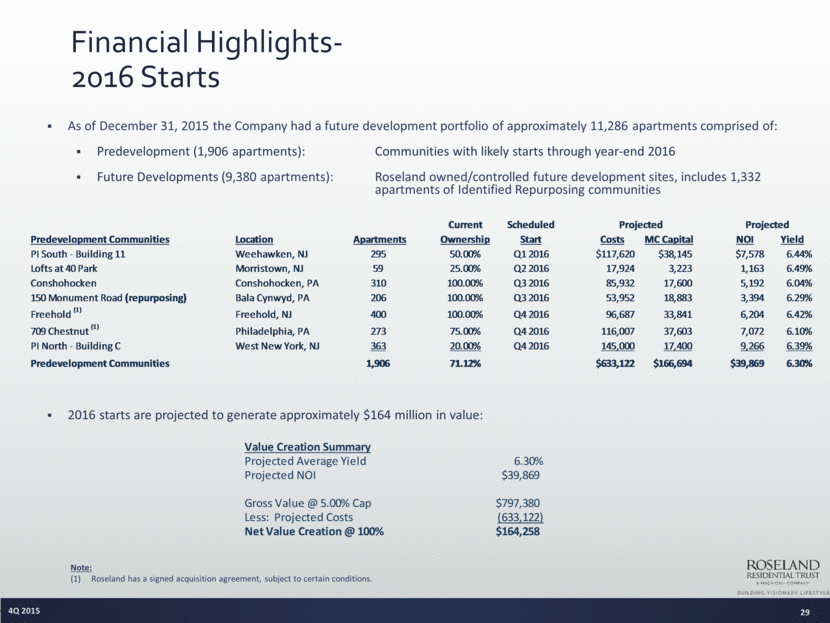
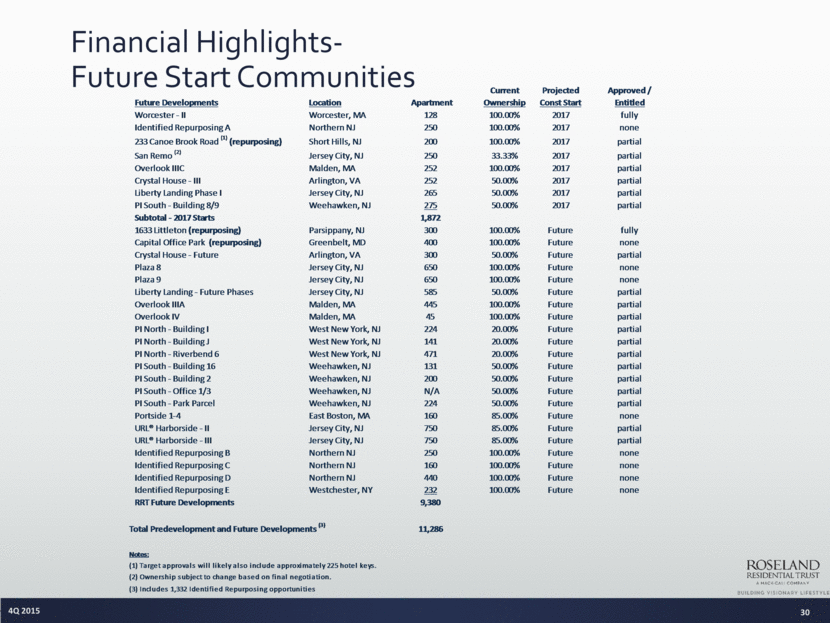
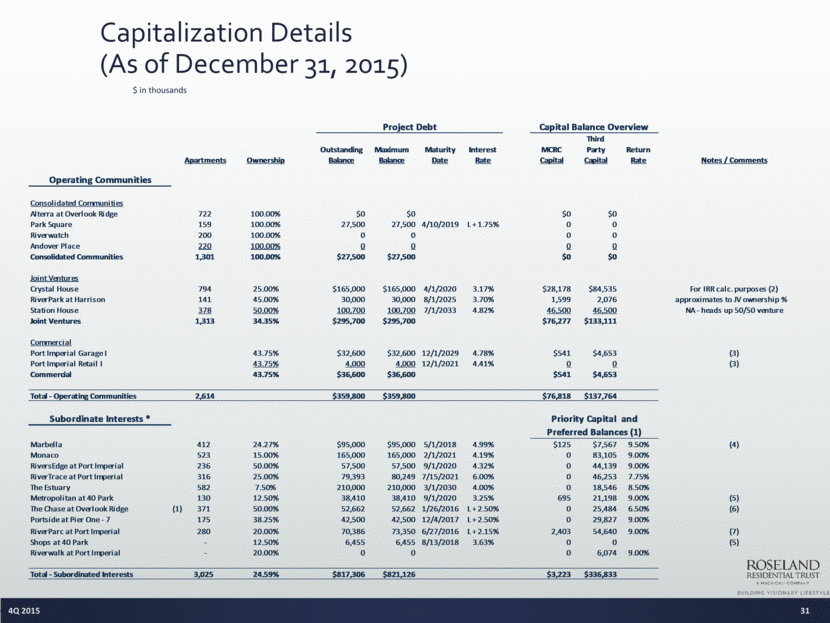
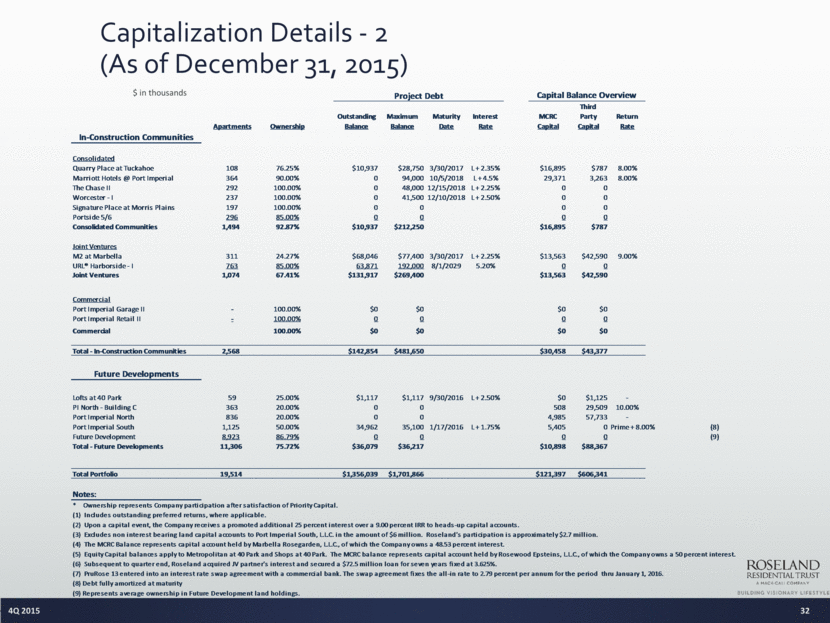
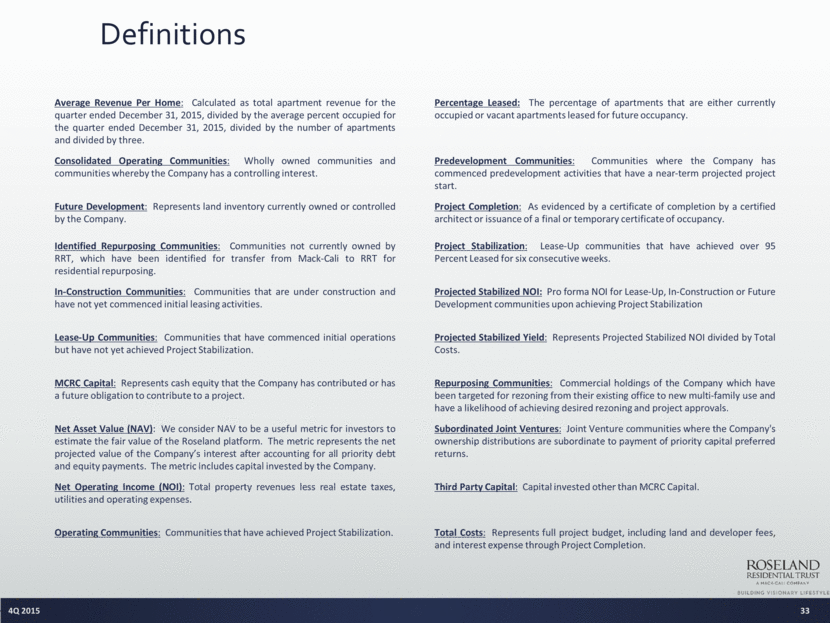
Financial Highlights- In-Construction Communities 26 4Q 2015 Third Projected Projected Apartment MCRC Party MCRC Initial Project Stabilized Stabilized Community Location Ownership Homes/Keys Costs Debt Capital Capital Costs Capital Start Occupancy Stabilization NOI Yield Consolidated Quarry Place at Tuckahoe Eastchester, NY 76.25% 108 $49,950 $28,750 $20,941 $259 $29,609 $14,683 Q1 2014 Q2 2016 Q1 2017 $3,448 6.90% Marriott Hotels @ Port Imperial Weehawken, NJ 90.00% 364 129,600 94,000 32,040 3,560 32,054 28,784 Q3 2015 Q1 2018 Q1 2019 13,000 10.03% The Chase II at Overlook Ridge Malden, MA 100.00% 292 74,900 48,000 26,900 0 22,118 18,901 Q3 2015 Q1 2017 Q1 2018 4,873 6.51% Worcester - I Worcester, MA 100.00% 237 59,200 41,500 17,700 0 6,057 5,889 Q3 2015 Q1 2017 Q4 2017 3,819 6.45% Signature Place at Morris Plains (1) Morris Plains, NJ 100.00% 197 61,300 42,000 19,300 0 1,948 1,948 Q4 2015 Q4 2017 Q3 2018 3,891 6.35% Portside 5/6 (1) East Boston, MA 85.00% 296 112,600 73,000 33,660 5,940 2,822 2,317 Q4 2015 Q1 2018 Q1 2019 6,882 6.11% Consolidated 92.87% 1,494 $487,550 $327,250 $150,541 $9,759 $94,608 $72,522 $35,913 7.29% Joint Ventures M2 at Marbella Jersey City, NJ 24.27% 311 $132,100 $77,400 $13,271 $41,429 $122,175 $12,012 Q3 2013 Q1 2016 Q1 2017 $8,666 6.56% URL® Harborside - I Jersey City, NJ 85.00% 763 320,305 192,000 109,059 19,246 210,221 109,059 Q4 2013 Q4 2016 Q3 2018 21,803 6.81% Joint Ventures 67.41% 1,074 $452,405 $269,400 $122,330 $60,675 $332,396 $121,071 $30,469 6.73% Total Residential Communities 82.23% 2,568 $939,955 $596,650 $272,871 $70,434 $427,004 $193,593 $66,382 7.06% Parking Commercial Spaces Port Imperial Garage North Weehawken, NJ 100.00% 786 $26,575 $0 $26,575 $0 $26,575 $24,666 Q3 2014 Q4 2015 NA $1,618 6.09% Port Imperial Retail North Weehawken, NJ 100.00% - 4,479 0 4,479 0 4,328 4,328 Q3 2014 Q3 2016 NA 318 7.10% Commercial 100.00% $31,054 $0 $31,054 $0 $30,903 $28,994 $1,936 6.23% Total In-Construction Communities 82.23% 2,568 $971,009 $596,650 $303,925 $70,434 $457,907 $222,587 $68,318 7.04% Notes: (1) Project level debt represents target commitments scheduled to close in early 2016. Development Schedule Project Capitalization - Total Capital as of 4Q-15
