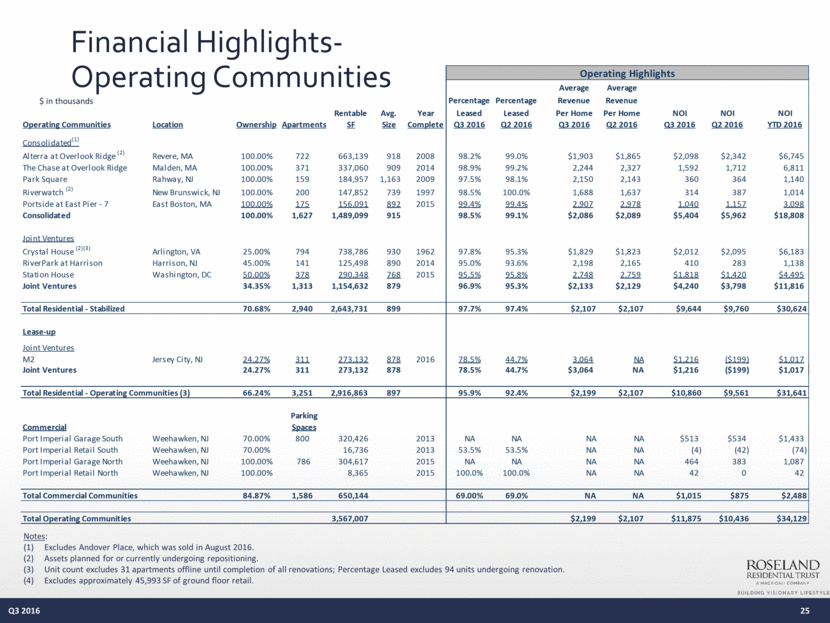
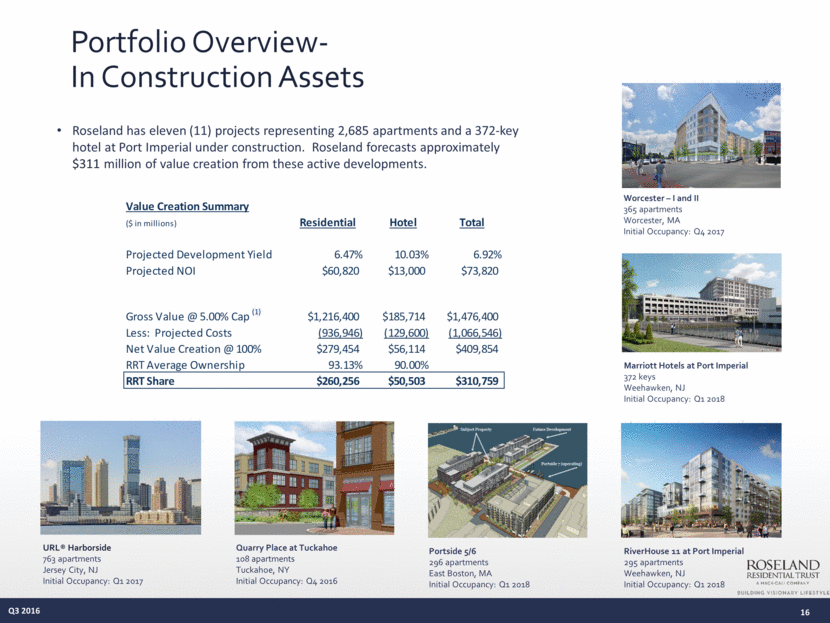
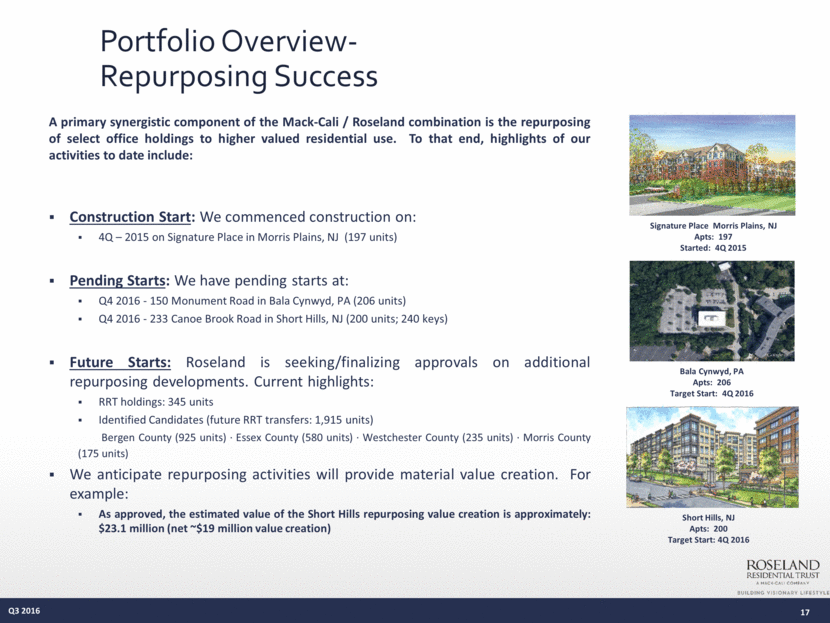
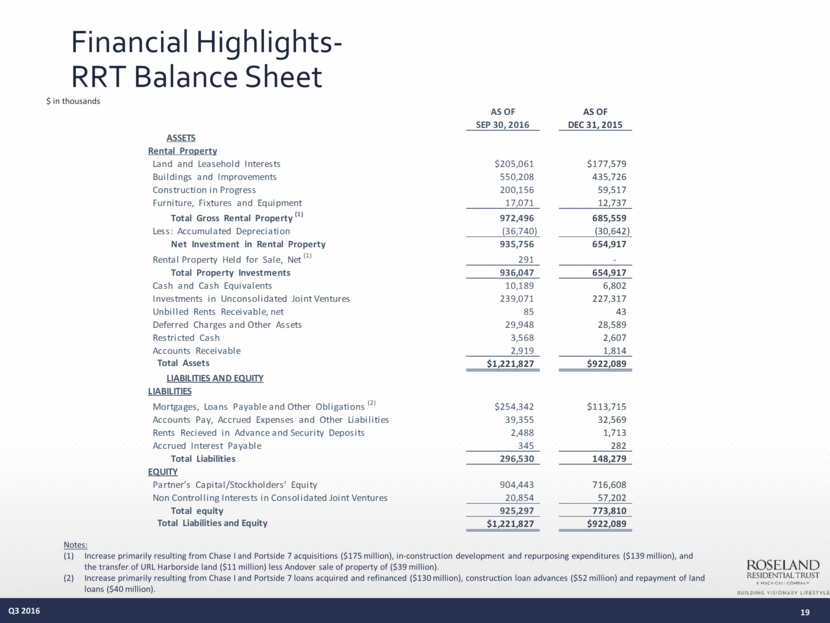
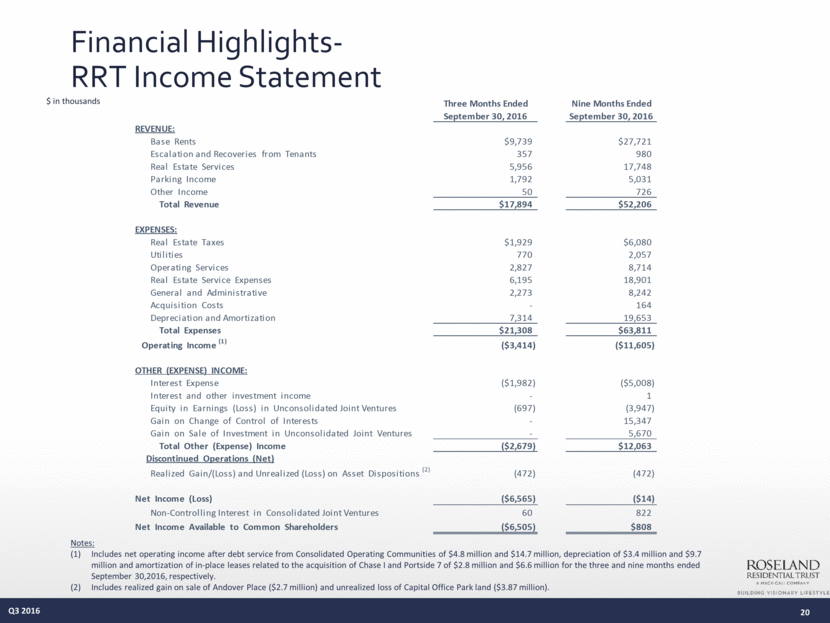
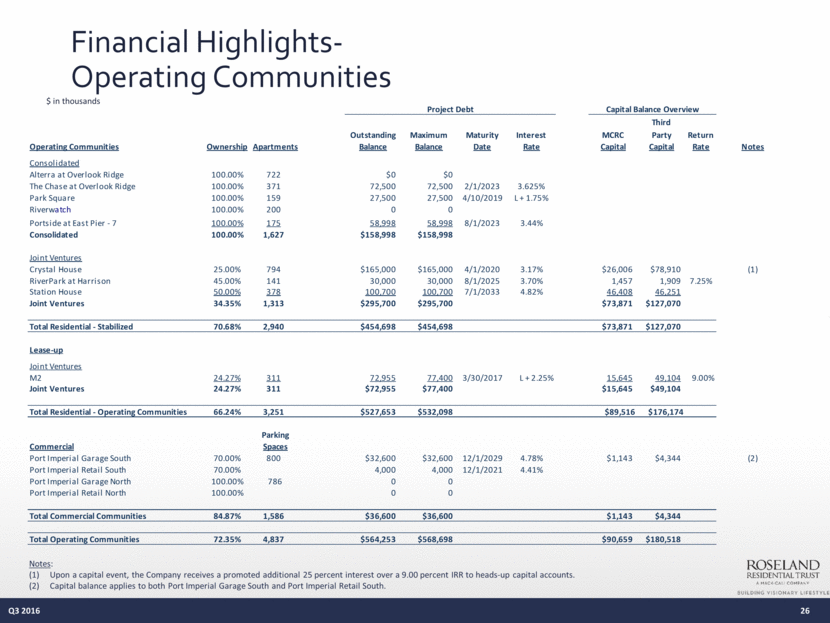
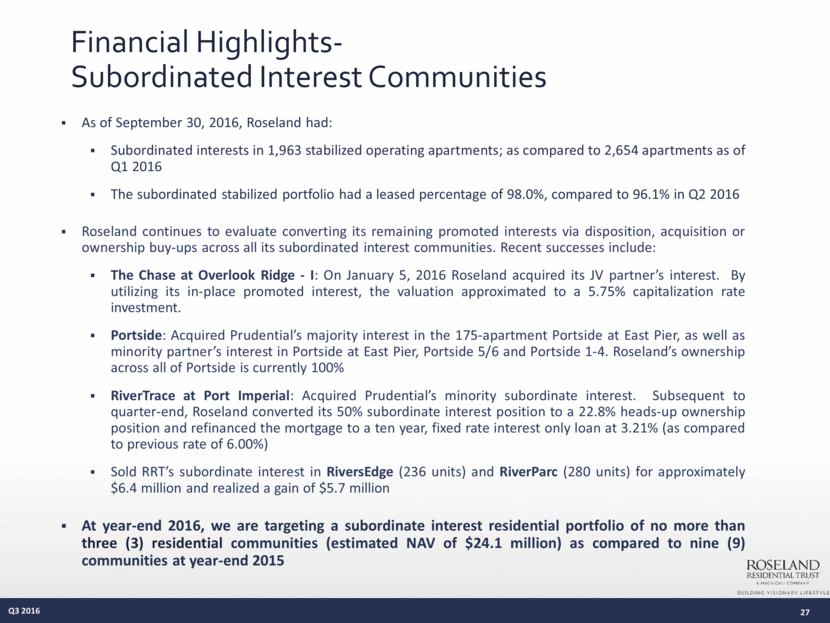
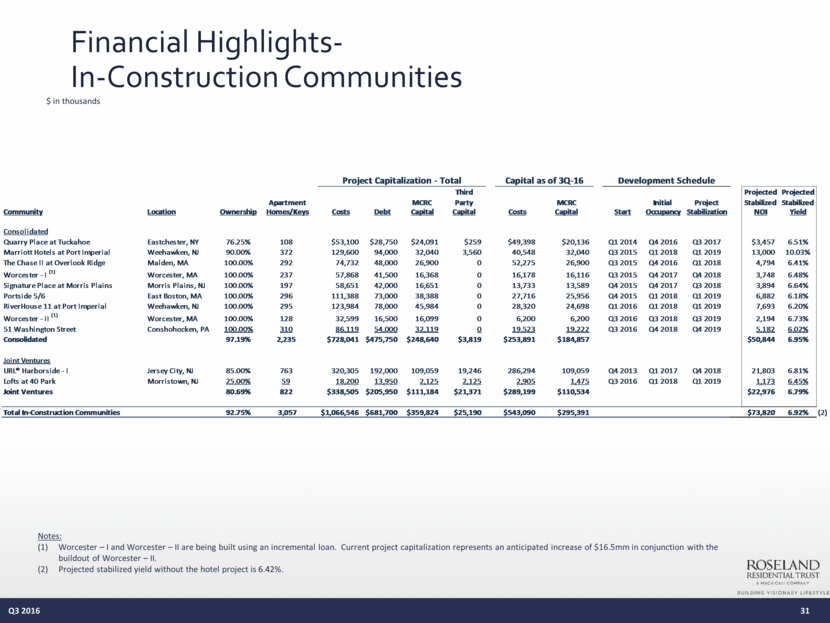
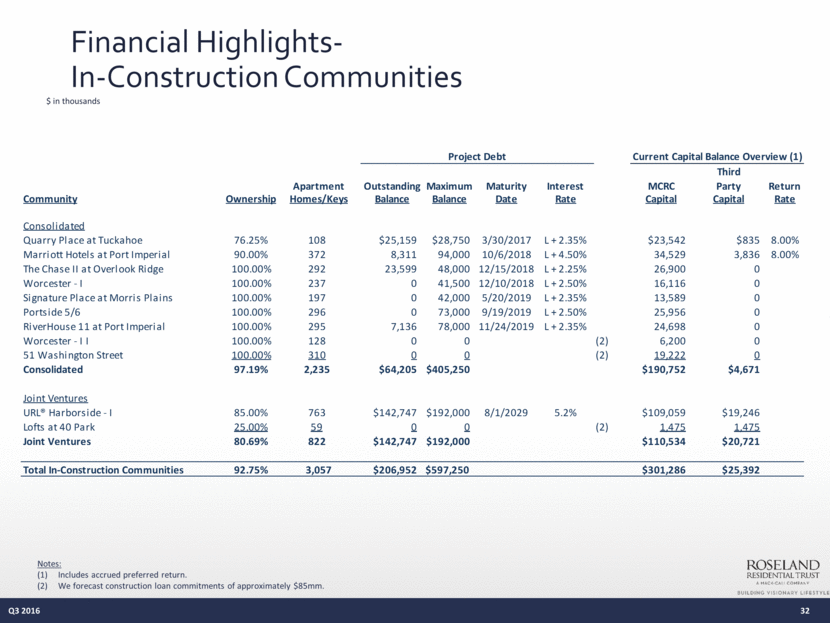
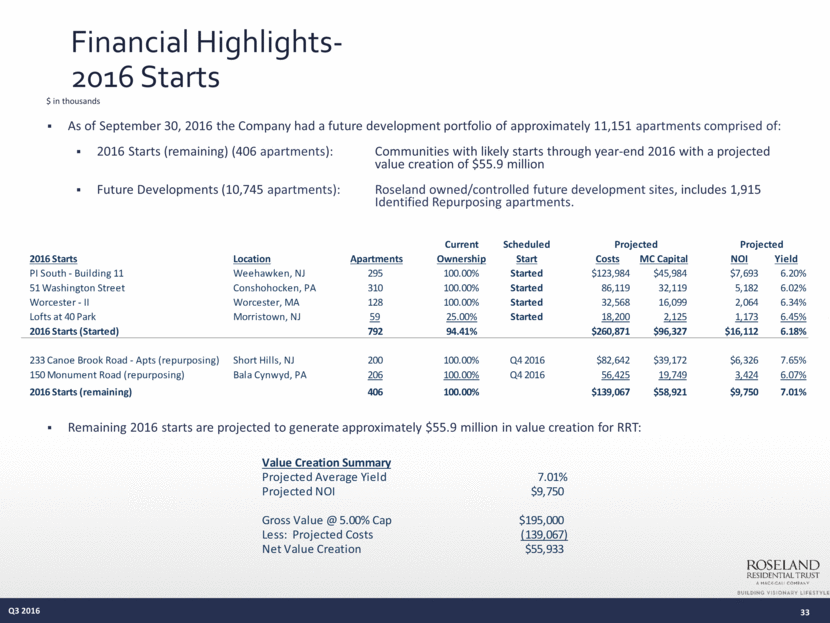
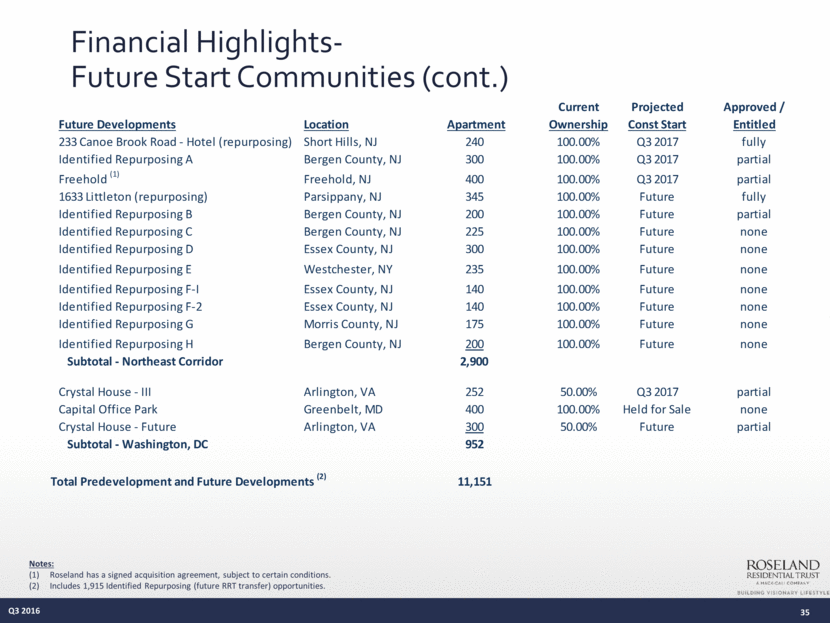
Financial Highlights- Operating Communities 25 Q3 2016 Notes: Excludes Andover Place, which was sold in August 2016. Assets planned for or currently undergoing repositioning. Unit count excludes 31 apartments offline until completion of all renovations; Percentage Leased excludes 94 units undergoing renovation. Excludes approximately 45,993 SF of ground floor retail. $ in thousands Average Average Percentage Percentage Revenue Revenue Rentable Avg. Year Leased Leased Per Home Per Home NOI NOI NOI Operating Communities Location Ownership Apartments SF Size Complete Q3 2016 Q2 2016 Q3 2016 Q2 2016 Q3 2016 Q2 2016 YTD 2016 Consolidated (1) Alterra at Overlook Ridge (2) Revere, MA 100.00% 722 663,139 918 2008 98.2% 99.0% $1,903 $1,865 $2,098 $2,342 $6,745 The Chase at Overlook Ridge Malden, MA 100.00% 371 337,060 909 2014 98.9% 99.2% 2,244 2,327 1,592 1,712 6,811 Park Square Rahway, NJ 100.00% 159 184,957 1,163 2009 97.5% 98.1% 2,150 2,143 360 364 1,140 Riverw atch (2) New Brunswick, NJ 100.00% 200 147,852 739 1997 98.5% 100.0% 1,688 1,637 314 387 1,014 Portside at East Pier - 7 East Boston, MA 100.00% 175 156,091 892 2015 99.4% 99.4% 2,907 2,978 1,040 1,157 3,098 Consolidated 100.00% 1,627 1,489,099 915 98.5% 99.1% $2,086 $2,089 $5,404 $5,962 $18,808 Joint Ventures Crystal House (2)(3) Arlington, VA 25.00% 794 738,786 930 1962 97.8% 95.3% $1,829 $1,823 $2,012 $2,095 $6,183 RiverPark at Harrison Harrison, NJ 45.00% 141 125,498 890 2014 95.0% 93.6% 2,198 2,165 410 283 1,138 Station House Washington, DC 50.00% 378 290,348 768 2015 95.5% 95.8% 2,748 2,759 $1,818 $1,420 $4,495 Joint Ventures 34.35% 1,313 1,154,632 879 96.9% 95.3% $2,133 $2,129 $4,240 $3,798 $11,816 Total Residential - Stabilized 70.68% 2,940 2,643,731 899 97.7% 97.4% $2,107 $2,107 $9,644 $9,760 $30,624 Lease-up Joint Ventures M2 Jersey City, NJ 24.27% 311 273,132 878 2016 78.5% 44.7% 3,064 NA $1,216 ($199) $1,017 Joint Ventures 24.27% 311 273,132 878 78.5% 44.7% $3,064 NA $1,216 ($199) $1,017 Total Residential - Operating Communities (3) 66.24% 3,251 2,916,863 897 95.9% 92.4% $2,199 $2,107 $10,860 $9,561 $31,641 Parking Commercial Spaces Port Imperial Garage South Weehawken, NJ 70.00% 800 320,426 2013 NA NA NA NA $513 $534 $1,433 Port Imperial Retail South Weehawken, NJ 70.00% 16,736 2013 53.5% 53.5% NA NA (4) (42) (74) Port Imperial Garage North Weehawken, NJ 100.00% 786 304,617 2015 NA NA NA NA 464 383 1,087 Port Imperial Retail North Weehawken, NJ 100.00% 8,365 2015 100.0% 100.0% NA NA 42 0 42 Total Commercial Communities 84.87% 1,586 650,144 69.00% 69.0% NA NA $1,015 $875 $2,488 Total Operating Communities 3,567,007 $2,199 $2,107 $11,875 $10,436 $34,129 Operating Highlights
