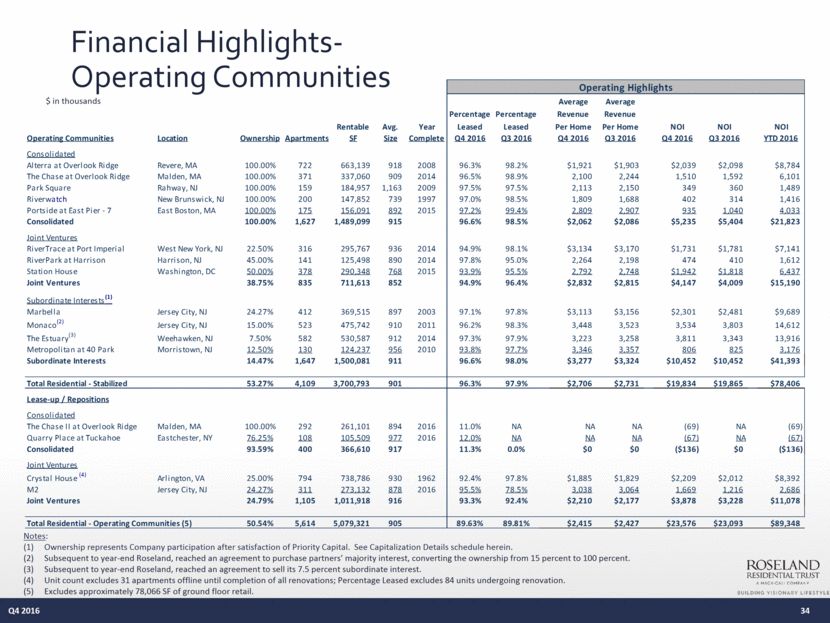
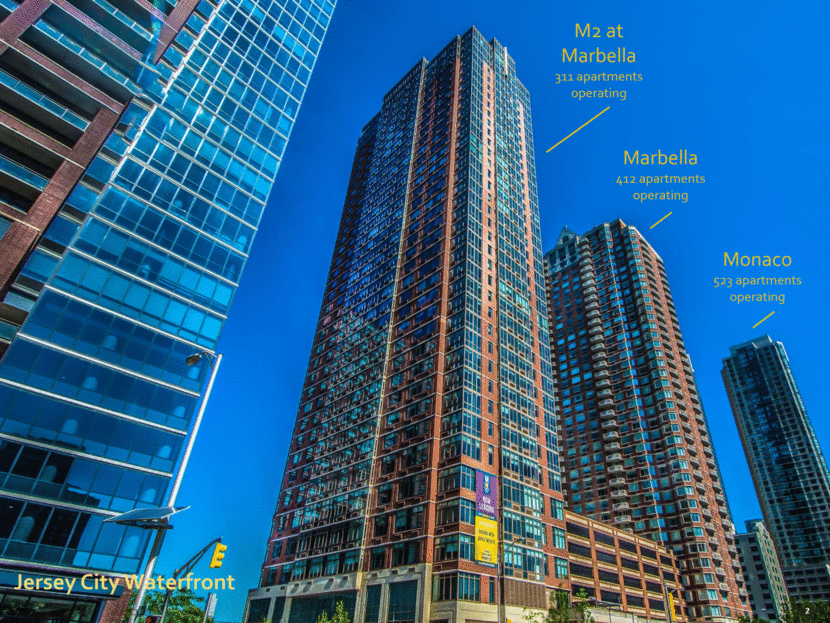
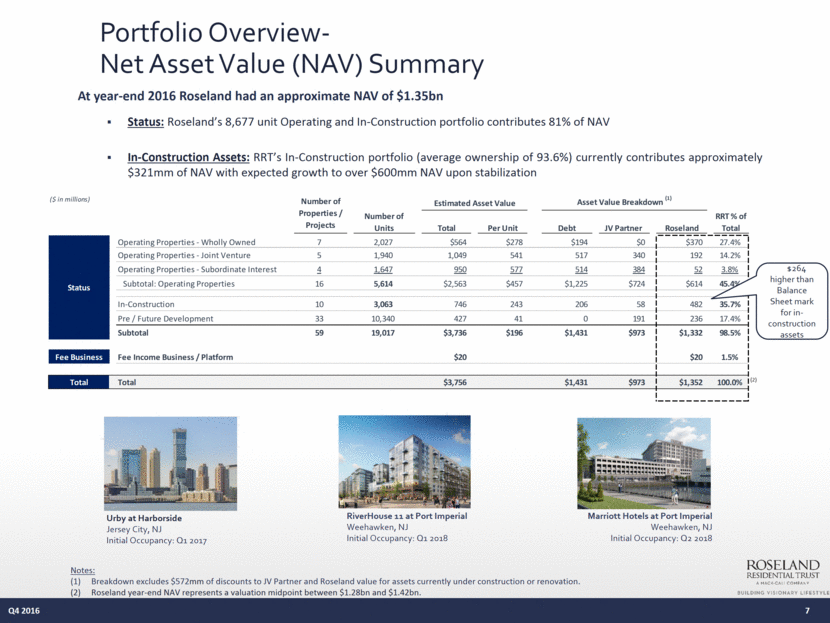
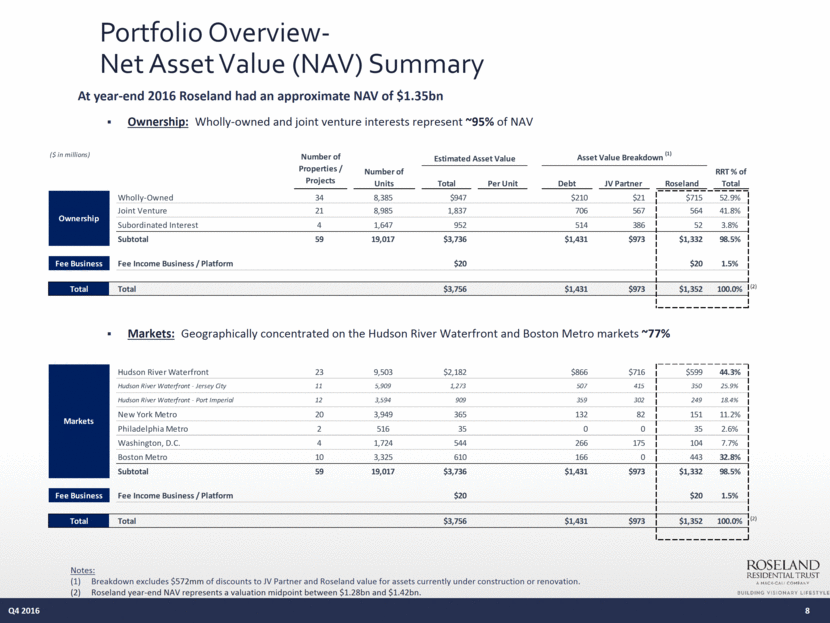
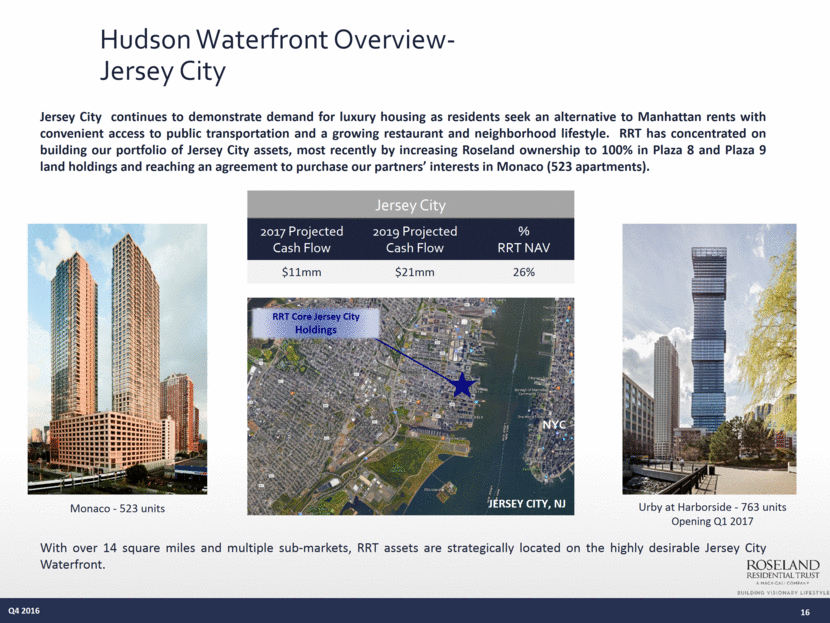
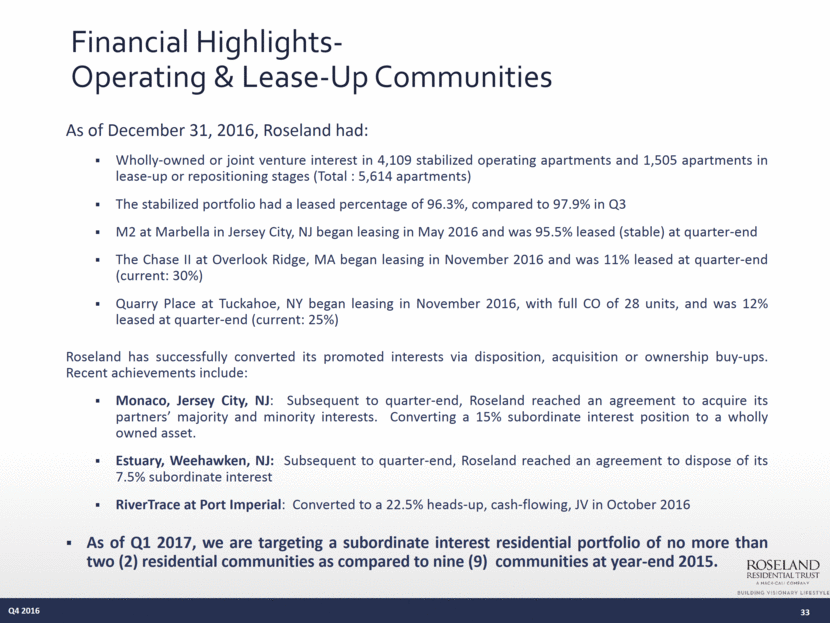
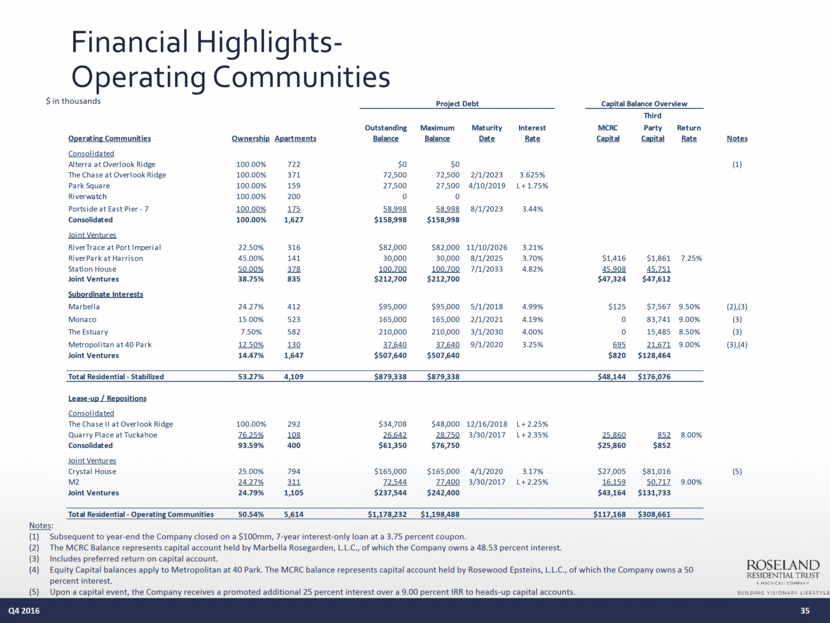
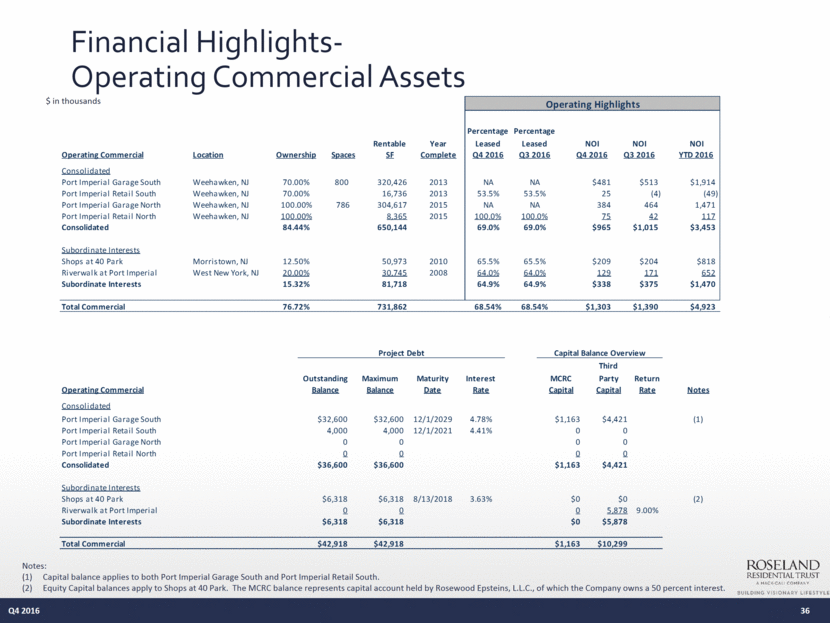
Financial Highlights- Operating Communities 34 Q4 2016 Notes: Ownership represents Company participation after satisfaction of Priority Capital. See Capitalization Details schedule herein. Subsequent to year-end Roseland, reached an agreement to purchase partners’ majority interest, converting the ownership from 15 percent to 100 percent. Subsequent to year-end Roseland, reached an agreement to sell its 7.5 percent subordinate interest. Unit count excludes 31 apartments offline until completion of all renovations; Percentage Leased excludes 84 units undergoing renovation. Excludes approximately 78,066 SF of ground floor retail. $ in thousands Average Average Percentage Percentage Revenue Revenue Rentable Avg. Year Leased Leased Per Home Per Home NOI NOI NOI Operating Communities Location Ownership Apartments SF Size Complete Q4 2016 Q3 2016 Q4 2016 Q3 2016 Q4 2016 Q3 2016 YTD 2016 Consolidated Alterra at Overlook Ridge Revere, MA 100.00% 722 663,139 918 2008 96.3% 98.2% $1,921 $1,903 $2,039 $2,098 $8,784 The Chase at Overlook Ridge Malden, MA 100.00% 371 337,060 909 2014 96.5% 98.9% 2,100 2,244 1,510 1,592 6,101 Park Square Rahway, NJ 100.00% 159 184,957 1,163 2009 97.5% 97.5% 2,113 2,150 349 360 1,489 Riverw atch New Brunswick, NJ 100.00% 200 147,852 739 1997 97.0% 98.5% 1,809 1,688 402 314 1,416 Portside at East Pier - 7 East Boston, MA 100.00% 175 156,091 892 2015 97.2% 99.4% 2,809 2,907 935 1,040 4,033 Consolidated 100.00% 1,627 1,489,099 915 96.6% 98.5% $2,062 $2,086 $5,235 $5,404 $21,823 Joint Ventures RiverTrace at Port Imperial West New York, NJ 22.50% 316 295,767 936 2014 94.9% 98.1% $3,134 $3,170 $1,731 $1,781 $7,141 RiverPark at Harrison Harrison, NJ 45.00% 141 125,498 890 2014 97.8% 95.0% 2,264 2,198 474 410 1,612 Station House Washington, DC 50.00% 378 290,348 768 2015 93.9% 95.5% 2,792 2,748 $1,942 $1,818 6,437 Joint Ventures 38.75% 835 711,613 852 94.9% 96.4% $2,832 $2,815 $4,147 $4,009 $15,190 Subordinate Interests (1) Marbella Jersey City, NJ 24.27% 412 369,515 897 2003 97.1% 97.8% $3,113 $3,156 $2,301 $2,481 $9,689 Monaco (2) Jersey City, NJ 15.00% 523 475,742 910 2011 96.2% 98.3% 3,448 3,523 3,534 3,803 14,612 The Estuary (3) Weehawken, NJ 7.50% 582 530,587 912 2014 97.3% 97.9% 3,223 3,258 3,811 3,343 13,916 Metropolitan at 40 Park Morristown, NJ 12.50% 130 124,237 956 2010 93.8% 97.7% 3,346 3,357 806 825 3,176 Subordinate Interests 14.47% 1,647 1,500,081 911 96.6% 98.0% $3,277 $3,324 $10,452 $10,452 $41,393 Total Residential - Stabilized 53.27% 4,109 3,700,793 901 96.3% 97.9% $2,706 $2,731 $19,834 $19,865 $78,406 Lease-up / Repositions Consolidated The Chase II at Overlook Ridge Malden, MA 100.00% 292 261,101 894 2016 11.0% NA NA NA (69) NA (69) Quarry Place at Tuckahoe Eastchester, NY 76.25% 108 105,509 977 2016 12.0% NA NA NA (67) NA (67) Consolidated 93.59% 400 366,610 917 11.3% 0.0% $0 $0 ($136) $0 ($136) Joint Ventures Crystal House (4) Arlington, VA 25.00% 794 738,786 930 1962 92.4% 97.8% $1,885 $1,829 $2,209 $2,012 $8,392 M2 Jersey City, NJ 24.27% 311 273,132 878 2016 95.5% 78.5% 3,038 3,064 1,669 1,216 2,686 Joint Ventures 24.79% 1,105 1,011,918 916 93.3% 92.4% $2,210 $2,177 $3,878 $3,228 $11,078 Total Residential - Operating Communities (5) 50.54% 5,614 5,079,321 905 89.63% 89.81% $2,415 $2,427 $23,576 $23,093 $89,348 Operating Highlights