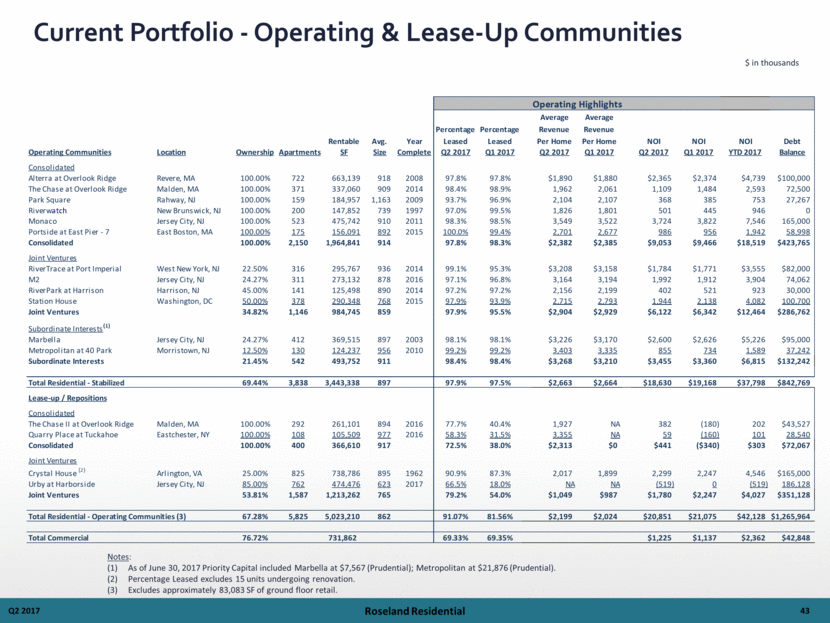
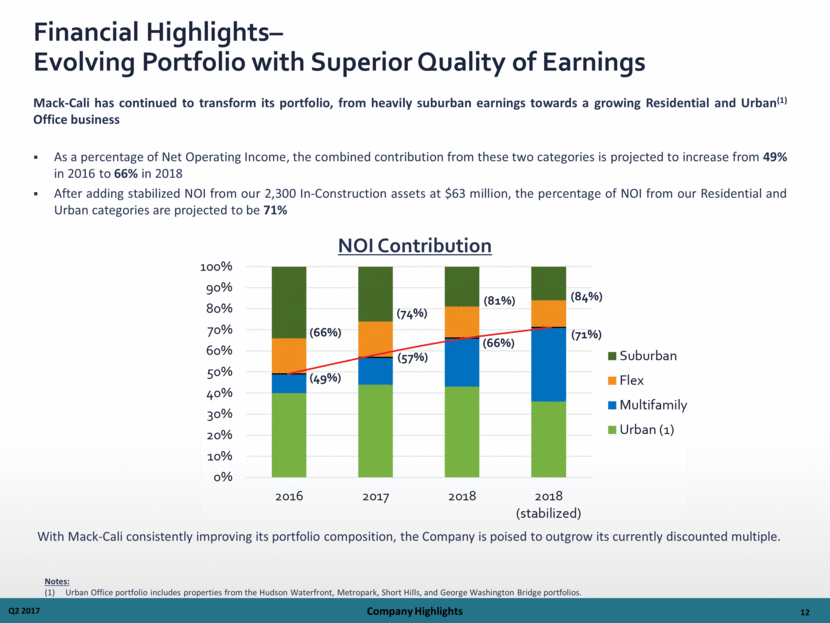
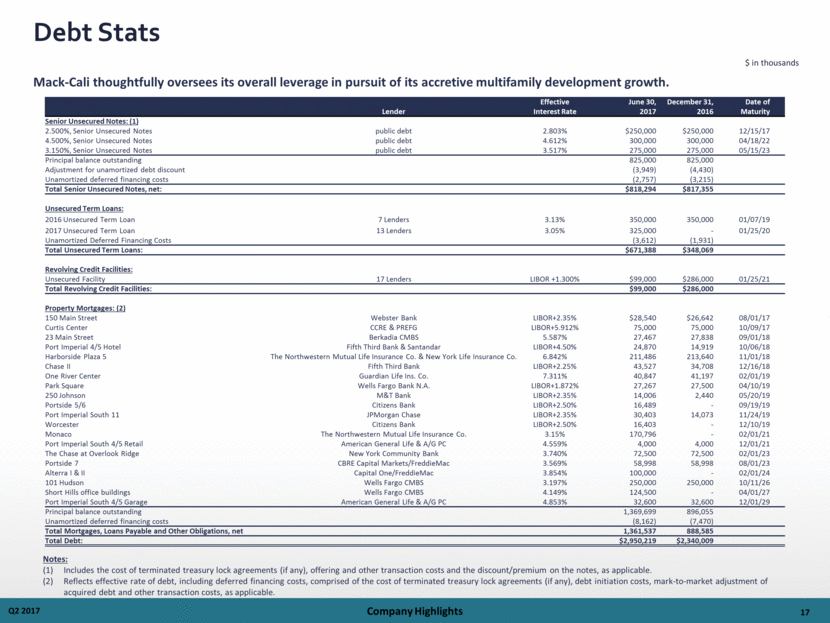
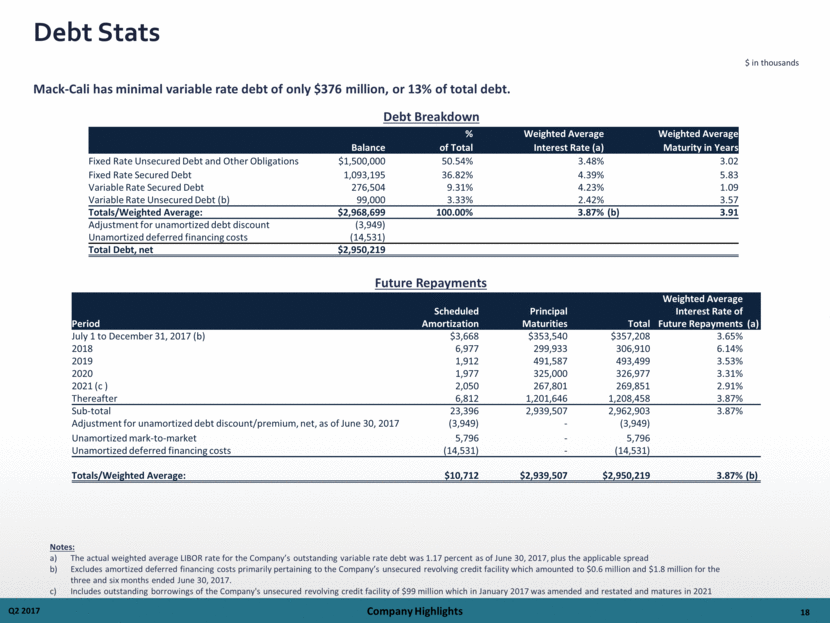
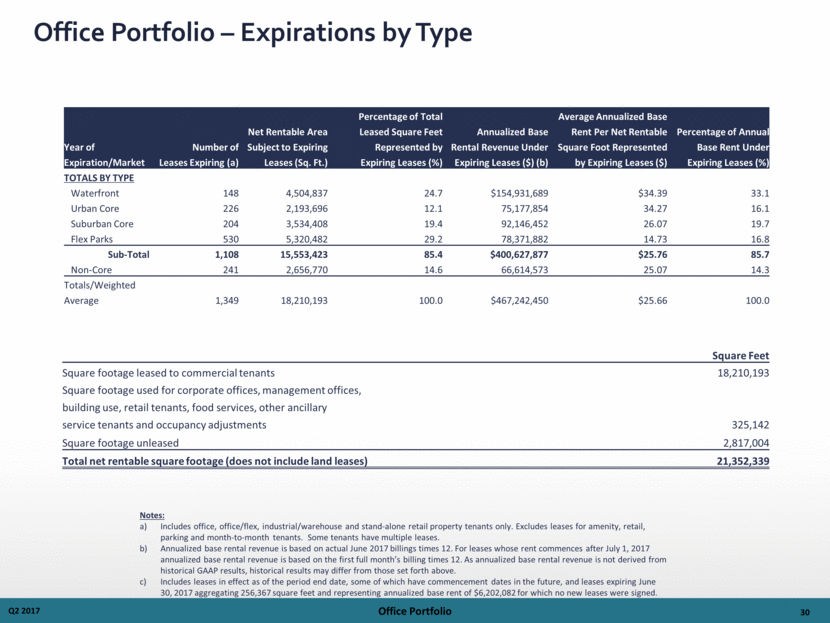
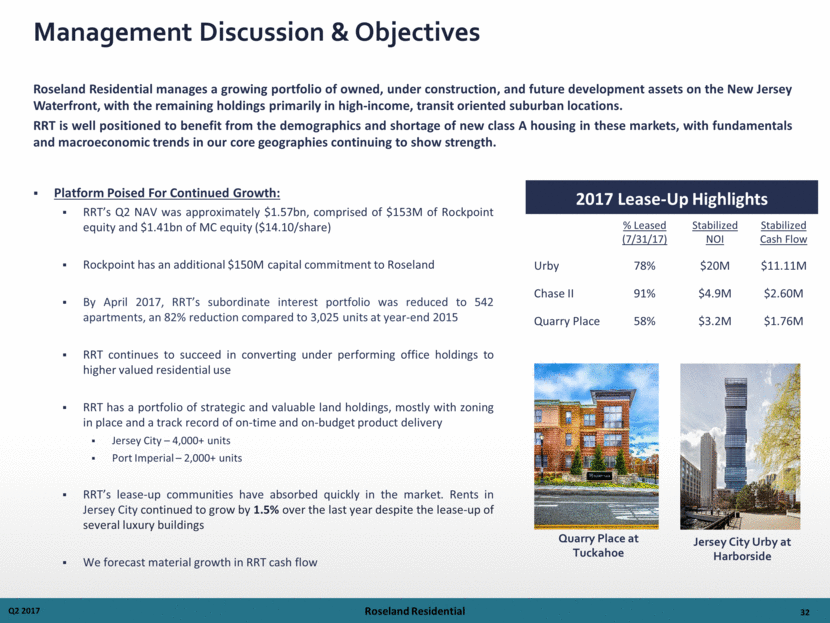
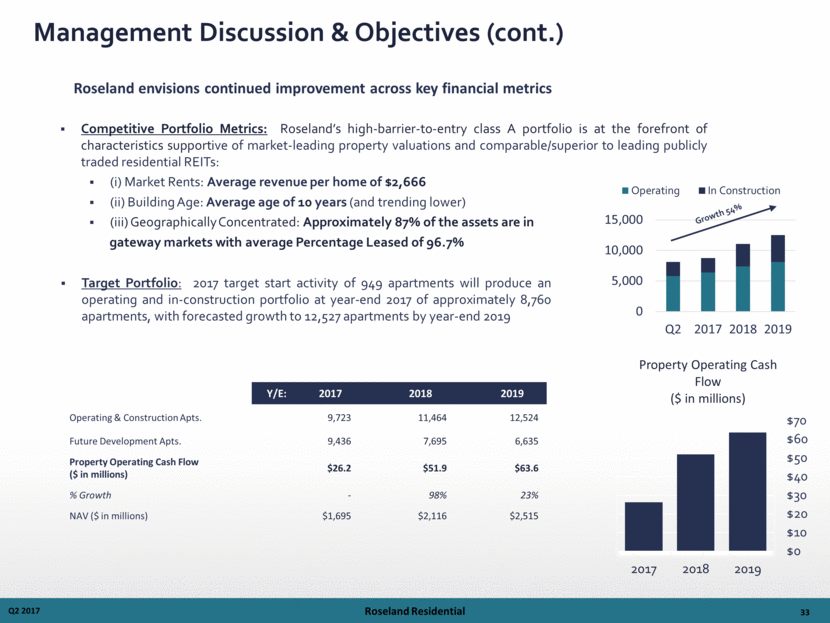
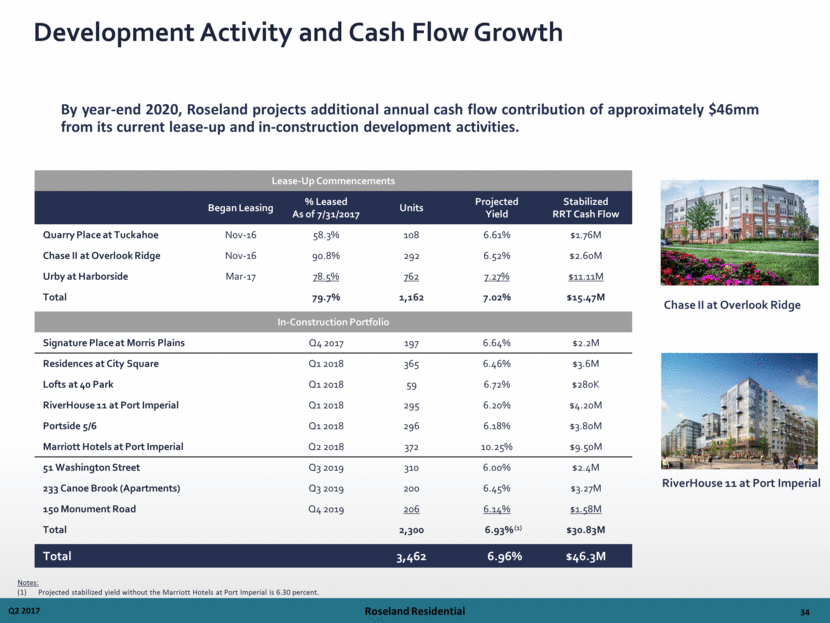
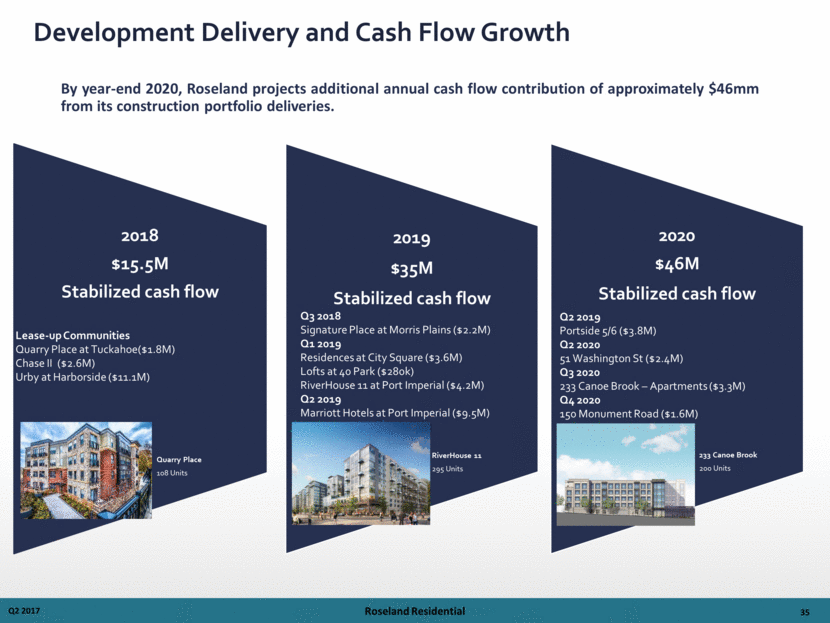
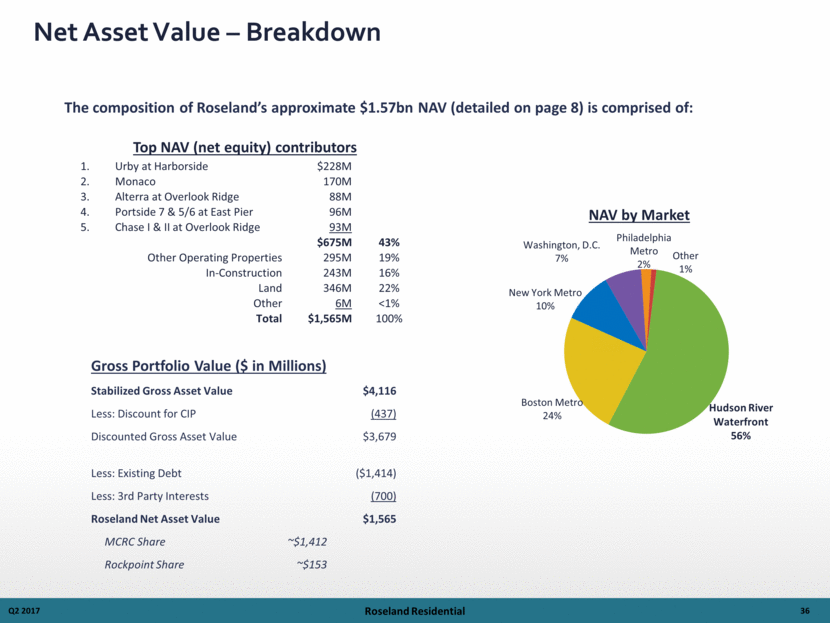
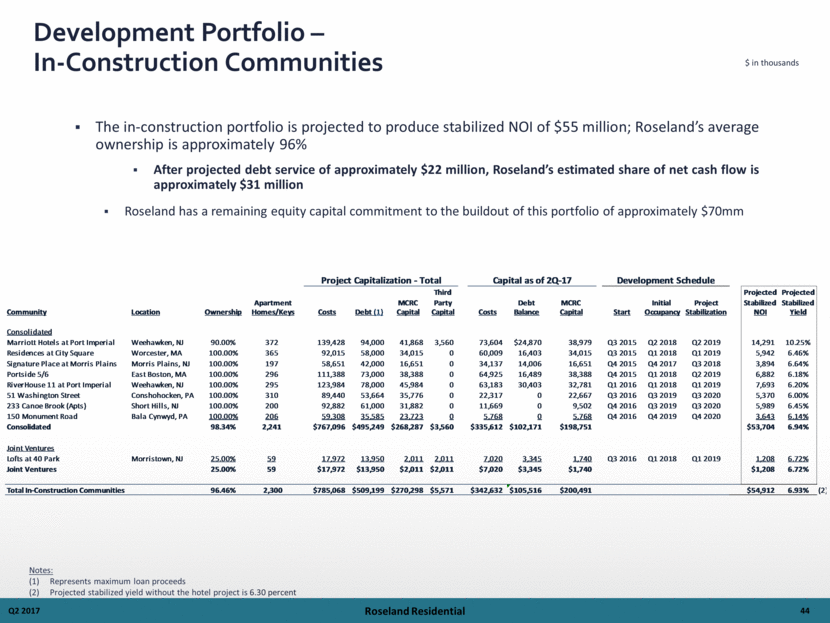
$ in thousands Current Portfolio - Operating & Lease-Up Communities 43 Q2 2017 Notes: As of June 30, 2017 Priority Capital included Marbella at $7,567 (Prudential); Metropolitan at $21,876 (Prudential). Percentage Leased excludes 15 units undergoing renovation. Excludes approximately 83,083 SF of ground floor retail. Roseland Residential Average Average Percentage Percentage Revenue Revenue Rentable Avg. Year Leased Leased Per Home Per Home NOI NOI NOI Debt Operating Communities Location Ownership Apartments SF Size Complete Q2 2017 Q1 2017 Q2 2017 Q1 2017 Q2 2017 Q1 2017 YTD 2017 Balance Consolidated Alterra at Overlook Ridge Revere, MA 100.00% 722 663,139 918 2008 97.8% 97.8% $1,890 $1,880 $2,365 $2,374 $4,739 $100,000 The Chase at Overlook Ridge Malden, MA 100.00% 371 337,060 909 2014 98.4% 98.9% 1,962 2,061 1,109 1,484 2,593 72,500 Park Square Rahway, NJ 100.00% 159 184,957 1,163 2009 93.7% 96.9% 2,104 2,107 368 385 753 27,267 Riverw atch New Brunswick, NJ 100.00% 200 147,852 739 1997 97.0% 99.5% 1,826 1,801 501 445 946 0 Monaco Jersey City, NJ 100.00% 523 475,742 910 2011 98.3% 98.5% 3,549 3,522 3,724 3,822 7,546 165,000 Portside at East Pier - 7 East Boston, MA 100.00% 175 156,091 892 2015 100.0% 99.4% 2,701 2,677 986 956 1,942 58,998 Consolidated 100.00% 2,150 1,964,841 914 97.8% 98.3% $2,382 $2,385 $9,053 $9,466 $18,519 $423,765 Joint Ventures RiverTrace at Port Imperial West New York, NJ 22.50% 316 295,767 936 2014 99.1% 95.3% $3,208 $3,158 $1,784 $1,771 $3,555 $82,000 M2 Jersey City, NJ 24.27% 311 273,132 878 2016 97.1% 96.8% 3,164 3,194 1,992 1,912 3,904 74,062 RiverPark at Harrison Harrison, NJ 45.00% 141 125,498 890 2014 97.2% 97.2% 2,156 2,199 402 521 923 30,000 Station House Washington, DC 50.00% 378 290,348 768 2015 97.9% 93.9% 2,715 2,793 1,944 2,138 4,082 100,700 Joint Ventures 34.82% 1,146 984,745 859 97.9% 95.5% $2,904 $2,929 $6,122 $6,342 $12,464 $286,762 Subordinate Interests (1) Marbella Jersey City, NJ 24.27% 412 369,515 897 2003 98.1% 98.1% $3,226 $3,170 $2,600 $2,626 $5,226 $95,000 Metropolitan at 40 Park Morristown, NJ 12.50% 130 124,237 956 2010 99.2% 99.2% 3,403 3,335 855 734 1,589 37,242 Subordinate Interests 21.45% 542 493,752 911 98.4% 98.4% $3,268 $3,210 $3,455 $3,360 $6,815 $132,242 Total Residential - Stabilized 69.44% 3,838 3,443,338 897 97.9% 97.5% $2,663 $2,664 $18,630 $19,168 $37,798 $842,769 Lease-up / Repositions Consolidated The Chase II at Overlook Ridge Malden, MA 100.00% 292 261,101 894 2016 77.7% 40.4% 1,927 NA 382 (180) 202 $43,527 Quarry Place at Tuckahoe Eastchester, NY 100.00% 108 105,509 977 2016 58.3% 31.5% 3,355 NA 59 (160) 101 28,540 Consolidated 100.00% 400 366,610 917 72.5% 38.0% $2,313 $0 $441 ($340) $303 $72,067 Joint Ventures Crystal House (2) Arlington, VA 25.00% 825 738,786 895 1962 90.9% 87.3% 2,017 1,899 2,299 2,247 4,546 $165,000 Urby at Harborside Jersey City, NJ 85.00% 762 474,476 623 2017 66.5% 18.0% NA NA (519) 0 (519) 186,128 Joint Ventures 53.81% 1,587 1,213,262 765 79.2% 54.0% $1,049 $987 $1,780 $2,247 $4,027 $351,128 Total Residential - Operating Communities (3) 67.28% 5,825 5,023,210 862 91.07% 81.56% $2,199 $2,024 $20,851 $21,075 $42,128 $1,265,964 Total Commercial 76.72% 731,862 69.33% 69.35% $1,225 $1,137 $2,362 $42,848 Operating Highlights
