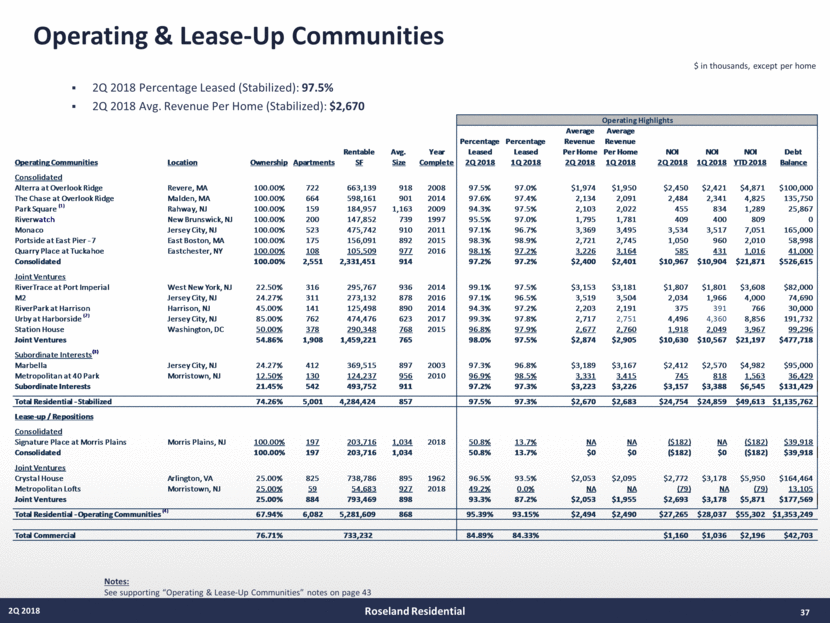
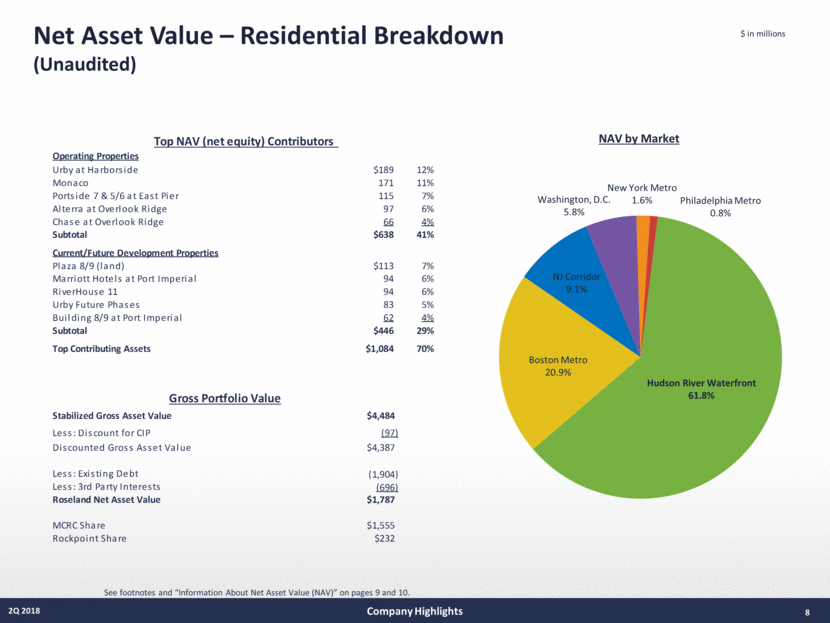
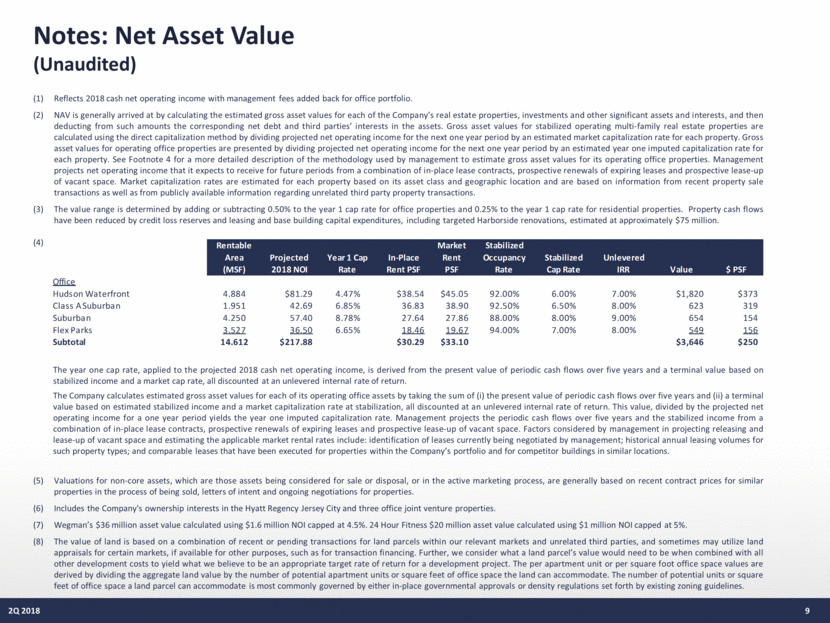
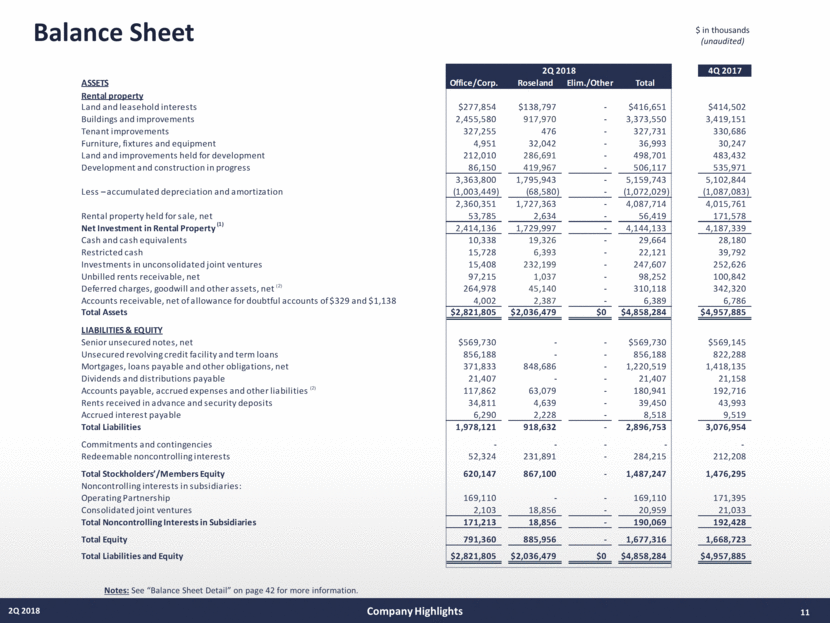
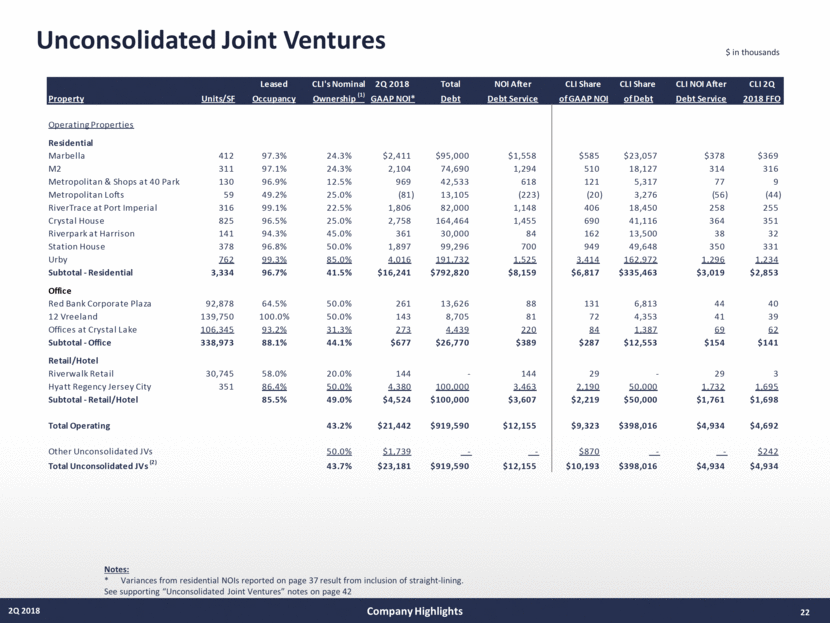
Operating & Lease-Up Communities $ in thousands, except per home 2Q 2018 Percentage Leased (Stabilized): 97.5% 2Q 2018 Avg. Revenue Per Home (Stabilized): $2,670 Notes: See supporting “Operating & Lease-Up Communities” notes on page 43 Roseland Residential 2Q 2018 37 RentableAvg.Year Operating Communities Location Ownership Apartments SF Size Complete Cons olida te d Alterra a t Overlook Ridge Revere, MA 100.00% 722 663,139 918 2008 The Cha s e a t Overlook Ridge Ma lden, MA 100.00% 664 598,161 901 2014 Pa rk Squa re (1 ) Ra hwa y, NJ 100.00% 159 184,957 1,163 2009 Riverwa tch New Bruns wick, NJ 100.00% 200 147,852 739 1997 Mona co Jers ey City, NJ 100.00% 523 475,742 910 2011 Ports ide a t Ea s t Pier - 7 Ea s t Bos ton, MA 100.00% 175 156,091 892 2015 Qua rry Pla ce a t Tucka hoe Ea s tches ter, NY 100.00% 108 105,509 977 2016 Consolidated 100.00% 2,551 2,331,451 914 Joint Ve nture s RiverTra ce a t Port Imperia l Wes t New York, NJ 22.50% 316 295,767 936 2014 M2 Jers ey City, NJ 24.27% 311 273,132 878 2016 RiverPa rk a t Ha rris on Ha rris on, NJ 45.00% 141 125,498 890 2014 Urby a t Ha rbors ide (2 ) Jers ey City, NJ 85.00% 762 474,476 623 2017 Sta tion Hous e Wa s hington, DC 50.00% 378 290,348 768 2015 Joint Ventures 54.86% 1,908 1,459,221 765 Subordina te Inte re s ts (3 ) Ma rbella Jers ey City, NJ 24.27% 412 369,515 897 2003 Metropolita n a t 40 Pa rk Morris town, NJ 12.50% 130 124,237 956 2010 Subordinate Interests 21.45% 542 493,752 911 Operating Highlights Average Average Percentage Percentage Revenue Revenue Leased Leased Per Home Per Home NOI NOI NOI Debt 2Q 2018 1Q 2018 2Q 2018 1Q 2018 2Q 2018 1Q 2018 YTD 2018 Balance 97.5% 97.0% $1,974 $1,950 $2,450 $2,421 $4,871 $100,000 97.6% 97.4% 2,134 2,091 2,484 2,341 4,825 135,750 94.3% 97.5% 2,103 2,022 455 834 1,289 25,867 95.5% 97.0% 1,795 1,781 409 400 809 0 97.1% 96.7% 3,369 3,495 3,534 3,517 7,051 165,000 98.3% 98.9% 2,721 2,745 1,050 960 2,010 58,998 98.1% 97.2% 3,226 3,164 585 431 1,016 41,000 97.2% 97.2% $2,400 $2,401 $10,967 $10,904 $21,871 $526,615 99.1% 97.5% $3,153 $3,181 $1,807 $1,801 $3,608 $82,000 97.1% 96.5% 3,519 3,504 2,034 1,966 4,000 74,690 94.3% 97.2% 2,203 2,191 375 391 766 30,000 99.3% 97.8% 2,717 2,751 4,496 4,360 8,856 191,732 96.8% 97.9% 2,677 2,760 1,918 2,049 3,967 99,296 98.0% 97.5% $2,874 $2,905 $10,630 $10,567 $21,197 $477,718 97.3% 96.8% $3,189 $3,167 $2,412 $2,570 $4,982 $95,000 96.9% 98.5% 3,331 3,415 745 818 1,563 36,429 97.2% 97.3% $3,223 $3,226 $3,157 $3,388 $6,545 $131,429 Total Residential - Stabilized 74.26% 5,001 4,284,424 857 97.5% 97.3% $2,670 $2,683 $24,754 $24,859 $49,613 $1,135,762 Lease-up / Repositions Cons olida te d Signa ture Pla ce a t Morris Pla ins Morris Pla ins , NJ 100.00% 197 203,716 1,034 2018 Consolidated 100.00% 197 203,716 1,034 Joint Ve nture s Crys ta l Hous e Arlington, VA 25.00% 825 738,786 895 1962 Metropolita n Lofts Morris town, NJ 25.00% 59 54,683 927 2018 Joint Ventures 25.00% 884 793,469 898 50.8% 13.7% NA NA ($182) NA ($182) $39,918 50.8% 13.7% $0 $0 ($182) $0 ($182) $39,918 96.5% 93.5% $2,053 $2,095 $2,772 $3,178 $5,950 $164,464 49.2% 0.0% NA NA (79) NA (79) 13,105 93.3% 87.2% $2,053 $1,955 $2,693 $3,178 $5,871 $177,569 Total Residential - Operating Communities (4 ) 67.94% 6,082 5,281,609 868 95.39% 93.15% $2,494 $2,490 $27,265 $28,037 $55,302 $1,353,249 Total Commercial 76.71% 733,232 84.89% 84.33% $1,160 $1,036 $2,196 $42,703
