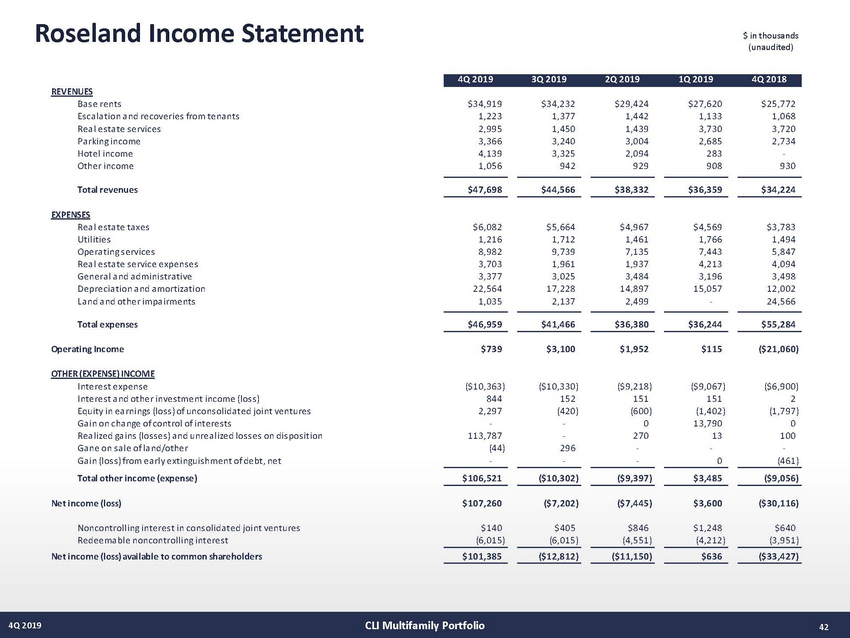
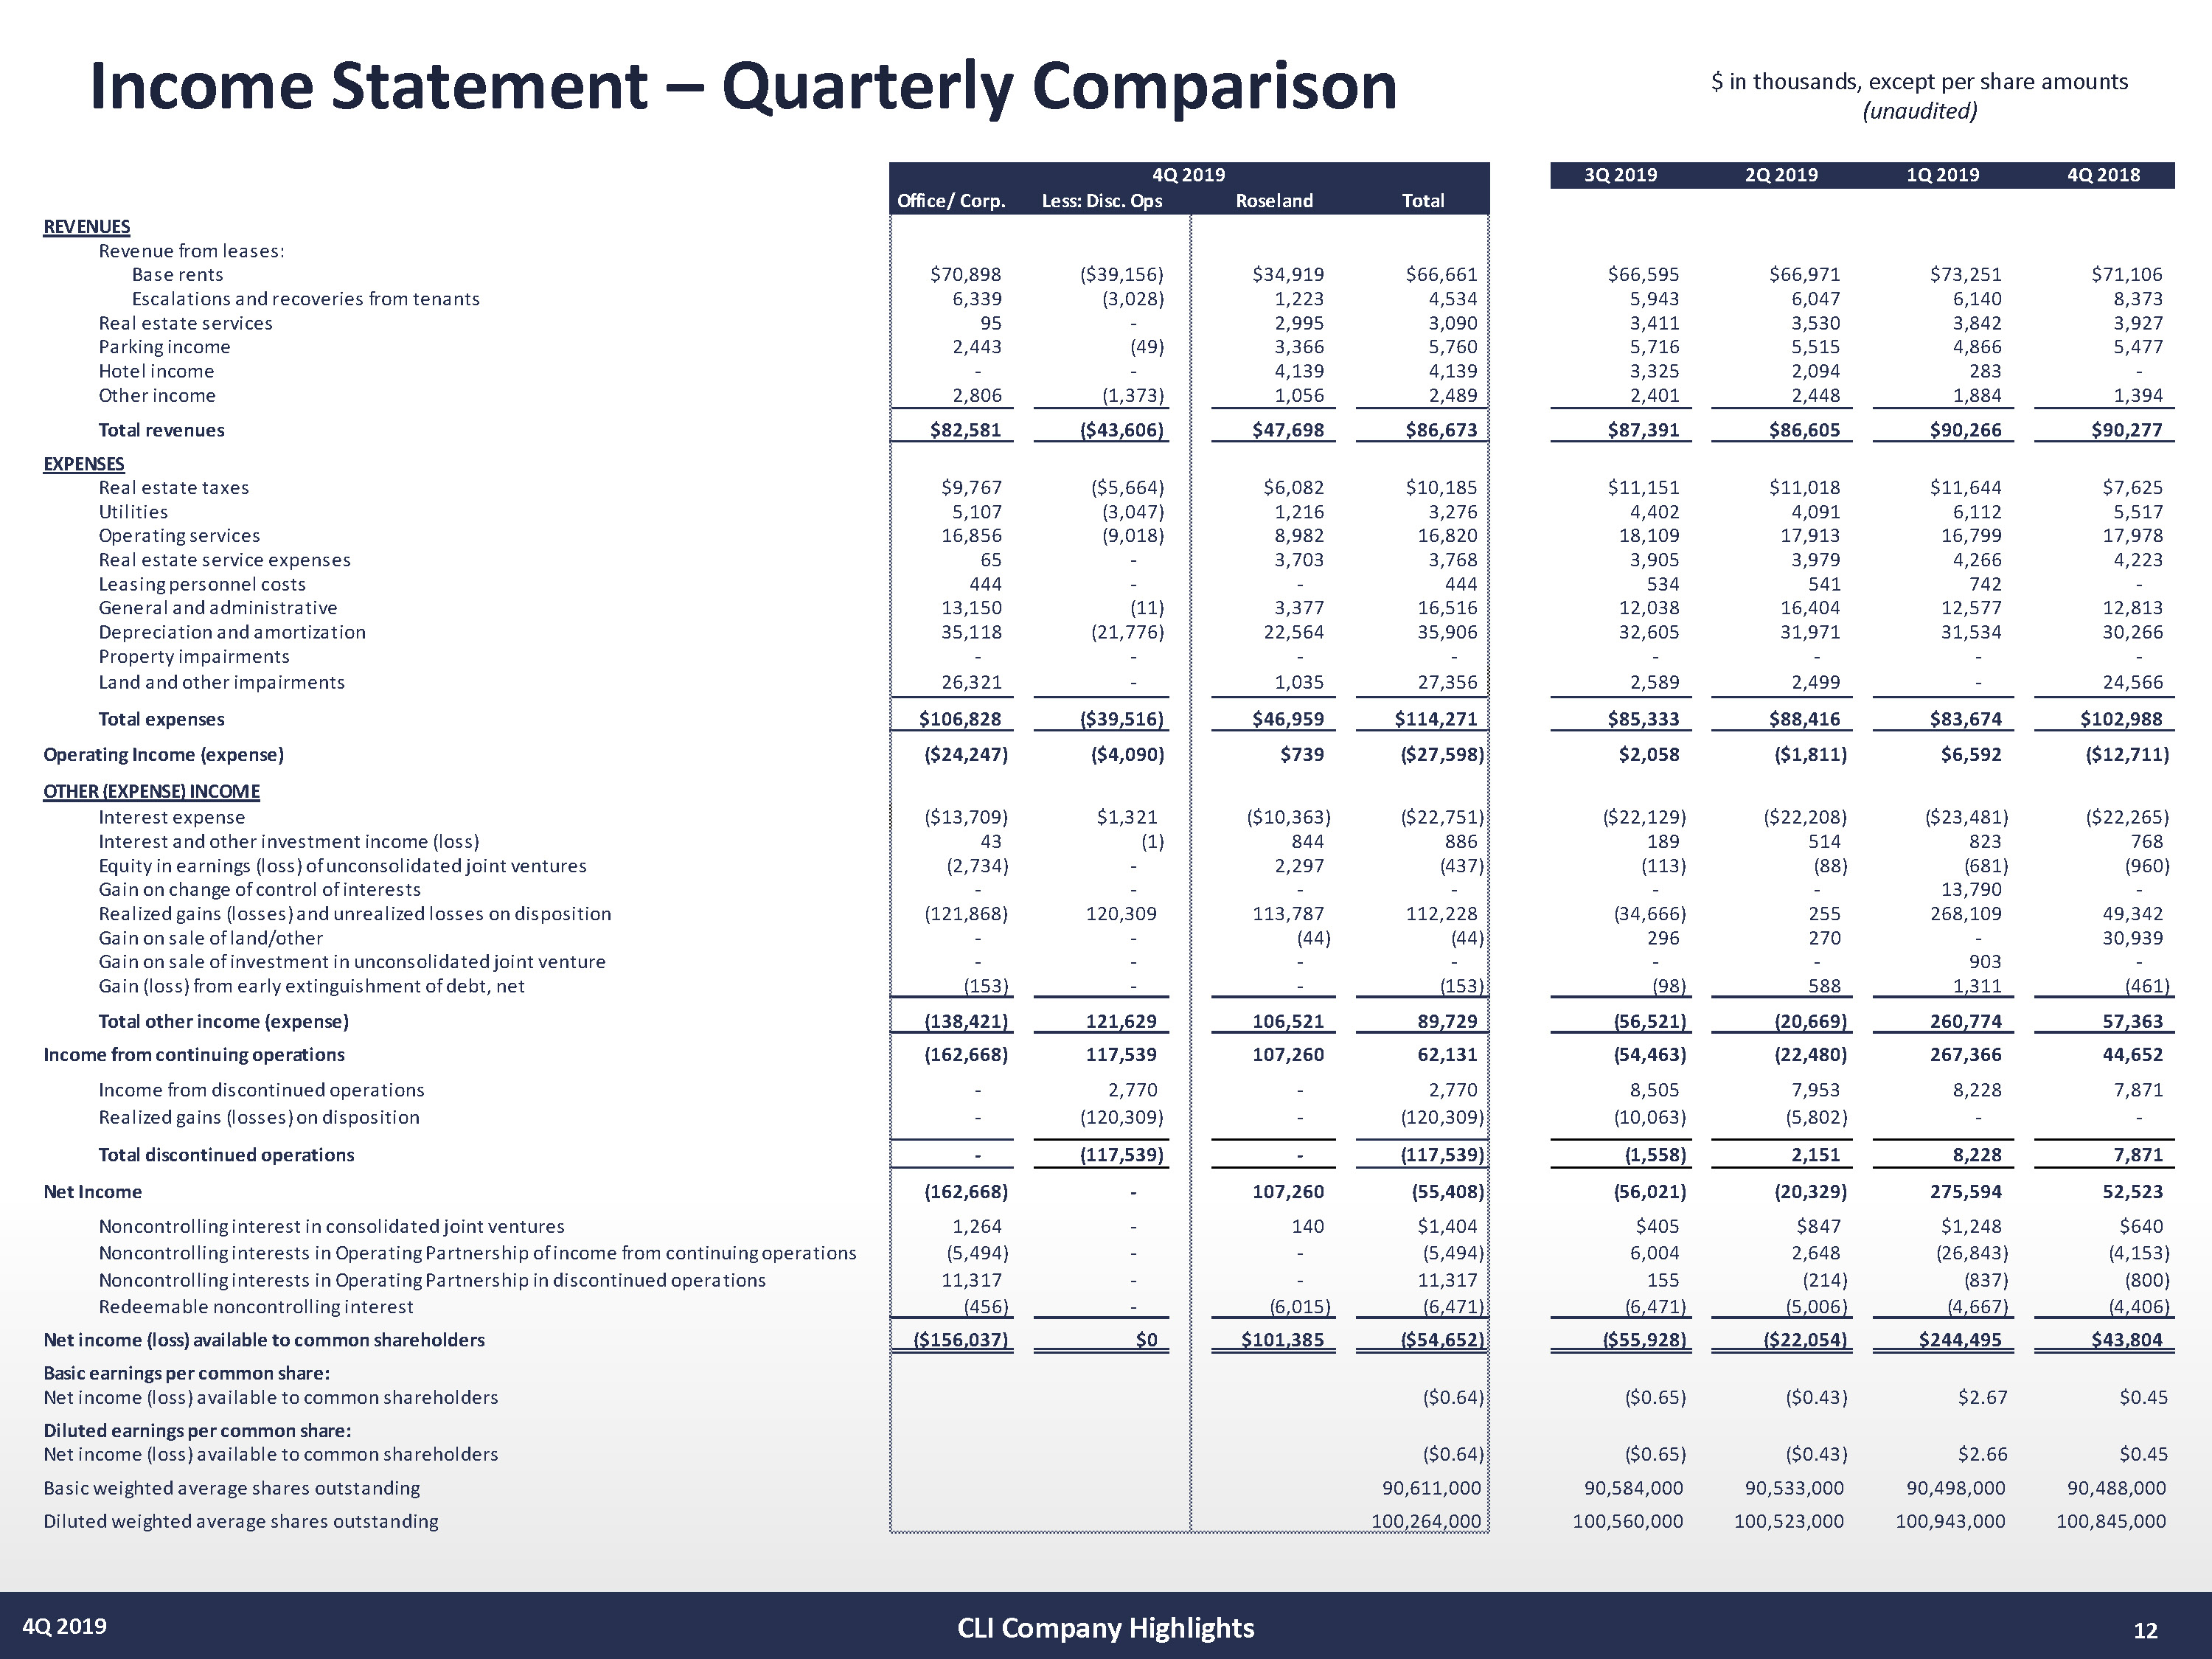
 | 1 2 4Q 2019 Income Statement – Quarterly Comparison $ in thousands, except per share amounts (unaudited) CLI Company Highlights 3Q 2019 2Q 2019 1Q 2019 4Q 2018 Office/ Corp. Less: Disc. Ops Roseland Total REVENUES Revenue from leases: Base rents $70,898 ($39,156) $34,919 $66,661 $66,595 $66,971 $73,251 $71,106 Escalations and recoveries from tenants 6,339 (3,028) 1,223 4,534 5,943 6,047 6,140 8,373 Real estate services 95 - 2,995 3,090 3,411 3,530 3,842 3,927 Parking income 2,443 (49) 3,366 5,760 5,716 5,515 4,866 5,477 Hotel income - - 4,139 4,139 3,325 2,094 283 - Other income 2,806 (1,373) 1,056 2,489 2,401 2,448 1,884 1,394 Total revenues $82,581 ($43,606) $47,698 $86,673 $87,391 $86,605 $90,266 $90,277 EXPENSES Real estate taxes $9,767 ($5,664) $6,082 $10,185 $11,151 $11,018 $11,644 $7,625 Utilities 5,107 (3,047) 1,216 3,276 4,402 4,091 6,112 5,517 Operating services 16,856 (9,018) 8,982 16,820 18,109 17,913 16,799 17,978 Real estate service expenses 65 - 3,703 3,768 3,905 3,979 4,266 4,223 Leasing personnel costs 444 - - 444 534 541 742 - General and administrative 13,150 (11) 3,377 16,516 12,038 16,404 12,577 12,813 Depreciation and amortization 35,118 (21,776) 22,564 35,906 32,605 31,971 31,534 30,266 Property impairments - - - - - - - - Land and other impairments 26,321 - 1,035 27,356 2,589 2,499 - 24,566 Total expenses $106,828 ($39,516) $46,959 $114,271 $85,333 $88,416 $83,674 $102,988 Operating Income (expense) ($24,247) ($4,090) $739 ($27,598) $2,058 ($1,811) $6,592 ($12,711) OTHER (EXPENSE) INCOME Interest expense ($13,709) $1,321 ($10,363) ($22,751) ($22,129) ($22,208) ($23,481) ($22,265) Interest and other investment income (loss) 43 (1) 844 886 189 514 823 768 Equity in earnings (loss) of unconsolidated joint ventures (2,734) - 2,297 (437) (113) (88) (681) (960) Gain on change of control of interests - - - - - - 13,790 - Realized gains (losses) and unrealized losses on disposition (121,868) 120,309 113,787 112,228 (34,666) 255 268,109 49,342 Gain on sale of land/other - - (44) (44) 296 270 - 30,939 Gain on sale of investment in unconsolidated joint venture - - - - - - 903 - Gain (loss) from early extinguishment of debt, net (153) - - (153) (98) 588 1,311 (461) Total other income (expense) (138,421) 121,629 106,521 89,729 (56,521) (20,669) 260,774 57,363 Income from continuing operations (162,668) 117,539 107,260 62,131 (54,463) (22,480) 267,366 44,652 Income from discontinued operations - 2,770 - 2,770 8,505 7,953 8,228 7,871 Realized gains (losses) on disposition - (120,309) - (120,309) (10,063) (5,802) - - Total discontinued operations - (117,539) - (117,539) (1,558) 2,151 8,228 7,871 Net Income (162,668) - 107,260 (55,408) (56,021) (20,329) 275,594 52,523 Noncontrolling interest in consolidated joint ventures 1,264 - 140 $1,404 $405 $847 $1,248 $640 Noncontrolling interests in Operating Partnership of income from continuing operations (5,494) - - (5,494) 6,004 2,648 (26,843) (4,153) Noncontrolling interests in Operating Partnership in discontinued operations 11,317 - - 11,317 155 (214) (837) (800) Redeemable noncontrolling interest (456) - (6,015) (6,471) (6,471) (5,006) (4,667) (4,406) Net income (loss) available to common shareholders ($156,037) $0 $101,385 ($54,652) ($55,928) ($22,054) $244,495 $43,804 Basic earnings per common share: Net income (loss) available to common shareholders ($0.64) ($0.65) ($0.43) $2.67 $0.45 Diluted earnings per common share: Net income (loss) available to common shareholders ($0.64) ($0.65) ($0.43) $2.66 $0.45 Basic weighted average shares outstanding 90,611,000 90,584,000 90,533,000 90,498,000 90,488,000 Diluted weighted average shares outstanding 100,264,000 100,560,000 100,523,000 100,943,000 100,845,000 4Q 2019 |