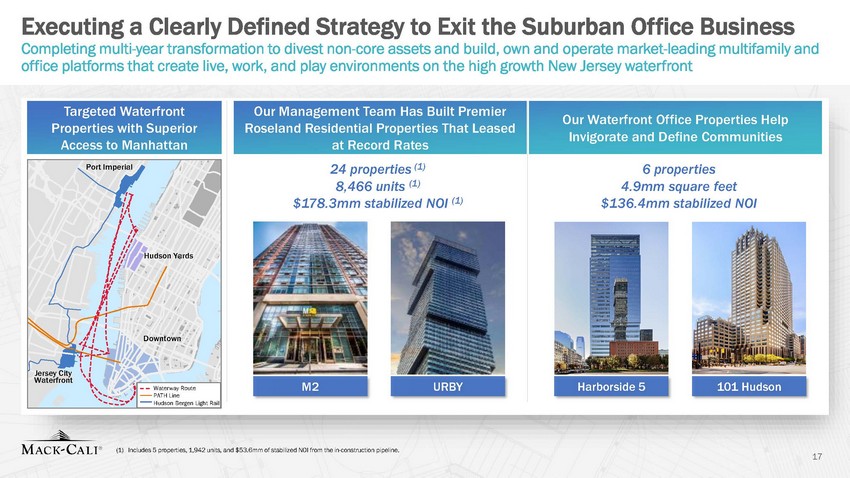
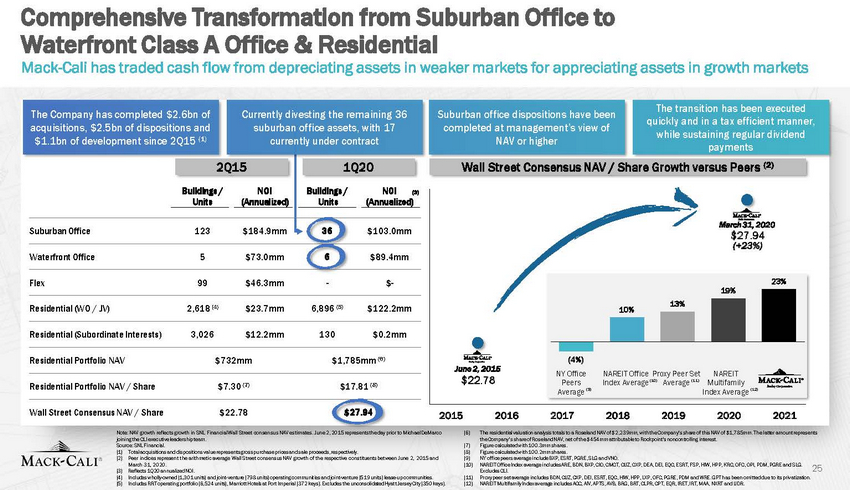
 | Comprehensive Transformation from Suburban Office to Waterfront Class A Office & Residential Mack-Cali has traded cash flow from depreciating assets in weaker markets for appreciating assets in growth marketsThe Company has completed $2.6bn of acquisitions, $2.5bn of dispositions and $1.1bn of development since 2Q15 (1)Currently divesting the remaining 36 suburban office assets, with 17 currently under contractSuburban office dispositions have been completed at management’s view of NAV or higherThe transition has been executed quickly and in a tax efficient manner, while sustaining regular dividend payments2Q15 1Q20Wall Street Consensus NAV / Share Growth versus Peers (2)Buildings /NOIBuildings /NOI(3)Units(Annualized)Units(Annualized)Suburban Office 123 $184.9mm 36 $103.0mmWaterfront Office 5 $73.0mm 6 $89.4mmMarch 31, 2020 $27.94 (+23%)Flex 99 $46.3mm - $- Residential (WO / JV) 2,618 (4) $23.7mm 6,896 (5) $122.2mm Residential (Subordinate Interests) 3,026 $12.2mm 130 $0.2mm13% 10%19%23%Residential Portfolio NAV $732mm $1,785mm (6)June 2, 2015(4%)NY OfficeNAREIT Office Proxy Peer SetNAREITCLIResidential Portfolio NAV / Share $7.30 (7) $17.81 (8)$22.78Peers Average (9)Index Average(10)Average (11)Multifamily Index Average (12)Wall Street Consensus NAV / Share $22.78 $27.942015 2016 2017 2018 20192020 2021Note: NAV growth reflects growth in SNL Financial Wall Street consensus NAV estimates. June 2, 2015 represents the day prior to Michael DeMarco joining the CLI executive leadership team. Source: SNL Financial. (1) Total acquisitions and dispositions value represents gross purchase prices and sale proceeds, respectively. (2) Peer indices represent the arithmetic average Wall Street consensus NAV growth of the respective constituents between June 2, 2015 and March 31, 2020. (3) Reflects 1Q20 annualized NOI. (4) Includes wholly-owned (1,301 units) and joint-venture (798 units) operating communities and joint-venture (519 units) lease-up communities. (5) Includes RRT operating portfolio (6,524 units), Marriott Hotels at Port Imperial (372 keys). Excludes the unconsolidated Hyat t Jersey City (350 keys).(6) The residential valuation analysis totals to a Roseland NAV of $2,239mm, with the Company’s share of this NAV of $1,785mm. Th e latter amount represents the Company’s share of Roseland NAV, net of the $454mm attributable to Rockpoint's noncontrolling interest. (7) Figure calculated with 100.3mm shares. (8) Figure calculated with 100.2mm shares. (9) NY office peers average include BXP, ESRT, PGRE, SLG and VNO. (10) NAREIT Office Index average includes ARE, BDN, BXP, CIO, CMCT, CUZ, CXP, DEA, DEI, EQC, ESRT, FSP, HIW, HPP, KRC, OFC, OPI, PDM, PGRE and SLG. Excludes CLI. (11) Proxy peer set average includes BDN, CUZ, CXP, DEI, ESRT, EQC, HIW, HPP, LXP, OFC, PGRE, PDM and WRE. GPT has been omitted due to its privatization. (12) NAREIT Multifamily Index average includes ACC, AIV, APTS, AVB, BRG, BRT, CLPR, CPT, EQR, IRET, IRT, MAA, NXRT and UDR. |