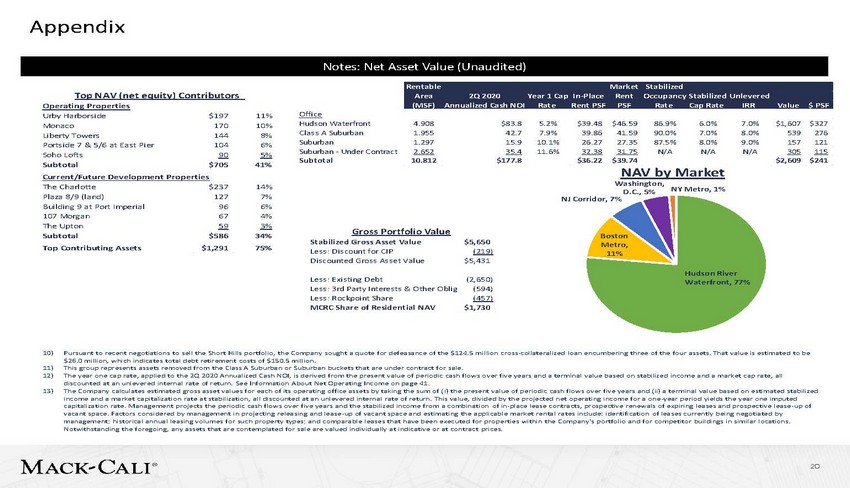
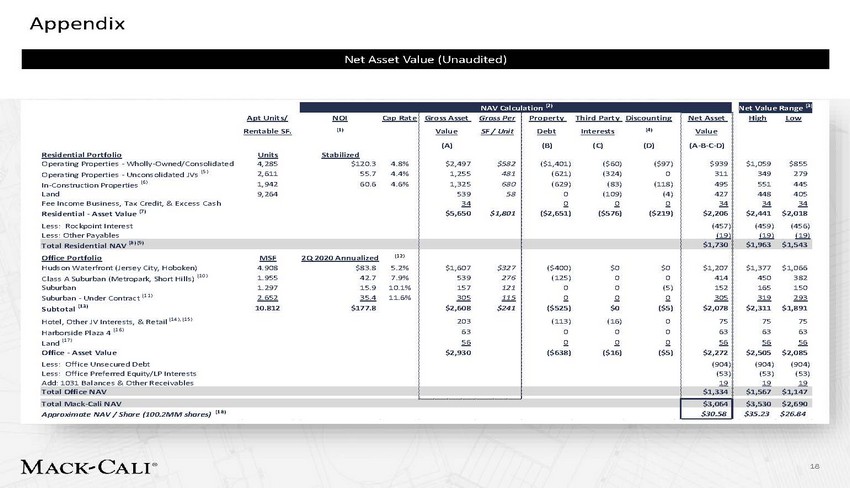
 | Appendix 18 NAV Calculation (2) Net Value Range (3 Apt Units/ NOI Cap Rate Rentable SF. (1) Residential Portfolio Units Stabilized Operating Properties - Wholly-Owned/Consolidated 4,285 $120.3 4.8% Operating Properties - Unconsolidated JVs (5) 2,611 55.7 4.4% In-Construction Properties (6) 1,942 60.6 4.6% Land 9,264 Fee Income Business, Tax Credit, & Excess Cash Residential - Asset Value (7) Less: Rockpoint Interest Less: Other Payables Gross Asset Gross Per Value SF / Unit (A) $2,497 $582 1,255 481 1,325 680 539 58 34 $5,650 $1,801 Property Third Party Discounting Debt Interests (4) (B) (C) (D) ($1,401) ($60) ($97) (621) (324) 0 (629) (83) (118) 0 (109) (4) 0 0 0 ($2,651) ($576) ($219) Net Asset Value (A-B-C-D) $939 311 495 427 34 $2,206 (457) (19) High Low $1,059 $855 349 279 551 445 448 405 34 34 $2,441 $2,018 (459) (456) (19) (19) Total Residential NAV (8) (9) $1,730 $1,963 $1,543 Office Portfolio MSF 2Q 2020 Annualized (12) Hudson Waterfront (Jersey City, Hoboken) 4.908 $83.8 5.2% Class A Suburban (Metropark, Short Hills) (10) 1.955 42.7 7.9% Suburban 1.297 15.9 10.1% Suburban - Under Contract (11) 2.652 35.4 11.6% Subtotal (13) 10.812 $177.8 Hotel, Other JV Interests, & Retail (14), (15) Harborside Plaza 4 (16) Land (17) Office - Asset Value Less: Office Unsecured Debt Less: Office Preferred Equity/LP Interests Add: 1031 Balances & Other Receivables $1,607 $327 539 276 157 121 305 115 $2,608 $241 203 63 56 $2,930 ($400) $0 $0 (125) 0 0 0 0 (5) 0 0 0 ($525) $0 ($5) (113) (16) 0 0 0 0 0 0 0 ($638) ($16) ($5) $1,207 414 152 305 $2,078 75 63 56 $2,272 (904) (53) 19 $1,377 $1,066 450 382 165 150 319 293 $2,311 $1,891 75 75 63 63 56 56 $2,505 $2,085 (904) (904) (53) (53) 19 19 Total Office NAV $1,334 $1,567 $1,147 Total Mack-Cali NAV $3,064 $3,530 $2,690 Approximate NAV / Share (100.2MM shares) (18) $30.58 $35.23 $26.84 Net Asset Value (Unaudited) |