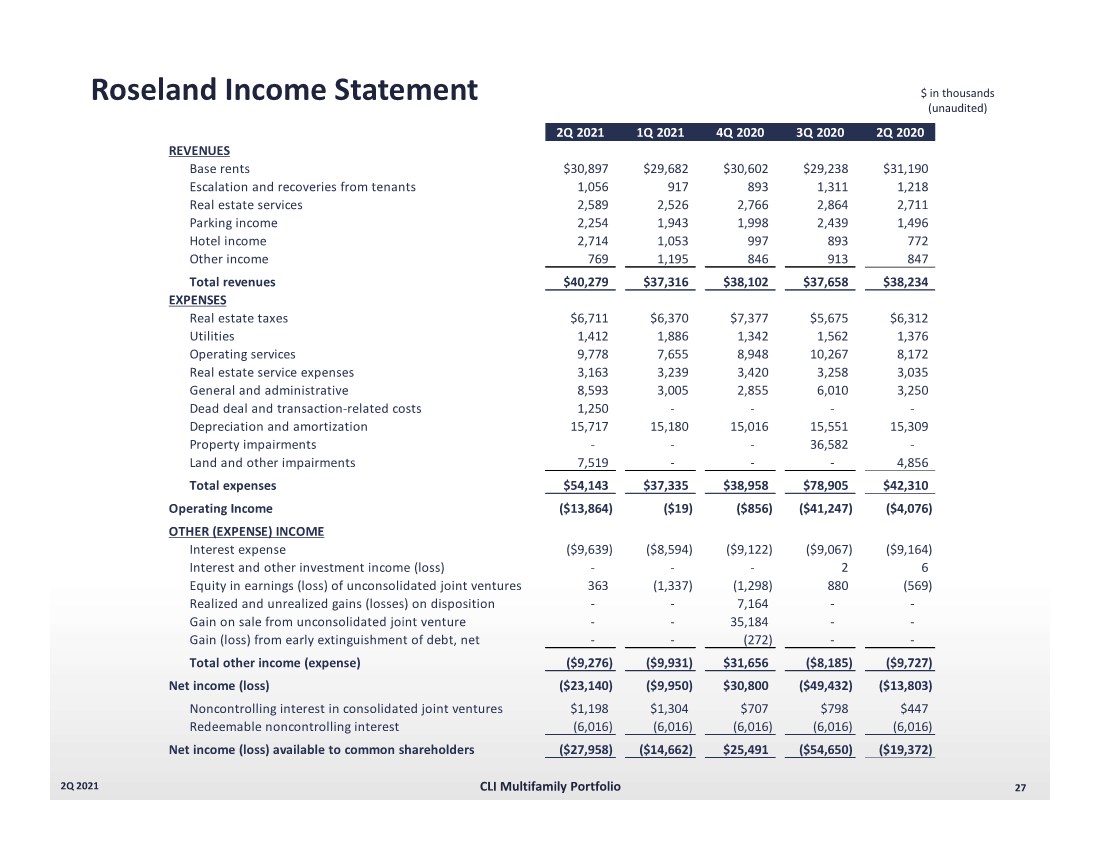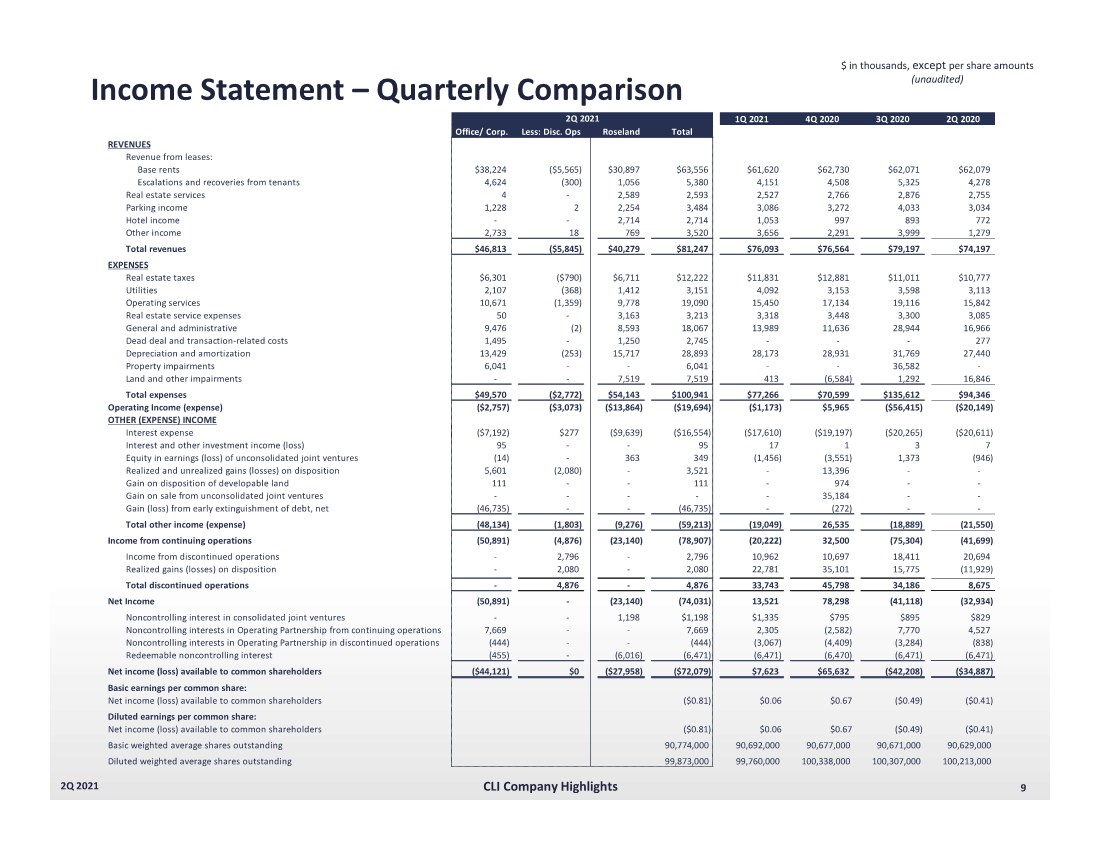
| 9 2Q 2021 Income Statement – Quarterly Comparison $ in thousands, except per share amounts (unaudited) CLI Company Highlights 1Q 2021 4Q 2020 3Q 2020 2Q 2020 Office/ Corp. Less: Disc. Ops Roseland Total REVENUES Revenue from leases: Base rents $38,224 ($5,565) $30,897 $63,556 $61,620 $62,730 $62,071 $62,079 Escalations and recoveries from tenants 4,624 (300) 1,056 5,380 4,151 4,508 5,325 4,278 Real estate services 4 - 2,589 2,593 2,527 2,766 2,876 2,755 Parking income 1,228 2 2,254 3,484 3,086 3,272 4,033 3,034 Hotel income - - 2,714 2,714 1,053 997 893 772 Other income 2,733 18 769 3,520 3,656 2,291 3,999 1,279 Total revenues $46,813 ($5,845) $40,279 $81,247 $76,093 $76,564 $79,197 $74,197 EXPENSES Real estate taxes $6,301 ($790) $6,711 $12,222 $11,831 $12,881 $11,011 $10,777 Utilities 2,107 (368) 1,412 3,151 4,092 3,153 3,598 3,113 Operating services 10,671 (1,359) 9,778 19,090 15,450 17,134 19,116 15,842 Real estate service expenses 50 - 3,163 3,213 3,318 3,448 3,300 3,085 General and administrative 9,476 (2) 8,593 18,067 13,989 11,636 28,944 16,966 Dead deal and transaction-related costs 1,495 - 1,250 2,745 - - - 277 Depreciation and amortization 13,429 (253) 15,717 28,893 28,173 28,931 31,769 27,440 Property impairments 6,041 - - 6,041 - - 36,582 - Land and other impairments - - 7,519 7,519 413 (6,584) 1,292 16,846 Total expenses $49,570 ($2,772) $54,143 $100,941 $77,266 $70,599 $135,612 $94,346 Operating Income (expense) ($2,757) ($3,073) ($13,864) ($19,694) ($1,173) $5,965 ($56,415) ($20,149) OTHER (EXPENSE) INCOME Interest expense ($7,192) $277 ($9,639) ($16,554) ($17,610) ($19,197) ($20,265) ($20,611) Interest and other investment income (loss) 95 - - 95 17 1 3 7 Equity in earnings (loss) of unconsolidated joint ventures (14) - 363 349 (1,456) (3,551) 1,373 (946) Realized and unrealized gains (losses) on disposition 5,601 (2,080) - 3,521 - 13,396 - - Gain on disposition of developable land 111 - - 111 - 974 - - Gain on sale from unconsolidated joint ventures - - - - - 35,184 - - Gain (loss) from early extinguishment of debt, net (46,735) - - (46,735) - (272) - - Total other income (expense) (48,134) (1,803) (9,276) (59,213) (19,049) 26,535 (18,889) (21,550) Income from continuing operations (50,891) (4,876) (23,140) (78,907) (20,222) 32,500 (75,304) (41,699) Income from discontinued operations - 2,796 - 2,796 10,962 10,697 18,411 20,694 Realized gains (losses) on disposition - 2,080 - 2,080 22,781 35,101 15,775 (11,929) Total discontinued operations - 4,876 - 4,876 33,743 45,798 34,186 8,675 Net Income (50,891) - (23,140) (74,031) 13,521 78,298 (41,118) (32,934) Noncontrolling interest in consolidated joint ventures - - 1,198 $1,198 $1,335 $795 $895 $829 Noncontrolling interests in Operating Partnership from continuing operations 7,669 - - 7,669 2,305 (2,582) 7,770 4,527 Noncontrolling interests in Operating Partnership in discontinued operations (444) - - (444) (3,067) (4,409) (3,284) (838) Redeemable noncontrolling interest (455) - (6,016) (6,471) (6,471) (6,470) (6,471) (6,471) Net income (loss) available to common shareholders ($44,121) $0 ($27,958) ($72,079) $7,623 $65,632 ($42,208) ($34,887) Basic earnings per common share: Net income (loss) available to common shareholders ($0.81) $0.06 $0.67 ($0.49) ($0.41) Diluted earnings per common share: Net income (loss) available to common shareholders ($0.81) $0.06 $0.67 ($0.49) ($0.41) Basic weighted average shares outstanding 90,774,000 90,692,000 90,677,000 90,671,000 90,629,000 Diluted weighted average shares outstanding 99,873,000 99,760,000 100,338,000 100,307,000 100,213,000 2Q 2021 |