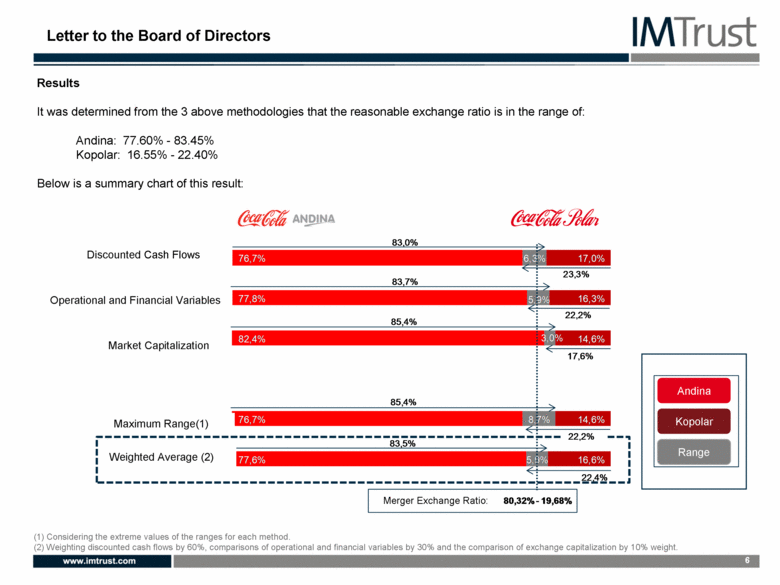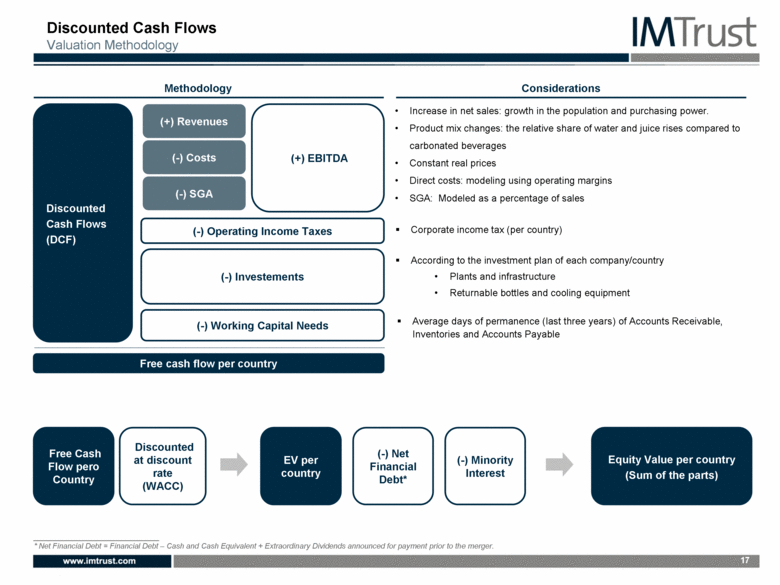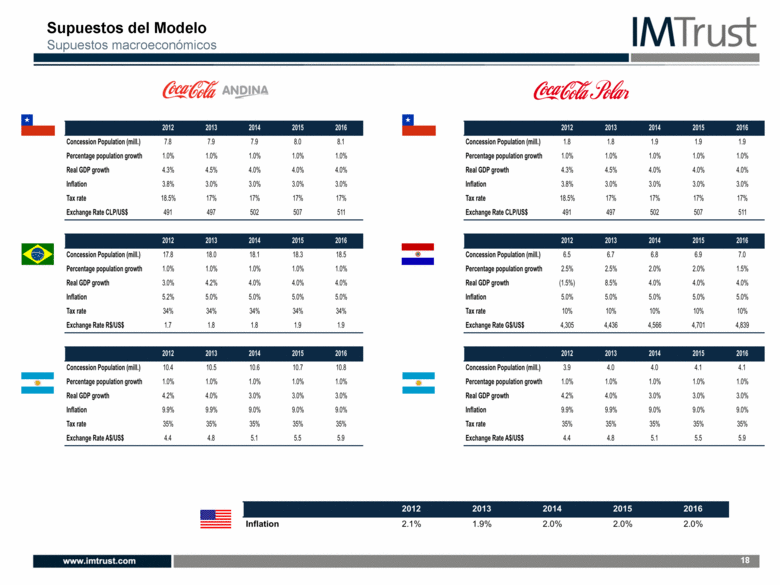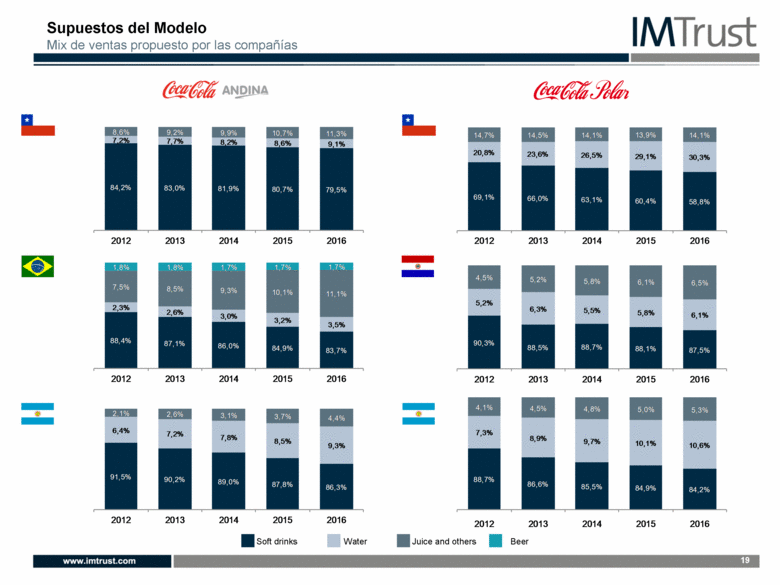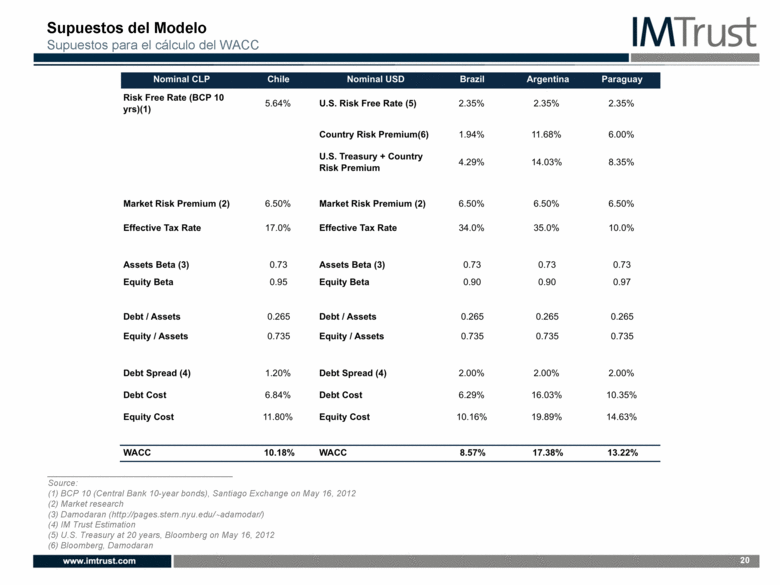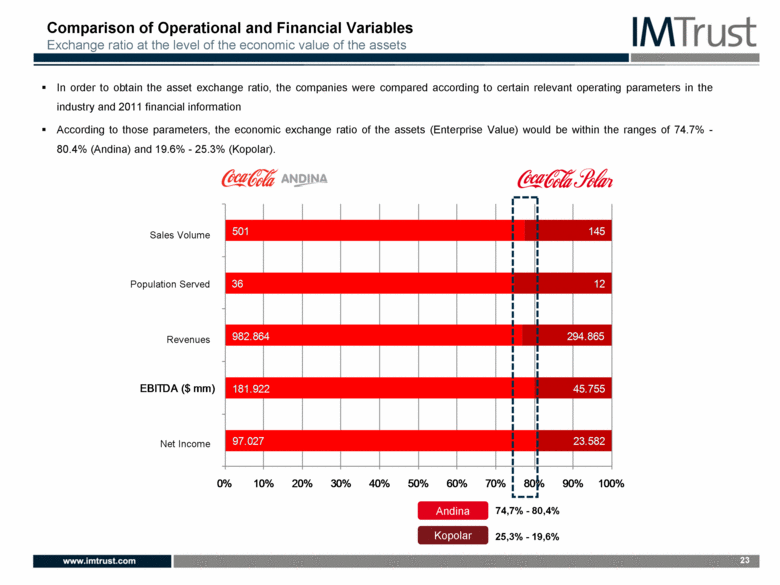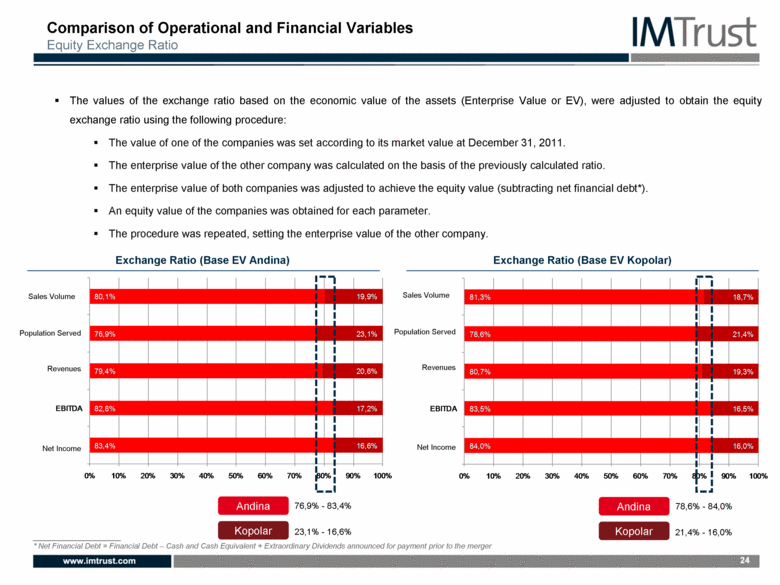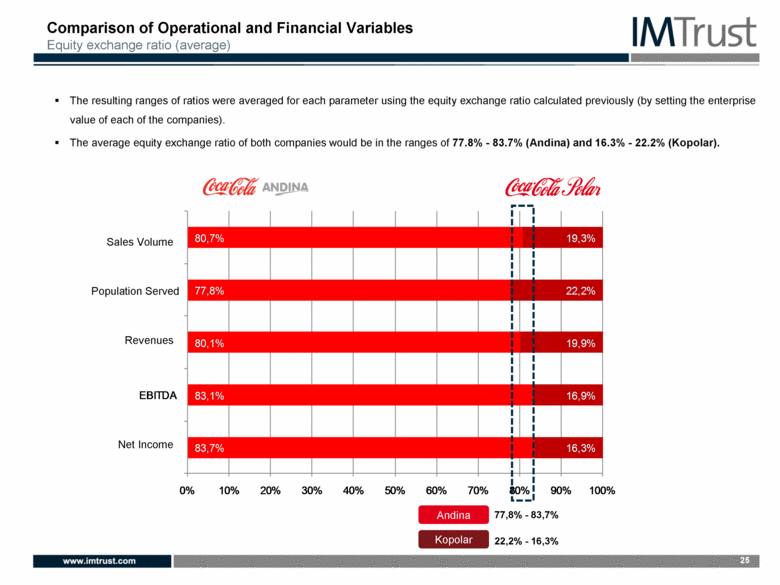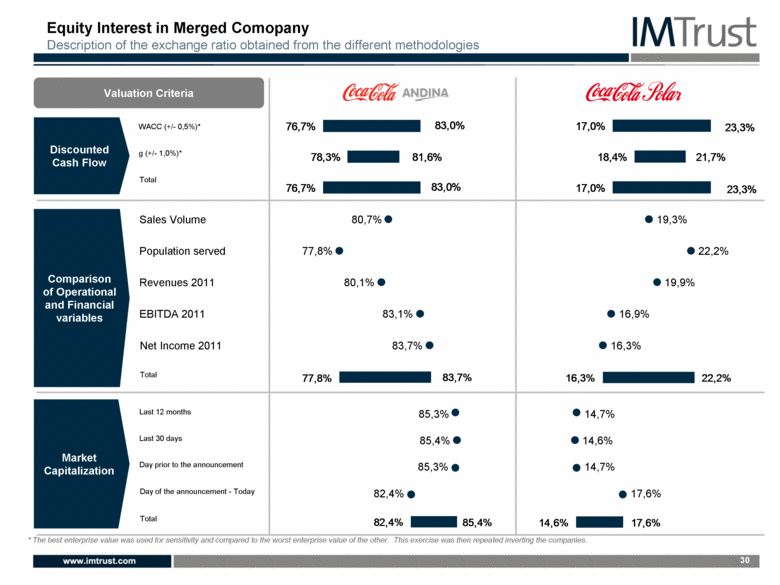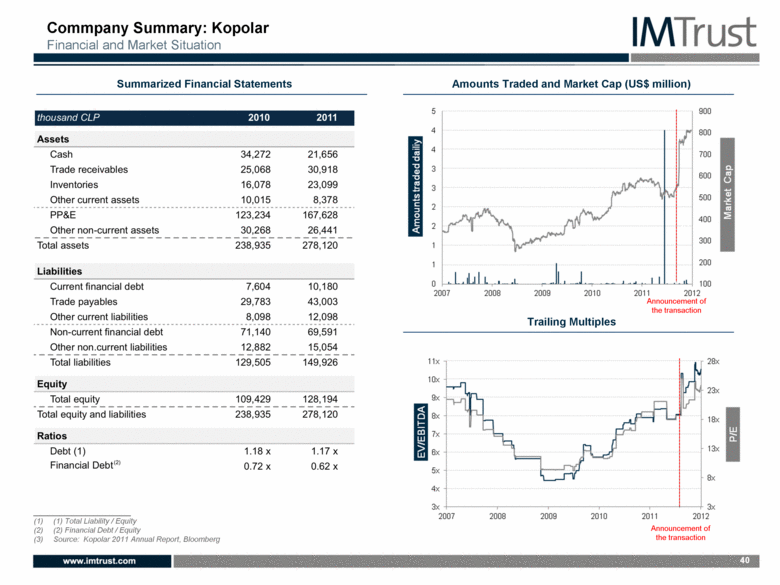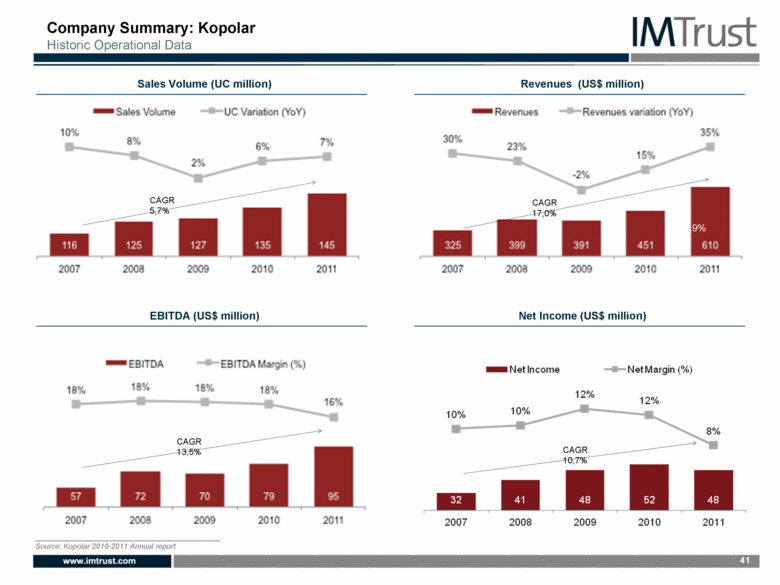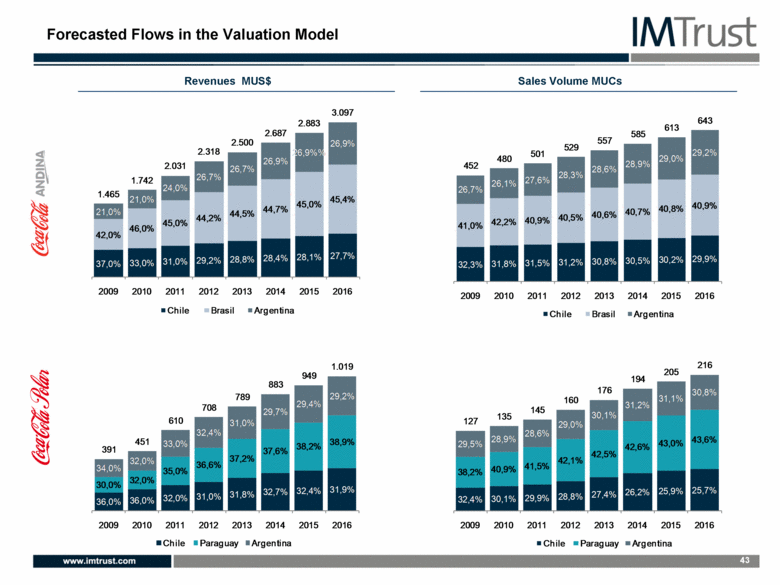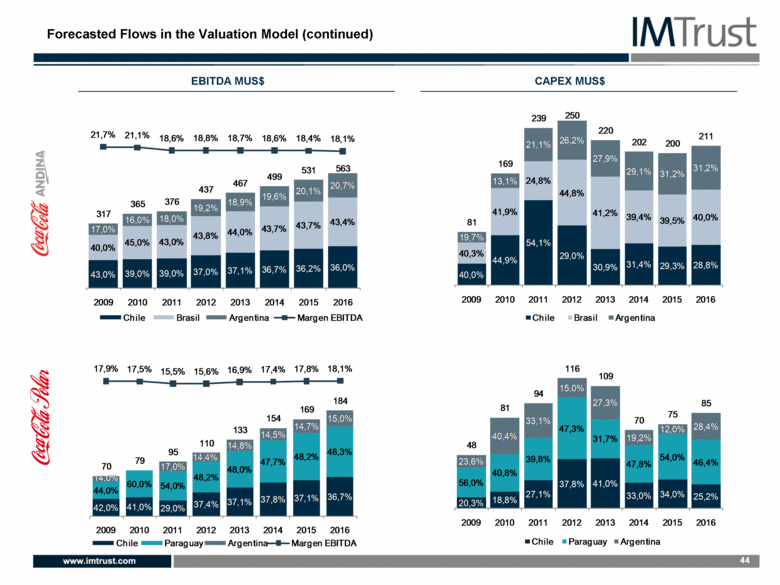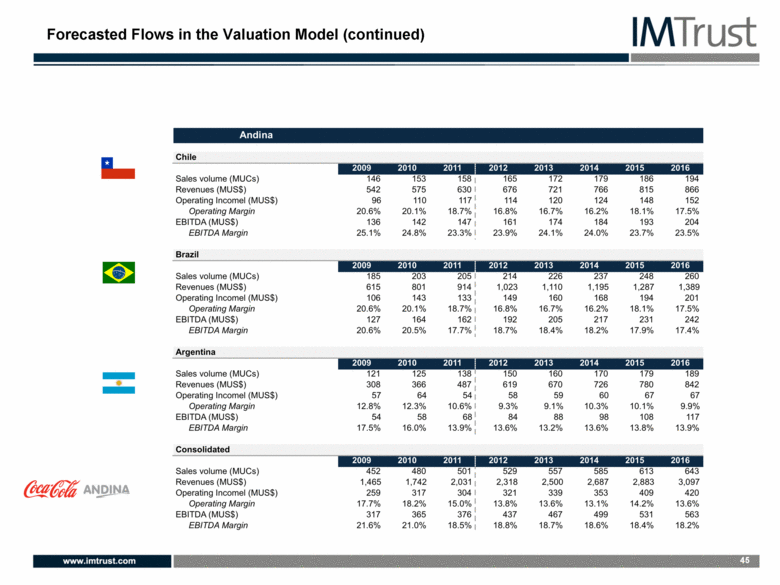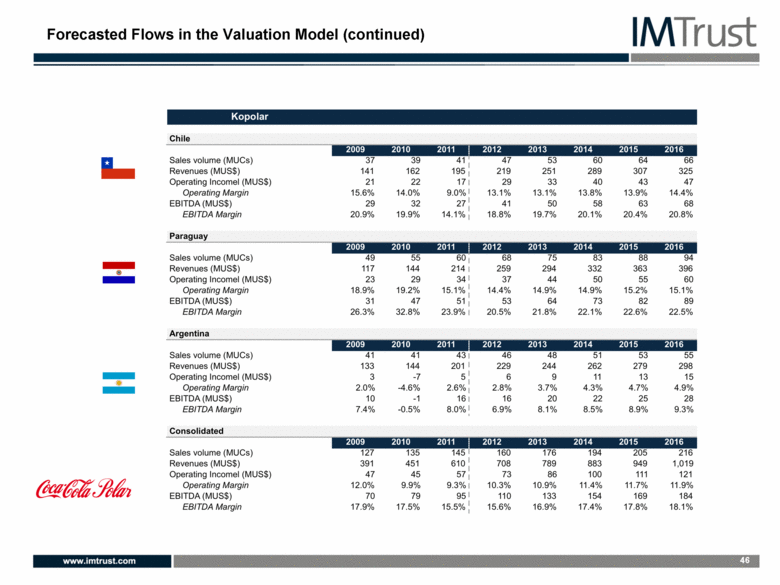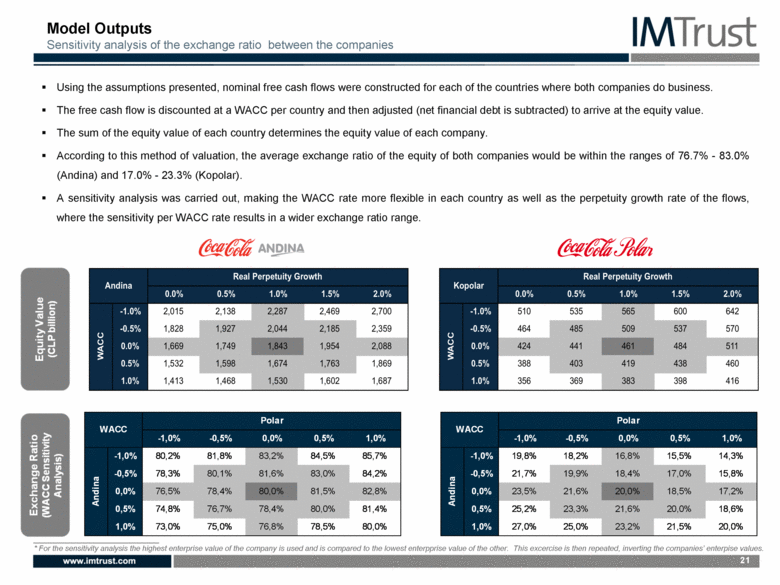
| Model Outputs Sensitivity analysis of the exchange ratio between the companies 21 Using the assumptions presented, nominal free cash flows were constructed for each of the countries where both companies do business. The free cash flow is discounted at a WACC per country and then adjusted (net financial debt is subtracted) to arrive at the equity value. The sum of the equity value of each country determines the equity value of each company. According to this method of valuation, the average exchange ratio of the equity of both companies would be within the ranges of 76.7% - 83.0% (Andina) and 17.0% - 23.3% (Kopolar). A sensitivity analysis was carried out, making the WACC rate more flexible in each country as well as the perpetuity growth rate of the flows, where the sensitivity per WACC rate results in a wider exchange ratio range.* For the sensitivity analysis the highest enterprise value of the company is used and is compared to the lowest enterpprise value of the other. This excercise is then repeated, inverting the companies’ enterpise values. Andina Real Perpetuity Growth 0.0% 0.5% 1.0% 1.5% 2.0% -1.0% 2,015 2,138 2,287 2,469 2,700 -0.5% 1,828 1,927 2,044 2,185 2,359 WACC 0.0% 1,669 1,749 1,843 1,954 2,088 0.5% 1,532 1,598 1,674 1,763 1,869 1.0% 1,413 1,468 1,530 1,602 1,687 Real Perpetuity Growth 0.0% 0.5% 1.0% 1.5% 2.0% -1.0% 510 535 565 600 642 WACC -0.5% 464 485 509 537 570 0.0% 424 441 461 484 511 0.5% 388 403 419 438 460 1.0% 356 369 383 398 416 WACC Polar -1,0% -0,5% 0,0% 0,5% 1,0% Andina -1,0% 80,2% 81,8% 83,2% 84,5% 85,7% -0,5% 78,3% 80,1% 81,6% 83,0% 84,2% 0,0% 76,5% 78,4% 80,0% 81,5% 82,8% 0,5% 74,8% 76,7% 78,4% 80,0% 81,4% 1,0% 73,0% 75,0% 76,8% 78,5% 80,0% WACC Polar -1,0% -0,5% 0,0% 0,5% 1,0% Andina -1,0% 19,8% 18,2% 16,8% 15,5% 14,3% -0,5% 21,7% 19,9% 18,4% 17,0% 15,8% 0,0% 23,5% 21,6% 20,0% 18,5% 17,2% 0,5% 25,2% 23,3% 21,6% 20,0% 18,6% 1,0% 27,0% 25,0% 23,2% 21,5% 20,0% |
