UNITED STATES
SECURITIES AND EXCHANGE COMMISSION
WASHINGTON, D.C. 20549
FORM 6-K
REPORT OF FOREIGN ISSUER
PURSUANT TO RULE 13a-16 OR 15b-16 OF
THE SECURITIES EXCHANGE ACT OF 1934
July 2024
Date of Report (Date of Earliest Event Reported)
Embotelladora Andina S.A.
(Exact name of registrant as specified in its charter)
Andina Bottling Company, Inc.
(Translation of Registrant´s name into English)
Avda. Miraflores 9153
Renca
Santiago, Chile
(Address of principal executive office)
Indicate by check mark whether the registrant files or will file annual reports under cover Form 20-F or Form 40-F.
Form 20-F x Form 40-F ¨
Indicate by check mark if the Registrant is submitting this Form 6-K in paper as permitted by Regulation S-T Rule 101(b)(1):
Yes¨ No x
Indicate by check mark if the Registrant is submitting this Form 6-K in paper as permitted by Regulation S-T Rule 101(b)(7):
Yes ¨ No x
Indicate by check mark whether the registrant by furnishing the information contained in this Form 6-K is also thereby furnishing the information to the Commission pursuant to Rule 12g3-2(b) under the Securities Exchange Act of 1934
Yes¨ No x


EXECUTIVE SUMMARY
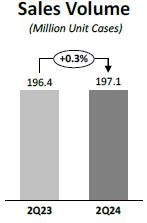
 | The quarter closed with a consolidated Sales Volume of 197.1 million unit cases*, increasing 0.3% regarding the same quarter of the previous year. Transactions reached 1,085.9 million in the quarter, representing a 0.1% decrease regarding the same quarter of the previous year. Accumulated consolidated Sales Volume reached 425.9 million unit cases, representing a 1.3% decrease regarding the previous year. Accumulated transactions reached 2,334.6 million, representing a 1.5% decrease. |
| Company figures reported are the following: |
| · | Consolidated Net Sales reached CLP 672,193 million in the quarter, increasing by 9.4% over the same quarter of the previous year. Accumulated consolidated Net Sales reached CLP 1,485,738 million, representing a 12.0% increase regarding the previous year. |
| · | Consolidated Operating Income* reached CLP 73,582 million in the quarter, representing a 5.6% increase over the same quarter of the previous year. Accumulated consolidated Operating Income reached CLP 199,846 million, an increase of 17.6% regarding the previous year. |
| · | Consolidated Adjusted EBITDA* increased by 9.5% over the same quarter of the previous year, reaching CLP 109,259 million in the quarter. Adjusted EBITDA Margin reached 16.3%, an expansion of 2 basis points regarding the same quarter of the previous year. Accumulated consolidated Adjusted EBITDA reached CLP 271,854 million, which represents an increase of 18.5% regarding the previous year. Adjusted EBITDA Margin for the period reached 18.3%, an expansion of 99 basis points regarding the previous year. |
| · | Net Income attributable to the owners of the controller for the quarter was CLP 24,602 million, representing a 101.8% increase regarding the same quarter of the previous year, as a result of good operating results and the fact that a non-operating loss was recorded in 2023, which was not repeated in 2024. Accumulated Net Income attributable to the owners of the controller was CLP 93,588 million, which represents a 76.8% increase regarding the previous year. |
SUMMARY OF RESULTS – SECOND QUARTER 2024 AND ACCUMULATED FOR THE FIRST HALF 2024
| (Figures in million CLP) | 2Q23 | 2Q24 | Var % | 1H23 | 1H24 | Var % | ||||||||||||||||||
| Sales Volume (Million Unit Cases) | 196.4 | 197.1 | 0.3 | % | 431.4 | 425.9 | -1.3 | % | ||||||||||||||||
| Net Sales | 614,428 | 672,193 | 9.4 | % | 1,325,983 | 1,485,738 | 12.0 | % | ||||||||||||||||
| Operating Income* | 69,682 | 73,582 | 5.6 | % | 169,868 | 199,846 | 17.6 | % | ||||||||||||||||
| Adjusted EBITDA* | 99,770 | 109,259 | 9.5 | % | 229,486 | 271,854 | 18.5 | % | ||||||||||||||||
| Net income attributable to the owners of the controller | 12,192 | 24,602 | 101.8 | % | 52,931 | 93,588 | 76.8 | % | ||||||||||||||||
Comment of the Chief Executive Officer. Mr. Miguel Ángel Peirano
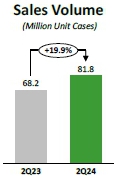
"We closed the second quarter with a Consolidated Adjusted EBITDA of CLP 109,259 million increasing 9.5% over the same quarter of the previous year. Additionally, Adjusted EBITDA margin reached 16.3%, an expansion of 2 basis points over the same period of the previous year. Sales volume totaled 197.1 million unit cases, a 0.3% growth over the same period. Results by operation were dissimilar. While in Brazil volume grew 19.9%, explained by favorable weather factors, industry growth and increased sales to other bottlers; our sales volume in Argentina dropped by 24.8% in the quarter, due to the country’s weak macroeconomic position. We are optimistic for the second half of the year, though, as we have seen an improvement in our volumes in Argentina over the past few weeks. In Paraguay, sales volumes grew 10.1%, explained by the country's solid macroeconomic conditions, and in Chile they declined 6.0%, mainly due to adverse weather conditions during the quarter.
Thus, Adjusted EBITDA in local currency grew 56.4% in Brazil and 17.7% in Paraguay, while in Chile it fell 4.0% and in Argentina it declined 68.3%. Excluding the Argentine operation, the Company's Adjusted EBITDA grew 32.1% compared to the same period of the previous year. Net income attributable to the owners of the controller for the quarter reached CLP 24,602 million, an increase of 101.8% over the same period of the previous year, and net margin was 3.7%, an expansion of 168 basis points.
In October of this year, we will terminate our distribution relationship with Heineken in Brazil, through an agreement established on the best terms between both Companies. This will provide us greater flexibility to develop our Therezópolis brand, and will allow us to generate new business opportunities in the beer segment, such as production and distribution for third parties. The construction of our beer production unit at our plant in Duque de Caxias, Brazil, is progressing according to schedule, and we expect it to begin operations in the second quarter of next year, with an initial installed capacity of 13 million unit cases. The multipurpose production line contemplated in this project will also allow us to produce soft drinks and other categories, with state-of-the-art technology and low environmental impact.
* The definitions used can be found in the Glossary on page 16 of this document.
| COCA-COLA ANDINA | |
| 2Q24 EARNINGS RELEASE | |
| www.koandina.com | -2- |
On the other hand, during June in Argentina, we signed a seven-year agreement with Pampa Energía to incorporate the use of wind energy for the operations of Coca-Cola Andina's plants in Córdoba, Trelew, Bahía Blanca and Andina Empaques. The reduction of greenhouse gas emissions and the management of climate change impacts are key priorities for the Company. Through this agreement, Coca-Cola Andina Argentina guarantees an electric power consumption base of 70% from renewable sources, and plans to inject an additional volume to reach up to 95% of clean energies. In this way, our consolidated energy matrix will increase from 38.6% of renewable energy use in 2023 to over 50% in the coming years.
In Paraguay we were recognized as leaders in the Top of Mind ranking for the thirteenth consecutive year. We are the most remembered brand in the country, an achievement that reflects the team's dedication to our purpose of reaching every corner together to refresh moments and open opportunities."
BASIS OF PRESENTATION
Figures in the following analysis are expressed in accordance with IFRS, in nominal Chilean pesos, both for consolidated results and for the results of each of our operations. All variations with respect to 2023 are nominal.
Since Argentina has been classified as a Hyperinflationary economy, pursuant to IAS 29, translation of figures from local to reporting currency was performed using the closing exchange rate for the translation to Chilean pesos. Local currency figures for both 2024 and 2023 referred to in the Argentina sections are expressed in June 2024 currency.
Finally, a devaluation of local currencies regarding the U.S. dollar has a negative impact on our dollarized costs and a devaluation of local currencies regarding the Chilean peso has a negative impact upon consolidating figures.
When we refer to "Argentina", it includes our subsidiaries Embotelladora del Atlántico S.A. and Empaques Argentina S.A. When we refer to "Chile", it includes the operation in Chile of Embotelladora Andina S.A., as well as its subsidiaries VJ S.A., Vital Aguas S.A., Envases Central S.A. and Re-Ciclar S.A.
CONSOLIDATED RESULTS: 2nd Quarter 2024 vs. 2nd Quarter 2023
| (Figures in million CLP) | 2Q23 | 2Q24 | Var % | |||||||||
| Net Sales | 614,428 | 672,193 | 9.4 | % | ||||||||
| Operating Income | 69,682 | 73,582 | 5.6 | % | ||||||||
| Adjusted EBITDA | 99,770 | 109,259 | 9.5 | % | ||||||||
| Net income attributable to the owners of the controller | 12,192 | 24,602 | 101.8 | % | ||||||||
During the quarter, consolidated Sales Volume was 197.1 million unit cases, which represented an increase of 0.3% compared to the same period of 2023, mainly explained by the volume increase in the Brazilian and Paraguayan operations, partially offset by the volume decrease in the Argentine and Chilean operations. The Non-Alcoholic Beverages Segment represented 95.1% of consolidated Sales Volume and grew 0.6%, mainly explained by the growth of the Segment in Brazil and Paraguay, partially offset by the decrease in Argentina and Chile. The Alcoholic Beverages Segment represented 4.9% of total volume and decreased 5.4%, explained by volume declines in Brazil, Chile and Argentina, partially offset by volume growth in Paraguay. Transactions reached 1,085.9 million during the quarter, representing a decrease of 0.1% compared to the same quarter of the previous year.
Consolidated Net Sales reached CLP 672,193 million, an increase of 9.4%, explained by revenue growth in Brazil and Paraguay, as well as the effect of translating figures from the local currencies of Brazil and Paraguay to the reporting currency, which was partially offset by lower revenues in Argentina and Chile. We continue to make steady progress on our digital transformation agenda. Our B2B platform MiAndina is consistently growing in transactions in all our operations; today more than 46% of total Revenues are through our digital platforms (+20 percentage points compared to the same quarter of the previous year) and with customer satisfaction levels (Net Promoter Score) of around 54%.
| COCA-COLA ANDINA | |
| 2Q24 EARNINGS RELEASE | |
| www.koandina.com | -3- |

Consolidated Cost of Sales increased 9.0%, which is mainly explained by (i) the effect of translating figures from our foreign subsidiaries to the reporting currency, (ii) the increase in sales volumes in Brazil and Paraguay, (iii) a higher cost of sugar, (iv) the effect of the shift in mix towards higher unit cost products in Chile and Paraguay, and (v) a higher cost of labor in Argentina. This was partially offset by (i) a lower cost of Pet resin in Brazil, Chile and Paraguay, and (ii) lower sales volume in Argentina and Chile.
Consolidated Distribution Costs and Administrative Expenses increased 11.9%, which is mainly explained by (i) the effect of translating figures from our foreign subsidiaries to the reporting currency, (ii) higher labor expenses in Brazil, Chile and Paraguay, (iii) higher marketing expenses in Argentina, Chile and Paraguay, and (iv) higher distribution expenses in Brazil and Paraguay, due to higher volumes sold. This was partially offset by (i) lower distribution costs in Argentina and Chile, due to lower volumes sold.
The aforementioned effects led to a consolidated Operating Income of CLP 73,582 million, an increase of 5.6%. Operating Margin was 10.9%.
Consolidated Adjusted EBITDA reached CLP 109,259 million, increasing by 9.5%. Adjusted EBITDA margin was 16.3%, an expansion of 2 basis points.
Net income attributable to owners of the controller for the quarter was CLP 24,602 million, an increase of 101.8%, and Net Margin reached 3.7%, an expansion of 168 basis points.
ARGENTINA: 2nd Quarter 2024 vs. 2nd Quarter 2023

| 2Q23 | 2Q24 | Var % | 2Q23 | 2Q24 | Var % | |||||||||||||||||||
| (Figures in million CLP) | (Figures in million ARS of June 2024) | |||||||||||||||||||||||
| Net Sales | 138,928 | 130,408 | -6.1 | % | 162,748 | 125,942 | -22.6 | % | ||||||||||||||||
| Operating Income | 15,781 | -616 | NA | 18,487 | -595 | NA | ||||||||||||||||||
| Adjusted EBITDA | 24,081 | 9,272 | -61.5 | % | 28,210 | 8,954 | -68.3 | % | ||||||||||||||||
Sales volume in the quarter decreased 24.8%, reaching 31.5 million unit cases, explained by the decrease in volume in all categories. Transactions totaled 148.2 million, representing a decrease of 26.1%.
Net sales amounted to CLP 130,408 million, a decrease of 6.1%. In local currency, they decreased by 22.6%, which was mainly explained by the aforementioned decrease in volume, partially offset by the increase in the average revenue per unit case sold, as a result of price increases slightly above local inflation realized this quarter.
Cost of sales increased 3.4%, while in local currency it decreased 14.8%, which is mainly explained by (i) the lower sales volume, and (ii) a lower cost of concentrate. This was offset by (i) higher labor costs, and (ii) higher sugar costs.
Distribution Costs and Administrative Expenses increased 10.8% in the reporting currency, while in local currency they decreased 8.7%, which is mainly explained by (i) lower distribution and transportation freight expenses, due to lower volumes sold, and (ii) lower labor expenses. This was offset by higher marketing expenses.
The aforementioned effects led to an Operating Income of -CLP 616 million, which compares to a profit of CLP 15,781 million in the same quarter of the previous year. Operating Margin was -0.5%. In local currency terms, Operating Income was a loss of ARS 595 million, which compares to a profit of ARS 18,487 million in the same quarter of the previous year.
Adjusted EBITDA amounted to CLP 9,272 million, a decrease of 61.5%. Adjusted EBITDA margin was 7.1%, a contraction of 1,022 basis points. Adjusted EBITDA in local currency decreased 68.3%.
| COCA-COLA ANDINA 2Q24 EARNINGS RELEASE www.koandina.com | -4- |
BRAZIL: 2nd Quarter 2024 vs. 2nd Quarter 2023
| 2Q23 | 2Q24 | Var % | 2Q23 | 2Q24 | Var % | |||||||||||||||||||
| (Figures in million CLP) | (Figures in million BRL) | |||||||||||||||||||||||
| Net Sales | 159,181 | 218,502 | 37.3 | % | 984 | 1,217 | 23.7 | % | ||||||||||||||||
| Operating Income | 22,078 | 42,628 | 93.1 | % | 137 | 238 | 74.0 | % | ||||||||||||||||
| Adjusted EBITDA | 29,929 | 51,901 | 73.4 | % | 185 | 289 | 56.4 | % | ||||||||||||||||
Sales volume for the quarter reached 81.8 million unit cases, an increase of 19.9%, explained by the increase in the Soft Drinks, Waters and Juices and other non-alcoholic beverages categories, partially offset by the decrease in the Beer and other alcoholic beverages category. The Non-Alcoholic Beverages Segment represented 98.7% of total sales volume, and grew 20.6%, which was explained by the growth of all the segment's categories. The Alcoholic Beverages Segment represented 1.3% of total volume and decreased 17.3%, explained by the decrease in all categories of the segment. Transactions amounted to 431.1 million, representing an increase of 16.1%.
Net Sales amounted to CLP 218,502 million, an increase of 37.3%. In local currency, Net Sales increased by 23.7%, which was mainly explained by the aforementioned increase in volume and to a lesser extent by the increase in the average revenue per unit case sold. Net Sales of the Non-Alcoholic Beverages segment increased 26.3% in local currency, representing 96.1% of total sales. Net Sales of the Alcoholic Beverages Segment decreased 17.4% in local currency, representing 3.9% of total sales.
Cost of Sales increased 29.2%, while in local currency it increased 16.4%, which is mainly explained by (i) the higher sales volume, (ii) the effect of the devaluation of the Brazilian real on our dollarized costs, (iii) a higher cost of concentrate due to price increases, and (iv) a higher cost of sugar. This was partially offset by a lower cost of raw materials, particularly Pet resin.
Distribution Costs and Administrative Expenses increased 26.0% in the reporting currency. In local currency, they increased 13.7%, which is mainly explained by (i) higher freight expenses, due to higher volumes sold, and (ii) higher labor expenses.
The aforementioned effects led to an Operating Income of CLP 42,628 million, an increase of 93.1%. Operating Margin was 19.5%. In local currency, Operating Income increased 74.0%.
Adjusted EBITDA reached CLP 51,901 million, an increase of 73.4% over the previous year. Adjusted EBITDA Margin was 23.8%, an expansion of 495 basis points. In local currency terms, Adjusted EBITDA increased 56.4%.
CHILE: 2nd Quarter 2024 vs. 2nd Quarter 2023

| 2Q23 | 2Q24 | Var % | ||||||||||
| (Figures in million CLP) | ||||||||||||
| Net Sales | 270,196 | 264,979 | -1.9 | % | ||||||||
| Operating Income | 23,226 | 20,003 | -13.9 | % | ||||||||
| Adjusted EBITDA | 34,196 | 32,840 | -4.0 | % | ||||||||
During the quarter, Sales Volume reached 65.3 million unit cases, a decrease of 6.0%, explained by the decrease in all categories. Transactions reached 390.5 million, representing a decrease of 4.9%. The volume of the Non-Alcoholic Beverages Segment represented 87.2% of total Sales Volume, and decreased by 6.2%, which was explained by the decrease in all categories of the segment. The volume of the Alcoholic Beverages Segment represented 12.8% of total Sales Volume, and decreased 4.9%, explained by the decrease in the Beer category, partially offset by the growth of the Other Alcoholic Beverages category.
Net Sales amounted to CLP 264,979 million, a decrease of 1.9%, which is mainly explained by the aforementioned decrease in volume, partially offset by the increase in the average revenue per unit case sold, as a result of price increases. Net Sales of the Non-Alcoholic Beverages segment decreased 2.2%, representing 75.9% of total sales. Net Sales of the Alcoholic Beverages Segment decreased 1.0%, representing 24.1% of total sales.
| COCA-COLA ANDINA 2Q24 EARNINGS RELEASE www.koandina.com | -5- |
Cost of Sales decreased 1.6%, which is mainly explained by (i) the lower volume sold, and (ii) a lower cost of Pet resin. This was partially offset by (i) a higher cost of sugar, (ii) a shift in the mix towards higher unit cost products, and (iii) the devaluation of the Chilean peso which has a negative effect on dollar-denominated costs.
Distribution Costs and Administrative Expenses increased 1.4%, which is mainly explained by (i) a higher cost of labor and services provided by third parties, and (ii) higher marketing expenses. This was partially offset by a lower distribution cost, due to lower volumes sold.
The aforementioned effects led to an Operating Income of CLP 20,003 million, 13.9% lower when compared to the previous year. Operating Margin was 7.5%.
Adjusted EBITDA reached CLP 32,840 million, a decrease of 4.0%. Adjusted EBITDA Margin was 12.4%, a contraction of 26 basis points.
PARAGUAY: 2nd Quarter 2024 vs. 2nd Quarter 2023

| 2Q23 | 2Q24 | Var % | 2Q23 | 2Q24 | Var % | |||||||||||||||||||
| (Figures in million CLP) | (Figures in million PGY) | |||||||||||||||||||||||
| Net Sales | 46,622 | 61,341 | 31.6 | % | 419,879 | 490,541 | 16.8 | % | ||||||||||||||||
| Operating Income | 10,210 | 13,956 | 36.7 | % | 91,955 | 111,366 | 21.1 | % | ||||||||||||||||
| Adjusted EBITDA | 13,342 | 17,718 | 32.8 | % | 120,166 | 141,479 | 17.7 | % | ||||||||||||||||
During the quarter, Sales Volume reached 18.4 million unit cases, an increase of 10.1%, explained by the volume increase in all categories. Transactions reached 116.1 million, an increase of 11.3%.
Net sales amounted to CLP 61,341 million, an increase of 31.6%. In local currency, Net Sales increased 16.8%, which was mainly explained by the aforementioned increase in volume and a higher average revenue per unit case sold.
Cost of Sales in the reporting currency increased 32.1%. In local currency, it increased 17.4%, which is mainly explained by (i) the higher volume sold, (ii) a higher cost of sugar and fructose, and (iii) the shift in the mix towards higher unit cost products. This was partially offset by a lower cost of Pet resin.
Distribution Costs and Administrative Expenses increased 25.0%, and in local currency they increased 11.2%. This is mainly explained by (i) a higher cost of labor and services provided by third parties, (ii) a higher distribution expense, due to the higher volume sold and higher tariffs, and, (iii) a higher marketing expense.
The aforementioned effects led to an Operating Income of CLP 13,956 million, 36.7% higher when compared to the previous year. Operating Margin reached 22.8%. In local currency, Operating Income increased 21.1%.
Adjusted EBITDA reached CLP 17,718 million, an increase of 32.8%, and Adjusted EBITDA Margin was 28.9%, an expansion of 27 basis points. In local currency terms, Adjusted EBITDA increased 17.7%.
| COCA-COLA ANDINA 2Q24 EARNINGS RELEASE www.koandina.com | -6- |
ACCUMULATED RESULTS: 1st Half 2024 vs. 1st Half 2023
Consolidated Results

| (Figures in million CLP) | 1H23 | 1H24 | Var % | |||||||||
| Net Sales | 1,325,983 | 1,485,738 | 12.0 | % | ||||||||
| Operating Income | 169,868 | 199,846 | 17.6 | % | ||||||||
| Adjusted EBITDA | 229,486 | 271,854 | 18.5 | % | ||||||||
| Net income attributable to the owners of the controller | 52,931 | 93,588 | 76.8 | % |
Consolidated Sales Volume was 425.9 million unit cases, which represented a decrease of 1.3% compared to the same period of 2023, mainly explained by the decrease in volume in the Argentine and Chilean operations, partially offset by the increase in volume in the Brazilian and Paraguayan operations. The Non-Alcoholic Beverages Segment represented 95.0% of consolidated Sales Volume and decreased by 1.3%, explained by the decrease of the Segment in Argentina and Chile, partially offset by the increase in Brazil and Paraguay. The Alcoholic Beverages Segment represented 5.0% of total volume and decreased 0.4%, which was mainly explained by the reduction of the Segment's volume in the operations of Brazil and Chile, partially offset by the growth in the operations of Argentina and Paraguay. Transactions amounted to 2,334.6 million, representing a decrease of 1.5%. Consolidated Net Sales reached CLP 1,485,738 million, an increase of 12.0%.
Consolidated Cost of Sales increased by 10.6%, which is mainly explained by (i) the effect of translating figures from our foreign subsidiaries to the reporting currency, (ii) the increase in sales volumes in Brazil and Paraguay, (iii) a higher cost of sugar, (iv) the effect of the shift in the mix towards higher unit cost products in Chile and Paraguay, and (v) a higher labor cost in Argentina. This was partially offset by (i) a lower cost of Pet resin in Brazil, Chile and Paraguay, and (ii) lower sales volume in Argentina and Chile.
Consolidated Distribution Costs and Administrative Expenses increased 12.6%, which is mainly explained by (i) the effect of translating figures from our foreign subsidiaries to the reporting currency, (ii) higher marketing expenses, (iii) higher labor expenses in Brazil, Chile and Paraguay, and (iv) higher distribution expenses in Brazil and Paraguay, due to higher volumes sold. This was partially offset by (i) lower distribution costs in Argentina and Chile, due to lower volumes sold.
The aforementioned effects led to a consolidated Operating Income of CLP 199,846 million, an increase of 17.6%. Operating Margin was 13.5%.
Consolidated Adjusted EBITDA reached CLP 271,854 million, an increase of 18.5%. Adjusted EBITDA Margin was 18.3%, an expansion of 99 basis points.
Net Income attributable to owners of the controller was CLP 93,588 million, an increase of 76.8%, and net margin reached 6.3%
Argentina

| 1H23 | 1H24 | Var % | 1H23 | 1H24 | Var % | |||||||||||||||||||
| (Figures in million CLP) | (Figures in million ARS of June 2024) | |||||||||||||||||||||||
| Net Sales | 323,541 | 316,002 | -2.3 | % | 379,014 | 305,180 | -19.5 | % | ||||||||||||||||
| Operating Income | 50,205 | 33,116 | -34.0 | % | 58,813 | 31,982 | -45.6 | % | ||||||||||||||||
| Adjusted EBITDA | 66,641 | 53,578 | -19.6 | % | 78,067 | 51,743 | -33.7 | % | ||||||||||||||||
Sales volume decreased 23.9%, reaching 73.3 million unit cases, explained by the decrease in the volume of the Soft Drinks, Waters and Juices and other non-alcoholic beverages categories, partially offset by the increase in the volume of the Beer and other alcoholic beverages category. Transactions amounted to 348.3 million, representing a decrease of 24.5%.
| COCA-COLA ANDINA 2Q24 EARNINGS RELEASE www.koandina.com | -7- |
Net Sales amounted to CLP 316,002 million, a decrease of 2.3%, while in local currency, Net Sales decreased 19.5%, which was mainly explained by the aforementioned decrease in volume, partially offset by the increase in the average revenue per unit case sold.
Cost of Sales increased 1.6%. In local currency, it decreased 16.2%, which is mainly explained by (i) the lower sales volume, and (ii) a lower cost of concentrate. This was offset by (i) higher labor costs, and (ii) higher sugar costs.
Distribution Costs and Administrative Expenses increased 6.3% in the reporting currency. In local currency, they decreased 12.3%, which is mainly explained by (i) a lower distribution cost due to lower sales volume, and (ii) a lower labor cost. This was partially offset by higher marketing expenses.
The aforementioned effects led to an Operating Income of CLP 33,116 million, a decrease of 34.0%. Operating Margin was 10.5%. In local currency, Operating Income decreased 45.6%.
Adjusted EBITDA reached CLP 53,578 million, a decrease of 19.6%. Adjusted EBITDA margin was 17.0%, a contraction of 364 basis points. Adjusted EBITDA in local currency decreased 33.7%.
Brazil
| 1H23 | 1H24 | Var % | 1H23 | 1H24 | Var % | |||||||||||||||||||
| (Figures in million CLP) | (Figures in million BRL) | |||||||||||||||||||||||
| Net Sales | 320,506 | 451,413 | 40.8 | % | 2,019 | 2,435 | 20.6 | % | ||||||||||||||||
| Operating Income | 41,848 | 82,246 | 96.5 | % | 264 | 444 | 68.6 | % | ||||||||||||||||
| Adjusted EBITDA | 57,168 | 100,945 | 76.6 | % | 360 | 546 | 51.5 | % | ||||||||||||||||
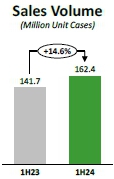
Sales volume increased 14.6%, reaching 162.4 million unit cases, explained by the volume increase in the Soft Drinks, Waters and Juices and other non-alcoholic beverages categories, partially offset by the decrease in the Beer and other alcoholic beverages category. The Non-Alcoholic Beverages Segment represented 98.4% of total sales volume, and grew 14.9%, which was explained by the growth of all the Segment's categories. The Alcoholic Beverages Segment represented 1.6% of total volume and decreased 3.2%, which was explained by the decrease in the Beer category, partially offset by the increase in the Other Alcoholic Beverages category. Transactions amounted to 864.1 million, representing an increase of 11.4%.
Net Sales reached CLP 451,413 million, an increase of 40.8%, driven by the positive effect of translating figures into Chilean pesos. In local currency, Net Sales increased 20.6%, due to the aforementioned volume increase and to a lesser extent due to a higher average price as a result of the price increases we have implemented. Net Sales of the Non-Alcoholic Beverages segment increased 22.3% in local currency, representing 95.5% of total sales. Net Sales of the Alcoholic Beverages segment decreased 5.6% in local currency, representing 4.5% of total sales.
Cost of Sales increased 32.3%, while in local currency it increased 13.2%, which is mainly explained by (i) the higher sales volume, (ii) a higher cost of concentrate due to price increases, and (iii) a higher cost of sugar. This was partially offset by a lower cost of Pet resin.
Distribution Costs and Administrative Expenses increased 33.0% in the reporting currency, and in local currency they increased 13.9%, which is mainly explained by (i) higher labor costs, (ii) higher distribution and haulage expenses, and (iii) higher marketing expenses.
The aforementioned effects led to an Operating Income of CLP 82,246 million, an increase of 96.5%. Operating Margin was 18.2%. In local currency, Operating Income increased 68.6%.
Adjusted EBITDA reached CLP 100,945 million, an increase of 76.6% over the previous year. Adjusted EBITDA Margin was 22.4%, an expansion of 453 basis points. In local currency terms, Adjusted EBITDA increased 51.5%.
| COCA-COLA ANDINA 2Q24 EARNINGS RELEASE www.koandina.com | -8- |
Chile

| 1H23 | 1H24 | Var % | |||||||
| (Figures in million CLP) | |||||||||
| Net Sales | 582,729 | 588,219 | 0.9 | % | |||||
| Operating Income | 57,280 | 56,787 | -0.9 | % | |||||
| Adjusted EBITDA | 78,933 | 81,784 | 3.6 | % | |||||
Sales volume reached 150.2 million unit cases, a decrease of 4.3%, explained by the decrease in all categories. Transactions reached 872.5 million, a decrease of 4.1%. The Non-Alcoholic Beverages Segment represented 87.7% of total sales volume, and decreased 4.7%, which was explained by the decrease in all categories of the segment. The Alcoholic Beverages Segment represented 12.3% of total Sales Volume and decreased 1.5%, explained by the decrease in the Beer category, partially offset by the increase in the Other Alcoholic Beverages category.
Net Sales amounted to CLP 588,219 million, an increase of 0.9%, which is explained by a higher average price in the period, due to the price increases made, partially offset by the aforementioned decrease in volume. Net Sales of the Non-Alcoholic Beverages segment increased 1.1%, representing 77.4% of total sales. Net Sales of the Alcoholic Beverages Segment increased 0.3%, representing 22.6% of total sales.
Cost of Sales increased 0.9%, which is mainly explained by (i) a shift in the mix towards higher unit cost products, (ii) a higher cost of sugar and (iii) the negative effect of the devaluation of the Chilean peso on our dollarized costs. This was partially offset by (i) lower sales volume, and (ii) a lower cost of Pet resin.
Distribution Costs and Administrative Expenses increased 1.8%, which is mainly explained by (i) a higher cost of labor and services provided by third parties, and (ii) higher marketing expenses. This was partially offset by lower distribution expenses due to lower sales volumes.
The aforementioned effects led to an Operating Income of CLP 56,787 million, 0.9% lower when compared to the previous year. Operating Margin was 9.7%.
Adjusted EBITDA reached CLP 81,784 million, an increase of 3.6%. Adjusted EBITDA Margin was 13.9%, an expansion of 36 basis points.
| COCA-COLA ANDINA | |
| 2Q24 EARNINGS RELEASE | |
| www.koandina.com | |
| -9- |
Paraguay
| 1H23 | 1H24 | Var % | 1H23 | 1H24 | Var % | |||||||||||||
| (Figures in million CLP) | (Figures in million PGY) | |||||||||||||||||
| Net Sales | 100,464 | 135,603 | 35.0 | % | 903,865 | 1,061,839 | 17.5 | % | ||||||||||
| Operating Income | 23,826 | 32,785 | 37.6 | % | 214,284 | 256,016 | 19.5 | % | ||||||||||
| Adjusted EBITDA | 30,200 | 40,799 | 35.1 | % | 271,647 | 318,823 | 17.4 | % | ||||||||||
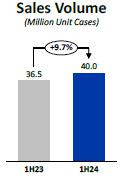
Sales volume reached 40.0 million unit cases, an increase of 9.7%, explained by the increase in volume in all categories. Transactions totaled 249.7 million, an increase of 12.1%.
Net Sales amounted to CLP 135,603 million, an increase of 35.0%. In local currency, Net Sales increased 17.5%, which is explained by the aforementioned increase in Sales Volume and a higher average price.
Cost of Sales increased 35.2% and in local currency it increased 17.7%, which is mainly explained by (i) the higher volume sold, (ii) a higher cost of sugar and fructose, and (iii) the shift in the mix towards higher unit cost products. This was partially offset by a lower cost of Pet resin.
Distribution Costs and Administrative Expenses increased 31.3% in the reporting currency. In local currency, they increased 14.5%, which is mainly explained by (i) higher labor expenses and services provided by third parties, (ii) higher marketing expenses, and (iii) higher distribution expenses, due to higher sales volumes.
The aforementioned effects led to an Operating Income of CLP 32,785 million, 37.6% higher when compared to the previous year. Operating Margin reached 24.2%. In local currency, Operating Income increased 19.5%.
Adjusted EBITDA reached CLP 40,799 million, 35.1% higher when compared to the previous year, and Adjusted EBITDA Margin was 30.1%, an expansion of 3 basis points. In local currency terms, Adjusted EBITDA increased 17.4%.
NON-OPERATING RESULTS FOR THE QUARTER
Net Financial Income and Expenses account recorded an expense of CLP 9,567 million, which compares with an expense of CLP 7,192 million in the same quarter of the previous year, mainly as a result of lower financial income due to a lower cash level, especially in Argentina.
Share of Profit or Loss from Investments Accounted for by the Equity Method went from a loss of CLP 230 million to a loss of CLP 76 million, which is mainly explained by higher results of subsidiaries in Brazil, which were offset by lower results of subsidiaries in Chile.
Other Income and Expenses account recorded a loss of CLP 9,813 million, which compares to a loss of CLP 28,890 million in the same quarter of the previous year; this difference is mainly explained by the fact that in the previous year a loss was generated by the assignment to a third party of a credit in favor of the Company, which was made at a discount.
Results by Adjustment Units and Exchange Rate Differences account recorded a loss of CLP 4,764 million, very similar to the figure for the previous year, which was a loss of CLP 5,300 million.
Income Tax went from -CLP 16,611 million to -CLP 23,951 million, a variation that is mainly explained by higher operating income and the withholding tax resulting from the payment of a dividend from Paraguay, as well as taxes generated in Chile as a result of the same dividend.
| COCA-COLA ANDINA | |
| 2Q24 EARNINGS RELEASE | |
| www.koandina.com | |
| -10- |
CONSOLIDATED BALANCE
The following are the balances of Assets and Liabilities as of the closing date of these financial statements:
| 12.31.2023 | 06.30.2024 | Variation | ||||||||||
| Assets | million CLP | million CLP | million CLP | |||||||||
| Current assets | 981,771 | 895,254 | -86,517 | |||||||||
| Non-current assets | 1,939,750 | 2,104,384 | 164,634 | |||||||||
| Total Assets | 2,921,521 | 2,999,638 | 78,117 | |||||||||
| 12.31.2023 | 06.30.2024 | Variation | ||||||||||
| Liabilities | million CLP | million CLP | million CLP | |||||||||
| Current liabilities | 692,871 | 609,433 | -83,438 | |||||||||
| Non-current liabilities | 1,307,664 | 1,330,089 | 22,425 | |||||||||
| Total Liabilities | 2,000,535 | 1,939,522 | -61,013 | |||||||||
| 12.31.2023 | 06.30.2024 | Variation | ||||||||||
| Equity | million CLP | million CLP | million CLP | |||||||||
| Non-controlling interests | 34,695 | 34,747 | 52 | |||||||||
| Equity attributable to the owners of the controller | 886,291 | 1,025,369 | 139,079 | |||||||||
| Total Equity | 920,985 | 1,060,116 | 139,130 | |||||||||
At the closing of June 2024, with respect to the closing of 2023, the Argentine peso and the Brazilian real depreciated with respect to the Chilean peso by 4.8% and 6.6%, respectively, which generated a decrease in assets, liabilities and equity accounts, due to the effect of translation of figures to the reporting currency. On the other hand, the Paraguayan guaraní appreciated against the Chilean peso by 3.8%, which generated an increase in the assets, liabilities and equity accounts, due to the effect of translation of figures to the reporting currency. Additionally, the figures for Argentina, in accordance with IAS 29, prior to the translation of figures, are adjusted for accumulated inflation as of the closing of 2023, until the closing currency of this report (June 2024), increasing the figures in local currency by 79.7%.
Assets
Total assets increased by CLP 78,117 million, 2.7% compared to December 2023.
Current assets decreased by CLP 86,517 million, 8.8% compared to December 2023, which is mainly explained by the decrease in Trade and other current accounts receivable (-CLP 78,217 million), due to seasonal factors, since we compare it to December, the month of highest sales of the year and therefore, of high accounts receivable with respect to an average month, and by the decrease in Cash and cash equivalents (-CLP 71,253 million) mainly due to the payment of dividends. The above decreases are partially offset by the increase in Other current non-financial assets (CLP 29,957 million) due to higher prepayments to suppliers of our subsidiary in Argentina, mainly of raw materials.
Non-current assets increased by CLP 164,634 million, 8.5% compared to December 2023, mainly due to the increase in Property, plant and equipment (CLP 128,350 million), which is explained by investments made (CLP 131,951 million), added to the effect of the translation of figures and IAS 29 adjustments, which were partially offset by the Depreciation account. Additionally there was an increase in Other non-current financial assets (CLP 25,201 million).
Liabilities and Equity
Liabilities decreased by CLP 61,013 million, 3.0% compared to December 2023.
Current liabilities decreased by CLP 83,438 million, 12.0% compared to December 2023, mainly due to the decrease in Trade and other current accounts payable (-CLP 85,788 million), due to seasonal factors considering that December is the month with the highest sales of the year, and therefore a month with high accounts payable to suppliers.
On the other hand, non-current liabilities increased by CLP 22,425 million, 1.7% compared to December 2023, mainly due to the increase in deferred tax liabilities (CLP 23,220 million), which is mainly explained by the increase in deferred liabilities for distribution rights and fixed assets.
Equity increased by CLP 139,130 million, 15.1% compared to December 2023, explained by the increase in Accumulated earnings from profits obtained in the period (CLP 93,588 million), the restatement of equity balances in our subsidiary in Argentina in accordance with IAS 29 (CLP 114,459 million) and the distribution of dividends (-CLP 61,622 million). The increase in Accumulated earnings was partially offset by the decrease in Other reserves (-CLP 7,347 million).
| COCA-COLA ANDINA | |
| 2Q24 EARNINGS RELEASE | |
| www.koandina.com | |
| -11- |
FINANCIAL ASSETS AND LIABILITIES
| CONSOLIDATED NET FINANCIAL DEBT | (million USD) | |||
| Total Financial Assets | 391 | |||
| Cash and Cash Equivalent (1) | 246 | |||
| Other current financial assets (1) | 73 | |||
| Net valuation of Hedge Derivatives (2) | 71 | |||
| Financial Debt | 1,156 | |||
| Bonds on the international market | 494 | |||
| Bonds on the local market (Chile) | 573 | |||
| Bank Debt and Others | 88 | |||
| Net Financial Debt | 764 | |||
(1) Financial Assets corresponding to Cash and Cash Equivalents and Other current financial assets are held invested in low-risk instruments such as time deposits, short-term fixed-income mutual funds and others.
(2) Considers the net effect of valuations in favor of and against hedge derivatives.
CURRENCY EXPOSURE (%)
| Financial Assets (1) | Financial Debt (3) | |||||||
| CLP (Chile) | 49 | % | 26 | % | ||||
| Unidad de Fomento (CLP indexed to inflation) | 17 | % | 54 | % | ||||
| BRL (Brazil) | 28 | % | 17 | % | ||||
| PGY (Paraguay) | 4 | % | 0 | % | ||||
| ARS (Argentina) | 1 | % | 2 | % | ||||
| USD (United States) | 1 | % | 1 | % | ||||
| CHF (Switzerland) | 0 | % | 0 | % | ||||
| Total | 100 | % | 100 | % | ||||
(3) Includes valuation of hedge derivatives.
RISK RATING
| Local rating agencies | Rating | |
| ICR | AA+ | |
| Fitch Chile | AA+ | |
| International rating agencies | Rating | |
| Standard & Poors | BBB | |
| Fitch Ratings, Inc. | BBB+ |
DEBT AMORTIZATION PROFILE

CASH FLOW
| 06.30.2023 | 06.30.2024 | Variation | ||||||||||
| Cash flow | million CLP | million CLP | million CLP | % | ||||||||
| Operating | 127,008 | 146,123 | 19,115 | 15.1 | % | |||||||
| Investment | -55,992 | -147,862 | -91,871 | 164.1 | % | |||||||
| Financing | -75,856 | -63,344 | 12,512 | -16.5 | % | |||||||
| Net Cash Flow for the period | -4,839 | -65,084 | -60,244 | 1,244.9 | % | |||||||
During the current period, the Company generated a negative net cash flow of CLP 65,084 million, which is explained as follows:
Operating activities generated a positive net cash flow of CLP 146,123 million, higher than the CLP 127,008 million recorded in the same period of 2023, which is mainly due to higher revenues from the sale of goods, partially offset by higher payments to suppliers.
Investing activities generated a negative cash flow of CLP 147,862 million, with a negative variation of CLP 91,871 million with respect to the previous period, which is mainly explained by the absence of redemptions of financial instruments in 2024, which increased cash and cash equivalents in 2023 (in 2023 the redemption was CLP 63,159 million), added to a higher investment in Capex of CLP 28,511 million.
Financing activities generated a negative cash flow of CLP 63,344 million, with a positive variation of CLP 12,512 million with respect to the previous period, which is mainly explained by a lower dividend payment in 2024.
| COCA-COLA ANDINA | |
| 2Q24 EARNINGS RELEASE | |
| www.koandina.com | |
| -12- |
MAIN INDICATORS
| INDICATOR | Definition | Unit | Jun 24 | Dec 23 | Jun 23 | Jun 24 vs Dec 23 | Jun 24 vs Jun 23 | |
| LIQUIDITY | ||||||||
| Current liquidity | Current Asset | Times | 1.5 | 1.4 | 1.2 | 3.7% | 21.4% | |
| Current Liability | |||||||
| Acid ratio | Current Asset – Inventory | Times | 1.0 | 1.1 | 0.9 | -3.6% | 16.4% | |
| Current Liability | ||||||||
| ACTIVITY | ||||||||
| Investment | Million CLP | 131,951 | 222,620 | 85,339 | -40.7% | 54.6% | ||
| Inventory turnover | Cost of Sales | Times | 3.6 | 6.7 | 3.3 | -45.9% | 10.1% | |
| Average Inventory | ||||||||
| INDEBTEDNESS | ||||||||
| Indebtedness ratio | Net Financial Debt* | Times | 0.7 | 0.7 | 0.8 | -1.2% | -16.5% | |
| Total Equity* | ||||||||
| Financial exp. coverage | Adjusted EBITDA (12M) | Times | 14.5 | 13.6 | 17.3(4) | 6.7% | -16.0% | |
| Financial Expenses* (12M) – Financial Income* (12M) | ||||||||
| Net financial debt / | Net Financial Debt | Times | 1.3 | 1.4 | 1.5 | -5.0% | -15.9% | |
| Adjusted EBITDA | Adjusted EBITDA (12M) | |||||||
| PROFITABILITY | ||||||||
| On Equity | Net Income Fiscal Year (12M) | % | 22.2% | 19.7% | 13.9% | 2.5 pp | 8.3 pp | |
| Average Equity | ||||||||
| On Total Assets | Net Income Fiscal Year (12M) | % | 7.2% | 5.8% | 4.1% | 1.4 pp | 3.1 pp | |
| Average Assets | ||||||||
Liquidity
Current Liquidity showed a positive variation of 3.7% compared to December 2023, explained by the 12.0% decrease in current liabilities, which was greater than the decrease in current assets (8.8%).
The Acid Ratio showed a decrease of 3.6% compared to December 2023, for the reasons explained above, in addition to the increase in inventories (11.8%) in the period. Current assets excluding inventories showed a decrease of 15.2% compared to December 2023.
Activity
At the closing of June 2024, investments reached CLP 131,951 million, which corresponds to an increase of 54.6% compared to the same period of 2023, mainly explained by higher productive investments.
Inventory turnover reached 3.6 times, showing an increase of 10.1% compared to the same period of 2023, mainly explained by the 10.6% increase in cost of sales compared to the same period of 2023, added to the increase in average inventory (0.5%).
Indebtedness
The debt ratio reached 0.7 times at the end of June 2024, which corresponds to a decrease of 1.2% compared to the end of December 2023. This is mainly due to the 15.1% increase in equity, which was 13.7% higher than the increase in net financial debt.
The Financial Expense Coverage indicator shows an increase of 6.7% when compared to December 2023, reaching 14.5 times. This is explained by the fact that the increase in the 12 rolling months Adjusted EBITDA (19.7%) was greater than the increase in the 12 rolling months net financial expenses (12.2%).
Net financial debt/Adjusted EBITDA reached 1.3 times, which represents a decrease of 5.0% compared to December 2023. This is due to the 19.7% increase in Adjusted EBITDA, which was 13.7% higher than the increase in net financial debt.
*Definitions used are contained in the Glossary on page 16 of this document.
(4) Due to a change in criteria in the calculation of Adjusted EBITDA for the rolling 12-month period, this value differs from that previously reported.
| COCA-COLA ANDINA | |
| 2Q24 EARNINGS RELEASE | |
| www.koandina.com | |
| -13- |
Profitability
Return on Equity reached 22.2%, 2.5 percentage points higher than the indicator measured in December 2023. This result is due to the increase in Net Income for the 12 rolling months (23.7%), which was higher than the increase in average Equity (9.8%).
Return on Total Assets was 7.2%, 1.4 percentage points higher than the indicator measured in December 2023, explained by the increase in the 12 rolling months Net Income (23.7%), which was higher than the decrease in Average Assets (0.2%).
MACROECONOMIC INFORMATION
| INFLATION | ||||||||
| Accumulated 1H24 | LTM | |||||||
| Argentina* | 79.70 | % | 270.98 | % | ||||
| Brazil | 2.48 | % | 4.23 | % | ||||
| Chile | 2.42 | % | 4.20 | % | ||||
| Paraguay | 2.77 | % | 4.30 | % | ||||
*Official inflation reported by the National Institute of Statistics and Censuses of Argentina (INDEC). It should be mentioned that the inflation used to restate Argentina's figures in accordance with IAS 29 corresponds to inflation estimated by the Central Bank of the Argentine Republic (in its Survey of Market Expectations report), which is also adjusted for the difference between the estimate (by the Central Bank) and the actual inflation of the previous month (INDEC).
| EXCHANGE | Local currency/USD | CLP/local currency | ||||||||||||||
| RATES USED | (Average exchange rate*) | (Average exchange rate*) | ||||||||||||||
| 2Q23 | 2Q24 | 2Q23 | 2Q24 | |||||||||||||
| Argentina | 256.7 | 912.0 | 3.1 | 1.0 | ||||||||||||
| Brazil | 4.95 | 5.22 | 161.77 | 179.06 | ||||||||||||
| Chile | 801 | 934 | N.A | N.A | ||||||||||||
| Paraguay | 7,216 | 7,486 | 0.11 | 0.12 | ||||||||||||
*Except Argentina, where the closing exchange rate is used, in accordance with IAS 29.
| EXCHANGE | Local currency/USD | CLP/local currency | ||||||||||||||
| RATES USED | (Average exchange rate*) | (Average exchange rate*) | ||||||||||||||
| 1H23 | 1H24 | 1H23 | 1H24 | |||||||||||||
| Argentina | 256.7 | 912.0 | 3.1 | 1.0 | ||||||||||||
| Brazil | 5.07 | 5.09 | 158.82 | 185.08 | ||||||||||||
| Chile | 806 | 941 | N.A | N.A | ||||||||||||
| Paraguay | 7,252 | 7,392 | 0.11 | 0.13 | ||||||||||||
*Except Argentina, where the closing exchange rate is used, in accordance with IAS 29.
MARKET RISK ANALYSIS
The Company’s risk management is the responsibility of the office of the Chief Executive Officer, (through the areas of Corporate Management Control, Sustainability and Risks, which depends on the office of the Chief Financial Officer), as well as each of the management areas of Coca-Cola Andina. The main risks that the Company has identified and that could possibly affect the business are as follows:
Relationship with The Coca-Cola Company
A large part of the Company’s sales derives from the sale of products whose trademarks are owned by The Coca-Cola Company, which has the ability to exert an important influence on the business through its rights under the Licensing or Bottling Agreements. In addition, we depend on The Coca-Cola Company to renew these Bottling Agreements.
Non-alcoholic beverage business environment
Consumers, public health officials, and government officials in our markets are increasingly concerned about the public health consequences associated with obesity, which can affect demand for our products, especially those containing sugar.
The Company has developed a large portfolio of sugar-free products and has also made reformulations to some of its sugary products, significantly reducing sugar contents of its products.
| COCA-COLA ANDINA | |
| 2Q24 EARNINGS RELEASE | |
| www.koandina.com | |
| -14- |
Raw material prices and exchange rate
Many raw materials are used in the production of beverages and packaging, including sugar and PET resin, the prices of which may present great volatility. In the case of sugar, the Company sets the price of a part of the volume that it consumes with some anticipation, in order to avoid having large fluctuations of cost that cannot be anticipated.
In addition, these raw materials are traded in dollars; the Company has a policy of hedging in the futures market a portion of the dollars it uses to buy raw materials.
Instability in the supply of utilities and raw materials
In the countries in which we operate, our operations depend on a stable supply of utilities, fuel and raw materials. Power outages or water shut offs as well as the lack of raw materials may result in interruptions of our production. The Company has mitigation plans to reduce the effects of eventual interruptions in the supply of utilities and raw materials.
Economic conditions of the countries where we operate
The Company maintains operations in Argentina, Brazil, Chile and Paraguay. The demand for our products largely depends on the economic situation of these countries. Moreover, economic instability can cause depreciation of the currencies of these countries, as well as inflation, which may eventually affect the Company’s financial situation.
New tax laws or modifications to tax incentives
We cannot ensure that any government authority in any of the countries in which we operate will not impose new taxes or increase existing taxes on our raw materials, products or containers. Likewise, we cannot assure that these authorities are going to uphold and/or renew tax incentives that currently benefit some of our operations.
A devaluation of the currencies of the countries where we have our operations, regarding the Chilean peso, can negatively affect the results reported by the Company in Chilean pesos
The Company reports its results in Chilean pesos, while a large part of its revenues and Adjusted EBITDA comes from countries that use other currencies. Should currencies devaluate regarding the Chilean peso, this would have a negative effect on the results of the Company, upon the translation of results into Chilean pesos.
The imposition of exchange controls could restrict the entry and exit of funds to and from the countries in which we operate, which could significantly limit our financial capacity
The imposition of exchange controls in the countries in which we operate could affect our ability to repatriate profits, which could significantly limit our ability to pay dividends to our shareholders. Additionally, it may limit the ability of our foreign subsidiaries to finance payments of U.S. dollar denominated liabilities required by foreign creditors.
Civil unrest in Chile could have a material adverse effect on general economic conditions in Chile and our business and financial condition
We cannot predict whether the Chilean economy will be significantly impacted by any protests or demonstrations, which have been violent on occasion in the past, or whether the public policies that the government implements in response to these demonstrations will have a negative impact on the economy and our business. Neither can we assure that demonstrations and vandalism will not cause damage to our logistics and production infrastructure. So far, the Company has not been affected in any material respect.
Our business is subject to risks from pandemics such as COVID-19.
Pandemics pose the risk that we or our employees, contractors, suppliers and other partners may be limited or prevented from conducting business for an indefinite period of time, including due to shutdowns that may be requested or ordered by governmental authorities. In addition, we may experience disruptions in the supply of raw materials.
Pandemics and related governmental actions could adversely affect our business and results of operations, potentially in a material way.
A more detailed analysis of business risks is available in the Company’s 20-F and Annual Report, available on our website.
| COCA-COLA ANDINA | |
| 2Q24 EARNINGS RELEASE | |
| www.koandina.com | |
| -15- |
RECENT EVENTS
Final Dividend 230
On May 23 2024, the Company paid Final Dividend 230: CLP 32.0 per Series A share; and CLP 35.2 per Series B share.
Final Dividend 231
On May 30, 2024, the Company paid Final Dividend 231: CLP 30.0 per Series A share; and CLP 33.0 per Series B share.
Termination of Beer Distribution Agreement with Heineken in Brazil
In October of this year, we will terminate our distribution relationship with Heineken in Brazil, through an agreement established on the best terms between both Companies. This will give us greater flexibility to develop our Therezópolis brand, and will allow us to generate new business opportunities in the beer segment, such as production and distribution for third parties.
GLOSSARY
Adjusted EBITDA: includes Revenue, Costs of Sales, Distribution Costs and Administrative Expenses, included in the Financial Statements submitted to Chile’s Financial Market Commission and determined in accordance with IFRS, plus Depreciation.
Currency-neutral of a quarter q for a Q year is calculated using the same ratio of local currencies to the Chilean peso as the q quarter of the Q-1 year. In the case of Argentina, given that it is a hyperinflationary economy, the result of the q quarter is also deflated by inflation of the last 12 months.
Financial Expenses: correspond to interest generated by the Company’s financial debt.
Financial Income: corresponds to the interest generated by the Company's cash.
Net Financial Debt: considers the consolidated financial liability that accrues interest, i.e.: (i) other current financial liabilities, plus (ii) other non-current financial liabilities, less (iii) the sum of cash and cash equivalent; plus other current financial assets; plus other non-current financial assets (to the extent that they correspond to the balances of assets for derivative financial instruments, taken to cover exchange rate risk and/or interest rate of financial liabilities).
Operating Income: includes Revenue, Costs of Sales, Distribution Costs and Administrative Expenses, included in the Financial Statements submitted to Chile’s Financial Market Commission and determined in accordance with IFRS.
Total Equity: corresponds to the equity attributable to the owners of the controller plus non-controlling interests.
Transactions: refers to the number of units sold, regardless of size.
Volume: expressed in Unit Cases (UCs), which is the conventional measurement used to measure sales volume in the Coca-Cola System worldwide.
| COCA-COLA ANDINA | |
| 2Q24 EARNINGS RELEASE | |
| www.koandina.com | |
| -16- |
ADDITIONAL INFORMATION
| STOCK EXCHANGES ON WHICH WE TRADE | |||
ANDINA-A ANDINA-B
|
AKO/A AKO/B
| ||
| ESG INDICES IN WHICH WE PARTICIPATE | |||
Dow Jones Sustainability Index Chile Dow Jones Sustainability MILA Pacific Alliance Index. |
|
|
|
| NUMBER OF SHARES | |||
| TOTAL: 946,570,604 | SERIES A: 473,289,301 | SERIES B: 473,281,303 | SHARES PER ADR: 6 |


ABOUT COCA-COLA ANDINA
Coca-Cola Andina is among the three largest Coca-Cola bottlers in Latin America, servicing franchised territories with almost 57.4 million people, delivering 882.6 million unit cases or 5,011 million liters of soft drinks, juices, bottled water, beer and other alcoholic beverages during 2023. Coca-Cola Andina has the franchise to produce and commercialize Coca-Cola products in certain territories in Argentina (through Embotelladora del Atlántico), in Brazil (through Rio de Janeiro Refrescos), in Chile, (through Embotelladora Andina) and in all of Paraguay (through Paraguay Refrescos). The Chadwick Claro, Garcés Silva, Said Handal and Said Somavía families control Coca-Cola Andina in equal parts. The Company's value generation proposal is to become a Total Beverage Company, using existing resources efficiently and sustainably, developing a relationship of excellence with consumers of its products, as well as with its collaborators, customers, suppliers, the community in which it operates and with its strategic partner The Coca-Cola Company, in order to increase ROIC for shareholders in the long term. For more company information visit www.koandina.com.
This document may contain projections reflecting Coca-Cola Andina’s good faith expectation and are based on currently available information. However, the results that are finally obtained are subject to diverse variables, many of which are beyond the Company's control, and which could materially impact the current performance. Among the factors that could change the performance are the political and economic conditions on mass consumption, pricing pressures resulting from competitive discounts of other bottlers, weather conditions in the Southern Cone and other risk factors that would be applicable from time to time, and which are periodically informed in reports filed before the appropriate regulatory authorities, and which are available on our website.
| COCA-COLA ANDINA | |
| 2Q24 EARNINGS RELEASE | |
| www.koandina.com | |
| -17- |
Embotelladora Andina S.A.
Second Quarter Results for the period ended June 30, 2024. Reported figures, IFRS GAAP.
(In nominal million Chilean pesos, except per share)
| April-June 2024 | April-June 2023 | |||||||||||||||||||||||||||||||||||||||||||
| Chilean Operations | Brazilian Operations | Argentine Operations | Paraguay Operations | Total (1) | Chilean Operations | Brazilian Operations | Argentine Operations | Paraguay Operations | Total (1) | % Ch. | ||||||||||||||||||||||||||||||||||
| Volume total beverages (Million UC) | 65.3 | 81.8 | 31.5 | 18.4 | 197.1 | 69.5 | 68.2 | 42.0 | 16.7 | 196.4 | 0.3 | % | ||||||||||||||||||||||||||||||||
| Transactions (Million) | 390.5 | 431.1 | 148.2 | 116.1 | 1,085.9 | 410.6 | 371.2 | 200.4 | 104.3 | 1,086.5 | -0.1 | % | ||||||||||||||||||||||||||||||||
| Net sales | 264,979 | 218,502 | 130,408 | 61,341 | 672,193 | 270,196 | 159,181 | 138,928 | 46,622 | 614,428 | 9.4 | % | ||||||||||||||||||||||||||||||||
| Cost of sales | (178,945 | ) | (126,150 | ) | (75,328 | ) | (34,493 | ) | (411,796 | ) | (181,862 | ) | (97,634 | ) | (72,876 | ) | (26,101 | ) | (377,809 | ) | 9.0 | % | ||||||||||||||||||||||
| Gross profit | 86,034 | 92,353 | 55,080 | 26,848 | 260,397 | 88,334 | 61,547 | 66,052 | 20,521 | 236,619 | 10.0 | % | ||||||||||||||||||||||||||||||||
| Gross margin | 32.5 | % | 42.3 | % | 42.2 | % | 43.8 | % | 38.7 | % | 32.7 | % | 38.7 | % | 47.5 | % | 44.0 | % | 38.5 | % | ||||||||||||||||||||||||
| Distribution and administrative expenses | (66,031 | ) | (49,724 | ) | (55,696 | ) | (12,893 | ) | (184,344 | ) | (65,108 | ) | (39,469 | ) | (50,271 | ) | (10,311 | ) | (165,159 | ) | 11.6 | % | ||||||||||||||||||||||
| Corporate expenses (2) | (2,471 | ) | (1,778 | ) | 39.0 | % | ||||||||||||||||||||||||||||||||||||||
| Operating income (3) | 20,003 | 42,628 | (616 | ) | 13,956 | 73,582 | 23,226 | 22,078 | 15,781 | 10,210 | 69,682 | 5.6 | % | |||||||||||||||||||||||||||||||
| Operating margin | 7.5 | % | 19.5 | % | -0.5 | % | 22.8 | % | 10.9 | % | 8.6 | % | 13.9 | % | 11.4 | % | 21.9 | % | 11.3 | % | ||||||||||||||||||||||||
| Adjusted EBITDA (4) | 32,840 | 51,901 | 9,272 | 17,718 | 109,259 | 34,196 | 29,929 | 24,081 | 13,342 | 99,770 | 9.5 | % | ||||||||||||||||||||||||||||||||
| Adjusted EBITDA margin | 12.4 | % | 23.8 | % | 7.1 | % | 28.9 | % | 16.3 | % | 12.7 | % | 18.8 | % | 17.3 | % | 28.6 | % | 16.2 | % | ||||||||||||||||||||||||
| Financial (expenses) income (net) | (9,567 | ) | (7,192 | ) | 33.0 | % | ||||||||||||||||||||||||||||||||||||||
| Share of (loss) profit of investments accounted for using the equity method | (76 | ) | (230 | ) | -67.0 | % | ||||||||||||||||||||||||||||||||||||||
| Other income (expenses) (5) | (9,813 | ) | (28,890 | ) | -66.0 | % | ||||||||||||||||||||||||||||||||||||||
| Results by readjustement unit and exchange rate difference | (5,300 | ) | (4,764 | ) | 11.3 | % | ||||||||||||||||||||||||||||||||||||||
| Net income before income taxes | 48,826 | 28,607 | 70.7 | % | ||||||||||||||||||||||||||||||||||||||||
| Income tax expense | (23,951 | ) | (16,611 | ) | 44.2 | % | ||||||||||||||||||||||||||||||||||||||
| Net income | 24,875 | 11,995 | 107.4 | % | ||||||||||||||||||||||||||||||||||||||||
| Net income attributable to non-controlling interests | (274 | ) | 196 | -239.4 | % | |||||||||||||||||||||||||||||||||||||||
| Net income attributable to equity holders of the parent | 24,602 | 12,192 | 101.8 | % | ||||||||||||||||||||||||||||||||||||||||
| Net margin | 3.7 | % | 2.0 | % | ||||||||||||||||||||||||||||||||||||||||
| WEIGHTED AVERAGE SHARES OUTSTANDING | 946.6 | 946.6 | ||||||||||||||||||||||||||||||||||||||||||
| EARNINGS PER SHARE | 26.0 | 12.9 | ||||||||||||||||||||||||||||||||||||||||||
| EARNINGS PER ADS | 155.9 | 77.3 | 101.8 | % | ||||||||||||||||||||||||||||||||||||||||
(1) Total may be different from the addition of the four countries because of intercountry eliminations.
(2) Corporate expenses partially reclassified to the operations.
(3) Operating Income considers Net Sales, Cost of Sales, Distribution Costs, and Administrative Expenses included in the Financial Statements filed with the Chilean Financial Market Comission and determined in accordance to IFRS.
(4) Adjusted EBITDA considers Net Sales, Cost of Sales, Distribution Costs, and Administrative Expenses included in the Financial Statements filed with the Chilean Financial Market Comission and determined in accordance to IFRS, plus Depreciation.
(5) Other income (expenses) includes the following lines of the income statement by function included in the published financial statements in the Financial Market Comission: "Other income", "Other expenses" and "Other (loss) gains".
Embotelladora Andina S.A.
Six Months Results for the period ended June 30, 2024. Reported figures, IFRS GAAP.
(In nominal million Chilean pesos, except per share)
| January-June 2024 | January-June 2023 | |||||||||||||||||||||||||||||||||||||||||||
| Chilean Operations | Brazilian Operations | Argentine Operations | Paraguay Operations | Total (1) | Chilean Operations | Brazilian Operations | Argentine Operations | Paraguay Operations | Total (1) | % Ch. | ||||||||||||||||||||||||||||||||||
| Volume total beverages (Million UC) | 150.2 | 162.4 | 73.3 | 40.0 | 425.9 | 156.9 | 141.7 | 96.3 | 36.5 | 431.4 | -1.3 | % | ||||||||||||||||||||||||||||||||
| Transactions (Million) | 872.5 | 864.1 | 348.3 | 249.7 | 2,334.6 | 910.0 | 775.5 | 461.5 | 222.7 | 2,369.7 | -1.5 | % | ||||||||||||||||||||||||||||||||
| Net sales | 588,219 | 451,413 | 316,002 | 135,603 | 1,485,738 | 582,729 | 320,506 | 323,541 | 100,464 | 1,325,983 | 12.0 | % | ||||||||||||||||||||||||||||||||
| Cost of sales | (393,111 | ) | (263,937 | ) | (167,252 | ) | (75,252 | ) | (893,888 | ) | (389,548 | ) | (199,508 | ) | (164,591 | ) | (55,647 | ) | (807,872 | ) | 10.6 | % | ||||||||||||||||||||||
| Gross profit | 195,108 | 187,475 | 148,750 | 60,351 | 591,850 | 193,182 | 120,998 | 158,950 | 44,817 | 518,111 | 14.2 | % | ||||||||||||||||||||||||||||||||
| Gross margin | 33.2 | % | 41.5 | % | 47.1 | % | 44.5 | % | 39.8 | % | 33.2 | % | 37.8 | % | 49.1 | % | 44.6 | % | 39.1 | % | ||||||||||||||||||||||||
| Distribution and administrative expenses | (138,322 | ) | (105,230 | ) | (115,634 | ) | (27,566 | ) | (386,752 | ) | (135,902 | ) | (79,149 | ) | (108,745 | ) | (20,991 | ) | (344,788 | ) | 12.2 | % | ||||||||||||||||||||||
| Corporate expenses (2) | (5,252 | ) | (3,455 | ) | 52.0 | % | ||||||||||||||||||||||||||||||||||||||
| Operating income (3) | 56,787 | 82,246 | 33,116 | 32,785 | 199,846 | 57,280 | 41,848 | 50,205 | 23,826 | 169,868 | 17.6 | % | ||||||||||||||||||||||||||||||||
| Operating margin | 9.7 | % | 18.2 | % | 10.5 | % | 24.2 | % | 13.5 | % | 9.8 | % | 13.1 | % | 15.5 | % | 23.7 | % | 12.8 | % | ||||||||||||||||||||||||
| Adjusted EBITDA (4) | 81,784 | 100,945 | 53,578 | 40,799 | 271,854 | 78,933 | 57,168 | 66,641 | 30,200 | 229,486 | 18.5 | % | ||||||||||||||||||||||||||||||||
| Adjusted EBITDA margin | 13.9 | % | 22.4 | % | 17.0 | % | 30.1 | % | 18.3 | % | 13.5 | % | 17.8 | % | 20.6 | % | 30.1 | % | 17.3 | % | ||||||||||||||||||||||||
| Financial (expenses) income (net) | (21,353 | ) | (9,236 | ) | 131.2 | % | ||||||||||||||||||||||||||||||||||||||
| Share of (loss) profit of investments accounted for using the equity method | 1,100 | 840 | 30.9 | % | ||||||||||||||||||||||||||||||||||||||||
| Other income (expenses) (5) | (18,891 | ) | (33,371 | ) | -43.4 | % | ||||||||||||||||||||||||||||||||||||||
| Results by readjustement unit and exchange rate difference | (1,243 | ) | (20,140 | ) | -93.8 | % | ||||||||||||||||||||||||||||||||||||||
| Net income before income taxes | 159,459 | 107,961 | 47.7 | % | ||||||||||||||||||||||||||||||||||||||||
| Income tax expense | (65,085 | ) | (53,468 | ) | 21.7 | % | ||||||||||||||||||||||||||||||||||||||
| Net income | 94,374 | 54,493 | 73.2 | % | ||||||||||||||||||||||||||||||||||||||||
| Net income attributable to non-controlling interests | (786 | ) | (1,562 | ) | -49.7 | % | ||||||||||||||||||||||||||||||||||||||
| Net income attributable to equity holders of the parent | 93,588 | 52,931 | 76.8 | % | ||||||||||||||||||||||||||||||||||||||||
| Net margin | 6.3 | % | 4.0 | % | ||||||||||||||||||||||||||||||||||||||||
| WEIGHTED AVERAGE SHARES OUTSTANDING | 946.6 | 946.6 | ||||||||||||||||||||||||||||||||||||||||||
| EARNINGS PER SHARE | 98.9 | 55.9 | ||||||||||||||||||||||||||||||||||||||||||
| EARNINGS PER ADS | 593.2 | 335.5 | 76.8 | % | ||||||||||||||||||||||||||||||||||||||||
(1) Total may be different from the addition of the four countries because of intercountry eliminations.
(2) Corporate expenses partially reclassified to the operations.
(3) Operating Income considers Net Sales, Cost of Sales, Distribution Costs, and Administrative Expenses included in the Financial Statements filed with the Chilean Financial Market Comission and determined in accordance to IFRS.
(4) Adjusted EBITDA considers Net Sales, Cost of Sales, Distribution Costs, and Administrative Expenses included in the Financial Statements filed with the Chilean Financial Market Comission and determined in accordance to IFRS, plus Depreciation.
(5) Other income (expenses) includes the following lines of the income statement by function included in the published financial statements in the Financial Market Comission: "Other income", "Other expenses" and "Other (loss) gains".
Embotelladora Andina S.A.
Second Quarter Results for the period ended June 30, 2024.
(In local nominal currency of each period, except Argentina (3))
| April-June 2024 | April-June 2023 | |||||||||||||||||||||||||||||||
| Chile Million Ch$ | Brazil Million R$ | Argentina (3) Million AR$ | Paraguay Million G$ | Chile Million Ch$ | Brazil Million R$ | Argentina (3) Million AR$ | Paraguay Million G$ | |||||||||||||||||||||||||
| Nominal | Nominal | IAS29 | Nominal | Nominal | Nominal | IAS 29 | Nominal | |||||||||||||||||||||||||
| Total beverages volume (Million UC) | 65.3 | 81.8 | 31.5 | 18.4 | 69.5 | 68.2 | 42.0 | 16.7 | ||||||||||||||||||||||||
| Transactions (Million) | 390.5 | 431.1 | 148.2 | 116.1 | 410.6 | 371.2 | 200.4 | 104.3 | ||||||||||||||||||||||||
| Net sales | 264,979 | 1,217.4 | 125,942.1 | 490,541 | 270,196 | 983.9 | 162,748.1 | 419,879 | ||||||||||||||||||||||||
| Cost of sales | (178,945 | ) | (702.5 | ) | (72,748.0 | ) | (275,884 | ) | (181,862 | ) | (603.4 | ) | (85,370.9 | ) | (235,046 | ) | ||||||||||||||||
| Gross profit | 86,034 | 514.9 | 53,194.1 | 214,658 | 88,334 | 380.5 | 77,377.3 | 184,833 | ||||||||||||||||||||||||
| Gross margin | 32.5 | % | 42.3 | % | 42.2 | % | 43.8 | % | 32.7 | % | 38.7 | % | 47.5 | % | 44.0 | % | ||||||||||||||||
| Distribution and administrative expenses | (66,031 | ) | (277.2 | ) | (53,789.0 | ) | (103,291 | ) | (65,108 | ) | (243.9 | ) | (58,890.2 | ) | (92,878 | ) | ||||||||||||||||
| Operating income (1) | 20,003 | 237.6 | (594.9 | ) | 111,366 | 23,226 | 136.6 | 18,487.0 | 91,955 | |||||||||||||||||||||||
| Operating margin | 7.5 | % | 19.5 | % | -0.5 | % | 22.7 | % | 8.6 | % | 13.9 | % | 11.4 | % | 21.9 | % | ||||||||||||||||
| Adjusted EBITDA (2) | 32,840 | 289.5 | 8,954.1 | 141,479 | 34,196 | 185.1 | 28,209.9 | 120,166 | ||||||||||||||||||||||||
| Adjusted EBITDA margin | 12.4 | % | 23.8 | % | 7.1 | % | 28.8 | % | 12.7 | % | 18.8 | % | 17.3 | % | 28.6 | % | ||||||||||||||||
(1) Operating Income considers Net Sales, Cost of Sales, Distribution Costs, and Administrative Expenses included in the Financial Statements filed with the Chilean Financial Market Comission and determined in accordance to IFRS.
(2) Adjusted EBITDA considers Net Sales, Cost of Sales, Distribution Costs, and Administrative Expenses included in the Financial Statements filed with the Chilean Financial Market Comission and determined in accordance to IFRS, plus Depreciation.
(3) Argentina 2024 figures are presented in accordance to IAS 29, in June 2024 currency. 2023 figures are also presented in accordance to IAS 29, in June 2024 currency.
Embotelladora Andina S.A.
Six Months Results for the period ended June 30, 2024.
(In local nominal currency of each period, except Argentina (3))
| January-June 2024 | January-June 2023 | |||||||||||||||||||||||||||||||
| Chile Million Ch$ | Brazil Million R$ | Argentina (3) Million AR$ | Paraguay Million G$ | Chile Million Ch$ | Brazil Million R$ | Argentina (3) Million AR$ | Paraguay Million G$ | |||||||||||||||||||||||||
| Nominal | Nominal | IAS29 | Nominal | Nominal | Nominal | IAS 29 | Nominal | |||||||||||||||||||||||||
| Total beverages volume (Million UC) | 150.2 | 162.4 | 73.3 | 40.0 | 156.9 | 141.7 | 96.3 | 36.5 | ||||||||||||||||||||||||
| Transactions (Million) | 872.5 | 864.1 | 348.3 | 249.7 | 910.0 | 775.5 | 461.5 | 222.7 | ||||||||||||||||||||||||
| Net sales | 588,219 | 2,435.3 | 305,179.9 | 1,061,839 | 582,729 | 2,018.7 | 379,013.9 | 903,865 | ||||||||||||||||||||||||
| Cost of sales | (393,111 | ) | (1,423.4 | ) | (161,523.8 | ) | (589,484 | ) | (389,548 | ) | (1,257.0 | ) | (192,810.7 | ) | (500,632 | ) | ||||||||||||||||
| Gross profit | 195,108 | 1,011.9 | 143,656.0 | 472,355 | 193,182 | 761.7 | 186,203.2 | 403,233 | ||||||||||||||||||||||||
| Gross margin | 33.2 | % | 41.6 | % | 47.1 | % | 44.5 | % | 33.2 | % | 37.7 | % | 49.1 | % | 44.6 | % | ||||||||||||||||
| Distribution and administrative expenses | (138,322 | ) | (567.4 | ) | (111,674.2 | ) | (216,339 | ) | (135,902 | ) | (498.1 | ) | (127,390.0 | ) | (188,949 | ) | ||||||||||||||||
| Operating income (1) | 56,787 | 444.4 | 31,981.9 | 256,016 | 57,280 | 263.6 | 58,813.1 | 214,284 | ||||||||||||||||||||||||
| Operating margin | 9.7 | % | 18.2 | % | 10.5 | % | 24.1 | % | 9.8 | % | 13.1 | % | 15.5 | % | 23.7 | % | ||||||||||||||||
| Adjusted EBITDA (2) | 81,784 | 545.5 | 51,743.2 | 318,823 | 78,933 | 360.0 | 78,066.6 | 271,647 | ||||||||||||||||||||||||
| Adjusted EBITDA margin | 13.9 | % | 22.4 | % | 17.0 | % | 30.0 | % | 13.5 | % | 17.8 | % | 20.6 | % | 30.1 | % | ||||||||||||||||
(1) Operating Income considers Net Sales, Cost of Sales, Distribution Costs, and Administrative Expenses included in the Financial Statements filed with the Chilean Financial Market Comission and determined in accordance to IFRS.
(2) Adjusted EBITDA considers Net Sales, Cost of Sales, Distribution Costs, and Administrative Expenses included in the Financial Statements filed with the Chilean Financial Market Comission and determined in accordance to IFRS, plus Depreciation.
(3) Argentina 2024 figures are presented in accordance to IAS 29, in June 2024 currency. 2023 figures are also presented in accordance to IAS 29, in June 2024 currency.
Embotelladora Andina S.A.
Consolidated Balance Sheet
(In million Chilean pesos)
| Variation % | ||||||||||||||||||||
| ASSETS | 06-30-2024 | 12-31-2023 | 06-30-2023 | 12-31-2023 | 06-30-2023 | |||||||||||||||
| Cash + Time deposits + market. Securit. | 305,736 | 370,969 | 425,801 | -17.6 | % | -28.2 | % | |||||||||||||
| Account receivables (net) | 228,207 | 315,053 | 214,033 | -27.6 | % | 6.6 | % | |||||||||||||
| Inventories | 260,642 | 233,053 | 245,474 | 11.8 | % | 6.2 | % | |||||||||||||
| Other current assets | 100,669 | 62,695 | 56,491 | 60.6 | % | 78.2 | % | |||||||||||||
| Total Current Assets | 895,254 | 981,771 | 941,799 | -8.8 | % | -4.9 | % | |||||||||||||
| Property, plant and equipment | 2,303,731 | 1,963,421 | 1,952,503 | 17.3 | % | 18.0 | % | |||||||||||||
| Depreciation | (1,302,992 | ) | (1,091,032 | ) | (1,133,786 | ) | 19.4 | % | 14.9 | % | ||||||||||
| Total Property, Plant, and Equipment | 1,000,739 | 872,389 | 818,718 | 14.7 | % | 22.2 | % | |||||||||||||
| Investment in related companies | 87,485 | 91,799 | 89,902 | -4.7 | % | -2.7 | % | |||||||||||||
| Goodwill | 141,358 | 122,104 | 129,222 | 15.8 | % | 9.4 | % | |||||||||||||
| Other long term assets | 874,802 | 853,458 | 818,272 | 2.5 | % | 6.9 | % | |||||||||||||
| Total Other Assets | 1,103,645 | 1,067,361 | 1,037,396 | 3.4 | % | 6.4 | % | |||||||||||||
| TOTAL ASSETS | 2,999,638 | 2,921,521 | 2,797,913 | 2.7 | % | 7.2 | % | |||||||||||||
| Variation % | ||||||||||||||||||||
| LIABILITIES & SHAREHOLDERS' EQUITY | 06-30-2024 | 12-31-2023 | 06-30-2023 | 12-31-2023 | 06-30-2023 | |||||||||||||||
| Short term bank liabilities | 39,089 | 1,501 | 32,238 | 2504.3 | % | 21.3 | % | |||||||||||||
| Current portion of bonds payable | 31,734 | 27,479 | 321,543 | 15.5 | % | -90.1 | % | |||||||||||||
| Other financial liabilities | 23,085 | 24,017 | 25,520 | -3.9 | % | -9.5 | % | |||||||||||||
| Trade accounts payable and notes payable | 344,047 | 524,958 | 338,503 | -34.5 | % | 1.6 | % | |||||||||||||
| Other liabilities | 171,478 | 114,917 | 60,803 | 49.2 | % | 182.0 | % | |||||||||||||
| Total Current Liabilities | 609,433 | 692,871 | 778,607 | -12.0 | % | -21.7 | % | |||||||||||||
| Long term bank liabilities | 9,508 | 13,404 | 13,310 | -29.1 | % | -28.6 | % | |||||||||||||
| Bonds payable | 977,238 | 953,660 | 753,898 | 2.5 | % | 29.6 | % | |||||||||||||
| Other financial liabilities | 54,281 | 77,262 | 86,387 | -29.7 | % | -37.2 | % | |||||||||||||
| Other long term liabilities | 289,062 | 263,338 | 279,893 | 9.8 | % | 3.3 | % | |||||||||||||
| Total Long Term Liabilities | 1,330,089 | 1,307,664 | 1,133,488 | 1.7 | % | 17.3 | % | |||||||||||||
| Minority interest | 34,747 | 34,695 | 31,242 | 0.1 | % | 11.2 | % | |||||||||||||
| Stockholders' Equity | 1,025,369 | 886,291 | 854,576 | 15.7 | % | 20.0 | % | |||||||||||||
| TOTAL LIABILITIES & SHAREHOLDERS' EQUITY | 2,999,638 | 2,921,521 | 2,797,913 | 2.7 | % | 7.2 | % | |||||||||||||
Financial Highlights
(In million Chilean pesos)
| Accumulated | ||||||||||||
| ADDITIONS TO FIXED ASSETS | 06-30-2024 | 12-31-2023 | 06-30-2023 | |||||||||
| Chile | 36,337 | 107,314 | 41,559 | |||||||||
| Brazil | 47,041 | 54,082 | 14,418 | |||||||||
| Argentina | 44,372 | 44,729 | 23,720 | |||||||||
| Paraguay | 4,202 | 16,495 | 5,643 | |||||||||
| Total | 131,951 | 222,620 | 85,339 | |||||||||
SIGNATURES
Pursuant to the requirements of the Securities Exchange Act of 1934, the registrant has duly caused this report to be signed on its behalf by the undersigned, thereunto duly authorized, in the city of Santiago, Chile.
| EMBOTELLADORA ANDINA S.A. | ||
| By: | /s/ Andrés Wainer | |
| Name: | Andrés Wainer | |
| Title: | Chief Financial Officer | |
Santiago, July 30, 2024