UNITED STATES
SECURITIES AND EXCHANGE COMMISSION
WASHINGTON, D.C. 20549
FORM 6-K
REPORT OF FOREIGN ISSUER
PURSUANT TO RULE 13a-16 OR 15b-16 OF
THE SECURITIES EXCHANGE ACT OF 1934
October 2024
Date of Report (Date of Earliest Event Reported)
Embotelladora Andina S.A.
(Exact name of registrant as specified in its charter)
Andina Bottling Company, Inc.
(Translation of Registrant´s name into English)
Avda. Miraflores 9153
Renca
Santiago, Chile
(Address of principal executive office)
Indicate by check mark whether the registrant files or will file annual reports under cover Form 20-F or Form 40-F.
Form 20-F x Form 40-F ¨
Indicate by check mark if the Registrant is submitting this Form 6-K in paper as permitted by Regulation S-T Rule 101(b)(1):
Yes ¨ No x
Indicate by check mark if the Registrant is submitting this Form 6-K in paper as permitted by Regulation S-T Rule 101(b)(7):
Yes ¨ No x
Indicate by check mark whether the registrant by furnishing the information contained in this Form 6-K is also thereby furnishing the information to the Commission pursuant to Rule 12g3-2(b) under the Securities Exchange Act of 1934
Yes ¨ No x

EXECUTIVE SUMMARY
 | The quarter closed with a consolidated Sales Volume of 214.4 million unit cases*, increasing 5.7% regarding the same quarter of the previous year. Transactions* reached 1,155.7 million in the quarter, representing a 2.4% increase regarding the same quarter of the previous year. Accumulated consolidated Sales Volume reached 640.3 million unit cases, representing a 0.9% increase regarding the previous year. Accumulated transactions reached 3,490.3 million, representing a 0.2% decrease. |
| Company figures reported are the following: |
| · | Consolidated Net Sales reached CLP 726,806 million in the quarter, increasing by 8.4% over the same quarter of the previous year. Accumulated consolidated Net Sales reached CLP 2,210,479 million, representing a 9.4% increase regarding the previous year. |
| · | Consolidated Operating Income* reached CLP 78,587 million in the quarter, representing a 0.6% increase over the same quarter of the previous year. Accumulated consolidated Operating Income reached CLP 278,204 million, an increase of 10.4% regarding the previous year. |
| · | Consolidated Adjusted EBITDA* increased by 3.7% over the same quarter of the previous year, reaching CLP 114,634 million in the quarter. Adjusted EBITDA Margin reached 15.8%, a contraction of 72 basis points regarding the same quarter of the previous year. Accumulated consolidated Adjusted EBITDA reached CLP 386,123 million, which represents an increase of 11.8% regarding the previous year. Adjusted EBITDA Margin for the period reached 17.5%, an expansion of 39 basis points regarding the previous year. |
| · | Net Income attributable to the owners of the controller for the quarter was CLP 41,942 million, representing a 34.2% decrease regarding the same quarter of the previous year. Accumulated Net Income attributable to the owners of the controller was CLP 132,988 million, which represents an 18.6% increase regarding the previous year. |
| SUMMARY OF RESULTS – THIRD QUARTER 2024 AND ACCUMULATED AS OF THE THIRD QUARTER | ||||||||||||||||||||||||
| (Figures in million CLP) | 3Q23 | 3Q24 | Var % | 9M23 | 9M24 | Var % | ||||||||||||||||||
| Sales Volume (Million Unit Cases) | 202.9 | 214.4 | 5.7 | % | 634.3 | 640.3 | 0.9 | % | ||||||||||||||||
| Net Sales | 670,333 | 726,806 | 8.4 | % | 2,021,002 | 2,210,479 | 9.4 | % | ||||||||||||||||
| Operating Income* | 78,140 | 78,587 | 0.6 | % | 251,974 | 278,204 | 10.4 | % | ||||||||||||||||
| Adjusted EBITDA* | 110,520 | 114,634 | 3.7 | % | 345,219 | 386,123 | 11.8 | % | ||||||||||||||||
| Net income attributable to the owners of the controller | 63,708 | 41,942 | -34.2 | % | 112,150 | 132,988 | 18.6 | % | ||||||||||||||||
Comment of the Chief Executive Officer. Mr. Miguel Ángel Peirano
"In the third quarter of 2024, sales volume increased by 5.7% compared to the same period in the previous year, reaching 214.4 million unit cases. The Brazilian market has experienced exceptional development, with a volume growth rate of 15.8% during the period, which is explained by favorable weather conditions, industry expansion, market share gains, and an increase in sales to other bottlers. Excluding sales to Coca-Cola Femsa's Rio Grande do Sul franchise in Brazil, which is temporarily facing production capacity issues due to the floods it experienced in May, sales volume still showed strong growth of 13.9%. In Paraguay, sales volumes increased by 6.3%, primarily driven by exports to Brazil for the previously mentioned reason. Excluding these exports, sales volume would have decreased by 0.8%, which is explained by less favorable weather than in the previous year. In contrast to the significant declines observed in the first half of the year, Argentina's sales volume decreased by only 4.3% (-10.0% excluding exports to Brazil). This improvement provides us with a sense of optimism for the remainder of 2024 and the upcoming year. Finally, in Chile, sales volume grew 1.7%.
Consolidated Adjusted EBITDA reached CLP 114,634 million, an increase of 3.7% compared to the same quarter of the previous year. Adjusted EBITDA in local currency grew by 28.1% in Brazil and 4.4% in Paraguay, while it decreased in Chile by 3.1% and in Argentina by 21.4%. Net Income attributable to the owners of the controller for the quarter reached CLP 41,942 million, a 34.2% decrease compared to the same period of the previous year, which is mainly explained by a lower gain due to price-level restatement in Argentina.
* The definitions used can be found in the Glossary on page 16 of this document.
| COCA-COLA ANDINA | |
| 3Q24 EARNINGS RELEASE | |
| www.koandina.com | |
| -2- | |
The Re-Ciclar recycled resin plant in Santiago, Chile, was inaugurated in August in collaboration with our partners at Coca-Cola Embonor. In this innovative facility, we reinvigorate beverage bottles by converting them into recycled food-grade resin. This resin is subsequently utilized to produce new PET containers. With an investment of USD 35 million, the plant has the capacity to recycle over 350 million bottles annually, thereby reducing the circulation of new plastic and creating over 25,000 indirect jobs throughout the recycling value chain. Its PET collection model is inclusive and collaborative, uniting grassroots recyclers, local governments, and territorial organizations. This facility is a trailblazer in the implementation of sustainable technologies. It is powered by solar energy via photovoltaic panels, and the water used in the production process is treated and subsequently repurposed for irrigation of gardens. The cranes are 100% electrical and operate on lithium batteries.
First place was awarded to us in the Best Corporate-Startup Strategic Alliance category at the Innova Awards 2024 in September. This award recognizes our most innovative strategic alliances, assessing the strategic impact, economic return and value we generate for both our business and the startups that we collaborate with.
Finally, in October for the second consecutive year we were awarded with the Most Innovative Companies award in the Beverages and Juices category. Organized by MIC Business Consulting, ESE Business School Chile and El Mercurio, this recognition underscores our constant effort to remain at the forefront of innovation and reaffirms the commitment we have as an organization to lead with creativity and passion in each of our processes."
BASIS OF PRESENTATION
Figures in the following analysis are expressed in accordance with IFRS, in nominal Chilean pesos, both for consolidated results and for the results of each of our operations. All variations with respect to 2023 are nominal.
Since Argentina has been classified as a Hyperinflationary economy, pursuant to IAS 29, translation of figures from local to reporting currency was performed using the closing exchange rate for the translation to Chilean pesos. Local currency figures for both 2024 and 2023 referred to in the Argentina sections are expressed in September 2024 currency.
Finally, a devaluation of local currencies regarding the U.S. dollar has a negative impact on our dollarized costs and a devaluation of local currencies regarding the Chilean peso has a negative impact upon consolidating figures.
When we refer to "Argentina", it includes our subsidiaries Embotelladora del Atlántico S.A. and Empaques Argentina S.A. When we refer to "Chile", it includes the operation in Chile of Embotelladora Andina S.A., as well as its subsidiaries VJ S.A., Vital Aguas S.A., Envases Central S.A. and Re-Ciclar S.A.
CONSOLIDATED RESULTS: 3rd Quarter 2024 vs. 3rd Quarter 2023

| (Figures in million CLP) | 3Q23 | 3Q24 | Var % | |||||||||
| Net Sales | 670,333 | 726,806 | 8.4 | % | ||||||||
| Operating Income | 78,140 | 78,587 | 0.6 | % | ||||||||
| Adjusted EBITDA | 110,520 | 114,634 | 3.7 | % | ||||||||
| Net income attributable to the owners of the controller | 63,708 | 41,942 | -34.2 | % |
During the quarter, consolidated Sales Volume was 214.4 million unit cases, which represented an increase of 5.7% compared to the same period of 2023, mainly explained by the volume increase in the Brazilian, Paraguayan and Chilean operations, partially offset by the volume decrease in the Argentine operation. The Non-Alcoholic Beverages Segment represented 94.8% of consolidated Sales Volume and grew 6.2%, mainly explained by the growth of the Segment in Brazil, Paraguay and Chile, partially offset by the decrease in Argentina. The Alcoholic Beverages Segment represented 5.2% of total volume and decreased 2.4%, explained by volume declines in Brazil, Argentina and Chile, partially offset by volume growth in Paraguay. Transactions reached 1,155.7 million during the quarter, representing an increase of 2.4% compared to the same quarter of the previous year.
Consolidated Net Sales reached CLP 726,806 million, an increase of 8.4%, explained by revenue growth in Brazil, Chile and Paraguay, as well as the effect of translating figures from the local currencies of Argentina and Paraguay to the reporting currency, which was partially offset by lower revenues in Argentina and the effect of translating figures to the reporting currency of our Brazilian subsidiary. We continue to make steady progress on our digital transformation agenda. Our B2B platform is consistently growing in transactions in all our operations; today more than 60% of total Revenues are through our digital platforms (+30 percentage points compared to the same quarter of the previous year) and with customer satisfaction levels (Net Promoter Score) of around 55%.
| COCA-COLA ANDINA | |
| 3Q24 EARNINGS RELEASE | |
| www.koandina.com | |
| -3- | |
Consolidated Cost of Sales increased 9.5%, which is mainly explained by (i) the effect of translating figures from our subsidiaries in Argentina and Paraguay to the reporting currency, (ii) the increase in sales volumes in Brazil and Paraguay, (iii) a higher cost of sugar in Chile and Paraguay, (iv) the effect of the shift in mix towards higher unit cost products in Chile and Paraguay, (v) a higher cost of labor in Argentina, and (vi) the effect of the devaluation of local currencies on our dollarized costs. This was partially offset by (i) the effect of translating figures from our Brazilian subsidiary to the reporting currency, (ii) a lower cost of Pet resin in Brazil and Chile, (iii) a lower cost of concentrate in Argentina and Chile, and (iv) the lower sales volume in Argentina.
Consolidated Distribution Costs and Administrative Expenses increased 9.3%, which is mainly explained by (i) the effect of translating figures of our subsidiaries in Argentina and Paraguay to the reporting currency, (ii) higher labor expenses in Brazil, Chile and Paraguay, (iii) higher marketing expenses in Chile and Paraguay, and (iv) higher distribution expenses in Brazil, Chile and Paraguay, due to higher volumes sold. This was partially offset by (i) the effect of translating figures from our Brazilian subsidiary to the reporting currency, (ii) lower labor costs in Argentina, and (iii) lower marketing expenses in Argentina.
The aforementioned effects led to a consolidated Operating Income of CLP 78,587 million, an increase of 0.6%. Operating Margin was 10.8%.
Consolidated Adjusted EBITDA reached CLP 114,634 million, increasing by 3.7%. Adjusted EBITDA margin was 15.8%, a contraction of 72 basis points.
Net income attributable to the owners of the controller for the quarter was CLP 41,942 million, a decrease of 34.2%, and Net Margin reached 5.8%, a contraction of 373 basis points.
ARGENTINA: 3rd Quarter 2024 vs. 3rd Quarter 2023
| 3Q23 | 3Q24 | Var % | 3Q23 | 3Q24 | Var % | |||||||||||||||||||
| (Figures in million CLP) | (Figures in million ARS of September 2024) | |||||||||||||||||||||||
| Net Sales | 159,472 | 169,490 | 6.3 | % | 192,960 | 183,239 | -5.0 | % | ||||||||||||||||
| Operating Income | 14,893 | 10,740 | -27.9 | % | 18,021 | 11,611 | -35.6 | % | ||||||||||||||||
| Adjusted EBITDA | 24,175 | 21,261 | -12.1 | % | 29,251 | 22,986 | -21.4 | % | ||||||||||||||||
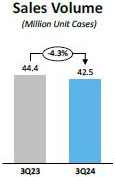
Sales volume in the quarter decreased 4.3%, reaching 42.5 million unit cases, explained by the decrease in volume in all categories. Transactions totaled 190.3 million, representing a decrease of 10.4%.
Net sales amounted to CLP 169,490 million, increasing by 6.3%. In local currency, they decreased by 5.0%, which was mainly explained by the aforementioned decrease in volume.
Cost of sales increased 11.6%, while in local currency it decreased 0.2%, which is mainly explained by (i) the lower sales volume, (ii) a lower cost of concentrate, and (iii) a lower cost of sugar. This was partially offset by higher labor costs.
Distribution Costs and Administrative Expenses increased 7.1% in the reporting currency, while in local currency they decreased 4.3%, which is mainly explained by (i) lower labor expenses and (ii) lower marketing expenses.
The aforementioned effects led to an Operating Income of CLP 10,740 million, a 27.9% decrease compared to the same period of the previous year. Operating Margin was 6.3%. In local currency Operating Income decreased by 35.6%.
Adjusted EBITDA amounted to CLP 21,261 million, a decrease of 12.1%. Adjusted EBITDA margin was 12.5%, a contraction of 261 basis points. Adjusted EBITDA in local currency decreased 21.4%.
| COCA-COLA ANDINA | |
| 3Q24 EARNINGS RELEASE | |
| www.koandina.com | |
| -4- | |
BRAZIL: 3rd Quarter 2024 vs. 3rd Quarter 2023

| 3Q23 | 3Q24 | Var % | 3Q23 | 3Q24 | Var % | |||||||||||||||||||
| (Figures in million CLP) | (Figures in million BRL) | |||||||||||||||||||||||
| Net Sales | 181,272 | 205,171 | 13.2 | % | 1,036 | 1,223 | 18.0 | % | ||||||||||||||||
| Operating Income | 25,152 | 32,368 | 28.7 | % | 144 | 193 | 34.4 | % | ||||||||||||||||
| Adjusted EBITDA | 33,638 | 41,297 | 22.8 | % | 192 | 246 | 28.1 | % | ||||||||||||||||
Sales volume for the quarter reached 81.5 million unit cases, an increase of 15.8%, explained by the increase in the Soft Drinks, Waters and Juices and other non-alcoholic beverages categories, partially offset by the decrease in the Beer and other alcoholic beverages category. The Non-Alcoholic Beverages Segment represented 98.8% of total sales volume, and grew 16.7%, which was explained by the growth of all the segment's categories. The Alcoholic Beverages Segment represented 1.2% of total volume and decreased by 30.8%, explained by the decrease in all categories of the segment. Transactions amounted to 420.2 million, an increase of 7.2%.
Net Sales amounted to CLP 205,171 million, an increase of 13.2%. In local currency, Net Sales increased 18.0%, which was mainly explained by the aforementioned increase in volume and to a lesser extent by the increase in the average revenue per unit case sold. Net Sales of the Non-Alcoholic Beverages segment increased 20.6% in local currency, representing 96.4% of total sales. Net Sales of the Alcoholic Beverages Segment decreased 25.0% in local currency, representing 3.6% of total sales.
Cost of Sales increased 11.7%, while in local currency it increased 16.4%, which is mainly explained by (i) the higher sales volume, (ii) the effect of the devaluation of the Brazilian real on our dollarized costs, and (iii) a higher cost of concentrate due to price increases. This was partially offset by the lower cost of Pet resin.
Distribution Costs and Administrative Expenses increased 8.2% in the reporting currency. In local currency, they increased 12.7%, which is mainly explained by (i) higher freight expenses, due to higher volumes sold, and (ii) higher labor expenses. This was partially offset by lower marketing expenses.
The aforementioned effects led to an Operating Income of CLP 32,368 million, an increase of 28.7%. Operating Margin was 15.8%. In local currency, Operating Income increased 34.4%.
Adjusted EBITDA reached CLP 41,297 million, an increase of 22.8% over the previous year. Adjusted EBITDA Margin was 20.1%, an expansion of 157 basis points. In local currency, Adjusted EBITDA increased 28.1%.
CHILE: 3rd Quarter 2024 vs. 3rd Quarter 2023

| 3Q23 | 3Q24 | Var % | ||||||||||
| (Figures in million CLP) | ||||||||||||
| Net Sales | 276,771 | 291,885 | 5.5 | % | ||||||||
| Operating Income | 28,056 | 25,366 | -9.6 | % | ||||||||
| Adjusted EBITDA | 39,176 | 37,958 | -3.1 | % | ||||||||
During the quarter, Sales Volume reached 71.0 million unit cases, an increase of 1.7%, explained by the increase in the Soft Drinks and Waters categories, partially offset by the decrease in the Juices and other non-alcoholic beverages and Beers and other alcoholic beverages categories. The volume of the Non-Alcoholic Beverages Segment represented 86.1% of total Sales Volume, and grew 2.1%, which was explained by the increase in the Soft Drinks and Waters categories, partially offset by the decrease in the Juices and other non-alcoholic beverages category. The volume of the Alcoholic Beverages Segment represented 13.9% of total Sales Volume, and decreased 0.5%, explained by the decrease in all categories of the segment. Transactions amounted to 427.9 million, representing an increase of 4.7%.
| COCA-COLA ANDINA | |
| 3Q24 EARNINGS RELEASE | |
| www.koandina.com | |
| -5- | |
Net Sales reached CLP 291,885 million, an increase of 5.5%, which is mainly explained by the increase in the average revenue per unit case sold, as a result of the price increases made and the aforementioned increase in volume. Net Sales of the Non-Alcoholic Beverages segment increased 6.8%, representing 74.4% of total sales. Net Sales of the Alcoholic Beverages Segment increased 1.8%, representing 25.6% of total sales.
Cost of Sales increased 5.6%, which is mainly explained by (i) a higher cost of sugar, (ii) a shift in the mix towards higher unit cost products, and (iii) the devaluation of the Chilean peso, which has a negative effect on dollar-denominated costs. This was partially offset by (i) a lower cost of concentrate, and (ii) a lower cost of Pet resin.
Distribution Costs and Administrative Expenses increased 11.8%, which is mainly explained by (i) higher labor costs and services provided by third parties, (ii) higher distribution expenses, and (iii) higher marketing expenses.
The aforementioned effects led to an Operating Income of CLP 25,366 million, 9.6% lower when compared to the previous year. Operating Margin was 8.7%.
Adjusted EBITDA reached CLP 37,958 million, a decrease of 3.1%. Adjusted EBITDA Margin was 13.0%, a contraction of 115 basis points.
PARAGUAY: 3rd Quarter 2024 vs. 3rd Quarter 2023

| 3Q23 | 3Q24 | Var % | 3Q23 | 3Q24 | Var % | |||||||||||||||||||
| (Figures in million CLP) | (Figures in million PGY) | |||||||||||||||||||||||
| Net Sales | 54,147 | 62,034 | 14.6 | % | 461,220 | 509,885 | 10.6 | % | ||||||||||||||||
| Operating Income | 12,028 | 12,787 | 6.3 | % | 102,343 | 105,095 | 2.7 | % | ||||||||||||||||
| Adjusted EBITDA | 15,590 | 16,874 | 8.2 | % | 132,770 | 138,660 | 4.4 | % | ||||||||||||||||
During the quarter, Sales Volume reached 19.4 million unit cases, an increase of 6.3%, explained by the increase in volume of all categories, with the exception of Water, which showed a decrease. Transactions reached 117.3 million, an increase of 1.4%.
Net sales amounted to CLP 62,034 million, an increase of 14.6%. In local currency, Net Sales increased 10.6%, which was mainly explained by the aforementioned increase in volume and a higher average revenue per unit case sold.
Cost of Sales in the reporting currency increased 21.0%. In local currency, it increased 16.8%, which is mainly explained by (i) the higher volume sold, (ii) a higher cost of sugar and fructose, and (iii) the shift in the mix towards higher unit cost products.
Distribution Costs and Administrative Expenses increased 6.4%, and in local currency they increased 2.7%. This is mainly explained by (i) higher distribution expenses, due to higher volume sold and higher tariffs, and (ii) higher labor costs and services provided by third parties. This was partially offset by lower marketing expenses.
The aforementioned effects led to an Operating Income of CLP 12,787 million, 6.3% higher when compared to the previous year. Operating Margin reached 20.6%. In local currency, Operating Income increased 2.7%.
Adjusted EBITDA reached CLP 16,874 million, an increase of 8.2%, and Adjusted EBITDA Margin was 27.2%, a contraction of 159 basis points. In local currency, Adjusted EBITDA increased 4.4%.
| COCA-COLA ANDINA | |
| 3Q24 EARNINGS RELEASE | |
| www.koandina.com | |
| -6- | |
ACCUMULATED RESULTS: as of September 30, 2024 vs. as of September 30, 2023
Consolidated Results

| (Figures in million CLP) | 9M23 | 9M24 | Var % | |||||||||
| Net Sales | 2,021,002 | 2,210,479 | 9.4 | % | ||||||||
| Operating Income | 251,974 | 278,204 | 10.4 | % | ||||||||
| Adjusted EBITDA | 345,219 | 386,123 | 11.8 | % | ||||||||
| Net income attributable to the owners of the controller | 112,150 | 132,988 | 18.6 | % |
Consolidated Sales Volume was 640.3 million unit cases, which represented an increase of 0.9% compared to the same period of 2023, mainly explained by the volume increase in the Brazilian and Paraguayan operations, partially offset by the volume decrease in the Argentine and Chilean operations. The Non-Alcoholic Beverages Segment represented 94.9% of consolidated Sales Volume and grew 1.1%, explained by the increase in the Segment in Brazil and Paraguay, partially offset by the decrease in Argentina and Chile. The Alcoholic Beverages Segment represented 5.1% of total volume and decreased 1.1%, which was mainly explained by the reduction of the Segment's volume in the Brazilian, Argentine and Chilean operations, partially offset by the growth in the Paraguayan operation. Transactions amounted to 3,490.3 million, a decrease of 0.2%. Consolidated Net Sales reached CLP 2,210,479 million, an increase of 9.4%.
Consolidated Cost of Sales increased by 9.1%, which is mainly explained by (i) the effect of translating figures from our foreign subsidiaries to the reporting currency, (ii) the increase in sales volumes in Brazil and Paraguay, (iii) a higher cost of sugar, (iv) the effect of the shift in the mix towards higher unit cost products in Chile and Paraguay, (v) a higher labor cost in Argentina, and (vi) the effect of the devaluation of local currencies on our dollarized costs. This was partially offset by (i) a lower cost of Pet resin in Brazil, Chile and Paraguay, and (ii) lower sales volume in Argentina and Chile.
Consolidated Distribution Costs and Administrative Expenses increased 9.6%, which is mainly explained by (i) the effect of translating figures from our foreign subsidiaries to the reporting currency, (ii) higher marketing expenses, (iii) higher labor expenses in Brazil, Chile and Paraguay, and (iv) higher distribution expenses in Brazil and Paraguay, due to higher volumes sold. This was partially offset by (i) lower distribution cost in Argentina, due to lower volumes sold, and (ii) lower labor cost in Argentina.
The aforementioned effects led to a consolidated Operating Income of CLP 278,204 million, an increase of 10.4%. Operating Margin was 12.6%.
Consolidated Adjusted EBITDA reached CLP 386,123 million, an increase of 11.8%. Adjusted EBITDA Margin was 17.5%, an expansion of 39 basis points.
Net Income attributable to the owners of the controller was CLP 132,988 million, an increase of 18.6%, and net margin reached 6.0%.
Argentina

| 9M23 | 9M24 | Var % | 9M23 | 9M24 | Var % | |||||||||||||||||||
| (Figures in million CLP) | (Figures in million ARS of September 2024) | |||||||||||||||||||||||
| Net Sales | 507,796 | 483,391 | -4.8 | % | 614,429 | 522,603 | -14.9 | % | ||||||||||||||||
| Operating Income | 69,052 | 43,628 | -36.8 | % | 83,552 | 47,168 | -43.5 | % | ||||||||||||||||
| Adjusted EBITDA | 96,028 | 74,476 | -22.4 | % | 116,193 | 80,517 | -30.7 | % | ||||||||||||||||
Sales volume decreased by 17.7% to 115.8 million unit cases, due to volume declines in all categories. Transactions totaled 538.6 million, representing a 20.1% decrease.
| COCA-COLA ANDINA | |
| 3Q24 EARNINGS RELEASE | |
| www.koandina.com | |
| -7- | |
Net Sales amounted to CLP 483,391 million, a decrease of 4.8%, while in local currency, Net Sales decreased by 14.9%, which was mainly explained by the aforementioned decrease in volume, partially offset by the increase in the average revenue per unit case sold.
Cost of sales decreased 0.4%. In local currency, it decreased 11.0%, which is mainly explained by (i) the lower sales volume, and (ii) a lower cost of concentrate. This was partially offset by (i) higher labor costs, and (ii) higher sugar costs.
Distribution Costs and Administrative Expenses increased 1.1% in the reporting currency. In local currency, these decreased 9.6%, which is mainly explained by (i) a lower distribution cost due to lower sales volume, and (ii) a lower labor cost. This was partially offset by higher marketing expenses.
The aforementioned effects led to an Operating Income of CLP 43,628 million, a decrease of 36.8%. Operating Margin was 9.0%. In local currency, Operating Income decreased 43.5%.
Adjusted EBITDA reached CLP 74,476 million, a decrease of 22.4%. Adjusted EBITDA margin was 15.4%, a contraction of 350 basis points. Adjusted EBITDA in local currency decreased 30.7%.
Brazil

| 9M23 | 9M24 | Var % | 9M23 | 9M24 | Var % | |||||||||||||||||||
| (Figures in million CLP) | (Figures in million BRL) | |||||||||||||||||||||||
| Net Sales | 501,779 | 656,584 | 30.9 | % | 3,055 | 3,658 | 19.8 | % | ||||||||||||||||
| Operating Income | 67,000 | 114,613 | 71.1 | % | 407 | 637 | 56.6 | % | ||||||||||||||||
| Adjusted EBITDA | 90,806 | 142,241 | 56.6 | % | 552 | 792 | 43.4 | % | ||||||||||||||||
Sales volume increased 15.0%, reaching 243.8 million unit cases, explained by the volume increase in the Soft Drinks, Waters and Juices and other non-alcoholic beverages categories, partially offset by the decrease in the Beer and other alcoholic beverages category. The Non-Alcoholic Beverages Segment represented 98.6% of total sales volume, and grew 15.5%, which was explained by the growth of all the Segment's categories. The Alcoholic Beverages Segment represented 1.4% of total volume and decreased by 12.9%, which was explained by the decrease in the Beer category, partially offset by the increase in the Other alcoholic beverages category. Transactions amounted to 1,284.2 million, representing an increase of 10.0%.
Net Sales reached CLP 656,584 million, an increase of 30.9%, driven by the positive effect of translating figures to Chilean pesos. In local currency, Net Sales increased 19.8%, due to the aforementioned volume increase and, to a lesser extent, to a higher average price as a result of the price increases we have implemented. Net Sales of the Non-Alcoholic Beverages segment increased 21.7% in local currency, representing 95.8% of total sales. Net Sales of the Alcoholic Beverages segment decreased 12.1% in local currency, representing 4.2% of total sales.
Cost of Sales increased 24.9%, while in local currency it increased 14.3%, which is mainly explained by (i) the higher sales volume, (ii) a higher cost of concentrate due to price increases, and (iii) a higher cost of sugar. This was partially offset by the lower cost of Pet resin.
Distribution Costs and Administrative Expenses increased 24.1% in the reporting currency, and in local currency they increased 13.5%, which is mainly explained by (i) higher freight expenses due to higher volume sold, (ii) higher labor costs, and (iii) higher marketing expenses.
The aforementioned effects led to an Operating Income of CLP 114,613 million, an increase of 71.1%. Operating Margin was 17.5%. In local currency, Operating Income increased 56.6%.
Adjusted EBITDA reached CLP 142,241 million, an increase of 56.6% over the previous year. Adjusted EBITDA Margin was 21.7%, an expansion of 357 basis points. In local currency, Adjusted EBITDA increased 43.4%.
| COCA-COLA ANDINA | |
| 3Q24 EARNINGS RELEASE | |
| www.koandina.com | |
| -8- | |

Chile

| 9M23 | 9M24 | Var % | ||||||||||
| (Figures in million CLP) | ||||||||||||
| Net Sales | 859,500 | 880,104 | 2.4 | % | ||||||||
| Operating Income | 85,336 | 82,152 | -3.7 | % | ||||||||
| Adjusted EBITDA | 118,109 | 119,742 | 1.4 | % | ||||||||
Sales volume reached 221.2 million unit cases, a decrease of 2.4%, explained by the decrease in all categories. The Non-Alcoholic Beverages Segment represented 87.2% of total Sales Volume, and decreased 2.6%, which was explained by the decrease in all categories of the segment. The Alcoholic Beverages Segment represented 12.8% of total Sales Volume and decreased 1.1%, explained by the decrease in the Beer category, partially offset by the increase in the Other Alcoholic Beverages category. Transactions amounted to 1,300.4 million, representing a decrease of 1.4%.
Net Sales amounted to CLP 880,104 million, an increase of 2.4%, which is explained by a higher average price in the period, due to the price increases made, partially offset by the aforementioned decrease in volume. Net Sales of the Non-Alcoholic Beverages segment increased 2.9%, representing 76.4% of total sales. Net Sales of the Alcoholic Beverages Segment increased 0.8%, representing 23.6% of total sales.
Cost of Sales increased 2.4%, which is mainly explained by (i) a shift in the mix towards higher unit cost products, (ii) a higher cost of sugar and (iii) the negative effect of the devaluation of the Chilean peso on our dollarized costs. This was partially offset by (i) lower sales volume, and (ii) a lower cost of Pet resin.
Distribution Costs and Administrative Expenses increased 5.0%, which is mainly explained by (i) a higher cost of labor and services provided by third parties, and (ii) higher marketing expenses.
The aforementioned effects led to an Operating Income of CLP 82,152 million, 3.7% lower when compared to the previous year. Operating Margin was 9.3%.
Adjusted EBITDA reached CLP 119,742 million, an increase of 1.4%. Adjusted EBITDA Margin was 13.6%, a contraction of 14 basis points.
| COCA-COLA ANDINA | |
| 3Q24 EARNINGS RELEASE | |
| www.koandina.com | |
| -9- | |
Paraguay

| 9M23 | 9M24 | Var % | 9M23 | 9M24 | Var % | |||||||||||||||||||
| (Figures in million CLP) | (Figures in million PGY) | |||||||||||||||||||||||
| Net Sales | 154,610 | 197,637 | 27.8 | % | 1,365,085 | 1,571,724 | 15.1 | % | ||||||||||||||||
| Operating Income | 35,853 | 45,572 | 27.1 | % | 316,627 | 361,111 | 14.0 | % | ||||||||||||||||
| Adjusted EBITDA | 45,790 | 57,673 | 26.0 | % | 404,417 | 457,482 | 13.1 | % | ||||||||||||||||
Sales volume reached 59.4 million unit cases, an increase of 8.6%, explained by the increase in volume in all categories. Transactions totaled 367.0 million, an increase of 8.4%.
Net Sales amounted to CLP 197,637 million, an increase of 27.8%. In local currency, Net Sales increased 15.1%, which is explained by the aforementioned increase in Sales Volume and a higher average price.
Cost of Sales increased 30.2% and in local currency it increased 17.4%, which is mainly explained by (i) the higher volume sold, (ii) a higher cost of sugar and fructose, and (iii) the shift in the mix towards higher unit cost products. This was partially offset by the lower cost of Pet resin.
Distribution Costs and Administrative Expenses increased 22.3% in the reporting currency. In local currency, the increase was 10.4%, which is mainly explained by (i) higher labor expenses and services provided by third parties, (ii) higher distribution expenses, due to higher sales volumes, and (iii) higher marketing expenses.
The aforementioned effects led to an Operating Income of CLP 45,572 million, 27.1% higher when compared to the previous year. Operating Margin reached 23.1%. In local currency, Operating Income increased 14.0%.
Adjusted EBITDA reached CLP 57,673 million, 26.0% higher when compared to the previous year, and Adjusted EBITDA Margin was 29.2%, a contraction of 44 basis points. In local currency terms, Adjusted EBITDA increased 13.1%.
NON-OPERATING RESULTS FOR THE QUARTER
Net Financial Income and Expenses account recorded an expense of CLP 12,763 million, which compares with an expense of CLP 16,039 million in the same quarter of the previous year, mainly due to lower debt levels in Argentina and a higher cash level in Brazil.
Share of Profit or Loss from Investments Accounted for by the Equity Method went from a loss of CLP 846 million to a profit of CLP 760 million, which is mainly explained by higher results of subsidiaries in Chile and Brazil.
Other Income and Expenses account recorded a loss of CLP 4,937 million, compared to a loss of CLP 8,632 million in the same quarter of the previous year, the difference being mainly explained by a loss generated in the previous year due to a change in the useful life of containers in Paraguay.
Results by Adjustment Units and Exchange Rate Differences account went from a profit of CLP 20,468 million to a loss of CLP 3,626 million. This is mainly explained by a non-cash flow gain in the same period of the previous year, due to price-level restatement in Argentina, which was substantially lower this year.
Income Tax went from -CLP 9,541 million to -CLP 15,725 million, a variation that is mainly explained by a positive effect in the previous year due to the exchange rate difference in Chile.
| COCA-COLA ANDINA | |
| 3Q24 EARNINGS RELEASE | |
| www.koandina.com | |
| -10- | |
CONSOLIDATED BALANCE
The following are the balances of Assets and Liabilities as of the closing date of these financial statements:
| 12.31.2023 | 09.30.2024 | Variation | ||||||||||
| million CLP | million CLP | million CLP | ||||||||||
| Assets | ||||||||||||
| Current assets | 981,771 | 887,637 | -94,134 | |||||||||
| Non-current assets | 1,939,750 | 2,132,775 | 193,025 | |||||||||
| Total Assets | 2,921,521 | 3,020,412 | 98,891 | |||||||||
| 12.31.2023 | 09.30.2024 | Variation | ||||||||||
| million CLP | million CLP | million CLP | ||||||||||
| Liabilities | ||||||||||||
| Current liabilities | 692,871 | 675,722 | -17,150 | |||||||||
| Non-current liabilities | 1,307,664 | 1,340,667 | 33,003 | |||||||||
| Total Liabilities | 2,000,535 | 2,016,389 | 15,853 | |||||||||
| 12.31.2023 | 09.30.2024 | Variation | ||||||||||
| million CLP | million CLP | million CLP | ||||||||||
| Equity | ||||||||||||
| Non-controlling interests | 34,695 | 34,640 | -55 | |||||||||
| Equity attributable to the owners of the controller | 886,291 | 969,383 | 83,093 | |||||||||
| Total Equity | 920,985 | 1,004,023 | 83,038 | |||||||||
At the closing of September 2024, with respect to the closing of 2023, the Argentine peso, the Brazilian real and the Paraguayan guarani depreciated against the Chilean peso by 17.3%, 10.0% and 4.7%, respectively, which generated a decrease in assets, liabilities and equity accounts, due to the effect of translation of figures to the reporting currency. Additionally, the figures for Argentina, in accordance with IAS 29, prior to the translation of figures, are adjusted for accumulated inflation as of the end of 2023, until the closing currency of this report (September 2024), increasing the figures in local currency by 101.6%.
Assets
Total assets increased by CLP 98,891 million, up 3.4% compared to December 2023.
Current assets decreased by CLP 94,134 million, 9.6% compared to December 2023, which is mainly explained by the decrease in Cash and cash equivalents (-CLP 92,998 million) due to the payment of dividends, and by the decrease in Trade and other current accounts receivable (-CLP 47,090 million), due to seasonal factors, as we are compared to December, the month of highest sales of the year and, as a result, of high accounts receivable in relation to an average month. The above decreases are partially offset by the increase in Inventories (CLP 41,207 million) due to higher purchases of raw materials and spare parts from our subsidiary in Argentina.
Non-current assets increased by CLP 193,025 million, 10.0% compared to December 2023, mainly due to the increase in Property, plant and equipment (CLP 150,775 million), which is explained by investments made (CLP 210,424 million), added to IAS 29 restatements, which were partially offset by the Depreciation account and the negative effect of the translation of figures. In addition to the above increase, there was an increase in Other non-current financial assets (CLP 54,941 million).
Liabilities and Equity
Total liabilities increased by CLP 15,853 million, 0.8% over December 2023.
Current liabilities decreased by CLP 17,150 million, by 2.5% compared to December 2023, mainly due to the decrease in Trade and other current accounts payable (-CLP 53,621 million), due to seasonal factors considering that December is the month with the highest sales of the year, and thus a month with high accounts payable to suppliers. The above decrease was partially offset by the increase in Other current financial liabilities (CLP 34,776 million), due to an increase in bank obligations in Argentina and Chile.
On the other hand, non-current liabilities increased by CLP 33,003 million, by 2.5% compared to December 2023, mainly due to the increase in Deferred tax liabilities (CLP 26,069 million), which is mainly explained by the increase in deferred liabilities for distribution rights and fixed assets.
Equity increased by CLP 83,038 million, 9.0% compared to December 2023, explained by the increase in Accumulated earnings from profits obtained in the period (CLP 132,988 million), the restatement of equity balances in our subsidiary in Argentina in accordance with IAS 29 (CLP 127,794 million) and the distribution of dividends (-CLP 125,231 million). The increase in Accumulated earnings was partially offset by the decrease in Other reserves (-CLP 52,458 million).
| COCA-COLA ANDINA | |
| 3Q24 EARNINGS RELEASE | |
| www.koandina.com | |
| -11- | |
FINANCIAL ASSETS AND LIABILITIES
| CONSOLIDATED NET FINANCIAL DEBT | (million USD) | |||
| Total Financial Assets | 396 | |||
| Cash and Cash Equivalent (1) | 235 | |||
| Other current financial assets (1) | 80 | |||
| Net valuation of Hedge Derivatives (2) | 81 | |||
| Financial Debt | 1,195 | |||
| Bonds on the international market | 500 | |||
| Bonds on the local market (Chile) | 602 | |||
| Bank Debt and Others | 93 | |||
| Net Financial Debt | 799 | |||
(1) Financial Assets corresponding to Cash and Cash Equivalents and Other current financial assets are held invested in low-risk instruments such as time deposits, short-term fixed-income mutual funds and others.
(2) Considers the net effect of valuations in favor of and against hedge derivatives.
CURRENCY EXPOSURE (%)
| Financial Assets (1) | Financial Debt (3) | |||||||
| CLP (Chile) | 60 | % | 25 | % | ||||
| Unidad de Fomento | ||||||||
| (CLP indexed to inflation) | 1 | % | 56 | % | ||||
| BRL (Brazil) | 33 | % | 15 | % | ||||
| PGY (Paraguay) | 4 | % | 0 | % | ||||
| ARS (Argentina) | 1 | % | 3 | % | ||||
| USD (United States) | 2 | % | 1 | % | ||||
| CHF (Switzerland) | 0 | % | 0 | % | ||||
| Total | 100 | % | 100 | % | ||||
(3) Includes valuation of hedge derivatives.
| RISK RATING | ||||
| Local rating agencies | Rating | |||
| ICR | AA+ | |||
| Fitch Chile | AA+ | |||
| International rating agencies | Rating | |||
| Standard & Poors | BBB | |||
| Fitch Ratings, Inc. | BBB+ |
DEBT AMORTIZATION PROFILE

CASH FLOW
| 09.30.2023 | 09.30.2024 | Variation | ||||||||||||||
| million CLP | million CLP | million CLP | % | |||||||||||||
| Cash flow | ||||||||||||||||
| Operating | 198,397 | 218,254 | 19,857 | 10.0 | % | |||||||||||
| Investment | -80,920 | -209,914 | -128,995 | 159.4 | % | |||||||||||
| Financing | -164,075 | -91,958 | 72,117 | -44.0 | % | |||||||||||
| Net Cash Flow for the period | -46,597 | -83,618 | -37,021 | 79.4 | % | |||||||||||
During the current period, the Company generated a negative net cash flow of CLP 83,618 million, which is explained as follows:
Operating activities generated a positive net cash flow of CLP 218,254 million, higher than the CLP 198,397 million recorded in the same period of 2023, mainly due to higher revenues from increased product sales, partially offset by higher operating and supplier payments.
Investing activities generated a negative cash flow of CLP 209,914 million, with a negative variation of CLP 128,995 million with respect to the previous period, which is mainly explained by the absence of redemptions of financial instruments in 2024 which increased cash and cash equivalents in 2023 (in 2023 the redemption was CLP 63,159 million), added to a higher investment in Capex of CLP 59,351 million.
Financing activities generated a negative cash flow of CLP 91,958 million, with a positive variation of CLP 72,117 million with respect to the previous period, which is mainly explained by transactions in 2023 not present in 2024: the payment on maturity of the US Bond for USD 365 million, which was partially offset by the placement of the Bond in the Swiss market for CHF 170 million. In addition to the above, in 2024 there is more short-term financing in Argentina and lower dividend payments than in 2023.
| COCA-COLA ANDINA | |
| 3Q24 EARNINGS RELEASE | |
| www.koandina.com | |
| -12- | |
MAIN INDICATORS
| INDICATOR | Definition | Unit | Sep 24 | Dec 23 | Sep 23 | Sep 24 vs Dec 23 | Sep 24 vs Sep 23 | |||||||||||||||||
| LIQUIDITY | ||||||||||||||||||||||||
| Current liquidity | Current Asset Current Liability | Times | 1.3 | 1.4 | 1.5 | -7.3 | % | -10.0 | % | |||||||||||||||
| Acid ratio | Current Asset – Inventory Current Liability | Times | 0.9 | 1.1 | 1.0 | -16.0 | % | -11.9 | % | |||||||||||||||
| ACTIVITY | ||||||||||||||||||||||||
| Investment | Million CLP | 210,424 | 222,620 | 141,389 | -5.5 | % | 48.8 | % | ||||||||||||||||
| Inventory turnover | Cost of Sales Average Inventory | Times | 5.3 | 6.7 | 4.8 | -20.8 | % | 9.3 | % | |||||||||||||||
| INDEBTEDNESS | ||||||||||||||||||||||||
| Indebtedness ratio | Net Financial Debt* Total Equity* | Times | 0.7 | 0.7 | 0.7 | 3.7 | % | -2.5 | % | |||||||||||||||
| Financial exp. coverage | Adjusted EBITDA (12M) Financial Expenses* (12M) – Financial Income* (12M) | Times | 13.8 | 13.6 | 15.4 | (4) | 1.5 | % | -10.4 | % | ||||||||||||||
| Net financial debt / Adjusted EBITDA | Net Financial Debt Adjusted EBITDA (12M) | Times | 1.3 | 1.4 | 1.4 | (4) | -5.6 | % | -9.4 | % | ||||||||||||||
| PROFITABILITY | ||||||||||||||||||||||||
| On Equity | Net Income Fiscal Year (12M) Average Equity | % | 20.7 | % | 19.7 | % | 16.5 | % | 1.0 pp | 4.2 pp | ||||||||||||||
| On Total Assets | Net Income Fiscal Year (12M) Average Asset | % | 6.5 | % | 5.8 | % | 5.0 | % | 0.7 pp | 1.5 pp | ||||||||||||||
Liquidity
Current Liquidity showed a negative variation of 7.3% with respect to December 2023, explained by the decrease in current assets (9.6%) which was greater than the decrease in current liabilities (2.5%).
The Acid Ratio showed a decrease of 16.0% with respect to December 2023, for the reasons explained above, in addition to the increase in inventories (17.7%) in the period. Current assets excluding inventories showed a decrease of 18.1% compared to December 2023.
Activity
At the closing of September 2024, investments amounted to CLP 210,424 million, which corresponds to an increase of 48.8% compared to the same period of 2023, mainly explained by higher productive investments (brewery).
Inventory turnover reached 5.3 times, showing an increase of 9.3% compared to the same period of 2023, mainly explained by the increase in the cost of sales by 9.1% compared to the same period of 2023.
Indebtedness
Indebtedness Ratio reached 0.7 times at the closing of September 2024, which corresponds to an increase of 3.7% compared to the closing of December 2023. This is mainly due to the 13.0% increase in net financial debt, which was higher than the increase in total equity (9.0%).
The Financial Expense Coverage indicator shows an increase of 1.5% when compared to December 2023, reaching 13.8 times. This is explained by the fact that the increase in the rolling 12-month period Adjusted EBITDA (19.8%) was greater than the increase in the rolling 12-month period net financial expenses (18.0%).
*Definitions used are contained in the Glossary on page 16 of this document.
(4) Due to a change in criteria in the calculation of Adjusted EBITDA for the rolling 12-month period, this value differs from that previously reported.
| COCA-COLA ANDINA | |
| 3Q24 EARNINGS RELEASE | |
| www.koandina.com | |
| -13- | |

Net Financial Debt/Adjusted EBITDA reached 1.3 times at the closing of September 2024, which represents a decrease of 5.6% compared to December 2023. This is due to an increase in Adjusted EBITDA of 19.8%, which was greater than the increase in net financial debt of 13.0%.
Profitability
Return on Equity reached 20.7%, 1.0 percentage points higher than the indicator measured in December 2023. This result is due to the increase in the rolling 12-month period Net Income (12.2%), which was higher than the increase in average Equity (6.6%).
Return on Total Assets was 6.5%, 0.7 percentage points higher than the indicator measured in December 2023, explained by the increase in the rolling 12-month period Net Income (12.2%), which was higher than the increase in average Assets (0.2%).
MACROECONOMIC INFORMATION
INFLATION
| Accumulated 9M24 | LTM | |||||||
| Argentina* | 101.55 | % | 209.01 | % | ||||
| Brazil | 3.31 | % | 4.42 | % | ||||
| Chile | 3.55 | % | 4.10 | % | ||||
| Paraguay | 2.85 | % | 4.05 | % | ||||
*Official inflation reported by the National Institute of Statistics and Censuses of Argentina (INDEC). It should be mentioned that the inflation used to restate Argentina’s figures in accordance with IAS 29 corresponds to inflation estimated by the Central Bank of the Argentine Republic (in its Survey of Market Expectations report), which is also adjusted for the difference between the estimate (by the Central Bank) and the actual inflation of the previous month (INDEC).
| Local currency/USD | CLP/local currency | |||||||||||||||
| (Average exchange rate*) | (Average exchange rate*) | |||||||||||||||
| EXCHANGE RATES USED | 3Q23 | 3Q24 | 3Q23 | 3Q24 | ||||||||||||
| Argentina | 350.0 | 970.5 | 2.6 | 0.9 | ||||||||||||
| Brazil | 4.88 | 5.55 | 174.72 | 167.79 | ||||||||||||
| Chile | 853 | 930 | N.A | N.A | ||||||||||||
| Paraguay | 7,278 | 7,641 | 0.12 | 0.12 | ||||||||||||
| *Except Argentina, where the closing exchange rate is used, in accordance with IAS 29. | ||||||||||||||||
| Local currency/USD | CLP/local currency | |||||||||||||||
| (Average exchange rate*) | (Average exchange rate*) | |||||||||||||||
| EXCHANGE RATES USED | 9M23 | 9M24 | 9M23 | 9M24 | ||||||||||||
| Argentina | 350.0 | 970.5 | 2.6 | 0.9 | ||||||||||||
| Brazil | 5.01 | 5.24 | 163.98 | 178.98 | ||||||||||||
| Chile | 821 | 938 | N.A | N.A | ||||||||||||
| Paraguay | 7,261 | 7,475 | 0.11 | 0.13 | ||||||||||||
| *Except Argentina, where the closing exchange rate is used, in accordance with IAS 29. | ||||||||||||||||
MARKET RISK ANALYSIS
The Company’s risk management is the responsibility of the office of the Chief Executive Officer, (through the areas of Corporate Management Control, Sustainability and Risks, which depends on the office of the Chief Financial Officer), as well as each of the management areas of Coca-Cola Andina. The main risks that the Company has identified and that could possibly affect the business are as follows:
Relationship with The Coca-Cola Company
A large part of the Company’s sales derives from the sale of products whose trademarks are owned by The Coca-Cola Company, which has the ability to exert an important influence on the business through its rights under the Licensing or Bottling Agreements. In addition, we depend on The Coca-Cola Company to renew these Bottling Agreements.
Non-alcoholic beverage business environment
Consumers, public health officials, and government officials in our markets are increasingly concerned about the public health consequences associated with obesity, which can affect demand for our products, especially those containing sugar.
The Company has developed a large portfolio of sugar-free products and has also made reformulations to some of its sugary products, significantly reducing sugar contents of its products.
| COCA-COLA ANDINA | |
| 3Q24 EARNINGS RELEASE | |
| www.koandina.com | |
| -14- | |
Raw material prices and exchange rate
Many raw materials are used in the production of beverages and packaging, including sugar and PET resin, the prices of which may present great volatility. In the case of sugar, the Company sets the price of a part of the volume that it consumes with some anticipation, in order to avoid having large fluctuations of cost that cannot be anticipated.
In addition, these raw materials are traded in dollars; the Company has a policy of hedging in the futures market a portion of the dollars it uses to buy raw materials.
Instability in the supply of utilities and raw materials
In the countries in which we operate, our operations depend on a stable supply of utilities, fuel and raw materials. Power outages or water shut offs as well as the lack of raw materials may result in interruptions of our production. The Company has mitigation plans to reduce the effects of eventual interruptions in the supply of utilities and raw materials.
Economic conditions of the countries where we operate
The Company maintains operations in Argentina, Brazil, Chile and Paraguay. The demand for our products largely depends on the economic situation of these countries. Moreover, economic instability can cause depreciation of the currencies of these countries, as well as inflation, which may eventually affect the Company’s financial situation.
New tax laws or modifications to tax incentives
We cannot ensure that any government authority in any of the countries in which we operate will not impose new taxes or increase existing taxes on our raw materials, products or containers. Likewise, we cannot assure that these authorities are going to uphold and/or renew tax incentives that currently benefit some of our operations.
A devaluation of the currencies of the countries where we have our operations, regarding the Chilean peso, can negatively affect the results reported by the Company in Chilean pesos
The Company reports its results in Chilean pesos, while a large part of its revenues and Adjusted EBITDA comes from countries that use other currencies. Should currencies devaluate regarding the Chilean peso, this would have a negative effect on the results of the Company, upon the translation of results into Chilean pesos.
The imposition of exchange controls could restrict the entry and exit of funds to and from the countries in which we operate, which could significantly limit our financial capacity
The imposition of exchange controls in the countries in which we operate could affect our ability to repatriate profits, which could significantly limit our ability to pay dividends to our shareholders. Additionally, it may limit the ability of our foreign subsidiaries to finance payments of U.S. dollar denominated liabilities required by foreign creditors.
Civil unrest in Chile could have a material adverse effect on general economic conditions in Chile and our business and financial condition
We cannot predict whether the Chilean economy will be significantly impacted by any protests or demonstrations, which have been violent on occasion in the past, or whether the public policies that the government implements in response to these demonstrations will have a negative impact on the economy and our business. Neither can we assure that demonstrations and vandalism will not cause damage to our logistics and production infrastructure. So far, the Company has not been affected in any material respect.
Our business is subject to risks from pandemics such as COVID-19.
Pandemics pose the risk that we or our employees, contractors, suppliers and other partners may be limited or prevented from conducting business for an indefinite period of time, including due to shutdowns that may be requested or ordered by governmental authorities. In addition, we may experience disruptions in the supply of raw materials.
Pandemics and related governmental actions could adversely affect our business and results of operations, potentially in a material way.
A more detailed analysis of business risks is available in the Company’s 20-F and Annual Report, available on our website.
RECENT EVENTS
Interim Dividend 232
On August 14, 2024, the Company paid Interim Dividend 232: CLP 32.0 per Series A share; and CLP 35.2 per Series B share.
Interim Dividend 233
On October 24, 2024, the Company paid Interim Dividend 233: CLP 32.0 per Series A share; and CLP 35.2 per Series B share.
| COCA-COLA ANDINA | |
| 3Q24 EARNINGS RELEASE | |
| www.koandina.com | |
| -15- | |
GLOSSARY
Adjusted EBITDA: includes Revenue, Costs of Sales, Distribution Costs and Administrative Expenses, included in the Financial Statements submitted to Chile’s Financial Market Commission and determined in accordance with IFRS, plus Depreciation.
Currency-neutral of a quarter q for a Q year is calculated using the same ratio of local currencies to the Chilean peso as the q quarter of the Q-1 year. In the case of Argentina, given that it is a hyperinflationary economy, the result of the q quarter is also deflated by inflation of the last 12 months.
Financial Expenses: correspond to interest generated by the Company’s financial debt.
Financial Income: corresponds to the interest generated by the Company’s cash.
Net Financial Debt: considers the consolidated financial liability that accrues interest, i.e.: (i) other current financial liabilities, plus (ii) other non-current financial liabilities, less (iii) the sum of cash and cash equivalent; plus other current financial assets; plus other non-current financial assets (to the extent that they correspond to the balances of assets for derivative financial instruments, taken to cover exchange rate risk and/or interest rate of financial liabilities).
Operating Income: includes Revenue, Costs of Sales, Distribution Costs and Administrative Expenses, included in the Financial Statements submitted to Chile Financial Market Commission and determined in accordance with IFRS.
Total Equity: corresponds to the equity attributable to the owners of the controller plus non-controlling interests.
Transactions: refers to the number of units sold, regardless of size.
Volume: expressed in Unit Cases (UCs), which is the conventional measurement used to measure sales volume in the Coca-Cola System worldwide.
ADDITIONAL INFORMATION
| STOCK EXCHANGES ON WHICH WE TRADE | ||||
ANDINA-A ANDINA-B
|
AKO/A AKO/B
| |||
| ESG INDICES IN WHICH WE PARTICIPATE | ||||
Dow Jones Sustainability Index Chile Dow Jones Sustainability MILA Pacific Alliance Index. |
|  |
|
|
| NUMBER OF SHARES | ||||
| TOTAL: 946,570,604 | SERIES A: 473,289,301 | SERIES B: 473,281,303 | SHARES PER ADR: 6 | |


| COCA-COLA ANDINA | |
| 3Q24 EARNINGS RELEASE | |
| www.koandina.com | |
| -16- | |
ABOUT COCA-COLA ANDINA
Coca-Cola Andina is among the three largest Coca-Cola bottlers in Latin America, servicing franchised territories with almost 57.4 million people, delivering 882.6 million unit cases or 5,011 million liters of soft drinks, juices, bottled water, beer and other alcoholic beverages during 2023. Coca-Cola Andina has the franchise to produce and commercialize Coca-Cola products in certain territories in Argentina (through Embotelladora del Atlántico), in Brazil (through Rio de Janeiro Refrescos), in Chile, (through Embotelladora Andina) and in all of Paraguay (through Paraguay Refrescos). The Chadwick Claro, Garcés Silva, Said Handal and Said Somavía families control Coca-Cola Andina in equal parts. The Company’s value generation proposal is to become a Total Beverage Company, using existing resources efficiently and sustainably, developing a relationship of excellence with consumers of its products, as well as with its collaborators, customers, suppliers, the community in which it operates and with its strategic partner The Coca-Cola Company, in order to increase ROIC for shareholders in the long term. For more company information visit www.koandina.com.
This document may contain projections reflecting Coca-Cola Andina’s good faith expectation and are based on currently available information. However, the results that are finally obtained are subject to diverse variables, many of which are beyond the Company’s control, and which could materially impact the current performance. Among the factors that could change the performance are the political and economic conditions on mass consumption, pricing pressures resulting from competitive discounts of other bottlers, weather conditions in the Southern Cone and other risk factors that would be applicable from time to time, and which are periodically informed in reports filed before the appropriate regulatory authorities, and which are available on our website.
| COCA-COLA ANDINA | |
| 3Q24 EARNINGS RELEASE | |
| www.koandina.com | |
| -17- | |
Embotelladora Andina S.A.
Third Quarter Results for the period ended September 30, 2024. Reported figures, IFRS GAAP.
(In nominal million Chilean pesos, except per share)
| July-September 2024 | July-September 2023 | |||||||||||||||||||||||||||||||||||||||||||
| Chilean Operations | Brazilian Operations | Argentine Operations | Paraguay Operations | Total (1) | Chilean Operations | Brazilian Operations | Argentine Operations | Paraguay Operations | Total (1) | % Ch. | ||||||||||||||||||||||||||||||||||
| Volume total beverages (Million UC) | 71.0 | 81.5 | 42.5 | 19.4 | 214.4 | 69.8 | 70.4 | 44.4 | 18.3 | 202.9 | 5.7 | % | ||||||||||||||||||||||||||||||||
| Transactions (Million) | 427.9 | 420.2 | 190.3 | 117.3 | 1,155.7 | 408.7 | 391.8 | 212.4 | 115.7 | 1,128.6 | 2.4 | % | ||||||||||||||||||||||||||||||||
| Net sales | 291,885 | 205,171 | 169,490 | 62,034 | 726,806 | 276,771 | 181,272 | 159,472 | 54,147 | 670,333 | 8.4 | % | ||||||||||||||||||||||||||||||||
| Cost of sales | (195,344 | ) | (124,914 | ) | (96,504 | ) | (36,636 | ) | (451,542 | ) | (185,071 | ) | (111,849 | ) | (86,438 | ) | (30,271 | ) | (412,230 | ) | 9.5 | % | ||||||||||||||||||||||
| Gross profit | 96,541 | 80,257 | 72,985 | 25,398 | 275,264 | 91,699 | 69,424 | 73,035 | 23,875 | 258,103 | 6.6 | % | ||||||||||||||||||||||||||||||||
| Gross margin | 33.1 | % | 39.1 | % | 43.1 | % | 40.9 | % | 37.9 | % | 33.1 | % | 38.3 | % | 45.8 | % | 44.1 | % | 38.5 | % | ||||||||||||||||||||||||
| Distribution and administrative expenses | (71,175 | ) | (47,889 | ) | (62,245 | ) | (12,610 | ) | (193,920 | ) | (63,643 | ) | (44,272 | ) | (58,141 | ) | (11,848 | ) | (177,904 | ) | 9.0 | % | ||||||||||||||||||||||
| Corporate expenses (2) | (2,758 | ) | (2,059 | ) | 34.0 | % | ||||||||||||||||||||||||||||||||||||||
| Operating income (3) | 25,366 | 32,368 | 10,740 | 12,787 | 78,587 | 28,056 | 25,152 | 14,893 | 12,028 | 78,140 | 0.6 | % | ||||||||||||||||||||||||||||||||
| Operating margin | 8.7 | % | 15.8 | % | 6.3 | % | 20.6 | % | 10.8 | % | 10.1 | % | 13.9 | % | 9.3 | % | 22.2 | % | 11.7 | % | ||||||||||||||||||||||||
| Adjusted EBITDA (4) | 37,958 | 41,297 | 21,261 | 16,874 | 114,634 | 39,176 | 33,638 | 24,175 | 15,590 | 110,520 | 3.7 | % | ||||||||||||||||||||||||||||||||
| Adjusted EBITDA margin | 13.0 | % | 20.1 | % | 12.5 | % | 27.2 | % | 15.8 | % | 14.2 | % | 18.6 | % | 15.2 | % | 28.8 | % | 16.5 | % | ||||||||||||||||||||||||
| Financial (expenses) income (net) | (12,763 | ) | (16,039 | ) | -20.4 | % | ||||||||||||||||||||||||||||||||||||||
| Share of (loss) profit of investments accounted for using the equity method | 760 | (846 | ) | -189.9 | % | |||||||||||||||||||||||||||||||||||||||
| Other income (expenses) (5) | (4,937 | ) | (8,632 | ) | -42.8 | % | ||||||||||||||||||||||||||||||||||||||
| Results by readjustement unit and exchange rate difference | (3,626 | ) | 20,468 | -117.7 | % | |||||||||||||||||||||||||||||||||||||||
| Net income before income taxes | 58,022 | 73,091 | -20.6 | % | ||||||||||||||||||||||||||||||||||||||||
| Income tax expense | (15,725 | ) | (9,541 | ) | 64.8 | % | ||||||||||||||||||||||||||||||||||||||
| Net income | 42,297 | 63,550 | -33.4 | % | ||||||||||||||||||||||||||||||||||||||||
| Net income attributable to non-controlling interests | (354 | ) | 158 | -324.8 | % | |||||||||||||||||||||||||||||||||||||||
| Net income attributable to equity holders of the parent | 41,942 | 63,708 | -34.2 | % | ||||||||||||||||||||||||||||||||||||||||
| Net margin | 5.8 | % | 9.5 | % | ||||||||||||||||||||||||||||||||||||||||
| WEIGHTED AVERAGE SHARES OUTSTANDING | 946.6 | 946.6 | ||||||||||||||||||||||||||||||||||||||||||
| EARNINGS PER SHARE | 44.3 | 67.3 | ||||||||||||||||||||||||||||||||||||||||||
| EARNINGS PER ADS | 265.9 | 403.8 | -34.2 | % | ||||||||||||||||||||||||||||||||||||||||
(1) Total may be different from the addition of the four countries because of intercountry eliminations.
(2) Corporate expenses partially reclassified to the operations.
(3) Operating Income considers Net Sales, Cost of Sales, Distribution Costs, and Administrative Expenses included in the Financial Statements filed with the Chilean Financial Market Comission and determined in accordance to IFRS.
(4) Adjusted EBITDA considers Net Sales, Cost of Sales, Distribution Costs, and Administrative Expenses included in the Financial Statements filed with the Chilean Financial Market Comission and determined in accordance to IFRS, plus Depreciation.
(5) Other income (expenses) includes the following lines of the income statement by function included in the published financial statements in the Financial Market Comission: “Other income”, “Other expenses” and “Other (loss) gains”.
| -18- |
Embotelladora Andina S.A.
Nine Months Results for the period ended September 30, 2024. Reported figures, IFRS GAAP.
(In nominal million Chilean pesos, except per share)
| January-September 2024 | January-September 2023 | |||||||||||||||||||||||||||||||||||||||||||
| Chilean Operations | Brazilian Operations | Argentine Operations | Paraguay Operations | Total (1) | Chilean Operations | Brazilian Operations | Argentine Operations | Paraguay Operations | Total (1) | % Ch. | ||||||||||||||||||||||||||||||||||
| Volume total beverages (Million UC) | 221.2 | 243.8 | 115.8 | 59.4 | 640.3 | 226.7 | 212.1 | 140.8 | 54.8 | 634.3 | 0.9 | % | ||||||||||||||||||||||||||||||||
| Transactions (Million) | 1,300.4 | 1,284.2 | 538.6 | 367.0 | 3,490.3 | 1,318.7 | 1,167.4 | 673.9 | 338.5 | 3,498.4 | -0.2 | % | ||||||||||||||||||||||||||||||||
| Net sales | 880,104 | 656,584 | 483,391 | 197,637 | 2,210,479 | 859,500 | 501,779 | 507,796 | 154,610 | 2,021,002 | 9.4 | % | ||||||||||||||||||||||||||||||||
| Cost of sales | (588,438 | ) | (388,852 | ) | (262,644 | ) | (111,888 | ) | (1,344,338 | ) | (574,619 | ) | (311,357 | ) | (263,636 | ) | (85,918 | ) | (1,232,600 | ) | 9.1 | % | ||||||||||||||||||||||
| Gross profit | 291,666 | 267,732 | 220,746 | 85,749 | 866,141 | 284,881 | 190,422 | 244,160 | 68,692 | 788,402 | 9.9 | % | ||||||||||||||||||||||||||||||||
| Gross margin | 33.1 | % | 40.8 | % | 45.7 | % | 43.4 | % | 39.2 | % | 33.1 | % | 37.9 | % | 48.1 | % | 44.4 | % | 39.0 | % | ||||||||||||||||||||||||
| Distribution and administrative expenses | (209,514 | ) | (153,119 | ) | (177,118 | ) | (40,177 | ) | (579,927 | ) | (199,545 | ) | (123,421 | ) | (175,108 | ) | (32,839 | ) | (530,913 | ) | 9.2 | % | ||||||||||||||||||||||
| Corporate expenses (2) | (8,010 | ) | (5,514 | ) | 45.3 | % | ||||||||||||||||||||||||||||||||||||||
| Operating income (3) | 82,152 | 114,613 | 43,628 | 45,572 | 278,204 | 85,336 | 67,000 | 69,052 | 35,853 | 251,974 | 10.4 | % | ||||||||||||||||||||||||||||||||
| Operating margin | 9.3 | % | 17.5 | % | 9.0 | % | 23.1 | % | 12.6 | % | 9.9 | % | 13.4 | % | 13.6 | % | 23.2 | % | 12.5 | % | ||||||||||||||||||||||||
| Adjusted EBITDA (4) | 119,742 | 142,241 | 74,476 | 57,673 | 386,123 | 118,109 | 90,806 | 96,028 | 45,790 | 345,219 | 11.8 | % | ||||||||||||||||||||||||||||||||
| Adjusted EBITDA margin | 13.6 | % | 21.7 | % | 15.4 | % | 29.2 | % | 17.5 | % | 13.7 | % | 18.1 | % | 18.9 | % | 29.6 | % | 17.1 | % | ||||||||||||||||||||||||
| Financial (expenses) income (net) | (34,082 | ) | (24,682 | ) | 38.1 | % | ||||||||||||||||||||||||||||||||||||||
| Share of (loss) profit of investments accounted for using the equity method | 1,860 | (5 | ) | -35187.2 | % | |||||||||||||||||||||||||||||||||||||||
| Other income (expenses) (5) | (23,797 | ) | (42,286 | ) | -43.7 | % | ||||||||||||||||||||||||||||||||||||||
| Results by readjustement unit and exchange rate difference | (7,345 | ) | (6,751 | ) | 8.8 | % | ||||||||||||||||||||||||||||||||||||||
| Net income before income taxes | 214,840 | 178,250 | 20.5 | % | ||||||||||||||||||||||||||||||||||||||||
| Income tax expense | (80,713 | ) | (64,697 | ) | 24.8 | % | ||||||||||||||||||||||||||||||||||||||
| Net income | 134,127 | 113,554 | 18.1 | % | ||||||||||||||||||||||||||||||||||||||||
| Net income attributable to non-controlling interests | (1,140 | ) | (1,404 | ) | -18.8 | % | ||||||||||||||||||||||||||||||||||||||
| Net income attributable to equity holders of the parent | 132,988 | 112,150 | 18.6 | % | ||||||||||||||||||||||||||||||||||||||||
| Net margin | 6.0 | % | 5.5 | % | ||||||||||||||||||||||||||||||||||||||||
| WEIGHTED AVERAGE SHARES OUTSTANDING | 946.6 | 946.6 | ||||||||||||||||||||||||||||||||||||||||||
| EARNINGS PER SHARE | 140.5 | 118.5 | ||||||||||||||||||||||||||||||||||||||||||
| EARNINGS PER ADS | 843.0 | 710.9 | 18.6 | % | ||||||||||||||||||||||||||||||||||||||||
(1) Total may be different from the addition of the four countries because of intercountry eliminations.
(2) Corporate expenses partially reclassified to the operations.
(3) Operating Income considers Net Sales, Cost of Sales, Distribution Costs, and Administrative Expenses included in the Financial Statements filed with the Chilean Financial Market Comission and determined in accordance to IFRS.
(4) Adjusted EBITDA considers Net Sales, Cost of Sales, Distribution Costs, and Administrative Expenses included in the Financial Statements filed with the Chilean Financial Market Comission and determined in accordance to IFRS, plus Depreciation.
(5) Other income (expenses) includes the following lines of the income statement by function included in the published financial statements in the Financial Market Comission: "Other income", "Other expenses" and "Other (loss) gains".
| -19- |
Embotelladora Andina S.A.
Third Quarter Results for the period ended September 30, 2024.
(In local nominal currency of each period, except Argentina (3))
| July-September 2024 | July-September 2023 | |||||||||||||||||||||||||||||||
| Chile Million Ch$ | Brazil Million R$ | Argentina (3) Million AR$ | Paraguay Million G$ | Chile Million Ch$ | Brazil Million R$ | Argentina (3) Million AR$ | Paraguay Million G$ | |||||||||||||||||||||||||
| Nominal | Nominal | IAS29 | Nominal | Nominal | Nominal | IAS 29 | Nominal | |||||||||||||||||||||||||
| Total beverages volume (Million UC) | 71.0 | 81.5 | 42.5 | 19.4 | 69.8 | 70.4 | 44.4 | 18.3 | ||||||||||||||||||||||||
| Transactions (Million) | 427.9 | 420.2 | 190.3 | 117.3 | 408.7 | 391.8 | 212.4 | 115.7 | ||||||||||||||||||||||||
| Net sales | 291,885 | 1,223.1 | 183,238.8 | 509,885 | 276,771 | 1,036.3 | 192,960.4 | 461,220 | ||||||||||||||||||||||||
| Cost of sales | (195,344 | ) | (744.8 | ) | (104,332.9 | ) | (301,095 | ) | (185,071 | ) | (639.6 | ) | (104,589.1 | ) | (257,885 | ) | ||||||||||||||||
| Gross profit | 96,541 | 478.3 | 78,905.8 | 208,790 | 91,699 | 396.7 | 88,371.3 | 203,335 | ||||||||||||||||||||||||
| Gross margin | 33.1 | % | 39.1 | % | 43.1 | % | 40.9 | % | 33.1 | % | 38.3 | % | 45.8 | % | 44.1 | % | ||||||||||||||||
| Distribution and administrative expenses | (71,175 | ) | (285.4 | ) | (67,294.5 | ) | (103,695 | ) | (63,643 | ) | (253.2 | ) | (70,350.6 | ) | (100,992 | ) | ||||||||||||||||
| Operating income (1) | 25,366 | 192.9 | 11,611.4 | 105,095 | 28,056 | 143.5 | 18,020.6 | 102,343 | ||||||||||||||||||||||||
| Operating margin | 8.7 | % | 15.8 | % | 6.3 | % | 20.6 | % | 10.1 | % | 13.8 | % | 9.3 | % | 22.2 | % | ||||||||||||||||
| Adjusted EBITDA (2) | 37,958 | 246.1 | 22,986.1 | 138,660 | 39,176 | 192.1 | 29,251.4 | 132,770 | ||||||||||||||||||||||||
| Adjusted EBITDA margin | 13.0 | % | 20.1 | % | 12.5 | % | 27.2 | % | 14.2 | % | 18.5 | % | 15.2 | % | 28.8 | % | ||||||||||||||||
(1) Operating Income considers Net Sales, Cost of Sales, Distribution Costs, and Administrative Expenses included in the Financial Statements filed with the Chilean Financial Market Comission and determined in accordance to IFRS.
(2) Adjusted EBITDA considers Net Sales, Cost of Sales, Distribution Costs, and Administrative Expenses included in the Financial Statements filed with the Chilean Financial Market Comission and determined in accordance to IFRS, plus Depreciation.
(3) Argentina 2024 figures are presented in accordance to IAS 29, in September 2024 currency. 2023 figures are also presented in accordance to IAS 29, in September 2024 currency.
| -20- |
Embotelladora Andina S.A.
Nine Months Results for the period ended September 30, 2024.
(In local nominal currency of each period, except Argentina (3))
| January-September 2024 | January-September 2023 | |||||||||||||||||||||||||||||||
| Chile Million Ch$ | Brazil Million R$ | Argentina (3) Million AR$ | Paraguay Million G$ | Chile Million Ch$ | Brazil Million R$ | Argentina (3) Million AR$ | Paraguay Million G$ | |||||||||||||||||||||||||
| Nominal | Nominal | IAS29 | Nominal | Nominal | Nominal | IAS 29 | Nominal | |||||||||||||||||||||||||
| Total beverages volume (Million UC) | 221.2 | 243.8 | 115.8 | 59.4 | 226.7 | 212.1 | 140.8 | 54.8 | ||||||||||||||||||||||||
| Transactions (Million) | 1,300.4 | 1,284.2 | 538.6 | 367.0 | 1,318.7 | 1,167.4 | 673.9 | 338.5 | ||||||||||||||||||||||||
| Net sales | 880,104 | 3,658.3 | 522,603.3 | 1,571,724 | 859,500 | 3,055.0 | 614,429.3 | 1,365,085 | ||||||||||||||||||||||||
| Cost of sales | (588,438 | ) | (2,168.2 | ) | (283,949.8 | ) | (890,579 | ) | (574,619 | ) | (1,896.6 | ) | (318,997.4 | ) | (758,517 | ) | ||||||||||||||||
| Gross profit | 291,666 | 1,490.2 | 238,653.5 | 681,145 | 284,881 | 1,158.4 | 295,431.9 | 606,568 | ||||||||||||||||||||||||
| Gross margin | 33.1 | % | 40.7 | % | 45.7 | % | 43.3 | % | 33.1 | % | 37.9 | % | 48.1 | % | 44.4 | % | ||||||||||||||||
| Distribution and administrative expenses | (209,514 | ) | (852.8 | ) | (191,485.9 | ) | (320,035 | ) | (199,545 | ) | (751.3 | ) | (211,879.5 | ) | (289,941 | ) | ||||||||||||||||
| Operating income (1) | 82,152 | 637.3 | 47,167.6 | 361,111 | 85,336 | 407.1 | 83,552.4 | 316,627 | ||||||||||||||||||||||||
| Operating margin | 9.3 | % | 17.4 | % | 9.0 | % | 23.0 | % | 9.9 | % | 13.3 | % | 13.6 | % | 23.2 | % | ||||||||||||||||
| Adjusted EBITDA (2) | 119,742 | 791.6 | 80,517.2 | 457,482 | 118,109 | 552.1 | 116,193.4 | 404,417 | ||||||||||||||||||||||||
| Adjusted EBITDA margin | 13.6 | % | 21.6 | % | 15.4 | % | 29.1 | % | 13.7 | % | 18.1 | % | 18.9 | % | 29.6 | % | ||||||||||||||||
(1) Operating Income considers Net Sales, Cost of Sales, Distribution Costs, and Administrative Expenses included in the Financial Statements filed with the Chilean Financial Market Comission and determined in accordance to IFRS.
(2) Adjusted EBITDA considers Net Sales, Cost of Sales, Distribution Costs, and Administrative Expenses included in the Financial Statements filed with the Chilean Financial Market Comission and determined in accordance to IFRS, plus Depreciation.
(3) Argentina 2024 figures are presented in accordance to IAS 29, in September 2024 currency. 2023 figures are also presented in accordance to IAS 29, in September 2024 currency.
| -21- |
Embotelladora Andina S.A.
Consolidated Balance Sheet
(In million Chilean pesos)
| Variation % | ||||||||||||||||||||
| ASSETS | 09-30-2024 | 12-31-2023 | 09-30-2023 | 12-31-2023 | 09-30-2023 | |||||||||||||||
| Cash + Time deposits + market. Securit. | 283,043 | 370,969 | 292,371 | -23.7 | % | -3.2 | % | |||||||||||||
| Account receivables (net) | 261,712 | 315,053 | 257,872 | -16.9 | % | 1.5 | % | |||||||||||||
| Inventories | 274,261 | 233,053 | 262,642 | 17.7 | % | 4.4 | % | |||||||||||||
| Other current assets | 68,621 | 62,695 | 79,598 | 9.5 | % | -13.8 | % | |||||||||||||
| Total Current Assets | 887,637 | 981,771 | 892,482 | -9.6 | % | -0.5 | % | |||||||||||||
| Property, plant and equipment | 2,323,403 | 1,963,421 | 2,103,100 | 18.3 | % | 10.5 | % | |||||||||||||
| Depreciation | (1,300,240 | ) | (1,091,032 | ) | (1,217,079 | ) | 19.2 | % | 6.8 | % | ||||||||||
| Total Property, Plant, and Equipment | 1,023,163 | 872,389 | 886,021 | 17.3 | % | 15.5 | % | |||||||||||||
| Investment in related companies | 87,372 | 91,799 | 92,094 | -4.8 | % | -5.1 | % | |||||||||||||
| Goodwill | 138,296 | 122,104 | 138,544 | 13.3 | % | -0.2 | % | |||||||||||||
| Other long term assets | 883,944 | 853,458 | 856,454 | 3.6 | % | 3.2 | % | |||||||||||||
| Total Other Assets | 1,109,611 | 1,067,361 | 1,087,092 | 4.0 | % | 2.1 | % | |||||||||||||
| TOTAL ASSETS | 3,020,412 | 2,921,521 | 2,865,595 | 3.4 | % | 5.4 | % | |||||||||||||
| Variation % | ||||||||||||||||||||
| LIABILITIES & SHAREHOLDERS' EQUITY | 09-30-2024 | 12-31-2023 | 09-30-2023 | 12-31-2023 | 09-30-2023 | |||||||||||||||
| Short term bank liabilities | 43,589 | 1,501 | 26,254 | 2804.2 | % | 66.0 | % | |||||||||||||
| Current portion of bonds payable | 20,707 | 27,479 | 19,241 | -24.6 | % | 7.6 | % | |||||||||||||
| Other financial liabilities | 23,477 | 24,017 | 23,897 | -2.2 | % | -1.8 | % | |||||||||||||
| Trade accounts payable and notes payable | 463,900 | 524,958 | 444,556 | -11.6 | % | 4.4 | % | |||||||||||||
| Other liabilities | 124,048 | 114,917 | 97,225 | 7.9 | % | 27.6 | % | |||||||||||||
| Total Current Liabilities | 675,722 | 692,871 | 611,173 | -2.5 | % | 10.6 | % | |||||||||||||
| Long term bank liabilities | 9,553 | 13,404 | 13,325 | -28.7 | % | -28.3 | % | |||||||||||||
| Bonds payable | 967,959 | 953,660 | 945,334 | 1.5 | % | 2.4 | % | |||||||||||||
| Other financial liabilities | 73,359 | 77,262 | 54,549 | -5.1 | % | 34.5 | % | |||||||||||||
| Other long term liabilities | 289,796 | 263,338 | 278,396 | 10.0 | % | 4.1 | % | |||||||||||||
| Total Long Term Liabilities | 1,340,667 | 1,307,664 | 1,291,604 | 2.5 | % | 3.8 | % | |||||||||||||
| Minority interest | 34,640 | 34,695 | 33,587 | -0.2 | % | 3.1 | % | |||||||||||||
| Stockholders' Equity | 969,383 | 886,291 | 929,230 | 9.4 | % | 4.3 | % | |||||||||||||
| TOTAL LIABILITIES & SHAREHOLDERS' EQUITY | 3,020,412 | 2,921,521 | 2,865,595 | 3.4 | % | 5.4 | % | |||||||||||||
Financial Highlights
(In million Chilean pesos)
| Accumulated | ||||||||||||
| ADDITIONS TO FIXED ASSETS | 09-30-2024 | 12-31-2023 | 09-30-2023 | |||||||||
| Chile | 48,119 | 107,314 | 58,679 | |||||||||
| Brazil | 91,362 | 54,082 | 35,928 | |||||||||
| Argentina | 61,370 | 44,729 | 37,236 | |||||||||
| Paraguay | 9,573 | 16,495 | 9,546 | |||||||||
| Total | 210,424 | 222,620 | 141,389 | |||||||||
| -22- |
SIGNATURES
Pursuant to the requirements of the Securities Exchange Act of 1934, the registrant has duly caused this report to be signed on its behalf by the undersigned, thereunto duly authorized, in the city of Santiago, Chile.
| EMBOTELLADORA ANDINA S.A. | ||
| By: | /s/ Andrés Wainer | |
| Name: | Andrés Wainer | |
| Title: | Chief Financial Officer | |
Santiago, October 29, 2024