UNITED STATES
SECURITIES AND EXCHANGE COMMISSION
Washington, D.C. 20549
FORM N-CSR
CERTIFIED SHAREHOLDER REPORT OF REGISTERED MANAGEMENT
INVESTMENT COMPANIES
Investment Company Act file number 811-08560
GAMCO International Growth Fund, Inc.
(Exact name of registrant as specified in charter)
One Corporate Center
Rye, New York 10580-1422
(Address of principal executive offices) (Zip code)
Bruce N. Alpert
Gabelli Funds, LLC
One Corporate Center
Rye, New York 10580-1422
(Name and address of agent for service)
Registrant’s telephone number, including area code: 1-800-422-3554
Date of fiscal year end: December 31
Date of reporting period: December 31, 2013
Form N-CSR is to be used by management investment companies to file reports with the Commission not later than 10 days after the transmission to stockholders of any report that is required to be transmitted to stockholders under Rule 30e-1 under the Investment Company Act of 1940 (17 CFR 270.30e-1). The Commission may use the information provided on Form N-CSR in its regulatory, disclosure review, inspection, and policymaking roles.
A registrant is required to disclose the information specified by Form N-CSR, and the Commission will make this information public. A registrant is not required to respond to the collection of information contained in Form N-CSR unless the Form displays a currently valid Office of Management and Budget (“OMB”) control number. Please direct comments concerning the accuracy of the information collection burden estimate and any suggestions for reducing the burden to Secretary, Securities and Exchange Commission, 100 F Street, NE, Washington, DC 20549. The OMB has reviewed this collection of information under the clearance requirements of 44 U.S.C. § 3507.
Item 1. Reports to Stockholders.
The Report to Shareholders is attached herewith.
| | |
GAMCO International Growth Fund, Inc. Annual Report — December 31, 2013 | | 
|
| |
| | |
| | | Caesar M. P. Bryan
Portfolio Manager |
To Our Shareholders,
For the year ended December 31, 2013, the net asset value (“NAV”) per Class AAA Share of the GAMCO International Growth Fund, Inc. increased 12.1% compared with an increase of 22.8% for the Morgan Stanley Capital International (“MSCI”) Europe, Australasia, and the Far East (“EAFE”) Index. See page 3 for additional performance information.
Enclosed are the schedule of investments and financial statements as of December 31, 2013.
Performance Discussion (Unaudited)
We purchase attractively valued companies that we believe have the opportunity to grow earnings more rapidly than average within that company’s local market. We pay close attention to a company’s market position, management, and balance sheet, with particular emphasis on the ability of the company to finance its growth. Generally, we value a company relative to its local market, but where appropriate, we will attempt to benefit from valuation discrepancies between markets. Our primary focus is on security selection and not country allocation, but the Fund will remain well diversified by sector and geography. Country allocation is likely to reflect broad economic, financial, and currency trends, as well as relative size of the market.
The Fund is focused on developed countries and not the emerging markets. Further, we remain skeptical of the recovery of the peripheral Eurozone countries. As a consequence we have no investments in countries such as Spain, Italy, Greece, and Ireland. Instead we have concentrated the Fund’s investments in Japan (24.7% of net assets as of December 31, 2013); the United Kingdom (18.6%); Switzerland (18.5%) and other European markets. Our lack of exposure to the peripheral Eurozone markets and to the financial sector hurt performance in 2013. Further our material, energy, gold, and South East Asian investments generally underperformed. We continue to favor companies with strong balance sheets which will help them weather any financial market or economic volatility.
Most equity markets enjoyed a strong finish to the year. The U.S. market again took the lead and set the tone for other developed markets to follow. The standout performer in Europe was Germany, which returned 13.3%.
Some of our better performing stocks were Kinnevik Investment AB (3.5% of net assets as of December 31, 2013), an investment company focused on increasing shareholder value, primarily through net asset value growth. The company’s holdings of growth companies are focused around Telecom & Financial Services, Online, Media and Industry, and other investments; Roche Holdings AG (3.8%), whose primary objective is to provide healthcare solutions that deliver superior options for diagnosis and treatment to clinicians and patients; and Naspers Ltd. (2.5%), a South Africa based multinational mass media company with principal operations in electronic media and print media.
Some of our weaker holdings were Jardine Matheson Holdings Ltd. (2.2%), a holding company with a majority of its business interests in Asia, including subsidiaries Jardine Pacific, Jardine Motors, Jardine Lloyd Thompson, Hongkong Land, Jardine Strategic, Dairy Farm, Mandarin Oriental Hotel Group, Jardine Cycle & Carriage and Astra International; Agnico Eagle Mines Ltd. (0.6%), a Canadian based gold producer with operations in Canada, Finland, and Mexico and exploration and development activities extending to the United States; and Newcrest Mining Ltd. (0.3%), one of the world’s largest gold mining companies operating mines in four countries, focusing on long term value creation with an emphasis on three key value drivers: maintaining low costs, growing reserves and production, and efficient use of capital.
We appreciate your confidence and trust.
| | |
| | Sincerely yours, |
| | 
|
| |
| |
| |
| | Bruce N. Alpert President |
February 13, 2014 | | |
2
Comparative Results
| | | | | | | | | | |
| | |
Average Annual Returns through December 31, 2013 (a) (Unaudited) | | |
| | | 1 Year | | 5 Year | | 10 Year | | Since
Inception
(6/30/95) | | |
Class AAA (GIGRX) | | 12.09% | | 14.27% | | 6.73% | | 7.32% | | |
MSCI EAFE Index | | 22.78 | | 12.44 | | 6.91 | | 5.58 | | |
Lipper International Large-Cap Growth Fund Average | | 17.94 | | 12.90 | | 7.57 | | 6.93 | | |
Lipper International Multi-Cap Growth Fund Average | | 19.47 | | 13.12 | | 6.93 | | 6.63 | | |
Class A (GAIGX) | | 12.06 | | 14.29 | | 6.78 | | 7.42 | | |
With sales charge (b) | | 5.61 | | 12.94 | | 6.15 | | 7.07 | | |
Class C (GCIGX) | | 11.29 | | 13.43 | | 5.96 | | 6.71 | | |
With contingent deferred sales charge (c) | | 10.29 | | 13.43 | | 5.96 | | 6.71 | | |
Class I (GIIGX) | | 12.38 | | 14.58 | | 6.90 | | 7.41 | | |
In the current prospectuses dated April 30, 2013, the expense ratios for Class AAA, A, C, and I Shares are 2.14%, 2.14%, 2.89%, and 1.89%, respectively. See page 10 for the expense ratios for the year ended December 31, 2013. Class AAA and Class I Shares do not have a sales charge. The maximum sales charge for Class A and Class C Shares is 5.75% and 1.00%, respectively. (a) Returns represent past performance and do not guarantee future results. Total returns and average annual returns reflect changes in share price, reinvestment of distributions, and are net of expenses. Investment returns and the principal value of an investment will fluctuate. When shares are redeemed, they may be worth more or less than their original cost. Current performance may be lower or higher than the performance data presented. Visit www.gabelli.com for performance information as of the most recent month end. The Fund imposes a 2% redemption fee on shares sold or exchanged within seven days after the date of purchase. Investors should carefully consider the investment objectives, risks, charges, and expenses of the Fund before investing. The prospectuses contain information about these and other matters and should be read carefully before investing. Investing in foreign securities involves risks not ordinarily associated with investments in domestic issues, including currency fluctuation, economic, and political risks. The Class AAA Share NAVs are used to calculate performance for the periods prior to the issuance of Class A Shares, Class C Shares, and Class I Shares on July 25, 2001, December 17, 2000, and January 11, 2008, respectively. The actual performance of the Class A Shares and Class C Shares would have been lower due to the additional fees and expenses associated with these classes of shares. The actual performance of the Class I Shares would have been higher due to lower expenses related to this class of shares. The MSCI EAFE Index is an unmanaged indicator of international stock market performance, while the Lipper International Large-Cap Growth Fund Average and the Lipper International Multi-Cap Growth Fund Average reflect the average performance of mutual funds classified in these particular categories. Dividends are considered reinvested. You cannot invest directly in an index. (b) Performance results include the effect of the maximum 5.75% sales charge at the beginning of the period. (c) Assuming payment of the 1% maximum contingent deferred sales charge imposed on redemptions made within one year of purchase. | | |
COMPARISON OF CHANGE IN VALUE OF A $10,000 INVESTMENT IN
GAMCO INTERNATIONAL GROWTH FUND (CLASS AAA SHARES)
AND MSCI EAFE INDEX (Unaudited)
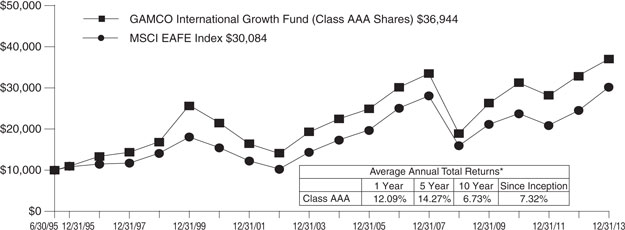
| * | Past performance is not predictive of future results. The performance tables and graph do not reflect the deduction of taxes that a shareholder would pay on fund distributions or the redemption of fund shares. |
3
| | |
GAMCO International Growth Fund, Inc. Disclosure of Fund Expenses (Unaudited) For the Six Month Period from July 1, 2013 through December 31, 2013 | | Expense Table |
We believe it is important for you to understand the impact of fees and expenses regarding your investment. All mutual funds have operating expenses. As a shareholder of a fund, you incur ongoing costs, which include costs for portfolio management, administrative services, and shareholder reports (like this one), among others. Operating expenses, which are deducted from a fund’s gross income, directly reduce the investment return of a fund. When a fund’s expenses are expressed as a percentage of its average net assets, this figure is known as the expense ratio. The following examples are intended to help you understand the ongoing costs (in dollars) of investing in your Fund and to compare these costs with those of other mutual funds. The examples are based on an investment of $1,000 made at the beginning of the period shown and held for the entire period.
The Expense Table below illustrates your Fund’s costs in two ways:
Actual Fund Return: This section provides information about actual account values and actual expenses. You may use this section to help you to estimate the actual expenses that you paid over the period after any fee waivers and expense reimbursements. The “Ending Account Value” shown is derived from the Fund’s actual return during the past six months, and the “Expenses Paid During Period” shows the dollar amount that would have been paid by an investor who started with $1,000 in the Fund. You may use this information, together with the amount you invested, to estimate the expenses that you paid over the period.
To do so, simply divide your account value by $1,000 (for example, an $8,600 account value divided by $1,000 = 8.6), then multiply the result by the number given for your Fund under the heading “Expenses Paid During Period” to estimate the expenses you paid during this period.
Hypothetical 5% Return: This section provides information about hypothetical account values and hypothetical expenses based on the Fund’s actual expense ratio. It assumes a hypothetical annualized return of 5% before expenses during the period shown. In this case – because the hypothetical return used is not the Fund’s actual return – the results do not apply to your
investment and you cannot use the hypothetical account value and expense to estimate the actual ending account balance or expenses you paid for the period. This example is useful in making comparisons of the ongoing costs of investing in the Fund and other funds. To do so, compare this 5% hypothetical example with the 5% hypothetical examples that appear in shareholder reports of other funds.
Please note that the expenses shown in the table are meant to highlight your ongoing costs only and do not reflect any transactional costs such as sales charges (loads), redemption fees, or exchange fees, if any, which are described in the Prospectus. If these costs were applied to your account, your costs would be higher. Therefore, the 5% hypothetical return is useful in comparing ongoing costs only, and will not help you determine the relative total costs of owning different funds. The “Annualized Expense Ratio” represents the actual expenses for the last six months and may be different from the expense ratio in the Financial Highlights which is for the year ended December 31, 2013.
| | | | | | | | |
| | | Beginning
Account Value
07/01/13 | | Ending
Account Value
12/31/13 | | Annualized
Expense
Ratio | | Expenses
Paid During
Period* |
GAMCO International Growth Fund, Inc. |
Actual Fund Return |
Class AAA | | $1,000.00 | | $1,135.00 | | 2.12% | | $11.41 |
Class A | | $1,000.00 | | $1,134.50 | | 2.15% | | $11.57 |
Class C | | $1,000.00 | | $1,131.20 | | 2.88% | | $15.47 |
Class I | | $1,000.00 | | $1,136.40 | | 1.88% | | $10.12 |
Hypothetical 5% Return |
Class AAA | | $1,000.00 | | $1,014.52 | | 2.12% | | $10.76 |
Class A | | $1,000.00 | | $1,014.37 | | 2.15% | | $10.92 |
Class C | | $1,000.00 | | $1,010.69 | | 2.88% | | $14.60 |
Class I | | $1,000.00 | | $1,015.73 | | 1.88% | | $ 9.55 |
| * | Expenses are equal to the Fund’s annualized expense ratio for the last six months multiplied by the average account value over the period, multiplied by the number of days in the most recent fiscal half year (184 days), then divided by 365. |
4
Summary of Portfolio Holdings (Unaudited)
The following table presents portfolio holdings as a percent of net assets as of December 31, 2013:
GAMCO International Growth Fund, Inc.
| | | | |
Consumer Staples | | | 21.9 | % |
Consumer Discretionary | | | 21.7 | % |
Industrials | | | 13.3 | % |
Financials | | | 10.7 | % |
Health Care | | | 10.6 | % |
Materials | | | 10.3 | % |
| | | | |
Energy | | | 5.1 | % |
Information Technology | | | 5.0 | % |
Telecommunication Services | | | 1.0 | % |
Other Assets and Liabilities (Net) | | | 0.4 | % |
| | | | |
| | | 100.0 | % |
| | | | |
The Fund files a complete schedule of portfolio holdings with the Securities and Exchange Commission (the “SEC”) for the first and third quarters of each fiscal year on Form N-Q. Shareholders may obtain this information at www.gabelli.com or by calling the Fund at 800-GABELLI (800-422-3554).The Fund’s Form N-Q is available on the SEC’s website at www.sec.gov and may also be reviewed and copied at the SEC’s Public Reference Room in Washington, DC. Information on the operation of the Public Reference Room may be obtained by calling 800-SEC-0330.
Proxy Voting
The Fund files Form N-PX with its complete proxy voting record for the twelve months ended June 30, no later than August 31 of each year. A description of the Fund’s proxy voting policies, procedures, and how the Fund voted proxies relating to portfolio securities is available without charge, upon request, by (i) calling 800-GABELLI (800-422-3554); (ii) writing to The Gabelli Funds at One Corporate Center, Rye, NY 10580-1422; or (iii) visiting the SEC website at www.sec.gov.
5
|
| GAMCO International Growth Fund, Inc. |
Schedule of Investments — December 31, 2013 |
| | | | | | | | | | | | |
Shares | | | | | Cost | | | Market
Value | |
| | | | COMMON STOCKS — 99.5% | | | | | |
| | | | CONSUMER STAPLES — 21.9% | | | | | |
| | 8,000 | | | Associated British Foods plc | | $ | 243,639 | | | $ | 323,905 | |
| | 9,000 | | | British American Tobacco plc | | | 225,291 | | | | 482,579 | |
| | 7,000 | | | Chr Hansen Holding A/S | | | 257,599 | | | | 278,051 | |
| | 4,500 | | | Danone SA | | | 290,710 | | | | 323,896 | |
| | 29,700 | | | Diageo plc | | | 317,797 | | | | 983,639 | |
| | 3,000 | | | FamilyMart Co. Ltd. | | | 139,258 | | | | 136,882 | |
| | 5,800 | | | Heineken NV | | | 276,620 | | | | 391,614 | |
| | 2,500 | | | Henkel AG & Co. KGaA | | | 204,442 | | | | 260,146 | |
| | 18,300 | | | Japan Tobacco Inc. | | | 516,812 | | | | 594,302 | |
| | 3,000 | | | L’Oreal SA | | | 320,990 | | | | 527,033 | |
| | 10,600 | | | Nestlé SA | | | 534,539 | | | | 775,943 | |
| | 3,000 | | | Pernod Ricard SA | | | 97,551 | | | | 341,766 | |
| | 50,000 | | | Super Group Ltd./Singapore | | | 161,081 | | | | 150,561 | |
| | 7,000 | | | Toyo Suisan Kaisha Ltd. | | | 217,224 | | | | 210,046 | |
| | 8,800 | | | Unicharm Corp. | | | 402,151 | | | | 501,377 | |
| | 7,604 | | | Wesfarmers Ltd. | | | 258,602 | | | | 299,013 | |
| | | | | | | | | | | | |
| | | | TOTAL CONSUMER STAPLES | | | 4,464,306 | | | | 6,580,753 | |
| | | | | | | | | | | | |
| | | | CONSUMER DISCRETIONARY — 21.6% | | | | | |
| | 8,100 | | | Accor SA | | | 247,272 | | | | 382,212 | |
| | 3,500 | | | Christian Dior SA | | | 251,990 | | | | 661,336 | |
| | 11,500 | | | Compagnie Financiere Richemont SA | | | 195,732 | | | | 1,144,779 | |
| | 1,500 | | | Fast Retailing Co. Ltd. | | | 275,217 | | | | 618,175 | |
| | 104,000 | | | Genting Berhad | | | 346,327 | | | | 325,764 | |
| | 8,000 | | | Hennes & Mauritz AB, Cl. B | | | 235,022 | | | | 368,417 | |
| | 6,000 | | | Honda Motor Co. Ltd | | | 237,884 | | | | 246,700 | |
| | 4,000 | | | Liberty Global plc, Cl. C† | | | 278,001 | | | | 337,280 | |
| | 7,300 | | | Naspers Ltd., Cl. N | | | 363,607 | | | | 762,714 | |
| | 28,000 | | | Rakuten Inc. | | | 308,292 | | | | 415,839 | |
| | 6,300 | | | The Swatch Group AG | | | 363,151 | | | | 709,063 | |
| | 22,200 | | | WPP plc | | | 299,443 | | | | 507,319 | |
| | | | | | | | | | | | |
| | | | TOTAL CONSUMER DISCRETIONARY | | | 3,401,938 | | | | 6,479,598 | |
| | | | | | | | | | | | |
| | | | INDUSTRIALS — 13.3% | | | | | |
| | 30,624 | | | CNH Industrial NV† | | | 238,117 | | | | 347,582 | |
| | 18,000 | | | Experian plc | | | 236,276 | | | | 332,053 | |
| | 3,600 | | | FANUC Corp. | | | 365,783 | | | | 658,057 | |
| | 12,700 | | | Jardine Matheson Holdings Ltd. | | | 481,424 | | | | 664,337 | |
| | 20,500 | | | Komatsu Ltd. | | | 481,471 | | | | 415,996 | |
| | 25,000 | | | Mitsui & Co. Ltd. | | | 415,087 | | | | 347,783 | |
| | 11,000 | | | Nabtesco Corp. | | | 222,566 | | | | 253,300 | |
| | 2,900 | | | SMC Corp. | | | 388,386 | | | | 729,750 | |
| | 7,100 | | | The Weir Group plc | | | 200,533 | | | | 250,666 | |
| | | | | | | | | | | | |
| | | | TOTAL INDUSTRIALS | | | 3,029,643 | | | | 3,999,524 | |
| | | | | | | | | | | | |
| | | | FINANCIALS — 10.7% | | | | | |
| | 20,000 | | | Cheung Kong (Holdings) Ltd. | | | 233,061 | | | | 315,696 | |
| | 18,300 | | | Hang Seng Bank Ltd. | | | 233,915 | | | | 296,650 | |
| | 49,600 | | | Hong kong Land Holdings Ltd. | | | 256,675 | | | | 292,640 | |
| | | | | | | | | | | | |
Shares | | | | | Cost | | | Market
Value | |
| | 23,000 | | | Kinnevik Investment AB, Cl. B | | $ | 475,975 | | | $ | 1,065,277 | |
| | 30,000 | | | Mitsubishi UFJ Financial Group Inc. | | | 200,980 | | | | 197,702 | |
| | 9,200 | | | Schroders plc | | | 206,137 | | | | 395,800 | |
| | 6,500 | | | Standard Chartered plc | | | 164,011 | | | | 146,387 | |
| | 4,000 | | | Sumitomo Mitsui Financial Group Inc. | | | 194,962 | | | | 205,868 | |
| | 114,700 | | | Swire Properties Ltd. | | | 274,295 | | | | 289,919 | |
| | | | | | | | | | | | |
| | | | TOTAL FINANCIALS | | | 2,240,011 | | | | 3,205,939 | |
| | | | | | | | | | | | |
| | | | HEALTH CARE — 10.6% | | | | | |
| | 5,000 | | | Bayer AG | | | 322,323 | | | | 701,266 | |
| | 9,300 | | | Novartis AG | | | 441,363 | | | | 742,290 | |
| | 1,500 | | | Novo Nordisk A/S, Cl. B | | | 266,515 | | | | 274,953 | |
| | 4,100 | | | Roche Holding AG, Genusschein | | | 529,233 | | | | 1,145,362 | |
| | 23,400 | | | Smith & Nephew plc | | | 222,443 | | | | 333,632 | |
| | | | | | | | | | | | |
| | | | TOTAL HEALTH CARE | | | 1,781,877 | | | | 3,197,503 | |
| | | | | | | | | | | | |
| | | | MATERIALS — 10.3% | | | | | |
| | 6,850 | | | Agnico Eagle Mines Ltd. | | | 378,553 | | | | 180,703 | |
| | 1,300 | | | Air Liquide SA | | | 157,743 | | | | 183,849 | |
| | 13,110 | | | BHP Billiton plc | | | 422,723 | | | | 405,753 | |
| | 116,815 | | | Glencore Xstrata plc | | | 431,046 | | | | 604,889 | |
| | 13,700 | | | Newcrest Mining Ltd. | | | 478,527 | | | | 96,448 | |
| | 14,925 | | | Rio Tinto plc | | | 525,035 | | | | 842,664 | |
| | 6,000 | | | Shin-Etsu Chemical Co. Ltd. | | | 340,739 | | | | 349,824 | |
| | 1,075 | | | Syngenta AG | | | 335,425 | | | | 428,048 | |
| | | | | | | | | | | | |
| | | | TOTAL MATERIALS | | | 3,069,791 | | | | 3,092,178 | |
| | | | | | | | | | | | |
| | | | ENERGY — 5.1% | | | | | | | | |
| | 19,000 | | | BG Group plc | | | 402,986 | | | | 408,235 | |
| | 25,600 | | | BP plc | | | 188,543 | | | | 206,897 | |
| | 3,400 | | | Imperial Oil Ltd. | | | 142,111 | | | | 150,563 | |
| | 3,000 | | | Schlumberger Ltd. | | | 216,570 | | | | 270,330 | |
| | 10,100 | | | Statoil ASA, ADR | | | 257,093 | | | | 243,713 | |
| | 19,000 | | | Tullow Oil plc | | | 338,464 | | | | 269,010 | |
| | | | | | | | | | | | |
| | | | TOTAL ENERGY | | | 1,545,767 | | | | 1,548,748 | |
| | | | | | | | | | | | |
| | | | INFORMATION TECHNOLOGY — 5.0% | | | | | |
| | 6,100 | | | Canon Inc. | | | 242,995 | | | | 192,888 | |
| | 2,000 | | | Keyence Corp. | | | 313,998 | | | | 854,620 | |
| | 85,000 | | | Yahoo! Japan Corp. | | | 326,505 | | | | 472,177 | |
| | | | | | | | | | | | |
| | | | TOTAL INFORMATION TECHNOLOGY | | | 883,498 | | | | 1,519,685 | |
| | | | | | | | | | | | |
| | | | TELECOMMUNICATION SERVICES — 1.0% | | | | | |
| | 11,000 | | | Vivendi SA | | | 265,462 | | | | 289,868 | |
| | | | | | | | | | | | |
| | | | TOTAL COMMON STOCKS | | | 20,682,293 | | | | 29,913,796 | |
| | | | | | | | | | | | |
See accompanying notes to financial statements.
6
GAMCO International Growth Fund, Inc.
Schedule of Investments (Continued) — December 31, 2013
| | | | | | | | | | | | |
Shares | | | | | Cost | | | Market
Value | |
| | | | WARRANTS — 0.1% | | | | | | | | |
| | | | CONSUMER DISCRETIONARY — 0.1% | | | | | |
| | 26,000 | | | Genting Berhad, expire 12/18/18† | | $ | 12,000 | | | $ | 24,845 | |
| | | | | | | | | | | | |
| | | |
| | | | TOTAL INVESTMENTS — 99.6% | | $ | 20,694,293 | | | | 29,938,641 | |
| | | | | | | | | | | | |
| | | | Other Assets and Liabilities (Net) — 0.4% | | | | | | | 109,668 | |
| | | | | | | | | | | | |
| | | | NET ASSETS — 100.0%. | | | | | | $ | 30,048,309 | |
| | | | | | | | | | | | |
† Non-income producing security.
ADR American Depositary Receipt
| | | | | | | | |
Geographic Diversification | | %of
Market
Value | | | Market
Value | |
Europe | | | 60.4 | % | | $ | 18,079,891 | |
Japan | | | 24.7 | | | | 7,401,287 | |
Asia/Pacific | | | 9.2 | | | | 2,755,873 | |
North America | | | 3.1 | | | | 938,876 | |
South Africa | | | 2.6 | | | | 762,714 | |
| | | | | | | | |
| | | 100.0 | % | | $ | 29,938,641 | |
| | | | | | | | |
See accompanying notes to financial statements.
7
GAMCO International Growth Fund, Inc.
Statement of Assets and Liabilities
December 31, 2013
| | | | |
Assets: | | | | |
Investments, at value (cost $20,694,293) | | $ | 29,938,641 | |
Due from broker | | | 154,017 | |
Receivable for investments sold | | | 150,555 | |
Receivable for Fund shares sold | | | 1,734 | |
Dividends receivable | | | 74,998 | |
Prepaid expenses | | | 18,222 | |
| | | | |
Total Assets. | | | 30,338,167 | |
| | | | |
Liabilities: | | | | |
Payable to custodian | | | 153,668 | |
Payable for Fund shares redeemed | | | 10,559 | |
Payable for investment advisory fees | | | 24,811 | |
Payable for distribution fees | | | 5,894 | |
Payable for legal and audit fees | | | 36,660 | |
Line of credit payable | | | 25,000 | |
Payable for shareholder communications expenses | | | 14,887 | |
Other accrued expenses | | | 18,379 | |
| | | | |
Total Liabilities | | | 289,858 | |
| | | | |
Net Assets
(applicable to 1,302,097 shares outstanding) | | $ | 30,048,309 | |
| | | | |
Net Assets Consist of: | | | | |
Paid-in capital | | $ | 20,806,372 | |
Accumulated net investment loss | | | (63,353 | ) |
Accumulated net realized gain on investments and foreign currency transactions | | | 58,527 | |
Net unrealized appreciation on investments | | | 9,244,348 | |
Net unrealized appreciation on foreign currency translations | | | 2,415 | |
| | | | |
Net Assets | | $ | 30,048,309 | |
| | | | |
Shares of Capital Stock, each at $0.001 par value: | | | | |
Class AAA: | | | | |
Net Asset Value, offering, and redemption price per share ($25,897,437 ÷ 1,122,148 shares outstanding; 375,000,000 shares authorized) | | $ | 23.08 | |
| | | | |
Class A: | | | | |
Net Asset Value and redemption price per share ($775,430 ÷ 32,993 shares outstanding; 250,000,000 shares authorized) | | $ | 23.50 | |
| | | | |
Maximum offering price per share (NAV ÷ 0.9425, based on maximum sales charge of 5.75% of the offering price) | | $ | 24.93 | |
| | | | |
Class C: | | | | |
Net Asset Value and offering price per share ($442,229 ÷ 20,526 shares outstanding; 125,000,000 shares authorized) | | $ | 21.55 | (a) |
| | | | |
Class I: | | | | |
Net Asset Value, offering, and redemption price per share ($2,933,213 ÷ 126,430 shares outstanding; 125,000,000 shares authorized) | | $ | 23.20 | |
| | | | |
| (a) | Redemption price varies based on the length of time held. Total amounts may differ due to rounding. |
Statement of Operations
For the Year Ended December 31, 2013
| | | | |
Investment Income: | | | | |
Dividends (net of foreign withholding taxes of $24,534) | | $ | 624,122 | |
Interest | | | 286 | |
| | | | |
Total Investment Income | | | 624,408 | |
| | | | |
Expenses: | | | | |
Investment advisory fees | | | 291,265 | |
Distribution fees - Class AAA | | | 64,111 | |
Distribution fees - Class A | | | 1,591 | |
Distribution fees - Class C | | | 4,615 | |
Custodian fees | | | 56,542 | |
Legal and audit fees | | | 54,780 | |
Shareholder communications expenses | | | 50,097 | |
Registration expenses | | | 46,571 | |
Shareholder services fees | | | 17,218 | |
Directors’ fees | | | 17,000 | |
Interest expense | | | 1,979 | |
Miscellaneous expenses | | | 43,334 | |
| | | | |
Total Expenses | | | 649,103 | |
| | | | |
Less: | | | | |
Custodian fee credits | | | (252 | ) |
| | | | |
Net Expenses | | | 648,851 | |
| | | | |
Net Investment Loss | | | (24,443 | ) |
| | | | |
Net Realized and Unrealized Gain/(Loss) on Investments and Foreign Currency: | | | | |
Net realized gain on investments | | | 1,633,060 | |
Net realized loss on foreign currency transactions | | | (29,918 | ) |
| | | | |
Net realized gain on investments and foreign currency transactions | | | 1,603,142 | |
| | | | |
Net change in unrealized appreciation/depreciation: | | | | |
on investments | | | 1,712,470 | |
on foreign currency translations | | | 2,461 | |
| | | | |
Net change in unrealized appreciation/depreciation on investments and foreign currency translations | | | 1,714,931 | |
| | | | |
Net Realized and Unrealized Gain/(Loss) on Investments and Foreign Currency | | | 3,318,073 | |
| | | | |
Net Increase in Net Assets Resulting from Operations | | $ | 3,293,630 | |
| | | | |
See accompanying notes to financial statements.
8
GAMCO International Growth Fund, Inc.
Statement of Changes in Net Assets
| | | | | | | | |
| | | Year Ended
December 31, 2013 | | | Year Ended
December 31, 2012 | |
Operations: | | | | | | | | |
Net investment income/(loss) | | $ | (24,443 | ) | | $ | 253,151 | |
Net realized gain on investments and foreign currency transactions | | | 1,603,142 | | | | 2,212,256 | |
Net change in unrealized appreciation on investments and foreign currency translations | | | 1,714,931 | | | | 2,652,638 | |
| | | | | | | | |
Net Increase in Net Assets Resulting from Operations | | | 3,293,630 | | | | 5,118,045 | |
| | | | | | | | |
| | |
Distributions to Shareholders: | | | | | | | | |
Net investment income | | | | | | | | |
Class AAA | | | — | | | | (217,763 | ) |
Class A | | | — | | | | (4,113 | ) |
Class C | | | — | | | | (2,099 | ) |
Class I | | | — | | | | (25,380 | ) |
| | | | | | | | |
| | | — | | | | (249,355 | ) |
| | | | | | | | |
| | |
Net realized gain | | | | | | | | |
Class AAA | | | (1,263,009 | ) | | | (1,925,164 | ) |
Class A | | | (37,198 | ) | | | (33,554 | ) |
Class C | | | (22,901 | ) | | | (32,734 | ) |
Class I | | | (138,295 | ) | | | (160,001 | ) |
| | | | | | | | |
| | | (1,461,403 | ) | | | (2,151,453 | ) |
| | | | | | | | |
Total Distributions to Shareholders | | | (1,461,403 | ) | | | (2,400,808 | ) |
| | | | | | | | |
| | |
Capital Share Transactions: | | | | | | | | |
Class AAA | | | (2,469,626 | ) | | | (16,023,088 | ) |
Class A | | | 262,829 | | | | 106,008 | |
Class C | | | (17,123 | ) | | | 252,135 | |
Class I | | | 525,434 | | | | 767,528 | |
| | | | | | | | |
Net Decrease in Net Assets from Capital Share Transactions | | | (1,698,486 | ) | | | (14,897,417 | ) |
| | | | | | | | |
| | |
Redemption Fees | | | — | | | | 554 | |
| | | | | | | | |
Net Increase/Decrease in Net Assets | | | 133,741 | | | | (12,179,626 | ) |
Net Assets: | | | | | | | | |
Beginning of year | | | 29,914,568 | | | | 42,094,194 | |
| | | | | | | | |
End of year (including undistributed net investment income of $0 and $0, respectively) | | $ | 30,048,309 | | | $ | 29,914,568 | |
| | | | | | | | |
See accompanying notes to financial statements.
9
GAMCO International Growth Fund, Inc.
Financial Highlights
Selected data for a share of capital stock outstanding throughout each year:
| | | | | | | | | | | | | | | | | | | | | | | | | | | | | | | | | | | | | | | | | | | | | | | | | | | | | | | | | | | | |
| | | | | | Income (Loss)
from Investment Operations | | | Distributions | | | | | | | | | | | | | | | Ratios to Average
Net Assets/
Supplemental Data | |
Year Ended
December 31 | | Net Asset
Value,
Beginning
of Year | | | Net
Investment
Income
(Loss)(a) | | | Net
Realized
and
Unrealized
Gain
(Loss) on
Investments | | | Total from
Investment
Operations | | | Net
Investment
Income | | | Net
Realized
Gain on
Investments | | | Return
of
Capital | | | Total
Distributions | | | Redemption
Fees
(a)(b) | | | Net
Asset
Value,
End of
Year | | | Total
Return† | | | Net
Assets
End of
Year (in
000’s) | | | Net
Investment
Income
(Loss) | | | Operating
Expenses | | | Portfolio
Turnover
Rate | |
Class AAA | | | | | | | | | | | | | | | | | | | | | | | | | | | | | | | | | | | | | | | | | | | | | | | | | | | | | | | | | | | | |
2013 | | $ | 21.66 | | | $ | (0.02 | ) | | $ | 2.62 | | | $ | 2.60 | | | | — | | | $ | (1.18 | ) | | | — | | | $ | (1.18 | ) | | | — | | | $ | 23.08 | | | | 12.1 | % | | $ | 25,898 | | | | (0.09 | )% | | | 2.24 | % | | | 13 | % |
2012 | | | 20.05 | | | | 0.15 | | | | 3.32 | | | | 3.47 | | | $ | (0.19 | ) | | | (1.67 | ) | | | — | | | | (1.86 | ) | | $ | 0.00 | | | | 21.66 | | | | 17.4 | | | | 26,740 | | | | 0.68 | | | | 2.14 | | | | 15 | |
2011 | | | 22.59 | | | | (0.03 | ) | | | (2.22 | ) | | | (2.25 | ) | | | (0.02 | ) | | | (0.26 | ) | | $ | (0.01 | ) | | | (0.29 | ) | | | 0.00 | | | | 20.05 | | | | 10.0 | | | | 40,182 | | | | (0.12 | ) | | | 2.10 | | | | 12 | |
2010 | | | 19.39 | | | | (0.06 | ) | | | 3.78 | | | | 3.72 | | | | — | | | | (0.52 | ) | | | — | | | | (0.52 | ) | | | — | | | | 22.59 | | | | 19.2 | | | | 29,666 | | | | (0.30 | ) | | | 2.38 | | | | 14 | |
2009 | | | 14.12 | | | | 0.03 | | | | 5.34 | | | | 5.37 | | | | (0.09 | ) | | | — | | | | (0.01 | ) | | | (0.10 | ) | | | 0.00 | | | | 19.39 | | | | 38.0 | | | | 27,628 | | | | 0.17 | | | | 2.44 | | | | 13 | |
Class A | | | | | | | | | | | | | | | | | | | | | | | | | | | | | | | | | | | | | | | | | | | | | | | | | | | | | | | | | | | | |
2013 | | $ | 22.04 | | | $ | (0.04 | ) | | $ | 2.68 | | | $ | 2.64 | | | | — | | | $ | (1.18 | ) | | | — | | | $ | (1.18 | ) | | | — | | | $ | 23.50 | | | | 12.1 | % | | $ | 775 | | | | (0.17 | )% | | | 2.24 | % | | | 13 | % |
2012 | | | 20.37 | | | | 0.11 | | | | 3.43 | | | | 3.54 | | | $ | (0.20 | ) | | | (1.67 | ) | | | — | | | | (1.87 | ) | | $ | 0.00 | | | | 22.04 | | | | 17.5 | | | | 473 | | | | 0.50 | | | | 2.14 | | | | 15 | |
2011 | | | 22.93 | | | | (0.02 | ) | | | (2.26 | ) | | | (2.28 | ) | | | (0.02 | ) | | | (0.26 | ) | | $ | (0.00 | )(b) | | | (0.28 | ) | | | 0.00 | | | | 20.37 | | | | (9.9 | ) | | | 334 | | | | (0.10 | ) | | | 2.10 | | | | 12 | |
2010 | | | 19.68 | | | | (0.06 | ) | | | 3.83 | | | | 3.77 | | | | — | | | | (0.52 | ) | | | — | | | | (0.52 | ) | | | — | | | | 22.93 | | | | 19.1 | | | | 282 | | | | (0.30 | ) | | | 2.38 | | | | 14 | |
2009 | | | 14.33 | | | | 0.02 | | | | 5.43 | | | | 5.45 | | | | (0.09 | ) | | | — | | | | (0.01 | ) | | | (0.10 | ) | | | 0.00 | | | | 19.68 | | | | 38.1 | | | | 241 | | | | 0.10 | | | | 2.44 | | | | 13 | |
Class C | | | | | | | | | | | | | | | | | | | | | | | | | | | | | | | | | | | | | | | | | | | | | | | | | | | | | | | | | | | | |
2013 | | $ | 20.44 | | | $ | (0.17 | ) | | $ | 2.46 | | | $ | 2.29 | | | | — | | | $ | (1.18 | ) | | | — | | | $ | (1.18 | ) | | | — | | | $ | 21.55 | | | | 11.3 | % | | $ | 442 | | | | (0.82 | )% | | | 2.99 | % | | | 13 | % |
2012 | | | 19.07 | | | | (0.05 | ) | | | 3.20 | | | | 3.15 | | | $ | (0.11 | ) | | | (1.67 | ) | | | — | | | | (1.78 | ) | | $ | 0.00 | | | | 20.44 | | | | 16.6 | | | | 435 | | | | (0.23 | ) | | | 2.89 | | | | 15 | |
2011 | | | 21.63 | | | | (0.22 | ) | | | (2.08 | ) | | | (2.30 | ) | | | — | | | | (0.26 | ) | | | — | | | | (0.26 | ) | | | 0.00 | | | | 19.07 | | | | (10.6 | ) | | | 173 | | | | (1.10 | ) | | | 2.85 | | | | 12 | |
2010 | | | 18.73 | | | | (0.21 | ) | | | 3.63 | | | | 3.42 | | | | — | | | | (0.52 | ) | | | — | | | | (0.52 | ) | | | — | | | | 21.63 | | | | 18.2 | | | | 27 | | | | (1.08 | ) | | | 3.13 | | | | 14 | |
2009 | | | 13.67 | | | | (0.08 | ) | | | 5.14 | | | | 5.06 | | | | — | | | | — | | | | — | | | | — | | | | 0.00 | | | | 18.73 | | | | 37.0 | | | | 16 | | | | (0.50 | ) | | | 3.19 | | | | 13 | |
Class I | | | | | | | | | | | | | | | | | | | | | | | | | | | | | | | | | | | | | | | | | | | | | | | | | | | | | | | | | | | | |
2013 | | $ | 21.71 | | | $ | 0.03 | | | $ | 2.64 | | | $ | 2.67 | | | | — | | | $ | (1.18 | ) | | | — | | | $ | (1.18 | ) | | | — | | | $ | 23.20 | | | | 12.4 | % | | $ | 2,933 | | | | 0.13 | % | | | 1.99 | % | | | 13 | % |
2012 | | | 20.10 | | | | 0.17 | | | | 3.37 | | | | 3.54 | | | $ | (0.26 | ) | | | (1.67 | ) | | | — | | | | (1.93 | ) | | $ | 0.00 | | | | 21.71 | | | | 17.7 | | | | 2,267 | | | | 0.77 | | | | 1.89 | | | | 15 | |
2011 | | | 22.62 | | | | 0.05 | | | | (2.24 | ) | | | (2.19 | ) | | | (0.05 | ) | | | (0.26 | ) | | $ | (0.02 | ) | | | (0.33 | ) | | | 0.00 | | | | 20.10 | | | | (9.7 | ) | | | 1,405 | | | | 0.23 | | | | 1.85 | | | | 12 | |
2010 | | | 19.37 | | | | (0.01 | ) | | | 3.78 | | | | 3.77 | | | | — | | | | (0.52 | ) | | | — | | | | (0.52 | ) | | | — | | | | 22.62 | | | | 19.4 | | | | 1,508 | | | | (0.07 | ) | | | 2.13 | | | | 14 | |
2009 | | | 14.10 | | | | 0.07 | | | | 5.34 | | | | 5.41 | | | | (0.13 | ) | | | — | | | | (0.01 | ) | | | (0.14 | ) | | | 0.00 | | | | 19.37 | | | | 38.4 | | | | 1,167 | | | | 0.46 | | | | 2.19 | | | | 13 | |
| | † | Total return represents aggregate total return of a hypothetical $1,000 investment at the beginning of the year and sold at the end of the year including reinvestment of distributions and does not reflect applicable sales charges. |
(a) Per share amounts have been calculated using the average shares outstanding method.
(b) Amount represents less than $0.005 per share.
See accompanying notes to financial statements.
10
GAMCO International Growth Fund, Inc.
Notes to Financial Statements
1. Organization. GAMCO International Growth Fund, Inc. was incorporated on May 25, 1994 in Maryland. The Fund is a diversified open-end management investment company registered under the Investment Company Act of 1940, as amended (the “1940 Act”). The Fund’s primary objective is long term capital appreciation. The Fund commenced investment operations on June 30, 1995.
2. Significant Accounting Policies. The Fund’s financial statements are prepared in accordance with U.S. Generally Accepted Accounting Principles (“GAAP”), which may require the use of management estimates and assumptions. Actual results could differ from those estimates. The following is a summary of significant accounting policies followed by the Fund in the preparation of its financial statements.
Security Valuation. Portfolio securities listed or traded on a nationally recognized securities exchange or traded in the U.S. over-the-counter market for which market quotations are readily available are valued at the last quoted sale price or a market’s official closing price as of the close of business on the day the securities are being valued. If there were no sales that day, the security is valued at the average of the closing bid and asked prices or, if there were no asked prices quoted on that day, then the security is valued at the closing bid price on that day. If no bid or asked prices are quoted on such day, the security is valued at the most recently available price or, if the Board of Directors (the “Board”) so determines, by such other method as the Board shall determine in good faith to reflect its fair market value. Portfolio securities traded on more than one national securities exchange or market are valued according to the broadest and most representative market, as determined by Gabelli Funds, LLC (the “Adviser”).
Portfolio securities primarily traded on a foreign market are generally valued at the preceding closing values of such securities on the relevant market, but may be fair valued pursuant to procedures established by the Board if market conditions change significantly after the close of the foreign market, but prior to the close of business on the day the securities are being valued. Debt instruments with remaining maturities of sixty days or less that are not credit impaired are valued at amortized cost, unless the Board determines such amount does not reflect the securities’ fair value, in which case these securities will be fair valued as determined by the Board. Debt instruments having a maturity greater than sixty days for which market quotations are readily available are valued at the average of the latest bid and asked prices. If there were no asked prices quoted on such day, the security is valued using the closing bid price. U.S. government obligations with maturities greater than sixty days are normally valued using a model that incorporates market observable data such as reported sales of similar securities, broker quotes, yields, bids, offers, and reference data. Certain securities are valued principally using dealer quotations.
Securities and assets for which market quotations are not readily available are fair valued as determined by the Board. Fair valuation methodologies and procedures may include, but are not limited to: analysis and review of available financial and non-financial information about the company; comparisons with the valuation and changes in valuation of similar securities, including a comparison of foreign securities with the equivalent U.S. dollar value American Depositary Receipt securities at the close of the U.S. exchange; and evaluation of any other information that could be indicative of the value of the security.
The Fund employs a fair value model to adjust prices to reflect events affecting the values of certain portfolio securities, which occur between the close of trading on the principal market for such securities (foreign exchanges
11
GAMCO International Growth Fund, Inc.
Notes to Financial Statements (Continued)
and over-the-counter markets) at the time when net asset values of the Fund are determined. If the Fund’s valuation committee believes that a particular event would materially affect net asset value, further adjustment is considered.
Accounting Standards Update (“ASU”) No. 2011-11 (as clarified by ASU No. 2013-01) “Disclosures about Offsetting Assets and Liabilities” requires a fund to disclose both gross information and net information about both instruments and transactions eligible for offset in the statement of assets and liabilities and instruments and transactions subject to an agreement similar to a master netting arrangement. The scope of ASU 2011-11 includes derivatives and sale and repurchase agreements. The purpose of ASU 2011-11 is to facilitate comparison of financial statements prepared on the basis of GAAP and on the basis of International Financial Reporting Standards. Management is continually evaluating the implications of ASU 2011-11 and its impact on the financial statements and, at this time, has concluded that ASU 2011-11 is not applicable to the Fund because the Fund does not have investments covered under this guidance.
The inputs and valuation techniques used to measure fair value of the Fund’s investments are summarized into three levels as described in the hierarchy below:
| | • | | Level 1 – quoted prices in active markets for identical securities; |
| | • | | Level 2 – other significant observable inputs (including quoted prices for similar securities, interest rates, prepayment speeds, credit risk, etc.); and |
| | • | | Level 3 – significant unobservable inputs (including the Board’s determinations as to the fair value of investments). |
A financial instrument’s level within the fair value hierarchy is based on the lowest level of any input both individually and in the aggregate that is significant to the fair value measurement. The inputs or methodology used for valuing securities are not necessarily an indication of the risk associated with investing in those securities. The summary of the Fund’s investments in securities by inputs used to value the Fund’s investments as of December 31, 2013 is as follows:
| | | | | | | | | | | | |
| | | Valuation Inputs | | | | |
| | | Level 1
Quoted Prices | | | Level 2 Other Significant
Observable Inputs | | | Total Market Value
at 12/31/13 | |
INVESTMENTS IN SECURITIES: | | | | | | | | | | | | |
ASSETS (Market Value): | | | | | | | | | | | | |
Common Stocks: | | | | | | | | | | | | |
Materials | | | $2,995,730 | | | | $96,448 | | | | $3,092,178 | |
Other Industries (a) | | | 26,821,618 | | | | — | | | | 26,821,618 | |
| |
Total Common Stocks | | | 29,817,348 | | | | 96,448 | | | | 29,913,796 | |
| |
Warrants | | | 24,845 | | | | — | | | | 24,845 | |
| |
TOTAL INVESTMENTS IN SECURITIES – ASSETS | | | $29,842,193 | | | | $96,448 | | | | $29,938,641 | |
| |
| (a) | Please refer to the Schedule of Investments for the industry classifications of these portfolio holdings. |
During the year ended December 31, 2013, foreign common stock was transferred from Level 2 to Level 1 due to the application, at December 31, 2012, of fair value procedures resulting from volatility in U.S. markets after the close of the foreign markets. The beginning of period value of the securities that transferred from Level 2 to Level 1 during the period amounted to $22,498,466 or 75% of total net assets as of December 31, 2012. The Fund’s policy is to recognize transfers among Levels as of the beginning of the reporting period.
12
GAMCO International Growth Fund, Inc.
Notes to Financial Statements (Continued)
There were no Level 3 investments held at December 31, 2013 or 2012.
Additional Information to Evaluate Qualitative Information.
General. The Fund uses recognized industry pricing services – approved by the Board and unaffiliated with the Adviser – to value most of its securities, and uses broker quotes provided by market makers of securities not valued by these and other recognized pricing sources. Several different pricing feeds are received to value domestic equity securities, international equity securities, preferred equity securities, and fixed income securities. The data within these feeds is ultimately sourced from major stock exchanges and trading systems where these securities trade. The prices supplied by external sources are checked by obtaining quotations or actual transaction prices from market participants. If a price obtained from the pricing source is deemed unreliable, prices will be sought from another pricing service or from a broker/dealer that trades that security or similar securities.
Fair Valuation. Fair valued securities may be common and preferred equities, warrants, options, rights, and fixed income obligations. Where appropriate, Level 3 securities are those for which market quotations are not available, such as securities not traded for several days, or for which current bids are not available, or which are restricted as to transfer. Among the factors to be considered to fair value a security are recent prices of comparable securities that are publicly traded, reliable prices of securities not publicly traded, the use of valuation models, current analyst reports, valuing the income or cash flow of the issuer, or cost if the preceding factors do not apply. The circumstances of Level 3 securities are frequently monitored to determine if fair valuation measures continue to apply.
The Adviser reports quarterly to the Board the results of the application of fair valuation policies and procedures. These include back testing the prices realized in subsequent trades of these fair valued securities to fair values previously recognized.
Foreign Currency Translations. The books and records of the Fund are maintained in U.S. dollars. Foreign currencies, investments, and other assets and liabilities are translated into U.S. dollars at current exchange rates. Purchases and sales of investment securities, income, and expenses are translated at the exchange rate prevailing on the respective dates of such transactions. Unrealized gains and losses that result from changes in foreign exchange rates and/or changes in market prices of securities have been included in unrealized appreciation/depreciation on investments and foreign currency translations. Net realized foreign currency gains and losses resulting from changes in exchange rates include foreign currency gains and losses between trade date and settlement date on investment securities transactions, foreign currency transactions, and the difference between the amounts of interest and dividends recorded on the books of the Fund and the amounts actually received. The portion of foreign currency gains and losses related to fluctuation in exchange rates between the initial purchase trade date and subsequent sale trade date is included in realized gain/(loss) on investments.
Foreign Securities. The Fund may directly purchase securities of foreign issuers. Investing in securities of foreign issuers involves special risks not typically associated with investing in securities of U.S. issuers. The risks include possible revaluation of currencies, the inability to repatriate funds, less complete financial information about companies, and possible future adverse political and economic developments. Moreover, securities of many foreign issuers and their markets may be less liquid and their prices more volatile than those of securities of comparable U.S. issuers.
13
GAMCO International Growth Fund, Inc.
Notes to Financial Statements (Continued)
Foreign Taxes. The Fund may be subject to foreign taxes on income, gains on investments, or currency repatriation, a portion of which may be recoverable. The Fund will accrue such taxes and recoveries as applicable, based upon its current interpretation of tax rules and regulations that exist in the markets in which it invests.
Securities Transactions and Investment Income. Securities transactions are accounted for on the trade date with realized gain/(loss) on investments determined by using the identified cost method. Interest income (including amortization of premium and accretion of discount) is recorded on the accrual basis. Premiums and discounts on debt securities are amortized using the effective yield to maturity method. Dividend income is recorded on the ex-dividend date, except for certain dividends from foreign securities that are recorded as soon after the ex-dividend date as the Fund becomes aware of such dividends.
Determination of Net Asset Value and Calculation of Expenses. Certain administrative expenses are common to, and allocated among, various affiliated funds. Such allocations are made on the basis of each fund’s average net assets or other criteria directly affecting the expenses as determined by the Adviser pursuant to procedures established by the Board.
In calculating NAV per share of each class, investment income, realized and unrealized gains and losses, redemption fees, and expenses other than class specific expenses are allocated daily to each class of shares based upon the proportion of net assets of each class at the beginning of each day. Distribution expenses are borne solely by the class incurring the expense.
Custodian Fee Credits. When cash balances are maintained in the custody account, the Fund receives credits which are used to offset custodian fees. The gross expenses paid under the custody arrangement are included in custodian fees in the Statement of Operations with the corresponding expense offset, if any, shown as “Custodian fee credits.”
Distributions to Shareholders. Distributions to shareholders are recorded on the ex-dividend date. Distributions to shareholders are based on income and capital gains as determined in accordance with federal income tax regulations, which may differ from income and capital gains as determined under GAAP. These differences are primarily due to differing treatments of income and gains on various investment securities and foreign currency transactions held by the Fund, timing differences, and differing characterizations of distributions made by the Fund. Distributions from net investment income for federal income tax purposes include net realized gains on foreign currency transactions. These book/tax differences are either temporary or permanent in nature. To the extent these differences are permanent, adjustments are made to the appropriate capital accounts in the period when the differences arise. Permanent differences were primarily due to the tax treatment of currency gains and losses and reclassifications of gains on investments in passive foreign investment companies. These reclassifications have no impact on the NAV of the Fund. For the year ended December 31, 2013, reclassifications were made to decrease accumulated net investment loss by $87,791 and decrease accumulated net realized gain on investments and foreign currency transactions by $87,791.
14
GAMCO International Growth Fund, Inc.
Notes to Financial Statements (Continued)
The tax character of distributions paid during the years ended December 31, 2013 and 2012 was as follows:
| | | | | | | | | | |
| | | Year Ended
December 31, 2013 | | Year Ended
December 31, 2012 |
Distributions paid from: | | | | | | | | | | |
Ordinary income (inclusive of short term capital gains) | | | $ | 94,418 | | | | $ | 354,965 | |
Net long term capital gains | | | | 1,366,985 | | | | | 2,045,843 | |
| | | | | | | | | | |
Total distributions paid | | | $ | 1,461,403 | | | | $ | 2,400,808 | |
| | | | | | | | | | |
Provision for Income Taxes. The Fund intends to continue to qualify as a regulated investment company under Subchapter M of the Internal Revenue Code of 1986, as amended (the “Code”). It is the policy of the Fund to comply with the requirements of the Code applicable to regulated investment companies and to distribute substantially all of its net investment company taxable income and net capital gains. Therefore, no provision for federal income taxes is required.
As of December 31, 2013, the components of accumulated earnings/losses on a tax basis were as follows:
| | | | |
Undistributed long term capital gains | | $ | 58,682 | |
Net unrealized appreciation on investments and foreign currency translations | | | 9,183,255 | |
| | | | |
Total | | $ | 9,241,937 | |
| | | | |
Under the Regulated Investment Company Modernization Act of 2010, the Fund is permitted to carry forward for an unlimited period capital losses incurred. As a result of the rule, post-enactment capital losses that are carried forward will retain their character as either short term or long term capital losses rather than being considered all short term as under previous law.
At December 31, 2013, the temporary differences between book basis and tax basis net unrealized appreciation were primarily due to mark-to-market adjustments on investments in passive foreign investment companies.
The following summarizes the tax cost of investments and the related net unrealized appreciation at December 31, 2013:
| | | | | | | | |
| | | Cost | | Gross
Unrealized
Appreciation | | Gross
Unrealized
Depreciation | | Net
Unrealized
Appreciation |
Investments | | $20,757,801 | | $10,168,505 | | $(987,665) | | $9,180,840 |
The Fund is required to evaluate tax positions taken or expected to be taken in the course of preparing the Fund’s tax returns to determine whether the tax positions are “more-likely-than-not” of being sustained by the applicable tax authority. Income tax and related interest and penalties would be recognized by the Fund as tax expense in the Statement of Operations if the tax positions were deemed not to meet the more-likely-than-not threshold. For the year ended December 31, 2013, the Fund did not incur any income tax, interest, or penalties. As of December 31, 2013, the Adviser has reviewed all open tax years and concluded that there was no impact to the Fund’s net assets or results of operations. Tax years ended December 31, 2010 through December 31, 2013 remain subject to examination by the Internal Revenue Service and state taxing authorities. On an ongoing basis, the Adviser will monitor the Fund’s tax positions to determine if adjustments to this conclusion are necessary.
3. Investment Advisory Agreement and Other Transactions. The Fund has entered into an investment advisory agreement (the “Advisory Agreement”) with the Adviser which provides that the Fund will pay the
15
GAMCO International Growth Fund, Inc.
Notes to Financial Statements (Continued)
Adviser a fee, computed daily and paid monthly, at the annual rate of 1.00% of the value of its average daily net assets. In accordance with the Advisory Agreement, the Adviser provides a continuous investment program for the Fund’s portfolio, oversees the administration of all aspects of the Fund’s business and affairs, and pays the compensation of all Officers and Directors of the Fund who are affiliated persons of the Adviser.
The Fund pays each Director who is not considered to be an affiliated person an annual retainer of $1,000 plus $500 for each Board meeting attended and they are reimbursed for any out of pocket expenses incurred in attending meetings. All Board committee members receive $500 per meeting attended. The Chairman of the Audit Committee and the Lead Director each receive an annual fee of $1,000. A Director may receive a single meeting fee, allocated among the participating funds, for attending certain meetings held on behalf of multiple funds. Directors who are directors or employees of the Adviser or an affiliated company receive no compensation or expense reimbursement from the Fund.
4. Distribution Plan. The Fund’s Board has adopted a distribution plan (the “Plan”) for each class of shares, except for Class I Shares, pursuant to Rule 12b-1 under the 1940 Act. Under the Class AAA, Class A, and Class C Share Plans, payments are authorized to G.distributors, LLC (the “Distributor”), an affiliate of the Fund, at annual rates of 0.25%, 0.25%, and 1.00%, respectively, of the average daily net assets of those classes, the annual limitations under each Plan. Such payments are accrued daily and paid monthly.
5. Portfolio Securities. Purchases and sales of securities during the year ended December 31, 2013, other than short term securities and U.S. Government obligations, aggregated $3,633,565 and $7,054,296, respectively.
6. Transactions with Affiliates. During the year ended December 31, 2013, the Distributor retained a total of $1,089 from investors representing commissions (sales charges and underwriting fees) on sales and redemptions of Fund shares.
7. Line of Credit. The Fund participates in an unsecured line of credit of up to $75,000,000 under which it may borrow up to 10% of its net assets from the custodian for temporary borrowing purposes. Borrowings under this arrangement bear interest at the higher of the sum of the overnight LIBOR rate plus 100 basis points or the sum of the federal funds rate plus 100 basis points at the time of borrowing. This amount, if any, would be included in “interest expense” in the Statement of Operations. At December 31, 2013, borrowings of $25,000 were outstanding under the line of credit.
The average daily amount of borrowings outstanding under the line of credit during the year ended December 31, 2013 was $71,332, with a weighted average interest rate of 1.16%. The maximum amount borrowed at any time during the year was $1,048,000.
8. Capital Stock. The Fund offers four classes of shares – Class AAA Shares, Class A Shares, Class C Shares, and Class I Shares. Class AAA Shares are offered without a sales charge only to investors who acquire them directly from the Distributor, through selected broker/dealers, or the transfer agent. Class I Shares are offered without a sales charge, solely to certain institutions, directly through the Distributor or brokers that have entered into selling agreements specifically with respect to Class I Shares. Class A Shares are subject to a maximum front-end sales charge of 5.75%. Class C Shares are subject to a 1.00% contingent deferred sales charge for one year after purchase.
16
GAMCO International Growth Fund, Inc.
Notes to Financial Statements (Continued)
The Fund imposes a redemption fee of 2.00% on all classes of shares that are redeemed or exchanged on or before the seventh day after the date of a purchase. The redemption fee is deducted from the proceeds otherwise payable to the redeeming shareholders and is retained by the Fund as an increase in paid-in capital. The redemption fees retained by the Fund during the years ended December 31, 2013 and 2012 amounted to $0 and $554, respectively.
Transactions in shares of capital stock were as follows:
| | | | | | | | | | | | | | | | |
| | | Year Ended
December 31, 2013 | | | Year Ended
December 31, 2012 | |
| | | Shares | | | Amount | | | Shares | | | Amount | |
Class AAA | | | | | | | | | | | | | | | | |
Shares sold | | | 60,526 | | | $ | 1,370,162 | | | | 213,199 | | | $ | 4,584,915 | |
Shares issued upon reinvestment of distributions | | | 50,402 | | | | 1,143,111 | | | | 90,974 | | | | 1,959,581 | |
Shares redeemed | | | (223,445 | ) | | | (4,982,899 | ) | | | (1,073,284 | ) | | | (22,567,584 | ) |
| | | | | | | | | | | | | | | | |
Net decrease | | | (112,517 | ) | | $ | (2,469,626 | ) | | | (769,111 | ) | | $ | (16,023,088 | ) |
| | | | | | | | | | | | | | | | |
Class A | | | | | | | | | | | | | | | | |
Shares sold | | | 14,359 | | | $ | 328,341 | | | | 10,321 | | | $ | 230,331 | |
Shares issued upon reinvestment of distributions | | | 1,055 | | | | 24,367 | | | | 1,306 | | | | 28,619 | |
Shares redeemed | | | (3,901 | ) | | | (89,879 | ) | | | (6,569 | ) | | | (152,942 | ) |
| | | | | | | | | | | | | | | | |
Net increase | | | 11,513 | | | $ | 262,829 | | | | 5,058 | | | $ | 106,008 | |
| | | | | | | | | | | | | | | | |
Class C | | | | | | | | | | | | | | | | |
Shares sold | | | 4,491 | | | $ | 94,878 | | | | 11,838 | | | $ | 243,834 | |
Shares issued upon reinvestment of distributions | | | 746 | | | | 15,787 | | | | 1,226 | | | | 24,942 | |
Shares redeemed | | | (6,005 | ) | | | (127,788 | ) | | | (837 | ) | | | (16,641 | ) |
| | | | | | | | | | | | | | | | |
Net increase/(decrease) | | | (768 | ) | | $ | (17,123 | ) | | | 12,227 | | | $ | 252,135 | |
| | | | | | | | | | | | | | | | |
Class I | | | | | | | | | | | | | | | | |
Shares sold | | | 37,836 | | | $ | 875,581 | | | | 27,691 | | | $ | 620,830 | |
Shares issued upon reinvestment of distributions | | | 5,970 | | | | 136,127 | | | | 8,455 | | | | 182,545 | |
Shares redeemed | | | (21,759 | ) | | | (486,274 | ) | | | (1,662 | ) | | | (35,847 | ) |
| | | | | | | | | | | | | | | | |
Net increase | | | 22,047 | | | $ | 525,434 | | | | 34,484 | | | $ | 767,528 | |
| | | | | | | | | | | | | | | | |
9. Indemnifications. The Fund enters into contracts that contain a variety of indemnifications. The Fund’s maximum exposure under these arrangements is unknown. However, the Fund has not had prior claims or losses pursuant to these contracts. Management has reviewed the Fund’s existing contracts and expects the risk of loss to be remote.
10. Other Matters. On April 24, 2008, the Adviser entered into a settlement with the SEC to resolve an inquiry regarding prior frequent trading in shares of the GAMCO Global Growth Fund (the “Global Growth Fund”) by one investor who was banned from the Global Growth Fund in August 2002. Under the terms of the settlement, the Adviser, without admitting or denying the SEC’s findings and allegations, paid $16 million (which included a $5 million civil monetary penalty). On the same day, the SEC filed a civil action in the U.S. District Court for the Southern District of New York against the Executive Vice President and Chief Operating Officer of the Adviser, alleging violations of certain federal securities laws arising from the same matter. The officer, who also is an officer of the Global Growth Fund and other funds in the Gabelli/GAMCO complex, including this Fund, denies the allegations and is continuing in his positions with the Adviser and the funds. The settlement by the Adviser did not have, and the resolution of the action against the officer is not expected to have, a material adverse impact on the Adviser or its ability to fulfill its obligations under the Advisory Agreement.
17
GAMCO International Growth Fund, Inc.
Notes to Financial Statements (Continued)
11. Subsequent Events. Management has evaluated the impact on the Fund of all subsequent events occurring through the date the financial statements were issued and has determined that there were no subsequent events requiring recognition or disclosure in the financial statements.
18
GAMCO International Growth Fund, Inc.
Report of Independent Registered Public Accounting Firm
To the Shareholders and Board of Directors of
GAMCO International Growth Fund, Inc.
We have audited the accompanying statement of assets and liabilities, including the schedule of investments, of GAMCO International Growth Fund, Inc. (the “Fund”), as of December 31, 2013, and the related statement of operations for the year then ended, the statements of changes in net assets for each of the two years in the period then ended, and the financial highlights for each of the five years in the period then ended. These financial statements and financial highlights are the responsibility of the Fund’s management. Our responsibility is to express an opinion on these financial statements and financial highlights based on our audits.
We conducted our audits in accordance with the standards of the Public Company Accounting Oversight Board (United States). Those standards require that we plan and perform the audit to obtain reasonable assurance about whether the financial statements and financial highlights are free of material misstatement. We were not engaged to perform an audit of the Fund’s internal control over financial reporting. Our audits included consideration of internal control over financial reporting as a basis for designing audit procedures that are appropriate in the circumstances, but not for the purpose of expressing an opinion on the effectiveness of the Fund’s internal control over financial reporting. Accordingly, we express no such opinion. An audit also includes examining, on a test basis, evidence supporting the amounts and disclosures in the financial statements and financial highlights, assessing the accounting principles used and significant estimates made by management, and evaluating the overall financial statement presentation. Our procedures included confirmation of securities owned as of December 31, 2013, by correspondence with the Fund’s custodian. We believe that our audits provide a reasonable basis for our opinion.
In our opinion, the financial statements and financial highlights referred to above present fairly, in all material respects, the financial position of the Fund at December 31, 2013, the results of its operations for the year then ended, the changes in its net assets for each of the two years in the period then ended, and its financial highlights for each of the five years in the period then ended, in conformity with U.S. generally accepted accounting principles.

New York, New York
February 24, 2014
19
GAMCO International Growth Fund, Inc.
Additional Fund Information (Unaudited)
The business and affairs of the Fund are managed under the direction of the Fund’s Board of Directors. Information pertaining to the Directors and officers of the Fund is set forth below. The Fund’s Statement of Additional Information includes additional information about the Fund’s Directors and is available without charge, upon request, by calling 800-GABELLI (800-422-3554) or by writing to the GAMCO International Growth Fund, Inc. at One Corporate Center, Rye, NY 10580-1422.
| | | | | | | | |
Name, Position(s) Address1 and Age | | Term of Office and Length of Time Served2 | | Number of Funds in Fund Complex Overseen by Director | | Principal Occupation(s) During Past Five Years | | Other Directorships Held
by Director4 |
| | | | |
INTERESTED DIRECTORS3: | | | | | | | | |
| | | | |
Mario J. Gabelli, CFA Director and Chief Investment Officer Age: 71 | | Since 1994 | | 27 | | Chairman, Chief Executive Officer, Chief Investment Officer–Value Portfolios of GAMCO Investors, Inc., and Chief Investment Officer– Value Portfolios of Gabelli Funds, LLC and GAMCO Asset Management Inc.; Director/ Trustee or Chief Investment Officer of other registered investment companies in the Gabelli/ GAMCO Funds Complex; Chief Executive Officer of GGCP, Inc. | | Director of Morgan Group Holdings, Inc. (holding company); Chairman of the Board and Chief Executive Officer of LICT Corp. (multimedia and communication services); Director of CIBL, Inc. (broadcasting and wireless communications); Director of ICTC Group, Inc. (communications); Director of RLJ Acquisition Inc. (blank check company)(2011-2012) |
| | | | |
| INDEPENDENT DIRECTORS5 : | | | | | | | | |
| | | | |
Anthony J. Colavita Director Age: 78 | | Since 1994 | | 36 | | President of the law firm of Anthony J. Colavita, P.C. | | — |
| | | | |
Werner J. Roeder, MD Director Age: 73 | | Since 1994 | | 23 | | Medical Director of Lawrence Hospital and practicing private physician | | — |
| | | | |
Anthonie C. van Ekris Director Age: 79 | | Since 1994 | | 20 | | Chairman of BALMAC International, Inc. (commodities and futures trading) | | — |
| | | | |
Salvatore J. Zizza Director Age: 68 | | Since 2004 | | 30 | | Chairman (since 1978) of Zizza & Associates Corp. (financial consulting); Chairman (since 2005) of Metropolitan Paper Recycling, Inc. (recycling); Chairman (since 1999) of Harbor BioSciences, Inc. (biotechnology) | | Director and Vice Chairman of Trans-Lux Corporation (business services); Director and Chairman of Harbor Diversified Inc. (pharmaceuticals); Chairman of Bion Environmental Technologies (technology); Director, Chairman, and CEO of General Employment Enterprises (staffing services) (2009-2012) |
20
GAMCO International Growth Fund, Inc.
Additional Fund Information (Continued) (Unaudited)
| | | | |
Name, Position(s) Address1 and Age | | Term of Office
and Length of
Time Served2 | | Principal Occupation(s) During Past Five Years |
| | |
OFFICERS: | | | | |
| | |
Bruce N. Alpert President Age: 62 | | Since 2006 | | Executive Vice President and Chief Operating Officer of Gabelli Funds, LLC since 1988 Officer of registered investment companies in the Gabelli/GAMCO Funds Complex; Director of Teton Advisors, Inc. 1998-2012; Chairman of Teton Advisors, Inc., 2008-2010; President of Teton Advisors, Inc., 1998-2008; Senior Vice President of GAMCO Investors, Inc. since 2008 |
| | |
Andrea R. Mango Secretary Age: 41 | | Since November
2013 | | Counsel of Gabelli Funds, LLC; Corporate Vice President within the Corporate Compliance Department of New York Life Insurance Company 2011-2013; Vice President and Counsel of Deutsche Bank 2006-2011 |
| | |
Agnes Mullady Treasurer Age: 55 | | Since 2006 | | President and Chief Operating Officer of the Open-End Fund Division of Gabelli Funds, LLC since September 2010; Senior Vice President of GAMCO Investors, Inc. since 2009; Vice President of Gabelli Funds, LLC since 2007; Officer of all of the registered investment companies in the Gabelli/GAMCO Funds Complex |
| | |
Richard J. Walz Chief Compliance Officer Age: 54 | | Since November
2013 | | Chief Compliance Officer of the Gabelli/GAMCO Funds Complex; Chief Compliance Officer of AEGON USA Investment Management, LLC 2011-2013; Chief Compliance Officer of Cutwater Asset Management 2004-2011. |
| 1 | Address: One Corporate Center, Rye, NY 10580-1422, unless otherwise noted. |
| 2 | Each Director will hold office for an indefinite term until the earliest of (i) the next meeting of shareholders, if any, called for the purpose of considering the election or re-election of such Director and until the election and qualification of his or her successor, if any, elected at such meeting, or (ii) the date a Director resigns or retires, or a Director is removed by the Board of Directors or shareholders, in accordance with the Fund’s By-Laws and Articles of Incorporation. Each officer will hold office for an indefinite term until the date he or she resigns or retires or until his or her successor is elected and qualified. |
| 3 | “Interested person” of the Fund as defined in the 1940 Act. Mr. Gabelli is considered an “interested person” because of his affiliation with Gabelli Funds, LLC which acts as the Fund’s investment adviser. |
| 4 | This column includes only directorships of companies required to report to the SEC under the Securities Exchange Act of 1934, as amended, i.e., public companies, or other investment companies registered under the 1940 Act. |
| 5 | Directors who are not interested persons are considered “Independent” Directors. |
21
Gabelli/GAMCO Funds and Your Personal Privacy
Who are we?
The Gabelli/GAMCO Funds are investment companies registered with the Securities and Exchange Commission under the Investment Company Act of 1940. We are managed by Gabelli Funds, LLC, which is affiliated with GAMCO Investors, Inc. GAMCO Investors, Inc. is a publicly held company that has subsidiaries that provide investment advisory or brokerage services for a variety of clients.
What kind of non-public information do we collect about you if you become a fund shareholder?
If you apply to open an account directly with us, you will be giving us some non-public information about yourself. The non-public information we collect about you is:
| | • | | Information you give us on your application form. This could include your name, address, telephone number, social security number, bank account number, and other information. | |
| | • | | Information about your transactions with us, any transactions with our affiliates, and transactions with the entities we hire to provide services to you. This would include information about the shares that you buy or redeem. If we hire someone else to provide services — like a transfer agent — we will also have information about the transactions that you conduct through them. | |
What information do we disclose and to whom do we disclose it?
We do not disclose any non-public personal information about our customers or former customers to anyone other than our affiliates, our service providers who need to know such information, and as otherwise permitted by law. If you want to find out what the law permits, you can read the privacy rules adopted by the Securities and Exchange Commission. They are in volume 17 of the Code of Federal Regulations, Part 248. The Commission often posts information about its regulations on its website, www.sec.gov.
What do we do to protect your personal information?
We restrict access to non-public personal information about you to the people who need to know that information in order to provide services to you or the fund and to ensure that we are complying with the laws governing the securities business. We maintain physical, electronic, and procedural safeguards to keep your personal information confidential.
GAMCO INTERNATIONAL GROWTH FUND, INC.
One Corporate Center Rye,
NY 10580-1422
Portfolio Manager Biography
Caesar M. P. Bryan joined GAMCO Asset Management in 1994. He is a member of the global investment team of Gabelli Funds, LLC and portfolio manager of several funds within the Gabelli/GAMCO Funds Complex. Prior to joining Gabelli, Mr. Bryan was a portfolio manager at Lexington Management. He began his investment career in 1979 at Samuel Montagu Company, the London based merchant bank. Mr. Bryan graduated from the University of Southampton in England with a Bachelor of Law and is a member of the English Bar.
2013 TAX NOTICE TO SHAREHOLDERS (Unaudited)
For the year ended December 31, 2013, the Fund paid to shareholders ordinary income distributions (comprised of net investment income and short term capital gains) totaling $0.077, $0.077, $0.077, and $0.077 per share for Class AAA, Class A, Class C, and Class I Shares, respectively, and long term capital gains totaling $1,366,985, or the maximum allowable. The distribution of long term capital gains has been designated as a capital gain dividend by the Fund’s Board of Directors. The Fund designates 100% of the ordinary income distribution as qualified dividend income pursuant to the Jobs and Growth Tax Relief Reconciliation Act of 2003. The Fund designates 0.00% of the ordinary income distribution as qualified interest income pursuant to the Tax Relief, Unemployment Reauthorization, and Job Creation Act of 2010. The Fund designates 67.90% of the ordinary income distribution as qualified short term gain pursuant to the American Jobs Creation Act of 2004. Also for the year 2013, the Fund passed through foreign tax credits of $0.036 per share to Class AAA, Class A, Class C, and Class I.
All designations are based on financial information available as of the date of this annual report and, accordingly, are subject to change. For each item, it is the intention of the Fund to designate the maximum amount permitted under the Internal Revenue Code and the regulations thereunder.
We have separated the portfolio manager’s commentary from the financial statements and investment portfolio due to corporate governance regulations stipulated by the Sarbanes-Oxley Act of 2002. We have done this to ensure that the content of the portfolio manager’s commentary is unrestricted. Both the commentary and the financial statements, including the portfolio of investments, will be available on our website at www.gabelli.com.
GAMCO INTERNATIONAL GROWTH FUND, INC.
One Corporate Center
Rye, New York 10580-1422
t 800-GABELLI (800-422-3554)
f 914-921-5118
e info@gabelli.com
GABELLI.COM
Net Asset Value per share available daily
by calling 800-GABELLI after 7:00 P.M.
| | |
BOARD OF DIRECTORS Mario J. Gabelli, CFA Chairman and Chief Executive Officer, GAMCO Investors, Inc. Anthony J. Colavita President, Anthony J. Colavita, P.C. Werner J. Roeder, MD Medical Director, Lawrence Hospital Anthonie C. van Ekris Chairman, BALMAC International, Inc. Salvatore J. Zizza Chairman, Zizza & Associates Corp. | | OFFICERS Bruce N. Alpert President Andrea R. Mango Secretary Agnes Mullady Treasurer Richard J. Walz Chief Compliance Officer DISTRIBUTOR G.distributors, LLC CUSTODIAN, TRANSFER AGENT, AND DIVIDEND DISBURSING AGENT State Street Bank and Trust Company LEGAL COUNSEL Paul Hastings LLP |
This report is submitted for the general information of the shareholders of the GAMCO International Growth Fund, Inc. It is not authorized for distribution to prospective investors unless preceded or accompanied by an effective prospectus.
GAB009Q413AR
Item 2. Code of Ethics.
| | (a) | The registrant, as of the end of the period covered by this report, has adopted a code of ethics that applies to the registrant’s principal executive officer, principal financial officer, principal accounting officer or controller, or persons performing similar functions, regardless of whether these individuals are employed by the registrant or a third party. |
| | (c) | There have been no amendments, during the period covered by this report, to a provision of the code of ethics that applies to the registrant’s principal executive officer, principal financial officer, principal accounting officer or controller, or persons performing similar functions, regardless of whether these individuals are employed by the registrant or a third party, and that relates to any element of the code of ethics description. |
| | (d) | The registrant has not granted any waivers, including an implicit waiver, from a provision of the code of ethics that applies to the registrant’s principal executive officer, principal financial officer, principal accounting officer or controller, or persons performing similar functions, regardless of whether these individuals are employed by the registrant or a third party, that relates to one or more of the items set forth in paragraph (b) of this item’s instructions. |
Item 3. Audit Committee Financial Expert.
As of the end of the period covered by the report, the registrant’s Board of Directors has determined that Salvatore J. Zizza is qualified to serve as an audit committee financial expert serving on its audit committee and that he is “independent,” as defined by Item 3 of Form N-CSR.
Item 4. Principal Accountant Fees and Services.
Audit Fees
| | (a) | The aggregate fees billed for each of the last two fiscal years for professional services rendered by the principal accountant for the audit of the registrant’s annual financial statements or services that are normally provided by the accountant in connection with statutory and regulatory filings or engagements for those fiscal years are $27,700 for 2012 and $28,700 for 2013. |
Audit-Related Fees
| | (b) | The aggregate fees billed in each of the last two fiscal years for assurance and related services by the principal accountant that are reasonably related to the performance of the audit of the registrant’s financial statements and are not reported under paragraph (a) of this Item are $0 for 2012 and $0 for 2013. |
Tax Fees
| | (c) | The aggregate fees billed in each of the last two fiscal years for professional services rendered by the principal accountant for tax compliance, tax advice, and tax planning are $3,300 for 2012 and $3,400 for 2013. Tax fees represent tax compliance services provided in connection with the review of the Registrant’s tax returns. |
All Other Fees
| | (d) | The aggregate fees billed in each of the last two fiscal years for products and services provided by the principal accountant, other than the services reported in paragraphs (a) through (c) of this Item are $0 for 2012 and $0 for 2013. |
| (e)(1) | Disclose the audit committee’s pre-approval policies and procedures described in paragraph (c)(7) of Rule 2-01 of Regulation S-X. |
Pre-Approval Policies and Procedures. The Audit Committee (“Committee”) of the registrant is responsible for pre-approving (i) all audit and permissible non-audit services to be provided by the independent registered public accounting firm to the registrant and (ii) all permissible non-audit services to be provided by the independent registered public accounting firm to the Adviser, Gabelli Funds, LLC, and any affiliate of Gabelli Funds, LLC (“Gabelli”) that provides services to the registrant (a “Covered Services Provider”) if the independent registered public accounting firm’s engagement related directly to the operations and financial reporting of the registrant. The Committee may delegate its responsibility to pre-approve any such audit and permissible non-audit services to the Chairperson of the Committee, and the Chairperson must report to the Committee, at its next regularly scheduled meeting after the Chairperson’s pre-approval of such services, his or her decision(s). The Committee may also establish detailed pre-approval policies and procedures for pre-approval of such services in accordance with applicable laws, including the delegation of some or all of the Committee’s pre-approval responsibilities to the other persons (other than Gabelli or the registrant’s officers). Pre-approval by the Committee of any permissible non-audit services is not required so long as: (i) the permissible non-audit services were not recognized by the registrant at the time of the engagement to be non-audit services; and (ii) such services are promptly brought to the attention of the Committee and approved by the Committee or Chairperson prior to the completion of the audit.
| (e)(2) | The percentage of services described in each of paragraphs (b) through (d) of this Item that were approved by the audit committee pursuant to paragraph (c)(7)(i)(C) of Rule 2-01 of Regulation S-X are as follows: |
(b) N/A
(c) 100%
(d) N/A
| | (f) | The percentage of hours expended on the principal accountant’s engagement to audit the registrant’s financial statements for the most recent fiscal year that were attributed to work performed by persons other than the principal accountant’s full-time, permanent employees was 0. |
| | (g) | The aggregate non-audit fees billed by the registrant’s accountant for services rendered to the registrant, and rendered to the registrant’s investment adviser (not including any sub-adviser whose role is primarily portfolio management and is subcontracted with or overseen by another investment adviser), and any entity controlling, controlled by, or under common control with the adviser that provides ongoing services to the registrant for each of the last two fiscal years of the registrant was $29,100 for 2012 and $33,520 for 2013. |
| | (h) | The registrant’s audit committee of the board of directors has considered whether the provision of non-audit services that were rendered to the registrant’s investment adviser (not including any sub-adviser whose role is primarily portfolio management and is subcontracted with or overseen by another investment adviser), and any entity controlling, controlled by, or under common control with the investment adviser that provides ongoing services to the registrant that were not pre-approved pursuant to paragraph (c)(7)(ii) of Rule 2-01 of Regulation S-X is compatible with maintaining the principal accountant’s independence. |
Item 5. Audit Committee of Listed registrants.
Not applicable.
Item 6. Investments.
| (a) | Schedule of Investments in securities of unaffiliated issuers as of the close of the reporting period is included as part of the report to shareholders filed under Item 1 of this form. |
| Item 7. | Disclosure of Proxy Voting Policies and Procedures for Closed-End Management Investment Companies. |
Not applicable.
Item 8. Portfolio Managers of Closed-End Management Investment Companies.
Not applicable.
| Item 9. | Purchases of Equity Securities by Closed-End Management Investment Company and Affiliated Purchasers. |
Not applicable.
Item 10. Submission of Matters to a Vote of Security Holders.
There have been no material changes to the procedures by which the shareholders may recommend nominees to the registrant’s Board of Directors, where those changes were implemented after the
registrant last provided disclosure in response to the requirements of Item 407(c)(2)(iv) of Regulation S-K (17 CFR 229.407) (as required by Item 22(b)(15) of Schedule 14A (17 CFR 240.14a-101)), or this Item.
Item 11. Controls and Procedures.
| | (a) | The registrant’s principal executive and principal financial officers, or persons performing similar functions, have concluded that the registrant’s disclosure controls and procedures (as defined in Rule 30a-3(c) under the Investment Company Act of 1940, as amended (the “1940 Act”) (17 CFR 270.30a-3(c))) are effective, as of a date within 90 days of the filing date of the report that includes the disclosure required by this paragraph, based on their evaluation of these controls and procedures required by Rule 30a-3(b) under the 1940 Act (17 CFR 270.30a-3(b)) and Rules 13a-15(b) or 15d-15(b) under the Securities Exchange Act of 1934, as amended (17 CFR 240.13a-15(b) or 240.15d-15(b)). |
| | (b) | There were no changes in the registrant’s internal control over financial reporting (as defined in Rule 30a-3(d) under the 1940 Act (17 CFR 270.30a-3(d)) that occurred during the registrant’s second fiscal quarter of the period covered by this report that has materially affected, or is reasonably likely to materially affect, the registrant’s internal control over financial reporting. |
Item 12. Exhibits.
| | (a)(1) | Code of ethics, or any amendment thereto, that is the subject of disclosure required by Item 2 is attached hereto. |
| | (a)(2) | Certifications pursuant to Rule 30a-2(a) under the 1940 Act and Section 302 of the Sarbanes-Oxley Act of 2002 are attached hereto. |
| | (b) | Certifications pursuant to Rule 30a-2(b) under the 1940 Act and Section 906 of the Sarbanes- Oxley Act of 2002 are attached hereto. |
(12.other) Not applicable.
SIGNATURES
Pursuant to the requirements of the Securities Exchange Act of 1934 and the Investment Company Act of 1940, the registrant has duly caused this report to be signed on its behalf by the undersigned, thereunto duly authorized.
|
| (Registrant) GAMCO International Growth Fund, Inc. |
|
| By (Signature and Title)* /s/ Bruce N. Alpert |
Bruce N. Alpert, Principal Executive Officer |
|
| Date 3/6/2014 |
Pursuant to the requirements of the Securities Exchange Act of 1934 and the Investment Company Act of 1940, this report has been signed below by the following persons on behalf of the registrant and in the capacities and on the dates indicated.
|
| By (Signature and Title)* /s/ Bruce N. Alpert |
Bruce N. Alpert, Principal Executive Officer |
|
| Date 3/6/2014 |
|
| By (Signature and Title)* /s/ Agnes Mullady |
Agnes Mullady, Principal Financial Officer and Treasurer |
|
| Date 3/6/2014 |
* Print the name and title of each signing officer under his or her signature.