Exhibit 99.2
| Third Quarter 2004 Earnings Review October 28, 2004 |
| This presentation contains forward-looking statements within the meaning of the Private Securities Litigation Reform Act of 1995. Actual results may differ materially from the anticipated results as a consequence of certain risks and uncertainties, including but not limited to our ability to finance our business, our reliance on key customers and platforms, our ability to obtain and maintain business with our customers, general economic conditions in the markets in which Tower Automotive operates, and various other factors. These slides should be reviewed in conjunction with the Company's press release issued October 28, 2004, which includes related disclosure of the Company's earnings results and additional discussion of various risk factors. |

| Agenda 3rd Quarter Highlights Management Overview 3rd Quarter Earnings Review Outlook for 4th Quarter and Full Year Summary |
| Challenging financial quarter due to: Lower vehicle volumes, especially in North America Increased steel costs, both base prices and surcharges Chicago launch expenses Revenues increased 16% YOY in the 3rd quarter with the new business programs representing over 45% of total revenue but much of the business still in launch or volume ramp mode Steel recovery generally successful in international operations but not as successful in North American direct buys for 2004. Moving more volume to resale steel programs for 2005 and holding tough negotiations to recover any exposure Chicago launch meeting program milestones and exceeding quality expectations but incurring costs higher than plan to assure throughput and quality levels Cost reduction pace continued strong in North America but were partially offset by performance issues in Gent, Belgium Managing liquidity closely through end of year Tower Automotive 3Q 04 Highlights |
| Build global turnaround leadership team Launch new business backlog successfully Focus on operational excellence Leverage scale to realize structural cost reductions Strengthen financial performance for long-term health Tower Automotive 2004 Key Strategies |
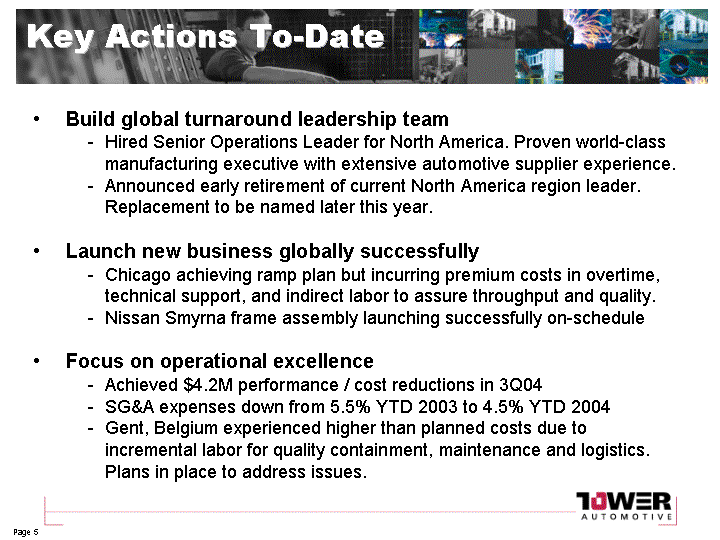
| Build global turnaround leadership team Hired Senior Operations Leader for North America. Proven world-class manufacturing executive with extensive automotive supplier experience. Announced early retirement of current North America region leader. Replacement to be named later this year. Launch new business globally successfully Chicago achieving ramp plan but incurring premium costs in overtime, technical support, and indirect labor to assure throughput and quality. Nissan Smyrna frame assembly launching successfully on-schedule Focus on operational excellence Achieved $4.2M performance / cost reductions in 3Q04 SG&A expenses down from 5.5% YTD 2003 to 4.5% YTD 2004 Gent, Belgium experienced higher than planned costs due to incremental labor for quality containment, maintenance and logistics. Plans in place to address issues. Key Actions To-Date |
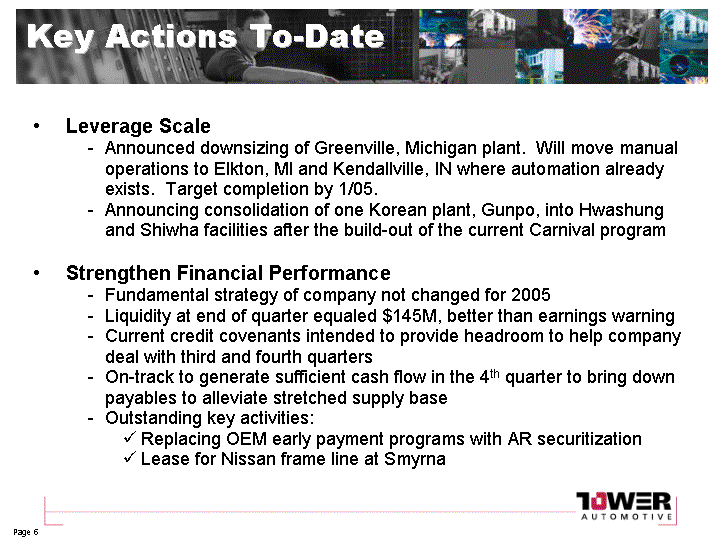
| Leverage Scale Announced downsizing of Greenville, Michigan plant. Will move manual operations to Elkton, MI and Kendallville, IN where automation already exists. Target completion by 1/05. Announcing consolidation of one Korean plant, Gunpo, into Hwashung and Shiwha facilities after the build-out of the current Carnival program Strengthen Financial Performance Fundamental strategy of company not changed for 2005 Liquidity at end of quarter equaled $145M, better than earnings warning Current credit covenants intended to provide headroom to help company deal with third and fourth quarters On-track to generate sufficient cash flow in the 4th quarter to bring down payables to alleviate stretched supply base Outstanding key activities: Replacing OEM early payment programs with AR securitization Lease for Nissan frame line at Smyrna Key Actions To-Date |
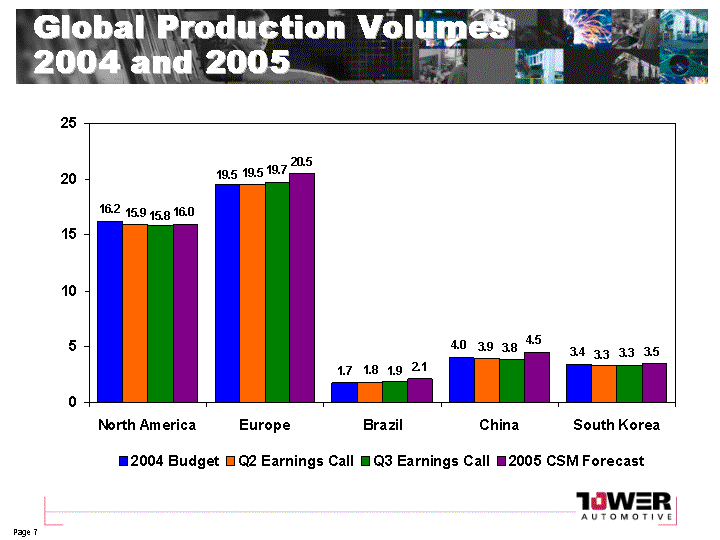
| Global Production Volumes 2004 and 2005 North America Europe Brazil China South Korea 2004 Budget 16.2 19.5 1.7 4 3.4 Q2 Earnings Call 15.9 19.5 1.8 3.9 3.3 Q3 Earnings Call 15.8 19.7 1.9 3.8 3.3 2005 CSM Forecast 16 20.5 2.1 4.5 3.5 |
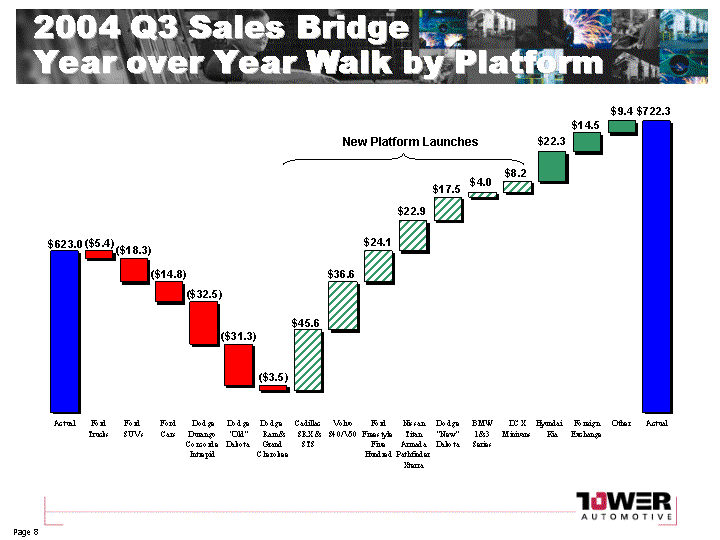
| 2004 Q3 Sales Bridge Year over Year Walk by Platform New Platform Launches |
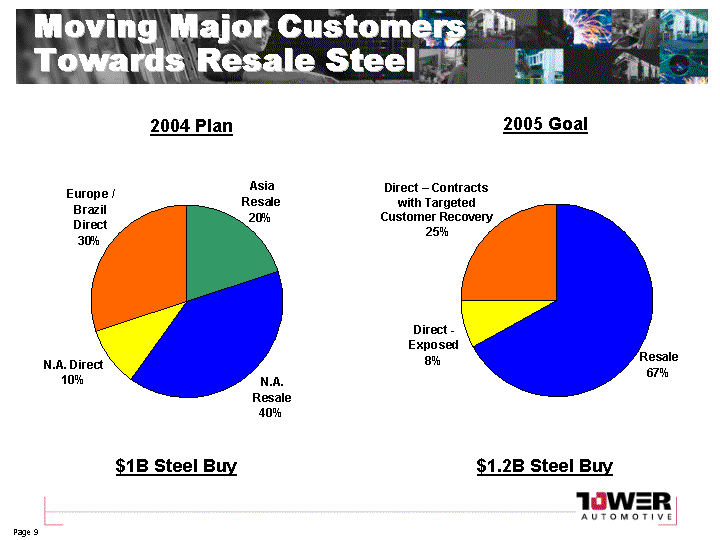
| Moving Major Customers Towards Resale Steel Asia Resale N.A. Resale N.A. Direct Europe / Brazil Direct East 20 40 10 30 2004 Plan $1B Steel Buy $1.2B Steel Buy 2005 Goal Resale Direct - Exposed East 67 8 25 Direct - Contracts with Targeted Customer Recovery 25% |
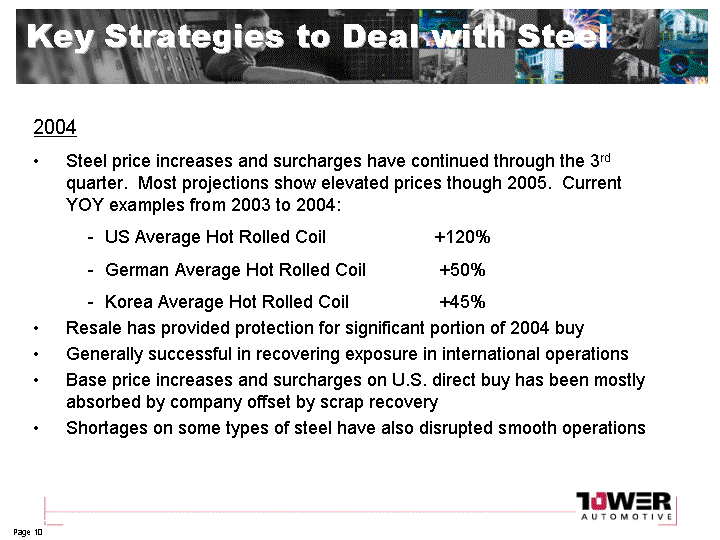
| 2004 Steel price increases and surcharges have continued through the 3rd quarter. Most projections show elevated prices though 2005. Current YOY examples from 2003 to 2004: US Average Hot Rolled Coil +120% German Average Hot Rolled Coil +50% Korea Average Hot Rolled Coil +45% Resale has provided protection for significant portion of 2004 buy Generally successful in recovering exposure in international operations Base price increases and surcharges on U.S. direct buy has been mostly absorbed by company offset by scrap recovery Shortages on some types of steel have also disrupted smooth operations Key Strategies to Deal with Steel |
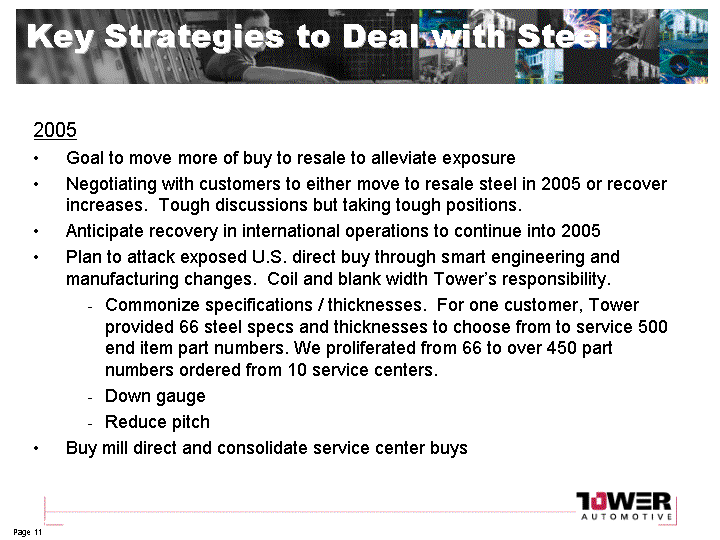
| 2005 Goal to move more of buy to resale to alleviate exposure Negotiating with customers to either move to resale steel in 2005 or recover increases. Tough discussions but taking tough positions. Anticipate recovery in international operations to continue into 2005 Plan to attack exposed U.S. direct buy through smart engineering and manufacturing changes. Coil and blank width Tower's responsibility. Commonize specifications / thicknesses. For one customer, Tower provided 66 steel specs and thicknesses to choose from to service 500 end item part numbers. We proliferated from 66 to over 450 part numbers ordered from 10 service centers. Down gauge Reduce pitch Buy mill direct and consolidate service center buys Key Strategies to Deal with Steel |
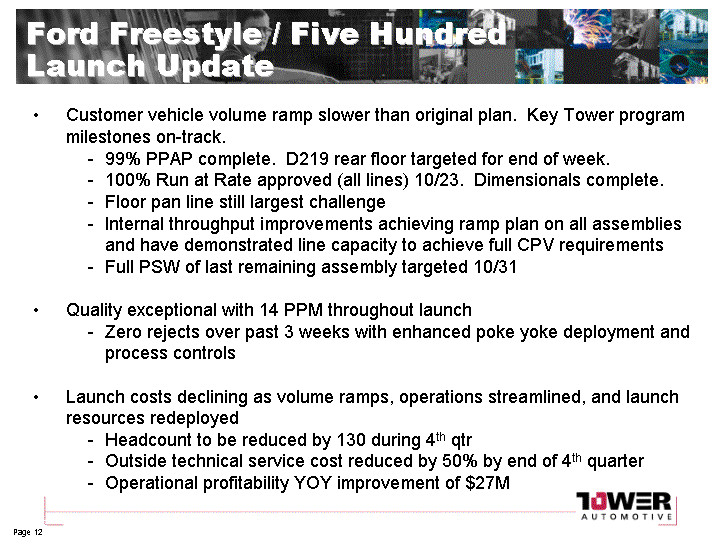
| Customer vehicle volume ramp slower than original plan. Key Tower program milestones on-track. 99% PPAP complete. D219 rear floor targeted for end of week. 100% Run at Rate approved (all lines) 10/23. Dimensionals complete. Floor pan line still largest challenge Internal throughput improvements achieving ramp plan on all assemblies and have demonstrated line capacity to achieve full CPV requirements Full PSW of last remaining assembly targeted 10/31 Quality exceptional with 14 PPM throughout launch Zero rejects over past 3 weeks with enhanced poke yoke deployment and process controls Launch costs declining as volume ramps, operations streamlined, and launch resources redeployed Headcount to be reduced by 130 during 4th qtr Outside technical service cost reduced by 50% by end of 4th quarter Operational profitability YOY improvement of $27M Ford Freestyle / Five Hundred Launch Update |
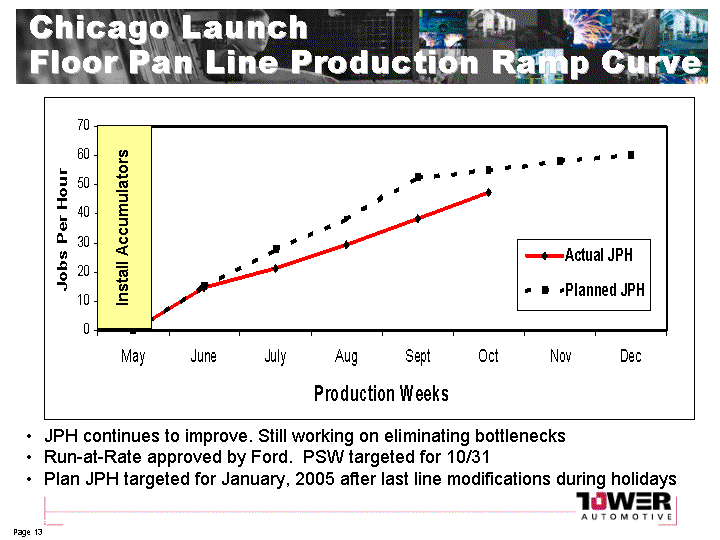
| JPH continues to improve. Still working on eliminating bottlenecks Run-at-Rate approved by Ford. PSW targeted for 10/31 Plan JPH targeted for January, 2005 after last line modifications during holidays Install Accumulators Chicago Launch Floor Pan Line Production Ramp Curve |
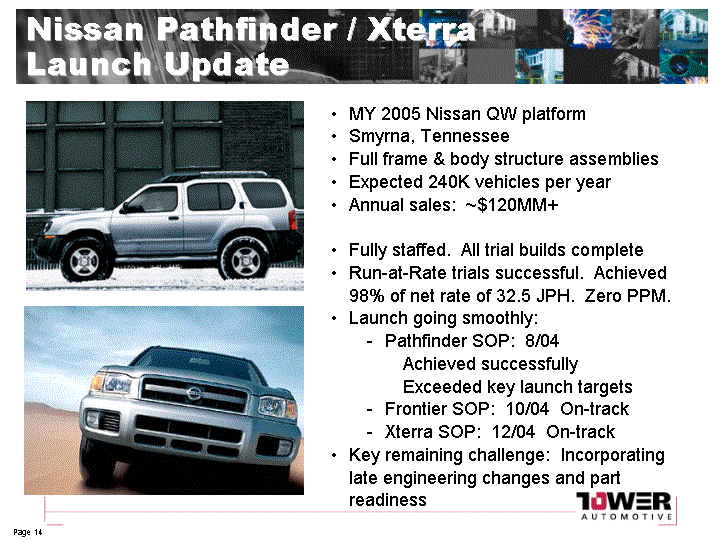
| Nissan Pathfinder / Xterra Launch Update MY 2005 Nissan QW platform Smyrna, Tennessee Full frame & body structure assemblies Expected 240K vehicles per year Annual sales: ~$120MM+ Fully staffed. All trial builds complete Run-at-Rate trials successful. Achieved 98% of net rate of 32.5 JPH. Zero PPM. Launch going smoothly: Pathfinder SOP: 8/04 Achieved successfully Exceeded key launch targets Frontier SOP: 10/04 On-track Xterra SOP: 12/04 On-track Key remaining challenge: Incorporating late engineering changes and part readiness |

| Continuing to Drive Performance / Cost Reductions Achieved overall 3Q YOY performance/ cost reductions of $4.2M despite seasonally lower volumes and launches North America achieved 3Q $9.4M YOY operating performance improvements through headcount reductions, OEE increases, and scrap elimination Partially offset by below plan 3Q performance in Gent, Belgium ($1.4M) from guidance Suffered higher expenses in logistics, quality and maintenance labor incurred as volume ramped on Volvo program. Extra heads were to have been gone by 3Q New regional / business unit leadership addressing issues 1Q 2Q 3Q 4Q 1Q 2Q 3Q Cost Reductions -1.8 3.3 3.8 3.5 6 9.9 4.2 ($MM) 2003 2004 |
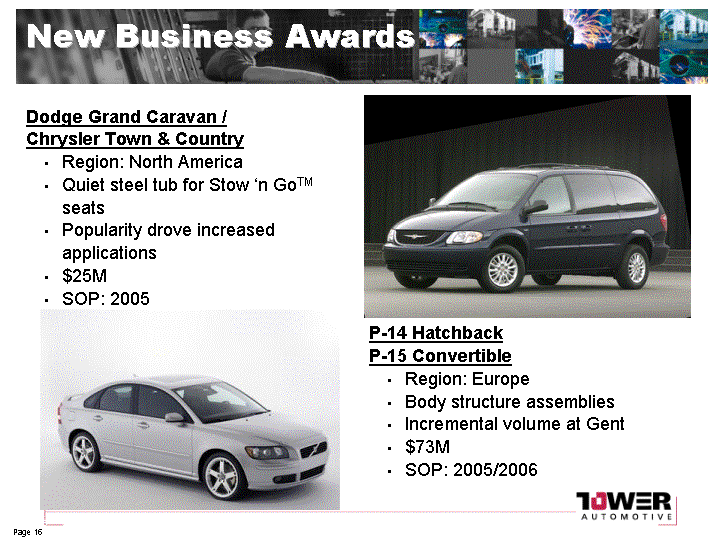
| New Business Awards P-14 Hatchback P-15 Convertible Region: Europe Body structure assemblies Incremental volume at Gent $73M SOP: 2005/2006 Dodge Grand Caravan / Chrysler Town & Country Region: North America Quiet steel tub for Stow 'n GoTM seats Popularity drove increased applications $25M SOP: 2005 |
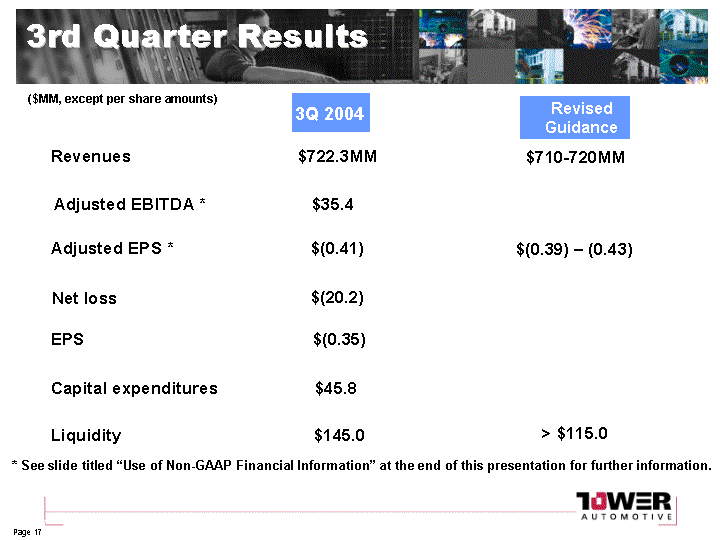
| 3rd Quarter Results ($MM, except per share amounts) 3Q 2004 Revenues $722.3MM Adjusted EBITDA * $35.4 Net loss $(20.2) EPS $(0.35) Adjusted EPS * $(0.41) Capital expenditures $45.8 Liquidity $145.0 Revised Guidance $710-720MM $(0.39) - (0.43) * See slide titled "Use of Non-GAAP Financial Information" at the end of this presentation for further information. > $115.0 |

| Q3 Guidance to Actuals - Revenue, Adjusted EBITDA, and Adjusted EPS ($MM, except per share amounts) * See slide titled "Use of Non-GAAP Financial Information" at the end of this presentation for further information. |
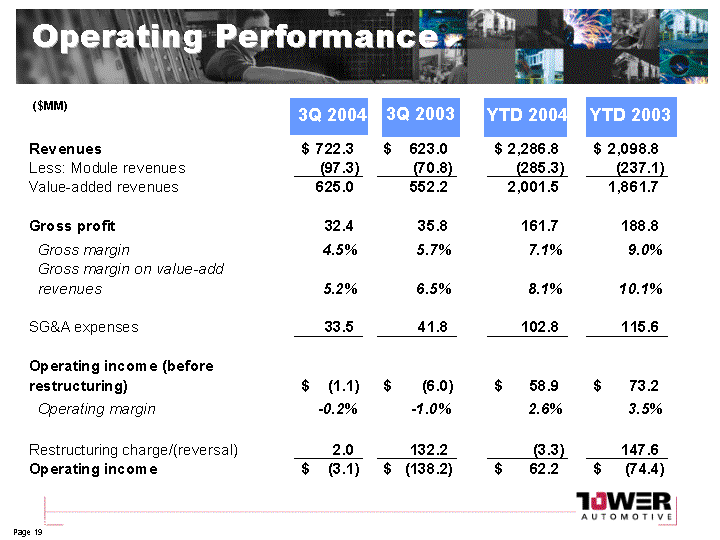
| Operating Performance ($MM) 3Q 2004 3Q 2003 YTD 2004 YTD 2003 |
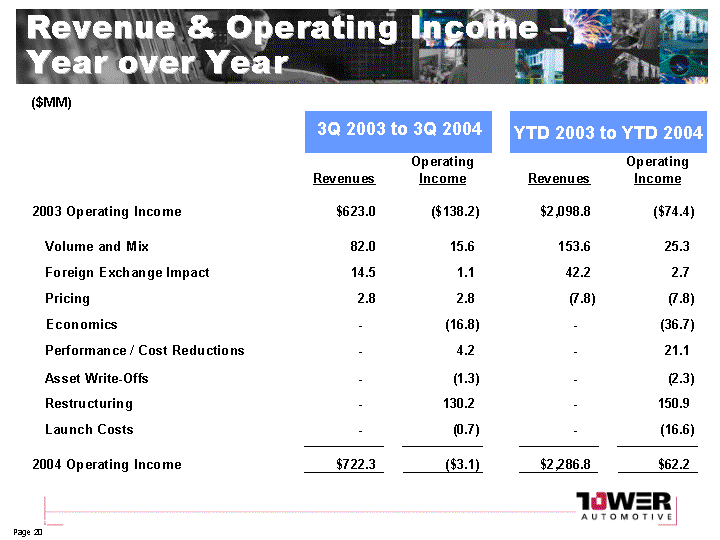
| Revenue & Operating Income - Year over Year ($MM) 3Q 2003 to 3Q 2004 YTD 2003 to YTD 2004 |
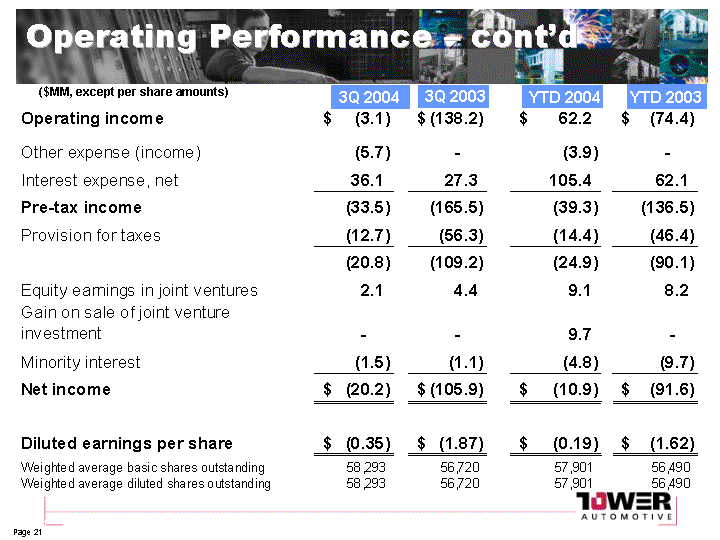
| Operating Performance - cont'd ($MM, except per share amounts) 3Q 2004 YTD 2003 3Q 2003 YTD 2004 |
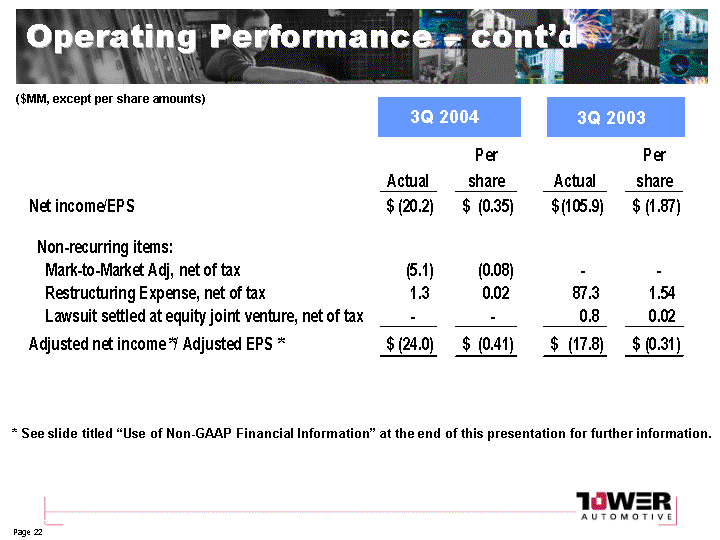
| Operating Performance - cont'd 3Q 2004 3Q 2003 * See slide titled "Use of Non-GAAP Financial Information" at the end of this presentation for further information. ($MM, except per share amounts) |
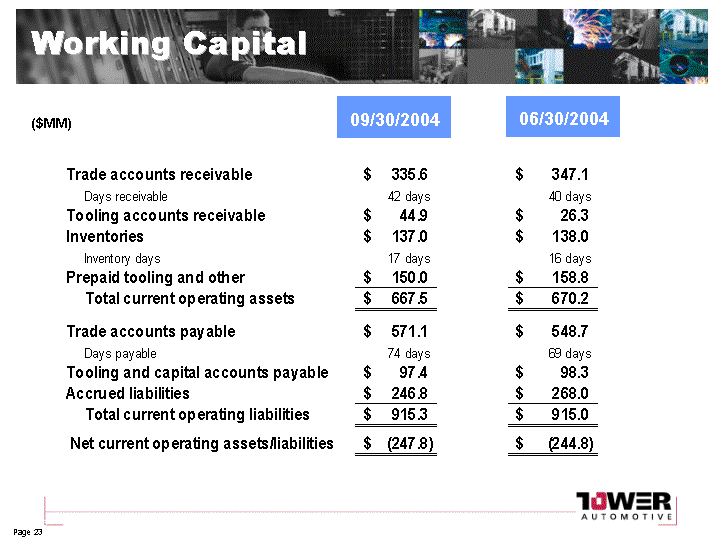
| Working Capital ($MM) 09/30/2004 06/30/2004 |
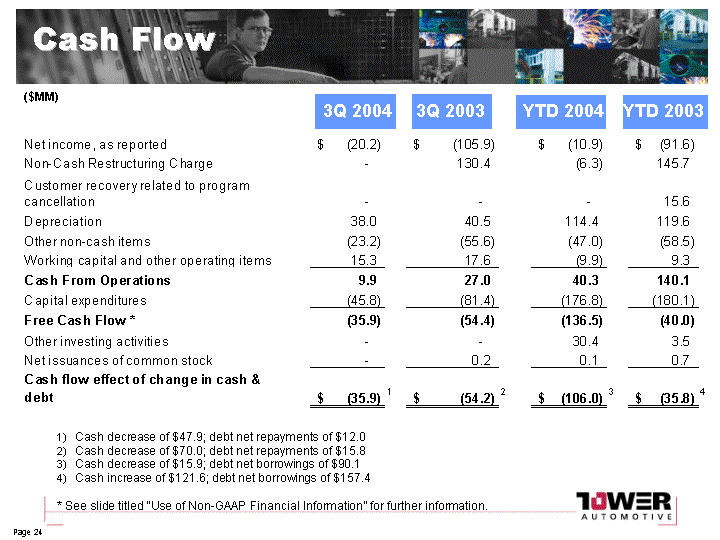
| Cash Flow ($MM) Cash decrease of $47.9; debt net repayments of $12.0 Cash decrease of $70.0; debt net repayments of $15.8 Cash decrease of $15.9; debt net borrowings of $90.1 Cash increase of $121.6; debt net borrowings of $157.4 * See slide titled "Use of Non-GAAP Financial Information" for further information. 3Q 2004 3Q 2003 YTD 2004 YTD 2003 |
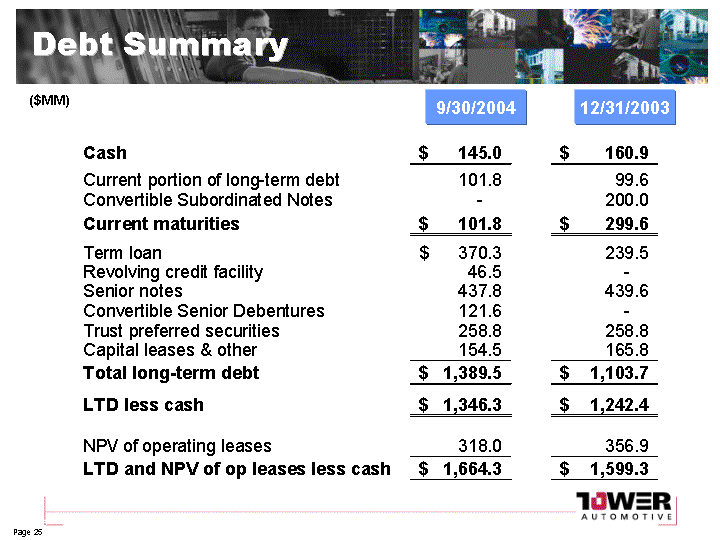
| Debt Summary ($MM) 9/30/2004 12/31/2003 |
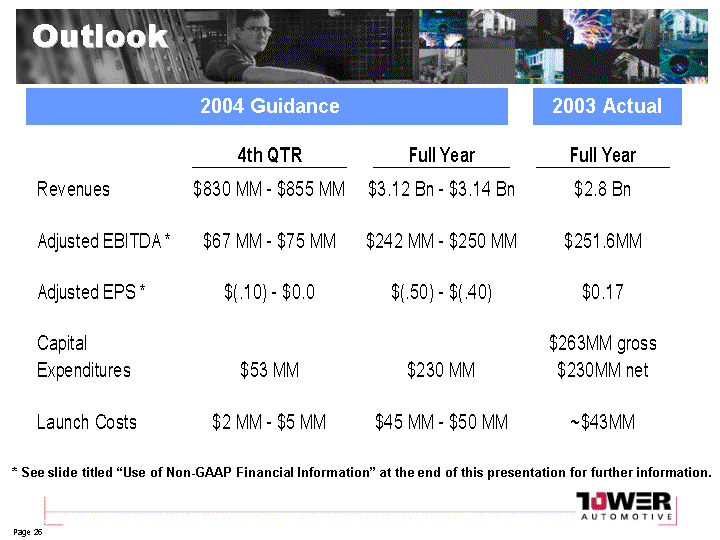
| Outlook 2004 Guidance 2003 Actual * See slide titled "Use of Non-GAAP Financial Information" at the end of this presentation for further information. |
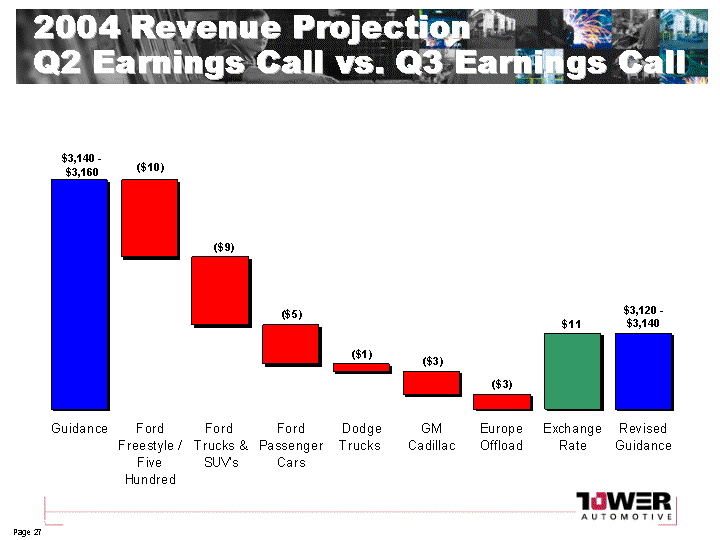
| 2004 Revenue Projection Q2 Earnings Call vs. Q3 Earnings Call $3,140 - $3,160 $3,120 - $3,140 |
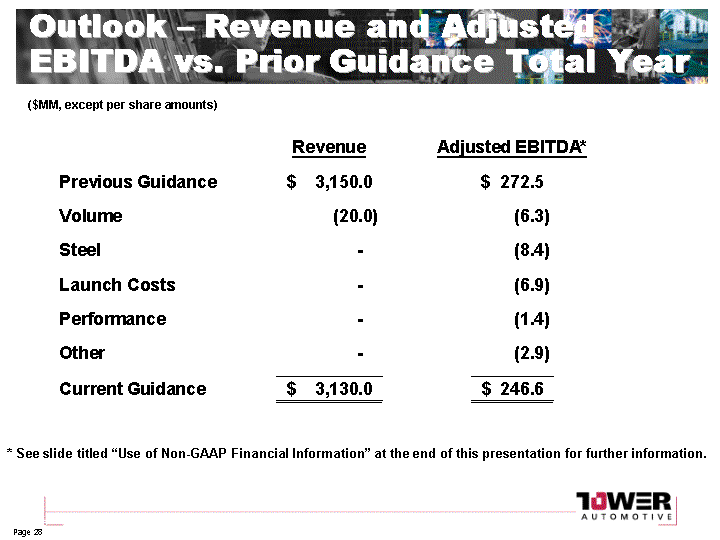
| Outlook - Revenue and Adjusted EBITDA vs. Prior Guidance Total Year ($MM, except per share amounts) * See slide titled "Use of Non-GAAP Financial Information" at the end of this presentation for further information. |
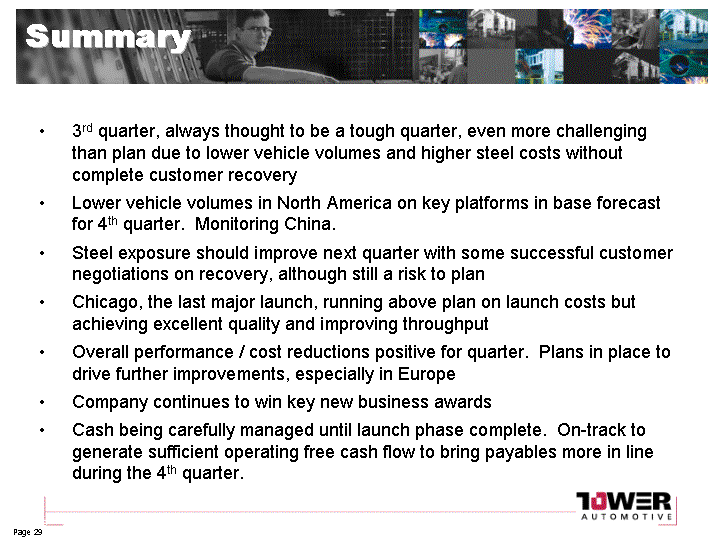
| Summary 3rd quarter, always thought to be a tough quarter, even more challenging than plan due to lower vehicle volumes and higher steel costs without complete customer recovery Lower vehicle volumes in North America on key platforms in base forecast for 4th quarter. Monitoring China. Steel exposure should improve next quarter with some successful customer negotiations on recovery, although still a risk to plan Chicago, the last major launch, running above plan on launch costs but achieving excellent quality and improving throughput Overall performance / cost reductions positive for quarter. Plans in place to drive further improvements, especially in Europe Company continues to win key new business awards Cash being carefully managed until launch phase complete. On-track to generate sufficient operating free cash flow to bring payables more in line during the 4th quarter. |
| Use of Non-GAAP Financial Information In addition to the results reported in accordance with accounting principles generally accepted in the United States ("GAAP") included throughout this presentation, the Company has provided information regarding certain non-GAAP financial measures. These measures include "Adjusted Net Income (Loss)", "Adjusted EPS", "Adjusted Earnings Before Interest, Taxes, Depreciation and Amortization" (Adjusted EBITDA) and "Free Cash Flow". Management believes that the non-GAAP financial measures used in this presentation are useful to both management and investors in their analysis of the Company's financial position and results of operations. In particular, management believes that "Adjusted Net Income (Loss)" and "Adjusted EPS"are useful measures in assessing the Company's financial performance by excluding certain items that are not indicative of the Company's core operating earnings or that may obscure trends useful in evaluating the Company's continuing operating activities. Management believes that "Adjusted EBITDA" and "Free Cash Flow" are useful in analyzing the company's ability to service and repay its debt. Further, management uses these non-GAAP measures for planning and forecasting in future periods. Neither "Adjusted Net Income (Loss)", "Adjusted EPS", "Adjusted EBITDA" or "Free Cash Flow" should be considered in isolation or as substitutes for net income, net cash provided by operating activities, total debt or other balance sheet, income statement or cash flow statement data prepared in accordance with GAAP or as measures of profitability or liquidity. Also, these non-GAAP financial measures, as determined and presented by the Company, may not be comparable to related or similarly titled measures reported by other companies. Reconciliations of "Adjusted Net Income (Loss)", "Adjusted EPS" and "Free Cash Flow" to the most directly comparable financial measures calculated and presented in accordance with GAAP are included with the non-GAAP financial measures in this presentation. A reconciliation of "Adjusted EBITDA" to net income calculated and presented in accordance with GAAP is included in the following slides. |
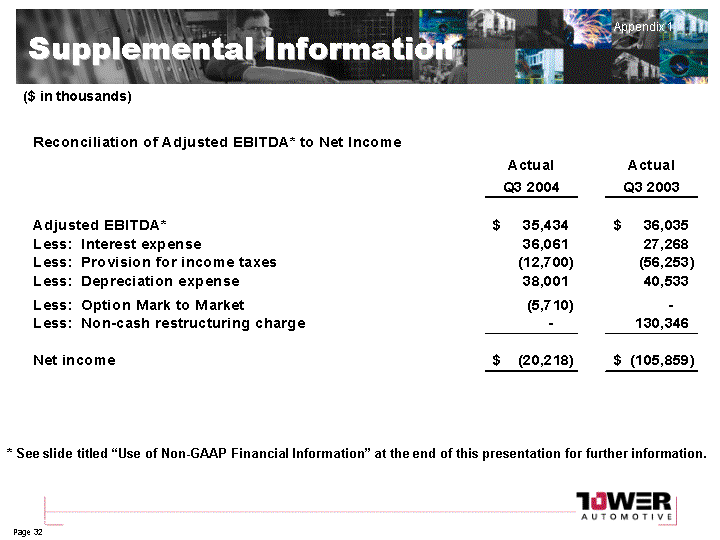
| Supplemental Information Appendix 1 ($ in thousands) * See slide titled "Use of Non-GAAP Financial Information" at the end of this presentation for further information. |
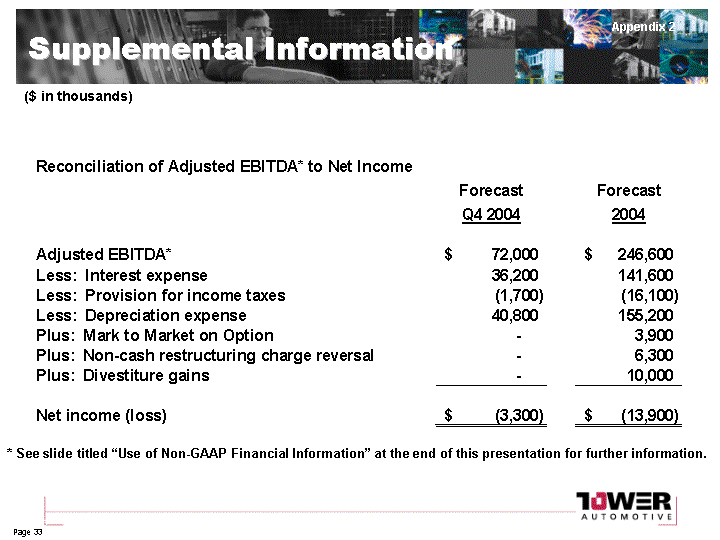
| Supplemental Information Appendix 2 ($ in thousands) * See slide titled "Use of Non-GAAP Financial Information" at the end of this presentation for further information. |