UNITED STATES
SECURITIES AND EXCHANGE COMMISSION
Washington, D.C. 20549
FORM 10-Q/A
AMENDMENT NO.1 TO FORM 10-Q
x QUARTERLY REPORT PURSUANT TO SECTION 13 OR 15(d) OF THE SECURITIES EXCHANGE ACT OF 1934
For the quarterly period ended June 30, 2007
¨ TRANSITION REPORT PURSUANT TO SECTION 13 OR 15(d) OF THE SECURITIES EXCHANGE ACT OF 1934
For the transition period from __________ to __________
Commission File Number: 0-24796
CENTRAL EUROPEAN MEDIA ENTERPRISES LTD.
(Exact name of registrant as specified in its charter)
| BERMUDA | 98-0438382 |
| (State or other jurisdiction of incorporation and organization) | (IRS Employer Identification No.) |
| Clarendon House, Church Street, Hamilton | HM 11 Bermuda |
| (Address of principal executive offices) | (Zip Code) |
Registrant's telephone number, including area code: 441-296-1431
Indicate by check mark whether registrant: (1) has filed all reports required to be filed by Section 13 or 15 (d) of the Securities Exchange Act of 1934 during the preceding 12 months (or for each shorter period that the registrant was required to file such reports), and (2) has been subject to such filing requirements for the past 90 days. Yes x No ¨
Indicate by check mark whether the registrant is a large accelerated filer, an accelerated filer, or a non-accelerated filer. See definition of “accelerated filer and large accelerated filer” in Rule 12b-2 of the Exchange Act.
Large accelerated filer x | Accelerated filer ¨ | Non-accelerated filer ¨ |
Indicate by check mark whether the registrant is a shell company (as defined by Rule 12b-2 of the Exchange Act) Yes ¨ No x
Indicate the number of shares outstanding of each of the issuer's classes of common stock, as of the latest practicable date.
| Class | Outstanding as of July 30, 2007 |
| Class A Common Stock, par value $0.08 | 34,639,921 |
| Class B Common Stock, par value $0.08 | 6,312,839 |
THIS PAGE INTENTIONALLY LEFT BLANK
EXPLANATORY NOTE
This is Amendment No. 1 to the Form 10-Q for the period ended June 30, 2007 of Central European Media Enterprises Ltd., as originally filed on August 2, 2007.
We are filing this Amendment No. 1 to correct the classification of certain provisions for legal contingencies, which had previously been reported as non-operating expenses within our condensed Consolidated Statement of Operations and are now being reported as operating expenses.
This modification resulted in changes in Item 1. Financial Statements, where the condensed consolidated statements of operations for the six months ended June 30, 2007 has been amended, and in Item 2. Management’s Discussion and Analysis of Financial Condition and Results of Operations, where the analysis of Corporate Operating Costs, Operating Income and Other Expense for the six months ended June 30, 2007 has been amended.
We have not otherwise updated this Quarterly Report on Form 10-Q/A to modify disclosures in the Quarterly Report on Form 10-Q for the period ended June 30, 2007 for events occurring subsequent to the original August 2, 2007 filing date; and except for the modifications referred to in the preceding paragraph, it continues to speak as of August 2, 2007.
CENTRAL EUROPEAN MEDIA ENTERPRISES LTD.
FORM 10-Q/A
AMENDMENT NO.1 TO FORM 10-Q
For the quarterly period ended June 30, 2007
INDEX
| Page | |
| Part I. Financial information | |
| 2 | |
| 4 | |
| 6 | |
| 7 | |
| 8 | |
| 41 | |
| Part II. Other Information | |
| 83 | |
| 84 | |
| 85 |
Part I. Financial Information
Item 1. Financial Statements
CENTRAL EUROPEAN MEDIA ENTERPRISES LTD.
CONDENSED CONSOLIDATED BALANCE SHEETS
(US$ 000’s)
(Unaudited)
June 30, 2007 | December 31, 2006 | |||||||
| ASSETS | ||||||||
| Current assets | ||||||||
| Cash and cash equivalents | $ | 116,662 | $ | 145,904 | ||||
| Restricted cash (Note 6) | 1,174 | 4,954 | ||||||
| Accounts receivable (net of allowance) (Note 7) | 180,059 | 152,505 | ||||||
| Income taxes receivable | 4,766 | 3,053 | ||||||
| Program rights, net | 62,182 | 59,645 | ||||||
| Other current assets (Note 8) | 61,755 | 47,555 | ||||||
| Total current assets | 426,598 | 413,616 | ||||||
| Non-current assets | ||||||||
| Investments | 16,563 | 19,214 | ||||||
| Property, plant and equipment, net (Note 9) | 130,181 | 115,805 | ||||||
| Program rights, net | 85,715 | 76,638 | ||||||
| Goodwill (Note 4) | 922,739 | 905,580 | ||||||
| Broadcast licenses, net (Note 4) | 210,881 | 198,730 | ||||||
| Other intangible assets, net (Note 4) | 88,464 | 71,942 | ||||||
| Other non-current assets (Note 8) | 19,151 | 17,475 | ||||||
| Total non-current assets | 1,473,694 | 1,405,384 | ||||||
| Total assets | $ | 1,900,292 | $ | 1,819,000 | ||||
The accompanying notes are an integral part of these condensed consolidated financial statements.
CENTRAL EUROPEAN MEDIA ENTERPRISES LTD.
CONDENSED CONSOLIDATED BALANCE SHEETS (continued)
(US$ 000’s)
(Unaudited)
June 30, 2007 | December 31, 2006 | |||||||
| LIABILITIES AND SHAREHOLDERS’ EQUITY | ||||||||
| Current liabilities | ||||||||
| Accounts payable and accrued liabilities (Note 10) | $ | 141,640 | $ | 119,717 | ||||
| Duties and other taxes payable | 35,845 | 31,707 | ||||||
| Income taxes payable | 13,483 | 12,434 | ||||||
| Credit facilities and obligations under capital leases (Note 11) | 12,433 | 13,057 | ||||||
| Dividends payable to minority shareholders in subsidiaries | 5,513 | - | ||||||
| Deferred consideration – Croatia | - | 4,010 | ||||||
| Deferred consideration – Ukraine | 1,060 | 200 | ||||||
| Deferred tax | 4,263 | 1,836 | ||||||
| Total current liabilities | 214,237 | 182,961 | ||||||
| Non-current liabilities | ||||||||
| Credit facilities and obligations under capital leases (Note 11) | 5,802 | 6,359 | ||||||
| Senior Notes (Note 5) | 533,424 | 487,291 | ||||||
| Income taxes payable | 5,072 | 3,000 | ||||||
| Deferred tax | 63,292 | 58,092 | ||||||
| Other non-current liabilities | 3,885 | 19,342 | ||||||
| Total non-current liabilities | 611,475 | 574,084 | ||||||
| Commitments and contingencies (Note 18) | ||||||||
| Minority interests in consolidated subsidiaries | 21,556 | 26,189 | ||||||
| SHAREHOLDERS' EQUITY: | ||||||||
| Nil shares of Preferred Stock of $0.08 each (December 31, 2006 – nil) | - | - | ||||||
| 34,639,921 shares of Class A Common Stock of $0.08 each (December 31, 2006 – 34,412,138) | 2,771 | 2,753 | ||||||
| 6,312,839 shares of Class B Common Stock of $0.08 each (December 31, 2006 – 6,312,839) | 505 | 505 | ||||||
| Additional paid-in capital | 936,730 | 931,108 | ||||||
| Accumulated deficit | (609 | ) | (31,730 | ) | ||||
| Accumulated other comprehensive income / (loss) | 113,627 | 133,130 | ||||||
| Total shareholders’ equity | 1,053,024 | 1,035,766 | ||||||
| Total liabilities and shareholders’ equity | $ | 1,900,292 | $ | 1,819,000 | ||||
The accompanying notes are an integral part of these condensed consolidated financial statements.
CENTRAL EUROPEAN MEDIA ENTERPRISES LTD.
CONDENSED CONSOLIDATED STATEMENTS OF OPERATIONS AND COMPREHENSIVE INCOME
(US$ 000’s, except share and per share data)
(Unaudited)
For the Three Months Ended June 30, | For the Six Months Ended June 30, | |||||||||||||||
| 2007 | 2006 | 2007 (as restated, see Note 2) | 2006 | |||||||||||||
| Net revenues | $ | 216,284 | $ | 156,589 | $ | 364,196 | $ | 276,343 | ||||||||
| Operating costs | 30,944 | 26,042 | 56,601 | 49,014 | ||||||||||||
| Cost of programming | 82,773 | 52,850 | 149,126 | 101,268 | ||||||||||||
| Depreciation of station property, plant and equipment | 7,680 | 6,059 | 14,579 | 11,761 | ||||||||||||
| Amortization of broadcast licenses and other intangibles (Note 4) | 5,165 | 4,620 | 10,327 | 8,952 | ||||||||||||
| Cost of revenues | 126,562 | 89,571 | 230,633 | 170,995 | ||||||||||||
| Station selling, general and administrative expenses | 15,699 | 14,541 | 31,480 | 28,707 | ||||||||||||
| Corporate operating costs | 7,444 | 7,696 | 22,217 | 15,677 | ||||||||||||
| Impairment charge | - | 748 | - | 748 | ||||||||||||
| Operating income | 66,579 | 44,033 | 79,866 | 60,216 | ||||||||||||
| Interest income | 1,732 | 1,741 | 3,146 | 3,194 | ||||||||||||
| Interest expense | (19,438 | ) | (11,337 | ) | (30,834 | ) | (21,855 | ) | ||||||||
| Foreign currency exchange loss, net | (2,116 | ) | (20,625 | ) | (5,252 | ) | (31,487 | ) | ||||||||
| Change in fair value of derivatives (Note 12) | 7,528 | (1,876 | ) | 12,052 | (1,876 | ) | ||||||||||
| Other (expense) / income | (546 | ) | 167 | (790 | ) | (381 | ) | |||||||||
| Income before provision for income taxes, minority interest, equity in loss of unconsolidated affiliates and discontinued operations | 53,739 | 12,103 | 58,188 | 7,811 | ||||||||||||
| Provision for income taxes | (13,419 | ) | (3,582 | ) | (18,478 | ) | (7,576 | ) | ||||||||
| Income before minority interest, equity in loss of unconsolidated affiliates and discontinued operations | 40,320 | 8,521 | 39,710 | 235 | ||||||||||||
| Minority interest in income of consolidated subsidiaries | (5,730 | ) | (1,276 | ) | (5,370 | ) | (6,717 | ) | ||||||||
| Equity in loss of unconsolidated affiliates | - | - | - | (730 | ) | |||||||||||
| Net income / (loss) from continuing operations | 34,590 | 7,245 | 34,340 | (7,212 | ) | |||||||||||
| Discontinued operations (Note 17): | ||||||||||||||||
| Tax on disposal of discontinued operations (Czech Republic) | - | 1,277 | - | (2,530 | ) | |||||||||||
| Net income / (loss) from discontinued operations | - | 1,277 | - | (2,530 | ) | |||||||||||
| Net income / (loss) | $ | 34,590 | $ | 8,522 | $ | 34,340 | $ | (9,742 | ) | |||||||
| Currency translation adjustment, net | (13,868 | ) | 44,706 | (19,503 | ) | 77,165 | ||||||||||
| Total comprehensive income | $ | 20,722 | $ | 53,228 | $ | 14,837 | $ | 67,423 | ||||||||
The accompanying notes are an integral part of these condensed consolidated financial statements.
CENTRAL EUROPEAN MEDIA ENTERPRISES LTD.
CONDENSED CONSOLIDATED STATEMENTS OF OPERATIONS AND COMPREHENSIVE INCOME (continued)
(US$ 000’s, except share and per share data)
(Unaudited)
For the Three Months Ended June 30, | For the Six Months Ended June 30, | |||||||||||||||
| 2007 | 2006 | 2007 | 2006 | |||||||||||||
| PER SHARE DATA (Note 15): | ||||||||||||||||
| Net income / (loss) per share: | ||||||||||||||||
| Continuing operations – Basic | $ | 0.84 | $ | 0.18 | $ | 0.84 | $ | (0.18 | ) | |||||||
| Continuing operations – Diluted | 0.83 | 0.18 | 0.83 | (0.18 | ) | |||||||||||
| Discontinued operations – Basic | 0.00 | 0.03 | 0.00 | (0.07 | ) | |||||||||||
| Discontinued operations – Diluted | 0.00 | 0.03 | 0.00 | (0.07 | ) | |||||||||||
| Net income / (loss) – Basic | 0.84 | 0.21 | 0.84 | (0.25 | ) | |||||||||||
| Net income / (loss) – Diluted | $ | 0.83 | $ | 0.21 | $ | 0.83 | $ | (0.25 | ) | |||||||
| Weighted average common shares used in computing per share amounts (000’s): | ||||||||||||||||
| Basic | 40,941 | 40,597 | 40,867 | 39,355 | ||||||||||||
| Diluted | 41,407 | 41,186 | 41,390 | 39,355 | ||||||||||||
The accompanying notes are an integral part of these condensed consolidated financial statements.
CENTRAL EUROPEAN MEDIA ENTERPRISES LTD.
CONDENSED CONSOLIDATED STATEMENTS OF SHAREHOLDERS' EQUITY
(US$ 000’s)
(Unaudited)
| Class A Common Stock | Class B Common Stock | |||||||||||||||||||||||||||||||
| Number of shares | Par value | Number of shares | Par value | Additional Paid-In Capital | Accumulated Deficit | Accumulated Other Comprehensive Income / (Loss) | Total Shareholders' Equity | |||||||||||||||||||||||||
BALANCE, December 31, 2006 | 34,412,138 | $ | 2,753 | 6,312,839 | $ | 505 | $ | 931,108 | $ | (31,730 | ) | $ | 133,130 | $ | 1,035,766 | |||||||||||||||||
| Impact of adoption of FIN 48 | - | - | - | - | - | (3,219 | ) | - | (3,219 | ) | ||||||||||||||||||||||
BALANCE, upon the adoption of FIN 48 | 34,412,138 | $ | 2,753 | 6,312,839 | $ | 505 | $ | 931,108 | $ | (34,949 | ) | $ | 133,130 | $ | 1,032,547 | |||||||||||||||||
| Stock-based compensation | - | - | - | - | 2,910 | - | - | 2,910 | ||||||||||||||||||||||||
| Stock options exercised | 227,783 | 18 | - | - | 2,712 | - | - | 2,730 | ||||||||||||||||||||||||
| Net income | - | - | - | - | - | 34,340 | - | 34,340 | ||||||||||||||||||||||||
| Currency translation adjustment | - | - | - | - | - | - | (19,503 | ) | (19,503 | ) | ||||||||||||||||||||||
BALANCE, June 30, 2007 | 34,639,921 | $ | 2,771 | 6,312,839 | $ | 505 | $ | 936,730 | $ | (609 | ) | $ | 113,627 | $ | 1,053,024 | |||||||||||||||||
| Class A Common Stock | Class B Common Stock | |||||||||||||||||||||||||||||||
| Number of Shares | Par Value | Number of Shares | Par Value | Additional Paid-In Capital | Accumulated Deficit | Accumulated Other Comprehensive Income / (Loss) | Total Shareholders' Equity | |||||||||||||||||||||||||
BALANCE, December 31, 2005 | 31,032,994 | $ | 2,482 | 6,966,533 | $ | 558 | $ | 754,061 | $ | (52,154 | ) | $ | (24,394 | ) | $ | 680,553 | ||||||||||||||||
| Stock-based compensation | - | - | - | - | 1,418 | - | - | 1,418 | ||||||||||||||||||||||||
| Stock options exercised | 77,250 | 7 | - | - | 1,060 | - | - | 1,067 | ||||||||||||||||||||||||
| Shares issued, net of fees | 2,530,000 | 202 | - | - | 168,397 | - | - | 168,599 | ||||||||||||||||||||||||
| Conversion of Class B to Class A Common Shares | 753,694 | 61 | (753,694 | ) | (61 | ) | - | - | - | - | ||||||||||||||||||||||
| Net loss | - | - | - | - | - | (9,742 | ) | - | (9,742 | ) | ||||||||||||||||||||||
| Currency translation adjustment | - | - | - | - | - | - | 77,165 | 77,165 | ||||||||||||||||||||||||
BALANCE, June 30, 2006 as restated (see Note 2) | 34,393,938 | $ | 2,752 | 6,212,839 | $ | 497 | $ | 924,936 | $ | (61,896 | ) | $ | 52,771 | $ | 919,060 | |||||||||||||||||
The accompanying notes are an integral part of these condensed consolidated financial statements.
CENTRAL EUROPEAN MEDIA ENTERPRISES LTD.
CONDENSED CONSOLIDATED STATEMENTS OF CASH FLOWS
(US$ 000’s)
(Unaudited)
| For the Six Months Ended June 30, | ||||||||
| 2007 | 2006 | |||||||
| CASH FLOWS FROM OPERATING ACTIVITIES: | ||||||||
| Net income/(loss) | $ | 34,340 | $ | (9,742 | ) | |||
| Adjustments to reconcile net income / (loss) to net cash generated from operating activities: | ||||||||
| Loss from discontinued operations (Note 17) | - | 2,530 | ||||||
| Equity in loss of unconsolidated affiliates, net of dividends received | - | 730 | ||||||
| Depreciation and amortization | 110,945 | 74,429 | ||||||
| Impairment charge | - | 748 | ||||||
| Loss on disposal of fixed asset | - | 1,171 | ||||||
| Stock-based compensation (Note 14) | 2,605 | 1,418 | ||||||
| Minority interest in income of consolidated subsidiaries | 5,370 | 6,717 | ||||||
| Change in fair value of derivative instruments | (12,052 | ) | 1,876 | |||||
| Foreign currency exchange loss, net | 5,252 | 31,487 | ||||||
| Net change in (net of effects of acquisitions and disposals of businesses): | ||||||||
| Accounts receivable | (25,572 | ) | (7,970 | ) | ||||
| Program rights | (100,593 | ) | (69,836 | ) | ||||
| Other assets | (8,018 | ) | 1,963 | |||||
| Accounts payable and accrued liabilities | 5,723 | (7,893 | ) | |||||
| Income taxes payable | (274 | ) | (6,922 | ) | ||||
| Deferred taxes | (458 | ) | 5,352 | |||||
| VAT and other taxes payable | 4,333 | 11,217 | ||||||
| Net cash generated from continuing operating activities | 21,601 | 37,275 | ||||||
| CASH FLOWS FROM INVESTING ACTIVITIES: | ||||||||
| Net change in restricted cash | - | (4,068 | ) | |||||
| Purchase of property, plant and equipment | (25,469 | ) | (18,461 | ) | ||||
| Proceeds from disposal of property, plant and equipment | 123 | 19 | ||||||
| Investments in subsidiaries and unconsolidated affiliates | (63,017 | ) | (59,308 | ) | ||||
| Repayment of loans and advances to related parties | 250 | 250 | ||||||
| Net cash used in continuing investing activities | (88,113 | ) | (81,568 | ) | ||||
| CASH FLOWS FROM FINANCING ACTIVITIES: | ||||||||
| Proceeds from credit facilities | 135,465 | 34,765 | ||||||
| Payment of credit facilities and capital leases | (137,289 | ) | (65,519 | ) | ||||
| Net proceeds from issuance of Senior Notes | 199,400 | - | ||||||
| Redemption of Senior Notes | (169,010 | ) | - | |||||
| Proceeds from issuance of stock options | 2,730 | 1,067 | ||||||
| Issuance of shares of Class A Common Stock | - | 168,599 | ||||||
| Excess tax benefits from share based payment arrangements | 305 | - | ||||||
| Dividends paid to minority shareholders | (476 | ) | (679 | ) | ||||
| Net cash received from continuing financing activities | 31,125 | 138,233 | ||||||
| NET CASH USED IN DISCONTINUED OPERATIONS – OPERATING ACTIVITIES | (1,624 | ) | (1,690 | ) | ||||
| Impact of exchange rate fluctuations on cash | 7,769 | (4,910 | ) | |||||
| Net (decrease)/increase in cash and cash equivalents | (29,242 | ) | 87,340 | |||||
| CASH AND CASH EQUIVALENTS, beginning of period | 145,904 | 71,658 | ||||||
| CASH AND CASH EQUIVALENTS, end of period | $ | 116,662 | $ | 158,998 | ||||
The accompanying notes are an integral part of these condensed consolidated financial statements.
CENTRAL EUROPEAN MEDIA ENTERPRISES LTD.
NOTES TO CONDENSED CONSOLIDATED FINANCIAL STATEMENTS
(Tabular amounts in US$ 000’s, except share and per share data)
(Unaudited)
1. ORGANIZATION AND BUSINESS
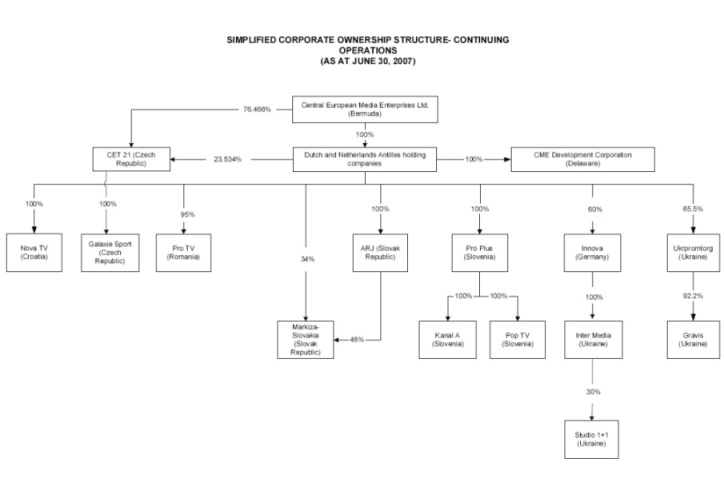
Central European Media Enterprises Ltd., a Bermuda corporation, was formed in June 1994. Our assets are held through a series of Dutch and Netherlands Antilles holding companies. We invest in, develop and operate national and regional commercial television stations and channels in Central and Eastern Europe. At June 30, 2007, we had operations in Croatia, the Czech Republic, Romania, the Slovak Republic, Slovenia and Ukraine.
Our principal subsidiaries, equity-accounted affiliates and cost investments as at June 30, 2007 were:
| Company Name | Effective Voting Interest | Jurisdiction of Organization | Type of Affiliate (1) |
| Nova TV d.d. (“Nova TV (Croatia)”) | 100.0% | Croatia | Subsidiary |
| Media House d.o.o. | 100.0% | Croatia | Subsidiary |
| Internet Dnevnik d.o.o. | 76.0% | Croatia | Subsidiary |
| CME Media Investments, s.r.o. | 100.0% | Czech Republic | Subsidiary |
| VILJA, a.s. (“Vilja”) | 100.0% | Czech Republic | Subsidiary |
| CET 21 spol., s r.o. (“CET 21”) | 100.0% | Czech Republic | Subsidiary |
| ERIKA a.s. | 100.0% | Czech Republic | Subsidiary |
| MEDIA CAPITOL a.s. | 100.0% | Czech Republic | Subsidiary |
| NOVA-V.I.P. a.s. | 100.0% | Czech Republic | Subsidiary (in liquidation) |
| HARTIC, a.s. | 100.0% | Czech Republic | Subsidiary |
| Galaxie sport s r.o. (“Galaxie Sport”) | 100.0% | Czech Republic | Subsidiary |
| Media Pro International S.A. (“MPI”) | 95.0% | Romania | Subsidiary |
| Media Vision SRL (“Media Vision”) | 95.0% | Romania | Subsidiary |
| MPI Romania B.V. | 95.0% | Netherlands | Subsidiary |
| Pro TV S.A. (“Pro TV”) | 95.0% | Romania | Subsidiary |
| Sport Radio TV Media SRL (“Sport.ro”) | 95.0% | Romania | Subsidiary |
| Media Pro B.V. | 10.0% | Netherlands | Cost investment |
| Media Pro Management S.A. | 10.0% | Romania | Cost investment |
| A.R.J. a.s. (“ARJ”) | 100.0% | Slovak Republic | Subsidiary |
| MARKIZA-SLOVAKIA spol. s r.o. (“Markiza”) | 80.0% | Slovak Republic | Subsidiary |
| GAMATEX spol. s r.o. | 80.0% | Slovak Republic | Subsidiary (in liquidation) |
| A.D.A.M., a.s. | 80.0% | Slovak Republic | Subsidiary (in liquidation) |
| MMTV 1 d.o.o. | 100.0% | Slovenia | Subsidiary |
| Produkcija Plus d.o.o. (“Pro Plus”) | 100.0% | Slovenia | Subsidiary |
| POP TV d.o.o. (“Pop TV”) | 100.0% | Slovenia | Subsidiary |
| Kanal A d.o.o. (“Kanal A”) | 100.0% | Slovenia | Subsidiary |
| Euro 3 TV d.o.o | 42.0% | Slovenia | Equity-Accounted Affiliate |
| MTC Holding d.o.o. | 24.0% | Slovenia | Equity-Accounted Affiliate (in liquidation) |
CENTRAL EUROPEAN MEDIA ENTERPRISES LTD.
NOTES TO CONDENSED CONSOLIDATED FINANCIAL STATEMENTS
(Tabular amounts in US$ 000’s, except share and per share data)
(Unaudited)
| Company Name | Effective Voting Interest | Jurisdiction of Organization | Type of Affiliate (1) |
| International Media Services Ltd. (“IMS”) | 60.0% | Bermuda | Subsidiary |
| Innova Film GmbH (“Innova”) | 60.0% | Germany | Subsidiary |
| Foreign Enterprise “Inter-Media” (“Inter-Media”) | 60.0% | Ukraine | Subsidiary |
| TV Media Planet Ltd. | 60.0% | Cyprus | Subsidiary |
| Studio 1+1 LLC (“Studio 1+1”) | 18.0% | Ukraine | Consolidated Variable Interest Entity |
| Ukrainian Media Services LLC | 99.0% | Ukraine | Subsidiary |
| Ukrpromtorg -2003 LLC (“Ukrpromtorg”) | 65.5% | Ukraine | Subsidiary |
| Gravis LLC | 60.4% | Ukraine | Subsidiary |
| Delta JSC | 60.4% | Ukraine | Subsidiary |
| Nart LLC | 65.5% | Ukraine | Subsidiary |
| TV Stimul LLC | 49.1% | Ukraine | Equity-Accounted Affiliate |
| Tor LLC (“Tor”) | 60.4% | Ukraine | Subsidiary |
| Zhysa LLC (“Zhysa”) | 60.4% | Ukraine | Subsidiary |
| CME Media Enterprises B.V. | 100.0% | Netherlands | Subsidiary |
| CME Czech Republic II B.V. | 100.0% | Netherlands | Subsidiary |
| CME Romania B.V. | 100.0% | Netherlands | Subsidiary |
| CME Slovak Holdings B.V. | 100.0% | Netherlands | Subsidiary |
| Central European Media Enterprises N.V. | 100.0% | Netherlands Antilles | Subsidiary |
| Central European Media Enterprises II B.V. | 100.0% | Netherlands Antilles | Subsidiary |
| CME SR d.o.o. | 100.0% | Serbia | Subsidiary (in liquidation) |
| CME Ukraine Holding GmbH | 100.0% | Austria | Subsidiary |
| CME Cyprus Holding Ltd. | 100.0% | Cyprus | Subsidiary |
| CME Development Corporation | 100.0% | Delaware | Subsidiary |
| (1) | all subsidiaries have been consolidated in our Consolidated Financial Statements. All equity-accounted affiliates have been accounted for using the equity method. All cost investments have been accounted for using the cost method. |
CENTRAL EUROPEAN MEDIA ENTERPRISES LTD.
NOTES TO CONDENSED CONSOLIDATED FINANCIAL STATEMENTS
(Tabular amounts in US$ 000’s, except share and per share data)
(Unaudited)
CENTRAL EUROPEAN MEDIA ENTERPRISES LTD.
NOTES TO CONDENSED CONSOLIDATED FINANCIAL STATEMENTS
(Tabular amounts in US$ 000’s, except share and per share data)
(Unaudited)
Croatia
We own 100.0% of Nova TV (Croatia), which holds a national terrestrial broadcast license for Croatia that expires in April 2010.
Czech Republic
We own 100.0% of CET 21, which holds the national terrestrial broadcast license for TV NOVA (Czech Republic) that expires in 2017.
Romania
On May 16, 2007, we acquired an additional 20.0% of Media Vision (a production, dubbing and subtitling company) and subsequently on June 1, 2007, we acquired an additional 5.0% of Pro TV and MPI from companies owned by, or individuals associated with, Adrian Sarbu, the general director of our Romanian operations and our Regional Director of Central and Eastern Europe operations, for aggregate consideration of US$ 51.6 million including acquisition costs. Following these transactions, we have a 95.0% interest in each of Pro TV, MPI and Media Vision. Pro TV holds the licenses for the PRO TV, ACASA, PRO TV INTERNATIONAL, PRO CINEMA and SPORT.RO channels. These licenses expire on various dates between August 2007 and February 2016.
As at June 30, 2007 we held 10.0% in each of Media Pro BV and Media Pro Management S.A., the parent companies of the Media Pro group of companies (“Media Pro”). Subsequent to June 30, 2007 our holding now represents 8.7% in these entities due to a capital increase in which we did not participate. Substantially all of the remaining shares of Media Pro are owned directly or indirectly by Adrian Sarbu. Media Pro comprises a number of companies with operations in the fields of publishing, information, printing, cinema, entertainment and radio in Romania.
Slovak Republic
As at June 30, 2007 we owned 80.0% of Markiza, which holds a national terrestrial broadcast license for the Slovak Republic that expires in September 2019. On July 13, 2007, we acquired the remaining 20.0% of Markiza for SKK 1.9 billion (approximately US$ 78.8 million at the date of acquisition). As a result, we own 100.0% of Markiza.
Slovenia
We own 100.0% of Pro Plus, the operating company for our Slovenia operations. Pro Plus has a 100.0% voting and economic interest in each of Pop TV, which holds the licenses for the POP TV network, and Kanal A, which holds the licenses for the KANAL A network. All such licenses expire in August 2012.
Ukraine (Studio 1+1)
The Studio 1+1 Group is comprised of several entities in which we hold direct or indirect interests. We hold a 60.0% ownership and economic interest in each of Innova, IMS and TV Media Planet. Innova owns 100% of Inter-Media, a Ukrainian company, which in turn holds a 30.0% voting and economic interest in Studio 1+1, holder of the licenses for the STUDIO 1+1 channel. The license which covers fifteen hours including prime time expires in December 2016. The second license for the remaining nine hours expires in 2014.
Our indirect ownership interest in Studio 1+1 is only 18.0%. We entered into an additional agreement on December 30, 2004 with Boris Fuchsmann, Alexander Rodnyansky and Studio 1+1 which re-affirms our entitlement to 60.0% of any distribution from Studio 1+1 to its shareholders until such time as Ukrainian legislation allows us to increase our ownership interest in Studio 1+1 to 60.0%. Following amendments to the Ukrainian Media Law in March 2006 that permit majority indirect foreign ownership, our partners entered into agreements with us to restructure the ownership of Studio 1+1 in order to permit CME to hold a 60.0% interest in Studio 1+1 (see Note 18).
CENTRAL EUROPEAN MEDIA ENTERPRISES LTD.
NOTES TO CONDENSED CONSOLIDATED FINANCIAL STATEMENTS
(Tabular amounts in US$ 000’s, except share and per share data)
(Unaudited)
Ukraine (KINO, CITI)
We hold a 65.5% interest in Ukrpromtorg. Ukrpromtorg owns (i) 92.2% of Gravis, which operates the local channels KINO and CITI; (ii) 100.0% of Nart LLC, which holds a satellite broadcasting license; and (iii) 75.0% of TV Stimul LLC, which operates TV STIMUL. We also own a 60.4% interest in each of Zhysa and Tor, two regional broadcasters. Licenses used for the KINO and CITI channels expire on dates ranging from June 2008 to July 2016.
2. SUMMARY OF SIGNIFICANT ACCOUNTING POLICIES
Basis of Presentation
The interim financial statements for the three and six months ended June 30, 2007 should be read in conjunction with the Notes to the Consolidated Financial Statements contained in our Annual Report on Form 10-K for the period ended December 31, 2006. Our significant accounting policies have not changed since December 31, 2006, except as noted below.
In the opinion of management, the accompanying interim unaudited financial statements reflect all adjustments, consisting only of normal recurring items, necessary for their fair presentation in conformity with accounting principles generally accepted in the United States of America (“US GAAP”). The consolidated results of operations for interim periods are not necessarily indicative of the results to be expected for a full year.
The preparation of financial statements in conformity with US GAAP requires management to make estimates and assumptions that affect the reported amounts of assets and liabilities and disclosure of contingent assets and liabilities at the date of the financial statements and the reported amounts of revenues and expenses during the reporting year. Actual results could differ from those estimates and assumptions.
The condensed consolidated financial statements include the accounts of Central European Media Enterprises Ltd. and our subsidiaries, after the elimination of intercompany accounts and transactions. We consolidate the financial statements of entities in which we hold at least a majority voting interest and also those entities which are deemed to be a Variable Interest Entity of which we are the primary beneficiary as defined by FASB Interpretation No. 46 (revised December 2003), “Consolidation of Variable Interest Entities” ("FIN 46(R)"). Entities in which we hold less than a majority voting interest but over which we have the ability to exercise significant influence are accounted for using the equity method. Other investments are accounted for using the cost method.
We, like other television operators, experience seasonality, with advertising sales tending to be lower during the first and third quarters of each calendar year, particularly during the summer holiday period (typically July and August) and higher during the second and fourth quarters of each calendar year, particularly toward the end of the year.
The terms “Company”, “we”, “us”, and “our” are used in this Form 10-Q/A to refer collectively to the parent company and the subsidiaries through which our various businesses are actually conducted.
Unless otherwise noted, all statistical and financial information presented in this report has been converted into US dollars using appropriate exchange rates. All references to “US$” or “dollars” are to US dollars, all references to “HRK” are to Croatian kuna, all references to “CZK” are to Czech korunas, all references to “RON” are to the New Romanian lei, all references to “SKK” are to Slovak korunas, all references to “UAH” are to Ukrainian hryvna, all references to “Euro” or “EUR” are to the European Union Euro and all references to “GBP” are to British pounds.
CENTRAL EUROPEAN MEDIA ENTERPRISES LTD.
NOTES TO CONDENSED CONSOLIDATED FINANCIAL STATEMENTS
(Tabular amounts in US$ 000’s, except share and per share data)
(Unaudited)
Income Taxes
We account for income taxes under the asset and liability method as set out in FAS No. 109, “Accounting for Income Taxes” (“FAS 109”). Deferred tax assets and liabilities are recognized for the expected tax consequences of temporary differences between the tax bases of assets and liabilities and their reported amounts. Valuation allowances are established when necessary to reduce deferred tax assets to amounts which are more likely than not to be realized.
On January 1, 2007, we adopted FASB Interpretation No. 48, “Accounting for Uncertainty in Income Taxes - an interpretation of FASB Statement No. 109” (“FIN 48”), which clarifies the accounting for uncertainty in tax positions. The evaluation of a tax position under FIN 48 is a two-step process. The first step is recognition: Tax positions taken or expected to be taken in a tax return should be recognized only if those positions are more likely than not to be sustained upon examination, based on the technical merits of the position. In evaluating whether a tax position has met the more likely than not recognition threshold, it should be presumed that the position will be examined by the relevant taxing authority and that they would have full knowledge of all relevant information. The second step is measurement: Tax positions that meet the recognition criteria are measured at the largest amount of benefit that is greater than 50 percent likely of being recognized upon ultimate settlement.
As a result of the implementation of FIN 48, we recognized a liability of approximately US$ 2.0 million for unrecognized tax benefits, of which US $1.7 million was accounted for as a reduction to retained deficit as at January 1, 2007. The total amount of unrecognized benefits that, if recognized, would affect the effective tax rate amounts to US$ 2.0 million, all of which would reduce the effective tax rate accordingly.
We recognize interest accrued and penalties related to unrecognized tax benefits within the provision for income taxes. As at January 1, 2007, we accrued US $1.8 million in respect of interest and penalties, of which US$1.5 million was accounted for as a reduction to retained deficit.
Our subsidiaries file income tax returns in the Netherlands and various other tax jurisdictions including the United States. As at January 1, 2007, analyzed by major tax jurisdictions, the Company’s subsidiaries are no longer subject to income tax examinations for years before:
| Jurisdiction | Year |
| Croatia | 2003 |
| Czech Republic | 2003 |
| Germany | 2000 |
| Netherlands | 2004 |
| Romania | 2002 |
| Slovak Republic | 2001 |
| Slovenia | 2001 |
| Ukraine | 2003 |
| United States | 2001 |
Recent Accounting Pronouncements
In September 2006, the FASB issued FASB Statement No. 157, “Fair Value Measurements” (“FAS 157”). FAS 157 addresses the need for increased consistency in fair value measurements, defining fair value as the price that would be received to sell an asset or paid to transfer a liability in an orderly transaction between market participants at the measurement date. It also establishes a framework for measuring fair value and expands disclosure requirements. FAS 157 is effective for us beginning January 1, 2008. We are currently evaluating the impact of the adoption of FAS 157 on our financial position and results of operations.
In February 2007, the FASB issued FASB Statement No. 159, "The Fair Value Option for Financial Assets and Financial Liabilities" ("FAS 159"). FAS 159 gives entities the option to prospectively measure many financial instruments and certain other items at fair value in the balance sheet with changes in the fair value recognized in the income statement. FAS 159 is effective for fiscal years beginning after November 15, 2008, although entities may elect to adopt the statement early. We are currently evaluating the impact of adoption on our financial position and results of operations.
CENTRAL EUROPEAN MEDIA ENTERPRISES LTD.
NOTES TO CONDENSED CONSOLIDATED FINANCIAL STATEMENTS
(Tabular amounts in US$ 000’s, except share and per share data)
(Unaudited)
Restatements
Classification of legal provisions
Subsequent to the issuance of our financial statements as of and for the period ended September 30, 2007, we determined that the current year provisions recorded in anticipation of the settlement of our Croatia litigation should be classified within operating expenses. In our previously issued 2007 quarterly condensed Consolidated Statement of Operations these provisions had been classified within non-operating expenses. As a result, we have restated Corporate Operating Costs and Other Expense to correct the classification of these legal contingencies.
The restatement had the impact on our previously presented financial information as set out below. All amounts are in US$ 000’s:
| As reported previously | Adjustment | As restated | ||||||||||
| Condensed Consolidated Statement of Operations (for the six months ended June 30, 2007) | ||||||||||||
| Net revenues | 364,196 | - | 364,196 | |||||||||
| Corporate operating costs | 16,248 | 5,969 | 22,217 | |||||||||
| Operating income | 85,835 | (5,969 | ) | 79,866 | ||||||||
| Other expense | (6,759 | ) | 5,969 | (790 | ) | |||||||
| Net income | 34,340 | - | 34,340 | |||||||||
Stock-based compensation
Subsequent to the issuance of our financial statements as of and for the period ended June 30, 2006 we initiated a voluntary review of our historical stock option granting practices for the period from 1994 to 2002. Our Audit Committee conducted the review with the assistance of independent legal counsel and an independent accounting firm. The Audit Committee found certain instances of administrative and procedural deficiencies that resulted in incorrect accounting measurement dates and other incorrect accounting, but found no evidence from which it could be concluded that the errors were the result of deliberate or intentional misconduct. These accounting errors resulted from grants made to grantees where the list of grantees and/or shares allocated to them were not sufficiently definitive for the grant to be deemed final as of the reported measurement date as well as from a small number of grants made to employees and non-employees that had been accounted for incorrectly. Errors were discovered in the accounting for grants made in the period between 1994 and 1998; we believe the impact of these instances to be immaterial for each prior year and they neither relate to nor have an impact on the current period.
However, we concluded that correcting the error in the financial statements for the year ended December 31, 2006 would be material; therefore, in accordance with Staff Accounting Bulletin No. 108 Section N to Topic 1 “Considering the Effects of Prior Year Misstatements in Current Year Financial Statements”, we restated our historical financial statements.
The restatement above had the impact on our previously presented financial information as set out below. All amounts are in US$ 000’s.
CENTRAL EUROPEAN MEDIA ENTERPRISES LTD.
NOTES TO CONDENSED CONSOLIDATED FINANCIAL STATEMENTS
(Tabular amounts in US$ 000’s, except share and per share data)
(Unaudited)
As reported previously | Adjustment | As restated | ||||||||||
| Balance Sheet (as of June 30, 2006) | ||||||||||||
| Additional paid-in capital at June 30, 2006 | $ | 917,755 | $ | 7,181 | $ | 924,936 | ||||||
| Accumulated deficit at June 30, 2006 | (54,715 | ) | (7,181 | ) | (61,896 | ) | ||||||
3. ACQUISITIONS AND DISPOSALS
Romania
Acquisition of additional interest – Sport.ro
On December 14, 2006 we acquired 20.0% of Sport.ro from Silviu Prigoana for cash consideration of EUR 2.0 million (approximately US$ 2.6 million). Sport.ro operated a sports-oriented channel focusing on local and international football, international boxing and a number of local Romanian sports.
On February 20, 2007 we acquired control of Sport.ro by acquiring an additional 50.0% interest from Nolsom Limited for cash consideration of EUR 4.2 million (approximately US$ 5.3 million). We acquired the remaining 30.0% of Sport.ro, also from Nolsom Limited, on March 15, 2007 for cash consideration of EUR 2.5 million (approximately US$ 3.1 million).
We performed a fair value exercise to allocate the purchase price to the acquired assets and liabilities and identified separately identifiable assets. The following table summarizes the preliminary fair values of the assets acquired and liabilities assumed at the date of acquisition:
| Fair Value on Acquisition | ||||
| Property, plant and equipment | $ | 35 | ||
| Intangible assets subject to amortization (1) | 4,784 | |||
| Intangible assets not subject to amortization (2) | 8,974 | |||
| Other assets | 2,904 | |||
| Goodwill | 2,311 | |||
| Deferred tax liability | (1,575 | ) | ||
| Other liabilities | (6,398 | ) | ||
| Total purchase price | $ | 11,035 | ||
| (1) The intangible assets subject to amortization comprise customer relationships, which are being amortized over one to twenty years (weighted average: 15.5 years) and trademarks, which are being amortized over two years. | ||||
| (2) Intangible assets not subject to amortization represent television broadcast licenses. | ||||
Acquisition of additional interest – MPI and Pro TV
On May 16, 2007, we acquired an additional 20.0% of Media Vision and subsequently on June 1, 2007 we acquired an additional 5.0% of Pro TV and MPI from companies owned by, or individuals associated with, Adrian Sarbu, for aggregate consideration of US$ 51.6 million including acquisition costs. We now own a 95.0% voting and economic interests in Pro TV, MPI and Media Vision. We performed a fair value exercise to allocate the purchase price to the acquired assets and liabilities, and identified separately identifiable assets. The following table summarizes the fair values of the assets acquired and liabilities assumed at the date of acquisition:
CENTRAL EUROPEAN MEDIA ENTERPRISES LTD.
NOTES TO CONDENSED CONSOLIDATED FINANCIAL STATEMENTS
(Tabular amounts in US$ 000’s, except share and per share data)
(Unaudited)
| Fair Value on Acquisition | ||||
| Intangible assets subject to amortization (1) | $ | 4,517 | ||
| Intangible assets not subject to amortization (2) | 23,597 | |||
| Goodwill | 23,974 | |||
| Deferred tax liability | (4,498 | ) | ||
| Minority interests | 4,029 | |||
| Total purchase price | $ | 51,619 | ||
| (1) The intangible assets subject to amortization comprise customer relationships, which are being amortized over one to ten years (weighted average: 8.3 years). | ||||
| (2) Intangible assets not subject to amortization comprise approximately US$ 9.2 million in trademarks and US$ 14.4 million relating to television broadcast licenses. | ||||
Mr. Sarbu has the right to sell the remaining shareholding in Pro TV and MPI that he holds personally to us under a put option agreement entered into in July 2004 at a price to be determined by an independent valuation, subject to a floor price of US$ 1.45 million for each 1.0% interest sold. Mr. Sarbu’s right to put his remaining shareholding to us is exercisable from November 12, 2009, provided that we have not enforced a pledge over this shareholding which Mr. Sarbu granted as security for our right to put to him our shareholding in Media Pro. As at June 30, 2007, we consider the fair value of Mr. Sarbu’s put option to be approximately US$ nil.
Croatia
Internet Dnevnik
On June 6, 2007, we purchased 76.0% of Internet Dnevnik d.o.o from Zeljko Anderlon and Dario Markus for cash consideration of EUR 0.5 million (US$ 0.7 million). Internet Dnevnik d.o.o operates the largest blogging website in Croatia, Blog.hr.
Ukraine (KINO, CITI)
Tor and Zhysa
On June 21, 2007, we completed the acquisition of a 60.4% interest in each of Tor and Zhysa from Dertus Finance Group Limited for total consideration of US$ 3.2 million including acquisition costs. Zhysa and Tor are regional broadcasters in Ukraine.
We have initiated a fair value exercise to allocate the purchase price to the acquired assets and liabilities. Upon completion of the fair value exercise, we expect the purchase price allocation to primarily include television broadcasting licenses and goodwill. The final allocation of the purchase price will be subject to adjustment following the completion of the fair value exercise.
CENTRAL EUROPEAN MEDIA ENTERPRISES LTD.
NOTES TO CONDENSED CONSOLIDATED FINANCIAL STATEMENTS
(Tabular amounts in US$ 000’s, except share and per share data)
(Unaudited)
4. GOODWILL AND INTANGIBLE ASSETS
Our goodwill and intangible asset additions are the result of acquisitions in Croatia, the Czech Republic, Romania, the Slovak Republic, Slovenia and Ukraine. No goodwill is expected to be deductible for tax purposes.
Goodwill:
Goodwill by operating segment as at June 30, 2007 and December 31, 2006 is summarized as follows:
Balance December 31, 2006 | Additions | Foreign currency movement | Balance June 30, 2007 | |||||||||||||
| Croatia | $ | - | $ | 712 | $ | - | $ | 712 | ||||||||
| Czech Republic | 823,786 | - | (14,804 | ) | 808,982 | |||||||||||
| Romania | 31,130 | 26,285 | - | 57,415 | ||||||||||||
| Slovak Republic | 25,483 | - | 1,427 | 26,910 | ||||||||||||
| Slovenia | 16,458 | - | 415 | 16,873 | ||||||||||||
| Ukraine (STUDIO 1+1) | 4,096 | - | - | 4,096 | ||||||||||||
| Ukraine (KINO, CITI) | 4,627 | 3,124 | - | 7,751 | ||||||||||||
| Total | $ | 905,580 | $ | 30,121 | $ | (12,962 | ) | $ | 922,739 | |||||||
Broadcast licenses:
The net book value of our broadcast licenses as at June 30, 2007 and December 31, 2006 is summarized as follows:
| Indefinite-Lived Broadcast Licenses | Amortized Broadcast Licenses | Total | ||||||||||
| Balance, December 31, 2006 | $ | 26,344 | $ | 172,386 | $ | 198,730 | ||||||
| Additions | 23,421 | - | 23,421 | |||||||||
| Amortization | - | (8,446 | ) | (8,446 | ) | |||||||
| Foreign currency movements | 132 | (2,956 | ) | (2,824 | ) | |||||||
| Balance, June 30, 2007 | $ | 49,897 | $ | 160,984 | $ | 210,881 | ||||||
With the exception of our broadcast licenses in the Czech Republic, Slovak Republic and Ukraine, our broadcast licenses primarily have indefinite lives and are subject to annual impairment reviews. The licenses in Ukraine have economic useful lives of, and are amortized on a straight-line basis over, between two and ten years. The license in the Czech Republic has an economic useful life of, and is amortized on a straight-line basis over, twelve years. The license in the Slovak Republic has an economic useful life of, and is amortized on a straight-line basis over, thirteen years.
The gross value and accumulated amortization of amortized broadcast licenses was as follows at June 30, 2007 and December 31, 2006:
CENTRAL EUROPEAN MEDIA ENTERPRISES LTD.
NOTES TO CONDENSED CONSOLIDATED FINANCIAL STATEMENTS
(Tabular amounts in US$ 000’s, except share and per share data)
(Unaudited)
June 30, 2007 | December 31, 2006 | |||||||
| Gross value | $ | 198,523 | $ | 201,994 | ||||
| Accumulated amortization | (37,539 | ) | (29,608 | ) | ||||
| Total net book value | $ | 160,984 | $ | 172,386 | ||||
Other intangible assets:
The net book value of our other intangible assets as at June 30, 2007 and December 31, 2006 is summarized as follows:
| Trademarks | Customer Relationships | Other | Total | |||||||||||||
| Balance, December 31, 2006 | $ | 44,026 | $ | 27,213 | $ | 703 | $ | 71,942 | ||||||||
| Additions | 9,787 | 8,664 | 14 | 18,465 | ||||||||||||
| Amortization | (106 | ) | (1,727 | ) | (48 | ) | (1,881 | ) | ||||||||
| Foreign currency movements | (241 | ) | 127 | 52 | (62 | ) | ||||||||||
| Balance, June 30, 2007 | $ | 53,466 | $ | 34,277 | $ | 721 | $ | 88,464 | ||||||||
Customer relationships are deemed to have an economic useful life of, and are amortized on a straight-line basis over, five to fourteen years. Other than the trademark acquired with Sport.ro, which has an economic life of, and is being amortized on a straight line basis over, two years, trademarks have an indefinite life.
The gross value and accumulated amortization of other intangible assets was as follows at June 30, 2007 and December 31, 2006:
June 30, 2007 | December 31, 2006 | |||||||
| Gross value | $ | 95,359 | $ | 76,695 | ||||
| Accumulated amortization | (6,895 | ) | (4,753 | ) | ||||
| Total net book value | $ | 88,464 | $ | 71,942 | ||||
5. SENIOR NOTES
Our Senior Notes consist of the following:
| Carrying Value | Fair Value | |||||||||||||||
June 30, 2007 | December 31, 2006 | June 30, 2007 | December 31, 2006 | |||||||||||||
| EUR 245.0 million 8.25% Senior Notes | $ | 330,858 | $ | 322,666 | $ | 357,326 | $ | 353,722 | ||||||||
| EUR 125.0 million Floating Rate Senior Notes | - | 164,625 | - | 170,181 | ||||||||||||
| EUR 150.0 million Floating Rate Senior Notes | 202,566 | - | 202,313 | - | ||||||||||||
| $ | 533,424 | $ | 487,291 | $ | 559,639 | $ | 523,903 | |||||||||
CENTRAL EUROPEAN MEDIA ENTERPRISES LTD.
NOTES TO CONDENSED CONSOLIDATED FINANCIAL STATEMENTS
(Tabular amounts in US$ 000’s, except share and per share data)
(Unaudited)
On May 5, 2005, we issued Senior Notes in the aggregate principal amount of EUR 370.0 million consisting of EUR 245.0 million of 8.25% Senior Notes due May 2012 (the “Fixed Rate Notes”) and EUR 125.0 million of floating rate Senior Notes due May 2012 (the “2012 Floating Rate Notes”), which bore interest at six-month Euro Inter-Bank Offered Rate (“EURIBOR”) plus 5.50%.
On May 15, 2007 we redeemed the 2012 Floating Rate Notes. Upon redemption we recorded a loss of US$ 6.9 million within interest expense comprising US$ 3.4 million of redemption premium and US$ 3.5 million to write off unamortized debt costs.
On May 16, 2007 we issued floating rate senior notes due November 2014 (the “2014 Floating Rate Notes”) in the aggregate principal amount of EUR 150.0 million, which bear interest at six-month EURIBOR plus 1.625% (5.80% was applicable at June 30, 2007).
Fixed Rate Notes
Interest is payable semi-annually in arrears on each May 15 and November 15. The fair value of the Fixed Rate Notes as at June 30, 2007 was calculated by multiplying the outstanding debt by the traded market price.
The Fixed Rate Notes are secured senior obligations and rank pari passu with all existing and future senior indebtedness and are effectively subordinated to all existing and future indebtedness of our subsidiaries. The amounts outstanding are guaranteed by two subsidiary holding companies and are secured by a pledge of shares of those subsidiaries as well as an assignment of certain contractual rights. The terms of our indebtedness restrict the manner in which our business is conducted, including the incurrence of additional indebtedness, the making of investments, the payment of dividends or the making of other distributions, entering into certain affiliate transactions and the sale of assets.
In the event that (A) there is a change in control by which (i) any party other than our present shareholders becomes the beneficial owner of more than 35.0% of our total voting power; (ii) we agree to sell substantially all of our operating assets; or (iii) there is a change in the composition of a majority of our Board of Directors; and (B) on the 60th day following any such change of control the rating of the Fixed Rate Notes is either withdrawn or downgraded from the rating in effect prior to the announcement of such change of control, we can be required to repurchase the Fixed Rate Notes at a purchase price in cash equal to 101.0% of the principal amount of the Fixed Rate Notes plus accrued and unpaid interest to the date of purchase.
The Fixed Rate Notes are redeemable at our option, in whole or in part, at the redemption prices set forth below:
| From: | Fixed Rate Notes Redemption Price | |||
| May 15, 2009 to May 14, 2010 | 104.125 | % | ||
| May 15, 2010 to May 14, 2011 | 102.063 | % | ||
| May 15, 2011 and thereafter | 100.000 | % | ||
At any time prior to May 15, 2008, we may redeem up to 35.0% of the Fixed Rate Notes with the proceeds of any public equity offering at a price of 108.250% of the principal amount of such notes, plus accrued and unpaid interest, if any, to the redemption date.
CENTRAL EUROPEAN MEDIA ENTERPRISES LTD.
NOTES TO CONDENSED CONSOLIDATED FINANCIAL STATEMENTS
(Tabular amounts in US$ 000’s, except share and per share data)
(Unaudited)
In addition, prior to May 15, 2009, we may redeem all or a part of the Fixed Rate Notes at a redemption price equal to 100.0% of the principal amount of such notes, plus a “make-whole” premium and accrued and unpaid interest to the redemption date.
Certain derivative instruments, including redemption call options and change of control and asset disposition put options, have been identified as being embedded in the Fixed Rate Notes; but as they are considered clearly and closely related to those notes, they are not accounted for separately.
2014 Floating Rate Notes
Interest is payable semi-annually in arrears on each May 15 and November 15. The fair value of the 2014 Floating Rate Notes as at June 30, 2007 was calculated by multiplying the outstanding debt by the traded market price.
The 2014 Floating Rate Notes are secured senior obligations and rank pari passu with all existing and future senior indebtedness and are effectively subordinated to all existing and future indebtedness of our subsidiaries. The amounts outstanding are guaranteed by two subsidiary holding companies and are secured by a pledge of shares of those subsidiaries as well as an assignment of certain contractual rights. The terms of our indebtedness restrict the manner in which our business is conducted, including the incurrence of additional indebtedness, the making of investments, the payment of dividends or the making of other distributions, entering into certain affiliate transactions and the sale of assets.
In the event that (A) there is a change in control by which (i) any party other than our present shareholders becomes the beneficial owner of more than 35.0% of our total voting power; (ii) we agree to sell substantially all of our operating assets; or (iii) there is a change in the composition of a majority of our Board of Directors; and (B) on the 60th day following any such change of control the rating of the 2014 Floating Rate Notes is either withdrawn or downgraded from the rating in effect prior to the announcement of such change of control, we can be required to repurchase the 2014 Floating Rate Notes at a purchase price in cash equal to 101.0% of the principal amount of the 2014 Floating Rate Notes plus accrued and unpaid interest to the date of purchase.
The 2014 Floating Rate Notes are redeemable at our option, in whole or in part, at the redemption prices set forth below:
| From: | 2014 Floating Rate Notes Redemption Price | |||
| November 15, 2007 to May 14, 2008 | 102.000 | % | ||
| May 15, 2008 to May 14, 2009 | 101.000 | % | ||
| May 15, 2009 and thereafter | 100.000 | % | ||
Certain derivative instruments, including redemption call options and change of control and asset disposition put options, have been identified as being embedded in the 2014 Floating Rate Notes; but as they are considered clearly and closely related to those notes, they are not accounted for separately.
CENTRAL EUROPEAN MEDIA ENTERPRISES LTD.
NOTES TO CONDENSED CONSOLIDATED FINANCIAL STATEMENTS
(Tabular amounts in US$ 000’s, except share and per share data)
(Unaudited)
6. RESTRICTED CASH
Restricted cash consists of the following at June 30, 2007 and December 31, 2006:
June 30, 2007 | December 31, 2006 | |||||||
| Croatia | $ | 383 | $ | 4,183 | ||||
| Slovenia | 743 | 724 | ||||||
| Ukraine (STUDIO 1+1) | 48 | 47 | ||||||
| Total restricted cash | $ | 1,174 | $ | 4,954 | ||||
Restricted cash held in escrow in Croatia was paid out to the former owners of our Croatia operations on May 11, 2007.
7. ACCOUNTS RECEIVABLE
Accounts receivable consist of the following at June 30, 2007 and December 31, 2006:
June 30, 2007 | December 31, 2006 | |||||||
| Trading: | ||||||||
| Third-party customers | $ | 187,160 | $ | 156,701 | ||||
| Less: allowance for bad debts and credit notes | (12,748 | ) | (11,472 | ) | ||||
| Related parties | 5,114 | 7,655 | ||||||
| Less: allowance for bad debts and credit notes | (134 | ) | (798 | ) | ||||
| Total trading | $ | 179,392 | $ | 152,086 | ||||
| Other: | ||||||||
| Third-party customers | $ | 365 | $ | 359 | ||||
| Less: allowance for bad debts and credit notes | (105 | ) | (103 | ) | ||||
| Related parties | 468 | 454 | ||||||
| Less: allowance for bad debts and credit notes | (61 | ) | (291 | ) | ||||
| Total other | $ | 667 | $ | 419 | ||||
| Total accounts receivable | $ | 180,059 | $ | 152,505 | ||||
At June 30, 2007, CZK 650 million (approximately US$ 30.6 million) (December 31, 2006: CZK 600.0 million, approximately US$ 28.7 million) of receivables in the Czech Republic were pledged as collateral subject to a factoring agreement (see Note 11).
CENTRAL EUROPEAN MEDIA ENTERPRISES LTD.
NOTES TO CONDENSED CONSOLIDATED FINANCIAL STATEMENTS
(Tabular amounts in US$ 000’s, except share and per share data)
(Unaudited)
8. OTHER ASSETS
Other current and non-current assets consist of the following at June 30, 2007 and December 31, 2006:
June 30, 2007 | December 31, 2006 | |||||||
| Current: | ||||||||
| Prepaid programming | $ | 32,531 | $ | 23,072 | ||||
| Other prepaid expenses | 17,182 | 13,177 | ||||||
| Deferred tax | 2,872 | 2,124 | ||||||
| VAT recoverable | 2,328 | 2,562 | ||||||
| Loan to related party | 600 | 600 | ||||||
| Capitalized debt issuance costs | 2,723 | 2,908 | ||||||
| Other | 3,519 | 3,112 | ||||||
| Total other current assets | $ | 61,755 | $ | 47,555 | ||||
| Non-current: | ||||||||
| Capitalized debt costs | $ | 10,765 | $ | 11,264 | ||||
| Loan to related party | 1,441 | 1,603 | ||||||
| Deferred tax | 4,636 | 3,443 | ||||||
| Other | 2,309 | 1,165 | ||||||
| Total other non-current assets | $ | 19,151 | $ | 17,475 | ||||
Capitalized debt costs primarily comprise the costs incurred in connection with the issuance of our Senior Notes in May 2005 and May 2007 (see Note 5) and are being amortized over the term of the Senior Notes.
CENTRAL EUROPEAN MEDIA ENTERPRISES LTD.
NOTES TO CONDENSED CONSOLIDATED FINANCIAL STATEMENTS
(Tabular amounts in US$ 000’s, except share and per share data)
(Unaudited)
9. PROPERTY, PLANT AND EQUIPMENT
Property, plant and equipment consists of the following at June 30, 2007 and December 31, 2006:
June 30, 2007 | December 31, 2006 | |||||||
| Land and buildings | $ | 57,958 | $ | 56,212 | ||||
| Station machinery, fixtures and equipment | 124,354 | 115,238 | ||||||
| Other equipment | 23,933 | 21,980 | ||||||
| Software licenses | 17,283 | 15,495 | ||||||
| Construction in progress | 18,404 | 4,070 | ||||||
| Total cost | 241,932 | 212,995 | ||||||
| Less: Accumulated depreciation | (111,751 | ) | (97,190 | ) | ||||
| Total net book value | $ | 130,181 | $ | 115,805 | ||||
| Assets held under capital leases (included above) | ||||||||
| Land and buildings | $ | 5,682 | $ | 5,541 | ||||
| Station machinery, fixtures and equipment | 1,674 | 2,330 | ||||||
| Total cost | 7,356 | 7,871 | ||||||
| Less: Accumulated depreciation | (1,533 | ) | (1,877 | ) | ||||
| Net book value | $ | 5,823 | $ | 5,994 | ||||
10. ACCOUNTS PAYABLE AND ACCRUED LIABILITIES
Accounts payable and accrued liabilities consist of the following at June 30, 2007 and December 31, 2006:
June 30, 2007 | December 31, 2006 | |||||||
| Accounts payable | $ | 27,080 | $ | 47,447 | ||||
| Programming liabilities | 38,647 | 32,316 | ||||||
| Accrued interest payable | 5,149 | 5,375 | ||||||
| Deferred income | 20,505 | 3,212 | ||||||
| Accrued staff costs | 16,854 | 12,947 | ||||||
| Accrued production costs | 7,197 | 7,435 | ||||||
| Accrued legal costs | 8,709 | 3,619 | ||||||
| Accrued rent costs | 1,339 | 1,163 | ||||||
| Authors’ rights | 7,215 | 943 | ||||||
| Onerous contracts | 1,804 | - | ||||||
| Other accrued liabilities | 7,141 | 5,260 | ||||||
| Total accounts payable and accrued liabilities | $ | 141,640 | $ | 119,717 | ||||
CENTRAL EUROPEAN MEDIA ENTERPRISES LTD.
NOTES TO CONDENSED CONSOLIDATED FINANCIAL STATEMENTS
(Tabular amounts in US$ 000’s, except share and per share data)
(Unaudited)
11. CREDIT FACILITIES AND OBLIGATIONS UNDER CAPITAL LEASES
Group loan obligations and overdraft facilities consist of the following at June 30, 2007 and December 31, 2006:
June 30, 2007 | December 31, 2006 | ||||||||
| Credit facilities: | |||||||||
| Corporate | (a) | $ | - | $ | - | ||||
| Croatia | (b) | - | 847 | ||||||
| Czech Republic | (c) – (e) | 11,760 | 11,975 | ||||||
| Romania | (f) | 40 | - | ||||||
| Slovenia | (g) | - | - | ||||||
| Ukraine (KINO, CITI) | (h) | 1,705 | 1,703 | ||||||
| Total credit facilities | $ | 13,505 | $ | 14,525 | |||||
| Capital leases: | |||||||||
| Croatia operations, net of interest | $ | - | $ | 19 | |||||
| Romania operations, net of interest | 430 | 495 | |||||||
| Slovak Republic operations, net of interest | 112 | 154 | |||||||
| Slovenia operations, net of interest | 4,188 | 4,223 | |||||||
| Total capital leases | $ | 4,730 | $ | 4,891 | |||||
| Total credit facilities and capital leases | $ | 18,235 | $ | 19,416 | |||||
| Less current maturities | (12,433 | ) | (13,057 | ) | |||||
| Total non-current maturities | $ | 5,802 | $ | 6,359 | |||||
Corporate
(a) On July 21, 2006, we entered into a five-year revolving loan agreement for EUR 100.0 million (approximately US$ 135.1 million) arranged by the European Bank for Reconstruction and Development (the “Loan”). ING Bank N.V. (“ING”) and Ceska Sporitelna, a.s. (“CS”) are participating in the facility for EUR 50.0 million in aggregate.
The Loan bears interest at a rate of three-month EURIBOR plus 2.75% on the drawn amount. The available amount of the Loan amortizes by 7.5% every six months from May 2008 to November 2009, then by 15% in May 2010 and November 2010, and by 40% in May 2011.
Covenants contained in the Loan are in line with those contained in our Senior Notes (see Note 5). In addition, the Loan’s covenants restrict us from making principal repayments on other debt of greater than US$ 20.0 million per year for the life of the Loan. This restriction is not applicable to our existing facilities with ING or CS or to any refinancing of our Senior Notes.
The Loan is a secured senior obligation and ranks pari passu with all existing and future senior indebtedness, including the Senior Notes, and is effectively subordinated to all existing and future indebtedness of our subsidiaries. The amount drawn is guaranteed by two subsidiary holding companies and is secured by a pledge of shares of those subsidiaries as well as an assignment of certain contractual rights. The terms of the Loan restrict the manner in which our business is conducted, including the incurrence of additional indebtedness, the making of investments, the payment of dividends or the making of other distributions, entering into certain affiliate transactions and the sale of assets.
CENTRAL EUROPEAN MEDIA ENTERPRISES LTD.
NOTES TO CONDENSED CONSOLIDATED FINANCIAL STATEMENTS
(Tabular amounts in US$ 000’s, except share and per share data)
(Unaudited)
There were no drawings under this facility as at June 30, 2007; however, the full amount of EUR 100.0 million was drawn on April 18, 2007 and repaid on June 1, 2007.
Croatia
(b) On March 28, 2007, we repaid EUR 0.6 million (approximately US$ 0.8 million) which was the total amount outstanding to our Croatia operations under two loan agreements with Hypo Alpe-Adria Bank d.d. Following repayment of this loan, the security held by the bank was released.
Czech Republic
(c) As at June 30, 2007, there were no drawings by CET 21 under a four-year credit facility of CZK 1.2 billion (approximately US$ 56.4 million) available until October 31, 2009 with Ceska Sporitelna, a.s. (“CS”). This facility may, at the option of CET 21, be drawn in CZK, US$ or EUR and bears interest at the three-month, six-month or twelve-month London Inter-Bank Offered Rate (“LIBOR”), EURIBOR or Prague Inter-Bank Offered Rate (“PRIBOR”) rate plus 1.95%. This facility is secured by a pledge of receivables, which are also subject to a factoring arrangement with Factoring Ceska Sporitelna, a.s., a subsidiary of CS. On July 10, 2007, CZK 860.0 million (approximately US$ 40.4 million) was drawn down under this facility and on July 31, 2007, CZK 260.0 million (approximately US$ 12.7 million) was repaid.
(d) CZK 250.0 million (approximately US$ 11.8 million), the full amount of the facility, had been drawn by CET 21 under a working capital facility agreement with CS with a maturity date of April 30, 2008 and bearing interest at the three-month PRIBOR plus 1.65% (three-month PRIBOR relevant to drawings under this facility at June 30, 2007 was 3.00%). This facility is secured by a pledge of receivables, which are also subject to a factoring arrangement with Factoring Ceska Sporitelna, a.s.
(e) As at June 30, 2007, there were no drawings under a CZK 300.0 million (approximately US$ 14.1 million) factoring facility with Factoring Ceska Sporitelna, a.s. available until March 31, 2010. The facility bears interest at one-month PRIBOR plus 1.40% for the period that actively assigned accounts receivable are outstanding.
Romania
(f) As at June 30, 2007, an amount of RON 97 thousand (approximately US$ 40 thousand) was outstanding under a loan agreement from one of the founding shareholders of Sport.ro. The loan is interest free and is repayable in equal monthly instalments by August 31, 2007.
Slovenia
(g) On July 29, 2005, Pro Plus entered into a revolving facility agreement for up to EUR 37.5 million (approximately US$ 50.6 million) in aggregate principal amount with ING Bank N.V., Nova Ljubljanska Banka d.d., Ljubljana and Bank Austria Creditanstalt d.d., Ljubljana. The facility amortizes by 10.0% each year for four years commencing one year after signing, with 60.0% repayable after five years. This facility is secured by a pledge of the bank accounts of Pro Plus, the assignment of certain receivables, a pledge of our interest in Pro Plus and a guarantee of our wholly-owned subsidiary CME Media Enterprises B.V. Loans drawn under this facility will bear interest at a rate of EURIBOR for the period of drawing plus a margin of between 2.1% and 3.6% that varies according to the ratio of consolidated net debt to consolidated broadcasting cash flow for Pro Plus. As at June 30, 2007, EUR 33.8 million (approximately US$ 45.6 million) was available for drawing under this revolving facility and there were no drawings outstanding.
CENTRAL EUROPEAN MEDIA ENTERPRISES LTD.
NOTES TO CONDENSED CONSOLIDATED FINANCIAL STATEMENTS
(Tabular amounts in US$ 000’s, except share and per share data)
(Unaudited)
Ukraine (KINO, CITI)
(h) Our Ukraine (KINO, CITI) operations have entered into a number of three-year unsecured loans with Glavred-Media, LLC, the minority shareholder in Ukrpromtorg. As at June 30, 2007, the total value of loans drawn was US$ 1.7 million. The loans are repayable between August 2009 and December 2009 and bear interest at 9.0%.
Total Group
At June 30, 2007, the maturity of our debt (including our Senior Notes) is as follows:
| 2007 | $ | 11,805 | ||
| 2008 | - | |||
| 2009 | 1,700 | |||
| 2010 | - | |||
| 2011 | - | |||
| 2012 and thereafter | 533,424 | |||
| Total | $ | 546,929 |
Capital Lease Commitments
We lease certain of our office and broadcast facilities as well as machinery and equipment under various leasing arrangements. The future minimum lease payments from continuing operations, by year and in the aggregate, under capital leases with initial or remaining non-cancelable lease terms in excess of one year, consisted of the following at June 30, 2007:
| 2007 | $ | 464 | ||
| 2008 | 1,190 | |||
| 2009 | 726 | |||
| 2010 | 620 | |||
| 2011 | 620 | |||
| 2012 and thereafter | 3,024 | |||
| $ | 6,644 | |||
| Less: amount representing interest | (1,914 | ) | ||
| Present value of net minimum lease payments | $ | 4,730 |
12. FINANCIAL INSTRUMENTS
On April 27, 2006, we entered into currency swap agreements with two counterparties whereby we swapped a fixed annual coupon interest rate (of 9.0%) on notional principal of CZK 10.7 billion (approximately US$ 503.3 million), payable on July 15, October 15, January 15, and April 15, to the termination date of April 15, 2012, for a fixed annual coupon interest rate (of 9.0%) on notional principal of EUR 375.9 million (approximately US$ 507.6 million) receivable on July 15, October 15, January 15, and April 15, to the termination date of April 15, 2012.
The fair value of these financial instruments as at June 30, 2007 was a US$ 0.5 million liability.
CENTRAL EUROPEAN MEDIA ENTERPRISES LTD.
NOTES TO CONDENSED CONSOLIDATED FINANCIAL STATEMENTS
(Tabular amounts in US$ 000’s, except share and per share data)
(Unaudited)
These currency swap agreements reduce our exposure to movements in foreign exchange rates on a part of the CZK-denominated cash flows generated by our Czech Republic operations that is approximately equivalent in value to the Euro-denominated interest payments on our Senior Notes (see Note 5). They are financial instruments that are used to minimize currency risk and are considered an economic hedge of foreign exchange rates. These instruments have not been designated as hedging instruments as defined under FASB Statement No. 133, “Accounting for Derivative Instruments and Hedging Activities”, and so changes in their fair value are recorded in the consolidated statement of operations and in the consolidated balance sheet in other non-current liabilities.
13. SHAREHOLDERS’ EQUITY
Preferred Stock
5,000,000 shares of Preferred Stock, with a $0.08 par value, were authorized as at June 30, 2007 and December 31, 2006. None were issued and outstanding as at June 30, 2007 and December 31, 2006.
Class A and B Common Stock
100,000,000 shares of Class A Common Stock and 15,000,000 shares of Class B Common Stock were authorized as at June 30, 2007 and December 31, 2006. The rights of the holders of Class A Common Stock and Class B Common Stock are identical except for voting rights. The shares of Class A Common Stock are entitled to one vote per share and the shares of Class B Common Stock are entitled to ten votes per share. Class B Common Stock is convertible into Class A Common Stock for no additional consideration on a one-for-one basis. Holders of each class of shares are entitled to receive dividends and upon liquidation or dissolution are entitled to receive all assets available for distribution to shareholders. The holders of each class have no preemptive or other subscription rights and there are no redemption or sinking fund provisions with respect to such shares.
14. STOCK-BASED COMPENSATION
The charge for stock-based compensation in our condensed consolidated statements of operations is as follows:
For the Three Months Ended June 30, | For the Six Months Ended June 30, | |||||||||||||||
| 2007 | 2006 | 2007 | 2006 | |||||||||||||
| Stock-based compensation charged under SFAS 123(R) | $ | 1,343 | $ | 730 | $ | 2,605 | $ | 1,418 | ||||||||
Under the provisions of SFAS 123(R), the fair value of stock options is estimated on the grant date using the Black-Scholes option-pricing model and recognized ratably over the requisite service period.
2007 Option Grants
Pursuant to the Amended and Restated 1995 Stock Incentive Plan, the Compensation Committee of our Board of Directors awarded grant of options to executives to purchase 12,500 shares of our Class A Common Stock, with a vesting period of four years and a contractual life of ten years, on April 2, 2007.
Pursuant to the Amended and Restated 1995 Stock Incentive Plan, the Compensation Committee of our Board of Directors awarded grant of options to non-executive directors to purchase 35,000 shares of our Class A Common Stock and 5,000 shares of our Class B Common Stock with a vesting period of one year and a contractual life of five years on June 5, 2007.
CENTRAL EUROPEAN MEDIA ENTERPRISES LTD.
NOTES TO CONDENSED CONSOLIDATED FINANCIAL STATEMENTS
(Tabular amounts in US$ 000’s, except share and per share data)
(Unaudited)
The exercise price of the granted options ranges from US$ 87.91 to US$ 94.28 per share. The fair value of the option grants was estimated on the date of the grant using the Black-Scholes option-pricing model, with the following assumptions used:
Date of Option Grant | Number of Options Granted | Risk-free interest rate (%) | Expected term (years) | Expected volatility (%) | Dividend yield (%) | Weighted-average fair value ($/share) | ||||||||||||||||||
| April 2, 2007 | 12,500 | 4.57 | % | 6.25 | 41.29 | % | 0 | % | $ | 42.25 | ||||||||||||||
| June 5, 2007 (Class A) | 35,000 | 4.92 | % | 3.00 | 32.38 | % | 0 | % | $ | 25.19 | ||||||||||||||
| June 5, 2007 (Class B) | 5,000 | 4.92 | % | 3.00 | 32.38 | % | 0 | % | $ | 23.35 | ||||||||||||||
The expected stock price volatility was calculated based on an analysis of the historical stock price volatility of our shares and its peers for the preceding 6.25 or 3.00-year period. We consider this basis to represent the best indicator of expected volatility over the life of the option. The expected dividend yield for these grants was assumed to be 0%. The weighted average fair value of all the grants made in the three months and six months ended June 30, 2007 was US$ 29.08 per option. In accordance with SFAS 123(R), the fair value of the option grants made in the six months ended June 30, 2007 less expected forfeitures of US$ 1.5 million is being recognized as an expense in the consolidated statement of operations over the requisite service period of the award.
A summary of option activity for the six months ended June 30, 2007 is presented below:
Shares | Weighted Average Exercise Price per Share | Weighted Average Remaining Contractual Term (years) | Aggregate Intrinsic Value | |||||||||||||
| Outstanding at December 31, 2007 | 1,288,575 | $ | 35.51 | 7.45 | $ | 44,443 | ||||||||||
| Granted | 52,500 | 89.77 | ||||||||||||||
| Exercised | (227,783 | ) | 11.99 | |||||||||||||
| Forfeited | (18,125 | ) | 46.76 | |||||||||||||
| Outstanding at June 30, 2007 | 1,095,167 | $ | 42.82 | 7.14 | $ | 59,974 | ||||||||||
| Vested or expected to vest at June 30, 2007 | 1,022,652 | 42.09 | 7.07 | 56,747 | ||||||||||||
| Exercisable at June 30, 2007 | 467,792 | $ | 23.71 | 6.45 | $ | 34,557 | ||||||||||
The exercise of stock options is expected to generate a net operating loss carryforward in our Delaware subsidiary of US$ 12.2 million. No tax benefit has been recognized in respect of this loss, which will be recorded as an addition to additional paid-in capital when it reduces income tax payable.
The aggregate intrinsic value (the difference between the stock price on the last day of trading of the second quarter of 2007 and the exercise prices multiplied by the number of in-the-money options) represents the total intrinsic value that would have been received by the option holders had all option holders exercised their options as of June 30, 2007. This amount changes based on the fair value of our Common Stock. The total intrinsic value of options exercised during the six months ended June 30, 2007 and 2006, respectively, was US$ 15.6 million and US$ 4.0 million, respectively. As of June 30, 2007, there was US$ 10.5 million of total unrecognized compensation expense related to options. The expense is expected to be recognized over a weighted average period of 1.9 years. Proceeds received from the exercise of stock options was US$ 2.7 million and US$ 1.1 million for the six months ended June 30, 2007 and 2006, respectively.
CENTRAL EUROPEAN MEDIA ENTERPRISES LTD.
NOTES TO CONDENSED CONSOLIDATED FINANCIAL STATEMENTS
(Tabular amounts in US$ 000’s, except share and per share data)
(Unaudited)
15. EARNINGS PER SHARE
The components of basic and diluted earnings per share are as follows:
For the Three Months Ended June 30, | For the Six Months Ended June 30, | |||||||||||||||
| 2007 | 2006 | 2007 | 2006 | |||||||||||||
| Net income / (loss) available for common shareholders | $ | 34,590 | $ | 8,522 | $ | 34,340 | $ | (9,742 | ) | |||||||
| Weighted average outstanding shares of common stock (000’s) | 40,941 | 40,597 | 40,867 | 39,355 | ||||||||||||
| Dilutive effect of employee stock options (000’s) | 466 | 589 | 523 | - | ||||||||||||
| Common stock and common stock equivalents (000’s) | 41,407 | 41,186 | 41,390 | 39,355 | ||||||||||||
| Net income / (loss) per share: | ||||||||||||||||
| Basic | $ | 0.84 | $ | 0.21 | $ | 0.84 | $ | (0.25 | ) | |||||||
| Diluted | $ | 0.83 | $ | 0.21 | $ | 0.83 | $ | (0.25 | ) | |||||||
At June 30, 2007 228,500 (2006: 327,000) stock options were antidilutive to income from continuing operations and excluded from the calculation of earnings per share. These may become dilutive in the future.
16. SEGMENT DATA
We manage our business on a geographic basis and review the performance of each business segment using data that reflects 100% of operating and license company results. Our business segments are comprised of Croatia, the Czech Republic, Romania, the Slovak Republic, Slovenia and our two businesses in Ukraine.
We evaluate the performance of our business segments based on Segment Net Revenues and Segment EBITDA. Segment Net Revenues and Segment EBITDA include our operations in the Slovak Republic which were not consolidated prior to January 23, 2006.
Our key performance measure of the efficiency of our business segments is EBITDA margin. We define Segment EBITDA margin as the ratio of Segment EBITDA to Segment Net Revenue.
Segment EBITDA is determined as segment net income / (loss), which includes program rights amortization costs, before interest, taxes, depreciation and amortization of intangible assets. Items that are not allocated to our business segments for purposes of evaluating their performance and therefore are not included in Segment EBITDA, include:
| · | expenses presented as corporate operating costs in our consolidated statements of operations and comprehensive income; |
| · | stock-based compensation charges; |
| · | foreign currency exchange gains and losses; |
| · | changes in fair value of derivatives; and |
| · | certain unusual or infrequent items (e.g., extraordinary gains and losses, impairments on assets or investments). |
CENTRAL EUROPEAN MEDIA ENTERPRISES LTD.
NOTES TO CONDENSED CONSOLIDATED FINANCIAL STATEMENTS
(Tabular amounts in US$ 000’s, except share and per share data)
(Unaudited)
Below are tables showing our Segment Net Revenues, Segment EBITDA, segment depreciation and segment asset information by operation, including a reconciliation of these amounts to our consolidated results for the three and six months ended June 30, 2007 and 2006 for condensed consolidated statement of operations data and as at June 30, 2007 and December 31, 2006 for condensed consolidated balance sheet data:
| For the Three Months Ended June 30, | ||||||||||||||||
| Segment Net Revenues (1) | Segment EBITDA | |||||||||||||||
| 2007 | 2006 | 2007 | 2006 | |||||||||||||
| Country: | ||||||||||||||||
| Croatia (NOVA TV) | $ | 10,414 | $ | 5,647 | $ | (2,167 | ) | $ | (2,639 | ) | ||||||
| Czech Republic (TV NOVA, GALAXIE SPORT) | 80,544 | 56,312 | 47,595 | 29,509 | ||||||||||||
| Romania (2) | 52,224 | 37,769 | 22,530 | 16,424 | ||||||||||||
| Slovak Republic (MARKIZA TV) | 29,652 | 20,046 | 11,712 | 7,827 | ||||||||||||
| Slovenia (POP TV, KANAL A) | 20,095 | 15,555 | 8,388 | 6,430 | ||||||||||||
| Ukraine (STUDIO 1+1) | 22,701 | 21,062 | 565 | 6,037 | ||||||||||||
| Ukraine (KINO, CITI) | 654 | 198 | (1,755 | ) | (432 | ) | ||||||||||
| Total segment data | $ | 216,284 | $ | 156,589 | $ | 86,868 | $ | 63,156 | ||||||||
| Reconciliation to condensed consolidated statement of operations: | ||||||||||||||||
| Consolidated net revenues / income before provision for income taxes, minority interest and discontinued operations | $ | 216,284 | $ | 156,589 | $ | 53,739 | $ | 12,103 | ||||||||
| Corporate operating costs | - | - | 7,444 | 7,696 | ||||||||||||
| Depreciation of station property, plant and equipment | - | - | 7,680 | 6,059 | ||||||||||||
| Amortization of broadcast licenses and other intangibles | - | - | 5,165 | 4,620 | ||||||||||||
| Impairment charge | - | - | - | 748 | ||||||||||||
| Interest income | - | - | (1,732 | ) | (1,741 | ) | ||||||||||
| Interest expense | - | - | 19,438 | 11,337 | ||||||||||||
| Foreign currency exchange loss, net | - | - | 2,116 | 20,625 | ||||||||||||
| Change in fair value of derivatives | - | - | (7,528 | ) | 1,876 | |||||||||||
| Other income | - | - | 546 | (167 | ) | |||||||||||
| Total segment data | $ | 216,284 | $ | 156,589 | $ | 86,868 | $ | 63,156 | ||||||||
| (1) All net revenues are derived from external customers. There are no inter-segmental revenues. | ||||||||||||||||
| (2) Romanian networks are PRO TV, PRO CINEMA, ACASA, PRO TV INTERNATIONAL and SPORT.RO. | ||||||||||||||||
CENTRAL EUROPEAN MEDIA ENTERPRISES LTD.
NOTES TO CONDENSED CONSOLIDATED FINANCIAL STATEMENTS
(Tabular amounts in US$ 000’s, except share and per share data)
(Unaudited)
| For the Six Months Ended June 30, | ||||||||||||||||
| Segment Net Revenues (1) | Segment EBITDA | |||||||||||||||
| 2007 | 2006 | 2007 | 2006 | |||||||||||||
| Country: | ||||||||||||||||
| Croatia (NOVA TV) | $ | 17,646 | $ | 9,457 | $ | (6,819 | ) | $ | (7,081 | ) | ||||||
| Czech Republic (TV NOVA, GALAXIE SPORT) | 132,063 | 96,861 | 73,262 | 42,335 | ||||||||||||
| Romania (2) | 91,566 | 67,640 | 37,666 | 28,037 | ||||||||||||
| Slovak Republic (MARKIZA TV) | 48,329 | 31,252 | 17,468 | 6,850 | ||||||||||||
| Slovenia (POP TV, KANAL A) | 32,764 | 25,782 | 11,389 | 9,463 | ||||||||||||
| Ukraine (STUDIO 1+1) | 40,776 | 46,540 | (1,805 | ) | 17,024 | |||||||||||
| Ukraine (KINO, CITI) (3) | 1,052 | 572 | (4,172 | ) | (557 | ) | ||||||||||
| Total segment data | $ | 364,196 | $ | 278,104 | $ | 126,989 | $ | 96,071 | ||||||||
| Reconciliation to condensed consolidated statement of operations: | ||||||||||||||||
| Consolidated net revenues / income before provision for income taxes, minority interest, equity in income of unconsolidated affiliates and discontinued operations | $ | 364,196 | $ | 276,343 | $ | 58,188 | $ | 7,811 | ||||||||
| Corporate operating costs | - | - | 22,217 | 15,677 | ||||||||||||
| Depreciation of station property, plant and equipment | - | - | 14,579 | 11,761 | ||||||||||||
| Amortization of broadcast licenses and other intangibles | - | - | 10,327 | 8,952 | ||||||||||||
| Impairment charge | - | - | - | 748 | ||||||||||||
| Unconsolidated equity affiliates (4) | - | 1,761 | - | (1,283 | ) | |||||||||||
| Interest income | - | - | (3,146 | ) | (3,194 | ) | ||||||||||
| Interest expense | - | - | 30,834 | 21,855 | ||||||||||||
| Foreign currency exchange loss, net | - | - | 5,252 | 31,487 | ||||||||||||
| Change in fair value of derivatives | - | - | (12,052 | ) | 1,876 | |||||||||||
| Other expense | - | - | 790 | 381 | ||||||||||||
| Total segment data | $ | 364,196 | $ | 278,104 | $ | 126,989 | $ | 96,071 | ||||||||
| (1) All net revenues are derived from external customers. There are no inter-segmental revenues. | ||||||||||||||||
| (2) Romanian networks are PRO TV, PRO CINEMA, ACASA, PRO TV INTERNATIONAL and SPORT.RO. | ||||||||||||||||
| (3) We acquired our Ukraine (KINO, CITI) operations in January 2006. | ||||||||||||||||
| (4) Our Slovak Republic operations were accounted for as an equity affiliate until January 23, 2006. | ||||||||||||||||
CENTRAL EUROPEAN MEDIA ENTERPRISES LTD.
NOTES TO CONDENSED CONSOLIDATED FINANCIAL STATEMENTS
(Tabular amounts in US$ 000’s, except share and per share data)
(Unaudited)
For the Three Months Ended June 30, | For the Six Months Ended June 30, | |||||||||||||||
| 2007 | 2006 | 2007 | 2006 | |||||||||||||
| Depreciation of station property, plant and equipment and amortization of broadcast licenses and other intangibles: | ||||||||||||||||
| Croatia | $ | 947 | $ | 902 | $ | 1,732 | $ | 1,431 | ||||||||
| Czech Republic | 6,689 | 5,883 | 13,150 | 11,408 | ||||||||||||
| Romania | 2,180 | 1,137 | 3,927 | 2,364 | ||||||||||||
| Slovak Republic | 947 | 877 | 2,134 | 2,348 | ||||||||||||
| Slovenia | 1,110 | 810 | 2,096 | 1,540 | ||||||||||||
| Ukraine (STUDIO 1+1) | 799 | 929 | 1,544 | 1,501 | ||||||||||||
| Ukraine (KINO, CITI) | 173 | 141 | 323 | 298 | ||||||||||||
| Total | $ | 12,845 | $ | 10,679 | $ | 24,906 | $ | 20,890 | ||||||||
| Reconciliation to condensed consolidated statement of operations: | ||||||||||||||||
| Unconsolidated equity affiliates | - | - | - | (177 | ) | |||||||||||
| Total consolidated depreciation and amortization | $ | 12,845 | $ | 10,679 | $ | 24,906 | $ | 20,713 | ||||||||
| Represented as follows: | ||||||||||||||||
| Depreciation of station property, plant & equipment | 7,680 | 6,059 | 14,579 | 11,761 | ||||||||||||
| Amortization of broadcast licenses and other intangibles | 5,165 | 4,620 | 10,327 | 8,952 | ||||||||||||
| Total assets (1): | June 30, 2007 | December 31, 2006 | ||||||
| Croatia | $ | 34,859 | $ | 30,394 | ||||
| Czech Republic | 1,205,154 | 1,200,894 | ||||||
| Romania | 302,436 | 206,850 | ||||||
| Slovak Republic | 110,576 | 86,872 | ||||||
| Slovenia | 75,858 | 67,919 | ||||||
| Ukraine (STUDIO 1+1) | 80,287 | 75,020 | ||||||
| Ukraine (KINO, CITI) | 14,756 | 13,293 | ||||||
| Total segment assets | $ | 1,823,926 | $ | 1,681,242 | ||||
| Reconciliation to condensed consolidated balance sheets: | ||||||||
| Corporate | 76,366 | 137,758 | ||||||
| Total assets | $ | 1,900,292 | $ | 1,819,000 | ||||
| (1) Segment assets exclude any inter-company investments, loans, payables and receivables. | ||||||||
CENTRAL EUROPEAN MEDIA ENTERPRISES LTD.
NOTES TO CONDENSED CONSOLIDATED FINANCIAL STATEMENTS
(Tabular amounts in US$ 000’s, except share and per share data)
(Unaudited)
| Long-lived assets (1): | June 30, 2007 | December 31, 2006 | ||||||
| Croatia | $ | 8,040 | $ | 6,804 | ||||
| Czech Republic | 36,687 | 28,002 | ||||||
| Romania | 34,906 | 32,312 | ||||||
| Slovak Republic | 20,374 | 19,498 | ||||||
| Slovenia | 16,904 | 15,595 | ||||||
| Ukraine (STUDIO 1+1) | 7,569 | 7,965 | ||||||
| Ukraine (KINO, CITI) | 4,082 | 3,674 | ||||||
| Total long-lived assets | $ | 128,562 | $ | 113,850 | ||||
| Reconciliation to condensed consolidated balance sheets: | ||||||||
| Corporate | 1,619 | 1,955 | ||||||
| Total long-lived assets | $ | 130,181 | $ | 115,805 | ||||
| (1) Reflects property, plant and equipment | ||||||||
We do not rely on any single major customer or group of major customers. No customer accounts for more than 10% of revenue.
17. DISCONTINUED OPERATIONS
For the Three Months Ended June 30, | For the Six Months Ended June 30, | |||||||||||||||
| 2007 | 2006 | 2007 | 2006 | |||||||||||||
| Tax on disposal of discontinued operations | - | 1,277 | - | (2,530 | ) | |||||||||||
| Net income / (loss) from discontinued operations | $ | - | $ | 1,277 | $ | - | $ | (2,530 | ) | |||||||
On May 19, 2003, we received US$ 358.6 million from the Czech Republic in final settlement of our UNCITRAL arbitration in respect of our former operations in the Czech Republic.
On June 19, 2003, our Board of Directors decided to withdraw from operations in the Czech Republic. The revenues and expenses of our former Czech Republic operations and the award income and related legal expenses have therefore all been accounted for as discontinued operations for all periods presented.
On February 9, 2004, we entered into an agreement with the Dutch tax authorities to settle all tax liabilities outstanding for the years up to and including 2003, including receipts in respect of our 2003 award in the arbitration against the Czech Republic, for a payment of US$ 9.0 million. We expected to continue to pay tax in the Netherlands of between US$ 1.0 and US$ 2.5 million for the foreseeable future and therefore agreed to a minimum payment of US$ 2.0 million per year for the years 2004 - 2008 and US$ 1.0 million for 2009.
We have re-evaluated our forecasts of the amount of taxable income we expect to earn in the Netherlands in the period to 2009. As the tax payable on this income is lower than the minimum amounts agreed with the Dutch tax authorities, we have provided for the shortfall. In our condensed consolidated statement of operations, we recognized a charge of US$ nil (credit of US$ 1.3 million for the three months ended June 30, 2006), and a charge of US$ nil (charge of US$ 2.5 million for the six months ended June 30, 2006) through discontinued operations for the three months and six months ended June 30, 2007, respectively.
CENTRAL EUROPEAN MEDIA ENTERPRISES LTD.
NOTES TO CONDENSED CONSOLIDATED FINANCIAL STATEMENTS
(Tabular amounts in US$ 000’s, except share and per share data)
(Unaudited)
The settlement with the Dutch tax authorities also provides that if any decision is issued at any time prior to December 31, 2008 exempting awards under Bilateral Investment Treaties from taxation in the Netherlands, we will be allowed to recover losses previously used against the 2003 arbitration award, which could be up to US$ 195.0 million, to offset other income within the applicable carry forward rules. This would not reduce the minimum amount of tax agreed payable under the settlement agreement. At this time there is no indication that the Dutch tax authorities will issue such a decision.
The settlement with the Dutch tax authorities has also resulted in a deductible temporary difference in the form of a ruling deficit against which a full valuation allowance has been recorded.
18. COMMITMENTS AND CONTINGENCIES
Commitments
a) Station Programming Rights Agreements
At June 30, 2007 we had the following commitments in respect of future programming, including contracts signed with license periods starting after the balance sheet date:
June 30, 2007 | ||||
| Croatia | $ | 2,771 | ||
| Czech Republic | 48,033 | |||
| Romania | 23,244 | |||
| Slovak Republic | 16,717 | |||
| Slovenia | 6,914 | |||
| Ukraine (STUDIO 1+1) | 18,792 | |||
| Ukraine (KINO, CITI) | 843 | |||
| Total | $ | 117,314 | ||
Of the amount shown in the table above, US$ 109.2 million is payable within one year.
CENTRAL EUROPEAN MEDIA ENTERPRISES LTD.
NOTES TO CONDENSED CONSOLIDATED FINANCIAL STATEMENTS
(Tabular amounts in US$ 000’s, except share and per share data)
(Unaudited)
b) Operating Lease Commitments
For the six months ended June 30, 2007 and 2006 we incurred aggregate rent on all facilities of US$ 6.0 million and US$ 5.3 million, respectively. Future minimum operating lease payments at June 30, 2007 for non-cancelable operating leases with remaining terms in excess of one year (net of amounts to be recharged to third parties) are payable as follows:
June 30, 2007 | ||||
| 2007 | $ | 1,673 | ||
| 2008 | 1,911 | |||
| 2009 | 1,169 | |||
| 2010 | 834 | |||
| 2011 | 428 | |||
| 2012 and thereafter | - | |||
| Total | $ | 6,015 | ||
c) Acquisition of Minority Shareholdings in Romania
Mr. Sarbu has the right to sell the remaining shareholding in Pro TV and MPI that he holds personally to us under a put option agreement entered into in July 2004 at a price to be determined by an independent valuation, subject to a floor price of US$ 1.45 million for each 1.0% interest sold. Mr. Sarbu’s right to put his remaining shareholding to us is exercisable from November 12, 2009, provided that we have not enforced a pledge over this shareholding which Mr. Sarbu granted as security for our right to put to him our shareholding in Media Pro. As at June 30, 2007, we consider the fair value of Mr. Sarbu’s put option to be approximately US$ nil.
d) Other
Dutch tax
On February 9, 2004 we entered into an agreement with the Dutch tax authorities to settle all tax liabilities outstanding for the period through 2003, including receipts in respect of our 2003 award in the arbitration against the Czech Republic, for a payment of US$ 9.0 million. We expected to continue to pay tax in the Netherlands of between US$ 1.0 and US$ 2.5 million for the foreseeable future and therefore also agreed to a minimum tax payable of US$ 2.0 million per year for the years 2004 - 2008 and US$ 1.0 million for 2009.
The settlement with the Dutch tax authorities also provides that if any decision is issued at any time prior to December 31, 2008 exempting awards under Bilateral Investment Treaties from taxation in the Netherlands, we will be allowed to recover losses previously used against the 2003 arbitration award, which could be up to US$ 195.0 million, to offset other income within the applicable carry forward rules. This would not reduce the minimum amount of tax agreed payable under the settlement agreement. At this time there is no indication that the Dutch tax authorities will issue such a decision.
As at June 30, 2007 we provided US$ 3.9 million (US$ 2.5 million in non-current liabilities and US$ 1.4 million in current liabilities) and as at December 31, 2006 we provided US$ 5.5 million (US$ 3.0 million in non-current liabilities and US$ 2.5 million in current liabilities) of tax in the Netherlands as the difference between our obligation under this agreement and our estimate of tax in the Netherlands that may fall due over this period from business operations, based on current business structures and economic conditions.
CENTRAL EUROPEAN MEDIA ENTERPRISES LTD.
NOTES TO CONDENSED CONSOLIDATED FINANCIAL STATEMENTS
(Tabular amounts in US$ 000’s, except share and per share data)
(Unaudited)
Czech Republic - Factoring of Trade Receivables
CET 21 has a working capital credit facility of CZK 250 million (approximately US$ 11.7 million) with Ceska Sporitelna, a.s. This facility is secured by a pledge of receivables under the factoring agreement with Factoring Ceska Sporitelna.
The transfer of the receivables is accounted for as a secured borrowing under FASB Statement No. 140, ‘Accounting for Transfers and Servicing of Financial Assets and Extinguishments of Liabilities’, with the proceeds received recorded in the Condensed Consolidated Balance Sheet as a liability and included in current credit facilities and obligations under capital leases. The corresponding receivables are a part of accounts receivable, as we retain the risks of ownership.
Contingencies
a) Litigation
We are, from time to time, a party to litigation that arises in the normal course of our business operations. Other than those claims discussed below, we are not presently a party to any such litigation, which could reasonably be expected to have a material adverse effect on our business or operations. Unless otherwise disclosed, no provision has been made against any potential losses that could arise.
We present below a summary of our more significant proceedings by country.
Croatia
Global Communications Disputes
On October 29, 2004, Operativna Kompanija d.o.o. (“OK”), our former operating company in Croatia, filed suit against Global Communications d.o.o. claiming approximately HRK 53.0 million (approximately US$ 9.8 million) in damages. Global Communications is a company controlled by Ivan Caleta, who had previously operated Nova TV (Croatia) through OK. Global Communications, together with GRP Media d.o.o., another company controlled by Mr. Caleta, had provided certain goods and services to OK and Nova TV (Croatia) in exchange for advertising time pursuant to an agreement dated April 10, 2001 (the “Global Agreement”). Global Communications and GRP Media were functionally managing the advertising inventory of Nova TV (Croatia). On December 31, 2003, Global Communications entered into a reconciliation agreement by which OK acknowledged that Global Communications was entitled to approximately 375,000 seconds of advertising time for goods and services previously provided. Following our acquisition of Nova TV (Croatia) and OK in July 2004, OK concluded that Global Communications had used all of its seconds by June 2004 based on a substantial discrepancy discovered between the utilization of advertising time recorded by Global Communications and that recorded by AGB Puls, an independent television audience measurement service operating in Croatia. In the course of its investigation of the usage of seconds by Global Communications, OK discovered that computer records of advertising seconds kept for OK may have been altered. OK brought a suit to recover amounts for advertising time used by Global Communications in excess of the 375,000 seconds agreed. Global Communications filed a counterclaim in January 2005 for HRK 68.0 million (approximately US$ 12.5 million), claiming that the AGB data is unreliable and that it is entitled to additional seconds under the previous agreement. The lower commercial court issued a judgment on July 12, 2006 in favor of Global Communications for the full amount of the counterclaim, and we have appealed this decision on the basis of false and inadequate disclosure, wrongful application of substantive law and procedural error. Global Communications separately brought a claim against Nova TV (Croatia), on the same basis as the OK counterclaim. Both Global Communications and Nova TV (Croatia) requested the court to join this claim with the OK counterclaim but this request was denied. The lower commercial court issued a judgment on August 1, 2006 in favor of Global Communications for the full amount of the claim, after having denied submission of evidence supporting our defense. We have also appealed this decision. We have accrued for the amounts we expect to be ultimately payable as a result of having commenced settlement negotiations with Global Communications. Any such settlement would also include a settlement of the former shareholder dispute described below.
CENTRAL EUROPEAN MEDIA ENTERPRISES LTD.
NOTES TO CONDENSED CONSOLIDATED FINANCIAL STATEMENTS
(Tabular amounts in US$ 000’s, except share and per share data)
(Unaudited)
On January 25, 2007, Nova TV (Croatia) filed suit against Global Communications. The facts underlying the claim are substantially the same as those of the abovementioned claims, but Nova TV (Croatia) is claiming that the Global Agreement and the two reconciliation agreements dated April 30, 2004 and June 30, 2004 (the “Reconciliation Agreements”), by which OK acknowledged the number of seconds of advertising time to which Global Communications was purportedly entitled, should be declared null and void under Article 141 of the Croatian Obligations Act. This provision is intended to protect a contractual party which has entered into unfair bargaining terms due to its dependency on the other contractual party. Global Communications, OK and Nova TV (Croatia) were all related parties (controlled by Ivan Caleta) and the contractual terms provided for the provision of 1,340,280 seconds by OK to Global Communications in exchange for certain transmitters. These seconds were valued at an aggregate of DEM 5 million (or DEM 3.73 per second; HRK 3.91 per second at the time) whereas the rate card price was DEM 97.18 or HRK 380.00 per second (i.e. a price that was 26 times higher). Other clients (unrelated parties) sampled from this period were paying between 382.50 HRK to 491.85 HRK per second. Nova TV (Croatia) is arguing for voidance of this contract because of its unconscionable terms which were detrimental to OK and Nova TV (Croatia) and beneficial solely to Global Communications (which, in its capacity as an advertising agency, on-sold these seconds to its clients at market rates, thereby reaping an extraordinary profit). Nova TV (Croatia) is further claiming restitution for advertising seconds appropriated by Global Communications under the Global Agreement. The restitution amount is HRK 586.5 million (approximately US$ 108.2 million). The first hearing has been scheduled for September 24, 2007.
Former Shareholder Dispute
On July 21, 2005, Narval A.M. d.o.o. (a company wholly-owned by Ivan Caleta), Studio Millenium d.o.o. and Richard Anthony Sheldon, three of the former shareholders of OK, filed suit against Nova TV (Croatia) for rescission of the sale and purchase contract pursuant to which they sold 75% of OK to Nova TV (Croatia) in July 2004 (the “OK Sale Contract”). Nova TV (Croatia) acquired OK immediately prior to our acquiring Nova TV (Croatia). The provisions of the OK Sale Contract required Nova TV (Croatia) to make payment to the four shareholders of OK by September 1, 2004, upon receipt of appropriate invoices and bank account details. The fourth shareholder, Pitos d.o.o., issued an invoice that was duly received by Nova TV (Croatia) and payment was made thereunder. The other three shareholders claim that they hand-delivered a joint invoice to one of the former directors of Nova TV (Croatia), but we continue to dispute this. Under the Croatian Obligations Act, one party to a contract who has performed may unilaterally rescind a contract if the other party fails to perform after receipt of a written warning. On May 24, 2006, the lower commercial court decided in favor of the plaintiffs to rescind the OK Sale Contract and ordered the defendant to pay court costs. We have appealed the decision on the basis that evidence supporting our position was not allowed to be presented to the court and we continue to challenge the validity of the power of attorney purportedly issued by Richard Anthony Sheldon (a resident of the United Kingdom) to legal counsel representing the other plaintiffs.
On August 28, 2006, we received a lower court decision of an injunction against us (decided without a hearing) that, inter alia, prohibits a sale or encumbrance of 75% of the shares of OK. Although we appealed this decision, the appellate commercial court upheld the lower court’s judgment on November 21, 2006. On November 6, 2006, we were notified of a request for a further injunction that would, inter alia, prohibit us from taking any actions to decrease the value of OK and require the management of OK to report to a delegate of the former shareholders. We have unsuccessfully sought the removal of the presiding judge, Raul Dubravec (who also presided over the Global Communications lawsuit against Nova TV (Croatia)). Mr. Dubravec ruled against us on December 18, 2006, requiring imposition of a temporary director for OK, which is not a remedy available under Croatian law under the facts of this action. Further, the temporary director who has been appointed is one of the former directors of OK who countersigned the Reconciliation Agreements and is an associate of Ivan Caleta. Our appeal against this decision was denied on May 8, 2007. While we continue to vigorously contest all these actions in the face of serious concerns as to the impartiality of the Croatian judicial system, we have commenced settlement negotiations with the former shareholders of OK.
CENTRAL EUROPEAN MEDIA ENTERPRISES LTD.
NOTES TO CONDENSED CONSOLIDATED FINANCIAL STATEMENTS
(Tabular amounts in US$ 000’s, except share and per share data)
(Unaudited)
Czech Republic
There are no significant outstanding legal actions that relate to our business in the Czech Republic.
Romania
There are no significant outstanding legal actions that relate to our business in Romania.
Slovenia
On November 20, 2002, we received notice of a claim filed by Mrs. Zdenka Meglic, the founder and a former shareholder of MMTV 1 d.o.o (MMTV), against MMTV, a subsidiary of CME Media Enterprises B.V. In her claim against MMTV, Mrs. Meglic is seeking an amount equal to EUR 0.8 million (approximately US$ 1.1 million) for repayment of monies advanced to MMTV from 1992 to 1994 (in the amount of approximately EUR 0.1 million (approximately US$ 0.1 million)) plus accrued interest. On September 9, 2004, the court of first instance found against MMTV and issued a judgment requiring MMTV to pay an amount equal to EUR 0.8 million (approximately US$ 1.1 million) plus interest as well as costs. On September 24, 2004, MMTV filed an appeal against the judgment. On December 15, 2004, the appellate court vacated the judgment of the lower court and returned the case for further proceedings A hearing has been scheduled for September 4, 2007. We do not believe that Mrs. Meglic will prevail and will continue to defend the claim.
Slovak Republic
There are no significant outstanding legal actions that relate to our business in the Slovak Republic.
Ukraine
On October 13, 2005, Igor Kolomoisky filed a lawsuit against Alexander Rodnyansky and Studio 1+1 in a district court in Kiev. Our Ukrainian affiliate Intermedia was joined in the proceedings as a “third party”. Igor Kolomoisky was attempting to enforce what he alleges was a binding oral agreement with Alexander Rodnyansky to purchase the latter’s 70.0% interest in Studio 1+1 for consideration of US$ 70.0 million and to transfer that interest to Igor Kolomoisky on receipt of a prepayment of US$ 2.0 million. The lawsuit arose from abortive negotiations among Igor Kolomoisky, Alexander Rodnyansky and Boris Fuchsmann for the acquisition by Igor Kolomoisky of the totality of interests in the Studio 1+1 Group held by Alexander Rodnyansky and Boris Fuchsmann, subject to Igor Kolomoisky assuming all of their obligations under our existing partnership arrangements. On August 16, 2006, the district court in Kiev ruled in favor of Igor Kolomoisky and found that he is entitled to the 70% interest in Studio 1+1 held by Alexander Rodnyansky. Our Ukrainian affiliate Intermedia and Alexander Rodnyansky filed appeals against this decision.
At a hearing on October 31, 2006, the appellate court overturned the decision of the court of first instance and denied Igor Kolomoisky’s claim that he is entitled to a 70% interest in Studio 1+1 held by Alexander Rodnyansky. On November 3, 2006, Igor Kolomoisky filed an appeal with the Supreme Court of Ukraine, the highest court in Ukraine. At a hearing on February 28, 2007, the Supreme Court rejected this appeal.
On April 4, 2007 the Supreme Court of Ukraine agreed to hear an extraordinary appeal from Igor Kolomoisky against the decision made on February 28, 2007 and the decision of the Court of Appeals of the city of Kiev made on October 31, 2006. At a hearing on May 25, 2007, the Supreme Court denied this extraordinary appeal. As a result of this decision, Igor Kolomoisky has no further rights to pursue this claim against Rodnyansky in the Ukrainian courts on the same grounds.
CENTRAL EUROPEAN MEDIA ENTERPRISES LTD.
NOTES TO CONDENSED CONSOLIDATED FINANCIAL STATEMENTS
(Tabular amounts in US$ 000’s, except share and per share data)
(Unaudited)
On December 23, 2005, we initiated proceedings against our partners Alexander Rodnyansky and Boris Fuchsmann in order to enforce our contractual rights and compel a restructuring of the ownership of Studio 1+1 in order to permit us to hold a 60% interest in Studio 1+1 through a subsidiary organized in Ukraine. Initiation of this proceeding followed protracted negotiations with our partners to restructure following confirmation from the Ukraine Media Council that our proposed ownership structure would not be in violation of restrictions on foreign ownership contained in the Ukraine Media Law, which restricts direct (but not indirect) investment by foreign persons in Ukrainian broadcasters to 30%. On January 12, 2006, the Ukraine parliament adopted an amended version of the Ukraine Media Law that clarifies the absence of any restriction on indirect foreign ownership of television broadcasters. This amended Ukraine Media Law came into force in March 2006. Our partners have acknowledged an obligation to restructure upon the entry into force of these amendments. Our partners have entered into certain agreements to implement the restructuring of the Ukrainian operations of the Studio 1+1 Group. Following the completion of the transactions reflected in these agreements and the registration of the charter of Studio 1+1 amended to reflect the new ownership of Studio 1+1, our ownership interest in Studio 1+1 (direct and indirect) will be 60%. Upon successful completion of the restructuring, we will terminate the proceedings initiated against our partners in December 2005.
Ongoing ancillary litigation to enjoin transactions related to the ownership of Studio 1+1 has been initiated by third parties who are not direct parties in interest to legal proceedings initiated by Igor Kolomoisky against Alexander Rodnyansky. The state registrar in the district administration in Kiev where charters are registered has declined to register amendments to the charter of Studio 1+1, including in respect of the restructured ownership agreed with our partners (see Part 1, Item 1, Note 1, Ukraine (Studio 1+1)) on the basis of injunctions that have been lodged by such third parties. We do not believe that there is any legal basis for permitting such injunctions to be enforced or for refusing to register the amended charter of Studio 1+1 and have initiated a lawsuit against the district administration in Kiev to compel it to register the amendments to the Studio 1+1 charter. A hearing in this matter is scheduled for August 2, 2007.
CENTRAL EUROPEAN MEDIA ENTERPRISES LTD.
NOTES TO CONDENSED CONSOLIDATED FINANCIAL STATEMENTS
(Tabular amounts in US$ 000’s, except share and per share data)
(Unaudited)
b) Licenses
Regulatory bodies in each country in which we operate control access to available frequencies through licensing regimes. We believe that the licenses for our license companies will be renewed prior to expiry. In Romania, the Slovak Republic, Slovenia and Ukraine local regulations contain a qualified presumption for extensions of broadcast licenses, according to which a broadcast license may be renewed if the licensee has operated substantially in compliance with the relevant licensing regime. To date, all expiring licenses have been renewed; however, there can be no assurance that any of the licenses will be renewed upon expiration of their current terms. The failure of any such license to be renewed could adversely affect the results of our operations.
The following summarizes the expiry dates of our television broadcasting licenses:
| Croatia | The license of NOVA TV (Croatia) expires in April 2010. |
| Czech Republic | The license of TV NOVA (Czech Republic) expires in January 2017. The GALAXIE SPORT license expires in March 2014. |
| Romania | Licenses expire on dates ranging from August 2007 to February 2016. |
| Slovak Republic | The license of MARKIZA TV in the Slovak Republic expires in September 2019. |
| Slovenia | The licenses of POP TV and KANAL A expire in August 2012. |
| Ukraine | The 15-hour prime time and off prime time license of STUDIO 1+1 expires in December 2016. The license to broadcast for the remaining nine hours in off prime expires in August 2014. Licenses used for the KINO and CITI channels expire on dates ranging from June 2008 to July 2016. |
c) Restrictions on dividends from Consolidated Subsidiaries and Unconsolidated Affiliates
Corporate law in the Central and Eastern European countries in which we have operations stipulates generally that dividends may be declared by shareholders, out of yearly profits, subject to the maintenance of registered capital and required reserves after the recovery of accumulated losses. The reserve requirement restriction generally provides that before dividends may be distributed, a portion of annual net profits (typically 5%) be allocated to a reserve, which reserve is capped at a proportion of the registered capital of a company (ranging from 5% to 25%). The restricted net assets of our consolidated subsidiaries and equity in earnings of investments accounted for under the equity method together are less than 25% of consolidated net assets.
19. SUBSEQUENT EVENTS
On July 13, 2007, we acquired 100.0% of Media Invest s.r.o. from our Slovak partner Jan Kovacik for aggregate consideration of SKK 1.9 billion (approximately US$ 78.8 million at the date of acquisition). Media Invest has a 20.0% voting and economic interest in Markiza. As a result of this transaction, we now own 100.0% of Markiza.
| Management's Discussion and Analysis of Financial Condition and Results of Operations |
Contents
I. | Forward-looking Statements |
II. | Executive Summary |
III. | Analysis of Segment Results |
IV. | Analysis of the Results of Consolidated Operations |
V. | Liquidity and Capital Resources |
VI. | Critical Accounting Policies and Estimates |
I. Forward-looking Statements
This report contains forward-looking statements, including the impact of the competitive market dynamics and political environment in Ukraine, the impact of legal proceedings in Croatia and Ukraine, the results of additional investment in Croatia and Ukraine, the implementation of an advertising sales strategy in the Czech Republic and cost reductions in the Czech and Slovak Republics, our ability to develop and implement multi-channel strategies generally, the growth of television advertising in our markets, the future economic conditions in our markets, future investments in television broadcast operations, the growth potential of advertising spending in our markets, and other business strategies and commitments. For these statements and all other forward-looking statements, we claim the protection of the safe harbor for forward-looking statements contained in the Private Securities Litigation Reform Act of 1995. Forward-looking statements are inherently subject to risks and uncertainties, many of which cannot be predicted with accuracy or are otherwise beyond our control and some of which might not even be anticipated. Future events and actual results, affecting our strategic plan as well as our financial position, results of operations and cash flows, could differ materially from those described in or contemplated by the forward-looking statements. Important factors that contribute to such risks include, but are not limited to, the general regulatory environments where we operate and application of relevant laws and regulations, the renewals of broadcasting licenses, our ability to implement strategies regarding sales and multi-channel distribution, the rate of development of advertising markets in countries where we operate, our ability to acquire necessary programming and the ability to attract audiences, our ability to obtain additional frequencies and licenses, and general market and political and economic conditions in these countries as well as in the United States and Western Europe.
The following discussion should be read in conjunction with our interim financial statements and notes included elsewhere in this report.
II. Executive Summary
The accompanying Management’s Discussion and Analysis of Financial Condition and Results of Operations reflects the restatement of the unaudited condensed Consolidated Financial Statements for the six months ended June 30, 2007 described in Item 1, Note 2.
Page 41
Continuing Operations
The following table provides a summary of our consolidated results for the three and six months ended June 30, 2007 and 2006:
| For the Three Months Ended June 30, (US$ 000's) | ||||||||||||
| 2007 | 2006 | Movement | ||||||||||
| Net revenues | $ | 216,284 | $ | 156,589 | $ | 59,695 | ||||||
| Operating income | 66,579 | 44,033 | 22,546 | |||||||||
| Net income from continuing operations | 34,590 | 7,245 | 27,345 | |||||||||
| Net income | $ | 34,590 | $ | 8,522 | $ | 26,068 | ||||||
| For the Six Months Ended June 30, (US$ 000's) | ||||||||||||
| 2007 | 2006 | Movement | ||||||||||
| Net revenues | $ | 364,196 | $ | 276,343 | $ | 87,853 | ||||||
| Operating income | 79,866 | 60,216 | 19,650 | |||||||||
| Net income / (loss) from continuing operations | 34,340 | (7,212) | 41,552 | |||||||||
| Net income / (loss) | $ | 34,340 | $ | (9,742) | $ | 44,082 | ||||||
| · | In the three months ended June 30, 2007, we reported growth in Segment Net Revenues of 38% and Segment EBITDA of 38% compared to the three months ended June 30, 2006, delivering a Segment EBITDA margin of 40%, in line with that reported in the three months ended June 30, 2006 (Segment EBITDA is defined and reconciled to our consolidated results in Item 1, Note 16). |
| · | Other than our operations in Ukraine, each of our stations reported revenue growth in excess of 25% compared to the three months ended June 30, 2006, with particularly strong growth reported in Croatia and the Slovak Republic. Our operations in Ukraine experienced a slight increase in Segment Net Revenues but a significant decline in Segment EBITDA as we were required to increase our investment in programming in the face of increased competition and poor ratings performance. |
| · | On May 15, 2007 we redeemed our EUR 125.0 million floating rate Senior Notes, bearing interest at six-month EURIBOR plus 5.50%. |
| · | On May 16, 2007 we issued EUR 150.0 million of floating rate Senior Notes, bearing interest at six-month EURIBOR plus 1.625%. |
| · | On June 1, 2007, we completed the acquisition of an additional 5% interest in Pro TV and MPI and now own a 95.0% interest in our Romania operations. |
| · | On June 25, 2007, our shares of Class A Common Stock were included within the broad-market Russell 3000 Index, the large-cap stocks Russell 1000 Index and the Russell Global Index. |
Events that occurred subsequent to June 30, 2007 have been as follows:
| · | On July 13, 2007, we acquired an additional 20.0% interest in Markiza and now own 100.0% of our Slovak Republic operations. |
Future Developments
As our markets mature, we anticipate more intense competition for audience share and advertising spending from other incumbent terrestrial broadcasters and, to a lesser extent, from local cable and satellite broadcasters. We believe we are in a solid position to manage increased competition. In the near term we intend to continue to pursue further improvements in the performance of our existing operations in order to maximize the potential for organic growth. In Croatia, we believe that our strategy and investments are beginning to bring consistent positive results, which has created a solid foundation for Nova TV (Croatia) to reach break even before the end of 2008. In Ukraine, we anticipate that political advertising in advance of parliamentary elections in September and increased television advertising spending that is expected to follow greater political certainty after the elections will facilitate an improvement in the results of Studio 1+1.
Our priorities in this regard include:
| · | Pursuing sub-regional efficiencies, especially in the area of local programming between Slovenia and Croatia and between the Czech and Slovak Republics; |
| · | Supporting the growth of television advertising in our markets through increased development and through the launch or acquisition of additional channels to expand our advertising inventory and target niche audiences; |
| · | Leveraging our existing brands and assets to develop new revenue opportunities, including in the creation and distribution of programming and in the new media sectors; and |
| · | Continuing to expand our footprint into additional Central and Eastern European markets when financially prudent opportunities arise. |
In particular, we are planning the following during the remainder of 2007:
| · | Continuing to improve the effectiveness of our operations in the Czech Republic and the Slovak Republic. |
| · | Additional investment in Russian series and local programming for STUDIO 1+1, which have driven ratings historically, and continuing the development of our Ukraine channels KINO and CITI which were launched in 2006. |
| · | Further development of our non-broadcast activities, particularly in new media, which is being coordinated across our markets. |
| · | Acquisition of additional shares in our operations in Ukraine if the opportunity arises; and |
| · | Continuing to invest in the development of our Croatia operations. |
III. Analysis of Segment Results
OVERVIEW
We manage our business on a geographic basis and review the performance of each business segment using data that reflects 100% of operating and license company results. We also consider how much of our total revenues and earnings are derived from our broadcast and non-broadcast operations. Our business segments are comprised of Croatia, the Czech Republic, Romania, the Slovak Republic, Slovenia and our two businesses in Ukraine.
We evaluate the performance of our business segments based on Segment Net Revenues and Segment EBITDA. Segment Net Revenues and Segment EBITDA include our operations in the Slovak Republic which were not consolidated prior to January 23, 2006.
Our key performance measure of the efficiency of our business segments is EBITDA margin. We define Segment EBITDA margin as the ratio of Segment EBITDA to Segment Net Revenues.
Segment EBITDA is determined as segment net income/loss, which includes program rights amortization costs, before interest, taxes, depreciation and amortization of intangible assets. Items that are not allocated to our segments for purposes of evaluating their performance, and therefore are not included in Segment EBITDA, include:
| · | expenses presented as corporate operating costs in our condensed consolidated statement of operations and comprehensive income; |
| · | stock-based compensation charges; |
| · | foreign currency exchange gains and losses; |
| · | change in fair value of derivatives; and |
| · | certain unusual or infrequent items (e.g., extraordinary gains and losses, impairments of assets or investments). |
EBITDA may not be comparable to similar measures reported by other companies. Non-GAAP measures should be evaluated in conjunction with, and are not a substitute for, US GAAP financial measures.
We believe Segment EBITDA is useful to investors because it provides a more meaningful representation of our performance as it excludes certain items that either do not impact our cash flows or the operating results of our stations. Segment EBITDA is also used as a component in determining management bonuses.
For a full reconciliation of our Segment Net Revenues and Segment EBITDA by operation to our consolidated results for the three and six months ended June 30, 2007 and 2006 see Part I, Item 1, Note 16.
A summary of our total Segment Net Revenues, Segment EBITDA and Segment EBITDA margin showing the relative contribution of each Segment, is as follows:
| SEGMENT FINANCIAL INFORMATION | ||||||||||||||
| For the Three Months Ended June 30, (US$ 000's) | ||||||||||||||
| 2007 | (1) | 2006 | (1) | |||||||||||
| Segment Net Revenue | ||||||||||||||
| Croatia (NOVA TV) | $ | 10,414 | 5 | % | $ | 5,647 | 4 | % | ||||||
| Czech Republic (TV NOVA, GALAXIE SPORT) | 80,544 | 37 | % | 56,312 | 36 | % | ||||||||
| Romania (2) | 52,224 | 24 | % | 37,769 | 24 | % | ||||||||
| Slovak Republic (MARKIZA TV) | 29,652 | 14 | % | 20,046 | 13 | % | ||||||||
| Slovenia (POP TV, KANAL A) | 20,095 | 9 | % | 15,555 | 10 | % | ||||||||
| Ukraine (STUDIO 1+1) | 22,701 | 11 | % | 21,062 | 13 | % | ||||||||
| Ukraine (KINO, CITI) | 654 | - | 198 | - | ||||||||||
| Total Segment Net Revenues | $ | 216,284 | 100 | % | $ | 156,589 | 100 | % | ||||||
| Represented by: | ||||||||||||||
| Broadcast operations | $ | 214,987 | 99 | % | $ | 155,902 | 100 | % | ||||||
| Non-broadcast operations | 1,297 | 1 | % | 687 | - | |||||||||
| Total Segment Revenues | $ | 216,284 | 100 | % | $ | 156,589 | 100 | % | ||||||
| Segment EBITDA | ||||||||||||||
| Croatia (NOVA TV) | $ | (2,167) | (2) | % | $ | (2,639) | (4) | % | ||||||
| Czech Republic (TV NOVA, GALAXIE SPORT) | 47,595 | 55 | % | 29,509 | 47 | % | ||||||||
| Romania (2) | 22,530 | 26 | % | 16,424 | 26 | % | ||||||||
| Slovak Republic (MARKIZA TV) | 11,712 | 13 | % | 7,827 | 12 | % | ||||||||
| Slovenia (POP TV, KANAL A) | 8,388 | 9 | % | 6,430 | 10 | % | ||||||||
| Ukraine (STUDIO 1+1) | 565 | 1 | % | 6,037 | 10 | % | ||||||||
| Ukraine (KINO, CITI) | (1,755) | (2) | % | (432) | (1) | % | ||||||||
| Total Segment EBITDA | $ | 86,868 | 100 | % | $ | 63,156 | 100 | % | ||||||
| Represented by: | ||||||||||||||
| Broadcast operations | $ | 87,175 | 100 | % | $ | 62,970 | 100 | % | ||||||
| Non-broadcast operations | (307) | - | 186 | - | ||||||||||
| Total Segment EBITDA | $ | 86,868 | 100 | % | $ | 63,156 | 100 | % | ||||||
| Segment EBITDA Margin (3) | 40 | % | 40 | % | ||||||||||
| (1) Percentage of Total Segment Net Revenues and Total Segment EBITDA. | ||||||||||||||||
| (2) Romania networks are PRO TV, PRO CINEMA, ACASA, PRO TV INTERNATIONAL and SPORT.RO. | ||||||||||||||||
| (3) We define Segment EBITDA margin as the ratio of Segment EBITDA to Segment Net Revenue. | ||||||||||||||||
| SEGMENT FINANCIAL INFORMATION | ||||||||||||||
| For the Six Months Ended June 30, (US$ 000's) | ||||||||||||||
| 2007 | (1) | 2006 | (1) | |||||||||||
| Segment Net Revenue | ||||||||||||||
| Croatia (NOVA TV) | $ | 17,646 | 5 | % | $ | 9,457 | 4 | % | ||||||
| Czech Republic (TV NOVA) | 132,063 | 37 | % | 96,861 | 35 | % | ||||||||
| Romania (2) | 91,566 | 25 | % | 67,640 | 24 | % | ||||||||
| Slovak Republic (MARKIZA TV) (3) | 48,329 | 13 | % | 31,252 | 11 | % | ||||||||
| Slovenia (POP TV, KANAL A) | 32,764 | 9 | % | 25,782 | 9 | % | ||||||||
| Ukraine (STUDIO 1+1) | 40,776 | 11 | % | 46,540 | 17 | % | ||||||||
| Ukraine (KINO, CITI) (4) | 1,052 | - | 572 | - | ||||||||||
| Total Segment Net Revenues | $ | 364,196 | 100 | % | $ | 278,104 | 100 | % | ||||||
| Represented by: | ||||||||||||||
| Broadcast operations | $ | 362,409 | 100 | % | $ | 276,975 | 100 | % | ||||||
| Non-broadcast operations | 1,787 | - | 1,129 | - | ||||||||||
| Total Segment Revenues | $ | 364,196 | 100 | % | $ | 278,104 | 100 | % | ||||||
| Segment EBITDA | ||||||||||||||
| Croatia (NOVA TV) | $ | (6,819) | (5) | % | $ | (7,081) | (7) | % | ||||||
| Czech Republic (TV NOVA) | 73,262 | 58 | % | 42,335 | 44 | % | ||||||||
| Romania (2) | 37,666 | 29 | % | 28,037 | 29 | % | ||||||||
| Slovak Republic (MARKIZA TV) (3) | 17,468 | 13 | % | 6,850 | 7 | % | ||||||||
| Slovenia (POP TV, KANAL A) | 11,389 | 9 | % | 9,463 | 10 | % | ||||||||
| Ukraine (STUDIO 1+1) | (1,805) | (1) | % | 17,024 | 18 | % | ||||||||
| Ukraine (KINO, CITI) (4) | (4,172) | (3) | % | (557) | (1) | % | ||||||||
| Total Segment EBITDA | $ | 126,989 | 100 | % | $ | 96,071 | 100 | % | ||||||
| Represented by: | ||||||||||||||
| Broadcast operations | $ | 127,889 | 101 | % | $ | 95,916 | 100 | % | ||||||
| Non-broadcast operations | (900) | (1) | % | 155 | - | |||||||||
| Total Segment EBITDA | $ | 126,989 | 100 | % | $ | 96,071 | 100 | % | ||||||
| Segment EBITDA Margin (5) | 35 | % | 35 | % | ||||||||||
| (1) Percentage of Total Segment Net Revenues and Total Segment EBITDA. | |||||||||||||||
| (2) Romania networks are PRO TV, PRO CINEMA, ACASA, PRO TV INTERNATIONAL and SPORT.RO. | |||||||||||||||
| (3) Our Slovak Republic operations were accounted for as an equity affiliate until January 23, 2006. | |||||||||||||||
| (4) We acquired our Ukraine (KINO, CITI) operations on January 11, 2006. | |||||||||||||||
| (5) We define Segment EBITDA margin as the ratio of Segment EBITDA to Segment Net Revenue. |
ANALYSIS BY GEOGRAPHIC SEGMENT
In the countries in which we operate, advertisers tend to allocate their television advertising budgets among channels based on each channel's audience share, audience demographic profile and pricing policy. We generally offer two different bases of pricing to our advertising customers. The first basis is cost per gross rating point (which we refer to as “GRP”). A GRP represents the percentage of audience (from the population over the age of four) reached by a television advertisement and the number of GRPs achieved for a defined time period is the product of the proportion of that total viewing population watching that television advertisement and the frequency that it is viewed (as measured by international measurement agencies using peoplemeters). The second basis is rate-card, which reflects the timing and duration of an advertisement. Whether advertising is sold on a GRP basis or a rate-card basis depends on the dynamics of a particular market and our relative audience share.
Cost per GRP pricing: Advertising priced on a cost per GRP basis allows an advertiser to specify the number of gross ratings points that it wants to achieve with an advertisement within a defined period of time. We schedule the timing of the airing of the advertisements during such defined period of time in a manner that enables us both to meet the advertiser's GRP target and to maximize the use and profitability of our available advertising programming time. The price per GRP package varies depending on the demographic group that the advertisement is targeting, the flexibility given to us by advertisers in scheduling their advertisements and the rebates offered by us to advertising agencies and their clients. GRP package sales generally allow for better inventory control than rate-card pricing and optimize the net price per GRP achieved.
Rate-card pricing: Advertising priced on a rate-card basis is applied to advertisements scheduled at a specific time. Consistent with industry practice, we provide an incentive rebate on rate-card prices to a number of advertising agencies and their clients. We recognize our advertising revenue net of rebates at the time the relevant advertisement is broadcast.
The majority of our advertising customers commit to annual minimum spending levels. We usually schedule specific advertisements one month in advance of broadcasting them. Prices paid by advertisers, whether they purchase advertising time on a GRP package or rate-card basis, tend to be higher during peak viewing months, particularly during the fourth quarter, than during off-peak months such as July and August.
When describing relative performance against other competitors in attracting audience we refer to ratings share, which represents the number of people watching a channel as a proportion of the total population, and audience share, which represents the share attracted by a channel of the total audience watching television.
Our goal is to increase revenues from advertising in local currency year-on-year in every market through disciplined management of our advertising inventory. In any given period, revenue changes can be attributable to combinations of price fluctuations, different inventory sales, seasonal or time-of-day incentives, target-audience delivery of specific campaigns, introductory pricing for new clients or audience movements based on our competitors’ program schedule.
For the purposes of our management discussion and analysis, total television advertising revenue net of rebates is referred to as “spot revenues”. Non-spot revenues refers to all other revenues, including those from sponsorship, game shows, program sales, text messaging, cable subscriptions and barter transactions. The total of spot revenues and non-spot revenues is equal to Segment Net Revenues.
(A) CROATIA
Market Background: We estimate that the television advertising market in Croatia experienced local currency growth of approximately 2% - 5% in 2006 and expect it to show low single digit growth during 2007.
In the six months ended June 30, 2007, national all day audience share for NOVA TV (Croatia) grew to 18.1% compared to 13.7% in the six months ended June 30, 2006. The major competitors are the two state-owned channels HRT1 and HRT2, with national all day audience shares for the six months ended June 30, 2007 of 27.0% and 17.4%, respectively, and privately owned broadcaster RTL with 28.0%.
Prime time audience share for NOVA TV (Croatia), which is our principal focus, grew from 15.5% in the six months ended June 30, 2006 to 19.2% in the six months ended June 30, 2007. Our average prime time ratings increased from 6.9% to 7.3% over comparable periods, while prime time ratings for the whole market decreased from 45.9% in the six months ended June 30, 2006, when viewership increased during the Winter Olympics and the Soccer World Cup, to 37.8% in the six months ended June 30, 2007.
| CROATIA SEGMENT FINANCIAL INFORMATION | ||||||||||||
| For the Three Months Ended June 30, (US$ 000's) | ||||||||||||
| 2007 | 2006 | Movement | ||||||||||
| Spot revenues | $ | 8,482 | $ | 4,698 | $ | 3,784 | ||||||
| Non-spot revenues | 1,932 | 949 | 983 | |||||||||
| Segment Net Revenues | $ | 10,414 | $ | 5,647 | $ | 4,767 | ||||||
| Represented by: | ||||||||||||
| Broadcast operations | $ | 10,389 | $ | 5,647 | $ | 4,742 | ||||||
| Non-broadcast operations | 25 | - | 25 | |||||||||
| Segment Net Revenues | $ | 10,414 | $ | 5,647 | $ | 4,767 | ||||||
| Segment EBITDA | $ | (2,167 | ) | $ | (2,639 | ) | $ | 472 | ||||
| Represented by: | ||||||||||||
| Broadcast operations | $ | (2,144 | ) | $ | (2,639 | ) | $ | 495 | ||||
| Non-broadcast operations | (23 | ) | - | (23 | ) | |||||||
| Segment EBITDA | $ | (2,167 | ) | $ | (2,639 | ) | $ | 472 | ||||
| Segment EBITDA Margin | (21 | )% | (47 | )% | 26 | % | ||||||
| · | Segment Net Revenues for the three months ended June 30, 2007 increased by US$ 4.8 million, or 84%, compared to the three months ended June 30, 2006. In local currency, Segment Net Revenues increased by 73%. Spot revenues increased by US$ 3.8 million, or 81%, as a result of a significant increase in the volume of GRPs sold. Non-spot revenues increased by US$ 1.0 million, or 104%, as a result of increased levels of sponsorship. |
| · | Segment EBITDA for the three months ended June 30, 2007 was a loss of US$ 2.2 million compared to a loss of US$ 2.6 million in the three months ended June 30, 2006, an improvement of 18%. In local currency, Segment EBITDA improved by 20%. |
Costs charged in arriving at Segment EBITDA for the three months ended June 30, 2007 increased by US$ 4.3 million, or 52%, compared to the three months ended June 30, 2006. Cost of programming increased by US$ 4.0 million, or 94%, due to increased investment in local productions and syndicated programming to continue to grow ratings. Other operating costs decreased by US$ 0.5 million, or 15%, primarily due to lower salary and wage costs, partially offset by higher transmission costs as a result of increased transmitter coverage and also higher music rights costs. Selling, general and administrative expenses increased by US$ 0.8 million, or 62%.
Six months ended June 30, 2007 compared to the six months ended June 30, 2006
| CROATIA SEGMENT FINANCIAL INFORMATION | ||||||||||||
| For the Six Months Ended June 30, (US$ 000's) | ||||||||||||
| 2007 | 2006 | Movement | ||||||||||
| Spot revenues | $ | 13,503 | $ | 7,751 | $ | 5,752 | ||||||
| Non-spot revenues | 4,143 | 1,706 | 2,437 | |||||||||
| Segment Net Revenues | $ | 17,646 | $ | 9,457 | $ | 8,189 | ||||||
| Represented by: | ||||||||||||
| Broadcast operations | $ | 17,616 | $ | 9,457 | $ | 8,159 | ||||||
| Non-broadcast operations | 30 | - | 30 | |||||||||
| Segment Net Revenues | $ | 17,646 | $ | 9,457 | $ | 8,189 | ||||||
| Segment EBITDA | $ | (6,819) | $ | (7,081) | $ | 262 | ||||||
| Represented by: | ||||||||||||
| Broadcast operations | $ | (6,767) | $ | (7,081) | $ | 314 | ||||||
| Non-broadcast operations | (52) | - | (52) | |||||||||
| Segment EBITDA | $ | (6,819) | $ | (7,081) | $ | 262 | ||||||
| Segment EBITDA Margin | (39) | % | (75) | % | 36 | % | ||||||
| · | Segment Net Revenues for the six months ended June 30, 2007 increased by US$ 8.2 million, or 87%, compared to the six months ended June 30, 2006. In local currency, Segment Net Revenues increased by 73%. Spot revenues increased by US$ 5.8 million, or 74%, as a result of a significant increase in the volume of GRPs sold, augmented by increased prices. Non-spot revenues increased by US$ 2.4 million, or 143%, as a result of increased levels of sponsorship. |
| · | Segment EBITDA for the six months ended June 30, 2007 was a loss of US$ 6.8 million compared to a loss of US$ 7.1 million in the six months ended June 30, 2006, an improvement of 4%. In local currency, Segment EBITDA improved by 10%. |
Costs charged in arriving at Segment EBITDA for the six months ended June 30, 2007 increased by US$ 7.9 million, or 48%, compared to the six months ended June 30, 2006. Cost of programming increased by US$ 7.8 million, or 93%, due to increased investment in local productions and syndicated programming. Other operating costs decreased by US$ 0.8 million, or 14%, primarily due to lower salary and wage costs, partially offset by higher transmission costs as a result of increased transmitter coverage and also higher music rights costs. Selling, general and administrative expenses increased by US$ 0.9 million, or 34%.
(B) CZECH REPUBLIC
Market Background: We estimate that the television advertising market in the Czech Republic remained stable in local currency during 2006. We expect the television advertising market to show high single digit growth in 2007. State television has reduced the amount of airtime that can be devoted to commercial advertising to 0.5% in 2007.
The national all day audience share of our channel, TV NOVA (Czech Republic), for the six months ended June 30, 2007 was 40.6% compared to 41.7% for the six months ended June 30, 2006. The major competitors are the two state-owned channels CT1 and CT2, with national all day audience shares for the six months ended June 30, 2007 of 22.2% and 8.3% respectively, and privately owned broadcaster TV Prima with a national all day audience share of 19.9%.
Prime time audience share grew from 43.2% in the six months ended June 30, 2006 to 44.7% in the six months ended June 30, 2007. Our average prime time ratings decreased from 17.8% to 17.0% over comparable periods, while prime time ratings for the whole market decreased from 41.1% in the six months ended June 30, 2006 to 38.0% in the six months ended June 30, 2007, reflecting the extremely warm weather enjoyed by much of Europe in 2007.
During the first quarter of 2006, we announced a new advertising sales strategy based on our belief that growth in the television advertising market in the Czech Republic has been impeded over the past several years due to broadcasters focusing on obtaining an increased share of revenues committed to television advertising rather than fostering market growth by focusing on maximizing value received from the sale of GRPs. The focus of the TV Nova (Czech Republic) group is now on the development of advertising revenues over the medium term by supporting and then capturing market growth through a more sophisticated pricing policy. In conjunction with this advertising strategy, the TV Nova (Czech Republic) group initiated a series of measures to reduce the costs of its operations, including the cancellation of poorly performing formats and reductions in operational costs. Our results in the first half of 2007 reflect the success of these initiatives to date.
Three months ended June 30, 2007 compared to the three months ended June 30, 2006
| CZECH REPUBLIC SEGMENT FINANCIAL INFORMATION | ||||||||||||
| For the Three Months Ended June 30, (US$ 000's) | ||||||||||||
| 2007 | 2006 | Movement | ||||||||||
| Spot revenues | $ | 74,048 | $ | 49,390 | $ | 24,658 | ||||||
| Non-spot revenues | 6,496 | 6,922 | (426) | |||||||||
| Segment Net Revenues | $ | 80,544 | $ | 56,312 | $ | 24,232 | ||||||
| Represented by: | ||||||||||||
| Broadcast operations | $ | 80,489 | $ | 56,092 | $ | 24,397 | ||||||
| Non-broadcast operations | 55 | 220 | (165) | |||||||||
| Segment Net Revenues | $ | 80,544 | $ | 56,312 | $ | 24,232 | ||||||
| Segment EBITDA | $ | 47,595 | $ | 29,509 | $ | 18,086 | ||||||
| Represented by: | ||||||||||||
| Broadcast operations | $ | 47,822 | $ | 29,463 | $ | 18,359 | ||||||
| Non-broadcast operations | (227) | 46 | (273) | |||||||||
| Segment EBITDA | $ | 47,595 | $ | 29,509 | $ | 18,086 | ||||||
| Segment EBITDA Margin | 59 | % | 52 | % | 7 | % | ||||||
| · | Segment Net Revenues for the three months ended June 30, 2007 increased by US$ 24.2 million, or 43%, compared to the three months ended June 30, 2006. In local currency, Segment Net Revenues increased by 33%. Spot revenues increased by US$ 24.7 million, or 50%, primarily due to an increase in the volume of GRPs sold as advertisers have shifted expenditure to our channel from our competitors, as well as increased average revenue per rating point sold. Non-spot revenue decreased by US$ 0.4 million, or 6%, primarily due to a reduction in the number of shows generating voting revenue in the three months ended June 30, 2007 compared to those programs broadcast in the three months ended June 30, 2006 and also a reduction in votes in the shows that were broadcast. |
| · | Segment EBITDA for the three months ended June 30, 2007 increased by US$ 18.1 million, or 61%, compared to the three months ended June 30, 2006, resulting in an EBITDA margin of 59% compared to 52% in the three months ended June 30, 2006. In local currency, Segment EBITDA increased by 48%. Costs charged in arriving at Segment EBITDA for the three months ended June 30, 2007 increased by US$ 6.1 million, or 23%, compared to the three months ended June 30, 2006. Cost of programming increased by US$ 2.3 million, or 15%, primarily due to increased investment in local productions. Other operating costs increased by US$ 3.3 million, or 49%, primarily due to increased accruals for performance-related bonus payments. Selling, general and administrative expenses increased by US$ 0.5 million, or 12%, primarily due to increased marketing and research costs. |
Six months ended June 30, 2007 compared to the six months ended June 30, 2006
| CZECH REPUBLIC SEGMENT FINANCIAL INFORMATION | ||||||||||||
| For the Six Months Ended June 30, (US$ 000's) | ||||||||||||
| 2007 | 2006 | Movement | ||||||||||
| Spot revenues | $ | 120,712 | $ | 82,833 | $ | 37,879 | ||||||
| Non-spot revenues | 11,351 | 14,028 | (2,677) | |||||||||
| Segment Net Revenues | $ | 132,063 | $ | 96,861 | $ | 35,202 | ||||||
| Represented by: | ||||||||||||
| Broadcast operations | $ | 131,969 | $ | 96,494 | $ | 35,475 | ||||||
| Non-broadcast operations | 94 | 367 | (273) | |||||||||
| Segment Net Revenues | $ | 132,063 | $ | 96,861 | $ | 35,202 | ||||||
| Segment EBITDA | $ | 73,262 | $ | 42,335 | $ | 30,927 | ||||||
| Represented by: | ||||||||||||
| Broadcast operations | $ | 73,759 | $ | 42,319 | $ | 31,440 | ||||||
| Non-broadcast operations | (497) | 16 | (513) | |||||||||
| Segment EBITDA | $ | 73,262 | $ | 42,335 | $ | 30,927 | ||||||
| Segment EBITDA Margin | 55 | % | 44 | % | 11 | % | ||||||
| · | Segment Net Revenues for the six months ended June 30, 2007 increased by US$ 35.2 million, or 36%, compared to the six months ended June 30, 2006. In local currency, Segment Net Revenues increased by 25%. Spot revenues increased by US$ 37.9 million, or 46%, primarily due to an increase in the volume of GRPs sold, as well as increased average revenue per rating point sold. Non-spot revenue decreased by US$ 2.7 million, or 19%, primarily due to a reduction in the number of shows generating voting revenue in the six months ended June 30, 2007 compared to those programs broadcast in the six months ended June 30, 2006 and also a reduction in votes in the shows that were broadcast. |
| · | Segment EBITDA for the six months ended June 30, 2007 increased by US$ 30.9 million, or 73%, compared to the six months ended June 30, 2006, resulting in an EBITDA margin of 55% compared to 44% in the six months ended June 30, 2006. In local currency, Segment EBITDA increased by 58%. Costs charged in arriving at Segment EBITDA for the six months ended June 30, 2007 increased by US$ 4.2 million, or 8%, compared to the six months ended June 30, 2006. Cost of programming was in line with the six months ended June 30, 2006 as we focused on improving operational efficiency. Other operating costs increased by US$ 4.2 million, or 33%, primarily due to increased accruals for performance-related bonus payments. Selling, general and administrative expenses were in line with the six months ended June 30, 2006 primarily due to increased accruals for performance-related bonus payments. Selling, general and administrative expenses were in line with the six months ended June 30, 2006. |
(C) ROMANIA
Market Background: We estimate that the television advertising market grew by approximately 32% - 37% in US dollars during 2006. We expect the television advertising market to show continued growth in the range of 25% to 30% in 2007.
The combined national all day audience share of PRO TV, ACASA and PRO CINEMA for the six months ended June 30, 2007 was 22.1% compared to 25.0% for the six months ended June 30, 2006. On March 1, 2007 we acquired the license to broadcast SPORT.RO which had an all day audience share of 1.9% in the six months ended June 30, 2007. We re-branded the channel SPORT.RO and re-launched it under its new name during April 2007. The major competitors are the two state-owned channels TVR1 and TVR2, with national all day audience shares for the six months ended June 30, 2007 of 13.5% and 4.8%, respectively, and privately owned broadcaster Antena 1 with 12.7%.
Prime time audience share for PRO TV, ACASA and PRO CINEMA decreased from 27.0% in the six months ended June 30, 2006 to 23.1% in the six months ended June 30, 2007. ACASA suffered a decline in share, as the popularity of our successful telenovellas has diminished following the decision by other competing stations to produce similar programs, while an increase in share for PRO CINEMA was offset by an equivalent decrease in PRO TV. Our average prime time ratings decreased from 11.3% to 8.7% over comparable periods, while prime time ratings for the whole market decreased from 41.6% in the six months ended June 30, 2006 to 37.6% in the six months ended June 30, 2007, reflecting the unusually warm weather conditions as well as the increased popularity of other forms of entertainment as consumer electronic products decine in price.
Three months ended June 30, 2007 compared to the three months ended June 30, 2006
| ROMANIA SEGMENT FINANCIAL INFORMATION | ||||||||||||
| For the Three Months Ended June 30, (US$ 000's) | ||||||||||||
| 2007 | 2006 | Movement | ||||||||||
| Spot revenues | $ | 49,069 | $ | 35,735 | $ | 13,334 | ||||||
| Non-spot revenues | 3,155 | 2,034 | 1,121 | |||||||||
| Segment Net Revenues | $ | 52,224 | $ | 37,769 | $ | 14,455 | ||||||
| Represented by: | ||||||||||||
| Broadcast operations | $ | 52,168 | $ | 37,769 | $ | 14,399 | ||||||
| Non-broadcast operations | 56 | - | 56 | |||||||||
| Segment Net Revenues | $ | 52,224 | $ | 37,769 | $ | 14,455 | ||||||
| Segment EBITDA | $ | 22,530 | $ | 16,424 | $ | 6,106 | ||||||
| Represented by: | ||||||||||||
| Broadcast operations | $ | 22,625 | $ | 16,424 | $ | 6,201 | ||||||
| Non-broadcast operations | (95) | - | (95) | |||||||||
| Segment EBITDA | $ | 22,530 | $ | 16,424 | $ | 6,106 | ||||||
| Segment EBITDA Margin | 43 | % | 43 | % | - | |||||||
| · | Segment Net Revenues for the three months ended June 30, 2007 increased by US$ 14.5 million, or 38%, compared to the three months ended June 30, 2006. Spot revenues increased by US$ 13.3 million, or 37%, driven primarily by increases in the average revenue per rating point sold in each of our three existing channels, which more than offset a decline in the volume of GRPs sold. Non-spot revenues increased by US$ 1.1 million, or 55%, primarily due to increased cable tariff revenue. The acquisition of Sport.ro added approximately US$ 2.2 million to our revenues for the three months ended June 30, 2007. |
| · | Segment EBITDA for the three months ended June 30, 2007 increased by US$ 6.1 million, or 37%, compared to the three months ended June 30, 2006, resulting in an unchanged EBITDA margin of 43%. Costs charged in arriving at Segment EBITDA for the three months ended June 30, 2007 increased by US$ 8.3 million, or 39%, compared to the three months ended June 30, 2006. Cost of programming grew by US$ 8.6 million, or 66%, due partially to the inclusion of the salary-related costs of production staff within cost of programming rather than operating costs; excluding the impact of this change in classification, cost of programming increased by US$ 6.4 million, or 49%, as a result of increased market competition and investment in quality programming. Other operating costs decreased by US$ 0.6 million, or 10%, after the difference in classification described above; excluding the impact of this change in classification, other operating costs increased by US$ 1.6 million, or 29%, primarily due to the impact of a weaker dollar on local currency denominated staffing costs. Selling, general and administrative expenses increased by US$ 0.3 million, or 10%, primarily due to increased marketing and research costs and increased office running costs. The acquisition of Sport.ro added approximately US$ 0.6 million to our Segment EBITDA for the three months ended June 30, 2007. |
Six months ended June 30, 2007 compared to the six months ended June 30, 2006
| ROMANIA SEGMENT FINANCIAL INFORMATION | ||||||||||||
| For the Six Months Ended June 30, (US$ 000's) | ||||||||||||
| 2007 | 2006 | Movement | ||||||||||
| Spot revenues | $ | 85,604 | $ | 63,870 | $ | 21,734 | ||||||
| Non-spot revenues | 5,962 | 3,770 | 2,192 | |||||||||
| Segment Net Revenues | $ | 91,566 | $ | 67,640 | $ | 23,926 | ||||||
| Represented by: | ||||||||||||
| Broadcast operations | $ | 91,510 | $ | 67,640 | $ | 23,870 | ||||||
| Non-broadcast operations | 56 | - | 56 | |||||||||
| Segment Net Revenues | $ | 91,566 | $ | 67,640 | $ | 23,926 | ||||||
| Segment EBITDA | $ | 37,666 | $ | 28,037 | $ | 9,629 | ||||||
| Represented by: | ||||||||||||
| Broadcast operations | $ | 37,899 | $ | 28,037 | $ | 9,862 | ||||||
| Non-broadcast operations | (233) | - | (233) | |||||||||
| Segment EBITDA | $ | 37,666 | $ | 28,037 | $ | 9,629 | ||||||
| Segment EBITDA Margin | 41 | % | 41 | % | - | |||||||
| · | Segment Net Revenues for the six months ended June 30, 2007 increased by US$ 23.9 million, or 35%, compared to the six months ended June 30, 2006. Spot revenues increased by US$ 21.7 million, or 34%, driven primarily by increases in the average revenue per rating point sold in each of our three existing channels, which more than offset a decline in the volume of GRPs sold. Non-spot revenues increased by US$ 2.2 million, or 58%, primarily due to increased cable tariff revenue. The acquisition of Sport.ro added approximately US$ 2.9 million to our revenues for the six months ended June 30, 2007. |
| · | Segment EBITDA for the six months ended June 30, 2007 increased by US$ 9.6 million, or 34%, compared to the six months ended June 30, 2006, with an unchanged EBITDA margin of 41%. Costs charged in arriving at Segment EBITDA for the six months ended June 30, 2007 increased by US$ 14.3 million, or 36%, compared to the six months ended June 30, 2006. Cost of programming grew by US$ 14.5 million, or 58%, due partially to the inclusion of the salary-related costs of production staff within cost of programming rather than operating costs; excluding the impact of this change in classification, cost of programming increased by US$ 10.5 million, or 42%, as a result of increased market competition and investment in quality programming. Other operating costs decreased by US$ 0.7 million, or 6%, after the difference in classification described above; excluding the impact of this change in classification, other operating costs increased by US$ 3.3 million, or 34%, primarily due to the impact of a weaker dollar on local currency denominated staffing costs. Selling, general and administrative expenses increased by US$ 0.5 million, or 11%, primarily due to increased marketing and research costs and increased office running costs. The acquisition of Sport.ro added approximately US$ 0.8 million to our Segment EBITDA for the six months ended June 30, 2007. |
Market Background: We estimate that the television advertising market in the Slovak Republic experienced local currency growth of approximately 5% - 7% in 2006. We expect the television advertising market to show growth in the range of 15% - 25% in 2007.
MARKIZA TV is the leading channel in the Slovak Republic. National all day audience share for the six months ended June 30, 2007 was 34.4% compared to 32.2% for the six months ended June 30, 2006. The major competitor is the state-owned channel STV1, with a national all day audience share of 17.6% for the six months ended June 30, 2007. The national all day audience share of TV JOJ, the only other significant privately owned channel, was 16.1% for the six months ended June 30, 2007.
Our prime time audience share increased from 33.8% in the six months ended June 30, 2006 to 38.3% in the six months ended June 30, 2007 primarily due to strong local programs such as Bailando and Neighbors. Our average prime time ratings increased from 13.5% to 14.7% over comparable periods, while prime time ratings for the whole market decreased from 40.1% in the six months ended June 30, 2006 to 38.5% in the six months ended June 30, 2007, reflecting the impact of the Winter Olympics and the Soccer World Cup on viewing habits in the six months ended June 30, 2006.
Page 54
Three months ended June 30, 2007 compared to the three months ended June 30, 2006
| SLOVAK REPUBLIC SEGMENT FINANCIAL INFORMATION | ||||||||||||
| For the Three Months Ended June 30, (US$ 000's) | ||||||||||||
| 2007 | 2006 | Movement | ||||||||||
| Spot revenues | $ | 28,494 | $ | 19,182 | $ | 9,312 | ||||||
| Non-spot revenues | 1,158 | 864 | 294 | |||||||||
| Segment Net Revenues | $ | 29,652 | $ | 20,046 | $ | 9,606 | ||||||
| Represented by: | ||||||||||||
| Broadcast operations | $ | 29,563 | $ | 20,039 | $ | 9,524 | ||||||
| Non-broadcast operations | 89 | 7 | 82 | |||||||||
| Segment Net Revenues | $ | 29,652 | $ | 20,046 | $ | 9,606 | ||||||
| Segment EBITDA | $ | 11,712 | $ | 7,827 | $ | 3,885 | ||||||
| Represented by: | ||||||||||||
| Broadcast operations | $ | 11,894 | $ | 7,821 | $ | 4,073 | ||||||
| Non-broadcast operations | (182) | 6 | (188) | |||||||||
| Segment EBITDA | $ | 11,712 | $ | 7,827 | $ | 3,885 | ||||||
| Segment EBITDA Margin | 39 | % | 39 | % | - | |||||||
| · | Segment Net Revenues for the three months ended June 30, 2007 increased by US$ 9.6 million, or 48%, compared to the three months ended June 30, 2006. In local currency, Segment Net Revenues increased by 23%. The increase in Segment Net Revenues was due to an increase of US$ 9.3 million, or 49%, in spot revenues and an increase of US$ 0.3 million, or 34%, in non-spot revenues. The increase in spot revenues is mainly due to increases in the average revenue per rating point sold, as well as an increase in the volume of advertising spots sold. |
| · | Segment EBITDA for the three months ended June 30, 2007 increased by US$ 3.9 million, or 50%, compared to the three months ended June 30, 2006, resulting in an unchanged EBITDA margin of 39%. In local currency, Segment EBITDA increased by 23%. Costs charged in arriving at Segment EBITDA for the three months ended June 30, 2007 increased by US$ 5.7 million, or 47%, compared to the three months ended June 30, 2006. Cost of programming increased by US$ 3.5 million, or 54% primarily due to increased investment in local productions such as Bailando. Other operating costs increased by US$ 1.8 million, or 47%, primarily due to increased accruals for performance-related bonus payments and increased broadcast and operating expenses. Selling, general and administrative expenses increased by US$ 0.4 million, or 23%, primarily due to increased consultancy costs. |
Six months ended June 30, 2007 compared to the six months ended June 30, 2006
| SLOVAK REPUBLIC SEGMENT FINANCIAL INFORMATION | ||||||||||||
| For the Six Months Ended June 30, (US$ 000's) | ||||||||||||
| 2007 | 2006 | Movement | ||||||||||
| Spot revenues | $ | 46,569 | $ | 29,496 | $ | 17,073 | ||||||
| Non-spot revenues | 1,760 | 1,756 | 4 | |||||||||
| Segment Net Revenues | $ | 48,329 | $ | 31,252 | $ | 17,077 | ||||||
| Represented by: | ||||||||||||
| Broadcast operations | $ | 48,225 | $ | 31,245 | $ | 16,980 | ||||||
| Non-broadcast operations | 104 | 7 | 97 | |||||||||
| Segment Net Revenues | $ | 48,329 | $ | 31,252 | $ | 17,077 | ||||||
| Segment EBITDA | $ | 17,468 | $ | 6,850 | $ | 10,618 | ||||||
| Represented by: | ||||||||||||
| Broadcast operations | $ | 17,753 | $ | 6,869 | $ | 10,884 | ||||||
| Non-broadcast operations | (285) | (19) | (266) | |||||||||
| Segment EBITDA | $ | 17,468 | $ | 6,850 | $ | 10,618 | ||||||
| Segment EBITDA Margin | 36 | % | 22 | % | 14 | % | ||||||
| · | Segment Net Revenues for the six months ended June 30, 2007 increased by US$ 17.1 million, or 55%, compared to the six months ended June 30, 2006. In local currency, Segment Net Revenues increased by 36%. The increase in Segment Net Revenues was due to an increase of US$ 17.1 million, or 58%, in spot revenues, with non-spot revenues in line with the six months ended June 30, 2007. The increase in spot revenues is mainly due to increases in the average revenue per rating point sold, as well as an increase in the volume of advertising spots sold. Our advertising revenues benefited from the launch of a new mobile phone operator during the six months ended June 30, 2007, as well as increased spending from existing customers, particularly in the pharmaceutical sector. Segment Net Revenues for the six months ended June 30, 2006 included approximately US$ 1.8 million in respect of the period prior to acquisition on January 23, 2006 when Markiza was accounted for as an equity affiliate. |
| · | Segment EBITDA for the six months ended June 30, 2007 increased by US$ 10.6 million, or 155%, compared to the six months ended June 30, 2006, resulting in an EBITDA margin of 36% compared to 22% in the six months ended June 30, 2006. In local currency, Segment EBITDA increased by 77%. Costs charged in arriving at Segment EBITDA for the six months ended June 30, 2007 increased by US$ 6.5 million, or 26%, compared to the six months ended June 30, 2006. Cost of programming increased by US$ 3.1 million, or 23%, due to increased investment in local productions and syndicated programming; the amount charged in the six months ended June 30, 2006 included a charge of US$ 0.7 million to write off an unsuccessful show. Other operating costs increased by US$ 2.4 million, or 31%, due to increased accruals for performance-related bonus payments, increased broadcast and operating expenses and increased music right costs. Selling, general and administrative expenses increased by US$ 0.9 million, or 28%, primarily due to increased consultancy and increased marketing and research costs. Costs charged in arriving at Segment EBITDA for the six months ended June 30, 2006 included US$ 1.7 million of programming costs, US$ 0.9 million of other operating costs and US$ 0.4 million of selling, general and administrative expenses in respect of the period prior to acquisition on January 23, 2006. |
(E) SLOVENIA
Market Background: We estimate that the television advertising market in Slovenia experienced local currency growth of approximately 6% - 8% in 2006. We expect the television advertising market to show low single digit growth in 2007.
The combined national all day audience share of our two channels increased from 37.3% for the six months ended June 30, 2006 to 37.6% for the six months ended June 30, 2007. The major competitors are state-owned channels SLO1 and SLO2, with national all day audience shares for the six months ended June 30, 2007 of 23.2% and 8.9%, respectively.
Our prime time audience share decreased from 44.5% in the six months ended June 30, 2006 to 43.4% in the six months ended June 30, 2007, with an increased share in KANAL A, partially offsetting a decreased share in POP TV. Our average prime time ratings decreased from 15.0% to 14.8% over comparable periods, while prime time ratings for the whole market increased from 33.6% in the six months ended June 30, 2006 to 34.0% in the six months ended June 30, 2007.
On January 1, 2007 Slovenia adopted the Euro and we adopted the Euro as the functional currency of our Slovenia operations in place of the Slovenian Tolar.
| SLOVENIA SEGMENT FINANCIAL INFORMATION | ||||||||||||
| For the Three Months Ended June 30, (US$ 000's) | ||||||||||||
| 2007 | 2006 | Movement | ||||||||||
| Spot revenues | $ | 17,435 | $ | 14,934 | $ | 2,501 | ||||||
| Non-spot revenues | 2,660 | 621 | 2,039 | |||||||||
| Segment Net Revenues | $ | 20,095 | $ | 15,555 | $ | 4,540 | ||||||
| Represented by: | ||||||||||||
| Broadcast operations | $ | 19,023 | $ | 15,095 | $ | 3,928 | ||||||
| Non-broadcast operations | 1,072 | 460 | 612 | |||||||||
| Segment Net Revenues | $ | 20,095 | $ | 15,555 | $ | 4,540 | ||||||
| Segment EBITDA | $ | 8,388 | $ | 6,430 | $ | 1,958 | ||||||
| Represented by: | ||||||||||||
| Broadcast operations | $ | 8,017 | $ | 6,296 | $ | 1,721 | ||||||
| Non-broadcast operations | 371 | 134 | 237 | |||||||||
| Segment EBITDA | $ | 8,388 | $ | 6,430 | $ | 1,958 | ||||||
| Segment EBITDA Margin | 42 | % | 41 | % | 1 | % | ||||||
| · | Segment Net Revenues for the three months ended June 30, 2007 increased by US$ 4.5 million, or 29%, compared to the three months ended June 30, 2006. Spot revenues increased by US$ 2.5 million, or 17%, as our operations benefited from an increase in the average revenue per thirty-second advertising spot, particularly from large fast-moving consumer goods clients and local retailers, which more than offset a decline in the volume of GRPs sold. Non-spot revenues increased by US$ 2.0 million, or 328%, due to an increased level of sponsorship and an increase in non-broadcast advertising revenue. |
Page 57
| · | Segment EBITDA for the three months ended June 30, 2007 increased by US$ 2.0 million, or 30%, compared to the three months June 30, 2006, resulting in an EBITDA margin of 42% compared to 41% in the three months ended June 30, 2006. Costs charged in arriving at Segment EBITDA for the three months ended June 30, 2007 increased by US$ 2.6 million, or 28%, compared to the three months ended June 30, 2006. Cost of programming grew by US$ 2.5 million, or 59%, due to increased investment in programming in a more competitive market environment. Other operating costs decreased by US$ 0.4 million, or 12%, primarily due to lower salary and freelance costs, partially offset by higher music rights costs and higher transmitter and associated maintenance costs. Selling, general and administrative expenses increased by US$ 0.5 million, or 39%, primarily due to higher office running costs and increased marketing and research costs. |
Six months ended June 30, 2007 compared to the six months ended June 30, 2006
| SLOVENIA SEGMENT FINANCIAL INFORMATION | ||||||||||||
| For the Six Months Ended June 30, (US$ 000's) | ||||||||||||
| 2007 | 2006 | Movement | ||||||||||
| Spot revenues | $ | 28,760 | $ | 24,675 | $ | 4,085 | ||||||
| Non-spot revenues | 4,004 | 1,107 | 2,897 | |||||||||
| Segment Net Revenues | $ | 32,764 | $ | 25,782 | $ | 6,982 | ||||||
| Represented by: | ||||||||||||
| Broadcast operations | $ | 31,261 | $ | 25,027 | $ | 6,234 | ||||||
| Non-broadcast operations | 1,503 | 755 | 748 | |||||||||
| Segment Net Revenues | $ | 32,764 | $ | 25,782 | $ | 6,982 | ||||||
| Segment EBITDA | $ | 11,389 | $ | 9,463 | $ | 1,926 | ||||||
| Represented by: | ||||||||||||
| Broadcast operations | $ | 11,039 | $ | 9,305 | $ | 1,734 | ||||||
| Non-broadcast operations | 350 | 158 | 192 | |||||||||
| Segment EBITDA | $ | 11,389 | $ | 9,463 | $ | 1,926 | ||||||
| Segment EBITDA Margin | 35 | % | 37 | % | (2) | % | ||||||
| · | Segment Net Revenues for the six months ended June 30, 2007 increased by US$ 7.0 million, or 27%, compared to the six months ended June 30, 2006. Spot revenues increased by US$ 4.1 million, or 17%, as our operations benefited from an increase in the average revenue per thirty-second advertising spot, which more than offset a decline in the volume of GRPs sold. Non-spot revenues increased by US$ 2.9 million, or 262%, due to an increased level of sponsorship and an increase in non-broadcast advertising revenue. |
Segment EBITDA for the six months ended June 30, 2007 increased by US$ 1.9 million, or 20%, compared to the six months ended June 30, 2006, resulting in an EBITDA margin of 35% compared to 37% in the six months ended June 30, 2006. Costs charged in arriving at Segment EBITDA for the six months ended June 30, 2007 increased by US$ 5.1 million, or 31%, compared to the six months ended June 30, 2006. Cost of programming grew by US$ 4.8 million, or 65%, due to increased investment in programming in a more competitive market environment. Other operating costs decreased by US$ 0.7 million, or 11%, primarily due to lower salary and freelance costs, partially offset by higher music rights costs and higher transmitter and associated maintenance costs. Selling, general and administrative expenses increased by US$ 1.0 million, or 40%, primarily due to higher marketing and research costs and higher office running costs.
(F) UKRAINE (STUDIO 1+1)
Market Background: We estimate that the television advertising market in Ukraine, where sales are denominated primarily in US dollars, experienced growth of approximately 28% - 31% in 2006.
STUDIO 1+1 had a national all day audience share of 15.9% for the six months ended June 30, 2007 compared to 18.8% for the six months ended June 30, 2006. Our competitors include: Inter, with a national all day audience share of 19.6%, Novy Kanal with 7.7%, ICTV with 7.1% and STB with 7.2%.
Our prime time audience share decreased from 24.1% in the six months ended June 30, 2006 to 18.5% in the six months ended June 30, 2007. Many larger major channels have lost audience share to new niche channels. Our share in the six months ended June 30, 2006 reflected the outstanding success of a show called Ugly Betty. Our average prime time ratings decreased from 9.1% to 6.6% over comparable periods, while prime time ratings for the whole market decreased from 37.8% in the six months ended June 30, 2006 to 35.5% in the six months ended June 30, 2007.
While the television advertising market has shown recovery in the second quarter it continues to lag behind expectations. Advertisers have been cautious in spending their budgets in the light of continuing political uncertainty arising from the disagreements between the Ukrainian President and Prime Minister.
In addition, our independent sales house Video International (Prioritet) has lost many of its broadcasting clients to its major rival InterReklama, which now has approximately 70% of available advertising inventory at its disposal for advertising clients. According to Video International, in order to cover the cash costs of financial guarantees made in the early part of the year to new and existing broadcasting clients, InterReklama discounted prices dramatically in the early part of the year. Subsequently, they have continued to exercise strong negotiating leverage with their significant broadcaster base. However, we have recently seen a recovery in pricing during the second quarter from the heavy discounting in the first quarter.
It is expected that parliamentary elections will take place on September 30, 2007 and will lead to strong growth of the television advertising market in the fourth quarter. Video International remains optimistic that, if the formation of a new government following the elections is rapid, advertising spending deferred from the first half of the year will be available in the final quarter and may result in an annual year-on-year market growth of at least 30%. It is likely that broadcasters will also benefit from significant additional political advertising spending during the election season in the third quarter. However, given the uncertainties surrounding the factors described above, there is a wide range of possible outcomes for market development in 2007.
Three months ended June 30, 2007 compared to the three months ended June 30, 2006
| UKRAINE (STUDIO 1+1) SEGMENT FINANCIAL INFORMATION | ||||||||||||
| For the Three Months Ended June 30, (US$ 000's) | ||||||||||||
| 2007 | 2006 | Movement | ||||||||||
| Spot revenues | $ | 18,285 | $ | 17,596 | $ | 689 | ||||||
| Non-spot revenues | 4,416 | 3,466 | 950 | |||||||||
| Segment Net Revenues | $ | 22,701 | $ | 21,062 | $ | 1,639 | ||||||
| Represented by: | ||||||||||||
| Broadcast operations | $ | 22,701 | $ | 21,062 | $ | 1,639 | ||||||
| Non-broadcast operations | - | - | - | |||||||||
| Segment Net Revenues | $ | 22,701 | $ | 21,062 | $ | 1,639 | ||||||
| Segment EBITDA | $ | 565 | $ | 6,037 | $ | (5,472) | ||||||
| Represented by: | ||||||||||||
| Broadcast operations | $ | 716 | $ | 6,037 | $ | (5,321) | ||||||
| Non-broadcast operations | (151) | - | (151) | |||||||||
| Segment EBITDA | $ | 565 | $ | 6,037 | $ | (5,472) | ||||||
| Segment EBITDA Margin | 2 | % | 29 | % | (27) | % | ||||||
| · | Segment Net Revenues for the three months ended June 30, 2007 increased by US$ 1.6 million, or 8%, compared to the three months ended June 30, 2006. Spot revenues increased by US$ 0.6 million, or 4%. There was a decrease in the volume of GRPs sold in the three months ended June 30, 2007 compared to the three months ended June 30, 2006 as our ratings declined due to the poor performance of the Russian series of Mothers and Daughters and of Damned Paradise (which aired following the conclusion of the successful current run of Cadets), particularly as against the runaway success of a new Russian series Day of Tatyana on Inter, which is expected to run until early 2008. We also suffered increased competition from other broadcasters. These factors were partially offset by an increase in the average revenue per rating point sold. Non-spot revenues increased by US$ 1.0 million, or 27%, primarily due to increased sponsorship and the sale of surplus programming. |
| · | Segment EBITDA for the three months ended June 30, 2007 decreased by US$ 5.5 million, or 87%, compared to the three months ended June 30, 2006, resulting in an EBITDA margin of 2% compared to 29% in the three months ended June 30, 2006. Costs charged in arriving at Segment EBITDA for the three months ended June 30, 2007 increased by US$ 7.1 million, or 47%, compared to the three months ended June 30, 2006. Cost of programming grew by US$ 7.7 million, or 87%, including a charge of US$ 2.2 million to write off poorly performing programming, principally second runs of American series. The increase in cost of programming reflects continued price inflation for Russian programming, which drives strong ratings in the market, as well as increased investment in such programming to improve our programming schedule and boost ratings following disappointing ratings in the first half of 2007 and against unusually strong programming on Inter. Other operating costs increased by US$ 1.0 million, or 31%, due to increased salary costs and increased broadcast operating expenses. Selling, general and administrative expenses decreased by US$ 1.6 million, or 53%, primarily due to decreased taxes and reduced bad debt expense. |
Six months ended June 30, 2007 compared to the six months ended June 30, 2006
| UKRAINE (STUDIO 1+1) SEGMENT FINANCIAL INFORMATION | ||||||||||||
| For the Six Months Ended June 30, (US$ 000's) | ||||||||||||
| 2007 | 2006 | Movement | ||||||||||
| Spot revenues | $ | 33,106 | $ | 40,324 | $ | (7,218 | ) | |||||
| Non-spot revenues | 7,670 | 6,216 | 1,454 | |||||||||
| Segment Net Revenues | $ | 40,776 | $ | 46,540 | $ | (5,764 | ) | |||||
| Represented by: | ||||||||||||
| Broadcast operations | $ | 40,776 | $ | 46,540 | $ | (5,764 | ) | |||||
| Non-broadcast operations | - | - | - | |||||||||
| Segment Net Revenues | $ | 40,776 | $ | 46,540 | $ | (5,764 | ) | |||||
| Segment EBITDA | $ | (1,805 | ) | $ | 17,024 | $ | (18,829 | ) | ||||
| Represented by: | ||||||||||||
| Broadcast operations | $ | (1,622 | ) | $ | 17,024 | $ | (18,646 | ) | ||||
| Non-broadcast operations | (183 | ) | - | (183 | ) | |||||||
| Segment EBITDA | $ | (1,805 | ) | $ | 17,024 | $ | (18,829 | ) | ||||
| Segment EBITDA Margin | (4 | )% | 37 | % | (41 | )% | ||||||
| · | Segment Net Revenues for the six months ended June 30, 2007 decreased by US$ 5.8 million, or 12%, compared to the six months ended June 30, 2006. Spot revenues decreased by US$ 7.2 million, or 18%. There was a decrease in the volume of GRPs sold as our ratings declined due to the poor performance of certain series on Studio 1+1 and increased competition from other broadcasters. There was also a decrease in the average revenue per rating point sold in the six months ended June 30, 2007 compared to the six months ended June 30, 2006 due to extreme price competition in the first quarter. In the six months ended June 30, 2006, we benefited from US$ 8.4 million of political advertising revenue ahead of the parliamentary elections in March 2006 as well as the extraordinary ratings success of the Russian series Ugly Betty, which ran until July 2006. Non-spot revenues increased by US$ 1.5 million, or 23%, primarily due to the sale of surplus programming and increased sponsorship. |
| · | Segment EBITDA for the six months ended June 30, 2007 decreased by US$ 18.8 million, or 111%, compared to the six months ended June 30, 2006, resulting in an EBITDA loss of (4)% compared to an EBITDA margin of 37% in the six months ended June 30, 2006. Costs charged in arriving at Segment EBITDA for the six months ended June 30, 2007 increased by US$ 13.1 million, or 44%, compared to the six months ended June 30, 2006. Cost of programming grew by US$ 13.0 million, or 75%, including a charge of US$ 2.7 million to write off poorly performing programming, principally second runs of American series. The increase in cost of programming reflects continued price inflation for Russian programming, which drives strong ratings in the market, as well as increased investment in such programming to improve our programming schedule and boost ratings following disappointing ratings in the first half of 2007 and against unusually strong programming on Inter. Other operating costs increased by US$ 1.6 million, or 22%, due to increased salary costs and increased broadcast operating expenses. Selling, general and administrative expenses decreased by US$ 1.5 million, or 27%, primarily due to decreased taxes and reduced bad debt expense. We plan continued investment in programming throughout the remainder of 2007 as we seek to recover audience share and improve profitability. The performance of our Ukraine operations remains subject both to political developments, which can have a significant impact on market development in the second half of 2007, and to the competitive dynamics of the market (See Part II, Item IA – “Risk Factors”). |
(G) UKRAINE (KINO, CITI)
On January 11, 2006, we acquired a 65.5% interest in Ukrpromtorg 2003 LLC, owner of 92.2% of Gravis LLC, which operated the local channels, CHANNEL 35 and CHANNEL 7. In July 2006, we ceased operating CHANNEL 7 and launched a new entertainment channel, KINO, targeted at a younger demographic. On December 1, 2006, we ceased operating CHANNEL 35 and launched a new youth-oriented channel, CITI, with a Kiev-wide reach.
KINO and CITI, both of which target a youth market have as their main competitors ICTV, TONIS and NTN. As at June 30, 2007, KINO had a technical reach of approximately 53.1% and in the six months ended June 30, 2007 achieved a 15-50 prime time audience share in the Kiev region of 2.2%. CITI had a technical reach of approximately 88.0% of the population of the city of Kiev and the Kiev region. In the six months ended June 30, 2007 CITI achieved a 4+ prime time audience share of 1.5% in Kiev and the Kiev region.
Three months ended June 30, 2007 compared to the three months ended June 30, 2006
| UKRAINE (KINO, CITI) SEGMENT FINANCIAL INFORMATION | ||||||||||||
| For the Three Months Ended June 30, (US$ 000's) | ||||||||||||
| 2007 | 2006 | Movement | ||||||||||
| Spot revenues | $ | 334 | $ | 106 | $ | 228 | ||||||
| Non-spot revenues | 320 | 92 | 228 | |||||||||
| Segment Net Revenues | $ | 654 | $ | 198 | $ | 456 | ||||||
| Represented by: | ||||||||||||
| Broadcast operations | $ | 654 | $ | 198 | $ | 456 | ||||||
| Non-broadcast operations | - | - | - | |||||||||
| Segment Net Revenues | $ | 654 | $ | 198 | $ | 456 | ||||||
| Segment EBITDA | $ | (1,755) | $ | (432) | $ | (1,323) | ||||||
| Represented by: | ||||||||||||
| Broadcast operations | $ | (1,755) | $ | (432) | $ | (1,323) | ||||||
| Non-broadcast operations | - | - | - | |||||||||
| Segment EBITDA | $ | (1,755) | $ | (432) | $ | (1,323) | ||||||
| Segment EBITDA Margin | (268) | % | (218) | % | (50) | % | ||||||
| · | Segment Net Revenues for the three months ended June 30, 2007 increased by US$ 0.5 million, or 230%, compared to the three months ended June 30, 2006. Spot revenues increased by US$ 0.2 million, or 215%. Non-spot revenues increased by US$ 0.2 million, or 248%, primarily due to increased program sponsorship. |
| · | Segment EBITDA for the three months ended June 30, 2007 decreased by US$ 1.3 million, or 306%, compared to the three months ended June 30, 2006, resulting in an EBITDA margin of (268)% compared to (218)% in the three months ended June 30, 2006. Costs charged in arriving at Segment EBITDA for the three months ended June 30, 2007 increased by US$ 1.8 million, or 282%, compared to the three months ended June 30, 2006 as we continued to develop the channels. Cost of programming grew by US$ 1.3 million, or 854%. Other operating costs increased by US$ 0.2 million, or 62%. Selling, general and administrative expenses increased by US$ 0.3 million, or 313%. |
Six months ended June 30, 2007 compared to the six months ended June 30, 2006
| UKRAINE (KINO, CITI) SEGMENT FINANCIAL INFORMATION | ||||||||||||
| For the Six Months Ended June 30, (US$ 000's) | ||||||||||||
| 2007 | 2006(1) | Movement | ||||||||||
| Spot revenues | $ | 477 | $ | 321 | $ | 156 | ||||||
| Non-spot revenues | 575 | 251 | 324 | |||||||||
| Segment Net Revenues | $ | 1,052 | $ | 572 | $ | 480 | ||||||
| Represented by: | ||||||||||||
| Broadcast operations | $ | 1,052 | $ | 572 | $ | 480 | ||||||
| Non-broadcast operations | - | - | - | |||||||||
| Segment Net Revenues | $ | 1,052 | $ | 572 | $ | 480 | ||||||
| Segment EBITDA | $ | (4,172) | $ | (557) | $ | (3,615) | ||||||
| Represented by: | ||||||||||||
| Broadcast operations | $ | (4,172) | $ | (557) | $ | (3,615) | ||||||
| Non-broadcast operations | - | - | - | |||||||||
| Segment EBITDA | $ | (4,172) | $ | (557) | $ | (3,615) | ||||||
| Segment EBITDA Margin | (397) | % | (97) | % | (300) | % | ||||||
| (1) From acquisition on January 11, 2006 only | ||||||||||||
| · | Segment Net Revenues for the six months ended June 30, 2007 increased by US$ 0.5 million, or 84%, compared to the six months ended June 30, 2006. Spot revenues increased by US$ 0.2 million, or 49%. Non-spot revenues increased by US$ 0.3 million, or 129%, primarily due to increased program sponsorship. |
| · | Segment EBITDA for the six months ended June 30, 2007 decreased by US$ 3.6 million, or 649%, compared to the six months ended June 30, 2006, resulting in an EBITDA margin of (397)% compared to (97)% in the six months ended June 30, 2006. Costs charged in arriving at Segment EBITDA for the six months ended June 30, 2007 increased by US$ 4.1 million, or 362%, compared to the six months ended June 30, 2006 as we continued to develop the channels. Cost of programming grew by US$ 3.0 million, or 1465%. Other operating costs increased by US$ 0.6 million, or 101%. Selling, general and administrative expenses increased by US$ 0.5 million, or 167%. |
PROGRAMMING PAYMENTS AND PROGRAM AMORTIZATION
Our cost of programming for the three and six months ended June 30, 2007 and 2006 was as follows:
| COST OF PROGRAMMING | ||||||||||||||||
For the Three Months Ended June 30, (US$ 000’s) | For the Six Months Ended June 30, (US$ 000’s) | |||||||||||||||
| 2007 | 2006 | 2007 | 2006 | |||||||||||||
| Production expenses | $ | 40,778 | $ | 26,045 | $ | 68,334 | $ | 49,020 | ||||||||
| Program amortization | 41,995 | 26,805 | 80,792 | 52,248 | ||||||||||||
| Cost of programming | $ | 82,773 | $ | 52,850 | $ | 149,126 | $ | 101,268 | ||||||||
Production expenses represent the cost of in-house productions as well as locally commissioned programming, such as news, current affairs and game shows. The cost of broadcasting all other purchased programming is recorded as program amortization.
Total consolidated programming costs (including amortization of programming rights and production costs) increased by US$ 29.9 million, or 57 %, in the three months ended June 30, 2007 compared to the three months ended June 30, 2006 primarily due to:
| · | US$ 4.0 million of additional programming costs from our Croatia operations; |
| · | US$ 2.3 million of additional programming costs from our Czech Republic operations. |
| · | US$ 8.6 million of additional programming costs from our Romania operations; |
| · | US$ 3.5 million of additional programming costs from our Slovak Republic operations; |
| · | US$ 2.5 million of additional programming costs from our Slovenia operations; |
| · | US$ 7.7 million of additional programming costs from our Ukraine (STUDIO 1+1) operations; and |
| · | US$ 1.3 million of additional programming costs from our Ukraine (KINO, CITI) operations; |
Total consolidated programming costs (including amortization of programming rights and production costs) increased by US$ 47.9 million, or 47 %, in the six months ended June 30, 2007 compared to the six months ended June 30, 2006 primarily due to:
| · | US$ 7.8 million of additional programming costs from our Croatia operations; |
| · | US$ 14.4 million of additional programming costs from our Romania operations; |
| · | US$ 4.8 million of additional programming costs from our Slovak Republic operations, which have been consolidated for the entire six-month period in 2007; |
| · | US$ 4.8 million of additional programming costs from our Slovenia operations; |
| · | US$ 13.0 million of additional programming costs from our Ukraine (STUDIO 1+1) operations; and |
| · | US$ 3.0 million of additional programming costs from our Ukraine (KINO, CITI) operations; |
The amortization of acquired programming for each of our consolidated operations for the three and six months ended June 30, 2007 and 2006, is set out in the table below. For comparison, the table also shows the cash paid for programming by each of our operations in the respective periods. The cash paid for programming by our operations in Croatia, the Czech Republic, Romania, Slovenia, Ukraine and the Slovak Republic (for the period from January 23, 2006) is reflected within net cash provided by continuing operating activities in our consolidated statement of cash flows.
| PROGRAM AMORTIZATION AND CASH PAID FOR PROGRAMMING | ||||||||||||||||
For the Three Months Ended June 30, (US$ 000’s) | For the Six Months Ended June 30, (US$ 000’s) | |||||||||||||||
| 2007 | 2006 | 2007 | 2006 | |||||||||||||
| Program amortization: | ||||||||||||||||
| Croatia (NOVA TV) | $ | 5,234 | $ | 3,472 | $ | 10,634 | $ | 6,890 | ||||||||
| Czech Republic (TV NOVA) | 7,295 | 6,506 | 13,851 | 13,889 | ||||||||||||
| Romania (PRO TV, ACASA, PRO CINEMA, PRO TV INTERNATIONAL and SPORT.RO) | 9,906 | 7,074 | 19,335 | 13,790 | ||||||||||||
| Slovak Republic (MARKIZA TV) (post-acquisition) | 2,969 | (1)3,642 | 6,176 | (1)4,078 | ||||||||||||
| Slovenia (POP TV and KANAL A) | 2,246 | 1,788 | 4,442 | 3,205 | ||||||||||||
| Ukraine (STUDIO 1+1) | 13,561 | 5,964 | 24,489 | 12,010 | ||||||||||||
| Ukraine (KINO, CITI) | 784 | 94 | 1,865 | 121 | ||||||||||||
| $ | 41,995 | $ | 28,540 | 80,792 | $ | 53,983 | ||||||||||
| (1) Includes the program amortization of our operations in the Slovak Republic (MARKIZA TV) for the period prior to January 23, 2006 when they were accounted for as an equity affiliate | ||||||||||||||||
| Cash paid for programming: | ||||||||||||||||
| Croatia (NOVA TV) | $ | 10,002 | $ | 3,232 | $ | 10,907 | $ | 7,598 | ||||||||
| Czech Republic (TV NOVA) | 4,269 | 4,277 | 10,846 | 16,213 | ||||||||||||
| Romania (PRO TV, ACASA, PRO CINEMA, PRO TV INTERNATIONAL and SPORT.RO) | 12,931 | 10,789 | 22,977 | 17,395 | ||||||||||||
| Slovak Republic (MARKIZA TV) | 4,466 | 2,263 | 8,165 | 5,542 | ||||||||||||
| Slovenia (POP TV and KANAL A) | 2,480 | 1,680 | 4,652 | 3,499 | ||||||||||||
| Ukraine (STUDIO 1+1) | 16,075 | 5,437 | 26,559 | 13,409 | ||||||||||||
| Ukraine (KINO, CITI) | 375 | 273 | 1,117 | 388 | ||||||||||||
| $ | 50,598 | $ | 27,951 | $ | 85,223 | $ | 64,044 | |||||||||
IV. Analysis of the Results of Consolidated Operations
IV (a) Net Revenues for the three months ended June 30, 2007 compared to the three months ended June 30, 2006
| CONSOLIDATED NET REVENUES | ||||||||||||
| For the Three Months Ended June 30, (US$ 000's) | ||||||||||||
| 2007 | 2006 | Movement | ||||||||||
| Croatia | $ | 10,414 | $ | 5,647 | $ | 4,767 | ||||||
| Czech Republic | 80,544 | 56,312 | 24,232 | |||||||||
| Romania | 52,224 | 37,769 | 14,455 | |||||||||
| Slovak Republic | 29,652 | 20,046 | 9,606 | |||||||||
| Slovenia | 20,095 | 15,555 | 4,540 | |||||||||
| Ukraine (STUDIO 1+1) | 22,701 | 21,062 | 1,639 | |||||||||
| Ukraine (KINO, CITI) | 654 | 198 | 456 | |||||||||
| Total Consolidated Net Revenues | $ | 216,284 | $ | 156,589 | $ | 59,695 | ||||||
Our consolidated net revenues increased by US$ 59.7 million, or 38%, for the three months ended June 30, 2007 compared to the three months ended June 30, 2006. See discussion in Item 2, III. “Analysis of Segment Results”.
IV (b) Net Revenues for the six months ended June 30, 2007 compared to the six months ended June 30, 2006
| CONSOLIDATED NET REVENUES | ||||||||||||
| For the Six Months Ended June 30, (US$ 000's) | ||||||||||||
| 2007 | 2006 | Movement | ||||||||||
| Croatia | $ | 17,646 | $ | 9,457 | $ | 8,189 | ||||||
| Czech Republic | 132,063 | 96,861 | 35,202 | |||||||||
| Romania | 91,566 | 67,640 | 23,926 | |||||||||
| Slovak Republic * | 48,329 | 29,491 | 18,838 | |||||||||
| Slovenia | 32,764 | 25,782 | 6,982 | |||||||||
| Ukraine (STUDIO 1+1) | 40,776 | 46,540 | (5,764 | ) | ||||||||
| Ukraine (KINO, CITI) | 1,052 | 572 | 480 | |||||||||
| Total Consolidated Net Revenues | $ | 364,196 | $ | 276,343 | $ | 87,853 | ||||||
* From January 23, 2006 only.
Our consolidated net revenues for the six months ended June 30, 2007 increased by US$ 87.9 million, or 32%, compared to the six months ended June 30, 2006. See discussion in Item 2, III. “Analysis of Segment Results”.
IV (c) Cost of Revenues for the three months ended June 30, 2007 compared to the three months ended June 30, 2006
| CONSOLIDATED COST OF REVENUES | ||||||||||||
| For the Three Months Ended June 30, (US$ 000's) | ||||||||||||
| 2007 | 2006 | Movement | ||||||||||
| Operating costs | $ | 30,944 | $ | 26,042 | $ | 4,902 | ||||||
| Cost of programming | 82,773 | 52,850 | 29,923 | |||||||||
| Depreciation of station property, plant and equipment | 7,680 | 6,059 | 1,621 | |||||||||
| Amortization of broadcast licenses and other intangibles | 5,165 | 4,620 | 545 | |||||||||
| Total Consolidated Cost of Revenues | $ | 126,562 | $ | 89,571 | $ | 36,991 | ||||||
Total consolidated cost of revenues increased by US$ 36.9 million, or 41%, in the three months ended June 30, 2007 compared to the three months ended June 30, 2006.
Operating costs: Total consolidated operating costs (excluding programming costs, depreciation of station property, plant and equipment, amortization of broadcast licenses and other intangibles as well as station selling, general and administrative expenses) for the three months ended June 30, 2007 increased by US$ 4.9 million, or 19%, compared to the three months ended June 30, 2006. See discussion in Item 2, III. “Analysis of Segment Results”.
Cost of programming: Consolidated programming costs (including amortization of programming rights and production costs) for the three months ended June 30, 2007 increased by US$ 29.9 million, or 57%, compared to the three months ended June 30, 2006. See discussion in Item 2, III. “Analysis of Segment Results”.
Depreciation of property, plant and equipment: Total consolidated depreciation of property, plant and equipment for the three months ended June 30, 2007 increased by US$ 1.6 million, or 27%, compared to the three months ended June 30, 2006 primarily due to depreciation of newly acquired production equipment assets across each of our operations.
Amortization of broadcast licenses and other intangibles: Total consolidated amortization of broadcast licenses and other intangibles for the three months ended June 30, 2007 increased by US$ 0.5 million, or 12%, compared to the three months ended June 30, 2006 primarily due to the amortization of the broadcast licenses and customer relationships of our Romania operations arising on our acquisition of an increased stake on June 1, 2007.
IV (d) Cost of Revenues for the six months ended June 30, 2007 compared to the six months ended June 30, 2006
| CONSOLIDATED COST OF REVENUES | ||||||||||||
| For the Six Months Ended June 30, (US$ 000's) | ||||||||||||
| 2007 | 2006 | Movement | ||||||||||
| Operating costs | $ | 56,601 | $ | 49,014 | $ | 7,587 | ||||||
| Cost of programming | 149,126 | 101,268 | 47,858 | |||||||||
| Depreciation of station property, plant and equipment | 14,579 | 11,761 | 2,818 | |||||||||
| Amortization of broadcast licenses and other intangibles | 10,327 | 8,952 | 1,375 | |||||||||
| Total Consolidated Cost of Revenues | $ | 230,633 | $ | 170,995 | $ | 59,638 | ||||||
Total consolidated cost of revenues increased by US$ 59.6 million, or 35%, in the six months ended June 30, 2007 compared to the six months ended June 30, 2006.
Operating costs: Total consolidated operating costs (excluding programming costs, depreciation of station property, plant and equipment, amortization of broadcast licenses and other intangibles as well as station selling, general and administrative expenses) for the six months ended June 30, 2007 increased by US$ 7.6 million, or 15%, compared to the six months ended June 30, 2006. See discussion in Item 2, III. “Analysis of Segment Results”.
Cost of programming: Consolidated programming costs (including amortization of programming rights and production costs) for the six months ended June 30, 2007 increased by US$ 47.9 million, or 47%, compared to the six months ended June 30, 2006. See discussion in Item 2, III. “Analysis of Segment Results”.
Depreciation of property, plant and equipment: Total consolidated depreciation of property, plant and equipment for the six months ended June 30, 2007 increased by US$ 2.8 million, or 24%, compared to the six months ended June 30, 2006 primarily due to depreciation of newly acquired production equipment assets across each of our operations.
Amortization of broadcast licenses and other intangibles: Total consolidated amortization of broadcast licenses and other intangibles for the six months ended June 30, 2007 increased by US$ 1.4 million, or 15%, compared to the six months ended June 30, 2006 primarily due to the amortization of the broadcast licenses and customer relationships of our Romania and Slovak Republic operations arising on our acquisition of increased stakes in 2006 and 2007.
IV (e) Station Selling, General and Administrative Expenses for the three months ended June 30, 2007 compared to the three months ended June 30, 2006
| CONSOLIDATED STATION SELLING, GENERAL AND ADMINISTRATIVE EXPENSES | ||||||||||||
| For the Three Months Ended June 30, (US$ 000's) | ||||||||||||
| 2007 | 2006 | Movement | ||||||||||
| Croatia | $ | 2,013 | $ | 1,248 | $ | 765 | ||||||
| Czech Republic | 4,908 | 4,388 | 520 | |||||||||
| Romania | 2,918 | 2,646 | 272 | |||||||||
| Slovak Republic | 2,321 | 1,894 | 427 | |||||||||
| Slovenia | 1,770 | 1,271 | 499 | |||||||||
| Ukraine (STUDIO 1+1) | 1,417 | 3,009 | (1,592 | ) | ||||||||
| Ukraine (KINO, CITI) | 352 | 85 | 267 | |||||||||
| Total Consolidated Station Selling, General and Administrative Expenses | $ | 15,699 | $ | 14,541 | $ | 1,158 | ||||||
Total consolidated station selling, general and administrative expenses increased by US$ 1.2 million, or 8%, in the three months ended June 30, 2007 compared to the three months ended June 30, 2006. See discussion in Item 2, III. “Analysis of Segment Results”.
IV (f) Station Selling, General and Administrative Expenses for the six months ended June 30, 2007 compared to the six months ended June 30, 2006
| CONSOLIDATED STATION SELLING, GENERAL AND ADMINISTRATIVE EXPENSES | ||||||||||||
| For the Six Months Ended June 30, (US$ 000's) | ||||||||||||
| 2007 | 2006 | Movement | ||||||||||
| Croatia | $ | 3,739 | $ | 2,790 | $ | 949 | ||||||
| Czech Republic | 10,000 | 10,065 | (65 | ) | ||||||||
| Romania | 5,342 | 4,810 | 532 | |||||||||
| Slovak Republic | 4,259 | 2,913 | 1,346 | |||||||||
| Slovenia | 3,477 | 2,484 | 993 | |||||||||
| Ukraine (STUDIO 1+1) | 3,883 | 5,353 | (1,470 | ) | ||||||||
| Ukraine (KINO, CITI) | 780 | 292 | 488 | |||||||||
| Total Consolidated Station Selling, General and Administrative Expenses | $ | 31,480 | $ | 28,707 | $ | 2,773 | ||||||
Total consolidated station selling, general and administrative expenses increased by US$ 2.8 million, or 10%, in the six months ended June 30, 2007 compared to the six months ended June 30, 2006. See discussion in Item 2, III. “Analysis of Segment Results”.
IV (g) Corporate Operating Costs for the three months ended June 30, 2007 compared to the three months ended June 30, 2006
| CORPORATE OPERATING COSTS | ||||||||||||
| For the Three Months Ended June 30, (US$ 000's) | ||||||||||||
| 2007 | 2006 | Movement | ||||||||||
| Corporate operating costs (excluding stock-based compensation) | $ | 6,101 | $ | 6,966 | $ | (865 | ) | |||||
| Stock-based compensation | 1,343 | 730 | 613 | |||||||||
| Corporate Operating Costs | $ | 7,444 | $ | 7,696 | $ | (252 | ) | |||||
Corporate operating costs (excluding non-cash stock-based compensation) for the three months ended June 30, 2007 decreased by US$ 0.9 million, or 12%, compared to the three months ended June 30, 2006, primarily due to:
| · | Decreased legal costs incurred in connection with legal proceedings in respect of our Ukraine operations, partly offset by; |
| · | Increased staff-related costs; and |
| · | Increased business development expenses incurred in researching potential acquisition targets. |
The increase in the charge for non-cash stock-based compensation for the three months ended June 30, 2007 compared to the three months ended June 30, 2006 reflects an increase in the number of stock options granted in 2006 compared to prior years as well as an increase in the fair value of stock options as our stock price increased in recent years. For more details, see Part I Item 1, Note 14.
IV (h) Corporate Operating Costs for the six months ended June 30, 2007 compared to the six months ended June 30, 2006
| CORPORATE OPERATING COSTS | ||||||||||||
| For the Six Months Ended June 30, (US$ 000's) | ||||||||||||
| 2007 | 2006 | Movement | ||||||||||
| Corporate operating costs (excluding stock-based compensation) | $ | 19,612 | $ | 14,259 | $ | 5,353 | ||||||
| Stock-based compensation | 2,605 | 1,418 | 1,187 | |||||||||
| Corporate Operating Costs | $ | 22,217 | $ | 15,677 | $ | 6,540 | ||||||
Corporate operating costs (excluding non-cash stock-based compensation) for the six months ended June 30, 2007 increased by US$ 5.4 million, or 38%, compared to the six months ended June 30, 2006, primarily due to:
| · | A charge of EUR 4.5 million (approximately US$ 6.0 million) in respect of the estimated cost of settlement of our Croatia litigation (see Item 1, Note 18); |
| · | Increased staff-related costs; and |
| · | Increased business development expenses incurred in researching potential acquisition targets, partly offset by: |
| · | Decreased property-related costs, as the expense incurred in the six months ended June 30, 2006 included a lease exit charge of approximately US$ 1.6 million (including additional depreciation of US$ 0.3 million) incurred following relocation of our London office during the first quarter of 2006; and |
| · | Decreased legal costs incurred in connection with legal proceedings in respect of our Ukraine operations. |
IV (i) Impairment charge for the three and six months ended June 30, 2007 compared to the three and six months ended June 30, 2006
When we updated our medium-term forecast models at June 30, 2006, we determined that the forecast future cash flows of our Croatia operations had decreased compared to our previous forecast. We therefore reviewed the carrying value of the intangible assets with indefinite lives to determine whether the assets are impaired. As a result of our analysis, we recognized an impairment charge of US$ 0.7 million to write down the carrying value of goodwill to US$ nil as at June 30, 2006.
IV (j) Operating Income for the three months ended June 30, 2007 compared to the three months ended June 30, 2006
| OPERATING INCOME | ||||||||||||
| For the Three Months Ended June 30, (US$ 000's) | ||||||||||||
| 2007 | 2006 | Movement | ||||||||||
| Operating Income | $ | 66,579 | $ | 44,033 | $ | 22,546 | ||||||
Operating income for the three months ended June 30, 2007 increased by US$ 22.5 million, or 51%, compared to the three months ended June 30, 2006. Operating margin was 31%, compared with 28% for the three months ended June 30, 2006.
IV (k) Operating Income for the six months ended June 30, 2007 compared to the six months ended June 30, 2006
| OPERATING INCOME | ||||||||||||
| For the Six Months Ended June 30, (US$ 000's) | ||||||||||||
| 2007 | 2006 | Movement | ||||||||||
| Operating Income | $ | 79,866 | $ | 60,216 | $ | 19,650 | ||||||
Operating income for the six months ended June 30, 2007 increased by US$ 19.7 million, or 32.6%, compared to the six months ended June 30, 2006. Operating margin was 24%, compared with 22% for the six months ended June 30, 2006.
IV (l) Other income / (expense) items for the three months ended June 30, 2007 compared to the three months ended June 30, 2006
| OTHER INCOME / (EXPENSE) ITEMS | ||||||||||||
| For the Three Months Ended June 30, (US$ 000's) | ||||||||||||
| 2007 | 2006 | Movement | ||||||||||
| Interest income | $ | 1,732 | $ | 1,741 | $ | (9 | ) | |||||
| Interest expense | (19,438 | ) | (11,337 | ) | (8,101 | ) | ||||||
| Foreign currency exchange loss, net | (2,116 | ) | (20,625 | ) | 18,509 | |||||||
| Change in fair value of derivatives | 7,528 | (1,876 | ) | 9,404 | ||||||||
| Other (expense) / income | (546 | ) | 167 | (713 | ) | |||||||
| Provision for income taxes | (13,419 | ) | (3,582 | ) | (9,837 | ) | ||||||
| Minority interest in income of consolidated subsidiaries | (5,730 | ) | (1,276 | ) | (4,454 | ) | ||||||
| Discontinued operations | $ | - | $ | 1,277 | $ | (1,277 | ) | |||||
Interest income for the three months ended June 30, 2007 was in line with that recognized in the three months ended June 30, 2006.
Interest expense for the three months ended June 30, 2007 increased by US$ 8.1 million compared to the three months ended June 30, 2006, primarily as a result of US$ 6.9 million of costs associated the redemption of our 2012 Floating Rate Notes as well as an increase in interest rates.
Foreign currency exchange loss, net: For the three months ended June 30, 2007 we recognized a US$ 2.1 million loss primarily as a result of the strengthening of the Euro against the dollar during the three-month period. Our fixed and floating rate Senior Notes are denominated in Euros, and we incurred a transaction loss of approximately US$ 6.1 million due to movements in the spot rate between March 31, 2007 and June 30, 2007. For the three months ended June 30, 2006, we recognized a transaction loss of US$ 20.6 million.
Change in fair value of derivatives: For the three months ended June 30, 2007 we recognized a US$ 7.5 million gain as a result of the change in the fair value of the currency swaps entered into on April 27, 2006. For further information, see Part I Item 1, Note 12.
Other (expense) / income : For the three months ended June 30, 2007 we incurred other expenses of US$ 0.5 million compared to income of US$ 0.2 million for the three months ended June 30, 2006.
Provision for income taxes: The provision for income taxes for the three months ended June 30, 2007 was US$ 13.4 million compared to US$ 3.6 million for the three months ended June 30, 2006 as a result of our increased profitability. Our effective tax rate for the three months ended June 30, 2007 was 25% compared to 29% for the three months ended June 30, 2006.
Minority interest in income of consolidated subsidiaries: For the three months ended June 30, 2007, we recognized a charge of US$ 5.7 million in respect of the minority interest in the income of consolidated subsidiaries, compared to a charge of US$ 1.3 million for the three months ended June 30, 2006. This reflected the strong increase in profitability of our Slovak Republic operations.
Discontinued operations: For the three months ended June 30, 2007 we recognized a charge of US$ nil in respect of discontinued operations compared to US$ 1.3 million for the three months ended June 30, 2006.
On June 19, 2003, our Board of Directors decided to withdraw from operations in the Czech Republic. On October 23, 2003, we sold our 93.2% interest in CNTS to our former Czech Republic operating company, for US$ 53.2 million.
The revenues and expenses of our former Czech Republic operations and the award income and related legal expenses have therefore all been treated as discontinued operations. For the three months ended June 30, 2006, the amounts credited to discontinued operations largely represented revised estimates of additional payments we expect to make to the Dutch tax authorities pursuant to the agreement we entered into on February 9, 2004 (see also Part I, Item 1, Note 17).
IV (m) Other income / (expense) items for the six months ended June 30, 2007 compared to the six months ended June 30, 2006
| OTHER INCOME / (EXPENSE) ITEMS | ||||||||||||
| For the Six Months Ended June 30, (US$ 000's) | ||||||||||||
| 2007 | 2006 | Movement | ||||||||||
| Interest income | $ | 3,146 | $ | 3,194 | $ | (48 | ) | |||||
| Interest expense | (30,834 | ) | (21,855 | ) | (8,979 | ) | ||||||
| Foreign currency exchange gain loss, net | (5,252 | ) | (31,487 | ) | 26,235 | |||||||
| Change in fair value of derivatives | 12,052 | (1,876 | ) | 13,928 | ||||||||
| Other expense | (790 | ) | (381 | ) | (409 | ) | ||||||
| Provision for income taxes | (18,478 | ) | (7,576 | ) | (10,902 | ) | ||||||
| Minority interest in income of consolidated subsidiaries | (5,370 | ) | (6,717 | ) | 1,347 | |||||||
| Equity in income / (loss) of unconsolidated affiliates | - | (730 | ) | 730 | ||||||||
| Discontinued operations | $ | - | $ | (2,530 | ) | $ | 2,530 | |||||
Interest income for the six months ended June 30, 2007 was in line with that recognized in the six months ended June 30, 2006.
Interest expense for the six months ended June 30, 2007 increased by US$ 9.0 million compared to the six months ended June 30, 2006, primarily as a result of US$ 6.9 million of costs associated the redemption of our 2012 Floating Rate Notes as well as an increase in interest rates.
Foreign currency exchange loss, net: For the six months ended June 30, 2007 we recognized a US$ 5.3 million loss primarily as a result of the strengthening of the Euro against the dollar during the six-month period. Our fixed and floating rate Senior Notes are denominated in Euros, and we incurred a transaction loss of approximately US$ 11.5 million due to movements in the spot rate between December 31, 2006 and June 30, 2007. For the six months ended June 30, 2006, we recognized a transaction loss of US$ 31.5 million.
Change in fair value of derivatives: For the six months ended June 30, 2007 we recognized a US$ 12.1 million gain as a result of the change in the fair value of the currency swaps entered into on April 27, 2006. For further information, see Part I Item 1, Note 12.
Other expense: For the six months ended June 30, 2007 we incurred other expenses of US$ 0.8 million compared to US$ 0.4 million for the six months ended June 30, 2006.
Provision for income taxes: The provision for income taxes for the six months ended June 30, 2007 was US$ 18.5 million compared to US$ 7.6 million for the six months ended June 30, 2006 as a result of our increased profitability. Our stations pay income taxes at rates ranging from 16.0% in Romania to 25.0% in Ukraine.
Minority interest in income of consolidated subsidiaries: For the six months ended June 30, 2007, we recognized a charge of US$ 5.4 million in respect of the minority interest in the income of consolidated subsidiaries, compared to a charge of US$ 6.7 million for the six months ended June 30, 2006. This movement primarily reflects the fact that our Ukraine (STUDIO 1+1) operations reported a net loss in the six months ended June 30, 2007 compared to a significant net profit in the six months ended June 30, 2006, partially offset by the increased profitability of our Slovak Republic and Romania operations.
Equity in income / (loss) of unconsolidated affiliates: Some of our broadcasting licenses were held by unconsolidated affiliates over which we had minority blocking rights but not majority control. These affiliates were accounted for using the equity method.
Equity in income / (loss) of unconsolidated affiliates for the six months ended June 30, 2007 decreased by US$ 0.7 million compared to the six months ended June 30, 2006 as detailed below:
| EQUITY IN INCOME / (LOSS) OF UNCONSOLIDATED AFFILIATES | ||||||||||||
| For the Six Months Ended June 30, (US$ 000's) | ||||||||||||
| 2007 | 2006 | Movement | ||||||||||
| Romania operations | $ | - | $ | 7 | $ | (7 | ) | |||||
| Slovak Republic operations | - | (737 | ) | 737 | ||||||||
| Equity in Income / (Loss) of Unconsolidated Affiliates | $ | - | $ | (730 | ) | $ | 730 | |||||
Discontinued operations: For the six months ended June 30, 2007 we recognized a charge of US$ nil in respect of discontinued operations compared to US$ 2.5 million for the six months ended June 30. 2006.
On June 19, 2003, our Board of Directors decided to withdraw from operations in the Czech Republic. On October 23, 2003, we sold our 93.2% interest in CNTS to our former Czech Republic operating company, for US$ 53.2 million.
The revenues and expenses of our former Czech Republic operations and the award income and related legal expenses have therefore all been treated as discontinued operations. For the six months ended June 30, 2006, the amounts charged to discontinued operations represent additional payments we expect to make to the Dutch tax authorities pursuant to the agreement we entered into on February 9, 2004 (see also Item 1, Note 17).
IV (n) Condensed consolidated balance sheet as at June 30, 2007 compared to December 31, 2006
| SUMMARIZED CONDENSED CONSOLIDATED BALANCE SHEET (US$ 000’s) | ||||||||||||
June 30, 2007 | December 31, 2006 | Movement | ||||||||||
| Current assets | $ | 426,598 | $ | 413,616 | $ | 12,982 | ||||||
| Non-current assets | 1,473,694 | 1,405,384 | 68,310 | |||||||||
| Current liabilities | 214,237 | 182,961 | 31,276 | |||||||||
| Non-current liabilities | 611,475 | 574,084 | 37,391 | |||||||||
| Minority interests in consolidated subsidiaries | 21,556 | 26,189 | (4,633 | ) | ||||||||
| Shareholders’ equity | $ | 1,053,024 | $ | 1,035,766 | 17,258 | |||||||
Current assets: Current assets at June 30, 2007 increased US$ 13.0 million compared to December 31, 2006, primarily as a result of an increase in accounts receivable.
Non-current assets: Non-current assets at June 30, 2007 increased US$ 68.3 million compared to December 31, 2006, primarily as a result of the recognition of goodwill and other intangible assets following our acquisition of Sport.ro and an additional 5% stake in our Romania operations.
Current liabilities: Current liabilities at June 30, 2007 increased US$ 31.3 million compared to December 31, 2006, reflecting increases in deferred income, authors’ rights and payroll taxes partially offset by a decrease in accounts payable.
Non-current liabilities: Non-current liabilities at June 30, 2007 increased US$ 37.4 million compared to December 31, 2006, primarily as a result of our issuance of EUR 150.0 million of floating rate Senior Notes, partially offset by the redemption of EUR 125.0 million of floating rate Senior Notes issued in May 2005.
Minority interests in consolidated subsidiaries: Minority interests in consolidated subsidiaries at June 30, 2007 decreased US$ 4.6 million compared to December 31, 2006, primarily as a result of our acquisition of an additional 5% stake in our Romania operations.
Shareholders’ equity: Total shareholders’ equity at June 30, 2007 increased US$ 17.3 million compared to December 31, 2006, primarily as a result of the net income of US$ 34.3 million for the six months ended June 30, 2007, partially offset by the decrease in Other Comprehensive Income (US$ 19.5 million) and the impact of the adoption of FIN 48 (US$ 3.2 million). Included in the total shareholders’ equity were proceeds from the exercise of stock options (US$ 0.7million) and a stock-based compensation charge of US$ 2.6 million.
V. Liquidity and Capital Resources
V (a) Summary of cash flows
Cash and cash equivalents decreased by US$ 29.2 million during the six months ended June 30, 2007. The change in cash and cash equivalents is summarized as follows:
| SUMMARY OF CASH FLOWS | ||||||||
| For the Six Months Ended June 30, (US$ 000's) | ||||||||
| 2007 | 2006 | |||||||
| Net cash generated from continuing operating activities | $ | 21,601 | $ | 37,275 | ||||
| Net cash used in continuing investing activities | (88,113 | ) | (81,568 | ) | ||||
| Net cash received from financing activities | 31,125 | 138,233 | ||||||
| Net cash used in discontinued operations – operating activities | (1,624 | ) | (1,690 | ) | ||||
| Net (decrease)/increase in cash and cash equivalents | $ | (29,242 | ) | $ | 87,340 | |||
Operating Activities
Cash generated from continuing operations decreased from US$ 37.3 million in the six months ended June 30, 2006 to US$ 21.6 million in the six months ended June 30, 2007, with strong increases in the amount of cash generated by all our stations outside Ukraine from improved operational performance, as well as a reduction in cash paid for taxes following simplification of our corporate structure in the Czech Republic. However, these positive factors were more than offset by increased investment in programming, particularly in Ukraine, which is experiencing significant price inflation for popular Russian series and making additional investments in such programming to boost ratings and in Croatia, where we are improving the quality of our programming to drive ratings growth. It is likely that the cost of acquired programming across all our markets will continue to grow in the future.
Investing Activities
Cash used in investing activities increased from US$ 81.6 million in the six months ended June 30, 2006 to US$ 88.1 million in the six months ended June 30, 2007. Our investing cash flows in the six months ended June 30, 2007 were primarily comprised of:
| · | Payment of US$ 51.6 million in connection with our acquisition of an additional 5% stake in our Romania broadcasting operations and a 20% stake in our Romanian production company (for further information, see Part I, Item 1, Note 3); |
| · | Payments of EUR 6.7 million (approximately US$ 8.4 million) in connection with our acquisition of Sport.ro (for further information, see Part I, Item 1, Note 3); |
| · | Payments of US$ 2.1 million in connection with our acquisition of a 60.4% stake in each of Tor and Zhysa (for further information, see Part I, Item 1, Note 3); and |
| · | Capital expenditure of US$ 25.5 million. |
Financing Activities
Net cash received from financing activities in the six months ended June 30, 2007 was US$ 31.2 million compared to US$ 138.2 million in the six months ended June 30, 2006. Our financing cash flows in the six months ended June 30, 2007 primarily comprised net proceeds of US$ 199.4 million from the issuance of EUR 150.0 million of floating rate Senior Notes, partially offset by payment of EUR 127.5 million (approximately US$ 172.8 million) to redeem our floating rate Senior Notes issued in May 2005.
The amount of cash received in the six months ended June 30, 2006 reflects proceeds of US$ 168.6 million from the issuance of Class A Common Stock and a net amount of US$ 28.0 million of cash received from credit facilities.
Discontinued Operations
In the six months ended June 30, 2007, we paid taxes of US$ 1.6 million to the Dutch tax authorities pursuant to the agreement we entered into with them on February 9, 2004, compared to US$ 1.7 million in the six months ended June 30, 2006.
V (b) Sources and Uses of Cash
We believe that our current cash resources are sufficient to allow us to continue operating for at least the next 12 months and we do not anticipate additional cash requirements in the near future for our existing operations, subject to the matters disclosed under “Contractual Obligations, Commitments and Off-Balance Sheet Arrangements” and “Cash Outlook” below.
Our ongoing source of cash at the operating stations is primarily the receipt of payments from advertisers and advertising agencies. This may be supplemented from time to time by local borrowing. Surplus cash generated in this manner, after funding the ongoing station operations, may be remitted to us, or to other shareholders where appropriate. Surplus cash is remitted to us in the form of debt interest payments and capital repayments, dividends, and other distributions and loans from our subsidiaries.
Corporate law in the Central and Eastern European countries in which we operate stipulates generally that dividends may be declared by the partners or shareholders out of yearly profits subject to the maintenance of registered capital, required reserves and after the recovery of accumulated losses. Except as set forth below, our voting power is sufficient to compel the making of distributions.
In the case of Nova TV (Croatia), distributions may be paid from net profits subject to a reserve of 5% of annual profits until the aggregate reserves equal 5% of the registered capital of Nova TV (Croatia). In the case of CET 21, distributions may be paid from net profits subject to a reserve of 5% of net profits until the aggregate reserves equal 10% of the registered capital of CET 21. In the case of Pro TV, distributions may be paid from the profits of Pro TV subject to a reserve of 5% of annual profits until the aggregate reserves equal 20% of Pro TV's registered capital. A majority vote is required in order for Pro TV to make distributions and we have sufficient voting power to compel distributions of dividends. In the case of Markiza, distributions may be paid from net profits subject to an initial reserve requirement of 10% of net profits until the reserve fund equals 5% of registered capital. Subsequently, the reserve requirement is equal to 5% of net profits until the reserve fund equals 10% of registered capital. In the case of Pro Plus, distributions may be paid from the profits of Pro Plus, subject to a reserve equal to 10% of registered capital being established from accumulated profits. In the case of Studio 1+1, distributions may be paid from net profits subject to a reserve of 5% of net profits until the aggregate reserves equals 25% of the registered capital of Studio 1+1. We do not have a sufficient majority in Studio 1+1 to compel the distribution of dividends. In the case of Intermedia, Innova and IMS, distributions may be paid from their profits and there is no reserve requirement for these companies. Our voting power in Innova and IMS is sufficient to compel the distribution of dividends.
As at June 30, 2007 and December 31, 2006 the operations had the following unsecured balances owing to their respective holding companies:
| Operating segment (US$ 000’s) | June 30, 2007 | December 31, 2006 | ||||||
| Croatia | $ | 85,140 | $ | 67,623 | ||||
| Czech Republic | 411,821 | 434,897 | ||||||
| Romania | 37,235 | 25,620 | ||||||
| Slovak Republic | 23,518 | 23,670 | ||||||
| Slovenia | 58 | - | ||||||
| Ukraine (STUDIO 1+1) | 556 | - | ||||||
| Ukraine (KINO, CITI) | 11,972 | 4,621 | ||||||
| Total | $ | 570,300 | $ | 556,431 | ||||
V (c) Contractual Obligations, Commitments and Off-Balance Sheet Arrangements
Our future contractual obligations as of June 30, 2007 are as follows:
| Contractual Obligations | Payments due by period (US$ 000’s) | |||||||||||||||||||
| Total | Less than 1 year | 1-3 years | 3-5 years | More than 5 years | ||||||||||||||||
| Long-Term Debt – principal | $ | 546,929 | $ | 11,805 | $ | 1,700 | $ | - | $ | 533,424 | ||||||||||
| Long-Term Debt – interest | 208,481 | 39,510 | 78,383 | 78,077 | 12,511 | |||||||||||||||
| Capital Lease Obligations | 6,644 | 540 | 1,840 | 1,240 | 3,024 | |||||||||||||||
| Operating Leases | 6,015 | 2,611 | 2,419 | 985 | - | |||||||||||||||
| Unconditional Purchase Obligations | 118,498 | 110,045 | 6,059 | 1,580 | 814 | |||||||||||||||
| Other Long-Term Obligations | 9,199 | 7,199 | 2,000 | - | - | |||||||||||||||
| Total Contractual Obligations | $ | 895,766 | $ | 171,710 | $ | 92,401 | $ | 81,882 | $ | 549,773 | ||||||||||
Long-Term Debt
At June 30, 2007, we had the following debt outstanding:
June 30, 2007 (US$ 000’s) | ||||||||
| Corporate | (1)–(2) | $ | 533,424 | |||||
| Croatia operations | (3) | - | ||||||
| Czech Republic operations | (4)–(6) | 11,760 | ||||||
| Romania operations | (7) | 40 | ||||||
| Slovenia operations | (8) | - | ||||||
| Ukraine (KINO, CITI) operations | (9) | 1,705 | ||||||
| Total | $ | 546,929 | ||||||
| (1) | In May 2005, we issued Senior Notes in the aggregate principal amount of EUR 370.0 million (approximately US$ 499.7 million) consisting of EUR 245.0 million (approximately US$ 330.9 million) of 8.25% Senior Notes due May 2012 and EUR 125.0 million (approximately US$ 168.8 million) of floating rate Senior Notes due May 2012, which bore interest at six-month Euro Inter-Bank Offered Rate (“EURIBOR”) plus 5.50%. On May 15, 2007, we redeemed the floating rate Senior Notes. |
On May 16, 2007 we issued Senior Notes in the aggregate principal amount of EUR 150.0 million (approximately US$ 202.6 million), which bear interest at EURIBOR plus 1.625% (5.80% was applicable at June 30, 2007). Interest is payable on the Senior Notes semi-annually in arrears on each May 15 and November 15.
The Senior Notes are secured senior obligations and rank pari passu with all existing and future senior indebtedness and are effectively subordinated to all existing and future indebtedness of our subsidiaries. The amounts outstanding are guaranteed by two subsidiary holding companies and are secured by a pledge of shares of these subsidiaries as well as an assignment of certain contractual rights. The terms of our indebtedness restrict the manner in which our business is conducted, including the incurrence of additional indebtedness, the making of investments, the payment of dividends or the making of other distributions, entering into certain affiliate transactions and the sale of assets.
In the event that (A) there is a change in control by which (i) any party other than our present shareholders becomes the beneficial owner of more than 35.0% of our total voting power; (ii) we agree to sell substantially all of our operating assets; or (iii) there is a change in the composition of a majority of our Board of Directors; and (B) on the 60th day following any such change of control the rating of the Senior Notes is either withdrawn or downgraded from the rating in effect prior to the announcement of such change of control, we can be required to repurchase the Senior Notes at a purchase price in cash equal to 101.0% of the principal amount of the Senior Notes plus accrued and unpaid interest to the date of purchase.
At any time prior to May 15, 2008, we may redeem up to 35.0% of the fixed rate Senior Notes with the proceeds of any public equity offering at a price of 108.25% of the principal amount of such notes, plus accrued and unpaid interest, if any, to the redemption date. In addition, prior to May 15, 2009, we may redeem all or a part of the fixed rate Senior Notes at a redemption price equal to 100.0% of the principal amount of such notes, plus a “make-whole” premium and accrued and unpaid interest, if any, to the redemption date.
As of June 30, 2007, Standard & Poor’s senior unsecured debt rating for our Senior Notes remained unchanged from December 31, 2006 at B+, with a corporate credit rating of BB- / positive, up from BB- / stable at December 31, 2006. At June 30, 2007, Moody’s Investors Service’s rating of both our corporate credit rating and our Senior Notes due 2012 was Ba3 stable.
| (2) | On July 21, 2006, we entered into a five-year revolving loan agreement for EUR 100.0 million (approximately US$ 135.1 million) arranged by the European Bank for Reconstruction and Development (the “Loan”). ING Bank N.V. (“ING”) and Ceska Sporitelna, a.s. (“CS”) are participating in the facility for EUR 50.0 million in aggregate. |
The Loan bears interest at a rate of three-month EURIBOR plus 2.75% on the drawn amount. The available amount of the Loan amortizes by 7.5% every six months from May 2008 to November 2009, then by 15% in May 2010 and November 2010, and by 40% in May 2011. There were no drawings under this facility as at June 30, 2007, however the entire EUR 100.0 million was drawn on April 18, 2007 and subsequently repaid on June 1, 2007.
Covenants contained in the Loan are in line with those contained in our Senior Notes. In addition, the Loan’s covenants restrict us from making principal repayments on other debt of greater than US$ 20.0 million per year for the life of the Loan. This restriction is not applicable to our existing facilities with ING or CS or to any refinancing of our Senior Notes.
The Loan is a secured senior obligation and ranks pari passu with all existing and future senior indebtedness, including the Senior Notes, and is effectively subordinated to all existing and future indebtedness of our subsidiaries. The amount drawn is guaranteed by two subsidiary holding companies and is secured by a pledge of shares of those subsidiaries as well as an assignment of certain contractual rights. The terms of the Loan restrict the manner in which our business is conducted, including the incurrence of additional indebtedness, the making of investments, the payment of dividends or the making of other distributions, entering into certain affiliate transactions and the sale of assets.
| (3) | On March 28, 2007, we repaid EUR 0.6 million (approximately US$ 0.8 million), which was the total amount outstanding to our Croatia operations under two loan agreements with Hypo Alpe-Adria Bank d.d. Following this repayment, the security held by the bank was released. |
| (4) | CET 21 has a four-year credit facility of CZK 1.2 billion (approximately US$ 56.4 million) with Ceska Sporitelna, a.s. (“CS”). The final repayment date is October 31, 2009. This facility may, at the option of CET 21, be drawn in CZK, US$ or EUR and bears interest at the three-month, six-month or twelve-month London Inter-Bank Offered Rate (“LIBOR”), EURIBOR or Prague Inter-Bank Offered Rate (“PRIBOR”) rate plus 1.95%. This facility is secured by a pledge of receivables, which are also subject to a factoring arrangement with Factoring Ceska Sporitelna, a.s., a subsidiary of CS. As at June 30, 2007, there were no drawings under this facility, however on July 10, 2007, CZK 860.0 million (approximately US$ 40.4 million) was drawn down under this facility and on July 31, 2007, CZK 260.0 million (approximately US$ 12.7 million) was repaid. |
| (5) | CET 21 has a working capital credit facility of CZK 250.0 million (approximately US$ 11.8 million) with CS. This working capital facility bears interest at the three-month PRIBOR rate plus 1.65% and is secured by a pledge of receivables, which are also subject to a factoring arrangement with Factoring Ceska Sporitelna, a.s. On June 30, 2007, the full CZK 250.0 million (approximately US$ 11.8 million) was drawn under this facility bearing interest at an aggregate 4.65% (three-month PRIBOR effective for this loan was 3.00%). |
| (6) | As at June 30, 2007, there were no drawings under a CZK 300.0 million (approximately US$ 14.1 million) factoring facility with Factoring Ceska Sporitelna, a.s., a subsidiary of CS. This facility is available until June 30, 2010 and bears interest at the rate of one-month PRIBOR plus 1.40% for the period that actively assigned accounts receivable are outstanding. |
| (7) | As at June 30, 2007, an amount of RON 97 thousand (approximately US$ 40 thousand) was outstanding under a loan agreement from one of the founding shareholders of Sport.ro. The loan is interest free and is repayable in equal monthly instalments by August 31, 2007. |
| (8) | A revolving five-year facility agreement was entered into by Pro Plus for up to EUR 37.5 million (approximately US$ 50.6 million) in aggregate principal amount with ING Bank N.V., Nova Ljubljanska Banka d.d., Ljubljana and Bank Austria Creditanstalt d.d., Ljubljana. The facility availability amortizes by 10.0% each year for four years commencing one year after signing, with 60.0% repayable after five years. This facility is secured by a pledge of the bank accounts of Pro Plus, the assignment of certain receivables, a pledge of our interest in Pro Plus and a guarantee of our wholly-owned subsidiary CME Media Enterprises B.V. Loans drawn under this facility will bear interest at a rate of EURIBOR for the period of drawing plus a margin of between 2.1% and 3.6% that varies according to the ratio of consolidated net debt to consolidated broadcasting cash flow for Pro Plus. As at June 30, 2007, EUR 33.8 million (approximately US$ 45.6 million) was available for drawing under this revolving facility; there were no drawings outstanding. |
| (9) | Our Ukraine (KINO, CITI) operations have entered into a number of three-year unsecured loans with Glavred-Media, LLC, the minority shareholder in Ukrpromtorg. As at June 30, 2007, the total value of loans drawn was US$ 1.7 million. The loans are repayable between August 2009 and December 2009 and bear interest at 9.0%. |
Capital Lease Obligations
Capital lease obligations include future interest payments of US$ 1.9 million. For more information on our capital lease obligations see Part I, Item 1, Note 11.
Operating Leases
For more information on our operating lease commitments see Part 1, Item 1, Note 18.
Unconditional Purchase Obligations
Unconditional purchase obligations largely comprise future programming commitments. At June 30, 2007, we had commitments in respect of future programming of US$ 117.3 million (December 31, 2006: US$ 98.0 million). This includes contracts signed with license periods starting after June 30, 2007. For more information on our programming commitments see Part I, Item 1, Note 18.
Other Long-Term Obligations
Included in Other Long-Term Obligations are our commitments to the Dutch tax authorities of US$ 3.9 million (see Part I, Item 1, Note 18).
In addition to the amounts disclosed above, Mr. Sarbu has the right to sell his remaining shareholding in Pro TV and MPI to us under a put option agreement entered into in July 2004 at a price to be determined by an independent valuation, subject to a floor price of US$ 1.45 million for each 1.0% interest sold. Mr. Sarbu’s right to put his remaining shareholding is exercisable from November 12, 2009, provided that we have not enforced a pledge over this shareholding which Mr. Sarbu granted as security for our right to put our interest in Media Pro. As at June 30, 2007, we consider the fair value of Mr. Sarbu’s put option to be approximately US$ nil (2006: US$ nil).
V (d) Cash Outlook
We issued EUR 370.0 million (approximately US$ 480.0 million at the time of issuance) Senior Notes in May 2005, consisting of EUR 245.0 million of Senior Fixed Rate Notes and EUR 125.0 million of Senior Floating Rate Notes. Our EUR 125 million Senior Floating Rate Notes were redeemed on May 15, 2007. On May 16, 2007 we issued new floating rate Senior Notes due November 2014 in the aggregate principal amount of EUR 150.0 million. We have significant debt service obligations in respect of the Senior Notes. The terms of our indebtedness restrict the manner in which our business is conducted, including the incurrence of additional indebtedness, the making of investments, the payment of dividends or the making of other distributions, entering into certain affiliate transactions and the sale of assets. Net cash proceeds from the issuance of new shares of our Class A Common Stock of US$ 168.6 million in March 2006 significantly reduced our net debt at that time and provided a useful source of funds to allow investment flexibility, including acquisitions better suited to equity rather than debt financing. On July 21, 2006, we entered into a five-year EUR 100.0 million revolving loan facility (the EBRD Loan Agreement), which, once fully drawn, can be used for general corporate purposes to further increase our financing flexibility, and will reduce our average cost of debt. The full amount of the facility was drawn on April 18, 2007 and subsequently repaid on June 1, 2007 and remains available for re-drawing.
Our future cash needs will depend on our overall financial performance, debt service requirements under the Senior Notes, the EBRD Loan Agreement as well as under other indebtedness incurred by us as well as any future acquisition, investment and development decisions. Our ability to raise further funds through external debt facilities depends on our satisfaction of leverage ratios under the Senior Notes, which are also incorporated into the drawing conditions of the EBRD Loan Agreement. In the short-term we are able to fund our operations from cash generated from operations, our current cash resources (US$ 116.7 million, at June 30, 2007) and available undrawn credit facilities (US$ 251.2 million, at June 30, 2007).
We expect to invest US$ 75-80 million on capital expenditure in 2007 and approximately US$ 10 million in furthering the development of our non-broadcast operations. Any further significant acquisitions could be financed through the issues of additional external debt or equity depending on prevailing market conditions at the time.
Our Croatia operations continue to require funding to improve our ratings performance and increase our market share. We expect the funding required to support Nova TV (Croatia) to be in excess of US$ 26.0 million during 2007, and have provided US$ 5.1 million in cash funding to Nova TV (Croatia) in the three months ended June 30, 2007. Our Ukraine (KINO, CITI) operations continue to require funding in order to achieve improved ratings and market share. We expect the funding required to support KINO and CITI to be in excess of US$ 7.0 million during 2007, and have provided US$ 3.0 million in cash funding to KINO and CITI in the three months ended June 30, 2007.
We expect that, taken together, our current cash balances, internally generated cash flow, committed bank facilities, and local financing of broadcast operations should result in us having adequate cash resources to meet our debt service and other existing financial obligations for the next 12 months. The acquisition of additional shareholdings in our current operations, further investment in the expansion of existing operations, acquisitions, or other investments in the development of new revenue opportunities may require further financing. To the extent we will need additional financing, we would expect to raise such financing through issuing additional debt or equity.
V (e) Tax Inspections
Pro Plus has been the subject of an income tax inspection by the Republic of Slovenia tax authorities for the years 1995 to 1998. As a result of these inspections the Slovenian tax authorities had levied an assessment seeking unpaid income taxes, customs duties and interest charges of an amount equivalent to EUR 4.5 million (approximately US$ 6.1 million). The Slovenian authorities have asserted that capital contributions and loans made by us to Pro Plus in 1995 and 1996 should be extraordinary revenue to Pro Plus. On this basis, the Slovenian authorities claim that Pro Plus made a profit in 1995 and 1996 for which it owes income taxes and interest. Additionally, the Slovenian tax authorities claim that the fixed assets imported as capital contributions were subject to customs duties, which were not paid. On February 9, 2001, the Slovenian tax authorities concluded that the cash capital contributions for 1995 and 1996 were not extraordinary income. This has reduced the assessment to an amount equivalent to EUR 2.7 million (approximately US$ 3.6 million) in aggregate principal amount. Pro Plus appealed this decision to the Administrative Court in Ljubljana and requested the tax authorities to defer the demand for payment until a final judgment has been issued, and the tax authorities have so agreed. On April 18, 2005, the Administrative Court issued a decision in favor of Pro Plus and dismissed the claims of the tax authorities. The tax authorities filed an appeal with the Slovenian Supreme Court in May 2005. The Slovenian Supreme Court denied the appeal in June 2007 and remanded the case back to the tax authorities. We do not have a provision in our financial statements in relation to this legal action.
V (f) Off-Balance Sheet Arrangements
None.
VI. Critical Accounting Policies and Estimates
Our accounting policies affecting our financial condition and results of operations are more fully described in Part II, Item 8 of our Annual Report on Form 10-K for the year ended December 31, 2006. The preparation of these financial statements requires us to make judgments in selecting appropriate assumptions for calculating financial estimates, which inherently contain some degree of uncertainty. We base our estimates on historical experience and on various other assumptions that we believe to be reasonable under the circumstances, the results of which form the basis of making judgments about the carrying values of assets and liabilities and the reported amounts of revenues and expenses that are not readily apparent from other sources. Actual results may differ from these estimates under different assumptions or conditions.
We believe our critical accounting policies relate to program rights, goodwill and intangible assets, impairment or disposal of long-lived assets, revenue recognition, income taxes, foreign exchange and contingencies. These critical accounting policies affect our more significant judgments and estimates used in the preparation of our condensed consolidated financial statements. There have been no significant changes in our critical accounting policies since December 31, 2006.
Recently adopted accounting principles
On January 1, 2007, we adopted FASB Interpretation No. 48, “Accounting for Uncertainty in Income Taxes - an interpretation of FASB Statement No. 109” (“FIN 48”), which clarifies the accounting for uncertainty in tax positions. The evaluation of a tax position under FIN 48 is a two-step process. The first step is recognition: Tax positions taken or expected to be taken in a tax return should be recognized only if those positions are more likely than not to be sustained upon examination, based on the technical merits of the position. In evaluating whether a tax position has met the more likely than not recognition threshold, it should be presumed that the position will be examined by the relevant taxing authority and that they would have full knowledge of all relevant information. The second step is measurement: Tax positions that meet the recognition criteria are measured at the largest amount of benefit that is greater than 50 percent likely of being recognized upon ultimate settlement.
As a result of the implementation of FIN 48, we recognized a liability of approximately US$ 2.0 million for unrecognized tax benefits, of which US$ 1.7 million was accounted for as a reduction to retained deficit as at January 1, 2007. The total amount of unrecognized benefits that, if recognized, would affect the effective tax rate amounts to US$ 2.0 million, all of which would reduce the effective tax rate accordingly.
We recognize interest accrued and penalties related to unrecognized tax benefits within the provision for income taxes. As at January 1, 2007, we accrued US$ 1.8 million in respect of interest and penalties, of which US$ 1.5 million was accounted for as a reduction to retained deficit.
Our subsidiaries file income tax returns in the Netherlands and various other tax jurisdictions including the United States. As at January 1, 2007, analyzed by major tax jurisdictions, the Company’s subsidiaries are no longer subject to income tax examinations for years before:
| Jurisdiction | Year |
| Croatia | 2003 |
| Czech Republic | 2003 |
| Germany | 2000 |
| Netherlands | 2004 |
| Romania | 2002 |
| Slovak Republic | 2001 |
| Slovenia | 2001 |
| Ukraine | 2003 |
| United States | 2001 |
PART II OTHER INFORMATION
Item 6. Exhibits
a) The following exhibits are attached:
| 31.01 | Sarbanes-Oxley Certification s. 302 CEO, dated February 22, 2008 . |
| 31.02 | Sarbanes-Oxley Certification s. 302 CFO, dated February 22, 2008 . |
| 32.01 | Sarbanes-Oxley Certification – CEO and CFO, dated February 22, 2008 (furnished only). |
SIGNATURES
Pursuant to the requirements of the Securities Exchange Act of 1934, the registrant has duly caused this report to be signed on its behalf by the undersigned thereunto duly authorized.
| Date: February 22, 2008 | /s/ Michael Garin |
| Michael Garin | |
| Chief Executive Officer | |
| (Duly Authorized Officer) | |
| Date: February 22, 2008 | /s/ Wallace Macmillan |
| Wallace Macmillan | |
| Chief Financial Officer | |
| (Principal Financial Officer and Accounting Officer) |
EXHIBIT INDEX
| s. 302 Sarbanes-Oxley Certification - CEO, dated February 22, 2008 | |
| s. 302 Sarbanes-Oxley Certification - CFO, dated February 22, 2008 | |
| s. 906 Sarbanes-Oxley Certification - CEO and CFO, dated February 22, 2008 (furnished only) |
Page 85