UNITED STATES
SECURITIES AND EXCHANGE COMMISSION
Washington, D.C. 20549
FORM N-CSR
CERTIFIED SHAREHOLDER REPORT OF REGISTERED
MANAGEMENT INVESTMENT COMPANIES
Investment Company Act file number811-08568
John Hancock Financial Opportunities Fund
(Exact name of registrant as specified in charter)
200 Berkeley Street, Boston, Massachusetts 02116
(Address of principal executive offices) (Zip code)
Salvatore Schiavone
Treasurer
200 BerkeleyStreet
Boston, Massachusetts 02116
(Name and address of agent for service)
| Registrant's telephone number, including area code:617-663-4497 |
| |
| Date of fiscal year end: | December 31 |
| |
| Date of reporting period: | December 31, 2019 |
ITEM 1. REPORTS TO STOCKHOLDERS.
John Hancock
Financial Opportunities Fund
Ticker: BTO
Annual report 12/31/19
Beginning on January 1, 2021, as permitted by regulations adopted by the Securities and Exchange Commission, paper copies of the fund's shareholder reports such as this one will no longer be sent by mail, unless you specifically request paper copies of the reports from the transfer agent or from your financial intermediary. Instead, the reports will be made available on our website, and you will be notified by mail each time a report is posted and be provided with a website link to access the report.
If you have already elected to receive shareholder reports electronically, you will not be affected by this change and you do not need to take any action. You may elect to receive shareholder reports and other communications electronically by calling the transfer agent, Computershare, at 800-852-0218, by going to "Communication Preferences" at computershare.com/investor, or by contacting your financial intermediary.
You may elect to receive all reports in paper, free of charge, at any time. You can inform the transfer agent or your financial intermediary that you wish to continue receiving paper copies of your shareholder reports by following the instructions listed above. Your election to receive reports in paper will apply to all funds held with John Hancock Investment Management or your financial intermediary.

A message to shareholders
Dear shareholder,
Global financial markets delivered robust returns during the 12 months ended December 31, 2019. Stocks were particularly strong in the United States, where they delivered double-digit returns across most economic sectors. The financials sector in particular was one of the best performing over the period. Investors benefited from a combination of low inflation, accommodative central bank policy, healthy fundamentals, and corporate buybacks of stock.
After such a strong year of returns—in a historically long bull market—investors are prudent to consider the risks to future gains. Growth has slowed in the United States, with some negative data in manufacturing reflecting concerns over international trade and wavering business confidence. Indeed, trade disputes and other geopolitical tensions may continue to create uncertainty among businesses and skepticism among investors. Your financial advisor can helpposition your portfolio so that it's sufficiently diversified to meet your long-term objectives and to withstand the inevitable bouts of market volatility along the way.
On behalf of everyone at John Hancock Investment Management, I'd like to take this opportunity to welcome new shareholders and thank existing shareholders for the continued trust you've placed in us.
Sincerely,
Andrew G. Arnott
President and CEO,
John Hancock Investment Management
Head of Wealth and Asset Management,
United States and Europe
This commentary reflects the CEO's views as of this report's period end and are subject to change at any time. Diversification does not guarantee investment returns and does not eliminate risk of loss. All investments entail risks, including the possible loss of principal. For more up-to-date information, you can visit our website at jhinvestments.com.
John Hancock
Financial Opportunities Fund
Table of contents
| | | |
| 2 | | Your fund at a glance |
| 5 | | Manager's discussion of fund performance |
| 7 | | Fund's investments |
| 14 | | Financial statements |
| 18 | | Financial highlights |
| 20 | | Notes to financial statements |
| 31 | | Report of independent registered public accounting firm |
| 32 | | Tax information |
| 33 | | Additional information |
| 36 | | Trustees and Officers |
| 40 | | More information |
ANNUAL REPORT | JOHN HANCOCK FINANCIAL OPPORTUNITIES FUND 1
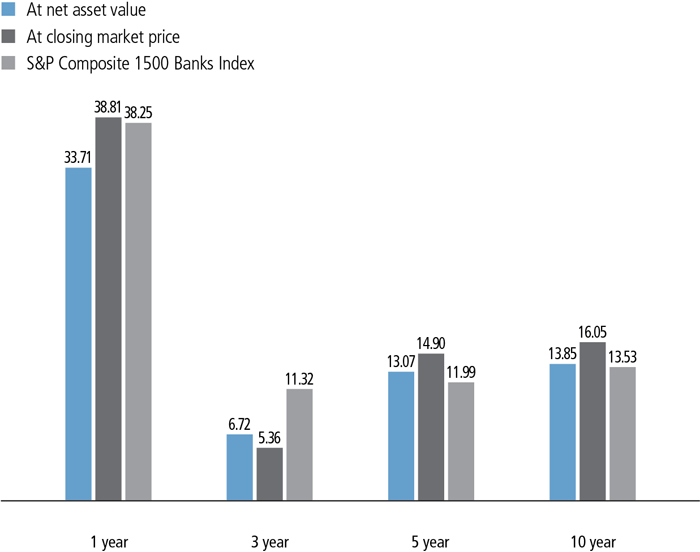
INVESTMENT OBJECTIVE
The fund seeks to provide a high level of total return consisting of long-term capital appreciation and current income.
AVERAGE ANNUAL TOTAL RETURNS AS OF 12/31/19 (%)
The S&P Composite 1500 Banks Index is an unmanaged index of banking sector stocks in the S&P 1500 Index.
It is not possible to invest directly in an index. Index figures do not reflect expenses and sales charges, which would result in lower returns.
The performance data contained within this material represents past performance, which does not guarantee future results.
Investment returns and principal value will fluctuate and a shareholder may sustain losses. Further, the fund's performance at net asset value (NAV) is different from the fund's performance at closing market price because the closing market price is subject to the dynamics of secondary market trading. Market risk may be increased when shares are purchased at a premium to NAV or sold at a discount to NAV. Current month-end performance may be higher or lower than the performance cited. The fund's most recent performance can be found at jhinvestment.com or by calling 800-852-0218.
ANNUAL REPORT | JOHN HANCOCK FINANCIAL OPPORTUNITIES FUND 2
PERFORMANCE HIGHLIGHTS OVER THE LAST TWELVE MONTHS
The broad U.S. equity market posted solid gains
Against a backdrop of generally supportive U.S. growth and recurring uncertainty in international trade, U.S. stocks rose, recovering from occasional bouts of volatility and market weakness.
Financials performed well in a variety of areas
The financials sector ranked among the best-performing sectors in the U.S. equity market, with large banks generally showing the most strength, due to factors such as solid loan growth, the stable credit environment, better pricing, and decent earnings results.
The fund underperformed its benchmark
The fund delivered attractive double-digit performance for the annual period but underperformed the S&P Composite 1500 Banks Index, due to the combination of stock selection and its overweight in regional banks.
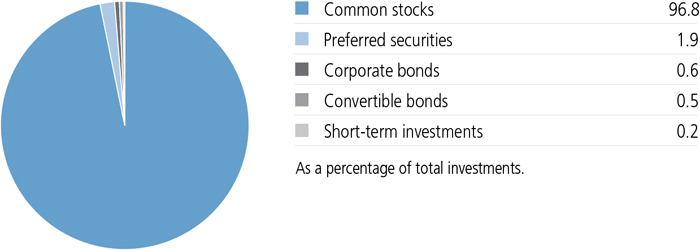
PORTFOLIO COMPOSITION AS OF 12/31/19 (%)
ANNUAL REPORT | JOHN HANCOCK FINANCIAL OPPORTUNITIES FUND 3
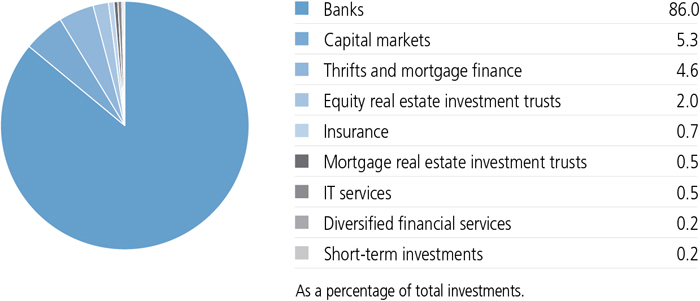
INDUSTRY COMPOSITION AS OF 12/31/19 (%)
A note about risks
As is the case with all exchange-listed closed-end funds, shares of this fund may trade at a discount or a premium to the fund's net asset value (NAV). An investment in the fund is subject to investment and market risks, including the possible loss of the entire principal invested. There is no guarantee prior distribution levels will be maintained, and distributions may include a substantial return of capital. A return of capital is the return of all or a portion of a shareholder's investment in the fund. The fund's prospectus includes additional information regarding returns of capital and the risks associated with distributions made by the fund, including potential tax implications. The fund's use of leverage creates additional risks, including greater volatility of the fund's NAV, market price, and returns. There is no assurance that the fund's leverage strategy will be successful. Focusing on a particular industry or sector may increase the fund's volatility and make it more susceptible to market, economic, and regulatory risks, as well as other factors affecting those industries or sectors. The value of a company's equity securities is subject to changes in its financial condition and overall market and economic conditions. Fixed-income investments are subject to interest-rate risk; their value will normally decline as interest rates rise. An issuer of securities held by the fund may default, have its credit rating downgraded, or otherwise perform poorly, which may affect fund performance. Derivatives transactions, including hedging and other strategic transactions, may increase a fund's volatility and could produce disproportionate losses, potentially more than the fund's principal investment. Liquidity—the extent to which a security may be sold or a derivative position closed without negatively affecting its market value—may be impaired by reduced trading volume, heightened volatility, rising interest rates, and other market conditions. The primary risks associated with the use of futures contracts and options are imperfect correlation, unanticipated market movement, and counterparty risk. Cybersecurity incidents may allow an unauthorized party to gain access to fund assets, customer data, or proprietary information, or cause a fund or its service providers to suffer data corruption or lose operational functionality. Similar incidents affecting issuers of a fund's securities may negatively impact performance.
ANNUAL REPORT | JOHN HANCOCK FINANCIAL OPPORTUNITIES FUND 4
Manager's discussion of fund performance
How would you describe economic conditions during the 12 months ended December 31, 2019?
The U.S. economy generally provided tailwinds to equity markets, despite some weakness that resulted from trade tensions that rose and fell throughout the year. Central banks around the world—concerned over the prospect of slower economic growth—adopted an accommodative monetary stance in the second half of the period. Interest rates fell as a result, and even crossed into negative territory in Japan and some European markets. This periodically put a damper on financials stocks' performance as investors worried that profits could suffer in a more protracted lower-rate environment. Sector fundamentals remained strong, buoyed by low credit costs, strong fee income, and healthy loan growth. Sentiment improved in the final months of the period, particularly as financials delivered solid third-quarter earnings results and investors showed renewed optimism on efforts to resolve tensions between the United States and China.
How did the fund perform?
The fund generated a strong return but underperformed its benchmark, the S&P Composite 1500 Banks Index, largely due to stock selection results. The fund's underweight relative to the benchmark in several of the stronger-performing large banks—including JPMorgan Chase & Co., Citigroup, Inc., and Bank of America Corp.—hurt performance. Another relative detractor was Cullen/Frost Bankers, Inc.
TOP 10 HOLDINGS AS OF 12/31/19 (%)
| | |
| JPMorgan Chase & Co. | 2.9 |
| The PNC Financial Services Group, Inc. | 2.8 |
| Truist Financial Corp. | 2.6 |
| Citizens Financial Group, Inc. | 2.5 |
| M&T Bank Corp. | 2.5 |
| Citigroup, Inc. | 2.5 |
| Bank of America Corp. | 2.4 |
| U.S. Bancorp | 2.3 |
| Zions Bancorp NA | 2.2 |
| Fifth Third Bancorp | 2.2 |
| TOTAL | 24.9 |
| As a percentage of total investments. |
| Cash and cash equivalents are not included. |
ANNUAL REPORT | JOHN HANCOCK FINANCIAL OPPORTUNITIES FUND 5
Falling interest rates and the bank's entrance into the Houston market factored into the pullback of its share price. Simon Property Group, Inc., a real estate investment trust that invests in high-end malls, was also a detractor. We take the view that substantial value can be found in its real estate portfolio and believe it will support the company's attractive dividend yield into 2020.
The largest contributor to relative performance was our decision to sell the fund's shares in Wells Fargo & Company. We sold the stock at the beginning of the fiscal year, as we believed its ongoing regulatory pressure would persist longer than anticipated. Other contributors included several private equity firms—The Blackstone Group, Inc., Ares Management Corp., and KKR & Company, Inc.—which delivered strong performance on their investments.
How was the fund positioned at period end?
We continue to expect solid economic results in the United States and expect the U.S. Federal Reserve to remain on hold as it waits to see the effects of its most recent interest-rate cuts on the economy. We believe that banks' net interest margins are likely to stabilize, which, in our view, is likely to boost investors' interest in financials.
Can you tell us about an upcoming manager change?
Effective June 30, 2020, Lisa A. Welch is retiring. We wish her well.
MANAGED BY
| | |
 | Susan A. Curry
On the fund since 2006
Investing since 1993 |
 | Lisa A. Welch
On the fund since 1998
Investing since 1986 |
 | Ryan P. Lentell, CFA
On the fund since 2015
Investing since 1999 |

The views expressed in this report are exclusively those of Susan A. Curry, Manulife Investment Management (US) LLC, and are subject to change. They are not meant as investment advice. Please note that the holdings discussed in this report may not have been held by the fund for the entire period. Portfolio composition is subject to review in accordance with the fund's investment strategy and may vary in the future. Current and future portfolio holdings are subject to risk.
ANNUAL REPORT | JOHN HANCOCK FINANCIAL OPPORTUNITIES FUND 6
AS OF 12-31-19
| | | | | Shares | Value |
| Common stocks 114.5% (96.8% of Total investments) | | $778,417,860 |
| (Cost $435,232,849) | | | | | |
| Financials 112.4% | | | | | 764,381,834 |
| Banks 100.0% | | |
| 1st Source Corp. | | | | 121,706 | 6,314,107 |
| American Business Bank (A) | | | | 21,548 | 768,186 |
| American National Bankshares, Inc. | | | | 93,258 | 3,690,219 |
| American River Bankshares | | | | 51,829 | 770,697 |
| American Riviera Bank (A) | | | | 186,611 | 3,694,898 |
| Ameris Bancorp | | | | 306,471 | 13,037,276 |
| Atlantic Capital Bancshares, Inc. (A) | | | | 202,690 | 3,719,362 |
| Atlantic Union Bankshares Corp. | | | | 252,536 | 9,482,727 |
| Avidbank Holdings, Inc. (A) | | | | 200,000 | 4,950,000 |
| Bank of America Corp. (B) | | | | 551,669 | 19,429,782 |
| Bank of Commerce Holdings | | | | 79,361 | 918,207 |
| Bank of Marin Bancorp | | | | 117,462 | 5,291,663 |
| Bar Harbor Bankshares | | | | 129,698 | 3,293,032 |
| Baycom Corp. (A) | | | | 79,604 | 1,810,195 |
| Berkshire Hills Bancorp, Inc. | | | | 241,309 | 7,934,240 |
| BOK Financial Corp. (B)(C) | | | | 39,621 | 3,462,875 |
| Bremer Financial Corp. (D)(E) | | | | 41,667 | 4,486,234 |
| Bryn Mawr Bank Corp. | | | | 80,000 | 3,299,200 |
| Business First Bancshares, Inc. | | | | 54,269 | 1,352,926 |
| Cadence BanCorp | | | | 286,424 | 5,192,867 |
| California Bancorp, Inc. (A) | | | | 31,598 | 631,960 |
| California Bancorp, Inc., PIPE (A) | | | | 19,085 | 372,158 |
| Cambridge Bancorp (B)(C) | | | | 26,971 | 2,161,726 |
| Camden National Corp. | | | | 55,164 | 2,540,854 |
| Carolina Financial Corp. | | | | 70,982 | 3,068,552 |
| Carolina Trust Bancshares, Inc. (A) | | | | 325,000 | 4,241,250 |
| CenterState Bank Corp. | | | | 117,392 | 2,932,452 |
| Centric Financial Corp. (A)(D) | | | | 275,000 | 2,614,219 |
| Citigroup, Inc. (B) | | | | 247,747 | 19,792,508 |
| Citizens Community Bancorp, Inc. | | | | 107,710 | 1,316,216 |
| Citizens Financial Group, Inc. | | | | 503,303 | 20,439,135 |
| City Holding Company | | | | 39,363 | 3,225,798 |
| Civista Bancshares, Inc. | | | | 127,682 | 3,064,368 |
| Coastal Financial Corp. (A) | | | | 124,054 | 2,043,169 |
| Columbia Banking System, Inc. (B)(C) | | | | 183,487 | 7,465,169 |
| Comerica, Inc. | | | | 167,706 | 12,032,906 |
| Communities First Financial Corp. (A) | | | | 115,523 | 3,321,286 |
| County Bancorp, Inc. | | | | 62,184 | 1,593,776 |
| Cullen/Frost Bankers, Inc. (B)(C) | | | | 178,964 | 17,499,100 |
| SEE NOTES TO FINANCIAL STATEMENTS | ANNUAL REPORT | JOHN HANCOCK FINANCIAL OPPORTUNITIES FUND | 7 |
| | | | | Shares | Value |
| Financials (continued) | | | | | |
| Banks (continued) | | |
| Eagle Bancorp Montana, Inc. | | | | 82,912 | $1,773,488 |
| East West Bancorp, Inc. | | | | 43,408 | 2,113,970 |
| Equity Bancshares, Inc., Class A (A) | | | | 130,915 | 4,041,346 |
| Evans Bancorp, Inc. | | | | 69,760 | 2,797,376 |
| Fifth Third Bancorp | | | | 579,289 | 17,807,344 |
| First Bancorp, Inc. | | | | 266,499 | 8,056,265 |
| First Business Financial Services, Inc. | | | | 60,700 | 1,598,231 |
| First Citizens BancShares, Inc., Class A | | | | 12,188 | 6,486,575 |
| First Community Corp. | | | | 136,228 | 2,943,887 |
| First Financial Bancorp (B)(C) | | | | 403,431 | 10,263,285 |
| First Hawaiian, Inc. | | | | 333,930 | 9,633,881 |
| First Horizon National Corp. | | | | 251,215 | 4,160,120 |
| First Merchants Corp. | | | | 118,683 | 4,936,026 |
| First Mid Bancshares, Inc. | | | | 28,496 | 1,004,484 |
| Flushing Financial Corp. | | | | 66,979 | 1,447,081 |
| FNB Corp. | | | | 621,243 | 7,889,786 |
| German American Bancorp, Inc. | | | | 139,432 | 4,966,568 |
| Glacier Bancorp, Inc. (B)(C) | | | | 116,005 | 5,335,070 |
| Great Southern Bancorp, Inc. | | | | 40,257 | 2,549,073 |
| Great Western Bancorp, Inc. | | | | 149,171 | 5,182,201 |
| Hancock Whitney Corp. | | | | 245,752 | 10,783,598 |
| HBT Financial, Inc. (A)(B)(C) | | | | 135,117 | 2,565,872 |
| Heritage Commerce Corp. | | | | 519,533 | 6,665,608 |
| Heritage Financial Corp. | | | | 189,099 | 5,351,502 |
| Horizon Bancorp, Inc. | | | | 404,586 | 7,687,134 |
| Howard Bancorp, Inc. (A) | | | | 156,530 | 2,642,226 |
| Huntington Bancshares, Inc. | | | | 550,049 | 8,294,739 |
| Independent Bank Corp. (Massachusetts) | | | | 157,197 | 13,086,650 |
| Independent Bank Corp. (Michigan) | | | | 125,407 | 2,840,469 |
| JPMorgan Chase & Co. (B)(C) | | | | 165,000 | 23,001,000 |
| KeyCorp | | | | 827,532 | 16,749,248 |
| Level One Bancorp, Inc. | | | | 68,719 | 1,728,970 |
| Live Oak Bancshares, Inc. | | | | 21,090 | 400,921 |
| M&T Bank Corp. | | | | 117,579 | 19,959,035 |
| Mackinac Financial Corp. | | | | 72,333 | 1,262,934 |
| Metrocity Bankshares, Inc. (B)(C) | | | | 61,757 | 1,081,365 |
| MidWestOne Financial Group, Inc. | | | | 38,224 | 1,384,856 |
| Nicolet Bankshares, Inc. (A) | | | | 49,538 | 3,658,381 |
| Northrim BanCorp, Inc. | | | | 99,739 | 3,820,004 |
| Old National Bancorp (B)(C) | | | | 419,575 | 7,674,027 |
| Old Second Bancorp, Inc. | | | | 271,961 | 3,663,315 |
| Pacific Premier Bancorp, Inc. | | | | 272,448 | 8,883,167 |
| PacWest Bancorp (B)(C) | | | | 201,725 | 7,720,016 |
| 8 | JOHN HANCOCK FINANCIAL OPPORTUNITIES FUND | ANNUAL REPORT | SEE NOTES TO FINANCIAL STATEMENTS |
| | | | | Shares | Value |
| Financials (continued) | | | | | |
| Banks (continued) | | |
| Park National Corp. (B)(C) | | | | 61,973 | $6,344,796 |
| Peoples Bancorp, Inc. | | | | 122,945 | 4,261,274 |
| Pinnacle Financial Partners, Inc. (B)(C) | | | | 126,415 | 8,090,560 |
| Prime Meridian Holding Company | | | | 108,010 | 2,214,205 |
| QCR Holdings, Inc. | | | | 70,803 | 3,105,420 |
| Red River Bancshares, Inc. (A)(B)(C) | | | | 7,901 | 442,930 |
| Regions Financial Corp. | | | | 703,904 | 12,078,993 |
| Renasant Corp. | | | | 185,399 | 6,566,833 |
| S&T Bancorp, Inc. | | | | 95,788 | 3,859,299 |
| SB Financial Group, Inc. | | | | 247,702 | 4,877,259 |
| Shore Bancshares, Inc. | | | | 183,579 | 3,186,931 |
| South Atlantic Bancshares, Inc. (A) | | | | 265,755 | 3,348,513 |
| Southern First Bancshares, Inc. (A) | | | | 131,586 | 5,591,089 |
| Stock Yards Bancorp, Inc. | | | | 102,924 | 4,226,059 |
| Synovus Financial Corp. | | | | 198,760 | 7,791,392 |
| TCF Financial Corp. | | | | 258,153 | 12,081,560 |
| The Community Financial Corp. | | | | 50,699 | 1,803,363 |
| The First Bancshares, Inc. | | | | 210,000 | 7,459,200 |
| The First of Long Island Corp. | | | | 57,322 | 1,437,636 |
| The PNC Financial Services Group, Inc. (B)(C) | | | | 140,085 | 22,361,769 |
| TriCo Bancshares | | | | 202,536 | 8,265,494 |
| Truist Financial Corp. | | | | 368,554 | 20,756,961 |
| U.S. Bancorp | | | | 318,276 | 18,870,584 |
| United Bancorporation of Alabama, Inc., PIPE (A) | | | | 150,000 | 4,183,107 |
| United Community Banks, Inc. | | | | 111,192 | 3,433,609 |
| Washington Trust Bancorp, Inc. | | | | 123,905 | 6,664,850 |
| Zions Bancorp NA (B)(C) | | | | 346,871 | 18,009,542 |
| Capital markets 6.4% | | |
| Ares Management Corp., Class A (B)(C) | | | | 217,118 | 7,748,941 |
| Golub Capital BDC, Inc. | | | | 84,878 | 1,566,423 |
| Invesco, Ltd. (B)(C) | | | | 114,189 | 2,053,116 |
| KKR & Company, Inc., Class A | | | | 355,776 | 10,377,986 |
| Oaktree Specialty Lending Corp. | | | | 837,762 | 4,574,181 |
| The Blackstone Group, Inc., Class A (B) | | | | 209,677 | 11,729,331 |
| TPG Specialty Lending, Inc. (B)(C) | | | | 243,379 | 5,225,347 |
| Diversified financial services 0.3% | | |
| Eurazeo SE | | | | 25,969 | 1,782,540 |
| Insurance 0.2% | | |
| Assured Guaranty, Ltd. | �� | | | 34,170 | 1,675,013 |
| Thrifts and mortgage finance 5.5% | | |
| First Defiance Financial Corp. | | | | 221,030 | 6,960,235 |
| SEE NOTES TO FINANCIAL STATEMENTS | ANNUAL REPORT | JOHN HANCOCK FINANCIAL OPPORTUNITIES FUND | 9 |
| | | | | Shares | Value |
| Financials (continued) | | | | | |
| Thrifts and mortgage finance (continued) | | |
| OP Bancorp | | | | 135,370 | $1,403,787 |
| Provident Financial Holdings, Inc. | | | | 97,339 | 2,131,724 |
| Provident Financial Services, Inc. | | | | 108,750 | 2,680,688 |
| Southern Missouri Bancorp, Inc. | | | | 112,188 | 4,303,532 |
| United Community Financial Corp. | | | | 634,588 | 7,399,296 |
| Westbury Bancorp, Inc. (A) | | | | 88,349 | 2,517,947 |
| WSFS Financial Corp. | | | | 222,599 | 9,792,130 |
| Information technology 0.6% | | | | | 3,902,992 |
| IT services 0.6% | | |
| EVERTEC, Inc. | | | | 114,659 | 3,902,992 |
| Real estate 1.5% | | | | | 10,133,034 |
| Equity real estate investment trusts 1.5% | | |
| Park Hotels & Resorts, Inc. (B) | | | | 50,154 | 1,297,484 |
| Plymouth Industrial REIT, Inc. | | | | 179,294 | 3,297,217 |
|
| Simon Property Group, Inc. (B) | | | | 37,180 | 5,538,333 |
| Preferred securities 2.2% (1.9% of Total investments) | | $15,070,018 |
| (Cost $14,421,050) | | | | | |
| Financials 1.4% | | | | | 9,475,030 |
| Banks 0.8% | |
| GMAC Capital Trust I (3 month LIBOR + 5.785%) (F) | | 135,075 | 3,518,704 |
| Tectonic Financial, Inc. (9.000% to 5-15-24, then 3 month LIBOR + 6.720%) | | 186,840 | 1,922,826 |
| Mortgage real estate investment trusts 0.6% | |
| Invesco Mortgage Capital, Inc. (7.750% to 12-27-24, then 3 month LIBOR + 5.180%) | | 150,000 | 4,033,500 |
| Real estate 0.8% | | | | | 5,594,988 |
| Equity real estate investment trusts 0.8% | |
| Bluerock Residential Growth REIT, Inc., 8.250% | | 84,140 | 2,185,957 |
| Sotherly Hotels, Inc., 8.000% | | 60,000 | 1,563,600 |
| Sotherly Hotels, Inc., 8.250% | | 70,625 | 1,845,431 |
|
| | Rate (%) | Maturity date | | Par value^ | Value |
| Corporate bonds 0.7% (0.6% of Total investments) | | $5,118,763 |
| (Cost $5,000,000) | | | | | |
| Financials 0.7% | | | | 5,118,763 |
| Banks 0.7% | | | |
|
| Northeast Bank (6.750% to 7-1-21, then 3 month LIBOR + 5.570%) (G) | 6.750 | 07-01-26 | | 5,000,000 | 5,118,763 |
| 10 | JOHN HANCOCK FINANCIAL OPPORTUNITIES FUND | ANNUAL REPORT | SEE NOTES TO FINANCIAL STATEMENTS |
| | Rate (%) | Maturity date | | Par value^ | Value |
|
| Convertible bonds 0.6% (0.5% of Total investments) | | $3,908,670 |
| (Cost $3,390,000) | | | | | |
| Financials 0.6% | | | | 3,908,670 |
| Insurance 0.6% | | | |
|
| AXA SA (B)(G) | 7.250 | 05-15-21 | | 3,390,000 | 3,908,670 |
| Certificate of deposit 0.0% (0.0% of Total investments) | $79,919 |
| (Cost $79,919) | | | | | |
| Country Bank for Savings | 1.140 | 08-27-20 | | 2,056 | 2,056 |
| Eastern Savings Bank FSB | 0.200 | 04-22-21 | | 1,954 | 1,954 |
| First Bank Richmond NA | 1.250 | 12-05-22 | | 21,642 | 21,642 |
| First Federal of Northern Michigan | 0.100 | 01-07-20 | | 3,048 | 3,048 |
| First National Bank | 0.400 | 12-17-20 | | 1,354 | 1,354 |
| Home National Bank | 1.739 | 11-04-21 | | 18,927 | 18,927 |
| Hudson United Bank | 0.800 | 04-23-21 | | 2,224 | 2,224 |
| Machias Savings Bank | 0.500 | 05-29-20 | | 1,996 | 1,996 |
| Milford Federal Bank | 0.300 | 04-24-20 | | 2,050 | 2,050 |
| Mount Washington Co-operative Bank | 0.650 | 11-01-21 | | 1,925 | 1,925 |
| Mt. McKinley Bank | 0.500 | 12-03-20 | | 1,717 | 1,717 |
| MutualOne Bank | 2.020 | 09-09-21 | | 4,097 | 4,097 |
| Newburyport Five Cents Savings Bank | 0.700 | 10-19-20 | | 2,122 | 2,122 |
| Newtown Savings Bank | 0.450 | 06-01-20 | | 1,973 | 1,973 |
| Rosedale Federal Savings & Loan Association | 0.500 | 06-01-20 | | 2,030 | 2,030 |
| Salem Five Bancorp | 0.250 | 12-17-20 | | 1,739 | 1,739 |
| Sunshine Federal Savings and Loan Association | 0.500 | 05-10-21 | | 2,066 | 2,066 |
| The Milford Bank | 0.250 | 06-10-21 | | 1,923 | 1,923 |
| U.S. Bancorp | 0.600 | 05-04-21 | | 5,076 | 5,076 |
| | Yield* (%) | Maturity date | | Par value^ | Value |
| Short-term investments 0.2% (0.2% of Total investments) | $1,288,000 |
| (Cost $1,287,963) | | | | | |
| U.S. Government Agency 0.2% | | | | | 1,178,000 |
| Federal Agricultural Mortgage Corp. Discount Note | 1.150 | 01-02-20 | | 158,000 | 158,000 |
| Federal Home Loan Bank Discount Note | 1.150 | 01-02-20 | | 447,000 | 447,000 |
| Federal Home Loan Mortgage Corp. Discount Note | 1.050 | 01-02-20 | | 573,000 | 573,000 |
| | | | | Par value^ | Value |
| Repurchase agreement 0.0% | | | | | 110,000 |
| Repurchase Agreement with State Street Corp. dated 12-31-19 at 0.550% to be repurchased at $110,003 on 1-2-20, collateralized by $115,000 U.S. Treasury Notes, 2.125% due 5-31-21 (valued at $116,029) | | | | 110,000 | 110,000 |
| SEE NOTES TO FINANCIAL STATEMENTS | ANNUAL REPORT | JOHN HANCOCK FINANCIAL OPPORTUNITIES FUND | 11 |
|
| Total investments (Cost $459,411,781) 118.2% | | | $803,883,230 |
| Other assets and liabilities, net (18.2%) | | | (123,828,382) |
| Total net assets 100.0% | | | $680,054,848 |
| The percentage shown for each investment category is the total value of the category as a percentage of the net assets of the fund unless otherwise indicated. |
| ^All par values are denominated in U.S. dollars unless otherwise indicated. |
| Security Abbreviations and Legend |
| LIBOR | London Interbank Offered Rate |
| PIPE | Private Investment in Public Equity |
| (A) | Non-income producing security. |
| (B) | All or a portion of this security is pledged as collateral pursuant to the Liquidity Agreement. Total collateral value at 12-31-19 was $134,433,730. A portion of the securities pledged as collateral were loaned pursuant to the Liquidity Agreement. The value of securities on loan amounted to $109,247,859. |
| (C) | All or a portion of this security is on loan as of 12-31-19, and is a component of the fund's leverage under the Liquidity Agreement. |
| (D) | Restricted security as to resale, excluding 144A securities. For more information on this security refer to the Notes to financial statements. |
| (E) | Security is valued using significant unobservable inputs and is classified as Level 3 in the fair value hierarchy. Refer to Note 2 to the financial statements. |
| (F) | Variable rate obligation. The coupon rate shown represents the rate at period end. |
| (G) | These securities are exempt from registration under Rule 144A of the Securities Act of 1933. Such securities may be resold, normally to qualified institutional buyers, in transactions exempt from registration. |
| * | Yield represents either the annualized yield at the date of purchase, the stated coupon rate or, for floating rate securities, the rate at period end. |
| 12 | JOHN HANCOCK FINANCIAL OPPORTUNITIES FUND | ANNUAL REPORT | SEE NOTES TO FINANCIAL STATEMENTS |
DERIVATIVES
SWAPS
| Interest rate swaps |
Counterparty (OTC)/
Centrally cleared | Notional
amount | Currency | Payments
made | Payments
received | Fixed
payment
frequency | Floating
payment
frequency | Maturity
date | Unamortized
upfront
payment
paid
(received) | Unrealized
appreciation
(depreciation) | Value |
| Centrally cleared | 5,000,000 | USD | Fixed 1.594% | 3 month LIBOR(a) | Semi-Annual | Quarterly | Dec 2020 | — | $9,893 | $9,893 |
| Centrally cleared | 5,000,000 | USD | Fixed 1.790% | 3 month LIBOR(a) | Semi-Annual | Quarterly | Aug 2022 | — | (34,660) | (34,660) |
| | | | | | | | | — | $(24,767) | $(24,767) |
| (a) | At 12-31-19, the 3 month LIBOR was 1.908%. |
| Derivatives Currency Abbreviations |
| USD | U.S. Dollar |
| Derivatives Abbreviations |
| LIBOR | London Interbank Offered Rate |
| OTC | Over-the-counter |
At 12-31-19, the aggregate cost of investments for federal income tax purposes was $459,568,559. Net unrealized appreciation aggregated to $344,289,904, of which $346,843,461 related to gross unrealized appreciation and $2,553,557 related to gross unrealized depreciation.
See Notes to financial statements regarding investment transactions and other derivatives information.
| SEE NOTES TO FINANCIAL STATEMENTS | ANNUAL REPORT | JOHN HANCOCK FINANCIAL OPPORTUNITIES FUND | 13 |
STATEMENT OF ASSETS AND LIABILITIES 12-31-19
| Assets | |
| Unaffiliated investments, at value (Cost $459,411,781) | $803,883,230 |
| Receivable for centrally cleared swaps | 57,443 |
| Cash | 581 |
| Dividends and interest receivable | 1,495,917 |
| Receivable from affiliates | 101,614 |
| Other assets | 10,497 |
| Total assets | 805,549,282 |
| Liabilities | |
| Liquidity agreement | 125,000,000 |
| Interest payable | 253,315 |
| Payable to affiliates | |
| Administrative services fees | 169,254 |
| Trustees' fees | 473 |
| Other liabilities and accrued expenses | 71,392 |
| Total liabilities | 125,494,434 |
| Net assets | $680,054,848 |
| Net assets consist of | |
| Paid-in capital | $332,995,136 |
| Total distributable earnings (loss) | 347,059,712 |
| Net assets | $680,054,848 |
| |
| Net asset value per share | |
| Based on 18,691,524 shares of beneficial interest outstanding - unlimited number of shares authorized with no par value | $36.38 |
| 14 | JOHN HANCOCK Financial Opportunities Fund | ANNUAL REPORT | SEE NOTES TO FINANCIAL STATEMENTS |
STATEMENT OF OPERATIONS For the year ended 12-31-19
| Investment income | |
| Dividends | $21,263,968 |
| Interest | 1,117,488 |
| Less foreign taxes withheld | (21,554) |
| Total investment income | 22,359,902 |
| Expenses | |
| Investment management fees | 8,215,429 |
| Interest expense | 3,578,315 |
| Administrative services fees | 1,865,155 |
| Transfer agent fees | 33,430 |
| Trustees' fees | 44,276 |
| Custodian fees | 70,598 |
| Printing and postage | 147,449 |
| Professional fees | 104,293 |
| Stock exchange listing fees | 23,750 |
| Other | 23,361 |
| Total expenses | 14,106,056 |
| Less expense reductions | (1,174,314) |
| Net expenses | 12,931,742 |
| Net investment income | 9,428,160 |
| Realized and unrealized gain (loss) | |
| Net realized gain (loss) on | |
| Unaffiliated investments and foreign currency transactions | 32,704,563 |
| Swap contracts | 174,853 |
| | 32,879,416 |
| Change in net unrealized appreciation (depreciation) of | |
| Unaffiliated investments | 135,886,763 |
| Swap contracts | (348,309) |
| | 135,538,454 |
| Net realized and unrealized gain | 168,417,870 |
| Increase in net assets from operations | $177,846,030 |
| SEE NOTES TO FINANCIAL STATEMENTS | ANNUAL REPORT | JOHN HANCOCK Financial Opportunities Fund | 15 |
STATEMENTS OF CHANGES IN NET ASSETS
| | Year ended
12-31-19 | Year ended
12-31-18 |
| Increase (decrease) in net assets | | |
| From operations | | |
| Net investment income | $9,428,160 | $7,229,529 |
| Net realized gain | 32,879,416 | 24,912,825 |
| Change in net unrealized appreciation (depreciation) | 135,538,454 | (148,111,807) |
| Increase (decrease) in net assets resulting from operations | 177,846,030 | (115,969,453) |
| Distributions to shareholders | | |
| From earnings | (41,109,769) | (30,994,369) |
| Total distributions | (41,109,769) | (30,994,369) |
| Fund share transactions | | |
| Issued pursuant to Dividend Reinvestment Plan | 665,138 | 423,395 |
| Total increase (decrease) | 137,401,399 | (146,540,427) |
| Net assets | | |
| Beginning of year | 542,653,449 | 689,193,876 |
| End of year | $680,054,848 | $542,653,449 |
| Share activity | | |
| Shares outstanding | | |
| Beginning of year | 18,670,462 | 18,659,117 |
| Issued pursuant to Dividend Reinvestment Plan | 21,062 | 11,345 |
| End of year | 18,691,524 | 18,670,462 |
| 16 | JOHN HANCOCK Financial Opportunities Fund | ANNUAL REPORT | SEE NOTES TO FINANCIAL STATEMENTS |
STATEMENT OF CASH FLOWSFor the year ended 12-31-19
| | |
| Cash flows from operating activities | |
| Net increase in net assets from operations | $177,846,030 |
| Adjustments to reconcile net increase in net assets from operations to net cash provided by operating activities: | |
| Long-term investments purchased | (92,910,886) |
| Long-term investments sold | 113,209,227 |
| Net purchases and sales in short-term investments | 5,657,273 |
| Net amortization of premium (discount) | 549,121 |
| (Increase) Decrease in assets: | |
| Receivable for centrally cleared swaps | (22,177) |
| Dividends and interest receivable | (198,183) |
| Receivable from affiliates | (12,864) |
| Other assets | 7,597 |
| Increase (Decrease) in liabilities: | |
| Payable for investments purchased | (2,692) |
| Interest payable | (46,351) |
| Payable to affiliates | 21,175 |
| Other liabilities and accrued expenses | (70,907) |
| Net change in unrealized (appreciation) depreciation on: | |
| Investments | (135,886,763) |
| Net realized (gain) loss on: | |
| Investments | (32,705,477) |
| Net cash provided by operating activities | $35,434,123 |
| Cash flows provided by (used in) financing activities | |
| Distributions to shareholders | $(40,444,631) |
| Borrowings from liquidity agreement | 5,000,000 |
| Net cash used in financing activities | $(35,444,631) |
| Net decrease in cash | $(10,508) |
| Cash at beginning of year | $11,089 |
| Cash at end of year | $581 |
| Supplemental disclosure of cash flow information: | |
| Cash paid for interest | $(3,624,666) |
| Noncash financing activities not included herein consists of reinvestment distributions: | $(665,138) |
| SEE NOTES TO FINANCIAL STATEMENTS | ANNUAL REPORT | JOHN HANCOCK Financial Opportunities Fund | 17 |
| Period ended | 12-31-19 | 12-31-18 | 12-31-17 | 12-31-16 | 12-31-151 | 10-31-15 |
| Per share operating performance | | | | | | |
| Net asset value, beginning of period | $29.06 | $36.94 | $34.98 | $26.17 | $26.00 | $25.19 |
| Net investment income2 | 0.50 | 0.39 | 0.37 | 0.50 | 0.10 | 0.523 |
| Net realized and unrealized gain (loss) on investments | 9.02 | (6.61) | 3.07 | 9.79 | 0.44 | 1.55 |
| Total from Investment operations | 9.52 | (6.22) | 3.44 | 10.29 | 0.54 | 2.07 |
| Less distributions | | | | | | |
| From net investment income | (0.48) | (0.40) | (0.42) | (0.40) | (0.10) | (0.47) |
| From net realized gain | (1.72) | (1.26) | (1.06) | (1.08) | (0.27) | (0.79) |
| Total distributions | (2.20) | (1.66) | (1.48) | (1.48) | (0.37) | (1.26) |
| Anti-dilutive impact of repurchase plan | — | — | — | —4,5 | — | — |
| Net asset value, end of period | $36.38 | $29.06 | $36.94 | $34.98 | $26.17 | $26.00 |
| Per share market value, end of period | $36.30 | $27.93 | $39.33 | $36.27 | $28.03 | $26.77 |
| Total return at net asset value (%)6,7 | 33.71 | (17.42) | 10.08 | 41.10 | 2.058 | 8.60 |
| Total return at market value (%)6 | 38.81 | (25.46) | 13.03 | 36.60 | 6.168 | 22.63 |
| Ratios and supplemental data | | | | | | |
| Net assets, end of period (in millions) | $680 | $543 | $689 | $651 | $486 | $482 |
| Ratios (as a percentage of average net assets): | | | | | | |
| Expenses before reductions | 2.27 | 2.04 | 1.93 | 2.02 | 2.029 | 1.99 |
| Expenses including reductions10 | 2.08 | 1.86 | 1.75 | 1.82 | 1.839 | 1.80 |
| Net investment income | 1.52 | 1.04 | 1.07 | 1.88 | 2.159 | 2.033 |
| Portfolio turnover (%) | 13 | 11 | 5 | 11 | 2 | 18 |
| Senior securities | | | | | | |
| Total debt outstanding end of period (in millions) | $125 | $120 | $110 | $110 | $110 | $110 |
| Asset coverage per $1,000 of debt11 | $6,440 | $5,522 | $7,265 | $6,922 | $5,419 | $5,385 |
| 18 | JOHN HANCOCK Financial Opportunities Fund | ANNUAL REPORT | SEE NOTES TO FINANCIAL STATEMENTS |
| 1 | For the two-month period ended 12-31-15. The fund changed its fiscal year end from October 31 to December 31. |
| 2 | Based on average daily shares outstanding. |
| 3 | Net investment income (loss) per share and ratio of net investment income (loss) to average net assets reflect a special dividend received by the fund, which amounted to $0.04 and 0.15%, respectively. |
| 4 | Less than $0.005 per share. |
| 5 | The repurchase plan was completed at an average repurchase price of $20.79 for 10,000 shares for the period ended 12-31-16. |
| 6 | Total return based on net asset value reflects changes in the fund’s net asset value during each period. Total return based on market value reflects changes in market value. Each figure assumes that distributions from income, capital gains and tax return of capital, if any, were reinvested. |
| 7 | Total returns would have been lower had certain expenses not been reduced during the applicable periods. |
| 8 | Not annualized. |
| 9 | Annualized. |
| 10 | Expenses including reductions excluding interest expense were 1.50%, 1.44%, 1.45%, 1.58%, 1.63% (annualized) and 1.62% for the periods ended 12-31-19, 12-31-18, 12-31-17, 12-31-16, 12-31-15 and 10-31-15, respectively. |
| 11 | Asset coverage equals the total net assets plus borrowings divided by the borrowings of the fund outstanding at period end (Note 8). As debt outstanding changes, the level of invested assets may change accordingly. Asset coverage ratio provides a measure of leverage. |
| SEE NOTES TO FINANCIAL STATEMENTS | ANNUAL REPORT | JOHN HANCOCK Financial Opportunities Fund | 19 |
| Notes to financial statements | |
Note 1—Organization
John Hancock Financial Opportunities Fund (the fund) is a closed-end management investment company organized as a Massachusetts business trust and registered under the Investment Company Act of 1940, as amended (the 1940 Act).
Note 2—Significant accounting policies
The financial statements have been prepared in conformity with accounting principles generally accepted in the United States of America (US GAAP), which require management to make certain estimates and assumptions as of the date of the financial statements. Actual results could differ from those estimates and those differences could be significant. The fund qualifies as an investment company under Topic 946 of Accounting Standards Codification of US GAAP.
Events or transactions occurring after the end of the fiscal period through the date that the financial statements were issued have been evaluated in the preparation of the financial statements. The following summarizes the significant accounting policies of the fund:
Security valuation. Investments are stated at value as of the scheduled close of regular trading on the New York Stock Exchange (NYSE), normally at 4:00 P.M., Eastern Time. In case of emergency or other disruption resulting in the NYSE not opening for trading or the NYSE closing at a time other than the regularly scheduled close, the net asset value (NAV) may be determined as of the regularly scheduled close of the NYSE pursuant to the fund's Valuation Policies and Procedures.
In order to value the securities, the fund uses the following valuation techniques: Equity securities, including exchange-traded or closed-end funds, are typically valued at the last sale price or official closing price on the exchange or principal market where the security trades. In the event there were no sales during the day or closing prices are not available, the securities are valued using the last available bid price. Debt obligations are typically valued based on the evaluated prices provided by an independent pricing vendor. Independent pricing vendors utilize matrix pricing, which takes into account factors such as institutional-size trading in similar groups of securities, yield, quality, coupon rate, maturity, type of issue, trading characteristics and other market data, as well as broker supplied prices. Swaps are generally valued using evaluated prices obtained from an independent pricing vendor. Foreign securities and currencies are valued in U.S. dollars based on foreign currency exchange rates supplied by an independent pricing vendor.
In certain instances, the Pricing Committee may determine to value equity securities using prices obtained from another exchange or market if trading on the exchange or market on which prices are typically obtained did not open for trading as scheduled, or if trading closed earlier than scheduled, and trading occurred as normal on another exchange or market.
Other portfolio securities and assets, for which reliable market quotations are not readily available, are valued at fair value as determined in good faith by the fund's Pricing Committee following procedures established by the Board of Trustees. The frequency with which these fair valuation procedures are used cannot be predicted and fair value of securities may differ significantly from the value that would have been used had a ready market for such securities existed. Trading in foreign securities may be completed before the scheduled daily close of trading on the NYSE. Significant events at the issuer or market level may affect the values of securities between the time when the valuation of the securities is generally determined and the close of the NYSE. If a significant event occurs, these securities may be fair valued, as determined in good faith by the fund's Pricing Committee, following
| 20 | JOHN HANCOCK Financial Opportunities Fund | ANNUAL REPORT | |
procedures established by the Board of Trustees. The fund uses fair value adjustment factors provided by an independent pricing vendor to value certain foreign securities in order to adjust for events that may occur between the close of foreign exchanges or markets and the close of the NYSE.
The fund uses a three-tier hierarchy to prioritize the pricing assumptions, referred to as inputs, used in valuation techniques to measure fair value. Level 1 includes securities valued using quoted prices in active markets for identical securities, including registered investment companies. Level 2 includes securities valued using other significant observable inputs. Observable inputs may include quoted prices for similar securities, interest rates, prepayment speeds and credit risk. Prices for securities valued using these inputs are received from independent pricing vendors and brokers and are based on an evaluation of the inputs described. Level 3 includes securities valued using significant unobservable inputs when market prices are not readily available or reliable, including the fund's own assumptions in determining the fair value of investments. Factors used in determining value may include market or issuer specific events or trends, changes in interest rates and credit quality. The inputs or methodology used for valuing securities are not necessarily an indication of the risks associated with investing in those securities. Changes in valuation techniques and related inputs may result in transfers into or out of an assigned level within the disclosure hierarchy.
The following is a summary of the values by input classification of the fund's investments as of December 31, 2019, by major security category or type:
| | Total
value at
12-31-19 | Level 1
quoted
price | Level 2
significant
observable
inputs | Level 3
significant
unobservable
inputs |
| Investments in securities: | | |
| Assets | | | | |
| Common stocks | | | | |
| Financials | | | | |
| Banks | $680,459,617 | $666,589,694 | $9,383,689 | $4,486,234 |
| Capital markets | 43,275,325 | 43,275,325 | — | — |
| Diversified financial services | 1,782,540 | — | 1,782,540 | — |
| Insurance | 1,675,013 | 1,675,013 | — | — |
| Thrifts and mortgage finance | 37,189,339 | 37,189,339 | — | — |
| Information technology | | | | |
| IT services | 3,902,992 | 3,902,992 | — | — |
| Real estate | | | | |
| Equity real estate investment trusts | 10,133,034 | 10,133,034 | — | — |
| Preferred securities | | | | |
| Financials | | | | |
| Banks | 5,441,530 | 3,518,704 | 1,922,826 | — |
| Mortgage real estate investment trusts | 4,033,500 | 4,033,500 | — | — |
| Real estate | | | | |
| Equity real estate investment trusts | 5,594,988 | 5,594,988 | — | — |
| | ANNUAL REPORT | JOHN HANCOCK Financial Opportunities Fund | 21 |
| | Total
value at
12-31-19 | Level 1
quoted
price | Level 2
significant
observable
inputs | Level 3
significant
unobservable
inputs |
| Corporate bonds | $5,118,763 | — | $5,118,763 | — |
| Convertible bonds | 3,908,670 | — | 3,908,670 | — |
| Certificate of deposit | 79,919 | — | 79,919 | — |
| Short-term investments | 1,288,000 | — | 1,288,000 | — |
| Total investments in securities | $803,883,230 | $775,912,589 | $23,484,407 | $4,486,234 |
| Derivatives: | | | | |
| Liabilities | | | | |
| Swap contracts | $(24,767) | — | $(24,767) | — |
Repurchase agreements. The fund may enter into repurchase agreements. When the fund enters into a repurchase agreement, it receives collateral that is held in a segregated account by the fund's custodian, or for tri-party repurchase agreements, collateral is held at a third-party custodian bank in a segregated account for the benefit of the fund. The collateral amount is marked-to-market and monitored on a daily basis to ensure that the collateral held is in an amount not less than the principal amount of the repurchase agreement plus any accrued interest. Collateral received by the fund for repurchase agreements is disclosed in the Fund's investments as part of the caption related to the repurchase agreement.
Repurchase agreements are typically governed by the terms and conditions of the Master Repurchase Agreement and/or Global Master Repurchase Agreement (collectively, MRA). Upon an event of default, the non-defaulting party may close out all transactions traded under the MRA and net amounts owed. Absent an event of default, assets and liabilities resulting from repurchase agreements are not offset in the Statement of assets and liabilities. In the event of a default by the counterparty, realization of the collateral proceeds could be delayed, during which time the collateral value may decline or the counterparty may have insufficient assets to pay claims resulting from close-out of the transactions.
Security transactions and related investment income. Investment security transactions are accounted for on a trade date plus one basis for daily NAV calculations. However, for financial reporting purposes, investment transactions are reported on trade date. Interest income is accrued as earned. Interest income includes coupon interest and amortization/accretion of premiums/discounts on debt securities. Debt obligations may be placed in a non-accrual status and related interest income may be reduced by stopping current accruals and writing off interest receivable when the collection of all or a portion of interest has become doubtful. Dividend income is recorded on the ex-date, except for dividends of certain foreign securities where the dividend may not be known until after the ex-date. In those cases, dividend income, net of withholding taxes, is recorded when the fund becomes aware of the dividends. Non-cash dividends, if any, are recorded at the fair market value of the securities received. Distributions received on securities that represent a tax return of capital and/or capital gain, if any, are recorded as a reduction of cost of investments and/or as a realized gain, if amounts are estimable. Gains and losses on securities sold are determined on the basis of identified cost and may include proceeds from litigation.
Real estate investment trusts. The fund may invest in real estate investment trusts (REITs). Distributions from REITs may be recorded as income and subsequently characterized by the REIT at the end of the fiscal year as a reduction of cost of investments and/or as a realized gain. As a result, the fund will estimate the components of distributions from these securities. Such estimates are revised when the actual components of the distributions are known.
| 22 | JOHN HANCOCK Financial Opportunities Fund | ANNUAL REPORT | |
Foreign investing. Assets, including investments, and liabilities denominated in foreign currencies are translated into U.S. dollar values each day at the prevailing exchange rate. Purchases and sales of securities, income and expenses are translated into U.S. dollars at the prevailing exchange rate on the date of the transaction. The effect of changes in foreign currency exchange rates on the value of securities is reflected as a component of the realized and unrealized gains (losses) on investments. Foreign investments are subject to a decline in the value of a foreign currency versus the U.S. dollar, which reduces the dollar value of securities denominated in that currency.
Funds that invest internationally generally carry more risk than funds that invest strictly in U.S. securities. Risks can result from differences in economic and political conditions, regulations, market practices (including higher transaction costs), accounting standards and other factors.
Foreign taxes. The fund may be subject to withholding tax on income, capital gains or repatriation taxes imposed by certain countries, a portion of which may be recoverable. Foreign taxes are accrued based upon the fund's understanding of the tax rules and rates that exist in the foreign markets in which it invests. Taxes are accrued based on gains realized by the fund as a result of certain foreign security sales. In certain circumstances, estimated taxes are accrued based on unrealized appreciation of such securities. Investment income is recorded net of foreign withholding taxes.
Overdrafts. Pursuant to the custodian agreement, the fund’s custodian may, in its discretion, advance funds to the fund to make properly authorized payments. When such payments result in an overdraft, the fund is obligated to repay the custodian for any overdraft, including any costs or expenses associated with the overdraft. The custodian may have a lien, security interest or security entitlement in any fund property that is not otherwise segregated or pledged, to the maximum extent permitted by law, to the extent of any overdraft.
Expenses. Within the John Hancock group of funds complex, expenses that are directly attributable to an individual fund are allocated to such fund. Expenses that are not readily attributable to a specific fund are allocated among all funds in an equitable manner, taking into consideration, among other things, the nature and type of expense and the fund’s relative net assets. Expense estimates are accrued in the period to which they relate and adjustments are made when actual amounts are known.
Statement of cash flows. A Statement of cash flows is presented when a fund has a significant amount of borrowing during the period, based on the average total borrowing in relation to total assets, or when a certain percentage of the fund’s investments is classified as Level 3 in the fair value hierarchy. Information on financial transactions that have been settled through the receipt and disbursement of cash is presented in the Statement of cash flows. The cash amount shown in the Statement of cash flows is the amount included in the fund’s Statement of assets and liabilities and represents the cash on hand at the fund’s custodian and does not include any short-term investments or collateral on derivative contracts, if any.
Federal income taxes. The fund intends to continue to qualify as a regulated investment company by complying with the applicable provisions of the Internal Revenue Code and will not be subject to federal income tax on taxable income that is distributed to shareholders. Therefore, no federal income tax provision is required.
As of December 31, 2019, the fund had no uncertain tax positions that would require financial statement recognition, derecognition or disclosure. The fund's federal tax returns are subject to examination by the Internal Revenue Service for a period of three years.
Managed distribution plan. The fund has adopted a managed distribution plan (Plan). Under the current Plan, the fund makes quarterly distributions of an amount equal to $0.5500 per share, which will be paid quarterly until further notice.
| | ANNUAL REPORT | JOHN HANCOCK Financial Opportunities Fund | 23 |
Distributions under the Plan may consist of net investment income, net realized capital gains and, to the extent necessary, return of capital. Return of capital distributions may be necessary when the fund’s net investment income and net capital gains are insufficient to meet the minimum distribution. In addition, the fund may also make additional distributions for the purpose of not incurring federal income and excise taxes.
The Board of Trustees may terminate or reduce the amount paid under the Plan at any time. The termination or reduction may have an adverse effect on the market price of the fund’s shares.
Distribution of income and gains. Distributions to shareholders from net investment income and net realized gains, if any, are recorded on the ex-date. The fund generally declares and pays dividends quarterly pursuant to the Managed Distribution Plan described above. Capital gain distributions, if any, are typically distributed annually.
The tax character of distributions for the years ended December 31, 2019 and 2018 was as follows:
| | December 31, 2019 | December 31, 2018 |
| Ordinary income | $8,905,318 | $8,438,294 |
| Long-term capital gains | 32,204,451 | 22,556,075 |
| Total | $41,109,769 | $30,994,369 |
As of December 31, 2019, the components of distributable earnings on a tax basis consisted of $2,769,808 of undistributed ordinary income.
Such distributions and distributable earnings, on a tax basis, are determined in conformity with income tax regulations, which may differ from US GAAP. Distributions in excess of tax basis earnings and profits, if any, are reported in the fund's financial statements as a return of capital.
Capital accounts within the financial statements are adjusted for permanent book-tax differences. These adjustments have no impact on net assets or the results of operations. Temporary book-tax differences, if any, will reverse in a subsequent period. The fund had no material book-tax differences at December 31, 2019.
Note 3—Derivative instruments
The fund may invest in derivatives in order to meet its investment objective. Derivatives include a variety of different instruments that may be traded in the over-the-counter (OTC) market, on a regulated exchange or through a clearing facility. The risks in using derivatives vary depending upon the structure of the instruments, including the use of leverage, optionality, the liquidity or lack of liquidity of the contract, the creditworthiness of the counterparty or clearing organization and the volatility of the position. Some derivatives involve risks that are potentially greater than the risks associated with investing directly in the referenced securities or other referenced underlying instrument. Specifically, the fund is exposed to the risk that the counterparty to an OTC derivatives contract will be unable or unwilling to make timely settlement payments or otherwise honor its obligations. OTC derivatives transactions typically can only be closed out with the other party to the transaction.
Certain derivatives are traded or cleared on an exchange or central clearinghouse. Exchange-traded or centrally-cleared transactions generally present less counterparty risk to a fund than OTC transactions. The exchange or clearinghouse stands between the fund and the broker to the contract and therefore, credit risk is generally limited to the failure of the exchange or clearinghouse and the clearing member.
Centrally-cleared swap contracts are subject to clearinghouse rules, including initial and variation margin requirements, daily settlement of obligations and the clearinghouse guarantee of payments to the broker. There is, however, still counterparty risk due to the potential insolvency of the broker with respect to any margin held in the brokers’ customer accounts. While clearing members are required to segregate customer assets from their own
| 24 | JOHN HANCOCK Financial Opportunities Fund | ANNUAL REPORT | |
assets, in the event of insolvency, there may be a shortfall in the amount of margin held by the broker for its clients. Collateral or margin requirements for centrally-cleared derivatives are set by the broker or applicable clearinghouse. Margin for centrally-cleared transactions is detailed in the Statement of assets and liabilities as Receivable/Payable for centrally-cleared swaps. Securities pledged by the fund for centrally-cleared transactions, if any, are identified in the Fund's investments.
Swaps. Swap agreements are agreements between the fund and a counterparty to exchange cash flows, assets, foreign currencies or market-linked returns at specified intervals. Swap agreements are privately negotiated in the OTC market (OTC swaps) or may be executed on a registered commodities exchange (centrally cleared swaps). Swaps are marked-to-market daily and the change in value is recorded as a component of unrealized appreciation/depreciation of swap contracts. The value of the swap will typically impose collateral posting obligations on the party that is considered out-of-the-money on the swap.
Upfront payments made/received by the fund, if any, are amortized/accreted for financial reporting purposes, with the unamortized/unaccreted portion included in the Statement of assets and liabilities. A termination payment by the counterparty or the fund is recorded as realized gain or loss, as well as the net periodic payments received or paid by the fund.
Entering into swap agreements involves, to varying degrees, elements of credit, market and documentation risk that may provide outcomes that are in excess of the amounts recognized on the Statement of assets and liabilities. Such risks involve the possibility that there will be no liquid market for the swap, or that a counterparty may default on its obligation or delay payment under the swap terms. The counterparty may disagree or contest the terms of the swap. In addition to interest rate risk, market risks may also impact the swap. The fund may also suffer losses if it is unable to terminate or assign outstanding swaps or reduce its exposure through offsetting transactions.
Interest rate swaps. Interest rate swaps represent an agreement between the fund and a counterparty to exchange cash flows based on the difference between two interest rates applied to a notional amount. The payment flows are usually netted against each other, with the difference being paid by one party to the other. The fund settles accrued net interest receivable or payable under the swap contracts at specified, future intervals.
During the year ended December 31, 2019, the fund used interest rate swap contracts to manage against anticipated interest rate changes. The fund held interest rate swaps with total USD notional amounts ranging from $10 million to $25 million as measured at each quarter end.
Fair value of derivative instruments by risk category
The table below summarizes the fair value of derivatives held by the fund at December 31, 2019 by risk category:
| Risk | Statement of
assets and
liabilities location | Financial
instruments
location | Assets
derivatives
fair value | Liabilities
derivatives
fair value |
| Interest rate | Swap contracts, at value | Interest rate swaps1 | $9,893 | $(34,660) |
| 1 | Reflects cumulative value of swap contracts. Receivable/payable for centrally cleared swaps, which includes value and margin, are shown separately on the Statement of assets and liabilities. |
Effect of derivative instruments on the Statement of operations
| | ANNUAL REPORT | JOHN HANCOCK Financial Opportunities Fund | 25 |
The table below summarizes the net realized gain (loss) included in the net increase (decrease) in net assets from operations, classified by derivative instrument and risk category, for the year ended December 31, 2019:
| | Statement of operations location - Net realized gain (loss) on: |
| Risk | Swap contracts |
| Interest rate | $174,853 |
The table below summarizes the net change in unrealized appreciation (depreciation) included in the net increase (decrease) in net assets from operations, classified by derivative instrument and risk category, for the year ended December 31, 2019:
| | Statement of operations location - Change in net unrealized appreciation (depreciation) of: |
| Risk | Swap contracts |
| Interest rate | $(348,309) |
Note 4—Guarantees and indemnifications
Under the fund's organizational documents, its Officers and Trustees are indemnified against certain liabilities arising out of the performance of their duties to the fund. Additionally, in the normal course of business, the fund enters into contracts with service providers that contain general indemnification clauses. The fund's maximum exposure under these arrangements is unknown, as this would involve future claims that may be made against the fund that have not yet occurred. The risk of material loss from such claims is considered remote.
Note 5—Fees and transactions with affiliates
John Hancock Investment Management LLC (the Advisor) serves as investment advisor for the fund. The Advisor is an indirect, wholly owned subsidiary of Manulife Financial Corporation (MFC). Prior to June 28, 2019, the Advisor was known as John Hancock Advisers, LLC.
Management fee. The fund has an investment advisory agreement with the Advisor under which the fund pays a daily management fee to the Advisor, equivalent on an annual basis to the sum of (a) 1.15% of the first $500 million of the fund’s average daily gross assets, including the assets attributed to the Liquidity Agreement (see Note 8) (collectively, gross managed assets), and (b) 1.00% of the fund’s average daily gross managed assets in excess of $500 million. The Advisor has a subadvisory agreement with Manulife Investment Management (US) LLC, an indirectly owned subsidiary of MFC and an affiliate of the Advisor. Prior to May 7, 2019, Manulife Investment Management (US) LLC was known as John Hancock Asset Management a division of Manulife Asset Management (US) LLC. The fund is not responsible for payment of the subadvisory fees.
The Advisor has contractually agreed to waive a portion of its management fee and/or reimburse expenses for certain funds of the John Hancock group of funds complex, including the fund (the participating portfolios). This waiver is based upon aggregate net assets of all the participating portfolios. The amount of the reimbursement is calculated daily and allocated among all the participating portfolios in proportion to the daily net assets of each fund. During the year ended December 31, 2019, this waiver amounted to 0.01% of the fund’s average daily net assets. This arrangement expires on July 31, 2021, unless renewed by mutual agreement of the fund and the Advisor based upon a determination that this is appropriate under the circumstances at that time.
The expense reductions described above amounted to $55,220 for the year ended December 31, 2019.
Expenses waived or reimbursed in the current fiscal period are not subject to recapture in future fiscal periods.
| 26 | JOHN HANCOCK Financial Opportunities Fund | ANNUAL REPORT | |
The investment management fees, including the impact of the waivers and reimbursements as described above, incurred for the year ended December 31, 2019, were equivalent to a net annual effective rate of 1.09% of the fund's average daily managed assets.
Administrative services. The fund has an administration agreement with the Advisor under which the Advisor provides certain administrative services to the fund and oversees operational activities of the fund. The compensation for the period was at an annual rate of 0.25% of the average weekly gross managed assets of the fund. The Advisor agreed to limit the administrative services fee to 0.10% of the fund’s average weekly gross assets. Accordingly, the expense reductions related to administrative services fees amounted to $1,119,094 for the year ended December 31, 2019. The Advisor reserves the right to terminate this limitation in the future with the Trustees’ approval. The administrative services fees incurred for the year ended December 31, 2019 amounted to an annual rate of 0.10% of the fund’s average weekly gross managed assets.
Trustee expenses. The fund compensates each Trustee who is not an employee of the Advisor or its affiliates. These Trustees receive from the fund and the other John Hancock closed-end funds an annual retainer. In addition, Trustee out-of-pocket expenses are allocated to each fund based on its net assets relative to other funds within the John Hancock group of funds complex.
Note 6—Fund share transactions
In May 2009, the Board of Trustees approved a share repurchase plan, which is subsequently reviewed and approved by the Board of Trustees each year in December. Under the current share repurchase plan, the fund may purchase in the open market, up to 10% of its outstanding common shares as of December 31, 2019. The current share repurchase plan will remain in effect between January 1, 2020 and December 31, 2020.
During the years ended December 31, 2019 and 2018, the fund had no activities under the repurchase program. Shares repurchased and corresponding dollar amounts, if any, are included on the Statements of changes in net assets. The anti-dilutive impacts of these share repurchases are included on the Financial highlights.
Note 7—Leverage risk
The fund utilizes a Liquidity Agreement (LA) to increase its assets available for investment. When the fund leverages its assets, shareholders bear the expenses associated with the LA and have potential to benefit or be disadvantaged from the use of leverage. The Advisor’s fee is also increased in dollar terms from the use of leverage. Consequently, the fund and the Advisor may have differing interests in determining whether to leverage the fund’s assets. Leverage creates risks that may adversely affect the return for the holders of shares, including:
| • | the likelihood of greater volatility of NAV and market price of shares; |
| • | fluctuations in the interest rate paid for the use of the LA; |
| • | increased operating costs, which may reduce the fund’s total return; |
| • | the potential for a decline in the value of an investment acquired through leverage, while the fund’s obligations under such leverage remains fixed; and |
| • | the fund is more likely to have to sell securities in a volatile market in order to meet asset coverage or other debt compliance requirements. |
To the extent the income or capital appreciation derived from securities purchased with funds received from leverage exceeds the cost of leverage, the fund’s return will be greater than if leverage had not been used; conversely, returns would be lower if the cost of the leverage exceeds the income or capital appreciation derived. The use of securities lending to obtain leverage in the fund’s investments may subject the fund to greater risk of loss than would reinvestment of collateral in short term highly rated investments.
| | ANNUAL REPORT | JOHN HANCOCK Financial Opportunities Fund | 27 |
In addition to the risks created by the fund’s use of leverage, the fund is subject to the risk that it would be unable to timely, or at all, obtain replacement financing if the LA is terminated. Were this to happen, the fund would be required to de-leverage, selling securities at a potentially inopportune time and incurring tax consequences. Further, the fund’s ability to generate income from the use of leverage would be adversely affected.
Note 8—Liquidity Agreement
The fund has entered into a Liquidity Agreement (LA) with State Street Bank and Trust Company (SSB) that allows it to borrow or otherwise access up to $150 million (maximum facility amount) through a line of credit, securities lending and reverse repurchase agreements. Prior to September 11, 2019, the maximum facility amount was $125 million. The amounts outstanding at December 31, 2019 are shown in the Statement of assets and liabilities as the Liquidity agreement.
The fund pledges its assets as collateral to secure obligations under the LA. The fund retains the risks and rewards of the ownership of assets pledged to secure obligations under the LA and makes these assets available for securities lending and reverse repurchase transactions with SSB acting as the fund’s authorized agent for these transactions. All transactions initiated through SSB are required to be secured with cash collateral received from the securities borrower (the Borrower) or cash is received from the reverse repurchase agreement (Reverse Repo) counterparties. Securities lending transactions will be secured with cash collateral in amounts at least equal to 100% of the market value of the securities utilized in these transactions. Cash received by SSB from securities lending or Reverse Repo transactions is credited against the amounts borrowed under the line of credit.
Upon return of securities by the Borrower or Reverse Repo counterparty, SSB will return the cash collateral to the Borrower or proceeds from the Reverse Repo, as applicable, which will eliminate the credit against the line of credit and will cause the drawdowns under the line of credit to increase by the amounts returned. Income earned on the loaned securities is retained by SSB, and any interest due on the reverse repurchase agreements is paid by SSB.
SSB has indemnified the fund for certain losses that may arise if the Borrower or a Reverse Repo Counterparty fails to return securities when due. With respect to securities lending transactions, upon a default of the securities borrower, SSB uses the collateral received from the Borrower to purchase replacement securities of the same issue, type, class and series. If the value of the collateral is less than the purchase cost of replacement securities, SSB is responsible for satisfying the shortfall but only to the extent that the shortfall is not due to any of the fund’s losses on the reinvested cash collateral. Although the risk of the loss of the securities is mitigated by receiving collateral from the Borrower or proceeds from the Reverse Repo counterparty and through SSB indemnification, the fund could experience a delay in recovering securities or could experience a lower than expected return if the Borrower or Reverse Repo counterparty fails to return the securities on a timely basis.
Under normal circumstances, interest charged is at the rate of one month LIBOR (London Interbank Offered Rate) plus 0.60%, is payable monthly on the aggregate balance of the drawdowns outstanding under the LA. As of December 31, 2019, the fund had an aggregate balance of $125,000,000 at an interest rate of 2.36%, which is reflected in the Liquidity agreement on the Statement of assets and liabilities. During the year ended December 31, 2019, the average balance of the LA and the effective average interest rate were $124,958,904 and 2.86%, respectively.
The fund may terminate the LA with 60 days’ notice. If certain asset coverage and collateral requirements, or other covenants are not met, the LA could be deemed in default and result in termination. Absent a default or facility termination event, SSB is required to provide the fund with 360 days’ notice prior to terminating the LA.
Due to the anticipated discontinuation of LIBOR, as discussed in Note 9, the LA may be amended to remove LIBOR
| 28 | JOHN HANCOCK Financial Opportunities Fund | ANNUAL REPORT | |
as the reference rate for interest and to replace LIBOR with an alternative reference rate for interest mutually agreed upon by the fund and SSB. However, there remains uncertainty regarding the future utilization of LIBOR and the nature of any replacement rate and the potential effect of a transition away from LIBOR on the fund and/or the LA cannot yet be fully determined.
Note 9—LIBOR Discontinuation Risk
The LA utilizes LIBOR as the reference or benchmark rate for interest rate calculations. LIBOR is a measure of the average interest rate at which major global banks can borrow from one another. Following allegations of rate manipulation and concerns regarding its thin liquidity, in July 2017, the U.K. Financial Conduct Authority, which regulates LIBOR, announced that it will stop encouraging banks to provide the quotations needed to sustain LIBOR after 2021. This event will likely cause LIBOR to cease to be published. Before then, it is expected that market participants such as the fund and SSB will transition to the use of different reference or benchmark rates. However, although regulators have suggested alternative rates, there is currently no definitive information regarding the future utilization of LIBOR or of any replacement rate.
It is uncertain what impact the discontinuation of LIBOR will have on the use of LIBOR as a reference rate in the LA. It is expected that market participants will amend financial instruments referencing LIBOR, such as the LA, to include fallback provisions and other measures that contemplate the discontinuation of LIBOR or other similar market disruption events, but neither the effect of the transition process nor the viability of such measures is known. In addition, there are obstacles to converting certain longer term securities and transactions to a new benchmark or benchmarks and the effectiveness of one alternative reference rate versus multiple alternative reference rates in new or existing financial instruments and products has not been determined. As market participants transition away from LIBOR, LIBOR's usefulness may deteriorate, which could occur prior to the end of 2021. The transition process may lead to increased volatility and illiquidity in markets that currently rely on LIBOR to determine interest rates. LIBOR's deterioration may adversely affect the liquidity and/or market value of securities that use LIBOR as a benchmark interest rate. The use of an alternative reference rate, or the transition process to an alternative reference rate, may result in increases to the interest paid by the fund pursuant to the LA and, therefore, may adversely affect the fund's performance.
Note 10—Purchase and sale of securities
Purchases and sales of securities, other than short-term investments, amounted to $92,910,886 and $113,209,227, respectively, for the year ended December 31, 2019.
Note 11—Industry or sector risk
The fund generally invests a large percentage of its assets in one or more particular industries or sectors of the economy. If a large percentage of the fund's assets are economically tied to a single or small number of industries or sectors of the economy, the fund will be less diversified than a more broadly diversified fund, and it may cause the fund to underperform if that industry or sector underperforms. In addition, focusing on a particular industry or sector may make the fund’s NAV more volatile. Further, a fund that invests in particular industries or sectors is particularly susceptible to the impact of market, economic, regulatory and other factors affecting those industries or sectors. Financial services companies can be hurt by economic declines, changes in interest rates regulatory and market impacts.
| | ANNUAL REPORT | JOHN HANCOCK Financial Opportunities Fund | 29 |
Note 12—Restricted securities
The fund may hold restricted securities which are restricted as to resale and the fund has limited rights to registration under the Securities Act of 1933. Disposal may involve time-consuming negotiations and expenses, and prompt sale at an acceptable price may be difficult to achieve. The following table summarizes the restricted securities held at December 31, 2019:
Issuer,
Description | Original
acquisition date | Acquisition
cost | Beginning
share
amount | Shares
purchased | Shares
sold | Ending
share
amount | Value as a
percentage of
net assets | Ending
value |
| Bremer Financial Corp. | 10-25-19 | $5,000,040 | — | 41,667 | — | 41,667 | 0.6% | $4,486,234 |
| Centric Financial Corp. | 5-22-18 | 2,543,750 | 275,000 | — | — | 275,000 | 0.4% | 2,614,219 |
| | | | | | | | | $7,100,453 |
| 30 | JOHN HANCOCK Financial Opportunities Fund | ANNUAL REPORT | |
Report of Independent Registered Public Accounting Firm
To the Board of Trustees and Shareholders of John Hancock Financial Opportunities Fund
Opinion on the Financial Statements
We have audited the accompanying statement of assets and liabilities, including the Fund’s investments, of John Hancock Financial Opportunities Fund (the “Fund”) as of December 31, 2019, the related statements of operations and cash flows for the year ended December 31, 2019, the statements of changes in net assets for each of the two years in the period ended December 31, 2019, including the related notes, and the financial highlights for each of the periods indicated therein (collectively referred to as the “financial statements”). In our opinion, the financial statements present fairly, in all material respects, the financial position of the Fund as of December 31, 2019, the results of its operations and its cash flows for the year then ended, the changes in its net assets for each of the two years in the period ended December 31, 2019 and the financial highlights for each of the periods indicated therein in conformity with accounting principles generally accepted in the United States of America.
Basis for Opinion
These financial statements are the responsibility of the Fund’s management. Our responsibility is to express an opinion on the Fund’s financial statements based on our audits. We are a public accounting firm registered with the Public Company Accounting Oversight Board (United States) (PCAOB) and are required to be independent with respect to the Fund in accordance with the U.S. federal securities laws and the applicable rules and regulations of the Securities and Exchange Commission and the PCAOB.
We conducted our audits of these financial statements in accordance with the standards of the PCAOB. Those standards require that we plan and perform the audit to obtain reasonable assurance about whether the financial statements are free of material misstatement, whether due to error or fraud.
Our audits included performing procedures to assess the risks of material misstatement of the financial statements, whether due to error or fraud, and performing procedures that respond to those risks. Such procedures included examining, on a test basis, evidence regarding the amounts and disclosures in the financial statements. Our audits also included evaluating the accounting principles used and significant estimates made by management, as well as evaluating the overall presentation of the financial statements. Our procedures included confirmation of securities owned as of December 31, 2019 by correspondence with the custodian and brokers; when replies were not received from brokers, we performed other auditing procedures. We believe that our audits provide a reasonable basis for our opinion.
/s/ PricewaterhouseCoopers LLP
Boston, Massachusetts
February 11, 2020
We have served as the auditor of one or more investment companies in the John Hancock group of funds since 1988.
| | ANNUAL REPORT | JOHN HANCOCK FINANCIAL OPPORTUNITIES FUND | 31 |
| Tax information (Unaudited) | |
For federal income tax purposes, the following information is furnished with respect to the distributions of the fund, if any, paid during its taxable year ended December 31, 2019.
The fund reports the maximum amount allowable of its net taxable income as eligible for the corporate dividends-received deduction.
The fund reports the maximum amount allowable of its net taxable income as qualified dividend income as provided in the Jobs and Growth Tax Relief Reconciliation Act of 2003.
The fund paid $32,204,451 in long term capital gain dividends.
The fund reports the maximum amount allowable of its Section 199A dividends as defined in Proposed Treasury Regulation §1.199A-3(d).
Eligible shareholders will be mailed a 2019 Form 1099-DIV in early 2020. This will reflect the tax character of all distributions paid in calendar year 2019.
Please consult a tax advisor regarding the tax consequences of your investment in the fund.
| 32 | JOHN HANCOCK FINANCIAL OPPORTUNITIES FUND | ANNUAL REPORT | |
Additional information (Unaudited)
Investment objective and policy
The fund is a closed-end, diversified management investment company, shares of which were initially offered to the public in August 1994. The fund's investment objective is to provide a high level of total return consisting of long-term capital appreciation and current income. The fund utilizes a credit facility agreement to increase its assets available for investments.
Under normal circumstances, the fund will invest at least 80% of its net assets plus borrowings for investment purposes in equity securities of U.S. and foreign financial services companies of any size. These companies may include, but are not limited to, banks, thrifts, finance companies, brokerage and advisory firms, real estate-related firms, insurance companies and financial holding companies. The fund will notify shareholders at least 60 days prior to any change in this 80% policy.
The use of securities lending collateral to obtain leverage in the fund's investment portfolio may subject the fund to greater risk of loss than would reinvestment of collateral in short-term, highly-rated investments. Risks associated with the fund's use of leverage are discussed under Note 7 to the financial statements.
Dividends and distributions
During the year ended December 31, 2019, distributions from net investment income totaling $2.2000 per share were paid to shareholders. The dates of payments and the amounts per share were as follows:
| | | | | | |
| | Payment date | | | Distributions | |
| | March 29, 2019 | | | $0.5500 | |
| | June 28, 2019 | | | 0.5500 | |
| | September 30, 2019 | | | 0.5500 | |
| | December 31, 2019 | | | 0.5500 | |
| | Total | | | $2.2000 | |
Dividend reinvestment plan
The fund's Dividend Reinvestment Plan (the Plan) provides that distributions of dividends and capital gains are automatically reinvested in common shares of the fund by Computershare Trust Company, N.A. (the Plan Agent). Every shareholder holding at least one full share of the fund is entitled to participate in the Plan. In addition, every shareholder who became a shareholder of the fund after June 30, 2011, and holds at least one full share of the fund will be automatically enrolled in the Plan. Shareholders may withdraw from the Plan at any time and shareholders who do not participate in the Plan will receive all distributions in cash.
If the fund declares a dividend or distribution payable either in cash or in common shares of the fund and the market price of shares on the payment date for the distribution or dividend equals or exceeds the fund's net asset value per share (NAV), the fund will issue common shares to participants at a value equal to the higher of NAV or 95% of the market price. The number of additional shares to be credited to each participant's account will be determined by dividing the dollar amount of the distribution or dividend by the higher of NAV or 95% of the market price. If the market price is lower than NAV, or if dividends or distributions are payable only in cash, then participants will receive shares purchased by the Plan Agent on participants' behalf on the NYSE or otherwise on the open market. If the market price exceeds NAV before the Plan Agent has completed its purchases, the average per share purchase price may exceed NAV, resulting in fewer shares being acquired than if the fund had issued new shares.
There are no brokerage charges with respect to common shares issued directly by the fund. However, whenever shares are purchased or sold on the NYSE or otherwise on the open market, each participant will pay a pro rata portion of brokerage trading fees, currently $0.05 per share purchased or sold. Brokerage trading fees will be deducted from amounts to be invested.
ANNUAL REPORT | JOHN HANCOCK FINANCIAL OPPORTUNITIES FUND 33
The reinvestment of dividends and net capital gains distributions does not relieve participants of any income tax that may be payable on such dividends or distributions.
Shareholders participating in the Plan may buy additional shares of the fund through the Plan at any time in amounts of at least $50 per investment, up to a maximum of $10,000, with a total calendar year limit of $100,000. Shareholders will be charged a $5 transaction fee plus $0.05 per share brokerage trading fee for each order. Purchases of additional shares of the fund will be made on the open market. Shareholders who elect to utilize monthly electronic fund transfers to buy additional shares of the fund will be charged a $2 transaction fee plus $0.05 per share brokerage trading fee for each automatic purchase. Shareholders can also sell fund shares held in the Plan account at any time by contacting the Plan Agent by telephone, in writing or by visiting the Plan Agent's website at www.computershare.com/investor. The Plan Agent will mail a check (less applicable brokerage trading fees) on settlement date (two business days after the shares have been sold). If shareholders choose to sell shares through their stockbroker, they will need to request that the Plan Agent electronically transfer those shares to their stockbroker through the Direct Registration System.
Shareholders participating in the Plan may withdraw from the Plan at any time by contacting the Plan Agent by telephone, in writing or by visiting the Plan Agent's website at www.computershare.com/investor. Such termination will be effective immediately if the notice is received by the Plan Agent prior to any dividend or distribution record date; otherwise, such termination will be effective on the first trading day after the payment date for such dividend or distribution, with respect to any subsequent dividend or distribution. If shareholders withdraw from the Plan, their shares will be credited to their account; or, if they wish, the Plan Agent will sell their full and fractional shares and send the shareholders the proceeds, less a transaction fee of $5 and less brokerage trading fees of $0.05 per share. If a shareholder does not maintain at least one whole share of common stock in the Plan account, the Plan Agent may terminate such shareholder's participation in the Plan after written notice. Upon termination, shareholders will be sent a check for the cash value of any fractional share in the Plan account, less any applicable broker commissions and taxes.
Shareholders who hold at least one full share of the fund may join the Plan by notifying the Plan Agent by telephone, in writing or by visiting the Plan Agent's website at www.computershare.com/investor. If received in proper form by the Plan Agent before the record date of a dividend, the election will be effective with respect to all dividends paid after such record date. If shareholders wish to participate in the Plan and their shares are held in the name of a brokerage firm, bank or other nominee, shareholders should contact their nominee to see if it will participate in the Plan. If shareholders wish to participate in the Plan, but their brokerage firm, bank or other nominee is unable to participate on their behalf, they will need to request that their shares be re-registered in their own name, or they will not be able to participate. The Plan Agent will administer the Plan on the basis of the number of shares certified from time to time by shareholders as representing the total amount registered in their name and held for their account by their nominee.
Experience under the Plan may indicate that changes are desirable. Accordingly, the fund and the Plan Agent reserve the right to amend or terminate the Plan. Participants generally will receive written notice at least 90 days before the effective date of any amendment. In the case of termination, participants will receive written notice at least 90 days before the record date for the payment of any dividend or distribution by the fund.
All correspondence or requests for additional information about the Plan should be directed to Computershare Trust Company, N.A., at the address stated below, or by calling 800-852-0218, 201-680-6578 (For International Telephone Inquiries) and 800-952-9245 (For the Hearing Impaired (TDD)).
ANNUAL REPORT | JOHN HANCOCK FINANCIAL OPPORTUNITIES FUND 34
Shareholder communication and assistance
If you have any questions concerning the fund, we will be pleased to assist you. If you hold shares in your own name and not with a brokerage firm, please address all notices, correspondence, questions or other communications regarding the fund to the transfer agent at:
Regular Mail:
Computershare
P.O. Box 505000
Louisville, KY 40233
Registered or Overnight Mail:
Computershare
462 South 4th Street, Suite 1600
Louisville, KY 40202
If your shares are held with a brokerage firm, you should contact that firm, bank or other nominee for assistance.
ANNUAL REPORT | JOHN HANCOCK FINANCIAL OPPORTUNITIES FUND 35
This chart provides information about the Trustees and Officers who oversee your John Hancock fund. Officers elected by the Trustees manage the day-to-day operations of the fund and execute policies formulated by the Trustees.
Independent Trustees
| | | |
Name, year of birth
Position(s) held with fund
Principal occupation(s) and other
directorships during past 5 years | Trustee
of the
Trust
since1 | Number of John
Hancock funds
overseen by
Trustee |
| Hassell H. McClellan, Born: 1945 | 2012 | 205 |
Trustee and Chairperson of the Board
Director/Trustee, Virtus Funds (since 2008); Director, The Barnes Group (since 2010); Associate Professor, The Wallace E. Carroll School of Management, Boston College (retired 2013). Trustee (since 2005) and Chairperson of the Board (since 2017) of various trusts within the John Hancock Fund Complex. |
| | | |
| Charles L. Bardelis,2 Born: 1941 | 2012 | 205 |
Trustee
Director, Island Commuter Corp. (marine transport). Trustee of various trusts within the John Hancock Fund Complex (since 1988). |
| | | |
| James R. Boyle,Born: 1959 | 2015 | 205 |
Trustee
Chief Executive Officer, Foresters Financial (since 2018); Chairman and Chief Executive Officer, Zillion Group, Inc. (formerly HealthFleet, Inc.) (healthcare) (2014-2018); Executive Vice President and Chief Executive Officer, U.S. Life Insurance Division of Genworth Financial, Inc. (insurance) (January 2014-July 2014); Senior Executive Vice President, Manulife Financial, President and Chief Executive Officer, John Hancock (1999-2012); Chairman and Director, John Hancock Investment Management LLC, John Hancock Investment Management Distributors LLC, and John Hancock Variable Trust Advisers LLC (2005-2010). Trustee of various trusts within the John Hancock Fund Complex (2005-2014 and since 2015). |
| | | |
| Peter S. Burgess,2 Born: 1942 | 2012 | 205 |
Trustee
Consultant (financial, accounting, and auditing matters) (since 1999); Certified Public Accountant; Partner, Arthur Andersen (independent public accounting firm) (prior to 1999); Director, Lincoln Educational Services Corporation (since 2004); Director, Symetra Financial Corporation (2010-2016); Director, PMA Capital Corporation (2004-2010). Trustee of various trusts within the John Hancock Fund Complex (since 2005). |
| | | |
| William H. Cunningham, Born: 1944 | 1995 | 205 |
Trustee
Professor, University of Texas, Austin, Texas (since 1971); former Chancellor, University of Texas System and former President of the University of Texas, Austin, Texas; Chairman (since 2009) and Director (since 2006), Lincoln National Corporation (insurance); Director, Southwest Airlines (since 2000); former Director, LIN Television (2009-2014). Trustee of various trusts within the John Hancock Fund Complex (since 1986). |
| | | |
| Grace K. Fey, Born: 1946 | 2012 | 205 |
Trustee
Chief Executive Officer, Grace Fey Advisors (since 2007); Director and Executive Vice President, Frontier Capital Management Company (1988-2007); Director, Fiduciary Trust (since 2009). Trustee of various trusts within the John Hancock Fund Complex (since 2008). |
ANNUAL REPORT | JOHN HANCOCK FINANCIAL OPPORTUNITIES FUND 36
Independent Trustees (continued)
| | | |
Name, year of birth
Position(s) held with fund
Principal occupation(s) and other
directorships during past 5 years | Trustee
of the
Trust
since1 | Number of John
Hancock funds
overseen by
Trustee |
| Deborah C. Jackson, Born: 1952 | 2008 | 205 |
Trustee
President, Cambridge College, Cambridge, Massachusetts (since 2011); Board of Directors, Massachusetts Women's Forum (since 2018); Board of Directors, National Association of Corporate Directors/New England (since 2015); Board of Directors, Association of Independent Colleges and Universities of Massachusetts (2014-2017); Chief Executive Officer, American Red Cross of Massachusetts Bay (2002-2011); Board of Directors of Eastern Bank Corporation (since 2001); Board of Directors of Eastern Bank Charitable Foundation (since 2001); Board of Directors of American Student Assistance Corporation (1996-2009); Board of Directors of Boston Stock Exchange (2002-2008); Board of Directors of Harvard Pilgrim Healthcare (health benefits company) (2007-2011). Trustee of various trusts within the John Hancock Fund Complex (since 2008). |
| | | |
| James M. Oates,2Born: 1946 | 2012 | 205 |
Trustee
Managing Director, Wydown Group (financial consulting firm) (since 1994); Chairman and Director, Emerson Investment Management, Inc. (2000-2015); Independent Chairman, Hudson Castle Group, Inc. (formerly IBEX Capital Markets, Inc.) (financial services company) (1997-2011); Director, Stifel Financial (since 1996); Director, Investor Financial Services Corporation (1995-2007); Director, Connecticut River Bancorp (1998-2014); Director/Trustee, Virtus Funds (since 1988). Trustee (since 2004) and Chairperson of the Board (2005-2016) of various trusts within the John Hancock Fund Complex. |
| | | |
| Steven R. Pruchansky, Born: 1944 | 1994 | 205 |
Trustee and Vice Chairperson of the Board
Managing Director, Pru Realty (since 2017); Chairman and Chief Executive Officer, Greenscapes of Southwest Florida, Inc. (since 2014); Director and President, Greenscapes of Southwest Florida, Inc. (until 2000); Member, Board of Advisors, First American Bank (until 2010); Managing Director, Jon James, LLC (real estate) (since 2000); Partner, Right Funding, LLC (2014-2017); Director, First Signature Bank & Trust Company (until 1991); Director, Mast Realty Trust (until 1994); President, Maxwell Building Corp. (until 1991). Trustee (since 1992), Chairperson of the Board (2011-2012), and Vice Chairperson of the Board (since 2012) of various trusts within the John Hancock Fund Complex. |
| | | |
| Gregory A. Russo, Born: 1949 | 2008 | 205 |
Trustee
Director and Audit Committee Chairman (since 2012), and Member, Audit Committee and Finance Committee (since 2011), NCH Healthcare System, Inc. (holding company for multi-entity healthcare system); Director and Member (2012-2018) and Finance Committee Chairman (2014-2018), The Moorings, Inc. (nonprofit continuing care community); Vice Chairman, Risk & Regulatory Matters, KPMG LLP (KPMG) (2002-2006); Vice Chairman, Industrial Markets, KPMG (1998-2002); Chairman and Treasurer, Westchester County, New York, Chamber of Commerce (1986-1992); Director, Treasurer, and Chairman of Audit and Finance Committees, Putnam Hospital Center (1989-1995); Director and Chairman of Fundraising Campaign, United Way of Westchester and Putnam Counties, New York (1990-1995). Trustee of various trusts within the John Hancock Fund Complex (since 2008). |
ANNUAL REPORT | JOHN HANCOCK FINANCIAL OPPORTUNITIES FUND 37
Non-Independent Trustees3
| | | |
Name, year of birth
Position(s) held with fund
Principal occupation(s) and other
directorships during past 5 years | Trustee
of the
Trust
since1 | Number of John
Hancock funds
overseen by
Trustee |
| Andrew G. Arnott, Born: 1971 | 2017 | 205 |
President and Non-Independent Trustee
Head of Wealth and Asset Management, United States and Europe, for John Hancock and Manulife (since 2018); Executive Vice President, John Hancock Financial Services (since 2009, including prior positions); Director and Executive Vice President, John Hancock Investment Management LLC (since 2005, including prior positions); Director and Executive Vice President, John Hancock Variable Trust Advisers LLC (since 2006, including prior positions); President, John Hancock Investment Management Distributors LLC (since 2004, including prior positions); President of various trusts within the John Hancock Fund Complex (since 2007, including prior positions). Trustee of various trusts within the John Hancock Fund Complex (since 2017). |
| | | |
| Marianne Harrison, Born: 1963 | 2018 | 205 |
Non-Independent Trustee
President and CEO, John Hancock (since 2017); President and CEO, Manulife Canadian Division (2013-2017); Member, Board of Directors, CAE Inc. (since 2019); Member, Board of Directors, MA Competitive Partnership Board (since 2018); Member, Board of Directors, American Council of Life Insurers (ACLI) (since 2018); Member, Board of Directors, Communitech, an industry-led innovation center that fosters technology companies in Canada (2017-2019); Member, Board of Directors, Manulife Assurance Canada (2015-2017); Board Member, St. Mary's General Hospital Foundation (2014-2017); Member, Board of Directors, Manulife Bank of Canada (2013-2017); Member, Standing Committee of the Canadian Life & Health Assurance Association (2013-2017); Member, Board of Directors, John Hancock USA, John Hancock Life & Health, John Hancock New York (2012-2013). Trustee of various trusts within the John Hancock Fund Complex (since 2018). |
Principal officers who are not Trustees
| | |
Name, year of birth
Position(s) held with fund
Principal occupation(s)
during past 5 years | Officer
of the
Trust
since |
| Francis V. Knox, Jr.,Born: 1947 | 2005 |
Chief Compliance Officer
Vice President, John Hancock Financial Services (since 2005); Chief Compliance Officer, various trusts within the John Hancock Fund Complex, John Hancock Investment Management LLC, and John Hancock Variable Trust Advisers LLC (since 2005). |
| | |
| Charles A. Rizzo, Born: 1957 | 2007 |
Chief Financial Officer
Vice President, John Hancock Financial Services (since 2008); Senior Vice President, John Hancock Investment Management LLC and John Hancock Variable Trust Advisers LLC (since 2008); Chief Financial Officer of various trusts within the John Hancock Fund Complex (since 2007). |
| | |
| Salvatore Schiavone, Born: 1965 | 2010 |
Treasurer
Assistant Vice President, John Hancock Financial Services (since 2007); Vice President, John Hancock Investment Management LLC and John Hancock Variable Trust Advisers LLC (since 2007); Treasurer of various trusts within the John Hancock Fund Complex (since 2007, including prior positions). |
ANNUAL REPORT | JOHN HANCOCK FINANCIAL OPPORTUNITIES FUND 38
Principal officers who are not Trustees (continued)
| | |
Name, year of birth
Position(s) held with fund
Principal occupation(s)
during past 5 years | Officer
of the
Trust
since |
| Christopher (Kit) Sechler,Born: 1973 | 2018 |
Chief Legal Officer and Secretary
Vice President and Deputy Chief Counsel, John Hancock Investments (since 2015); Assistant Vice President and Senior Counsel (2009-2015), John Hancock Investment Management; Chief Legal Officer and Secretary of various trusts within the John Hancock Fund Complex (since 2018); Assistant Secretary of John Hancock Investment Management LLC and John Hancock Variable Trust Advisers LLC (since 2009). |
The business address for all Trustees and Officers is 200 Berkeley Street, Boston, Massachusetts 02116-5023.
| 1 | Mr. Boyle, Mr. Cunningham, Ms. Fey, Mr. McClellan and Mr. Russo serve as Trustees for a term expiring in 2020; Mr. Bardelis, Mr. Burgess and Ms. Harrison serve as Trustees for a term expiring in 2021; Mr. Arnott, Ms. Jackson, Mr. Oates and Mr. Pruchansky serve as Trustees for a term expiring in 2022; Mr. Boyle has served as Trustee at various times prior to date listed in the table. |
| 2 | Member of the Audit Committee. |
| 3 | The Trustee is a Non-Independent Trustee due to current or former positions with the Advisor and certain of its affiliates. |
ANNUAL REPORT | JOHN HANCOCK FINANCIAL OPPORTUNITIES FUND 39
| | |
Trustees
Hassell H. McClellan,Chairperson
Steven R. Pruchansky,Vice Chairperson
Andrew G. Arnott†
Charles L. Bardelis*
James R. Boyle
Peter S. Burgess*
William H. Cunningham
Grace K. Fey
Marianne Harrison†
Deborah C. Jackson
James M. Oates*
Gregory A. Russo
Officers
Andrew G. Arnott
President
Francis V. Knox, Jr.
Chief Compliance Officer
Charles A. Rizzo
Chief Financial Officer
Salvatore Schiavone
Treasurer
Christopher (Kit) Sechler
Secretary and Chief Legal Officer
| Investment advisor
John Hancock Investment Management LLC
Subadvisor
Manulife Investment Management (US) LLC
Portfolio Managers
Susan A. Curry
Ryan P. Lentell, CFA
Lisa A. Welch1
Custodian
State Street Bank and Trust Company
Transfer agent
Computershare Shareowner Services, LLC
Legal counsel
K&L Gates LLP
Independent registered public accounting firm
PricewaterhouseCoopers LLP
Stock symbol
Listed New York Stock Exchange: BTO
1 Effective June 1, 2020, Lisa A. Welch will no longer serve as portfolio manager of the fund.
|
* Member of the Audit Committee
† Non-Independent Trustee
For shareholder assistance refer to page 6
| | | | |
| | You can also contact us: |
| | 800-852-0218
jhinvestments.com | Regular mail:
Computershare
P.O. Box 505000
Louisville, KY 40233
| Express mail:
Computershare
462 South 4th Street, Suite 1600
Louisville, KY 40202
|
The fund's proxy voting policies and procedures, as well as the fund's proxy voting record for the most recent twelve-month period ended June 30, are available free of charge on the Securities and Exchange Commission (SEC) website at sec.gov or on our website.
All of the fund's holdings as of the end of the third month of every fiscal quarter are filed with the SEC on Form N-PORT within 60 days of the end of the fiscal quarter. The fund's Form N-PORT filings are available on our website and the SEC's website, sec.gov.
We make this information on your fund, as well asmonthly portfolio holdings, and other fund details available on our website at jhinvestments.com or by calling 800-852-0218.
The report is certified under the Sarbanes-Oxley Act, which requires closed-end funds and other public companies to affirm that, to the best of their knowledge, the information in their financial reports is fairly and accurately stated in all material respects.ANNUAL REPORT | JOHN HANCOCK FINANCIAL OPPORTUNITIES FUND 40
John Hancock family of funds
| | | |
DOMESTIC EQUITY FUNDS
Blue Chip Growth
Classic Value
Disciplined Value
Disciplined Value Mid Cap
Equity Income
Financial Industries
Fundamental All Cap Core
Fundamental Large Cap Core
New Opportunities
Regional Bank
Small Cap Core
Small Cap Growth
Small Cap Value
U.S. Global Leaders Growth
U.S. Quality Growth
GLOBAL AND INTERNATIONAL EQUITY FUNDS
Disciplined Value International
Emerging Markets
Emerging Markets Equity
Fundamental Global Franchise
Global Equity
Global Shareholder Yield
Global Thematic Opportunities
International Dynamic Growth
International Growth
International Small Company
| | INCOME FUNDS
Bond
California Tax-Free Income
Emerging Markets Debt
Floating Rate Income
Government Income
High Yield
High Yield Municipal Bond
Income
Investment Grade Bond
Money Market
Short Duration Bond
Short Duration Credit Opportunities
Strategic Income Opportunities
Tax-Free Bond
ALTERNATIVE AND SPECIALTY FUNDS
Absolute Return Currency
Alternative Asset Allocation
Alternative Risk Premia
Disciplined Alternative Yield
Diversified Macro
Infrastructure
Multi-Asset Absolute Return
Seaport Long/Short
|
The fund's investment objectives, risks, charges, and expenses are included in the prospectus and should be considered carefully before investing. For a prospectus, contact your financial professional, call John Hancock Investment Management at 800-852-0218, or visit the fund's website at jhinvestments.com. Please read the prospectus carefully before investing or sending money.
The John Hancock funds are distributed by John Hancock Investment Management Distributors LLC. Member FINRA SIPC.
| | | |
ASSET ALLOCATION
Balanced
Income Allocation
Multi-Index Lifetime Portfolios
Multi-Index Preservation Portfolios
Multimanager Lifestyle Portfolios
Multimanager Lifetime Portfolios
Retirement Income 2040
EXCHANGE-TRADED FUNDS
John Hancock Multifactor Consumer Discretionary ETF
John Hancock Multifactor Consumer Staples ETF
John Hancock Multifactor Developed International ETF
John Hancock Multifactor Emerging Markets ETF
John Hancock Multifactor Energy ETF
John Hancock Multifactor Financials ETF
John Hancock Multifactor Healthcare ETF
John Hancock Multifactor Industrials ETF
John Hancock Multifactor Large Cap ETF
John Hancock Multifactor Materials ETF
John Hancock Multifactor Media and
Communications ETF
John Hancock Multifactor Mid Cap ETF
John Hancock Multifactor Small Cap ETF
John Hancock Multifactor Technology ETF
John Hancock Multifactor Utilities ETF
| | ENVIRONMENTAL, SOCIAL, AND
GOVERNANCE FUNDS
ESG All Cap Core
ESG Core Bond
ESG International Equity
ESG Large Cap Core
CLOSED-END FUNDS
Financial Opportunities
Hedged Equity & Income
Income Securities Trust
Investors Trust
Preferred Income
Preferred Income II
Preferred Income III
Premium Dividend
Tax-Advantaged Dividend Income
Tax-Advantaged Global Shareholder Yield
|
John Hancock Multifactor ETF shares are bought and sold at market price (not NAV), and are not individually redeemed
from the fund. Brokerage commissions will reduce returns.
John Hancock ETFs are distributed by Foreside Fund Services, LLC, and are subadvised by Dimensional Fund Advisors LP.
Foreside is not affiliated with John Hancock Investment Management Distributors LLC or Dimensional Fund Advisors LP.
Dimensional Fund Advisors LP receives compensation from John Hancock in connection with licensing rights to the
John Hancock Dimensional indexes. Dimensional Fund Advisors LP does not sponsor, endorse, or sell, and makes no
representation as to the advisability of investing in, John Hancock Multifactor ETFs.
John Hancock Investment Management
A trusted brand
John Hancock Investment Management is a premier asset manager
representing one of America's most trusted brands, with a heritage of
financial stewardship dating back to 1862. Helping our shareholders
pursue their financial goals is at the core of everything we do. It's why
we support the role of professional financial advice and operate with
the highest standards of conduct and integrity.
A better way to invest
We serve investors globally through a unique multimanager approach:
We search the world to find proven portfolio teams with specialized
expertise for every strategy we offer, then we apply robust investment
oversight to ensure they continue to meet our uncompromising
standards and serve the best interests of our shareholders.
Results for investors
Our unique approach to asset management enables us to provide
a diverse set of investments backed by some of the world's best
managers, along with strong risk-adjusted returns across asset classes.
John Hancock Investment Management LLC
200 Berkeley Street n Boston, MA 02116-5010 n 800-225-5291 n jhinvestments.com
ITEM 2. CODE OF ETHICS.
As of the end of the period, December 31, 2019, the registrant has adopted a code of ethics, as defined in Item 2 of Form N-CSR, that applies to its Chief Executive Officer, Chief Financial Officer and Treasurer (respectively, the principal executive officer, the principal financial officer and the principal accounting officer, the “Senior Financial Officers”). A copy of the code of ethics is filed as an exhibit to this Form N-CSR.
ITEM 3. AUDIT COMMITTEE FINANCIAL EXPERT.
Peter S. Burgess is the audit committee financial expert and is “independent”, pursuant to general instructions on Form N-CSR Item 3.
ITEM 4. PRINCIPAL ACCOUNTANT FEES AND SERVICES.
(a) Audit Fees
The aggregate fees billed for professional services rendered by the principal accountant(s) for the audit of the registrant’s annual financial statements or services that are normally provided by the accountant(s) in connection with statutory and regulatory filings or engagements amounted to $34,737 for the fiscal period ended December 31, 2019, $33,738 for the fiscal year ended December 31, 2018.
(b) Audit-Related Services
Audit-related fees during the fiscal periods ended December 31, 2019 and December 31, 2018 amounted to $5 and $0, respectively, billed to the registrant or to the registrant's investment adviser (not including any sub-adviser whose role is primarily portfolio management and is subcontracted with or overseen by another investment adviser), and any entity controlling, controlled by, or under common control with the adviser that provides ongoing services to the registrant ("control affiliates"). In addition, amounts billed to control affiliates for service provider internal controls reviews were $116,467, and $113,000 for the fiscal periods ended December 31, 2019 and 2018, respectively.
(c) Tax Fees
The aggregate fees billed for professional services rendered by the principal accountant(s) for the tax compliance, tax advice and tax planning (“tax fees”) amounted to $3,837 for the fiscal period ended December 31, 2019, and $3,725 for the fiscal year ended December 31, 2018. The nature of the services comprising the tax fees was the review of the registrant’s tax returns and tax distribution requirements.
(d) All Other Fees
Other fees amounted to $84 for the fiscal period ended December 31, 2019, and $239 for the fiscal year ended December 31, 2018, billed to the registrant or to the control affiliates for products and services provided by the principal accountant. The nature of the services comprising the all other fees consisted mainly of review of foreign tax withholding rates.
(e)(1) Audit Committee Pre-Approval Policies and Procedures:
The trust’s Audit Committee must pre-approve all audit and non-audit services provided by the independent registered public accounting firm (the “Auditor”) relating to the operations or financial reporting of the funds. Prior to the commencement of any audit or non-audit services to a fund, the Audit Committee reviews the services to determine whether they are appropriate and permissible under applicable law.
The trust’s Audit Committee has adopted policies and procedures to, among other purposes, provide a framework for the Committee’s consideration of audit-related and non-audit services by the Auditor. The policies and procedures require that any audit-related and non-audit service provided by the Auditor and any non-audit service provided by the Auditor to a fund service provider that relates directly to the operations and financial reporting of a fund are subject to approval by the Audit Committee before such service is provided. Audit-related services provided by the Auditor that are expected to exceed $25,000 per instance/per fund are subject to specific pre-approval by the Audit Committee. Tax services provided by the Auditor that are expected to exceed $30,000 per instance/per fund are subject to specific pre-approval by the Audit Committee.
All audit services, as well as the audit-related and non-audit services that are expected to exceed the amounts stated above, must be approved in advance of provision of the service by formal resolution of the Audit Committee. At the regularly scheduled Audit Committee meetings, the Committee reviews a report summarizing the services, including fees, provided by the Auditor.
(e)(2) Services approved pursuant to paragraph (c)(7)(i)(C) of Rule 2-01 of Regulation S-X:
Audit-Related Fees, Tax Fees and All Other Fees:
There were no amounts that were approved by the Audit Committee pursuant to the de minimis exception under Rule 2-01 of Regulation S-X.
(f) According to the registrant’s principal accountant, for the fiscal year ended December 31, 2019, the percentage of hours spent on the audit of the registrant's financial statements for the most recent fiscal year that were attributed to work performed by persons who were not full-time, permanent employees of principal accountant was less than 50%.
(g) The aggregate non-audit fees billed by the registrant's accountant(s) for services rendered to the registrant and rendered to the registrant's control affiliates for each of the last two fiscal years of the registrant were $941,023 for the fiscal period ended December 31, 2019 and $736,243 for the fiscal year ended December 31, 2018.
(h) The audit committee of the registrant has considered the non-audit services provided by the registrant’s principal accountant(s) to the control affiliates and has determined that the services that were not pre-approved are compatible with maintaining the principal accountant(s)' independence.
ITEM 5. AUDIT COMMITTEE OF LISTED REGISTRANTS.
The registrant has a separately-designated standing audit committee comprised of independent trustees. The members of the audit committee are as follows:
Peter S. Burgess - Chairman
Charles L. Bardelis
Theron S. Hoffman
ITEM 6. SCHEDULE OF INVESTMENTS.
(a) Not applicable.
(b) Not applicable.
ITEM 7. DISCLOSURE OF PROXY VOTING POLICIES AND PROCEDURES FOR CLOSED-END MANAGEMENT INVESTMENT COMPANIES.
See attached exhibit “Proxy Voting Policies and Procedures”.
ITEM 8.PORTFOLIO MANAGERS OF CLOSED-END MANAGEMENT INVESTMENT COMPANIES.
Information about the Manulife Investment Management (US) LLC (“Manulife IM (US)”) portfolio managers
Below is a list of the Manulife Investment Management (US) LLC “Manulife IM (US)” portfolio managers who share joint responsibility for the day-to-day investment management of the Fund subject to oversight by John Hancock Investment Management LLC (the “Adviser”). It provides a brief summary of their business careers over the past five years. Information is provided as of December 31, 2019.
Lisa A. Welch1
Senior Managing Director and Senior Portfolio Manager
Manulife Investment Management (US) LLC since 2005
Managed the Fund since 1998
Began business career in 1986
1Effective June 1, 2020, Lisa A. Welch will no longer serve as a portfolio manager of the fund.
Susan A. Curry
Managing Director and Portfolio Manager
Manulife Investment Management (US) LLC since 2006
Managed the Fund since 2004
Began business career in 1993
Ryan P. Lentell, CFA
Managing Director and Portfolio Manager
Manulife Investment Management (US) LLC since 2008
Managed the Fund since 2008
Began business career in 1999
Other Accounts the Portfolio Managers are Managing
The table below indicates, for each portfolio manager, information about the accounts over which the portfolio manager has day-to-day investment responsibility. All information on the number of accounts and total assets in the table is as of December 31, 2019. For purposes of the table, “Other Pooled Investment Vehicles” may include investment partnerships and group trusts, and “Other Accounts” may include separate accounts for institutions or individuals, insurance company general or separate accounts, pension funds and other similar institutional accounts.
| | Registered Investment | | Other Pooled | | | | |
| | Companies | | Investment Vehicles | | Other Accounts |
| | Number | | Total | | Number | | Total | | Number | | Total |
| | of | | Assets | | of | | Assets | | of | | Assets |
| | Accounts | | $Million | | Accounts | | $Million | | Accounts | | $Million |
| Lisa A. Welch | | 4 | | 4,899.43 | | 7 | | 600.61 | | 1 | | .61 |
| Susan A. Curry | | 3 | | 2,588.75 | | 3 | | 301.14 | | 1 | | .61 |
| Ryan P. Lentell, | | 3 | | 2,588.75 | | 3 | | 301.14 | | 1 | | .61 |
| CFA | | | | | | | | | | | | |
Accounts within the total accounts that are subject to a performance-based advisory fee: None.
Conflicts of Interest.When a portfolio manager is responsible for the management of more than one account, the potential arises for the portfolio manager to favor one account over another. The principal types of potential conflicts of interest that may arise are discussed below. For the reasons outlined below, the Fund does not believe that any material conflicts are likely to arise out of a portfolio manager’s responsibility for the management of the Fund as well as one or more other accounts. The Advisor and Subadvisor have adopted procedures that are intended to monitor compliance with the policies referred to in the following paragraphs. Generally, the risks of such conflicts of interests are increased to the extent that a portfolio manager has a financial incentive to favor one account over another. The Advisor and Subadvisor have structured their compensation arrangements in a manner that is intended to limit such potential for conflicts of interests. See “Compensation of Portfolio Managers” below.
| ● | A portfolio manager could favor one account over another in allocating new investment opportunities that have limited supply, such as initial public offerings and private placements. If, for example, an initial public offering that was expected to appreciate in value significantly shortly after the offering was allocated to a single account, that account may be expected to have better investment performance than other accounts that did not receive an allocation on the initial public offering. The Subadvisor has policies that require a portfolio manager to allocate such investment opportunities in an equitable manner and generally to allocate such investments proportionately among all accounts with similar investment objectives. |
| | |
| ● | A portfolio manager could favor one account over another in the order in which trades for the accounts are placed. If a portfolio manager determines to purchase a security for more than one account in an aggregate amount that may influence the market price of the security, accounts that purchased or sold the security first may receive a more favorable price than accounts that made subsequent transactions. The less liquid the market for the security or the greater the percentage that the proposed aggregate purchases or sales represent of average daily trading volume, the greater the potential for accounts that make subsequent purchases or sales to receive a less favorable price. When a portfolio manager intends to trade the same security for more than one account, the policies of the Subadvisor generally require that such trades be “bunched,” which means that the trades for the individual accounts are aggregated and each account receives the same price. There are some types of accounts as to which bunching may not be possible for contractual reasons (such as directed brokerage arrangements). Circumstances may also arise where the trader believes that bunching the orders may not result in the best possible price. Where those accounts or circumstances are involved, the Subadvisor will place the order in a manner intended to result in as favorable a price as possible for such client. |
| | |
| ● | A portfolio manager could favor an account if the portfolio manager’s compensation is tied to the performance of that account rather than all accounts managed by the portfolio manager. If, for example, the portfolio manager receives a bonus based upon the performance of certain accounts relative to a benchmark while other accounts are disregarded for this purpose, the portfolio manager will have a financial incentive to seek to have the accounts that determine the portfolio manager’s bonus achieve the best possible performance to the possible detriment of other accounts. Similarly, if the Subadvisor receives a performance-based advisory fee, the portfolio manager may favor that account, whether or not the performance of that account directly determines the portfolio manager’s compensation. The investment performance on specific accounts is not a factor in determining the portfolio manager’s compensation. See “Compensation of Portfolio Managers” below. Neither the Advisor nor the Subadvisor receives a performance-based fee with respect to any of the accounts managed by the portfolio managers. |
| | |
| ● | A portfolio manager could favor an account if the portfolio manager has a beneficial interest in the account, in order to benefit a large client or to compensate a client that had poor returns. For example, if the portfolio manager held an interest in an investment partnership that was one of the accounts managed by the portfolio manager, the portfolio manager would have an economic incentive to favor the account in which the portfolio manager held an interest. The Subadvisor imposes certain trading restrictions and reporting requirements for accounts in which a portfolio manager or certain family members have a personal interest in order to confirm that such accounts are not favored over other accounts. |
| ● | If the different accounts have materially and potentially conflicting investment objectives or strategies, a conflict of interest may arise. For example, if a portfolio manager purchases a security for one account and sells the same security short for another account, such trading pattern could disadvantage either the account that is long or short. In making portfolio manager assignments, the Subadvisor seeks to avoid such potentially conflicting situations. However, where a portfolio manager is responsible for accounts with differing investment objectives and policies, it is possible that the portfolio manager will conclude that it is in the best interest of one account to sell a portfolio security while another account continues to hold or increase the holding in such security. |
Compensation of Portfolio Managers.The Subadvisor has adopted a system of compensation for portfolio managers and others involved in the investment process that is applied systematically among investment professionals. At the Subadvisor, the structure of compensation of investment professionals is currently composed of the following basic components: base salary and short-and long-term incentives. The following describes each component of the compensation package for the individuals identified as a portfolio manager for the Funds.
| ● | Base salary. Base compensation is fixed and normally reevaluated on an annual basis. The Subadvisor seeks to set compensation at market rates, taking into account the experience and responsibilities of the investment professional. |
| | |
| ● | Incentives. Only investment professionals are eligible to participate in the short-and long-term incentive plan. Under the plan, investment professionals are eligible for an annual cash award. The plan is intended to provide a competitive level of annual bonus compensation that is tied to the investment professional achieving superior investment performance and aligns the financial incentives of the Subadvisor and the investment professional. Any bonus under the plan is completely discretionary, with a maximum annual bonus that may be well in excess of base salary. Payout of a portion of this bonus may be deferred for up to five years. While the amount of any bonus is discretionary, the following factors are generally used in determining bonuses under the plan: |
| | |
| ● | Investment Performance: The investment performance of all accounts managed by the investment professional over one, three and five-year periods are considered. With respect to fixed income accounts, relative yields are also used to measure performance. The pre-tax performance of each account is measured relative to an appropriate benchmark and universe as identified in the table below. |
| | |
| ● | Financial Performance: The profitability of the Subadvisor and its parent company are also considered in determining bonus awards. |
| | |
| ● | In addition to the above, compensation may also include a revenue component for an investment team derived from a number of factors including, but not limited to client assets under management, investment performance, and firm metrics. |
| ● | Manulife Equity Awards. A limited number of senior investment professionals may receive options to purchase shares of Manulife Financial stock. Generally, such option would permit the investment professional to purchase a set amount of stock at the market price on the date of grant. The option can be exercised for a set period (normally a number of years or until termination of employment) and the investment professional would exercise the option if the market value of Manulife Financial stock increases. Some investment professionals may receive restricted stock grants, where the investment professional is entitled to receive the stock at no or nominal cost, provided that the stock is forgone if the investment professional’s employment is terminated prior to a vesting date. |
| | |
| ● | Deferred Incentives. Investment professionals may receive deferred incentives which are fully invested in strategies managed by the team/individuals as well as other Manulife Asset Management strategies. |
The Subadvisor also permits investment professionals to participate on a voluntary basis in a deferred compensation plan, under which the investment professional may elect on an annual basis to defer receipt of a portion of their compensation until retirement. Participation in the plan is voluntary.
| Fund | Peer Universe |
| Financial Opportunities Fund | Financial |
Share Ownership by Portfolio Managers.The following table indicates as of as of December 31, 2019, the value of shares beneficially owned by the portfolio managers in the Fund.
| | Range of |
| | Beneficial |
| Portfolio Manager | Ownership |
| Lisa A. Welch | $1-$10,000 |
| Susan A. Curry | $10,001-$50,000 |
| Ryan P. Lentell, CFA | $0 |
| REGISTRANT PURCHASES OF |
| (b) | EQUITY SECURITIES |
| | | | | | Total Number | | Maximum |
| | | | | | of | | Number |
| | | | | | Shares | | of Shares |
| | | | | | Purchased | | that May |
| | Total | | Average | | as Part of | | Yet Be |
| | Number of | | Price | | Publicly | | Purchased |
| | Shares | | | | Announced | | Under the |
| Period | | Purchased | | per Share | | Plans* | | Plans |
| Jan-19 | | - | | - | | - | | 1,867,046* |
| Feb-19 | | - | | - | | - | | 1,869,152 |
| Mar-19 | | - | | - | | - | | 1,869,152 |
| Apr-19 | | - | | - | | - | | 1,869,152 |
| May-19 | | - | | - | | - | | 1,869,152 |
| Jun-19 | | - | | - | | - | | 1,869,152 |
| Jul-19 | | - | | - | | - | | 1,869,152 |
| Aug-19 | | - | | - | | - | | 1,869,152 |
| Sep-19 | | - | | - | | - | | 1,869,152 |
| Oct-19 | | - | | - | | - | | 1,869,152 |
| Nov-19 | | - | | - | | - | | 1,869,152 |
| Dec-19 | | - | | - | | - | | 1,869,152* |
| Total | | - | | - | | - | | |
____________________
*In May 2009, the Board of Trustees approved a share repurchase plan, which was subsequently reviewed and approved by the Board of Trustees each year in December. Under the current share repurchase plan, the Fund may purchase in the open market up to 10% of its outstanding common shares as of December 31, 2019. The current plan is in effect between January 1, 2020 and December 31, 2020.
ITEM 10. SUBMISSION OF MATTERS TO A VOTE OF SECURITY HOLDERS.
(a) The registrant has adopted procedures by which shareholders may recommend nominees to the registrant's Board of Trustees. A copy of the procedures is filed as an exhibit to this Form N-CSR. See attached "John Hancock Funds – Nominating and Governance Committee Charter".
ITEM 11. CONTROLS AND PROCEDURES.
(a) Based upon their evaluation of the registrant's disclosure controls and procedures as conducted within 90 days of the filing date of this Form N-CSR, the registrant's principal executive officer and principal financial officer have concluded that those disclosure controls and procedures provide reasonable assurance that the material information required to be disclosed by the registrant on this report is recorded, processed, summarized and reported within the time periods specified in the Securities and Exchange Commission's rules and forms.
(b) There were no changes in the registrant's internal control over financial reporting that occurred during the period covered by this report that have materially affected, or are reasonably likely to materially affect, the registrant's internal control over financial reporting.
ITEM 12. DISCLOSURE OF SECURITIES LENDING ACTIVITIES FOR CLOSED-END MANAGEMENT INVESTMENT COMPANIES.
The Fund did not participate directly in securities lending activities. See Note 8 to financial statements in Item 1.
ITEM 13. EXHIBITS.
(a)(1) Code of Ethics for Senior Financial Officers is attached.
(a)(2) Separate certifications for the registrant's principal executive officer and principal financial officer, as required by Section 302 of the Sarbanes-Oxley Act of 2002 and Rule 30a-2(a) under the Investment Company Act of 1940, are attached.
(b)(1) Separate certifications for the registrant's principal executive officer and principal financial officer, as required by 18 U.S.C. Section 1350, as adopted pursuant to Section 906 of the Sarbanes-Oxley Act of 2002, and Rule 30a-2(b) under the Investment Company Act of 1940, are attached. The certifications furnished pursuant to this paragraph are not deemed to be "filed" for purposes of Section 18 of the Securities Exchange Act of 1934, or otherwise subject to the liability of that section. Such certifications are not deemed to be incorporated by reference into any filing under the Securities Act of 1933 or the Securities Exchange Act of 1934, except to the extent that the Registrant specifically incorporates them by reference.
(c)(1) Proxy Voting Policies and Procedures are attached.
(c)(2) Submission of Matters to a Vote of Security Holders is attached. See attached "John Hancock Funds - Governance Committee Charter".
(c)(3) Registrant’s notice to shareholders pursuant to Registrant’s exemptive order granting an exemption from Section 19(b) of the Investment Company Act of 1940, as amended and Rule 19b-1 thereunder regarding distributions made pursuant to the Registrant’s Managed Distribution Plan.
SIGNATURES
Pursuant to the requirements of the Securities Exchange Act of 1934 and the Investment Company Act of 1940, the registrant has duly caused this report to be signed on its behalf by the undersigned, thereunto duly authorized.
John Hancock Financial Opportunities Fund
| By: | /s/ Andrew Arnott |
| Andrew Arnott |
| President |
| |
| |
| Date: | February 14, 2020 |
Pursuant to the requirements of the Securities Exchange Act of 1934 and the Investment Company Act of 1940, this report has been signed below by the following persons on behalf of the registrant and in the capacities and on the dates indicated.
| By: | /s/ Andrew Arnott |
| Andrew Arnott |
| President |
| |
| |
| Date: | February 14, 2020 |
| |
| |
| By: | /s/ Charles A. Rizzo |
| Charles A. Rizzo |
| Chief Financial Officer |
| |
| |
| Date: | February 14, 2020 |