UNITED STATES
SECURITIES AND EXCHANGE COMMISSION
Washington, D.C. 20549
FORM N-CSR
CERTIFIED SHAREHOLDER REPORT OF REGISTERED
MANAGEMENT INVESTMENT COMPANIES
Investment Company Act file number 811-08568
John Hancock Financial Opportunities Fund
(Exact name of registrant as specified in charter)
200 Berkeley Street, Boston, Massachusetts 02116
(Address of principal executive offices) (Zip code)
Salvatore Schiavone
Treasurer
200 Berkeley Street
Boston, Massachusetts 02116
(Name and address of agent for service)
| Registrant's telephone number, including area code: 617-663-4497 |
| |
| Date of fiscal year end: | December 31 |
| |
| Date of reporting period: | June 30, 2020 |
ITEM 1. REPORTS TO STOCKHOLDERS.
John Hancock
Financial Opportunities Fund
Ticker: BTO
Semiannual report 6/30/2020
Beginning on January 1, 2021, as permitted by regulations adopted by the Securities and Exchange Commission, paper copies of the fund's shareholder reports such as this one will no longer be sent by mail, unless you specifically request paper copies of the reports from the transfer agent or from your financial intermediary. Instead, the reports will be made available on our website, and you will be notified by mail each time a report is posted and be provided with a website link to access the report.
If you have already elected to receive shareholder reports electronically, you will not be affected by this change and you do not need to take any action. You may elect to receive shareholder reports and other communications electronically by calling the transfer agent, Computershare, at 800-852-0218, by going to "Communication Preferences" at computershare.com/investor, or by contacting your financial intermediary.
You may elect to receive all reports in paper, free of charge, at any time. You can inform the transfer agent or your financial intermediary that you wish to continue receiving paper copies of your shareholder reports by following the instructions listed above. Your election to receive reports in paper will apply to all funds held with John Hancock Investment Management or your financial intermediary.

A message to shareholders
Dear shareholder,
Heightened fears over the coronavirus (COVID-19) sent U.S. markets tumbling during February and early March. By the end of the first quarter, however, equity markets began to rise. Against gathering evidence of widespread economic upheaval and the pandemic's tragic human toll, this comeback gathered momentum during the second half of the six-month period ended June 30, 2020. However, financial stocks were particularly hard hit and have had a rockier recovery.
Of course, it would be a mistake to consider this market turnaround a trustworthy signal of assured or swift economic recovery. Dramatic job losses mounted during the pandemic, putting millions of households at risk. In addition, widespread business losses have contributed to projections of a serious setback to growth in 2020.
From an investment perspective, we continue to think that maintaining a focus on long-term objectives while pursuing a risk-aware strategy is a prudent way forward. Above all, we believe the counsel of a trusted financial professional continues to matter now more than ever. Periods of heightened uncertainty are precisely the time to review your financial goals and follow a plan that helps you make the most of what continues to be a challenging situation.
On behalf of everyone at John Hancock Investment Management, I'd like to take this opportunity to welcome new shareholders and thank existing shareholders for the continued trust you've placed in us.
Sincerely,
Andrew G. Arnott
President and CEO,
John Hancock Investment Management
Head of Wealth and Asset Management,
United States and Europe
This commentary reflects the CEO's views as of this report's period end and are subject to change at any time. Diversification does not guarantee investment returns and does not eliminate risk of loss. All investments entail risks, including the possible loss of principal. For more up-to-date information, you can visit our website at jhinvestments.com.
John Hancock
Financial Opportunities Fund
Table of contents
| | | |
| 2 | | Your fund at a glance |
| 3 | | Portfolio Summary |
| 5 | | Fund's investments |
| 12 | | Financial statements |
| 16 | | Financial highlights |
| 18 | | Notes to financial statements |
| 28 | | Additional information |
| 28 | | Shareholder meeting |
| 29 | | Continuation of investment advisory and subadvisory agreements |
| 36 | | More information |
SEMIANNUAL REPORT | JOHN HANCOCK FINANCIAL OPPORTUNITIES FUND 1
INVESTMENT OBJECTIVE
The fund seeks to provide a high level of total return consisting of long-term capital appreciation and current income.
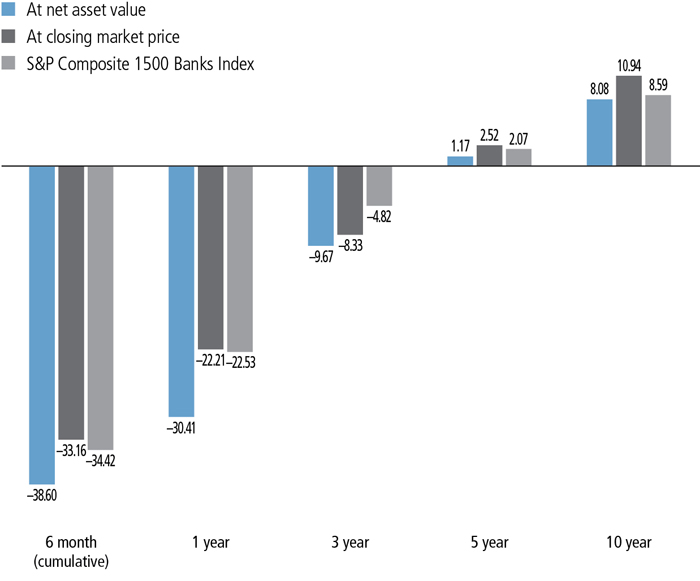
AVERAGE ANNUAL TOTAL RETURNS AS OF 6/30/2020 (%)
The S&P Composite 1500 Banks Index is an unmanaged index of banking sector stocks in the S&P 1500 Index.
It is not possible to invest directly in an index. Index figures do not reflect expenses and sales charges, which would result in lower returns.
The performance data contained within this material represents past performance, which does not guarantee future results.
Investment returns and principal value will fluctuate and a shareholder may sustain losses. Further, the fund's performance at net asset value (NAV) is different from the fund's performance at closing market price because the closing market price is subject to the dynamics of secondary market trading. Market risk may be increased when shares are purchased at a premium to NAV or sold at a discount to NAV. Current month-end performance may be higher or lower than the performance cited. The fund's most recent performance can be found at jhinvestment.com or by calling 800-852-0218.
SEMIANNUAL REPORT | JOHN HANCOCK FINANCIAL OPPORTUNITIES FUND 2
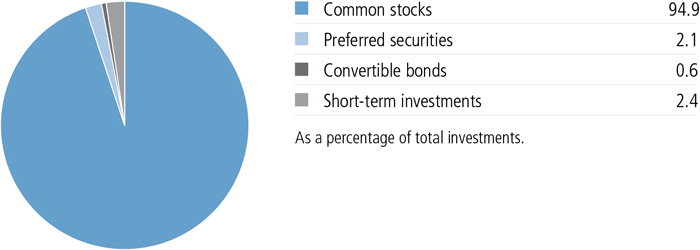
PORTFOLIO COMPOSITION AS OF 6/30/2020 (%)
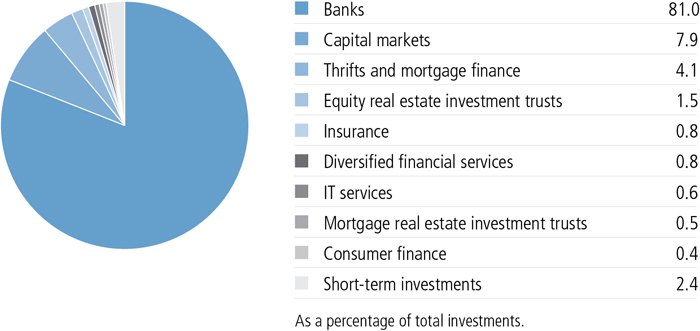
INDUSTRY COMPOSITION AS OF 6/30/2020 (%)
SEMIANNUAL REPORT | JOHN HANCOCK FINANCIAL OPPORTUNITIES FUND 3
TOP 10 HOLDINGS AS OF 6/30/2020 (%)
| | |
| The PNC Financial Services Group, Inc. | 2.6 |
| Truist Financial Corp. | 2.6 |
| JPMorgan Chase & Co. | 2.6 |
| Bank of America Corp. | 2.5 |
| Citizens Financial Group, Inc. | 2.5 |
| Citigroup, Inc. | 2.5 |
| The Blackstone Group, Inc., Class A | 2.3 |
| Cullen/Frost Bankers, Inc. | 2.3 |
| Zions Bancorp NA | 2.3 |
| M&T Bank Corp. | 2.2 |
| TOTAL | 24.4 |
| As a percentage of total investments. |
| Cash and cash equivalents are not included. |
A note about risks
As is the case with all exchange-listed closed-end funds, shares of this fund may trade at a discount or a premium to the fund's net asset value (NAV). An investment in the fund is subject to investment and market risks, including the possible loss of the entire principal invested. There is no guarantee prior distribution levels will be maintained, and distributions may include a substantial return of capital. A return of capital is the return of all or a portion of a shareholder's investment in the fund. The fund's prospectus includes additional information regarding returns of capital and the risks associated with distributions made by the fund, including potential tax implications. The fund's use of leverage creates additional risks, including greater volatility of the fund's NAV, market price, and returns. There is no assurance that the fund's leverage strategy will be successful. Focusing on a particular industry or sector may increase the fund's volatility and make it more susceptible to market, economic, and regulatory risks, as well as other factors affecting those industries or sectors. The value of a company's equity securities is subject to changes in its financial condition and overall market and economic conditions. Fixed-income investments are subject to interest-rate risk; their value will normally decline as interest rates rise. An issuer of securities held by the fund may default, have its credit rating downgraded, or otherwise perform poorly, which may affect fund performance. Derivatives transactions, including hedging and other strategic transactions, may increase a fund's volatility and could produce disproportionate losses, potentially more than the fund's principal investment. Liquidity—the extent to which a security may be sold or a derivative position closed without negatively affecting its market value—may be impaired by reduced trading volume, heightened volatility, rising interest rates, and other market conditions. The primary risks associated with the use of futures contracts and options are imperfect correlation, unanticipated market movement, and counterparty risk. Cybersecurity incidents may allow an unauthorized party to gain access to fund assets, customer data, or proprietary information, or cause a fund or its service providers to suffer data corruption or lose operational functionality. Similar incidents affecting issuers of a fund's securities may negatively impact performance.
A widespread health crisis such as a global pandemic could cause substantial market volatility, exchange trading suspensions and closures, and affect fund performance. For example, the novel coronavirus disease (COVID-19) has resulted in significant disruptions to global business activity. The impact of a health crisis and other epidemics and pandemics that may arise in the future, could affect the global economy in ways that cannot necessarily be foreseen at the present time. A health crisis may exacerbate other pre-existing political, social, and economic risks. Any such impact could adversely affect the fund's performance, resulting in losses to your investment.
SEMIANNUAL REPORT | JOHN HANCOCK FINANCIAL OPPORTUNITIES FUND 4
AS OF 6-30-20 (unaudited)
| | | | | Shares | Value |
| Common stocks 123.3% (94.9% of Total investments) | | $487,714,113 |
| (Cost $418,822,896) | | | | | |
| Financials 121.1% | | | | | 479,006,285 |
| Banks 103.7% | | |
| 1st Source Corp. | | | | 121,706 | 4,330,299 |
| American Business Bank (A) | | | | 21,548 | 539,777 |
| American National Bankshares, Inc. | | | | 93,258 | 2,335,180 |
| American River Bankshares | | | | 63,184 | 676,069 |
| American Riviera Bank (A) | | | | 186,611 | 2,285,985 |
| Ameris Bancorp | | | | 306,471 | 7,229,651 |
| Atlantic Capital Bancshares, Inc. (A) | | | | 202,690 | 2,464,710 |
| Atlantic Union Bankshares Corp. | | | | 251,010 | 5,813,392 |
| Avidbank Holdings, Inc. (A) | | | | 200,000 | 2,974,000 |
| Bank of America Corp. (B) | | | | 551,669 | 13,102,139 |
| Bank of Commerce Holdings | | | | 127,451 | 966,079 |
| Bank of Marin Bancorp | | | | 117,462 | 3,915,008 |
| Bar Harbor Bankshares | | | | 129,698 | 2,903,938 |
| Baycom Corp. (A) | | | | 123,093 | 1,589,131 |
| Berkshire Hills Bancorp, Inc. | | | | 172,246 | 1,898,151 |
| BOK Financial Corp. (B)(C) | | | | 39,621 | 2,236,209 |
| Bremer Financial Corp. (D)(E) | | | | 41,667 | 2,535,835 |
| Bryn Mawr Bank Corp. | | | | 80,000 | 2,212,800 |
| Business First Bancshares, Inc. | | | | 54,269 | 833,029 |
| Cadence BanCorp | | | | 286,424 | 2,537,717 |
| California Bancorp, Inc. (A) | | | | 76,909 | 1,145,944 |
| Cambridge Bancorp | | | | 44,174 | 2,616,868 |
| Camden National Corp. | | | | 54,131 | 1,869,685 |
| Centric Financial Corp. (A)(D) | | | | 275,000 | 1,745,494 |
| Citigroup, Inc. (B) | | | | 247,747 | 12,659,872 |
| Citizens Community Bancorp, Inc. | | | | 107,710 | 738,891 |
| Citizens Financial Group, Inc. | | | | 503,303 | 12,703,368 |
| City Holding Company | | | | 30,868 | 2,011,668 |
| Civista Bancshares, Inc. | | | | 127,682 | 1,966,303 |
| Coastal Financial Corp. (A) | | | | 124,053 | 1,801,250 |
| Columbia Banking System, Inc. (B)(C) | | | | 183,487 | 5,200,939 |
| Comerica, Inc. | | | | 167,706 | 6,389,599 |
| Communities First Financial Corp. (A) | | | | 115,523 | 2,633,924 |
| County Bancorp, Inc. | | | | 62,184 | 1,301,511 |
| Cullen/Frost Bankers, Inc. (B)(C) | | | | 158,225 | 11,820,990 |
| Eagle Bancorp Montana, Inc. | | | | 82,912 | 1,441,011 |
| East West Bancorp, Inc. (B) | | | | 43,408 | 1,573,106 |
| Equity Bancshares, Inc., Class A (A) | | | | 130,915 | 2,283,158 |
| Evans Bancorp, Inc. | | | | 69,760 | 1,622,618 |
| SEE NOTES TO FINANCIAL STATEMENTS | SEMIANNUAL REPORT | JOHN HANCOCK FINANCIAL OPPORTUNITIES FUND | 5 |
| | | | | Shares | Value |
| Financials (continued) | | | | | |
| Banks (continued) | | |
| Fifth Third Bancorp | | | | 579,289 | $11,168,692 |
| First Business Financial Services, Inc. | | | | 60,700 | 998,515 |
| First Community Corp. | | | | 132,912 | 2,013,617 |
| First Financial Bancorp (B)(C) | | | | 403,431 | 5,603,657 |
| First Horizon National Corp. (B)(C) | | | | 251,215 | 2,502,101 |
| First Merchants Corp. | | | | 114,010 | 3,143,256 |
| First Mid Bancshares, Inc. | | | | 28,496 | 747,450 |
| FNB Corp. | | | | 621,243 | 4,659,323 |
| German American Bancorp, Inc. | | | | 110,169 | 3,426,256 |
| Glacier Bancorp, Inc. | | | | 82,643 | 2,916,471 |
| Great Southern Bancorp, Inc. | | | | 40,257 | 1,624,773 |
| Great Western Bancorp, Inc. | | | | 141,778 | 1,950,865 |
| Hancock Whitney Corp. | | | | 263,808 | 5,592,730 |
| HBT Financial, Inc. | | | | 135,117 | 1,801,110 |
| Heritage Commerce Corp. | | | | 519,533 | 3,899,095 |
| Heritage Financial Corp. | | | | 161,533 | 3,230,660 |
| Horizon Bancorp, Inc. | | | | 429,365 | 4,589,912 |
| Howard Bancorp, Inc. (A) | | | | 156,530 | 1,662,349 |
| Huntington Bancshares, Inc. | | | | 672,537 | 6,076,372 |
| Independent Bank Corp. (Massachusetts) (B)(C) | | | | 59,430 | 3,987,159 |
| Independent Bank Corp. (Michigan) | | | | 125,407 | 1,862,294 |
| JPMorgan Chase & Co. (B)(C) | | | | 139,331 | 13,105,474 |
| KeyCorp | | | | 827,532 | 10,079,340 |
| Level One Bancorp, Inc. | | | | 68,719 | 1,150,356 |
| Live Oak Bancshares, Inc. (B)(C) | | | | 100,017 | 1,451,247 |
| M&T Bank Corp. | | | | 110,578 | 11,496,795 |
| Mackinac Financial Corp. | | | | 72,333 | 750,093 |
| Metrocity Bankshares, Inc. | | | | 65,263 | 935,219 |
| MidWestOne Financial Group, Inc. | | | | 38,224 | 764,480 |
| Nicolet Bankshares, Inc. (A) | | | | 49,538 | 2,714,682 |
| Northrim BanCorp, Inc. | | | | 97,720 | 2,456,681 |
| Old National Bancorp (B)(C) | | | | 364,040 | 5,009,190 |
| Old Second Bancorp, Inc. | | | | 305,694 | 2,378,299 |
| Pacific Premier Bancorp, Inc. (B)(C) | | | | 285,177 | 6,182,637 |
| PacWest Bancorp | | | | 201,725 | 3,976,000 |
| Park National Corp. (B)(C) | | | | 30,072 | 2,116,467 |
| Peoples Bancorp, Inc. | | | | 122,945 | 2,616,270 |
| Pinnacle Financial Partners, Inc. (B)(C) | | | | 126,415 | 5,308,166 |
| Prime Meridian Holding Company | | | | 108,010 | 1,479,737 |
| QCR Holdings, Inc. | | | | 70,803 | 2,207,638 |
| Red River Bancshares, Inc. | | | | 8,993 | 394,703 |
| Regions Financial Corp. | | | | 703,904 | 7,827,412 |
| 6 | JOHN HANCOCK FINANCIAL OPPORTUNITIES FUND | SEMIANNUAL REPORT | SEE NOTES TO FINANCIAL STATEMENTS |
| | | | | Shares | Value |
| Financials (continued) | | | | | |
| Banks (continued) | | |
| Renasant Corp. | | | | 185,399 | $4,616,435 |
| SB Financial Group, Inc. | | | | 247,702 | 4,116,807 |
| Shore Bancshares, Inc. | | | | 183,579 | 2,035,891 |
| South Atlantic Bancshares, Inc. (A) | | | | 289,568 | 2,490,285 |
| South State Corp. | | | | 29,868 | 1,423,509 |
| Southern First Bancshares, Inc. (A) | | | | 131,586 | 3,646,248 |
| Stock Yards Bancorp, Inc. | | | | 94,346 | 3,792,709 |
| Synovus Financial Corp. | | | | 230,856 | 4,739,474 |
| TCF Financial Corp. (B)(C) | | | | 258,153 | 7,594,861 |
| The Community Financial Corp. | | | | 50,699 | 1,237,056 |
| The First Bancorp, Inc. | | | | 245,664 | 5,330,909 |
| The First Bancshares, Inc. | | | | 210,000 | 4,725,000 |
| The First of Long Island Corp. | | | | 52,561 | 858,847 |
| The PNC Financial Services Group, Inc. (B)(C) | | | | 129,013 | 13,573,459 |
| TriCo Bancshares | | | | 194,071 | 5,909,462 |
| Truist Financial Corp. (B) | | | | 355,146 | 13,335,732 |
| U.S. Bancorp (B) | | | | 305,283 | 11,240,520 |
| United Bancorporation of Alabama, Inc., Class A | | | | 150,000 | 3,045,000 |
| United Bankshares, Inc. (B)(C) | | | | 147,123 | 4,069,422 |
| United Community Banks, Inc. | | | | 86,702 | 1,744,444 |
| Washington Trust Bancorp, Inc. | | | | 123,905 | 4,057,889 |
| Zions Bancorp NA (B)(C) | | | | 346,871 | 11,793,614 |
| Capital markets 10.2% | | |
| Ares Management Corp., Class A | | | | 217,118 | 8,619,585 |
| Golub Capital BDC, Inc. | | | | 106,097 | 1,236,030 |
| Invesco, Ltd. (B)(C) | | | | 114,189 | 1,228,667 |
| KKR & Company, Inc. (B)(C) | | | | 355,776 | 10,986,363 |
| Oaktree Specialty Lending Corp. (B)(C) | | | | 837,762 | 3,744,796 |
| Sixth Street Specialty Lending, Inc. (B)(C) | | | | 168,379 | 2,776,570 |
| The Blackstone Group, Inc., Class A (B)(C) | | | | 209,677 | 11,880,299 |
| Consumer finance 0.6% | | |
| Discover Financial Services (B) | | | | 45,454 | 2,276,791 |
| Diversified financial services 1.0% | | |
| Eurazeo SE (A) | | | | 25,969 | 1,334,440 |
| Onex Corp. | | | | 58,449 | 2,640,452 |
| Insurance 0.3% | | |
| Assured Guaranty, Ltd. (B) | | | | 41,862 | 1,021,851 |
| Thrifts and mortgage finance 5.3% | | |
| OP Bancorp | | | | 170,717 | 1,177,947 |
| Premier Financial Corp. (B)(C) | | | | 456,779 | 8,071,285 |
| Provident Financial Holdings, Inc. | | | | 97,339 | 1,305,316 |
| SEE NOTES TO FINANCIAL STATEMENTS | SEMIANNUAL REPORT | JOHN HANCOCK FINANCIAL OPPORTUNITIES FUND | 7 |
| | | | | Shares | Value |
| Financials (continued) | | | | | |
| Thrifts and mortgage finance (continued) | | |
| Southern Missouri Bancorp, Inc. | | | | 101,900 | $2,476,170 |
| Westbury Bancorp, Inc. (A) | | | | 88,349 | 1,700,718 |
| WSFS Financial Corp. | | | | 222,599 | 6,388,591 |
| Information technology 0.8% | | | | | 3,221,918 |
| IT services 0.8% | | |
| EVERTEC, Inc. (B)(C) | | | | 114,659 | 3,221,918 |
| Real estate 1.4% | | | | | 5,485,910 |
| Equity real estate investment trusts 1.4% | | |
| Park Hotels & Resorts, Inc. (B) | | | | 50,154 | 496,023 |
| Plymouth Industrial REIT, Inc. | | | | 179,294 | 2,294,963 |
|
| Simon Property Group, Inc. (B)(C) | | | | 39,411 | 2,694,924 |
| Preferred securities 2.7% (2.1% of Total investments) | | $10,887,301 |
| (Cost $14,002,150) | | | | | |
| Financials 2.1% | | | | | 8,552,999 |
| Banks 1.5% | |
| Atlantic Union Bankshares Corp., 6.875% | | 57,500 | 1,434,625 |
| Pinnacle Financial Partners, Inc., 6.750% | | 71,825 | 1,866,014 |
| Tectonic Financial, Inc. (9.000% to 5-15-24, then 3 month LIBOR + 6.720%) | | 186,840 | 1,354,590 |
| United Community Banks, Inc., 6.875% (B)(C) | | 57,500 | 1,412,200 |
| Mortgage real estate investment trusts 0.6% | |
| Invesco Mortgage Capital, Inc. (7.750% to 12-27-24, then 3 month LIBOR + 5.180%) | | 121,425 | 2,485,570 |
| Real estate 0.6% | | | | | 2,334,302 |
| Equity real estate investment trusts 0.6% | |
| Bluerock Residential Growth REIT, Inc., 8.250% | | 47,315 | 1,132,721 |
| Sotherly Hotels, Inc., 8.000% | | 60,000 | 537,000 |
| Sotherly Hotels, Inc., 8.250% | | 70,625 | 664,581 |
|
| | Rate (%) | Maturity date | | Par value^ | Value |
| Convertible bonds 0.8% (0.6% of Total investments) | | $3,095,494 |
| (Cost $3,390,000) | | | | | |
| Financials 0.8% | | | | 3,095,494 |
| Insurance 0.8% | | | |
|
| AXA SA (B)(F) | 7.250 | 05-15-21 | | 3,390,000 | 3,095,494 |
| Certificate of deposit 0.0% (0.0% of Total investments) | $79,954 |
| (Cost $79,954) | | | | | |
| Country Bank for Savings | 1.140 | 08-27-20 | | 2,056 | 2,056 |
| Eastern Savings Bank FSB | 0.200 | 04-22-21 | | 1,954 | 1,954 |
| First Bank Richmond NA | 1.250 | 12-05-22 | | 21,642 | 21,642 |
| First Federal of Northern Michigan | 0.100 | 01-07-21 | | 3,051 | 3,051 |
| 8 | JOHN HANCOCK FINANCIAL OPPORTUNITIES FUND | SEMIANNUAL REPORT | SEE NOTES TO FINANCIAL STATEMENTS |
| | Rate (%) | Maturity date | | Par value^ | Value |
|
| First National Bank | 0.400 | 12-17-20 | | 1,354 | $1,354 |
| Home National Bank | 1.739 | 11-04-21 | | 18,927 | 18,927 |
| Hudson United Bank | 0.800 | 04-23-21 | | 2,224 | 2,224 |
| Machias Savings Bank | 0.500 | 05-31-21 | | 2,006 | 2,006 |
| Milford Federal Bank | 0.300 | 10-26-20 | | 2,053 | 2,053 |
| Milford Federal Bank | 0.250 | 06-10-21 | | 1,923 | 1,923 |
| Mount Washington Co-operative Bank | 0.650 | 11-01-21 | | 1,925 | 1,925 |
| Mt. McKinley Bank | 0.500 | 12-03-20 | | 1,717 | 1,717 |
| MutualOne Bank | 2.020 | 09-09-21 | | 4,097 | 4,097 |
| Newburyport Five Cents Savings Bank | 0.700 | 10-19-20 | | 2,122 | 2,122 |
| Newtown Savings Bank | 0.450 | 06-01-21 | | 1,982 | 1,982 |
| Rosedale Federal Savings & Loan Association | 0.500 | 06-01-21 | | 2,040 | 2,040 |
| Salem Five Bancorp | 0.250 | 12-17-20 | | 1,739 | 1,739 |
| Sunshine Federal Savings and Loan Association | 0.500 | 05-10-21 | | 2,066 | 2,066 |
| U.S. Bancorp | 0.600 | 04-05-21 | | 5,076 | 5,076 |
| | Yield* (%) | Maturity date | | Par value^ | Value |
| Short-term investments 3.1% (2.4% of Total investments) | $12,073,887 |
| (Cost $12,073,962) | | | | | |
| U.S. Government Agency 1.1% | | | | | 4,228,887 |
| Federal Home Loan Bank Discount Note | 0.040 | 07-09-20 | | 4,229,000 | 4,228,887 |
��
| | | | | Par value^ | Value |
| Repurchase agreement 2.0% | | | | | 7,845,000 |
| Repurchase Agreement with State Street Corp. dated 6-30-20 at 0.000% to be repurchased at $7,845,000 on 7-1-20, collateralized by $7,983,400 U.S. Treasury Notes, 0.250% due 6-15-23 (valued at $8,001,997) | | | | 7,845,000 | 7,845,000 |
|
| Total investments (Cost $448,368,962) 129.9% | | | $513,850,749 |
| Other assets and liabilities, net (29.9%) | | | (118,173,079) |
| Total net assets 100.0% | | | $395,677,670 |
| The percentage shown for each investment category is the total value of the category as a percentage of the net assets of the fund unless otherwise indicated. |
| ^All par values are denominated in U.S. dollars unless otherwise indicated. |
| Security Abbreviations and Legend |
| LIBOR | London Interbank Offered Rate |
| (A) | Non-income producing security. |
| (B) | All or a portion of this security is pledged as collateral pursuant to the Liquidity Agreement. Total collateral value at 6-30-20 was $143,385,997. A portion of the securities pledged as collateral were loaned pursuant to the Liquidity Agreement. The value of securities on loan amounted to $104,005,798. |
| (C) | All or a portion of this security is on loan as of 6-30-20, and is a component of the fund's leverage under the Liquidity Agreement. |
| (D) | Restricted security as to resale, excluding 144A securities. For more information on this security refer to the Notes to financial statements. |
| SEE NOTES TO FINANCIAL STATEMENTS | SEMIANNUAL REPORT | JOHN HANCOCK FINANCIAL OPPORTUNITIES FUND | 9 |
| (E) | Security is valued using significant unobservable inputs and is classified as Level 3 in the fair value hierarchy. Refer to Note 2 to the financial statements. |
| (F) | These securities are exempt from registration under Rule 144A of the Securities Act of 1933. Such securities may be resold, normally to qualified institutional buyers, in transactions exempt from registration. |
| * | Yield represents either the annualized yield at the date of purchase, the stated coupon rate or, for floating rate securities, the rate at period end. |
| 10 | JOHN HANCOCK FINANCIAL OPPORTUNITIES FUND | SEMIANNUAL REPORT | SEE NOTES TO FINANCIAL STATEMENTS |
DERIVATIVES
SWAPS
| Interest rate swaps |
Counterparty (OTC)/
Centrally cleared | Notional
amount | Currency | Payments
made | Payments
received | Fixed
payment
frequency | Floating
payment
frequency | Maturity
date | Unamortized
upfront
payment
paid
(received) | Unrealized
appreciation
(depreciation) | Value |
| Centrally cleared | 5,000,000 | USD | Fixed 1.594% | USD 3 Month LIBOR BBA(a) | Semi-Annual | Quarterly | Dec 2020 | — | $(32,257) | $(32,257) |
| Centrally cleared | 5,000,000 | USD | Fixed 1.790% | USD 3 Month LIBOR BBA(a) | Semi-Annual | Quarterly | Aug 2022 | — | (197,655) | (197,655) |
| Centrally cleared | 15,000,000 | USD | Fixed 1.220% | USD 3 Month LIBOR BBA(a) | Semi-Annual | Quarterly | Mar 2030 | — | (910,177) | (910,177) |
| Centrally cleared | 25,000,000 | USD | Fixed 1.136% | USD 3 Month LIBOR BBA(a) | Semi-Annual | Quarterly | Mar 2030 | — | (1,309,069) | (1,309,069) |
| Centrally cleared | 25,000,000 | USD | Fixed 1.077% | USD 3 Month LIBOR BBA(a) | Semi-Annual | Quarterly | Mar 2030 | — | (1,161,413) | (1,161,413) |
| | | | | | | | | — | $(3,610,571) | $(3,610,571) |
| (a) | At 6-30-20, the 3 month LIBOR was 0.302%. |
| Derivatives Currency Abbreviations |
| USD | U.S. Dollar |
| Derivatives Abbreviations |
| BBA | The British Banker's Association |
| LIBOR | London Interbank Offered Rate |
| OTC | Over-the-counter |
At 6-30-20, the aggregate cost of investments for federal income tax purposes was $448,571,254. Net unrealized appreciation aggregated to $61,668,924, of which $118,361,446 related to gross unrealized appreciation and $56,692,522 related to gross unrealized depreciation.
See Notes to financial statements regarding investment transactions and other derivatives information.
| SEE NOTES TO FINANCIAL STATEMENTS | SEMIANNUAL REPORT | JOHN HANCOCK FINANCIAL OPPORTUNITIES FUND | 11 |
STATEMENT OF ASSETS AND LIABILITIES 6-30-20 (unaudited)
| Assets | |
| Unaffiliated investments, at value (Cost $448,368,962) | $513,850,749 |
| Receivable for centrally cleared swaps | 3,706,176 |
| Cash | 726,241 |
| Foreign currency, at value (Cost $3,589) | 3,669 |
| Dividends and interest receivable | 1,241,555 |
| Receivable for investments sold | 1,316,726 |
| Receivable from affiliates | 66,035 |
| Other assets | 21,099 |
| Total assets | 520,932,250 |
| Liabilities | |
| Liquidity agreement | 125,000,000 |
| Interest payable | 81,644 |
| Payable to affiliates | |
| Administrative services fees | 114,653 |
| Trustees' fees | 441 |
| Other liabilities and accrued expenses | 57,842 |
| Total liabilities | 125,254,580 |
| Net assets | $395,677,670 |
| Net assets consist of | |
| Paid-in capital | $333,622,307 |
| Total distributable earnings (loss) | 62,055,363 |
| Net assets | $395,677,670 |
| |
| Net asset value per share | |
| Based on 18,720,290 shares of beneficial interest outstanding - unlimited number of shares authorized with no par value | $21.14 |
| 12 | JOHN HANCOCK Financial Opportunities Fund | SEMIANNUAL REPORT | SEE NOTES TO FINANCIAL STATEMENTS |
STATEMENT OF OPERATIONS For the six months ended 6-30-20 (unaudited)
| Investment income | |
| Dividends | $10,753,796 |
| Interest | 201,797 |
| Less foreign taxes withheld | (624) |
| Total investment income | 10,954,969 |
| Expenses | |
| Investment management fees | 3,337,895 |
| Interest expense | 938,323 |
| Administrative services fees | 747,997 |
| Transfer agent fees | 15,759 |
| Trustees' fees | 20,496 |
| Custodian fees | 42,718 |
| Printing and postage | 81,178 |
| Professional fees | 41,190 |
| Stock exchange listing fees | 11,819 |
| Other | 11,600 |
| Total expenses | 5,248,975 |
| Less expense reductions | (469,385) |
| Net expenses | 4,779,590 |
| Net investment income | 6,175,379 |
| Realized and unrealized gain (loss) | |
| Net realized gain (loss) on | |
| Unaffiliated investments and foreign currency transactions | 11,731,371 |
| Swap contracts | 224,963 |
| | 11,956,334 |
| Change in net unrealized appreciation (depreciation) of | |
| Unaffiliated investments and translation of assets and liabilities in foreign currencies | (278,989,582) |
| Swap contracts | (3,585,804) |
| | (282,575,386) |
| Net realized and unrealized loss | (270,619,052) |
| Decrease in net assets from operations | $(264,443,673) |
| SEE NOTES TO FINANCIAL STATEMENTS | SEMIANNUAL REPORT | JOHN HANCOCK Financial Opportunities Fund | 13 |
STATEMENTS OF CHANGES IN NET ASSETS
| | Six months ended
6-30-20
(unaudited) | Year ended
12-31-19 |
| Increase (decrease) in net assets | | |
| From operations | | |
| Net investment income | $6,175,379 | $9,428,160 |
| Net realized gain | 11,956,334 | 32,879,416 |
| Change in net unrealized appreciation (depreciation) | (282,575,386) | 135,538,454 |
| Increase (decrease) in net assets resulting from operations | (264,443,673) | 177,846,030 |
| Distributions to shareholders | | |
| From earnings | (20,560,676) | (41,109,769) |
| Total distributions | (20,560,676) | (41,109,769) |
| Fund share transactions | | |
| Issued pursuant to Dividend Reinvestment Plan | 627,171 | 665,138 |
| Total increase (decrease) | (284,377,178) | 137,401,399 |
| Net assets | | |
| Beginning of period | 680,054,848 | 542,653,449 |
| End of period | $395,677,670 | $680,054,848 |
| Share activity | | |
| Shares outstanding | | |
| Beginning of period | 18,691,524 | 18,670,462 |
| Issued pursuant to Dividend Reinvestment Plan | 28,766 | 21,062 |
| End of period | 18,720,290 | 18,691,524 |
| 14 | JOHN HANCOCK Financial Opportunities Fund | SEMIANNUAL REPORT | SEE NOTES TO FINANCIAL STATEMENTS |
STATEMENT OF CASH FLOWS For the six months ended 6-30-20 (unaudited)
| | |
| Cash flows from operating activities | |
| Net decrease in net assets from operations | $(264,443,673) |
| Adjustments to reconcile net decrease in net assets from operations to net cash provided by operating activities: | |
| Long-term investments purchased | (22,016,342) |
| Long-term investments sold | 58,061,489 |
| Net purchases and sales in short-term investments | (13,259,646) |
| Net amortization of premium (discount) | (10,948) |
| (Increase) Decrease in assets: | |
| Receivable for centrally cleared swaps | (3,648,733) |
| Foreign currency, at value | (3,669) |
| Dividends and interest receivable | 254,362 |
| Receivable for investments sold | (1,316,726) |
| Receivable from affiliates | 35,579 |
| Other assets | (10,602) |
| Increase (Decrease) in liabilities: | |
| Interest payable | (171,671) |
| Payable to affiliates | (54,633) |
| Other liabilities and accrued expenses | (13,550) |
| Net change in unrealized (appreciation) depreciation on: | |
| Investments | 278,989,662 |
| Net realized (gain) loss on: | |
| Investments | (11,731,734) |
| Net cash provided by operating activities | $20,659,165 |
| Cash flows provided by (used in) financing activities | |
| Distributions to shareholders | $(19,933,505) |
| Net cash used in financing activities | $(19,933,505) |
| Net increase in cash | $725,660 |
| Cash at beginning of period | $581 |
| Cash at end of period | $726,241 |
| Supplemental disclosure of cash flow information: | |
| Cash paid for interest | $(1,109,994) |
| Noncash financing activities not included herein consists of reinvestment distributions | $627,171 |
| SEE NOTES TO FINANCIAL STATEMENTS | SEMIANNUAL REPORT | JOHN HANCOCK Financial Opportunities Fund | 15 |
| Period ended | 6-30-20 1 | 12-31-19 | 12-31-18 | 12-31-17 | 12-31-16 | 12-31-15 2 | 10-31-15 |
| Per share operating performance | | | | | | | |
| Net asset value, beginning of period | $36.38 | $29.06 | $36.94 | $34.98 | $26.17 | $26.00 | $25.19 |
| Net investment income3 | 0.33 | 0.50 | 0.39 | 0.37 | 0.50 | 0.10 | 0.52 4 |
| Net realized and unrealized gain (loss) on investments | (14.47) | 9.02 | (6.61) | 3.07 | 9.79 | 0.44 | 1.55 |
| Total from Investment operations | (14.14) | 9.52 | (6.22) | 3.44 | 10.29 | 0.54 | 2.07 |
| Less distributions | | | | | | | |
| From net investment income | (1.10) | (0.48) | (0.40) | (0.42) | (0.40) | (0.10) | (0.47) |
| From net realized gain | — | (1.72) | (1.26) | (1.06) | (1.08) | (0.27) | (0.79) |
| Total distributions | (1.10) | (2.20) | (1.66) | (1.48) | (1.48) | (0.37) | (1.26) |
| Anti-dilutive impact of repurchase plan | — | — | — | — | — 5,6 | — | — |
| Net asset value, end of period | $21.14 | $36.38 | $29.06 | $36.94 | $34.98 | $26.17 | $26.00 |
| Per share market value, end of period | $22.95 | $36.30 | $27.93 | $39.33 | $36.27 | $28.03 | $26.77 |
| Total return at net asset value (%)7,8 | (38.60) 9 | 33.71 | (17.42) | 10.08 | 41.10 | 2.05 9 | 8.60 |
| Total return at market value (%)7 | (33.16) 9 | 38.81 | (25.46) | 13.03 | 36.60 | 6.16 9 | 22.63 |
| Ratios and supplemental data | | | | | | | |
| Net assets, end of period (in millions) | $396 | $680 | $543 | $689 | $651 | $486 | $482 |
| Ratios (as a percentage of average net assets): | | | | | | | |
| Expenses before reductions | 2.23 10 | 2.27 | 2.04 | 1.93 | 2.02 | 2.02 10 | 1.99 |
| Expenses including reductions11 | 2.03 10 | 2.08 | 1.86 | 1.75 | 1.82 | 1.83 10 | 1.80 |
| Net investment income | 2.63 10 | 1.52 | 1.04 | 1.07 | 1.88 | 2.15 10 | 2.03 4 |
| Portfolio turnover (%) | 4 | 13 | 11 | 5 | 11 | 2 | 18 |
| Senior securities | | | | | | | |
| Total debt outstanding end of period (in millions) | $125 | $125 | $120 | $110 | $110 | $110 | $110 |
| Asset coverage per $1,000 of debt12 | $4,165 | $6,440 | $5,522 | $7,265 | $6,922 | $5,419 | $5,385 |
| 16 | JOHN HANCOCK Financial Opportunities Fund | SEMIANNUAL REPORT | SEE NOTES TO FINANCIAL STATEMENTS |
| 1 | Six months ended 6-30-20. Unaudited. |
| 2 | For the two-month period ended 12-31-15. The fund changed its fiscal year end from October 31 to December 31. |
| 3 | Based on average daily shares outstanding. |
| 4 | Net investment income (loss) per share and ratio of net investment income (loss) to average net assets reflect a special dividend received by the fund, which amounted to $0.04 and 0.15%, respectively. |
| 5 | Less than $0.005 per share. |
| 6 | The repurchase plan was completed at an average repurchase price of $20.79 for 10,000 shares for the period ended 12-31-16. |
| 7 | Total return based on net asset value reflects changes in the fund’s net asset value during each period. Total return based on market value reflects changes in market value. Each figure assumes that distributions from income, capital gains and tax return of capital, if any, were reinvested. |
| 8 | Total returns would have been lower had certain expenses not been reduced during the applicable periods. |
| 9 | Not annualized. |
| 10 | Annualized. |
| 11 | Expenses including reductions excluding interest expense were 1.63% (annualized), 1.50%, 1.44%, 1.45%, 1.58%, 1.63% (annualized) and 1.62% for the periods ended 6-30-20, 12-31-19, 12-31-18, 12-31-17, 12-31-16, 12-31-15 and 10-31-15, respectively. |
| 12 | Asset coverage equals the total net assets plus borrowings divided by the borrowings of the fund outstanding at period end (Note 8). As debt outstanding changes, the level of invested assets may change accordingly. Asset coverage ratio provides a measure of leverage. |
| SEE NOTES TO FINANCIAL STATEMENTS | SEMIANNUAL REPORT | JOHN HANCOCK Financial Opportunities Fund | 17 |
Notes to financial statements (unaudited)
Note 1—Organization
John Hancock Financial Opportunities Fund (the fund) is a closed-end management investment company organized as a Massachusetts business trust and registered under the Investment Company Act of 1940, as amended (the 1940 Act).
Note 2—Significant accounting policies
The financial statements have been prepared in conformity with accounting principles generally accepted in the United States of America (US GAAP), which require management to make certain estimates and assumptions as of the date of the financial statements. Actual results could differ from those estimates and those differences could be significant. The fund qualifies as an investment company under Topic 946 of Accounting Standards Codification of US GAAP.
Events or transactions occurring after the end of the fiscal period through the date that the financial statements were issued have been evaluated in the preparation of the financial statements. The following summarizes the significant accounting policies of the fund:
Security valuation. Investments are stated at value as of the scheduled close of regular trading on the New York Stock Exchange (NYSE), normally at 4:00 P.M., Eastern Time. In case of emergency or other disruption resulting in the NYSE not opening for trading or the NYSE closing at a time other than the regularly scheduled close, the net asset value (NAV) may be determined as of the regularly scheduled close of the NYSE pursuant to the fund's Valuation Policies and Procedures.
In order to value the securities, the fund uses the following valuation techniques: Equity securities, including exchange-traded or closed-end funds, are typically valued at the last sale price or official closing price on the exchange or principal market where the security trades. In the event there were no sales during the day or closing prices are not available, the securities are valued using the last available bid price. Debt obligations are typically valued based on evaluated prices provided by an independent pricing vendor. Independent pricing vendors utilize matrix pricing, which takes into account factors such as institutional-size trading in similar groups of securities, yield, quality, coupon rate, maturity, type of issue, trading characteristics and other market data, as well as broker supplied prices. Swaps are generally valued using evaluated prices obtained from an independent pricing vendor. Foreign securities and currencies are valued in U.S. dollars based on foreign currency exchange rates supplied by an independent pricing vendor.
In certain instances, the Pricing Committee may determine to value equity securities using prices obtained from another exchange or market if trading on the exchange or market on which prices are typically obtained did not open for trading as scheduled, or if trading closed earlier than scheduled, and trading occurred as normal on another exchange or market.
Other portfolio securities and assets, for which reliable market quotations are not readily available, are valued at fair value as determined in good faith by the fund's Pricing Committee following procedures established by the Board of Trustees. The frequency with which these fair valuation procedures are used cannot be predicted and fair value of securities may differ significantly from the value that would have been used had a ready market for such securities existed. Trading in foreign securities may be completed before the scheduled daily close of trading on the NYSE. Significant events at the issuer or market level may affect the values of securities between the time when the valuation of the securities is generally determined and the close of the NYSE. If a significant event occurs, these securities may be fair valued, as determined in good faith by the fund's Pricing Committee, following procedures established by the Board of Trustees. The fund uses fair value adjustment factors provided by an independent pricing vendor to value certain foreign securities in order to adjust for events that may occur between the close of foreign exchanges or markets and the close of the NYSE.
The fund uses a three-tier hierarchy to prioritize the pricing assumptions, referred to as inputs, used in valuation techniques to measure fair value. Level 1 includes securities valued using quoted prices in active markets for identical securities, including registered investment companies. Level 2 includes securities valued using other
| 18 | JOHN HANCOCK Financial Opportunities Fund | SEMIANNUAL REPORT | |
significant observable inputs. Observable inputs may include quoted prices for similar securities, interest rates, prepayment speeds and credit risk. Prices for securities valued using these inputs are received from independent pricing vendors and brokers and are based on an evaluation of the inputs described. Level 3 includes securities valued using significant unobservable inputs when market prices are not readily available or reliable, including the fund's own assumptions in determining the fair value of investments. Factors used in determining value may include market or issuer specific events or trends, changes in interest rates and credit quality. The inputs or methodology used for valuing securities are not necessarily an indication of the risks associated with investing in those securities. Changes in valuation techniques and related inputs may result in transfers into or out of an assigned level within the disclosure hierarchy.
The following is a summary of the values by input classification of the fund's investments as of June 30, 2020, by major security category or type:
| | Total
value at
6-30-20 | Level 1
quoted
price | Level 2
significant
observable
inputs | Level 3
significant
unobservable
inputs |
| Investments in securities: | | |
| Assets | | | | |
| Common stocks | | | | |
| Financials | | | | |
| Banks | $410,140,414 | $404,379,348 | $3,225,231 | $2,535,835 |
| Capital markets | 40,472,310 | 40,472,310 | — | — |
| Consumer finance | 2,276,791 | 2,276,791 | — | — |
| Diversified financial services | 3,974,892 | 2,640,452 | 1,334,440 | — |
| Insurance | 1,021,851 | 1,021,851 | — | — |
| Thrifts and mortgage finance | 21,120,027 | 21,120,027 | — | — |
| Information technology | | | | |
| IT services | 3,221,918 | 3,221,918 | — | — |
| Real estate | | | | |
| Equity real estate investment trusts | 5,485,910 | 5,485,910 | — | — |
| Preferred securities | 10,887,301 | 10,887,301 | — | — |
| Convertible bonds | 3,095,494 | — | 3,095,494 | — |
| Certificate of deposit | 79,954 | — | 79,954 | — |
| Short-term investments | 12,073,887 | — | 12,073,887 | — |
| Total investments in securities | $513,850,749 | $491,505,908 | $19,809,006 | $2,535,835 |
| Derivatives: | | | | |
| Liabilities | | | | |
| Swap contracts | $(3,610,571) | — | $(3,610,571) | — |
Repurchase agreements. The fund may enter into repurchase agreements. When the fund enters into a repurchase agreement, it receives collateral that is held in a segregated account by the fund's custodian, or for tri-party repurchase agreements, collateral is held at a third-party custodian bank in a segregated account for the benefit of the fund. The collateral amount is marked-to-market and monitored on a daily basis to ensure that the collateral held is in an amount not less than the principal amount of the repurchase agreement plus any accrued interest. Collateral received by the fund for repurchase agreements is disclosed in the Fund's investments as part of the caption related to the repurchase agreement.
Repurchase agreements are typically governed by the terms and conditions of the Master Repurchase Agreement
| | SEMIANNUAL REPORT | JOHN HANCOCK Financial Opportunities Fund | 19 |
and/or Global Master Repurchase Agreement (collectively, MRA). Upon an event of default, the non-defaulting party may close out all transactions traded under the MRA and net amounts owed. Absent an event of default, assets and liabilities resulting from repurchase agreements are not offset in the Statement of assets and liabilities. In the event of a default by the counterparty, realization of the collateral proceeds could be delayed, during which time the collateral value may decline or the counterparty may have insufficient assets to pay claims resulting from close-out of the transactions.
Real estate investment trusts. The fund may invest in real estate investment trusts (REITs). Distributions from REITs may be recorded as income and subsequently characterized by the REIT at the end of the fiscal year as a reduction of cost of investments and/or as a realized gain. As a result, the fund will estimate the components of distributions from these securities. Such estimates are revised when the actual components of the distributions are known.
Security transactions and related investment income. Investment security transactions are accounted for on a trade date plus one basis for daily NAV calculations. However, for financial reporting purposes, investment transactions are reported on trade date. Interest income is accrued as earned. Interest income includes coupon interest and amortization/accretion of premiums/discounts on debt securities. Debt obligations may be placed in a non-accrual status and related interest income may be reduced by stopping current accruals and writing off interest receivable when the collection of all or a portion of interest has become doubtful. Dividend income is recorded on the ex-date, except for dividends of certain foreign securities where the dividend may not be known until after the ex-date. In those cases, dividend income, net of withholding taxes, is recorded when the fund becomes aware of the dividends. Non-cash dividends, if any, are recorded at the fair market value of the securities received. Distributions received on securities that represent a tax return of capital and/or capital gain, if any, are recorded as a reduction of cost of investments and/or as a realized gain, if amounts are estimable. Gains and losses on securities sold are determined on the basis of identified cost and may include proceeds from litigation.
Foreign investing. Assets, including investments, and liabilities denominated in foreign currencies are translated into U.S. dollar values each day at the prevailing exchange rate. Purchases and sales of securities, income and expenses are translated into U.S. dollars at the prevailing exchange rate on the date of the transaction. The effect of changes in foreign currency exchange rates on the value of securities is reflected as a component of the realized and unrealized gains (losses) on investments. Foreign investments are subject to a decline in the value of a foreign currency versus the U.S. dollar, which reduces the dollar value of securities denominated in that currency.
Funds that invest internationally generally carry more risk than funds that invest strictly in U.S. securities. Risks can result from differences in economic and political conditions, regulations, market practices (including higher transaction costs), accounting standards and other factors.
Foreign taxes. The fund may be subject to withholding tax on income, capital gains or repatriation taxes imposed by certain countries, a portion of which may be recoverable. Foreign taxes are accrued based upon the fund's understanding of the tax rules and rates that exist in the foreign markets in which it invests. Taxes are accrued based on gains realized by the fund as a result of certain foreign security sales. In certain circumstances, estimated taxes are accrued based on unrealized appreciation of such securities. Investment income is recorded net of foreign withholding taxes.
Overdrafts. Pursuant to the custodian agreement, the fund’s custodian may, in its discretion, advance funds to the fund to make properly authorized payments. When such payments result in an overdraft, the fund is obligated to repay the custodian for any overdraft, including any costs or expenses associated with the overdraft. The custodian may have a lien, security interest or security entitlement in any fund property that is not otherwise segregated or pledged, to the maximum extent permitted by law, to the extent of any overdraft.
| 20 | JOHN HANCOCK Financial Opportunities Fund | SEMIANNUAL REPORT | |
Expenses. Within the John Hancock group of funds complex, expenses that are directly attributable to an individual fund are allocated to such fund. Expenses that are not readily attributable to a specific fund are allocated among all funds in an equitable manner, taking into consideration, among other things, the nature and type of expense and the fund’s relative net assets. Expense estimates are accrued in the period to which they relate and adjustments are made when actual amounts are known.
Statement of cash flows. A Statement of cash flows is presented when a fund has a significant amount of borrowing during the period, based on the average total borrowing in relation to total assets, or when a certain percentage of the fund’s investments is classified as Level 3 in the fair value hierarchy. Information on financial transactions that have been settled through the receipt and disbursement of cash is presented in the Statement of cash flows. The cash amount shown in the Statement of cash flows is the amount included in the fund’s Statement of assets and liabilities and represents the cash on hand at the fund’s custodian and does not include any short-term investments or collateral on derivative contracts, if any.
Federal income taxes. The fund intends to continue to qualify as a regulated investment company by complying with the applicable provisions of the Internal Revenue Code and will not be subject to federal income tax on taxable income that is distributed to shareholders. Therefore, no federal income tax provision is required.
As of December 31, 2019, the fund had no uncertain tax positions that would require financial statement recognition, derecognition or disclosure. The fund's federal tax returns are subject to examination by the Internal Revenue Service for a period of three years.
Managed distribution plan. The fund has adopted a managed distribution plan (Plan). Under the current Plan, the fund makes quarterly distributions of an amount equal to $0.5500 per share, which will be paid quarterly until further notice.
Distributions under the Plan may consist of net investment income, net realized capital gains and, to the extent necessary, return of capital. Return of capital distributions may be necessary when the fund’s net investment income and net capital gains are insufficient to meet the minimum distribution. In addition, the fund may also make additional distributions for the purpose of not incurring federal income and excise taxes.
The Board of Trustees may terminate or reduce the amount paid under the Plan at any time. The termination or reduction may have an adverse effect on the market price of the fund’s shares.
Distribution of income and gains. Distributions to shareholders from net investment income and net realized gains, if any, are recorded on the ex-date. The fund generally declares and pays dividends quarterly pursuant to the Managed Distribution Plan described above. Capital gain distributions, if any, are typically distributed annually.
Such distributions, on a tax basis, are determined in conformity with income tax regulations, which may differ from US GAAP. Distributions in excess of tax basis earnings and profits, if any, are reported in the fund's financial statements as a return of capital. The final determination of tax characteristics of the fund's distribution will occur at the end of the year and will subsequently be reported to shareholders.
Capital accounts within the financial statements are adjusted for permanent book-tax differences. These adjustments have no impact on net assets or the results of operations. Temporary book-tax differences, if any, will reverse in a subsequent period. The fund had no material book-tax differences at December 31, 2019.
Note 3—Derivative instruments
The fund may invest in derivatives in order to meet its investment objective. Derivatives include a variety of different instruments that may be traded in the over-the-counter (OTC) market, on a regulated exchange or through a clearing facility. The risks in using derivatives vary depending upon the structure of the instruments, including the use of leverage, optionality, the liquidity or lack of liquidity of the contract, the creditworthiness of the counterparty or clearing organization and the volatility of the position. Some derivatives involve risks that are potentially greater than the risks associated with investing directly in the referenced securities or other referenced
| | SEMIANNUAL REPORT | JOHN HANCOCK Financial Opportunities Fund | 21 |
underlying instrument. Specifically, the fund is exposed to the risk that the counterparty to an OTC derivatives contract will be unable or unwilling to make timely settlement payments or otherwise honor its obligations. OTC derivatives transactions typically can only be closed out with the other party to the transaction.
Certain derivatives are traded or cleared on an exchange or central clearinghouse. Exchange-traded or centrally-cleared transactions generally present less counterparty risk to a fund than OTC transactions. The exchange or clearinghouse stands between the fund and the broker to the contract and therefore, credit risk is generally limited to the failure of the exchange or clearinghouse and the clearing member.
Centrally-cleared swap contracts are subject to clearinghouse rules, including initial and variation margin requirements, daily settlement of obligations and the clearinghouse guarantee of payments to the broker. There is, however, still counterparty risk due to the potential insolvency of the broker with respect to any margin held in the brokers’ customer accounts. While clearing members are required to segregate customer assets from their own assets, in the event of insolvency, there may be a shortfall in the amount of margin held by the broker for its clients. Collateral or margin requirements for centrally-cleared derivatives are set by the broker or applicable clearinghouse. Margin for centrally-cleared transactions is detailed in the Statement of assets and liabilities as Receivable/Payable for centrally-cleared swaps. Securities pledged by the fund for centrally-cleared transactions, if any, are identified in the Fund's investments.
Swaps. Swap agreements are agreements between the fund and a counterparty to exchange cash flows, assets, foreign currencies or market-linked returns at specified intervals. Swap agreements are privately negotiated in the OTC market (OTC swaps) or may be executed on a registered commodities exchange (centrally cleared swaps). Swaps are marked-to-market daily and the change in value is recorded as a component of unrealized appreciation/depreciation of swap contracts. The value of the swap will typically impose collateral posting obligations on the party that is considered out-of-the-money on the swap.
Upfront payments made/received by the fund, if any, are amortized/accreted for financial reporting purposes, with the unamortized/unaccreted portion included in the Statement of assets and liabilities. A termination payment by the counterparty or the fund is recorded as realized gain or loss, as well as the net periodic payments received or paid by the fund.
Entering into swap agreements involves, to varying degrees, elements of credit, market and documentation risk that may provide outcomes that are in excess of the amounts recognized on the Statement of assets and liabilities. Such risks involve the possibility that there will be no liquid market for the swap, or that a counterparty may default on its obligation or delay payment under the swap terms. The counterparty may disagree or contest the terms of the swap. In addition to interest rate risk, market risks may also impact the swap. The fund may also suffer losses if it is unable to terminate or assign outstanding swaps or reduce its exposure through offsetting transactions.
Interest rate swaps. Interest rate swaps represent an agreement between the fund and a counterparty to exchange cash flows based on the difference between two interest rates applied to a notional amount. The payment flows are usually netted against each other, with the difference being paid by one party to the other. The fund settles accrued net interest receivable or payable under the swap contracts at specified, future intervals.
During the six months ended June 30, 2020, the fund used interest rate swap contracts to manage against anticipated interest rate changes. The fund held interest rate swaps with total USD notional amounts ranging from $10 million to $75 million as measured at each quarter end.
| 22 | JOHN HANCOCK Financial Opportunities Fund | SEMIANNUAL REPORT | |
Fair value of derivative instruments by risk category
The table below summarizes the fair value of derivatives held by the fund at June 30, 2020 by risk category:
| Risk | Statement of assets
and liabilities
location | Financial
instruments
location | Assets
derivatives
fair value | Liabilities
derivatives
fair value |
| Interest rate | Swap contracts, at value | Interest rate swaps1 | — | $(3,610,571) |
| 1 | Reflects cumulative value of swap contracts. Receivable/payable for centrally cleared swaps, which includes value and margin, are shown separately on the Statement of assets and liabilities. |
Effect of derivative instruments on the Statement of operations
The table below summarizes the net realized gain (loss) included in the net increase (decrease) in net assets from operations, classified by derivative instrument and risk category, for the six months ended June 30, 2020:
| | Statement of operations location - Net realized gain (loss) on: |
| Risk | Swap contracts |
| Interest rate | $224,963 |
The table below summarizes the net change in unrealized appreciation (depreciation) included in the net increase (decrease) in net assets from operations, classified by derivative instrument and risk category, for the six months ended June 30, 2020:
| | Statement of operations location - Change in net unrealized appreciation (depreciation) of: |
| Risk | Swap contracts |
| Interest rate | $(3,585,804) |
Note 4—Guarantees and indemnifications
Under the fund's organizational documents, its Officers and Trustees are indemnified against certain liabilities arising out of the performance of their duties to the fund. Additionally, in the normal course of business, the fund enters into contracts with service providers that contain general indemnification clauses. The fund's maximum exposure under these arrangements is unknown, as this would involve future claims that may be made against the fund that have not yet occurred. The risk of material loss from such claims is considered remote.
Note 5—Fees and transactions with affiliates
John Hancock Investment Management LLC (the Advisor) serves as investment advisor for the fund. The Advisor is an indirect, wholly owned subsidiary of Manulife Financial Corporation (MFC).
Management fee. The fund has an investment advisory agreement with the Advisor under which the fund pays a daily management fee to the Advisor, equivalent on an annual basis to the sum of (a) 1.15% of the first $500 million of the fund’s average daily gross assets, including the assets attributed to the Liquidity Agreement (see Note 8) (collectively, gross managed assets), and (b) 1.00% of the fund’s average daily gross managed assets in excess of $500 million. The Advisor has a subadvisory agreement with Manulife Investment Management (US) LLC, an indirectly owned subsidiary of MFC and an affiliate of the Advisor. The fund is not responsible for payment of the subadvisory fees.
| | SEMIANNUAL REPORT | JOHN HANCOCK Financial Opportunities Fund | 23 |
The Advisor has contractually agreed to waive a portion of its management fee and/or reimburse expenses for certain funds of the John Hancock group of funds complex, including the fund (the participating portfolios). This waiver is based upon aggregate net assets of all the participating portfolios. The amount of the reimbursement is calculated daily and allocated among all the participating portfolios in proportion to the daily net assets of each fund. During the six months ended June 30, 2020, this waiver amounted to 0.01% of the fund’s average daily net assets on an annualized basis. This arrangement expires on July 31, 2022, unless renewed by mutual agreement of the fund and the Advisor based upon a determination that this is appropriate under the circumstances at that time.
The expense reductions described above amounted to $20,587 for the six months ended June 30, 2020.
Expenses waived or reimbursed in the current fiscal period are not subject to recapture in future fiscal periods.
The investment management fees, including the impact of the waivers and reimbursements as described above, incurred for the six months ended June 30, 2020, were equivalent to a net annual effective rate of 1.12% of the fund's average daily managed assets.
Administrative services. The fund has an administration agreement with the Advisor under which the Advisor provides certain administrative services to the fund and oversees operational activities of the fund. The compensation for the period was at an annual rate of 0.25% of the average weekly gross managed assets of the fund. The Advisor agreed to limit the administrative services fee to 0.10% of the fund’s average weekly gross assets. Accordingly, the expense reductions related to administrative services fees amounted to $448,798 for the six months ended June 30, 2020. The Advisor reserves the right to terminate this limitation in the future with the Trustees’ approval. The administrative services fees incurred for the six months ended June 30, 2020 amounted to an annual rate of 0.10% of the fund’s average weekly gross managed assets.
Trustee expenses. The fund compensates each Trustee who is not an employee of the Advisor or its affiliates. These Trustees receive from the fund and the other John Hancock closed-end funds an annual retainer. In addition, Trustee out-of-pocket expenses are allocated to each fund based on its net assets relative to other funds within the John Hancock group of funds complex.
Note 6—Fund share transactions
In May 2009, the Board of Trustees approved a share repurchase plan, which is subsequently reviewed and approved by the Board of Trustees each year in December. Under the current share repurchase plan, the fund may purchase in the open market, between January 1, 2020 and December 31, 2020, up to 10% of its outstanding common shares as of December 31, 2019. The current share repurchase plan will remain in effect between January 1, 2020 and December 31, 2020.
During the six months ended June 30, 2020 and the year ended December 31, 2019, the fund had no activities under the repurchase program. Shares repurchased and corresponding dollar amounts, if any, are included on the Statements of changes in net assets. The anti-dilutive impacts of these share repurchases are included on the Financial highlights.
Note 7—Leverage risk
The fund utilizes a Liquidity Agreement (LA) to increase its assets available for investment. When the fund leverages its assets, shareholders bear the expenses associated with the LA and have potential to benefit or be disadvantaged from the use of leverage. The Advisor’s fee is also increased in dollar terms from the use of leverage. Consequently, the fund and the Advisor may have differing interests in determining whether to leverage the fund’s assets. Leverage creates risks that may adversely affect the return for the holders of shares, including:
| • | the likelihood of greater volatility of NAV and market price of shares; |
| • | fluctuations in the interest rate paid for the use of the LA; |
| • | increased operating costs, which may reduce the fund’s total return;
|
| 24 | JOHN HANCOCK Financial Opportunities Fund | SEMIANNUAL REPORT | |
| • | the potential for a decline in the value of an investment acquired through leverage, while the fund’s obligations under such leverage remains fixed; and |
| • | the fund is more likely to have to sell securities in a volatile market in order to meet asset coverage or other debt compliance requirements. |
To the extent the income or capital appreciation derived from securities purchased with funds received from leverage exceeds the cost of leverage, the fund’s return will be greater than if leverage had not been used; conversely, returns would be lower if the cost of the leverage exceeds the income or capital appreciation derived. The use of securities lending to obtain leverage in the fund’s investments may subject the fund to greater risk of loss than would reinvestment of collateral in short term highly rated investments.
In addition to the risks created by the fund’s use of leverage, the fund is subject to the risk that it would be unable to timely, or at all, obtain replacement financing if the LA is terminated. Were this to happen, the fund would be required to de-leverage, selling securities at a potentially inopportune time and incurring tax consequences. Further, the fund’s ability to generate income from the use of leverage would be adversely affected.
Note 8—Liquidity Agreement
The fund has entered into a Liquidity Agreement (LA) with State Street Bank and Trust Company (SSB) that allows it to borrow or otherwise access up to $150 million (maximum facility amount) through a line of credit, securities lending and reverse repurchase agreements. The amounts outstanding at June 30, 2020 are shown in the Statement of assets and liabilities as the Liquidity agreement.
The fund pledges its assets as collateral to secure obligations under the LA. The fund retains the risks and rewards of the ownership of assets pledged to secure obligations under the LA and makes these assets available for securities lending and reverse repurchase transactions with SSB acting as the fund’s authorized agent for these transactions. All transactions initiated through SSB are required to be secured with cash collateral received from the securities borrower (the Borrower) or cash is received from the reverse repurchase agreement (Reverse Repo) counterparties. Securities lending transactions will be secured with cash collateral in amounts at least equal to 100% of the market value of the securities utilized in these transactions. Cash received by SSB from securities lending or Reverse Repo transactions is credited against the amounts borrowed under the line of credit.
Upon return of securities by the Borrower or Reverse Repo counterparty, SSB will return the cash collateral to the Borrower or proceeds from the Reverse Repo, as applicable, which will eliminate the credit against the line of credit and will cause the drawdowns under the line of credit to increase by the amounts returned. Income earned on the loaned securities is retained by SSB, and any interest due on the reverse repurchase agreements is paid by SSB.
SSB has indemnified the fund for certain losses that may arise if the Borrower or a Reverse Repo Counterparty fails to return securities when due. With respect to securities lending transactions, upon a default of the securities borrower, SSB uses the collateral received from the Borrower to purchase replacement securities of the same issue, type, class and series. If the value of the collateral is less than the purchase cost of replacement securities, SSB is responsible for satisfying the shortfall but only to the extent that the shortfall is not due to any of the fund’s losses on the reinvested cash collateral. Although the risk of the loss of the securities is mitigated by receiving collateral from the Borrower or proceeds from the Reverse Repo counterparty and through SSB indemnification, the fund could experience a delay in recovering securities or could experience a lower than expected return if the Borrower or Reverse Repo counterparty fails to return the securities on a timely basis.
Interest charged is at the rate of one month LIBOR (London Interbank Offered Rate) plus 0.600% and is payable monthly on the aggregate balance of the drawdowns outstanding under the LA. As of June 30, 2020, the fund had an aggregate balance of $125,000,000 at an interest rate of 0.76%, which is reflected in the Liquidity agreement on the Statement of assets and liabilities. During the six months ended June 30, 2020, the average balance of the LA and the effective average interest rate were $125,000,000 and 1.51%, respectively.
| | SEMIANNUAL REPORT | JOHN HANCOCK Financial Opportunities Fund | 25 |
The fund may terminate the LA with 60 days’ notice. If certain asset coverage and collateral requirements, or other covenants are not met, the LA could be deemed in default and result in termination. Absent a default or facility termination event, SSB is required to provide the fund with 360 days’ notice prior to terminating the LA.
Due to the anticipated discontinuation of LIBOR, as discussed in Note 9, the LA may be amended to remove LIBOR as the reference rate for interest and to replace LIBOR with an alternative reference rate for interest mutually agreed upon by the fund and SSB. However, there remains uncertainty regarding the future utilization of LIBOR and the nature of any replacement rate and the potential effect of a transition away from LIBOR on the fund and/or the LA cannot yet be fully determined.
Note 9—LIBOR Discontinuation Risk
The LA utilizes LIBOR as the reference or benchmark rate for interest rate calculations. LIBOR is a measure of the average interest rate at which major global banks can borrow from one another. Following allegations of rate manipulation and concerns regarding its thin liquidity, in July 2017, the U.K. Financial Conduct Authority, which regulates LIBOR, announced that it will stop encouraging banks to provide the quotations needed to sustain LIBOR after 2021. This event will likely cause LIBOR to cease to be published. Before then, it is expected that market participants such as the fund and SSB will transition to the use of different reference or benchmark rates. However, although regulators have suggested alternative rates, there is currently no definitive information regarding the future utilization of LIBOR or of any replacement rate.
It is uncertain what impact the discontinuation of LIBOR will have on the use of LIBOR as a reference rate in the LA. It is expected that market participants will amend financial instruments referencing LIBOR, such as the LA, to include fallback provisions and other measures that contemplate the discontinuation of LIBOR or other similar market disruption events, but neither the effect of the transition process nor the viability of such measures is known. In addition, there are obstacles to converting certain longer term securities and transactions to a new benchmark or benchmarks and the effectiveness of one alternative reference rate versus multiple alternative reference rates in new or existing financial instruments and products has not been determined. As market participants transition away from LIBOR, LIBOR's usefulness may deteriorate, which could occur prior to the end of 2021. The transition process may lead to increased volatility and illiquidity in markets that currently rely on LIBOR to determine interest rates. LIBOR's deterioration may adversely affect the liquidity and/or market value of securities that use LIBOR as a benchmark interest rate. The use of an alternative reference rate, or the transition process to an alternative reference rate, may result in increases to the interest paid by the fund pursuant to the LA and, therefore, may adversely affect the fund's performance.
Note 10—Purchase and sale of securities
Purchases and sales of securities, other than short-term investments, amounted to $22,016,342 and $58,061,489, respectively, for the six months ended June 30, 2020.
Note 11—Industry or sector risk
The fund generally invests a large percentage of its assets in one or more particular industries or sectors of the economy. If a large percentage of the fund's assets are economically tied to a single or small number of industries or sectors of the economy, the fund will be less diversified than a more broadly diversified fund, and it may cause the fund to underperform if that industry or sector underperforms. In addition, focusing on a particular industry or sector may make the fund’s NAV more volatile. Further, a fund that invests in particular industries or sectors is particularly susceptible to the impact of market, economic, regulatory and other factors affecting those industries or sectors. Financial services companies can be hurt by economic declines, changes in interest rates regulatory and market impacts.
| 26 | JOHN HANCOCK Financial Opportunities Fund | SEMIANNUAL REPORT | |
Note 12—Restricted securities
The fund may hold restricted securities which are restricted as to resale and the fund has limited rights to registration under the Securities Act of 1933. Disposal may involve time-consuming negotiations and expenses, and prompt sale at an acceptable price may be difficult to achieve. The following table summarizes the restricted securities held at June 30, 2020:
Issuer,
Description | Original
acquisition date | Acquisition
cost | Beginning
share
amount | Shares
purchased | Shares
sold | Ending
share
amount | Value as a
percentage of
net assets | Ending
value |
| Bremer Financial Corp. | 10-25-19 | $5,000,040 | 41,667 | — | — | 41,667 | 0.6% | $ 2,535,835 |
| Centric Financial Corp. | 5-22-18 | 2,543,750 | 275,000 | — | — | 275,000 | 0.5% | 1,745,494 |
| | | | | | | | | $4,281,329 |
Note 13—Coronavirus (COVID-19) pandemic
The novel COVID-19 disease has resulted in significant disruptions to global business activity. A widespread health crisis such as a global pandemic could cause substantial market volatility, exchange trading suspensions and closures, and affect fund performance.
| | SEMIANNUAL REPORT | JOHN HANCOCK Financial Opportunities Fund | 27 |
Additional information (Unaudited)
Investment objective and policy
The fund is a closed-end, diversified management investment company, shares of which were initially offered to the public in August 1994. The fund's investment objective is to provide a high level of total return consisting of long-term capital appreciation and current income. The fund utilizes a credit facility agreement to increase its assets available for investments.
Under normal circumstances, the fund will invest at least 80% of its net assets plus borrowings for investment purposes in equity securities of U.S. and foreign financial services companies of any size. These companies may include, but are not limited to, banks, thrifts, finance companies, brokerage and advisory firms, real estate-related firms, insurance companies and financial holding companies. The fund will notify shareholders at least 60 days prior to any change in this 80% policy.
The use of securities lending collateral to obtain leverage in the fund's investment portfolio may subject the fund to greater risk of loss than would reinvestment of collateral in short-term, highly-rated investments. Risks associated with the fund's use of leverage are discussed under Note 7 to the financial statements.
Dividends and distributions
During the six months ended June 30, 2020, distributions from net investment income totaling $1.1000 per share were paid to shareholders. The dates of payments and the amounts per share were as follows:
| | | | | | |
| | Payment date | | | Distributions | |
| | March 31, 2020 | | | $0.5500 | |
| | June 30, 2020 | | | 0.5500 | |
| | Total | | | $1.1000 | |
Shareholder meeting
The fund held its Annual Meeting of Shareholders on Monday, February 3, 2020. The following proposal was considered by the shareholders:
Proposal: To elect five (5) Trustees (James R. Boyle, William H. Cunningham, Grace K. Fey, Hassell H. McClellan and Gregory A. Russo) to serve for a three-year term ending at the 2023 Annual Meeting of Shareholders.
| | | |
| | Total votes
for the nominee | Total votes withheld
from the nominee |
| Independent Trustees | | |
| James R. Boyle | 15,179,766.104 | 290,564.135 |
| William H. Cunningham | 15,131,668.104 | 338,662.135 |
| Grace K. Fey | 15,111,414.157 | 358,916.082 |
| Hassell H. McClellan | 15,096,403.022 | 373,927.217 |
| Gregory A. Russo | 15,109,303.104 | 361,027.135 |
Trustees whose term of office continued after the Annual Meeting of Shareholders because they were not up for election are: Charles L. Bardelis, Peter S. Burgess, Marianne Harrison, Andrew G. Arnott, Deborah C. Jackson, James M. Oates and Steven R. Pruchansky.
SEMIANNUAL REPORT | JOHN HANCOCK FINANCIAL OPPORTUNITIES FUND 28
Continuation of Investment Advisory and Subadvisory Agreements
Evaluation of Advisory and Subadvisory Agreements by the Board of Trustees
This section describes the evaluation by the Board of Trustees (the Board) of John Hancock Financial Opportunities Fund (the fund) of the Advisory Agreement (the Advisory Agreement) with John Hancock Investment Management LLC (the Advisor)and the Subadvisory Agreement (the Subadvisory Agreement) with Manulife Investment Management (US) LLC (the Subadvisor). The Advisory Agreement and Subadvisory Agreement are collectively referred to as the Agreements. Prior to the June 23-25, 2020 telephonic1 meeting at which the Agreements were approved, the Board also discussed and considered information regarding the proposed continuation of the Agreements at the telephonic meeting held on May 26-27, 2020.
Approval of Advisory and Subadvisory Agreements
At telephonic meetings held on June 23-25, 2020, the Board, including the Trustees who are not parties to any Agreement or considered to be interested persons of the fund under the Investment Company Act of 1940, as amended (the 1940 Act) (the Independent Trustees), reapproved for an annual period the continuation of the Advisory Agreement between the fund and the Advisor and the Subadvisory Agreement between the Advisor and the Subadvisor with respect to the fund.
In considering the Advisory Agreement and the Subadvisory Agreement, the Board received in advance of the meetings a variety of materials relating to the fund, the Advisor and the Subadvisor, including comparative performance, fee and expense information for a peer group of similar funds prepared by an independent third-party provider of fund data, performance information for an applicable benchmark index; and other pertinent information, such as the market premium and discount information, and, with respect to the Subadvisor, comparative performance information for comparably managed accounts, as applicable, and other information provided by the Advisor and the Subadvisor regarding the nature, extent and quality of services provided by the Advisor and the Subadvisor under their respective Agreements, as well as information regarding the Advisor's revenues and costs of providing services to the fund and any compensation paid to affiliates of the Advisor. At the meetings at which the renewal of the Advisory Agreement and Subadvisory Agreement are considered, particular focus is given to information concerning fund performance, comparability of fees and total expenses, and profitability. However, the Board notes that the evaluation process with respect to the Advisor and the Subadvisor is an ongoing one. In this regard, the Board also took into account discussions with management and information provided to the Board (including its various committees) at prior meetings with respect to the services provided by the Advisor and the Subadvisor to the fund, including quarterly performance reports prepared by management containing reviews of investment results and prior presentations from the Subadvisor with respect to the fund. The information received and considered by the Board in connection with the May and June meetings and throughout the year was both written and oral. The Board noted the affiliation of the
____________________
1 On March 13, 2020, in response to health and safety measures put in place to combat the global COVID-19 pandemic, the Securities and Exchange Commission announced regulatory relief (the "Order") pursuant to Sections 6(c) and 38(a) of the Investment Company Act of 1940, as amended (the "1940 Act"), that temporarily exempts registered investment management companies from the requirements under the 1940 Act regarding in-person votes by the Board, subject to certain requirements, including that votes taken pursuant to the Order are ratified at the next in-person meeting. The Board's May and June meetings were held telephonically in reliance on the Order.
SEMIANNUAL REPORT | JOHN HANCOCK FINANCIAL OPPORTUNITIES FUND 29
Subadvisor with the Advisor, noting any potential conflicts of interest. The Board also considered the nature, quality, and extent of non-advisory services, if any, to be provided to the fund by the Advisor's affiliates. The Board considered the Advisory Agreement and the Subadvisory Agreement separately in the course of its review. In doing so, the Board noted the respective roles of the Advisor and Subadvisor in providing services to the fund.
Throughout the process, the Board asked questions of and requested additional information from management. The Board is assisted by counsel for the fund and the Independent Trustees are also separately assisted by independent legal counsel throughout the process. The Independent Trustees also received a memorandum from their independent legal counsel discussing the legal standards for their consideration of the proposed continuation of the Agreements and discussed the proposed continuation of the Agreements in private sessions with their independent legal counsel at which no representatives of management were present.
Approval of Advisory Agreement
In approving the Advisory Agreement with respect to the fund, the Board, including the Independent Trustees, considered a variety of factors, including those discussed below. The Board also considered other factors (including conditions and trends prevailing generally in the economy, the securities markets, and the industry) and did not treat any single factor as determinative, and each Trustee may have attributed different weights to different factors. The Board's conclusions may be based in part on its consideration of the advisory and subadvisory arrangements in prior years and on the Board's ongoing regular review of fund performance and operations throughout the year.
Nature, extent, and quality of services. Among the information received by the Board from the Advisor relating to the nature, extent, and quality of services provided to the fund, the Board reviewed information provided by the Advisor relating to its operations and personnel, descriptions of its organizational and management structure, and information regarding the Advisor's compliance and regulatory history, including its Form ADV. The Board also noted that on a regular basis it receives and reviews information from the fund's Chief Compliance Officer (CCO) regarding the fund's compliance policies and procedures established pursuant to Rule 38a-1 under the 1940 Act. The Board observed that the scope of services provided by the Advisor, and of the undertakings required of the Advisor in connection with those services, including maintaining and monitoring its own and the fund's compliance programs, risk management programs, liquidity management programs and cybersecurity programs, had expanded over time as a result of regulatory, market and other developments. The Board considered that the Advisor is responsible for the management of the day-to-day operations of the fund, including, but not limited to, general supervision of and coordination of the services provided by the Subadvisor, and is also responsible for monitoring and reviewing the activities of the Subadvisor and third-party service providers. The Board also considered the significant risks assumed by the Advisor in connection with the services provided to the fund including entrepreneurial risk in sponsoring new funds and ongoing risks including investment, operational, enterprise, litigation, regulatory and compliance risk with respect to all funds.
The Board also considered the differences between the Advisor's services to the fund and the services it provides to other clients that are not closed-end funds, including, for example, the differences in services related to the regulatory and legal obligations of closed-end funds.
In considering the nature, extent, and quality of the services provided by the Advisor, the Trustees also took into account their knowledge of the Advisor's management and the quality of the performance of the Advisor's duties, through Board meetings, discussions and reports during the preceding year and through each Trustee's experience as a Trustee of the fund and of the other funds in the John Hancock group of funds complex (the John Hancock Fund Complex).
SEMIANNUAL REPORT | JOHN HANCOCK FINANCIAL OPPORTUNITIES FUND 30
In the course of their deliberations regarding the Advisory Agreement, the Board considered, among other things:
| (a) | the skills and competency with which the Advisor has in the past managed the fund's affairs and its subadvisory relationship, the Advisor's oversight and monitoring of the Subadvisor's investment performance and compliance programs, such as the Subadvisor's compliance with fund policies and objectives, review of brokerage matters, including with respect to trade allocation and best execution and the Advisor's timeliness in responding to performance issues; |
| (b) | the background, qualifications and skills of the Advisor's personnel; |
| (c) | the Advisor's compliance policies and procedures and its responsiveness to regulatory changes and fund industry developments; |
| (d) | the Advisor's administrative capabilities, including its ability to supervise the other service providers for the fund, as well as the Advisor's oversight of any securities lending activity, its monitoring of class action litigation and collection of class action settlements on behalf of the fund, and bringing loss recovery actions on behalf of the fund; |
| (e) | the financial condition of the Advisor and whether it has the financial wherewithal to provide a high level and quality of services to the fund; |
| (f) | the Advisor's initiatives intended to improve various aspects of the fund's operations and investor experience with the fund; and |
| (g) | the Advisor's reputation and experience in serving as an investment advisor to the fund and the benefit to shareholders of investing in funds that are part of a family of funds offering a variety of investments. |
The Board concluded that the Advisor may reasonably be expected to continue to provide a high quality of services under the Advisory Agreement with respect to the fund.
Investment performance. In considering the fund's performance, the Board noted that it reviews at its regularly scheduled meetings information about the fund's performance results. In connection with the consideration of the Advisory Agreement, the Board:
| (a) | reviewed information prepared by management regarding the fund's performance; |
| (b) | considered the comparative performance of an applicable benchmark index; |
| (c) | considered the performance of comparable funds, if any, as included in the report prepared by an independent third-party provider of fund data; |
| (d) | took into account the Advisor's analysis of the fund's performance; and |
| (e) | considered the fund's share performance and premium/discount information. |
The Board noted that while it found the data provided by the independent third-party generally useful it recognized its limitations, including in particular that the data may vary depending on the end date selected and the results of the performance comparisons may vary depending on the selection of the peer group. The Board noted that, based on its net asset value, the fund outperformed its benchmark index for the five- and ten-year periods and underperformed its benchmark index for the one- and three-year periods ended December 31, 2019.The Board also noted that, based on its net asset value, the fund outperformed its peer group median for the one-,three-, five- and ten-year periods ended December 31, 2019. In considering the fund's performance relative to peers, the Board took into account the relatively limited number of funds in the fund's peer group. The Board took into account management's discussion of the fund's
SEMIANNUAL REPORT | JOHN HANCOCK FINANCIAL OPPORTUNITIES FUND 31
performance, including the favorable performance relative to the benchmark index for the five- and ten-year periods and to the peer group median for the one-, three-, five- and ten-year periods. The Board concluded that the fund's performance has generally been in line with or outperformed the historical performance of comparable funds and the fund's benchmark index.
Fees and expenses. The Board reviewed comparative information prepared by an independent third-party provider of fund data, including, among other data, the fund's contractual and net management fees (and subadvisory fees, to the extent available) and total expenses as compared to similarly situated investment companies deemed to be comparable to the fund in light of the nature, extent and quality of the management and advisory and subadvisory services provided by the Advisor and the Subadvisor. The Board considered the fund's ranking within a smaller group of peer funds chosen by the independent third-party provider, as well as the fund's ranking within a broader group of funds. In comparing the fund's contractual and net management fees to those of comparable funds, the Board noted that such fees include both advisory and administrative costs.
The Board also took into account the impact of leverage on fund expenses. The Board took into account the management fee structure, including that management fees for the fund were based on the fund's total managed assets, which are attributable to common stock and borrowings. The Board noted that net management fees for the fund are higher than the peer group median and that net total expenses for the fund are lower than the peer group median.
The Board took into account management's discussion of the fund's expenses. The Board also took into account management's discussion with respect to the overall management fee and the fees of the Subadvisor, including the amount of the advisory fee retained by the Advisor after payment of the subadvisory fee, in each case in light of the services rendered for those amounts and the risks undertaken by the Advisor. The Board also noted that the Advisor pays the subadvisory fee. In addition, the Board took into account that management had agreed to implement an overall fee waiver across the complex, including the fund, which is discussed further below. The Board also noted that, in addition, the Advisor is currently waiving fees and/or reimbursing expenses with respect to the fund and that the fund has breakpoints in its contractual management fee schedule that reduces management fees as assets increase. The Board reviewed information provided by the Advisor concerning the investment advisory fee charged by the Advisor or one of its advisory affiliates to other clients (including other funds in the John Hancock Fund Complex) having similar investment mandates, if any. The Board considered any differences between the Advisor's and Subadvisor's services to the fund and the services they provide to other comparable clients or funds. The Board concluded that the advisory fee paid with respect to the fund is reasonable in light of the nature, extent and quality of the services provided to the fund under the Advisory Agreement.
Profitability/Fall out benefits. In considering the costs of the services to be provided and the profits to be realized by the Advisor and its affiliates (including the Subadvisor) from the Advisor's relationship with the fund, the Board:
| (a) | reviewed financial information of the Advisor; |
| (b) | reviewed and considered information presented by the Advisor regarding the net profitability to the Advisor and its affiliates with respect to the fund; |
| (c) | received and reviewed profitability information with respect to the John Hancock Fund Complex as a whole and with respect to the fund; |
| (d) | received information with respect to the Advisor's allocation methodologies used in preparing the profitability data and considered that the advisor hired an independent third-party consultant to provide an analysis of the Advisor's allocation methodologies; |
SEMIANNUAL REPORT | JOHN HANCOCK FINANCIAL OPPORTUNITIES FUND 32
| (e) | considered that the Advisor also provides administrative services to the fund on a cost basis pursuant to an administrative services agreement; |
| (f) | noted that the fund's Subadvisor is an affiliate of the Advisor; |
| (g) | noted that the Advisor also derives reputational and other indirect benefits from providing advisory services to the fund; |
| (h) | noted that the subadvisory fees for the fund are paid by the Advisor; |
| (i) | considered the Advisor's ongoing costs and expenditures necessary to improve services, meet new regulatory and compliance requirements, and adapt to other challenges impacting the fund industry; and |
| (j) | considered that the Advisor should be entitled to earn a reasonable level of profits in exchange for the level of services it provides to the fund and the risks that it assumes as Advisor, including entrepreneurial, operational, reputational, litigation and regulatory risk. |
Based upon its review, the Board concluded that the level of profitability, if any, of the Advisor and its affiliates (including the Subadvisor) from their relationship with the fund was reasonable and not excessive.
Economies of scale. In considering the extent to which the fund may realize any economies of scale and whether fee levels reflect these economies of scale for the benefit of the fund shareholders, the Board noted that the fund has a limited ability to increase its assets as a closed-end fund. The Board took into account management's discussions of the current advisory fee structure, and, as noted above, the services the Advisor provides in performing its functions under the Advisory Agreement and in supervising the Subadvisor.
The Board also considered potential economies of scale that may be realized by the fund as part of the John Hancock Fund Complex. Among them, the Board noted that the Advisor has contractually agreed to waive a portion of its management fee and/or reimburse expenses for certain funds of the John Hancock Fund Complex, including the fund (the participating portfolios). This waiver is based upon aggregate net assets of all the participating portfolios. The amount of the reimbursement is calculated daily and allocated among all the participating portfolios in proportion to the daily net assets of each fund. The Board reviewed the fund's advisory fee structure and concluded that: (i) the fund's fee structure contains breakpoints in the advisory fees for the fund; and (ii) although economies of scale cannot be measured with precision, these arrangements permit shareholders of the fund to benefit from economies of scale if the fund grows. The Board also took into account management's discussion of the fund's advisory fee structure. The Board also considered the Advisor's overall operations and its ongoing investment in its business in order to expand the scale of, and improve the quality of, its operations that benefit the fund. The Board determined that the management fee structure for the fund was reasonable.
Approval of Subadvisory Agreement
In making its determination with respect to approval of the Subadvisory Agreement, the Board reviewed:
| (1) | information relating to the Subadvisor's business, including current subadvisory services to the fund (and other funds in the John Hancock Fund Complex); |
| (2) | the historical and current performance of the fund and comparative performance information relating to an applicable benchmark index and comparable funds; and |
| (3) | the subadvisory fee for the fund and to the extent available, comparable fee information prepared by an independent third party provider of fund data. |
SEMIANNUAL REPORT | JOHN HANCOCK FINANCIAL OPPORTUNITIES FUND 33
Nature, extent, and quality of services. With respect to the services provided by the Subadvisor, the Board received information provided to the Board by the Subadvisor, including the Subadvisor's Form ADV, as well as took into account information presented throughout the past year. The Board considered the Subadvisor's current level of staffing and its overall resources, as well as received information relating to the Subadvisor's compensation program. The Board reviewed the Subadvisor's history and investment experience, as well as information regarding the qualifications, background, and responsibilities of the Subadvisor's investment and compliance personnel who provide services to the fund. The Board also considered, among other things, the Subadvisor's compliance program and any disciplinary history. The Board also considered the Subadvisor's risk assessment and monitoring process. The Board reviewed the Subadvisor's regulatory history, including whether it was involved in any regulatory actions or investigations as well as material litigation, and any settlements and amelioratory actions undertaken, as appropriate. The Board noted that the Advisor conducts regular, periodic reviews of the Subadvisor and its operations, including regarding investment processes and organizational and staffing matters. The Board also noted that the fund's CCO and his staff conduct regular, periodic compliance reviews with the Subadvisor and present reports to the Independent Trustees regarding the same, which includes evaluating the regulatory compliance systems of the Subadvisor and procedures reasonably designed to assure compliance with the federal securities laws. The Board also took into account the financial condition of the Subadvisor.
The Board considered the Subadvisor's investment process and philosophy. The Board took into account that the Subadvisor's responsibilities include the development and maintenance of an investment program for the fund that is consistent with the fund's investment objective, the selection of investment securities and the placement of orders for the purchase and sale of such securities, as well as the implementation of compliance controls related to performance of these services. The Board also received information with respect to the Subadvisor's brokerage policies and practices, including with respect to best execution and soft dollars.
Subadvisor compensation. In considering the cost of services to be provided by the Subadvisor and the profitability to the Subadvisor of its relationship with the fund, the Board noted that the fees under the Subadvisory Agreement are paid by the Advisor and not the fund. The Board also received information and took into account any potential conflicts of interest the Advisor might have in connection with the Subadvisory Agreement.
In addition, the Board considered other potential indirect benefits that the Subadvisor and its affiliates may receive from the Subadvisor's relationship with the fund, such as the opportunity to provide advisory services to additional funds in the John Hancock Fund Complex and reputational benefits.
Subadvisory fees. The Board considered that the fund pays an advisory fee to the Advisor and that, in turn, the Advisor pays subadvisory fees to the Subadvisor. As noted above, the Board also considered the fund's subadvisory fee as compared to similarly situated investment companies deemed to be comparable to the fund as included in the report prepared by the independent third party provider of fund data, to the extent available. The Board noted that the limited size of the Lipper peer group was not sufficient for comparative purposes. The Board also took into account the subadvisory fee paid by the Advisor to the Subadvisor with respect to the fund and compared them to fees charged by the Subadvisor to manage other subadvised portfolios and portfolios not subject to regulation under the 1940 Act, as applicable.
Subadvisor performance. As noted above, the Board considered the fund's performance as compared to the fund's peer group and the benchmark index and noted that the Board reviews information about the fund's performance results at its regularly scheduled meetings. The Board noted the Advisor's expertise and resources in monitoring the performance, investment style and risk-adjusted performance of the Subadvisor. The Board was mindful of the
SEMIANNUAL REPORT | JOHN HANCOCK FINANCIAL OPPORTUNITIES FUND 34
Advisor's focus on the Subadvisor's performance. The Board also noted the Subadvisor's long-term performance record for similar accounts, as applicable.
The Board's decision to approve the Subadvisory Agreement was based on a number of determinations, including the following:
| (1) | the Subadvisor has extensive experience and demonstrated skills as a manager; |
| (2) | the fund's performance, based on net asset value, has generally been in line with or outperformed the historical performance of comparable funds and the fund's benchmark index; and |
| (3) | the subadvisory fees are reasonable in relation to the level and quality of services being provided under the Subadvisory Agreement. |
* * *
Based on the Board's evaluation of all factors that the Board deemed to be material, including those factors described above, the Board, including the Independent Trustees, concluded that renewal of the Advisory Agreement and the Subadvisory Agreement would be in the best interest of the fund and its shareholders. Accordingly, the Board, and the Independent Trustees voting separately, approved the Advisory Agreement and Subadvisory Agreement for an additional one-year period.
SEMIANNUAL REPORT | JOHN HANCOCK FINANCIAL OPPORTUNITIES FUND 35
| | |
Trustees
Hassell H. McClellan, Chairperson
Steven R. Pruchansky, Vice Chairperson
Andrew G. Arnott†
Charles L. Bardelis*
James R. Boyle
Peter S. Burgess*
William H. Cunningham
Grace K. Fey
Marianne Harrison†
Deborah C. Jackson
James M. Oates*
Gregory A. Russo
Officers
Andrew G. Arnott
President
Francis V. Knox, Jr.1
Chief Compliance Officer
Charles A. Rizzo
Chief Financial Officer
Salvatore Schiavone
Treasurer
Christopher (Kit) Sechler
Secretary and Chief Legal Officer
Trevor Swanberg2
Chief Compliance Officer
| Investment advisor
John Hancock Investment Management LLC
Subadvisor
Manulife Investment Management (US) LLC
Portfolio Managers
Susan A. Curry
Ryan P. Lentell, CFA
Custodian
State Street Bank and Trust Company
Transfer agent
Computershare Shareowner Services, LLC
Legal counsel
K&L Gates LLP
Stock symbol
Listed New York Stock Exchange: BTO
|
* Member of the Audit Committee
† Non-Independent Trustee
1 Retired on July 31, 2020
2 Effective July 31, 2020
The fund's proxy voting policies and procedures, as well as the fund's proxy voting record for the most recent twelve-month period ended June 30, are available free of charge on the Securities and Exchange Commission (SEC) website at sec.gov or on our website.
All of the fund's holdings as of the end of the third month of every fiscal quarter are filed with the SEC on Form N-PORT within 60 days of the end of the fiscal quarter. The fund's Form N-PORT filings are available on our website and the SEC's website, sec.gov.
We make this information on your fund, as well as monthly portfolio holdings, and other fund details available on our website at jhinvestments.com or by calling 800-852-0218.
The report is certified under the Sarbanes-Oxley Act, which requires closed-end funds and other public companies to affirm that, to the best of their knowledge, the information in their financial reports is fairly and accurately stated in all material respects.| | | | |
| | You can also contact us: |
| | 800-852-0218
jhinvestments.com | Regular mail:
Computershare
P.O. Box 505000
Louisville, KY 40233
| Express mail:
Computershare
462 South 4th Street, Suite 1600
Louisville, KY 40202
|
SEMIANNUAL REPORT | JOHN HANCOCK FINANCIAL OPPORTUNITIES FUND 36
John Hancock family of funds
| | | |
DOMESTIC EQUITY FUNDS
Blue Chip Growth
Classic Value
Disciplined Value
Disciplined Value Mid Cap
Equity Income
Financial Industries
Fundamental All Cap Core
Fundamental Large Cap Core
New Opportunities
Regional Bank
Small Cap Core
Small Cap Growth
Small Cap Value
U.S. Global Leaders Growth
U.S. Quality Growth
GLOBAL AND INTERNATIONAL EQUITY FUNDS
Disciplined Value International
Emerging Markets
Emerging Markets Equity
Fundamental Global Franchise
Global Equity
Global Shareholder Yield
Global Thematic Opportunities
International Dynamic Growth
International Growth
International Small Company
| | INCOME FUNDS
Bond
California Tax-Free Income
Emerging Markets Debt
Floating Rate Income
Government Income
High Yield
High Yield Municipal Bond
Income
Investment Grade Bond
Money Market
Short Duration Bond
Short Duration Credit Opportunities
Strategic Income Opportunities
Tax-Free Bond
ALTERNATIVE AND SPECIALTY FUNDS
Absolute Return Currency
Alternative Asset Allocation
Alternative Risk Premia
Diversified Macro
Infrastructure
Multi-Asset Absolute Return
Seaport Long/Short
|
The fund's investment objectives, risks, charges, and expenses are included in the prospectus and should be considered carefully before investing. For a prospectus, contact your financial professional, call John Hancock Investment Management at 800-852-0218, or visit the fund's website at jhinvestments.com. Please read the prospectus carefully before investing or sending money.
The John Hancock funds are distributed by John Hancock Investment Management Distributors LLC. Member FINRA SIPC.
| | | |
ASSET ALLOCATION
Balanced
Multi-Asset High Income
Multi-Index Lifetime Portfolios
Multi-Index Preservation Portfolios
Multimanager Lifestyle Portfolios
Multimanager Lifetime Portfolios
Retirement Income 2040
EXCHANGE-TRADED FUNDS
John Hancock Multifactor Consumer Discretionary ETF
John Hancock Multifactor Consumer Staples ETF
John Hancock Multifactor Developed International ETF
John Hancock Multifactor Emerging Markets ETF
John Hancock Multifactor Energy ETF
John Hancock Multifactor Financials ETF
John Hancock Multifactor Healthcare ETF
John Hancock Multifactor Industrials ETF
John Hancock Multifactor Large Cap ETF
John Hancock Multifactor Materials ETF
John Hancock Multifactor Media and
Communications ETF
John Hancock Multifactor Mid Cap ETF
John Hancock Multifactor Small Cap ETF
John Hancock Multifactor Technology ETF
John Hancock Multifactor Utilities ETF
| | ENVIRONMENTAL, SOCIAL, AND
GOVERNANCE FUNDS
ESG All Cap Core
ESG Core Bond
ESG International Equity
ESG Large Cap Core
CLOSED-END FUNDS
Financial Opportunities
Hedged Equity & Income
Income Securities Trust
Investors Trust
Preferred Income
Preferred Income II
Preferred Income III
Premium Dividend
Tax-Advantaged Dividend Income
Tax-Advantaged Global Shareholder Yield
|
John Hancock Multifactor ETF shares are bought and sold at market price (not NAV), and are not individually redeemed
from the fund. Brokerage commissions will reduce returns.
John Hancock ETFs are distributed by Foreside Fund Services, LLC, and are subadvised by Dimensional Fund Advisors LP.
Foreside is not affiliated with John Hancock Investment Management Distributors LLC or Dimensional Fund Advisors LP.
Dimensional Fund Advisors LP receives compensation from John Hancock in connection with licensing rights to the
John Hancock Dimensional indexes. Dimensional Fund Advisors LP does not sponsor, endorse, or sell, and makes no
representation as to the advisability of investing in, John Hancock Multifactor ETFs.
John Hancock Investment Management
A trusted brand
John Hancock Investment Management is a premier asset manager
with a heritage of financial stewardship dating back to 1862. Helping
our shareholders pursue their financial goals is at the core of
everything we do. It's why we support the role of professional financial
advice and operate with the highest standards of conduct and integrity.
A better way to invest
We serve investors globally through a unique multimanager approach:
We search the world to find proven portfolio teams with specialized
expertise for every strategy we offer, then we apply robust investment
oversight to ensure they continue to meet our uncompromising
standards and serve the best interests of our shareholders.
Results for investors
Our unique approach to asset management enables us to provide
a diverse set of investments backed by some of the world's best
managers, along with strong risk-adjusted returns across asset classes.
John Hancock Investment Management LLC
200 Berkeley Street n Boston, MA 02116-5010 n 800-225-5291 n jhinvestments.com
ITEM 2. CODE OF ETHICS.
Not applicable at this time.
ITEM 3. AUDIT COMMITTEE FINANCIAL EXPERT.
Not applicable at this time.
ITEM 4. PRINCIPAL ACCOUNTANT FEES AND SERVICES.
Not applicable at this time.
ITEM 5. AUDIT COMMITTEE OF LISTED REGISTRANTS.
Not applicable at this time.
ITEM 6. SCHEDULE OF INVESTMENTS.
(a) Not applicable.
(b) Not applicable.
ITEM 7. DISCLOSURE OF PROXY VOTING POLICIES AND PROCEDURES FOR CLOSED-END MANAGEMENT INVESTMENT COMPANIES.
Not applicable.
ITEM 8. PORTFOLIO MANAGERS OF CLOSED-END MANAGEMENT INVESTMENT COMPANIES.
Not applicable.
ITEM 9. PURCHASES OF EQUITY SECURITIES BY CLOSED-END MANAGEMENT INVESTMENT COMPANY AND AFFILIATED PURCHASERS.
(a) Not applicable.
(b)
REGISTRANT PURCHASES OF EQUITY SECURITIES
| | | Total number of shares | Maximum number of |
| Total number of | Average | purchased as part of | shares that may yet be |
| shares | price per | publicly announced | purchased under the |
| Period | purchased | share | plans* | plans |
| 19-Dec | - | - | - | 1,869,152 |
| 20-Jan | - | - | - | 1,869,152 |
| 20-Feb | - | - | - | 1,869,152 |
| 20-Mar | - | - | - | 1,869,152 |
| 20-Apr | - | - | - | 1,869,152 |
| 20-May | - | - | - | 1,869,152 |
| 20-Jun | - | - | - | 1,869,152 |
| Total | - | - | - | |
| * In May 2009, the Board of Trustees approved a share repurchase plan, which was subsequently reviewed and approved by the Board of Trustees each year in December. Under the current share repurchase plan, the Fund may purchase in the open market up to 10% of its outstanding common shares as of December 31, 2019. The current plan is in effect between January 1, 2020 and December 31, 2020. |
ITEM 10. SUBMISSION OF MATTERS TO A VOTE OF SECURITY HOLDERS.
The registrant has adopted procedures by which shareholders may recommend nominees to the registrant’s Board of Trustees. A copy of the procedures is filed as an exhibit to this Form N-CSR. See attached John Hancock Funds – Nominating and Governance Committee Charter.
ITEM 11. CONTROLS AND PROCEDURES.
(a) Based upon their evaluation of the registrant's disclosure controls and procedures as conducted within 90 days of the filing date of this Form N-CSR, the registrant's principal executive officer and principal financial officer have concluded that those disclosure controls and procedures provide reasonable assurance that the material information required to be disclosed by the registrant on this report is recorded, processed, summarized and reported within the time periods specified in the Securities and Exchange Commission's rules and forms.
(b) There were no changes in the registrant's internal control over financial reporting that occurred during the period covered by this report that have materially affected, or are reasonably likely to materially affect, the registrant's internal control over financial reporting.
ITEM 12. DISCLOSURE OF SECURITIES LENDING ACTIVITIES FOR CLOSED-END MANAGEMENT INVESTMENT COMPANIES.
The Fund did not participate directly in securities lending activities. See Note 8 to financial statements in Item 1.
ITEM 13. EXHIBITS.
(a) Separate certifications for the registrant's principal executive officer and principal financial officer, as required by Section 302 of the Sarbanes-Oxley Act of 2002 and Rule 30a-2(a) under the Investment Company Act of 1940, are attached.
(b)(1) Separate certifications for the registrant's principal executive officer and principal financial officer, as required by 18 U.S.C. Section 1350, as adopted pursuant to Section 906 of the Sarbanes-Oxley Act of 2002, and Rule 30a-2(b) under the Investment Company Act of 1940, are attached. The certifications furnished pursuant to this paragraph are not deemed to be "filed" for purposes of Section 18 of the Securities Exchange Act of 1934, or otherwise subject to the liability of that section. Such certifications are not deemed to be incorporated by reference into any filing under the Securities Act of 1933 or the Securities Exchange Act of 1934, except to the extent that the Registrant specifically incorporates them by reference.
(c)(1) Submission of Matters to a Vote of Security Holders is attached. See attached "John Hancock Funds - Governance Committee Charter".
(c)(2) Registrant’s notice to shareholders pursuant to Registrant’s exemptive order granting an exemption from Section 19(b) of the Investment Company Act of 1940, as amended and Rule 19b-1 thereunder regarding distributions made pursuant to the Registrant’s Managed Distribution Plan.
SIGNATURES
Pursuant to the requirements of the Securities Exchange Act of 1934 and the Investment Company Act of 1940, the registrant has duly caused this report to be signed on its behalf by the undersigned, thereunto duly authorized.
John Hancock Financial Opportunities Fund
| By: | /s/ Andrew Arnott | |
| Andrew Arnott | |
| President | |
| | |
| | |
| Date: | August 11, 2020 |
| |
| |
| Pursuant to the requirements of the Securities Exchange Act of 1934 and the Investment Company Act of 1940, this report has been signed below by the following persons on behalf of the registrant and in the capacities and on the dates indicated. |
| |
| |
| By: | /s/ Andrew Arnott | |
| Andrew Arnott | |
| President | |
| |
| |
| Date: | August 11, 2020 |
| |
| |
| By: | /s/ Charles A. Rizzo | |
| Charles A. Rizzo | |
| Chief Financial Officer | |
| |
| | |
| Date: | August 11, 2020 |