UNITED STATES
SECURITIES AND EXCHANGE COMMISSION
Washington, D.C. 20549
CERTIFIED SHAREHOLDER REPORT OF REGISTERED
MANAGEMENT INVESTMENT COMPANIES
Investment Company Act file number
811-08568
John Hancock Financial Opportunities Fund
(Exact name of registrant as specified in charter)
200 Berkeley Street, Boston, Massachusetts 02116
(Address of principal executive offices) (Zip code)
Salvatore Schiavone
Treasurer
200 Berkeley Street
Boston, Massachusetts 02116
(Name and address of agent for service) Registrant's telephone number, including area code:
617-543-9634
| Date of fiscal year end: | December 31 |
| Date of reporting period: | December 31, 2023 |
ITEM 1. REPORTS TO STOCKHOLDERS.
Annual report
John Hancock
Financial Opportunities Fund
Ticker: BTO
December 31, 2023
Managed distribution plan
The fund has adopted a managed distribution plan (Plan). Under the Plan, the fund currently makes quarterly distributions of an amount equal to $0.6500 per share, which will be paid quarterly until further notice. The fund may make additional distributions: (i) for purposes of not incurring federal income tax at the fund level of investment company taxable income and net capital gain, if any, not included in such regular distributions; and (ii) for purposes of not incurring federal excise tax on ordinary income and capital gain net income, if any, not included in such regular distributions.
The Plan provides that the Board of Trustees of the fund may amend the terms of the Plan or terminate the Plan at any time without prior notice to the fund’s shareholders. The Plan is subject to periodic review by the fund’s Board of Trustees.
You should not draw any conclusions about the fund’s investment performance from the amount of the fund’s distributions or from the terms of the fund’s Plan. The fund’s total return at net asset value (NAV) is presented in the "Financial highlights" section.
With each distribution that does not consist solely of net income, the fund will issue a notice to shareholders and an accompanying press release that will provide detailed information regarding the amount and composition of the distribution and other related information. The amounts and sources of distributions reported in the notice to shareholders are only estimates and are not provided for tax reporting purposes. The actual amounts and sources of the amounts for tax reporting purposes will depend upon the fund’s investment experience during the remainder of its fiscal year and may be subject to changes based on tax regulations. The fund will send you a Form 1099-DIV for the calendar year that will tell you how to report these distributions for federal income-tax purposes. The fund may, at times, distribute more than its net investment income and net realized capital gains; therefore, a portion of your distribution may result in a return of capital. A return of capital may occur, for example, when some or all of the money that you invested in the fund is paid back to you. A return of capital does not necessarily reflect the fund’s investment performance and should not be confused with "yield" or "income".
Dear shareholder,
Following a steep loss in 2022, the broad-based S&P 500 Index rallied sharply during the 12 months ended December 31, 2023, buoyed by a resilient U.S. economy, easing inflation, better-than-expected corporate earnings, stabilizing interest rates, and an unemployment rate that fell to its lowest level since 1969. Investor enthusiasm around generative artificial intelligence also gave a notable boost to a handful of large technology-related stocks that led the market’s advance. These tailwinds outweighed the negative impact of inflation that stayed stubbornly above the U.S. Federal Reserve’s (Fed’s) target, plus relatively high interest rates and a regional banking crisis last spring. Even the conflict in the Middle East this past October could not derail the market’s charge. A late-period signal from the Fed that it could cut its target interest rate in 2024 propelled stocks to a near-record finish for the year.
In these uncertain times, your financial professional can assist with positioning your portfolio so that it’s sufficiently diversified to help meet your long-term objectives and to withstand the inevitable bouts of market volatility along the way.
On behalf of everyone at John Hancock Investment Management, I’d like to take this opportunity to welcome new shareholders and thank existing shareholders for the continued trust you’ve placed in us.
Sincerely,
Head of Wealth and Asset Management,
United States and Europe
Manulife Investment Management
President and CEO,
John Hancock Investment Management
This commentary reflects the CEO’s views as of this report’s period end and are subject to change at any time. Diversification does not guarantee investment returns and does not eliminate risk of loss. All investments entail risks, including the possible loss of principal. For more up-to-date information, you can visit our website at jhinvestments.com.
John Hancock
Financial Opportunities Fund
| 1 | JOHN HANCOCK FINANCIAL OPPORTUNITIES FUND | ANNUAL REPORT | |
The fund seeks to provide a high level of total return consisting of long-term capital appreciation and current income.
AVERAGE ANNUAL TOTAL RETURNS AS OF 12/31/2023 (%)
The S&P Composite 1500 Banks Index tracks the performance of publicly traded large- and mid-cap banking companies in the United States.
It is not possible to invest directly in an index. Index figures do not reflect expenses, which would result in lower returns.
The performance data contained within this material represents past performance, which does not guarantee future results.
Investment returns and principal value will fluctuate and a shareholder may sustain losses. Further, the fund’s performance at net asset value (NAV) is different from the fund’s performance at closing market price because the closing market price is subject to the dynamics of secondary market trading. Market risk may increase when shares are purchased at a premium to NAV or sold at a discount to NAV. Current month-end performance may be higher or lower than the performance cited. The fund’s most recent performance can be found at jhinvestments.com or by calling 800-852-0218.
| | ANNUAL REPORT | JOHN HANCOCK FINANCIAL OPPORTUNITIES FUND | 2 |
PERFORMANCE HIGHLIGHTS OVER THE LAST TWELVE MONTHS
A volatile period for U.S. financial stocks, especially regional banks
While the fund’s comparative index, the S&P Composite 1500 Banks Index, posted a positive return, the period was volatile for regional banks, as rising interest rates contributed to multiple bank failures early in the year.
Bank stocks underperformed the broader market
The banking industry, as represented by the fund’s comparative index, underperformed the broader U.S. stock market.
The fund underperformed its comparative index
Underperformance of regional bank holdings within the fund’s banks segment caused the fund to lag its comparative index.
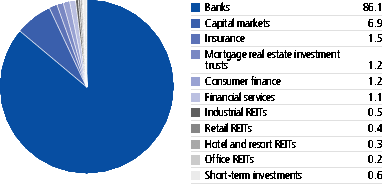
INDUSTRY COMPOSITION AS OF 12/31/2023 (% of total investments)
| 3 | JOHN HANCOCK FINANCIAL OPPORTUNITIES FUND | ANNUAL REPORT | |
Management’s discussion of fund performance
How would you describe market conditions during the 12 months ended December 31, 2023?
U.S. equities rose as inflation moderated throughout most of the period covered by this report, fueling expectations of a shift to a more accommodative monetary policy. While inflation remained well above the U.S. Federal Reserve’s (Fed’s) target rate of around 2%, the overall decline in readings helped to fuel expectations that the central bank might be near the end of its aggressive course of interest-rate hikes initiated in March 2022 in response to spiking consumer prices. The banking industry, as represented by the fund’s comparative index, generated a positive absolute return but lagged the broader U.S. stock market, as represented by the S&P 500 Index.
The lagged effect of the Fed’s rate increases created challenges for financial sector stocks and especially for regional banks, some of which were particularly vulnerable owing in part to certain rate-sensitive exposures in their investment portfolios. These pressures triggered liquidity issues for a relatively small number of institutions, eventually leading to the mid-March failures of SVB Financial Group and Signature Bank.
Deposit flows were comparatively stable at most other regional banks, but the failures created an overhang that subsequently pressured shares of other institutions. These pressures eased late in the period, and financial stocks and the
TOP 10 HOLDINGS
AS OF 12/31/2023 (% of total investments) |
| Popular, Inc. | 1.5 |
| Huntington Bancshares, Inc. | 1.5 |
| KKR & Company, Inc. | 1.4 |
| U.S. Bancorp | 1.4 |
| WSFS Financial Corp. | 1.4 |
| JPMorgan Chase & Co. | 1.4 |
| M&T Bank Corp. | 1.4 |
| Hancock Whitney Corp. | 1.4 |
| Fifth Third Bancorp | 1.4 |
| Bank of America Corp. | 1.4 |
| TOTAL | 14.2 |
| Cash and cash equivalents are not included. |
| | ANNUAL REPORT | JOHN HANCOCK FINANCIAL OPPORTUNITIES FUND | 4 |
broader stock market rallied amid optimism that continued easing of inflation would cause the Fed to pivot in 2024 and begin cutting rates. This positive sentiment was bolstered by solid data on the labor market, GDP, and retail spending, which fueled hopes that the U.S. economy was likely to avoid a recession in 2024.
How did the fund perform?
The fund at net asset value generated a positive absolute return but underperformed its comparative index, due to underperformance of holdings within the fund’s banks segment and an underweight to certain large-capitalization diversified banks. On the positive side, an allocation to the capital markets segment had a positive impact on relative performance.
At the individual security level, JPMorgan Chase & Co. was among the large, diversified banks in which the fund had structural underweights, owing to JPMorgan Chase’s 31% weighting in the benchmark at period end. The JPMorgan Chase position was the largest detractor from relative performance, as the bank’s shares outperformed during the period. Among smaller banks, positions in Southern First Bancshares, Inc., Bank of Marin Bancorp, and TriCo Bancshares were among the notable detractors. We sold the fund’s position in Southern First prior to period end.
On the positive side, positions in global alternative investment manager Ares Management Corp. and private equity firm KKR & Company, Inc. were among the notable contributors to relative performance. Underweight positions in Bank of America Corp. and First Horizon Corp. also were beneficial, as shares of both banks underperformed.
The views expressed in this report are exclusively those of Susan A. Curry and Ryan P. Lentell, CFA, Manulife Investment Management (US) LLC, and are subject to change. They are not meant as investment advice. Please note that the holdings discussed in this report may not have been held by the fund for the entire period. Portfolio composition is subject to review in accordance with the fund’s investment strategy and may vary in the future. Current and future portfolio holdings are subject to risk.
| 5 | JOHN HANCOCK FINANCIAL OPPORTUNITIES FUND | ANNUAL REPORT | |
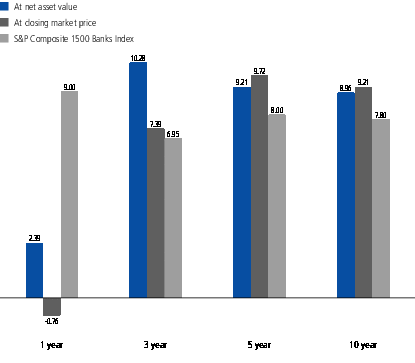
TOTAL RETURNS FOR THE PERIOD ENDED DECEMBER 31, 2023
| Average annual total returns (%) | Cumulative total returns (%) |
| | 1-Year | 5-Year | 10-Year | 5-year | 10-Year |
| At Net asset value | 2.39 | 9.21 | 8.96 | 55.34 | 135.86 |
| At Market price | -0.76 | 9.72 | 9.21 | 59.04 | 141.44 |
| S&P Composite 1500 Banks Index | 9.00 | 8.00 | 7.80 | 46.93 | 111.96 |
Performance figures assume all distributions have been reinvested.
The returns reflect past results and should not be considered indicative of future performance. Investment returns and principal value will fluctuate and a shareholder may sustain losses. Further, the fund’s performance at net asset value (NAV) is different from the fund’s performance at closing market price because the closing market price is subject to the dynamics of secondary market trading. Market risk may be augmented when shares are purchased at a premium to NAV or when shares need to be sold at a discount to NAV. Current month-end performance may be higher or lower than the performance cited. The fund’s most recent performance can be found at jhinvestments.com or by calling 800-852-0218.
The performance table above and the chart on the next page do not reflect the deduction of taxes that a shareholder would pay on fund distributions or the sale of fund shares. The fund’s performance results reflect any applicable fee waivers or expense reductions, without which the expenses would increase and results would have been less favorable.
| | ANNUAL REPORT | JOHN HANCOCK FINANCIAL OPPORTUNITIES FUND | 6 |
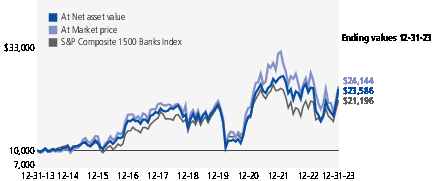
This chart shows what happened to a hypothetical $10,000 investment in John Hancock Financial Opportunities Fund for the periods indicated, assuming all distributions were reinvested. For comparison, we’ve shown the same investment in the S&P Composite 1500 Banks Index.
The S&P Composite 1500 Banks Index tracks the performance of publicly traded large- and mid-cap banking companies in the United States.
It is not possible to invest directly in an index. Index figures do not reflect expenses, which would result in lower returns.
The returns reflect past results and should not be considered indicative of future performance.
| 7 | JOHN HANCOCK FINANCIAL OPPORTUNITIES FUND | ANNUAL REPORT | |
| | | | | Shares | Value |
| Common stocks 110.9% (92.3% of Total investments) | | $667,361,776 |
| (Cost $441,096,169) | | | | | |
| Financials 110.3% | | | | | 663,952,044 |
| Banks 97.5% | | |
| 1st Source Corp. | | | | 120,335 | 6,612,408 |
| Alpine Banks of Colorado, Class B | | | | 173,462 | 4,943,667 |
| American Business Bank (A) | | | | 74,896 | 2,694,758 |
| American National Bankshares, Inc. | | | | 84,377 | 4,113,379 |
| American Riviera Bancorp (A) | | | | 218,459 | 3,604,574 |
| Ameris Bancorp | | | | 179,209 | 9,507,037 |
| Atlantic Union Bankshares Corp. | | | | 134,792 | 4,925,300 |
| Avidbank Holdings, Inc. (A) | | | | 257,070 | 5,493,586 |
| Bank of America Corp. | | | | 295,808 | 9,959,855 |
| Bank of Idaho Holding Company (A) | | | | 150,000 | 4,050,000 |
| Bank of Marin Bancorp | | | | 189,583 | 4,174,618 |
| Bank7 Corp. | | | | 116,363 | 3,182,528 |
| Banner Corp. | | | | 66,503 | 3,561,901 |
| Bar Harbor Bankshares | | | | 142,394 | 4,180,688 |
| BayCom Corp. | | | | 173,874 | 4,101,688 |
| Bremer Financial Corp. (B)(C) | | | | 41,667 | 4,229,159 |
| Business First Bancshares, Inc. | | | | 182,458 | 4,497,590 |
| C&F Financial Corp. | | | | 37,912 | 2,585,219 |
| California BanCorp (A) | | | | 121,815 | 3,016,139 |
| Camden National Corp. | | | | 68,551 | 2,579,574 |
| CB Financial Services, Inc. | | | | 57,155 | 1,361,432 |
| Central Pacific Financial Corp. | | | | 144,201 | 2,837,876 |
| Central Valley Community Bancorp | | | | 126,760 | 2,833,086 |
| Citizens Community Bancorp, Inc. | | | | 169,116 | 1,980,348 |
| Citizens Financial Group, Inc. (D)(E) | | | | 285,466 | 9,460,343 |
| Civista Bancshares, Inc. | | | | 183,001 | 3,374,538 |
| Coastal Financial Corp. (A) | | | | 132,503 | 5,884,458 |
| Codorus Valley Bancorp, Inc. | | | | 99,915 | 2,567,816 |
| Colony Bankcorp, Inc. | | | | 86,996 | 1,157,047 |
| Columbia Banking System, Inc. | | | | 269,124 | 7,180,228 |
| Comerica, Inc. | | | | 64,887 | 3,621,343 |
| Community Heritage Financial, Inc. | | | | 141,197 | 2,329,751 |
| ConnectOne Bancorp, Inc. | | | | 85,763 | 1,964,830 |
| Cullen/Frost Bankers, Inc. | | | | 87,349 | 9,476,493 |
| CVB Financial Corp. | | | | 222,784 | 4,498,009 |
| Eagle Bancorp Montana, Inc. | | | | 127,715 | 2,016,620 |
| East West Bancorp, Inc. (E) | | | | 57,098 | 4,108,201 |
| Eastern Bankshares, Inc. | | | | 416,161 | 5,909,486 |
| Enterprise Bancorp, Inc. | | | | 74,904 | 2,416,403 |
| SEE NOTES TO FINANCIAL STATEMENTS | ANNUAL REPORT | JOHN HANCOCK FINANCIAL OPPORTUNITIES FUND | 8 |
| | | | | Shares | Value |
| Financials (continued) | | | | | |
| Banks (continued) | | |
| Equity Bancshares, Inc., Class A | | | | 147,255 | $4,991,945 |
| ESSA Bancorp, Inc. | | | | 94,578 | 1,893,452 |
| Evans Bancorp, Inc. | | | | 69,760 | 2,199,533 |
| Farmers & Merchants Bancorp, Inc. (D)(E) | | | | 114,822 | 2,847,586 |
| Farmers National Banc Corp. | | | | 162,398 | 2,346,651 |
| FFB Bancorp (A) | | | | 82,186 | 6,244,525 |
| Fifth Third Bancorp (D)(E) | | | | 290,471 | 10,018,345 |
| First Business Financial Services, Inc. | | | | 91,858 | 3,683,506 |
| First Commonwealth Financial Corp. | | | | 311,718 | 4,812,926 |
| First Community Corp. | | | | 132,912 | 2,861,595 |
| First Financial Bancorp | | | | 345,565 | 8,207,169 |
| First Horizon Corp. | | | | 348,843 | 4,939,617 |
| First Interstate BancSystem, Inc., Class A | | | | 129,540 | 3,983,355 |
| First Merchants Corp. | | | | 152,194 | 5,643,354 |
| First Mid Bancshares, Inc. | | | | 76,166 | 2,639,914 |
| First Northwest Bancorp | | | | 52,942 | 843,895 |
| First Reliance Bancshares, Inc. (A)(F) | | | | 426,454 | 3,654,711 |
| Flushing Financial Corp. | | | | 118,649 | 1,955,336 |
| German American Bancorp, Inc. (E) | | | | 124,124 | 4,022,859 |
| Great Southern Bancorp, Inc. | | | | 40,257 | 2,389,253 |
| Hancock Whitney Corp. | | | | 206,285 | 10,023,388 |
| HBT Financial, Inc. | | | | 209,443 | 4,421,342 |
| Heritage Commerce Corp. (E) | | | | 513,678 | 5,095,686 |
| Heritage Financial Corp. (E) | | | | 90,346 | 1,932,501 |
| Horizon Bancorp, Inc. | | | | 378,518 | 5,416,593 |
| Huntington Bancshares, Inc. (D)(E) | | | | 842,465 | 10,716,155 |
| InBankshares Corp. (A) | | | | 207,676 | 1,661,408 |
| Independent Bank Corp. (Massachusetts) (E) | | | | 85,080 | 5,599,115 |
| Independent Bank Corp. (Michigan) | | | | 163,971 | 4,266,525 |
| JPMorgan Chase & Co. (D)(E) | | | | 60,031 | 10,211,273 |
| KeyCorp (D)(E) | | | | 673,808 | 9,702,835 |
| Landmark Bancorp, Inc. | | | | 64,780 | 1,255,436 |
| Live Oak Bancshares, Inc. | | | | 110,051 | 5,007,321 |
| M&T Bank Corp. (D)(E) | | | | 73,564 | 10,084,153 |
| Metrocity Bankshares, Inc. | | | | 65,263 | 1,567,617 |
| Mid Penn Bancorp, Inc. | | | | 71,323 | 1,731,722 |
| MidWestOne Financial Group, Inc. | | | | 133,914 | 3,603,626 |
| NBT Bancorp, Inc. (D)(E) | | | | 104,324 | 4,372,219 |
| New York Community Bancorp, Inc. (D)(E) | | | | 454,005 | 4,644,471 |
| Nicolet Bankshares, Inc. (D)(E) | | | | 90,381 | 7,273,863 |
| Northrim BanCorp, Inc. | | | | 92,403 | 5,286,376 |
| Ohio Valley Banc Corp. | | | | 79,347 | 1,824,981 |
| Old National Bancorp | | | | 359,938 | 6,079,353 |
| 9 | JOHN HANCOCK FINANCIAL OPPORTUNITIES FUND | ANNUAL REPORT | SEE NOTES TO FINANCIAL STATEMENTS |
| | | | | Shares | Value |
| Financials (continued) | | | | | |
| Banks (continued) | | |
| Old Second Bancorp, Inc. | | | | 351,764 | $5,431,236 |
| OP Bancorp | | | | 170,717 | 1,869,351 |
| Orange County Bancorp, Inc. | | | | 43,740 | 2,634,898 |
| Pinnacle Financial Partners, Inc. (D)(E) | | | | 112,170 | 9,783,467 |
| Plumas Bancorp | | | | 54,412 | 2,249,936 |
| Popular, Inc. | | | | 133,406 | 10,948,630 |
| Premier Financial Corp. (D)(E) | | | | 333,084 | 8,027,324 |
| Prime Meridian Holding Company | | | | 125,087 | 2,945,799 |
| Private Bancorp of America, Inc. (A) | | | | 116,752 | 4,086,320 |
| Provident Financial Holdings, Inc. | | | | 97,172 | 1,225,339 |
| QCR Holdings, Inc. | | | | 75,459 | 4,406,051 |
| Red River Bancshares, Inc. | | | | 58,027 | 3,255,895 |
| Regions Financial Corp. | | | | 481,460 | 9,330,695 |
| Renasant Corp. | | | | 144,643 | 4,871,576 |
| Riverview Bancorp, Inc. | | | | 368,806 | 2,360,358 |
| SB Financial Group, Inc. | | | | 257,156 | 3,919,057 |
| Shore Bancshares, Inc. | | | | 406,028 | 5,785,899 |
| Sierra Bancorp | | | | 163,038 | 3,676,507 |
| South Atlantic Bancshares, Inc. | | | | 289,568 | 3,691,992 |
| Southern California Bancorp (A) | | | | 261,632 | 4,539,315 |
| Southern Missouri Bancorp, Inc. (D)(E) | | | | 104,786 | 5,594,525 |
| SouthState Corp. (D)(E) | | | | 84,976 | 7,176,223 |
| SpareBank 1 SR-Bank ASA | | | | 127,986 | 1,623,119 |
| Stock Yards Bancorp, Inc. (D)(E) | | | | 79,829 | 4,110,395 |
| Synovus Financial Corp. | | | | 228,255 | 8,593,801 |
| The First Bancorp, Inc. | | | | 226,174 | 6,382,630 |
| The First Bancshares, Inc. | | | | 181,973 | 5,337,268 |
| The PNC Financial Services Group, Inc. (D)(E) | | | | 63,618 | 9,851,247 |
| Timberland Bancorp, Inc. | | | | 113,266 | 3,563,348 |
| TriCo Bancshares | | | | 193,684 | 8,322,601 |
| Truist Financial Corp. | | | | 215,638 | 7,961,355 |
| U.S. Bancorp (D)(E) | | | | 238,928 | 10,340,804 |
| United BanCorp of Alabama, Inc., Class A | | | | 168,566 | 7,012,346 |
| Virginia National Bankshares Corp. | | | | 82,690 | 2,842,882 |
| Walden Mutual (A)(B)(C) | | | | 100,000 | 667,800 |
| Westamerica BanCorp | | | | 112,746 | 6,360,002 |
| Western Alliance Bancorp | | | | 53,528 | 3,521,607 |
| WSFS Financial Corp. | | | | 222,325 | 10,211,387 |
| WTB Financial Corp., Class B | | | | 10,170 | 3,112,020 |
| Zions Bancorp NA | | | | 226,397 | 9,932,036 |
| Capital markets 8.3% | | |
| Ares Management Corp., Class A | | | | 77,184 | 9,178,721 |
| Brookfield Corp. (D)(E) | | | | 124,500 | 4,994,940 |
| SEE NOTES TO FINANCIAL STATEMENTS | ANNUAL REPORT | JOHN HANCOCK FINANCIAL OPPORTUNITIES FUND | 10 |
| | | | | Shares | Value |
| Financials (continued) | | | | | |
| Capital markets (continued) | | |
| KKR & Company, Inc. | | | | 126,340 | $10,467,269 |
| Oaktree Specialty Lending Corp. (D)(E) | | | | 266,364 | 5,439,153 |
| Onex Corp. | | | | 105,066 | 7,336,898 |
| Sixth Street Specialty Lending, Inc. | | | | 217,057 | 4,688,431 |
| The Carlyle Group, Inc. (D)(E) | | | | 201,936 | 8,216,776 |
| Consumer finance 1.4% | | |
| Discover Financial Services | | | | 54,395 | 6,113,998 |
| LendingClub Corp. (A) | | | | 260,870 | 2,280,004 |
| Financial services 1.3% | | |
| Eurazeo SE | | | | 101,170 | 8,044,450 |
| Insurance 1.8% | | |
| Assured Guaranty, Ltd. | | | | 83,698 | 6,263,121 |
| Skyward Specialty Insurance Group, Inc. (A) | | | | 130,513 | 4,421,780 |
| Real estate 0.6% | | | | | 3,409,732 |
| Industrial REITs 0.6% | | |
|
| Plymouth Industrial REIT, Inc. | | | | 141,659 | 3,409,732 |
| Preferred securities 5.6% (4.6% of Total investments) | | $33,439,711 |
| (Cost $34,396,246) | | | | | |
| Financials 4.9% | | | | | 29,628,725 |
| Banks 4.5% | |
| Atlantic Union Bankshares Corp., 6.875% | | 143,775 | 3,022,151 |
| CNB Financial Corp., 7.125% | | 69,615 | 1,512,038 |
| First Business Financial Services, Inc., 7.000% (7.000% to 3-15-27, then 3 month CME Term SOFR + 5.390%) (C)(G) | | 4,000 | 3,357,196 |
| First Merchants Corp., 7.500% | | 50,000 | 1,212,500 |
| Midland States Bancorp, Inc., 7.750% (7.750% to 9-30-27, then 5 Year CMT + 4.713%) (D)(E) | | 120,000 | 2,916,000 |
| Northpointe Bancshares, Inc., 8.250% (8.250% to 12-30-25, then Overnight SOFR + 7.990%) (A)(G) | | 160,000 | 3,680,000 |
| Pinnacle Financial Partners, Inc., 6.750% | | 71,825 | 1,623,245 |
| Synovus Financial Corp., 5.875% (5.875% to 7-1-24, then 5 Year CMT + 4.127%) | | 77,222 | 1,803,134 |
| Tectonic Financial, Inc., 9.000% (9.000% to 5-15-24, then 3 month LIBOR + 6.720%) | | 186,840 | 1,887,084 |
| United Community Banks, Inc., 6.875% | | 86,596 | 2,012,491 |
| WaFd, Inc., 4.875% | | 210,875 | 3,177,886 |
| WesBanco, Inc., 6.750% (6.750% to 11-15-25, then 5 Year CMT + 6.557%) (D)(E) | | 50,000 | 1,197,500 |
| Mortgage real estate investment trusts 0.4% | |
| Invesco Mortgage Capital, Inc., 7.750% (7.750% to 12-27-24, then 3 month LIBOR + 5.180%) | | 99,000 | 2,227,500 |
| 11 | JOHN HANCOCK FINANCIAL OPPORTUNITIES FUND | ANNUAL REPORT | SEE NOTES TO FINANCIAL STATEMENTS |
| | | | | Shares | Value |
| Real estate 0.7% | | | | | $3,810,986 |
| Hotel and resort REITs 0.4% | |
| Sotherly Hotels, Inc., 8.000% | | 44,519 | 894,832 |
| Sotherly Hotels, Inc., 8.250% | | 59,188 | 1,251,234 |
| Office REITs 0.3% | |
| Hudson Pacific Properties, Inc., 4.750% | | 118,838 | 1,664,920 |
|
| | Rate (%) | Maturity date | | Par value^ | Value |
| Corporate bonds 1.9% (1.6% of Total investments) | | $11,481,246 |
| (Cost $10,912,012) | | | | | |
| Financials 1.5% | | | | 8,955,006 |
| Banks 1.5% | | | |
| BNP Paribas SA (7.750% to 8-16-29, then 5 Year CMT + 4.899%) (G)(H) | 7.750 | 08-16-29 | | 2,903,000 | 2,963,295 |
| BNP Paribas SA (9.250% to 11-17-27, then 5 Year CMT + 4.969%) (G)(H) | 9.250 | 11-17-27 | | 832,000 | 889,712 |
| Cullen/Frost Capital Trust II (3 month CME Term SOFR + 1.812%) (I) | 7.189 | 03-01-34 | | 3,000,000 | 2,617,599 |
| University Bancorp, Inc. (8.250% to 1-31-28, then 3 month CME Term SOFR + 4.870%) (G) | 8.250 | 01-31-33 | | 2,500,000 | 2,484,400 |
| Real estate 0.4% | | | | 2,526,240 |
| Retail REITs 0.4% | | | |
|
| The Necessity Retail REIT, Inc. (G) | 4.500 | 09-30-28 | | 3,000,000 | 2,526,240 |
| Convertible bonds 1.1% (0.9% of Total investments) | | $6,554,121 |
| (Cost $6,475,614) | | | | | |
| Financials 1.1% | | | | 6,554,121 |
| Mortgage real estate investment trusts 1.1% | | | |
| Blackstone Mortgage Trust, Inc. | 5.500 | 03-15-27 | | 3,000,000 | 2,722,500 |
|
| Redwood Trust, Inc. | 7.750 | 06-15-27 | | 4,179,000 | 3,831,621 |
| Certificate of deposit 0.0% (0.0% of Total investments) | $82,957 |
| (Cost $82,957) | | | | | |
| East Boston Savings Bank | 2.960 | 11-03-25 | | 1,944 | 1,944 |
| Eastern Savings Bank FSB | 0.200 | 04-24-25 | | 1,970 | 1,970 |
| First Bank Richmond NA (C) | 3.500 | 12-05-25 | | 22,466 | 22,466 |
| First Federal of Northern Michigan | 0.250 | 01-09-24 | | 3,065 | 3,065 |
| First National Bank | 0.400 | 06-17-24 | | 1,368 | 1,368 |
| First Savings Bank of Perkasie | 0.747 | 04-07-25 | | 5,201 | 5,201 |
| Home National Bank | 5.100 | 11-06-24 | | 22,034 | 22,034 |
| Hudson United Bank | 4.250 | 04-24-25 | | 2,296 | 2,296 |
| Machias Savings Bank | 1.010 | 05-31-24 | | 2,023 | 2,023 |
| Midstates Bank NA | 0.520 | 06-03-24 | | 2,066 | 2,066 |
| Milford Federal Savings and Loan Bank | 0.500 | 04-29-24 | | 2,075 | 2,075 |
| MutualOne Bank | 1.300 | 09-11-25 | | 4,309 | 4,309 |
| SEE NOTES TO FINANCIAL STATEMENTS | ANNUAL REPORT | JOHN HANCOCK FINANCIAL OPPORTUNITIES FUND | 12 |
| | Rate (%) | Maturity date | | Par value^ | Value |
|
| Newburyport Five Cents Savings Bank | 0.300 | 10-18-24 | | 2,183 | $2,183 |
| Newtown Savings Bank | 0.250 | 06-03-24 | | 2,001 | 2,001 |
| Newtown Savings Bank (C) | 0.250 | 08-29-24 | | 3,905 | 3,905 |
| Sunshine Federal Savings and Loan Association | 0.500 | 05-12-25 | | 2,108 | 2,108 |
| The Milford Bank | 0.100 | 06-12-25 | | 1,943 | 1,943 |
| | | Yield (%) | | Shares | Value |
| Short-term investments 0.7% (0.6% of Total investments) | $4,353,721 |
| (Cost $4,354,003) | | | | | |
| Short-term funds 0.7% | | | | | 4,353,721 |
| John Hancock Collateral Trust (J) | | 5.3645(K) | | 435,363 | 4,353,721 |
|
| Total investments (Cost $497,317,001) 120.2% | | | $723,273,532 |
| Other assets and liabilities, net (20.2%) | | | (121,522,493) |
| Total net assets 100.0% | | | $601,751,039 |
| The percentage shown for each investment category is the total value of the category as a percentage of the net assets of the fund unless otherwise indicated. |
| ^All par values are denominated in U.S. dollars unless otherwise indicated. |
| Security Abbreviations and Legend |
| CME | CME Group Published Rates |
| CMT | Constant Maturity Treasury |
| LIBOR | London Interbank Offered Rate |
| SOFR | Secured Overnight Financing Rate |
| (A) | Non-income producing security. |
| (B) | Restricted security as to resale, excluding 144A securities. For more information on this security refer to the Notes to financial statements. |
| (C) | Security is valued using significant unobservable inputs and is classified as Level 3 in the fair value hierarchy. Refer to Note 2 to the financial statements. |
| (D) | All or a portion of this security is on loan as of 12-31-23, and is a component of the fund’s leverage under the Liquidity Agreement. |
| (E) | All or a portion of this security is pledged as collateral pursuant to the Liquidity Agreement. Total collateral value at 12-31-23 was $130,623,842. A portion of the securities pledged as collateral were loaned pursuant to the Liquidity Agreement. The value of securities on loan amounted to $110,971,852. |
| (F) | The fund owns 5% or more of the outstanding voting shares of the issuer and the security is considered an affiliate of the fund. For more information on this security refer to the Notes to financial statements. |
| (G) | These securities are exempt from registration under Rule 144A of the Securities Act of 1933. Such securities may be resold, normally to qualified institutional buyers, in transactions exempt from registration. |
| (H) | Perpetual bonds have no stated maturity date. Date shown as maturity date is next call date. |
| (I) | Variable rate obligation. The coupon rate shown represents the rate at period end. |
| (J) | Investment is an affiliate of the fund, the advisor and/or subadvisor. |
| (K) | The rate shown is the annualized seven-day yield as of 12-31-23. |
| 13 | JOHN HANCOCK FINANCIAL OPPORTUNITIES FUND | ANNUAL REPORT | SEE NOTES TO FINANCIAL STATEMENTS |
| Interest rate swaps |
Counterparty (OTC)/
Centrally cleared | Notional
amount | Currency | Payments
made | Payments
received | Fixed
payment
frequency | Floating
payment
frequency | Maturity
date | Unamortized
upfront
payment
paid
(received) | Unrealized
appreciation
(depreciation) | Value |
| Centrally cleared | 10,000,000 | USD | Fixed 3.874% | USD SOFR Compounded OIS (a) | Semi-Annual | Quarterly | Dec 2026 | — | $(50,969) | $(50,969) |
| Centrally cleared | 10,000,000 | USD | Fixed 3.356% | USD SOFR Compounded OIS (a) | Semi-Annual | Quarterly | May 2028 | — | 104,055 | 104,055 |
| Centrally cleared | 15,000,000 | USD | Fixed 1.220% | USD SOFR Compounded OIS + 0.262% (a) | Semi-Annual | Quarterly | Mar 2030 | $(4,063) | 2,107,394 | 2,103,331 |
| Centrally cleared | 25,000,000 | USD | Fixed 1.136% | USD SOFR Compounded OIS + 0.262% (a) | Semi-Annual | Quarterly | Mar 2030 | (6,492) | 3,630,287 | 3,623,795 |
| Centrally cleared | 25,000,000 | USD | Fixed 1.077% | USD SOFR Compounded OIS + 0.262% (a) | Semi-Annual | Quarterly | Mar 2030 | (6,379) | 3,715,074 | 3,708,695 |
| | | | | | | | | $(16,934) | $9,505,841 | $9,488,907 |
| (a) | At 12-31-23, the overnight SOFR was 5.380%. |
| Derivatives Currency Abbreviations |
| USD | U.S. Dollar |
| Derivatives Abbreviations |
| OIS | Overnight Index Swap |
| OTC | Over-the-counter |
| SOFR | Secured Overnight Financing Rate |
At 12-31-23, the aggregate cost of investments for federal income tax purposes was $498,367,927. Net unrealized appreciation aggregated to $234,394,512, of which $247,270,728 related to gross unrealized appreciation and $12,876,216 related to gross unrealized depreciation.
See Notes to financial statements regarding investment transactions and other derivatives information.
| SEE NOTES TO FINANCIAL STATEMENTS | ANNUAL REPORT | JOHN HANCOCK FINANCIAL OPPORTUNITIES FUND | 14 |
STATEMENT OF ASSETS AND LIABILITIES
12-31-23
| Assets | |
| Unaffiliated investments, at value (Cost $489,080,031) | $715,265,100 |
| Affiliated investments, at value (Cost $8,236,970) | 8,008,432 |
| Total investments, at value (Cost $497,317,001) | 723,273,532 |
| Receivable for centrally cleared swaps | 2,553,449 |
| Cash | 132,879 |
| Dividends and interest receivable | 1,533,194 |
| Receivable from affiliates | 89,084 |
| Other assets | 148,344 |
| Total assets | 727,730,482 |
| Liabilities | |
| Liquidity agreement | 125,000,000 |
| Interest payable | 647,986 |
| Payable to affiliates | |
| Administrative services fees | 148,473 |
| Trustees’ fees | 814 |
| Other liabilities and accrued expenses | 182,170 |
| Total liabilities | 125,979,443 |
| Net assets | $601,751,039 |
| Net assets consist of | |
| Paid-in capital | $366,396,833 |
| Total distributable earnings (loss) | 235,354,206 |
| Net assets | $601,751,039 |
| |
| Net asset value per share | |
| Based on 19,686,612 shares of beneficial interest outstanding - unlimited number of shares authorized with no par value | $30.57 |
| 15 | JOHN HANCOCK Financial Opportunities Fund | ANNUAL REPORT | SEE NOTES TO FINANCIAL STATEMENTS |
STATEMENT OF OPERATIONS
For the year ended
12-31-23
| Investment income | |
| Dividends | $23,121,815 |
| Interest | 819,973 |
| Dividends from affiliated investments | 205,546 |
| Less foreign taxes withheld | (101,459) |
| Total investment income | 24,045,875 |
| Expenses | |
| Investment management fees | 7,325,861 |
| Interest expense | 7,246,102 |
| Administrative services fees | 1,645,296 |
| Transfer agent fees | 25,072 |
| Trustees’ fees | 46,880 |
| Custodian fees | 76,622 |
| Printing and postage | 154,519 |
| Professional fees | 233,994 |
| Stock exchange listing fees | 23,751 |
| Other | 30,334 |
| Total expenses | 16,808,431 |
| Less expense reductions | (1,036,495) |
| Net expenses | 15,771,936 |
| Net investment income | 8,273,939 |
| Realized and unrealized gain (loss) | |
| Net realized gain (loss) on | |
| Unaffiliated investments and foreign currency transactions | 35,048,414 |
| Affiliated investments | (1,056) |
| Swap contracts | 2,786,075 |
| | 37,833,433 |
| Change in net unrealized appreciation (depreciation) of | |
| Unaffiliated investments and translation of assets and liabilities in foreign currencies | (35,741,100) |
| Affiliated investments | (43,254) |
| Swap contracts | (1,686,228) |
| | (37,470,582) |
| Net realized and unrealized gain | 362,851 |
| Increase in net assets from operations | $8,636,790 |
| SEE NOTES TO FINANCIAL STATEMENTS | ANNUAL REPORT | JOHN HANCOCK Financial Opportunities Fund | 16 |
STATEMENTS OF CHANGES IN NET ASSETS
| | Year ended
12-31-23 | Year ended
12-31-22 |
| Increase (decrease) in net assets | | |
| From operations | | |
| Net investment income | $8,273,939 | $9,621,893 |
| Net realized gain | 37,833,433 | 32,002,379 |
| Change in net unrealized appreciation (depreciation) | (37,470,582) | (128,541,647) |
| Increase (decrease) in net assets resulting from operations | 8,636,790 | (86,917,375) |
| Distributions to shareholders | | |
| From earnings | (50,807,042) | (47,926,823) |
| Total distributions | (50,807,042) | (47,926,823) |
| Fund share transactions | | |
| Issued in shelf offering | 9,223,955 | 6,595,560 |
| Issued pursuant to Dividend Reinvestment Plan | 2,568,882 | 3,138,679 |
| Total from fund share transactions | 11,792,837 | 9,734,239 |
| Total decrease | (30,377,415) | (125,109,959) |
| Net assets | | |
| Beginning of year | 632,128,454 | 757,238,413 |
| End of year | $601,751,039 | $632,128,454 |
| Share activity | | |
| Shares outstanding | | |
| Beginning of year | 19,263,174 | 19,014,318 |
| Issued in shelf offering | 325,851 | 156,533 |
| Issued pursuant to Dividend Reinvestment Plan | 97,587 | 92,323 |
| End of year | 19,686,612 | 19,263,174 |
| 17 | JOHN HANCOCK Financial Opportunities Fund | ANNUAL REPORT | SEE NOTES TO FINANCIAL STATEMENTS |
STATEMENT OF CASH FLOWS
For the year ended
12-31-23
| | |
| Cash flows from operating activities | |
| Net increase in net assets from operations | $8,636,790 |
| Adjustments to reconcile net increase in net assets from operations to net cash provided by operating activities: | |
| Long-term investments purchased | (87,735,125) |
| Long-term investments sold | 119,362,593 |
| Net purchases and sales of short-term investments | (3,115,422) |
| Net amortization of premium (discount) | (164,255) |
| (Increase) Decrease in assets: | |
| Receivable for centrally cleared swaps | (205,542) |
| Dividends and interest receivable | (36,824) |
| Receivable from affiliates | 9,230 |
| Other assets | 58,034 |
| Increase (Decrease) in liabilities: | |
| Payable for investments purchased | (10,145) |
| Interest payable | 118,889 |
| Payable to affiliates | (14,722) |
| Other liabilities and accrued expenses | 120,872 |
| Net change in unrealized (appreciation) depreciation on: | |
| Investments | 35,786,468 |
| Net realized (gain) loss on: | |
| Investments | (35,054,980) |
| Proceeds received as return of capital | 299,439 |
| Net cash provided by operating activities | $38,055,300 |
| Cash flows provided by (used in) financing activities | |
| Distributions to shareholders | $(48,238,160) |
| Fund shares issued in shelf offering | 9,223,955 |
| Net cash used in financing activities | $(39,014,205) |
| Net decrease in cash | $(958,905) |
| Cash at beginning of year | $1,091,784 |
| Cash at end of year | $132,879 |
| Supplemental disclosure of cash flow information: | |
| Cash paid for interest | $(7,127,213) |
| Noncash financing activities not included herein consists of reinvestment of distributions | $2,568,882 |
| SEE NOTES TO FINANCIAL STATEMENTS | ANNUAL REPORT | JOHN HANCOCK Financial Opportunities Fund | 18 |
| Period ended | 12-31-23 | 12-31-22 | 12-31-21 | 12-31-20 | 12-31-19 |
| Per share operating performance | | | | | |
| Net asset value, beginning of period | $32.82 | $39.82 | $28.48 | $36.38 | $29.06 |
| Net investment income 1 | 0.42 | 0.50 | 0.54 | 0.60 | 0.50 |
| Net realized and unrealized gain (loss) on investments | (0.11) 2 | (5.03) | 12.96 | (6.30) | 9.02 |
| Total from investment operations | 0.31 | (4.53) | 13.50 | (5.70) | 9.52 |
| Less distributions | | | | | |
| From net investment income | (0.62) | (0.47) | (0.62) | (0.65) | (0.48) |
| From net realized gain | (1.98) | (2.03) | (1.58) | (1.55) | (1.72) |
| Total distributions | (2.60) | (2.50) | (2.20) | (2.20) | (2.20) |
| Premium from shares sold through shelf offering | 0.04 | 0.03 | 0.04 | — | — |
| Net asset value, end of period | $30.57 | $32.82 | $39.82 | $28.48 | $36.38 |
| Per share market value, end of period | $30.08 | $33.31 | $46.59 | $30.35 | $36.30 |
Total return at net asset value (%) 3,4 | 2.39 | (11.39) | 47.83 | (13.38) | 33.71 |
Total return at market value (%) 3 | (0.76) | (23.11) | 62.31 | (7.49) | 38.81 |
| Ratios and supplemental data | | | | | |
| Net assets, end of period (in millions) | $602 | $632 | $757 | $535 | $680 |
| Ratios (as a percentage of average net assets): | | | | | |
| Expenses before reductions | 3.16 | 2.12 | 1.78 | 2.21 | 2.27 |
| Expenses including reductions 5 | 2.96 | 1.93 | 1.60 | 2.01 | 2.08 |
| Net investment income | 1.55 | 1.41 | 1.45 | 2.50 | 1.52 |
| Portfolio turnover (%) | 13 | 10 | 14 | 10 | 13 |
| Senior securities | | | | | |
| Total debt outstanding end of period (in millions) | $125 | $125 | $125 | $125 | $125 |
| Asset coverage per $1,000 of debt 6 | $5,814 | $6,057 | $7,058 | $5,278 | $6,440 |
| 1 | Based on average daily shares outstanding. |
| 2 | The amount shown for a share outstanding does not correspond with the aggregate net gain (loss) on investments for the period due to the timing of the sales and repurchases of shares in relation to fluctuating market values of the investments of the fund. |
| 3 | Total return based on net asset value reflects changes in the fund’s net asset value during each period. Total return based on market value reflects changes in market value. Each figure assumes that distributions from income, capital gains and tax return of capital, if any, were reinvested. |
| 4 | Total returns would have been lower had certain expenses not been reduced during the applicable periods. |
| 5 | Expenses including reductions excluding interest expense were 1.60%, 1.47%, 1.47%, 1.69% and 1.50% for the periods ended 12-31-23, 12-31-22, 12-31-21, 12-31-20 and 12-31-19, respectively. |
| 6 | Asset coverage equals the total net assets plus borrowings divided by the borrowings of the fund outstanding at period end (Note 8). As debt outstanding changes, the level of invested assets may change accordingly. Asset coverage ratio provides a measure of leverage. |
| 19 | JOHN HANCOCK Financial Opportunities Fund | ANNUAL REPORT | SEE NOTES TO FINANCIAL STATEMENTS |
Notes to financial statements
John Hancock Financial Opportunities Fund (the fund) is a closed-end management investment company organized as a Massachusetts business trust and registered under the Investment Company Act of 1940, as amended (the 1940 Act).
Note 2
—
Significant accounting policies
The financial statements have been prepared in conformity with accounting principles generally accepted in the United States of America (US GAAP), which require management to make certain estimates and assumptions as of the date of the financial statements. Actual results could differ from those estimates and those differences could be significant. The fund qualifies as an investment company under Topic 946 of Accounting Standards Codification of US GAAP.
Events or transactions occurring after the end of the fiscal period through the date that the financial statements were issued have been evaluated in the preparation of the financial statements. The following summarizes the significant accounting policies of the fund:
Security valuation.
Investments are stated at value as of the scheduled close of regular trading on the New York Stock Exchange (NYSE), normally at 4:00 P.M., Eastern Time. In case of emergency or other disruption resulting in the NYSE not opening for trading or the NYSE closing at a time other than the regularly scheduled close, the net asset value (NAV) may be determined as of the regularly scheduled close of the NYSE pursuant to the Valuation Policies and Procedures of the Advisor, John Hancock Investment Management LLC.
In order to value the securities, the fund uses the following valuation techniques: Equity securities, including exchange-traded or closed-end funds, are typically valued at the last sale price or official closing price on the exchange or principal market where the security trades. In the event there were no sales during the day or closing prices are not available, the securities are valued using the last available bid price. Investments by the fund in open-end mutual funds, including John Hancock Collateral Trust (JHCT), are valued at their respective NAVs each business day. Debt obligations are typically valued based on evaluated prices provided by an independent pricing vendor. Independent pricing vendors utilize matrix pricing, which takes into account factors such as institutional-size trading in similar groups of securities, yield, quality, coupon rate, maturity, type of issue, trading characteristics and other market data, as well as broker supplied prices. Swaps are generally valued using evaluated prices obtained from an independent pricing vendor. Foreign securities and currencies are valued in U.S. dollars based on foreign currency exchange rates supplied by an independent pricing vendor.
In certain instances, the Pricing Committee of the Advisor may determine to value equity securities using prices obtained from another exchange or market if trading on the exchange or market on which prices are typically obtained did not open for trading as scheduled, or if trading closed earlier than scheduled, and trading occurred as normal on another exchange or market.
Other portfolio securities and assets, for which reliable market quotations are not readily available, are valued at fair value as determined in good faith by the Pricing Committee following procedures established by the Advisor and adopted by the Board of Trustees. The frequency with which these fair valuation procedures are used cannot be predicted and fair value of securities may differ significantly from the value that would have been used had a ready market for such securities existed. Trading in foreign securities may be completed before the scheduled daily close of trading on the NYSE. Significant events at the issuer or market level may affect the values of securities between the time when the valuation of the securities is generally determined and the close of the NYSE. If a significant event occurs, these securities may be fair valued, as determined in good faith by the Pricing Committee, following procedures established by the Advisor and adopted by the Board of Trustees. The Advisor uses fair value adjustment factors provided by an independent pricing vendor to value certain foreign securities in order to adjust for events that may occur between the close of foreign exchanges or markets and the close of the NYSE.
| | ANNUAL REPORT | JOHN HANCOCK Financial Opportunities Fund | 20 |
The fund uses a three tier hierarchy to prioritize the pricing assumptions, referred to as inputs, used in valuation techniques to measure fair value. Level 1 includes securities valued using quoted prices in active markets for identical securities, including registered investment companies. Level 2 includes securities valued using other significant observable inputs. Observable inputs may include quoted prices for similar securities, interest rates, prepayment speeds and credit risk. Prices for securities valued using these inputs are received from independent pricing vendors and brokers and are based on an evaluation of the inputs described. Level 3 includes securities valued using significant unobservable inputs when market prices are not readily available or reliable, including the Advisor’s assumptions in determining the fair value of investments. Factors used in determining value may include market or issuer specific events or trends, changes in interest rates and credit quality. The inputs or methodology used for valuing securities are not necessarily an indication of the risks associated with investing in those securities. Changes in valuation techniques and related inputs may result in transfers into or out of an assigned level within the disclosure hierarchy.
The following is a summary of the values by input classification of the fund’s investments as of December 31, 2023, by major security category or type:
| | Total
value at
12-31-23 | Level 1
quoted
price | Level 2
significant
observable
inputs | Level 3
significant
unobservable
inputs |
| Investments in securities: | | |
| Assets | | | | |
| Common stocks | | | | |
| Financials | | | | |
| Banks | $586,506,503 | $579,986,425 | $1,623,119 | $4,896,959 |
| Capital markets | 50,322,188 | 50,322,188 | — | — |
| Consumer finance | 8,394,002 | 8,394,002 | — | — |
| Financial services | 8,044,450 | — | 8,044,450 | — |
| Insurance | 10,684,901 | 10,684,901 | — | — |
| Real estate | | | | |
| Industrial REITs | 3,409,732 | 3,409,732 | — | — |
| Preferred securities | | | | |
| Financials | | | | |
| Banks | 27,401,225 | 20,364,029 | 3,680,000 | 3,357,196 |
| Mortgage real estate investment trusts | 2,227,500 | 2,227,500 | — | — |
| Real estate | | | | |
| Hotel and resort REITs | 2,146,066 | 2,146,066 | — | — |
| Office REITs | 1,664,920 | 1,664,920 | — | — |
| Corporate bonds | 11,481,246 | — | 11,481,246 | — |
| Convertible bonds | 6,554,121 | — | 6,554,121 | — |
| Certificate of deposit | 82,957 | — | 56,586 | 26,371 |
| Short-term investments | 4,353,721 | 4,353,721 | — | — |
| Total investments in securities | $723,273,532 | $683,553,484 | $31,439,522 | $8,280,526 |
| Derivatives: | | | | |
| Assets | | | | |
| Swap contracts | $9,539,876 | — | $9,539,876 | — |
| Liabilities | | | | |
| Swap contracts | (50,969) | — | (50,969) | — |
| 21 | JOHN HANCOCK Financial Opportunities Fund | ANNUAL REPORT | |
The fund holds liabilities for which the fair value approximates the carrying amount for financial statement purposes. As of December 31, 2023, the liability for the fund’s Liquidity agreement on the Statement of assets and liabilities is categorized as Level 2 within the disclosure hierarchy.
The following is a reconciliation of Level 3 assets for which significant unobservable inputs were used to determine fair value. Transfers into or out of Level 3, if any, represent the beginning value of any security or instrument where a change in the level has occurred from the beginning to the end of the period and in all cases were transferred into or out of Level 2.
| | Common
stocks | Preferred
securities | Certificate
of deposit | Total |
| Balance as of 12-31-22 | $6,139,314 | $3,574,533 | $4,265 | $9,718,112 |
| Realized gain (loss) | — | — | — | — |
| Change in unrealized appreciation (depreciation) | (1,242,355) | (217,337) | — | (1,459,692) |
| Purchases | — | — | 26,371 | 26,371 |
| Sales | — | — | (4,265) | (4,265) |
| Transfers into Level 3 | — | — | — | — |
| Transfers out of Level 3 | — | — | — | — |
| Balance as of 12-31-23 | $4,896,959 | $3,357,196 | $26,371 | $8,280,526 |
| Change in unrealized appreciation (depreciation) at period end 1 | $(1,242,355) | $(217,337) | — | $(1,459,692) |
| 1 | Change in unrealized appreciation (depreciation) attributable to Level 3 securities held at period end. This balance is included in change in unrealized appreciation (depreciation) on the Statement of operations. |
The valuation techniques and significant amounts of unobservable inputs used in the fair value measurement of the fund’s Level 3 securities are outlined in the table below:
| | Fair Value
at 12-31-23 | Valuation technique | Significant
unobservable inputs | Input/Range* | Input weighted average* |
| Common Stocks | $4,896,959 | Market Comparable | Price/Book Value multiple
Discount | 1.06x - 1.08x
18% | 1.08x
18% |
| | | | | | |
| Preferred Securities | $3,357,196 | Bond Comparable | Benchmark Option Adjusted Spread (OAS)
Implied OAS premium | 466.59
135% | 466.59
135% |
| | | | | | |
| Certificate of deposit | $26,371 | Transactions Indicative of Value | Prior/recent transactions | $100 | $100 |
| | | | | | |
| Total | $8,280,526 | | | | |
*A weighted average is an average in which each input in the grouping is assigned a weighting before summing to a single average value. The weighting of the input is determined based on a security’s fair value as a percentage of the total fair value.
A change to unobservable inputs of the fund’s Level 3 securities as of December 31, 2023 could have resulted in changes to the fair value measurement, as follows:
| Significant Unobservable Input | Impact to Valuation
if input had increased | Impact to Valuation
if input had decreased |
| Benchmark Option Adjusted Spread (OAS) | Increase | Decrease |
| Discount | Decrease | Increase |
| Implied OAS premium | Increase | Decrease |
| Price/Book Value multiple | Increase | Decrease |
| | ANNUAL REPORT | JOHN HANCOCK Financial Opportunities Fund | 22 |
| Significant Unobservable Input | Impact to Valuation
if input had increased | Impact to Valuation
if input had decreased |
| Prior/recent transactions | Increase | Decrease |
Real estate investment trusts.
The fund may invest in real estate investment trusts (REITs). Distributions from REITs may be recorded as income and subsequently characterized by the REIT at the end of their fiscal year as a reduction of cost of investments and/or as a realized gain. As a result, the fund will estimate the components of distributions from these securities. Such estimates are revised when the actual components of the distributions are known.
Security transactions and related investment income.
Investment security transactions are accounted for on a trade date plus one basis for daily NAV calculations. However, for financial reporting purposes, investment transactions are reported on trade date. Interest income is accrued as earned. Interest income includes coupon interest and amortization/accretion of premiums/discounts on debt securities. Debt obligations may be placed in a non-accrual status and related interest income may be reduced by stopping current accruals and writing off interest receivable when the collection of all or a portion of interest has become doubtful. Dividend income is recorded on ex-date, except for dividends of certain foreign securities where the dividend may not be known until after the ex-date. In those cases, dividend income, net of withholding taxes, is recorded when the fund becomes aware of the dividends. Non-cash dividends, if any, are recorded at the fair market value of the securities received. Distributions received on securities that represent a tax return of capital and/or capital gain, if any, are recorded as a reduction of cost of investments and/or as a realized gain, if amounts are estimable. Gains and losses on securities sold are determined on the basis of identified cost and may include proceeds from litigation.
Foreign investing.
Assets, including investments, and liabilities denominated in foreign currencies are translated into U.S. dollar values each day at the prevailing exchange rate. Purchases and sales of securities, income and expenses are translated into U.S. dollars at the prevailing exchange rate on the date of the transaction. The effect of changes in foreign currency exchange rates on the value of securities is reflected as a component of the realized and unrealized gains (losses) on investments. Foreign investments are subject to a decline in the value of a foreign currency versus the U.S. dollar, which reduces the dollar value of securities denominated in that currency.
Funds that invest internationally generally carry more risk than funds that invest strictly in U.S. securities. Risks can result from differences in economic and political conditions, regulations, market practices (including higher transaction costs), accounting standards and other factors.
Foreign taxes.
The fund may be subject to withholding tax on income, capital gains or repatriations imposed by certain countries, a portion of which may be recoverable. Foreign taxes are accrued based upon the fund’s understanding of the tax rules and rates that exist in the foreign markets in which it invests. Taxes are accrued based on gains realized by the fund as a result of certain foreign security sales. In certain circumstances, estimated taxes are accrued based on unrealized appreciation of such securities. Investment income is recorded net of foreign withholding taxes.
Overdrafts.
Pursuant to the custodian agreement, the fund’s custodian may, in its discretion, advance funds to the fund to make properly authorized payments. When such payments result in an overdraft, the fund is obligated to repay the custodian for any overdraft, including any costs or expenses associated with the overdraft. The custodian may have a lien, security interest or security entitlement in any fund property that is not otherwise segregated or pledged, to the maximum extent permitted by law, to the extent of any overdraft.
Expenses.
Within the John Hancock group of funds complex, expenses that are directly attributable to an individual fund are allocated to such fund. Expenses that are not readily attributable to a specific fund are allocated among all funds in an equitable manner, taking into consideration, among other things, the nature and type of expense and the fund’s relative net assets. Expense estimates are accrued in the period to which they relate and adjustments are made when actual amounts are known.
| 23 | JOHN HANCOCK Financial Opportunities Fund | ANNUAL REPORT | |
Statement of cash flows.
A Statement of cash flows is presented when a fund has a significant amount of borrowing during the period, based on the average total borrowing in relation to total assets, or when a certain percentage of the fund’s investments is classified as Level 3 in the fair value hierarchy. Information on financial transactions that have been settled through the receipt and disbursement of cash is presented in the Statement of cash flows. The cash amount shown in the Statement of cash flows is the amount included in the fund’s Statement of assets and liabilities and represents the cash on hand at the fund’s custodian and does not include any short-term investments or collateral on derivative contracts, if any.
Federal income taxes.
The fund intends to continue to qualify as a regulated investment company by complying with the applicable provisions of the Internal Revenue Code and will not be subject to federal income tax on taxable income that is distributed to shareholders. Therefore, no federal income tax provision is required.
As of December 31, 2023, the fund had no uncertain tax positions that would require financial statement recognition, derecognition or disclosure. The fund’s federal tax returns are subject to examination by the Internal Revenue Service for a period of three years.
Managed distribution plan.
The fund has adopted a managed distribution plan (Plan). Under the current Plan, the fund makes quarterly distributions of an amount equal to $0.6500 per share, which will be paid quarterly until further notice.
Distributions under the Plan may consist of net investment income, net realized capital gains and, to the extent necessary, return of capital. Return of capital distributions may be necessary when the fund’s net investment income and net capital gains are insufficient to meet the minimum distribution. In addition, the fund may also make additional distributions for the purpose of not incurring federal income and excise taxes.
The Board of Trustees may terminate or reduce the amount paid under the Plan at any time. The termination or reduction may have an adverse effect on the market price of the fund’s shares.
Distribution of income and gains.
Distributions to shareholders from net investment income and net realized gains, if any, are recorded on the ex-date. The fund generally declares and pays dividends quarterly pursuant to the Managed Distribution Plan described above. Capital gain distributions, if any, are typically distributed annually.
The tax character of distributions for the years ended December 31, 2023 and 2022 was as follows:
| | December 31, 2023 | December 31, 2022 |
| Ordinary income | $12,123,860 | $8,945,964 |
| Long-term capital gains | 38,683,182 | 38,980,859 |
| Total | $50,807,042 | $47,926,823 |
As of December 31, 2023, the components of distributable earnings on a tax basis consisted of $98,731 of undistributed ordinary income and $860,963 of undistributed long-term capital gains.
Such distributions and distributable earnings, on a tax basis, are determined in conformity with income tax regulations, which may differ from US GAAP. Distributions in excess of tax basis earnings and profits, if any, are reported in the fund’s financial statements as a return of capital.
Capital accounts within the financial statements are adjusted for permanent book-tax differences. These adjustments have no impact on net assets or the results of operations. Temporary book-tax differences, if any, will reverse in a subsequent period. Book-tax differences are primarily attributable to investments in passive foreign investment companies and derivative transactions.
| | ANNUAL REPORT | JOHN HANCOCK Financial Opportunities Fund | 24 |
Note 3
—
Derivative instruments
The fund may invest in derivatives in order to meet its investment objective. Derivatives include a variety of different instruments that may be traded in the over-the-counter (OTC) market, on a regulated exchange or through a clearing facility. The risks in using derivatives vary depending upon the structure of the instruments, including the use of leverage, optionality, the liquidity or lack of liquidity of the contract, the creditworthiness of the counterparty or clearing organization and the volatility of the position. Some derivatives involve risks that are potentially greater than the risks associated with investing directly in the referenced securities or other referenced underlying instrument. Specifically, the fund is exposed to the risk that the counterparty to an OTC derivatives contract will be unable or unwilling to make timely settlement payments or otherwise honor its obligations. OTC derivatives transactions typically can only be closed out with the other party to the transaction.
Certain derivatives are traded or cleared on an exchange or central clearinghouse. Exchange-traded or centrally-cleared transactions generally present less counterparty risk to a fund than OTC transactions. The exchange or clearinghouse stands between the fund and the broker to the contract and therefore, credit risk is generally limited to the failure of the exchange or clearinghouse and the clearing member.
Centrally-cleared swap contracts are subject to clearinghouse rules, including initial and variation margin requirements, daily settlement of obligations and the clearinghouse guarantee of payments to the broker. There is, however, still counterparty risk due to the potential insolvency of the broker with respect to any margin held in the brokers’ customer accounts. While clearing members are required to segregate customer assets from their own assets, in the event of insolvency, there may be a shortfall in the amount of margin held by the broker for its clients. Collateral or margin requirements for centrally-cleared derivatives are set by the broker or applicable clearinghouse. Margin for centrally-cleared transactions is detailed in the Statement of assets and liabilities as Receivable/Payable for centrally-cleared swaps. Securities pledged by the fund for centrally-cleared transactions, if any, are identified in the Fund’s investments.
Swaps.
Swap agreements are agreements between the fund and a counterparty to exchange cash flows, assets, foreign currencies or market-linked returns at specified intervals. Swap agreements are privately negotiated in the OTC market (OTC swaps) or may be executed on a registered commodities exchange (centrally cleared swaps). Swaps are marked-to-market daily and the change in value is recorded as a component of unrealized appreciation/depreciation of swap contracts. The value of the swap will typically impose collateral posting obligations on the party that is considered out-of-the-money on the swap.
Upfront payments made/received by the fund, if any, are amortized/accreted for financial reporting purposes, with the unamortized/unaccreted portion included in the Statement of assets and liabilities. A termination payment by the counterparty or the fund is recorded as realized gain or loss, as well as the net periodic payments received or paid by the fund.
Entering into swap agreements involves, to varying degrees, elements of credit, market and documentation risk that may provide outcomes that produce losses in excess of the amounts recognized on the Statement of assets and liabilities. Such risks involve the possibility that there will be no liquid market for the swap, or that a counterparty may default on its obligation or delay payment under the swap terms. The counterparty may disagree or contest the terms of the swap. In addition to interest rate risk, market risks may also impact the swap. The fund may also suffer losses if it is unable to terminate or assign outstanding swaps or reduce its exposure through offsetting transactions.
Interest rate swaps.
Interest rate swaps represent an agreement between the fund and a counterparty to exchange cash flows based on the difference between two interest rates applied to a notional amount. The payment flows are usually netted against each other, with the difference being paid by one party to the other. The fund settles accrued net interest receivable or payable under the swap contracts at specified, future intervals.
| 25 | JOHN HANCOCK Financial Opportunities Fund | ANNUAL REPORT | |
During the year ended December 31, 2023, the fund used interest rate swap contracts to manage against changes in the liquidity agreement interest rates. The fund held interest rate swaps with total USD notional amounts ranging from $65.0 million to $140.0 million, as measured at each quarter end.
Fair value of derivative instruments by risk category
The table below summarizes the fair value of derivatives held by the fund at December 31, 2023 by risk category:
| Risk | Statement of assets
and liabilities
location | Financial
instruments
location | Assets
derivatives
fair value | Liabilities
derivatives
fair value |
| Interest rate | Swap contracts, at value 1 | Interest rate swaps | $9,539,876 | $(50,969) |
| 1 | Reflects cumulative value of swap contracts. Receivable/payable for centrally cleared swaps, which includes value and margin, are shown separately on the Statement of assets and liabilities. |
Effect of derivative instruments on the Statement of operations
The table below summarizes the net realized gain (loss) included in the net increase (decrease) in net assets from operations, classified by derivative instrument and risk category, for the year ended December 31, 2023:
| | Statement of operations location - Net realized gain (loss) on: |
| Risk | Swap contracts |
| Interest rate | $2,786,075 |
The table below summarizes the net change in unrealized appreciation (depreciation) included in the net increase (decrease) in net assets from operations, classified by derivative instrument and risk category, for the year ended December 31, 2023:
| | Statement of operations location - Change in net unrealized appreciation (depreciation) of: |
| Risk | Swap contracts |
| Interest rate | $(1,686,228) |
Note 4
—
Guarantees and indemnifications
Under the fund’s organizational documents, its Officers and Trustees are indemnified against certain liabilities arising out of the performance of their duties to the fund. Additionally, in the normal course of business, the fund enters into contracts with service providers that contain general indemnification clauses. The fund’s maximum exposure under these arrangements is unknown, as this would involve future claims that may be made against the fund that have not yet occurred. The risk of material loss from such claims is considered remote.
Note 5
—
Fees and transactions with affiliates
John Hancock Investment Management LLC (the Advisor) serves as investment advisor for the fund. John Hancock Investment Management Distributors LLC (the Distributor), an affiliate of the Advisor, serves as distributor for the common shares offered through the equity shelf offering of the fund. The Advisor is an indirect, principally owned subsidiary of John Hancock Life Insurance Company (U.S.A.), which in turn is a subsidiary of Manulife Financial Corporation (MFC).
Management fee.
The fund has an investment advisory agreement with the Advisor under which the fund pays a daily management fee to the Advisor, equivalent on an annual basis to the sum of (a) 1.15% of the first $500 million of the fund’s average daily gross assets, including the assets attributed to the Liquidity Agreement (LA) (see Note 8) (collectively, gross managed assets), and (b) 1.00% of the fund’s average daily gross assets in
| | ANNUAL REPORT | JOHN HANCOCK Financial Opportunities Fund | 26 |
excess of $500 million. The Advisor has a subadvisory agreement with Manulife Investment Management (US) LLC, an indirectly owned subsidiary of MFC and an affiliate of the Advisor. The fund is not responsible for payment of the subadvisory fees.
The Advisor has contractually agreed to waive a portion of its management fee and/or reimburse expenses for certain funds of the John Hancock group of funds complex, including the fund (the participating portfolios). This waiver is based upon aggregate managed assets of all the participating portfolios. The amount of the reimbursement is calculated daily and allocated among all the participating portfolios in proportion to the daily net assets of each fund. During the year ended December 31, 2023, this waiver amounted to 0.01% of the fund’s average daily net assets. This arrangement expires on July 31, 2025, unless renewed by mutual agreement of the fund and the Advisor based upon a determination that this is appropriate under the circumstances at that time.
The expense reductions described above amounted to $49,317 for the year ended December 31, 2023.
Expenses waived or reimbursed in the current fiscal period are not subject to recapture in future fiscal periods.
The investment management fees, including the impact of the waivers and reimbursements as described above, incurred for the year ended December 31, 2023, were equivalent to a net annual effective rate of 1.11% of the fund’s average daily managed assets.
Administrative services.
The fund has an administration agreement with the Advisor under which the Advisor provides certain administrative services to the fund and oversees operational activities of the fund. The compensation for the period was at an annual rate of 0.25% of the average weekly gross managed assets of the fund. The Advisor agreed to limit the administrative services fee to 0.10% of the fund’s average weekly gross assets. This arrangement expires on April 30, 2025, unless renewed by mutual agreement of the fund and the Advisor based upon a determination that this is appropriate under the circumstances at that time. Accordingly, the expense reductions related to administrative services fees amounted to $987,178 for the year ended December 31, 2023. The net administrative services fees incurred for the year ended December 31, 2023 amounted to an annual rate of 0.10% of the fund’s average weekly gross managed assets.
Distributor.
The fund will compensate the Distributor with respect to sales of the common shares offered through the equity shelf offering at a commission rate of 1.00% of the gross proceeds of the sale of common shares, a portion of which is allocated to the selling dealers. During the year ended December 31, 2023, compensation to the Distributor was $93,727. The Distributor has an agreement with a sub-placement agent in the sale of common shares. The fund is not responsible for payment of commissions to the sub placement agent.
Trustee expenses.
The fund compensates each Trustee who is not an employee of the Advisor or its affiliates. These Trustees receive from the fund and the other John Hancock closed-end funds an annual retainer. In addition, Trustee out-of-pocket expenses are allocated to each fund based on its net assets relative to other funds within the John Hancock group of funds complex.
Note 6
—
Fund share transactions
In May 2009, the Board of Trustees approved a share repurchase plan, which is subsequently reviewed by the Board of Trustees each year in December. Under the current share repurchase plan, the fund may purchase in the open market, between January 1, 2024 and December 31, 2024, up to 10% of its outstanding common shares as of December 31, 2023. The share repurchase plan will remain in effect between January 1, 2024 and December 31, 2024.
During the years ended December 31, 2023 and 2022, the fund had no activities under the repurchase program. Shares repurchased and corresponding dollar amounts, if any, are included on the Statements of changes in net assets. The anti-dilutive impacts of these share repurchases, if any, are included on the Financial highlights.
Transactions in common shares, if any, are presented in the Statements of changes in net assets. In 2021, the fund filed a registration statement with the Securities and Exchange Commission, registering an additional 1,500,000
| 27 | JOHN HANCOCK Financial Opportunities Fund | ANNUAL REPORT | |
common shares through an equity shelf offering program. Under this program, the fund, subject to market conditions, may raise additional equity capital from time to time by offering new common shares at a price equal to or above the fund’s net asset value per common share. Shares issued in shelf offering and corresponding dollar amounts, if any, are included on the Statements of changes in net assets. The net proceeds in excess of the net asset value of the shares sold were $840,044 and $652,440 for the years ended December 31, 2023 and December 31, 2022, respectively. The premium from shares sold through these shelf offerings, if any, are included on the Financial highlights. Proceeds received in connection with the shelf offering are net of commissions and offering costs. Total offering costs of $246,606 have been prepaid by the fund. As of December 31, 2023, $104,798 has been deducted from proceeds of shares issued and the remaining $141,808 is included in Other assets on the Statement of assets and liabilities.
The fund utilizes the LA to increase its assets available for investment. When the fund leverages its assets, shareholders bear the expenses associated with the LA and have potential to benefit or be disadvantaged from the use of leverage. The Advisor’s fee is also increased in dollar terms from the use of leverage. Consequently, the fund and the Advisor may have differing interests in determining whether to leverage the fund’s assets. Leverage creates risks that may adversely affect the return for the holders of shares, including:
| • | the likelihood of greater volatility of NAV and market price of shares; |
| • | fluctuations in the interest rate paid for the use of the LA; |
| • | increased operating costs, which may reduce the fund’s total return; |
| • | the potential for a decline in the value of an investment acquired through leverage, while the fund’s obligations under such leverage remains fixed; and |
| • | the fund is more likely to have to sell securities in a volatile market in order to meet asset coverage or other debt compliance requirements. |
To the extent the income or capital appreciation derived from securities purchased with funds received from leverage exceeds the cost of leverage, the fund’s return will be greater than if leverage had not been used; conversely, returns would be lower if the cost of the leverage exceeds the income or capital appreciation derived. The use of securities lending to obtain leverage in the fund’s investments may subject the fund to greater risk of loss than would reinvestment of collateral in short term highly rated investments.
In addition to the risks created by the fund’s use of leverage, the fund is subject to the risk that it would be unable to timely, or at all, obtain replacement financing if the LA is terminated. Were this to happen, the fund would be required to de-leverage, selling securities at a potentially inopportune time and incurring tax consequences. Further, the fund’s ability to generate income from the use of leverage would be adversely affected.
Note 8
—
Liquidity Agreement
The fund has entered into a LA with State Street Bank and Trust Company (SSB) that allows it to borrow or otherwise access up to $150.0 million (maximum facility amount) through a line of credit, securities lending and reverse repurchase agreements. The amounts outstanding at December 31, 2023 are shown in the Statement of assets and liabilities as the Liquidity agreement.
The fund pledges its assets as collateral to secure obligations under the LA. The fund retains the risks and rewards of the ownership of assets pledged to secure obligations under the LA and makes these assets available for securities lending and reverse repurchase transactions with SSB acting as the fund’s authorized agent for these transactions. All transactions initiated through SSB are required to be secured with cash collateral received from the securities borrower (the Borrower) or cash is received from the reverse repurchase agreement (Reverse Repo) counterparties. Securities lending transactions will be secured with cash collateral in amounts at least equal to 100% of the market value of the securities utilized in these transactions. Cash received by SSB from securities lending or Reverse Repo transactions is credited against the amounts borrowed under the line of credit. As of December 31, 2023, the LA balance of $125,000,000 was comprised of $10,019,219 from the line of credit and
| | ANNUAL REPORT | JOHN HANCOCK Financial Opportunities Fund | 28 |
$114,980,781 cash received by SSB from securities lending or Reverse Repo transactions.
Upon return of securities by the Borrower or Reverse Repo counterparty, SSB will return the cash collateral to the Borrower or proceeds from the Reverse Repo, as applicable, which will eliminate the credit against the line of credit and will cause the drawdowns under the line of credit to increase by the amounts returned. Income earned on the loaned securities is retained by SSB, and any interest due on the reverse repurchase agreements is paid by SSB.
SSB has indemnified the fund for certain losses that may arise if the Borrower or a Reverse Repo Counterparty fails to return securities when due. With respect to securities lending transactions, upon a default of the securities borrower, SSB uses the collateral received from the Borrower to purchase replacement securities of the same issue, type, class and series. If the value of the collateral is less than the purchase cost of replacement securities, SSB is responsible for satisfying the shortfall but only to the extent that the shortfall is not due to any of the fund’s losses on the reinvested cash collateral. Although the risk of the loss of the securities is mitigated by receiving collateral from the Borrower or proceeds from the Reverse Repo counterparty and through SSB indemnification, the fund could experience a delay in recovering securities or could experience a lower than expected return if the Borrower or Reverse Repo counterparty fails to return the securities on a timely basis.
Effective April 1, 2023, interest charged is at the rate of overnight bank funding rate (OBFR) plus 0.700% and is payable monthly on the aggregate balance of the drawdowns outstanding under the LA. Prior to April 1, 2023, interest was charged at a rate of one month London Interbank Offered Rate (LIBOR) plus 0.60%. As of December 31, 2023, the fund had an aggregate balance of $125,000,000 at an interest rate of 6.02%, which is reflected in the Liquidity agreement on the Statement of assets and liabilities. During the year ended December 31, 2023, the average balance of the LA and the effective average interest rate were $125,000,000 and 5.80%, respectively.
The fund may terminate the LA with 60 days’ notice. If certain asset coverage and collateral requirements, or other covenants are not met, the LA could be deemed in default and result in termination. Absent a default or facility termination event, SSB is required to provide the fund with 360 days’ notice prior to terminating the LA.
Due to the discontinuation of LIBOR, as discussed in Note 9, effective April 1, 2023 the LA was amended to remove LIBOR as the reference rate for interest and has been replaced with OBFR for interest mutually agreed upon by the fund and SSB. However, there remains uncertainty regarding the future utilization of LIBOR and the nature of any replacement rate and the potential effect of a transition away from LIBOR on the fund cannot yet be fully determined.
Note 9
—
LIBOR Discontinuation Risk
Certain debt securities, derivatives and other financial instruments have traditionally utilized LIBOR as the reference or benchmark rate for interest rate calculations. However, following allegations of manipulation and concerns regarding liquidity, the U.K. Financial Conduct Authority (UK FCA) announced that LIBOR would be discontinued as of June 30, 2023. The UK FCA elected to require the ICE Benchmark Administration Limited, the administrator of LIBOR, to continue publishing a subset of British pound sterling and U.S. dollar LIBOR settings on a “synthetic” basis. The synthetic publication of the three-month sterling LIBOR will continue until March 31, 2024, and the publication of the one-, three and six-month U.S. dollar LIBOR will continue until September 30, 2024.
Although the transition process away from LIBOR has become increasingly well-defined in advance of the discontinuation dates, the impact on certain debt securities, derivatives and other financial instruments remains uncertain. Market participants have adopted alternative rates such as Secured Overnight Financing Rate (SOFR) or otherwise amended financial instruments referencing LIBOR to include fallback provisions and other measures that contemplated the discontinuation of LIBOR or other similar market disruption events, but neither the effect of the transition process nor the viability of such measures is known. To facilitate the transition of legacy derivatives contracts referencing LIBOR, the International Swaps and Derivatives Association, Inc. launched a protocol to
| 29 | JOHN HANCOCK Financial Opportunities Fund | ANNUAL REPORT | |
incorporate fallback provisions. However, there are obstacles to converting certain longer term securities and transactions to a new benchmark or benchmarks and the effectiveness of one alternative reference rate versus multiple alternative reference rates in new or existing financial instruments and products has not been determined. Certain proposed replacement rates to LIBOR, such as SOFR, which is a broad measure of secured overnight U.S. Treasury repo rates, are materially different from LIBOR, and changes in the applicable spread for financial instruments transitioning away from LIBOR will need to be made to accommodate the differences.
The utilization of an alternative reference rate, or the transition process to an alternative reference rate, may adversely affect the fund’s performance.
Note 10
—
Purchase and sale of securities
Purchases and sales of securities, other than short-term investments, amounted to $87,735,125 and $119,362,593, respectively, for the year ended December 31, 2023.
Note 11
—
Industry or sector risk
The fund may invest a large percentage of its assets in one or more particular industries or sectors of the economy. If a large percentage of the fund’s assets are economically tied to a single or small number of industries or sectors of the economy, the fund will be less diversified than a more broadly diversified fund, and it may cause the fund to underperform if that industry or sector underperforms. In addition, focusing on a particular industry or sector may make the fund’s NAV more volatile. Further, a fund that invests in particular industries or sectors is particularly susceptible to the impact of market, economic, regulatory and other factors affecting those industries or sectors. Financial services companies can be hurt by economic declines, changes in interest rates, and regulatory and market impacts.
Note 12
—
Investment in affiliated underlying funds
The fund may invest in affiliated underlying funds that are managed by the Advisor and its affiliates. Information regarding the fund’s fiscal year to date purchases and sales of the affiliated underlying funds as well as income and capital gains earned by the fund, if any, is as follows:
| | | | | | | | Dividends and distributions |
| Affiliate | Ending
share
amount | Beginning
value | Cost of
purchases | Proceeds
from shares
sold | Realized
gain
(loss) | Change in
unrealized
appreciation
(depreciation) | Income
distributions
received | Capital gain
distributions
received | Ending
value |
| John Hancock Collateral Trust | 435,363 | $1,253,479 | $121,078,470 | $(117,976,563) | $(1,056) | $(609) | $205,546 | — | $4,353,721 |
Note 13
—
Restricted securities
The fund may hold restricted securities which are restricted as to resale and the fund has limited rights to registration under the Securities Act of 1933. Disposal may involve time-consuming negotiations and expenses, and prompt sale at an acceptable price may be difficult to achieve. The following table summarizes the restricted securities held at December 31, 2023:
Issuer,
Description | Original
acquisition date | Acquisition
cost | Beginning
share
amount | Shares
purchased | Shares
sold | Ending
share
amount | Value as a
percentage of
net assets | Ending
value |
| Bremer Financial Corp. | 10-25-19 | $5,000,040 | 41,667 | — | — | 41,667 | 0.7% | $4,229,159 |
| Walden Mutual | 9-1-22 | 1,000,000 | 100,000 | — | — | 100,000 | 0.1% | 667,800 |
| | | | | | | | | $4,896,959 |
| | ANNUAL REPORT | JOHN HANCOCK Financial Opportunities Fund | 30 |
Note 14
—
Transactions in securities of affiliated issuers
Affiliated issuers, as defined by the 1940 Act, are those in which the fund’s holdings of an issuer represent 5% or more of the outstanding voting securities of the issuer. A summary of the fund’s transactions in the securities of these issuers during the year ended December 31, 2023, is set forth below:
| | | | | | | | Dividends and distributions |
| Affiliate | Ending
share
amount | Beginning
value | Cost of
purchases | Proceeds
from shares
sold | Realized
gain
(loss) | Change in
unrealized
appreciation
(depreciation) | Income
distributions
received | Capital gain
distributions
received | Ending
value |
| First Reliance Bancshares, Inc. | 426,454 | $3,697,356 | — | — | — | $(42,645) | — | — | $3,654,711 |
Note 15
—
New accounting pronouncement
In March 2020, the Financial Accounting Standards Board (FASB) issued an Accounting Standards Update (ASU), ASU 2020-04, Reference Rate Reform (Topic 848), which provides optional, temporary relief with respect to the financial reporting of contracts subject to certain types of modifications due to the discontinuation of the LIBOR and other IBOR-based reference rates as of the end of 2021. In January 2021 and December 2022, the FASB issued ASU No. 2021-01 and ASU No. 2022-06, with further amendments to Topic 848. The temporary relief provided by ASU 2020-04 is effective for certain reference rate-related contract modifications that occur during the period March 12, 2020 through December 31, 2024. Management expects that the adoption of the guidance will not have a material impact to the financial statements.
| 31 | JOHN HANCOCK Financial Opportunities Fund | ANNUAL REPORT | |
Report of Independent Registered Public Accounting Firm
To the Board of Trustees and Shareholders of John Hancock Financial Opportunities Fund
Opinion on the Financial Statements
We have audited the accompanying statement of assets and liabilities, including the fund’s investments, of John Hancock Financial Opportunities Fund (the "Fund") as of December 31, 2023, the related statements of operations and cash flows for the year ended December 31, 2023, the statements of changes in net assets for each of the two years in the period ended December 31, 2023, including the related notes, and the financial highlights for each of the five years in the period ended December 31, 2023 (collectively referred to as the “financial statements”). In our opinion, the financial statements present fairly, in all material respects, the financial position of the Fund as of December 31, 2023, the results of its operations and its cash flows for the year then ended, the changes in its net assets for each of the two years in the period ended December 31, 2023 and the financial highlights for each of the five years in the period ended December 31, 2023 in conformity with accounting principles generally accepted in the United States of America.
These financial statements are the responsibility of the Fund’s management. Our responsibility is to express an opinion on the Fund’s financial statements based on our audits. We are a public accounting firm registered with the Public Company Accounting Oversight Board (United States) (PCAOB) and are required to be independent with respect to the Fund in accordance with the U.S. federal securities laws and the applicable rules and regulations of the Securities and Exchange Commission and the PCAOB.
We conducted our audits of these financial statements in accordance with the standards of the PCAOB. Those standards require that we plan and perform the audit to obtain reasonable assurance about whether the financial statements are free of material misstatement, whether due to error or fraud.
Our audits included performing procedures to assess the risks of material misstatement of the financial statements, whether due to error or fraud, and performing procedures that respond to those risks. Such procedures included examining, on a test basis, evidence regarding the amounts and disclosures in the financial statements. Our audits also included evaluating the accounting principles used and significant estimates made by management, as well as evaluating the overall presentation of the financial statements. Our procedures included confirmation of securities owned as of December 31, 2023 by correspondence with the custodian, transfer agent and brokers; when replies were not received from brokers, we performed other auditing procedures. We believe that our audits provide a reasonable basis for our opinion.
/s/ PricewaterhouseCoopers LLP
Boston, Massachusetts
February 16, 2024
We have served as the auditor of one or more investment companies in the John Hancock group of funds since 1988.
| | ANNUAL REPORT | JOHN HANCOCK FINANCIAL OPPORTUNITIES FUND | 32 |
(Unaudited)
For federal income tax purposes, the following information is furnished with respect to the distributions of the fund, if any, paid during its taxable year ended December 31, 2023.
The fund reports the maximum amount allowable of its net taxable income as eligible for the corporate dividends-received deduction.
The fund reports the maximum amount allowable of its net taxable income as qualified dividend income as provided in the Jobs and Growth Tax Relief Reconciliation Act of 2003.
The fund reports the maximum amount allowable as Section 163(j) Interest Dividends.
The fund paid $38,683,182 in long term capital gain dividends.
The fund reports the maximum amount allowable of its Section 199A dividends as defined in Proposed Treasury Regulation §1.199A-3(d).
Eligible shareholders will be mailed a 2023 Form 1099-DIV in early 2024. This will reflect the tax character of all distributions paid in calendar year 2023.
Please consult a tax advisor regarding the tax consequences of your investment in the fund.
| 33 | JOHN HANCOCK FINANCIAL OPPORTUNITIES FUND | ANNUAL REPORT | |
Investment objective, principal investment strategies, and principal risks
Unaudited
The fund’s primary investment objective is to provide a high level of total return consisting of long-term capital appreciation and current income.
Principal Investment Strategies
Under normal circumstances, the fund will invest at least 80% of its net assets in equity securities of U.S. and foreign financial services companies of any size. These companies may include, but are not limited to, banks, thrifts, finance and financial technology companies, brokerage and advisory firms, real estate-related firms, insurance companies and financial holding companies. The equity securities in which the fund may invest are common stocks, preferred stocks, warrants, stock purchase rights and securities convertible into other equity securities. Because the fund normally invests more than 25% of its assets in securities of issuers in the banking and thrift industry, the fund is considered to be “concentrated” in this industry. “Net assets” is defined as net assets plus any borrowings for investment purposes. The fund will notify shareholders at least 60 days prior to any change in this 80% policy.
The fund may invest up to 20% of its total assets in common and preferred equity securities and other preferred securities of foreign banking, lending and financial services companies, including securities quoted in foreign currencies. The fund may invest in investment grade securities for lower volatility and yields that potentially meet or exceed the fund’s distribution. The fund will focus on common and preferred equity securities of issuers, in that the Advisor believes are undervalued by the marketplace as indicated by, among other factors: (1) the value and quality of the underlying assets of the financial services companies; and (2) the value of a financial services company relative to its earnings potential and to market valuations of comparable companies.
The fund may invest in securities of issuers that are small from a national perspective but have a significant share of their local market. The Advisor intends to focus its investment analysis on delinquency trends, reserve levels and investment and loan portfolio compositions, among other things, in assessing asset quality.
Under normal market conditions, the fund may also invest up to 20% of its net assets in the common and preferred equity securities and other preferred securities of non-financial services companies. The fund may also invest in debt securities that are rated, at the time of purchase, below investment grade (junk bonds) (i.e., rated “Ba” or lower by Moody’s or “BB” or lower by S&P), or in unrated securities determined by the fund’s Advisor or Subadvisor to be of comparable quality. The fund will not purchase debt securities rated below C or which are in default at the time of purchase.
The fund may enter into interest-rate swaps for the purposes of reducing risk, obtaining efficient market exposure, and/or enhancing investment returns. The fund may engage in portfolio trading, may issue preferred shares, borrow or issue short-term debt securities, and enter into reverse repurchase agreements to obtain investment leverage either alone and/or in combination with other forms of investment leverage or for temporary purposes. The fund utilizes a liquidity agreement to increase its assets available for investments, and may also seek to obtain additional income or portfolio leverage by making secured loans of its portfolio securities with a value of up to 33 1/3% of its total assets.
The manager may also take into consideration environmental, social, and/or governance (ESG) factors, alongside other relevant factors, as part of its investment selection process. The ESG characteristics utilized in the fund’s investment process may change over time and one or more characteristics may not be relevant with respect to all issuers that are eligible fund investments.
| | ANNUAL REPORT | JOHN HANCOCK FINANCIAL OPPORTUNITIES FUND | 34 |
As is the case with all exchange-listed closed-end funds, shares of this fund may trade at a discount or a premium to the fund’s net asset value (NAV). An investment in the fund is subject to investment and market risks, including the possible loss of the entire principal invested.
The fund’s main risks are listed below in alphabetical order, not in order of importance.
Banking industry risk.
Commercial banks, savings and loan associations, and holding companies of the foregoing are especially subject to adverse effects of volatile interest rates, concentrations of loans in particular industries, and significant competition. Profitability of these businesses depends significantly upon the availability and cost of capital funds. Commercial banks and savings associations are subject to extensive federal and state regulation.
Changing distribution level & return of capital risk.
There is no guarantee prior distribution levels will be maintained, and distributions may include a substantial tax return of capital. A return of capital is the return of all or a portion of a shareholder’s investment in the fund.
Concentration risk.
Because the fund focuses on a single industry or sector of the economy, its performance depends in large part on the performance of that industry or sector. As a result, the value of an investment may fluctuate more widely since it is more susceptible to market, economic, political, regulatory, and other conditions and risks affecting that industry or sector than a fund that invests more broadly across industries a
Credit and counterparty risk.
The issuer or guarantor of a fixed-income security, the counterparty to an over-the-counter derivatives contract, or a borrower of fund securities may not make timely payments or otherwise honor its obligations. A downgrade or default affecting any of the fund’s securities could affect the fund’s performance.
Economic and market events risk.
Events in the U.S. and global financial markets, including actions taken by the U.S. Federal Reserve or foreign central banks to stimulate or stabilize economic growth, may at times result in unusually high market volatility, which could negatively impact performance. Reduced liquidity in credit and fixed-income markets could adversely affect issuers worldwide. Financial institutions could suffer losses as interest rates rise or economic conditions deteriorate.
Equity securities risk.
The price of equity securities may decline due to changes in a company’s financial condition or overall market conditions. Securities the manager believes are undervalued may never realize their full potential value, and in certain markets value stocks may underperform the market as a whole.
ESG integration risk.
The manager considers ESG factors that it deems relevant or additive, along with other material factors and analysis, when managing the fund. The portion of the fund’s investments for which the manager considers these ESG factors may vary, and could increase or decrease over time. In certain situations, the extent to which these
ESG factors may be applied according to the manager’s integrated investment process may not include U.S. Treasuries, government securities, or other asset classes. ESG factors may include, but are not limited to, matters regarding board diversity, climate change policies, and supply chain and human rights policies. Incorporating ESG criteria and making
investment decisions based on certain ESG characteristics, as determined by the Advisor, carries the risk that the fund may perform differently, including underperforming funds that do not utilize ESG criteria or funds that utilize different ESG criteria. Integration of ESG factors into the fund’s investment process may result in a manager making different
investments for the fund than for a fund with a similar investment universe and/or investment style that does not incorporate such considerations in its investment strategy or processes, and the fund’s investment performance may be affected. Because ESG factors are one of many considerations for the fund, the manager may nonetheless include
companies with low ESG characteristics or exclude companies with high ESG characteristics in the fund’s investments.
| 35 | JOHN HANCOCK FINANCIAL OPPORTUNITIES FUND | | |
Fixed-income securities risk.
A rise in interest rates typically causes bond prices to fall. The longer the average maturity or duration of the bonds held by a fund, the more sensitive it will likely be to interest-rate fluctuations. An issuer may not make all interest payment or repay all or any of the principal borrowed. Changes in a security’s credit qualify may adversely affect fund performance. Additionally, the value of inflation-indexed securities is subject to the effects of changes in market interest rates caused by factors other than inflation (“real interest rates”). Generally, when real interest rates rise, the value of inflation-indexed securities will fall and the fund’s value may decline as a result of this exposure to these securities.
Foreign securities risk.
Less information may be publicly available regarding foreign issuers, including foreign government issuers. Foreign securities may be subject to foreign taxes and may be more volatile than U.S. securities. Currency fluctuations and political and economic developments may adversely impact the value of foreign securities. The risks of investing in foreign securities are magnified in emerging markets. If applicable, depositary receipts are subject to most of the risks associated with investing in foreign securities directly because the value of a depositary receipt is dependent upon the market price of the underlying foreign equity security. Depositary receipts are also subject to liquidity risk and the fund’s value may decline as a result of this exposure to these securities.
Hedging, derivatives, and other strategic transactions risk.
Hedging, derivatives, and other strategic transactions may increase a fund’s volatility and could produce disproportionate losses, potentially more than the fund’s principal investment. Risks of these transactions are different from and possibly greater than risks of investing directly in securities and other traditional instruments. Under certain market conditions, derivatives could become harder to value or sell and may become subject to liquidity risk (i.e., the inability to enter into closing transactions). Derivatives and other strategic transactions that the fund intends to utilize include: interest rate swaps and reverse repurchase agreements. Swaps generally are subject to counterparty risk. In addition, swaps may be subject to interest-rate and settlement risk, and the risk of default of the underlying reference obligation. An event of default or insolvency of the counterparty to a reverse repurchase agreement could result in delays or restrictions with respect to the fund’s ability to dispose of the underlying securities, in addition, a reverse repurchase agreement may be considered a form of leverage and may, therefore, increase fluctuations in the fund’s net asset value per share (NAV).
Large company risk.
Larger companies may grow more slowly than smaller companies or be slower to respond to business developments. Large-capitalization securities may underperform the market as a whole.
Leveraging risk.
Issuing preferred shares or using derivatives may result in a leveraged portfolio. Leveraging long exposures increases a fund’s losses when the value of its investments declines. Some derivatives have the potential for unlimited loss, regardless of the size of the initial investment. The fund also utilizes a Liquidity Agreement to increase its assets available for investment. See “Note 7 —Leverage risk” above.
LIBOR discontinuation risk.
The official publication of the London Interbank Offered Rate (LIBOR), which many debt securities, derivatives and other financial instruments traditionally utilized as the reference or benchmark rate for interest rate calculations, was discontinued as of June 30, 2023. However, a subset of British pound sterling and U.S. dollar LIBOR settings will continue to be published on a “synthetic” basis. The synthetic publication of the three-month sterling LIBOR will continue until March 31, 2024, and the publication of the one-, three- and six-month U.S. dollar LIBOR will continue until September 30, 2024. The discontinuation of LIBOR and a transition to replacement rates may lead to volatility and illiquidity in markets and may adversely affect the fund’s performance.
Liquidity risk.
The extent (if at all) to which a security may be sold or a derivative position closed without negatively impacting its market value may be impaired by reduced market activity or participation, legal restrictions, or other economic and market impediments.
| | ANNUAL REPORT | JOHN HANCOCK FINANCIAL OPPORTUNITIES FUND | 36 |
Lower-rated and high-yield fixed-income securities risk.
Lower-rated and high-yield fixed-income securities (junk bonds) are subject to greater credit quality risk, risk of default, and price volatility than higher-rated fixed-income securities, may be considered speculative, and can be difficult to resell.
Operational and cybersecurity risk.
Cybersecurity breaches may allow an unauthorized party to gain access to fund assets, customer data, or proprietary information, or cause a fund or its service providers to suffer data corruption or lose operational functionality. Similar incidents affecting issuers of a fund’s securities may negatively impact performance. Operational risk may arise from human error, error by third parties, communication errors, or technology failures, among other causes.
Preferred and convertible securities risk.
Preferred stock dividends are payable only if declared by the issuer’s board. Preferred stock may be subject to redemption provisions. The market values of convertible securities tend to fall as interest rates rise and rise as interest rates fall. Convertible preferred stock’s value can depend heavily upon the underlying common stock’s value.
Real estate investment trust risk.
REITs, pooled investment vehicles that typically invest in real estate directly or in loans collateralized by real estate, carry risks associated with owning real estate, including the potential for a decline in value due to economic or market conditions.
Real estate securities risk.
Securities of companies in the real estate industry carry risks associated with owning real estate, including the potential for a decline in value due to economic or market conditions.
Small and mid-sized company risk.
Small and mid-sized companies are generally less established and may be more volatile than larger companies. Small and/or mid-capitalization securities may underperform the market as a whole.
| 37 | JOHN HANCOCK FINANCIAL OPPORTUNITIES FUND | ANNUAL REPORT | |
Unaudited
The fund is a closed-end, diversified management investment company, shares of which were initially offered to the public in August 1994.
Dividends and distributions
During the year ended December 31, 2023, distributions from net investment income totaling $0.6200 per share and distributions from capital gains totaling $1.9800 per share were paid to shareholders. The dates of payments and the amounts per share were as follows:
| Payment Date | Distributions |
| March 31, 2023 | $0.6500 |
| June 30, 2023 | 0.6500 |
| September 29, 2023 | 0.6500 |
| December 29, 2023 | 0.6500 |
| Total | $2.6000 |
Dividend reinvestment plan
The fund’s Dividend Reinvestment Plan (the Plan) provides that distributions of dividends and capital gains are automatically reinvested in common shares of the fund by Computershare Trust Company, N.A. (the Plan Agent). Every shareholder holding at least one full share of the fund is entitled to participate in the Plan. In addition, every shareholder who became a shareholder of the fund after June 30, 2011, and holds at least one full share of the fund will be automatically enrolled in the Plan. Shareholders may withdraw from the Plan at any time and shareholders who do not participate in the Plan will receive all distributions in cash.
If the fund declares a dividend or distribution payable either in cash or in common shares of the fund and the market price of shares on the payment date for the distribution or dividend equals or exceeds the fund’s net asset value per share (NAV), the fund will issue common shares to participants at a value equal to the higher of NAV or 95% of the market price. The number of additional shares to be credited to each participant’s account will be determined by dividing the dollar amount of the distribution or dividend by the higher of NAV or 95% of the market price. If the market price is lower than NAV, or if dividends or distributions are payable only in cash, then participants will receive shares purchased by the Plan Agent on participants’ behalf on the NYSE or otherwise on the open market. If the market price exceeds NAV before the Plan Agent has completed its purchases, the average per share purchase price may exceed NAV, resulting in fewer shares being acquired than if the fund had issued new shares.
There are no brokerage charges with respect to common shares issued directly by the fund. However, whenever shares are purchased or sold on the NYSE or otherwise on the open market, each participant will pay a pro rata portion of brokerage trading fees, currently $0.05 per share purchased or sold. Brokerage trading fees will be deducted from amounts to be invested.
The reinvestment of dividends and net capital gains distributions does not relieve participants of any income tax that may be payable on such dividends or distributions.
Shareholders participating in the Plan may buy additional shares of the fund through the Plan at any time in amounts of at least $50 per investment, up to a maximum of $10,000, with a total calendar year limit of $100,000. Shareholders will be charged a $5 transaction fee plus $0.05 per share brokerage trading fee for each order. Purchases of additional shares of the fund will be made on the open market. Shareholders who elect to utilize monthly electronic fund transfers to buy additional shares of the fund will be charged a $2 transaction fee plus $0.05 per share brokerage trading fee for each automatic purchase. Shareholders can also sell fund shares held in the Plan account at any time by contacting the Plan Agent by telephone, in writing or by visiting the Plan
| | ANNUAL REPORT | JOHN HANCOCK FINANCIAL OPPORTUNITIES FUND | 38 |
Agent’s website at www.computershare.com/investor. The Plan Agent will mail a check (less applicable brokerage trading fees) on settlement date. Pursuant to regulatory changes, effective September 5, 2017, the settlement date is changed from three business days after the shares have been sold to two business days after the shares have been sold. If shareholders choose to sell shares through their stockbroker, they will need to request that the Plan Agent electronically transfer those shares to their stockbroker through the Direct Registration System.
Shareholders participating in the Plan may withdraw from the Plan at any time by contacting the Plan Agent by telephone, in writing or by visiting the Plan Agent’s website at www.computershare.com/investor. Such termination will be effective immediately if the notice is received by the Plan Agent prior to any dividend or distribution record date; otherwise, such termination will be effective on the first trading day after the payment date for such dividend or distribution, with respect to any subsequent dividend or distribution. If shareholders withdraw from the Plan, their shares will be credited to their account; or, if they wish, the Plan Agent will sell their full and fractional shares and send the shareholders the proceeds, less a transaction fee of $5 and less brokerage trading fees of $0.05 per share. If a shareholder does not maintain at least one whole share of common stock in the Plan account, the Plan Agent may terminate such shareholder’s participation in the Plan after written notice. Upon termination, shareholders will be sent a check for the cash value of any fractional share in the Plan account, less any applicable broker commissions and taxes.
Shareholders who hold at least one full share of the fund may join the Plan by notifying the Plan Agent by telephone, in writing or by visiting the Plan Agent’s website at www.computershare.com/investor. If received in proper form by the Plan Agent before the record date of a dividend, the election will be effective with respect to all dividends paid after such record date. If shareholders wish to participate in the Plan and their shares are held in the name of a brokerage firm, bank or other nominee, shareholders should contact their nominee to see if it will participate in the Plan. If shareholders wish to participate in the Plan, but their brokerage firm, bank or other nominee is unable to participate on their behalf, they will need to request that their shares be re-registered in their own name, or they will not be able to participate. The Plan Agent will administer the Plan on the basis of the number of shares certified from time to time by shareholders as representing the total amount registered in their name and held for their account by their nominee.
Experience under the Plan may indicate that changes are desirable. Accordingly, the fund and the Plan Agent reserve the right to amend or terminate the Plan. Participants generally will receive written notice at least 90 days before the effective date of any amendment. In the case of termination, participants will receive written notice at least 90 days before the record date for the payment of any dividend or distribution by the fund.
All correspondence or requests for additional information about the Plan should be directed to Computershare Trust Company, N.A., at the address stated below, or by calling 800-852-0218, 201-680-6578 (For International Telephone Inquiries) and 800-952-9245 (For the Hearing Impaired (TDD)).
The following information is presented in conformance with annual reporting requirements for funds that have filed a registration statement pursuant to General Instruction A.2 of Form N-2 (“Short Form N-2”), sets forth each class of senior securities outstanding of the fund for the years ended, as indicated below. Refer to the “Financial highlights” for the most recent five years of senior securities outstanding, which have been audited by PricewaterhouseCoopers LLP (“PwC”), the fund’s independent registered public accounting firm. The report of PwC is included within this report.
| Senior securities | 12-31-18 | 12-31-17 | 12-31-16 | 12-31-15 | 10-31-15 | 10-31-14 |
| Total debt outstanding end of period (in millions) | $120 | $110 | $110 | $110 | $110 | $110 |
| Asset coverage per $1,000 of debt 1 | $5,522 | $7,265 | $6,922 | $5,419 | $5,385 | $5,244 |
| 39 | JOHN HANCOCK FINANCIAL OPPORTUNITIES FUND | ANNUAL REPORT | |
| 1 | Asset coverage equals the total net assets plus borrowings divided by the borrowings of the fund outstanding at period end (Note 8). As debt outstanding changes, the level of invested assets may change accordingly. Asset coverage ratio provides a measure of leverage. |
The following information is presented in conformance with annual reporting requirements for funds that have filed a registration statement pursuant to General Instruction A.2 of Short Form N-2. The purpose of the table below is to help you understand all fees and expenses that you, as a common shareholder, would bear directly or indirectly. In accordance with SEC requirements, the table below shows the fund’s expenses as a percentage of its average net assets as of December 31, 2023, and not as a percentage of total assets. By showing expenses as a percentage of average net assets, expenses are not expressed as a percentage of all of the assets in which the fund invests. The offering costs to be paid or reimbursed by the fund are not included in the annual expenses table below. However, these expenses will be borne by common shareholders and may result in a reduction in the
N
AV of the common shares. The table and example are based on the fund’s capital structure as of December 31, 2023.
| Shareholder Transaction Expenses | |
| Sales load ( as a percentage of offering price )1 | — % |
| Offering expenses ( as a percentage of offering price )1 | % |
| Dividend Reinvestment Plan fees 2 | None |
Annual Expenses ( Percentage of Net Assets Attributable to Common Shares ) | |
| Management fees 3 | 1.38 % |
| Interest payments on borrowed funds 4 | 1.36 % |
| Other expenses | 0.42 % |
| Total Annual Operating Expenses | 3.16 % |
| Contractual Expense Reimbursement 5 | (0.20) % |
| Total Annual Fund Operating Expenses After Expense Reimbursements | 2.96 % |
| | |
| 1 | If common shares are sold to or through underwriters, the fund’s prospectus will set forth any applicable sales load and the estimated offering expenses. |
| 2 | Participants in the fund’s dividend reinvestment plan do not pay brokerage charges with respect to common shares issued directly by the fund. However, whenever common shares are purchased or sold on the NYSE or otherwise on the open market, each participant will pay a pro rata portion of brokerage trading fees, currently $0.05 per share purchased or sold. Brokerage trading fees will be deducted from amounts to be invested. Shareholders participating in the Plan may buy additional common shares of the fund through the Plan at any time and will be charged a $5 transaction fee plus $0.05 per share brokerage trading fee for each order. See “Dividends and distributions” and “Dividend reinvestment plan”. |
| 3 | See "Note 5 – Fees and transactions with affiliates.” |
| 4 | The fund uses leverage by borrowing under a liquidity agreement. “Interest payments on borrowed funds” includes all interest paid in connection with outstanding loans. See “Note 8 - “Liquidity Agreement.” |
| 5 | The Advisor has contractually agreed to waive a portion of its management fee and/or reimburse expenses for certain funds of the John Hancock group of funds complex, including the fund (the participating portfolios). This waiver is based upon aggregate managed assets of all the participating portfolios. The amount of the reimbursement is calculated daily and allocated among all the participating portfolios in proportion to the daily net assets of each fund. During the year ended December 31, 2023, this waiver amounted to 0.01% of the fund’s average daily net assets. This arrangement expires on July 31, 2025, unless renewed by mutual agreement of the fund and the Advisor based upon a determination that this is appropriate under the circumstances at that time.The Advisor contractually agrees to limit its administration fee to 0.10% of the fund’s average weekly gross assets. This agreement expires on April 30, 2025, unless renewed by mutual agreement of the fund and the Advisor based upon a determination that this is appropriate under the circumstances at that time. |
Example
The following example illustrates the expenses that Common Shareholders would pay on a $1,000 investment in common shares, assuming (i) total annual expenses set forth above, including any reimbursements through their current expiration date; ; (ii) (a 5% annual return; and (iii) all distributions are reinvested at NAV:
| | ANNUAL REPORT | JOHN HANCOCK FINANCIAL OPPORTUNITIES FUND | 40 |
| | 1 Year | 3 Years | 5 Years | 10 Years |
| Total Expenses | $30 | $96 | $164 | $345 |
The above table and example and the assumption in the example of a 5% annual return are required by regulations of the SEC that are applicable to all investment companies; the assumed 5% annual return is not a prediction of, and does not represent, the projected or actual performance of the fund’s common shares. For more complete descriptions of certain of the fund’s costs and expenses, see “Management of the Fund” in the fund’s prospectus. In addition, while the example assumes reinvestment of all dividends and distributions at NAV, participants in the Fund’s dividend reinvestment plan may receive Common Shares purchased or issued at a price or value different from NAV. See “Distribution Policy” and “Dividend Reinvestment Plan” in the fund’s prospectus.
The example should not be considered a representation of past or future expenses, and the fund’s actual expenses may be greater or less than those shown. Moreover, the fund’s actual rate of return may be greater or less than the hypothetical 5% return shown in the example.
Market and Net Asset Value Information
The following table, presented in conformance with annual reporting requirements for funds that have filed a registration statement pursuant to General Instruction A.2 of Short Form N-2, sets forth, for each of the periods indicated, the high and low closing market prices of the fund’s Common Shares on the NYSE, the high and low NAV per common share and the high and low premium/discount to NAV per common share. See Note 2, Investment Valuation and Fair Value Measurements in the Notes to Financial Statements for information as to how the Fund’s NAV is determined.
The fund’s currently outstanding Common Shares are listed on the New York Stock Exchange (“NYSE”) under the symbol BTO and commenced trading on the NYSE in 1994.
The fund’s common shares have traded both at a premium and at a discount to its net asset value (“NAV”). The fund cannot predict whether its shares will trade in the future at a premium or discount to NAV. The provisions of the 1940 Act generally require that the public offering price of common shares (less any underwriting commissions and discounts) must equal or exceed the NAV per share of a company’s common stock (calculated within 48 hours of pricing). The fund’s issuance of common shares may have an adverse effect on prices in the secondary market for common shares by increasing the number of common shares available, which may put downward pressure on the market price for common shares. Shares of common stock of closed-end investment companies frequently trade at a discount from NAV. See “Risk Factors—General Risks—Market Discount Risk” and “—Secondary Market for the Common Shares” in the within the fund’s prospectus.
The following table sets forth for each of the periods indicated the high and low closing market prices for common shares on the NYSE, and the corresponding NAV per share and the premium or discount to NAV per share at which the fund’s common shares were trading as of such date. NAV is determined once daily as of the close of regular trading of the NYSE (typically 4:00 P.M., Eastern Time). See “Determination of Net Asset Value” within the fund’s prospectus for information as to the determination of the fund’s NAV.
| | Market Price | NAV per Share on
Date of Market Price
High and Low | Premium/(Discount) on
Date of Market Price
High and Low |
| Fiscal Quarter Ended | High | Low | High | Low | High | Low |
| March 31, 2022 | 52.03 | 40.20 | 42.91 | 37.50 | 21.25% | 7.20% |
| June 30, 2022 | 40.80 | 32.16 | 36.22 | 31.13 | 12.64% | 3.31% |
| September 30, 2022 | 39.84 | 31.20 | 36.43 | 31.49 | 9.36% | -0.92% |
| December 31, 2022 | 36.52 | 30.14 | 36.11 | 31.69 | 1.14% | -4.89% |
| March 31, 2023 | 38.20 | 28.14 | 34.51 | 25.52 | 10.69% | 10.27% |
| June 30, 2023 | 30.54 | 22.99 | 26.36 | 21.82 | 15.86% | 5.36% |
| 41 | JOHN HANCOCK FINANCIAL OPPORTUNITIES FUND | ANNUAL REPORT | |
| | Market Price | NAV per Share on
Date of Market Price
High and Low | Premium/(Discount) on
Date of Market Price
High and Low |
| Fiscal Quarter Ended | High | Low | High | Low | High | Low |
| September 30, 2023 | 31.05 | 25.11 | 28.52 | 24.25 | 8.87% | 3.55% |
| December 31, 2023 | 30.96 | 23.12 | 30.47 | 23.04 | 1.61% | 0.35% |
The fund does not believe that there are any material unresolved written comments, received 180 days or more before December 31, 2023, from the Staff of the SEC regarding any of the fund’s periodic or current reports under the Securities Exchange Act or the 1940 Act, or its registration statement.
Shareholder communication and assistance
If you have any questions concerning the fund, we will be pleased to assist you. If you hold shares in your own name and not with a brokerage firm, please address all notices, correspondence, questions or other communications regarding the fund to the transfer agent at:
Regular Mail:
Computershare
P.O. Box 43006
Providence, RI 02940-3078
Registered or Overnight Mail:
Computershare
150 Royall Street, Suite 101
Canton, MA 02021
If your shares are held with a brokerage firm, you should contact that firm, bank or other nominee for assistance.
| | ANNUAL REPORT | JOHN HANCOCK FINANCIAL OPPORTUNITIES FUND | 42 |
This chart provides information about the Trustees and Officers who oversee your John Hancock fund. Officers elected by the Trustees manage the day-to-day operations of the fund and execute policies formulated by the Trustees.
| Independent Trustees | | |
Name, year of birth
Position(s) held with fund
Principal occupation(s) and other
directorships during past 5 years | | Number of John
Hancock funds
overseen by
Trustee |
Hassell H. McClellan, 2 Born: 1945 | 2012 | |
| Trustee and Chairperson of the Board | | |
| Director/Trustee, Virtus Funds (2008-2020); Director, The Barnes Group (2010-2021); Associate Professor, The Wallace E. Carroll School of Management, Boston College (retired 2013). Trustee (since 2005) and Chairperson of the Board (since 2017) of various trusts within the John Hancock Fund Complex. |
| James R. Boyle, Born: 1959 | 2015 | |
| Trustee | | |
| Board Member, United of Omaha Life Insurance Company (since 2022). Board Member, Mutual of Omaha Investor Services, Inc. (since 2022). Foresters Financial, Chief Executive Officer (2018–2022) and board member (2017–2022). Manulife Financial and John Hancock, more than 20 years, retiring in 2012 as Chief Executive Officer, John Hancock and Senior Executive Vice President, Manulife Financial. Trustee of various trusts within the John Hancock Fund Complex (2005–2014 and since 2015). |
William H. Cunningham, 3 Born: 1944 | 1995 | |
| Trustee | | |
| Professor, University of Texas, Austin, Texas (since 1971); former Chancellor, University of Texas System and former President of the University of Texas, Austin, Texas; Director (since 2006), Lincoln National Corporation (insurance); Director, Southwest Airlines (since 2000). Trustee of various trusts within the John Hancock Fund Complex (since 1986). |
| Noni L. Ellison, Born: 1971 | 2022 | |
| Trustee | | |
| Senior Vice President, General Counsel & Corporate Secretary, Tractor Supply Company (rural lifestyle retailer) (since 2021); General Counsel, Chief Compliance Officer & Corporate Secretary, Carestream Dental, L.L.C. (2017–2021); Associate General Counsel & Assistant Corporate Secretary, W.W. Grainger, Inc. (global industrial supplier) (2015–2017); Board Member, Goodwill of North Georgia, 2018 (FY2019)–2020 (FY2021); Board Member, Howard University School of Law Board of Visitors (since 2021); Board Member, University of Chicago Law School Board of Visitors (since 2016); Board member, Children’s Healthcare of Atlanta Foundation Board (2021–2023). Trustee of various trusts within the John Hancock Fund Complex (since 2022). |
| Grace K. Fey, Born: 1946 | 2012 | |
| Trustee | | |
| Chief Executive Officer, Grace Fey Advisors (since 2007); Director and Executive Vice President, Frontier Capital Management Company (1988–2007); Director, Fiduciary Trust (since 2009). Trustee of various trusts within the John Hancock Fund Complex (since 2008). |
| Dean C. Garfield, Born: 1968 | 2022 | |
| Trustee | | |
| Vice President, Netflix, Inc. (since 2019); President & Chief Executive Officer, Information Technology Industry Council (2009–2019); NYU School of Law Board of Trustees (since 2021); Member, U.S. Department of Transportation, Advisory Committee on Automation (since 2021); President of the United States Trade Advisory Council (2010–2018); Board Member, College for Every Student (2017–2021); Board Member, The Seed School of Washington, D.C. (2012–2017); Advisory Board Member of the Block Center for Technology and Society (since 2019). Trustee of various trusts within the John Hancock Fund Complex (since 2022). |
| 43 | JOHN HANCOCK FINANCIAL OPPORTUNITIES FUND | ANNUAL REPORT | |
Independent Trustees (continued) | | |
Name, year of birth
Position(s) held with fund
Principal occupation(s) and other
directorships during past 5 years | | Number of John
Hancock funds
overseen by
Trustee |
| Deborah C. Jackson, Born: 1952 | 2008 | |
| Trustee | | |
| President, Cambridge College, Cambridge, Massachusetts (2011-2023); Board of Directors, Amwell Corporation (since 2020); Board of Directors, Massachusetts Women’s Forum (2018-2020); Board of Directors, National Association of Corporate Directors/New England (2015-2020); Chief Executive Officer, American Red Cross of Massachusetts Bay (2002–2011); Board of Directors of Eastern Bank Corporation (since 2001); Board of Directors of Eastern Bank Charitable Foundation (since 2001); Board of Directors of Boston Stock Exchange (2002–2008); Board of Directors of Harvard Pilgrim Healthcare (health benefits company) (2007–2011). Trustee of various trusts within the John Hancock Fund Complex (since 2008). |
| Steven R. Pruchansky, Born: 1944 | 1994 | |
| Trustee and Vice Chairperson of the Board | | |
| Managing Director, Pru Realty (since 2017); Chairman and Chief Executive Officer, Greenscapes of Southwest Florida, Inc. (2014-2020); Director and President, Greenscapes of Southwest Florida, Inc. (until 2000); Member, Board of Advisors, First American Bank (until 2010); Managing Director, Jon James, LLC (real estate) (since 2000); Partner, Right Funding, LLC (2014-2017); Director, First Signature Bank & Trust Company (until 1991); Director, Mast Realty Trust (until 1994); President, Maxwell Building Corp. (until 1991). Trustee (since 1992), Chairperson of the Board (2011–2012), and Vice Chairperson of the Board (since 2012) of various trusts within the John Hancock Fund Complex. |
Frances G. Rathke, 3 Born: 1960 | 2020 | |
| Trustee | | |
| Director, Audit Committee Chair, Oatly Group AB (plant-based drink company) (since 2021); Director, Audit Committee Chair and Compensation Committee Member, Green Mountain Power Corporation (since 2016); Director, Treasurer and Finance & Audit Committee Chair, Flynn Center for Performing Arts (since 2016); Director and Audit Committee Chair, Planet Fitness (since 2016); Chief Financial Officer and Treasurer, Keurig Green Mountain, Inc. (2003-retired 2015). Trustee of various trusts within the John Hancock Fund Complex (since 2020). |
| Gregory A. Russo, Born: 1949 | 2008 | |
| Trustee | | |
| Director and Audit Committee Chairman (2012-2020), and Member, Audit Committee and Finance Committee (2011-2020), NCH Healthcare System, Inc. (holding company for multi-entity healthcare system); Director and Member (2012-2018), and Finance Committee Chairman (2014-2018), The Moorings, Inc. (nonprofit continuing care community); Global Vice Chairman, Risk & Regulatory Matters, KPMG LLP (KPMG) (2002–2006); Vice Chairman, Industrial Markets, KPMG (1998–2002). Trustee of various trusts within the John Hancock Fund Complex (since 2008). |
| | ANNUAL REPORT | JOHN HANCOCK FINANCIAL OPPORTUNITIES FUND | 44 |
Non-Independent Trustees 4 | | |
Name, year of birth
Position(s) held with fund
Principal occupation(s) and other
directorships during past 5 years | | Number of John
Hancock funds
overseen by
Trustee |
| Andrew G. Arnott, Born: 1971 | 2017 | |
| Non-Independent Trustee | | |
| Global Head of Retail for Manulife (since 2022); Head of Wealth and Asset Management, United States and Europe, for John Hancock and Manulife (2018-2023); Director and Chairman, John Hancock Investment Management LLC (2005-2023, including prior positions); Director and Chairman, John Hancock Variable Trust Advisers LLC (2006-2023, including prior positions); Director and Chairman, John Hancock Investment Management Distributors LLC (2004-2023, including prior positions); President of various trusts within the John Hancock Fund Complex (2007-2023, including prior positions). Trustee of various trusts within the John Hancock Fund Complex (since 2017). |
| Paul Lorentz, Born: 1968 | 2022 | |
| Non-Independent Trustee | | |
| Global Head, Manulife Wealth and Asset Management (since 2017); General Manager, Manulife, Individual Wealth Management and Insurance (2013–2017); President, Manulife Investments (2010–2016). Trustee of various trusts within the John Hancock Fund Complex (since 2022). |
| Principal officers who are not Trustees | |
Name, year of birth
Position(s) held with fund
Principal occupation(s)
during past 5 years | Current
Position(s)
with the
Trust
since |
| Kristie M. Feinberg, Born: 1975 | |
| President | |
| Head of Wealth and Asset Management, United States and Europe, for John Hancock and Manulife (since 2023); Director and Chairman, John Hancock Investment Management LLC (since 2023); Director and Chairman, John Hancock Variable Trust Advisers LLC (since 2023); Director and Chairman, John Hancock Investment Management Distributors LLC (since 2023); CFO and Global Head of Strategy, Manulife Investment Management (2021-2023, including prior positions); CFO Americas & Global Head of Treasury, Invesco, Ltd., Invesco US (2019-2020, including prior positions); Senior Vice President, Corporate Treasurer and Business Controller, Oppenheimer Funds (2001-2019, including prior positions); President of various trusts within the John Hancock Fund Complex (since 2023). |
| Charles A. Rizzo, Born: 1957 | |
| Chief Financial Officer | |
| Vice President, John Hancock Financial Services (since 2008); Senior Vice President, John Hancock Investment Management LLC and John Hancock Variable Trust Advisers LLC (since 2008); Chief Financial Officer of various trusts within the John Hancock Fund Complex (since 2007). |
| Salvatore Schiavone, Born: 1965 | |
| Treasurer | |
| Assistant Vice President, John Hancock Financial Services (since 2007); Vice President, John Hancock Investment Management LLC and John Hancock Variable Trust Advisers LLC (since 2007); Treasurer of various trusts within the John Hancock Fund Complex (since 2007, including prior positions). |
| 45 | JOHN HANCOCK FINANCIAL OPPORTUNITIES FUND | ANNUAL REPORT | |
Principal officers who are not Trustees (continued) | |
Name, year of birth
Position(s) held with fund
Principal occupation(s)
during past 5 years | Current
Position(s)
with the
Trust
since |
| Christopher (Kit) Sechler, Born: 1973 | |
| Secretary and Chief Legal Officer | |
| Vice President and Deputy Chief Counsel, John Hancock Investment Management (since 2015); Assistant Vice President and Senior Counsel (2009–2015), John Hancock Investment Management; Assistant Secretary of John Hancock Investment Management LLC and John Hancock Variable Trust Advisers LLC (since 2009); Chief Legal Officer and Secretary of various trusts within the John Hancock Fund Complex (since 2009, including prior positions). |
| Trevor Swanberg, Born: 1979 | |
| Chief Compliance Officer | |
| Chief Compliance Officer, John Hancock Investment Management LLC and John Hancock Variable Trust Advisers LLC (since 2020); Deputy Chief Compliance Officer, John Hancock Investment Management LLC and John Hancock Variable Trust Advisers LLC (2019–2020); Assistant Chief Compliance Officer, John Hancock Investment Management LLC and John Hancock Variable Trust Advisers LLC (2016–2019); Vice President, State Street Global Advisors (2015–2016); Chief Compliance Officer of various trusts within the John Hancock Fund Complex (since 2016, including prior positions). |
The business address for all Trustees and Officers is 200 Berkeley Street, Boston, Massachusetts 02116-5023.
A copy of the Statement of Additional Information may be obtained without charge by visiting the Fund’s website, (jhinvestments.com) or by calling 800-225-6020 (toll-free) or from the SEC’s website at www.sec.gov.
| 1 | Ms. Ellison and Ms. Rathke serve as Trustees for a term expiring in 2024; Mr. Arnott, Mr. Garfield, Ms. Jackson, and Mr. Pruchansky serve as Trustees for a term expiring in 2025; Mr. Boyle, Dr. Cunningham, Ms. Fey, Mr. Lorentz, Dr. McClellan and Mr. Russo serve as Trustees for a term expiring in 2026; Mr. Boyle has served as Trustee at various times prior to date listed in the table. |
| 2 | Member of the Audit Committee as of September 26, 2023. |
| 3 | Member of the Audit Committee. |
| 4 | The Trustee is a Non-Independent Trustee due to current or former positions with the Advisor and certain of its affiliates. |
| | |
| | |
| | ANNUAL REPORT | JOHN HANCOCK FINANCIAL OPPORTUNITIES FUND | 46 |
Hassell H. McClellan,
Steven R. Pruchansky,
Andrew G. Arnott
†
James R. Boyle
William H. Cunningham
*
Noni L. Ellison
Grace K. Fey
Dean C. Garfield
Deborah C. Jackson
Paul Lorentz
†
Frances G. Rathke
*
Gregory A. Russo
Christopher (Kit) Sechler
Secretary and Chief Legal Officer
John Hancock Investment Management LLC
Manulife Investment Management (US) LLC
Susan A. Curry
Ryan P. Lentell, CFA
John Hancock Investment Management Distributors LLC
State Street Bank and Trust Company
Computershare Shareowner Services, LLC
K&L Gates LLP
Independent registered public accounting firm
PricewaterhouseCoopers LLP
Listed New York Stock Exchange: BTO
π
Member of the Audit Committee as of September 26, 2023.
†
Non-Independent Trustee
*
Member of the Audit Committee
#
Effective June 29, 2023.
The fund’s proxy voting policies and procedures, as well as the fund proxy voting record for the most recent twelve-month period ended June 30, are available free of charge on the Securities and Exchange Commission (SEC) website at sec.gov or on our website.
All of the fund’s holdings as of the end of the third month of every fiscal quarter are filed with the SEC on Form N-PORT within 60 days of the end of the fiscal quarter. The fund’s Form N-PORT filings are available on our website and the SEC’s website, sec.gov.
We make this information on your fund, as well as
monthly portfolio holdings
, and other fund details available on our website at jhinvestments.com or by calling 800-852-0218.
The report is certified under the Sarbanes-Oxley Act, which requires closed-end funds and other public companies to affirm that, to the best of their knowledge, the information in their financial reports is fairly and accurately stated in all material respects.
| You can also contact us: | | |
| 800-852-0218 | Regular mail: | Express mail: |
| jhinvestments.com | Computershare
P.O. Box 43006
Providence, RI 02940-3078 | Computershare
150 Royall St., Suite 101
Canton, MA 02021 |
| 47 | JOHN HANCOCK FINANCIAL OPPORTUNITIES FUND | ANNUAL REPORT | |
John Hancock family of funds
Blue Chip Growth
Classic Value
Disciplined Value
Disciplined Value Mid Cap
Equity Income
Financial Industries
Fundamental All Cap Core
Fundamental Large Cap Core
Mid Cap Growth
New Opportunities
Regional Bank
Small Cap Core
Small Cap Dynamic Growth
Small Cap Value
U.S. Global Leaders Growth
U.S. Growth
INTERNATIONAL EQUITY FUNDS
Disciplined Value International
Emerging Markets
Emerging Markets Equity
Fundamental Global Franchise
Global Environmental Opportunities
Global Equity
Global Shareholder Yield
Global Thematic Opportunities
International Dynamic Growth
International Growth
International Small Company
Bond
California Municipal Bond
Emerging Markets Debt
Floating Rate Income
Government Income
High Yield
High Yield Municipal Bond
Income
Investment Grade Bond
Money Market
Municipal Opportunities
Opportunistic Fixed Income
Short Duration Bond
Short Duration Municipal Opportunities
Strategic Income Opportunities
Alternative Asset Allocation
Diversified Macro
Infrastructure
Multi-Asset Absolute Return
Real Estate Securities
Seaport Long/Short
The fund’s investment objectives, risks, charges, and expenses are included in the prospectus and should be considered carefully before investing. For a prospectus, contact your financial professional, call John Hancock Investment Management at 800-852-0218, or visit the fund’s website at jhinvestments.com. Please read the prospectus carefully before investing or sending money.
The John Hancock funds are distributed by John Hancock Investment Management Distributors LLC. Member FINRA SIPC.
Corporate Bond ETF
Disciplined Value International Select ETF
Dynamic Municipal Bond ETF
Fundamental All Cap Core ETF
International High Dividend ETF
Mortgage-Backed Securities ETF
Multifactor Developed International ETF
Multifactor Emerging Markets ETF
Multifactor Large Cap ETF
Multifactor Mid Cap ETF
Multifactor Small Cap ETF
Preferred Income ETF
U.S. High Dividend ETF
ASSET ALLOCATION/TARGET DATE FUNDS
Balanced
Multi-Asset High Income
Lifestyle Blend Portfolios
Lifetime Blend Portfolios
Multimanager Lifestyle Portfolios
Multimanager Lifetime Portfolios
ENVIRONMENTAL, SOCIAL, AND
GOVERNANCE FUNDS
ESG Core Bond
ESG International Equity
ESG Large Cap Core
Asset-Based Lending
Financial Opportunities
Hedged Equity & Income
Income Securities Trust
Investors Trust
Preferred Income
Preferred Income II
Preferred Income III
Premium Dividend
Tax-Advantaged Dividend Income
Tax-Advantaged Global Shareholder Yield
John Hancock ETF shares are bought and sold at market price (not NAV), and are not individually redeemed from the fund. Brokerage commissions will reduce returns.
John Hancock ETFs are distributed by Foreside Fund Services, LLC, and are subadvised by Manulife Investment Management (US) LLC or Dimensional Fund Advisors LP. Foreside is not affiliated with John Hancock Investment Management Distributors LLC, Manulife Investment Management (US) LLC or Dimensional Fund Advisors LP.
Dimensional Fund Advisors LP receives compensation from John Hancock in connection with licensing rights to the John Hancock Dimensional indexes. Dimensional Fund Advisors LP does not sponsor, endorse, or sell, and makes no representation as to the advisability of investing in, John Hancock Multifactor ETFs.
We serve investors globally through a unique multimanager approach:
We search the world to find proven portfolio teams with specialized
expertise for every strategy we offer, then we apply robust investment
oversight to ensure they continue to meet our uncompromising
standards and serve the best interests of our shareholders.
Our unique approach to asset management enables us to provide
a diverse set of investments backed by some of the world’s best
managers, along with strong risk-adjusted returns across asset classes.
John Hancock Investment Management LLC, 200 Berkeley Street, Boston, MA 02116-5010, 800-225-5291, jhinvestments.com
Manulife Investment Management, the Stylized M Design, and Manulife Investment Management & Stylized M Design are trademarks of The Manufacturers Life Insurance Company and are used by its affiliates under license.
2/2024
ITEM 2. CODE OF ETHICS.
As of the end of the period, December 31, 2023, the registrant has adopted a code of ethics, as defined in Item 2 of Form N-CSR, that applies to its Chief Executive Officer, Chief Financial Officer and Treasurer (respectively, the principal executive officer, the principal financial officer and the principal accounting officer, the "Covered Officers"). A copy of the code of ethics is filed as an exhibit to this Form N-CSR.
ITEM 3. AUDIT COMMITTEE FINANCIAL EXPERT.
Frances G. Rathke is the audit committee financial expert and is "independent", pursuant to general instructions on Form N-CSR Item 3.
ITEM 4. PRINCIPAL ACCOUNTANT FEES AND SERVICES.
(a) Audit Fees
The aggregate fees billed for professional services rendered by the principal accountant(s) for John Hancock Financial Opportunities Fund for the audit of the registrant's annual financial statements or services that are normally provided by the accountant(s) in connection with statutory and regulatory filings or engagements amounted to $48,623 for the fiscal period ended December 31, 2023, and $46,611 for the fiscal year ended December 31, 2022. These fees were billed to the registrant and were approved by the registrant's audit committee.
(b) Audit-Related Services
The aggregate fees for John Hancock Financial Opportunities Fund for audit-related fees amounted to $12 for the fiscal year ended December 31, 2023, and $1,805 for the fiscal year ended December 31, 2022. These fees were billed to the registrant or to the registrant's investment adviser (not including any sub-adviser whose role is primarily portfolio management and is subcontracted with or overseen by another investment adviser), and any entity controlling, controlled by, or under common control with the adviser that provides ongoing services to the registrant ("control affiliates"). The nature of the services provided was related to a software licensing fee.
(c) Tax Fees
The aggregate fees for John Hancock Financial Opportunities Fund billed for professional services rendered by the principal accountant(s) for the tax compliance, tax advice and tax planning ("tax fees") amounted to $4,254 for the fiscal period ended December 31, 2023
and $4,110 for the fiscal period ended December 31, 2022. The nature of the services comprising the tax fees was the review of the registrant's tax returns and tax distribution requirements. These fees were billed to the registrant and were approved by the registrant's audit committee.
(d) All Other Fees
All other fees for John Hancock Financial Opportunities Fund billed to the registrant or control affiliates for products and services provided by the principal accountant were $369 for the fiscal year ended December 31, 2023 and $163 for the fiscal year ended December 31, 2022. The nature of the services comprising all other fees is advisory services provided to the investment manager. These fees were approved by the registrant's audit committee.
(e)(1) Audit Committee Pre-Approval Policies and Procedures:
The trust's Audit Committee must pre-approve all audit and non-audit services provided by the independent registered public accounting firm (the "Auditor") relating to the operations or financial reporting of the funds. Prior to the commencement of any audit or non-audit services to a fund, the Audit Committee reviews the services to determine whether they are appropriate and permissible under applicable law.
The trust's Audit Committee has adopted policies and procedures to, among other purposes, provide a framework for the Committee's consideration of audit-related and non-audit services by the Auditor. The policies and procedures require that any audit-related and non-audit service provided by the Auditor and any non-audit service provided by the Auditor to a fund service provider that relates directly to the operations and financial reporting of a fund are subject to approval by the Audit Committee before such service is provided. Audit-related services provided by the Auditor that are expected to exceed $25,000 per instance/per fund are subject to specific pre-approval by the Audit Committee. Tax services provided by the Auditor that are expected to exceed $30,000 per instance/per fund are subject to specific pre-approval by the Audit Committee.
All audit services, as well as the audit-related and non-audit services that are expected to exceed the amounts stated above, must be approved in advance of provision of the service by formal resolution of the Audit Committee. At the regularly scheduled Audit Committee meetings, the Committee reviews a report summarizing the services, including fees, provided by the Auditor.
(e)(2) Services approved pursuant to paragraph (c)(7)(i)(C) of Rule 2-01 of Regulation S-X: Audit-Related Fees, Tax Fees and All Other Fees:
There were no amounts that were approved by the Audit Committee pursuant to the de minimis exception under Rule 2-01 of Regulation S-X.
(f)According to the registrant's principal accountant, for the fiscal year ended December 31, 2023, the percentage of hours spent on the audit of the registrant's financial statements for the most recent fiscal year that were attributed to work performed by persons who were not full-time, permanent employees of principal accountant was less than 50%.
(g)The aggregate non-audit fees billed by the registrant's accountant(s) for services rendered to the registrant and rendered to the registrant's control affiliates for each of the last two fiscal years of the registrant were $1,370,062 for the fiscal year ended December 31, 2023 and $1,328,389 for the fiscal year ended December 31, 2022.
(h)The audit committee of the registrant has considered the non-audit services provided by the registrant's principal accountant(s) to the control affiliates and has determined that the services that were not pre-approved are compatible with maintaining the principal accountant(s)' independence.
(i)Not applicable.
(j)Not applicable.
ITEM 5. AUDIT COMMITTEE OF LISTED REGISTRANTS
The registrant has a separately-designated standing audit committee comprised of independent trustees. The members of the audit committee are as follows:
Frances G. Rathke – Chairperson William H. Cunningham
Hassell H. McClellan, effective September 26, 2023
ITEM 6. SCHEDULE OF INVESTMENTS.
(a)Not applicable.
(b)Not applicable.
ITEM 7. DISCLOSURE OF PROXY VOTING POLICIES AND PROCEDURES FOR CLOSED- END MANAGEMENT INVESTMENT COMPANIES.
See attached exhibit "Proxy Voting Policies and Procedures"
ITEM 8.
PORTFOLIO MANAGERS OF CLOSED-END MANAGEMENT INVESTMENT COMPANIES.
Information about the Manulife Investment Management (US) LLC ("Manulife IM (US)") portfolio managers
Below is a list of the Manulife Investment Management (US) LLC "Manulife IM (US)" portfolio managers who share joint responsibility for the day-to-day investment management of the Fund subject to oversight by John Hancock Investment Management LLC (the "Adviser"). It provides a brief summary of their business careers over the past five years. The information provided is as of the filing date of this N-CSR.
Susan A. Curry
Managing Director and Portfolio Manager
Manulife Investment Management (US) LLC since 2006
Managed the Fund since 2004
Began business career in 1993
Ryan P. Lentell, CFA
Managing Director and Portfolio Manager
Manulife Investment Management (US) LLC since 2008
Managed the Fund since 2008
Began business career in 1999
Other Accounts the Portfolio Managers are Managing
The table below indicates, for each portfolio manager, information about the accounts over which the portfolio manager has day-to-day investment responsibility. All information on the number of accounts and total assets in the table is as of December 31, 2023. For purposes of the table, "Other Pooled Investment Vehicles" may include investment partnerships and group trusts, and "Other Accounts" may include separate accounts for institutions or individuals, insurance company general or separate accounts, pension funds and other similar institutional accounts.
| Registered Investment | Other Pooled Investment | | |
| Companies | Vehicles | | Other Accounts |
| | | | | | |
| | Total | | Total | | Total |
| Number of | Assets | Number of | Assets | Number of | Assets |
| Accounts | $Million | Accounts | $Million | Accounts | $Million |
Susan A. Curry | 3 | 4,482 | 2 | 191 | 1 | <1 |
| | | | | | |
Ryan P. Lentell, | 3 | 1,441 | 2 | 191 | 0 | 0 |
CFA | | | | | | |
Accounts within the total accounts that are subject to a performance-based advisory fee: 0.
Conflicts of Interest. When a portfolio manager is responsible for the management of more than one account, the potential arises for the portfolio manager to favor one account over another. The principal types of potential conflicts of interest that may arise are discussed below. For the reasons outlined below, the Fund does not believe that any material conflicts are likely to arise out of a portfolio manager's responsibility for the management of the Fund as well as one or more other accounts. The Advisor and Subadvisor have adopted procedures that are intended to monitor compliance with the policies referred to in the following paragraphs. Generally, the risks of such conflicts of interests are increased to the extent that a portfolio manager has a financial
incentive to favor one account over another. The Advisor and Subadvisor have structured their compensation arrangements in a manner that is intended to limit such potential for conflicts of interests. See "Compensation of Portfolio Managers" below.
•A portfolio manager could favor one account over another in allocating new investment opportunities that have limited supply, such as initial public offerings and private placements. If, for example, an initial public offering that was expected to appreciate in value significantly shortly after the offering was allocated to a single account, that account may be expected to have better investment performance than other accounts that did not receive an allocation on the initial public offering. The Subadvisor has policies that require a portfolio manager to allocate such investment opportunities in an equitable manner and generally to allocate such investments proportionately among all accounts with similar investment objectives.
•A portfolio manager could favor one account over another in the order in which trades for the accounts are placed. If a portfolio manager determines to purchase a security for more than one account in an aggregate amount that may influence the market price of the security, accounts that purchased or sold the security first may receive a more favorable price than accounts that made subsequent transactions. The less liquid the market for the security or the greater the percentage that the proposed aggregate purchases or sales represent of average daily trading volume, the greater the potential for accounts that make subsequent purchases or sales to receive a less favorable price. When a portfolio manager intends to trade the same security for more than one account, the policies of the Subadvisor generally require that such trades be "bunched," which means that the trades for the individual accounts are aggregated and each account receives the same price. There are some types of accounts as to which bunching may not be possible for contractual reasons (such as directed brokerage arrangements). Circumstances may also arise where the trader believes that bunching the orders may not result in the best possible price. Where those accounts or circumstances are involved, the Subadvisor will place the order in a manner intended to result in as favorable a price as possible for such client.
•A portfolio manager could favor an account if the portfolio manager's compensation is tied to the performance of that account rather than all accounts managed by the portfolio manager. If, for example, the portfolio manager receives a bonus based upon the performance of certain accounts relative to a benchmark while other accounts are disregarded for this purpose, the portfolio manager will have a financial incentive to seek to have the accounts that determine the portfolio manager's bonus achieve the best possible performance to the possible detriment of other accounts. Similarly, if the Subadvisor receives a performance-based advisory fee, the portfolio manager may favor that account, whether or not the performance of that account directly determines the portfolio manager's compensation. The investment performance on specific accounts is not a factor in determining the portfolio manager's compensation. See "Compensation of Portfolio Managers" below. Neither the Advisor nor the Subadvisor receives a performance-based fee with respect to any of the accounts managed by the portfolio managers.
•A portfolio manager could favor an account if the portfolio manager has a beneficial interest in the account, in order to benefit a large client or to compensate a client that had poor returns. For example, if the portfolio manager held an interest in an investment partnership that was one of the accounts managed by the portfolio manager, the portfolio manager would have an economic incentive to favor the account in which the portfolio manager held an interest. The Subadvisor imposes certain trading restrictions and reporting requirements for accounts in which a portfolio manager or certain family
members have a personal interest in order to confirm that such accounts are not favored over other accounts.
•If the different accounts have materially and potentially conflicting investment objectives or strategies, a conflict of interest may arise. For example, if a portfolio manager purchases a security for one account and sells the same security short for another account, such trading pattern could disadvantage either the account that is long or short. In making portfolio manager assignments, the Subadvisor seeks to avoid such potentially conflicting situations. However, where a portfolio manager is responsible for accounts with differing investment objectives and policies, it is possible that the portfolio manager will conclude that it is in the best interest of one account to sell a portfolio security while another account continues to hold or increase the holding in such security.
Compensation of Portfolio Managers. The Subadvisor has adopted a system of compensation for portfolio managers and others involved in the investment process that is applied systematically among investment professionals. At the Subadvisor, the structure of compensation of investment professionals is currently composed of the following basic components: base salary and short- and long-term incentives. The following describes each component of the compensation package for the individuals identified as a portfolio manager for the Funds.
•Base salary. Base compensation is fixed and normally reevaluated on an annual basis. The Subadvisor seeks to set compensation at market rates, taking into account the experience and responsibilities of the investment professional.
•Incentives. Only investment professionals are eligible to participate in the short-and long-term incentive plan. Under the plan, investment professionals are eligible for an annual cash award. The plan is intended to provide a competitive level of annual bonus compensation that is tied to the investment professional achieving superior investment performance and aligns the financial incentives of the Subadvisor and the investment professional. Any bonus under the plan is completely discretionary, with a maximum annual bonus that may be well in excess of base salary. Payout of a portion of this bonus may be deferred for up to five years. While the amount of any bonus is discretionary, the following factors are generally used in determining bonuses under the plan:
•Investment Performance: The investment performance of all accounts managed by the investment professional over one, three and five-year periods are considered. With respect to fixed income accounts, relative yields are also used to measure performance. The pre-tax performance of each account is measured relative to an appropriate benchmark and universe as identified in the table below.
•Financial Performance: The profitability of the Subadvisor and its parent company are also considered in determining bonus awards.
•In addition to the above, compensation may also include a revenue component for an investment team derived from a number of factors including, but not limited to client assets under management, investment performance, and firm metrics.
•Manulife Equity Awards. A limited number of senior investment professionals may receive options to purchase shares of Manulife Financial stock. Generally, such option would permit the investment professional to purchase a set amount of stock at the market price on the date of grant. The option can be exercised for a set period (normally a number of years or until termination of employment) and the investment
professional would exercise the option if the market value of Manulife Financial stock increases. Some investment professionals may receive restricted stock grants, where the investment professional is entitled to receive the stock at no or nominal cost, provided that the stock is forgone if the investment professional's employment is terminated prior to a vesting date.
•Deferred Incentives. Investment professionals may receive deferred incentives which are fully invested in strategies managed by the team/individuals as well as other Manulife Asset Management strategies.
The Subadvisor also permits investment professionals to participate on a voluntary basis in a deferred compensation plan, under which the investment professional may elect on an annual basis to defer receipt of a portion of their compensation until retirement. Participation in the plan is voluntary.
Share Ownership by Portfolio Managers. For purposes of these tables, "similarly managed accounts" include all accounts that are managed (i) by the same portfolio managers that are jointly and primarily responsible for the day-to-day management of the Fund; and (ii) with an investment style, objective, policies and strategies substantially similar to those that are used to manage the Fund.
Portfolio | Range of Beneficial | Range of Beneficial Ownership |
Manager | Ownership | in Similarly Managed Accounts |
Susan A. Curry | $10,001-$50,000 | $500,001-$1,000,000 |
Ryan P. Lentell, CFA | $100,001-$500,000 | $Over $1,000,000 |
ITEM 9. PURCHASES OF EQUITY SECURITIES BY CLOSED-END MANAGEMENT INVESTMENT COMPANY AND AFFILIATED PURCHASERS
(a)Not applicable.
REGISTRANT PURCHASES OF EQUITY SECURITIES
| | | Total Number | Maximum |
| | | of | Number |
| | | Shares | of Shares that |
| | | Purchased | May |
| Total | Average | as Part of | Yet Be |
| Number of | Price | Publicly | Purchased |
| Shares | | Announced | Under the |
Period | Purchased | per Share | Plans* | Plans |
Jan-23 | - | - | - | 1,926,317 |
Feb-23 | - | - | - | 1,926,317 |
Mar-23 | - | - | - | 1,926,317 |
Apr-23 | - | - | - | 1,926,317 |
May-23 | - | - | - | 1,926,317 |
Jun-23 | - | - | - | 1,926,317 |
Jul-23 | - | - | - | 1,926,317 |
Aug-23 | - | - | - | 1,926,317 |
Sep-23 | - | - | - | 1,926,317 |
Oct-23 | - | - | - | 1,926,317 |
Nov-23 | - | - | - | 1,926,317 |
Dec-23 | - | - | - | 1,926,317 |
Total | - | - | | |
*In May 2009, the Board of Trustees approved a share repurchase plan, which was subsequently reviewed by the Board of Trustees each year in December. Under the current share repurchase plan, the Fund may purchase in the open market up to 10% of its outstanding common shares as of December 31, 2023 (shares that may yet be purchased under the current plan are 1,968,661 shares). The current plan is in effect between January 1, 2024 and December 31, 2024.
ITEM 10. SUBMISSION OF MATTERS TO A VOTE OF SECURITY HOLDERS.
(a)The registrant has adopted procedures by which shareholders may recommend nominees to the registrant's Board of Trustees. A copy of the procedures is filed as an exhibit to this Form N-CSR. See attached "John Hancock Funds – Nominating and Governance Committee Charter".
ITEM 11. CONTROLS AND PROCEDURES.
(a)Based upon their evaluation of the registrant's disclosure controls and procedures as conducted within 90 days of the filing date of this Form N-CSR, the registrant's principal executive officer and principal financial officer have concluded that those disclosure controls and procedures provide reasonable assurance that the material information required to be disclosed by the registrant on this report is recorded, processed, summarized and reported within the time periods specified in the Securities and Exchange Commission's rules and forms.
(b)There were no changes in the registrant's internal control over financial reporting that occurred during the period covered by this report that have materially affected, or are reasonably likely to materially affect, the registrant's internal control over financial reporting.
ITEM 12. DISCLOSURE OF SECURITIES LENDING ACTIVITIES FOR CLOSED-END MANAGEMENT INVESTMENT COMPANIES.
The Fund did not participate directly in securities lending activities. See Note 8 to financial statements in Item 1.
Not Applicable
ITEM 13. EXHIBITS.
(a)(1) Code of Ethics for Covered Officers is attached.
(a)(2) Separate certifications for the registrant's principal executive officer and principal financial officer, as required by Section 302 of the Sarbanes-Oxley Act of 2002 and Rule 30a-2(a) under the Investment Company Act of 1940, are attached.
(b)Separate certifications for the registrant's principal executive officer and principal financial officer, as required by 18 U.S.C. Section 1350, as adopted pursuant to Section 906 of the Sarbanes-Oxley Act of 2002, and Rule 30a-2(b) under the Investment Company Act of 1940, are attached. The certifications furnished pursuant to this paragraph are not deemed to be "filed" for purposes of Section 18 of the Securities Exchange Act of 1934, or otherwise subject to the liability of that section. Such certifications are not deemed to be incorporated by reference intoany filing under the Securities Act of 1933 or the Securities Exchange Act of 1934, except to the extent that the Registrant specifically incorporates them by reference.
(c)(1) Proxy Voting Policies and Procedures are attached.
(c)(2) Submission of Matters to a Vote of Security Holders is attached. See attached "John Hancock Funds - Governance Committee Charter".
(c)(3) Registrant's notice to shareholders pursuant to Registrant's exemptive order granting an exemption from Section 19(b) of the Investment Company Act of 1940, as amended and Rule 19b-1 thereunder regarding distributions made pursuant to the Registrant's Managed Distribution Plan.
(d) Exhibit 99. CONSENT - Consent of Independent Registered Public Accounting Firm
SIGNATURES
Pursuant to the requirements of the Securities Exchange Act of 1934 and the Investment Company Act of 1940, the registrant has duly caused this report to be signed on its behalf by the undersigned, thereunto duly authorized.
John Hancock Financial Opportunities Fund
By: | /s/ Kristie M. Feinberg |
| ------------------------------ |
| Kristie M. Feinberg |
| President |
Date: | February 16, 2024 |
Pursuant to the requirements of the Securities Exchange Act of 1934 and the Investment Company Act of 1940, this report has been signed below by the following persons on behalf of the registrant and in the capacities and on the dates indicated.
By: | /s/ Kristie M. Feinberg |
| ------------------------------ |
| Kristie M. Feinberg |
| President |
Date: | February 16, 2024 |
By: | /s/ Charles A. Rizzo |
| -------------------------------- |
| Charles A. Rizzo |
| Chief Financial Officer |
Date: | February 16, 2024 |