United States Securities and Exchange Commission
Washington, D.C. 20549
Form N-CSR
Certified Shareholder Report of Registered Management Investment Companies
811-7193
(Investment Company Act File Number)
Federated Hermes Institutional Trust
(Exact Name of Registrant as Specified in Charter)
Federated Hermes Funds
4000 Ericsson Drive
Warrendale, PA 15086-7561
(Address of Principal Executive Offices)
(412) 288-1900
(Registrant’s Telephone Number)
Peter J. Germain, Esquire
1001 Liberty Avenue
Pittsburgh, Pennsylvania 15222-3779
(Name and Address of Agent for Service)
(Notices should be sent to the Agent for Service)
Date of Fiscal Year End: 2024-10-31
Date of Reporting Period: 2024-10-31
| Item 1. | Reports to Stockholders |
Federated Hermes Institutional High Yield Bond Fund

Class A Shares | FIHAX
Annual Shareholder Report - October 31, 2024
A Portfolio of Federated Hermes Institutional Trust
This annual shareholder report contains important information about the Federated Hermes Institutional High Yield Bond Fund (the "Fund") for the period of November 1, 2023 to October 31, 2024. You can find additional information at FederatedHermes.com/us/FundInformation. You can also request this information by contacting us at 1-800-341-7400, Option 4, or your financial advisor.
This report describes planned changes made to the Fund since the beginning of the reporting period.
What were the Fund costs for the last year?
(based on a hypothetical $10,000 investment)
| Class Name | Costs of a $10,000 investment | Costs paid as a percentage of a $10,000 investment |
|---|---|---|
| Class A Shares | $79 | 0.74% |
Management's Discussion of Fund Performance
The following discussion compares the performance of the Fund to the Bloomberg US Corporate High Yield 2% Issuer Capped Index (the “Index”) to show how the Fund’s performance compares to the returns of similar investments for the reporting period. See the Average Annual Total Returns table below for the returns of the Fund and related indexes, including the Bloomberg US Aggregate Bond Index, which represents the overall U.S. fixed-income market. The Fund seeks high current income by investing primarily in lower-rated corporate fixed-income securities, including debt securities issued by U.S. or foreign businesses.
Top Contributors to Performance
■ The Fund was positively impacted by security selection in the Building Materials, Consumer Cyclical Services, Healthcare,
Cable & Satellite and Pharmaceutical industry sectors.
■ The Fund was positively impacted by its underweight position in the underperforming Metals and Mining sector.
■ Specific Fund holdings that positively impacted performance relative to the Index included: Clydesdale Acquisition,
NFP Corp, Community Health Systems, SRS Distribution and Condor Merger Sub.
Top Detractors from Performance
■ The Fund was negatively impacted by security selection overall, especially in the Media & Entertainment, Electric Utility,
Automotive and Technology industry sectors.
■ The Fund was also negatively impacted by its industry allocation, especially its underweight allocations to the strong
performing Wireline Telecommunications and Retail industry sectors. It was also negatively impacted by its overweight
allocations to the underperforming Automotive and Packaging industry sectors. Given the strong absolute performance during
the period, the Fund’s cash position was also a drag on relative performance.
■ Specific Fund holdings that negatively impacted performance relative to the Index included: Enviva Inc., iHeartCommunications,
Ardagh Packaging, Terrier Media Buyer and Rackspace Technologies.
Annual Shareholder Report
Federated Hermes Institutional High Yield Bond Fund
Fund Performance
Keep in mind that the Fund’s past performance is not a good predictor of how the Fund will perform in the future. The graph and table do not reflect the deduction of taxes that a shareholder would pay on fund distributions or redemption of fund shares.
Cumulative Performance: 10/31/2014 to 10/31/2024
Total Return Based on $10,000 Investment
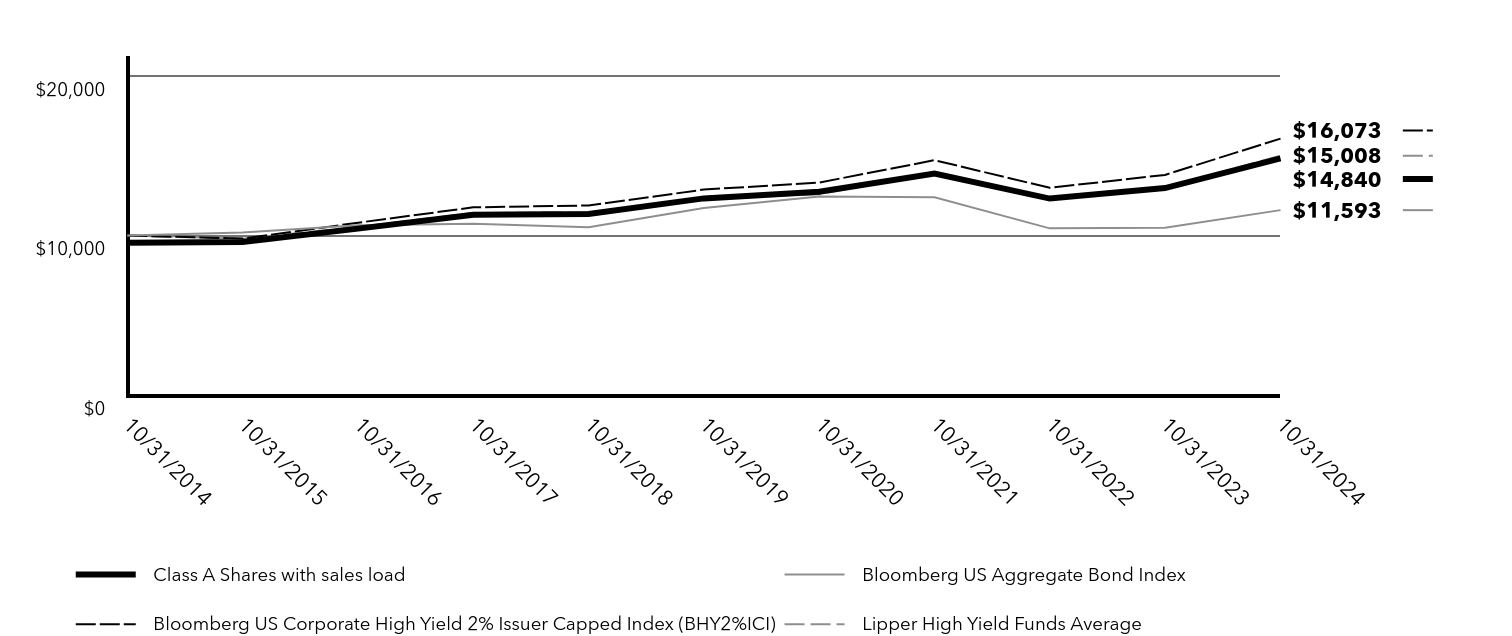
| Class A Shares with sales load | Bloomberg US Aggregate Bond Index | Bloomberg US Corporate High Yield 2% Issuer Capped Index (BHY2%ICI) | Lipper High Yield Funds Average | |
|---|---|---|---|---|
| 10/31/2014 | $9,550 | $10,000 | $10,000 | $10,000 |
| 10/31/2015 | $9,594 | $10,196 | $9,809 | $9,806 |
| 10/31/2016 | $10,434 | $10,641 | $10,805 | $10,541 |
| 10/31/2017 | $11,308 | $10,737 | $11,768 | $11,414 |
| 10/31/2018 | $11,352 | $10,517 | $11,883 | $11,453 |
| 10/31/2019 | $12,328 | $11,727 | $12,879 | $12,335 |
| 10/31/2020 | $12,746 | $12,453 | $13,320 | $12,587 |
| 10/31/2021 | $13,885 | $12,393 | $14,722 | $13,918 |
| 10/31/2022 | $12,316 | $10,450 | $12,991 | $12,368 |
| 10/31/2023 | $12,976 | $10,487 | $13,800 | $13,012 |
| 10/31/2024 | $14,840 | $11,593 | $16,073 | $15,008 |
Average Annual Total Returns
| Fund/Index | 1 Year | 5 Years | 10 Years |
|---|---|---|---|
| Class A Shares with sales load | 9.21% | 2.83% | 4.03% |
| Class A Shares without sales load | 14.36% | 3.78% | 4.51% |
Bloomberg US Aggregate Bond IndexFootnote Reference* | 10.55% | (0.23%) | 1.49% |
| Bloomberg US Corporate High Yield 2% Issuer Capped Index (BHY2%ICI) | 16.47% | 4.53% | 4.86% |
| Lipper High Yield Funds Average | 15.34% | 3.97% | 4.03% |
| Footnote | Description |
Footnote* | The Fund has designated the Bloomberg US Aggregate Bond Index as its new broad-based securities market index in accordance with the SEC’s revised definition for such an index. |
Visit FederatedHermes.com/us/FundInformation and click on the link to your fund and share class for more recent performance information.
Key Fund Statistics
| Net Assets | $7,717,085,790 |
| Number of Investments | 576 |
| Portfolio Turnover | 24% |
| Total Advisory Fees Paid | $29,203,762 |
Annual Shareholder Report
Federated Hermes Institutional High Yield Bond Fund
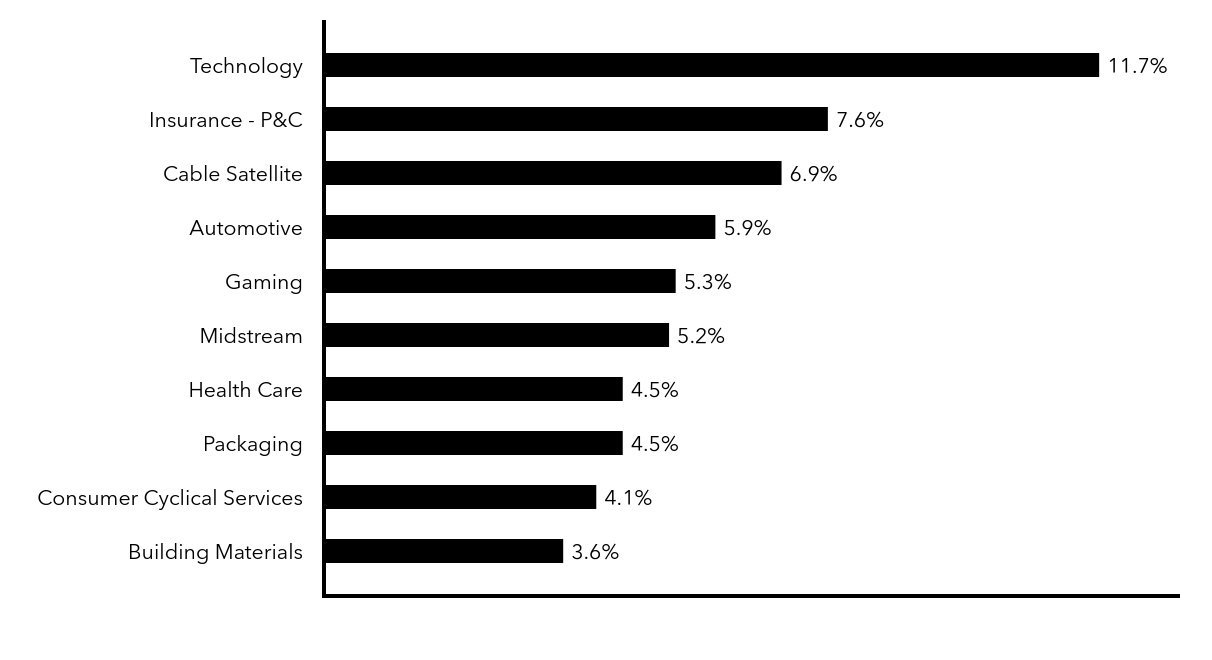
Fund Holdings
Top Index Classifications (% of Net Assets)

| Value | Value |
|---|---|
| Building Materials | 3.6% |
| Consumer Cyclical Services | 4.1% |
| Packaging | 4.5% |
| Health Care | 4.5% |
| Midstream | 5.2% |
| Gaming | 5.3% |
| Automotive | 5.9% |
| Cable Satellite | 6.9% |
| Insurance - P&C | 7.6% |
| Technology | 11.7% |
Material Fund Changes
Following is a summary of material changes planned for the Fund since the beginning of the reporting period. For more complete and current information, you may review the Fund’s disclosure documents on its webpage at FederatedHermes.com/us/FundInformation or upon request at 1-800-341-7400, Option 4, or by contacting your financial advisor.
Effective December 27, 2024, Randal Stuckwish has been added to the Fund’s portfolio management team.
Additional Information about the Fund
Additional information is available on the Fund’s website at FederatedHermes.com/us/FundInformation, including its:
• prospectus • financial information • holdings • proxy voting information
CUSIP 31420B839
29856-A (12/24)
Federated Securities Corp., Distributor
FederatedHermes.com/us
© 2024 Federated Hermes, Inc.
Federated Hermes Institutional High Yield Bond Fund

Class C Shares | FIHCX
Annual Shareholder Report - October 31, 2024
A Portfolio of Federated Hermes Institutional Trust
This annual shareholder report contains important information about the Federated Hermes Institutional High Yield Bond Fund (the "Fund") for the period of November 1, 2023 to October 31, 2024. You can find additional information at FederatedHermes.com/us/FundInformation. You can also request this information by contacting us at 1-800-341-7400, Option 4, or your financial advisor.
This report describes planned changes made to the Fund since the beginning of the reporting period.
What were the Fund costs for the last year?
(based on a hypothetical $10,000 investment)
| Class Name | Costs of a $10,000 investment | Costs paid as a percentage of a $10,000 investment |
|---|---|---|
| Class C Shares | $163 | 1.53% |
Management's Discussion of Fund Performance
The following discussion compares the performance of the Fund to the Bloomberg US Corporate High Yield 2% Issuer Capped Index (the “Index”) to show how the Fund’s performance compares to the returns of similar investments for the reporting period. See the Average Annual Total Returns table below for the returns of the Fund and related indexes, including the Bloomberg US Aggregate Bond Index, which represents the overall U.S. fixed-income market. The Fund seeks high current income by investing primarily in lower-rated corporate fixed-income securities, including debt securities issued by U.S. or foreign businesses.
Top Contributors to Performance
■ The Fund was positively impacted by security selection in the Building Materials, Consumer Cyclical Services, Healthcare,
Cable & Satellite and Pharmaceutical industry sectors.
■ The Fund was positively impacted by its underweight position in the underperforming Metals and Mining sector.
■ Specific Fund holdings that positively impacted performance relative to the Index included: Clydesdale Acquisition,
NFP Corp, Community Health Systems, SRS Distribution and Condor Merger Sub.
Top Detractors from Performance
■ The Fund was negatively impacted by security selection overall, especially in the Media & Entertainment, Electric Utility,
Automotive and Technology industry sectors.
■ The Fund was also negatively impacted by its industry allocation, especially its underweight allocations to the strong
performing Wireline Telecommunications and Retail industry sectors. It was also negatively impacted by its overweight
allocations to the underperforming Automotive and Packaging industry sectors. Given the strong absolute performance during
the period, the Fund’s cash position was also a drag on relative performance.
■ Specific Fund holdings that negatively impacted performance relative to the Index included: Enviva Inc., iHeartCommunications,
Ardagh Packaging, Terrier Media Buyer and Rackspace Technologies.
Annual Shareholder Report
Federated Hermes Institutional High Yield Bond Fund
Fund Performance
Keep in mind that the Fund’s past performance is not a good predictor of how the Fund will perform in the future. The graph and table do not reflect the deduction of taxes that a shareholder would pay on fund distributions or redemption of fund shares.
Cumulative Performance: 10/31/2014 to 10/31/2024
Total Return Based on $10,000 Investment
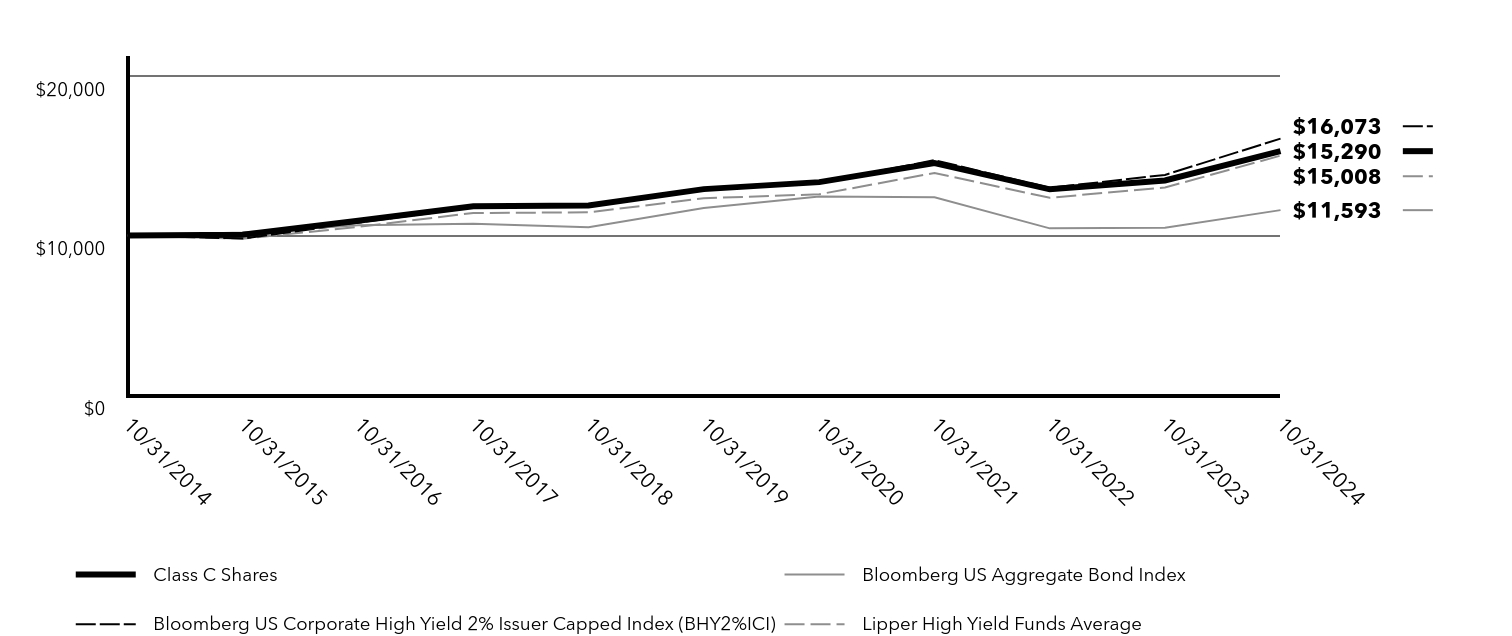
| Class C Shares | Bloomberg US Aggregate Bond Index | Bloomberg US Corporate High Yield 2% Issuer Capped Index (BHY2%ICI) | Lipper High Yield Funds Average | |
|---|---|---|---|---|
| 10/31/2014 | $10,000 | $10,000 | $10,000 | $10,000 |
| 10/31/2015 | $10,047 | $10,196 | $9,809 | $9,806 |
| 10/31/2016 | $10,926 | $10,641 | $10,805 | $10,541 |
| 10/31/2017 | $11,841 | $10,737 | $11,768 | $11,414 |
| 10/31/2018 | $11,887 | $10,517 | $11,883 | $11,453 |
| 10/31/2019 | $12,909 | $11,727 | $12,879 | $12,335 |
| 10/31/2020 | $13,347 | $12,453 | $13,320 | $12,587 |
| 10/31/2021 | $14,540 | $12,393 | $14,722 | $13,918 |
| 10/31/2022 | $12,897 | $10,450 | $12,991 | $12,368 |
| 10/31/2023 | $13,450 | $10,487 | $13,800 | $13,012 |
| 10/31/2024 | $15,290 | $11,593 | $16,073 | $15,008 |
Average Annual Total Returns
| Fund/Index | 1 Year | 5 Years | 10 Years |
|---|---|---|---|
| Class C Shares with sales load | 12.68% | 3.44% | 4.34% |
| Class C Shares without sales load | 13.68% | 3.44% | 4.34% |
Bloomberg US Aggregate Bond IndexFootnote Reference* | 10.55% | (0.23%) | 1.49% |
| Bloomberg US Corporate High Yield 2% Issuer Capped Index (BHY2%ICI) | 16.47% | 4.53% | 4.86% |
| Lipper High Yield Funds Average | 15.34% | 3.97% | 4.03% |
| Footnote | Description |
Footnote* | The Fund has designated the Bloomberg US Aggregate Bond Index as its new broad-based securities market index in accordance with the SEC’s revised definition for such an index. |
Visit FederatedHermes.com/us/FundInformation and click on the link to your fund and share class for more recent performance information.
Key Fund Statistics
| Net Assets | $7,717,085,790 |
| Number of Investments | 576 |
| Portfolio Turnover | 24% |
| Total Advisory Fees Paid | $29,203,762 |
Annual Shareholder Report
Federated Hermes Institutional High Yield Bond Fund
Fund Holdings
Top Index Classifications (% of Net Assets)
| Value | Value |
|---|---|
| Building Materials | 3.6% |
| Consumer Cyclical Services | 4.1% |
| Packaging | 4.5% |
| Health Care | 4.5% |
| Midstream | 5.2% |
| Gaming | 5.3% |
| Automotive | 5.9% |
| Cable Satellite | 6.9% |
| Insurance - P&C | 7.6% |
| Technology | 11.7% |
Material Fund Changes
Following is a summary of material changes planned for the Fund since the beginning of the reporting period. For more complete and current information, you may review the Fund’s disclosure documents on its webpage at FederatedHermes.com/us/FundInformation or upon request at 1-800-341-7400, Option 4, or by contacting your financial advisor.
Effective December 27, 2024, Randal Stuckwish has been added to the Fund’s portfolio management team.
Additional Information about the Fund
Additional information is available on the Fund’s website at FederatedHermes.com/us/FundInformation, including its:
• prospectus • financial information • holdings • proxy voting information
CUSIP 31420B821
29856-B (12/24)
Federated Securities Corp., Distributor
FederatedHermes.com/us
© 2024 Federated Hermes, Inc.
Federated Hermes Institutional High Yield Bond Fund

Institutional Shares | FIHBX
Annual Shareholder Report - October 31, 2024
A Portfolio of Federated Hermes Institutional Trust
This annual shareholder report contains important information about the Federated Hermes Institutional High Yield Bond Fund (the "Fund") for the period of November 1, 2023 to October 31, 2024. You can find additional information at FederatedHermes.com/us/FundInformation. You can also request this information by contacting us at 1-800-341-7400, Option 4, or your financial advisor.
This report describes planned changes made to the Fund since the beginning of the reporting period.
What were the Fund costs for the last year?
(based on a hypothetical $10,000 investment)
| Class Name | Costs of a $10,000 investment | Costs paid as a percentage of a $10,000 investment |
|---|---|---|
| Institutional Shares | $53 | 0.49% |
Management's Discussion of Fund Performance
The following discussion compares the performance of the Fund to the Bloomberg US Corporate High Yield 2% Issuer Capped Index (the “Index”) to show how the Fund’s performance compares to the returns of similar investments for the reporting period. See the Average Annual Total Returns table below for the returns of the Fund and related indexes, including the Bloomberg US Aggregate Bond Index, which represents the overall U.S. fixed-income market. The Fund seeks high current income by investing primarily in lower-rated corporate fixed-income securities, including debt securities issued by U.S. or foreign businesses.
Top Contributors to Performance
■ The Fund was positively impacted by security selection in the Building Materials, Consumer Cyclical Services, Healthcare,
Cable & Satellite and Pharmaceutical industry sectors.
■ The Fund was positively impacted by its underweight position in the underperforming Metals and Mining sector.
■ Specific Fund holdings that positively impacted performance relative to the Index included: Clydesdale Acquisition,
NFP Corp, Community Health Systems, SRS Distribution and Condor Merger Sub.
Top Detractors from Performance
■ The Fund was negatively impacted by security selection overall, especially in the Media & Entertainment, Electric Utility,
Automotive and Technology industry sectors.
■ The Fund was also negatively impacted by its industry allocation, especially its underweight allocations to the strong
performing Wireline Telecommunications and Retail industry sectors. It was also negatively impacted by its overweight
allocations to the underperforming Automotive and Packaging industry sectors. Given the strong absolute performance during
the period, the Fund’s cash position was also a drag on relative performance.
■ Specific Fund holdings that negatively impacted performance relative to the Index included: Enviva Inc., iHeartCommunications,
Ardagh Packaging, Terrier Media Buyer and Rackspace Technologies.
Annual Shareholder Report
Federated Hermes Institutional High Yield Bond Fund
Fund Performance
Keep in mind that the Fund’s past performance is not a good predictor of how the Fund will perform in the future. The graph and table do not reflect the deduction of taxes that a shareholder would pay on fund distributions or redemption of fund shares.
Cumulative Performance: 10/31/2014 to 10/31/2024
Total Return Based on $10,000 Investment

| Institutional Shares | Bloomberg US Aggregate Bond Index | Bloomberg US Corporate High Yield 2% Issuer Capped Index (BHY2%ICI) | Lipper High Yield Funds Average | |
|---|---|---|---|---|
| 10/31/2014 | $10,000 | $10,000 | $10,000 | $10,000 |
| 10/31/2015 | $10,047 | $10,196 | $9,809 | $9,806 |
| 10/31/2016 | $10,926 | $10,641 | $10,805 | $10,541 |
| 10/31/2017 | $11,841 | $10,737 | $11,768 | $11,414 |
| 10/31/2018 | $11,887 | $10,517 | $11,883 | $11,453 |
| 10/31/2019 | $12,909 | $11,727 | $12,879 | $12,335 |
| 10/31/2020 | $13,347 | $12,453 | $13,320 | $12,587 |
| 10/31/2021 | $14,540 | $12,393 | $14,722 | $13,918 |
| 10/31/2022 | $12,897 | $10,450 | $12,991 | $12,368 |
| 10/31/2023 | $13,596 | $10,487 | $13,800 | $13,012 |
| 10/31/2024 | $15,589 | $11,593 | $16,073 | $15,008 |
Average Annual Total Returns
| Fund/Index | 1 Year | 5 Years | 10 Years |
|---|---|---|---|
| Institutional Shares | 14.66% | 3.84% | 4.54% |
Bloomberg US Aggregate Bond IndexFootnote Reference* | 10.55% | (0.23%) | 1.49% |
| Bloomberg US Corporate High Yield 2% Issuer Capped Index (BHY2%ICI) | 16.47% | 4.53% | 4.86% |
| Lipper High Yield Funds Average | 15.34% | 3.97% | 4.03% |
| Footnote | Description |
Footnote* | The Fund has designated the Bloomberg US Aggregate Bond Index as its new broad-based securities market index in accordance with the SEC’s revised definition for such an index. |
Visit FederatedHermes.com/us/FundInformation and click on the link to your fund and share class for more recent performance information.
Key Fund Statistics
| Net Assets | $7,717,085,790 |
| Number of Investments | 576 |
| Portfolio Turnover | 24% |
| Total Advisory Fees Paid | $29,203,762 |
Annual Shareholder Report
Federated Hermes Institutional High Yield Bond Fund
Fund Holdings
Top Index Classifications (% of Net Assets)

| Value | Value |
|---|---|
| Building Materials | 3.6% |
| Consumer Cyclical Services | 4.1% |
| Packaging | 4.5% |
| Health Care | 4.5% |
| Midstream | 5.2% |
| Gaming | 5.3% |
| Automotive | 5.9% |
| Cable Satellite | 6.9% |
| Insurance - P&C | 7.6% |
| Technology | 11.7% |
Material Fund Changes
Following is a summary of material changes planned for the Fund since the beginning of the reporting period. For more complete and current information, you may review the Fund’s disclosure documents on its webpage at FederatedHermes.com/us/FundInformation or upon request at 1-800-341-7400, Option 4, or by contacting your financial advisor.
Effective December 27, 2024, Randal Stuckwish has been added to the Fund’s portfolio management team.
Additional Information about the Fund
Additional information is available on the Fund’s website at FederatedHermes.com/us/FundInformation, including its:
• prospectus • financial information • holdings • proxy voting information
CUSIP 31420B300
29856-C (12/24)
Federated Securities Corp., Distributor
FederatedHermes.com/us
© 2024 Federated Hermes, Inc.
Federated Hermes Institutional High Yield Bond Fund

Class R6 Shares | FIHLX
Annual Shareholder Report - October 31, 2024
A Portfolio of Federated Hermes Institutional Trust
This annual shareholder report contains important information about the Federated Hermes Institutional High Yield Bond Fund (the "Fund") for the period of November 1, 2023 to October 31, 2024. You can find additional information at FederatedHermes.com/us/FundInformation. You can also request this information by contacting us at 1-800-341-7400, Option 4, or your financial advisor.
This report describes planned changes made to the Fund since the beginning of the reporting period.
What were the Fund costs for the last year?
(based on a hypothetical $10,000 investment)
| Class Name | Costs of a $10,000 investment | Costs paid as a percentage of a $10,000 investment |
|---|---|---|
| Class R6 Shares | $52 | 0.48% |
Management's Discussion of Fund Performance
The following discussion compares the performance of the Fund to the Bloomberg US Corporate High Yield 2% Issuer Capped Index (the “Index”) to show how the Fund’s performance compares to the returns of similar investments for the reporting period. See the Average Annual Total Returns table below for the returns of the Fund and related indexes, including the Bloomberg US Aggregate Bond Index, which represents the overall U.S. fixed-income market. The Fund seeks high current income by investing primarily in lower-rated corporate fixed-income securities, including debt securities issued by U.S. or foreign businesses.
Top Contributors to Performance
■ The Fund was positively impacted by security selection in the Building Materials, Consumer Cyclical Services, Healthcare,
Cable & Satellite and Pharmaceutical industry sectors.
■ The Fund was positively impacted by its underweight position in the underperforming Metals and Mining sector.
■ Specific Fund holdings that positively impacted performance relative to the Index included: Clydesdale Acquisition,
NFP Corp, Community Health Systems, SRS Distribution and Condor Merger Sub.
Top Detractors from Performance
■ The Fund was negatively impacted by security selection overall, especially in the Media & Entertainment, Electric Utility,
Automotive and Technology industry sectors.
■ The Fund was also negatively impacted by its industry allocation, especially its underweight allocations to the strong
performing Wireline Telecommunications and Retail industry sectors. It was also negatively impacted by its overweight
allocations to the underperforming Automotive and Packaging industry sectors. Given the strong absolute performance during
the period, the Fund’s cash position was also a drag on relative performance.
■ Specific Fund holdings that negatively impacted performance relative to the Index included: Enviva Inc., iHeartCommunications,
Ardagh Packaging, Terrier Media Buyer and Rackspace Technologies.
Annual Shareholder Report
Federated Hermes Institutional High Yield Bond Fund
Fund Performance
Keep in mind that the Fund’s past performance is not a good predictor of how the Fund will perform in the future. The graph and table do not reflect the deduction of taxes that a shareholder would pay on fund distributions or redemption of fund shares.
Cumulative Performance: 10/31/2014 to 10/31/2024
Total Return Based on $10,000 Investment

| Class R6 Shares | Bloomberg US Aggregate Bond Index | Bloomberg US Corporate High Yield 2% Issuer Capped Index (BHY2%ICI) | Lipper High Yield Funds Average | |
|---|---|---|---|---|
| 10/31/2014 | $10,000 | $10,000 | $10,000 | $10,000 |
| 10/31/2015 | $10,040 | $10,196 | $9,809 | $9,806 |
| 10/31/2016 | $10,916 | $10,641 | $10,805 | $10,541 |
| 10/31/2017 | $11,843 | $10,737 | $11,768 | $11,414 |
| 10/31/2018 | $11,878 | $10,517 | $11,883 | $11,453 |
| 10/31/2019 | $12,914 | $11,727 | $12,879 | $12,335 |
| 10/31/2020 | $13,340 | $12,453 | $13,320 | $12,587 |
| 10/31/2021 | $14,547 | $12,393 | $14,722 | $13,918 |
| 10/31/2022 | $12,892 | $10,450 | $12,991 | $12,368 |
| 10/31/2023 | $13,593 | $10,487 | $13,800 | $13,012 |
| 10/31/2024 | $15,604 | $11,593 | $16,073 | $15,008 |
Average Annual Total Returns
| Fund/Index | 1 Year | 5 Years | 10 Years |
|---|---|---|---|
| Class R6 Shares | 14.80% | 3.86% | 4.55% |
Bloomberg US Aggregate Bond IndexFootnote Reference* | 10.55% | (0.23%) | 1.49% |
| Bloomberg US Corporate High Yield 2% Issuer Capped Index (BHY2%ICI) | 16.47% | 4.53% | 4.86% |
| Lipper High Yield Funds Average | 15.34% | 3.97% | 4.03% |
| Footnote | Description |
Footnote* | The Fund has designated the Bloomberg US Aggregate Bond Index as its new broad-based securities market index in accordance with the SEC’s revised definition for such an index. |
Visit FederatedHermes.com/us/FundInformation and click on the link to your fund and share class for more recent performance information.
Key Fund Statistics
| Net Assets | $7,717,085,790 |
| Number of Investments | 576 |
| Portfolio Turnover | 24% |
| Total Advisory Fees Paid | $29,203,762 |
Annual Shareholder Report
Federated Hermes Institutional High Yield Bond Fund
Fund Holdings
Top Index Classifications (% of Net Assets)

| Value | Value |
|---|---|
| Building Materials | 3.6% |
| Consumer Cyclical Services | 4.1% |
| Packaging | 4.5% |
| Health Care | 4.5% |
| Midstream | 5.2% |
| Gaming | 5.3% |
| Automotive | 5.9% |
| Cable Satellite | 6.9% |
| Insurance - P&C | 7.6% |
| Technology | 11.7% |
Material Fund Changes
Following is a summary of material changes planned for the Fund since the beginning of the reporting period. For more complete and current information, you may review the Fund’s disclosure documents on its webpage at FederatedHermes.com/us/FundInformation or upon request at 1-800-341-7400, Option 4, or by contacting your financial advisor.
Effective December 27, 2024, Randal Stuckwish has been added to the Fund’s portfolio management team.
Additional Information about the Fund
Additional information is available on the Fund’s website at FederatedHermes.com/us/FundInformation, including its:
• prospectus • financial information • holdings • proxy voting information
CUSIP 31420B847
29856-D (12/24)
Federated Securities Corp., Distributor
FederatedHermes.com/us
© 2024 Federated Hermes, Inc.
| Item 2. | Code of Ethics |
(a) As of the end of the period covered by this report, the registrant has adopted a code of ethics (the “Section 406 Standards for Investment Companies - Ethical Standards for Principal Executive and Financial Officers”) that applies to the registrant’s Principal Executive Officer and Principal Financial Officer; the registrant’s Principal Financial Officer also serves as the Principal Accounting Officer.
(c) There was no amendment to the registrant’s code of ethics described in Item 2(a) above during the period covered by the report.
(d) There was no waiver granted, either actual or implicit, from a provision to the registrant’s code of ethics described in Item 2(a) above during the period covered by the report.
(e) Not Applicable
(f)(3) The registrant hereby undertakes to provide any person, without charge, upon request, a copy of the code of ethics. To request a copy of the code of ethics, contact the registrant at 1-800-341-7400, and ask for a copy of the Section 406 Standards for Investment Companies - Ethical Standards for Principal Executive and Financial Officers.
| Item 3. | Audit Committee Financial Expert |
The registrant’s Board has determined that each of the following members of the Board’s Audit Committee is an “audit committee financial expert,” and is “independent,” for purposes of this Item 3: Thomas M. O’Neill and John S. Walsh.
| Item 4. | Principal Accountant Fees and Services |
(a) Audit Fees billed to the registrant for the two most recent fiscal years:
Fiscal year ended 2024 – $113,620
Fiscal year ended 2023 - $107,086
(b) Audit-Related Fees billed to the registrant for the two most recent fiscal years:
Fiscal year ended 2024 - $0
Fiscal year ended 2023 - $0
Amount requiring approval of the registrant’s Audit Committee pursuant to paragraph (c)(7)(ii) of Rule 2-01 of Regulation S-X, $1,683 and $0 respectively. Fiscal year ended 2024- Travel expenses for attendance at Board meeting.
(c) Tax Fees billed to the registrant for the two most recent fiscal years:
Fiscal year ended 2024 - $0
Fiscal year ended 2023 - $0
Amount requiring approval of the registrant’s Audit Committee pursuant to paragraph (c)(7)(ii) of Rule 2-01 of Regulation S-X, $0 and $0 respectively.
(d) All Other Fees billed to the registrant for the two most recent fiscal years:
Fiscal year ended 2024 - $0
Fiscal year ended 2023 - $0
Amount requiring approval of the registrant’s Audit Committee pursuant to paragraph (c)(7)(ii) of Rule 2-01 of Regulation S-X, $0 and $0 respectively.
(e)(1) Audit Committee Policies regarding Pre-approval of Services.
The Audit Committee is required to pre-approve audit and non-audit services performed by the independent auditor in order to assure that the provision of such services do not impair the auditor’s independence. The Audit Committee is required to pre-concur with independence conclusions made by the independent auditor regarding non-audit services to be provided by the independent auditor to the Funds, the Funds Board of Directors, or any entity that is controlled directly or indirectly by the Funds. Unless a type of service to be provided by the independent auditor has received general pre-approval, it will require specific pre-approval(and pre-concurrence for non-audit services) by the Audit Committee. Any proposed services exceeding pre-approved cost levels will require specific pre-approval by the Audit Committee.
Certain services have the general pre-approval of the Audit Committee. The term of the general pre-approval is 12 months from the date of pre-approval, unless the Audit Committee specifically provides for a different period. The Audit Committee will annually review the services that may be provided by the independent auditor without obtaining specific pre-approval from the Audit Committee and may grant general pre-approval for such services. The Audit Committee will revise the list of general pre-approved services from time to time, based on subsequent determinations. The Audit Committee will not delegate to management its responsibilities to pre-approve services performed by the independent auditor.
The Audit Committee has delegated pre-approval/pre-concurrence authority to its chairman (the “Chairman”) for services that do not exceed a specified dollar threshold. The Chairman or Chief Audit Executive will report any such pre-approval/pre-concurrence decisions to the Audit Committee at its next scheduled meeting. The Committee will designate another member with such pre-approval/pre-concurrence authority when the Chairman is unavailable.
AUDIT SERVICES
The annual audit services engagement terms and fees will be subject to the specific pre-approval of the Audit Committee. The Audit Committee will approve, if necessary, any changes in terms, conditions and fees resulting from changes in audit scope, registered investment company (RIC) structure or other matters.
In addition to the annual audit services engagement specifically approved by the Audit Committee, the Audit Committee may grant general pre-approval for other audit services, which are those services that only the independent auditor reasonably can provide. The Audit Committee has pre-approved certain audit services; with limited exception, all other audit services must be specifically pre-approved by the Audit Committee.
AUDIT-RELATED SERVICES
Audit-related services are assurance and related services that are reasonably related to the performance of the audit or review of the RIC’s financial statements or that are traditionally performed by the independent auditor. The Audit Committee believes that the provision of audit-related services does not impair the independence of the auditor, and has pre-approved certain audit-related services; all other audit-related services must be specifically pre-approved by the Audit Committee.
TAX SERVICES
The Audit Committee believes that the independent auditor can provide tax services to the RIC such as tax compliance, tax planning and tax advice without impairing the auditor’s independence. However, the Audit Committee will not permit the retention of the independent auditor in connection with a transaction initially recommended by the independent auditor, the purpose of which may be tax avoidance and the tax treatment of which may not be supported in the Internal Revenue Code and related regulations. The Audit Committee has pre-approved/pre-concurred certain tax services; with limited exception, all tax services involving large and complex transactions must be specifically pre-approved/pre-concurred by the Audit Committee.
ALL OTHER SERVICES
With respect to the provision of permissible services other than audit, review or attest services the pre-approval/pre-concurrence requirement is waived if:
(1) With respect to such services rendered to the Funds, the aggregate amount of all such services provided constitutes no more than five percent of the total amount of revenues paid by the audit client to its accountant during the fiscal year in which the services are provided; and,
(2) With respect to such services rendered to the Fund’s investment adviser ( the “Adviser”)and any entity controlling, controlled by to under common control with the Adviser such as affiliated non-U.S. and U.S. funds not under the Audit Committee’s purview and which do not fall within a category of service which has been determined by the Audit Committee not to have a direct impact on the operations or financial reporting of the RIC, the aggregate amount of all services provided constitutes no more than five percent of the total amount of revenues paid to the RIC’s auditor by the RIC, its Adviser and any entity controlling, controlled by, or under common control with the Adviser during the fiscal year in which the services are provided; and
(3) Such services were not recognized by the issuer or RIC at the time of the engagement to be non-audit services; and
(4) Such services are promptly brought to the attention of the Audit Committee and approved prior to the completion of the audit by the Audit Committee or by one or more members of the Audit Committee who are members of the Board of Directors to whom authority to grant such approvals has been delegated by the Audit Committee.
The Audit Committee may grant general pre-approval/pre-concurrence to those permissible non-audit services which qualify for pre-approval and which it believes are routine and recurring services, and would not impair the independence of the auditor.
The Securities and Exchange Commission’s (the “SEC”) rules and relevant guidance should be consulted to determine the precise definitions of these services and applicability of exceptions to certain of the prohibitions.
PRE-APPROVAL FEE LEVELS
Pre-approval fee levels for all services to be provided by the independent auditor will be established annually by the Audit Committee. Any proposed services exceeding these levels will require specific pre-approval by the Audit Committee.
PROCEDURES
Requests or applications to provide services that require specific approval/concurrence by the Audit Committee will be submitted to the Audit Committee by the Fund’s Principal Accounting Officer and/or the Chief Audit Executive of Federated Hermes, Inc., only after those individuals have determined that the request or application is consistent with the SEC’s rules on auditor independence.
(e)(2) Percentage of services identified in items 4(b) through 4(d) that were approved by the registrant’s Audit Committee pursuant to paragraph (c)(7)(i)(C) of Rule 2-01 of Regulation S-X:
4(b)
Fiscal year ended 2024 – 0%
Fiscal year ended 2023 - 0%
Percentage of services provided to the registrant’s Adviser and any entity controlling, controlled by, or under common control with the Adviser that provides ongoing services to the registrant that were approved by the registrant’s Audit Committee pursuant to paragraph (c)(7)(i)(C) of Rule 2-01 of Regulation S-X, 0% and 0% respectively.
4(c)
Fiscal year ended 2024 – 0%
Fiscal year ended 2023 – 0%
Percentage of services provided to the registrant’s Adviser and any entity controlling, controlled by, or under common control with the Adviser that provides ongoing services to the registrant that were approved by the registrant’s Audit Committee pursuant to paragraph (c)(7)(i)(C) of Rule 2-01 of Regulation S-X, 0% and 0% respectively.
4(d)
Fiscal year ended 2024 – 0%
Fiscal year ended 2023 – 0%
Percentage of services provided to the registrant’s Adviser and any entity controlling, controlled by, or under common control with the Adviser that provides ongoing services to the registrant that were approved by the registrant’s Audit Committee pursuant to paragraph (c)(7)(i)(C) of Rule 2-01 of Regulation S-X, 0% and 0% respectively.
(f) NA
(g) Non-Audit Fees billed to the registrant, the registrant’s Adviser, and certain entities controlling, controlled by or under common control with the Adviser:
Fiscal year ended 2024 - $235,511
Fiscal year ended 2023 - $282,294
(h) The registrant’s Audit Committee has considered that the provision of non-audit services that were rendered to the registrant’s Adviser (not including any sub-adviser whose role is primarily portfolio management and is subcontracted with or overseen by another investment adviser), and any entity controlling, controlled by, or under common control with the Adviser that provides ongoing services to the registrant that were not pre-approved pursuant to paragraph (c)(7)(ii) of Rule 2-01 of Regulation S-X is compatible with maintaining the principal accountant’s independence.
| Item 5. | Audit Committee of Listed Registrants |
Not Applicable
| Item 6. | Schedule of Investments |
(a) The registrant’s Schedule of Investments is included as part of the Financial Statements filed under Item 7 of this form.
(b) Not Applicable
| Item 7. | Financial Statements and Financial Highlights for Open-End Management Companies |
and Additional Information

Share Class | Ticker | A | FIHAX | C | FIHCX | Institutional | FIHBX | R6 | FIHLX |
Federated Hermes Institutional High Yield Bond Fund
A Portfolio of Federated Hermes Institutional Trust
Principal Amount or Shares | Value | ||
CORPORATE BONDS—96.1% | |||
Aerospace/Defense—1.6% | |||
$ 9,550,000 | TransDigm, Inc., 144A, 6.375%, 3/1/2029 | $ 9,705,565 | |
20,750,000 | TransDigm, Inc., 1st Priority Sr. Secd. Note, 144A, 6.625%, 3/1/2032 | 21,127,219 | |
2,950,000 | TransDigm, Inc., Sec. Fac. Bond, 144A, 6.000%, 1/15/2033 | 2,926,265 | |
13,925,000 | TransDigm, Inc., Sec. Fac. Bond, 144A, 6.750%, 8/15/2028 | 14,241,251 | |
38,600,000 | TransDigm, Inc., Sec. Fac. Bond, 144A, 6.875%, 12/15/2030 | 39,602,210 | |
6,175,000 | TransDigm, Inc., Sr. Sub. Note, Series WI, 4.625%, 1/15/2029 | 5,869,811 | |
14,275,000 | TransDigm, Inc., Sr. Sub. Note, Series WI, 4.875%, 5/1/2029 | 13,647,928 | |
17,925,000 | TransDigm, Inc., Sr. Sub., Series WI, 5.500%, 11/15/2027 | 17,782,263 | |
TOTAL | 124,902,512 | ||
Airlines—0.2% | |||
9,787,500 | American Airlines, Inc./AAdvantage Loyalty IP Ltd., 144A, 5.500%, 4/20/2026 | 9,765,233 | |
2,125,000 | American Airlines, Inc./AAdvantage Loyalty IP Ltd., 144A, 5.750%, 4/20/2029 | 2,105,997 | |
TOTAL | 11,871,230 | ||
Automotive—5.9% | |||
36,950,000 | Adient Global Holdings Ltd., Sr. Unsecd. Note, 144A, 4.875%, 8/15/2026 | 36,439,477 | |
3,725,000 | Adient Global Holdings Ltd., Sr. Unsecd. Note, 144A, 8.250%, 4/15/2031 | 3,861,838 | |
4,100,000 | Adient Global Holdings Ltd., Term Loan - 1st Lien, 144A, 7.000%, 4/15/2028 | 4,171,688 | |
6,875,000 | Dana Financing Lux S.a.r.l., Sr. Unsecd. Note, 144A, 5.750%, 4/15/2025 | 6,849,546 | |
36,600,000 | Dornoch Debt Merger Sub, Inc., Sr. Unsecd. Note, 144A, 6.625%, 10/15/2029 | 30,674,840 | |
9,150,000 | Ford Motor Credit Co. LLC, Sr. Unsecd. Note, 2.700%, 8/10/2026 | 8,735,635 | |
30,600,000 | Ford Motor Credit Co. LLC, Sr. Unsecd. Note, 3.375%, 11/13/2025 | 30,021,434 | |
23,600,000 | Ford Motor Credit Co. LLC, Sr. Unsecd. Note, 4.000%, 11/13/2030 | 21,320,613 | |
23,800,000 | Ford Motor Credit Co. LLC, Sr. Unsecd. Note, 4.063%, 11/1/2024 | 23,800,000 | |
11,725,000 | Ford Motor Credit Co. LLC, Sr. Unsecd. Note, 4.125%, 8/17/2027 | 11,334,256 | |
4,375,000 | Ford Motor Credit Co. LLC, Sr. Unsecd. Note, 4.271%, 1/9/2027 | 4,278,502 | |
22,975,000 | Ford Motor Credit Co. LLC, Sr. Unsecd. Note, 5.113%, 5/3/2029 | 22,370,370 | |
23,475,000 | Ford Motor Credit Co. LLC, Sr. Unsecd. Note, 5.125%, 6/16/2025 | 23,418,920 | |
12,050,000 | Ford Motor Credit Co. LLC, Sr. Unsecd. Note, 7.350%, 11/4/2027 | 12,661,495 | |
30,200,000 | Ford Motor Credit Co. LLC, Sr. Unsecd. Note, Series GMTN, 4.389%, 1/8/2026 | 29,837,597 | |
15,225,000 | IHO Verwaltungs GmbH, 144A, 8.000%, 11/15/2032 | 15,288,184 | |
21,775,000 | IHO Verwaltungs GmbH, Sec. Fac. Bond, 144A, 6.375%, 5/15/2029 | 21,069,174 | |
13,275,000 | J.B. Poindexter & Co., Inc., Sr. Unsecd. Note, 144A, 8.750%, 12/15/2031 | 13,944,644 | |
80,275,000 | Panther BF Aggregator 2 LP, Sr. Unsecd. Note, 144A, 8.500%, 5/15/2027 | 80,854,425 | |
33,975,000 | Real Hero Merger Sub 2, Inc., Sr. Unsecd. Note, 144A, 6.250%, 2/1/2029 | 29,707,512 | |
6,525,000 | ZF North America Capital, Inc., Sr. Unsecd. Note, 144A, 6.750%, 4/23/2030 | 6,437,329 | |
5,200,000 | ZF North America Capital, Inc., Sr. Unsecd. Note, 144A, 6.875%, 4/14/2028 | 5,249,858 | |
10,500,000 | ZF North America Capital, Inc., Sr. Unsecd. Note, 144A, 7.125%, 4/14/2030 | 10,568,197 | |
TOTAL | 452,895,534 | ||
Banking—0.2% | |||
12,675,000 | Ally Financial, Inc., Sr. Sub. Note, 5.750%, 11/20/2025 | 12,728,242 | |
Building Materials—3.6% | |||
9,850,000 | American Builders & Contractors Supply Co., Inc., 144A, 4.000%, 1/15/2028 | 9,370,288 | |
3,275,000 | American Builders & Contractors Supply Co., Inc., Sr. Unsecd. Note, 144A, 3.875%, 11/15/2029 | 2,981,168 | |
5,975,000 | Beacon Roofing Supply, Inc., Sr. Note, 144A, 6.500%, 8/1/2030 | 6,079,515 | |
10,275,000 | Camelot Return Merger SU, Sec. Fac. Bond, 144A, 8.750%, 8/1/2028 | 10,333,898 | |
2,050,000 | Cornerstone Building Brands, Sr. Unsecd. Note, 144A, 6.125%, 1/15/2029 | 1,834,540 | |
33,150,000 | Cp Atlas Buyer, Inc., Sr. Unsecd. Note, 144A, 7.000%, 12/1/2028 | 30,376,833 | |
39,475,000 | Foundation Building Materials, Inc., Sr. Unsecd. Note, 144A, 6.000%, 3/1/2029 | 34,921,543 | |
26,425,000 | Gyp Holdings III Corp., Sr. Unsecd. Note, 144A, 4.625%, 5/1/2029 | 24,969,804 |
Principal Amount or Shares | Value | ||
CORPORATE BONDS—continued | |||
Building Materials—continued | |||
$ 14,925,000 | Interface, Inc., Sr. Unsecd. Note, 144A, 5.500%, 12/1/2028 | $ 14,626,500 | |
4,925,000 | Masterbrand, Inc., 144A, 7.000%, 7/15/2032 | 5,050,041 | |
11,525,000 | Miter Brands Acquisition Holdco, Inc./MIWD Borrower LLC, Sec. Fac. Bond, 144A, 6.750%, 4/1/2032 | 11,731,000 | |
6,575,000 | MIWD Holdco II LLC/ MIWD Finance Corp., Sr. Unsecd. Note, 144A, 5.500%, 2/1/2030 | 6,298,381 | |
15,750,000 | Patrick Industries, Inc., Sec. Fac. Bond, 144A, 6.375%, 11/1/2032 | 15,589,671 | |
15,050,000 | Standard Industries, Inc., Sr. Unsecd. Note, 144A, 3.375%, 1/15/2031 | 13,078,597 | |
15,725,000 | Standard Industries, Inc., Sr. Unsecd. Note, 144A, 4.375%, 7/15/2030 | 14,462,171 | |
5,950,000 | Standard Industries, Inc., Sr. Unsecd. Note, 144A, 4.750%, 1/15/2028 | 5,744,135 | |
28,400,000 | Standard Industries, Inc., Sr. Unsecd. Note, 144A, 5.000%, 2/15/2027 | 27,832,568 | |
3,425,000 | Standard Industries, Inc., Sr. Unsecd. Note, 144A, 6.500%, 8/15/2032 | 3,449,475 | |
25,800,000 | White Cap Buyer LLC, Sr. Unsecd. Note, 144A, 6.875%, 10/15/2028 | 25,907,870 | |
15,375,000 | White Cap Parent LLC, Sr. Sub. Secd. Note, 144A, 8.250%, 3/15/2026 | 15,403,828 | |
TOTAL | 280,041,826 | ||
Cable Satellite—6.9% | |||
438,000 | CCO Holdings LLC/Cap Corp., Sr. Sub. Secd. Note, 144A, 5.500%, 5/1/2026 | 436,877 | |
14,325,000 | CCO Holdings LLC/Cap Corp., Sr. Unsecd. Note, 4.500%, 5/1/2032 | 12,199,848 | |
40,675,000 | CCO Holdings LLC/Cap Corp., Sr. Unsecd. Note, 144A, 4.250%, 2/1/2031 | 35,332,013 | |
8,775,000 | CCO Holdings LLC/Cap Corp., Sr. Unsecd. Note, 144A, 4.250%, 1/15/2034 | 7,018,632 | |
31,525,000 | CCO Holdings LLC/Cap Corp., Sr. Unsecd. Note, 144A, 4.500%, 8/15/2030 | 28,182,212 | |
3,450,000 | CCO Holdings LLC/Cap Corp., Sr. Unsecd. Note, 144A, 4.500%, 6/1/2033 | 2,872,484 | |
27,325,000 | CCO Holdings LLC/Cap Corp., Sr. Unsecd. Note, 144A, 4.750%, 3/1/2030 | 24,879,399 | |
6,225,000 | CCO Holdings LLC/Cap Corp., Sr. Unsecd. Note, 144A, 4.750%, 2/1/2032 | 5,387,899 | |
9,350,000 | CCO Holdings LLC/Cap Corp., Sr. Unsecd. Note, 144A, 5.000%, 2/1/2028 | 9,056,494 | |
10,400,000 | CCO Holdings LLC/Cap Corp., Sr. Unsecd. Note, 144A, 5.125%, 5/1/2027 | 10,191,247 | |
7,600,000 | CCO Holdings LLC/Cap Corp., Sr. Unsecd. Note, 144A, 5.375%, 6/1/2029 | 7,260,892 | |
4,000,000 | CCO Holdings LLC/Cap Corp., Sr. Unsecd. Note, 144A, 7.375%, 3/1/2031 | 4,070,306 | |
3,825,000 | CSC Holdings LLC, Sr. Unsecd. Note, 144A, 3.375%, 2/15/2031 | 2,747,846 | |
24,400,000 | CSC Holdings LLC, Sr. Unsecd. Note, 144A, 4.125%, 12/1/2030 | 18,036,155 | |
25,925,000 | CSC Holdings LLC, Sr. Unsecd. Note, 144A, 4.500%, 11/15/2031 | 19,032,452 | |
19,475,000 | CSC Holdings LLC, Sr. Unsecd. Note, 144A, 4.625%, 12/1/2030 | 9,815,151 | |
20,500,000 | CSC Holdings LLC, Sr. Unsecd. Note, 144A, 5.500%, 4/15/2027 | 18,267,581 | |
24,025,000 | CSC Holdings LLC, Sr. Unsecd. Note, 144A, 5.750%, 1/15/2030 | 12,681,489 | |
3,975,000 | CSC Holdings LLC, Sr. Unsecd. Note, 144A, 6.500%, 2/1/2029 | 3,364,674 | |
2,525,000 | DISH DBS Corp., Sec. Fac. Bond, 144A, 5.750%, 12/1/2028 | 2,210,855 | |
13,125,000 | DISH DBS Corp., Sr. Unsecd. Note, 7.375%, 7/1/2028 | 9,630,589 | |
6,825,000 | DISH DBS Corp., Sr. Unsecd. Note, 7.750%, 7/1/2026 | 5,780,618 | |
22,175,000 | DISH DBS Corp., Sr. Unsecd. Note, Series WI, 5.125%, 6/1/2029 | 14,776,143 | |
16,350,000 | Doyla Holdco 18 Designated Activity Co., Sr. Unsecd. Note, 144A, 5.000%, 7/15/2028 | 15,688,494 | |
6,050,000 | Sirius XM Radio, Inc., Sr. Unsecd. Note, 144A, 3.125%, 9/1/2026 | 5,808,819 | |
15,125,000 | Sirius XM Radio, Inc., Sr. Unsecd. Note, 144A, 3.875%, 9/1/2031 | 13,008,462 | |
9,825,000 | Sirius XM Radio, Inc., Sr. Unsecd. Note, 144A, 4.000%, 7/15/2028 | 9,187,841 | |
18,925,000 | Sirius XM Radio, Inc., Sr. Unsecd. Note, 144A, 4.125%, 7/1/2030 | 16,947,000 | |
3,600,000 | Sirius XM Radio, Inc., Sr. Unsecd. Note, 144A, 5.000%, 8/1/2027 | 3,530,262 | |
20,375,000 | Sirius XM Radio, Inc., Sr. Unsecd. Note, 144A, 5.500%, 7/1/2029 | 19,780,256 | |
37,675,000 | Sunrise FinCo I B.V., Sr. Note, 144A, 4.875%, 7/15/2031 | 34,506,344 | |
44,000,000 | Telenet Finance Luxembourg, Sec. Fac. Bond, 144A, 5.500%, 3/1/2028 | 42,839,258 | |
15,025,000 | Virgin Media Finance PLC, Sr. Unsecd. Note, 144A, 5.000%, 7/15/2030 | 12,934,863 | |
7,400,000 | Virgin Media Secured Finance PLC, Sec. Fac. Bond, 144A, 4.500%, 8/15/2030 | 6,487,698 | |
9,850,000 | Virgin Media Secured Finance PLC, Sec. Fac. Bond, 144A, 5.500%, 5/15/2029 | 9,323,582 | |
10,100,000 | Vmed O2 UK Financing I PLC, Sec. Fac. Bond, 144A, 4.250%, 1/31/2031 | 8,723,324 | |
17,325,000 | Vmed O2 UK Financing I PLC, Sr. Note, 144A, 4.750%, 7/15/2031 | 15,020,692 | |
14,525,000 | VZ Secured Financing B.V., Sec. Fac. Bond, 144A, 5.000%, 1/15/2032 | 13,062,935 |
Principal Amount or Shares | Value | ||
CORPORATE BONDS—continued | |||
Cable Satellite—continued | |||
$ 3,800,000 | Ziggo B.V., Sec. Fac. Bond, 144A, 4.875%, 1/15/2030 | $ 3,527,349 | |
7,925,000 | Ziggo Bond Co. B.V., Sr. Unsecd. Note, 144A, 5.125%, 2/28/2030 | 7,180,856 | |
31,625,000 | Ziggo Finance B.V., Sr. Unsecd. Note, 144A, 6.000%, 1/15/2027 | 31,582,973 | |
TOTAL | 532,372,864 | ||
Chemicals—2.7% | |||
7,350,000 | Ashland, Inc., Sr. Unsecd. Note, 144A, 3.375%, 9/1/2031 | 6,363,432 | |
6,125,000 | Axalta Coat/Dutch Holding B.V., Sr. Unsecd. Note, 144A, 4.750%, 6/15/2027 | 6,007,683 | |
5,275,000 | Axalta Coating Systems Dutch Holding B B.V., Sr. Unsecd. Note, 144A, 7.250%, 2/15/2031 | 5,519,206 | |
9,500,000 | Axalta Coating Systems LLC, Sr. Unsecd. Note, 144A, 3.375%, 2/15/2029 | 8,746,332 | |
9,425,000 | Cheever Escrow Issuer, Sec. Fac. Bond, 144A, 7.125%, 10/1/2027 | 9,578,938 | |
20,250,000 | Element Solutions, Inc., Sr. Unsecd. Note, 144A, 3.875%, 9/1/2028 | 19,527,405 | |
11,850,000 | H.B. Fuller Co., Sr. Unsecd. Note, 4.250%, 10/15/2028 | 11,239,342 | |
35,550,000 | Herens Holdco S.a.r.l., Sec. Fac. Bond, 144A, 4.750%, 5/15/2028 | 31,229,431 | |
14,900,000 | Illuminate Buyer LLC/Illuminate Holdings IV, Inc., Sr. Unsecd. Note, 144A, 9.000%, 7/1/2028 | 15,106,827 | |
17,475,000 | Olympus Water US Holding Corp., Sec. Fac. Bond, 144A, 4.250%, 10/1/2028 | 16,465,288 | |
4,750,000 | Olympus Water US Holding Corp., Sec. Fac. Bond, 144A, 7.250%, 6/15/2031 | 4,878,297 | |
18,700,000 | Olympus Water US Holding Corp., Sec. Fac. Bond, 144A, 9.750%, 11/15/2028 | 19,862,374 | |
20,400,000 | Olympus Water US Holding Corp., Sr. Unsecd. Note, 144A, 6.250%, 10/1/2029 | 19,475,960 | |
2,325,000 | SPCM S.A., Sr. Unsecd. Note, 144A, 3.125%, 3/15/2027 | 2,213,941 | |
7,125,000 | SPCM S.A., Sr. Unsecd. Note, 144A, 3.375%, 3/15/2030 | 6,407,214 | |
7,625,000 | WR Grace Holdings LLC, 144A, 4.875%, 6/15/2027 | 7,491,463 | |
4,050,000 | WR Grace Holdings LLC, Sec. Fac. Bond, 144A, 7.375%, 3/1/2031 | 4,189,555 | |
14,025,000 | WR Grace Holdings LLC, Sr. Unsecd. Note, 144A, 5.625%, 8/15/2029 | 12,968,114 | |
TOTAL | 207,270,802 | ||
Construction Machinery—0.8% | |||
24,850,000 | H&E Equipment Services, Inc., Sr. Unsecd. Note, 144A, 3.875%, 12/15/2028 | 22,968,716 | |
2,500,000 | United Rentals North America, Inc., Sr. Unsecd. Note, 3.750%, 1/15/2032 | 2,218,946 | |
3,200,000 | United Rentals North America, Inc., Sr. Unsecd. Note, 3.875%, 2/15/2031 | 2,905,147 | |
12,850,000 | United Rentals North America, Inc., Sr. Unsecd. Note, 4.000%, 7/15/2030 | 11,878,675 | |
10,600,000 | United Rentals North America, Inc., Sr. Unsecd. Note, 4.875%, 1/15/2028 | 10,384,876 | |
1,725,000 | United Rentals North America, Inc., Sr. Unsecd. Note, 5.250%, 1/15/2030 | 1,699,051 | |
5,650,000 | United Rentals North America, Inc., Sr. Unsecd. Note, 144A, 6.125%, 3/15/2034 | 5,704,212 | |
825,000 | United Rentals North America, Inc., Term Loan - 1st Lien, 144A, 6.000%, 12/15/2029 | 839,002 | |
TOTAL | 58,598,625 | ||
Consumer Cyclical Services—4.1% | |||
13,375,000 | Allied Universal Holdco LLC, Sec. Fac. Bond, 144A, 7.875%, 2/15/2031 | 13,622,946 | |
20,800,000 | Allied Universal Holdco LLC, Sr. Unsecd. Note, 144A, 6.000%, 6/1/2029 | 19,052,619 | |
43,300,000 | Allied Universal Holdco LLC, Sr. Unsecd. Note, 144A, 9.750%, 7/15/2027 | 43,434,403 | |
24,575,000 | Cars.com, Inc., Sr. Unsecd. Note, 144A, 6.375%, 11/1/2028 | 24,523,896 | |
18,400,000 | Dun & Bradstreet Corp., Sr. Unsecd. Note, 144A, 5.000%, 12/15/2029 | 18,044,230 | |
3,950,000 | Garda World Security Corp., 144A, 8.250%, 8/1/2032 | 3,932,455 | |
5,625,000 | Garda World Security Corp., Sec. Fac. Bond, 144A, 4.625%, 2/15/2027 | 5,482,121 | |
4,325,000 | Garda World Security Corp., Sec. Fac. Bond, 144A, 7.750%, 2/15/2028 | 4,470,744 | |
28,325,000 | Garda World Security Corp., Sr. Unsecd. Note, 144A, 6.000%, 6/1/2029 | 26,569,994 | |
25,525,000 | Garda World Security Corp., Sr. Unsecd. Note, 144A, 8.375%, 11/15/2032 | 25,554,798 | |
46,201,000 | Garda World Security Corp., Sr. Unsecd. Note, 144A, 9.500%, 11/1/2027 | 46,267,206 | |
8,900,000 | Go Daddy Operating Co. LLC / GD Finance Co., Inc., Sr. Unsecd. Note, 144A, 5.250%, 12/1/2027 | 8,803,528 | |
2,100,000 | Match Group Holdings II LLC, Sr. Unsecd. Note, 144A, 3.625%, 10/1/2031 | 1,841,716 | |
21,175,000 | Match Group Holdings II LLC, Sr. Unsecd. Note, 144A, 4.125%, 8/1/2030 | 19,273,957 | |
12,600,000 | Match Group Holdings II LLC, Sr. Unsecd. Note, 144A, 4.625%, 6/1/2028 | 12,130,262 | |
8,175,000 | Match Group Holdings II LLC, Sr. Unsecd. Note, 144A, 5.000%, 12/15/2027 | 7,988,910 | |
12,850,000 | Raven Acquisition Holdings LLC, Sr. Secd. Note, 144A, 6.875%, 11/15/2031 | 12,847,870 |
Principal Amount or Shares | Value | ||
CORPORATE BONDS—continued | |||
Consumer Cyclical Services—continued | |||
$ 11,850,000 | The Brink’s Co., Sr. Unsecd. Note, 144A, 6.500%, 6/15/2029 | $ 12,095,686 | |
11,900,000 | The Brink’s Co., Sr. Unsecd. Note, 144A, 6.750%, 6/15/2032 | 12,129,111 | |
TOTAL | 318,066,452 | ||
Consumer Products—1.7% | |||
2,550,000 | Acushnet Co., Sr. Unsecd. Note, 144A, 7.375%, 10/15/2028 | 2,661,491 | |
53,250,000 | BCPE Empire Holdings, Inc., Sr. Unsecd. Note, 144A, 7.625%, 5/1/2027 | 53,619,395 | |
5,625,000 | Edgewell Personal Care Co., Sr. Unsecd. Note, 144A, 4.125%, 4/1/2029 | 5,256,887 | |
9,850,000 | Edgewell Personal Care Co., Sr. Unsecd. Note, 144A, 5.500%, 6/1/2028 | 9,714,961 | |
25,900,000 | Energizer Holdings, Inc., Sr. Unsecd. Note, 144A, 4.375%, 3/31/2029 | 24,250,144 | |
20,050,000 | Energizer Holdings, Inc., Sr. Unsecd. Note, 144A, 4.750%, 6/15/2028 | 19,268,365 | |
12,175,000 | Energizer Holdings, Inc., Sr. Unsecd. Note, 144A, 6.500%, 12/31/2027 | 12,325,678 | |
4,700,000 | Prestige Brands, Inc., Sr. Unsecd. Note, 144A, 3.750%, 4/1/2031 | 4,193,205 | |
TOTAL | 131,290,126 | ||
Diversified Manufacturing—1.3% | |||
42,525,000 | Emerald Debt Merger, Sec. Fac. Bond, 144A, 6.625%, 12/15/2030 | 43,302,059 | |
3,275,000 | Emrld Borrower LP, Sec. Fac. Bond, 144A, 6.750%, 7/15/2031 | 3,350,151 | |
10,350,000 | Gates Corp., Sr. Unsecd. Note, 144A, 6.875%, 7/1/2029 | 10,646,838 | |
10,700,000 | WESCO Distribution, Inc., Sr. Unsecd. Note, 144A, 6.375%, 3/15/2029 | 10,931,516 | |
12,900,000 | WESCO Distribution, Inc., Sr. Unsecd. Note, 144A, 6.625%, 3/15/2032 | 13,235,337 | |
18,100,000 | WESCO Distribution, Inc., Sr. Unsecd. Note, 144A, 7.250%, 6/15/2028 | 18,540,663 | |
TOTAL | 100,006,564 | ||
Finance Companies—2.7% | |||
40,125,000 | Boost Newco Borrower LLC, 144A, 7.500%, 1/15/2031 | 42,339,085 | |
1,850,000 | Macquarie Airfinance Holdings Ltd., Sr. Unsecd. Note, 144A, 6.400%, 3/26/2029 | 1,908,025 | |
1,825,000 | Macquarie Airfinance Holdings Ltd., Sr. Unsecd. Note, 144A, 6.500%, 3/26/2031 | 1,897,571 | |
2,025,000 | Macquarie Airfinance Holdings Ltd., Sr. Unsecd. Note, 144A, 8.125%, 3/30/2029 | 2,143,983 | |
14,225,000 | Navient Corp., Sr. Unsecd. Note, 4.875%, 3/15/2028 | 13,567,800 | |
8,050,000 | Navient Corp., Sr. Unsecd. Note, 5.000%, 3/15/2027 | 7,920,678 | |
10,425,000 | Navient Corp., Sr. Unsecd. Note, 5.500%, 3/15/2029 | 9,941,513 | |
12,100,000 | Navient Corp., Sr. Unsecd. Note, 6.750%, 6/25/2025 | 12,167,941 | |
6,400,000 | Navient Corp., Sr. Unsecd. Note, 6.750%, 6/15/2026 | 6,527,219 | |
17,150,000 | Rocket Mortgage Co-Issuer, Inc., Sr. Unsecd. Note, 144A, 2.875%, 10/15/2026 | 16,334,866 | |
17,400,000 | Rocket Mortgage Co-Issuer, Inc., Sr. Unsecd. Note, 144A, 3.625%, 3/1/2029 | 16,042,099 | |
18,475,000 | Rocket Mortgage Co-Issuer, Inc., Sr. Unsecd. Note, 144A, 3.875%, 3/1/2031 | 16,472,384 | |
11,300,000 | Rocket Mortgage Co-Issuer, Inc., Sr. Unsecd. Note, 144A, 4.000%, 10/15/2033 | 9,755,656 | |
25,375,000 | United Wholesale Mortgage, LLC, Sr. Unsecd. Note, 144A, 5.500%, 11/15/2025 | 25,264,715 | |
19,600,000 | United Wholesale Mortgage, LLC, Sr. Unsecd. Note, 144A, 5.500%, 4/15/2029 | 18,710,950 | |
11,200,000 | United Wholesale Mortgage, LLC, Sr. Unsecd. Note, 144A, 5.750%, 6/15/2027 | 11,015,919 | |
TOTAL | 212,010,404 | ||
Food & Beverage—1.7% | |||
2,125,000 | Aramark Services, Inc., Sr. Unsecd. Note, 144A, 5.000%, 4/1/2025 | 2,122,419 | |
1,175,000 | Aramark Services, Inc., Sr. Unsecd. Note, 144A, 5.000%, 2/1/2028 | 1,154,918 | |
19,450,000 | Bellring Brands, Inc., Sr. Unsecd. Note, 144A, 7.000%, 3/15/2030 | 20,262,504 | |
17,025,000 | Performance Food Group, Inc., Sr. Unsecd. Note, 144A, 4.250%, 8/1/2029 | 15,952,396 | |
6,475,000 | Performance Food Group, Inc., Sr. Unsecd. Note, 144A, 5.500%, 10/15/2027 | 6,425,303 | |
3,950,000 | Performance Food Group, Inc., Sr. Unsecd. Note, 144A, 6.125%, 9/15/2032 | 3,971,464 | |
18,425,000 | Post Holdings, Inc., 144A, 6.375%, 3/1/2033 | 18,274,588 | |
8,100,000 | Post Holdings, Inc., Sec. Fac. Bond, 144A, 6.250%, 2/15/2032 | 8,200,100 | |
12,325,000 | Post Holdings, Inc., Sr. Unsecd. Note, 144A, 5.500%, 12/15/2029 | 12,031,489 | |
3,632,000 | Post Holdings, Inc., Sr. Unsecd. Note, 144A, 5.625%, 1/15/2028 | 3,664,566 | |
3,575,000 | Post Holdings, Inc., Sr. Unsecd. Note, 144A, 6.250%, 10/15/2034 | 3,544,442 | |
3,550,000 | US Foods, Inc., Sr. Unsecd. Note, 144A, 4.625%, 6/1/2030 | 3,371,546 |
Principal Amount or Shares | Value | ||
CORPORATE BONDS—continued | |||
Food & Beverage—continued | |||
$ 20,375,000 | US Foods, Inc., Sr. Unsecd. Note, 144A, 4.750%, 2/15/2029 | $ 19,650,357 | |
2,850,000 | US Foods, Inc., Sr. Unsecd. Note, 144A, 5.750%, 4/15/2033 | 2,813,751 | |
8,225,000 | US Foods, Inc., Sr. Unsecd. Note, 144A, 6.875%, 9/15/2028 | 8,464,841 | |
TOTAL | 129,904,684 | ||
Gaming—5.3% | |||
16,575,000 | Affinity Gaming LLC, 144A, 6.875%, 12/15/2027 | 13,619,772 | |
12,800,000 | Boyd Gaming Corp., Sr. Unsecd. Note, 4.750%, 12/1/2027 | 12,583,225 | |
11,375,000 | Boyd Gaming Corp., Sr. Unsecd. Note, 144A, 4.750%, 6/15/2031 | 10,624,814 | |
18,525,000 | Caesars Entertainment Corp., 144A, 6.000%, 10/15/2032 | 18,081,932 | |
11,125,000 | Caesars Entertainment Corp., Sec. Fac. Bond, 144A, 7.000%, 2/15/2030 | 11,412,439 | |
12,075,000 | Caesars Entertainment Corp., Sr. Secd. Note, 144A, 6.500%, 2/15/2032 | 12,252,985 | |
9,300,000 | Caesars Entertainment Corp., Sr. Unsecd. Note, 144A, 4.625%, 10/15/2029 | 8,724,943 | |
7,975,000 | CCM Merger, Inc., Sr. Unsecd. Note, 144A, 6.375%, 5/1/2026 | 7,955,349 | |
5,825,000 | Churchill Downs, Inc., Sr. Secd. Note, 144A, 5.750%, 4/1/2030 | 5,739,208 | |
425,000 | Churchill Downs, Inc., Sr. Unsecd. Note, 144A, 5.500%, 4/1/2027 | 422,784 | |
21,100,000 | Churchill Downs, Inc., Sr. Unsecd. Note, 144A, 6.750%, 5/1/2031 | 21,507,631 | |
7,549,000 | Colt Merger Sub, Inc., Sr. Unsecd. Note, 144A, 8.125%, 7/1/2027 | 7,701,822 | |
17,425,000 | Light & Wonder International, Inc., Sr. Unsecd. Note, 144A, 7.250%, 11/15/2029 | 17,828,336 | |
6,775,000 | Light & Wonder International, Inc., Sr. Unsecd. Note, 144A, 7.500%, 9/1/2031 | 7,004,178 | |
12,575,000 | MGM Resorts International, Sr. Unsecd. Note, 6.125%, 9/15/2029 | 12,539,976 | |
21,975,000 | MGM Resorts International, Sr. Unsecd. Note, 6.500%, 4/15/2032 | 21,993,811 | |
12,500,000 | Midwest Gaming Borrower LLC, Sr. Note, 144A, 4.875%, 5/1/2029 | 11,810,859 | |
40,325,000 | Mohegan Tribal Gaming Authority, 144A, 8.000%, 2/1/2026 | 40,078,933 | |
22,075,000 | Ontario Gaming GTA LP, Sec. Fac. Bond, 144A, 8.000%, 8/1/2030 | 22,801,223 | |
13,275,000 | Penn National Gaming, Inc., Sr. Unsecd. Note, 144A, 4.125%, 7/1/2029 | 11,944,755 | |
7,725,000 | Penn National Gaming, Inc., Sr. Unsecd. Note, 144A, 5.625%, 1/15/2027 | 7,583,911 | |
13,125,000 | Raptor Acquisition Corp. / Raptor Co-Issuer LLC, Sec. Fac. Bond, 144A, 4.875%, 11/1/2026 | 13,025,506 | |
20,400,000 | Scientific Games Holdings Corp., Sr. Unsecd. Note, 144A, 6.625%, 3/1/2030 | 19,904,808 | |
4,075,000 | Station Casinos, Inc., 144A, 6.625%, 3/15/2032 | 4,098,085 | |
33,600,000 | Station Casinos, Inc., Sr. Unsecd. Note, 144A, 4.500%, 2/15/2028 | 32,096,898 | |
4,300,000 | Station Casinos, Inc., Sr. Unsecd. Note, 144A, 4.625%, 12/1/2031 | 3,910,719 | |
2,675,000 | VICI Properties LP/ VICI Note Co., Inc., Sr. Unsecd. Note, 144A, 3.500%, 2/15/2025 | 2,659,633 | |
8,100,000 | VICI Properties LP/ VICI Note Co., Inc., Sr. Unsecd. Note, 144A, 4.250%, 12/1/2026 | 7,952,106 | |
5,025,000 | VICI Properties LP/ VICI Note Co., Inc., Sr. Unsecd. Note, 144A, 4.500%, 1/15/2028 | 4,903,332 | |
11,450,000 | VICI Properties LP/ VICI Note Co., Inc., Sr. Unsecd. Note, 144A, 4.625%, 6/15/2025 | 11,397,661 | |
14,950,000 | Wynn Resorts Finance LLC / Wynn Resorts Capital Corp, 144A, 7.125%, 2/15/2031 | 15,738,388 | |
12,025,000 | Wynn Resorts Finance LLC / Wynn Resorts Capital Corp, Sr. Unsecd. Note, 144A, 6.250%, 3/15/2033 | 11,977,372 | |
TOTAL | 411,877,394 | ||
Health Care—4.5% | |||
13,625,000 | Ardent Health Services, Sr. Unsecd. Note, 144A, 5.750%, 7/15/2029 | 13,219,757 | |
11,675,000 | Avantor Funding, Inc., Sr. Unsecd. Note, 144A, 3.875%, 11/1/2029 | 10,776,792 | |
32,350,000 | Avantor Funding, Inc., Sr. Unsecd. Note, 144A, 4.625%, 7/15/2028 | 31,306,755 | |
10,050,000 | CHS/Community Health Systems, Inc., 144A, 6.125%, 4/1/2030 | 7,877,514 | |
20,425,000 | CHS/Community Health Systems, Inc., 144A, 6.875%, 4/15/2029 | 17,270,445 | |
10,825,000 | CHS/Community Health Systems, Inc., Sec. Fac. Bond, 144A, 5.625%, 3/15/2027 | 10,566,628 | |
3,375,000 | CHS/Community Health Systems, Inc., Sec. Fac. Bond, 144A, 6.000%, 1/15/2029 | 3,181,903 | |
15,700,000 | CHS/Community Health Systems, Inc., Sr. Note, 144A, 5.250%, 5/15/2030 | 13,713,832 | |
7,500,000 | Concentra Escrow Issuer Corp., Sr. Unsecd. Note, 144A, 6.875%, 7/15/2032 | 7,705,703 | |
5,150,000 | Embecta Corp., Sec. Fac. Bond, 144A, 5.000%, 2/15/2030 | 4,665,499 | |
8,850,000 | Embecta Corp., Sr. Note, 144A, 6.750%, 2/15/2030 | 8,262,884 | |
3,175,000 | Garden Spinco Corp., Sr. Unsecd. Note, 144A, 8.625%, 7/20/2030 | 3,439,166 | |
7,850,000 | HCA, Inc., Sr. Unsecd. Note, 5.375%, 2/1/2025 | 7,850,987 |
Principal Amount or Shares | Value | ||
CORPORATE BONDS—continued | |||
Health Care—continued | |||
$ 7,400,000 | HCA, Inc., Sr. Unsecd. Note, 5.875%, 2/15/2026 | $ 7,453,029 | |
8,350,000 | Iqvia, Inc., Sr. Unsecd. Note, 144A, 5.000%, 10/15/2026 | 8,266,204 | |
8,450,000 | Iqvia, Inc., Sr. Unsecd. Note, 144A, 5.000%, 5/15/2027 | 8,348,827 | |
2,550,000 | Iqvia, Inc., Sr. Unsecd. Note, 144A, 6.500%, 5/15/2030 | 2,621,767 | |
5,250,000 | LifePoint Health, Inc., Sr. Unsecd. Note, 144A, 5.375%, 1/15/2029 | 4,810,220 | |
8,275,000 | Medline Borrower LP/Medline Co-Issuer, Inc., 144A, 6.250%, 4/1/2029 | 8,429,693 | |
16,725,000 | Mozart Debt Merger Sub, Inc., Sec. Fac. Bond, 144A, 3.875%, 4/1/2029 | 15,659,454 | |
73,300,000 | Mozart Debt Merger Sub, Inc., Sr. Unsecd. Note, 144A, 5.250%, 10/1/2029 | 71,061,856 | |
4,600,000 | Teleflex, Inc., Sr. Unsecd. Note, 4.625%, 11/15/2027 | 4,526,032 | |
1,550,000 | Teleflex, Inc., Sr. Unsecd. Note, 144A, 4.250%, 6/1/2028 | 1,487,570 | |
5,250,000 | Tenet Healthcare Corp., 4.250%, 6/1/2029 | 4,970,561 | |
18,900,000 | Tenet Healthcare Corp., 5.125%, 11/1/2027 | 18,754,292 | |
16,275,000 | Tenet Healthcare Corp., 144A, 6.250%, 2/1/2027 | 16,300,686 | |
5,675,000 | Tenet Healthcare Corp., Sec. Fac. Bond, 144A, 6.750%, 5/15/2031 | 5,805,514 | |
27,550,000 | Tenet Healthcare Corp., Sr. Unsecd. Note, 6.125%, 10/1/2028 | 27,549,127 | |
4,625,000 | Tenet Healthcare Corp., Term Loan - 1st Lien, 4.625%, 6/15/2028 | 4,474,773 | |
TOTAL | 350,357,470 | ||
Health Insurance—0.4% | |||
18,250,000 | Centene Corp., Sr. Unsecd. Note, Series WI, 4.250%, 12/15/2027 | 17,669,086 | |
12,900,000 | Centene Corp., Sr. Unsecd. Note, Series WI, 4.625%, 12/15/2029 | 12,336,888 | |
TOTAL | 30,005,974 | ||
Independent Energy—3.3% | |||
15,300,000 | Aethon United LP BR/Aethon United Finance, 144A, 7.500%, 10/1/2029 | 15,416,556 | |
6,325,000 | Antero Resources Corp., Sr. Unsecd. Note, 144A, 5.375%, 3/1/2030 | 6,147,053 | |
2,475,000 | Antero Resources Corp., Sr. Unsecd. Note, 144A, 7.625%, 2/1/2029 | 2,539,909 | |
6,075,000 | Ascent Resources Utica Holdings LLC/ ARU Finance Corp., Sr. Unsecd. Note, 144A, 5.875%, 6/30/2029 | 5,873,859 | |
4,925,000 | Ascent Resources Utica Holdings LLC/ ARU Finance Corp., Sr. Unsecd. Note, 144A, 6.625%, 10/15/2032 | 4,881,988 | |
8,375,000 | Ascent Resources Utica Holdings LLC/ ARU Finance Corp., Sr. Unsecd. Note, 144A, 8.250%, 12/31/2028 | 8,551,886 | |
2,971,000 | Ascent Resources Utica Holdings LLC/ ARU Finance Corp., Sr. Unsecd. Note, 144A, 9.000%, 11/1/2027 | 3,528,342 | |
2,200,000 | Chord Energy Corp., Sr. Unsecd. Note, 144A, 6.375%, 6/1/2026 | 2,206,266 | |
4,775,000 | Civitas Resources, Inc., Sr. Unsecd. Note, 144A, 8.625%, 11/1/2030 | 5,020,492 | |
3,250,000 | Civitas Resources, Inc., Sr. Unsecd. Note, 144A, 8.750%, 7/1/2031 | 3,407,982 | |
16,050,000 | Civitas Resources, Inc., Unsecd. Note, 144A, 8.375%, 7/1/2028 | 16,607,256 | |
9,475,000 | Comstock Resources, Inc., Sr. Unsecd. Note, 144A, 5.875%, 1/15/2030 | 8,665,160 | |
22,450,000 | Comstock Resources, Inc., Sr. Unsecd. Note, 144A, 6.750%, 3/1/2029 | 21,514,351 | |
5,650,000 | Expand Energy Corp., Sr. Unsecd. Note, 4.750%, 2/1/2032 | 5,313,772 | |
6,975,000 | Expand Energy Corp., Sr. Unsecd. Note, 5.375%, 3/15/2030 | 6,864,133 | |
1,900,000 | 1,2 | Expand Energy Corp., Sr. Unsecd. Note, 5.750%, 3/15/2099 | 42,750 |
10,175,000 | 1,2 | Expand Energy Corp., Sr. Unsecd. Note, 7.000%, 10/1/2099 | 228,938 |
2,525,000 | Expand Energy Corp., Sr. Unsecd. Note, 8.375%, 9/15/2028 | 2,599,353 | |
2,250,000 | Expand Energy Corp., Sr. Unsecd. Note, 144A, 5.500%, 2/1/2026 | 2,247,626 | |
1,600,000 | Expand Energy Corp., Sr. Unsecd. Note, 144A, 5.875%, 2/1/2029 | 1,599,297 | |
9,575,000 | Matador Resources Co., Sr. Unsecd. Note, 144A, 6.250%, 4/15/2033 | 9,394,309 | |
8,900,000 | Matador Resources Co., Sr. Unsecd. Note, 144A, 6.500%, 4/15/2032 | 8,820,887 | |
11,525,000 | Occidental Petroleum Corp., Sr. Unsecd. Note, 5.875%, 9/1/2025 | 11,575,168 | |
2,500,000 | Occidental Petroleum Corp., Sr. Unsecd. Note, 7.150%, 5/15/2028 | 2,635,873 | |
5,725,000 | Permian Resources Operating LLC, Sr. Sub. Secd. Note, 144A, 6.250%, 2/1/2033 | 5,687,643 | |
10,925,000 | Permian Resources Operating LLC, Sr. Unsecd. Note, 144A, 5.375%, 1/15/2026 | 10,880,508 | |
10,019,000 | Range Resources Corp., Sr. Unsecd. Note, 4.875%, 5/15/2025 | 9,993,074 | |
5,900,000 | Range Resources Corp., Sr. Unsecd. Note, 8.250%, 1/15/2029 | 6,083,118 | |
5,500,000 | Range Resources Corp., Sr. Unsecd. Note, 144A, 4.750%, 2/15/2030 | 5,182,654 | |
15,375,000 | Rockcliff Energy II LLC, Sr. Unsecd. Note, 144A, 5.500%, 10/15/2029 | 14,528,408 |
Principal Amount or Shares | Value | ||
CORPORATE BONDS—continued | |||
Independent Energy—continued | |||
$ 10,175,000 | Sitio Royalties Operating Partnership LP / Sitio Finance Corp., Sr. Unsecd. Note, 144A, 7.875%, 11/1/2028 | $ 10,570,993 | |
4,450,000 | SM Energy Co., Sr. Unsecd. Note, 6.500%, 7/15/2028 | 4,441,333 | |
4,575,000 | SM Energy Co., Sr. Unsecd. Note, 6.625%, 1/15/2027 | 4,577,655 | |
9,175,000 | SM Energy Co., Sr. Unsecd. Note, 6.750%, 9/15/2026 | 9,200,580 | |
8,325,000 | SM Energy Co., Sr. Unsecd. Note, 144A, 6.750%, 8/1/2029 | 8,280,176 | |
6,800,000 | SM Energy Co., Sr. Unsecd. Note, 144A, 7.000%, 8/1/2032 | 6,749,216 | |
TOTAL | 251,858,564 | ||
Industrial - Other—1.6% | |||
20,575,000 | Hillenbrand, Inc., Sr. Unsecd. Note, 6.250%, 2/15/2029 | 20,678,350 | |
2,950,000 | Madison Iaq LLC, Sec. Fac. Bond, 144A, 4.125%, 6/30/2028 | 2,812,681 | |
53,725,000 | Madison Iaq LLC, Sr. Unsecd. Note, 144A, 5.875%, 6/30/2029 | 51,008,535 | |
32,275,000 | SPX Flow, Inc., Sr. Unsecd. Note, 144A, 8.750%, 4/1/2030 | 33,580,782 | |
17,325,000 | TK Elevator U.S. Newco, Inc., Sr. Unsecd. Note, 144A, 5.250%, 7/15/2027 | 17,055,111 | |
TOTAL | 125,135,459 | ||
Insurance - P&C—7.6% | |||
22,825,000 | Acrisure LLC, Sec. Fac. Bond, 144A, 7.500%, 11/6/2030 | 23,227,108 | |
5,200,000 | Alliant Holdings Intermediate LLC / Alliant Holdings Co-Issuer, 144A, 5.875%, 11/1/2029 | 4,916,532 | |
14,675,000 | Alliant Holdings Intermediate LLC / Alliant Holdings Co-Issuer, 144A, 7.375%, 10/1/2032 | 14,565,974 | |
22,125,000 | Alliant Holdings Intermediate LLC / Alliant Holdings Co-Issuer, Sec. Fac. Bond, 144A, 7.000%, 1/15/2031 | 22,292,331 | |
5,650,000 | Alliant Holdings Intermediate LLC / Alliant Holdings Co-Issuer, Sr. Unsecd. Note, 144A, 6.500%, 10/1/2031 | 5,601,708 | |
7,050,000 | Alliant Holdings Intermediate LLC / Alliant Holdings Co-Issuer, Sr. Unsecd. Note, 144A, 6.750%, 10/15/2027 | 7,029,872 | |
12,725,000 | AmWINS Group, Inc., Sec. Fac. Bond, 144A, 6.375%, 2/15/2029 | 12,795,751 | |
30,950,000 | AmWINS Group, Inc., Sr. Unsecd. Note, 144A, 4.875%, 6/30/2029 | 29,159,994 | |
8,550,000 | Ardonagh Finco Ltd., Sec. Fac. Bond, 144A, 7.750%, 2/15/2031 | 8,773,933 | |
62,325,000 | Ardonagh Group Finance Ltd., Sr. Unsecd. Note, 144A, 8.875%, 2/15/2032 | 63,729,225 | |
24,900,000 | AssuredPartners, Inc., Sr. Unsecd. Note, 144A, 5.625%, 1/15/2029 | 23,585,706 | |
11,525,000 | AssuredPartners, Inc., Sr. Unsecd. Note, 144A, 7.500%, 2/15/2032 | 11,616,451 | |
23,125,000 | Baldwin Insurance Group Holdings LLC/Baldwin Insurance Group Holdings Finance, 144A, 7.125%, 5/15/2031 | 23,609,006 | |
62,850,000 | Broadstreet Partners, Inc., Sr. Unsecd. Note, 144A, 5.875%, 4/15/2029 | 60,158,618 | |
36,125,000 | Hub International Ltd., Sec. Fac. Bond, 144A, 7.250%, 6/15/2030 | 37,363,293 | |
27,575,000 | Hub International Ltd., Sr. Unsecd. Note, 144A, 5.625%, 12/1/2029 | 26,731,241 | |
52,800,000 | Hub International Ltd., Sr. Unsecd. Note, 144A, 7.375%, 1/31/2032 | 53,894,333 | |
19,625,000 | Jones Deslauriers Insurance Management, Inc., Sec. Fac. Bond, 144A, 8.500%, 3/15/2030 | 20,803,010 | |
24,950,000 | Jones Deslauriers Insurance Management, Inc., Sr. Unsecd. Note, 144A, 10.500%, 12/15/2030 | 26,898,212 | |
40,950,000 | Panther Escrow Issuer, Sec. Fac. Bond, 144A, 7.125%, 6/1/2031 | 41,962,712 | |
11,675,000 | Ryan Specialty LLC, Sec. Fac. Bond, 144A, 4.375%, 2/1/2030 | 11,081,951 | |
8,350,000 | Ryan Specialty LLC, Sec. Fac. Bond, 144A, 5.875%, 8/1/2032 | 8,329,416 | |
49,250,000 | USI, Inc./NY, Sr. Unsecd. Note, 144A, 7.500%, 1/15/2032 | 50,310,500 | |
TOTAL | 588,436,877 | ||
Leisure—2.1% | |||
3,825,000 | Carnival Corp., Sr. Secd. Note, 144A, 7.000%, 8/15/2029 | 4,003,283 | |
9,725,000 | Carnival Corp., Sr. Unsecd. Note, 144A, 6.000%, 5/1/2029 | 9,747,568 | |
3,650,000 | Carnival Corp., Sr. Unsecd. Note, 144A, 7.625%, 3/1/2026 | 3,677,806 | |
8,550,000 | NCL Corp. Ltd., Sr. Secd. Note, 144A, 8.125%, 1/15/2029 | 9,070,062 | |
13,025,000 | NCL Corp. Ltd., Sr. Unsecd. Note, 144A, 5.875%, 3/15/2026 | 13,018,893 | |
1,650,000 | NCL Corp. Ltd., Sr. Unsecd. Note, 144A, 6.250%, 3/1/2030 | 1,633,255 | |
6,775,000 | NCL Corp. Ltd., Sr. Unsecd. Note, 144A, 7.750%, 2/15/2029 | 7,192,828 | |
7,900,000 | Ncl Finance Ltd., Sr. Unsecd. Note, 144A, 6.125%, 3/15/2028 | 7,954,842 | |
17,500,000 | Royal Caribbean Cruises, Ltd., 144A, 6.000%, 2/1/2033 | 17,618,391 | |
750,000 | Royal Caribbean Cruises, Ltd., Sr. Unsecd. Note, 144A, 4.250%, 7/1/2026 | 736,252 | |
4,325,000 | Royal Caribbean Cruises, Ltd., Sr. Unsecd. Note, 144A, 5.375%, 7/15/2027 | 4,319,771 | |
7,750,000 | Royal Caribbean Cruises, Ltd., Sr. Unsecd. Note, 144A, 5.500%, 8/31/2026 | 7,763,570 |
Principal Amount or Shares | Value | ||
CORPORATE BONDS—continued | |||
Leisure—continued | |||
$ 6,650,000 | Royal Caribbean Cruises, Ltd., Sr. Unsecd. Note, 144A, 5.625%, 9/30/2031 | $ 6,626,991 | |
10,050,000 | Royal Caribbean Cruises, Ltd., Sr. Unsecd. Note, 144A, 6.250%, 3/15/2032 | 10,252,467 | |
5,775,000 | Six Flags Entertainment Corp., Sr. Unsecd. Note, 144A, 5.500%, 4/15/2027 | 5,744,927 | |
23,550,000 | Six Flags Entertainment Corp., Sr. Unsecd. Note, 144A, 7.250%, 5/15/2031 | 24,160,110 | |
32,625,000 | United Parks & Resorts, Inc., Sr. Unsecd. Note, 144A, 5.250%, 8/15/2029 | 31,357,271 | |
TOTAL | 164,878,287 | ||
Lodging—0.9% | |||
1,875,000 | Hilton Domestic Operating Company, Inc., Sr. Unsecd. Note, 144A, 3.625%, 2/15/2032 | 1,647,221 | |
9,275,000 | Hilton Domestic Operating Company, Inc., Sr. Unsecd. Note, 144A, 3.750%, 5/1/2029 | 8,645,768 | |
5,050,000 | Hilton Domestic Operating Company, Inc., Sr. Unsecd. Note, 144A, 5.375%, 5/1/2025 | 5,059,812 | |
13,000,000 | Hilton Domestic Operating Company, Inc., Sr. Unsecd. Note, 144A, 5.750%, 5/1/2028 | 13,037,999 | |
10,950,000 | Hilton Domestic Operating Company, Inc., Sr. Unsecd. Note, 144A, 5.875%, 3/15/2033 | 10,979,751 | |
3,225,000 | Hilton Domestic Operating Company, Inc., Sr. Unsecd. Note, Series WI, 4.875%, 1/15/2030 | 3,127,044 | |
12,925,000 | RHP Hotel Property/RHP Finance Corp., Sr. Unsecd. Note, 144A, 6.500%, 4/1/2032 | 13,087,558 | |
5,900,000 | RHP Hotel Property/RHP Finance Corp., Sr. Unsecd. Note, 144A, 7.250%, 7/15/2028 | 6,124,589 | |
10,650,000 | Wyndham Hotels & Resorts, Inc., Sr. Unsecd. Note, 144A, 4.375%, 8/15/2028 | 10,144,242 | |
TOTAL | 71,853,984 | ||
Media Entertainment—3.4% | |||
3,674,000 | Cumulus Media News Holdings, Inc., 144A, 8.000%, 7/1/2029 | 1,515,150 | |
16,475,000 | Gray Escrow II, Inc., Sr. Unsecd. Note, 144A, 5.375%, 11/15/2031 | 9,953,451 | |
6,200,000 | Gray Television, Inc., Sr. Unsecd. Note, 144A, 4.750%, 10/15/2030 | 3,905,120 | |
5,400,000 | iHeartCommunications, Inc., 144A, 4.750%, 1/15/2028 | 3,324,916 | |
2,900,000 | iHeartCommunications, Inc., 144A, 5.250%, 8/15/2027 | 1,953,790 | |
2,000,000 | Lamar Media Corp., Sr. Unsecd. Note, 4.000%, 2/15/2030 | 1,850,718 | |
8,850,000 | Lamar Media Corp., Sr. Unsecd. Note, 4.875%, 1/15/2029 | 8,621,689 | |
3,100,000 | Lamar Media Corp., Sr. Unsecd. Note, Series WI, 3.625%, 1/15/2031 | 2,769,617 | |
61,325,000 | Midas Opco Holdings, LLC, Sr. Unsecd. Note, 144A, 5.625%, 8/15/2029 | 58,381,357 | |
1,550,000 | Nexstar Broadcasting, Inc., Sr. Unsecd. Note, 144A, 4.750%, 11/1/2028 | 1,458,436 | |
14,100,000 | Nexstar Escrow Corp., Sr. Unsecd. Note, 144A, 5.625%, 7/15/2027 | 13,868,068 | |
3,200,000 | Outfront Media Capital LLC / Outfront Media Capital Corp., 144A, 7.375%, 2/15/2031 | 3,382,256 | |
6,225,000 | Outfront Media Capital LLC / Outfront Media Capital Corp., Sr. Unsecd. Note, 144A, 4.250%, 1/15/2029 | 5,842,875 | |
11,525,000 | Outfront Media Capital LLC / Outfront Media Capital Corp., Sr. Unsecd. Note, 144A, 4.625%, 3/15/2030 | 10,729,515 | |
6,575,000 | Outfront Media Capital LLC / Outfront Media Capital Corp., Sr. Unsecd. Note, 144A, 5.000%, 8/15/2027 | 6,481,403 | |
14,100,000 | ROBLOX Corp., Sr. Unsecd. Note, 144A, 3.875%, 5/1/2030 | 12,774,139 | |
5,375,000 | Scripps Escrow II, Inc., Sr. Unsecd. Note, 144A, 5.375%, 1/15/2031 | 3,234,833 | |
11,325,000 | Scripps Escrow, Inc., Sr. Unsecd. Note, 144A, 5.875%, 7/15/2027 | 9,966,000 | |
2,775,000 | Sinclair Television Group, Sec. Fac. Bond, 144A, 4.125%, 12/1/2030 | 2,135,016 | |
15,950,000 | Sinclair Television Group, Sr. Unsecd. Note, 144A, 5.125%, 2/15/2027 | 14,202,358 | |
12,350,000 | Sinclair Television Group, Sr. Unsecd. Note, 144A, 5.500%, 3/1/2030 | 8,513,225 | |
15,075,000 | Tegna, Inc., Sr. Unsecd. Note, 144A, 5.000%, 9/15/2029 | 14,087,960 | |
20,950,000 | Terrier Media Buyer, Inc., Sr. Unsecd. Note, 144A, 8.875%, 12/15/2027 | 15,214,937 | |
14,425,000 | Univision Communications, Inc., Sec. Fac. Bond, 144A, 4.500%, 5/1/2029 | 12,819,966 | |
11,100,000 | Univision Communications, Inc., Sec. Fac. Bond, 144A, 7.375%, 6/30/2030 | 10,668,478 | |
15,200,000 | Univision Communications, Inc., Sec. Fac. Bond, 144A, 8.000%, 8/15/2028 | 15,462,002 | |
5,800,000 | Urban One, Inc., Sec. Fac. Bond, 144A, 7.375%, 2/1/2028 | 4,308,234 | |
6,425,000 | WMG Acquisition Corp., Sec. Fac. Bond, 144A, 3.750%, 12/1/2029 | 5,955,608 | |
1,250,000 | WMG Acquisition Corp., Sec. Fac. Bond, 144A, 3.875%, 7/15/2030 | 1,152,060 | |
TOTAL | 264,533,177 | ||
Metals & Mining—0.9% | |||
19,650,000 | Cleveland-Cliffs, Inc., Sr. Unsecd. Note, 144A, 4.625%, 3/1/2029 | 18,428,637 | |
3,850,000 | Cleveland-Cliffs, Inc., Sr. Unsecd. Note, 144A, 4.875%, 3/1/2031 | 3,556,051 | |
1,150,000 | Cleveland-Cliffs, Inc., Sr. Unsecd. Note, 144A, 6.750%, 4/15/2030 | 1,150,260 |
Principal Amount or Shares | Value | ||
CORPORATE BONDS—continued | |||
Metals & Mining—continued | |||
$ 4,300,000 | Cleveland-Cliffs, Inc., Sr. Unsecd. Note, 144A, 6.875%, 11/1/2029 | $ 4,320,911 | |
16,000,000 | Cleveland-Cliffs, Inc., Sr. Unsecd. Note, 144A, 7.000%, 3/15/2032 | 16,038,086 | |
7,175,000 | Cleveland-Cliffs, Inc., Sr. Unsecd. Note, 144A, 7.375%, 5/1/2033 | 7,234,623 | |
21,350,000 | Coeur Mining, Inc., Sr. Unsecd. Note, 144A, 5.125%, 2/15/2029 | 20,391,118 | |
TOTAL | 71,119,686 | ||
Midstream—5.2% | |||
1,725,000 | AmeriGas Partners LP, Sr. Unsecd. Note, 5.750%, 5/20/2027 | 1,665,291 | |
9,325,000 | Antero Midstream Partners LP, Sr. Unsecd. Note, 144A, 5.375%, 6/15/2029 | 9,089,101 | |
23,650,000 | Antero Midstream Partners LP, Sr. Unsecd. Note, 144A, 5.750%, 3/1/2027 | 23,623,775 | |
32,175,000 | Antero Midstream Partners LP, Sr. Unsecd. Note, 144A, 5.750%, 1/15/2028 | 32,026,265 | |
2,050,000 | Antero Midstream Partners LP, Sr. Unsecd. Note, 144A, 6.625%, 2/1/2032 | 2,074,555 | |
4,575,000 | Blue Racer Midstream LLC/Blue Racer Finance Corp., Sr. Unsecd. Note, 144A, 7.000%, 7/15/2029 | 4,696,498 | |
7,200,000 | Blue Racer Midstream LLC/Blue Racer Finance Corp., Sr. Unsecd. Note, 144A, 7.250%, 7/15/2032 | 7,442,294 | |
13,050,000 | Cheniere Energy Partners, LP, Sr. Unsecd. Note, Series WI, 4.500%, 10/1/2029 | 12,573,351 | |
6,000,000 | Cheniere Energy, Inc., Sec. Fac. Bond, Series WI, 4.625%, 10/15/2028 | 5,884,478 | |
22,225,000 | CNX Midstream Partners LP, Sr. Unsecd. Note, 144A, 4.750%, 4/15/2030 | 20,707,239 | |
11,575,000 | Crestwood Midstream Partners LP, Sr. Unsecd. Note, 144A, 7.375%, 2/1/2031 | 12,189,656 | |
17,675,000 | DT Midstream, Inc., Sr. Unsecd. Note, 144A, 4.375%, 6/15/2031 | 16,273,060 | |
21,375,000 | EQM Midstream Partners, LP, Sr. Unsecd. Note, 5.500%, 7/15/2028 | 21,232,286 | |
5,150,000 | EQM Midstream Partners, LP, Sr. Unsecd. Note, 6.500%, 7/15/2048 | 5,186,750 | |
10,000,000 | EQM Midstream Partners, LP, Sr. Unsecd. Note, 144A, 4.500%, 1/15/2029 | 9,633,777 | |
24,275,000 | EQM Midstream Partners, LP, Sr. Unsecd. Note, 144A, 4.750%, 1/15/2031 | 23,095,160 | |
2,120,000 | EQM Midstream Partners, LP, Sr. Unsecd. Note, 144A, 6.000%, 7/1/2025 | 2,123,973 | |
5,525,000 | EQM Midstream Partners, LP, Sr. Unsecd. Note, 144A, 6.375%, 4/1/2029 | 5,615,499 | |
17,100,000 | EQM Midstream Partners, LP, Sr. Unsecd. Note, 144A, 6.500%, 7/1/2027 | 17,503,987 | |
1,600,000 | EQM Midstream Partners, LP, Sr. Unsecd. Note, 144A, 7.500%, 6/1/2027 | 1,637,126 | |
1,450,000 | EQM Midstream Partners, LP, Sr. Unsecd. Note, 144A, 7.500%, 6/1/2030 | 1,560,458 | |
4,550,000 | Hess Midstream Operations LP, Sr. Unsecd. Note, 144A, 4.250%, 2/15/2030 | 4,252,106 | |
15,300,000 | Hess Midstream Operations LP, Sr. Unsecd. Note, 144A, 5.125%, 6/15/2028 | 14,984,453 | |
1,525,000 | Hess Midstream Operations LP, Sr. Unsecd. Note, 144A, 5.500%, 10/15/2030 | 1,491,256 | |
575,000 | Hess Midstream Operations LP, Sr. Unsecd. Note, 144A, 5.625%, 2/15/2026 | 574,051 | |
4,500,000 | Hess Midstream Operations LP, Sr. Unsecd. Note, 144A, 6.500%, 6/1/2029 | 4,578,070 | |
19,150,000 | HF Sinclair Corp., Sr. Unsecd. Note, 5.000%, 2/1/2028 | 18,965,403 | |
19,000,000 | Northriver Midstream Fin, 144A, 6.750%, 7/15/2032 | 19,514,638 | |
9,500,000 | Solaris Midstream Holdings LLC, Sr. Unsecd. Note, 144A, 7.625%, 4/1/2026 | 9,558,111 | |
12,600,000 | Suburban Propane Partners LP, Sr. Unsecd. Note, 5.875%, 3/1/2027 | 12,593,845 | |
30,250,000 | Suburban Propane Partners LP, Sr. Unsecd. Note, 144A, 5.000%, 6/1/2031 | 27,776,996 | |
3,425,000 | Targa Resources Partners LP / Targa Resources Partners Finance Corp., Sr. Unsecd. Note, 4.875%, 2/1/2031 | 3,325,934 | |
12,300,000 | Targa Resources Partners LP / Targa Resources Partners Finance Corp., Sr. Unsecd. Note, 5.000%, 1/15/2028 | 12,232,186 | |
4,200,000 | Targa Resources Partners LP / Targa Resources Partners Finance Corp., Sr. Unsecd. Note, 6.500%, 7/15/2027 | 4,238,275 | |
24,050,000 | Targa Resources Partners LP / Targa Resources Partners Finance Corp., Sr. Unsecd. Note, 144A, 5.500%, 3/1/2030 | 24,113,756 | |
4,600,000 | TransMontaigne Partners LP/TLP Finance Corp., Sr. Unsecd. Note, 6.125%, 2/15/2026 | 4,528,273 | |
3,475,000 | Western Midstream Operating, LP, Sr. Unsecd. Note, 4.650%, 7/1/2026 | 3,447,501 | |
2,975,000 | Western Midstream Operating, LP, Sr. Unsecd. Note, 5.300%, 3/1/2048 | 2,587,916 | |
TOTAL | 404,597,349 | ||
Oil Field Services—2.1% | |||
29,450,000 | Archrock Partners LP / Archrock Partners Finance Corp., Sr. Unsecd. Note, 144A, 6.250%, 4/1/2028 | 29,528,692 | |
29,575,000 | Archrock Partners LP / Archrock Partners Finance Corp., Sr. Unsecd. Note, 144A, 6.875%, 4/1/2027 | 29,684,457 | |
21,200,000 | Kodiak Gas Services LLC, Sr. Unsecd. Note, 144A, 7.250%, 2/15/2029 | 21,808,928 | |
6,900,000 | Nabors Industries Ltd., Sr. Unsecd. Note, 144A, 7.500%, 1/15/2028 | 6,570,474 | |
2,975,000 | Nabors Industries, Inc., Sec. Fac. Bond, 144A, 9.125%, 1/31/2030 | 3,075,043 | |
1,575,000 | Nabors Industries, Inc., Sr. Unsecd. Note, 144A, 7.375%, 5/15/2027 | 1,577,419 |
Principal Amount or Shares | Value | ||
CORPORATE BONDS—continued | |||
Oil Field Services—continued | |||
$ 6,000,000 | Nabors Industries, Inc., Sr. Unsecd. Note, 144A, 8.875%, 8/15/2031 | $ 5,677,493 | |
11,425,000 | Precision Drilling Corp., Sr. Unsecd. Note, 144A, 6.875%, 1/15/2029 | 11,376,341 | |
5,211,000 | Precision Drilling Corp., Sr. Unsecd. Note, 144A, 7.125%, 1/15/2026 | 5,207,547 | |
26,200,000 | USA Compression Partners LP, Sr. Unsecd. Note, 6.875%, 9/1/2027 | 26,344,152 | |
17,625,000 | USA Compression Partners LP, Sr. Unsecd. Note, 144A, 7.125%, 3/15/2029 | 17,962,307 | |
TOTAL | 158,812,853 | ||
Packaging—4.5% | |||
32,189,354 | ARD Finance S.A., Sec. Fac. Bond, 144A, 7.250% PIK, 6/30/2027 | 6,835,892 | |
23,400,000 | Ardagh Metal Packaging, Sr. Unsecd. Note, 144A, 4.000%, 9/1/2029 | 20,548,870 | |
31,800,000 | Ardagh Packaging Finance PLC/Ardagh Holdings, Sec. Fac. Bond, 144A, 5.250%, 8/15/2027 | 19,115,775 | |
26,100,000 | Ardagh Packaging Finance PLC/Ardagh Holdings, Sr. Unsecd. Note, 144A, 5.250%, 8/15/2027 | 15,689,363 | |
13,750,000 | Ball Corp., Sr. Unsecd. Note, 2.875%, 8/15/2030 | 11,976,767 | |
6,325,000 | Ball Corp., Sr. Unsecd. Note, 6.000%, 6/15/2029 | 6,431,905 | |
10,650,000 | Ball Corp., Sr. Unsecd. Note, 6.875%, 3/15/2028 | 10,956,752 | |
5,350,000 | Berry Global Escrow Corp., 144A, 5.625%, 7/15/2027 | 5,345,568 | |
8,225,000 | Clydesdale Acquisition Holdings, Inc., Sec. Fac. Bond, 144A, 6.875%, 1/15/2030 | 8,355,078 | |
67,900,000 | Clydesdale Acquisition Holdings, Inc., Sr. Unsecd. Note, 144A, 8.750%, 4/15/2030 | 69,009,486 | |
8,600,000 | Crown Americas LLC / Crown Americas Capital Corp. VI, Sr. Unsecd. Note, 4.750%, 2/1/2026 | 8,544,019 | |
17,700,000 | Mauser Packaging Solutions Holding Co., 144A, 9.250%, 4/15/2027 | 18,116,499 | |
13,375,000 | Mauser Packaging Solutions Holding Co., Sec. Fac. Bond, 144A, 7.875%, 4/15/2027 | 13,759,531 | |
5,425,000 | OI European Group B.V., Sr. Unsecd. Note, 144A, 4.750%, 2/15/2030 | 4,919,560 | |
8,113,000 | Owens-Brockway Glass Container, Inc., Sr. Unsecd. Note, 144A, 6.625%, 5/13/2027 | 8,080,943 | |
11,475,000 | Owens-Brockway Glass Container, Inc., Sr. Unsecd. Note, 144A, 7.250%, 5/15/2031 | 11,300,293 | |
14,075,000 | Owens-Brockway Glass Container, Inc., Sr. Unsecd. Note, 144A, 7.375%, 6/1/2032 | 13,788,639 | |
17,525,000 | Sealed Air Corp., 144A, 6.500%, 7/15/2032 | 17,804,927 | |
3,950,000 | Sealed Air Corp., Sr. Unsecd. Note, 144A, 4.000%, 12/1/2027 | 3,784,270 | |
2,525,000 | Sealed Air Corp., Sr. Unsecd. Note, 144A, 5.000%, 4/15/2029 | 2,441,219 | |
6,125,000 | Sealed Air Corp., Sr. Unsecd. Note, 144A, 6.125%, 2/1/2028 | 6,194,409 | |
5,900,000 | Sealed Air Corp., Sr. Unsecd. Note, 144A, 7.250%, 2/15/2031 | 6,132,926 | |
8,125,000 | Trivium Packaging Finance B.V., Sec. Fac. Bond, 144A, 5.500%, 8/15/2026 | 8,061,068 | |
47,075,000 | Trivium Packaging Finance B.V., Sr. Unsecd. Note, 144A, 8.500%, 8/15/2027 | 46,986,146 | |
TOTAL | 344,179,905 | ||
Paper—0.5% | |||
20,725,000 | Clearwater Paper Corp., Sr. Unsecd. Note, 144A, 4.750%, 8/15/2028 | 19,271,063 | |
2,225,000 | Graphic Packaging International, LLC, Sr. Unsecd. Note, 144A, 3.500%, 3/15/2028 | 2,079,397 | |
13,475,000 | Graphic Packaging International, LLC, Sr. Unsecd. Note, 144A, 3.500%, 3/1/2029 | 12,311,017 | |
1,025,000 | Graphic Packaging International, LLC, Sr. Unsecd. Note, 144A, 3.750%, 2/1/2030 | 938,330 | |
1,250,000 | Graphic Packaging International, LLC, Sr. Unsecd. Note, 144A, 4.750%, 7/15/2027 | 1,226,591 | |
TOTAL | 35,826,398 | ||
Pharmaceuticals—1.7% | |||
8,850,000 | Bausch Health Cos., Inc., Sec. Fac. Bond, 144A, 4.875%, 6/1/2028 | 6,848,617 | |
5,050,000 | Bausch Health Cos., Inc., Sec. Fac. Bond, 144A, 5.750%, 8/15/2027 | 4,173,396 | |
2,100,000 | Bausch Health Cos., Inc., Sec. Fac. Bond, 144A, 6.125%, 2/1/2027 | 1,897,875 | |
14,000,000 | Bausch Health Cos., Inc., Sr. Unsecd. Note, 144A, 5.000%, 2/15/2029 | 8,065,120 | |
3,850,000 | Bausch Health Cos., Inc., Sr. Unsecd. Note, 144A, 5.250%, 1/30/2030 | 2,121,118 | |
15,250,000 | Bausch Health Cos., Inc., Sr. Unsecd. Note, 144A, 6.250%, 2/15/2029 | 9,475,245 | |
13,925,000 | Bausch Health Cos., Inc., Sr. Unsecd. Note, 144A, 7.250%, 5/30/2029 | 8,787,093 | |
40,075,000 | Grifols Escrow Issuer S.A., Sr. Unsecd. Note, 144A, 4.750%, 10/15/2028 | 36,970,584 | |
17,175,000 | Jazz Securities Designated Activity Co., Sec. Fac. Bond, 144A, 4.375%, 1/15/2029 | 16,268,040 | |
7,525,000 | Organon & Co./Organon Foreign Debt Co-Issuer B.V., Sec. Fac. Bond, 144A, 6.750%, 5/15/2034 | 7,548,689 | |
3,825,000 | Organon & Co./Organon Foreign Debt Co-Issuer B.V., Sr. Unsecd. Note, 144A, 7.875%, 5/15/2034 | 3,953,114 | |
3,400,000 | Organon Finance 1 LLC, Sec. Fac. Bond, 144A, 4.125%, 4/30/2028 | 3,224,532 |
Principal Amount or Shares | Value | ||
CORPORATE BONDS—continued | |||
Pharmaceuticals—continued | |||
$ 24,000,000 | Organon Finance 1 LLC, Sr. Unsecd. Note, 144A, 5.125%, 4/30/2031 | $ 21,906,285 | |
TOTAL | 131,239,708 | ||
Restaurant—1.6% | |||
2,925,000 | 1011778 BC Unltd. Liability Co./New Red Finance, Inc., 144A, 3.875%, 1/15/2028 | 2,790,256 | |
72,125,000 | 1011778 BC Unltd. Liability Co./New Red Finance, Inc., 144A, 4.000%, 10/15/2030 | 65,210,359 | |
8,900,000 | 1011778 BC Unltd. Liability Co./New Red Finance, Inc., 144A, 4.375%, 1/15/2028 | 8,568,161 | |
6,100,000 | 1011778 BC Unltd. Liability Co./New Red Finance, Inc., 144A, 6.125%, 6/15/2029 | 6,210,947 | |
6,400,000 | 1011778 BC Unltd. Liability Co./New Red Finance, Inc., Term Loan - 1st Lien, 144A, 5.625%, 9/15/2029 | 6,391,831 | |
6,050,000 | KFC Holding Co./Pizza Hut Holdings LLC/Taco Bell of America LLC, Sr. Unsecd. Note, 144A, 4.750%, 6/1/2027 | 5,999,316 | |
4,975,000 | Yum! Brands, Inc., Sr. Unsecd. Note, 3.625%, 3/15/2031 | 4,510,550 | |
7,150,000 | Yum! Brands, Inc., Sr. Unsecd. Note, 4.625%, 1/31/2032 | 6,711,338 | |
5,450,000 | Yum! Brands, Inc., Sr. Unsecd. Note, 5.375%, 4/1/2032 | 5,311,558 | |
13,200,000 | Yum! Brands, Inc., Sr. Unsecd. Note, 144A, 4.750%, 1/15/2030 | 12,785,896 | |
TOTAL | 124,490,212 | ||
Retailers—1.5% | |||
16,225,000 | Academy Ltd., Sec. Fac. Bond, 144A, 6.000%, 11/15/2027 | 16,194,231 | |
225,000 | Asbury Automotive Group, Inc., Sr. Unsecd. Note, 4.750%, 3/1/2030 | 211,923 | |
16,275,000 | Asbury Automotive Group, Inc., Sr. Unsecd. Note, 144A, 4.625%, 11/15/2029 | 15,251,965 | |
10,325,000 | Asbury Automotive Group, Inc., Sr. Unsecd. Note, 144A, 5.000%, 2/15/2032 | 9,519,413 | |
4,450,000 | BELRON Uk Finance PLC, 144A, 5.750%, 10/15/2029 | 4,462,060 | |
8,325,000 | Gap (The), Inc., Sr. Unsecd. Note, 144A, 3.625%, 10/1/2029 | 7,479,999 | |
9,525,000 | Gap (The), Inc., Sr. Unsecd. Note, 144A, 3.875%, 10/1/2031 | 8,195,864 | |
3,875,000 | Group 1 Automotive, Inc., Sr. Unsecd. Note, 144A, 6.375%, 1/15/2030 | 3,902,061 | |
5,525,000 | Kontoor Brands, Inc., Sr. Unsecd. Note, 144A, 4.125%, 11/15/2029 | 5,155,407 | |
3,200,000 | LCM Investments Holdings II, LLC, Sr. Unsecd. Note, 144A, 4.875%, 5/1/2029 | 3,026,653 | |
27,750,000 | LCM Investments Holdings II, LLC, Sr. Unsecd. Note, 144A, 8.250%, 8/1/2031 | 29,002,580 | |
10,975,000 | Velocity Vehicle Group, Sr. Unsecd. Note, 144A, 8.000%, 6/1/2029 | 11,315,840 | |
875,000 | William Carter Co., Sr. Unsecd. Note, 144A, 5.625%, 3/15/2027 | 870,657 | |
TOTAL | 114,588,653 | ||
Supermarkets—0.6% | |||
6,800,000 | Albertsons Cos. LLC/SAFEW, Sr. Unsecd. Note, 144A, 3.250%, 3/15/2026 | 6,589,380 | |
12,775,000 | Albertsons Cos. LLC/SAFEW, Sr. Unsecd. Note, 144A, 3.500%, 3/15/2029 | 11,815,503 | |
13,275,000 | Albertsons Cos. LLC/SAFEW, Sr. Unsecd. Note, 144A, 5.875%, 2/15/2028 | 13,308,307 | |
6,100,000 | Albertsons Cos. LLC/SAFEW, Sr. Unsecd. Note, 144A, 6.500%, 2/15/2028 | 6,247,907 | |
8,675,000 | Albertsons Cos. LLC/SAFEW, Sr. Unsecd. Note, 144A, 7.500%, 3/15/2026 | 8,782,049 | |
TOTAL | 46,743,146 | ||
Technology—11.7% | |||
11,475,000 | Amentum Escrow Corp., Sr. Unsecd. Note, 144A, 7.250%, 8/1/2032 | 11,895,582 | |
4,175,000 | ams-OSRAM AG, Sr. Unsecd. Note, 144A, 12.250%, 3/30/2029 | 4,339,833 | |
20,300,000 | Capstone Borrower, Inc., Sec. Fac. Bond, 144A, 8.000%, 6/15/2030 | 21,234,165 | |
15,150,000 | Centerfield Media Parent, Sr. Note, 144A, 6.625%, 8/1/2026 | 9,762,290 | |
11,475,000 | Central Parent LLC / CDK Global II LLC / CDK Financing Co., 144A, 8.000%, 6/15/2029 | 11,737,250 | |
26,125,000 | Central Parent, Inc./Central Merger Sub, Inc., 144A, 7.250%, 6/15/2029 | 26,248,597 | |
3,900,000 | Ciena Corp., Sr. Unsecd. Note, 144A, 4.000%, 1/31/2030 | 3,602,090 | |
41,750,000 | Clarivate Science Holdings Corp., Sr. Unsecd. Note, 144A, 4.875%, 7/1/2029 | 39,498,468 | |
33,325,000 | Cloud Software Group, Inc., Sec. Fac. Bond, 144A, 6.500%, 3/31/2029 | 32,572,812 | |
9,750,000 | Cloud Software Group, Inc., Sec. Fac. Bond, 144A, 8.250%, 6/30/2032 | 10,028,291 | |
38,125,000 | Cloud Software Group, Inc., Sec. Fac. Bond, 144A, 9.000%, 9/30/2029 | 38,150,893 | |
26,300,000 | Coherent Corp., Sr. Unsecd. Note, 144A, 5.000%, 12/15/2029 | 25,251,593 | |
17,800,000 | Consensus Cloud Solutions, Inc., Sr. Unsecd. Note, 144A, 6.000%, 10/15/2026 | 17,623,673 | |
23,175,000 | Consensus Cloud Solutions, Inc., Sr. Unsecd. Note, 144A, 6.500%, 10/15/2028 | 22,978,073 | |
26,675,000 | Elastic N.V., Sr. Unsecd. Note, 144A, 4.125%, 7/15/2029 | 24,708,308 |
Principal Amount or Shares | Value | ||
CORPORATE BONDS—continued | |||
Technology—continued | |||
$ 8,700,000 | Entegris Escrow Corp., Sec. Fac. Bond, 144A, 4.750%, 4/15/2029 | $ 8,435,457 | |
19,200,000 | Entegris Escrow Corp., Sr. Unsecd. Note, 144A, 5.950%, 6/15/2030 | 19,196,237 | |
13,500,000 | Entegris, Inc., Sr. Unsecd. Note, 144A, 3.625%, 5/1/2029 | 12,409,267 | |
6,150,000 | Fair Isaac & Co., Inc., Sr. Unsecd. Note, 144A, 4.000%, 6/15/2028 | 5,846,053 | |
12,100,000 | Fortress Intermediate 3, Inc., Sec. Fac. Bond, 144A, 7.500%, 6/1/2031 | 12,594,067 | |
8,828,820 | GoTo Group, Inc., First Out, Series 144A, 5.500%, 5/1/2028 | 6,828,651 | |
12,192,180 | GoTo Group, Inc., Second Out, Series 144A, 5.500%, 5/1/2028 | 3,895,402 | |
24,625,000 | HealthEquity, Inc., Sr. Unsecd. Note, 144A, 4.500%, 10/1/2029 | 23,498,712 | |
10,575,000 | Helios Software Holdings, Sec. Fac. Bond, 144A, 4.625%, 5/1/2028 | 9,702,416 | |
5,675,000 | Insight Enterprises, Inc., Sr. Unsecd. Note, 144A, 6.625%, 5/15/2032 | 5,806,240 | |
27,650,000 | Iron Mountain, Inc., Sr. Unsecd. Note, 144A, 7.000%, 2/15/2029 | 28,456,827 | |
72,175,000 | McAfee Corp., Sr. Unsecd. Note, 144A, 7.375%, 2/15/2030 | 69,642,596 | |
68,650,000 | Minerva Merger Sub, Inc., Sr. Unsecd. Note, 144A, 6.500%, 2/15/2030 | 64,974,657 | |
3,000,000 | MSCI, Inc., Sr. Unsecd. Note, 144A, 3.875%, 2/15/2031 | 2,771,364 | |
13,450,000 | NCR Atleos Escrow Corp., 144A, 9.500%, 4/1/2029 | 14,814,580 | |
9,225,000 | NCR Voyix Corp., Sr. Unsecd. Note, 144A, 5.000%, 10/1/2028 | 8,883,101 | |
10,600,000 | NCR Voyix Corp., Sr. Unsecd. Note, 144A, 5.125%, 4/15/2029 | 10,139,936 | |
9,050,000 | Open Text, Inc., 144A, 6.900%, 12/1/2027 | 9,416,326 | |
17,450,000 | Open Text, Inc., Sr. Unsecd. Note, 144A, 3.875%, 2/15/2028 | 16,429,055 | |
8,000,000 | Open Text, Inc., Sr. Unsecd. Note, 144A, 4.125%, 12/1/2031 | 7,191,954 | |
3,000,000 | Qorvo, Inc., Sr. Unsecd. Note, 4.375%, 10/15/2029 | 2,830,821 | |
8,975,000 | Rocket Software, Inc., Sec. Fac. Bond, 144A, 9.000%, 11/28/2028 | 9,365,152 | |
39,925,000 | Rocket Software, Inc., Sr. Unsecd. Note, 144A, 6.500%, 2/15/2029 | 37,167,452 | |
4,350,000 | Science Applications International Corp., Sr. Unsecd. Note, 144A, 4.875%, 4/1/2028 | 4,270,836 | |
1,150,000 | Seagate HDD Cayman, Sr. Unsecd. Note, 8.250%, 12/15/2029 | 1,238,262 | |
7,300,000 | Seagate HDD Cayman, Sr. Unsecd. Note, 8.500%, 7/15/2031 | 7,875,379 | |
25,859,625 | Seagate HDD Cayman, Sr. Unsecd. Note, 9.625%, 12/1/2032 | 29,495,049 | |
3,100,000 | Sensata Technologies B.V., Sr. Unsecd. Note, 144A, 4.375%, 2/15/2030 | 2,888,857 | |
8,700,000 | Sensata Technologies B.V., Sr. Unsecd. Note, 144A, 5.875%, 9/1/2030 | 8,616,926 | |
4,450,000 | Sensata Technologies, Inc., Sr. Unsecd. Note, 144A, 3.750%, 2/15/2031 | 3,975,434 | |
4,600,000 | Sensata Technologies, Inc., Sr. Unsecd. Note, 144A, 6.625%, 7/15/2032 | 4,664,518 | |
41,500,000 | SS&C Technologies, Inc., Sr. Unsecd. Note, 144A, 5.500%, 9/30/2027 | 41,363,282 | |
9,675,000 | SS&C Technologies, Inc., Sr. Unsecd. Note, 144A, 6.500%, 6/1/2032 | 9,855,197 | |
8,875,000 | Synaptics, Inc., Sr. Unsecd. Note, 144A, 4.000%, 6/15/2029 | 8,149,123 | |
13,500,000 | TTM Technologies, Inc., Sr. Unsecd. Note, 144A, 4.000%, 3/1/2029 | 12,633,106 | |
45,150,000 | UKG, Inc., Sec. Fac. Bond, 144A, 6.875%, 2/1/2031 | 46,293,481 | |
11,975,000 | Viavi Solutions, Inc., Sr. Unsecd. Note, 144A, 3.750%, 10/1/2029 | 10,877,722 | |
5,625,000 | Zebra Technologies Corp., Sr. Unsecd. Note, 144A, 6.500%, 6/1/2032 | 5,759,331 | |
14,025,000 | ZipRecruiter, Inc., Sr. Unsecd. Note, 144A, 5.000%, 1/15/2030 | 12,660,848 | |
TOTAL | 900,545,592 | ||
Transportation Services—0.4% | |||
15,225,000 | Stena International S.A., Sr. Secd. Note, 144A, 7.250%, 1/15/2031 | 15,818,866 | |
12,725,000 | Watco Cos. LLC/Finance Co., Sr. Unsecd. Note, 144A, 7.125%, 8/1/2032 | 13,130,164 | |
TOTAL | 28,949,030 | ||
Utility - Electric—2.8% | |||
13,300,000 | Calpine Corp., 144A, 4.500%, 2/15/2028 | 12,818,387 | |
14,650,000 | Calpine Corp., Sr. Secd. Note, 144A, 3.750%, 3/1/2031 | 13,216,471 | |
7,900,000 | Calpine Corp., Sr. Unsecd. Note, 144A, 4.625%, 2/1/2029 | 7,498,431 | |
7,450,000 | Calpine Corp., Sr. Unsecd. Note, 144A, 5.000%, 2/1/2031 | 7,038,858 | |
9,500,000 | Calpine Corp., Sr. Unsecd. Note, 144A, 5.125%, 3/15/2028 | 9,293,470 | |
6,625,000 | NextEra Energy Operating Partners LP, Sr. Unsecd. Note, 144A, 4.500%, 9/15/2027 | 6,365,595 | |
19,900,000 | NextEra Energy Operating Partners LP, Sr. Unsecd. Note, 144A, 7.250%, 1/15/2029 | 20,487,289 |
Principal Amount or Shares | Value | ||
CORPORATE BONDS—continued | |||
Utility - Electric—continued | |||
$ 6,150,000 | NRG Energy, Inc., Sr. Unsecd. Note, 144A, 3.375%, 2/15/2029 | $ 5,612,790 | |
6,450,000 | NRG Energy, Inc., Sr. Unsecd. Note, 144A, 3.625%, 2/15/2031 | 5,716,810 | |
2,082,000 | NRG Energy, Inc., Sr. Unsecd. Note, 144A, 3.875%, 2/15/2032 | 1,850,384 | |
7,375,000 | NRG Energy, Inc., Sr. Unsecd. Note, 144A, 5.250%, 6/15/2029 | 7,212,465 | |
4,100,000 | NRG Energy, Inc., Sr. Unsecd. Note, 144A, 6.000%, 2/1/2033 | 4,079,869 | |
4,850,000 | NRG Energy, Inc., Sr. Unsecd. Note, 144A, 6.250%, 11/1/2034 | 4,847,924 | |
4,325,000 | NRG Energy, Inc., Sr. Unsecd. Note, Series WI, 5.750%, 1/15/2028 | 4,330,826 | |
11,875,000 | TerraForm Power Operating LLC, Sr. Unsecd. Note, 144A, 4.750%, 1/15/2030 | 11,091,668 | |
27,175,000 | TerraForm Power Operating LLC, Sr. Unsecd. Note, 144A, 5.000%, 1/31/2028 | 26,573,234 | |
8,350,000 | TransAlta Corp., Sr. Unsecd. Note, 7.750%, 11/15/2029 | 8,824,723 | |
8,750,000 | Vistra Operations Co., LLC, Sr. Unsecd. Note, 144A, 5.000%, 7/31/2027 | 8,640,358 | |
9,650,000 | Vistra Operations Co., LLC, Sr. Unsecd. Note, 144A, 5.500%, 9/1/2026 | 9,626,912 | |
28,825,000 | Vistra Operations Co., LLC, Sr. Unsecd. Note, 144A, 5.625%, 2/15/2027 | 28,768,641 | |
2,425,000 | Vistra Operations Co., LLC, Sr. Unsecd. Note, 144A, 6.875%, 4/15/2032 | 2,509,401 | |
9,425,000 | Vistra Operations Co., LLC, Sr. Unsecd. Note, 144A, 7.750%, 10/15/2031 | 9,963,952 | |
TOTAL | 216,368,458 | ||
Wireless Communications—0.1% | |||
7,400,000 | Sprint Corp., Sr. Unsecd. Note, 7.625%, 2/15/2025 | 7,402,325 | |
TOTAL CORPORATE BONDS (IDENTIFIED COST $7,714,009,059) | 7,415,760,366 | ||
COMMON STOCK—0.0% | |||
Media Entertainment—0.0% | |||
67,353 | 2,3 | Audacy Capital Corp. (IDENTIFIED COST $45,005,284) | 1,640,046 |
WARRANTS—0.0% | |||
Media Entertainment—0.0% | |||
81,640 | 2,3 | Audacy Capital Corp., Warrants | 817 |
13,607 | 2,3 | Audacy Capital Corp., Warrants | 136 |
TOTAL WARRANTS (IDENTIFIED COST $27,014) | 953 | ||
INVESTMENT COMPANY—2.7% | |||
205,105,579 | Federated Hermes Government Obligations Fund, Premier Shares, 4.77%4 (IDENTIFIED COST $205,105,579) | 205,105,579 | |
TOTAL INVESTMENT IN SECURITIES—98.8% (IDENTIFIED COST $7,964,146,936)5 | 7,622,506,944 | ||
OTHER ASSETS AND LIABILITIES - NET—1.2%6 | 94,578,846 | ||
TOTAL NET ASSETS—100% | $7,717,085,790 |
Federated Hermes Institutional Prime Value Obligations Fund, Institutional Shares | Federated Hermes Government Obligations Fund, Premier Shares | Total of Affiliated Transactions | |
Value as of 10/31/2023 | $168,580,302 | $— | $168,580,302 |
Purchases at Cost | $1,015,971,148 | $809,457,214 | $1,825,428,362 |
Proceeds from Sales | $(1,184,503,975) | $(604,351,635) | $(1,788,855,610) |
Change in Unrealized Appreciation/Depreciation | $12,252 | $— | $12,252 |
Net Realized Gain/(Loss) | $(59,727) | $— | $(59,727) |
Value as of 10/31/2024 | $— | $205,105,579 | $205,105,579 |
Shares Held as of 10/31/2024 | — | 205,105,579 | 205,105,579 |
Dividend Income | $6,475,413 | $6,151,070 | $12,626,483 |
1 | Issuer in default. |
2 | Non-income-producing security. |
3 | Market quotations and price evaluations are not available. Fair value determined using significant unobservable inputs in accordance with procedures established by and under the general supervision of the Fund’s Adviser acting through its Valuation Committee (“Valuation Committee”). |
4 | 7-day net yield. |
5 | The cost of investments for federal tax purposes amounts to $7,977,722,183. |
6 | Assets, other than investments in securities, less liabilities. See Statement of Assets and Liabilities. |
The following is a summary of the inputs used, as of October 31, 2024, in valuing the Fund’s assets carried at fair value:
Valuation Inputs | ||||
Level 1— Quoted Prices | Level 2— Other Significant Observable Inputs | Level 3— Significant Unobservable Inputs | Total | |
Debt Securities: | ||||
Corporate Bonds | $— | $7,415,760,366 | $— | $7,415,760,366 |
Warrants | — | — | 953 | 953 |
Equity Security: | ||||
Common Stock | ||||
Domestic | — | — | 1,640,046 | 1,640,046 |
Investment Company | 205,105,579 | — | — | 205,105,579 |
TOTAL SECURITIES | $205,105,579 | $7,415,760,366 | $1,640,999 | $7,622,506,944 |
The following acronym(s) are used throughout this portfolio: | ||
GMTN | —Global Medium Term Note | |
PIK | —Payment in Kind | |
Year Ended 10/31/2024 | Period Ended 10/31/20231 | |
Net Asset Value, Beginning of Period | $8.26 | $8.57 |
Income From Investment Operations: | ||
Net investment income (loss)2 | 0.48 | 0.35 |
Net realized and unrealized gain (loss) | 0.69 | (0.31) |
Total From Investment Operations | 1.17 | 0.04 |
Less Distributions: | ||
Distributions from net investment income | (0.51) | (0.35) |
Net Asset Value, End of Period | $8.92 | $8.26 |
Total Return3 | 14.36% | 0.50% |
Ratios to Average Net Assets: | ||
Net expenses4 | 0.74% | 0.74%5 |
Net investment income | 5.44% | 5.74%5 |
Expense waiver/reimbursement6 | 0.06% | 0.06%5 |
Supplemental Data: | ||
Net assets, end of period (000 omitted) | $14,325 | $12,066 |
Portfolio turnover7 | 24% | 14%8 |
1 | Reflects operations for the period from February 9, 2023 (commencement of operations) to October 31, 2023. |
2 | Per share numbers have been calculated using the average shares method. |
3 | Based on net asset value, which does not reflect the sales charge, redemption fee or contingent deferred sales charge, if applicable. Total returns for periods of less than one year are not annualized. |
4 | Amount does not reflect net expenses incurred by investment companies in which the Fund may invest. |
5 | Computed on an annualized basis. |
6 | This expense decrease is reflected in both the net expense and the net investment income ratios shown above. Amount does not reflect expense waiver/ reimbursement recorded by investment companies in which the Fund may invest. |
7 | Securities that mature are considered sales for purposes of this calculation. |
8 | Portfolio turnover is calculated at the Fund level. Percentage indicated was calculated for the year ended October 31, 2023. |
Year Ended 10/31/2024 | Period Ended 10/31/20231 | |
Net Asset Value, Beginning of Period | $8.22 | $8.57 |
Income From Investment Operations: | ||
Net investment income (loss)2 | 0.41 | 0.30 |
Net realized and unrealized gain (loss) | 0.70 | (0.34) |
Total From Investment Operations | 1.11 | (0.04) |
Less Distributions: | ||
Distributions from net investment income | (0.44) | (0.31) |
Net Asset Value, End of Period | $8.89 | $8.22 |
Total Return3 | 13.68% | (0.52)% |
Ratios to Average Net Assets: | ||
Net expenses4 | 1.53% | 1.49%5 |
Net investment income | 4.63% | 4.87%5 |
Expense waiver/reimbursement6 | 0.02% | 0.05%5 |
Supplemental Data: | ||
Net assets, end of period (000 omitted) | $2,584 | $901 |
Portfolio turnover7 | 24% | 14%8 |
1 | Reflects operations for the period from February 9, 2023 (commencement of operations) to October 31, 2023. |
2 | Per share numbers have been calculated using the average shares method. |
3 | Based on net asset value, which does not reflect the sales charge, redemption fee or contingent deferred sales charge, if applicable. Total returns for periods of less than one year are not annualized. |
4 | Amount does not reflect net expenses incurred by investment companies in which the Fund may invest. |
5 | Computed on an annualized basis. |
6 | This expense decrease is reflected in both the net expense and the net investment income ratios shown above. Amount does not reflect expense waiver/ reimbursement recorded by investment companies in which the Fund may invest. |
7 | Securities that mature are considered sales for purposes of this calculation. |
8 | Portfolio turnover is calculated at the Fund level. Percentage indicated was calculated for the year ended October 31, 2023. |
Year Ended October 31, | |||||
2024 | 2023 | 2022 | 2021 | 2020 | |
Net Asset Value, Beginning of Period | $8.25 | $8.32 | $9.91 | $9.57 | $9.78 |
Income From Investment Operations: | |||||
Net investment income (loss)1 | 0.50 | 0.51 | 0.48 | 0.48 | 0.52 |
Net realized and unrealized gain (loss) | 0.69 | (0.06) | (1.57) | 0.37 | (0.21) |
Total From Investment Operations | 1.19 | 0.45 | (1.09) | 0.85 | 0.31 |
Less Distributions: | |||||
Distributions from net investment income | (0.53) | (0.52) | (0.50) | (0.51) | (0.52) |
Net Asset Value, End of Period | $8.91 | $8.25 | $8.32 | $9.91 | $9.57 |
Total Return2 | 14.66% | 5.42% | (11.30)% | 8.94% | 3.39% |
Ratios to Average Net Assets: | |||||
Net expenses3 | 0.49% | 0.49% | 0.49% | 0.49% | 0.49% |
Net investment income | 5.70% | 6.03% | 5.30% | 4.76% | 5.48% |
Expense waiver/reimbursement4 | 0.04% | 0.05% | 0.05% | 0.05% | 0.06% |
Supplemental Data: | |||||
Net assets, end of period (000 omitted) | $5,736,376 | $5,202,252 | $5,542,801 | $7,425,236 | $6,287,623 |
Portfolio turnover5 | 24% | 14% | 12% | 32% | 32% |
1 | Per share numbers have been calculated using the average shares method. |
2 | Based on net asset value. |
3 | Amount does not reflect net expenses incurred by investment companies in which the Fund may invest. |
4 | This expense decrease is reflected in both the net expense and the net investment income ratios shown above. Amount does not reflect expense waiver/ reimbursement recorded by investment companies in which the Fund may invest. |
5 | Securities that mature are considered sales for purposes of this calculation. |
Year Ended October 31, | |||||
2024 | 2023 | 2022 | 2021 | 2020 | |
Net Asset Value, Beginning of Period | $8.25 | $8.32 | $9.92 | $9.57 | $9.79 |
Income From Investment Operations: | |||||
Net investment income (loss)1 | 0.50 | 0.51 | 0.48 | 0.47 | 0.51 |
Net realized and unrealized gain (loss) | 0.70 | (0.06) | (1.58) | 0.39 | (0.21) |
Total From Investment Operations | 1.20 | 0.45 | (1.10) | 0.86 | 0.30 |
Less Distributions: | |||||
Distributions from net investment income | (0.53) | (0.52) | (0.50) | (0.51) | (0.52) |
Net Asset Value, End of Period | $8.92 | $8.25 | $8.32 | $9.92 | $9.57 |
Total Return2 | 14.80% | 5.43% | (11.38)% | 9.06% | 3.29% |
Ratios to Average Net Assets: | |||||
Net expenses3 | 0.48% | 0.48% | 0.48% | 0.48% | 0.48% |
Net investment income | 5.71% | 6.03% | 5.29% | 4.78% | 5.34% |
Expense waiver/reimbursement4 | 0.02% | 0.02% | 0.02% | 0.01% | 0.03% |
Supplemental Data: | |||||
Net assets, end of period (000 omitted) | $1,963,801 | $1,958,657 | $1,669,728 | $2,679,769 | $3,059,665 |
Portfolio turnover5 | 24% | 14% | 12% | 32% | 32% |
1 | Per share numbers have been calculated using the average shares method. |
2 | Based on net asset value. |
3 | Amount does not reflect net expenses incurred by investment companies in which the Fund may invest. |
4 | This expense decrease is reflected in both the net expense and the net investment income ratios shown above. Amount does not reflect expense waiver/ reimbursement recorded by investment companies in which the Fund may invest. |
5 | Securities that mature are considered sales for purposes of this calculation. |
Assets: | |
Investment in securities, at value including $205,105,579 of investments in affiliated holdings* (identified cost $7,964,146,936, including $205,105,579 of identified cost in affiliated holdings) | $7,622,506,944 |
Income receivable | 122,190,184 |
Income receivable from affiliated holdings | 1,016,114 |
Receivable for investments sold | 4,882,738 |
Receivable for shares sold | 4,226,399 |
Total Assets | 7,754,822,379 |
Liabilities: | |
Payable for investments purchased | 14,392,924 |
Payable for shares redeemed | 17,743,295 |
Income distribution payable | 4,906,487 |
Payable for investment adviser fee (Note 5) | 81,022 |
Payable for administrative fee (Note 5) | 16,322 |
Payable for Directors’/Trustees’ fees (Note 5) | 164 |
Payable for distribution services fee (Note 5) | 1,630 |
Payable for other service fees (Notes 2 and 5) | 4,314 |
Accrued expenses (Note 5) | 590,431 |
Total Liabilities | 37,736,589 |
Net assets for 865,844,712 shares outstanding | $7,717,085,790 |
Net Assets Consist of: | |
Paid-in capital | $8,625,273,664 |
Total distributable earnings (loss) | (908,187,874) |
Total Net Assets | $7,717,085,790 |
Net Asset Value, Offering Price and Redemption Proceeds Per Share: | |
Class A Shares: | |
$14,324,405 ÷ 1,605,964 shares outstanding, no par value, unlimited shares authorized | $8.92 |
Offering price per share (100/95.50 of $8.92) | $9.34 |
Redemption proceeds per share | $8.92 |
Class C Shares: | |
$2,583,842 ÷ 290,800 shares outstanding, no par value, unlimited shares authorized | $8.89 |
Offering price per share | $8.89 |
Redemption proceeds per share (99.00/100 of $8.89) | $8.80 |
Institutional Shares: | |
$5,736,376,262 ÷ 643,687,898 shares outstanding, no par value, unlimited shares authorized | $8.91 |
Offering price per share | $8.91 |
Redemption proceeds per share | $8.91 |
Class R6 Shares: | |
$1,963,801,281 ÷ 220,260,050 shares outstanding, no par value, unlimited shares authorized | $8.92 |
Offering price per share | $8.92 |
Redemption proceeds per share | $8.92 |
* | See information listed after the Fund’s Portfolio of Investments. |
Investment Income: | |
Interest | $453,920,851 |
Dividends (including $12,626,483 received from affiliated holdings*) | 16,428,641 |
TOTAL INCOME | 470,349,492 |
Expenses: | |
Investment adviser fee (Note 5) | 30,381,041 |
Administrative fee (Note 5) | 5,906,023 |
Custodian fees | 217,367 |
Transfer agent fees (Note 2) | 2,886,710 |
Directors’/Trustees’ fees (Note 5) | 26,631 |
Auditing fees | 42,213 |
Legal fees | 10,841 |
Portfolio accounting fees | 222,385 |
Distribution services fee (Note 5) | 14,358 |
Other service fees (Notes 2 and 5) | 37,009 |
Share registration costs | 120,667 |
Printing and postage | 272,383 |
Miscellaneous (Note 5) | 64,016 |
TOTAL EXPENSES | 40,201,644 |
Waiver and Reimbursements: | |
Waiver/reimbursement of investment adviser fee (Note 5) | (1,177,279) |
Reimbursement of other operating expenses (Notes 2 and 5) | (1,585,602) |
TOTAL WAIVER AND REIMBURSEMENTS | (2,762,881) |
Net expenses | 37,438,763 |
Net investment income | 432,910,729 |
Realized and Unrealized Gain (Loss) on Investments: | |
Net realized loss on investments (including net realized loss of $(59,727) on sales of investments in affiliated holdings*) | (216,454,784) |
Net change in unrealized depreciation of investments (including net change in unrealized depreciation of $12,252 on investments in affiliated holdings*) | 813,850,212 |
Net realized and unrealized gain (loss) on investments | 597,395,428 |
Change in net assets resulting from operations | $1,030,306,157 |
* | See information listed after the Fund’s Portfolio of Investments. |
Year Ended October 31 | 2024 | 2023 |
Increase (Decrease) in Net Assets | ||
Operations: | ||
Net investment income | $432,910,729 | $456,094,327 |
Net realized gain (loss) | (216,454,784) | (121,498,837) |
Net change in unrealized appreciation/depreciation | 813,850,212 | 67,646,931 |
CHANGE IN NET ASSETS RESULTING FROM OPERATIONS | 1,030,306,157 | 402,242,421 |
Distributions to Shareholders: | ||
Class A Shares | (748,130) | (256,440)1 |
Class C Shares | (94,828) | (6,881)1 |
Institutional Shares | (334,359,005) | (342,550,009) |
Class R6 Shares | (121,865,733) | (121,768,212) |
CHANGE IN NET ASSETS RESULTING FROM DISTRIBUTIONS TO SHAREHOLDERS | (457,067,696) | (464,581,542) |
Share Transactions: | ||
Proceeds from sale of shares | 1,775,333,445 | 2,270,570,864 |
Net asset value of shares issued to shareholders in payment of distributions declared | 399,703,860 | 400,999,024 |
Cost of shares redeemed | (2,205,065,489) | (2,647,884,106) |
CHANGE IN NET ASSETS RESULTING FROM SHARE TRANSACTIONS | (30,028,184) | 23,685,782 |
Change in net assets | 543,210,277 | (38,653,339) |
Net Assets: | ||
Beginning of period | 7,173,875,513 | 7,212,528,852 |
End of period | $7,717,085,790 | $7,173,875,513 |
1 | Reflects operations for the period from February 9, 2023 (commencement of operations) to October 31, 2023. |
Transfer Agent Fees Incurred | Transfer Agent Fees Reimbursed | |
Class A Shares | $7,726 | $(5,180) |
Class C Shares | 1,143 | (60) |
Institutional Shares | 2,684,025 | (1,580,362) |
Class R6 Shares | 193,816 | — |
TOTAL | $2,886,710 | $(1,585,602) |
Other Service Fees Incurred | |
Class A Shares | $32,309 |
Class C Shares | 4,700 |
TOTAL | $37,009 |
Year Ended 10/31/2024 | Period Ended 10/31/20231 | |||
Class A Shares: | Shares | Amount | Shares | Amount |
Shares sold | 924,105 | $8,093,576 | 1,568,267 | $13,192,829 |
Shares issued to shareholders in payment of distributions declared | 84,898 | 747,582 | 30,335 | 256,276 |
Shares redeemed | (864,655) | (7,579,051) | (136,986) | (1,155,560) |
NET CHANGE RESULTING FROM CLASS A SHARE TRANSACTIONS | 144,348 | $1,262,107 | 1,461,616 | $12,293,545 |
Year Ended 10/31/2024 | Period Ended 10/31/20231 | |||
Class C Shares: | Shares | Amount | Shares | Amount |
Shares sold | 190,119 | $1,661,762 | 112,620 | $945,728 |
Shares issued to shareholders in payment of distributions declared | 10,824 | 95,150 | 828 | 6,888 |
Shares redeemed | (19,660) | (170,207) | (3,931) | (32,692) |
NET CHANGE RESULTING FROM CLASS C SHARE TRANSACTIONS | 181,283 | $1,586,705 | 109,517 | $919,924 |
Year Ended 10/31/2024 | Year Ended 10/31/2023 | |||
Institutional Shares: | Shares | Amount | Shares | Amount |
Shares sold | 150,769,239 | $1,319,051,958 | 178,658,378 | $1,510,275,168 |
Shares issued to shareholders in payment of distributions declared | 33,426,895 | 294,030,024 | 35,370,724 | 298,683,798 |
Shares redeemed | (171,279,720) | (1,496,591,780) | (249,391,947) | (2,103,122,727) |
NET CHANGE RESULTING FROM INSTITUTIONAL SHARE TRANSACTIONS | 12,916,414 | $116,490,202 | (35,362,845) | $(294,163,761) |
Year Ended 10/31/2024 | Year Ended 10/31/2023 | |||
Class R6 Shares: | Shares | Amount | Shares | Amount |
Shares sold | 51,024,087 | $446,526,149 | 89,163,650 | $746,157,139 |
Shares issued to shareholders in payment of distributions declared | 11,916,195 | 104,831,104 | 12,081,702 | 102,052,062 |
Shares redeemed | (80,061,328) | (700,724,451) | (64,436,102) | (543,573,127) |
NET CHANGE RESULTING FROM CLASS R6 SHARE TRANSACTIONS | (17,121,046) | $(149,367,198) | 36,809,250 | $304,636,074 |
NET CHANGE RESULTING FROM TOTAL FUND SHARE TRANSACTIONS | (3,879,001) | $(30,028,184) | 3,017,538 | $23,685,782 |
1 | Reflects operations for the period from February 9, 2023 (commencement of operations) to October 31, 2023. |
2024 | 2023 | |
Ordinary income | $457,067,696 | $464,581,542 |
Undistributed ordinary income | $10,582,216 |
Net unrealized depreciation | $(355,215,239) |
Capital loss carryforwards | $(563,554,851) |
TOTAL | $(908,187,874) |
Short-Term | Long-Term | Total |
$3,683,225 | $559,871,626 | $563,554,851 |
Administrative Fee | Average Daily Net Assets of the Investment Complex |
0.100% | on assets up to $50 billion |
0.075% | on assets over $50 billion |
Distribution Services Fees Incurred | |
Class C Shares | $14,358 |
Purchases | $1,733,166,362 |
Sales | $1,820,731,482 |

December 23, 2024
Trustee: | Voted For | Withheld Authority | Abstained | Broker Non-Voting |
J. Christopher Donahue | 714,358,854.839 | 1,076,333.751 | 0 | N/A |
John B. Fisher | 714,459,491.978 | 975,696.612 | 0 | N/A |
John G. Carson | 714,390,526.531 | 1,044,662.059 | 0 | N/A |
G. Thomas Hough | 714,417,084.158 | 1,018,104.432 | 0 | N/A |
Karen L. Larrimer | 714,492,965.310 | 942,223.280 | 0 | N/A |
Max F. Miller | 714,404,534.493 | 1,030,654.097 | 0 | N/A |
Frank J. Nasta | 714,445,567.501 | 989,621.089 | 0 | N/A |
Thomas M. O’Neill | 713,648,793.998 | 1,786,394.592 | 0 | N/A |
Madelyn A. Reilly | 713,797,516.590 | 1,637,672.000 | 0 | N/A |
John S. Walsh | 713,582,576.007 | 1,852,612.583 | 0 | N/A |

Federated Hermes Funds
4000 Ericsson Drive
Warrendale, PA 15086-7561
or call 1-800-341-7400.
CUSIP 31420B821
CUSIP 31420B300
CUSIP 31420B847
| Item 8. | Changes in and Disagreements with Accountants for Open-End Management Investment Companies |
Federated Hermes Institutional High Yield Bond Fund: Not Applicable.
| Item 9. | Proxy Disclosures for Open-End Management Investment Companies. |
Federated Hermes Institutional High Yield Bond Fund: The Fund’s report on its most recent meeting of shareholders is filed under Item 7 of this form.
| Item 10. | Remuneration Paid to Directors, Officers, and Others of Open-End Management Investment Companies. |
Federated Hermes Institutional High Yield Bond Fund: The Fund’s disclosure of remuneration items is included as part of the Financial Statements filed under Item 7 of this form.
| Item 11. | Statement Regarding Basis for Approval of Investment Advisory Contract. |
Federated Hermes Institutional High Yield Bond Fund: The Fund’s Evaluation and Approval of Advisory Contract summary by fund appear in the Financial Statements filed under Item 7 of this form.
| Item 12. | Disclosure of Proxy Voting Policies and Procedures for Closed-End Management Investment Companies |
Not Applicable
| Item 13. | Portfolio Managers of Closed-End Management Investment Companies. |
Not Applicable
| Item 14. | Purchases of Equity Securities by Closed-End Management Investment Company and Affiliated Purchasers. |
Not Applicable
| Item 15. | Submission of Matters to a Vote of Security Holders. |
No Changes to Report
| Item 16. | Controls and Procedures. |
(a) The registrant’s Principal Executive Officer and Principal Financial Officer have concluded that the registrant’s disclosure controls and procedures (as defined in Rule 30a-3(c) under the Act) are effective in design and operation and are sufficient to form the basis of the certifications required by Rule 30a-(2) under the Act, based on their evaluation of these disclosure controls and procedures as of a date within 90 days of the filing date of this report on Form N-CSR.
(b) There were no changes in the registrant’s internal control over financial reporting (as defined in Rule 30a-3(d) under the Act) during the period covered by this report that have materially affected, or are reasonably likely to materially affect, the registrant’s internal control over financial reporting.
| Item 17. | Disclosure of Securities Lending Activities for Closed-End Management Investment Companies. |
Not Applicable
| Item 18. | Recovery of Erroneously Awarded Compensation |
(a) Not Applicable
(b) Not Applicable
| Item 19. | Exhibits |
(a)(1) Not Applicable.
(a)(2) Not Applicable.
(a)(3) Certifications of Principal Executive Officer and Principal Financial Officer.
(a)(4) Not Applicable.
(a)(5) Not Applicable.
(b) Certifications pursuant to 18 U.S.C. Section 1350.
SIGNATURES
Pursuant to the requirements of the Securities Exchange Act of 1934 and the Investment Company Act of 1940, the registrant has duly caused this report to be signed on its behalf by the undersigned, thereunto duly authorized.
Registrant: Federated Hermes Institutional Trust
By: /s/ Jeremy D. Boughton
Jeremy D. Boughton, Principal Financial Officer
Date: December 23, 2024
Pursuant to the requirements of the Securities Exchange Act of 1934 and the Investment Company Act of 1940, this report has been signed below by the following persons on behalf of the registrant and in the capacities and on the dates indicated.
By: /s/ J. Christopher Donahue
J. Christopher Donahue, Principal Executive Officer
Date: December 23, 2024
By: /s/ Jeremy D. Boughton
Jeremy D. Boughton, Principal Financial Officer
Date: December 23, 2024