UNITED STATES
SECURITIES AND EXCHANGE COMMISSION
Washington, D.C. 20549
FORM N-CSRS
CERTIFIED SHAREHOLDER REPORT OF REGISTERED
MANAGEMENT INVESTMENT COMPANIES
Investment Company Act File Number 811-08572
Bishop Street Funds
(Exact name of registrant as specified in charter)
c/o CT Corporation
101 Federal Street
Boston, MA 02110
(Address of principal executive offices)
SEI Investments
One Freedom Valley Drive
Oaks, PA 19456
(Name and address of agent for service)
Registrant’s telephone number, including area code: 1-800-262-9565
Date of fiscal year end: December 31, 2017
Date of reporting period: June 30, 2017
| Item 1. | Reports to Stockholders. |
The Funds file their complete schedules of portfolio holdings with the Securities and Exchange Commission (the “Commission”) for the first and third quarters of each fiscal year on Form N-Q within sixty days after the end of the period. The Funds’ Forms N-Q are available on the Commission’s website at http://www.sec.gov, and may be reviewed and copied at the Commission’s Public Reference Room in Washington, DC. Information on the operation of the Public Reference Room may be obtained by calling 1-800-SEC-0330.
A description of the policies and procedures that the Funds use to determine how to vote proxies (if any) relating to portfolio securities is available without charge, by calling 1-800-262-9565 or by visiting the Commission’s website at http://www.sec.gov. Information regarding how the Funds voted proxies relating to portfolio securities during the most recent twelve-month period ended June 30 is available without charge, by calling 1-800-262-9565 or by visiting the Funds’ website at http://www.bishopstreetfunds.com or the website of the Securities and Exchange Commission.
BISHOP STREET
TABLE OF CONTENTS
FUNDS
1
| | | | |
| Dividend Value Fund | | | (unaudited) | |
Top Ten Equity Holdings†
| | | | | | | | |
| | | | | | Percentage of
Investments | |
| |
| | 1. | | | Microsoft | | | 4.5% | |
| |
| | 2. | | | JPMorgan Chase | | | 3.6% | |
| |
| | 3. | | | Johnson & Johnson | | | 3.5% | |
| |
| | 4. | | | Apple | | | 2.9% | |
| |
| | 5. | | | ExxonMobil | | | 2.8% | |
| |
| | 6. | | | BlackRock FedFund, Institutional Shares | | | 2.7% | |
| |
| | 7. | | | Philip Morris International | | | 2.6% | |
| |
| | 8. | | | Comcast Cl A | | | 2.5% | |
| |
| | 9. | | | Home Depot | | | 2.5% | |
| |
| | 10. | | | Merck | | | 2.4% | |
| † | | Percentages based on total investments. Top ten holdings do not include short-term investments. |
Schedule of Investments
| | | | | | | | |
Shares | | | | | Value
(000) | |
| | | | | | | | |
| | COMMON STOCK — 96.9% | |
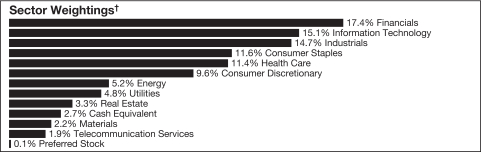
| | Consumer Discretionary — 9.6% | | | | |
| | 27,142 | | | Comcast, Cl A | | $ | 1,056 | |
| | 2,376 | | | Genuine Parts | | | 221 | |
| | 6,823 | | | Home Depot | | | 1,047 | |
| | 8,305 | | | Interpublic Group of Companies | | | 204 | |
| | 2,757 | | | McDonald’s | | | 422 | |
| | 5,415 | | | Time Warner | | | 544 | |
| | 4,635 | | | TJX | | | 334 | |
| | 2,001 | | | Walt Disney | | | 213 | |
| | | | | | | | |
| | | | | | | 4,041 | |
| | | | | | | | |
2
| | | | |
| Dividend Value Fund | | | (unaudited) | |
Schedule of Investments
(continued)
| | | | | | | | |
Shares | | | | | Value
(000) | |
| | | | | | | | |
| | Consumer Staples — 11.6% | | | | |
| | 11,842 | | | Altria Group | | $ | 882 | |
| | 4,995 | | | Coca-Cola Enterprises | | | 203 | |
| | 5,108 | | | CVS Health | | | 411 | |
| | 6,403 | | | General Mills | | | 355 | |
| | 2,490 | | | Kimberly-Clark | | | 321 | |
| | 6,830 | | | PepsiCo | | | 789 | |
| | 9,120 | | | Philip Morris International | | | 1,071 | |
| | 5,158 | | | Procter & Gamble | | | 450 | |
| | 5,034 | | | Wal-Mart Stores | | | 381 | |
| | | | | | | | |
| | | | | | | 4,863 | |
| | | | | | | | |
| | Energy — 5.1% | |
| | 5,000 | | | Chevron | | | 522 | |
| | 14,302 | | | ExxonMobil | | | 1,155 | |
| | 6,926 | | | Suncor Energy | | | 202 | |
| | 4,214 | | | Valero Energy | | | 284 | |
| | | | | | | | |
| | | | | | | 2,163 | |
| | | | | | | | |
| | Financials — 17.3% | |
| | 18,872 | | | Bank of America | | | 458 | |
| | 6,941 | | | BB&T | | | 315 | |
| | 1,304 | | | BlackRock | | | 551 | |
| | 5,207 | | | Chubb | | | 757 | |
| | 4,856 | | | CME Group | | | 608 | |
| | 16,412 | | | JPMorgan Chase | | | 1,500 | |
| | 8,986 | | | Marsh & McLennan | | | 700 | |
| | 4,224 | | | Northern Trust | | | 411 | |
| | 5,355 | | | PNC Financial Services Group | | | 669 | |
| | 3,844 | | | T Rowe Price Group | | | 285 | |
| | 8,818 | | | US Bancorp | | | 458 | |
| | 10,266 | | | Wells Fargo | | | 569 | |
| | | | | | | | |
| | | | | | | 7,281 | |
| | | | | | | | |
| | Health Care — 11.3% | |
| | 6,566 | | | AbbVie | | | 476 | |
| | 756 | | | Aetna | | | 115 | |
| | 3,122 | | | Bristol-Myers Squibb | | | 174 | |
| | 2,352 | | | Eli Lilly | | | 194 | |
| | 10,953 | | | Johnson & Johnson | | | 1,449 | |
| | 3,345 | | | Medtronic PLC | | | 297 | |
| | 15,468 | | | Merck | | | 991 | |
| | 24,168 | | | Pfizer | | | 812 | |
| | 1,378 | | | UnitedHealth Group | | | 255 | |
| | | | | | | | |
| | | | | | | 4,763 | |
| | | | | | | | |
| | | | |
| June 30, 2017 | | | | www.bishopstreetfunds.com |
3
| | | | |
| Dividend Value Fund | | | (unaudited) | |
Schedule of Investments
(continued)
| | | | | | | | |
Shares | | | | | Value
(000) | |
| | | | | | | | |
| | Industrials — 14.7% | | | | |
| | 2,856 | | | 3M | | $ | 595 | |
| | 1,418 | | | Boeing | | | 280 | |
| | 1,933 | | | Cummins | | | 314 | |
| | 4,436 | | | General Dynamics | | | 879 | |
| | 6,704 | | | Honeywell International | | | 894 | |
| | 4,090 | | | Ingersoll-Rand PLC | | | 374 | |
| | 2,979 | | | Lockheed Martin | | | 827 | |
| | 2,124 | | | Parker Hannifin | | | 339 | |
| | 2,401 | | | Stanley Black & Decker | | | 338 | |
| | 6,276 | | | Union Pacific | | | 683 | |
| | 2,021 | | | United Technologies | | | 247 | |
| | 5,553 | | | Waste Management | | | 407 | |
| | | | | | | | |
| | | | | | | 6,177 | |
| | | | | | | | |
| | Information Technology — 15.1% | | | | |
| | 8,354 | | | Apple | | | 1,203 | |
| | 4,985 | | | Automatic Data Processing | | | 511 | |
| | 2,598 | | | Broadcom | | | 605 | |
| | 23,758 | | | Cisco Systems | | | 744 | |
| | 11,644 | | | Intel | | | 393 | |
| | 3,463 | | | Lam Research | | | 490 | |
| | 27,310 | | | Microsoft | | | 1,882 | |
| | 6,694 | | | Texas Instruments | | | 515 | |
| | | | | | | | |
| | | | | | | 6,343 | |
| | | | | | | | |
| | Materials — 2.2% | | | | |
| | 6,523 | | | Dow Chemical | | | 411 | |
| | 1,894 | | | International Paper | | | 107 | |
| | 1,961 | | | LyondellBasell Industries NV, Cl A | | | 166 | |
| | 4,639 | | | Sonoco Products | | | 238 | |
| | | | | | | | |
| | | | | | | 922 | |
| | | | | | | | |
| | Real Estate — 3.3% | | | | |
| | 983 | | | American Tower ‡ | | | 130 | |
| | 440 | | | AvalonBay Communities ‡ | | | 84 | |
| | 1,561 | | | Crown Castle International ‡ | | | 156 | |
| | 2,114 | | | Digital Realty Trust ‡ | | | 239 | |
| | 5,000 | | | Duke Realty ‡ | | | 140 | |
| | 1,364 | | | Equity LifeStyle Properties ‡ | | | 118 | |
| | 598 | | | Essex Property Trust ‡ | | | 154 | |
| | 1,798 | | | Public Storage ‡ | | | 375 | |
| | | | | | | | |
| | | | | | | 1,396 | |
| | | | | | | | |
4
| | | | |
| Dividend Value Fund | | | (unaudited) | |
Schedule of Investments
(concluded)
| | | | | | | | |
Shares | | | | | Value
(000) | |
| | | | | | | | |
| | Telecommunication Services — 1.9% | | | | |
| | 21,646 | | | AT&T | | $ | 817 | |
| | | | | | | | |
| | Utilities — 4.8% | | | | |
| | 3,656 | | | American Electric Power | | | 254 | |
| | 6,546 | | | CMS Energy | | | 303 | |
| | 2,870 | | | Dominion Resources | | | 220 | |
| | 4,249 | | | Eversource Energy | | | 258 | |
| | 2,129 | | | NextEra Energy | | | 298 | |
| | 3,468 | | | PG&E | | | 230 | |
| | 1,779 | | | Sempra Energy | | | 200 | |
| | 4,234 | | | WEC Energy Group | | | 260 | |
| | | | | | | | |
| | | | | | | 2,023 | |
| | | | | | | | |
| | TOTAL COMMON STOCK (Cost $26,961) | | | 40,789 | |
| | | | | | | | |
|
| | PREFERRED STOCK — 0.2% | |
| | Energy — 0.2% | | | | |
| | 1,186 | | | Hess, 8.00%* (Cost $67) | | | 66 | |
| | | | | | | | |
|
| | CASH EQUIVALENT — 2.6% | |
| | 1,117,948 | | | BlackRock FedFund, Institutional Shares, 0.860% (A) (Cost $1,118) | | | 1,118 | |
| | | | | | | | |
| | TOTAL INVESTMENTS (Cost $28,146) — 99.7% | | $ | 41,973 | |
| | | | | | | | |
Percentages are based on Net Assets of $42,104 (000).
| ‡ | Real Estate Investment Trust |
| * | Non-income producing security. |
(A) The rate reported is the 7-day effective yield as of June 30, 2017.
Cl — Class
PLC — Public Limited Company
Cost figures are shown in thousands.
The accompanying notes are an integral part of the financial statements.
| | | | |
| June 30, 2017 | | | | www.bishopstreetfunds.com |
5
| | | | |
| High Grade Income Fund | | | (unaudited) | |
Top Ten Holdings†
| | | | | | | | | | | | | | | | |
| | | | | | Coupon
Rate | | | Maturity
Date | | | Percentage of
Investments | |
| |
| | 1. | | | U.S. Treasury Bond | | | 4.500% | | | | 08/15/39 | | | | 2.6% | |
| |
| | 2. | | | FHLMC, Ser 2011-3970, Cl KC | | | 3.500% | | | | 03/15/33 | | | | 2.5% | |
| |
| | 3. | | | U.S. Treasury Bond | | | 3.625% | | | | 08/15/43 | | | | 1.9% | |
| |
| | 4. | | | FHLB | | | 4.125% | | | | 03/13/20 | | | | 1.7% | |
| |
| | 5. | | | MetLife | | | 6.817% | | | | 08/15/18 | | | | 1.7% | |
| |
| | 6. | | | U.S. Treasury Bond | | | 6.000% | | | | 02/15/26 | | | | 1.7% | |
| |
| | 7. | | | Home Depot | | | 5.875% | | | | 12/16/36 | | | | 1.5% | |
| |
| | 8. | | | U.S. Treasury Bond | | | 2.250% | | | | 08/15/46 | | | | 1.4% | |
| |
| | 9. | | | International Business Machines | | | 8.375% | | | | 11/01/19 | | | | 1.3% | |
| |
| | 10. | | | Merck Sharp & Dohme | | | 5.000% | | | | 06/30/19 | | | | 1.3% | |
| † | | Percentages based on total investments. Top ten holdings do not include short-term investments. |
Schedule of Investments
| | | | | | | | |
Face
Amount
(000) | | | | | Value
(000) | |
| | | | | | | | |
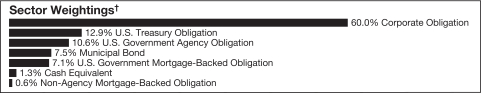
| | CORPORATE OBLIGATIONS — 59.8% | |
| | Consumer Discretionary — 10.1% | | | | |
| | | | Amazon.com | | | | |
| $ | 650 | | | 4.800%, 12/05/34 | | $ | 748 | |
| | | | Anheuser-Busch InBev Worldwide | | | | |
| | 350 | | | 7.750%, 01/15/19 | | | 381 | |
| | | | CBS | | | | |
| | 500 | | | 3.500%, 01/15/25 | | | 507 | |
| | | | Comcast | | | | |
| | 500 | | | 3.600%, 03/01/24 | | | 525 | |
| | 350 | | | 3.150%, 03/01/26 | | | 352 | |
| | | | DIRECTV Holdings LLC | | | | |
| | 275 | | | 3.800%, 03/15/22 | | | 284 | |
| | | | Discovery Communications LLC | | | | |
| | 425 | | | 3.250%, 04/01/23 | | | 419 | |
| | | | | | | | |
6
| | | | |
| High Grade Income Fund | | | (unaudited) | |
Schedule of Investments
(continued)
| | | | | | | | |
Face
Amount
(000) | | | | | Value
(000) | |
| | Consumer Discretionary — (continued) | | | | |
| | | | George Washington University | | | | |
| $ | 225 | | | 4.363%, 09/15/43 | | $ | 229 | |
| | | | | | | | |
| | | | Home Depot | | | | |
| | 700 | | | 5.875%, 12/16/36 | | | 912 | |
| | | | McDonald’s MTN | | | | |
| | 500 | | | 4.600%, 05/26/45 | | | 539 | |
| | | | Starbucks | | | | |
| | 495 | | | 2.450%, 06/15/26 | | | 477 | |
| | | | Target | | | | |
| | 525 | | | 2.300%, 06/26/19 | | | 531 | |
| | | | Walt Disney MTN | | | | |
| | 425 | | | 1.850%, 07/30/26 | | | 387 | |
| | | | | | | | |
| | | | | | | 6,291 | |
| | | | | | | | |
| | Consumer Staples — 5.2% | | | | |
| | | | Campbell Soup | | | | |
| | 500 | | | 4.250%, 04/15/21 | | | 532 | |
| | | | Coca-Cola | | | | |
| | 250 | | | 2.875%, 10/27/25 | | | 252 | |
| | 200 | | | 2.450%, 11/01/20 | | | 203 | |
| | | | Colgate-Palmolive MTN | | | | |
| | 500 | | | 1.950%, 02/01/23 | | | 488 | |
| | | | CVS Health | | | | |
| | 500 | | | 2.875%, 06/01/26 | | | 485 | |
| | | | Hershey | | | | |
| | 250 | | | 2.625%, 05/01/23 | | | 254 | |
| | | | Kellogg | | | | |
| | 250 | | | 3.250%, 04/01/26 | | | 250 | |
| | | | Unilever Capital | | | | |
| | 375 | | | 2.100%, 07/30/20 | | | 376 | |
| | | | Walgreens Boots Alliance | | | | |
| | 400 | | | 3.300%, 11/18/21 | | | 412 | |
| | | | | | | | |
| | | | | | | 3,252 | |
| | | | | | | | |
| | Energy — 4.4% | | | | |
| | | | BP Capital Markets PLC | | | | |
| | 500 | | | 3.814%, 02/10/24 | | | 521 | |
| | | | ConocoPhillips | | | | |
| | 450 | | | 3.350%, 11/15/24 | | | 459 | |
| | | | Kinder Morgan Energy Partners LP | | | | |
| | 450 | | | 4.300%, 05/01/24 | | | 465 | |
| | | | Occidental Petroleum | | | | |
| | 400 | | | 2.700%, 02/15/23 | | | 400 | |
| | | | | | | | |
| | | | Schlumberger Investment SA | | | | |
| | 400 | | | 3.650%, 12/01/23 | | | 421 | |
| | | | |
| June 30, 2017 | | | | www.bishopstreetfunds.com |
7
| | | | |
| High Grade Income Fund | | | (unaudited) | |
Schedule of Investments
(continued)
| | | | | | | | |
Face
Amount
(000) | | | | | Value
(000) | |
| | Energy — (continued) | | | | |
| | | | Shell International Finance BV | | | | |
| $ | 500 | | | 1.875%, 05/10/21 | | $ | 494 | |
| | | | | | | | |
| | | | | | | 2,760 | |
| | | | | | | | |
| | Financials — 16.0% | | | | |
| | | | Aflac | | | | |
| | 600 | | | 3.625%, 11/15/24 | | | 628 | |
| | | | Aon PLC | | | | |
| | 440 | | | 4.450%, 05/24/43 | | | 444 | |
| | | | Bank of America MTN | | | | |
| | 575 | | | 4.000%, 04/01/24 | | | 602 | |
| | | | Bank of New York Mellon MTN | | | | |
| | 500 | | | 4.150%, 02/01/21 | | | 532 | |
| | | | Citigroup | | | | |
| | 450 | | | 3.875%, 10/25/23 | | | 470 | |
| | | | Discover Bank | | | | |
| | 600 | | | 4.200%, 08/08/23 | | | 631 | |
| | | | Goldman Sachs Group MTN | | | | |
| | 500 | | | 7.500%, 02/15/19 | | | 542 | |
| | 800 | | | 2.486%, 11/23/24 (A) | | | 796 | |
| | | | JPMorgan Chase | | | | |
| | 250 | | | 6.400%, 05/15/38 | | | 335 | |
| | 600 | | | 2.250%, 01/23/20 | | | 602 | |
| | | | Lincoln National | | | | |
| | 500 | | | 8.750%, 07/01/19 | | | 562 | |
| | | | MetLife | | | | |
| | 1,000 | | | 6.817%, 08/15/18 | | | 1,056 | |
| | | | Morgan Stanley MTN | | | | |
| | 250 | | | 3.702%, 08/31/17 (A) | | | 249 | |
| | | | MUFG Americas Holdings | | | | |
| | 250 | | | 2.250%, 02/10/20 | | | 250 | |
| | | | Prudential Financial MTN | | | | |
| | 320 | | | 7.375%, 06/15/19 | | | 353 | |
| | | | Royal Bank of Canada MTN | | | | |
| | 400 | | | 2.150%, 03/06/20 | | | 401 | |
| | 300 | | | 1.500%, 07/29/19 | | | 298 | |
| | | | State Street | | | | |
| | 425 | | | 4.956%, 03/15/18 | | | 434 | |
| | | | US Bancorp MTN | | | | |
| | 500 | | | 3.000%, 03/15/22 | | | 513 | |
| | | | Wells Fargo | | | | |
| | 300 | | | 2.150%, 01/15/19 | | | 301 | |
| | | | | | | | |
| | | | | | | 9,999 | |
| | | | | | | | |
8
| | | | |
| High Grade Income Fund | | | (unaudited) | |
Schedule of Investments
(continued)
| | | | | | | | |
Face
Amount
(000) | | | | | Value
(000) | |
| | | | | | | | |
| | Health Care — 4.8% | | | | |
| | | | AbbVie | | | | |
| $ | 500 | | | 2.900%, 11/06/22 | | $ | 505 | |
| | | | Amgen | | | | |
| | 350 | | | 5.700%, 02/01/19 | | | 371 | |
| | 150 | | | 4.950%, 10/01/41 | | | 162 | |
| | | | Celgene | | | | |
| | 450 | | | 3.875%, 08/15/25 | | | 470 | |
| | | | Gilead Sciences | | | | |
| | 650 | | | 4.500%, 04/01/21 | | | 701 | |
| | | | Merck Sharp & Dohme | | | | |
| | 750 | | | 5.000%, 06/30/19 | | | 797 | |
| | | | | | | | |
| | | | | | | 3,006 | |
| | | | | | | | |
| | Industrials — 6.0% | | | | |
| | | | Caterpillar | | | | |
| | 500 | | | 7.900%, 12/15/18 | | | 544 | |
| | | | FedEx | | | | |
| | 425 | | | 2.625%, 08/01/22 | | | 427 | |
| | | | General Electric MTN | | | | |
| | 500 | | | 2.246%, 03/15/23 (A) | | | 514 | |
| | | | Johnson Controls International PLC | | | | |
| | 250 | | | 4.250%, 03/01/21 | | | 265 | |
| | | | Norfolk Southern | | | | |
| | 450 | | | 2.900%, 06/15/26 | | | 443 | |
| | | | Northrop Grumman | | | | |
| | 500 | | | 4.750%, 06/01/43 | | | 563 | |
| | | | Raytheon | | | | |
| | 475 | | | 2.500%, 12/15/22 | | | 477 | |
| | | | United Technologies | | | | |
| | 500 | | | 3.100%, 06/01/22 | | | 518 | |
| | | | | | | | |
| | | | | | | 3,751 | |
| | | | | | | | |
| | Information Technology — 7.6% | | | | |
| | | | Apple | | | | |
| | 725 | | | 2.850%, 05/06/21 | | | 745 | |
| | | | Applied Materials | | | | |
| | 600 | | | 3.900%, 10/01/25 | | | 639 | |
| | | | Intel | | | | |
| | 500 | | | 3.300%, 10/01/21 | | | 523 | |
| | | | International Business Machines | | | | |
| | 700 | | | 8.375%, 11/01/19 | | | 803 | |
| | | | Juniper Networks | | | | |
| | 410 | | | 4.500%, 03/15/24 | | | 436 | |
| | | | |
| June 30, 2017 | | | | www.bishopstreetfunds.com |
9
| | | | |
| High Grade Income Fund | | | (unaudited) | |
Schedule of Investments
(continued)
| | | | | | | | |
Face
Amount
(000) | | | | | Value
(000) | |
| | | | | | | | |
| | Information Technology — (continued) | | | | |
| | | | Microsoft | | | | |
| $ | 500 | | | 3.625%, 12/15/23 | | $ | 530 | |
| | | | NetApp | | | | |
| | 550 | | | 3.375%, 06/15/21 | | | 564 | |
| | | | Texas Instruments | | | | |
| | 500 | | | 1.000%, 05/01/18 | | | 498 | |
| | | | | | | | |
| | | | | | | 4,738 | |
| | | | | | | | |
| | Materials — 2.3% | | | | |
| | | | Mosaic | | | | |
| | 400 | | | 5.625%, 11/15/43 | | | 408 | |
| | | | Praxair | | | | |
| | 500 | | | 2.200%, 08/15/22 | | | 495 | |
| | | | Sherwin-Williams | | | | |
| | 500 | | | 3.125%, 06/01/24 | | | 503 | |
| | | | | | | | |
| | | | | | | 1,406 | |
| | | | | | | | |
| | Telecommunication Services — 0.8% | | | | |
| | | | Ameritech Capital Funding | | | | |
| | 425 | | | 6.875%, 10/15/27 | | | 497 | |
| | | | | | | | |
| | Transportation — 0.9% | | | | |
| | | | Burlington Northern Santa Fe LLC | | | | |
| | 500 | | | 4.450%, 03/15/43 | | | 543 | |
| | | | | | | | |
| | Utilities — 1.7% | | | | |
| | | | Berkshire Hathaway Energy | | | | |
| | 475 | | | 6.125%, 04/01/36 | | | 610 | |
| | | | Xcel Energy | | | | |
| | 425 | | | 3.300%, 06/01/25 | | | 429 | |
| | | | | | | | |
| | | | | | | 1,039 | |
| | | | | | | | |
| | TOTAL CORPORATE OBLIGATIONS (Cost $36,393) | | | 37,282 | |
| | | | | | | | |
|
| | U.S. TREASURY OBLIGATIONS — 12.8% | |
| | | | U.S. Treasury Bond | | | | |
| | 800 | | | 6.000%, 02/15/26 | | | 1,037 | |
| | 500 | | | 5.375%, 02/15/31 | | | 672 | |
| | 350 | | | 4.750%, 02/15/37 | | | 466 | |
| | 1,250 | | | 4.500%, 08/15/39 | | | 1,619 | |
| | 500 | | | 4.375%, 05/15/41 | | | 641 | |
| | 1,000 | | | 3.625%, 08/15/43 | | | 1,150 | |
| | 1,000 | | | 2.250%, 08/15/46 | | | 880 | |
10
| | | | |
| High Grade Income Fund | | | (unaudited) | |
Schedule of Investments
(continued)
| | | | | | | | |
Face
Amount
(000) | | | | | Value
(000) | |
| | | | | | | | |
| | U.S. TREASURY OBLIGATIONS — (continued) | |
| | | | U.S. Treasury Note | | | | |
| $ | 350 | | | 3.625%, 02/15/21 | | $ | 374 | |
| | 250 | | | 3.500%, 05/15/20 | | | 264 | |
| | 400 | | | 2.875%, 03/31/18 | | | 405 | |
| | 180 | | | 2.375%, 08/15/24 | | | 183 | |
| | 300 | | | 2.000%, 11/15/26 | | | 293 | |
| | | | | | | | |
| | TOTAL U.S. TREASURY OBLIGATIONS (Cost $7,600) | | | 7,984 | |
| | | | | | | | |
|
| | U.S. GOVERNMENT AGENCY OBLIGATIONS — 10.5% | |
| | | | FFCB | | | | |
| | 300 | | | 2.670%, 04/18/24 | | | 301 | |
| | 600 | | | 2.000%, 06/01/21 | | | 599 | |
| | 675 | | | 1.750%, 08/01/22 | | | 656 | |
| | 500 | | | 1.420%, 12/28/18 | | | 499 | |
| | 500 | | | 1.240%, 11/29/19 | | | 493 | |
| | | | FHLB | | | | |
| | 475 | | | 4.750%, 03/10/23 | | | 542 | |
| | 1,000 | | | 4.125%, 03/13/20 | | | 1,066 | |
| | 500 | | | 3.750%, 12/14/18 | | | 517 | |
| | | | FHLMC MTN | | | | |
| | 650 | | | 1.600%, 09/30/21 | | | 640 | |
| | 675 | | | 1.500%, 08/25/21 (B) | | | 667 | |
| | 600 | | | 1.500%, 05/25/22 (B) | | | 600 | |
| | | | | | | | |
| | TOTAL U.S. GOVERNMENT AGENCY OBLIGATIONS (Cost $6,574) | | | 6,580 | |
| | | | | | | | |
|
| | MUNICIPAL BONDS — 7.5% | |
| | Municipal — 7.5% | | | | |
| | | | California State, GO | | | | |
| | 560 | | | 6.509%, 04/01/39 | | | 647 | |
| | | | Clark County, School District, GO | | | | |
| | 200 | | | 5.510%, 06/15/24 | | | 221 | |
| | | | Hawaii State, Department of Budget & Finance, Pacific Health Project, Ser A, RB | | | | |
| | 500 | | | 5.500%, 07/01/43 | | | 562 | |
| | | | Houston, Independent School District, GO | | | | |
| | 250 | | | 6.125%, 02/15/28 | | | 266 | |
| | | | Hudson County, Improvement Authority, RB, AGM Insured | | | | |
| | 575 | | | 7.400%, 12/01/25 | | | 665 | |
| | | | Maryland State, Transportation Authority, RB | | | | |
| | 500 | | | 5.788%, 07/01/29 | | | 591 | |
| | | | Napa Valley, Unified School District, GO | | | | |
| | 225 | | | 6.507%, 08/01/43 | | | 307 | |
| | | | |
| June 30, 2017 | | | | www.bishopstreetfunds.com |
11
| | | | |
| High Grade Income Fund | | | (unaudited) | |
Schedule of Investments
(continued)
| | | | | | | | |
Face
Amount
(000) | | | | | Value
(000) | |
| | | | | | | | |
| | MUNICIPAL BONDS — (continued) | |
| | | | Oklahoma County, Finance Authority, RB | | | | |
| $ | 375 | | | 6.600%, 09/01/22 | | $ | 440 | |
| | | | Oklahoma, Development Finance Authority, RB | | | | |
| | 100 | | | 3.200%, 06/01/27 | | | 98 | |
| | | | San Antonio, Texas Water System Revenue, RB | | | | |
| | 250 | | | 5.502%, 05/15/29 | | | 296 | |
| | | | Stockton, Public Financing Authority, RB, BAM | | | | |
| | 500 | | | 7.942%, 10/01/38 | | | 559 | |
| | | | | | | | |
| | TOTAL MUNICIPAL BONDS (Cost $4,523) | | | 4,652 | |
| | | | | | | | |
|
| | U.S. GOVERNMENT MORTGAGE-BACKED OBLIGATIONS — 7.1% | |
| | | | FHLMC, Ser 2011-3970, Cl KC | | | | |
| | 1,500 | | | 3.500%, 03/15/33 | | | 1,559 | |
| | | | FHLMC, Ser 2015-4425, Cl BY | | | | |
| | 597 | | | 2.000%, 01/15/45 | | | 513 | |
| | | | FHLMC, Ser G12710 | | | | |
| | 76 | | | 5.500%, 07/01/22 | | | 79 | |
| | | | FNMA, Ser 2003-58, Cl D | | | | |
| | 48 | | | 3.500%, 07/25/33 | | | 49 | |
| | | | FNMA, Ser 2012-84, Cl JB | | | | |
| | 399 | | | 3.000%, 05/25/42 | | | 394 | |
| | | | FNMA, Ser 2013-92, Cl MT | | | | |
| | 58 | | | 4.000%, 07/25/41 | | | 62 | |
| | | | FNMA, Ser 889958 | | | | |
| | 36 | | | 5.000%, 10/01/23 | | | 38 | |
| | | | GNMA, Ser 2011-112, Cl JP | | | | |
| | 171 | | | 2.000%, 02/20/40 | | | 170 | |
| | | | GNMA, Ser 2012-101, Cl KL | | | | |
| | 711 | | | 2.000%, 09/20/41 | | | 669 | |
| | | | GNMA, Ser 2012-91, Cl QL | | | | |
| | 765 | | | 2.000%, 09/20/41 | | | 685 | |
| | | | GNMA, Ser 2013-4, Cl CN | | | | |
| | 220 | | | 2.000%, 10/16/42 | | | 218 | |
| | | | | | | | |
| | TOTAL U.S. GOVERNMENT MORTGAGE-BACKED OBLIGATIONS (Cost $4,406) | | | 4,436 | |
| | | | | | | | |
|
| | NON-AGENCY MORTGAGE-BACKED OBLIGATION — 0.6% | |
| | | | GSR Mortgage Loan Trust, Ser 2004-4, Cl 3A2 | | | | |
| | 414 | | | 2.600%, 04/25/32 (A) (Cost $380) | | | 390 | |
| | | | | | | | |
12
| | | | |
| High Grade Income Fund | | | (unaudited) | |
Schedule of Investments
(concluded)
| | | | | | | | |
Shares | | | | | Value
(000) | |
| | | | | | | | |
| | CASH EQUIVALENT — 1.3% | |
| | 831,689 | | | BlackRock FedFund, Institutional Shares, 0.860% (C) (Cost $832) | | $ | 832 | |
| | | | | | | | |
| | TOTAL INVESTMENTS (Cost $60,708) — 99.6% | | $ | 62,156 | |
| | | | | | | | |
Percentages are based on Net Assets of $62,382 (000).
| (A) | Floating Rate Security — The rate reflected on the Schedule of Investments is the rate in effect on June 30, 2017. The maturity date shown is the final maturity date. |
| (B) | Step Bond — The rate reflected on the Schedule of Investments is the effective yield on June 30, 2017. The coupon on a step bond changes on a specified date. |
| (C) | The rate reported is the 7-day effective yield as of June 30, 2017. |
AGM — Assured Guaranty Municipal Corp.
BAM — Build America Mutual
Cl — Class
FFCB — Federal Farm Credit Bank
FHLB — Federal Home Loan Bank
FHLMC — Federal Home Loan Mortgage Corporation
FNMA — Federal National Mortgage Corporation
GNMA — Government National Mortgage Corporation
GO — General Obligation
LLC — Limited Liability Corporation
LP — Limited Partnership
MTN — Medium Term Note
PLC — Public Limited Company
RB — Revenue Bond
Ser — Series
Cost figures are shown in thousands.
The accompanying notes are an integral part of the financial statements.
| | | | |
| June 30, 2017 | | | | www.bishopstreetfunds.com |
13
| | | | |
| Hawaii Municipal Bond Fund | | | (unaudited) | |
Top Ten Holdings†
| | | | | | | | | | | | | | | | |
| | | | | | Coupon
Rate | | | Maturity
Date | | | Percentage of
Investments | |
| |
| | 1. | | | Hawaii State, Department of Budget & Finance, Ser 2009 | | | 6.500% | | | | 07/01/39 | | | | 3.3% | |
| |
| | 2. | | | Hawaii State, Department of Transportation, Airports Division Lease Revenue, AMT | | | 5.000% | | | | 08/01/27 | | | | 3.1% | |
| |
| | 3. | | | Hawaii State, Department of Budget & Finance, Ser A | | | 5.000% | | | | 07/01/35 | | | | 3.0% | |
| |
| | 4. | | | Hawaii State, Department of Transportation, Airports Division Lease Revenue, AMT | | | 5.000% | | | | 08/01/21 | | | | 2.1% | |
| |
| | 5. | | | Hawaii State, Airport System Authority, Ser A | | | 5.250% | | | | 07/01/27 | | | | 2.1% | |
| |
| | 6. | | | Hawaii State, Ser FK | | | 5.000% | | | | 05/01/29 | | | | 1.8% | |
| |
| | 7. | | | Hawaii State, Airport System Authority, AMT | | | 5.000% | | | | 07/01/24 | | | | 1.6% | |
| |
| | 8. | | | Hawaii State, Department of Budget & Finance, Ser A | | | 5.000% | | | | 07/01/27 | | | | 1.6% | |
| |
| | 9. | | | Hawaii State, Housing Finance & Development, Rental Housing System, Ser B, AGM Insured | | | 6.500% | | | | 07/01/33 | | | | 1.6% | |
| |
| | 10. | | | Hawaii State, Department of Hawaiian Home Lands, Kapolei Office Facilities, Ser A, AGM Insured | | | 5.000% | | | | 11/01/31 | | | | 1.5% | |
| † | | Percentages based on total investments. Top ten holdings do not include short-term investments. |
14
| | | | |
| Hawaii Municipal Bond Fund | | | (unaudited) | |
Schedule of Investments
| | | | | | | | |
Face
Amount
(000) | | | | | Value
(000) | |
| | | | | | | | |
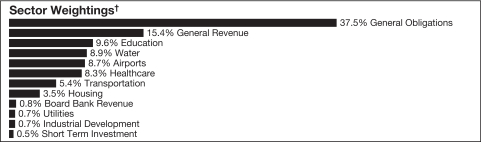
| | MUNICIPAL BONDS — 98.0% | |
| | Alabama — 0.2% | | | | |
| | | | Huntsville, Electric System Revenue, RB | | | | |
| $ | 225 | | | 5.250%, 12/01/29 | | $ | 260 | |
| | | | | | | | |
| | Alaska — 1.4% | | | | |
| | | | Alaska, Municipal Bond Bank Authority, Ser 3, RB, Bond Bank Moral Obligation Insured | | | | |
| | 1,000 | | | 5.000%, 09/01/22 | | | 1,134 | |
| | | | Alaska State, Housing Finance, State Capital Project, Ser A, RB | | | | |
| | 175 | | | 5.000%, 12/01/33 | | | 201 | |
| | | | Alaska State, Ser A, GO | | | | |
| | 525 | | | 5.000%, 08/01/34 | | | 598 | |
| | | | | | | | |
| | | | | | | 1,933 | |
| | | | | | | | |
| | California — 3.9% | | | | |
| | | | California State, GO | | | | |
| | 1,000 | | | 5.000%, 09/01/23 | | | 1,198 | |
| | 5 | | | 4.500%, 08/01/30 | | | 5 | |
| | | | Orange County, Water District, Ser A, RB | | | | |
| | 1,000 | | | 5.000%, 08/15/31 | | | 1,178 | |
| | | | Sacramento City, Unified School District, GO | | | | |
| | 500 | | | 5.000%, 07/01/23 | | | 598 | |
| | | | Sonoma County, Junior College District, GO | | | | |
| | 1,000 | | | 5.000%, 08/01/27 | | | 1,184 | |
| | | | University of California, Ser AF, RB | | | | |
| | 1,000 | | | 5.000%, 05/15/36 | | | 1,150 | |
| | | | | | | | |
| | | | | | | 5,313 | |
| | | | | | | | |
| | Florida — 1.0% | | | | |
| | | | Jacksonville, Sales Tax Revenue, Ser A, RB | | | | |
| | 1,000 | | | 5.000%, 10/01/29 | | | 1,145 | |
| | | | Miami-Dade County, School Board, Ser D, COP | | | | |
| | 150 | | | 5.000%, 02/01/27 | | | 179 | |
| | | | | | | | |
| | | | | | | 1,324 | |
| | | | | | | | |
| | Georgia — 0.4% | | | | |
| | | | Atlanta, Water & Wastewater Revenue, Ser A, RB, NATL Insured | | | | |
| | 450 | | | 5.500%, 11/01/27 | | | 558 | |
| | | | | | | | |
| | Hawaii — 83.4% | | | | |
| | | | Hawaii County, Ser A, GO | | | | |
| | 1,000 | | | 5.000%, 07/15/18, Pre-Refunded @ 100 (A) | | | 1,041 | |
| | | | |
| June 30, 2017 | | | | www.bishopstreetfunds.com |
15
| | | | |
| Hawaii Municipal Bond Fund | | | (unaudited) | |
Schedule of Investments
(continued)
| | | | | | | | |
Face
Amount
(000) | | | | | Value
(000) | |
| | | | | | | | |
| | Hawaii — (continued) | | | | |
| $ | 500 | | | 5.000%, 09/01/20 | | $ | 558 | |
| | 250 | | | 5.000%, 09/01/22(B) | | | 294 | |
| | 1,000 | | | 5.000%, 09/01/31 | | | 1,181 | |
| | 500 | | | 4.000%, 03/01/20, Pre-Refunded @ 100 (A) | | | 537 | |
| | 1,500 | | | 4.000%, 09/01/35 | | | 1,605 | |
| | | | Hawaii County, Ser B, GO | | | | |
| | 200 | | | 5.000%, 09/01/22 | | | 235 | |
| | | | Hawaii County, Ser D, GO | | | | |
| | 450 | | | 5.000%, 09/01/25 | | | 552 | |
| | | | Hawaii State, Airport System Authority, RB, AGM Insured | | | | |
| | 1,000 | | | 5.250%, 07/01/27 | | | 1,117 | |
| | | | Hawaii State, Airport System Authority, RB, AMT | | | | |
| | 2,000 | | | 5.000%, 07/01/24 | | | 2,218 | |
| | 1,000 | | | 4.125%, 07/01/24 | | | 1,065 | |
| | 250 | | | 3.000%, 07/01/17 | | | 250 | |
| | | | Hawaii State, Airport System Authority, Ser A, RB | | | | |
| | 250 | | | 5.250%, 07/01/23 | | | 279 | |
| | 2,500 | | | 5.250%, 07/01/27 | | | 2,789 | |
| | 1,000 | | | 5.250%, 07/01/28 | | | 1,115 | |
| | 900 | | | 5.250%, 07/01/30 | | | 1,003 | |
| | 1,500 | | | 5.000%, 07/01/45 | | | 1,682 | |
| | | | Hawaii State, Airports System Revenue, Ser A, RB | | | | |
| | 420 | | | 5.000%, 07/01/39 | | | 461 | |
| | | | Hawaii State, Department of Budget & Finance, Mid Pacific Institute, RB, AGC Insured | | | | |
| | 920 | | | 5.000%, 01/01/26 | | | 922 | |
| | | | Hawaii State, Department of Budget & Finance, Pacific Health Project, Ser A, RB | | | | |
| | 425 | | | 6.000%, 07/01/33 | | | 499 | |
| | 500 | | | 4.625%, 07/01/21 | | | 544 | |
| | | | Hawaii State, Department of Budget & Finance, Pacific Health Project, Ser B, RB | | | | |
| | 225 | | | 5.000%, 07/01/18 | | | 234 | |
| | | | Hawaii State, Department of Budget & Finance, RB | | | | |
| | 325 | | | 5.125%, 07/01/31 | | | 365 | |
| | 350 | | | 3.250%, 01/01/25 | | | 356 | |
| | | | Hawaii State, Department of Budget & Finance, RB, AMT | | | | |
| | 500 | | | 4.000%, 03/01/37 | | | 500 | |
| | | | Hawaii State, Department of Budget & Finance, Ser 2009, RB | | | | |
| | 4,100 | | | 6.500%, 07/01/39 | | | 4,428 | |
| | | | Hawaii State, Department of Budget & Finance, Ser A, RB | | | | |
| | 100 | | | 5.000%, 07/01/22 | | | 115 | |
16
| | | | |
| Hawaii Municipal Bond Fund | | | (unaudited) | |
Schedule of Investments
(continued)
| | | | | | | | |
Face
Amount
(000) | | | | | Value
(000) | |
| | | | | | | | |
| | Hawaii — (continued) | | | | |
| $ | 575 | | | 5.000%, 07/01/26 | | $ | 658 | |
| | 1,800 | | | 5.000%, 07/01/27 | | | 2,143 | |
| | 3,500 | | | 5.000%, 07/01/35 | | | 3,986 | |
| | 600 | | | 4.000%, 07/01/18 | | | 617 | |
| | | | Hawaii State, Department of Budget & Finance, Ser B, RB | | | | |
| | 775 | | | 5.000%, 07/01/28 | | | 878 | |
| | | | Hawaii State, Department of Hawaiian Home Lands, Kapolei Office Facilities, Ser A, COP, AGM Insured | | | | |
| | 2,000 | | | 5.000%, 11/01/31 | | | 2,005 | |
| | 110 | | | 4.250%, 11/01/26 | | | 110 | |
| | | | Hawaii State, Department of Transportation, Airports Division Lease Revenue, COP, AMT | | | | |
| | 1,000 | | | 5.250%, 08/01/25 | | | 1,158 | |
| | 2,525 | | | 5.000%, 08/01/21 | | | 2,858 | |
| | 3,675 | | | 5.000%, 08/01/27 | | | 4,143 | |
| | 1,000 | | | 5.000%, 08/01/28 | | | 1,119 | |
| | | | Hawaii State, Harbor System Revenue, Ser A, RB | | | | |
| | 100 | | | 5.000%, 07/01/25 | | | 110 | |
| | 1,125 | | | 4.250%, 07/01/21 | | | 1,209 | |
| | | | Hawaii State, Highway Authority, Ser A, RB | | | | |
| | 700 | | | 5.000%, 01/01/23 | | | 825 | |
| | 1,600 | | | 5.000%, 01/01/30 | | | 1,905 | |
| | 1,700 | | | 5.000%, 01/01/31 | | | 1,984 | |
| | 1,000 | | | 5.000%, 01/01/33 | | | 1,178 | |
| | | | Hawaii State, Housing Finance & Development, Kuhio Park Terrace Multi-Family Housing, Ser A, RB, FHLMC Insured | | | | |
| | 200 | | | 3.900%, 04/01/22 | | | 216 | |
| | 115 | | | 3.750%, 04/01/21 | | | 124 | |
| | 180 | | | 3.500%, 04/01/20 | | | 190 | |
| | | | Hawaii State, Housing Finance & Development, Rental Housing System, Ser B, RB, AGM Insured | | | | |
| �� | 2,000 | | | 6.500%, 07/01/33 | | | 2,134 | |
| | | | Hawaii State, Housing Finance & Development, Single-Family Housing, Ser B, RB, GNMA/FNMA/FHLMC Insured | | | | |
| | 465 | | | 3.450%, 01/01/22 | | | 493 | |
| | | | Hawaii State, Housing Finance & Development, Wilikina Apartments Project, Ser A, RB | | | | |
| | 1,000 | | | 5.000%, 05/01/34 | | | 1,009 | |
| | | | Hawaii State, Ser DQ, GO | | | | |
| | 35 | | | 5.000%, 06/01/19, Pre-Refunded @ 100 (A) | | | 38 | |
| | | | Hawaii State, Ser DR, GO | | | | |
| | 1,000 | | | 5.000%, 06/01/19 | | | 1,073 | |
| | | | |
| June 30, 2017 | | | | www.bishopstreetfunds.com |
17
| | | | |
| Hawaii Municipal Bond Fund | | | (unaudited) | |
Schedule of Investments
(continued)
| | | | | | | | |
Face
Amount
(000) | | | | | Value
(000) | |
| | | | | | | | |
| | Hawaii — (continued) | | | | |
| | | | Hawaii State, Ser DT, GO | | | | |
| $ | 270 | | | 5.000%, 11/01/19 | | $ | 294 | |
| | | | Hawaii State, Ser DY, GO | | | | |
| | 825 | | | 5.000%, 02/01/19 | | | 875 | |
| | | | Hawaii State, Ser DZ, GO | | | | |
| | 100 | | | 5.000%, 12/01/20 (D) | | | 112 | |
| | 1,895 | | | 5.000%, 12/01/21, Pre-Refunded @ 100 (A) | | | 2,189 | |
| | | | Hawaii State, Ser EA, GO | | | | |
| | 935 | | | 5.000%, 12/01/21 | | | 1,081 | |
| | 1,700 | | | 5.000%, 12/01/22 | | | 1,958 | |
| | | | Hawaii State, Ser EE-2017, GO | | | | |
| | 315 | | | 5.000%, 11/01/27 | | | 369 | |
| | 85 | | | 5.000%, 11/01/22, Pre-Refunded @ 100 (A) | | | 100 | |
| | | | Hawaii State, Ser EF, GO | | | | |
| | 500 | | | 5.000%, 11/01/22 | | | 590 | |
| | 300 | | | 5.000%, 11/01/23 | | | 354 | |
| | | | Hawaii State, Ser EH, GO | | | | |
| | 335 | | | 5.000%, 08/01/23 (B) | | | 400 | |
| | 285 | | | 5.000%, 08/01/23, Pre-Refunded @ 100 (A) | | | 340 | |
| | 365 | | | 5.000%, 08/01/24 | | | 436 | |
| | 855 | | | 5.000%, 08/01/30 | | | 1,003 | |
| | 195 | | | 5.000%, 08/01/32 | | | 228 | |
| | | | Hawaii State, Ser EH-2017, GO | | | | |
| | 85 | | | 5.000%, 08/01/23 (B) | | | 101 | |
| | 255 | | | 5.000%, 08/01/23 | | | 306 | |
| | | | Hawaii State, Ser EO, GO | | | | |
| | 150 | | | 5.000%, 08/01/24 | | | 182 | |
| | 1,000 | | | 5.000%, 08/01/29 | | | 1,178 | |
| | 1,000 | | | 5.000%, 08/01/30 | | | 1,174 | |
| | 1,000 | | | 5.000%, 08/01/33 | | | 1,161 | |
| | | | Hawaii State, Ser EP, GO | | | | |
| | 1,000 | | | 5.000%, 08/01/22 | | | 1,174 | |
| | 325 | | | 5.000%, 08/01/26 | | | 389 | |
| | | | Hawaii State, Ser ET, GO | | | | |
| | 300 | | | 5.000%, 10/01/24 | | | 365 | |
| | | | Hawaii State, Ser EY, GO | | | | |
| | 140 | | | 5.000%, 10/01/26 | | | 172 | |
| | 1,000 | | | 5.000%, 10/01/27 | | | 1,216 | |
| | | | Hawaii State, Ser FE, GO | | | | |
| | 285 | | | 5.000%, 10/01/27 | | | 352 | |
| | | | Hawaii State, Ser FK, GO | | | | |
| | 2,000 | | | 5.000%, 05/01/29 | | | 2,450 | |
18
| | | | |
| Hawaii Municipal Bond Fund | | | (unaudited) | |
Schedule of Investments
(continued)
| | | | | | | | |
Face
Amount
(000) | | | | | Value
(000) | |
| | | | | | | | |
| | Hawaii — (continued) | | | | |
| | | | Hawaii State, Ser FN, GO | | | | |
| $ | 1,000 | | | 5.000%, 10/01/23 | | $ | 1,200 | |
| | 500 | | | 5.000%, 10/01/24 | | | 609 | |
| | | | Honolulu Hawaii City & County, Board of Water Supply, Ser A, RB | | | | |
| | 1,050 | | | 5.000%, 07/01/19 | | | 1,129 | |
| | 875 | | | 5.000%, 07/01/23 | | | 1,019 | |
| | 400 | | | 5.000%, 07/01/24 | | | 485 | |
| | 600 | | | 5.000%, 07/01/27 | | | 720 | |
| | | | Honolulu Hawaii City & County, Ser A, GO | | | | |
| | 275 | | | 5.250%, 08/01/21, Pre-Refunded @ 100 (A) | | | 318 | |
| | 700 | | | 5.000%, 10/01/19 | | | 760 | |
| | 680 | | | 5.000%, 11/01/21 | | | 785 | |
| | 500 | | | 5.000%, 11/01/22 | | | 589 | |
| | 1,000 | | | 5.000%, 10/01/27 | | | 1,209 | |
| | 325 | | | 5.000%, 10/01/29 | | | 387 | |
| | 500 | | | 5.000%, 11/01/30 | | | 581 | |
| | 700 | | | 4.000%, 11/01/19 | | | 746 | |
| | 325 | | | 4.000%, 08/01/21, Pre-Refunded @ 100 (A) | | | 359 | |
| | | | Honolulu Hawaii City & County, Ser B, GO | | | | |
| | 250 | | | 5.000%, 12/01/18 | | | 264 | |
| | 375 | | | 5.000%, 08/01/21 | | | 430 | |
| | 350 | | | 5.000%, 08/01/22 | | | 400 | |
| | 1,200 | | | 5.000%, 11/01/24 | | | 1,408 | |
| | 300 | | | 5.000%, 08/01/26 | | | 342 | |
| | 1,525 | | | 5.000%, 10/01/26 | | | 1,859 | |
| | 500 | | | 4.000%, 10/01/19 | | | 531 | |
| | | | Honolulu Hawaii City & County, Ser B, GO, AGM Insured | | | | |
| | 100 | | | 5.250%, 07/01/19 | | | 108 | |
| | | | Honolulu Hawaii City & County, Ser C, GO | | | | |
| | 750 | | | 5.000%, 10/01/23 | | | 899 | |
| | 1,000 | | | 5.000%, 10/01/28 | | | 1,201 | |
| | | | Honolulu Hawaii City & County, Ser D, GO | | | | |
| | 400 | | | 5.250%, 09/01/19, Pre-Refunded @ 100 (A) | | | 435 | |
| | | | Honolulu Hawaii City & County, Ser Junior A, RB | | | | |
| | 450 | | | 4.000%, 07/01/25 | | | 483 | |
| | | | Honolulu Hawaii City & County, Wastewater System Authority, Ser A, RB | | | | |
| | 440 | | | 5.000%, 07/01/20 | | | 473 | |
| | 250 | | | 5.000%, 07/01/21, Pre-Refunded @ 100 (A) | | | 286 | |
| | 100 | | | 5.000%, 07/01/22, Pre-Refunded @ 100 (A) | | | 117 | |
| | 1,500 | | | 5.000%, 07/01/24 | | | 1,804 | |
| | 500 | | | 5.000%, 07/01/38 | | | 562 | |
| | | | |
| June 30, 2017 | | | | www.bishopstreetfunds.com |
19
| | | | |
| Hawaii Municipal Bond Fund | | | (unaudited) | |
Schedule of Investments
(continued)
| | | | | | | | |
Face
Amount
(000) | | | | | Value
(000) | |
| | | | | | | | |
| | Hawaii — (continued) | | | | |
| | | | Honolulu Hawaii City & County, Wastewater System Authority, Ser B, RB | | | | |
| $ | 1,575 | | | 5.000%, 07/01/23 | | $ | 1,875 | |
| | 200 | | | 4.000%, 07/01/21 | | | 220 | |
| | | | Honolulu Hawaii City & County, Wastewater System Authority, Ser S, RB | | | | |
| | 650 | | | 5.000%, 07/01/22 | | | 759 | |
| | | | Honolulu Hawaii City & County, Wastewater System Revenue, Ser B, RB | | | | |
| | 125 | | | 5.000%, 07/01/20 | | | 139 | |
| | | | Kauai County, Ser A, GO | | | | |
| | 250 | | | 5.000%, 08/01/21 | | | 286 | |
| | 150 | | | 5.000%, 08/01/23 | | | 175 | |
| | 250 | | | 4.000%, 08/01/24 | | | 278 | |
| | 250 | | | 3.250%, 08/01/23 | | | 264 | |
| | | | Kauai County, Ser A, GO, NATL FGIC Insured | | | | |
| | 415 | | | 5.000%, 08/01/21 | | | 416 | |
| | | | Maui County, GO | | | | |
| | 250 | | | 5.000%, 06/01/20 | | | 277 | |
| | 150 | | | 5.000%, 06/01/21 | | | 171 | |
| | | | Maui County, Ser B, GO | | | | |
| | 500 | | | 4.000%, 06/01/21 | | | 538 | |
| | | | University of Hawaii, RB | | | | |
| | 1,400 | | | 5.000%, 10/01/25 | | | 1,731 | |
| | 1,350 | | | 5.000%, 10/01/32 | | | 1,606 | |
| | | | University of Hawaii, Ser A, RB | | | | |
| | 100 | | | 6.000%, 10/01/38 | | | 111 | |
| | | | University of Hawaii, Ser A, RB, NATL Insured | | | | |
| | 350 | | | 3.500%, 07/15/28 | | | 350 | |
| | | | University of Hawaii, Ser A-2, RB | | | | |
| | 1,030 | | | 4.000%, 10/01/18 | | | 1,067 | |
| | | | University of Hawaii, Ser B, RB | | | | |
| | 1,500 | | | 5.000%, 10/01/34 | | | 1,752 | |
| | 1,000 | | | 4.000%, 10/01/23 | | | 1,144 | |
| | | | | | | | |
| | | | | | | 114,314 | |
| | | | | | | | |
| | Indiana — 0.1% | | | | |
| | | | Indiana State, Housing & Community Development Authority, Ser C, RB, GNMA/FNMA/FHLMC Insured | | | | |
| | 70 | | | 4.100%, 06/01/27 | | | 73 | |
| | | | | | | | |
| | Maine — 0.6% | | | | |
| | | | Maine State, Health & Higher Educational Facilities Authority, Ser A, RB | | | | |
| | 750 | | | 5.250%, 07/01/31 | | | 827 | |
| | | | | | | | |
20
| | | | |
| Hawaii Municipal Bond Fund | | | (unaudited) | |
Schedule of Investments
(continued)
| | | | | | | | |
Face
Amount
(000) | | | | | Value
(000) | |
| | | | | | | | |
| | Maryland — 0.5% | | | | |
| | | | Maryland State, GO | | | | |
| $ | 575 | | | 5.000%, 03/01/22 | | $ | 631 | |
| | | | | | | | |
| | New York — 1.2% | | | | |
| | | | New York City, Trust for Cultural Resources, Ser S, RB | | | | |
| | 1,000 | | | 5.000%, 07/01/41 | | | 1,142 | |
| | | | New York, Ser H, GO | | | | |
| | 500 | | | 5.000%, 08/01/20 | | | 557 | |
| | | | | | | | |
| | | | | | | 1,699 | |
| | | | | | | | |
| | Ohio — 1.1% | | | | |
| | | | Akron, Income Tax Revenue, RB | | | | |
| | 1,000 | | | 5.000%, 12/01/33 | | | 1,148 | |
| | | | Ohio State, Ser 2011-B, GO | | | | |
| | 300 | | | 5.000%, 08/01/22 | | | 352 | |
| | | | | | | | |
| | | | | | | 1,500 | |
| | | | | | | | |
| | Oklahoma — 0.5% | | | | |
| | | | Oklahoma City, Water Utilities Trust, RB | | | | |
| | 125 | | | 5.000%, 07/01/40 | | | 141 | |
| | | | Tulsa County, Industrial Authority, RB | | | | |
| | 500 | | | 5.000%, 09/01/26 | | | 598 | |
| | | | | | | | |
| | | | | | | 739 | |
| | | | | | | | |
| | Tennessee — 0.4% | | | | |
| | | | Memphis, Ser A, GO | | | | |
| | 500 | | | 5.000%, 04/01/26 | | | 608 | |
| | | | | | | | |
| | Texas — 2.2% | | | | |
| | | | Arlington, Higher Education Finance, Ser 2014-A, RB, PSF-GTD Insured | | | | |
| | 750 | | | 5.000%, 08/15/27 | | | 881 | |
| | | | City of Mesquite, GO | | | | |
| | 1,000 | | | 5.000%, 02/15/27 | | | 1,192 | |
| | | | Clifton, Higher Education Finance, Ser 2014, RB, PSF-GTD Insured | | | | |
| | 500 | | | 5.000%, 08/15/26 | | | 586 | |
| | | | Midland County, Fresh Water Supply District No. 1, Ser A, RB | | | | |
| | 1,000 | | | 4.789%, 09/15/37(C) | | | 405 | |
| | | | | | | | |
| | | | | | | 3,064 | |
| | | | | | | | |
| | Utah — 0.2% | | | | |
| | | | Central Utah, Water Conservancy District, Ser B, GO | | | | |
| | 200 | | | 5.250%, 04/01/23 | | | 228 | |
| | | | | | | | |
| | | | |
| June 30, 2017 | | | | www.bishopstreetfunds.com |
21
| | | | |
| Hawaii Municipal Bond Fund | | | (unaudited) | |
Schedule of Investments
(concluded)
| | | | | | | | |
Face
Amount
(000)/Shares | | | | | Value
(000) | |
| | | | | | | | |
| | Washington — 0.9% | | | | |
| | | | Port of Seattle Washington, Ser A, RB | | | | |
| $ | 750 | | | 5.000%, 08/01/26 | | $ | 871 | |
| | | | Washington State, Housing Finance Commission, RB | | | | |
| | 300 | | | 4.750%, 07/15/29 | | | 331 | |
| | | | | | | | |
| | | | | | | 1,202 | |
| | | | | | | | |
| | TOTAL MUNICIPAL BONDS (Cost $132,114) | | | 134,273 | |
| | | | | | | | |
|
| | CASH EQUIVALENT — 0.5% | |
| | 713,904 | | | BlackRock FedFund, Institutional Shares, 0.860% (D) (Cost $714) | | | 714 | |
| | | | | | | | |
| | TOTAL INVESTMENTS (Cost $132,828) — 98.5% | | $ | 134,987 | |
| | | | | | | | |
Percentages are based on Net Assets of $137,016 (000).
| (A) | Pre-Refunded Security — The maturity date shown is the pre-refunded date. |
| (B) | Security is escrowed to maturity. |
| (C) | Zero coupon security. The rate reported on the Schedule of Investments is the effective yield at time of purchase. |
| (D) | The rate reported is the 7-day effective yield as of June 30, 2017. |
AGC — American Guarantee Corporation
AGM — Assured Guaranty Municipal Corp.
AMT — Alternative Minimum Tax
COP — Certificate of Participation
FGIC — Financial Guarantee Insurance Corporation
FHLMC — Federal Home Loan Mortgage Corporation
FNMA — Federal National Mortgage Corporation
GNMA — Government National Mortgage Corporation
GO — General Obligation
NATL — National Public Finance Guarantee Corporation
PSF-GTD — Guaranteed by Permanent School Fund
RB — Revenue Bond
Ser — Series
Cost figures are shown in thousands.
The accompanying notes are an integral part of the financial statements.
22
| | | | |
| Short-Duration Bond Fund | | | (unaudited) | |
Top Ten Holdings†
| | | | | | | | | | | | | | | | |
| | | | | | Coupon
Rate | | | Maturity
Date | | | Percentage of
Investments | |
| |
| | 1. | | | FHLMC | | | 1.250% | | | | 08/01/19 | | | | 8.4% | |
| |
| | 2. | | | U.S. Treasury Note | | | 0.875% | | | | 05/15/19 | | | | 7.8% | |
| |
| | 3. | | | FHLMC | | | 0.750% | | | | 04/09/18 | | | | 7.5% | |
| |
| | 4. | | | U.S. Treasury Note | | | 1.500% | | | | 05/15/20 | | | | 5.9% | |
| |
| | 5. | | | FHLB | | | 1.375% | | | | 11/15/19 | | | | 5.0% | |
| |
| | 6. | | | U.S. Treasury Note | | | 1.250% | | | | 12/31/18 | | | | 4.3% | |
| |
| | 7. | | | FHLB | | | 1.375% | | | | 03/18/19 | | | | 3.9% | |
| |
| | 8. | | | U.S. Treasury Note | | | 1.375% | | | | 12/15/19 | | | | 3.8% | |
| |
| | 9. | | | U.S. Treasury Note | | | 0.750% | | | | 08/31/18 | | | | 2.0% | |
| |
| | 10. | | | FNMA | | | 4.000% | | | | 07/01/29 | | | | 1.9% | |
| † | | Percentages based on total investments. Top ten holdings do not include short-term investments. |
Schedule of Investments
| | | | | | | | |
Face
Amount
(000) | | | | | Value
(000) | |
| | | | | | | | |
| | U.S. GOVERNMENT AGENCY OBLIGATIONS — 42.6% | |
| | | | FHLB | | | | |
| $ | 465 | | | 1.375%, 03/18/19 | | $ | 465 | |
| | 595 | | | 1.375%, 11/15/19 | | | 593 | |
| | | | FHLMC | | | | |
| | 168 | | | 6.000%, 01/01/24 | | | 177 | |
| | 40 | | | 5.500%, 04/01/19 | | | 41 | |
| | 163 | | | 5.000%, 06/01/20 | | | 169 | |
| | 102 | | | 5.000%, 01/01/24 | | | 108 | |
| | 35 | | | 4.500%, 09/01/20 | | | 35 | |
| | 84 | | | 4.500%, 05/01/25 | | | 89 | |
| | 39 | | | 4.000%, 08/01/18 | | | 41 | |
| | 191 | | | 4.000%, 03/01/25 | | | 200 | |
| | 129 | | | 4.000%, 08/01/25 | | | 137 | |
| | 82 | | | 2.500%, 06/01/24 | | | 84 | |
| | 1,010 | | | 1.250%, 08/01/19 | | | 1,005 | |
| | | | |
| June 30, 2017 | | | | www.bishopstreetfunds.com |
23
| | | | |
| Short-Duration Bond Fund | | | (unaudited) | |
Schedule of Investments
(continued)
| | | | | | | | |
Face
Amount
(000) | | | | | Value
(000) | |
| | | | | | | | |
| | U.S. GOVERNMENT AGENCY OBLIGATIONS — (continued) | |
| | | | FHLMC MTN | | | | |
| $ | 895 | | | 0.750%, 04/09/18 | | $ | 892 | |
| | | | FNMA | | | | |
| | 89 | | | 6.000%, 02/01/23 | | | 95 | |
| | 61 | | | 5.500%, 09/01/20 | | | 63 | |
| | 152 | | | 5.500%, 05/01/24 | | | 160 | |
| | 71 | | | 5.000%, 06/01/20 | | | 73 | |
| | 120 | | | 4.500%, 06/01/20 | | | 123 | |
| | 89 | | | 4.500%, 06/01/25 | | | 95 | |
| | 125 | | | 4.000%, 05/01/21 | | | 129 | |
| | 106 | | | 4.000%, 02/01/25 | | | 112 | |
| | 79 | | | 4.000%, 06/01/25 | | | 84 | |
| | 102 | | | 2.500%, 09/01/23 | | | 104 | |
| | | | | | | | |
| | TOTAL U.S. GOVERNMENT AGENCY OBLIGATIONS (Cost $5,085) | | | 5,074 | |
| | | | | | | | |
|
| | U.S. GOVERNMENT MORTGAGE-BACKED OBLIGATIONS — 31.3% | |
| | | | FHLMC | | | | |
| | 18 | | | 5.500%, 10/01/19 | | | 19 | |
| | 130 | | | 5.500%, 05/01/20 | | | 135 | |
| | 71 | | | 5.500%, 07/01/20 | | | 73 | |
| | 106 | | | 5.500%, 01/01/24 | | | 114 | |
| | 85 | | | 4.500%, 12/01/24 | | | 90 | |
| | 84 | | | 4.500%, 02/01/25 | | | 89 | |
| | 59 | | | 4.500%, 06/01/26 | | | 63 | |
| | 176 | | | 4.000%, 05/01/27 | | | 188 | |
| | | | FNMA | | | | |
| | 82 | | | 6.000%, 05/01/21 | | | 87 | |
| | 46 | | | 6.000%, 08/01/21 | | | 49 | |
| | 77 | | | 6.000%, 10/01/39 | | | 88 | |
| | 24 | | | 5.500%, 10/01/18 | | | 24 | |
| | 64 | | | 5.500%, 02/01/20 | | | 66 | |
| | 57 | | | 5.500%, 07/01/20 | | | 59 | |
| | 20 | | | 5.500%, 10/01/21 | | | 21 | |
| | 141 | | | 5.500%, 09/01/23 | | | 149 | |
| | 80 | | | 5.000%, 05/01/19 | | | 82 | |
| | 194 | | | 5.000%, 11/01/21 | | | 200 | |
| | 37 | | | 4.500%, 05/01/23 | | | 39 | |
| | 141 | | | 4.500%, 01/01/27 | | | 148 | |
| | 89 | | | 4.000%, 06/01/25 | | | 94 | |
| | 43 | | | 4.000%, 10/01/26 | | | 45 | |
| | 145 | | | 4.000%, 11/01/26 | | | 153 | |
24
| | | | |
| Short-Duration Bond Fund | | | (unaudited) | |
Schedule of Investments
(continued)
| | | | | | | | |
Face
Amount
(000)/Shares | | | | | Value
(000) | |
| | | | | | | | |
| | U.S. GOVERNMENT MORTGAGE-BACKED OBLIGATIONS — (continued) | |
| $ | 74 | | | 4.000%, 02/01/29 | | $ | 78 | |
| | 215 | | | 4.000%, 07/01/29 | | | 227 | |
| | 161 | | | 3.557%, 06/01/35 (A) | | | 171 | |
| | 198 | | | 3.500%, 05/01/27 | | | 206 | |
| | 91 | | | 3.500%, 07/01/27 | | | 94 | |
| | 157 | | | 3.500%, 08/01/28 | | | 164 | |
| | 88 | | | 3.250%, 10/01/38 (A) | | | 92 | |
| | 195 | | | 3.155%, 12/01/36 (A) | | | 206 | |
| | 86 | | | 2.000%, 08/01/23 | | | 85 | |
| | 34 | | | 2.000%, 09/01/23 | | | 34 | |
| | | | GNMA | | | | |
| | 121 | | | 4.000%, 05/15/25 | | | 127 | |
| | 158 | | | 4.000%, 05/15/26 | | | 165 | |
| | | | | | | | |
| | TOTAL U.S. GOVERNMENT MORTGAGE-BACKED OBLIGATIONS (Cost $3,756) | | | 3,724 | |
| | | | | | | | |
|
| | U.S. TREASURY OBLIGATIONS — 24.8% | |
| | | | U.S. Treasury Note | | | | |
| | 700 | | | 1.500%, 05/15/20 | | | 699 | |
| | 455 | | | 1.375%, 12/15/19 | | | 454 | |
| | 515 | | | 1.250%, 12/31/18 | | | 514 | |
| | 940 | | | 0.875%, 05/15/19 | | | 932 | |
| | 240 | | | 0.750%, 08/31/18 | | | 238 | |
| | 125 | | | 0.750%, 08/15/19 | | | 123 | |
| | | | | | | | |
| | TOTAL U.S. TREASURY OBLIGATIONS (Cost $2,968) | | | 2,960 | |
| | | | | | | | |
|
| | CASH EQUIVALENT — 1.3% | |
| | 150,687 | | | BlackRock FedFund, Institutional Shares, 0.860% (B) (Cost $151) | | | 151 | |
| | | | | | | | |
| | TOTAL INVESTMENTS (Cost $11,960) — 100.0% | | $ | 11,909 | |
| | | | | | | | |
Percentages are based on Net Assets of $11,907 (000).
| (A) | Floating Rate Security — The rate reflected on the Schedule of Investments is the rate in effect on June 30, 2017. The maturity date shown is the final maturity date. |
| (B) | The rate reported is the 7-day effective yield as of June 30, 2017. |
| | | | |
| June 30, 2017 | | | | www.bishopstreetfunds.com |
25
| | | | |
| Short-Duration Bond Fund | | | (unaudited) | |
Schedule of Investments
(concluded)
FHLB — Federal Home Loan Bank
FHLMC — Federal Home Loan Mortgage Corporation
FNMA — Federal National Mortgage Corporation
GNMA — Government National Mortgage Corporation
MTN — Medium Term Note
Cost figures are shown in thousands.
The accompanying notes are an integral part of the financial statements.
26
| | | | |
| Bishop Street Funds | | | (unaudited) | |
Statements of Assets and Liabilities (000)
June 30, 2017
| | | | | | | | |
| | | Dividend
Value
Fund | | | High
Grade
Income
Fund | |
Assets: | | | | | | | | |
Investments, at Cost | | $ | 28,146 | | | $ | 60,708 | |
| |
Investments, at Value | | $ | 41,973 | | | $ | 62,156 | |
Receivable for Investment Securities Sold | | | 651 | | | | — | |
Dividends and Interest Receivable | | | 50 | | | | 523 | |
Reclaim Receivable | | | 1 | | | | 2 | |
Receivable for Fund Shares Sold | | | — | | | | 2 | |
Prepaid Expenses | | | 1 | | | | 6 | |
| |
Total Assets | | | 42,676 | | | | 62,689 | |
| |
Liabilities: | | | | | | | | |
Payable for Investment Securities Purchased | | | 511 | | | | 198 | |
Advisory Fees Payable | | | 20 | | | | 13 | |
Administrative Fees Payable | | | 5 | | | | 7 | |
Shareholder Servicing Fees Payable | | | 3 | | | | 5 | |
Chief Compliance Officer Fees Payable | | | 1 | | | | 1 | |
Income Distribution Payable | | | — | | | | 35 | |
Other Accrued Expenses Payable | | | 32 | | | | 48 | |
| |
Total Liabilities | | | 572 | | | | 307 | |
| |
Net Assets | | $ | 42,104 | | | $ | 62,382 | |
| |
Paid-in Capital | | $ | 26,585 | | | $ | 60,742 | |
Undistributed Net Investment Income | | | 2 | | | | 10 | |
Accumulated Net Realized Gain on Investments | | | 1,690 | | | | 182 | |
Net Unrealized Appreciation on Investments | | | 13,827 | | | | 1,448 | |
| |
Net Assets | | $ | 42,104 | | | $ | 62,382 | |
| |
Class I Shares: | | | | | | | | |
Net Assets | | $ | 42,104 | | | $ | 62,382 | |
Outstanding Shares of Beneficial Interest
(unlimited authorization — no par value) | | | 2,670 | | | | 6,390 | |
Net Asset Value, Offering and Redemption Price Per Share — Class I
(Net Assets / Shares Outstanding) | | $ | 15.77 | | | $ | 9.76 | |
| |
Amounts designated as “—” are either $0 or have been rounded to $0.
The accompanying notes are an integral part of the financial statements.
| | | | |
| June 30, 2017 | | | | www.bishopstreetfunds.com |
27
| | | | |
| Bishop Street Funds | | | (unaudited) | |
Statements of Assets and Liabilities (000)
June 30, 2017
| | | | | | | | |
| | | Hawaii
Municipal
Bond
Fund | | | Short-
Duration
Bond
Fund | |
Assets: | | | | | | | | |
Investments, at Cost | | $ | 132,828 | | | $ | 11,960 | |
| |
Investments, at Value | | $ | 134,987 | | | $ | 11,909 | |
Receivable for Investment Securities Sold | | | 2,371 | | | | 628 | |
Dividends and Interest Receivable | | | 2,180 | | | | 28 | |
Receivable for Fund Shares Sold | | | 326 | | | | 2,000 | |
Due from Advisor | | | — | | | | 6 | |
Prepaid Expenses | | | 6 | | | | — | |
| |
Total Assets | | | 139,870 | | | | 14,571 | |
| |
Liabilities: | | | | | | | | |
Payable for Investment Securities Purchased | | | — | | | | 2,631 | |
Payable for Fund Shares Redeemed | | | 2,490 | | | | — | |
Income Distribution Payable | | | 214 | | | | — | |
Advisory Fees Payable | | | 15 | | | | — | |
Shareholder Servicing Fees Payable | | | 12 | | | | 1 | |
Administrative Fees Payable | | | 11 | | | | 1 | |
Chief Compliance Officer Fees Payable | | | 2 | | | | — | |
Other Accrued Expenses Payable | | | 110 | | | | 31 | |
| |
Total Liabilities | | | 2,854 | | | | 2,664 | |
| |
Net Assets | | $ | 137,016 | | | $ | 11,907 | |
| |
Paid-in Capital | | $ | 134,848 | | | $ | 12,048 | |
Undistributed (Distributions in Excess of) Net Investment Income | | | 53 | | | | (45 | ) |
Accumulated Net Realized Loss on Investments | | | (44 | ) | | | (45 | ) |
Net Unrealized Appreciation (Depreciation) on Investments | | | 2,159 | | | | (51 | ) |
| |
Net Assets | | $ | 137,016 | | | $ | 11,907 | |
| |
Class I Shares: | | | | | | | | |
Net Assets | | $ | 116,011 | | | $ | 11,907 | |
Outstanding Shares of Beneficial Interest
(unlimited authorization — no par value) | | | 10,927 | | | | 1,207 | |
Net Asset Value, Offering and Redemption Price Per Share — Class I
(Net Assets / Shares Outstanding) | | $ | 10.62 | | | $ | 9.87 | * |
| |
Class A Shares: | | | | | | | | |
Net Assets | | $ | 21,005 | | | | N/A | |
Outstanding Shares of Beneficial Interest
(unlimited authorization — no par value) | | | 1,979 | | | | N/A | |
Net Asset Value, Offering and Redemption Price Per Share — Class I
(Net Assets / Shares Outstanding) | | $ | 10.62 | * | | | N/A | |
| |
Maximum Offering Price Per Shares — Class A ($10.62/ 97.00%) | | $ | 10.95 | | | | N/A | |
| |
| * | Difference in net asset value recalculation and net asset value stated is caused by rounding differences. |
N/A — Not Applicable. Share class currently not offered.
Amounts designated as “—” are either $0 or have been rounded to $0.
The accompanying notes are an integral part of the financial statements.
28
| | | | |
| Bishop Street Funds | | | (unaudited) | |
Statements of Operations (000)
For the six-month period ended June 30, 2017
| | | | | | | | |
| | | Dividend
Value Fund | | | High
Grade
Income Fund | |
Investment Income: | | | | | | | | |
Dividend Income | | $ | 528 | | | $ | — | |
Interest Income | | | — | | | | 944 | |
| |
Total Investment Income | | | 528 | | | | 944 | |
| |
Expenses: | | | | | | | | |
Investment Adviser Fees | | | 152 | | | | 168 | |
Shareholder Servicing Fees | | | 51 | | | | 76 | |
Administrative Fees | | | 41 | | | | 61 | |
Chief Compliance Officer Fees | | | 1 | | | | 2 | |
Transfer Agent Fees | | | 21 | | | | 24 | |
Audit Fees | | | 9 | | | | 14 | |
Printing Fees | | | 7 | | | | 10 | |
Trustees’ Fees | | | 4 | | | | 5 | |
Legal Fees | | | 4 | | | | 6 | |
Custody Fees | | | 2 | | | | 3 | |
Registration Fees | | | 1 | | | | 11 | |
Pricing Fees | | | 1 | | | | 6 | |
Miscellaneous Expenses | | | 3 | | | | 4 | |
| |
Total Expenses | | | 297 | | | | 390 | |
| |
Less Waivers: | | | | | | | | |
Investment Adviser Fees | | | (41 | ) | | | (98 | ) |
Shareholder Servicing Fees | | | (31 | ) | | | (46 | ) |
Administrative Fees | | | (10 | ) | | | (14 | ) |
| |
Total Waivers | | | (82 | ) | | | (158 | ) |
| |
Total Net Expenses | | | 215 | | | | 232 | |
| |
Net Investment Income | | | 313 | | | | 712 | |
| |
Net Realized Gain on Investments | | | 282 | | | | 59 | |
Net Change in Unrealized Appreciation on Investments | | | 2,601 | | | | 630 | |
| |
Net Realized and Unrealized Gain on Investments | | | 2,883 | | | | 689 | |
| |
Increase in Net Assets Resulting from Operations | | $ | 3,196 | | | $ | 1,401 | |
| |
Amounts designated as “—” are either $0 or have been rounded to $0.
The accompanying notes are an integral part of the financial statements.
| | | | |
| June 30, 2017 | | | | www.bishopstreetfunds.com |
29
| | | | |
| Bishop Street Funds | | | (unaudited) | |
Statements of Operations (000)
For the six-month period ended June 30, 2017
| | | | | | | | |
| | | Hawaii
Municipal
Bond
Fund | | | Short-
Duration
Bond
Fund | |
Investment Income: | | | | | | | | |
Interest Income | | $ | 2,108 | | | $ | 61 | |
| |
Total Investment Income | | | 2,108 | | | | 61 | |
| |
Expenses: | | | | | | | | |
Investment Adviser Fees | | | 247 | | | | 13 | |
Shareholder Servicing Fees | | | 176 | | | | 13 | |
Administrative Fees | | | 141 | | | | 10 | |
Distribution Fees, Class A | | | 27 | | | | — | |
Chief Compliance Officer Fees | | | 5 | | | | — | |
Transfer Agent Fees | | | 50 | | | | 15 | |
Audit Fees | | | 31 | | | | 2 | |
Printing Fees | | | 24 | | | | 2 | |
Legal Fees | | | 14 | | | | 1 | |
Pricing Fees | | | 14 | | | | 1 | |
Trustees’ Fees | | | 12 | | | | 1 | |
Registration Fees | | | 5 | | | | — | |
Custody Fees | | | 4 | | | | 2 | |
Offering Fees | | | — | | | | 26 | |
Miscellaneous Expenses | | | 9 | | | | 1 | |
| |
Total Expenses | | | 759 | | | | 87 | |
| |
Less Waivers: | | | | | | | | |
Investment Adviser Fees | | | (170 | ) | | | (13 | ) |
Shareholder Servicing Fees | | | (106 | ) | | | (7 | ) |
Administrative Fees | | | (69 | ) | | | (2 | ) |
Expense Reimbursement by Advisor | | | — | | | | (37 | ) |
| |
Total Waivers | | | (345 | ) | | | (59 | ) |
| |
Total Net Expenses | | | 414 | | | | 28 | |
| |
Net Investment Income | | | 1,694 | | | | 33 | |
| |
Net Realized (Loss) on Investments | | | (2 | ) | | | (6 | ) |
Net Change in Unrealized Appreciation on Investments | | | 2,241 | | | | 14 | |
| |
Net Realized and Unrealized Gain on Investments | | | 2,239 | | | | 8 | |
| |
Increase in Net Assets Resulting from Operations | | $ | 3,933 | | | $ | 41 | |
| |
Amounts designated as “—” are either $0 or have been rounded to $0.
The accompanying notes are an integral part of the financial statements.
30
Statement of Changes in Net Assets (000)
For the six-month period ended June 30, 2017 (unaudited) and the year ended December 31, 2016
| | | | | | | | | | | | | | | | |
| | | Dividend Value Fund | | | High Grade Income Fund | |
| | | 2017 | | | 2016 | | | 2017 | | | 2016 | |
Investment Activities from Operations: | | | | | | | | | | | | | | | | |
Net Investment Income | | $ | 313 | | | $ | 741 | | | $ | 712 | | | $ | 1,504 | |
Net Realized Gain on Investments | | | 282 | | | | 5,496 | | | | 59 | | | | 600 | |
Net Change in Unrealized Appreciation (Depreciation) on Investments | | | 2,601 | | | | (860 | ) | | | 630 | | | | (692 | ) |
| |
Increase in Net Assets Resulting from Operations | | | 3,196 | | | | 5,377 | | | | 1,401 | | | | 1,412 | |
| |
Dividends and Distributions to Shareholders: | | | | | | | | | | | | | |
Net Investment Income: | | | | | | | | | | | | | | | | |
Class I Shares | | | (312 | ) | | | (746 | ) | | | (703 | ) | | | (1,478 | ) |
Capital Gains: | | | | | | | | | | | | | | | | |
Class I Shares | | | — | | | | (694 | ) | | | — | | | | (514 | ) |
| |
Total Dividends and Distributions to Shareholders | | | (312 | ) | | | (1,440 | ) | | | (703 | ) | | | (1,992 | ) |
| |
Capital Share Transactions: | | | | | | | | | | | | | | | | |
Proceeds from Shares Issued | | | 503 | | | | 102 | | | | 2,260 | | | | 3,317 | |
Reinvestments of Cash Distributions | | | 187 | | | | 873 | | | | 483 | | | | 1,374 | |
Cost of Shares Redeemed | | | (1,112 | ) | | | (11,516 | ) | | | (2,263 | ) | | | (15,158 | ) |
| |
Net Increase (Decrease) in Net Assets from Capital Share Transactions | | | (422 | ) | | | (10,541 | ) | | | 480 | | | | (10,467 | ) |
| |
Total Increase (Decrease) in Net Assets | | | 2,462 | | | | (6,604 | ) | | | 1,178 | | | | (11,047 | ) |
| |
Net Assets: | | | | | | | | | | | | | | | | |
Beginning of Period | | | 39,642 | | | | 46,246 | | | | 61,204 | | | | 72,251 | |
| |
End of Period | | $ | 42,104 | | | $ | 39,642 | | | $ | 62,382 | | | $ | 61,204 | |
| |
Undistributed Net Investment Income | | $ | 2 | | | $ | 1 | | | $ | 10 | | | $ | 1 | |
| |
Share Transactions: | | | | | | | | | | | | | | | | |
Shares Issued | | | 33 | | | | 7 | | | | 232 | | | | 330 | |
Shares Issued in Lieu of Cash Distributions | | | 12 | | | | 60 | | | | 50 | | | | 139 | |
Shares Redeemed | | | (72 | ) | | | (808 | ) | | | (233 | ) | | | (1,499 | ) |
| |
Net Increase (Decrease) in Shares Outstanding from Share Transactions | | | (27 | ) | | | (741 | ) | | | 49 | | | | (1,030 | ) |
| |
Amounts designated as “—” are either $0, or have been rounded to $0.
The accompanying notes are an integral part of the financial statements.
| | | | |
| June 30, 2017 | | | | www.bishopstreetfunds.com |
31
Statement of Changes in Net Assets (000)
For the six-month period ended June 30, 2017 (unaudited) and the year ended December 31, 2016
| | | | | | | | | | | | | | | | |
| | | Hawaii Municipal
Bond Fund | | | Short-Duration
Bond Fund(1) | |
| | | 2017 | | | 2016 | | | 2017 | | | 2016 | |
Investment Activities from Operations: | | | | | | | | | | | | | | | | |
Net Investment Income | | $ | 1,694 | | | $ | 3,621 | | | $ | 33 | | | $ | 24 | |
Net Realized Gain (Loss) on Investments | | | (2 | ) | | | 578 | | | | (6 | ) | | | — | |
Net Change in Unrealized Appreciation (Depreciation) on Investments | | | 2,241 | | | | (4,551 | ) | | | 14 | | | | (65 | ) |
| |
Increase (Decrease) in Net Assets Resulting from Operations | | | 3,933 | | | | (352 | ) | | | 41 | | | | (41 | ) |
| |
Dividends and Distributions to Shareholders: | | | | | | | | | | | | | |
Net Investment Income: | | | | | | | | | | | | | | | | |
Class I Shares | | | (1,457 | ) | | | (3,091 | ) | | | (78 | ) | | | (63 | ) |
Class A Shares | | | (233 | ) | | | (508 | ) | | | N/A | | | | N/A | |
Capital Gains: | | | | | | | | | | | | | | | | |
Class I Shares | | | — | | | | (658 | ) | | | — | | | | — | |
Class A Shares | | | — | | | | (121 | ) | | | N/A | | | | N/A | |
| |
Total Dividends and Distributions to Shareholders | | | (1,690 | ) | | | (4,378 | ) | | | (78 | ) | | | (63 | ) |
| |
Capital Share Transactions: | | | | | | | | | | | | | | | | |
Class I Shares: | | | | | | | | | | | | | | | | |
Proceeds from Shares Issued | | | 3,521 | | | | 9,032 | | | | 2,580 | | | | 10,087 | |
Reinvestments of Cash Distributions | | | 216 | | | | 572 | | | | 18 | | | | 10 | |
Cost of Shares Redeemed | | | (10,517 | ) | | | (12,434 | ) | | | (647 | ) | | | — | |
| |
Total Class I Capital Share Transactions | | | (6,780 | ) | | | (2,830 | ) | | | 1,951 | | | | 10,097 | |
| |
Class A Shares: | | | | | | | | | | | | | | | | |
Proceeds from Shares Issued | | | 474 | | | | 1,745 | | | | N/A | | | | N/A | |
Reinvestments of Cash Distributions | | | 164 | | | | 483 | | | | N/A | | | | N/A | |
Cost of Shares Redeemed | | | (2,353 | ) | | | (2,071 | ) | | | N/A | | | | N/A | |
| |
Total Class A Capital Share Transactions | | | (1,715 | ) | | | 157 | | | | N/A | | | | N/A | |
| |
Net Increase (Decrease) in Net Assets from Capital Share Transactions | | | (8,495 | ) | | | (2,673 | ) | | | 1,951 | | | | 10,097 | |
| |
Total Increase (Decrease) in Net Assets | | | (6,252 | ) | | | (7,403 | ) | | | 1,914 | | | | 9,993 | |
| |
Net Assets: | | | | | | | | | | | | | | | | |
Beginning of Period | | | 143,268 | | | | 150,671 | | | | 9,993 | | | | — | |
| |
End of Period | | $ | 137,016 | | | $ | 143,268 | | | $ | 11,907 | | | $ | 9,993 | |
| |
Undistributed (Distributions in Excess of) Net Investment Income | | $ | 53 | | | $ | 49 | | | $ | (45 | ) | | $ | — | |
| |
| (1) | Fund commenced operations May 31, 2016. |
N/A – Not Applicable. Share class currently not offered.
Amounts designated as “—” are either $0, or have been rounded to $0.
The accompanying notes are an integral part of the financial statements.
32
Statement of Changes in Net Assets (000)
For the six-month period ended June 30, 2017 (unaudited) and the year ended December 31, 2016
| | | | | | | | | | | | | | | | |
| | | Hawaii Municipal
Bond Fund | | | Short-Duration
Bond Fund(1) | |
| | | 2017 | | | 2016 | | | 2017 | | | 2016 | |
Share Transactions: | | | | | | | | | | | | | | | | |
Class I Shares: | | | | | | | | | | | | | | | | |
Shares Issued | | | 333 | | | | 825 | | | | 261 | | | | 1,008 | |
Shares Issued in Lieu of Cash Distributions | | | 20 | | | | 53 | | | | 2 | | | | 1 | |
Shares Redeemed | | | (993 | ) | | | (1,139 | ) | | | (65 | ) | | | – | |
| |
Total Class I Transactions | | | (640 | ) | | | (261 | ) | | | 198 | | | | 1,009 | |
| |
Class A Shares: | | | | | | | | | | | | | | | | |
Shares Issued | | | 45 | | | | 160 | | | | N/A | | | | N/A | |
Shares Issued in Lieu of Cash Distributions | | | 16 | | | | 45 | | | | N/A | | | | N/A | |
Shares Redeemed | | | (223 | ) | | | (191 | ) | | | N/A | | | | N/A | |
| |
Total Class A Transactions | | | (162 | ) | | | 14 | | | | N/A | | | | N/A | |
| |
Net Increase (Decrease) in Shares Outstanding from Share Transactions | | | (802 | ) | | | (247 | ) | | | 198 | | | | 1,009 | |
| |
| (1) | Fund commenced operations May 31, 2016. |
N/A – Not Applicable. Share class currently not offered.
Amounts designated as “—” are either $0, or have been rounded to $0.
The accompanying notes are an integral part of the financial statements.
| | | | |
| June 30, 2017 | | | | www.bishopstreetfunds.com |
33
Financial Highlights
For a share outstanding throughout the six-month period ended June 30, 2017 (unaudited) and the years ended
December 31,
| | | | | | | | | | | | | | | | | | | | | | | | | | | | | | | | | | | |
| | | | | Investment Activities | | Total
Investment
Activities
from
Operations | | Dividends and
Distributions from | | |
| | | Net Asset
Value,
Beginning
of Period | | Net
Investment
Income
(Loss)(1) | | Net Realized
and Unrealized
Gain(Loss) on
Investments | | | Net
Investment
Income | | Capital
Gains | | Total
Dividends
and
Distributions |
|
DIVIDEND VALUE FUND |
Class I Shares: | |
2017 | | | $ | 14.70 | | | | $ | 0.12 | | | | $ | 1.07 | | | | $ | 1.19 | | | | $ | (0.12 | ) | | | $ | — | | | | $ | (0.12 | ) |
2016 | | | | 13.45 | | | | | 0.24 | | | | | 1.52 | | | | | 1.76 | | | | | (0.25 | ) | | | | (0.26 | ) | | | | (0.51 | ) |
2015 | | | | 13.62 | | | | | 0.22 | | | | | (0.17 | ) | | | | 0.05 | | | | | (0.22 | ) | | | | — | | | | | (0.22 | ) |
2014 | | | | 12.43 | | | | | 0.29 | | | | | 1.20 | | | | | 1.49 | | | | | (0.30 | ) | | | | — | | | | | (0.30 | ) |
2013 | | | | 9.83 | | | | | 0.21 | | | | | 2.61 | | | | | 2.82 | | | | | (0.22 | ) | | | | — | | | | | (0.22 | ) |
2012 | | | | 9.05 | | | | | 0.21 | | | | | 0.79 | | | | | 1.00 | | | | | (0.22 | ) | | | | — | | | | | (0.22 | ) |
|
HIGH GRADE INCOME FUND |
Class I Shares: | |
2017 | | | $ | 9.65 | | | | $ | 0.11 | | | | $ | 0.11 | | | | $ | 0.22 | | | | $ | (0.11 | ) | | | $ | — | | | | $ | (0.11 | ) |
2016 | | | | 9.80 | | | | | 0.22 | | | | | (0.07 | ) | | | | 0.15 | | | | | (0.22 | ) | | | | (0.08 | ) | | | | (0.30 | ) |
2015 | | | | 10.05 | | | | | 0.23 | | | | | (0.19 | ) | | | | 0.04 | | | | | (0.23 | ) | | | | (0.06 | ) | | | | (0.29 | ) |
2014 | | | | 9.78 | | | | | 0.23 | | | | | 0.33 | | | | | 0.56 | | | | | (0.23 | ) | | | | (0.06 | ) | | | | (0.29 | ) |
2013 | | | | 10.51 | | | | | 0.22 | | | | | (0.50 | ) | | | | (0.28 | ) | | | | (0.22 | ) | | | | (0.23 | ) | | | | (0.45 | ) |
2012 | | | | 10.44 | | | | | 0.26 | | | | | 0.26 | | | | | 0.52 | | | | | (0.26 | ) | | | | (0.19 | ) | | | | (0.45 | ) |
| (1) | Per share net investment income calculated using average shares. |
| † | Total return is for the period indicated and has not been annualized. Returns shown do not reflect the deduction of taxes that a shareholder would pay on Fund distributions or the redemption of Fund shares. Fee waivers are in effect; if they had not been in effect, performance would have been lower. |
Amounts designated as “—” are either $0 or have been rounded to $0
34
| | | | | | | | | | | | | | | | | | | | | | | | | | | | | | | | | |
| | | | | | |
Net Asset
Value,
End of
Period | | Total
Return† | | Net Assets
End of
Period
(000) | | Ratio of
Expenses to
Average
Net
Assets | | Ratio of Expenses
to Average
Net Assets
(Excluding
Waivers) | | Ratio of Net
Investments
Income (Loss)
to Average
Net Assets | | Portfolio
Turnover
Rate |
| | | | | | |
| | | | | | | | | | | | | | | | | | | | | | | | | | | | | | | | | | |
| | | | | | | | | | | | | | | | | | | | | | | | | | | | | | | | | | |
| | $ | 15.77 | | | | | 8.08 | % | | | $ | 42,104 | | | | | 1.05 | %* | | | | 1.45 | %* | | | | 1.52 | %* | | | | 6 | % |
| | | 14.70 | | | | | 13.16 | | | | | 39,642 | | | | | 1.05 | | | | | 1.43 | | | | | 1.70 | | | | | 17 | |
| | | 13.45 | | | | | 0.44 | | | | | 46,246 | | | | | 1.05 | | | | | 1.38 | | | | | 1.62 | | | | | 24 | |
| | | 13.62 | | | | | 12.08 | | | | | 55,665 | | | | | 1.05 | | | | | 1.37 | | | | | 2.27 | | | | | 21 | |
| | | 12.43 | | | | | 28.84 | | | | | 61,460 | | | | | 1.05 | | | | | 1.38 | | | | | 1.87 | | | | | 13 | |
| | | 9.83 | | | | | 11.07 | | | | | 57,137 | | | | | 1.05 | | | | | 1.38 | | | | | 2.19 | | | | | 17 | |
| | | | | | |
| | | | | | | | | | | | | | | | | | | | | | | | | | | | | | | | | | |
| | | | | | | | | | | | | | | | | | | | | | | | | | | | | | | | | | |
| | $ | 9.76 | | | | | 2.30 | % | | | $ | 62,382 | | | | | 0.76 | %* | | | | 1.28 | %* | | | | 2.33 | %* | | | | 20 | % |
| | | 9.65 | | | | | 1.47 | | | | | 61,204 | | | | | 0.76 | | | | | 1.25 | | | | | 2.20 | | | | | 27 | |
| | | 9.80 | | | | | 0.37 | | | | | 72,251 | | | | | 0.76 | | | | | 1.21 | | | | | 2.31 | | | | | 24 | |
| | | 10.05 | | | | | 5.77 | | | | | 74,642 | | | | | 0.76 | | | | | 1.20 | | | | | 2.32 | | | | | 28 | |
| | | 9.78 | | | | | (2.69 | ) | | | | 74,007 | | | | | 0.76 | | | | | 1.21 | | | | | 2.18 | | | | | 35 | |
| | | 10.51 | | | | | 5.05 | | | | | 85,771 | | | | | 0.76 | | | | | 1.20 | | | | | 2.47 | | | | | 39 | |
The accompanying notes are an integral part of the financial statements.
| | | | |
| June 30, 2017 | | | | www.bishopstreetfunds.com |
35
Financial Highlights
For a share outstanding throughout the six-month period ended June 30, 2017 (unaudited) and the years ended
December 31,
| | | | | | | | | | | | | | | | | | | | | | | | | | | | | | | | | | | |
| | | Investment Activities | | Total
Investment
Activities
from
Operations | | Dividends and
Distributions from | | |
| | | Net Asset
Value,
Beginning
of Period | | Net
Investment
Income
(Loss)(1) | | Net Realized
and Unrealized
Gain(Loss) on
Investments | | | Net
Investment
Income | | Capital
Gains | | Total
Dividends
and
Distributions |
|
HAWAII MUNICIPAL BOND FUND |
Class I Shares: | |
2017 | | | $ | 10.45 | | | | $ | 0.13 | | | | $ | 0.17 | | | | $ | 0.30 | | | | $ | (0.13 | ) | | | $ | — | | | | $ | (0.13 | ) |
2016 | | | | 10.80 | | | | | 0.27 | | | | | (0.30 | ) | | | | (0.03 | ) | | | | (0.26 | ) | | | | (0.06 | ) | | | | (0.32 | ) |
2015 | | | | 10.88 | | | | | 0.29 | | | | | (0.01 | ) | | | | 0.28 | | | | | (0.29 | ) | | | | (0.07 | ) | | | | (0.36 | ) |
2014 | | | | 10.52 | | | | | 0.29 | | | | | 0.38 | | | | | 0.67 | | | | | (0.29 | ) | | | | (0.02 | ) | | | | (0.31 | ) |
2013 | | | | 11.13 | | | | | 0.29 | | | | | (0.57 | ) | | | | (0.28 | ) | | | | (0.29 | ) | | | | (0.04 | ) | | | | (0.33 | ) |
2012 | | | | 10.94 | | | | | 0.32 | | | | | 0.23 | | | | | 0.55 | | | | | (0.32 | ) | | | | (0.04 | ) | | | | (0.36 | ) |
Class A Shares: | | | | | | | | | | | | | | | | | | | | | | | | | | | | | | | | | | | |
2017 | | | $ | 10.45 | | | | $ | 0.11 | | | | $ | 0.17 | | | | $ | 0.28 | | | | $ | (0.11 | ) | | | $ | — | | | | $ | (0.11 | ) |
2016 | | | | 10.80 | | | | | 0.24 | | | | | (0.29 | ) | | | | (0.05 | ) | | | | (0.24 | ) | | | | (0.06 | ) | | | | (0.30 | ) |
2015 | | | | 10.88 | | | | | 0.26 | | | | | (0.01 | ) | | | | 0.25 | | | | | (0.26 | ) | | | | (0.07 | ) | | | | (0.33 | ) |
2014 | | | | 10.52 | | | | | 0.26 | | | | | 0.38 | | | | | 0.64 | | | | | (0.26 | ) | | | | (0.02 | ) | | | | (0.28 | ) |
2013 | | | | 11.13 | | | | | 0.27 | | | | | (0.57 | ) | | | | (0.30 | ) | | | | (0.27 | ) | | | | (0.04 | ) | | | | (0.31 | ) |
2012 | | | | 10.94 | | | | | 0.29 | | | | | 0.23 | | | | | 0.52 | | | | | (0.29 | ) | | | | (0.04 | ) | | | | (0.33 | ) |
|
SHORT-DURATION BOND FUND |
Class I Shares: | | | | | | | | | | | | | | | | | | | | | | | | | | | | | | | | | | | |
2017 | | | $ | 9.90 | | | | $ | 0.03 | | | | $ | 0.02 | | | | $ | 0.05 | | | | $ | (0.08 | ) | | | $ | — | | | | $ | (0.08 | ) |
2016** | | | | 10.00 | | | | | 0.03 | | | | | (0.06 | ) | | | | (0.03 | ) | | | | (0.07 | ) | | | | — | | | | | (0.07 | ) |
| (1) | Per share net investment income calculated using average shares. |
| ** | Fund commenced operations on May 31, 2016. |
| † | Total return is for the period indicated and has not been annualized. Returns shown do not reflect the deduction of taxes that a shareholder would pay on Fund distributions or the redemption of Fund shares. Fee waivers are in effect; if they had not been in effect, performance would have been lower. |
Amounts designated as “—” are either $0 or have been rounded to $0
36
| | | | | | | | | | | | | | | | | | | | | | | | | | | | | | | | | |
| | | | | | |
Net Asset
Value,
End of
Period | | Total
Return† | | Net Assets
End of
Period
(000) | | Ratio of
Expenses to
Average
Net
Assets | | Ratio of Expenses
to Average
Net Assets
(Excluding
Waivers) | | Ratio of Net
Investments
Income (Loss)
to Average
Net Assets | | Portfolio
Turnover
Rate |
| | | | | | | | | | | | | | | | | | | | | | | | | | | | | | | | | | |
| | | | | | |
| | | | | | | | | | | | | | | | | | | | | | | | | | | | | | | | | | |
| | $ | 10.62 | | | | | 2.86 | % | | | $ | 116,011 | | | | | 0.55 | %* | | | | 1.04 | %* | | | | 2.44 | %* | | | | 13 | % |
| | | 10.45 | | | | | (0.32 | ) | | | | 120,894 | | | | | 0.55 | | | | | 1.02 | | | | | 2.45 | | | | | 26 | |
| | | 10.80 | | | | | 2.61 | | | | | 127,712 | | | | | 0.55 | | | | | 0.98 | | | | | 2.64 | | | | | 28 | |
| | | 10.88 | | | | | 6.36 | | | | | 132,540 | | | | | 0.55 | | | | | 0.99 | | | | | 2.66 | | | | | 27 | |
| | | 10.52 | | | | | (2.47 | ) | | | | 126,289 | | | | | 0.55 | | | | | 1.01 | | | | | 2.72 | | | | | 29 | |
| | | 11.13 | | | | | 5.06 | | | | | 134,179 | | | | | 0.55 | | | | | 0.99 | | | | | 2.86 | | | | | 23 | |
| | | | | | | | | | | | | | | | | | | | | | | | | | | | | | | | | | |
| | $ | 10.62 | | | | | 2.72 | % | | | $ | 21,005 | | | | | 0.80 | %* | | | | 1.29 | %* | | | | 2.19 | %* | | | | 13 | % |
| | | 10.45 | | | | | (0.57 | ) | | | | 22,374 | | | | | 0.80 | | | | | 1.27 | | | | | 2.20 | | | | | 26 | |
| | | 10.80 | | | | | 2.36 | | | | | 22,959 | | | | | 0.80 | | | | | 1.23 | | | | | 2.39 | | | | | 28 | |
| | | 10.88 | | | | | 6.10 | | | | | 22,324 | | | | | 0.80 | | | | | 1.24 | | | | | 2.41 | | | | | 27 | |
| | | 10.52 | | | | | (2.72 | ) | | | | 24,359 | | | | | 0.80 | | | | | 1.26 | | | | | 2.47 | | | | | 29 | |
| | | 11.13 | | | | | 4.80 | | | | | 25,660 | | | | | 0.80 | | | | | 1.24 | | | | | 2.61 | | | | | 23 | |
| | | | | | |
| | | | | | | | | | | | | | | | | | | | | | | | | | | | | | | | | | |
| | | | | | | | | | | | | | | | | | | | | | | | | | | | | | | | | | |
| | $ | 9.87 | | | | | 0.47 | % | | | $ | 11,907 | | | | | 0.55 | %* | | | | 1.73 | %* | | | | 0.65 | %* | | | | 18 | % |
| | | 9.90 | | | | | (0.32 | ) | | | | 9,993 | | | | | 0.55 | * | | | | 1.88 | * | | | | 0.53 | * | | | | 9 | |
The accompanying notes are an integral part of the financial statements.
| | | | |
| June 30, 2017 | | | | www.bishopstreetfunds.com |
37
| | | | |
| Bishop Street Funds | | | (unaudited) | |
Notes to Financial Statements
June 30, 2017
The amounts included in the Notes to Financial Statements are in thousands unless otherwise noted.
The Bishop Street Funds (the “Trust”) are registered under the Investment Company Act of 1940, as amended, as an open-end, management investment company. The Bishop Street Funds consist of a series of four funds (each a Fund, collectively the “Funds”) which includes Dividend Value Fund, High Grade Income Fund, Hawaii Municipal Bond Fund and the Short-Duration Bond Fund. Each Fund is diversified, with the exception of Hawaii Municipal Bond Fund, which is non-diversified. Class A Shares of the Hawaii Municipal Bond Fund are subject to a sales load as disclosed in the prospectus. The Short-Duration Bond Fund commenced operations on May 31, 2016. The assets of each Fund are segregated, and a shareholder’s interest is limited to the Fund in which shares are held. The Funds’ prospectus provides a description of each Fund’s investment objectives, policies and strategies. On April 7, 2017 the Bishop Strategic Growth Fund ceased operations and liquidated all remaining assets on a pro rata basis to the shareholders.
| 2. | SIGNIFICANT ACCOUNTING POLICIES |
The following is a summary of significant accounting policies followed by the Trust. The Funds are investment companies in conformity with U.S. generally accepted accounting principles (U.S. GAAP). Therefore, the Funds follow the accounting and reporting guidelines for investment companies.
Use of Estimates in the Preparation of Financial Statements
The preparation of financial statements in conformity with U.S. GAAP requires management to make estimates and assumptions that affect the fair value of assets, the reported amount of assets and liabilities and disclosure of contingent assets and liabilities at the date of the financial statements and the reported amounts of increases and decreases in net assets from operations during the reporting period. Actual results could differ from those estimates and such differences could be material.
Security Valuation
The Funds’ investments in equity securities listed on a securities exchange, market or automated quotation system for which quotations are readily available (except for securities traded on NASDAQ) including securities traded over the counter, are valued at the last quoted sale price on an exchange or market (foreign or domestic) on which they are traded on valuation date (or at approximately 4:00 pm ET if a security’s primary exchange is normally open at that time), or, if there is no such reported sale on the valuation date, at the most recent quoted bid price. For securities traded on NASDAQ, the NASDAQ Official Closing Price will be used. Debt securities are priced based upon valuations provided by independent, third-party pricing agents, if available.
38
Such values generally reflect the last reported sales price in the most advantageous market, if the security is actively traded. The third-party pricing agents may also value debt securities at an evaluated bid price by employing methodologies that utilize actual market transactions, broker-supplied valuations, or other methodologies designed to identify the fair value for such securities. Such methodologies typically include matrix systems which reflect such factors as security prices, yields, maturities and ratings. Debt obligations with remaining maturities of sixty days or less may be valued at their amortized cost, which approximates market value provided that it is determined the amortized cost continues to approximate fair value. Should existing credit, liquidity or interest rate conditions in the relevant markets and issuer specific circumstances suggest that amortized cost does not approximate fair value, then the amortized cost method may not be used. Prices for most securities held in the Funds are provided daily by recognized independent pricing agents.
If a security price cannot be obtained from an independent, third-party pricing agent, the Funds seek to obtain a bid price from at least one independent broker.
Securities for which market prices are not “readily available” are valued in accordance with Fair Value Procedures established by the Funds’ Board of Trustees (the “Board”). The Funds’ Fair Value Procedures are implemented through a Fair Value Pricing Committee (the “Committee”) designated by the Funds’ Board. Some of the more common reasons that may necessitate that a security be valued using Fair Value Procedures include: the security’s trading has been halted or suspended; the security has been delisted from a national exchange; the security’s primary trading market is temporarily closed at a time when under normal conditions it would be open; or the security’s primary pricing source is not able or willing to provide a price. When a security is valued in accordance with the Fair Value Procedures, the Committee will determine the value after taking into consideration relevant information reasonably available to the Committee.
In accordance with the authoritative guidance on fair value measurement under U.S. GAAP, the Funds disclose fair value of their investments in a hierarchy that prioritizes the inputs to valuation techniques used to measure the fair value. The objective of a fair value measurement is to determine the price that would be received to sell an asset or paid to transfer a liability in an orderly transaction between market participants at the measurement date (an exit price). Accordingly, the fair value hierarchy gives the highest priority to quoted prices (unadjusted) in active markets for identical assets or liabilities (Level 1) and the lowest priority to unobservable inputs (Level 3). The three levels of the fair value hierarchy are described below:
| | • | | Level 1 — Unadjusted quoted prices in active markets for identical, unrestricted assets or liabilities that the Funds have the ability to access at the measurement date; |
| | | | |
| June 30, 2017 | | | | www.bishopstreetfunds.com |
39
| | | | |
| Bishop Street Funds | | | (unaudited) | |
| | • | | Level 2 — Other significant observable inputs (including quoted prices for similar securities, interest rates, prepayment speeds, credit risk, referenced indices, quoted prices in inactive markets, adjusted quoted prices in active markets, etc.); and |
| | • | | Level 3 — Prices, inputs or exotic modeling techniques which are both significant to the fair value measurement and unobservable (supported by little or no market activity). |
Investments are classified within the level of the lowest significant input considered in determining fair value. Investments classified within Level 3 whose fair value measurement considers several inputs may include Level 1 or Level 2 inputs as components of the overall fair value measurement.
As of June 30, 2017, all investments in the Dividend Value Fund were considered Level 1.
The following is a summary of the levels of inputs used in valuing the following Fund’s investments carried at value:
| | | | | | | | | | | | | | | | |
| High Grade Income Fund | |
| Investments in Securities | | Level 1 | | | Level 2 | | | Level 3 | | | Total | |
Corporate Obligations | | $ | — | | | $ | 37,282 | | | $ | — | | | $ | 37,282 | |
U.S. Treasury Obligations | | | — | | | | 7,984 | | | | — | | | | 7,984 | |
U.S. Government Agency Obligations | | | — | | | | 6,580 | | | | — | | | | 6,580 | |
Municipal Bonds | | | — | | | | 4,652 | | | | — | | | | 4,652 | |
U.S. Government Mortgage-Backed Obligations | | | — | | | | 4,436 | | | | — | | | | 4,436 | |
Non-Agency Mortgage-Backed Obligation | | | — | | | | 390 | | | | — | | | | 390 | |
Cash Equivalent | | | 832 | | | | — | | | | — | | | | 832 | |
| | | | |
Total Investments in Securities | | $ | 832 | | | $ | 61,324 | | | $ | — | | | $ | 62,156 | |
| | | | |
| | | | |
| Hawaii Municipal Bond Fund | | | | | | | | | | | | |
| Investments in Securities | | Level 1 | | | Level 2 | | | Level 3 | | | Total | |
Municipal Bonds | | $ | — | | | $ | 134,273 | | | $ | — | | | $ | 134,273 | |
Cash Equivalent | | | 714 | | | | — | | | | — | | | | 714 | |
| | | | |
Total Investments in Securities | | $ | 714 | | | $ | 134,273 | | | $ | — | | | $ | 134,987 | |
| | | | |
40
| | | | | | | | | | | | | | | | |
| Short-Duration Bond Fund | |
| Investments in Securities | | Level 1 | | | Level 2 | | | Level 3 | | | Total | |
U.S. Government Agency Obligations | | $ | — | | | $ | 5,074 | | | $ | — | | | $ | 5,074 | |
U.S. Government Mortgage-Backed Obligations | | | — | | | | 3,724 | | | | — | | | | 3,724 | |
U.S. Treasury Obligations | | | — | | | | 2,960 | | | | — | | | | 2,960 | |
Cash Equivalent | | | 151 | | | | — | | | | — | | | | 151 | |
| | | | |
Total Investments in Securities | | $ | 151 | | | $ | 11,758 | | | $ | — | | | $ | 11,909 | |
| | | | |
For the six-month period ended June 30, 2017, there were no transfers between Level 1 and Level 2 assets and liabilities. For the six-month period ended June 30, 2017, there were no transfers between Level 2 and Level 3 assets and liabilities. There were no Level 3 investments during the six-month period ended June 30, 2017. For the six-month period ended June 30, 2017, there have been no changes to the Funds’ fair value methodologies.
Federal Income Taxes
It is each Fund’s intention to continue to qualify as a regulated investment company for Federal income tax purposes by complying with the appropriate provisions of Subchapter M of the Internal Revenue Code of 1986, as amended, and to distribute substantially all of its income to shareholders. Accordingly, no provision for Federal income taxes has been made in the financial statements.
The Funds evaluate tax positions taken or expected to be taken in the course of preparing the Funds’ tax returns to determine whether it is “more-likely-than- not” (i.e., greater than 50-percent) that each tax position will be sustained upon examination by a taxing authority based on the technical merits of the position. Tax positions not deemed to meet the more-likely-than-not threshold are recorded as a tax benefit or expense in the current year. The Funds did not record any tax provision in the current period. However, management’s conclusions regarding tax positions taken may be subject to review and adjustment at a later date based on factors including, but not limited to, examination by tax authorities (i.e., the last 3 open tax year ends, as applicable), on-going analysis of and changes to tax laws, regulations and interpretations thereof.
Security Transactions and Investment Income
Security transactions are accounted for on trade date. Costs used in determining net realized capital gains and losses on the sale of securities are on the basis of specific identification. Interest income is recorded on the accrual basis from settlement date and dividend income is recorded on ex-dividend date.
| | | | |
| June 30, 2017 | | | | www.bishopstreetfunds.com |
41
| | | | |
| Bishop Street Funds | | | (unaudited) | |
Discounts and premiums are accreted or amortized using the effective interest method over the life of each security and are recorded as interest income. Realized gains (losses) on paydowns of mortgage-backed and asset-backed securities are recorded as an adjustment to interest income.
Classes
Class-specific expenses are borne by the applicable class of shares. Income, realized and unrealized gains/losses and non-class-specific expenses are allocated to the respective class on the basis of relative daily net assets. Distribution fees are the only class-specific expense.
Expenses
Expenses that are directly related to one of the Funds are charged directly to that Fund. Other operating expenses of the Trust are prorated to each of the Funds on the basis of relative net assets.
Dividends and Distributions to Shareholders
The Dividend Value Fund and Short-Duration Bond Fund declare and pay dividends from net investment income, if available, on a quarterly basis. Dividends from net investment income are declared daily and paid on a monthly basis for the High Grade Income and Hawaii Municipal Bond. Any net realized capital gains will be distributed at least annually for all Funds. Distributions to shareholders are recorded on the ex-dividend date.
Front-End Sales Commission
Front-end sales commissions (the “sales charges”) are not recorded as expenses of the Hawaii Municipal Bond Fund. Sales charges are deducted from proceeds from the sales of Hawaii Municipal Bond Fund shares prior to investment in Class A shares.
Cash Overdraft Charges
Per the terms of the agreement with MUFG Union Bank, N.A., the custodian of the Funds (the “Custodian”), if a Fund has a cash overdraft on a given day, it will be assessed an overdraft charge of the Prime Rate plus 4.00%. Cash overdraft charges are included in miscellaneous expenses on the Statements of Operations. For the six-month period ended June 30, 2017, there were no cash overdraft charges.
| 3. | INVESTMENT ADVISORY AGREEMENT |
Investment advisory services are provided to the Funds by Bishop Street Capital Management (the “Adviser”), a registered adviser and wholly owned subsidiary of First Hawaiian Bank. First Hawaiian Bank is a subsidiary of BancWest Corporation, itself a subsidiary of BNP Paribas. The Adviser is entitled to receive an annual fee of 0.74% of
42
the average daily net assets of the Dividend Value Funds, 0.55% of the average daily net assets of the High Grade Income Fund, 0.35% of the average daily net assets of the Hawaii Municipal Bond Fund and 0.25% of the daily average net assets of the Short-Duration Bond Fund. The Adviser has contractually agreed, through April 30, 2018, to waive a portion of its advisory fee (excluding interest, taxes, brokerage commissions, acquired fund fees and expenses, and extraordinary expenses (collectively, excluded expenses)) to the extent necessary to keep operating expenses at or below certain percentages of the respective average daily net assets. The contractual expense limitations are as follows:
| | | | |
Dividend Value Fund, Class I Shares | | | 1.05% | |
High Grade Income Fund, Class I Shares | | | 0.76% | |
Hawaii Municipal Bond Fund, Class I Shares | | | 0.55% | |
Hawaii Municipal Bond Fund, Class A Shares | | | 0.80% | |
The Adviser has voluntarily agreed to waive a portion of its advisory fees and to assume expenses, if necessary, in order to keep the Short-Duration Bond Fund’s total annual operating expenses, after the effect of expense-offset arrangements, from exceeding 0.55% of average daily net assets. These fees and waivers are labeled on the Statement of Operations as “Investment Adviser Fees/Waivers and Reimbursement from Adviser.” The Adviser intends to continue these fee reductions and expense reimbursements until further notice, but may discontinue them at any time.
If at any point it becomes unnecessary for the Adviser to reduce fees and make expense reimbursements, the Board may permit the Adviser to retain the difference between the Total Annual Fund Operating Expenses and contractual expense limitations to recapture all or a portion of its prior expense reductions or reimbursements made during the preceding three year period during which this agreement was in place. During the six-month period ended June 30, 2017, the Adviser did not recapture any previously waived fees.
As of June 30, 2017, fees which were previously waived by the Investment Manager which may be subject to possible future reimbursement to the Adviser were as follows:
| | | | | | | | | | | | | | | | | | | | | | |
Dividend
Value
Fund | | | High
Grade Income
Fund | | | Hawaii
Municipal
Bond Fund | | | Short-
Duration
Bond Fund | | | Total | | | Expires | |
| $ | 53 | | | $ | 160 | | | $ | 237 | | | $ | 0 | | | $ | 450 | | | | 12/31/2017 | |
| | 52 | | | | 160 | | | | 236 | | | | 0 | | | | 448 | | | | 12/31/2018 | |
| | 73 | | | | 192 | | | | 319 | | | | 51 | | | | 635 | | | | 12/31/2019 | |
| | 41 | | | | 98 | | | | 170 | | | | 50 | | | | 359 | | | | 12/31/2020 | |
| | | | |
| June 30, 2017 | | | | www.bishopstreetfunds.com |
43
| | | | |
| Bishop Street Funds | | | (unaudited) | |
Columbia Management Investment Advisers, LLC (“Columbia”) serves as the investment sub-adviser for the Dividend Value Fund, pursuant to a sub-adviser agreement. Columbia is entitled to receive from the Adviser a fee, computed daily and paid monthly, at the annual rate based on the average daily net assets of the Dividend Value Fund, under the following fee schedule: 0.360% on the first $75 million; 0.350% on the next $75 million; 0.325% on the next $100 million; 0.300% on the next $250 million; and 0.250% on assets over $500 million.
| 4. | ADMINISTRATIVE, CUSTODIAN, TRANSFER AGENT, DISTRIBUTION AND SHAREHOLDER SERVICES |
The Funds and the Administrator are parties to an Administration Agreement under which the Administrator provides administrative services to the Funds. For these services, the Administrator is paid an asset based fee which will vary depending on the number of share classes and the average daily net assets of the Funds. The Administrator has voluntarily agreed to waive 0.06% of its administrative fee on each of the Funds’ average daily net assets excluding the Hawaii Municipal Bond Fund for which the Administrator is waiving 0.11% of its fee. These fee waivers are voluntary and may be discontinued at any time. For the six-month period ended June 30, 2017, the Funds were charged as follows for these services: $41 in the Dividend Value Fund, $61 in the High Grade Income Fund, $141 in the Hawaii Municipal Bond Fund and $10 in the Short-Duration Bond Fund. For the six-month period ended June 30, 2017, the Funds waived as follows for these services: $10 in the Dividend Value Fund, $14 in the High Grade Income Fund, and $69 in the Hawaii Municipal Bond Fund, and $2 in the Short-Duration Bond Fund. These fees and waivers are labeled as “Administrative Fees/Waivers” on the Statement of Operations.
MUFG Union Bank, N.A. acts as custodian for the Funds. The Custodian plays no role in determining the investment policies of the Funds or which securities are to be purchased or sold by the Funds. These fees are labeled on the Statement of Operations as “Custody Fees.”
DST Systems, Inc. (“DST”) acts as the Transfer Agent of the Funds. As such, DST provides transfer agency, dividend disbursing and shareholder services to the Funds. These fees are disclosed on the Statement of Operations as “Transfer Agent Fees.”
SEI Investments Distribution Co. (“SIDCO”), the “Distributer” a wholly owned subsidiary of SEI Investments Company, acts as the Trust’s Distributor pursuant to the distribution agreement. The Funds have adopted a Distribution Plan (the “Plan”) on behalf of Class A Shares pursuant to Rule 12b-1 under the Investment Company Act of 1940. The Plan provides that Class A Shares will bear the cost of their distribution expenses. SIDCO, as compensation for its services under the Plan, receives a distribution
44
fee, computed daily and payable monthly, of 0.25% of the average daily net assets attributable to each Fund’s Class A Shares. This fee is disclosed as “Distribution Fees, Class A” on the Statement of Operations.
The Trust has adopted and entered into a shareholder service plan and agreement with SIDCO. Each Fund pays to SIDCO a shareholder servicing fee not to exceed an annual rate of 0.25% of the average daily net asset value of all shares of each fund, which is computed daily and paid monthly. Under the shareholder service plan, SIDCO may perform, or may compensate other service providers for performing various shareholder and administrative services. SIDCO may also retain as profit any difference between the fee it receives and amount it pays to third parties. For the year, SIDCO paid the entire amount of fees received under the shareholder service plan to First Hawaiian Bank, the Parent Company of Bishop Street Capital Management, for shareholder services performed by First Hawaiian Bank on behalf of SIDCO for the benefit of certain shareholders to the Funds. SIDCO has voluntarily agreed to waive 0.15% of its shareholder servicing fee to the extent necessary to keep operating expenses at or below certain percentages of the respective average daily net assets. These fees and waivers are represented as “Shareholder Servicing Fees/Waivers” on the Statement of Operations.
| 5. | TRANSACTIONS WITH AFFILIATES |
Certain officers of the Trust are also officers of SEI Investments Global Funds Services (the “Administrator”), a wholly owned subsidiary of SEI Investments Company, and/or SIDCO. Such officers are paid no fees by the Trust other than the Chief Compliance Officer (“CCO”) as described below, for serving as officers of the Trust.
A portion of the services provided by the CCO and his staff, who are employees of the Administrator, are paid for by the Trust as incurred. The services include regulatory oversight of the Trust’s Advisers and service providers as required by SEC regulations. The CCO’s services and expenses have been approved by and are reviewed by the Board. These fees are disclosed on the Statement of Operations as “Chief Compliance Officer Fees.”
| 6. | INVESTMENT TRANSACTIONS |
The cost of security purchases and the proceeds from the sale and maturities of securities, other than short-term investments, for the six-month period ended June 30, 2017 are presented below for the Funds.
| | | | | | | | | | | | | | | | |
| | | Dividend
Value
Fund | | | High Grade
Income
Fund | | | Hawaii
Municipal
Bond Fund | | | Short-
Duration
Bond Fund | |
Purchases | | | | | | | | | | | | | | | | |
U.S. Government Securities | | $ | — | | | $ | 4,130 | | | $ | — | | | $ | 4,601 | |
Other | | | 2,603 | | | | 8,612 | | | | 17,800 | | | | — | |
| | | | |
| June 30, 2017 | | | | www.bishopstreetfunds.com |
45
| | | | |
| Bishop Street Funds | | | (unaudited) | |
| | | | | | | | | | | | | | | | |
| | | Dividend
Value
Fund | | | High Grade
Income
Fund | | | Hawaii
Municipal
Bond Fund | | | Short-
Duration
Bond Fund | |
Sales and Maturities | | | | | | | | | | | | | | | | |
U.S. Government Securities | | $ | — | | | $ | 3,587 | | | $ | — | | | $ | 1,728 | |
Other | | | 3,779 | | | | 7,945 | | | | 25,787 | | | | — | |
| 7. | FEDERAL TAX INFORMATION |
The timing and characterization of certain income and capital gains distributions are determined annually in accordance with Federal tax regulations which may differ from U.S. GAAP.
As a result, net investment income (loss) and net realized gain (loss) on investment transactions for the reporting period may differ from distributions during such period. These book/tax differences may be temporary or permanent in nature. To the extent these differences are permanent, they are charged or credited to undistributed net investment income/(loss), paid-in capital or accumulated net realized gain/(loss), as appropriate, in the period that the differences arise.
The tax character of dividends and distributions declared during the years ended December 31, 2016 and 2015 were as follows:
| | | | | | | | | | | | | | | | |
| | | Ordinary
Income | | | Tax Exempt
Income | | | Long Term
Capital Gain | | | Total | |
Dividend Value Fund | | | | | | | | | | | | | | | | |
2016 | | $ | 746 | | | $ | — | | | $ | 694 | | | $ | 1,440 | |
2015 | | | 847 | | | | — | | | | — | | | | 847 | |
High Grade Income Fund | | | | | | | | | | | | | | | | |
2016 | | $ | 1,647 | | | $ | — | | | $ | 345 | | | $ | 1,992 | |
2015 | | | 1,709 | | | | — | | | | 423 | | | | 2,132 | |
Hawaii Municipal Bond Fund | | | | | | | | | | | | | | | | |
2016 | | $ | 163 | | | $ | 3,599 | | | $ | 616 | | | $ | 4,378 | |
2015 | | | 3 | | | | 3,978 | | | | 1,037 | | | | 5,018 | |
Short-Duration Bond Fund | | | | | | | | | | | | | | | | |
2016 | | $ | 63 | | | $ | — | | | $ | — | | | $ | 63 | |
46
As of December 31, 2016, the components of Distributable Earnings (Accumulated Losses) on a tax basis were as follows:
| | | | | | | | | | | | | | | | |
| | | Dividend
Value
Fund | | | High Grade
Income
Fund | | | Hawaii
Municipal
Bond Fund | | | Short-
Duration
Bond Fund | |
Undistributed Tax-Exempt Income | | $ | — | | | $ | — | | | $ | 4 | | | $ | — | |
Undistributed Ordinary Income | | | — | | | | — | | | | — | | | | — | |
Undistributed Long-Term Capital Gain Income | | | 1,433 | | | | 123 | | | | — | | | | — | |
Capital Loss Carryforwards | | | — | | | | — | | | | — | | | | (39 | ) |
Post October Losses | | | — | | | | — | | | | (40 | ) | | | — | |
Unrealized Appreciation (Depreciation) | | | 11,202 | | | | 817 | | | | (39 | ) | | | (65 | ) |
Other Temporary Differences | | | — | | | | 2 | | | | — | | | | — | |
| | | | | | | | | | | | | | | | |
Total Distributable Earnings (Accumulated Losses) | | $ | 12,635 | | | $ | 942 | | | $ | (75 | ) | | $ | (104 | ) |
| | | | | | | | | | | | | | | | |
Post-October losses represent losses realized on investment transactions from November 1, 2016 through December 31, 2016 that, in accordance with Federal income tax regulations, the Funds have elected to defer and treat as having arisen in the following fiscal year.
For Federal income tax purposes, capital losses incurred may be carried forward and applied against future capital gains. Under the Regulated Investment Company Modernization Act of 2010, Funds are permitted to carry forward capital losses incurred in taxable years beginning after December 22, 2010 for an unlimited period. Additionally, post enactment capital losses that are carried forward will retain their character as either short-term or long-term capital losses rather than being considered all short-term as under previous law.
Losses carried forward under these new provisions are as follows:
| | | | |
| | | Short-Term Loss | |
Short-Duration Bond Fund | | $ | 39 | |
During the year ended December 31, 2016, the Dividend Value Fund utilized capital loss carryforwards of $3,387.
For Federal income tax purposes, the cost of securities owned at December 31, 2016, and the net realized gains or losses on securities sold for the period were not materially different from amounts reported for financial reporting purposes. These differences are primarily due to wash sales which cannot be used for Federal income tax purposes in the current year and have been deferred for use in future years. The aggregate gross unrealized appreciation and depreciation of securities held by the Dividend Value, High Grade
| | | | |
| June 30, 2017 | | | | www.bishopstreetfunds.com |
47
| | | | |
| Bishop Street Funds | | | (unaudited) | |
Income, Hawaii Municipal Bond and Short-Duration Bond Funds for Federal income tax purposes at June 30, 2017 were as follows:
| | | | | | | | | | | | | | | | |
| | | Dividend
Value
Fund | | | High Grade
Income
Fund | | | Hawaii
Municipal
Bond Fund | | | Short-
Duration
Bond Fund | |
Federal Tax Cost | | $ | 28,146 | | | $ | 60,708 | | | $ | 132,775 | | | $ | 11,960 | |
| | | | | | | | | | | | | | | | |
Gross Unrealized Appreciation | | | 13,923 | | | | 1,897 | | | | 2,995 | | | | 8 | |
Gross Unrealized Depreciation | | | (96 | ) | | | (449 | ) | | | (783 | ) | | | (59 | ) |
| | | | | | | | | | | | | | | | |
Net Unrealized Appreciation (Depreciation) | | $ | 13,827 | | | $ | 1,448 | | | $ | 2,212 | | | $ | (51 | ) |
| | | | | | | | | | | | | | | | |
The Hawaii Municipal Bond Fund invests primarily in debt instruments in the state of Hawaii. The issuers’ ability to meet their obligations may be affected by economic developments in that state. In addition, each Fund’s investments in debt securities are subject to “credit risk,” which is the risk that an issuer will be unable, or will be perceived to be unable, to repay its obligations at maturity and “interest rate risk” which is the potential for fluctuations in bond prices due to changing interest rates. Funds that invest primarily in high quality debt securities generally are subject to less credit risk than funds that invest in lower quality debt securities.
Certain debt securities are backed by credit enhancements from various financial institutions and financial guarantee assurance agencies. These credit enhancements reinforce the credit quality of the individual securities; however, if any of the financial institutions or financial guarantee assurance agencies’ credit quality should deteriorate, it could cause the individual security’s credit quality to change. Additionally, if any of the Funds concentrate their credit enhancements in any one financial institution, the risk of credit quality deterioration increases. The following table provides detail on the approximate percentage of each fund’s investments in securities with these types of enhancements, as well as the name of the entity providing the largest proportion of enhancements in the Fund.
| | |
| | | Hawaii
Municipal
Bond Fund |
% of investments in securities with credit enhancements or liquidity enhancements | | 8.68% |
Largest % of investments in securities with credit enhancements or liquidity enhancements from a single institution | | 4.06%
(Assured Guaranty
Municipal Corporation) |
48
The value of asset-backed securities may be affected by the credit risk of the servicing agent for the pool, the originator of the loans or receivables, or the financial institution(s) providing the credit support. In addition to credit risk, asset-backed securities and other securities with early redemption features are subject to pre-payment risk. During periods of declining interest rates, prepayment of loans underlying asset-backed securities can be expected to accelerate or an issuer may retire an outstanding bond early to reduce interest costs. A Fund’s ability to maintain positions in such securities will be affected by reductions in the principal amount of such securities resulting from prepayments, and its ability to reinvest the returns of principal at comparable yields is subject to the general prevailing interest rates at that time.
The market value of the Funds’ investments in fixed income securities may change in response to interest rate changes and other factors. During periods of falling interest rates, the values of fixed income securities generally rise. Conversely, during periods of rising interest rates, the values of such securities generally decline. Changes by recognized rating agencies in the ratings of any fixed income security and in the ability of an issuer to make payments of interest and principal may also affect the value of these investments.
In the normal course of business, the Funds enter into contracts that provide general indemnifications. The Funds’ maximum exposure under these arrangements is dependent on future claims that may be made against the Funds and, therefore, cannot be established; however, based on experience, the risk of loss from such claims is considered remote.
Dividend Value Fund invest solely in equity securities. Purchases of equity securities are subject to the risk that stock prices will fall over short or extended periods of time. Historically, the equity markets have moved in cycles, and the value of the Fund’s equity securities may fluctuate drastically from day to day. Individual companies may report poor results or be negatively affected by industry and/or economic trends and developments. The prices of securities issued by such companies may suffer a decline in response. These factors contribute to price volatility, which is the principal risk of investing in the Fund’s.
Through June 4, 2017, the Funds, which are not jointly liable, had entered into an agreement which enabled them to participate in a $5 million unsecured committed revolving line of credit on a first come, first served basis, with MUFG Union Bank, N.A. (the “Bank”). The proceeds from the borrowings were used to finance the Funds’ short term general working capital requirements, including the funding of shareholder redemptions. Interest was charged to the Funds based on their borrowings during the period at the Bank current reference rate minus 1%.
| | | | |
| June 30, 2017 | | | | www.bishopstreetfunds.com |
49
| | | | |
| Bishop Street Funds | | | (unaudited) | |
For the six-month period ended June 30, 2017, the Funds had the following borrowings under the line of credit:
| | | | | | | | | | | | | | | | |
Fund | | Average
Borrowings | | | Borrowing
Cost | | | Number
of Days
Outstanding | | | Weighted
Average
Interest Rate | |
Hawaii Municipal Bond Fund | | $ | 124 | | | | — | | | | 5 | | | | 3.95 | % |
At June 30, 2017, the percentage of total shares outstanding held by shareholders owning 10% or greater of total shares outstanding of each Fund, which comprised omnibus accounts that were held on behalf of several individual shareholders, was as follows:
| | | | | | | | |
| | | Number of
Shareholders | | | % of Outstanding
Shares | |
Dividend Value Fund, Class I Shares | | | 2 | | | | 97.98 | |
High Grade Income Fund, Class I Shares* | | | 3 | | | | 84.85 | |
Hawaii Municipal Bond Fund, Class I Shares | | | 1 | | | | 64.15 | |
Hawaii Municipal Bond Fund, Class A Shares | | | — | | | | — | |
Short-Duration Bond Fund, Class I Shares | | | 2 | | | | 100.00 | |
| * | Includes one unaffiliated shareholder, all other shareholders in the above table are affiliated. |
In October 2016, the Securities and Exchange Commission (the “SEC”) released its Final Rule on Investment Company Reporting Modernization (the “Rule”). The Rule which introduces two new regulatory reporting forms for investment companies — Form N-PORT and Form N-CEN — also contains amendments to Regulation S-X which impact financial statement presentation, particularly the presentation of derivative investments. Although still evaluating the impact of the Rule, management believes that many of the Regulation S-X amendments are consistent with the Portfolios’ current financial statement presentation and expects that the Portfolios will be able to comply with the Rule’s Regulation S-X amendments by the August 1, 2017 compliance date.
The Funds have evaluated the need for additional disclosures and/or adjustments resulting from subsequent events through the date the financial statements were issued. Based on this evaluation, no additional disclosures and/or adjustments were required to the financial statements.
50
| | | | |
| Bishop Street Funds | | | (unaudited) | |
Disclosure of Fund Expenses
All mutual funds have operating expenses. As a shareholder of a mutual fund you incur two types of costs: (1) transaction costs, including applicable sales charges (loads); and (2) ongoing costs, which include (among others) costs for portfolio management, administrative services, distribution and service (12b-1), shareholder service fees, and shareholder reports like this one. It is important for you to understand the impact of these costs on your investment returns.
Operating expenses such as these are deducted from a mutual fund’s gross income and directly reduce its final investment return. These expenses are expressed as a percentage of the mutual fund’s average net assets; this percentage is known as the mutual fund’s expense ratio.
The following examples use the expense ratio and are intended to help you understand the ongoing costs (in dollars) of investing in your Fund and to compare these costs with those of other mutual funds. The examples are based on an investment of $1,000 made at the beginning of the period shown and held for the entire period from January 1, 2017 to June 30, 2017.
The table on the next page illustrates your Fund’s costs in two ways:
| • | | Actual Fund Return. This section helps you to estimate the actual expenses after fee waivers that your Fund incurred over the period. The “Expenses Paid During Period” column shows the actual dollar expense cost incurred by a $1,000 investment in the Fund, and the “Ending Account Value” number is derived from deducting that expense cost from the Fund’s gross investment return. |
You can use this information, together with the actual amount you invested in the Fund, to estimate the expenses you paid over that period. Simply divide your actual account value by $1,000 to arrive at a ratio (for example, an $8,600 account value divided by $1,000 = 8.6), then multiply that ratio by the number shown for your Fund under “Expenses Paid During Period.”
| • | | Hypothetical 5% Return. This section helps you compare your Fund’s costs with those of other mutual funds. It assumes that the Fund had an annual 5% return before expenses during the year, but that the expense ratio (Column 3) for the period is unchanged. This example is useful in making comparisons because the Securities and Exchange Commission requires all mutual funds to make this 5% calculation. You can assess your Fund’s comparative cost by comparing the hypothetical result for your Fund in the “Expenses Paid During Period” column with those that appear in the same charts in the shareholder reports for other funds. |
Note: Because the return is set at 5% for comparison purposes — NOT your Fund’s actual return — the account values shown may not apply to your specific investment.
| | | | |
| June 30, 2017 | | | | www.bishopstreetfunds.com |
51
| | | | |
| Bishop Street Funds | | | (unaudited) | |
| | | | | | | | | | | | | | | | |
| | | Beginning
Account
Value
1/1/17 | | | Ending
Account
Value
6/30/17 | | | Annualized
Expense
Ratios | | | Expenses
Paid During
Period* | |
Dividend Value Fund — Class I | | | | | | | | | | | | | | | | |
| |
Actual Fund Return | | $ | 1,000.00 | | | $ | 1,080.80 | | | | 1.05 | % | | $ | 5.42 | |
Hypothetical 5% Return | | | 1,000.00 | | | | 1,019.59 | | | | 1.05 | | | | 5.26 | |
| |
High Grade Income Fund — Class I | | | | | | | | | | | | | | | | |
| |
Actual Fund Return | | $ | 1,000.00 | | | $ | 1,023.00 | | | | 0.76 | % | | $ | 3.81 | |
Hypothetical 5% Return | | | 1,000.00 | | | | 1,021.03 | | | | 0.76 | | | | 3.81 | |
| |
Hawaii Municipal Bond Fund — Class I | | | | | | | | | | | | | | | | |
| |
Actual Fund Return | | $ | 1,000.00 | | | $ | 1,028.60 | | | | 0.55 | % | | $ | 2.77 | |
Hypothetical 5% Return | | | 1,000.00 | | | | 1,022.07 | | | | 0.55 | | | | 2.76 | |
| |
Hawaii Municipal Bond Fund — Class A | | | | | | | | | | | | | | | | |
| |
Actual Fund Return | | $ | 1,000.00 | | | $ | 1,027.20 | | | | 0.80 | % | | $ | 4.02 | |
Hypothetical 5% Return | | | 1,000.00 | | | | 1,020.83 | | | | 0.80 | | | | 4.01 | |
| |
Short-Duration Bond Fund — Class I | | | | | | | | | | | | | | | | |
| |
Actual Fund Return | | $ | 1,000.00 | | | $ | 1,004.70 | | | | 0.55 | % | | $ | 2.73 | |
Hypothetical 5% Return | | | 1,000.00 | | | | 1,022.07 | | | | 0.55 | | | | 2.76 | |
| |
| * | | Expenses are equal to the Fund’s annualized expense ratio multiplied by the average account value over the period, multiplied by 181/365 (to reflect the one-half year period). |
52
| | | | |
| Bishop Street Funds | | | (unaudited) | |
Approval of Investment Advisory Agreement
Pursuant to Section 15 of the Investment Company Act of 1940 (the “1940 Act”), the Funds’ advisory and sub-advisory agreements must be renewed after their initial two-year term: (i) by the vote of the Board of Trustees (the “Board” or the “Trustees”) of Bishop Street Funds (the “Trust”) or by a vote of a majority of the shareholders of the Funds; and (ii) by the vote of a majority of the Trustees who are not parties to the advisory or sub-advisory agreements or “interested persons” of any party thereto, as defined in the 1940 Act (the “Independent Trustees”), cast in person at a meeting called for the purpose of voting on such renewal.
A Board meeting was held on March 1, 2017 to decide whether to renew the following agreements (the “Agreements”) for additional one-year terms:
| | • | | the advisory agreement between Bishop Street Capital Management (the “Adviser”) and the Trust, on behalf of the Bishop Street Hawaii Municipal Bond Fund, Bishop Street High Grade Income Fund, Bishop Street Dividend Value Fund, and Bishop Street Short Duration Bond Fund; and |
| | • | | the sub-advisory agreement between the Adviser and Columbia Management Investment Advisers, LLC (the “Sub-Adviser”) on behalf of the Bishop Street Dividend Value Fund. |
In preparation for the meeting, the Trustees requested that the Adviser and the Sub-Adviser furnish information necessary to evaluate the terms of the Agreements. Prior to the meeting, the Independent Trustees of the Funds met to review and discuss the information provided and submitted a request for additional information to the Adviser, and information was provided in response to this request. The Trustees used this information, as well as other information that the Adviser, the Sub-Adviser and other service providers of the Funds presented or submitted to the Board at the meeting and other meetings held during the prior year, to help them decide whether to renew the Agreements for an additional year.
Specifically, the Board requested and received written materials from the Adviser, the Sub-Adviser and other service providers of the Funds regarding: (i) the nature, extent and quality of the Adviser’s and the Sub-Adviser’s services; (ii) the Adviser’s and the Sub-Adviser’s investment management personnel; (iii) the Adviser’s and the Sub-Adviser’s operations and financial condition; (iv) the Adviser’s and the Sub-Adviser’s brokerage practices (including any soft dollar arrangements) and investment strategies; (v) the Funds’ advisory fees paid to the Adviser and the Sub-Adviser and overall fees and operating expenses compared with peer groups of mutual funds; (vi) the level of the Adviser’s and the Sub-Adviser’s profitability from their relationships with the Funds, including both direct and indirect benefits accruing to the Adviser and the Sub-Adviser and their affiliates; (vii) the Adviser’s and the Sub-Adviser’s potential economies of scale; (viii) the Adviser’s and the Sub-Adviser’s compliance programs, including a description of material compliance matters and material compliance violations;
| | | | |
| June 30, 2017 | | | | www.bishopstreetfunds.com |
53
| | | | |
| Bishop Street Funds | | | (unaudited) | |
(ix) the Adviser’s and the Sub-Adviser’s policies on and compliance procedures for personal securities transactions; and (x) the Funds’ performance compared with peer groups of mutual funds and the Funds’ benchmark indices.
Representatives from the Adviser and the Sub-Adviser, along with other Fund service providers, presented additional information and participated in question and answer sessions at the Board meeting to help the Trustees evaluate the Adviser’s and the Sub-Adviser’s services, fees and other aspects of the Agreements. The Independent Trustees received advice from independent counsel and met in executive sessions outside the presence of Fund management, the Adviser and the Sub-Adviser.
At the Board meeting, the Trustees, including all of the Independent Trustees, based on their evaluation of the information provided by the Adviser, the Sub-Adviser and other service providers of the Funds, renewed the Agreements. In considering the renewal of the Agreements, the Board considered various factors that they determined were relevant, including: (i) the nature, extent and quality of the services provided by the Adviser and the Sub-Adviser; (ii) the investment performance of the Funds and the Adviser and the Sub-Adviser; (iii) the costs of the services provided and profits realized by the Adviser and the Sub-Adviser from their relationships with the Funds, including both direct and indirect benefits accruing to the Adviser and the Sub-Adviser and their affiliates; (iv) the extent to which economies of scale are being realized by the Adviser and the Sub-Adviser; and (v) whether fee levels reflect such economies of scale for the benefit of Fund investors, as discussed in further detail below.
Nature, Extent and Quality of Services Provided by the Adviser and the Sub-Adviser
In considering the nature, extent and quality of the services provided by the Adviser and the Sub-Adviser, the Board reviewed the portfolio management services provided by the Adviser and the Sub-Adviser to the Funds, including the quality and continuity of the Adviser’s and the Sub-Adviser’s portfolio management personnel, the resources of the Adviser and the Sub-Adviser, and the Adviser’s and the Sub-Adviser’s compliance histories and compliance programs. The Trustees reviewed the terms of the Agreements. The Trustees also reviewed the Adviser’s and the Sub-Adviser’s investment and risk management approaches for the Funds. The Trustees considered that the Adviser supervises and monitors the performance of the Sub-Adviser. The most recent investment adviser registration forms (“Form ADV”) for the Adviser and the Sub-Adviser were provided to the Board, as were the responses of the Adviser and the Sub-Adviser to a detailed series of questions which included, among other things, information about the investment advisory services provided by the Adviser and the Sub-Adviser to the Funds.
54
The Trustees also considered other services provided to the Funds by the Adviser and the Sub-Adviser such as selecting broker-dealers for executing portfolio transactions, monitoring adherence to the Funds’ investment restrictions, and monitoring compliance with various Fund policies and procedures and with applicable securities laws and regulations. Based on the factors above, as well as those discussed below, the Board concluded, within the context of its full deliberations, that the nature, extent and quality of the services provided to the Funds by the Adviser and the Sub-Adviser were sufficient to support renewal of the Agreements.
Investment Performance of the Funds, the Adviser and the Sub-Adviser
The Board was provided with regular reports regarding the Funds’ performance over various time periods, including since their inception, and information regarding the Funds’ performance since the Agreements were last renewed. The Trustees also reviewed reports prepared by the Funds’ administrator comparing the Funds’ performance to their benchmark indices and peer groups of mutual funds as classified by Lipper, an independent provider of investment company data, over various periods of time. Representatives from the Adviser and the Sub-Adviser provided information regarding and led discussions of factors impacting the performance of the Funds, outlining current market conditions and explaining their expectations and strategies for the future. The Trustees determined that the Funds’ performance was satisfactory, or, where the Funds’ performance was materially below their benchmarks and/or peer groups, the Trustees were satisfied by the reasons for the underperformance and/or the steps taken by the Adviser and the Sub-Adviser in an effort to improve the performance of the Funds. Based on this information, the Board concluded, within the context of its full deliberations, that the investment results that the Adviser and the Sub-Adviser had been able to achieve for the Funds were sufficient to support renewal of the Agreements.
Costs of Advisory Services, Profitability and Economies of Scale
In considering the advisory fees payable by the Funds to the Adviser, as well as the fees payable by the Adviser to the Sub-Adviser, the Trustees reviewed, among other things, a report of the advisory fees paid to the Adviser and the Sub-Adviser. The Trustees also reviewed reports prepared by the Funds’ administrator comparing the Funds’ net and gross expense ratios and advisory fees to those paid by peer groups of mutual funds as classified by Lipper. The Trustees reviewed the management fees charged by the Sub-Adviser to other clients with comparable mandates. The Trustees considered any differences in management fees and took into account the respective demands, resources and complexity associated with the Bishop Street Dividend Value Fund and other client accounts as well as the extensive regulatory, compliance and tax regimes to which the Fund is subject. The Trustees also considered that the Adviser, not the Bishop Street Dividend Value Fund, paid the Sub-Adviser pursuant to
| | | | |
| June 30, 2017 | | | | www.bishopstreetfunds.com |
55
| | | | |
| Bishop Street Funds | | | (unaudited) | |
the sub-advisory agreement and that the fee payable to the Sub-Adviser reflected an arms-length negotiation between the Adviser and the Sub-Adviser. The Trustees evaluated both the fee under the sub-advisory agreement and the portion of the fee under the advisory agreement retained by the Adviser. The Board concluded, within the context of its full deliberations, that the advisory fees were reasonable in light of the nature and quality of the services rendered by the Adviser and the Sub-Adviser.
The Trustees reviewed the costs of services provided by and the profits realized by the Adviser and the Sub-Adviser from their relationship with the Funds, including both direct benefits and indirect benefits, such as research and brokerage services received under soft dollar arrangements, accruing to the Adviser and the Sub-Adviser and their affiliates. The Trustees considered how the Adviser’s and the Sub-Adviser’s profitability was affected by factors such as their organizational structures and methods for allocating expenses. The Trustees concluded that the profit margins of the Adviser and the Sub-Adviser with respect to the management of the Funds were not unreasonable. The Board also considered the Adviser’s and the Sub-Adviser’s commitment to managing the Funds and the Adviser’s willingness to continue its expense limitation and fee waiver arrangements with the Funds.
The Trustees considered the Adviser’s and Sub-Adviser’s views relating to economies of scale in connection with the Funds as Fund assets grow and the extent to which the benefits of any such economies of scale are shared with the Funds and Fund shareholders. The Board considered the existence of any economies of scale and whether those were passed along to the Funds’ shareholders through a graduated advisory fee schedule or other means, including fee waivers. The Trustees recognized that economies of scale are difficult to identify and quantify and are rarely identifiable on a fund-by-fund basis. Based on this evaluation, the Board concluded that the advisory fees were reasonable in light of the information that was provided to the Trustees by the Adviser and the Sub-Adviser with respect to economies of scale.
Renewal of the Agreements
Based on the Board’s deliberations and its evaluation of the information described above and other factors and information it believed relevant in the exercise of its reasonable business judgment, the Board, including all of the Independent Trustees, with the assistance of Fund counsel and Independent Trustees’ counsel, unanimously concluded that the terms of the Agreements, including the fees payable thereunder, were fair and reasonable and agreed to renew the Agreements for another year. In its deliberations, the Board did not identify any absence of information as material to its decision, or any particular factor (or conclusion with respect thereto) or single piece of information that was all-important, controlling or determinative of its decision, but considered all of the factors together, and each Trustee may have attributed different weights to the various factors (and conclusions with respect thereto) and information.
56
INVESTMENT ADVISER
BISHOP STREET CAPITAL MANAGEMENT
HONOLULU, HI 96813
ADMINISTRATOR
SEI INVESTMENTS GLOBAL FUNDS SERVICES
ONE FREEDOM VALLEY DRIVE
OAKS, PA 19456
DISTRIBUTOR
SEI INVESTMENTS DISTRIBUTION CO.
ONE FREEDOM VALLEY DRIVE
OAKS, PA 19456
TRANSFER AGENT
DST SYSTEMS, INC.
KANSAS CITY, MO 64121
CUSTODIAN
MUFG UNION BANK, N.A.
SAN FRANCISCO, CA 94101
LEGAL COUNSEL
MORGAN, LEWIS & BOCKIUS LLP
PHILADELPHIA, PA 19103
INDEPENDENT REGISTERED PUBLIC ACCOUNTING FIRM
PRICEWATERHOUSECOOPERS LLP
PHILADELPHIA, PA 19103

FORMOREINFORMATIONABOUT BISHOP STREET FUNDS,CALL 1-800-262-9565
ORYOUR INVESTMENT SPECIALIST
VISITUSONLINEATWWW.BISHOPSTREETFUNDS.COM
| | |
 | | BISHOP STREET FUNDS P.O. BOX 219721 KANSAS CITY, MO 64121-9721 |
THISREPORTANDTHEFINANCIALSTATEMENTSCONTAINEDHEREINARESUBMITTEDFORTHEGENERALINFORMATIONOF BISHOP STREET FUNDS’SHAREHOLDERS. THISREPORTISNOTAUTHORIZEDFORDISTRIBUTIONTOPROSPECTIVEINVESTORSUNLESSPRECEDEDORACCOMPANIEDBYANEFFECTIVEPROSPECTUS.
SHARESOF BISHOP STREET FUNDSARE NOTDEPOSITSOROBLIGATIONSOF,ORGUARANTEEDBY FIRST HAWAIIAN BANKORANYOFITSAFFILIATES. SUCHSHARESAREALSO NOTFEDERALLYINSUREDBYTHE FEDERAL DEPOSIT INSURANCE CORPORATION, THE FEDERAL RESERVE BOARD,ORANYOTHERAGENCY. INVESTMENTINSHARESOFMUTUALFUNDSINVOLVESRISK,INCLUDINGTHEPOSSIBLELOSSOFPRINCIPAL. THE BISHOP STREET FUNDSAREDISTRIBUTEDBY SEI INVESTMENTS DISTRIBUTION CO.,WHICHIS NOTAFFILIATEDWITH FIRST HAWAIIAN BANK, BANKOFTHE WESTOR BANCWEST CORPORATION. BANCWEST CORPORATIONISAWHOLLY-OWNEDSUBSIDIARYOF BNP PARIBAS.
BSF-SA-004-2300
Not applicable for semi-annual report.
| Item 3. | Audit Committee Financial Expert. |
Not applicable for semi-annual report.
| Item 4. | Principal Accountant Fees and Services. |
Not applicable for semi-annual report.
| Item 5. | Audit Committee of Listed Registrants. |
Not applicable to open-end management investment companies.
| Item 6. | Schedule of Investments. |
Schedule of Investments is included as part of the Report to Shareholders filed under Item 1 of this form.
| Item 7. | Disclosure of Proxy Voting Policies and Procedures for Closed-End Management Investment Companies. |
Not applicable to open-end management investment companies.
| Item 8. | Portfolio Managers of Closed-End Management Investment Companies. |
Not applicable. Effective for closed-end management investment companies for fiscal years ending on or after December 31, 2005.
| Item 9. | Purchases of Equity Securities by Closed-End Management Company and Affiliated Purchasers. |
Not applicable to open-end management investment companies.
| Item 10. | Submission of Matters to a Vote of Security Holders. |
There have been no changes to the procedures by which shareholders may recommend nominees to the Registrant’s Board of Trustees during the period covered by this report.
| Item 11. | Controls and Procedures. |
(a) The Registrant’s principal executive and principal financial officers, or persons performing similar functions, have concluded that the Registrant’s disclosure controls and procedures (as defined in Rule 30a-3(c) under the Act (17 CFR 270.30a-3(c))) as of a date within 90 days of the filing date of the report, are effective based on the evaluation of these controls and procedures required by Rule 30a-3(b) under the Act (17 CFR 270.30a-3(b)) and Rules 13a-15(b) or 15d-15(b) under the Exchange Act (17 CFR 240.30a-15(b)) or 240.15d-15(b)).
(b) There has been no change in the Registrant’s internal control over financial reporting (as defined in Rule 30a-3(d) under the Act (17 CFR 270.30a-3(d)) that occurred during the second fiscal quarter of the period covered by this report that has materially affected, or is reasonably likely to materially affect, the Registrant’s internal control over financial reporting.
(a)(1) Not applicable for semi-annual report.
(a)(2) A separate certification for the principal executive officer and the principal financial officer of the Registrant as required by Rule 30a-2(a) under the Investment Company Act of 1940, as amended (17 CFR 270.30a-2(a)), is filed herewith.
(b) Officer certifications as required by Rule 30a-2(b) under the Investment Company Act of 1940, as amended (17 CFR 270.30a-2(b)) also accompany this filing as an exhibit.
SIGNATURES
Pursuant to the requirements of the Securities Exchange Act of 1934 and the Investment Company Act of 1940, the Registrant has duly caused this report to be signed on its behalf by the undersigned, thereunto duly authorized.
| | | | | | |
| (Registrant) | | | | | | Bishop Street Funds |
| | | |
| By (Signature and Title)* | | | | | | /s/ Michael Beattie |
| | | | | | Michael Beattie |
| | | | | | President |
Date: September 8, 2017
Pursuant to the requirements of the Securities Exchange Act of 1934 and the Investment Company Act of 1940, this report has been signed below by the following persons on behalf of the Registrant and in the capacities and on the dates indicated.
| | | | | | |
| By (Signature and Title)* | | | | | | /s/ Michael Beattie |
| | | | | | Michael Beattie |
| | | | | | President |
Date: September 8, 2017
| | | | | | |
| By (Signature and Title)* | | | | | | /s/ Stephen Connors |
| | | | | | Stephen Connors |
| | | | | | Treasurer, Controller & CFO |
Date: September 8, 2017