UNITED STATES
SECURITIES AND EXCHANGE COMMISSION
Washington, D.C. 20549
FORM N-CSR
Certified Shareholder Report of
Registered Management Investment Companies
Investment Company Act File Number: 811-08576
American High-Income Municipal Bond Fund
(Exact Name of Registrant as Specified in Charter)
333 South Hope Street
Los Angeles, California 90071
(Address of Principal Executive Offices)
Registrant's telephone number, including area code: (213) 486-9200
Date of fiscal year end: July 31
Date of reporting period: January 31, 2017
Steven I. Koszalka
American High-Income Municipal Bond Fund
333 South Hope Street
Los Angeles, California 90071
(Name and Address of Agent for Service)
ITEM 1 – Reports to Stockholders
![]()
 | American Funds Short-Term Tax-Exempt Bond Fund®
Semi-annual reports for the six months |
American Funds Short-Term Tax-Exempt Bond Fund seeks to provide you with current income exempt from regular federal income tax, consistent with the maturity and quality standards described in the prospectus, and to preserve capital.
Limited Term Tax-Exempt Bond Fund of America seeks to provide you with current income exempt from regular federal income tax, consistent with the maturity and quality standards described in the prospectus, and to preserve capital.
The Tax-Exempt Bond Fund of America seeks to provide you with a high level of current income exempt from federal income tax, consistent with the preservation of capital.
American High-Income Municipal Bond Fund seeks to provide you with a high level of current income exempt from regular federal income tax.
The Tax-Exempt Fund of California seeks to provide you with a high level of current income exempt from regular federal and California state income taxes. Its secondary objective is preservation of capital.
American Funds Tax-Exempt Fund of New York seeks to provide you with a high level of current income exempt from regular federal, New York state and New York City income taxes. Its secondary objective is preservation of capital.
Each fund is one of more than 40 offered by one of the nation’s largest mutual fund families, American Funds, from Capital Group. For more than 85 years, Capital has invested with a long-term focus based on thorough research and attention to risk.
Fund results shown in this report, unless otherwise indicated, are for Class A shares at net asset value. If a sales charge had been deducted (maximum 2.50% for American Funds Short-Term Tax-Exempt Bond Fund and Limited Term Tax-Exempt Bond Fund of America; 3.75% for The Tax-Exempt Bond Fund of America, American High-Income Municipal Bond Fund, The Tax-Exempt Fund of California and American Funds Tax-Exempt Fund of New York), the results would have been lower. Results are for past periods and are not predictive of results for future periods. Current and future results may be lower or higher than those shown. Share prices and returns will vary, so investors may lose money. Investing for short periods makes losses more likely. Investments are not FDIC-insured, nor are they deposits of or guaranteed by a bank or any other entity, so they may lose value. For current information and month-end results, visit americanfunds.com.
Here are the total returns on a $1,000 investment with all distributions reinvested for periods ended December 31, 2016 (the most recent calendar quarter-end), and the total annual fund operating expense ratios as of the prospectus dated January 1, 2017.
| Cumulative total returns | Average annual total returns | Gross | ||||||||||||||
| Class A shares | 1 year | 5 years | 10 years/Lifetime* | expense ratios | ||||||||||||
| Reflecting 2.50% maximum sales charge | ||||||||||||||||
| American Funds Short-Term Tax-Exempt Bond Fund | –2.53 | % | 0.18 | % | 1.05 | % | 0.59 | % | ||||||||
| Limited Term Tax-Exempt Bond Fund of America | –2.75 | 1.11 | 2.76 | 0.59 | ||||||||||||
| Reflecting 3.75% maximum sales charge | ||||||||||||||||
| The Tax-Exempt Bond Fund of America | –3.41 | 2.96 | 3.55 | 0.54 | ||||||||||||
| American High-Income Municipal Bond Fund | –2.27 | 5.11 | 3.86 | 0.67 | ||||||||||||
| The Tax-Exempt Fund of California | –3.86 | 3.41 | 3.75 | 0.60 | ||||||||||||
| American Funds Tax-Exempt Fund of New York | –3.75 | 2.41 | 3.10 | 0.72 | † | |||||||||||
| * | Applicable only to American Funds Tax-Exempt Fund of New York, which began operations on 11/1/10. All other funds reflect 10-year results. |
| † | The net expense ratio for American Funds Tax-Exempt Fund of New York is 0.69% as of the prospectus dated January 1, 2017. |
For other share class results, visit americanfunds.com.
The 10-year investment result for American Funds Short-Term Tax-Exempt Bond Fund includes the fund’s results as a money market fund through the date of its conversion (August 7, 2009) to a short-term tax-exempt bond fund, and therefore is not representative of the fund’s results had it operated as a short-term tax-exempt bond fund for the full term of that period. Investment results assume all distributions are reinvested and reflect applicable fees and expenses. When applicable, investment results reflect fee waivers and/or expense reimbursements, without which results would have been lower. The investment adviser is currently reimbursing a portion of other expenses for American Funds Tax-Exempt Fund of New York. Investment results reflect the reimbursement, without which the results would have been lower. This reimbursement will be in effect through at least January 1, 2018, unless modified or terminated by the fund’s board. The adviser may elect at its discretion to extend, modify or terminate the reimbursement at that time. Visit americanfunds.com for more information.
A summary of each fund’s 30-day yield can be found on page 3.
Fellow investors:
This report covers the results of American Funds Short-Term Tax-Exempt Bond Fund, Limited Term Tax-Exempt Bond Fund of America, The Tax-Exempt Bond Fund of America, American High-Income Municipal Bond Fund, The Tax-Exempt Fund of California and American Funds Tax-Exempt Fund of New York for the six months ended January 31, 2017.
Volatility returned to the municipal bond market during the first half of the funds’ fiscal year as investors weighed the potential impact of the U.S. presidential election, strengthening economic conditions and rising interest rates. The market was further pressured by a record level of municipal bond issuance in 2016. Against this backdrop, all six funds registered declines, ranging from –0.92% for American Funds Short-Term Tax-Exempt Bond Fund to –3.77% for American High-Income Municipal Bond Fund. (See pages 4 through 10 for fund specific results and information.)
Economic and market overview
The first half of the fiscal year began as the prior ended, with a strong showing for municipal bond markets on the whole. In August, the unmanaged Bloomberg Barclays Municipal Bond Index, a broad measure of the tax-exempt investment-grade market (bonds rated BBB/Baa and above), recorded its 14th consecutive month of positive returns. By September, however, that trend reversed sharply and the tax-exempt market experienced a high level of volatility.
This abrupt shift in market sentiment was attributable to several factors, including upbeat economic news. Gross Domestic Product (GDP) rose an annualized rate of 3.5% in the third quarter of 2016, up from 1.4% in the second. Wages also improved, climbing nearly 3.0% year over year in December. In response to expectations for tax cuts and a pro-growth agenda from the new administration, bond yields spiked in November and December.
Inflation expectations also increased significantly. In December, U.S. consumer prices rose 2.1% on a year-over-year basis, the largest inflation bump since June 2014. In a widely anticipated move, the U.S. Federal Reserve raised the federal funds target rate to a range of 0.50%–0.75% in mid-December. Longer term interest rates also rose during the period, depressing U.S. Treasury bond prices. Tax-exempt bonds sold off along with the broader bond market.
Municipal bond issuance reached an all-time high in 2016, further pressuring the market. The year’s $445 billion in offerings — driven by refundings mid-year as issuers looked to take advantage of low borrowing costs — eclipsed the old record of $433 billion set in 2010. After experiencing inflows for the first 10 months of the year, muni fund flows turned negative in November and December, further contributing to the volatility.
In the closing weeks of the period however, fund flows turned positive
| American Funds Tax-Exempt Funds | 1 |

again, helping drive a modest muni market rebound.
In general, municipal bonds of lower credit quality suffered more pronounced declines than higher rated issues, and longer term bonds tended to trail those with shorter maturities. Given the accelerating growth of the U.S. economy and anticipation of the Fed’s rate hike in December, most of the funds covered in this report entered the period with a conservative approach, maintaining a relatively short duration position. This helped mitigate the worst of the declines during the heightened volatility that characterized the final months of the calendar year. That said, the funds tended to lag the broader market during the rebound that occurred during the closing weeks of the period.
Looking ahead
As we look to the months ahead, there remains a great deal of uncertainty. The United States economy appears to be gaining momentum, and bond and equity markets alike have appeared to price in the potential effect of any shifts in policy under President Trump. That said, it is important to recognize that the details of future policy and their potential impact remain unclear. The possibility of both higher inflation and interest rates presents further challenges for municipal bond investors. Fed officials have in fact signaled that more rate increases are likely in 2017.
At this time we do not expect municipal bond returns to match the strong levels of the last few years. Faced with higher uncertainty and probable market volatility, we expect to maintain relatively neutral duration and curve investment positions. That being said, we believe that in the current low-yield environment we may continue to uncover potentially compelling income opportunities through comprehensive credit research.
We appreciate the trust you have placed in us and look forward to reporting back to you at the close of the fiscal year.
Sincerely,

Neil L. Langberg
President, American Funds Short-Term
Tax-Exempt Bond Fund, Limited Term
Tax-Exempt Bond Fund of America,
The Tax-Exempt Bond Fund of America
and The Tax-Exempt Fund of California

Jerry H. Solomon
President, American Funds Tax-Exempt
Fund of New York

Karl J. Zeile
President, American High-Income
Municipal Bond Fund
March 17, 2017
For current information about the funds, visit americanfunds.com.
| 2 | American Funds Tax-Exempt Funds |
Funds’ 30-day yields
Below is a summary of each fund’s 30-day yield and 12-month distribution rate for Class A shares as of February 28, 2017. Both measures reflect the 2.50%/3.75% maximum sales charge. Each fund’s 30-day yield is calculated in accordance with the U.S. Securities and Exchange Commission (SEC) formula. The SEC yield reflects the rate at which each fund is earning income on its current portfolio of securities while the distribution rate reflects the funds’ past dividends paid to shareholders. Accordingly, the funds’ SEC yields and distribution rates may differ. The equivalent taxable yield assumes a 43.4% tax rate.1
| Class A shares | SEC 30-day yield | Equivalent taxable yield | 12-month distribution rate | |||||||||
| Reflecting 2.50% maximum sales charge | ||||||||||||
| American Funds Short-Term Tax-Exempt Bond Fund | 1.06 | % | 1.87 | % | 1.06 | % | ||||||
| Limited Term Tax-Exempt Bond Fund of America | 1.31 | 2.31 | 2.00 | |||||||||
| Reflecting 3.75% maximum sales charge | ||||||||||||
| The Tax-Exempt Bond Fund of America | 2.17 | 3.83 | 3.02 | |||||||||
| American High-Income Municipal Bond Fund | 3.35 | 5.92 | 3.68 | |||||||||
| The Tax-Exempt Fund of California | 2.01 | 4.10 | 2 | 2.96 | ||||||||
| American Funds Tax-Exempt Fund of New York | 2.10 | 3 | 4.07 | 4 | 2.42 | |||||||
| 1 | Based on 2016 federal tax rates. For the year 2016, there will be an Unearned Income Medicare Contribution Tax of 3.8% that applies to net investment income for taxpayers whose modified adjusted gross income exceeds $200,000 (for single filers) and $250,000 (for married filing jointly). Thus taxpayers in the highest tax bracket will face a combined 43.4% marginal tax rate on their investment income. The federal rates do not include an adjustment for the loss of personal exemptions and the phaseout of itemized deductions that are applicable to certain taxable income levels. |
| 2 | For investors in the 50.93% federal and California state tax bracket. |
| 3 | The SEC 30-day yield for American Funds Tax-Exempt Fund of New York is 2.10% with the fund’s reimbursement. |
| 4 | For investors in the 48.39% federal and New York state tax bracket. |
The return of principal for bond funds and for funds with significant underlying bond holdings is not guaranteed. Fund shares are subject to the same interest rate, inflation and credit risks associated with the underlying bond holdings. Income may be subject to state or local income taxes and/or federal alternative minimum taxes. Also, certain other income (such as distributions from gains on the sale of certain bonds purchased at less than par value, for The Tax-Exempt Bond Fund of America), as well as capital gain distributions, may be taxable. High-yield/lower rated bonds are subject to greater fluctuations in value and risk of loss of income and principal than investment-grade/higher rated bonds. The Tax-Exempt Fund of California and American Funds Tax-Exempt Fund of New York are more susceptible to factors adversely affecting issuers of each state’s tax-exempt securities than a more widely diversified municipal bond fund. Refer to the funds’ prospectus and the Risk Factors section of this report for more information on these and other risks associated with investing in the funds.
| American Funds Tax-Exempt Funds | 3 |
American Funds Short-Term Tax-Exempt Bond Fund
The fund registered a total return of –0.92% for the first half of the fiscal year, trailing the –0.68% return of the Lipper Short Municipal Debt Funds Average, a peer group measure. The fund also lagged the –0.88% decline of the Bloomberg Barclays Municipal Short 1–5 Years Index.
The fund paid monthly dividends totaling 6 cents a share for the six months. This amounts to a federally tax-exempt income return of 0.55% for investors who reinvested dividends. This is equivalent to a taxable income return of 0.97% for investors in the 43.4%1 maximum federal tax bracket. A portion of the fund’s return also may be exempt from some state and local taxes.
In an uncertain market environment, the fund’s managers sought to provide relative stability. With yields near multiyear lows, the fund maintained its focus on high-quality issues of shorter duration. Municipal bonds on the whole struggled during the period; among the fund’s biggest detractors were revenue bonds supporting single-family housing and hospital facilities.
The market index is unmanaged and, therefore, has no expenses. Investors cannot invest directly in an index. Bloomberg Barclays source: Bloomberg Index Services Ltd. Lipper averages reflect the current composition of all eligible mutual funds (all share classes) within a given category. Lipper source: Thomson Reuters Lipper.
Tax-exempt yields vs. taxable yields
Find your estimated taxable income below to determine your federal tax rate,2 then look in the far right column to see what you would have had to earn from a taxable investment to equal the fund’s 1.06% tax-exempt distribution rate3 as of January 31, 2017.
| If your taxable income is … | … then your federal | The fund’s tax-exempt distribution rate of 1.06% is | ||||||||||||||
| Single | Joint | tax rate is … | equivalent to a taxable rate of … | |||||||||||||
| $ | 0 – | 9,275 | $ | 0 – | 18,550 | 10.0 | % | 1.18 | % | |||||||
| 9,276 – | 37,650 | 18,551 – | 75,300 | 15.0 | 1.25 | |||||||||||
| 37,651 – | 91,150 | 75,301 – | 151,900 | 25.0 | 1.41 | |||||||||||
| 91,151 – | 190,150 | 151,901 – | 231,450 | 28.0 | 1.47 | |||||||||||
| 190,151 – | 413,350 | 231,451 – | 413,350 | 36.8 | 1 | 1.68 | ||||||||||
| 413,351 – | 415,050 | 413,351 – | 466,950 | 38.8 | 1 | 1.73 | ||||||||||
| Over 415,050 | Over 466,950 | 43.4 | 1 | 1.87 | ||||||||||||
| 1 | For the year 2016, there will be an Unearned Income Medicare Contribution Tax of 3.8% that applies to net investment income for taxpayers whose modified adjusted gross income exceeds $200,000 (for single filers) and $250,000 (for married filing jointly). Thus taxpayers in the highest tax bracket will face a combined 43.4% marginal tax rate on their investment income. |
| 2 | Based on 2016 federal tax rates. The federal rates do not include an adjustment for the loss of personal exemptions and the phaseout of itemized deductions that are applicable to certain taxable income levels. |
| 3 | The distribution rate is based on dividends paid over the last 12 months divided by the maximum offering price as of January 31, 2017. Capital gain distributions, if any, are added back at the maximum offering price to determine the rate. |
Fund results shown are for Class A shares at net asset value. If a sales charge (maximum 2.50%) had been deducted, the results would have been lower. Results are for past periods and are not predictive of results for future periods. Current and future results may be lower or higher than those shown. Share prices and returns will vary, so investors may lose money. For current information and month-end results, visit americanfunds.com.
| 4 | American Funds Tax-Exempt Funds |
Limited Term Tax-Exempt Bond Fund of America
The fund recorded a decline of –1.75% for the six months ended January 31, a result that bested the –1.91% total return of the Bloomberg Barclays Municipal Short-Intermediate 1–10 Years Index. The fund’s result was in line with the –1.78% total return of the Lipper Short-Intermediate Municipal Debt Funds Average, a peer group measure.
The fund paid monthly dividends totaling 16 cents a share for the period. Those individuals who reinvested dividends received a federally tax-exempt income return of 1.00%. This is equivalent to a taxable income return of 1.77% for investors in the 43.4%1 maximum federal tax bracket.
The fund focuses primarily on investment-grade bonds (those rated BBB/Baa and above). The fund’s managers positioned the portfolio fairly conservatively, seeking to maintain a relatively short duration. This approach dampened returns to an extent as the broader municipal bond market experienced a solid rebound in the final weeks of the period.
The market index is unmanaged and, therefore, has no expenses. Investors cannot invest directly in an index. Bloomberg Barclays source: Bloomberg Index Services Ltd. Lipper averages reflect the current composition of all eligible mutual funds (all share classes) within a given category. Lipper source: Thomson Reuters Lipper.
Tax-exempt yields vs. taxable yields
Find your estimated taxable income below to determine your federal tax rate,2 then look in the far right column to see what you would have had to earn from a taxable investment to equal the fund’s 2.02% tax-exempt distribution rate3 as of January 31, 2017.
| If your taxable income is … | ... then your federal | The fund’s tax-exempt distribution rate of 2.02% is | ||||||||||||||
| Single | Joint | tax rate is … | equivalent to a taxable rate of ... | |||||||||||||
| $ | 0 – | 9,275 | $ | 0 – | 18,550 | 10.0 | % | 2.24 | % | |||||||
| 9,276 – | 37,650 | 18,551 – | 75,300 | 15.0 | 2.38 | |||||||||||
| 37,651 – | 91,150 | 75,301 – | 151,900 | 25.0 | 2.69 | |||||||||||
| 91,151 – | 190,150 | 151,901 – | 231,450 | 28.0 | 2.81 | |||||||||||
| 190,151 – | 413,350 | 231,451 – | 413,350 | 36.8 | 1 | 3.20 | ||||||||||
| 413,351 – | 415,050 | 413,351 – | 466,950 | 38.8 | 1 | 3.30 | ||||||||||
| Over 415,050 | Over 466,950 | 43.4 | 1 | 3.57 | ||||||||||||
| 1 | For the year 2016, there will be an Unearned Income Medicare Contribution Tax of 3.8% that applies to net investment income for taxpayers whose modified adjusted gross income exceeds $200,000 (for single filers) and $250,000 (for married filing jointly). Thus taxpayers in the highest tax bracket will face a combined 43.4% marginal tax rate on their investment income. |
| 2 | Based on 2016 federal tax rates. The federal rates do not include an adjustment for the loss of personal exemptions and the phaseout of itemized deductions that are applicable to certain taxable income levels. |
| 3 | The distribution rate is based on dividends paid over the last 12 months divided by the maximum offering price as of January 31, 2017. Capital gain distributions, if any, are added back at the maximum offering price to determine the rate. |
Fund results shown are for Class A shares at net asset value. If a sales charge (maximum 2.50%) had been deducted, the results would have been lower. Results are for past periods and are not predictive of results for future periods. Current and future results may be lower or higher than those shown. Share prices and returns will vary, so investors may lose money. For current information and month-end results, visit americanfunds.com.
| American Funds Tax-Exempt Funds | 5 |
The Tax-Exempt Bond Fund of America
The fund logged a total return of –3.37% during the six-month period, a result that was in line with the –3.34% decline of the Bloomberg Barclays Municipal Bond Index. However, the fund outpaced the –3.59% total return of the Lipper General & Insured Municipal Debt Funds Average, a peer group measure.
During the period, the fund paid monthly dividends totaling 20 cents a share, amounting to a federally tax-exempt income return of 1.51% for investors who reinvested dividends. This is equivalent to a taxable income return of 2.67% for investors in the 43.4%1 maximum federal tax bracket. The fund does not invest in bonds subject to the Alternative Minimum Tax (AMT).
The fund’s managers continued on a relatively conservative path during the first half of the fiscal year, focusing on minimizing risk in an uncertain environment. They continue to seek out opportunities for incremental yield through deep credit research while remaining mindful of improving economic conditions and the potential for rising interest rates. At the close of the period about 93% of the portfolio consisted of revenue bonds. The largest concentrations were in holdings backing health care and transportation initiatives.
Amid declines across most areas of the market, holdings of bonds supporting hospital facilities were particularly detrimental to fund returns.
The market index is unmanaged and, therefore, has no expenses. Investors cannot invest directly in an index. Bloomberg Barclays source: Bloomberg Index Services Ltd. Lipper averages reflect the current composition of all eligible mutual funds (all share classes) within a given category. Lipper source: Thomson Reuters Lipper.
Tax-exempt yields vs. taxable yields
Find your estimated taxable income below to determine your federal tax rate,2 then look in the far right column to see what you would have had to earn from a taxable investment to equal the fund’s 3.04% tax-exempt distribution rate3 as of January 31, 2017.
| If your taxable income is … | ... then your federal | The fund’s tax-exempt distribution rate of 3.04% is | ||||||||||||||
| Single | Joint | tax rate is … | equivalent to a taxable rate of ... | |||||||||||||
| $ | 0 – | 9,275 | $ | 0 – | 18,550 | 10.0 | % | 3.38 | % | |||||||
| 9,276 – | 37,650 | 18,551 – | 75,300 | 15.0 | 3.58 | |||||||||||
| 37,651 – | 91,150 | 75,301 – | 151,900 | 25.0 | 4.05 | |||||||||||
| 91,151 – | 190,150 | 151,901 – | 231,450 | 28.0 | 4.22 | |||||||||||
| 190,151 – | 413,350 | 231,451 – | 413,350 | 36.8 | 1 | 4.81 | ||||||||||
| 413,351 – | 415,050 | 413,351 – | 466,950 | 38.8 | 1 | 4.97 | ||||||||||
| Over 415,050 | Over 466,950 | 43.4 | 1 | 5.37 | ||||||||||||
| 1 | For the year 2016, there will be an Unearned Income Medicare Contribution Tax of 3.8% that applies to net investment income for taxpayers whose modified adjusted gross income exceeds $200,000 (for single filers) and $250,000 (for married filing jointly). Thus taxpayers in the highest tax bracket will face a combined 43.4% marginal tax rate on their investment income. |
| 2 | Based on 2016 federal tax rates. The federal rates do not include an adjustment for the loss of personal exemptions and the phaseout of itemized deductions that are applicable to certain taxable income levels. |
| 3 | The distribution rate is based on dividends paid over the last 12 months divided by the maximum offering price as of January 31, 2017. Capital gain distributions, if any, are added back at the maximum offering price to determine the rate. |
Fund results shown are for Class A shares at net asset value. If a sales charge (maximum 3.75%) had been deducted, the results would have been lower. Results are for past periods and are not predictive of results for future periods. Current and future results may be lower or higher than those shown. Share prices and returns will vary, so investors may lose money. For current information and month-end results, visit americanfunds.com.
| 6 | American Funds Tax-Exempt Funds |
American High-Income Municipal Bond Fund
The fund registered a total return of –3.77% for the first half of its fiscal year. This result exceeded both the –3.91% loss of the Bloomberg Barclays High Yield Municipal Bond Index, and the –4.25% total return of the Lipper High Yield Municipal Debt Funds Average, a measure of the fund’s peer group.
For the six months, the fund paid monthly dividends totaling 29 cents a share, amounting to a federally tax-exempt income return of 1.83% for investors who reinvested dividends. This is equivalent to a taxable income return of 3.23% for investors in the 43.4%1 maximum federal tax bracket. A portion of the fund’s return also may be exempt from some state and local taxes.
Rigorous credit research helped the fund mitigate the impact of some of the more extreme crosscurrents in the municipal bond market. Holdings of bonds backing hospitals, senior living facilities and airports posted some of the worst declines for the period.
The market index is unmanaged and, therefore, has no expenses. Investors cannot invest directly in an index. Bloomberg Barclays source: Bloomberg Index Services Ltd. Lipper averages reflect the current composition of all eligible mutual funds (all share classes) within a given category. Lipper source: Thomson Reuters Lipper.
Tax-exempt yields vs. taxable yields
Find your estimated taxable income below to determine your federal tax rate,2 then look in the far right column to see what you would have had to earn from a taxable investment to equal the fund’s 3.73% tax-exempt distribution rate3 as of January 31, 2017.
| If your taxable income is … | ... then your federal | The fund’s tax-exempt distribution rate of 3.73% is | ||||||||||||||
| Single | Joint | tax rate is … | equivalent to a taxable rate of ... | |||||||||||||
| $ | 0 – | 9,275 | $ | 0 – | 18,550 | 10.0 | % | 4.14 | % | |||||||
| 9,276 – | 37,650 | 18,551 – | 75,300 | 15.0 | 4.39 | |||||||||||
| 37,651 – | 91,150 | 75,301 – | 151,900 | 25.0 | 4.97 | |||||||||||
| 91,151 – | 190,150 | 151,901 – | 231,450 | 28.0 | 5.18 | |||||||||||
| 190,151 – | 413,350 | 231,451 – | 413,350 | 36.8 | 1 | 5.90 | ||||||||||
| 413,351 – | 415,050 | 413,351 – | 466,950 | 38.8 | 1 | 6.09 | ||||||||||
| Over 415,050 | Over 466,950 | 43.4 | 1 | 6.59 | ||||||||||||
| 1 | For the year 2016, there will be an Unearned Income Medicare Contribution Tax of 3.8% that applies to net investment income for taxpayers whose modified adjusted gross income exceeds $200,000 (for single filers) and $250,000 (for married filing jointly). Thus taxpayers in the highest tax bracket will face a combined 43.4% marginal tax rate on their investment income. |
| 2 | Based on 2016 federal tax rates. The federal rates do not include an adjustment for the loss of personal exemptions and the phaseout of itemized deductions that are applicable to certain taxable income levels. |
| 3 | The distribution rate is based on dividends paid over the last 12 months divided by the maximum offering price as of January 31, 2017. Capital gain distributions, if any, are added back at the maximum offering price to determine the rate. |
Fund results shown are for Class A shares at net asset value. If a sales charge (maximum 3.75%) had been deducted, the results would have been lower. Results are for past periods and are not predictive of results for future periods. Current and future results may be lower or higher than those shown. Share prices and returns will vary, so investors may lose money. For current information and month-end results, visit americanfunds.com.
| American Funds Tax-Exempt Funds | 7 |
The Tax-Exempt Fund of California
The fund posted a total return of –3.66% for the six months. This result bested the –4.22% total return of the Lipper California Municipal Debt Funds Average, a peer group measure. However, the fund trailed the –3.54% return of the Bloomberg Barclays California Municipal Index.
For the period, the fund paid monthly dividends totaling 27 cents a share. Those investors who reinvested dividends received an income return of 1.48%. This is equivalent to a taxable income return of 3.02% for investors in the 50.93%1 effective combined federal and California state tax bracket.
Holdings of tax assessment bonds and issues backing hospitals and school districts dampened fund returns.
The market index is unmanaged and, therefore, has no expenses. Investors cannot invest directly in an index. Bloomberg Barclays source: Bloomberg Index Services Ltd. Lipper averages reflect the current composition of all eligible mutual funds (all share classes) within a given category. Lipper source: Thomson Reuters Lipper.
Tax-exempt yields vs. taxable yields
Find your estimated 2016 taxable income below to determine your combined federal and California tax rate2, then look in the far right column to see what you would have had to earn from a taxable investment to equal the fund’s 2.99% tax-exempt distribution rate3 at January 31, 2017.
| If your taxable income is … | … then your combined federal and California | The fund’s tax-exempt distribution rate of 2.99% is | ||||||||||||||
| Single | Joint | state tax rate is … | equivalent to a taxable rate of ... | |||||||||||||
| $ | 0 – | 8,015 | $ | 0 – | 16,030 | 10.90 | % | 3.36 | % | |||||||
| 8,016 – | 9,275 | 16,031 – | 18,550 | 11.80 | 3.39 | |||||||||||
| 9,276 – | 19,001 | 18,551 – | 38,002 | 16.70 | 3.59 | |||||||||||
| 19,002 – | 29,989 | 38,003 – | 59,978 | 18.40 | 3.66 | |||||||||||
| 29,990 – | 37,650 | 59,979 – | 75,300 | 20.10 | 3.74 | |||||||||||
| 37,651 – | 41,629 | 75,301 – | 83,258 | 29.50 | 4.24 | |||||||||||
| 41,630 – | 52,612 | 83,259 – | 105,224 | 31.00 | 4.33 | |||||||||||
| 52,613 – | 91,150 | 105,225 – | 151,900 | 31.98 | 4.40 | |||||||||||
| 91,151 – | 190,150 | 151,901 – | 231,450 | 34.70 | 4.58 | |||||||||||
| 190,151 – | 268,750 | 231,451 – | 413,350 | 42.68 | 1 | 5.22 | ||||||||||
| 268,751 – | 322,499 | – | 43.31 | 1 | 5.27 | |||||||||||
| 322,500 – | 413,350 | – | 43.94 | 1 | 5.33 | |||||||||||
| – | 413,351 – | 466,950 | 44.49 | 1 | 5.39 | |||||||||||
| 413,351 – | 415,050 | – | 45.72 | 1 | 5.51 | |||||||||||
| – | 466,951 – | 537,500 | 48.66 | 1 | 5.82 | |||||||||||
| – | 537,501 – | 644,998 | 49.23 | 1 | 5.89 | |||||||||||
| 415,051 – | 537,498 | 644,999 – | 1,000,000 | 49.80 | 1 | 5.96 | ||||||||||
| 537,499 – | 1,000,000 | 1,000,001 – | 1,074,996 | 50.36 | 1 | 6.02 | ||||||||||
| Over – | 1,000,000 | Over 1,074,996 | 50.93 | 1 | 6.09 | |||||||||||
1 |
For the year 2016, there will be an Unearned Income Medicare Contribution Tax of 3.8% that applies to net investment income for taxpayers whose modified adjusted gross income exceeds $200,000 (for single filers) and $250,000 (for married filing jointly). Thus taxpayers in the highest tax bracket will face a combined 50.93% marginal tax rate on their investment income. |
| 2 | Based on 2016 federal and 2016 California state tax rates. (State rates from 1.0% to 13.3% are individually calculated for each bracket. The federal brackets are expanded to include additional state brackets.) The effective combined tax rates paid by California residents may be lower than those shown due to the availability of income tax deductions. |
| 3 | The distribution rate is based on dividends paid over the last 12 months divided by the maximum offering price as of January 31, 2017. Capital gains distributions, if any, are added back at the maximum offering price to determine the rate. |
Fund results shown are for Class A shares at net asset value. If a sales charge (maximum 3.75%) had been deducted, the results would have been lower. Results are for past periods and are not predictive of results for future periods. Current and future results may be lower or higher than those shown. Share prices and returns will vary, so investors may lose money. For current information and month-end results, visit americanfunds.com.
| 8 | American Funds Tax-Exempt Funds |
American Funds Tax-Exempt Fund of New York
The fund recorded a total return of –3.55%, trailing the –3.22% decline of the Bloomberg Barclays New York Municipal Index. By way of comparison, the Lipper New York Municipal Debt Funds Average, a peer group measure, posted a –3.51% total return.
The fund paid monthly dividends totaling 14 cents a share for the six months. This represents an income return of 1.23% for those who reinvested dividends. For investors in the 48.39%1,2 combined effective federal and New York state tax bracket, this is equivalent to a taxable income return of 2.38%.
Revenue bonds supporting higher education and hospitals and general obligation bonds were among those holdings that detracted from the fund’s overall total return.
The market index is unmanaged and, therefore, has no expenses. Investors cannot invest directly in an index. Bloomberg Barclays source: Bloomberg Index Services Ltd. Lipper averages reflect the current composition of all eligible mutual funds (all share classes) within a given category. Lipper source: Thomson Reuters Lipper.
Tax-exempt yields vs. taxable yields
Find your estimated 2016 taxable income below to determine your combined federal and New York state tax rate,2,3 then look in the far right column to see what you would have had to earn from a taxable investment to equal the fund’s 2.43% tax-exempt distribution rate4 at January 31, 2017.
| If your taxable income is … | … then your combined federal and New York | The fund’s tax-exempt distribution rate of 2.43% is | ||||||||||||||
| Single | Joint | state tax rate is … | equivalent to a taxable rate of ... | |||||||||||||
| $ | 0 – | 8,450 | $ | 0 – | 17,050 | 13.60 | % | 2.81 | % | |||||||
| 8,451 – | 9,275 | 17,051 – | 18,550 | 14.05 | 2.83 | |||||||||||
| 9,276 – | 11,650 | 18,551 – | 23,450 | 18.83 | 2.99 | |||||||||||
| 11,651 – | 13,850 | 23,451 – | 27,750 | 19.46 | 3.02 | |||||||||||
| 13,851 – | 21,300 | 27,751 – | 42,750 | 20.02 | 3.04 | |||||||||||
| 21,301 – | 37,650 | 42,751 – | 75,300 | 20.48 | 3.06 | |||||||||||
| 37,651 – | 80,150 | 75,301 – | 151,900 | 29.84 | 3.46 | |||||||||||
| 80,151 – | 91,150 | – | 29.99 | 3.47 | ||||||||||||
| – | 151,901 – | 160,500 | 32.64 | 3.61 | ||||||||||||
| 91,151 – | 190,150 | 160,501 – | 231,450 | 32.79 | 3.62 | |||||||||||
| 190,151 – | 214,000 | 231,451 – | 321,050 | 41.00 | 1 | 4.12 | ||||||||||
| 214,001 – | 413,350 | 321,051 – | 413,350 | 41.13 | 1 | 4.13 | ||||||||||
| 413,351 – | 415,050 | 413,351 – | 466,950 | 42.99 | 1 | 4.26 | ||||||||||
| 415,051 – | 1,070,350 | 466,951 – | 2,140,900 | 47.28 | 1 | 4.61 | ||||||||||
| over –�� | 1,070,350 | over – | 2,140,900 | 48.39 | 1 | 4.71 | ||||||||||
1
|
For the year 2016, there will be an Unearned Income Medicare Contribution Tax of 3.8% that applies to net investment income for taxpayers whose modified adjusted gross income exceeds $200,000 (for single filers) and $250,000 (for married filing jointly). Thus taxpayers in the highest tax bracket will face a combined 48.39% marginal tax rate on their investment income. |
| 2 | Income generated by the fund’s investments is also generally exempt from New York City taxes, offering additional tax advantages to New York City residents. |
| 3 | Based on 2016 federal and 2016 New York state tax rates. (State rates from 4.00% to 8.82% are individually calculated for each bracket. The federal brackets are expanded to include additional state brackets.) The effective combined tax rates assume full deductibility of state taxes. |
| 4 | The distribution rate is based on dividends paid over the last 12 months divided by the maximum offering price as of January 31, 2017. Capital gain distributions, if any, are added back at the maximum offering price to determine the rate. |
Fund results shown are for Class A shares at net asset value. If a sales charge (maximum 3.75%) had been deducted, the results would have been lower. Results are for past periods and are not predictive of results for future periods. Current and future results may be lower or higher than those shown. Share prices and returns will vary, so investors may lose money. For current information and month-end results, visit americanfunds.com.
| American Funds Tax-Exempt Funds | 9 |
Results at a glance
For periods ended January 31, 2017, with distributions reinvested
| Cumulative total returns | Average annual total returns | |||||||||||||||
| 1 year | 5 years | 10 years | Lifetime1 | |||||||||||||
| American Funds Short-Term Tax-Exempt Bond Fund (Class A shares) | –0.11 | % | 0.66 | % | — | 1.22 | % | |||||||||
| Bloomberg Barclays Municipal Short 1–5 Years Index2 | 0.12 | 1.12 | — | 1.74 | ||||||||||||
| Lipper Short Municipal Debt Funds Average | –0.10 | 0.59 | — | 1.13 | ||||||||||||
| Limited Term Tax-Exempt Bond Fund of America (Class A shares) | –0.56 | 1.50 | 3.09 | % | 3.95 | |||||||||||
| Bloomberg Barclays Municipal Short-Intermediate 1–10 Years Index3 | –0.36 | 1.77 | 3.58 | 4.20 | ||||||||||||
| Lipper Short-Intermediate Municipal Debt Funds Average | –0.46 | 1.14 | 2.58 | 3.45 | ||||||||||||
| The Tax-Exempt Bond Fund of America (Class A shares) | –0.25 | 3.25 | 4.01 | 6.49 | ||||||||||||
| Bloomberg Barclays Municipal Bond Index | –0.28 | 2.94 | 4.34 | — | 4 | |||||||||||
| Lipper General & Insured Municipal Debt Funds Average | –0.45 | 2.94 | 3.65 | 6.24 | ||||||||||||
| American High-Income Municipal Bond Fund (Class A shares) | 1.04 | 5.38 | 4.31 | 5.50 | ||||||||||||
| Bloomberg Barclays Municipal Bond Index | –0.28 | 2.94 | 4.34 | 5.38 | ||||||||||||
| Bloomberg Barclays High Yield Municipal Bond Index | 3.85 | 5.44 | 4.14 | — | 4 | |||||||||||
| Lipper High Yield Municipal Debt Funds Average | 0.66 | 4.65 | 3.42 | 4.99 | ||||||||||||
| The Tax-Exempt Fund of California (Class A shares) | –0.75 | 3.70 | 4.20 | 5.53 | ||||||||||||
| Bloomberg Barclays California Municipal Index | –0.45 | 3.48 | 4.54 | — | 4 | |||||||||||
| Lipper California Municipal Debt Funds Average | –0.51 | 3.63 | 3.98 | 5.53 | ||||||||||||
| American Funds Tax-Exempt Fund of New York (Class A shares) | –0.24 | 2.75 | — | 3.80 | ||||||||||||
| Bloomberg Barclays New York Municipal Index | –0.26 | 2.93 | — | 3.62 | ||||||||||||
| Lipper New York Municipal Debt Funds Average | –0.02 | 2.68 | — | 3.33 | ||||||||||||
| 1 | Since 8/7/09 (American Funds Short-Term Tax-Exempt Bond Fund), 10/6/93 (Limited Term Tax-Exempt Bond Fund of America), 10/3/79 (The Tax-Exempt Bond Fund of America), 9/26/94 (American High-Income Municipal Bond Fund), 10/28/86 (The Tax-Exempt Fund of California) and 11/1/10 (American Funds Tax-Exempt Fund of New York). |
| 2 | Bloomberg Barclays Municipal Short 1–5 Years Index is a market value-weighted index that includes investment-grade tax-exempt bonds with maturities of one to five years. |
| 3 | Bloomberg Barclays Municipal Short-Intermediate 1–10 Years Index is a market value-weighted index that includes investment-grade tax-exempt bonds with maturities of one to 10 years. |
| 4 | This index did not exist at the fund’s inception. |
The market indexes are unmanaged and, therefore, have no expenses. Investors cannot invest directly in an index. Bloomberg Barclays source: Bloomberg Index Services Ltd. Lipper averages reflect the current composition of all eligible mutual funds (all share classes) within a given category. Lipper source: Thomson Reuters Lipper.
| 10 | American Funds Tax-Exempt Funds |
| American Funds Short-Term Tax-Exempt Bond Fund | unaudited |
| Summary investment portfolio January 31, 2017 |
| Portfolio quality summary* | Percent of net assets |
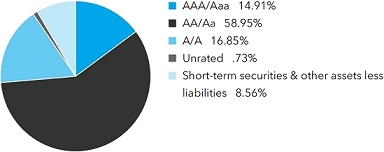
| * | Bond ratings, which typically range from AAA/Aaa (highest) to D (lowest), are assigned by credit rating agencies such as Standard & Poor’s, Moody’s and/or Fitch as an indication of an issuer’s creditworthiness. In assigning a credit rating to a security, the fund looks specifically to the ratings assigned to the issuer of the security by Standard & Poor’s, Moody’s and/or Fitch. If agency ratings differ, the security will be considered to have received the highest of those ratings, consistent with the fund’s investment policies. Securities in the “unrated” category (above) have not been rated by a rating agency; however, the investment adviser performs its own credit analysis and assigns comparable ratings that are used for compliance with the fund’s investment policies. |
| Bonds, notes & other debt instruments 91.44% | Principal amount (000) | Value (000) | ||||||
| Alabama 2.28% | ||||||||
| Black Belt Energy Gas Dist., Gas Supply Rev. Bonds, Series 2016-A, 4.00% 2046 (put 2021) | $ | 9,500 | $ | 10,185 | ||||
| Federal Aid Highway Fin. Auth., Federal Highway Grant Anticipation Bonds, Series 2012, 5.00% 2018 | 3,315 | 3,519 | ||||||
| Other securities | 5,372 | |||||||
| 19,076 | ||||||||
| California 10.54% | ||||||||
| Bay Area Toll Auth., San Francisco Bay Area Toll Bridge Rev. Ref. Bonds, Series 2006-C-1, 1.56% 2045 (put 2023)1 | 6,600 | 6,551 | ||||||
| Bay Area Toll Auth., San Francisco Bay Area Toll Bridge Rev. Ref. Bonds, Series 2007-E-3, 1.33% 2047 (put 2019)1 | 3,000 | 2,995 | ||||||
| Bay Area Toll Auth., San Francisco Bay Area Toll Bridge Rev. Ref. Bonds, Series 2014-G, 1.26% 2034 (put 2020)1 | 2,000 | 2,001 | ||||||
| Health Facs. Fncg. Auth., Rev. Bonds (Sutter Health), Series 2016-C, 1.00% 2053 (put 2019) | 5,000 | 4,933 | ||||||
| Health Facs. Fncg. Auth., Rev. Ref. Bonds (St. Joseph Health System), Series 2009-C, 5.00% 2034 (put 2022) | 2,200 | 2,514 | ||||||
| Health Facs. Fncg. Auth., Rev. Ref. Bonds (St. Joseph Health System), Series 2013-B, 5.00% 2043 (put 2017) | 1,145 | 1,177 | ||||||
| Health Facs. Fncg. Auth., Rev. Ref. Bonds (St. Joseph Health System), Series 2013-D, 5.00% 2043 (put 2020) | 1,500 | 1,676 | ||||||
| Infrastructure and Econ. Dev. Bank, Rev. Ref. Bonds (J. Paul Getty Trust), Series 2013-A-2, 1.043% 2047 (put 2019)1 | 3,500 | 3,483 | ||||||
| Los Angeles County, Metropolitan Transportation Auth., Proposition A, Sales Tax Rev. Ref. Bonds, Series 2013-A, 5.00% 2018 | 3,000 | 3,174 | ||||||
| Statewide Communities Dev. Auth., Rev. Bonds (Hebrew Home for Aged Disabled), Series 2016, 3.50% 2021 | 3,350 | 3,504 | ||||||
| Other securities | 56,183 | |||||||
| 88,191 | ||||||||
| Connecticut 1.54% | ||||||||
| Housing Fin. Auth., Housing Mortgage Fin. Program Bonds, Series 2014-C-1, 4.00% 2044 | 825 | 866 | ||||||
| Housing Fin. Auth., Housing Mortgage Fin. Program Bonds, Series 2016-E-1, 3.50% 2046 | 1,300 | 1,366 | ||||||
| Housing Fin. Auth., Housing Mortgage Fin. Program Rev. Ref. Bonds, 4.00% 2044 | 1,345 | 1,396 | ||||||
| Housing Fin. Auth., Housing Mortgage Fin. Program Rev. Ref. Bonds, Series 2012-F-2, AMT, 2.75% 2035 | 570 | 577 | ||||||
| Housing Fin. Auth., Housing Mortgage Fin. Program Rev. Ref. Bonds, Series 2015-A, 3.50% 2044 | 3,240 | 3,372 | ||||||
| American Funds Tax-Exempt Funds | 11 |
American Funds Short-Term Tax-Exempt Bond Fund
| Bonds, notes & other debt instruments (continued) | Principal amount (000) | Value (000) | ||||||
| Connecticut (continued) | ||||||||
| Housing Fin. Auth., Housing Mortgage Fin. Program Rev. Ref. Bonds, Series 2015-C-1, 3.50% 2045 | $ | 1,925 | $ | 2,006 | ||||
| Housing Fin. Auth., Housing Mortgage Fin. Program Rev. Ref. Bonds, Series 2016-A-1, 4.00% 2045 | 1,365 | 1,456 | ||||||
| Other securities | 1,861 | |||||||
| 12,900 | ||||||||
| Florida 4.40% | ||||||||
| Citizens Property Insurance Corp., Coastal Account Secured Bonds, Series 2011-A-1, 5.00% 2019 | 1,660 | 1,797 | ||||||
| Citizens Property Insurance Corp., High-Risk Account Secured Bonds, Series 2009-A-1, 6.00% 2017 | 1,300 | 1,322 | ||||||
| Citizens Property Insurance Corp., Personal Lines Account/Commercial Lines Account Secured Bonds, Series 2012-A-1, 5.00% 2017 | 1,000 | 1,014 | ||||||
| Citizens Property Insurance Corp., Personal Lines Account/Commercial Lines Account Secured Bonds, Series 2012-A-1, 5.00% 2019 | 7,450 | 8,064 | ||||||
| Health and Educational Facs. Auth., Rev. Bonds (Ascension Health Credit Group), Series 1999-B, 1.65% 2029 (put 2019) | 1,500 | 1,500 | ||||||
| Health and Educational Facs. Auth., Rev. Bonds (Ascension Senior Credit Group), Series 2013-B-1, 1.375% 2038 (put 2019) | 2,225 | 2,203 | ||||||
| Health Facs. Fncg. Auth., Rev. Bonds (Ascension Health Credit Group), Series 2001-A-2, 4.00% 2036 (put 2019) | 1,500 | 1,579 | ||||||
| City of Lakeland, Energy System Rev. Ref. Bonds, Series 2012, 1.41% 20171 | 3,800 | 3,801 | ||||||
| Other securities | 15,523 | |||||||
| 36,803 | ||||||||
| Georgia 2.81% | ||||||||
| Dev. Auth. Of Floyd County, Pollution Control Rev. Bonds (Georgia Power Company Plant Hammond Project), 2.35% 2022 (put 2020) | 4,000 | 4,007 | ||||||
| Metropolitan Atlanta Rapid Transit Auth., Sales Tax Rev. Ref. Bonds (Third Indenture Series), Series 2014-A, 0.93% 2025 (put 2017)1 | 5,250 | 5,246 | ||||||
| Metropolitan Atlanta Rapid Transit Auth., Sales Tax Rev. Ref. Bonds, Series 2014-B, 0.91% 2025 (put 2017)1 | 3,500 | 3,497 | ||||||
| Other securities | 10,740 | |||||||
| 23,490 | ||||||||
| Illinois 6.96% | ||||||||
| Build Bonds (Sales Tax Rev. Bonds), Series June 2013, 5.00% 2020 | 3,500 | 3,848 | ||||||
| Build Illinois Bonds, Sales Tax Rev. Ref. Bonds, Series 2016-D, 4.00% 2021 | 3,000 | 3,233 | ||||||
| Educational Facs. Auth., Rev. Bonds (University of Chicago), Series 1998-B, 1.65% 2025 (put 2019) | 10,390 | 10,429 | ||||||
| Educational Facs. Auth., Rev. Bonds (University of Chicago), Series 2001-B-1, 1.10% 2036 (put 2018) | 1,250 | 1,250 | ||||||
| Housing Dev. Auth., Multifamily Housing Rev. Notes (Marshall Field Garden Apartment Homes), 1.66% 2050 (put 2025)1 | 3,400 | 3,366 | ||||||
| Other securities | 36,171 | |||||||
| 58,297 | ||||||||
| Indiana 2.54% | ||||||||
| Dev. Fin. Auth., Solid Waste Disposal Rev. Bonds (Waste Management, Inc. Project), Series 2001, AMT, 1.75% 2031 (put 2015) | 500 | 502 | ||||||
| Fin. Auth., Hospital Rev. Ref. Bonds (Indiana University Health Obligated Group), Series 2011-N, 5.00% 2017 | 2,500 | 2,509 | ||||||
| Fin. Auth., Hospital Rev. Ref. Bonds (Indiana University Health Obligated Group), Series 2016-A, 5.00% 2019 | 1,100 | 1,211 | ||||||
| Fin. Auth., Hospital Rev. Ref. Bonds (Indiana University Health Obligated Group), Series 2016-A, 5.00% 2022 | 2,500 | 2,905 | ||||||
| Fin. Auth., Hospital Rev. Ref. Bonds (Indiana University Health Obligated Group), Series 2016-A, 5.00% 2023 | 2,000 | 2,345 | ||||||
| 12 | American Funds Tax-Exempt Funds |
American Funds Short-Term Tax-Exempt Bond Fund
| Principal amount (000) | Value (000) | |||||||
| Health and Educational Fac. Fncg. Auth., Rev. Bonds (Ascension Health Credit Group), Series 2005-A-5, 2.00% 2027 (put 2017) | $ | 2,615 | $ | 2,626 | ||||
| Hobart Building Corp. (Lake County), First Mortgage Bonds, Series 2006, National insured, 6.50% 2029 (preref. 2020) | 6,000 | 6,897 | ||||||
| Other securities | 2,276 | |||||||
| 21,271 | ||||||||
| Kentucky 0.62% | ||||||||
| State Property and Buildings Commission, Rev. Ref. Bonds (Project No. 112), Series 2016-B, 5.00% 2022 | 4,500 | 5,156 | ||||||
| Maryland 1.03% | ||||||||
| Montgomery County, G.O. Consolidated Public Improvement Bonds, Series 2011-A, 5.00% 2024 (preref. 2019) | 900 | 982 | ||||||
| Other securities | 7,608 | |||||||
| 8,590 | ||||||||
| Massachusetts 4.01% | ||||||||
| Dev. Fin. Agcy., Rev. Bonds (Partners HealthCare System), Series 2014-M-3, 1.18% 2038 (put 2018)1 | 8,315 | 8,315 | ||||||
| Dev. Fin. Agcy., Rev. Bonds (Partners HealthCare System), Series 2014-M-5, 0.96% 2038 (put 2018)1 | 1,075 | 1,075 | ||||||
| Educational Fncg. Auth., Education Loan Rev. Bonds, Series 2016-J, AMT, 5.00% 2024 | 3,000 | 3,361 | ||||||
| Educational Fncg. Auth., Education Loan Rev. Bonds, Series 2014-I, AMT, 5.00% 2021 | 3,000 | 3,272 | ||||||
| Housing Fin. Agcy., Single Family Housing Rev. Bonds, Series 167, 4.00% 2043 | 765 | 794 | ||||||
| Housing Fin. Agcy., Single Family Housing Rev. Bonds, Series 169, 4.00% 2044 | 820 | 855 | ||||||
| Housing Fin. Agcy., Single Family Housing Rev. Bonds, Series 172, 4.00% 2045 | 1,345 | 1,415 | ||||||
| Housing Fin. Agcy., Single Family Housing Rev. Bonds, Series 181, 4.00% 2044 | 965 | 1,025 | ||||||
| Housing Fin. Agcy., Single Family Housing Rev. Bonds, Series 183, 3.50% 2046 | 1,000 | 1,043 | ||||||
| Housing Fin. Agcy., Single Family Housing Rev. Ref. Bonds, Series 160, AMT, 3.75% 2034 | 400 | 411 | ||||||
| Housing Fin. Agcy., Single Family Housing Rev. Ref. Bonds, Series 162, 2.75% 2041 | 450 | 455 | ||||||
| Housing Fin. Agcy., Single Family Housing Rev. Ref. Bonds, Series 165, 2.65% 2041 | 1,445 | 1,463 | ||||||
| Housing Fin. Agcy., Single Family Housing Rev. Ref. Bonds, Series 171, 4.00% 2044 | 850 | 904 | ||||||
| Housing Fin. Agcy., Single Family Housing Rev. Ref. Bonds, Series 177, AMT, 4.00% 2039 | 3,220 | 3,402 | ||||||
| Other securities | 5,740 | |||||||
| 33,530 | ||||||||
| Michigan 4.32% | ||||||||
| State Hospital Fin. Auth., Project Rev. Ref. Bonds (Ascension Health Credit Group), Series 2010-F3, 1.40% 2047 (put 2018) | 1,500 | 1,501 | ||||||
| Other securities | 34,703 | |||||||
| 36,204 | ||||||||
| Minnesota 1.20% | ||||||||
| Housing Fin. Agcy., Homeownership Fin. Bonds (Mortgage-Backed Securities Program), Series 2011-G, 4.25% 2035 | 530 | 551 | ||||||
| Housing Fin. Agcy., Residential Housing Fin. Bonds, Series 2012-D, 4.00% 2040 | 730 | 756 | ||||||
| Housing Fin. Agcy., Residential Housing Fin. Bonds, Series 2013-A, AMT, 3.00% 2031 | 595 | 604 | ||||||
| Housing Fin. Agcy., Residential Housing Fin. Bonds, Series 2014-A, 4.00% 2038 | 1,115 | 1,187 | ||||||
| Housing Fin. Agcy., Residential Housing Fin. Bonds, Series 2014-C, AMT, 4.00% 2045 | 4,365 | 4,598 | ||||||
| Housing Fin. Agcy., Residential Housing Fin. Bonds, Series 2015-A, AMT, 4.00% 2041 | 870 | 921 | ||||||
| Housing Fin. Agcy., Residential Housing Fin. Bonds, Series 2015-E, AMT, 3.50% 2046 | 890 | 923 | ||||||
| Housing Fin. Agcy., Residential Housing Fin. Bonds, Series 2016-E, 4.00% 2047 | 250 | 267 | ||||||
| Other securities | 269 | |||||||
| 10,076 | ||||||||
| Nebraska 1.60% | ||||||||
| Central Plains Energy Project, Gas Supply Rev. Ref. Bonds, Series 2014, 5.00% 2039 (put 2019) | 4,200 | 4,554 | ||||||
| Other securities | 8,809 | |||||||
| 13,363 | ||||||||
| American Funds Tax-Exempt Funds | 13 |
American Funds Short-Term Tax-Exempt Bond Fund
| Bonds, notes & other debt instruments (continued) | Principal amount (000) | Value (000) | ||||||
| Nevada 1.56% | ||||||||
| Clark County, Pollution Control Rev. Ref. Bonds (Southern California Edison Company), Series 2010, 1.875% 2031 (put 2020) | $ | 5,500 | $ | 5,519 | ||||
| Other securities | 7,576 | |||||||
| 13,095 | ||||||||
| New Jersey 2.48% | ||||||||
| Econ. Dev. Auth., School Facs. Construction Rev. Ref. Bonds, Series 2014-PP, 5.00% 2019 | 4,000 | 4,196 | ||||||
| Higher Education Student Assistance Auth., Student Loan Rev. Bonds, Series 2012-1A, AMT, 4.00% 2017 | 3,500 | 3,562 | ||||||
| Higher Education Student Assistance Auth., Student Loan Rev. Bonds, Series 2012-1A, AMT, 5.00% 2018 | 2,000 | 2,105 | ||||||
| Higher Education Student Assistance Auth., Student Loan Rev. Bonds, Series 2016-1-A, AMT, 5.00% 2020 | 750 | 813 | ||||||
| Higher Education Student Assistance Auth., Student Loan Rev. Bonds, Series 2016-1-A, AMT, 5.00% 2021 | 2,000 | 2,187 | ||||||
| Higher Education Student Assistance Auth., Student Loan Rev. Ref. Bonds, Series 2014-1A1, AMT, 5.00% 2018 | 2,250 | 2,368 | ||||||
| Other securities | 5,521 | |||||||
| 20,752 | ||||||||
| New Mexico 0.83% | ||||||||
| City of Farmington, Pollution Control Rev. Ref. Bonds (Southern California Edison | ||||||||
| Company Four Corners Project), 1.875% 2029 (put 2020) | 2,000 | 2,012 | ||||||
| City of Farmington, Pollution Control Rev. Ref. Bonds (Southern California Edison Company Four Corners Project), Series 2005-B, 1.875% 2029 (put 2020) | 2,250 | 2,245 | ||||||
| Other securities | 2,697 | |||||||
| 6,954 | ||||||||
| New York 8.21% | ||||||||
| Metropolitan Transportation Auth., Transportation Rev. Bonds, Series 2014-A-1, 4.00% 2019 | 750 | 803 | ||||||
| Metropolitan Transportation Auth., Transportation Rev. Bonds, Series 2014-C, 5.00% 2020 | 2,000 | 2,250 | ||||||
| Metropolitan Transportation Auth., Transportation Rev. Bonds, Series 2015-A-2, 1.24% 2039 (put 2020)1 | 6,250 | 6,243 | ||||||
| Mortgage Agcy., Homeowner Mortgage Rev. Bonds, Series 178, 3.50% 2043 | 1,530 | 1,568 | ||||||
| Mortgage Agcy., Homeowner Mortgage Rev. Bonds, Series 191, AMT, 3.50% 2034 | 2,855 | 2,935 | ||||||
| Mortgage Agcy., Homeowner Mortgage Rev. Bonds, Series 195, 4.00% 2046 | 2,985 | 3,196 | ||||||
| Mortgage Agcy., Homeowner Mortgage Rev. Bonds, Series 197, 3.50% 2044 | 1,000 | 1,051 | ||||||
| Mortgage Agcy., Homeowner Mortgage Rev. Bonds, Series 200, 3.50% 2045 | 650 | 685 | ||||||
| Mortgage Agcy., Homeowner Mortgage Rev. Bonds, Series 52, AMT, 3.50% 2030 | 950 | 986 | ||||||
| City of New York, G.O. Bonds, Fiscal 2014 Series A-6, 1.13% 20311 | 2,500 | 2,497 | ||||||
| City of New York, G.O. Bonds, Series 2008-J-4, 1.21% 20251 | 6,000 | 6,000 | ||||||
| City of New York, G.O. Bonds, Series 2012-I, 5.00% 2018 | 1,000 | 1,059 | ||||||
| City of New York, G.O. Bonds, Series 2014-A, 5.00% 2020 | 1,500 | 1,681 | ||||||
| New York City Transitional Fin. Auth., Future Tax Secured Bonds, Series B, 5.00% 2017 | 1,000 | 1,000 | ||||||
| Thruway Auth., General Rev. Junior Indebtedness Obligations, Series 2013-A, 5.00% 2019 | 4,700 | 5,081 | ||||||
| Other securities | 31,728 | |||||||
| 68,763 | ||||||||
| Ohio 1.66% | ||||||||
| Solid Waste Disposal Rev. Bonds (Waste Management Inc. Project), Series 2002, AMT, 1.70% 2022 (put 2018) | 2,500 | 2,508 | ||||||
| Other securities | 11,376 | |||||||
| 13,884 | ||||||||
| 14 | American Funds Tax-Exempt Funds |
American Funds Short-Term Tax-Exempt Bond Fund
| Principal amount (000) | Value (000) | |||||||
| Oregon 1.20% | ||||||||
| Facs. Auth., Rev. Ref. Bonds (Providence Health & Services), Series 2013-C, 1.66% 2022 (put 2018)1 | $ | 3,000 | $ | 3,000 | ||||
| Facs. Auth., Rev. Ref. Bonds (Providence Health & Services), Series 2013-C, 1.51% 2020 (put 2017)1 | 1,500 | 1,500 | ||||||
| Other securities | 5,581 | |||||||
| 10,081 | ||||||||
| Pennsylvania 3.12% | ||||||||
| Econ. Dev. Fncg. Auth., Unemployment Compensation Rev. Bonds, Series 2012-B, 5.00% 2021 | 4,000 | 4,152 | ||||||
| Housing Fin. Agcy., Single Family Mortgage Rev. Bonds, Series 2015-117-A, AMT, 3.50% 2040 | 1,675 | 1,736 | ||||||
| Housing Fin. Agcy., Single Family Mortgage Rev. Bonds, Series 2015-118-A, AMT, 3.50% 2040 | 1,775 | 1,839 | ||||||
| Housing Fin. Agcy., Single Family Mortgage Rev. Bonds, Series 2016-119, 3.50% 2041 | 905 | 943 | ||||||
| Housing Fin. Agcy., Single Family Mortgage Rev. Bonds, Series 2016-120, 3.50% 2046 | 985 | 1,030 | ||||||
| Housing Fin. Agcy., Single Family Mortgage Rev. Bonds, Series 2017-122, 4.00% 2046 | 3,440 | 3,682 | ||||||
| Turnpike Commission, Turnpike Rev. Bonds, Series 2016, 5.00% 2021 | 3,500 | 3,930 | ||||||
| Other securities | 8,769 | |||||||
| 26,081 | ||||||||
| Rhode Island 1.09% | ||||||||
| Housing and Mortgage Fin. Corp., Homeownership Opportunity Bonds, Series 66-A-1, 4.00% 2033 | 3,010 | 3,157 | ||||||
| Other securities | 5,979 | |||||||
| 9,136 | ||||||||
| South Carolina 0.73% | ||||||||
| Public Service Auth., Rev. Obligations (Santee Cooper), Series 2012-A, 4.00% 2020 | 2,945 | 3,207 | ||||||
| Other securities | 2,905 | |||||||
| 6,112 | ||||||||
| Tennessee 1.52% | ||||||||
| Housing Dev. Agcy., Homeownership Program Bonds, Issue 2012-2-C, 4.00% 2038 | 565 | 594 | ||||||
| Housing Dev. Agcy., Homeownership Program Bonds, Issue 2012-1-C, 4.50% 2037 | 785 | 832 | ||||||
| Housing Dev. Agcy., Homeownership Program Rev. Ref. Bonds, Issue 2011-1-A, AMT, 4.50% 2031 | 1,345 | 1,415 | ||||||
| Housing Dev. Agcy., Homeownership Program Rev. Ref. Bonds, Issue 2012-1-A, AMT, 4.50% 2038 | 660 | 695 | ||||||
| Housing Dev. Agcy., Residential Fin. Program Bonds, 4.00% 2046 | 455 | 484 | ||||||
| Housing Dev. Agcy., Residential Fin. Program Bonds, Issue 2013-1-C, 3.00% 2038 | 1,235 | 1,266 | ||||||
| Housing Dev. Agcy., Residential Fin. Program Bonds, Series 2013-2-A, AMT, 4.00% 2043 | 1,220 | 1,271 | ||||||
| Housing Dev. Agcy., Residential Fin. Program Bonds, Series 2014-1-A, AMT, 4.00% 2039 | 1,605 | 1,686 | ||||||
| Housing Dev. Agcy., Residential Fin. Program Bonds, Series 2014-2-A, AMT, 4.00% 2045 | 1,375 | 1,452 | ||||||
| Housing Dev. Agcy., Residential Fin. Program Bonds, Series 2014-2-C, 4.00% 2045 | 1,040 | 1,095 | ||||||
| Housing Dev. Agcy., Residential Fin. Program Bonds, Series 2016-1-B, 3.50% 2047 | 930 | 978 | ||||||
| Other securities | 1,000 | |||||||
| 12,768 | ||||||||
| Texas 8.83% | ||||||||
| Mission Econ. Dev. Corp., Solid Waste Disposal Rev. Bonds (Waste Management, Inc. Project), Series 2008, AMT, 2.50% 2020 (put 2013) | 2,000 | 2,030 | ||||||
| City of San Antonio, Electric and Gas Systems Rev. Ref. Bonds, 5.00% 2018 | 2,000 | 2,082 | ||||||
| City of San Antonio, Electric and Gas Systems Rev. Ref. Bonds, Series 2009-A, 5.25% 2024 (preref. 2019) | 1,100 | 1,188 | ||||||
| City of San Antonio, Electric and Gas Systems Rev. Ref. Bonds, Series 2012-C, 2.00% 2027 (put 2018) | 1,625 | 1,641 | ||||||
| City of San Antonio, Electric and Gas Systems Rev. Ref. Bonds, Series 2015-A, 2.25% 2033 (put 2019) | 5,500 | 5,584 | ||||||
| City of San Antonio, Electric and Gas Systems Rev. Ref. Bonds, Series 2015-B, 1.040% 2033 (put 2018)1 | 6,000 | 5,987 | ||||||
| American Funds Tax-Exempt Funds | 15 |
American Funds Short-Term Tax-Exempt Bond Fund
| Bonds, notes & other debt instruments (continued) | Principal amount (000) | Value (000) | ||||||
| Texas (continued) | ||||||||
| Transportation Commission, G.O. Mobility Fund Bonds, Series 2014-B, 1.040% 2041 (put 2018)1 | $ | 6,500 | $ | 6,496 | ||||
| Board of Regents of The University of Texas System, Rev. Fncg. System Bonds, Series 2016-J, 5.00% 2024 | 5,000 | 5,990 | ||||||
| Other securities | 42,953 | |||||||
| 73,951 | ||||||||
| Virginia 0.79% | ||||||||
| Commonwealth Transportation Board, Federal Transportation Grant Anticipation Rev. Notes, Series 2013-A, 5.00% 2020 | 3,000 | 3,335 | ||||||
| Other securities | 3,284 | |||||||
| 6,619 | ||||||||
| Washington 3.26% | ||||||||
| Econ. Dev. Fin. Auth., Solid Waste Disposal Rev. Bonds (Waste Management, Inc. Project), Series 2008, 2.125% 20202 | 5,000 | 5,021 | ||||||
| Health Care Facs. Auth., Rev. Bonds (Providence Health & Services), Series 2012-B, 4.00% 2042 (put 2021) | 250 | 273 | ||||||
| Health Care Facs. Auth., Rev. Ref. Bonds (Providence Health & Services), Series 2012-A, 5.00% 2018 | 500 | 532 | ||||||
| Health Care Facs. Auth., Rev. Ref. Bonds (Providence Health & Services), Series 2012-B, 5.00% 2042 (put 2021) | 2,550 | 2,893 | ||||||
| Other securities | 18,559 | |||||||
| 27,278 | ||||||||
| Wisconsin 2.52% | ||||||||
| Health and Educational Facs. Auth., Rev. Bonds (Ascension Health Alliance Senior Credit Group), Series 2013-B-2, 4.00% 2043 (put 2019) | 1,000 | 1,060 | ||||||
| Health and Educational Facs. Auth., Rev. Bonds (Ascension Health Alliance Senior Credit Group), Series 2013-B-3, 5.00% 2043 (put 2020) | 4,500 | 4,989 | ||||||
| Housing and Econ. Dev. Auth., Home Ownership Rev. Bonds, Series 2016-A, AMT, 3.50% 2046 | 3,855 | 3,994 | ||||||
| Public Fin. Auth., Solid Waste Disposal Rev. Ref. Bonds (Waste Management, Inc. Project), Series 2016-A-4, AMT, 2.00% 2033 (put 2021) | 1,500 | 1,482 | ||||||
| Other securities | 9,539 | |||||||
| 21,064 | ||||||||
| Other states & U.S. territories 9.79% | ||||||||
| Other securities | 81,850 | |||||||
| Total bonds, notes & other debt instruments (cost: $767,110,000) | 765,335 | |||||||
| Short-term securities 8.35% | ||||||||
| State of Maryland, Montgomery County, Consolidated Public Improvement Bond Anticipation Notes, Series 2009-B, 0.74% 3/1/2017 | 10,000 | 10,000 | ||||||
| State of Mississippi, Business Fin. Corp., Gulf Opportunity Zone Industrial Dev. Rev. Bonds (Chevron U.S.A. Inc. Project), Series 2010-J, 0.58% 20351 | 7,000 | 7,000 | ||||||
| State of Mississippi, Business Fin. Corp., Gulf Opportunity Zone Industrial Dev. Rev. Bonds (Chevron U.S.A. Inc. Project), Series 2011-E, 0.58% 20351 | 3,000 | 3,000 | ||||||
| State of New York, City of New York, G.O. Bonds, Series 2006-H-1, 0.63% 20361 | 7,300 | 7,300 | ||||||
| State of New York, City of New York, G.O. Bonds, Series 2006-L-5, 0.63% 20351 | 3,700 | 3,700 | ||||||
| State of New York, City of New York, G.O. Bonds, Series 2008-J-5, 0.63% 20281 | 3,310 | 3,310 | ||||||
| State of New York, City of New York, G.O. Bonds, Series 2008-L-4, 0.62% 20381 | 3,100 | 3,100 | ||||||
| State of New York, New York City Transitional Fin. Auth., Future Tax Secured Rev. Ref. Bonds, Series 2015-E-3, 0.63% 20451 | 2,000 | 2,000 | ||||||
| State of New York, New York City Transitional Fin. Auth., Future Tax Secured Rev. Ref. Bonds, Series 2016-E-4, 0.63% 20451 | 10,700 | 10,700 | ||||||
| 16 | American Funds Tax-Exempt Funds |
American Funds Short-Term Tax-Exempt Bond Fund
| Principal amount (000) | Value (000) | |||||||
| State of New York, New York City Transitional Fin. Auth., New York City Recovery Bonds, Fiscal 2003, Series 2002-1-C, 0.63% 20221 | $ | 7,160 | $ | 7,160 | ||||
| State of New York, New York City, Municipal Water Fin. Auth., Water and Sewer System Rev. Bonds, Series 2003-F-2, 0.62% 20351 | 5,650 | 5,650 | ||||||
| Other securities | 7,006 | |||||||
| Total short-term securities (cost: $69,926,000) | 69,926 | |||||||
| Total investment securities 99.79% (cost: $837,036,000) | 835,261 | |||||||
| Other assets less liabilities 0.21% | 1,762 | |||||||
| Net assets 100.00% | $ | 837,023 | ||||||
This summary investment portfolio is designed to streamline the report and help investors better focus on the fund’s principal holdings. See the inside back cover for details on how to obtain a complete schedule of portfolio holdings.
“Other securities” includes all issues that are not disclosed separately in the summary investment portfolio.
| 1 | Coupon rate may change periodically. For short-term securities, the date of the next scheduled coupon rate change is considered to be the maturity date. | |
| 2 | Acquired in a transaction exempt from registration under Rule 144A of the Securities Act of 1933. May be resold in the U.S. in transactions exempt from registration, normally to qualified institutional buyers. The total value of all such securities was $5,021,000, which represented .60% of the net assets of the fund. |
Key to abbreviations
Agcy. = Agency
AMT = Alternative Minimum Tax
Auth. = Authority
Certs. of Part. = Certificates of Participation
Dept. = Department
Dev. = Development
Dist. = District
Econ. = Economic
Fac. = Facility
Facs. = Facilities
Fin. = Finance
Fncg. = Financing
G.O. = General Obligation
LOC = Letter of Credit
Preref. = Prerefunded
Redev. = Redevelopment
Ref. = Refunding
Rev. = Revenue
TECP = Tax-Exempt Commercial Paper
See Notes to Financial Statements
| American Funds Tax-Exempt Funds | 17 |
| Limited Term Tax-Exempt Bond Fund of America | unaudited |
| Summary investment portfolio January 31, 2017 | |
| Portfolio quality summary* | Percent of net assets |
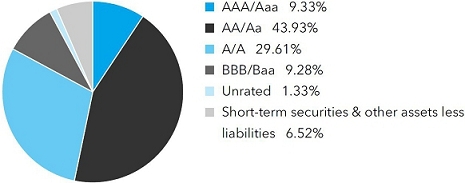
| * | Bond ratings, which typically range from AAA/Aaa (highest) to D (lowest), are assigned by credit rating agencies such as Standard & Poor’s, Moody’s and/or Fitch as an indication of an issuer’s creditworthiness. In assigning a credit rating to a security, the fund looks specifically to the ratings assigned to the issuer of the security by Standard & Poor’s, Moody’s and/or Fitch. If agency ratings differ, the security will be considered to have received the highest of those ratings, consistent with the fund’s investment policies. Securities in the “unrated” category (above) have not been rated by a rating agency; however, the investment adviser performs its own credit analysis and assigns comparable ratings that are used for compliance with the fund’s investment policies. |
| Bonds, notes & other debt instruments 93.48% | Principal amount (000) | Value (000) | ||||||
| Alabama 1.01% | ||||||||
| Black Belt Energy Gas Dist., Gas Supply Rev. Bonds, Series 2016-A, 4.00% 2046 (put 2021) | $ | 14,500 | $ | 15,545 | ||||
| Other securities | 22,027 | |||||||
| 37,572 | ||||||||
| California 10.93% | ||||||||
| Bay Area Toll Auth., San Francisco Bay Area Toll Bridge Rev. Ref. Bonds, Series 2006-C-1, 1.56% 2045 (put 2023)1 | 20,500 | 20,348 | ||||||
| Bay Area Toll Auth., San Francisco Bay Area Toll Bridge Rev. Ref. Bonds, Series 2007-C-1, 1.56% 2047 (put 2023)1 | 3,500 | 3,474 | ||||||
| Bay Area Toll Auth., San Francisco Bay Area Toll Bridge Rev. Ref. Bonds, Series 2007-E-3, 1.33% 2047 (put 2019)1 | 1,000 | 999 | ||||||
| Bay Area Toll Auth., San Francisco Bay Area Toll Bridge Rev. Ref. Bonds, Series 2008-B-1, 1.76% 2045 (put 2024)1 | 2,500 | 2,500 | ||||||
| Bay Area Toll Auth., San Francisco Bay Area Toll Bridge Rev. Ref. Bonds, Series 2014-G, 1.26% 2034 (put 2020)1 | 2,500 | 2,501 | ||||||
| Bay Area Toll Auth., San Francisco Bay Area Toll Bridge Rev. Ref. Bonds, Series 2014-H, 1.36% 2034 (put 2021)1 | 10,480 | 10,474 | ||||||
| Econ. Recovery Bonds, Ref. Series 2009-A, 5.00% 2020 (preref. 2019) | 9,000 | 9,833 | ||||||
| Other securities | 358,150 | |||||||
| 408,279 | ||||||||
| Connecticut 1.36% | ||||||||
| Special Tax Obligation Ref. Bonds, Transportation Infrastructure Purposes, Series 2009-1, 5.00% 2019 | 8,550 | 9,176 | ||||||
| Other securities | 41,534 | |||||||
| 50,710 | ||||||||
| Florida 7.64% | ||||||||
| Citizens Property Insurance Corp., Coastal Account Secured Bonds, Series 2011-A-1, 5.00% 2018 | 2,000 | 2,102 | ||||||
| Citizens Property Insurance Corp., Coastal Account Secured Bonds, Series 2011-A-1, 5.00% 2019 | 5,000 | 5,412 | ||||||
| Citizens Property Insurance Corp., High-Risk Account Secured Bonds, Series 2009-A-1, 5.50% 2017 | 10,035 | 10,191 | ||||||
| Citizens Property Insurance Corp., High-Risk Account Secured Rev. Ref. Bonds, Series 2015-A-1, 5.00% 2020 | 3,500 | 3,830 | ||||||
| Citizens Property Insurance Corp., Personal Lines Account/Commercial Lines Account Secured Bonds, Series 2012-A-1, 5.00% 2019 | 3,600 | 3,897 | ||||||
| Citizens Property Insurance Corp., Personal Lines Account/Commercial Lines Account Secured Bonds, Series 2012-A-1, 5.00% 2020 | 4,500 | 4,993 | ||||||
| 18 | American Funds Tax-Exempt Funds |
Limited Term Tax-Exempt Bond Fund of America
| Principal amount (000) | Value (000) | |||||||
| Citizens Property Insurance Corp., Personal Lines Account/Commercial Lines Account Secured Bonds, Series 2012-A-1, 5.00% 2021 | $ | 1,000 | $ | 1,132 | ||||
| Citizens Property Insurance Corp., Personal Lines Account/Commercial Lines Account Secured Bonds, Series 2012-A-1, 5.00% 2022 | 10,200 | 11,742 | ||||||
| Fin. Auth., Econ. Dev. Rev. Bonds (Republic Services, Inc. Project), Series 2010-B, 0.90% 2028 (put 2017)1 | 10,500 | 10,500 | ||||||
| Lee County, Industrial Dev. Auth., Healthcare Facs. Rev. Ref. Bonds (Shell Point/Alliance Obligated Group, Shell Point Village/Alliance Community Project), Series 2007, 5.00% 2029 | 13,000 | 13,073 | ||||||
| Miami-Dade County, Aviation Rev. Ref. Bonds, Series 2012-A, AMT, 5.00% 2021 | 11,600 | 13,082 | ||||||
| Putnam County Dev. Auth., Pollution Control Rev. Ref. Bonds (Seminole Electric Cooperative, Inc. Project), Series 2007-B, AMBAC insured, 5.35% 2042 (put 2018) | 10,370 | 10,874 | ||||||
| Other securities | 194,628 | |||||||
| 285,456 | ||||||||
| Georgia 2.74% | ||||||||
| Municipal Electric Auth., Project 1, Series 2008-D, 5.75% 2019 (preref. 2018) | 11,840 | 12,627 | ||||||
| Public Gas Partners, Inc., Gas Project Rev. Ref. Bonds (Gas Supply Pool No. 1), Series A, 5.00% 2018 | 10,930 | 11,594 | ||||||
| Other securities | 78,267 | |||||||
| 102,488 | ||||||||
| Hawaii 0.53% | ||||||||
| Airports System Rev. Bonds, Series 2010-B, AMT, 5.00% 2018 | 9,900 | 10,409 | ||||||
| Other securities | 9,522 | |||||||
| 19,931 | ||||||||
| Illinois 9.59% | ||||||||
| City of Chicago, O’Hare International Airport, General Airport Rev. Bonds, Series 2011-B, 5.00% 2019 | 2,785 | 2,975 | ||||||
| City of Chicago, O’Hare International Airport, General Airport Rev. Bonds, Series 2012-B, AMT, 5.00% 2024 | 2,000 | 2,216 | ||||||
| City of Chicago, O’Hare International Airport, General Airport Rev. Bonds, Series 2013-A, AMT, 5.00% 2022 | 3,055 | 3,415 | ||||||
| City of Chicago, O’Hare International Airport, General Airport Rev. Ref. Bonds, Series 2012-A, AMT, 5.00% 2025 | 6,170 | 6,816 | ||||||
| City of Chicago, O’Hare International Airport, General Airport Rev. Ref. Bonds, Series 2013-A, AMT, 5.00% 2021 | 10,000 | 11,053 | ||||||
| City of Chicago, O’Hare International Airport, Passenger Fac. Charge Rev. Ref. Bonds, Series 2012-B, AMT, 5.00% 2018 | 2,000 | 2,064 | ||||||
| City of Chicago, O’Hare International Airport, Passenger Fac. Charge Rev. Ref. Bonds, Series 2012-B, AMT, 5.00% 2019 | 2,000 | 2,123 | ||||||
| City of Chicago, O’Hare International Airport, Passenger Fac. Charge Rev. Ref. Bonds, Series 2013-B, AMT, 5.00% 2022 | 3,000 | 3,354 | ||||||
| City of Chicago, O’Hare International Airport, General Airport Rev. Bonds, Series 2017-D, 5.00% 2026 | 4,000 | 4,687 | ||||||
| City of Chicago, O’Hare International Airport, General Airport Rev. Bonds, Series 2017-D, 5.25% 2029 | 1,500 | 1,762 | ||||||
| City of Chicago, O’Hare International Airport, General Airport Rev. Ref. Bonds, Series 2008-A, Assured Guaranty Municipal insured, 5.00% 2019 (preref. 2018) | 2,000 | 2,074 | ||||||
| City of Chicago, O’Hare International Airport, General Airport Rev. Ref. Bonds, Series 2013-A, AMT, 5.00% 2023 | 5,000 | 5,636 | ||||||
| City of Chicago, O’Hare International Airport, General Airport Rev. Ref. Bonds, Series 2015-B, 5.00% 2023 | 1,500 | 1,732 | ||||||
| City of Chicago, O’Hare International Airport, General Airport Rev. Ref. Bonds, Series 2016-B, 5.00% 2019 | 2,500 | 2,671 | ||||||
| City of Chicago, O’Hare International Airport, General Airport Rev. Ref. Bonds, Series 2016-C, 5.00% 2028 | 3,145 | 3,602 | ||||||
| City of Chicago, Water Rev. Bonds, Series 2000, 5.00% 2022 | 10,500 | 11,774 | ||||||
| American Funds Tax-Exempt Funds | 19 |
Limited Term Tax-Exempt Bond Fund of America
| Bonds, notes & other debt instruments (continued) | Principal amount (000) | Value (000) | ||||||
| Illinois (continued) | ||||||||
| Housing Dev. Auth., Multifamily Housing Rev. Notes (Marshall Field Garden Apartment Homes), 1.66% 2050 (put 2025)1 | $ | 10,500 | $ | 10,394 | ||||
| Railsplitter Tobacco Settlement Auth., Tobacco Settlement Rev. Bonds, Series 2010, 5.50% 2023 | 12,925 | 14,585 | ||||||
| Other securities | 265,239 | |||||||
| 358,172 | ||||||||
| Michigan 4.85% | ||||||||
| Housing Dev. Auth., Single-Family Mortgage Rev. Bonds, Series 2016-B, 3.50% 2047 | 20,600 | 21,445 | ||||||
| Wayne County, Airport Auth., Airport Rev. Bonds (Detroit Metropolitan Wayne County Airport), Series 2007, AMT, FGIC-National insured, 5.00% 2018 | 1,000 | 1,031 | ||||||
| Wayne County, Airport Auth., Airport Rev. Bonds (Detroit Metropolitan Wayne County Airport), Series 2007, AMT, National insured, 5.00% 2017 | 1,000 | 1,031 | ||||||
| Wayne County, Airport Auth., Airport Rev. Ref. Bonds (Detroit Metropolitan Wayne County Airport), Series 2008-A, AMT, Assured Guaranty insured, 5.25% 2018 | 595 | 620 | ||||||
| Wayne County, Airport Auth., Airport Rev. Ref. Bonds (Detroit Metropolitan Wayne County Airport), Series 2010-A, AMT, 5.00% 2017 | 1,615 | 1,663 | ||||||
| Wayne County, Airport Auth., Airport Rev. Ref. Bonds (Detroit Metropolitan Wayne County Airport), Series 2010-A, AMT, 5.00% 2018 | 3,590 | 3,794 | ||||||
| Wayne County, Airport Auth., Airport Rev. Ref. Bonds (Detroit Metropolitan Wayne County Airport), Series 2011-A, AMT, 5.00% 2019 | 1,000 | 1,082 | ||||||
| Wayne County, Airport Auth., Airport Rev. Ref. Bonds (Detroit Metropolitan Wayne County Airport), Series 2011-A, AMT, 5.00% 2020 | 10,000 | 11,027 | ||||||
| Wayne County, Airport Auth., Airport Rev. Ref. Bonds (Detroit Metropolitan Wayne County Airport), Series 2011-A, AMT, 5.00% 2021 | 8,240 | 9,211 | ||||||
| Wayne County, Airport Auth., Airport Rev. Ref. Bonds (Detroit Metropolitan Wayne County Airport), Series 2011-A, AMT, Assured Guaranty Municipal insured, 4.00% 2020 | 4,000 | 4,265 | ||||||
| Wayne County, Airport Auth., Airport Rev. Ref. Bonds (Detroit Metropolitan Wayne County Airport), Series 2011-B, 5.00% 2019 | 1,000 | 1,092 | ||||||
| Wayne County, Airport Auth., Airport Rev. Ref. Bonds (Detroit Metropolitan Wayne County Airport), Series 2012-D, AMT, 5.00% 2019 | 3,560 | 3,851 | ||||||
| Wayne County, Airport Auth., Airport Rev. Ref. Bonds (Detroit Metropolitan Wayne County Airport), Series 2015-F, AMT, 5.00% 2025 | 1,500 | 1,717 | ||||||
| Wayne County, Airport Auth., Airport Rev. Ref. Bonds (Detroit Metropolitan Wayne County Airport), Series 2015-F, AMT, 5.00% 2026 | 1,000 | 1,136 | ||||||
| Other securities | 118,228 | |||||||
| 181,193 | ||||||||
| Nebraska 0.99% | ||||||||
| Central Plains Energy Project, Gas Supply Rev. Ref. Bonds, Series 2014, 5.00% 2039 (put 2019) | 8,800 | 9,542 | ||||||
| Other securities | 27,352 | |||||||
| 36,894 | ||||||||
| Nevada 2.17% | ||||||||
| Clark County, Highway Rev. (Motor Vehicle Fuel Tax) Ref. Bonds, Series 2011, 5.00% 2020 | 12,320 | 13,742 | ||||||
| Clark County, Pollution Control Rev. Ref. Bonds (Southern California Edison Company), Series 2010, 1.875% 2031 (put 2020) | 15,150 | 15,203 | ||||||
| Other securities | 52,229 | |||||||
| 81,174 | ||||||||
| New Jersey 2.71% | ||||||||
| Turnpike Auth., Turnpike Rev. Ref. Bonds, Series 2013-D, 1.34% 2024 (put 2018)1 | 11,500 | 11,509 | ||||||
| Other securities | 89,583 | |||||||
| 101,092 | ||||||||
| 20 | American Funds Tax-Exempt Funds |
Limited Term Tax-Exempt Bond Fund of America
| Principal amount (000) | Value (000) | |||||||
| New York 8.58% | ||||||||
| Metropolitan Transportation Auth., Transportation Rev. Bonds, Series 2003-B, FGIC-National insured, 5.25% 2020 | $ | 5,500 | $ | 6,237 | ||||
| Metropolitan Transportation Auth., Transportation Rev. Bonds, Series 2008-C, 5.50% 2018 | 3,670 | 3,868 | ||||||
| Metropolitan Transportation Auth., Transportation Rev. Bonds, Series 2012-E, 5.00% 2020 | 3,250 | 3,656 | ||||||
| Metropolitan Transportation Auth., Transportation Rev. Bonds, Series 2014-A-1, 4.00% 2021 | 3,470 | 3,820 | ||||||
| Metropolitan Transportation Auth., Transportation Rev. Bonds, Series 2014-C, 5.00% 2024 | 5,000 | 5,935 | ||||||
| Metropolitan Transportation Auth., Transportation Rev. Bonds, Series 2015-A-1, 5.00% 2027 | 3,150 | 3,667 | ||||||
| Metropolitan Transportation Auth., Transportation Rev. Bonds, Series 2015-A-2, 1.24% 2039 (put 2020)1 | 12,250 | 12,235 | ||||||
| Metropolitan Transportation Auth., Transportation Rev. Ref. Bonds, Series 2011-C, 5.00% 2018 | 1,105 | 1,182 | ||||||
| Metropolitan Transportation Auth., Transportation Rev. Ref. Bonds, Series 2012-D, 5.00% 2020 | 7,000 | 7,874 | ||||||
| Metropolitan Transportation Auth., Transportation Rev. Ref. Bonds, Series 2012-F, 5.00% 2021 | 1,000 | 1,147 | ||||||
| Metropolitan Transportation Auth., Transportation Rev. Ref. Bonds, Series 2014-A-2, 5.00% 2028 | 3,000 | 3,432 | ||||||
| Mortgage Agcy., Homeowner Mortgage Rev. Bonds, Series 197, 3.50% 2044 | 9,700 | 10,190 | ||||||
| City of New York, G.O. Bonds, Fiscal 2017, Series 2016-B-1, 5.00% 2032 | 1,500 | 1,754 | ||||||
| City of New York, G.O. Bonds, Series 2008-J-4, 1.21% 20251 | 8,825 | 8,825 | ||||||
| City of New York, G.O. Bonds, Series 2011-I-1, 5.00% 2017 | 5,000 | 5,105 | ||||||
| City of New York, G.O. Bonds, Series 2012-I, 5.00% 2020 | 5,000 | 5,605 | ||||||
| City of New York, G.O. Bonds, Series 2013-E, 5.25% 2022 | 5,000 | 5,882 | ||||||
| City of New York, G.O. Bonds, Series 2014-A, 5.00% 2025 | 3,000 | 3,558 | ||||||
| City of New York, G.O. Bonds, Series 2014-G, 5.00% 2023 | 1,500 | 1,766 | ||||||
| City of New York, G.O. Bonds, Series 2015-C, 5.00% 2028 | 1,000 | 1,166 | ||||||
| City of New York, G.O. Bonds, Series 2016-E, 5.00% 2026 | 2,000 | 2,412 | ||||||
| New York City Transitional Fin. Auth., Future Tax Secured Bonds, Series 2015-C, 5.00% 2025 | 2,420 | 2,906 | ||||||
| New York City Transitional Fin. Auth., Future Tax Secured Bonds, Series 2015-C, 5.00% 2027 | 5,000 | 5,923 | ||||||
| New York City Transitional Fin. Auth., Future Tax Secured Bonds, Series B, 5.00% 2017 | 1,910 | 1,910 | ||||||
| New York City Transitional Fin. Auth., Future Tax Secured Rev. Ref. Bonds, Fiscal 2003 Series A-1, 5.00% 2022 | 1,305 | 1,521 | ||||||
| New York City Transitional Fin. Auth., Multi-Modal Rev. Ref. Bonds, Series 2011-B, 5.00% 2022 | 1,750 | 1,999 | ||||||
| Thruway Auth., Local Highway and Bridge Service Contract Rev. Ref. Bonds, Series 2009, 5.00% 2017 | 10,000 | 10,071 | ||||||
| Other securities | 196,946 | |||||||
| 320,592 | ||||||||
| Pennsylvania 5.12% | ||||||||
| Housing Fin. Agcy., Single Family Mortgage Rev. Bonds, Series 2016-121, 3.50% 2046 | 12,000 | 12,536 | ||||||
| Housing Fin. Agcy., Single Family Mortgage Rev. Bonds, Series 2015-117-A, AMT, 3.50% 2040 | 550 | 570 | ||||||
| Housing Fin. Agcy., Single Family Mortgage Rev. Bonds, Series 2015-118-A, AMT, 3.50% 2040 | 7,245 | 7,507 | ||||||
| Housing Fin. Agcy., Single Family Mortgage Rev. Bonds, Series 2016-119, 3.50% 2041 | 905 | 943 | ||||||
| Housing Fin. Agcy., Single Family Mortgage Rev. Bonds, Series 2016-120, 3.50% 2046 | 7,410 | 7,749 | ||||||
| Housing Fin. Agcy., Single Family Mortgage Rev. Bonds, Series 2017-122, 4.00% 2046 | 10,680 | 11,432 | ||||||
| Other securities | 150,348 | |||||||
| 191,085 | ||||||||
| South Dakota 0.47% | ||||||||
| Housing Dev. Auth., Homeownership Mortgage Bonds, Series 2016-D, 3.50% 2046 | 10,200 | 10,738 | ||||||
| Other securities | 6,967 | |||||||
| 17,705 | ||||||||
| American Funds Tax-Exempt Funds | 21 |
Limited Term Tax-Exempt Bond Fund of America
| Bonds, notes & other debt instruments (continued) | Principal amount (000) | Value (000) | ||||||
| Texas 9.09% | ||||||||
| Brazos River Harbor Navigation Dist. of Brazoria County, Environmental Facs. Rev. Ref. Bonds (Dow Chemical Co. Project), Series 2002-A-4, AMT, 5.95% 2033 | $ | 13,040 | $ | 13,844 | ||||
| Harris County Cultural Education Facs. Fin. Corp., Medical Facs. Rev. Ref. Bonds (Baylor College of Medicine), 1.34% 2045 (put 2020)1 | 13,000 | 13,193 | ||||||
| Harris County, Toll Road Rev. Bonds, Series 2012-B, 1.36% 2021 (put 2018)1 | 13,500 | 13,493 | ||||||
| City of Houston, Airport System Rev. Ref. Bonds, Series 2011-A, AMT, 5.00% 2019 | 10,000 | 10,780 | ||||||
| City of San Antonio, Electric and Gas Systems Rev. Ref. Bonds, Series 2015-A, 2.25% 2033 (put 2019) | 11,500 | 11,676 | ||||||
| Other securities | 276,709 | |||||||
| 339,695 | ||||||||
| Virginia 0.56% | ||||||||
| Industrial Dev. Auth. of Wise County, Solid Waste and Sewage Disposal Rev. Bonds (Virginia Electric and Power Co. Project), Series 2009-A, 2.15% 2040 (put 2020) | 12,000 | 12,071 | ||||||
| Other securities | 8,946 | |||||||
| 21,017 | ||||||||
| Washington 2.46% | ||||||||
| Central Puget Sound Regional Transit Auth., Sales Tax Bonds, Series 2015-S-2A, 1.33% 2045 (put 2018)1 | 10,500 | 10,506 | ||||||
| Various Purpose G.O. Bonds, Series 2017-D, 5.00% 2028 | 10,000 | 12,067 | ||||||
| Other securities | 69,251 | |||||||
| 91,824 | ||||||||
| Wisconsin 1.62% | ||||||||
| Health and Educational Facs. Auth., Rev. Bonds (Ascension Health Alliance Senior Credit Group), Series 2013-B-3, 5.00% 2043 (put 2020) | 10,310 | 11,430 | ||||||
| Other securities | 48,995 | |||||||
| 60,425 | ||||||||
| Other states & U.S. territories 21.06% | ||||||||
| Other securities | 786,982 | |||||||
| Total bonds, notes & other debt instruments (cost: $3,458,154,000) | 3,492,286 | |||||||
| Short-term securities 6.30% | ||||||||
| State of California, County of Los Angeles, 2016-17 Tax and Rev. Anticipation Notes, 3.00% 6/30/2017 | 14,000 | 14,141 | ||||||
| State of Colorado, General Fund Tax and Rev. Anticipation Notes, Series 2016-A, 2.00% 6/27/2017 | 25,000 | 25,131 | ||||||
| State of Idaho, Tax Anticipation Notes, Series 2016, 2.00% 6/30/2017 | 20,000 | 20,101 | ||||||
| State of Mississippi, Business Fin. Corp., Gulf Opportunity Zone Industrial Dev. Rev. Bonds (Chevron U.S.A. Inc. Project), Series 2007-A, 0.58% 20301 | 5,000 | 5,000 | ||||||
| State of Mississippi, Business Fin. Corp., Gulf Opportunity Zone Industrial Dev. Rev. Bonds (Chevron U.S.A. Inc. Project), Series 2009-D, 0.58% 20301 | 10,000 | 10,000 | ||||||
| State of Mississippi, Business Fin. Corp., Gulf Opportunity Zone Industrial Dev. Rev. Bonds (Chevron U.S.A. Inc. Project), Series 2011-E, 0.58% 20351 | 4,000 | 4,000 | ||||||
| State of New York, Metropolitan Transportation Auth., Dedicated Tax Fund Bond Anticipation Notes, Series 2016-A-1-F, 2.00% 3/1/2017 | 7,500 | 7,507 | ||||||
| State of New York, Metropolitan Transportation Auth., Transportation Rev. Bond Anticipation Notes, Series 2016-A-1-E, 2.00% 3/1/2017 | 10,000 | 10,010 | ||||||
| State of New York, City of New York, G.O. Bonds, Series 2006-H-1, 0.63% 20361 | 6,100 | 6,100 | ||||||
| State of New York, City of New York, G.O. Bonds, Series 2006-L-5, 0.63% 20351 | 10,610 | 10,610 | ||||||
| State of New York, City of New York, G.O. Bonds, Series 2008-J-5, 0.63% 20281 | 10,000 | 10,000 | ||||||
| State of New York, New York City Transitional Fin. Auth., Future Tax Secured Rev. Ref. Bonds, Series 2015-E-3, 0.63% 20451 | 14,850 | 14,850 | ||||||
| State of New York, New York City Transitional Fin. Auth., Future Tax Secured Rev. Ref. Bonds, Series 2015-E-4, 0.63% 20451 | 2,800 | 2,800 | ||||||
| State of New York, New York City Transitional Fin. Auth., Future Tax Secured Rev. Ref. Bonds, Series 2016-E-4, 0.63% 20451 | 14,000 | 14,000 | ||||||
| 22 | American Funds Tax-Exempt Funds |
Limited Term Tax-Exempt Bond Fund of America
| Principal amount (000) | Value (000) | |||||||
| State of New York, New York City Transitional Fin. Auth., New York City Recovery Bonds, Fiscal 2003, Series 2002-1-C, 0.63% 20221 | $ | 1,790 | $ | 1,790 | ||||
| State of New York, New York City, Municipal Water Fin. Auth., Water and Sewer System Second General Resolution Rev. Bonds, Fiscal 2006, Series 2005-B, 0.62% 20321 | 8,530 | 8,530 | ||||||
| State of New York, New York City, Municipal Water Fin. Auth., Water and Sewer System Second General Resolution Rev. Bonds, Fiscal 2014, Series 2013-AA-2, 0.63% 20501 | 3,200 | 3,200 | ||||||
| State of Oregon, Full Faith and Credit Tax Anticipation Notes, Series 2016-A, 2.00% 6/30/2017 | 13,000 | 13,069 | ||||||
| State of Texas, City of Houston, Public Improvement G.O. Bonds, Series 2017-H-2, 0.75% 2/7/2017 | 5,000 | 5,000 | ||||||
| State of Texas, City of Houston, Tax and Rev. Anticipation Notes, 1.00% 6/30/2017 | 5,000 | 5,004 | ||||||
| Other securities | 44,594 | |||||||
| Total short-term securities (cost: $235,445,000) | 235,437 | |||||||
| Total investment securities 99.78% (cost: $3,693,599,000) | 3,727,723 | |||||||
| Other assets less liabilities 0.22% | 8,183 | |||||||
| Net assets 100.00% | $ | 3,735,906 | ||||||
This summary investment portfolio is designed to streamline the report and help investors better focus on the fund’s principal holdings. See the inside back cover for details on how to obtain a complete schedule of portfolio holdings.
“Other securities” includes all issues that are not disclosed separately in the summary investment portfolio. Some of these securities (with an aggregate value of $34,311,000, which represented .92% of the net assets of the fund) were acquired in transactions exempt from registration under Rule 144A of the Securities Act of 1933 and may be resold in the U.S. in transactions exempt from registration, normally to qualified institutional buyers.
| 1 | Coupon rate may change periodically. For short-term securities, the date of the next scheduled coupon rate change is considered to be the maturity date. |
Key to abbreviations
Agcy. = Agency
AMT = Alternative Minimum Tax
Auth. = Authority
Certs. of Part. = Certificates of Participation
Dept. = Department
Dev. = Development
Dist. = District
Econ. = Economic
Fac. = Facility
Facs. = Facilities
Fin. = Finance
Fncg. = Financing
G.O. = General Obligation
LOC = Letter of Credit
Preref. = Prerefunded
Redev. = Redevelopment
Ref. = Refunding
Rev. = Revenue
TECP = Tax-Exempt Commercial Paper
See Notes to Financial Statements
| American Funds Tax-Exempt Funds | 23 |
| The Tax-Exempt Bond Fund of America | unaudited |
| Summary investment portfolio January 31, 2017 |
| Portfolio quality summary* | Percent of net assets |
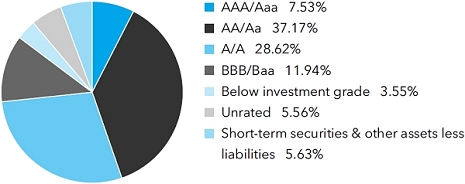
| * | Bond ratings, which typically range from AAA/Aaa (highest) to D (lowest), are assigned by credit rating agencies such as Standard & Poor’s, Moody’s and/or Fitch as an indication of an issuer’s creditworthiness. In assigning a credit rating to a security, the fund looks specifically to the ratings assigned to the issuer of the security by Standard & Poor’s, Moody’s and/or Fitch. If agency ratings differ, the security will be considered to have received the highest of those ratings, consistent with the fund’s investment policies. Securities in the “unrated” category (above) have not been rated by a rating agency; however, the investment adviser performs its own credit analysis and assigns comparable ratings that are used for compliance with the fund’s investment policies. |
| Bonds, notes & other debt instruments 94.37% | Principal amount (000) | Value (000) | ||||||
| Alabama 1.85% | ||||||||
| City of Birmingham, Water Works Board, Water Rev. Ref. Bonds, Series 2016-B, 5.00% 2043 | $ | 26,200 | $ | 29,074 | ||||
| Black Belt Energy Gas Dist., Gas Supply Rev. Bonds, Series 2016-A, 4.00% 2046 (put 2021) | 50,000 | 53,605 | ||||||
| Jefferson County, Sewer Rev. Warrants, Series 2013-A, Assured Guaranty Municipal insured, 5.00% 2044 | 22,340 | 24,785 | ||||||
| Public School and College Auth., Capital Improvement Bonds, Series 2007, 5.00% 2019 (preref. 2017) | 30,220 | 31,275 | ||||||
| Other securities | 115,254 | |||||||
| 253,993 | ||||||||
| Arizona 2.14% | ||||||||
| Health Facs. Auth., Rev. Bonds (Banner Health), Series 2007-B, 1.479% 20371 | 27,200 | 23,250 | ||||||
| Other securities | 269,794 | |||||||
| 293,044 | ||||||||
| California 10.21% | ||||||||
| Bay Area Toll Auth., San Francisco Bay Area Toll Bridge Rev. Ref. Bonds, Series 2008-B-1, 1.76% 2045 (put 2024)1 | 30,850 | 30,847 | ||||||
| Foothill/Eastern Transportation Corridor Agcy., Toll Road Rev. Ref. Bonds, Series 2013-A, 6.00% 2053 | 24,000 | 27,426 | ||||||
| City of San Buenaventura, Rev. Bonds (Community Memorial Health System), Series 2011, 7.50% 2041 | 19,850 | 23,140 | ||||||
| Other securities | 1,320,513 | |||||||
| 1,401,926 | ||||||||
| Colorado 2.23% | ||||||||
| Health Facs. Auth., Health Facs. Rev. Ref. Bonds (Evangelical Lutheran Good Samaritan Society Project), Series 2012, 5.00% 2042 | 29,815 | 30,428 | ||||||
| Regional Transportation Dist., Private Activity Bonds (Denver Transit Partners Eagle P3 Project), Series 2010, 6.00% 2041 | 23,765 | 26,323 | ||||||
| Other securities | 249,942 | |||||||
| 306,693 | ||||||||
| Delaware 0.23% | ||||||||
| Transportation Auth., Rev. Bonds (U.S. 301 Project), 5.00% 2055 | 25,455 | 27,675 | ||||||
| Other securities | 3,517 | |||||||
| 31,192 | ||||||||
| 24 | American Funds Tax-Exempt Funds |
The Tax-Exempt Bond Fund of America
| Principal amount (000) | Value (000) | |||||||
| Florida 7.42% | ||||||||
| Greater Orlando Aviation Auth. (City of Orlando), Airport Facs. Rev. Bonds, Series 2016-B, 5.00% 2046 | $ | 21,020 | $ | 23,513 | ||||
| Orlando-Orange County, Expressway Auth., Rev. Ref. Bonds, Series 2013-A, 5.00% 2035 | 27,350 | 30,470 | ||||||
| Other securities | 964,402 | |||||||
| 1,018,385 | ||||||||
| Georgia 2.66% | ||||||||
| City of Atlanta, Water and Wastewater Rev. Ref. Bonds, Series 1999-A, FGIC-National insured, 5.50% 2022 | 20,500 | 24,102 | ||||||
| Other securities | 341,272 | |||||||
| 365,374 | ||||||||
| Illinois 11.58% | ||||||||
| Chicago Transit Auth., Sales Tax Receipts Rev. Bonds, Series 2014, 5.25% 2049 | 27,500 | 30,159 | ||||||
| Chicago Transit Auth., Sales Tax Receipts Rev. Bonds, Series 2017, 5.00% 2051 | 24,000 | 25,374 | ||||||
| Fin. Auth., Rev. Bonds (Mercy Health Corp.), Series 2016, 5.00% 2046 | 23,190 | 24,407 | ||||||
| Fin. Auth., Rev. Ref. Bonds (OSF Healthcare System), Series 2015-A, 5.00% 2045 | 26,890 | 28,865 | ||||||
| Fin. Auth., Student Housing Rev. Ref. Bonds (CHF-DeKalb II, LLC - Northern Illinois University Project), Series 2011, 6.875% 2043 | 27,500 | 30,449 | ||||||
| Fin. Auth., Rev. Ref. Bonds (Provena Health), Series 2009-A, 7.75% 2034 (preref. 2019) | 18,820 | 21,859 | ||||||
| Housing Dev. Auth., Multifamily Housing Rev. Notes (Marshall Field Garden Apartment Homes), 1.66% 2050 (put 2025)1 | 26,175 | 25,912 | ||||||
| Southwestern Illinois Dev. Auth., Health Fac. Rev. Bonds (Memorial Group, Inc.), Series 2013, 7.625% 2048 | 17,340 | 22,529 | ||||||
| State Toll Highway Auth., Toll Highway Rev. Bonds, Series 2008-B, 5.50% 2033 (preref. 2018) | 18,210 | 18,969 | ||||||
| State Toll Highway Auth., Toll Highway Rev. Bonds, Series 2013-A, 5.00% 2027 | 1,305 | 1,485 | ||||||
| State Toll Highway Auth., Toll Highway Rev. Bonds, Series 2013-A, 5.00% 2028 | 1,000 | 1,133 | ||||||
| State Toll Highway Auth., Toll Highway Rev. Bonds, Series 2013-A, 5.00% 2029 | 3,000 | 3,384 | ||||||
| State Toll Highway Auth., Toll Highway Rev. Bonds, Series 2013-A, 5.00% 2030 | 7,100 | 7,967 | ||||||
| State Toll Highway Auth., Toll Highway Rev. Bonds, Series 2013-A, 5.00% 2032 | 1,000 | 1,114 | ||||||
| State Toll Highway Auth., Toll Highway Rev. Bonds, Series 2013-A, 5.00% 2033 | 2,200 | 2,443 | ||||||
| State Toll Highway Auth., Toll Highway Rev. Bonds, Series 2013-A, 5.00% 2038 | 34,430 | 37,902 | ||||||
| State Toll Highway Auth., Toll Highway Rev. Bonds, Series 2014-B, 5.00% 2038 | 2,500 | 2,749 | ||||||
| State Toll Highway Auth., Toll Highway Rev. Bonds, Series 2014-B, 5.00% 2039 | 3,000 | 3,301 | ||||||
| State Toll Highway Auth., Toll Highway Rev. Bonds, Series 2015-B, 5.00% 2036 | 2,000 | 2,218 | ||||||
| State Toll Highway Auth., Toll Highway Rev. Bonds, Series 2015-B, 5.00% 2037 | 1,500 | 1,659 | ||||||
| State Toll Highway Auth., Toll Highway Rev. Bonds, Series 2015-B, 5.00% 2040 | 9,500 | 10,491 | ||||||
| State Toll Highway Auth., Toll Highway Rev. Ref. Bonds, Series 2010-A-1, 4.50% 2027 | 6,000 | 6,358 | ||||||
| State Toll Highway Auth., Toll Highway Rev. Ref. Bonds, Series 2010-A-1, 5.00% 2025 | 10,000 | 10,968 | ||||||
| State Toll Highway Auth., Toll Highway Rev. Ref. Bonds, Series 2010-A-1, 5.00% 2028 | 10,000 | 10,941 | ||||||
| State Toll Highway Auth., Toll Highway Rev. Ref. Bonds, Series 2010-A-1, 5.00% 2031 | 4,000 | 4,312 | ||||||
| Toll Highway Auth., Toll Highway Rev. Bonds, Series 2016-B, 5.00% 2035 | 3,055 | 3,415 | ||||||
| Toll Highway Auth., Toll Highway Rev. Bonds, Series 2016-B, 5.00% 2036 | 2,000 | 2,229 | ||||||
| Toll Highway Auth., Toll Highway Rev. Bonds, Series 2016-B, 5.00% 2037 | 1,900 | 2,111 | ||||||
| Toll Highway Auth., Toll Highway Rev. Bonds, Series 2016-B, 5.00% 2041 | 20,430 | 22,645 | ||||||
| Other securities | 1,222,361 | |||||||
| 1,589,709 | ||||||||
| Louisiana 1.93% | ||||||||
| Local Government Environmental Facs. and Community Dev. Auth., Rev. Bonds (Westlake Chemical Corp. Projects), Series 2007, 6.75% 2032 | 24,560 | 25,331 | ||||||
| Other securities | 239,279 | |||||||
| 264,610 | ||||||||
| American Funds Tax-Exempt Funds | 25 |
The Tax-Exempt Bond Fund of America
| Bonds, notes & other debt instruments (continued) | Principal amount (000) | Value (000) | ||||||
| Michigan 3.65% | ||||||||
| School Dist. of the City of Detroit (Wayne County), School Building and Site Improvement Ref. Bonds (Unlimited Tax G.O.), Series 2005-A, Assured Guaranty Municipal insured, 5.25% 2032 | $ | 20,000 | $ | 23,055 | ||||
| Housing Dev. Auth., Single-Family Mortgage Rev. Bonds, Series 2016-B, 3.50% 2047 | 28,595 | 29,768 | ||||||
| Tobacco Settlement Fin. Auth., Tobacco Settlement Asset-backed Bonds, Current Interest Bonds, Series 2007-A, 6.00% 2048 | 55,520 | 51,284 | ||||||
| Other securities | 397,414 | |||||||
| 501,521 | ||||||||
| New Jersey 2.00% | ||||||||
| Tobacco Settlement Fncg. Corp., Tobacco Settlement Asset-backed Rev. Ref. Bonds, Series 2007-1-A, 5.00% 2041 | 34,150 | 30,736 | ||||||
| Other securities | 244,144 | |||||||
| 274,880 | ||||||||
| New York 6.31% | ||||||||
| Liberty Dev. Corp., Liberty Rev. Ref. Bonds (Bank of America Tower at One Bryant Park Project), Series 2010, 6.375% 2049 | 21,000 | 22,915 | ||||||
| Metropolitan Transportation Auth., Transportation Rev. Bonds, Series 2015-A-1, 5.00% 2045 | 20,000 | 22,217 | ||||||
| City of New York, G.O. Bonds, Series 2013-F-1, 5.00% 2037 | 3,000 | 3,340 | ||||||
| City of New York, G.O. Bonds, Series 2013-H, 5.00% 2023 | 2,475 | 2,915 | ||||||
| City of New York, G.O. Bonds, Fiscal 2017, Series 2016-A-1, 5.00% 2037 | 2,500 | 2,857 | ||||||
| City of New York, G.O. Bonds, Fiscal 2017, Series 2016-B-1, 5.00% 2032 | 1,500 | 1,754 | ||||||
| City of New York, G.O. Bonds, Fiscal 2017, Series 2016-B-1, 5.00% 2034 | 1,000 | 1,159 | ||||||
| City of New York, G.O. Bonds, Fiscal 2017, Series 2016-B-1, 5.00% 2037 | 2,500 | 2,868 | ||||||
| City of New York, G.O. Bonds, Fiscal 2017, Series 2016-B-1, 5.00% 2038 | 1,500 | 1,725 | ||||||
| City of New York, G.O. Bonds, Fiscal 2017, Series 2016-B-1, 5.00% 2041 | 1,500 | 1,721 | ||||||
| City of New York, G.O. Bonds, Series 2007-D, 5.00% 2017 | 5,000 | 5,000 | ||||||
| City of New York, G.O. Bonds, Series 2008-J-4, 1.21% 20251 | 2,350 | 2,350 | ||||||
| City of New York, G.O. Bonds, Series 2013-J, 5.00% 2023 | 500 | 589 | ||||||
| City of New York, G.O. Bonds, Series 2014-A, 5.00% 2024 | 5,500 | 6,543 | ||||||
| City of New York, G.O. Bonds, Series 2014-G, 5.00% 2023 | 2,500 | 2,944 | ||||||
| City of New York, G.O. Bonds, Series 2014-J, 5.00% 2030 | 2,000 | 2,318 | ||||||
| City of New York, G.O. Bonds, Series 2015-A, 5.00% 2026 | 8,000 | 9,532 | ||||||
| City of New York, G.O. Bonds, Series 2015-C, 5.00% 2028 | 1,500 | 1,749 | ||||||
| City of New York, G.O. Bonds, Series 2015-C, 5.00% 2030 | 10,000 | 11,527 | ||||||
| City of New York, G.O. Bonds, Series 2015-C, 5.00% 2032 | 3,500 | 4,003 | ||||||
| City of New York, G.O. Bonds, Series 2015-C, 5.00% 2033 | 1,000 | 1,139 | ||||||
| City of New York, G.O. Bonds, Series 2015-D, 5.00% 2030 | 2,560 | 2,951 | ||||||
| City of New York, G.O. Bonds, Series 2016-E, 5.00% 2026 | 2,000 | 2,412 | ||||||
| New York City Transitional Fin. Auth., Future Tax Secured Bonds, Fiscal 2011 Series D, 5.00% 2024 | 1,000 | 1,139 | ||||||
| New York City Transitional Fin. Auth., Future Tax Secured Bonds, Fiscal 2012 Series E-1, 5.00% 2037 | 2,000 | 2,248 | ||||||
| New York City Transitional Fin. Auth., Future Tax Secured Bonds, Fiscal 2012 Series F-1, 5.00% 2039 | 1,000 | 1,123 | ||||||
| New York City Transitional Fin. Auth., Future Tax Secured Bonds, Fiscal 2013 Series F-1, 5.00% 2028 | 1,500 | 1,735 | ||||||
| New York City Transitional Fin. Auth., Future Tax Secured Bonds, Fiscal 2013 Series F-1, 5.00% 2036 | 1,000 | 1,126 | ||||||
| New York City Transitional Fin. Auth., Future Tax Secured Bonds, Fiscal 2017 Series 2016-A-1, 5.00% 2040 | 14,170 | 16,149 | ||||||
| New York City Transitional Fin. Auth., Future Tax Secured Bonds, Fiscal 2017 Series 2016-A-1, 5.00% 2035 | 1,000 | 1,148 | ||||||
| New York City Transitional Fin. Auth., Future Tax Secured Bonds, Series 2014-D-1, 5.00% 2036 | 500 | 562 | ||||||
| New York City Transitional Fin. Auth., Future Tax Secured Bonds, Series 2015-C, 5.00% 2027 | 7,250 | 8,588 | ||||||
| New York City Transitional Fin. Auth., Future Tax Secured Rev. Ref. Bonds, Series 2014-A-1, 5.00% 2037 | 2,500 | 2,826 | ||||||
| New York City Transitional Fin. Auth., Future Tax Secured Rev. Ref. Bonds, Series 2015-A-1, 5.00% 2034 | 8,000 | 9,141 | ||||||
| 26 | American Funds Tax-Exempt Funds |
The Tax-Exempt Bond Fund of America
| Principal amount (000) | Value (000) | |||||||
| New York City Transitional Fin. Auth., Future Tax Secured Rev. Ref. Bonds, Series 2015-A-1, 5.00% 2036 | $ | 4,000 | $ | 4,542 | ||||
| New York City Transitional Fin. Auth., Future Tax Secured Rev. Ref. Bonds, Series 2015-A-1, 5.00% 2037 | 3,000 | 3,402 | ||||||
| New York City Transitional Fin. Auth., Future Tax Secured Rev. Ref. Bonds, Series 2015-E-1, 5.00% 2031 | 5,000 | 5,745 | ||||||
| New York City Transitional Fin. Auth., Future Tax Secured Rev. Ref. Bonds, Series 2015-E-1, 5.00% 2041 | 1,200 | 1,349 | ||||||
| New York City Transitional Fin. Auth., Multi-Modal Rev. Ref. Bonds, Series 2011-B, 5.00% 2020 | 1,500 | 1,662 | ||||||
| Other securities | 687,040 | |||||||
| 866,053 | ||||||||
| Ohio 3.07% | ||||||||
| Buckeye Tobacco Settlement Fncg. Auth., Tobacco Settlement Asset-backed Bonds, Current Interest Bonds, Series 2007-A-2, 5.875% 2047 | 83,455 | 76,769 | ||||||
| Buckeye Tobacco Settlement Fncg. Auth., Tobacco Settlement Asset-backed Bonds, Current Interest Bonds, Series 2007-A-2, 6.50% 2047 | 28,495 | 28,072 | ||||||
| Housing Fin. Agcy., Residential Mortgage Rev. Ref. Bonds (Mortgage-backed Securities Program), Series 2016-D, 4.00% 2047 | 26,405 | 28,251 | ||||||
| Other securities | 288,297 | |||||||
| 421,389 | ||||||||
| Pennsylvania 3.00% | ||||||||
| Montgomery County, Industrial Dev. Auth., Retirement Communities Rev. Bonds (ACTS Retirement-Life Communities, Inc. Obligated Group), Series 2016, 5.00% 2036 | 22,000 | 23,509 | ||||||
| Other securities | 388,905 | |||||||
| 412,414 | ||||||||
| Texas 9.66% | ||||||||
| Grand Parkway Transportation Corp., Grand Parkway System Toll Rev. Bonds, Series 2013-B, 5.00% 2053 | 32,800 | 36,194 | ||||||
| Harris County Cultural Education Facs. Fin. Corp., Medical Facs. Rev. Ref. Bonds (Baylor College of Medicine), 1.34% 2045 (put 2020)1 | 22,000 | 22,327 | ||||||
| North Texas Tollway Auth., System Rev. Ref. Bonds, Capital Appreciation Bonds, Series 2008-D, Assured Guaranty insured, 0% 2032 | 5,360 | 2,980 | ||||||
| North Texas Tollway Auth., System Rev. Ref. Bonds, Current Interest Bonds, Series 2008-A, 5.50% 2018 | 1,000 | 1,040 | ||||||
| North Texas Tollway Auth., System Rev. Ref. Bonds, Current Interest Bonds, Series 2008-A, 5.625% 2033 (preref 2018) | 6,890 | 7,183 | ||||||
| North Texas Tollway Auth., System Rev. Ref. Bonds, Current Interest Bonds, Series 2008-A, 6.00% 2021 | 465 | 483 | ||||||
| North Texas Tollway Auth., System Rev. Ref. Bonds, Current Interest Bonds, Series 2008-A, 6.00% 2021 (preref. 2018) | 3,295 | 3,446 | ||||||
| North Texas Tollway Auth., System Rev. Ref. Bonds, Current Interest Bonds, Series 2008-A, 6.00% 2023 | 1,545 | 1,606 | ||||||
| North Texas Tollway Auth., System Rev. Ref. Bonds, Current Interest Bonds, Series 2008-A, 6.00% 2023 (preref. 2018) | 11,025 | 11,532 | ||||||
| North Texas Tollway Auth., System Rev. Ref. Bonds, Current Interest Bonds, Series 2008-A, 6.00% 2025 | 615 | 641 | ||||||
| North Texas Tollway Auth., System Rev. Ref. Bonds, Current Interest Bonds, Series 2008-A, 6.00% 2025 (preref. 2018) | 4,385 | 4,587 | ||||||
| North Texas Tollway Auth., System Rev. Ref. Bonds, Current Interest Bonds, Series 2012-B, 5.25% 2052 | 8,435 | 9,264 | ||||||
| North Texas Tollway Auth., System Rev. Ref. Bonds, Current Interest Bonds, Series 2014-C, 1.33% 2038 (put 2020)1 | 7,500 | 7,521 | ||||||
| North Texas Tollway Auth., System Rev. Ref. Bonds, Current Interest Bonds, Series 2015-B, 5.00% 2040 | 7,200 | 7,967 | ||||||
| North Texas Tollway Auth., System Rev. Ref. Bonds, Series 2008-A, 5.625% 2033 | 1,860 | 1,925 | ||||||
| North Texas Tollway Auth., System Rev. Ref. Bonds, Series 2008-A, 5.625% 2033 (preref. 2018) | 6,350 | 6,620 | ||||||
| North Texas Tollway Auth., System Rev. Ref. Bonds, Series 2008-F, 5.75% 2033 (preref. 2018) | 3,000 | 3,131 | ||||||
| American Funds Tax-Exempt Funds | 27 |
The Tax-Exempt Bond Fund of America
| Bonds, notes & other debt instruments (continued) | Principal amount (000) | Value (000) | ||||||
| Texas (continued) | ||||||||
| North Texas Tollway Auth., System Rev. Ref. Bonds, Series 2008-F, 5.75% 2038 (preref. 2018) | $ | 8,500 | $ | 8,871 | ||||
| North Texas Tollway Auth., System Rev. Ref. Bonds, Series 2009-A, 6.00% 2028 | 2,995 | 3,251 | ||||||
| North Texas Tollway Auth., System Rev. Ref. Bonds, Series 2009-A, 6.00% 2028 (preref. 2019) | 13,005 | 14,197 | ||||||
| North Texas Tollway Auth., System Rev. Ref. Bonds, Series 2009-A, 6.10% 2028 | 940 | 1,023 | ||||||
| North Texas Tollway Auth., System Rev. Ref. Bonds, Series 2009-A, 6.10% 2028 (preref. 2019) | 4,060 | 4,440 | ||||||
| North Texas Tollway Auth., System Rev. Ref. Bonds, Series 2009-A, 6.25% 2039 | 935 | 1,011 | ||||||
| North Texas Tollway Auth., System Rev. Ref. Bonds, Series 2009-A, 6.25% 2039 (preref. 2019) | 4,065 | 4,457 | ||||||
| North Texas Tollway Auth., System Rev. Ref. Bonds, Series 2010, 6.00% 2034 | 1,500 | 1,723 | ||||||
| North Texas Tollway Auth., System Rev. Ref. Bonds, Series 2010, 6.00% 2038 | 5,000 | 5,717 | ||||||
| North Texas Tollway Auth., System Rev. Ref. Bonds, Series 2011-A, 1.46% 2050 (put 2019)1 | 3,600 | 3,604 | ||||||
| North Texas Tollway Auth., System Rev. Ref. Bonds, Series 2011-B, 5.00% 2038 | 8,000 | 8,584 | ||||||
| North Texas Tollway Auth., System Rev. Ref. Bonds, Series 2012-C, 1.95% 2038 (put 2019) | 8,600 | 8,651 | ||||||
| North Texas Tollway Auth., System Rev. Ref. Bonds, Series 2014-A, 5.00% 2022 | 1,000 | 1,140 | ||||||
| North Texas Tollway Auth., System Rev. Ref. Bonds, Series 2015-A, 5.00% 2032 | 7,500 | 8,404 | ||||||
| North Texas Tollway Auth., System Rev. Ref. Bonds, Series 2015-A, 5.00% 2034 | 4,500 | 5,003 | ||||||
| North Texas Tollway Auth., System Rev. Ref. Bonds, Series 2015-A, 5.00% 2035 | 4,000 | 4,432 | ||||||
| North Texas Tollway Auth., System Rev. Ref. Bonds, Series 2015-A, 5.00% 2038 | 1,500 | 1,652 | ||||||
| North Texas Tollway Auth., System Rev. Ref. Bonds, Series 2016-A, 5.00% 2030 | 1,800 | 2,059 | ||||||
| North Texas Tollway Auth., System Rev. Ref. Bonds, Series 2016-A, 5.00% 2031 | 1,000 | 1,137 | ||||||
| North Texas Tollway Auth., System Rev. Ref. Bonds, Series 2016-A, 5.00% 2032 | 500 | 566 | ||||||
| North Texas Tollway Auth., System Rev. Ref. Bonds, Series 2016-A, 5.00% 2033 | 455 | 513 | ||||||
| North Texas Tollway Auth., System Rev. Ref. Bonds, Series 2016-A, 5.00% 2034 | 1,000 | 1,122 | ||||||
| North Texas Tollway Auth., System Rev. Ref. Bonds, Series 2016-A, 5.00% 2035 | 1,200 | 1,342 | ||||||
| North Texas Tollway Auth., System Rev. Ref. Bonds, Series 2016-A, 5.00% 2036 | 1,000 | 1,115 | ||||||
| North Texas Tollway Auth., System Rev. Ref. Bonds, Series 2016-A, 5.00% 2039 | 7,000 | 7,775 | ||||||
| Other securities | 1,095,291 | |||||||
| 1,325,527 | ||||||||
| Washington 2.94% | ||||||||
| Health Care Facs. Auth., Rev. Bonds (Catholic Health Initiatives), Series 2013-B-1, 1.66% 2035 (put 2021)1 | 59,750 | 59,475 | ||||||
| Health Care Facs. Auth., Rev. Ref. Bonds (Virginia Mason Medical Center), Series 2007-A, 6.125% 2037 | 22,000 | 22,446 | ||||||
| Other securities | 320,994 | |||||||
| 402,915 | ||||||||
| Wisconsin 1.91% | ||||||||
| General Fund Annual Appropriation Rev. Ref. Bonds, Series 2009-A, 6.00% 2036 (preref. 2019) | 52,960 | 58,611 | ||||||
| Other securities | 203,924 | |||||||
| 262,535 | ||||||||
| 28 | American Funds Tax-Exempt Funds |
The Tax-Exempt Bond Fund of America
| Principal amount (000) | Value (000) | |||||||
| Other states & U.S. territories 21.58% | ||||||||
| Other securities | $ | 2,960,400 | ||||||
| Total bonds, notes & other debt instruments (cost: $12,683,199,000) | 12,952,560 | |||||||
| Short-term securities 5.58% | ||||||||
| State of California, County of Los Angeles, 2016-17 Tax and Rev. Anticipation Notes, 3.00% 6/30/2017 | $ | 60,000 | 60,605 | |||||
| State of Colorado, General Fund Tax and Rev. Anticipation Notes, Series 2016-A, 2.00% 6/27/2017 | 75,000 | 75,393 | ||||||
| State of Idaho, Tax Anticipation Notes, Series 2016, 2.00% 6/30/2017 | 40,000 | 40,202 | ||||||
| State of Mississippi, Business Fin. Corp., Gulf Opportunity Zone Industrial Dev. Rev. Bonds (Chevron U.S.A. Inc. Project), Series 2007-A, 0.58% 20301 | 3,000 | 3,000 | ||||||
| State of Mississippi, Business Fin. Corp., Gulf Opportunity Zone Industrial Dev. Rev. Bonds (Chevron U.S.A. Inc. Project), Series 2007-E, 0.60% 20301 | 9,000 | 9,000 | ||||||
| State of Mississippi, Business Fin. Corp., Gulf Opportunity Zone Industrial Dev. Rev. Bonds (Chevron U.S.A. Inc. Project), Series 2009-D, 0.58% 20301 | 8,000 | 8,000 | ||||||
| State of Mississippi, Business Fin. Corp., Gulf Opportunity Zone Industrial Dev. Rev. Bonds (Chevron U.S.A. Inc. Project), Series 2010-G, 0.59% 20351 | 1,525 | 1,525 | ||||||
| State of Mississippi, Business Fin. Corp., Gulf Opportunity Zone Industrial Dev. Rev. Bonds (Chevron U.S.A. Inc. Project), Series 2010-J, 0.58% 20351 | 18,400 | 18,400 | ||||||
| State of Mississippi, Business Fin. Corp., Gulf Opportunity Zone Industrial Dev. Rev. Bonds (Chevron U.S.A. Inc. Project), Series 2011-E, 0.58% 20351 | 9,000 | 9,000 | ||||||
| State of Mississippi, Business Fin. Corp., Gulf Opportunity Zone Industrial Dev. Rev. Bonds (Chevron U.S.A. Inc. Project), Series 2014-B, 0.60% 20351 | 15,250 | 15,250 | ||||||
| State of Missouri, Health and Educational Facs. Auth., Demand Educational Facs. Rev. Bonds (Washington University), Series 1996-A, 0.62% 20301 | 9,700 | 9,700 | ||||||
| State of Missouri, Health and Educational Facs. Auth., Demand Educational Facs. Rev. Bonds (Washington University), Series 2003-B, 0.60% 20331 | 12,895 | 12,895 | ||||||
| State of New York, Metropolitan Transportation Auth., Dedicated Tax Fund Bond Anticipation Notes, Series 2016-A-1-F, 2.00% 3/1/2017 | 10,000 | 10,010 | ||||||
| State of New York, Metropolitan Transportation Auth., Transportation Rev. Bond Anticipation Notes, Series 2016-A-1-E, 2.00% 3/1/2017 | 33,000 | 33,034 | ||||||
| State of New York, City of New York, G.O. Bonds, Series 2006-H-1, 0.63% 20361 | 23,485 | 23,485 | ||||||
| State of New York, City of New York, G.O. Bonds, Series 2006-L-5, 0.63% 20351 | 35,000 | 35,000 | ||||||
| State of New York, City of New York, G.O. Bonds, Series 2008-J-5, 0.63% 20281 | 19,195 | 19,195 | ||||||
| State of New York, City of New York, G.O. Bonds, Series 2008-L-4, 0.62% 20381 | 20,590 | 20,590 | ||||||
| State of New York, New York City Transitional Fin. Auth., Future Tax Secured Rev. Ref. Bonds, Series 2015-E-3, 0.63% 20451 | 15,740 | 15,740 | ||||||
| State of New York, New York City Transitional Fin. Auth., Future Tax Secured Rev. Ref. Bonds, Series 2015-E-4, 0.63% 20451 | 13,050 | 13,050 | ||||||
| State of New York, New York City Transitional Fin. Auth., Future Tax Secured Rev. Ref. Bonds, Series 2016-E-4, 0.63% 20451 | 43,250 | 43,250 | ||||||
| State of New York, New York City Transitional Fin. Auth., New York City Recovery Bonds, Fiscal 2003, Series 2002-1-C, 0.63% 20221 | 6,985 | 6,985 | ||||||
| State of New York, New York City, Municipal Water Fin. Auth., Water and Sewer System Rev. Bonds, Series 2003-F-2, 0.62% 20351 | 23,600 | 23,600 | ||||||
| State of New York, New York City, Municipal Water Fin. Auth., Water and Sewer System Second General Resolution Rev. Bonds, Fiscal 2006, Series 2005-B, 0.62% 20321 | 29,850 | 29,850 | ||||||
| State of New York, New York City, Municipal Water Fin. Auth., Water and Sewer System Second General Resolution Rev. Bonds, Fiscal 2014, Series 2013-AA-2, 0.63% 20501 | 8,000 | 8,000 | ||||||
| State of Oregon, Full Faith and Credit Tax Anticipation Notes, Series 2016-A, 2.00% 6/30/2017 | 35,390 | 35,577 | ||||||
| Other securities | 185,289 | |||||||
| Total short-term securities (cost: $765,630,000) | 765,625 | |||||||
| Total investment securities 99.95% (cost: $13,448,829,000) | 13,718,185 | |||||||
| Other assets less liabilities 0.05% | 7,161 | |||||||
| Net assets 100.00% | $ | 13,725,346 | ||||||
| American Funds Tax-Exempt Funds | 29 |
The Tax-Exempt Bond Fund of America
This summary investment portfolio is designed to streamline the report and help investors better focus on the fund’s principal holdings. See the inside back cover for details on how to obtain a complete schedule of portfolio holdings.
“Other securities” includes all issues that are not disclosed separately in the summary investment portfolio. Some of these securities (with an aggregate value of $266,758,000, which represented 1.94% of the net assets of the fund) were acquired in transactions exempt from registration under Rule 144A of the Securities Act of 1933 and may be resold in the U.S. in transactions exempt from registration, normally to qualified institutional buyers.
| 1 | Coupon rate may change periodically. For short-term securities, the date of the next scheduled coupon rate change is considered to be the maturity date. |
| Key to abbreviations |
| Agcy. = Agency |
| Auth. = Authority |
| Certs. of Part. = Certificates of Participation |
| Dept. = Department |
| Dev. = Development |
| Dist. = District |
| Econ. = Economic |
| Fac. = Facility |
| Facs. = Facilities |
| Fin. = Finance |
| Fncg. = Financing |
| G.O. = General Obligation |
| LOC = Letter of Credit |
| Preref. = Prerefunded |
| Redev. = Redevelopment |
| Ref. = Refunding |
| Rev. = Revenue |
| TECP = Tax-Exempt Commercial Paper |
See Notes to Financial Statements
| 30 | American Funds Tax-Exempt Funds |
| American High-Income Municipal Bond Fund | unaudited |
| Summary investment portfolio January 31, 2017 |
| Portfolio quality summary* | Percent of net assets |
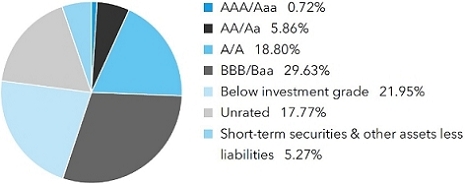
| * | Bond ratings, which typically range from AAA/Aaa (highest) to D (lowest), are assigned by credit rating agencies such as Standard & Poor’s, Moody’s and/or Fitch as an indication of an issuer’s creditworthiness. In assigning a credit rating to a security, the fund looks specifically to the ratings assigned to the issuer of the security by Standard & Poor’s, Moody’s and/or Fitch. If agency ratings differ, the security will be considered to have received the highest of those ratings, consistent with the fund’s investment policies. Securities in the “unrated“ category (above) have not been rated by a rating agency; however, the investment adviser performs its own credit analysis and assigns comparable ratings that are used for compliance with the fund’s investment policies. |
| Bonds, notes & other debt instruments 94.73% | Principal amount (000) | Value (000) | ||||||
| California 8.83% | ||||||||
| City of San Buenaventura, Rev. Bonds (Community Memorial Health System), Series 2011, 7.50% 2041 | $ | 13,040 | $ | 15,201 | ||||
| Other securities | 421,641 | |||||||
| 436,842 | ||||||||
| Colorado 4.25% | ||||||||
| City and County of Denver, Dept. of Aviation, Special Facs. Airport Rev. Ref. Bonds (United Air Lines Project), Series 2007-A, AMT, 5.25% 2032 | 16,000 | 16,241 | ||||||
| City and County of Denver, Dept. of Aviation, Special Facs. Airport Rev. Ref. Bonds (United Air Lines Project), Series 2007-A, AMT, 5.75% 2032 | 5,505 | 5,602 | ||||||
| Health Facs. Auth., Health Care Facs. Rev. Bonds (American Baptist Homes of the Midwest Obligated Group), Series 2013, 8.00% 2043 | 11,100 | 12,578 | ||||||
| Health Facs. Auth., Health Facs. Rev. Ref. Bonds (Evangelical Lutheran Good Samaritan Society Project), Series 2012, 5.00% 2042 | 11,555 | 11,793 | ||||||
| Regional Transportation Dist., Private Activity Bonds (Denver Transit Partners Eagle P3 Project), Series 2010, 6.00% 2041 | 14,800 | 16,393 | ||||||
| Other securities | 147,513 | |||||||
| 210,120 | ||||||||
| District of Columbia 0.74% | ||||||||
| Tobacco Settlement Fncg. Corp., Tobacco Settlement Asset-Backed Bonds, Series 2006-A, 0% 2046 | 145,000 | 16,584 | ||||||
| Other securities | 20,256 | |||||||
| 36,840 | ||||||||
| Florida 6.01% | ||||||||
| Dev. Fin. Corp., Healthcare Facs. Rev. Bonds (UF Health - Jacksonville Project), Series 2013-A, 6.00% 2033 | 11,930 | 13,176 | ||||||
| Lee County, Industrial Dev. Auth., Healthcare Facs. Rev. Ref. Bonds (Shell Point/Alliance Obligated Group, Shell Point Village/Alliance Community Project), Series 2007, 5.00% 2029 | 13,425 | 13,501 | ||||||
| Palm Beach County, Health Facs. Auth., Retirement Communities Rev. Bonds (ACTS Retirement-Life Communities, Inc. Obligated Group), Series 2016, 5.00% 2032 | 11,675 | 12,573 | ||||||
| City of Tallahassee, Health Facs. Rev. Ref. Bonds (Tallahassee Memorial HealthCare, Inc. Project), Series 2016-A, 5.00% 2055 | 11,200 | 11,754 | ||||||
| Other securities | 246,555 | |||||||
| 297,559 | ||||||||
| American Funds Tax-Exempt Funds | 31 |
American High-Income Municipal Bond Fund
| Bonds, notes & other debt instruments (continued) | Principal amount (000) | Value (000) | ||||||
| Illinois 11.70% | ||||||||
| Chicago Transit Auth., Sales Tax Receipts Rev. Bonds, Series 2017, 5.00% 2051 | $ | 15,000 | $ | 15,859 | ||||
| City of Chicago, Chicago Midway Airport, Rev. Ref. Bonds, Series 2014-A, AMT, 5.00% 2041 | 13,000 | 13,778 | ||||||
| Fin. Auth., Student Housing Rev. Ref. Bonds (CHF-DeKalb II, LLC - Northern Illinois University Project), Series 2011, 6.875% 2043 | 11,510 | 12,744 | ||||||
| Fin. Auth., Rev. Ref. Bonds (Provena Health), Series 2009-A, 7.75% 2034 (preref. 2019) | 12,825 | 14,896 | ||||||
| G.O. Bonds, Series 2012-A, 5.00% 2028 | 2,000 | 2,034 | ||||||
| G.O. Bonds, Series 2013, 5.50% 2026 | 2,000 | 2,113 | ||||||
| G.O. Bonds, Series 2013, 5.50% 2033 | 3,000 | 3,131 | ||||||
| G.O. Bonds, Series 2014, 5.00% 2026 | 2,025 | 2,092 | ||||||
| G.O. Bonds, Series 2014, 5.00% 2026 | 2,000 | 2,080 | ||||||
| G.O. Bonds, Series 2014, 5.00% 2027 | 2,000 | 2,067 | ||||||
| G.O. Bonds, Series 2014, 5.00% 2039 | 4,625 | 4,613 | ||||||
| G.O. Bonds, Series 2016, 4.00% 2032 | 7,000 | 6,146 | ||||||
| G.O. Bonds, Series 2016, 5.00% 2028 | 1,500 | 1,541 | ||||||
| G.O. Bonds, Series 2016, 5.00% 2038 | 1,000 | 995 | ||||||
| G.O. Bonds, Series 2016, 5.50% 2027 | 2,000 | 2,102 | ||||||
| G.O. Bonds, Series of July 2013, 5.50% 2038 | 1,000 | 1,035 | ||||||
| G.O. Bonds, Series of March 2012, 5.00% 2037 | 1,980 | 1,970 | ||||||
| G.O. Bonds, Series of May 2014, 5.00% 2039 | 2,600 | 2,593 | ||||||
| G.O. Ref. Bonds, 5.00% 2030 | 3,000 | 3,045 | ||||||
| G.O. Rev. Ref. Bonds, Series 2012, 4.00% 2025 | 405 | 394 | ||||||
| G.O. Rev. Ref. Bonds, Series 2016, 5.00% 2026 | 7,250 | 7,545 | ||||||
| G.O. Rev. Ref. Bonds, Series 2016, 5.00% 2028 | 5,000 | 5,153 | ||||||
| G.O. Rev. Ref. Bonds, Series 2016, Assured Guaranty Municipal insured, 4.00% 2030 | 2,000 | 2,003 | ||||||
| Southwestern Illinois Dev. Auth., Health Fac. Rev. Bonds (Memorial Group, Inc.), Series 2013, 7.625% 2048 | 11,020 | 14,318 | ||||||
| Other securities | 455,038 | |||||||
| 579,285 | ||||||||
| Massachusetts 2.60% | ||||||||
| Dev. Fin. Agcy., Rev. Bonds (Linden Ponds, Inc. Fac.), Series 2011-A-1, 6.25% 2046 | 12,261 | 12,568 | ||||||
| Dev. Fin. Agcy., Rev. Bonds (Linden Ponds, Inc. Fac.), Series 2016-A, 4.68% 20211 | 11,440 | 11,388 | ||||||
| Dev. Fin. Agcy., Rev. Ref. Bonds (Tufts Medical Center Issue), Series 2011-I, 6.75% 2036 | 11,175 | 12,695 | ||||||
| Educational Fncg. Auth., Education Loan Rev. Bonds, Series 2016-J, AMT, 3.50% 2033 | 21,000 | 18,761 | ||||||
| Other securities | 73,481 | |||||||
| 128,893 | ||||||||
| Michigan 4.27% | ||||||||
| Tobacco Settlement Fin. Auth., Tobacco Settlement Asset-backed Bonds, Current Interest Bonds, Series 2007-A, 6.00% 2034 | 4,050 | 3,925 | ||||||
| Tobacco Settlement Fin. Auth., Tobacco Settlement Asset-backed Bonds, Current Interest Bonds, Series 2007-A, 6.00% 2048 | 60,385 | 55,778 | ||||||
| Tobacco Settlement Fin. Auth., Tobacco Settlement Asset-backed Rev. Ref. Bonds, Current Interest Bonds, Series 2008-A, 6.875% 2042 | 5,440 | 5,473 | ||||||
| Wayne County, Airport Auth., Airport Rev. Ref. Bonds (Detroit Metropolitan Wayne County Airport), Series 2012-D, AMT, 5.00% 2028 | 12,000 | 12,991 | ||||||
| Other securities | 133,169 | |||||||
| 211,336 | ||||||||
| New Jersey 3.85% | ||||||||
| Econ. Dev. Auth., School Facs. Construction Rev. Ref. Bonds, Series 2013-I, 2.26% 20282 | 13,500 | 12,471 | ||||||
| Econ. Dev. Auth., Special Fac. Rev. Bonds (Continental Airlines, Inc. Project), Series 1999, AMT, 5.125% 2023 | 3,500 | 3,706 | ||||||
| Econ. Dev. Auth., Special Fac. Rev. Bonds (Continental Airlines, Inc. Project), Series 1999, AMT, 5.25% 2029 | 16,300 | 17,194 | ||||||
| Econ. Dev. Auth., Special Fac. Rev. Bonds (Continental Airlines, Inc. Project), Series 2000-B, AMT, 5.625% 2030 | 2,500 | 2,721 | ||||||
| Econ. Dev. Auth., Special Fac. Rev. Bonds (Continental Airlines, Inc. Project), Series 2003, AMT, 5.50% 2033 | 3,500 | 3,761 | ||||||
| Econ. Dev. Auth., Special Fac. Rev. Ref. Bonds (Continental Airlines, Inc. Project), Series 2012, AMT, 5.75% 2027 | 4,500 | 4,825 | ||||||
| 32 | American Funds Tax-Exempt Funds |
American High-Income Municipal Bond Fund
| Principal amount (000) | Value (000) | |||||||
| South Jersey Transportation Auth., Transportation System Rev. Bonds, Series 2014-A, 5.00% 2039 | $ | 12,650 | $ | 13,546 | ||||
| Tobacco Settlement Fncg. Corp., Tobacco Settlement Asset-backed Rev. Ref. Bonds, Series 2007-1-A, 5.00% 2041 | 22,860 | 20,575 | ||||||
| Other securities | 111,577 | |||||||
| 190,376 | ||||||||
| New York 4.33% | ||||||||
| Liberty Dev. Corp., Liberty Rev. Ref. Bonds (Bank of America Tower at One Bryant Park Project), Series 2010, 6.375% 2049 | 13,360 | 14,578 | ||||||
| Transportation Dev. Corp., Special Facs. Bonds (LaGuardia Airport Terminal B Redev. Project), Series 2016-A, AMT, 5.25% 2050 | 21,950 | 23,227 | ||||||
| Other securities | 176,747 | |||||||
| 214,552 | ||||||||
| Ohio 5.04% | ||||||||
| Buckeye Tobacco Settlement Fncg. Auth., Tobacco Settlement Asset-backed Bonds, Current Interest Bonds, Series 2007-A-2, 5.875% 2030 | 2,350 | 2,148 | ||||||
| Buckeye Tobacco Settlement Fncg. Auth., Tobacco Settlement Asset-backed Bonds, Current Interest Bonds, Series 2007-A-2, 5.875% 2047 | 108,715 | 100,007 | ||||||
| Buckeye Tobacco Settlement Fncg. Auth., Tobacco Settlement Asset-backed Bonds, Current Interest Bonds, Series 2007-A-2, 6.50% 2047 | 18,215 | 17,945 | ||||||
| Other securities | 129,361 | |||||||
| 249,461 | ||||||||
| Oklahoma 0.87% | ||||||||
| Trustees of the Tulsa Municipal Airport Trust, American Airlines Inc. Rev. Ref. Bonds, Series 2001-B, AMT, 5.50% 2035 | 15,875 | 16,839 | ||||||
| Other securities | 26,282 | |||||||
| 43,121 | ||||||||
| Pennsylvania 5.19% | ||||||||
| Hospitals and Higher Education Facs. Auth. of Philadelphia, Hospital Rev. Bonds (Temple University Health System Obligated Group), Series 2012-A, 5.625% 2042 | 12,320 | 13,160 | ||||||
| Other securities | 243,641 | |||||||
| 256,801 | ||||||||
| Puerto Rico 3.45% | ||||||||
| Aqueduct and Sewer Auth., Rev. Ref. Bonds, Series 2012-A, 5.25% 2042 | 26,410 | 20,080 | ||||||
| Electric Power Auth., Power Rev. Ref. Bonds, Series UU, Assured Guaranty Municipal insured, 1.189% 20292 | 19,260 | 14,653 | ||||||
| Highways and Transportation Auth., Transportation Rev. Ref. Bonds, Series 2007-N, Assured Guaranty insured, 5.25% 2036 | 11,085 | 11,914 | ||||||
| Industrial, Tourist, Educational, Medical and Environmental Control Facs. Fncg. Auth., Hospital Rev. and Rev. Ref. Bonds (Hospital Auxilio Mutuo Obligated Group Project), Series 2011-A, 6.00% 2033 | 12,025 | 12,208 | ||||||
| Sales Tax Fncg. Corp., Sales Tax Rev. Ref. Bonds, Series 2007-A, National insured, 0% 2043 | 54,000 | 11,837 | ||||||
| Other securities | 100,154 | |||||||
| 170,846 | ||||||||
| Rhode Island 1.09% | ||||||||
| Health and Educational Building Corp., Hospital Fncg. Rev. Ref. Bonds (Care New England Issue), Series 2016-B, 5.00% 2031 | 11,410 | 11,645 | ||||||
| Housing and Mortgage Fin. Corp., Homeownership Opportunity Bonds, Series 68-C, AMT, 3.50% 2039 | 13,250 | 13,801 | ||||||
| Other securities | 28,440 | |||||||
| 53,886 | ||||||||
| American Funds Tax-Exempt Funds | 33 |
American High-Income Municipal Bond Fund
| Bonds, notes & other debt instruments (continued) | Principal amount (000) | Value (000) | ||||||
| Texas 7.52% | ||||||||
| Brazos River Harbor Navigation Dist. of Brazoria County, Environmental Facs. Rev. Ref. Bonds (Dow Chemical Co. Project), Series 2002-A-4, AMT, 5.95% 2033 | $ | 24,675 | $ | 26,197 | ||||
| City of Houston, Airport System Special Facs. Rev. Bonds (Continental Airlines, Inc. Terminal Improvement Projects), Series 2011, AMT, 6.50% 2030 | 9,300 | 10,224 | ||||||
| City of Houston, Airport System Special Facs. Rev. Bonds (Continental Airlines, Inc. Terminal Improvement Projects), Series 2011, AMT, 6.625% 2038 | . | 3,000 | 3,313 | |||||
| City of Houston, Airport System Special Facs. Rev. Ref. Bonds (United Airlines, Inc. Airport Improvement Projects), Series 2015-B-1, AMT, 5.00% 2030 | 3,000 | 3,150 | ||||||
| City of Houston, Airport System Special Facs. Rev. Ref. Bonds (United Airlines, Inc. Airport Improvement Projects), Series 2015-C, AMT, 5.00% 2020 | 7,235 | 7,552 | ||||||
| City of Houston, Airport System Special Facs. Rev. Ref. Bonds (United Airlines, Inc. Terminal E Project), Series 2014, AMT, 4.75% 2024 | 5,500 | 5,834 | ||||||
| City of Houston, Airport System Special Facs. Rev. Ref. Bonds (United Airlines, Inc. Terminal E Project), Series 2014, AMT, 5.00% 2029 | 6,745 | 7,095 | ||||||
| Mission Econ. Dev. Corp., Rev. Bonds (Natgasoline Project), Series 2016-B, AMT, 5.75% 20311 | 14,165 | 14,659 | ||||||
| Tarrant County, Cultural Education Facs. Fin. Corp., Retirement Fac. Rev. Bonds (Air Force Villages Obligated Group), 5.00% 2045 | 12,125 | 11,784 | ||||||
| Turnpike Auth, Central Texas Turnpike System, Rev. Bonds, Series 2002-A, AMBAC insured, 0% 2028 | 25,800 | 17,159 | ||||||
| Other securities | 265,307 | |||||||
| 372,274 | ||||||||
| Wisconsin 2.13% | ||||||||
| Housing and Econ. Dev. Auth., Home Ownership Rev. Bonds, Series 2016-A, AMT, 3.50% 2046 | 18,330 | 18,991 | ||||||
| Other securities | 86,272 | |||||||
| 105,263 | ||||||||
| Other states & U.S. territories 22.86% | ||||||||
| Other securities | 1,131,818 | |||||||
| Total bonds, notes & other debt instruments (cost: $4,636,125,000) | 4,689,273 | |||||||
| Short-term securities 4.67% | ||||||||
| State of California, County of Los Angeles, 2016-17 Tax and Rev. Anticipation Notes, 3.00% 6/30/2017 | 14,000 | 14,141 | ||||||
| State of Colorado, General Fund Tax and Rev. Anticipation Notes, Series 2016-A, 2.00% 6/27/2017 | 50,000 | 50,262 | ||||||
| State of Mississippi, Business Fin. Corp., Gulf Opportunity Zone Industrial Dev. Rev. Bonds (Chevron U.S.A. Inc. Project), Series 2007-A, 0.58% 20302 | 3,000 | 3,000 | ||||||
| State of Mississippi, Business Fin. Corp., Gulf Opportunity Zone Industrial Dev. Rev. Bonds (Chevron U.S.A. Inc. Project), Series 2007-E, 0.60% 20302 | 3,375 | 3,375 | ||||||
| State of Mississippi, Business Fin. Corp., Gulf Opportunity Zone Industrial Dev. Rev. Bonds (Chevron U.S.A. Inc. Project), Series 2011-E, 0.58% 20352 | 5,000 | 5,000 | ||||||
| State of New York, Metropolitan Transportation Auth., Dedicated Tax Fund Bond Anticipation Notes, Series 2016-A-1-F, 2.00% 3/1/2017 | 7,500 | 7,508 | ||||||
| State of New York, Metropolitan Transportation Auth., Transportation Rev. Bond Anticipation Notes, Series 2016-A-1-E, 2.00% 3/1/2017 | 7,000 | 7,007 | ||||||
| State of New York, City of New York, G.O. Bonds, Series 2006-H-1, 0.63% 20362 | 5,000 | 5,000 | ||||||
| State of New York, City of New York, G.O. Bonds, Series 2006-L-5, 0.63% 20352 | 15,000 | 15,000 | ||||||
| State of New York, City of New York, G.O. Bonds, Series 2008-J-5, 0.63% 20282 | 7,000 | 7,000 | ||||||
| 34 | American Funds Tax-Exempt Funds |
American High-Income Municipal Bond Fund
| Principal amount (000) | Value (000) | |||||||
| State of New York, New York City Transitional Fin. Auth., Future Tax Secured Rev. Ref. Bonds, Series 2016-E-4, 0.63% 20452 | $ | 11,600 | $ | 11,600 | ||||
| State of Oregon, Full Faith and Credit Tax Anticipation Notes, Series 2016-A, 2.00% 6/30/2017 | 15,000 | 15,079 | ||||||
| Other securities | 87,084 | |||||||
| Total short-term securities (cost: $231,070,000) | 231,056 | |||||||
| Total investment securities 99.40% (cost: $4,867,195,000) | 4,920,329 | |||||||
| Other assets less liabilities 0.60% | 29,661 | |||||||
| Net assets 100.00% | $ | 4,949,990 | ||||||
This summary investment portfolio is designed to streamline the report and help investors better focus on the fund’s principal holdings. See the inside back cover for details on how to obtain a complete schedule of portfolio holdings.
“Other securities” includes all issues that are not disclosed separately in the summary investment portfolio.
| 1 | Acquired in a transaction exempt from registration under Rule 144A of the Securities Act of 1933. May be resold in the U.S. in transactions exempt from registration, normally to qualified institutional buyers. The total value of all such securities, including those in “Other securities,“ was $382,810,000, which represented 7.73% of the net assets of the fund. |
| 2 | Coupon rate may change periodically. For short-term securities, the date of the next scheduled coupon rate change is considered to be the maturity date. |
Key to abbreviations
Agcy. = Agency
AMT = Alternative Minimum Tax
Auth. = Authority
Certs. of Part. = Certificates of Participation
Dept. = Department
Dev. = Development
Dist. = District
Econ. = Economic
Fac. = Facility
Facs. = Facilities
Fin. = Finance
Fncg. = Financing
G.O. = General Obligation
LOC = Letter of Credit
Preref. = Prerefunded
Redev. = Redevelopment
Ref. = Refunding
Rev. = Revenue
TECP = Tax-Exempt Commercial Paper
See Notes to Financial Statements
| American Funds Tax-Exempt Funds | 35 |
| The Tax-Exempt Fund of California | unaudited |
| Summary investment portfolio January 31, 2017 |
| Portfolio quality summary* | Percent of net assets |
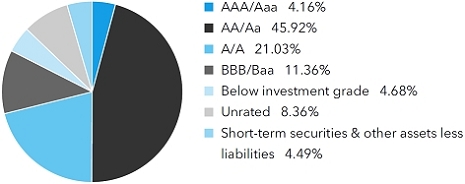
| * | Bond ratings, which typically range from AAA/Aaa (highest) to D (lowest), are assigned by credit rating agencies such as Standard & Poor’s, Moody’s and/or Fitch as an indication of an issuer’s creditworthiness. In assigning a credit rating to a security, the fund looks specifically to the ratings assigned to the issuer of the security by Standard & Poor’s, Moody’s and/or Fitch. If agency ratings differ, the security will be considered to have received the highest of those ratings, consistent with the fund’s investment policies. Securities in the “unrated“ category (above) have not been rated by a rating agency; however, the investment adviser performs its own credit analysis and assigns comparable ratings that are used for compliance with the fund’s investment policies. |
| Bonds, notes & other debt instruments 95.51% | Principal amount (000) | Value (000) | ||||||
| California 93.41% | ||||||||
| State issuers 37.11% | ||||||||
| Trustees of The California State University, Systemwide Rev. Bonds, Series 2016-A, 4.00% 2034 | $ | 2,000 | $ | 2,078 | ||||
| Trustees of The California State University, Systemwide Rev. Bonds, Series 2016-A, 4.00% 2035 | 10,000 | 10,344 | ||||||
| Trustees of The California State University, Systemwide Rev. Bonds, Series 2016-A, 4.00% 2037 | 6,645 | 6,831 | ||||||
| Trustees of The California State University, Systemwide Rev. Bonds, Series 2016-B-2, 4.00% 2049 (put 2021) | 5,000 | 5,471 | ||||||
| Trustees of The California State University, Systemwide Rev. Ref. Bonds, Series 2012-A, 5.00% 2027 | 3,000 | 3,445 | ||||||
| Educational Facs. Auth., Rev. Ref. Bonds (California Lutheran University), Series 2008, 5.75% 2038 | 6,000 | 6,357 | ||||||
| Educational Facs. Auth., Rev. Ref. Bonds (Chapman University), Series 2011, 5.00% 2031 | 8,615 | 9,508 | ||||||
| G.O. Bonds, Series 2012-A, 1.11% 2033 (put 2018)1 | 6,500 | 6,490 | ||||||
| G.O. Bonds, Series 2013-E, 1.37% 20291 | 1,500 | 1,505 | ||||||
| Various Purpose G.O. Bonds, 5.00% 2017 | 6,000 | 6,000 | ||||||
| Various Purpose G.O. Bonds, 5.00% 2033 | 4,000 | 4,591 | ||||||
| Various Purpose G.O. Bonds, 5.25% 2028 | 5,000 | 5,749 | ||||||
| Various Purpose G.O. Bonds, 5.25% 2028 | 2,000 | 2,295 | ||||||
| Various Purpose G.O. Bonds, 5.25% 2032 | 5,000 | 5,896 | ||||||
| Various Purpose G.O. Bonds, 6.00% 2038 | 7,000 | 7,684 | ||||||
| Various Purpose G.O. Bonds, 6.00% 2039 | 2,000 | 2,236 | ||||||
| Various Purpose G.O. Bonds, 6.50% 2033 | 5,000 | 5,558 | ||||||
| Various Purpose G.O. Bonds, Series 2008, 5.00% 2017 | 2,675 | 2,685 | ||||||
| Various Purpose G.O. Bonds, Series 2016, 4.00% 2017 | 10,000 | 10,191 | ||||||
| Various Purpose G.O. Rev. Ref. Bonds, 4.00% 2017 | 1,000 | 1,003 | ||||||
| Various Purpose G.O. Rev. Ref. Bonds, Series 2016-C, 5.00% 2033 | 2,000 | 2,311 | ||||||
| Veterans G.O. Ref. Bonds, Series 2016-CN, 3.50% 2045 | 9,980 | 10,509 | ||||||
| Golden State Tobacco Securitization Corp., Enhanced Tobacco Settlement Asset-backed Bonds, Series 2005-A, Assured Guaranty Municipal insured, 0% 2026 | 11,000 | 8,155 | ||||||
| Golden State Tobacco Securitization Corp., Enhanced Tobacco Settlement Asset-backed Bonds, Series 2007-A-1, 5.125% 2047 | 5,000 | 4,685 | ||||||
| Golden State Tobacco Securitization Corp., Enhanced Tobacco Settlement Asset-backed Bonds, Series 2015-A, 5.00% 2032 | 3,250 | 3,650 | ||||||
| Golden State Tobacco Securitization Corp., Enhanced Tobacco Settlement Asset-backed Bonds, Series 2015-A, 5.00% 2033 | 5,265 | 5,896 | ||||||
| Golden State Tobacco Securitization Corp., Enhanced Tobacco Settlement Asset-backed Bonds, Series 2015-A, 5.00% 2040 | 5,000 | 5,534 | ||||||
| Golden State Tobacco Securitization Corp., Tobacco Settlement Asset-backed Rev. Ref. Bonds, Series 2007-A-1, 5.75% 2047 | 27,225 | 26,937 | ||||||
| Health Facs. Fncg. Auth., Rev. Bonds (Sutter Health), Series 2011-D, 5.25% 2031 | 2,000 | 2,287 | ||||||
| 36 | American Funds Tax-Exempt Funds |
The Tax-Exempt Fund of California
| Principal amount (000) | Value (000) | |||||||
| Health Facs. Fncg. Auth., Rev. Ref. Bonds (Stanford Hospital and Clinics), Series 2010-B, 5.25% 2031 | $ | 8,000 | $ | 8,894 | ||||
| Health Facs. Fncg. Auth., Rev. Ref. Bonds (Sutter Health), Series 2008-A, 5.25% 2022 | 2,000 | 2,121 | ||||||
| Health Facs. Fncg. Auth., Rev. Ref. Bonds (Sutter Health), Series 2016-A, 5.00% 2033 | 1,000 | 1,134 | ||||||
| Health Facs. Fncg. Auth., Rev. Ref. Bonds (Sutter Health), Series 2016-A, 5.00% 2034 | 2,000 | 2,254 | ||||||
| Health Facs. Fncg. Auth., Rev. Ref. Bonds (Sutter Health), Series 2016-A, 5.00% 2035 | 2,000 | 2,248 | ||||||
| Health Facs. Fncg. Auth., Rev. Ref. Bonds (Sutter Health), Series 2016-B, 4.00% 2038 | 9,165 | 9,268 | ||||||
| Health Facs. Fncg. Auth., Rev. Ref. Bonds (Sutter Health), Series 2016-B, 5.00% 2035 | 1,000 | 1,136 | ||||||
| Imperial Irrigation Dist., Electric System Rev. Ref. Bonds, 5.25% 2024 (preref. 2018) | 1,630 | 1,751 | ||||||
| Imperial Irrigation Dist., Electric System Rev. Ref. Bonds, 5.25% 2024 (preref. 2018) | 370 | 397 | ||||||
| Imperial Irrigation Dist., Electric System Rev. Ref. Bonds, Series 2008-A, 5.00% 2033 (preref. 2018) | 5,305 | 5,676 | ||||||
| Imperial Irrigation Dist., Electric System Rev. Ref. Bonds, Series 2008-A, 5.00% 2033 (preref. 2018) | 2,110 | 2,258 | ||||||
| Imperial Irrigation Dist., Electric System Rev. Ref. Bonds, Series 2008-A, 5.25% 2025 (preref. 2018) | 365 | 392 | ||||||
| Imperial Irrigation Dist., Electric System Rev. Ref. Bonds, Series 2016-B-2, 4.00% 2032 | 1,830 | 1,934 | ||||||
| Imperial Irrigation Dist., Electric System Rev. Ref. Bonds, Series 2016-B-2, 5.00% 2041 | 6,965 | 7,914 | ||||||
| Infrastructure and Econ. Dev. Bank, Rev. Ref. Bonds (J. Paul Getty Trust), Series 2013-A-2, 1.043% 2047 (put 2019)1 | 10,000 | 9,952 | ||||||
| Municipal Fin. Auth., Rev. Ref. Bonds (Azusa Pacific University Project), Series 2011-B, 8.00% 2041 (preref. 2021)2 | 8,550 | 10,763 | ||||||
| Municipal Fin. Auth., Rev. Bonds (NorthBay Healthcare Group), Series 2017-A, 5.25% 2041 | 5,825 | 6,281 | ||||||
| Northern California Power Agcy., Lodi Energy Center Rev. Bonds, Issue One, Series 2010-A, 5.00% 2025 | 6,000 | 6,554 | ||||||
| Pollution Control Fncg. Auth., Water Furnishing Rev. Bonds (Poseidon Resources (Channelside) LP Desalination Project), Series 2012 Plant Bonds, AMT, 5.00% 20452 | 7,000 | 7,143 | ||||||
| Public Works Board, Lease Rev. Bonds (Regents of the University of California, Various University of California Projects), Series 2009-E, 5.00% 2024 (preref. 2019) | 2,500 | 2,708 | ||||||
| Public Works Board, Lease Rev. Bonds (Regents of the University of California, Various University of California Projects), Series 2009-E, 5.00% 2034 (preref. 2019) | 1,500 | 1,625 | ||||||
| Statewide Communities Dev. Auth., Rev. Bonds (Front Porch Communities and Services Project), Series 2007-A, 5.125% 20372 | 9,500 | 9,526 | ||||||
| Statewide Communities Dev. Auth., Rev. Bonds (Inland Regional Center Project), Series 2007, 5.375% 2037 (preref. 2017) | 6,500 | 6,743 | ||||||
| Statewide Communities Dev. Auth., Rev. Bonds (John Muir Health), Series 2016-A, 4.00% 2046 | 10,395 | 10,183 | ||||||
| Statewide Communities Dev. Auth., Rev. Bonds (Kaiser Permanente), Series 2012-A, 5.00% 2042 | 6,500 | 7,075 | ||||||
| Statewide Communities Dev. Auth., Rev. Bonds (Sutter Health), Series 2011-A, 5.25% 2024 | 1,000 | 1,125 | ||||||
| Statewide Communities Dev. Auth., Rev. Bonds (Sutter Health), Series 2011-A, 6.00% 2042 | 4,500 | 5,130 | ||||||
| Statewide Communities Dev. Auth., Rev. Ref. Bonds (Catholic Healthcare West), Series 2008-D, 5.50% 2031 (preref. 2017) | 6,090 | 6,210 | ||||||
| Regents of the University of California, Limited Project Rev. Bonds, Series 2015-I, 5.00% 2017 | 5,050 | 5,113 | ||||||
| Regents of the University of California, Limited Project Rev. Bonds, Series 2016-K, 5.00% 2033 | 2,110 | 2,465 | ||||||
| Regents of the University of California, Limited Project Rev. Bonds, Series 2016-K, 5.00% 2034 | 2,500 | 2,907 | ||||||
| Regents of the University of California, Limited Project Rev. Bonds, Series 2016-K, 5.00% 2035 | 9,390 | 10,877 | ||||||
| Regents of the University of California, Medical Center Pooled Rev. Bonds, Series 2016-L, 4.00% 2037 | 5,585 | 5,702 | ||||||
| Regents of the University of California, Medical Center Pooled Rev. Bonds, Series 2016-L, 4.00% 2038 | 2,360 | 2,408 | ||||||
| Regents of the University of California, Medical Center Pooled Rev. Bonds, Series 2016-L, 5.00% 2033 | 3,000 | 3,452 | ||||||
| American Funds Tax-Exempt Funds | 37 |
The Tax-Exempt Fund of California
| Bonds, notes & other debt instruments (continued) | Principal amount (000) | Value (000) | ||||||
| California (continued) | ||||||||
| State issuers (continued) | ||||||||
| Regents of the University of California, Medical Center Pooled Rev. Bonds, Series 2016-L, 5.00% 2034 | $ | 2,000 | $ | 2,291 | ||||
| Regents of the University of California, Medical Center Pooled Rev. Ref. Bonds, Series 2007-C-2, National insured, 1.274% 20371 | 5,000 | 4,262 | ||||||
| Regents of the University of California, Medical Center Pooled Rev. Ref. Bonds, Series 2007-C-2, National insured, 1.344% 20431 | 8,000 | 6,506 | ||||||
| Other securities | 383,052 | |||||||
| 743,311 | ||||||||
| City & county issuers 56.30% | ||||||||
| Alameda Corridor Transportation Auth., Rev. Ref. Bonds, Series 2013-A, 5.00% 2025 | 1,700 | 1,962 | ||||||
| Alameda Corridor Transportation Auth., Rev. Ref. Bonds, Series 2013-A, 5.00% 2026 | 6,375 | 7,309 | ||||||
| Alameda Corridor Transportation Auth., Rev. Ref. Bonds, Series 2016-B, 5.00% 2034 | 2,000 | 2,198 | ||||||
| Alameda Corridor Transportation Auth., Rev. Ref. Bonds, Series 2016-B, 5.00% 2036 | 1,000 | 1,091 | ||||||
| Alameda Corridor Transportation Auth., Rev. Ref. Bonds, Series 2016-B, 5.00% 2037 | 3,790 | 4,120 | ||||||
| Alameda Corridor Transportation Auth., Rev. Ref. Bonds, Series 2016-B, Assured Guaranty Municipal insured, 4.00% 2035 | 2,500 | 2,522 | ||||||
| Alameda Corridor Transportation Auth., Rev. Ref. Bonds, Series 2016-B, Assured Guaranty Municipal insured, 4.00% 2037 | 2,000 | 2,009 | ||||||
| Alameda Corridor Transportation Auth., Rev. Ref. Bonds, Series 2016-B, Assured Guaranty Municipal insured, 5.00% 2036 | 1,500 | 1,675 | ||||||
| Baldwin Park Unified School Dist. (Los Angeles County), G.O. Rev. Ref. Bonds, Series 2016, Assured Guaranty Municipal insured, 4.00% 2031 | 6,420 | 6,730 | ||||||
| Assn. of Bay Area Governments, Fin. Auth. for Nonprofit Corps., Insured Rev. Ref. Bonds (Casa de las Campanas, Inc.), Series 2010, 6.00% 2037 | 6,000 | 6,711 | ||||||
| Bay Area Toll Auth., San Francisco Bay Area Toll Bridge Rev. Bonds, Series 2017-F-1, 5.00% 2056 | 6,000 | 6,674 | ||||||
| Bay Area Toll Auth., San Francisco Bay Area Toll Bridge Rev. Ref. Bonds, Series 2006-C-1, 1.56% 2045 (put 2023)1 | 2,000 | 1,985 | ||||||
| Bay Area Toll Auth., San Francisco Bay Area Toll Bridge Rev. Ref. Bonds, Series 2008-B-1, 1.76% 2045 (put 2024)1 | 7,500 | 7,499 | ||||||
| Bay Area Toll Auth., San Francisco Bay Area Toll Bridge Rev. Ref. Bonds, Series 2008-F-1, 5.00% 2039 (preref. 2018) | 2,000 | 2,095 | ||||||
| Bay Area Toll Auth., San Francisco Bay Area Toll Bridge Rev. Ref. Bonds, Series 2009-F-1, 5.125% 2039 (preref. 2019) | 2,000 | 2,172 | ||||||
| Bay Area Toll Auth., San Francisco Bay Area Toll Bridge Rev. Ref. Bonds, Series 2009-F-1, 5.625% 2044 (preref. 2019) | 1,670 | 1,831 | ||||||
| Bay Area Toll Auth., San Francisco Bay Area Toll Bridge Rev. Ref. Bonds, Series 2014-B, 1.50% 2047 (put 2018) | 3,950 | 3,966 | ||||||
| Bay Area Toll Auth., San Francisco Bay Area Toll Bridge Rev. Ref. Bonds, Series 2014-F-1, 5.00% 2054 | 5,000 | 5,498 | ||||||
| Bay Area Toll Auth., San Francisco Bay Area Toll Bridge Rev. Ref. Bonds, Series 2014-G, 1.26% 2034 (put 2020)1 | 2,750 | 2,751 | ||||||
| Bay Area Toll Auth., San Francisco Bay Area Toll Bridge Rev. Ref. Bonds, Series 2014-H, 1.36% 2034 (put 2021)1 | 4,000 | 3,998 | ||||||
| Certs. of Part., Palomar Pomerado Health, 6.00% 2030 | 1,500 | 1,621 | ||||||
| Certs. of Part., Palomar Pomerado Health, 6.00% 2041 | 3,710 | 4,039 | ||||||
| Certs. of Part., Palomar Pomerado Health, 6.75% 2039 (preref. 2019) | 3,500 | 4,026 | ||||||
| Chabot-Las Positas Community College Dist. (Alameda and Contra Costa Counties), G.O. Rev. Ref. Bonds, Series 2016, 4.00% 2034 | 9,940 | 10,412 | ||||||
| Coachella Valley Unified School Dist., G.O. Bonds (Riverside and Imperial Counties), 2005 Election, Series 2016-E, Assured Guaranty Municipal insured, 4.00% 2045 | 6,555 | 6,627 | ||||||
| Foothill/Eastern Transportation Corridor Agcy., Toll Road Rev. Ref. Bonds, Series 2013-A, 6.00% 2053 | 7,500 | 8,570 | ||||||
| Foothill/Eastern Transportation Corridor Agcy., Toll Road Rev. Ref. Bonds, Series 2014-A, 6.00% 2049 | 5,800 | 6,647 | ||||||
| City of Los Angeles, Dept. of Airports, Los Angeles International Airport, Rev. Bonds, Series 2016-B, AMT, 5.00% 2029 | 1,450 | 1,671 | ||||||
| City of Los Angeles, Dept. of Airports, Los Angeles International Airport, Rev. Bonds, Series 2016-B, AMT, 5.00% 2031 | 1,020 | 1,163 | ||||||
| City of Los Angeles, Dept. of Airports, Los Angeles International Airport, Rev. Bonds, Series 2016-B, AMT, 5.00% 2033 | 500 | 564 | ||||||
| 38 | American Funds Tax-Exempt Funds |
The Tax-Exempt Fund of California
| Principal amount (000) | Value (000) | |||||||
| Dept. of Airports of the City of Los Angeles, Los Angeles International Airport, Rev. Bonds, Series 2016-A, AMT, 4.00% 2034 | $ | 1,000 | $ | 1,020 | ||||
| Dept. of Airports of the City of Los Angeles, Los Angeles International Airport, Rev. Bonds, Series 2016-A, AMT, 5.00% 2035 | 2,000 | 2,231 | ||||||
| Dept. of Airports of the City of Los Angeles, Los Angeles International Airport, Rev. Bonds, Series 2016-A, AMT, 5.00% 2042 | 1,000 | 1,103 | ||||||
| Dept. of Airports of the City of Los Angeles, Los Angeles International Airport, Rev. Bonds, Series 2010-B, 5.00% 2035 | 1,000 | 1,099 | ||||||
| Dept. of Airports of the City of Los Angeles, Los Angeles International Airport, Rev. Ref. Bonds, Series 2008-A, AMT, 5.50% 2022 (preref. 2018) | 5,000 | 5,286 | ||||||
| Dept. of Airports of the City of Los Angeles, Los Angeles International Airport, Rev. Ref. Bonds, Series 2009-A, 5.25% 2029 | 2,000 | 2,171 | ||||||
| Dept. of Airports of the City of Los Angeles, Los Angeles International Airport, Rev. Ref. Bonds, Series 2010-A, 5.00% 2029 | 2,000 | 2,207 | ||||||
| Dept. of Airports, Los Angeles International Airport Rev. Bonds, Series 2015-A, AMT, 5.00% 2027 | 1,250 | 1,460 | ||||||
| Dept. of Airports, Los Angeles International Airport Rev. Bonds, Series 2015-A, AMT, 5.00% 2029 | 1,560 | 1,793 | ||||||
| Oakland Unified School Dist., (County of Alameda), G.O. Bonds, Series 2015-A, 5.00% 2040 | 5,550 | 6,262 | ||||||
| Palomar Health, G.O. Rev. Ref. Bonds, Series 2016-A, 5.00% 2034 | 970 | 1,083 | ||||||
| Palomar Health, G.O. Rev. Ref. Bonds, Series 2016-B, 4.00% 2030 | 1,000 | 1,037 | ||||||
| Palomar Health, G.O. Rev. Ref. Bonds, Series 2016-B, 4.00% 2031 | 1,000 | 1,031 | ||||||
| Palomar Health, Rev. Ref. Bonds, Series 2016, 5.00% 2036 | 3,000 | 3,122 | ||||||
| Palomar Health, Rev. Ref. Bonds, Series 2016, 5.00% 2039 | 3,250 | 3,359 | ||||||
| Palomar Pomerado Health, G.O. Bonds, Election of 2004, Series 2009-A, Assured Guaranty insured, 0% 2028 | 2,000 | 1,300 | ||||||
| Palomar Pomerado Health, G.O. Bonds, Election of 2004, Series 2009-A, Assured Guaranty insured, 0% 2029 | 9,350 | 5,793 | ||||||
| Palomar Pomerado Health, G.O. Bonds, Election of 2004, Series 2009-A, Assured Guaranty insured, 0% 2031 | 3,000 | 1,695 | ||||||
| Pasadena Unified School Dist. (Los Angeles County), 2008 Election G.O. Bonds, Series 2016, 4.00% 2032 | 5,000 | 5,288 | ||||||
| Pasadena Unified School Dist. (Los Angeles County), 2008 Election G.O. Bonds, Series 2016, 4.00% 2034 | 5,040 | 5,259 | ||||||
| Pasadena Unified School Dist. (Los Angeles County), 2008 Election G.O. Bonds, Series 2016, 4.00% 2035 | 15,940 | 16,579 | ||||||
| Pasadena Unified School Dist. (Los Angeles County), 2008 Election G.O. Bonds, Series 2016, 4.00% 2036 | 2,250 | 2,329 | ||||||
| Sacramento County Sanitation Dist. Fncg. Auth., Rev. Ref. Bonds (Sacramento Regional County Sanitation Dist.), Series 2007-B, FGIC-National insured, 1.154% 20351 | 13,500 | 11,591 | ||||||
| City of San Buenaventura, Rev. Bonds (Community Memorial Health System), Series 2011, 7.50% 2041 | 10,825 | 12,619 | ||||||
| Airport Commission, City and County of San Francisco, San Francisco International Airport, Second Series Rev. Bonds, Series 2009-E, 6.00% 2039 | 3,000 | 3,302 | ||||||
| Airport Commission, City and County of San Francisco, San Francisco International Airport, Second Series Rev. Ref. Bonds, Issue 34-E, AMT, 5.75% 2019 | 3,500 | 3,696 | ||||||
| Airport Commission, City and County of San Francisco, San Francisco International Airport, Second Series Rev. Ref. Bonds, Series 2009-A, 4.90% 2029 | 5,000 | 5,440 | ||||||
| Airport Commission, City and County of San Francisco, San Francisco International Airport, Second Series Rev. Ref. Bonds, Series 2010-F, 5.00% 2040 | 3,000 | 3,270 | ||||||
| Airport Commission, City and County of San Francisco, San Francisco International Airport, Second Series Rev. Ref. Bonds, Series 2011-F, AMT, 5.00% 2028 | 2,630 | 2,885 | ||||||
| Airport Commission, City and County of San Francisco, San Francisco International Airport, Second Series Rev. Ref. Bonds, Series 2012-A, AMT, 5.00% 2028 | 1,000 | 1,123 | ||||||
| Airport Commission, City and County of San Francisco, San Francisco International Airport, Second Series Rev. Ref. Bonds, Series 2012-A, AMT, 5.00% 2030 | 1,000 | 1,106 | ||||||
| Airport Commission, City and County of San Francisco, San Francisco International Airport, Second Series Rev. Ref. Bonds, Series 2016-A, 5.00% 2029 | 1,375 | 1,629 | ||||||
| City and County of San Francisco, Airport Commission, San Francisco International Airport, Second Series Rev. Bonds, Series 2016-B, AMT, 5.00% 2046 | 4,000 | 4,394 | ||||||
| Public Utilities Commission of the City and County of San Francisco, Wastewater Rev. Green Bonds, Series 2016-A, 4.00% 2037 | 6,575 | 6,869 | ||||||
| American Funds Tax-Exempt Funds | 39 |
The Tax-Exempt Fund of California
| Bonds, notes & other debt instruments (continued) | Principal amount (000) | Value (000) | ||||||
| California (continued) | ||||||||
| City & county issuers (continued) | ||||||||
| City of San Jose, Airport Rev. Ref. Bonds, Series 2011-A-1, AMT, 5.50% 2030 | $ | 8,000 | $ | 8,961 | ||||
| Stockton Unified School Dist. (San Joaquin County), G.O. Rev. Ref. Bonds, Series 2016, 5.00% 2031 | 7,800 | 8,943 | ||||||
| Tobacco Securitization Auth. of Southern California, Tobacco Settlement Asset-backed Rev. Ref. Bonds (San Diego County Tobacco Asset Securitization Corp.), Series 2006-A, 5.125% 2046 | 7,800 | 7,512 | ||||||
| Victor Valley Union High School Dist., G.O. Rev. Ref. Bonds, Series 2016-A, BAM insured, 4.00% 2032 | 7,500 | 7,826 | ||||||
| City of Whittier, Health Fac. Rev. Bonds (PIH Health), Series 2014, 5.00% 2044 | 9,000 | 9,433 | ||||||
| Other securities | 834,607 | |||||||
| 1,127,849 | ||||||||
| Puerto Rico 1.50% | ||||||||
| Highways and Transportation Auth., Transportation Rev. Ref. Bonds, Series 2007-N, Assured Guaranty insured, 5.25% 2036 | 6,590 | 7,083 | ||||||
| Industrial, Tourist, Educational, Medical and Environmental Control Facs. Fncg. Auth., Hospital Rev. and Rev. Ref. Bonds (Hospital Auxilio Mutuo Obligated Group Project), Series 2011-A, 6.00% 2033 | 7,150 | 7,259 | ||||||
| Other securities | 15,612 | |||||||
| 29,954 | ||||||||
| Other U.S. territories 0.60% | ||||||||
| Other securities | 12,075 | |||||||
| Total bonds, notes & other debt instruments (cost: $1,874,787,000) | 1,913,189 | |||||||
| Short-term securities 3.52% | ||||||||
| Various Purpose G.O. Commercial Paper, Series 2011-A-5, 0.71% 2/9/2017 | 5,300 | 5,300 | ||||||
| Various Purpose G.O. Commercial Paper, Series 2011-A-5, 0.76% 3/7/2017 | 3,000 | 3,000 | ||||||
| Various Purpose G.O. Commercial Paper, Series 2017-A-1, 0.74% 3/7/2017 | 4,200 | 4,200 | ||||||
| Various Purpose G.O. Commercial Paper, Series 2017-A-2, 0.73% 3/9/2017 | 3,000 | 3,000 | ||||||
| County of Los Angeles, 2016-17 Tax and Rev. Anticipation Notes, 3.00% 6/30/2017 | 21,000 | 21,212 | ||||||
| Metropolitan Water Dist. of Southern California, Water Rev. Ref. Bonds, Series 2016-B-2, 0.57% 20371 | 15,400 | 15,400 | ||||||
| Pollution Control Fncg. Auth., Pollution Control Rev. Ref. Bonds (Pacific Gas and Electric Co.), Series 1996-C, JPMorgan Chase LOC, 0.59% 20261 | 10,000 | 10,000 | ||||||
| Other securities | 8,500 | |||||||
| Total short-term securities (cost: $70,595,000) | 70,612 | |||||||
| Total investment securities 99.03% (cost: $1,945,382,000) | 1,983,801 | |||||||
| Other assets less liabilities 0.97% | 19,343 | |||||||
| Net assets 100.00% | $ | 2,003,144 | ||||||
This summary investment portfolio is designed to streamline the report and help investors better focus on the fund’s principal holdings. See the inside back cover for details on how to obtain a complete schedule of portfolio holdings.
“Other securities” includes all issues that are not disclosed separately in the summary investment portfolio.
| 1 | Coupon rate may change periodically. For short-term securities, the date of the next scheduled coupon rate change is considered to be the maturity date. |
| 2 | Acquired in a transaction exempt from registration under Rule 144A of the Securities Act of 1933. May be resold in the U.S. in transactions exempt from registration, normally to qualified institutional buyers. The total value of all such securities, including those in “Other securities,“ was $53,217,000, which represented 2.66% of the net assets of the fund. |
| 40 | American Funds Tax-Exempt Funds |
The Tax-Exempt Fund of California
Key to abbreviations
Agcy. = Agency
AMT = Alternative Minimum Tax
Auth. = Authority
Certs. of Part. = Certificates of Participation
Dept. = Department
Dev. = Development
Dist. = District
Econ. = Economic
Fac. = Facility
Facs. = Facilities
Fin. = Finance
Fncg. = Financing
G.O. = General Obligation
LOC = Letter of Credit
Preref. = Prerefunded
Redev. = Redevelopment
Ref. = Refunding
Rev. = Revenue
TECP = Tax-Exempt Commercial Paper
See Notes to Financial Statements
| American Funds Tax-Exempt Funds | 41 |
| American Funds Tax-Exempt Fund of New York | unaudited |
| Summary Investment portfolio January 31, 2017 |
| Portfolio quality summary* | Percent of net assets |
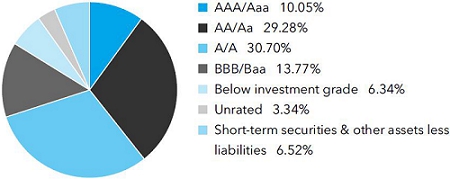
| * | Bond ratings, which typically range from AAA/Aaa (highest) to D (lowest), are assigned by credit rating agencies such as Standard & Poor’s, Moody’s and/or Fitch as an indication of an issuer’s creditworthiness. In assigning a credit rating to a security, the fund looks specifically to the ratings assigned to the issuer of the security by Standard & Poor’s, Moody’s and/or Fitch. If agency ratings differ, the security will be considered to have received the highest of those ratings, consistent with the fund’s investment policies. Securities in the “unrated” category (above) have not been rated by a rating agency; however, the investment adviser performs its own credit analysis and assigns comparable ratings that are used for compliance with the fund’s investment policies. |
| Bonds, notes & other debt instruments 93.48% | Principal amount (000) | Value (000) | ||||||
| New York 90.03% | ||||||||
| State issuers 47.98% | ||||||||
| Dobbs Ferry Local Dev. Corp., Rev. Bonds, Series 2014, 5.00% 2039 | $ | 1,625 | $ | 1,795 | ||||
| Dobbs Ferry Local Dev. Corp., Rev. Bonds, Series 2014, 5.00% 2044 | 500 | 551 | ||||||
| Dormitory Auth., Columbia University Rev. Green Bonds, Series 2016-A-1, 5.00% 2026 | 500 | 619 | ||||||
| Dormitory Auth., Cornell University, Rev. Bonds, Series 2016-A, 5.00% 2033 | 1,000 | 1,167 | ||||||
| Dormitory Auth., Fordham University, Rev. Bonds, Series 2011-A, 5.50% 2036 | 1,000 | 1,141 | ||||||
| Dormitory Auth., Icahn School of Medicine at Mount Sinai, Rev. Bonds, Series 2015-A, 5.00% 2031 | 500 | 557 | ||||||
| Dormitory Auth., Icahn School of Medicine at Mount Sinai, Rev. Bonds, Series 2015-A, 5.00% 2035 | 1,000 | 1,091 | ||||||
| Dormitory Auth., Icahn School of Medicine at Mount Sinai, Rev. Bonds, Series 2015-A, 5.00% 2040 | 250 | 270 | ||||||
| Dormitory Auth., Mount Sinai School of Medicine of New York University, Rev. Ref. Bonds, Series 2010-A, 5.00% 2021 | 1,000 | 1,106 | ||||||
| Dormitory Auth., New School Rev. Bonds, Series 2010, 5.25% 2021 (preref. 2020) | 500 | 564 | ||||||
| Dormitory Auth., New School Rev. Bonds, Series 2010, 5.50% 2040 (preref. 2020) | 500 | 569 | ||||||
| Dormitory Auth., New School Rev. Bonds, Series 2015-A, 5.00% 2032 | 1,000 | 1,126 | ||||||
| Dormitory Auth., North Shore-Long Island Jewish Obligated Group, Rev. Ref. Bonds, Series 2011-A, 5.00% 2032 | 1,500 | 1,644 | ||||||
| Dormitory Auth., NYU Hospitals Center Rev. Bonds, 5.00% 2022 | 200 | 228 | ||||||
| Dormitory Auth., NYU Hospitals Center Rev. Bonds, 5.00% 2034 | 1,000 | 1,113 | ||||||
| Dormitory Auth., NYU Hospitals Center Rev. Bonds, Series 2011-A, 6.00% 2040 (preref. 2020) | 1,000 | 1,154 | ||||||
| Dormitory Auth., NYU Hospitals Center Rev. Bonds, Series 2016-A, 5.00% 2033 | 400 | 448 | ||||||
| Dormitory Auth., Pratt Institute, Rev. Bonds, Series 2016, 5.00% 2039 | 650 | 729 | ||||||
| Dormitory Auth., School Dist. Rev. Bond Fncg. Program Rev. Bonds, Series 2011-A, 5.00% 2024 | 500 | 565 | ||||||
| Dormitory Auth., School Dist. Rev. Bond Fncg. Program Rev. Bonds, Series 2013-E, Assured Guaranty Municipal insured, 5.00% 2022 | 1,000 | 1,167 | ||||||
| Dormitory Auth., School Dist. Rev. Bond Fncg. Program Rev. Bonds, Series 2016-A, 5.00% 2022 | 1,000 | 1,159 | ||||||
| Dormitory Auth., School Dist. Rev. Bond Fncg. Program Rev. Bonds, Series 2016-A, 5.00% 2033 | 1,000 | 1,142 | ||||||
| Dormitory Auth., Skidmore College Rev. Bonds, Series 2011-A, 5.50% 2041 | 1,420 | 1,600 | ||||||
| Dormitory Auth., State Personal Income Tax Rev. Bonds (Education), Series 2014-E, 5.00% 2017 | 845 | 846 | ||||||
| Dormitory Auth., State Personal Income Tax Rev. Bonds (Education), Series 2014-E, 5.00% 2032 | 750 | 862 | ||||||
| Dormitory Auth., State Personal Income Tax Rev. Bonds (General Purpose), Series 2016-A, 5.00% 2039 | 365 | 417 | ||||||
| Dormitory Auth., The New School Rev. Bonds, Series 2016-A, 5.00% 2035 | 500 | 561 | ||||||
| 42 | American Funds Tax-Exempt Funds |
American Funds Tax-Exempt Fund of New York
| Principal amount | Value | |||||||
| (000) | (000) | |||||||
| Environmental Facs. Corp., Rev. Green Bonds (Revolving Funds), Series 2016-B, 4.00% 2036 | $ | 2,000 | $ | 2,110 | ||||
| Environmental Facs. Corp., Solid Waste Disposal Rev. Ref. Bonds (Waste Management, Inc. Project), Series 2012, AMT, 0.85% 2030 (put 2016)1 | 750 | 750 | ||||||
| Environmental Facs. Corp., Solid Waste Disposal Rev. Ref. Bonds (Waste Management, Inc. Project), Series 2012, AMT, 0.85% 2030 (put 2017)1 | 750 | 750 | ||||||
| Environmental Facs. Corp., Solid Waste Disposal Rev. Ref. Bonds (Waste Management, Inc. Project), Series 2013-A, 2.75% 2017 | 1,000 | 1,006 | ||||||
| Hudson Yards Infrastructure Corp., Rev. Bonds, Fiscal 2007 Series A, 5.00% 2047 | 825 | 834 | ||||||
| Hudson Yards Infrastructure Corp., Rev. Bonds, Fiscal 2012 Series A, 5.25% 2047 | 1,000 | 1,107 | ||||||
| Hudson Yards Infrastructure Corp., Rev. Bonds, Fiscal 2012 Series A, 5.75% 2047 | 1,000 | 1,133 | ||||||
| Liberty Dev. Corp., Liberty Rev. Ref. Bonds (3 World Trade Center Project), Series 2014, Class 2, 5.15% 20342 | 1,250 | 1,334 | ||||||
| Liberty Dev. Corp., Liberty Rev. Ref. Bonds (3 World Trade Center Project), Series 2014, Class 2, 5.375% 20402 | 350 | 377 | ||||||
| Liberty Dev. Corp., Liberty Rev. Ref. Bonds (3 World Trade Center Project), Series 2014, Class 3, 7.25% 20442 | 375 | 443 | ||||||
| Liberty Dev. Corp., Liberty Rev. Ref. Bonds (4 World Trade Center Project), Series 2011, 5.00% 2031 | 1,500 | 1,673 | ||||||
| Liberty Dev. Corp., Liberty Rev. Ref. Bonds (Bank of America Tower at One Bryant Park Project), Series 2010, 6.375% 2049 | 1,500 | 1,637 | ||||||
| Liberty Dev. Corp., Rev. Bonds (Goldman Sachs Headquarters Issue), Series 2005, 5.25% 2035 | 1,000 | 1,197 | ||||||
| Metropolitan Transportation Auth., Dedicated Tax Fund Bonds, Series 2004-C, AMBAC insured, 5.50% 2017 | 1,000 | 1,037 | ||||||
| Metropolitan Transportation Auth., Dedicated Tax Fund Rev. Ref. Bonds, Series 2002-B-3D, 1.66% 20201 | 2,000 | 2,022 | ||||||
| Metropolitan Transportation Auth., Dedicated Tax Fund Rev. Ref. Bonds, Series 2008-A-2A, 1.04% 2026 (put 2017)1 | 485 | 485 | ||||||
| Metropolitan Transportation Auth., Transportation Rev. Bonds, Series 2012-E, 5.00% 2031 | 1,000 | 1,129 | ||||||
| Metropolitan Transportation Auth., Transportation Rev. Bonds, Series 2014-D-1, 5.00% 2039 | 250 | 281 | ||||||
| Metropolitan Transportation Auth., Transportation Rev. Bonds, Series 2015-A-2, 1.24% 2039 (put 2020)1 | 500 | 499 | ||||||
| Metropolitan Transportation Auth., Transportation Rev. Bonds, Series 2015-C-1, 5.00% 2035 | 1,750 | 1,972 | ||||||
| Metropolitan Transportation Auth., Transportation Rev. Bonds, Series 2015-C-1, 5.25% 2030 | 280 | 329 | ||||||
| Metropolitan Transportation Auth., Transportation Rev. Bonds, Series 2016-C-1, 4.00% 2041 | 1,000 | 1,019 | ||||||
| Mortgage Agcy., Homeowner Mortgage Rev. Bonds, Series 178, 3.50% 2043 | 415 | 425 | ||||||
| Mortgage Agcy., Homeowner Mortgage Rev. Bonds, Series 191, AMT, 3.50% 2034 | 580 | 596 | ||||||
| Mortgage Agcy., Homeowner Mortgage Rev. Bonds, Series 194, AMT, 3.50% 2035 | 680 | 703 | ||||||
| Mortgage Agcy., Homeowner Mortgage Rev. Bonds, Series 195, 4.00% 2046 | 1,970 | 2,109 | ||||||
| Mortgage Agcy., Homeowner Mortgage Rev. Bonds, Series 197, 3.50% 2044 | 900 | 946 | ||||||
| Mortgage Agcy., Homeowner Mortgage Rev. Bonds, Series 200, 3.50% 2045 | 325 | 343 | ||||||
| Mortgage Agcy., Homeowner Mortgage Rev. Bonds, Series 52, AMT, 3.50% 2030 | 1,060 | 1,100 | ||||||
| Mortgage Agcy., Mortgage Rev. Bonds, Series 46, 5.00% 2029 | 80 | 83 | ||||||
| Mortgage Agcy., Mortgage Rev. Ref. Bonds, Series 45, 4.50% 2029 | 220 | 227 | ||||||
| Mortgage Agcy., Mortgage Rev. Ref. Bonds, Series 48, 2.625% 2041 | 530 | 538 | ||||||
| Port Auth., Consolidated Bonds, Series 147, AMT, FGIC-National insured, 5.00% 2021 | 500 | 504 | ||||||
| Port Auth., Consolidated Bonds, Series 166, 5.00% 2031 | 1,000 | 1,113 | ||||||
| Port Auth., Consolidated Rev. Ref. Bonds, Series 167, AMT, 5.00% 2025 | 1,000 | 1,107 | ||||||
| Port Auth., Consolidated Rev. Ref. Bonds, Series 172, AMT, 5.00% 2034 | 500 | 545 | ||||||
| Port Auth., Consolidated Rev. Ref. Bonds, Series 186, AMT, 5.00% 2044 | 500 | 551 | ||||||
| Power Auth. of the State of New York, Rev. Ref. Bonds, Series 2011-A, 5.00% 2038 | 1,500 | 1,683 | ||||||
| Thruway Auth., General Rev. Bonds, Series 2014-J, 5.00% 2027 | 1,000 | 1,162 | ||||||
| Transportation Dev. Corp., Special Fac. Rev. Ref. Bonds (American Airlines, Inc. John F. Kennedy International Airport Project), Series 2016, AMT, 5.00% 2026 | 500 | 522 | ||||||
| Transportation Dev. Corp., Special Fac. Rev. Ref. Bonds (American Airlines, Inc. John F. Kennedy International Airport Project), Series 2016, AMT, 5.00% 2031 | 2,250 | 2,335 | ||||||
| American Funds Tax-Exempt Funds | 43 |
American Funds Tax-Exempt Fund of New York
| Bonds, notes & other debt instruments (continued) | Principal amount | Value | ||||||
| (000) | (000) | |||||||
| New York (continued) | ||||||||
| State issuers (continued) | ||||||||
| Transportation Dev. Corp., Special Facs. Bonds (LaGuardia Airport Terminal B Redev. Project), Series 2016-A, AMT, 5.00% 2034 | $ | 500 | $ | 542 | ||||
| Transportation Dev. Corp., Special Facs. Bonds (LaGuardia Airport Terminal B Redev. Project), Series 2016-A, AMT, 5.00% 2041 | 500 | 529 | ||||||
| Transportation Dev. Corp., Special Facs. Bonds (LaGuardia Airport Terminal B Redev. Project), Series 2016-A, AMT, 5.25% 2050 | 1,500 | 1,587 | ||||||
| TSASC, Inc., Tobacco Settlement Bonds, Series 2017-A, 5.00% 2022 | 1,000 | 1,131 | ||||||
| TSASC, Inc., Tobacco Settlement Bonds, Series 2017-A, 5.00% 2025 | 750 | 865 | ||||||
| Urban Dev. Corp., Rev. Bonds (General Purpose), Series 2014-A, 5.00% 2027 | 1,500 | 1,769 | ||||||
| Urban Dev. Corp., State Personal Income Tax Rev. Bonds (General Purpose), Series 2016-A, 5.00% 2032 | 1,000 | 1,161 | ||||||
| Urban Dev. Corp., State Personal Income Tax Rev. Bonds (General Purpose), Series 2016-A, 5.00% 2035 | 300 | 344 | ||||||
| Urban Dev. Corp., State Personal Income Tax Rev. Bonds (State Facs. and Equipment), Series 2009-B-1, 5.25% 2038 | 1,000 | 1,080 | ||||||
| Utility Debt Securitization Auth., Restructuring Bonds, Series 2016-B, 5.00% 2030 | 1,000 | 1,191 | ||||||
| Utility Debt Securitization Auth., Restructuring Bonds, Series 2016-B, 5.00% 2035 | 1,000 | 1,165 | ||||||
| Other securities | 19,960 | |||||||
| 95,231 | ||||||||
| City & county issuers 42.05% | ||||||||
| City of Albany, Capital Resource Corp., Rev. Bonds (St. Peter’s Hospital of the City of Albany Project), Series 2011, 6.25% 2038 (preref. 2020) | 1,000 | 1,177 | ||||||
| Buffalo and Erie County, Industrial Land Dev. Corp., Rev. Bonds (Buffalo State College Foundation Housing Corp. Project), Series 2011-A, 5.375% 2041 | 1,400 | 1,549 | ||||||
| Dutchess County, Local Dev. Corp., Rev. Ref. Bonds (Health Quest Systems, Inc. Project), Series 2010, 5.75% 2030 | 500 | 549 | ||||||
| Dutchess County, Local Dev. Corp., Rev. Ref. Bonds (Health Quest Systems, Inc. Project), Series 2010, 5.75% 2040 | 1,000 | 1,093 | ||||||
| Dutchess County, Local Dev. Corp., Rev. Ref. Bonds (Health Quest Systems, Inc. Project), Series 2014-A, 5.00% 2028 | 430 | 480 | ||||||
| Erie County, Industrial Dev. Agcy., School Fac. Rev. Bonds (City School Dist. of the City of Buffalo Project), Series 2011-A, 5.25% 2025 | 500 | 572 | ||||||
| Erie County, Industrial Dev. Agcy., School Fac. Rev. Ref. Bonds (City School Dist. of the City of Buffalo Project), Series 2012-A, 5.00% 2021 | 500 | 564 | ||||||
| Erie County, Industrial Dev. Agcy., School Fac. Rev. Ref. Bonds (City School Dist. of the City of Buffalo Project), Series 2013-A, 5.00% 2027 | 790 | 916 | ||||||
| Various Purpose G.O. Bonds, Series 2014-A, 5.00% 2028 | 1,250 | 1,427 | ||||||
| Various Purpose G.O. Bonds, Series 2016-A, 5.00% 2027 | 850 | 1,004 | ||||||
| Various Purpose G.O. Bonds, Series 2016-B, 5.00% 2025 | 1,000 | 1,189 | ||||||
| Town of Hempstead, Local Dev. Corp., Rev. Bonds (Hofstra University Project), Series 2011, 5.00% 2027 | 1,300 | 1,439 | ||||||
| Town of Hempstead, Local Dev. Corp., Rev. Bonds (Hofstra University Project), Series 2011, 5.00% 2041 | 800 | 880 | ||||||
| Long Island Power Auth., Electric System General Rev. Bonds, Series 2011-A, 5.00% 2038 | 500 | 534 | ||||||
| Long Island Power Auth., Electric System General Rev. Bonds, Series 2014-A, 5.00% 2044 | 740 | 812 | ||||||
| Long Island Power Auth., Electric System General Rev. Bonds, Series 2014-C, 1.19% 2033 (put 2018)1 | 1,000 | 1,000 | ||||||
| Long Island Power Auth., Electric System General Rev. Bonds, Series 2015-B, 5.00% 2035 | 1,215 | 1,354 | ||||||
| Long Island Power Auth., Electric System General Rev. Bonds, Series 2015-B, 5.00% 2038 | 750 | 832 | ||||||
| Long Island Power Auth., Electric System General Rev. Bonds, Series 2015-C, 1.42% 2033 (put 2018)1 | 300 | 301 | ||||||
| Nassau County, Tobacco Settlement Corp., Tobacco Settlement Asset-Backed Current Interest Bonds, Series 2006-A-3, 5.125% 2046 | 2,000 | 1,888 | ||||||
| Nassau County, G.O. General Improvement Bonds, Ref. Series 2016-A, 5.00% 2030 | 1,795 | 2,077 | ||||||
| Nassau County, G.O. General Improvement Bonds, Series 2016-B, 5.00% 2023 | 750 | 882 | ||||||
| Nassau County, G.O. General Improvement Bonds, Series 2016-C, 5.00% 2042 | 700 | 777 | ||||||
| City of New York, G.O. Bonds, Fiscal 2017, Series 2016-A-1, 5.00% 2034 | 2,000 | 2,309 | ||||||
| City of New York, G.O. Bonds, Fiscal 2017, Series 2016-A-1, 5.00% 2037 | 750 | 857 | ||||||
| City of New York, G.O. Bonds, Fiscal 2017, Series 2016-B-1, 5.00% 2041 | 500 | 574 | ||||||
| City of New York, G.O. Bonds, Series 2008-J-4, 1.21% 20251 | 1,500 | 1,500 | ||||||
| City of New York, G.O. Bonds, Series 2008-L-1, 5.00% 2023 | 1,000 | 1,045 | ||||||
| 44 | American Funds Tax-Exempt Funds |
American Funds Tax-Exempt Fund of New York
| Principal amount | Value | |||||||
| (000) | (000) | |||||||
| City of New York, G.O. Bonds, Series 2015-A, 5.00% 2026 | $ | 1,000 | $ | 1,192 | ||||
| City of New York, G.O. Bonds, Series 2015-C, 5.00% 2028 | 500 | 583 | ||||||
| City of New York, G.O. Bonds, Series 2015-C, 5.00% 2033 | 1,000 | 1,139 | ||||||
| City of New York, G.O. Bonds, Series 2016-C, 5.00% 2031 | 1,500 | 1,743 | ||||||
| New York City Transitional Fin. Auth., Future Tax Secured Bonds, Fiscal 2011 Series C, 5.25% 2025 | 1,000 | 1,136 | ||||||
| New York City Transitional Fin. Auth., Future Tax Secured Bonds, Fiscal 2017 Series 2016-A-1, 5.00% 2035 | 1,000 | 1,148 | ||||||
| New York City Transitional Fin. Auth., Future Tax Secured Bonds, Series 2015-C, 5.00% 2027 | 750 | 888 | ||||||
| New York City Transitional Fin. Auth., Future Tax Secured Rev. Ref. Bonds, Fiscal 2010 Series D, 5.00% 2023 | 1,000 | 1,115 | ||||||
| New York City Transitional Fin. Auth., Future Tax Secured Rev. Ref. Bonds, Series 2015-A-1, 5.00% 2037 | 500 | 567 | ||||||
| New York City Transitional Fin. Auth., Future Tax Secured Rev. Ref. Bonds, Series 2015-C, 5.00% 2026 | 1,000 | 1,202 | ||||||
| New York City Transitional Fin. Auth., Future Tax Secured Rev. Ref. Bonds, Series 2015-E-1, 5.00% 2041 | 345 | 388 | ||||||
| New York City, Housing Dev. Corp. Multi-Family Rev. Bonds (8 Spruce Street), Series 2014-E, 3.50% 2048 | 1,670 | 1,643 | ||||||
| New York City, Housing Dev. Corp. Multi-Family Rev. Bonds (8 Spruce Street), Series 2014-F, 4.50% 2048 | 500 | 510 | ||||||
| New York City, Municipal Water Fin. Auth., Water and Sewer System Second General Resolution Rev. Bonds, Series 2011-EE, 5.375% 2043 | 1,000 | 1,129 | ||||||
| New York City, Municipal Water Fin. Auth., Water and Sewer System Second General Resolution Rev. Bonds, Series 2014-EE, 5.00% 2045 | 500 | 562 | ||||||
| New York City, Municipal Water Fin. Auth., Water and Sewer System Second General Resolution Rev. Bonds, Series 2015-HH, 5.00% 2039 | 500 | 568 | ||||||
| Trust for Cultural Resources of the City of New York, Rev. Bonds (Juilliard School), Series 2009-B, 1.35% 2036 (put 2017) | 1,500 | 1,504 | ||||||
| Niagara Frontier Transportation Auth., Airport Rev. Ref. Bonds (Buffalo Niagara International Airport), Series 2014-A, AMT, 5.00% 2027 | 600 | 665 | ||||||
| Niagara Frontier Transportation Auth., Airport Rev. Ref. Bonds (Buffalo Niagara International Airport), Series 2014-A, AMT, 5.00% 2028 | 500 | 551 | ||||||
| Niagara Frontier Transportation Auth., Airport Rev. Ref. Bonds (Buffalo Niagara International Airport), Series 2014-A, AMT, 5.00% 2029 | 700 | 769 | ||||||
| Onondaga County, Resource Recovery Agcy., Rev. Ref. Bonds, Series 2015-A, AMT, Assured Guaranty Municipal insured, 5.00% 2030 | 1,750 | 1,924 | ||||||
| County of Rockland G.O. Bonds, Series 2014-A, Assured Guaranty Municipal insured, 5.00% 2024 | 1,000 | 1,151 | ||||||
| Southold Local Dev. Corporation, Rev. Bonds (Peconic Landing at Southold, Inc. Project), Series 2015, 5.00% 2045 | 1,500 | 1,557 | ||||||
| Suffolk County, Econ. Dev. Corp., Rev. Ref. Bonds (Peconic Landing at Southold, Inc. Project), Series 2010, 5.875% 2030 | 1,000 | 1,093 | ||||||
| TSASC, Inc., Tobacco Settlement Asset-Backed Rev. Ref. Bonds, Series 2006-1, 5.00% 2034 | 1,380 | 1,380 | ||||||
| TSASC, Inc., Tobacco Settlement Asset-Backed Rev. Ref. Bonds, Series 2006-1, 5.125% 2042 | 4,845 | 4,846 | ||||||
| Westchester County, Health Care Corp., Rev. Bonds, Series 2010-B, 6.00% 2030 | 130 | 144 | ||||||
| Westchester County, Health Care Corp., Rev. Bonds, Series 2010-B, 6.00% 2030 (preref. 2020) | 870 | 1,014 | ||||||
| Westchester County, Health Care Corp., Rev. Bonds, Series 2011-A, 5.00% 2021 | 100 | 113 | ||||||
| Westchester County, Local Dev. Corp., Rev. Bonds (Westchester Medical Center Obligated Group Project), Series 2016, 5.00% 2034 | 1,150 | 1,233 | ||||||
| Westchester County, Local Dev. Corp., Rev. Bonds (Westchester Medical Center Obligated Group Project), Series 2016, 5.00% 2046 | 1,000 | 1,054 | ||||||
| Other securities | 19,354 | |||||||
| 83,446 | ||||||||
| American Funds Tax-Exempt Funds | 45 |
American Funds Tax-Exempt Fund of New York
| Bonds, notes & other debt instruments (continued) | Principal amount | Value | ||||||
| (000) | (000) | |||||||
| Guam 1.48% | ||||||||
| Government of Guam, Business Privilege Tax Bonds, Series 2011-A, 5.00% 2031 | $ | 1,200 | $ | 1,245 | ||||
| Other securities | 1,699 | |||||||
| 2,944 | ||||||||
| Puerto Rico 1.97% | ||||||||
| Other securities | 3,919 | |||||||
| Total bonds, notes & other debt instruments (cost: $181,687,000) | 185,540 | |||||||
| Short-term securities 4.65% | ||||||||
| Dormitory Auth. Rev., Higher Education Commercial Paper, Series 2002-C, 0.76% 4/3/2017 | 3,000 | 3,000 | ||||||
| City of New York, G.O. Bonds, Series 2006-H-1, 0.63% 20361 | 1,050 | 1,050 | ||||||
| New York City Transitional Fin. Auth., Future Tax Secured Rev. Ref. Bonds, Series 2016-E-4, 0.63% 20451 | 550 | 550 | ||||||
| New York City, Municipal Water Fin. Auth., Water and Sewer System Second General Resolution Rev. Bonds, Fiscal 2006, Series 2005-B, 0.62% 20321 | 1,120 | 1,120 | ||||||
| New York City, Municipal Water Fin. Auth., Water and Sewer System Second General Resolution Rev. Bonds, Fiscal 2014, Series 2013-AA-2, 0.63% 20501 | 3,500 | 3,500 | ||||||
| Total short-term securities (cost: $9,220,000) | 9,220 | |||||||
| Total investment securities 98.13% (cost: $190,907,000) | 194,760 | |||||||
| Other assets less liabilities 1.87% | 3,713 | |||||||
| Net assets 100.00% | $ | 198,473 |
| 46 | American Funds Tax-Exempt Funds |
American Funds Tax-Exempt Fund of New York
This summary investment portfolio is designed to streamline the report and help investors better focus on the fund’s principal holdings. See the inside back cover for details on how to obtain a complete schedule of portfolio holdings.
“Other securities” includes all issues that are not disclosed separately in the summary investment portfolio.
| 1 | Coupon rate may change periodically. For short-term securities, the date of the next scheduled coupon rate change is considered to be the maturity date. |
| 2 | Acquired in a transaction exempt from registration under Rule 144A of the Securities Act of 1933. May be resold in the U.S. in transactions exempt from registration, normally to qualified institutional buyers. The total value of all such securities, including those in “Other securities,” was $3,904,000, which represented 1.97% of the net assets of the fund. |
Key to abbreviations
Agcy. = Agency
AMT = Alternative Minimum Tax
Auth. = Authority
Certs. of Part. = Certificates of Participation
Dept. = Department
Dev. = Development
Dist. = District
Econ. = Economic
Fac. = Facility
Facs. = Facilities
Fin. = Finance
Fncg. = Financing
G.O. = General Obligation
LOC = Letter of Credit
Preref. = Prerefunded
Redev. = Redevelopment
Ref. = Refunding
Rev. = Revenue
TECP = Tax-Exempt
Commercial Paper
See Notes to Financial Statements
| American Funds Tax-Exempt Funds | 47 |
Financial statements
Statements of assets and liabilities
at January 31, 2017
| American Funds Short-Term Tax-Exempt Bond Fund | Limited Term Tax-Exempt Bond Fund of America | |||||||
| Assets: | ||||||||
| Investment securities, at value | $ | 835,261 | $ | 3,727,723 | ||||
| Cash | 925 | 12,794 | ||||||
| Receivables for: | ||||||||
| Sales of investments | 7,897 | 936 | ||||||
| Sales of fund’s shares | 5,860 | 9,665 | ||||||
| Interest | 5,464 | 32,965 | ||||||
| Other | 90 | 486 | ||||||
| 855,497 | 3,784,569 | |||||||
| Liabilities: | ||||||||
| Payables for: | ||||||||
| Purchases of investments | 13,931 | 37,497 | ||||||
| Repurchases of fund’s shares | 4,092 | 8,872 | ||||||
| Dividends on fund’s shares | 73 | 564 | ||||||
| Investment advisory services | 261 | 741 | ||||||
| Services provided by related parties | 86 | 856 | ||||||
| Trustees’ deferred compensation | 31 | 132 | ||||||
| Other | — | * | 1 | |||||
| 18,474 | 48,663 | |||||||
| Net assets at January 31, 2017 | $ | 837,023 | $ | 3,735,906 | ||||
| Net assets consist of: | ||||||||
| Capital paid in on shares of beneficial interest | $ | 840,811 | $ | 3,701,637 | ||||
| Undistributed net investment income | 35 | 641 | ||||||
| Accumulated net realized loss | (2,048 | ) | (496 | ) | ||||
| Net unrealized (depreciation) appreciation | (1,775 | ) | 34,124 | |||||
| Net assets at January 31, 2017 | $ | 837,023 | $ | 3,735,906 | ||||
| Investment securities, at cost | $ | 837,036 | $ | 3,693,599 | ||||
| * | Amount less than one thousand. |
See Notes to Financial Statements
| 48 | American Funds Tax-Exempt Funds |
unaudited
(dollars in thousands)
| The Tax-Exempt Bond Fund of America | | | American High-Income Municipal Bond Fund | | | The Tax-Exempt Fund of California | | | American Funds Tax-Exempt Fund of New York | | ||||
| $ | 13,718,185 | $ | 4,920,329 | $ | 1,983,801 | $ | 194,760 | |||||||
| 4,633 | 7,718 | 1,405 | 1,916 | |||||||||||
| 33,055 | 12,008 | 7,636 | 399 | |||||||||||
| 39,476 | 14,722 | 5,807 | 502 | |||||||||||
| 136,761 | 51,280 | 26,022 | 1,871 | |||||||||||
| 1,959 | 767 | 286 | 26 | |||||||||||
| 13,934,069 | 5,006,824 | 2,024,957 | 199,474 | |||||||||||
| 169,834 | 41,002 | 16,677 | 750 | |||||||||||
| 29,958 | 11,973 | 3,283 | 84 | |||||||||||
| 2,873 | 1,476 | 740 | 107 | |||||||||||
| 2,610 | 1,247 | 511 | 57 | |||||||||||
| 2,887 | 1,031 | 471 | 14 | |||||||||||
| 558 | 104 | 130 | 1 | |||||||||||
| 3 | 1 | 1 | (12 | ) | ||||||||||
| 208,723 | 56,834 | 21,813 | 1,001 | |||||||||||
| $ | 13,725,346 | $ | 4,949,990 | $ | 2,003,144 | $ | 198,473 | |||||||
| $ | 13,513,712 | $ | 4,986,469 | $ | 1,996,613 | $ | 195,084 | |||||||
| 12,117 | 12,840 | 2,517 | 248 | |||||||||||
| (27,759 | ) | (102,453 | ) | (34,405 | ) | (712 | ) | |||||||
| 227,276 | 53,134 | 38,419 | 3,853 | |||||||||||
| $ | 13,725,346 | $ | 4,949,990 | $ | 2,003,144 | $ | 198,473 | |||||||
| $ | 13,448,829 | $ | 4,867,195 | $ | 1,945,382 | $ | 190,907 | |||||||
| American Funds Tax-Exempt Funds | 49 |
Statements of assets and liabilities
at January 31, 2017
| | | | | American Funds Short-Term Tax-Exempt Bond Fund | | | Limited Term Tax-Exempt Bond Fund of America | | ||
| Shares of beneficial interest issued and outstanding (no stated par value) — unlimited shares authorized | ||||||||||
| Class A: | Net assets | $ | 741,801 | $ | 2,989,294 | |||||
| Shares outstanding | 73,637 | 191,675 | ||||||||
| Net asset value per share | $ | 10.07 | $ | 15.60 | ||||||
| Class B: | Net assets | $ | 43 | |||||||
| Shares outstanding | 3 | |||||||||
| Net asset value per share | $ | 15.60 | ||||||||
| Class C: | Net assets | $ | 28,873 | |||||||
| Shares outstanding | 1,851 | |||||||||
| Net asset value per share | $ | 15.60 | ||||||||
| Class F-1: | Net assets | $ | 12,314 | $ | 85,906 | |||||
| Shares outstanding | 1,222 | 5,508 | ||||||||
| Net asset value per share | $ | 10.07 | $ | 15.60 | ||||||
| Class F-2: | Net assets | $ | 82,898 | $ | 342,025 | |||||
| Shares outstanding | 8,229 | 21,931 | ||||||||
| Net asset value per share | $ | 10.07 | $ | 15.60 | ||||||
| Class F-3: | Net assets | $ | 10 | $ | 10 | |||||
| Shares outstanding | 1 | 1 | ||||||||
| Net asset value per share | $ | 10.07 | $ | 15.60 | ||||||
| Class R-6: | Net assets | $ | 289,755 | |||||||
| Shares outstanding | 18,579 | |||||||||
| Net asset value per share | $ | 15.60 | ||||||||
See Notes to Financial Statements
| 50 | American Funds Tax-Exempt Funds |
unaudited
(dollars and shares in thousands, except per-share amounts)
| The Tax-Exempt Bond Fund of America | | | American High-Income Municipal Bond Fund | | | The Tax-Exempt Fund of California | | | American Funds Tax-Exempt Fund of New York | | ||||
| $ | 9,278,479 | $ | 3,380,834 | $ | 1,585,720 | $ | 156,518 | |||||||
| 727,470 | 220,769 | 91,774 | 14,785 | |||||||||||
| $ | 12.75 | $ | 15.31 | $ | 17.28 | $ | 10.59 | |||||||
| $ | 1,164 | $ | 491 | $ | 84 | $ | 21 | |||||||
| 91 | 32 | 5 | 2 | |||||||||||
| $ | 12.75 | $ | 15.31 | $ | 17.28 | $ | 10.59 | |||||||
| $ | 490,595 | $ | 228,967 | $ | 88,987 | $ | 13,208 | |||||||
| 38,465 | 14,952 | 5,150 | 1,247 | |||||||||||
| $ | 12.75 | $ | 15.31 | $ | 17.28 | $ | 10.59 | |||||||
| $ | 478,463 | $ | 219,466 | $ | 74,890 | $ | 2,115 | |||||||
| 37,513 | 14,331 | 4,334 | 200 | |||||||||||
| $ | 12.75 | $ | 15.31 | $ | 17.28 | $ | 10.59 | |||||||
| $ | 3,043,186 | $ | 810,662 | $ | 253,453 | $ | 26,601 | |||||||
| 238,598 | 52,936 | 14,668 | 2,513 | |||||||||||
| $ | 12.75 | $ | 15.31 | $ | 17.28 | $ | 10.59 | |||||||
| $ | 10 | $ | 10 | $ | 10 | $ | 10 | |||||||
| 1 | 1 | 1 | 1 | |||||||||||
| $ | 12.75 | $ | 15.31 | $ | 17.28 | $ | 10.59 | |||||||
| $ | 433,449 | $ | 309,560 | |||||||||||
| 33,984 | 20,214 | |||||||||||||
| $ | 12.75 | $ | 15.31 | |||||||||||
| American Funds Tax-Exempt Funds | 51 |
Statements of operations
for the six months ended January 31, 2017
| | | American Funds Short-Term Tax-Exempt Bond Fund | | | Limited Term Tax-Exempt Bond Fund of America | | ||
| Investment income: | ||||||||
| Income: | ||||||||
| Interest | $ | 6,882 | $ | 49,875 | ||||
| Fees and expenses*: | ||||||||
| Investment advisory services | 1,495 | 4,419 | ||||||
| Distribution services | 559 | 4,895 | ||||||
| Transfer agent services | 170 | 741 | ||||||
| Administrative services | 60 | 343 | ||||||
| Reports to shareholders | 7 | 33 | ||||||
| Registration statement and prospectus | 96 | 275 | ||||||
| Trustees’ compensation | 4 | 17 | ||||||
| Auditing and legal | — | † | 1 | |||||
| Custodian | 1 | 5 | ||||||
| State and local taxes | — | 3 | ||||||
| Other | 1 | 3 | ||||||
| Total fees and expenses | 2,393 | 10,735 | ||||||
| Net investment income | 4,489 | 39,140 | ||||||
| Net realized (loss) gain and unrealized depreciation: | ||||||||
| Net realized (loss) gain on investments | (509 | ) | (115 | ) | ||||
| Net unrealized depreciation on investments | (10,788 | ) | (109,365 | ) | ||||
| Net realized (loss) gain and unrealized depreciation | (11,297 | ) | (109,480 | ) | ||||
| Net decrease in net assets resulting from operations | $ | (6,808 | ) | $ | (70,340 | ) | ||
| * | Additional information related to class-specific fees and expenses is included in the Notes to Financial Statements. |
| † | Amount less than one thousand. |
See Notes to Financial Statements
| 52 | American Funds Tax-Exempt Funds |
unaudited
(dollars in thousands)
| The Tax-Exempt Bond Fund of America | | | American High-Income Municipal Bond Fund | | | The Tax-Exempt Fund of California | | | American Funds Tax-Exempt Fund of New York | | ||||
| $ | 252,944 | $ | 115,410 | $ | 37,774 | $ | 3,388 | |||||||
| 15,567 | 7,449 | 3,094 | 349 | |||||||||||
| 15,227 | 6,743 | 2,665 | 274 | |||||||||||
| 3,760 | 1,557 | 366 | 48 | |||||||||||
| 1,587 | 574 | 186 | 20 | |||||||||||
| 121 | 45 | 19 | 2 | |||||||||||
| 690 | 410 | 79 | 72 | |||||||||||
| 70 | 19 | 12 | 1 | |||||||||||
| 12 | 1 | 1 | — | † | ||||||||||
| 16 | 6 | 3 | — | † | ||||||||||
| 365 | 926 | 8 | 5 | |||||||||||
| 9 | 4 | 2 | (13 | ) | ||||||||||
| 37,424 | 17,734 | 6,435 | 758 | |||||||||||
| 215,520 | 97,676 | 31,339 | 2,630 | |||||||||||
| (7,593 | ) | 10,963 | (149 | ) | (710 | ) | ||||||||
| (685,455 | ) | (307,942 | ) | (111,259 | ) | (9,713 | ) | |||||||
| (693,048 | ) | (296,979 | ) | (111,408 | ) | (10,423 | ) | |||||||
| $ | (477,528 | ) | $ | (199,303 | ) | $ | (80,069 | ) | $ | (7,793 | ) | |||
| American Funds Tax-Exempt Funds | 53 |
Statements of changes in net assets
| American Funds Short-Term Tax-Exempt Bond Fund | Limited Term Tax-Exempt Bond Fund of America | The Tax-Exempt Bond Fund of America | ||||||||||||||||||||||
| Six months ended January 31 | Year ended July 31 | Six months ended January 31 | Year ended July 31 | Six months ended January 31 | Year ended July 31 | |||||||||||||||||||
| 2017* | 2016 | 2017* | 2016 | 2017* | 2016 | |||||||||||||||||||
| Operations: | ||||||||||||||||||||||||
| Net investment income | $ | 4,489 | $ | 7,680 | $ | 39,140 | $ | 74,201 | $ | 215,520 | $ | 365,265 | ||||||||||||
| Net realized (loss) gain | (509 | ) | (762 | ) | (115 | ) | 269 | (7,593 | ) | 559 | ||||||||||||||
| Net unrealized (depreciation) appreciation | (10,788 | ) | 4,308 | (109,365 | ) | 27,733 | (685,455 | ) | 383,061 | |||||||||||||||
| Net (decrease) increase in net assets resulting from operations | (6,808 | ) | 11,226 | (70,340 | ) | 102,203 | (477,528 | ) | 748,885 | |||||||||||||||
| Dividends paid or accrued to shareholders from net investment income | (4,500 | ) | (7,612 | ) | (39,110 | ) | (74,286 | ) | (213,816 | ) | (364,050 | ) | ||||||||||||
| Net capital share transactions | 67,218 | 51,287 | 95,566 | 538,776 | 599,135 | 2,957,629 | ||||||||||||||||||
| Total increase (decrease) in net assets | 55,910 | 54,901 | (13,884 | ) | 566,693 | (92,209 | ) | 3,342,464 | ||||||||||||||||
| Net assets: | ||||||||||||||||||||||||
| Beginning of year | 781,113 | 726,212 | 3,749,790 | 3,183,097 | 13,817,555 | 10,475,091 | ||||||||||||||||||
| End of year | $ | 837,023 | $ | 781,113 | $ | 3,735,906 | $ | 3,749,790 | $ | 13,725,346 | $ | 13,817,555 | ||||||||||||
| Undistributed net investment income | $ | 35 | $ | 46 | $ | 641 | $ | 611 | $ | 12,117 | $ | 10,413 | ||||||||||||
| * | Unaudited. |
See Notes to Financial Statements
| 54 | American Funds Tax-Exempt Funds |
(dollars in thousands)
| American High-Income Municipal Bond Fund | | The Tax-Exempt Fund of California | | American Funds Tax-Exempt Fund of New York | ||||||||||||||||||
| Six months ended January 31 2017* | | Year ended July 31 2016 | | Six months ended January 31 2017* | | Year ended July 31 2016 | | Six months ended January 31 2017* | | Year ended July 31 2016 | ||||||||||||
| $ | 97,676 | $ | 168,148 | $ | 31,339 | $ | 57,271 | $ | 2,630 | $ | 4,494 | |||||||||||
| 10,963 | 9,631 | (149 | ) | (415 | ) | (710 | ) | 271 | ||||||||||||||
| (307,942 | ) | 208,275 | (111,259 | ) | 61,026 | (9,713 | ) | 7,254 | ||||||||||||||
| (199,303 | ) | 386,054 | (80,069 | ) | 117,882 | (7,793 | ) | 12,019 | ||||||||||||||
| (94,576 | ) | (162,941 | ) | (30,867 | ) | (56,704 | ) | (2,576 | ) | (4,403 | ) | |||||||||||
| 151,354 | 1,267,761 | 43,212 | 347,830 | (57 | ) | 45,587 | ||||||||||||||||
| (142,525 | ) | 1,490,874 | (67,724 | ) | 409,008 | (10,426 | ) | 53,203 | ||||||||||||||
| 5,092,515 | 3,601,641 | 2,070,868 | 1,661,860 | 208,899 | 155,696 | |||||||||||||||||
| $ | 4,949,990 | $ | 5,092,515 | $ | 2,003,144 | $ | 2,070,868 | $ | 198,473 | $ | 208,899 | |||||||||||
| $ | 12,840 | $ | 9,740 | $ | 2,517 | $ | 2,045 | $ | 248 | $ | 194 | |||||||||||
| American Funds Tax-Exempt Funds | 55 |
| Notes to financial statements | unaudited |
1. Organization
American Funds Short-Term Tax-Exempt Bond Fund, Limited Term Tax-Exempt Bond Fund of America, The Tax-Exempt Bond Fund of America, American High-Income Municipal Bond Fund, The Tax-Exempt Fund of California, which is presently the only series of The American Funds Tax-Exempt Series II, and American Funds Tax-Exempt Fund of New York (each a “fund” or collectively, the “funds”), are registered under the Investment Company Act of 1940 as open-end, diversified management investment companies.
Each fund’s investment objectives are as follows:
American Funds Short-Term Tax-Exempt Bond Fund — Seeks to provide current income exempt from regular federal income tax, consistent with the maturity and quality standards described in the prospectus, and to preserve capital.
Limited Term Tax-Exempt Bond Fund of America — Seeks to provide current income exempt from regular federal income tax, consistent with the maturity and quality standards described in the prospectus, and to preserve capital.
The Tax-Exempt Bond Fund of America — Seeks to provide a high level of current income exempt from federal income tax, consistent with the preservation of capital.
American High-Income Municipal Bond Fund — Seeks to provide a high level of current income exempt from regular federal income tax.
The Tax-Exempt Fund of California — Seeks to provide a high level of current income exempt from regular federal and California state income taxes. Its secondary objective is preservation of capital.
American Funds Tax-Exempt Fund of New York — Seeks to provide a high level of current income exempt from regular federal, New York state and New York City income taxes. Its secondary objective is preservation of capital.
American Funds Short-Term Tax-Exempt Bond Fund has four share classes (Class A, as well as three F share classes, F-1, F-2 and F-3). Limited Term Tax-Exempt Bond Fund of America, The Tax-Exempt Bond Fund of America and American High-Income Municipal Bond Fund each have seven share classes consisting of six retail share classes (Classes A, B and C, as well as three F share classes, F-1, F-2 and F-3) and one share class that is only available to the American Funds Portfolio Series (Class R-6). The Tax-Exempt Fund of California and American Funds Tax-Exempt Fund of New York each have six retail share classes (Classes A, B and C, as well as three F share classes, F-1, F-2 and F-3). Some share classes are only available to limited categories of investors. The funds’ share classes are described further in the following table:
| Share class | Initial sales charge | Contingent deferred sales charge upon redemption | Conversion feature | |||
| Class A | Up to 2.50% for American Funds Short-Term Tax-Exempt Bond Fund and Limited Term Tax-Exempt Bond Fund of America; up to 3.75% for all other funds | None (except 1% for certain redemptions within one year of purchase without an initial sales charge) | None | |||
| Class B* | None | Declines from 5% to 0% for redemptions within six years of purchase | Class B converts to Class A after eight years | |||
| Class C† | None | 1% for redemptions within one year of purchase | Class C converts to Class F-1 after 10 years | |||
| Classes F-1, F-2 and F-3 | None | None | None | |||
| Class R-6 | None | None | None |
| * | Class B shares are not available for purchase in Limited Term Tax-Exempt Bond Fund of America, The Tax-Exempt Bond Fund of America, American High-Income Municipal Bond Fund, The Tax-Exempt Fund of California and American Funds Tax-Exempt Fund of New York. |
| † | Class C shares are not available for purchase in Limited Term Tax-Exempt Bond Fund of America. |
On January 27, 2017, each fund made an additional retail plan share class (Class F-3) available for sale pursuant to an amendment to its registration statement filed with the U.S. Securities and Exchange Commission. Refer to the fund’s prospectus for more details.
Holders of all share classes of each fund have equal pro rata rights to the assets, dividends and liquidation proceeds of each fund held. Each share class of each fund has identical voting rights, except for the exclusive right to vote on matters affecting only its class. Share
| 56 | American Funds Tax-Exempt Funds |
classes have different fees and expenses (“class-specific fees and expenses”), primarily due to different arrangements for distribution, transfer agent and administrative services. Differences in class-specific fees and expenses will result in differences in net investment income and, therefore, the payment of different per-share dividends by each share class of each fund.
2. Significant accounting policies
Each fund is an investment company that applies the accounting and reporting guidance issued in Topic 946 by the U.S. Financial Accounting Standards Board. Each fund’s financial statements have been prepared to comply with U.S. generally accepted accounting principles (“U.S. GAAP”). These principles require the funds’ investment adviser to make estimates and assumptions that affect reported amounts and disclosures. Actual results could differ from those estimates. Subsequent events, if any, have been evaluated through the date of issuance in the preparation of the financial statements. The funds follow the significant accounting policies described in this section, as well as the valuation policies described in the next section on valuation.
Security transactions and related investment income — Security transactions are recorded by the funds as of the date the trades are executed with brokers. Realized gains and losses from security transactions are determined based on the specific identified cost of the securities. In the event a security is purchased with a delayed payment date, the funds will segregate liquid assets sufficient to meet their payment obligations. Interest income is recognized on an accrual basis. Market discounts, premiums and original issue discounts on fixed-income securities are amortized daily over the expected life of the security.
Class allocations — Income, fees and expenses (other than class-specific fees and expenses) are allocated daily among the various share classes of each fund based on the relative value of their settled shares. Realized and unrealized gains and losses are allocated daily among the various share classes of each fund based on their relative net assets. Class-specific fees and expenses, such as distribution, transfer agent and administrative services, are charged directly to the respective share class of each fund.
Dividends and distributions to shareholders — Dividends to shareholders are declared daily after the determination of each fund’s net investment income and are paid to shareholders monthly. Distributions to shareholders are recorded on each fund’s ex-dividend date.
3. Valuation
Capital Research and Management Company (“CRMC”), the funds’ investment adviser, values each fund’s investments at fair value as defined by U.S. GAAP. The net asset value of each share class of each fund is generally determined as of approximately 4:00 p.m. New York time each day the New York Stock Exchange is open.
Methods and inputs — The funds’ investment adviser uses the following methods and inputs to establish the fair value of each fund’s assets and liabilities. Use of particular methods and inputs may vary over time based on availability and relevance as market and economic conditions evolve.
Fixed-income securities, including short-term securities, are generally valued at prices obtained from one or more pricing vendors. Vendors value such securities based on one or more of the following inputs: benchmark yields, transactions, bids, offers, quotations from dealers and trading systems, new issues, spreads and other relationships observed in the markets among comparable securities; and proprietary pricing models such as yield measures calculated using factors such as cash flows, financial or collateral performance and other reference data. For certain distressed securities, valuations may include cash flows or liquidation values using a net present value calculation based on inputs that include, but are not limited to, financial statements and debt contracts.
When the funds’ investment adviser deems it appropriate to do so (such as when vendor prices are unavailable or not deemed to be representative), fixed-income securities will be valued in good faith at the mean quoted bid and ask prices that are reasonably and timely available (or bid prices, if ask prices are not available) or at prices for securities of comparable maturity, quality and type. Some securities may be valued based on their effective maturity or average life, which may be shorter than the stated maturity.
Securities and other assets for which representative market quotations are not readily available or are considered unreliable by the funds’ investment adviser are fair valued as determined in good faith under fair valuation guidelines adopted by authority of each fund’s board of trustees as further described. The investment adviser follows fair valuation guidelines, consistent with U.S. Securities and Exchange Commission rules and guidance, to consider relevant principles and factors when making fair value determinations. The investment adviser considers relevant indications of value that are reasonably and timely available to it in determining the fair value to be assigned to a particular security, such as the type and cost of the security; contractual or legal restrictions on resale of the security;
| American Funds Tax-Exempt Funds | 57 |
relevant financial or business developments of the issuer; actively traded similar or related securities; conversion or exchange rights on the security; related corporate actions; significant events occurring after the close of trading in the security; and changes in overall market conditions. In addition, the closing prices of equity securities that trade in markets outside U.S. time zones may be adjusted to reflect significant events that occur after the close of local trading but before the net asset value of each share class of the fund is determined. Fair valuations and valuations of investments that are not actively trading involve judgment and may differ materially from valuations that would have been used had greater market activity occurred.
Processes and structure — Each fund’s board of trustees has delegated authority to the funds’ investment adviser to make fair value determinations, subject to board oversight. The investment adviser has established a Joint Fair Valuation Committee (the “Fair Valuation Committee”) to administer, implement and oversee the fair valuation process, and to make fair value decisions. The Fair Valuation Committee regularly reviews its own fair value decisions, as well as decisions made under its standing instructions to the investment adviser’s valuation teams. The Fair Valuation Committee reviews changes in fair value measurements from period to period and may, as deemed appropriate, update the fair valuation guidelines to better reflect the results of back testing and address new or evolving issues. The Fair Valuation Committee reports any changes to the fair valuation guidelines to the boards of trustees with supplemental information to support the changes. Each fund’s board and audit committee also regularly review reports that describe fair value determinations and methods.
The funds’ investment adviser has also established a Fixed-Income Pricing Review Group to administer and oversee the fixed-income valuation process, including the use of fixed-income pricing vendors. This group regularly reviews pricing vendor information and market data. Pricing decisions, processes and controls over security valuation are also subject to additional internal reviews, including an annual control self-evaluation program facilitated by the investment adviser’s compliance group.
Classifications — The funds’ investment adviser classifies each fund’s assets and liabilities into three levels based on the inputs used to value the assets or liabilities. Level 1 values are based on quoted prices in active markets for identical securities. Level 2 values are based on significant observable market inputs, such as quoted prices for similar securities and quoted prices in inactive markets. Certain securities trading outside the U.S. may transfer between Level 1 and Level 2 due to valuation adjustments resulting from significant market movements following the close of local trading. Level 3 values are based on significant unobservable inputs that reflect the investment adviser’s determination of assumptions that market participants might reasonably use in valuing the securities. The valuation levels are not necessarily an indication of the risk or liquidity associated with the underlying investment. For example, U.S. government securities are reflected as Level 2 because the inputs used to determine fair value may not always be quoted prices in an active market. At January 31, 2017, all of the investment securities held by each fund were classified as Level 2.
4. Risk factors
Investing in each fund may involve certain risks including, but not limited to, those described below.
Market conditions — The prices of, and the income generated by, the securities held by the funds may decline — sometimes rapidly or unpredictably — due to various factors, including events or conditions affecting the general economy or particular industries; overall market changes; local, regional or global political, social or economic instability; governmental or governmental agency responses to economic conditions; and currency exchange rate, interest rate and commodity price fluctuations.
Issuer risks — The prices of, and the income generated by, securities held by the funds may decline in response to various factors directly related to the issuers of such securities, including reduced demand for an issuer’s goods or services, poor management performance and strategic initiatives such as mergers, acquisitions or dispositions and the market response to any such initiatives.
Investing in municipal securities — The yield and/or value of the funds’ investments in municipal securities may be adversely affected by events tied to the municipal securities markets, which can be very volatile and significantly impacted by unfavorable legislative or political developments and negative changes in the financial conditions of municipal securities issuers and the economy. To the extent the funds invest in obligations of a municipal issuer, the volatility, credit quality and performance of the funds may be adversely impacted by local political and economic conditions of the issuer. For example, a credit rating downgrade, bond default or bankruptcy involving an issuer within a particular state or territory could affect the market values and marketability of many or all municipal obligations of that state or territory. Income from municipal securities held by the funds could also be declared taxable because of changes in tax laws or interpretations by taxing authorities or as a result of noncompliant conduct of a municipal issuer. Additionally, the relative amount of publicly available information about municipal securities is generally less than that for corporate securities.
| 58 | American Funds Tax-Exempt Funds |
Investing in debt instruments — The prices of, and the income generated by, bonds and other debt securities held by the funds may be affected by changing interest rates and by changes in the effective maturities and credit ratings of these securities.
Rising interest rates will generally cause the prices of bonds and other debt securities to fall. Falling interest rates may cause an issuer to redeem, call or refinance a debt security before its stated maturity, which may result in the funds having to reinvest the proceeds in lower yielding securities. Longer maturity debt securities generally have greater sensitivity to changes in interest rates and may be subject to greater price fluctuations than shorter maturity debt securities.
Bonds and other debt securities are also subject to credit risk, which is the possibility that the credit strength of an issuer will weaken and/or an issuer of a debt security will fail to make timely payments of principal or interest and the security will go into default. Lower quality debt securities generally have higher rates of interest and may be subject to greater price fluctuations than higher quality debt securities. Credit risk is gauged, in part, by the credit ratings of the debt securities in which the funds invest. However, ratings are only the opinions of the rating agencies issuing them and are not guarantees as to credit quality or an evaluation of market risk. The funds’ investment adviser relies on its own credit analysts to research issuers and issues in seeking to mitigate various credit and default risks.
Thinly traded securities — There may be little trading in the secondary market for particular bonds or other debt securities, which may make them more difficult to value, acquire or sell.
Credit and liquidity support — Changes in the credit quality of banks and financial institutions providing credit and liquidity support features with respect to securities held by the funds could cause the values of these securities to decline.
Investing in lower rated debt instruments — Lower rated bonds and other lower rated debt securities generally have higher rates of interest and involve greater risk of default or price declines due to changes in the issuer’s creditworthiness than those of higher quality debt securities. The market prices of these securities may fluctuate more than the prices of higher quality debt securities and may decline significantly in periods of general economic difficulty. These risks may be increased with respect to investments in junk bonds.
Investing in similar municipal bonds — Investing significantly in municipal obligations of issuers in the same state or backed by revenues of similar types of projects or industries may make the funds more susceptible to certain economic, political or regulatory occurrences. As a result, the potential for fluctuations in the funds’ share price may increase.
Risks of investing in municipal bonds of issuers within the state of California — Because The Tax-Exempt Fund of California invests primarily in securities of issuers within the state of California, the fund is more susceptible to factors adversely affecting issuers of California securities than a comparable municipal bond mutual fund that does not concentrate its investments in a single state. For example, in the past, California voters have passed amendments to the state’s constitution and other measures that limit the taxing and spending authority of California governmental entities, and future voter initiatives may adversely affect California municipal bonds.
Risks of investing in municipal bonds of issuers within the state of New York — Because American Funds Tax-Exempt Fund of New York invests primarily in securities of issuers within the state of New York, the fund is more susceptible to factors adversely affecting issuers of New York securities than a comparable municipal bond mutual fund that does not concentrate its investments in a single state. For example, such factors may include political policy changes, tax base erosion, state constitutional limits on tax increases, budget deficits and other financial or economic difficulties, and changes in the credit ratings assigned to New York’s municipal issuers. New York’s economy and finances may be especially vulnerable to changes in the performance of the financial services sector, which historically has been volatile.
Management — The investment adviser to the funds actively manages the funds’ investments. Consequently, the funds are subject to the risk that the methods and analyses employed by the investment adviser in this process may not produce the desired results. This could cause the funds to lose value or its investment results to lag relevant benchmarks or other funds with similar objectives.
5. Taxation and distributions
Federal income taxation — Each fund complies with the requirements under Subchapter M of the Internal Revenue Code applicable to mutual funds and intends to distribute substantially all of its net income and net capital gains each year. The funds are not subject to income taxes to the extent taxable income and net capital gains are distributed. Generally, income earned by each fund is exempt from federal income taxes; however, each fund may earn taxable income from certain investments.
| American Funds Tax-Exempt Funds | 59 |
As of and during the period ended January 31, 2017, none of the funds had a liability for any unrecognized tax benefits. The funds recognize interest and penalties, if any, related to unrecognized tax benefits as income tax expense in their respective statement of operations. During the period, none of the funds incurred any interest or penalties.
The funds are not subject to examination by U.S. federal tax authorities for tax years before 2012 or by state tax authorities for tax years before 2011.
Distributions — Distributions paid to shareholders are based on each fund’s net investment income and net realized gains determined on a tax basis, which may differ from net investment income and net realized gains for financial reporting purposes. These differences are due primarily to different treatment for items such as short-term capital gains and losses; capital losses related to sales of certain securities within 30 days of purchase; deferred expenses; cost of investments sold; net capital losses and income on certain investments. The fiscal year in which amounts are distributed may differ from the year in which the net investment income and net realized gains are recorded by the funds for financial reporting purposes.
As indicated in the following tables, all of the funds had capital loss carryforwards available at July 31, 2016. These will be used to offset any capital gains realized by these funds in future years through the expiration dates, if applicable. None of the funds will make distributions from capital gains while a capital loss carryforward remains.
Under the Regulated Investment Company Modernization Act of 2010 (the “Act”), net capital losses recognized after July 31, 2011, (August 31, 2011, for The Tax-Exempt Bond Fund of America and The Tax-Exempt Fund of California) may be carried forward indefinitely, and their character is retained as short-term and/or long-term losses. Previously, net capital losses were carried forward for eight years and treated as short-term losses. As a transition rule, the Act requires that post-enactment net capital losses be used before pre-enactment net capital losses.
The components of distributable earnings on a tax basis are reported as of each fund’s most recent year-end. As of July 31, 2016, the components of distributable earnings on a tax basis for each fund were as follows (dollars in thousands):
| American Funds Short-Term Tax-Exempt Bond Fund | Limited Term Tax-Exempt Bond Fund of America | The Tax-Exempt Bond Fund of America | American High-Income Municipal Bond Fund | The Tax-Exempt Fund of California | American Funds Tax-Exempt Fund of New York | |||||||||||||||||||
| Undistributed tax-exempt income | $ | 103 | $ | 577 | $ | 3,596 | $ | 2,754 | $ | 757 | $ | 138 | ||||||||||||
| Capital loss carryforward: | ||||||||||||||||||||||||
| No expiration | (1,539 | ) | (380 | ) | (10,160 | ) | (1,323 | ) | (463 | ) | (3 | ) | ||||||||||||
| Expiring 2017 | — | — | (2,271 | ) | (14,384 | ) | (3,446 | ) | — | |||||||||||||||
| Expiring 2018 | — | — | (15,752 | ) | (69,970 | ) | (30,345 | ) | — | |||||||||||||||
| Expiring 2019 | — | — | — | (24,408 | ) | — | — | |||||||||||||||||
| $ | (1,539 | ) | $ | (380 | ) | $ | (28,183 | ) | $ | (110,085 | ) | $ | (34,254 | ) | $ | (3 | ) | |||||||
As of January 31, 2017, the tax basis unrealized appreciation (depreciation) and cost of investment securities were as follows (dollars in thousands):
| American Funds Short-Term Tax-Exempt Bond Fund | Limited Term Tax-Exempt Bond Fund of America | The Tax-Exempt Bond Fund of America | American High-Income Municipal Bond Fund | The Tax-Exempt Fund of California | American Funds Tax-Exempt Fund of New York | |||||||||||||||||||
| Gross unrealized appreciation on investment securities | $ | 2,833 | $ | 63,586 | $ | 481,227 | $ | 188,663 | $ | 81,757 | $ | 6,944 | ||||||||||||
| Gross unrealized depreciation on investment securities | (4,583 | ) | (29,231 | ) | (202,747 | ) | (125,486 | ) | (40,886 | ) | (2,859 | ) | ||||||||||||
| Net unrealized (depreciation) appreciation on investment securities | (1,750 | ) | 34,355 | 278,480 | 63,177 | 40,871 | 4,085 | |||||||||||||||||
| Cost of investment securities | 837,011 | 3,693,368 | 13,439,705 | 4,857,152 | 1,942,930 | 190,675 | ||||||||||||||||||
| 60 | American Funds Tax-Exempt Funds |
Tax-exempt income distributions paid or accrued to shareholders of each fund were as follows (dollars in thousands):
American Funds Short-Term Tax-Exempt Bond Fund
| Six months ended | Year ended | |||||||
| Share class | January 31, 2017 | July 31, 2016 | ||||||
| Class A | $ | 3,970 | $ | 6,775 | ||||
| Class F-1 | 57 | 90 | ||||||
| Class F-2 | 473 | 747 | ||||||
| Class F-3* | — | † | ||||||
| Total | $ | 4,500 | $ | 7,612 | ||||
Limited Term Tax-Exempt Bond Fund of America
| Six months ended | Year ended | |||||||
| Share class | January 31, 2017 | July 31, 2016 | ||||||
| Class A | $ | 30,939 | $ | 60,916 | ||||
| Class B | 1 | 7 | ||||||
| Class C | 188 | 422 | ||||||
| Class F-1 | 863 | 1,795 | ||||||
| Class F-2 | 3,687 | 5,409 | ||||||
| Class F-3* | — | † | ||||||
| Class R-6 | 3,432 | 5,737 | ||||||
| Total | $ | 39,110 | $ | 74,286 | ||||
The Tax-Exempt Bond Fund of America
| Six months ended | Year ended | |||||||
| Share class | January 31, 2017 | July 31, 2016 | ||||||
| Class A | $ | 146,237 | $ | 252,498 | ||||
| Class B | 25 | 127 | ||||||
| Class C | 5,848 | 9,193 | ||||||
| Class F-1 | 7,401 | 37,801 | ||||||
| Class F-2 | 47,446 | 53,592 | ||||||
| Class F-3* | — | † | ||||||
| Class R-6 | 6,859 | 10,839 | ||||||
| Total | $ | 213,816 | $ | 364,050 | ||||
American High-Income Municipal Bond Fund
| Six months ended | Year ended | |||||||
| Share class | January 31, 2017 | July 31, 2016 | ||||||
| Class A | $ | 64,964 | $ | 118,431 | ||||
| Class B | 13 | 76 | ||||||
| Class C | 3,599 | 6,480 | ||||||
| Class F-1 | 4,590 | 9,162 | ||||||
| Class F-2 | 15,635 | 19,563 | ||||||
| Class F-3* | — | † | ||||||
| Class R-6 | 5,775 | 9,229 | ||||||
| Total | $ | 94,576 | $ | 162,941 | ||||
The Tax-Exempt Fund of California
| Six months ended | Year ended | |||||||
| Share class | January 31, 2017 | July 31, 2016 | ||||||
| Class A | $ | 24,981 | $ | 47,262 | ||||
| Class B | 2 | 21 | ||||||
| Class C | 1,059 | 1,955 | ||||||
| Class F-1 | 1,145 | 2,131 | ||||||
| Class F-2 | 3,680 | 5,335 | ||||||
| Class F-3* | — | † | ||||||
| Total | $ | 30,867 | $ | 56,704 | ||||
See page 62 for footnotes.
| American Funds Tax-Exempt Funds | 61 |
American Funds Tax-Exempt Fund of New York
| Six months ended | Year ended | |||||||
| Share class | January 31, 2017 | July 31, 2016 | ||||||
| Class A | $ | 2,021 | $ | 3,489 | ||||
| Class B | — | † | 1 | |||||
| Class C | 120 | 207 | ||||||
| Class F-1 | 27 | 43 | ||||||
| Class F-2 | 408 | 663 | ||||||
| Class F-3* | — | † | ||||||
| Total | $ | 2,576 | $ | 4,403 | ||||
| * | Class F-3 shares were offered beginning January 27, 2017. |
| † | Amount less than one thousand. |
6. Fees and transactions with related parties
CRMC, the funds’ investment adviser, is the parent company of American Funds Distributors,® Inc. (“AFD”), the principal underwriter of the funds’ shares, and American Funds Service Company® (“AFS”), the funds’ transfer agent. CRMC, AFD and AFS are considered related parties to each fund.
Investment advisory services — Each fund has an investment advisory and service agreement with CRMC that provides for monthly fees accrued daily. These fees are based on annual rates that generally decrease as average net asset levels increase. The agreement for each fund, except American Funds Short-Term Tax-Exempt Bond Fund, also provides for monthly fees accrued daily based on a series of decreasing rates on each fund’s monthly gross income.
The range of rates, net asset levels, gross income levels and annualized rates of average net assets for each fund are as follows:
| Rates | Net asset level (in billions) | Rates | Monthly gross income | Annualized rates for the six months ended | ||||||||||||||||||||||||||||||||
| Fund | Beginning with | Ending with | Up to | In excess of | Beginning with | Ending with | Up to | In excess of | January 31, 2017 | |||||||||||||||||||||||||||
| American Funds Short-Term Tax-Exempt Bond Fund | .390 | % | .290 | % | $ | .20 | $ | 1.2 | .364 | % | ||||||||||||||||||||||||||
| Limited Term Tax-Exempt Bond Fund of America | .300 | .150 | .06 | 1.0 | 3.00 | % | 2.50 | % | $ | 3,333,333 | $ | 3,333,333 | .230 | |||||||||||||||||||||||
| The Tax-Exempt Bond Fund of America | .300 | .120 | .06 | 10.0 | 3.00 | 2.00 | 3,333,333 | 8,333,333 | .222 | |||||||||||||||||||||||||||
| American High-Income Municipal Bond Fund | .300 | .150 | .06 | 3.0 | 3.00 | 2.50 | 3,333,333 | 3,333,333 | .292 | |||||||||||||||||||||||||||
| The Tax-Exempt Fund of California | .300 | .180 | .06 | 1.0 | 3.00 | 2.50 | 3,333,333 | 3,333,333 | .298 | |||||||||||||||||||||||||||
| American Funds Tax-Exempt Fund of New York | .300 | .180 | .06 | 1.0 | 3.00 | 2.50 | 3,333,333 | 3,333,333 | .333 | |||||||||||||||||||||||||||
Class-specific fees and expenses — Expenses that are specific to individual share classes are accrued directly to the respective share class of each fund. The principal class-specific fees and expenses are described below:
Distribution services — Each fund has plans of distribution for all share classes, except Class F-2, F-3 and R-6 shares, if applicable. Under the plans, each fund’s board of trustees approves certain categories of expenses that are used to finance activities primarily intended to sell fund shares and service existing accounts. The plans provide for payments based on an annualized percentage of average daily net assets. In some cases, the boards of trustees have limited the amounts that may be paid to less than the maximum allowed by the plans. All share classes with a plan may use the allotted percentage of average daily net assets to pay service fees, or to compensate AFD for paying service fees, to firms that have entered into agreements with AFD to provide certain
| 62 | American Funds Tax-Exempt Funds |
shareholder services. The remaining amounts available to be paid under each plan are paid to dealers to compensate them for their sales activities.
| American Funds Short-Term Tax-Exempt Bond Fund | Limited Term Tax-Exempt Bond Fund of America | The Tax-Exempt Bond Fund of America | ||||||||||||||||||||
| Share class | Currently approved limits | Plan limits | Currently approved limits | Plan limits | Currently approved limits | Plan limits | ||||||||||||||||
| Class A | 0.15 | % | 0.15 | % | 0.30 | % | 0.30 | % | 0.25 | % | 0.25 | % | ||||||||||
| Class B | Not applicable | Not applicable | 1.00 | 1.00 | 1.00 | 1.00 | ||||||||||||||||
| Class C | Not applicable | Not applicable | 1.00 | 1.00 | 1.00 | 1.00 | ||||||||||||||||
| Class F-1 | 0.25 | 0.50 | 0.25 | 0.50 | 0.25 | 0.50 | ||||||||||||||||
| American High-Income Municipal Bond Fund | The Tax-Exempt Fund of California | American Funds Tax-Exempt Fund of New York | ||||||||||||||||||||||
| Share class | Currently approved limits | Plan limits | Currently approved limits | Plan limits | Currently approved limits | Plan limits | ||||||||||||||||||
| Class A | 0.30 | % | 0.30 | % | 0.25 | % | 0.25 | % | 0.25 | % | 0.30 | % | ||||||||||||
| Class B | 1.00 | 1.00 | 1.00 | 1.00 | 1.00 | 1.00 | ||||||||||||||||||
| Class C | 1.00 | 1.00 | 1.00 | 1.00 | 1.00 | 1.00 | ||||||||||||||||||
| Class F-1 | 0.25 | 0.50 | 0.25 | 0.50 | 0.25 | 0.50 | ||||||||||||||||||
For Class A shares, distribution-related expenses include the reimbursement of dealer and wholesaler commissions paid by AFD for certain shares sold without a sales charge. This share class of each fund reimburses AFD for amounts billed within the prior 15 months but only to the extent that the overall annual expense limit is not exceeded. As of January 31, 2017, unreimbursed expenses subject to reimbursement for Class A shares of each fund were as follows (dollars in thousands):
| Fund | Class A | |||
| American Funds Short-Term Tax-Exempt Bond Fund | $ | 1,214 | ||
| Limited-Term Tax-Exempt Bond Fund of America | 744 | |||
| The Tax-Exempt Bond Fund of America | 9,471 | |||
| American High-Income Municipal Bond Fund | — | |||
| The Tax-Exempt Fund of California | 1,581 | |||
| American Funds Tax-Exempt Fund of New York | 25 | |||
Transfer agent services — Each fund has a shareholder services agreement with AFS under which each fund compensates AFS for providing transfer agent services to each of the funds’ share classes. These services include recordkeeping, shareholder communications and transaction processing. In addition, each fund reimburses AFS for amounts paid to third parties for performing transfer agent services on behalf of its respective fund shareholders.
Administrative services — Each fund has an administrative services agreement with CRMC under which each fund compensates CRMC for providing administrative services to each of the funds’ Class A, C, F and R shares, if applicable. These services include, but are not limited to, coordinating, monitoring, assisting and overseeing third parties that provide services to each fund’s shareholders. Under the agreements, Class A shares of each fund pay an annual fee of 0.01% and Class C, F and R shares of each fund, if applicable, pay an annual fee of 0.05% of their respective average daily net assets.
For the six months ended January 31, 2017, class-specific expenses under the agreements for each fund were as follows (dollars in thousands):
American Funds Short-Term Tax-Exempt Bond Fund
| Distribution | Transfer agent | Administrative | ||||||||||
| Share class | services | services | services | |||||||||
| Class A | $542 | $116 | $36 | |||||||||
| Class F-1 | 17 | 8 | 3 | |||||||||
| Class F-2 | Not applicable | 46 | 21 | |||||||||
| Class F-3* | Not applicable | — | — | † | ||||||||
| Total class-specific expenses | $559 | $170 | $60 | |||||||||
Limited Term Tax-Exempt Bond Fund of America
| Distribution | Transfer agent | Administrative | ||||||||||
| Share class | services | services | services | |||||||||
| Class A | $4,635 | $496 | $155 | |||||||||
| Class B | — | † | — | † | Not applicable | |||||||
| Class C | 149 | 5 | 7 | |||||||||
| Class F-1 | 111 | 54 | 22 | |||||||||
| Class F-2 | Not applicable | 184 | 84 | |||||||||
| Class F-3* | Not applicable | — | — | † | ||||||||
| Class R-6 | Not applicable | 2 | 75 | |||||||||
| Total class-specific expenses | $4,895 | $741 | $343 | |||||||||
See page 64 for footnotes.
| American Funds Tax-Exempt Funds | 63 |
The Tax-Exempt Bond Fund of America
| Distribution | Transfer agent | Administrative | ||||||||||
| Share class | services | services | services | |||||||||
| Class A | $11,995 | $1,600 | $480 | |||||||||
| Class B | 10 | — | † | Not applicable | ||||||||
| Class C | 2,591 | 88 | 130 | |||||||||
| Class F-1 | 631 | 301 | 126 | |||||||||
| Class F-2 | Not applicable | 1,768 | 747 | |||||||||
| Class F-3* | Not applicable | — | — | † | ||||||||
| Class R-6 | Not applicable | 3 | 104 | |||||||||
| Total class-specific expenses | $15,227 | $3,760 | $1,587 | |||||||||
American High-Income Municipal Bond Fund
| Distribution | Transfer agent | Administrative | ||||||||||
| Share class | services | services | services | |||||||||
| Class A | $5,202 | $862 | $176 | |||||||||
| Class B | 4 | — | † | Not applicable | ||||||||
| Class C | 1,220 | 61 | 61 | |||||||||
| Class F-1 | 317 | 159 | 64 | |||||||||
| Class F-2 | Not applicable | 472 | 201 | |||||||||
| Class F-3* | Not applicable | — | — | † | ||||||||
| Class R-6 | Not applicable | 3 | 72 | |||||||||
| Total class-specific expenses | $6,743 | $1,557 | $574 | |||||||||
The Tax-Exempt Fund of California
| Distribution | Transfer agent | Administrative | ||||||||||
| Share class | services | services | services | |||||||||
| Class A | $2,085 | $182 | $83 | |||||||||
| Class B | 1 | — | † | Not applicable | ||||||||
| Class C | 480 | 11 | 24 | |||||||||
| Class F-1 | 99 | 46 | 20 | |||||||||
| Class F-2 | Not applicable | 127 | 59 | |||||||||
| Class F-3* | Not applicable | — | — | |||||||||
| Total class-specific expenses | $2,665 | $366 | $186 | |||||||||
American Funds Tax-Exempt Fund of New York
| Distribution | Transfer agent | Administrative | ||||||||||
| Share class | services | services | services | |||||||||
| Class A | $202 | $27 | $8 | |||||||||
| Class B | — | † | — | † | Not applicable | |||||||
| Class C | 71 | 3 | 3 | |||||||||
| Class F-1 | 1 | 1 | 1 | |||||||||
| Class F-2 | Not applicable | 17 | 8 | |||||||||
| Class F-3* | Not applicable | — | — | † | ||||||||
| Total class-specific expenses | $274 | $48 | $20 | |||||||||
| * | Class F-3 shares were offered beginning January 27, 2017. |
| † | Amount less than one thousand. |
Trustees’ deferred compensation — Trustees who are unaffiliated with CRMC may elect to defer the cash payment of part or all of their compensation. These deferred amounts, which remain as liabilities of each fund, are treated as if invested in shares of the funds or other American Funds. These amounts represent general, unsecured liabilities of each fund and vary according to the total returns of the selected funds. Trustees’ compensation in the funds’ statement of operations reflects the current fees (either paid in cash or deferred) and a net increase in the value of the following deferred amounts (dollars in thousands):
| Increase in value of | Total trustees’ | |||||||||||
| Fund | Current fees | deferred amounts | compensation | |||||||||
| American Funds Short-Term Tax-Exempt Bond Fund | $ | 3 | $ | 1 | $ | 4 | ||||||
| Limited Term Tax-Exempt Bond Fund of America | 12 | 5 | 17 | |||||||||
| The Tax-Exempt Bond Fund of America | 44 | 26 | 70 | |||||||||
| American High-Income Municipal Bond Fund | 15 | 4 | 19 | |||||||||
| The Tax-Exempt Fund of California | 7 | 5 | 12 | |||||||||
| American Funds Tax-Exempt Fund of New York | 1 | — | * | 1 | ||||||||
| * | Amount less than one thousand. |
Affiliated officers and trustees — Officers and certain trustees of the funds are or may be considered to be affiliated with CRMC, AFD and AFS. No affiliated officers or trustees received any compensation directly from the funds.
Security transactions with related funds — Each fund may purchase from, or sell securities to, other CRMC-managed funds (or funds managed by certain affiliates of CRMC) under procedures adopted by each fund’s board of trustees. The funds involved in such transactions are considered related by virtue of having a common investment adviser (or affiliated investment advisers), common trustees and/or common officers. When such transactions occur, each transaction is executed at the current market price of the security and no brokerage commissions or fees are paid in accordance with Rule 17a-7 of the 1940 Act. During the six months ended January 31, 2017, such purchase transactions occurred between American Funds Short-Term Tax-Exempt Bond Fund and related funds in the amount of $12,543,000. There were no sale transactions between American Funds Short-Term Tax-Exempt Bond Fund and related funds during the period.
| 64 | American Funds Tax-Exempt Funds |
7. Capital share transactions
Capital share transactions in the funds were as follows (dollars and shares in thousands):
American Funds Short-Term Tax-Exempt Bond Fund
| Sales1 | Reinvestments of dividends | Repurchases1 | Net increase (decrease) | |||||||||||||||||||||||||||||
| Share class | Amount | Shares | Amount | Shares | Amount | Shares | Amount | Shares | ||||||||||||||||||||||||
| Six months ended January 31, 2017 | ||||||||||||||||||||||||||||||||
| Class A | $ | 240,612 | 23,842 | $ | 3,751 | 371 | $ | (180,381 | ) | (17,886 | ) | $ | 63,982 | 6,327 | ||||||||||||||||||
| Class F-1 | 3,148 | 312 | 56 | 5 | (3,841 | ) | (381 | ) | (637 | ) | (64 | ) | ||||||||||||||||||||
| Class F-2 | 47,764 | 4,728 | 390 | 39 | (44,291 | ) | (4,387 | ) | 3,863 | 380 | ||||||||||||||||||||||
| Class F-32 | 10 | 1 | — | — | — | — | 10 | 1 | ||||||||||||||||||||||||
| Total net increase (decrease) | $ | 291,534 | 28,883 | $ | 4,197 | 415 | $ | (228,513 | ) | (22,654 | ) | $ | 67,218 | 6,644 | ||||||||||||||||||
| Year ended July 31, 2016 | ||||||||||||||||||||||||||||||||
| Class A | $ | 265,488 | 26,090 | $ | 6,336 | 622 | $ | (240,607 | ) | (23,645 | ) | $ | 31,217 | 3,067 | ||||||||||||||||||
| Class F-1 | 7,767 | 763 | 90 | 9 | (4,002 | ) | (394 | ) | 3,855 | 378 | ||||||||||||||||||||||
| Class F-2 | 62,784 | 6,169 | 603 | 59 | (47,172 | ) | (4,638 | ) | 16,215 | 1,590 | ||||||||||||||||||||||
| Total net increase (decrease) | $ | 336,039 | 33,022 | $ | 7,029 | 690 | $ | (291,781 | ) | (28,677 | ) | $ | 51,287 | 5,035 | ||||||||||||||||||
| Limited Term Tax-Exempt Bond Fund of America | ||||||||||||||||||||||||||||||||
| Sales1 | Reinvestments of dividends | Repurchases1 | Net increase (decrease) | |||||||||||||||||||||||||||||
| Share class | Amount | Shares | Amount | Shares | Amount | Shares | Amount | Shares | ||||||||||||||||||||||||
| Six months ended January 31, 2017 | ||||||||||||||||||||||||||||||||
| Class A | $ | 519,094 | 32,980 | $ | 29,188 | 1,854 | $ | (526,237 | ) | (33,573 | ) | $ | 22,045 | 1,261 | ||||||||||||||||||
| Class B | 3 | — | 3 | 1 | — | 3 | (233 | ) | (14 | ) | (229 | ) | (14 | ) | ||||||||||||||||||
| Class C | 7,280 | 464 | 182 | 11 | (8,220 | ) | (523 | ) | (758 | ) | (48 | ) | ||||||||||||||||||||
| Class F-1 | 16,367 | 1,042 | 832 | 53 | (18,525 | ) | (1,182 | ) | (1,326 | ) | (87 | ) | ||||||||||||||||||||
| Class F-2 | 194,524 | 12,341 | 3,252 | 207 | (136,782 | ) | (8,728 | ) | 60,994 | 3,820 | ||||||||||||||||||||||
| Class F-32 | 10 | 1 | — | — | — | — | 10 | 1 | ||||||||||||||||||||||||
| Class R-6 | 44,774 | 2,823 | 3,431 | 218 | (33,375 | ) | (2,140 | ) | 14,830 | 901 | ||||||||||||||||||||||
| Total net increase (decrease) | $ | 782,052 | 49,651 | $ | 36,886 | 2,343 | $ | (723,372 | ) | (46,160 | ) | $ | 95,566 | 5,834 | ||||||||||||||||||
| Sales | Reinvestments of dividends | Repurchases | Net increase (decrease) | |||||||||||||||||||||||||||||
| Share class | Amount | Shares | Amount | Shares | Amount | Shares | Amount | Shares | ||||||||||||||||||||||||
| Year ended July 31, 2016 | ||||||||||||||||||||||||||||||||
| Class A | $ | 770,995 | 48,281 | $ | 56,942 | 3,566 | $ | (466,226 | ) | (29,211 | ) | $ | 361,711 | 22,636 | ||||||||||||||||||
| Class B | 144 | 9 | 7 | — | 3 | (597 | ) | (37 | ) | (446 | ) | (28 | ) | |||||||||||||||||||
| Class C | 11,072 | 693 | 408 | 26 | (11,244 | ) | (705 | ) | 236 | 14 | ||||||||||||||||||||||
| Class F-1 | 24,656 | 1,544 | 1,728 | 108 | (20,991 | ) | (1,315 | ) | 5,393 | 337 | ||||||||||||||||||||||
| Class F-2 | 143,068 | 8,950 | 4,556 | 286 | (66,832 | ) | (4,185 | ) | 80,792 | 5,051 | ||||||||||||||||||||||
| Class R-6 | 101,074 | 6,329 | 5,737 | 359 | (15,721 | ) | (986 | ) | 91,090 | 5,702 | ||||||||||||||||||||||
| Total net increase (decrease) | $ | 1,051,009 | 65,806 | $ | 69,378 | 4,345 | $ | (581,611 | ) | (36,439 | ) | $ | 538,776 | 33,712 | ||||||||||||||||||
See page 67 for footnotes.
| American Funds Tax-Exempt Funds | 65 |
The Tax-Exempt Bond Fund of America
| Sales1 | Issued in connection with the mergers | Reinvestments of dividends | Repurchases1 | Net increase (decrease) | ||||||||||||||||||||||||||||||||||||
| Share class | Amount | Shares | Amount | Shares | Amount | Shares | Amount | Shares | Amount | Shares | ||||||||||||||||||||||||||||||
| Six months ended January 31, 2017 | ||||||||||||||||||||||||||||||||||||||||
| Class A | $ | 1,053,950 | 80,626 | $ | 135,485 | 10,430 | $ | (946,936 | ) | (73,509 | ) | $ | 242,499 | 17,547 | ||||||||||||||||||||||||||
| Class B | 4 | — | 3 | 24 | 2 | (1,975 | ) | (151 | ) | (1,947 | ) | (149 | ) | |||||||||||||||||||||||||||
| Class C | 70,821 | 5,397 | 5,559 | 428 | (77,079 | ) | (5,952 | ) | (699 | ) | (127 | ) | ||||||||||||||||||||||||||||
| Class F-1 | 75,376 | 5,818 | 7,123 | 548 | (96,589 | ) | (7,487 | ) | (14,090 | ) | (1,121 | ) | ||||||||||||||||||||||||||||
| Class F-2 | 758,379 | 58,499 | 45,186 | 3,479 | (493,467 | ) | (38,326 | ) | 310,098 | 23,652 | ||||||||||||||||||||||||||||||
| Class F-32 | 10 | 1 | — | — | — | — | 10 | 1 | ||||||||||||||||||||||||||||||||
| Class R-6 | 69,352 | 5,317 | 6,859 | 528 | (12,947 | ) | (1,014 | ) | 63,264 | 4,831 | ||||||||||||||||||||||||||||||
| Total net increase (decrease) | $ | 2,027,892 | 155,658 | $ | 200,236 | 15,415 | $ | (1,628,993 | ) | (126,439 | ) | $ | 599,135 | 44,634 | ||||||||||||||||||||||||||
| Year ended July 31, 2016 | ||||||||||||||||||||||||||||||||||||||||
| Class A | $ | 1,871,164 | 141,849 | $ | 608,701 | 45,527 | $ | 232,021 | 17,617 | $ | (850,880 | ) | (64,706 | ) | $ | 1,861,006 | 140,287 | |||||||||||||||||||||||
| Class B | 188 | 14 | 336 | 25 | 122 | 9 | (4,787 | ) | (363 | ) | (4,141 | ) | (315 | ) | ||||||||||||||||||||||||||
| Class C | 159,538 | 12,081 | 63,427 | 4,744 | 8,714 | 661 | (76,537 | ) | (5,817 | ) | 155,142 | 11,669 | ||||||||||||||||||||||||||||
| Class F-1 | 444,340 | 34,050 | 37,279 | 2,788 | 37,270 | 2,843 | (1,510,010 | ) | (114,741 | ) | (991,121 | ) | (75,060 | ) | ||||||||||||||||||||||||||
| Class F-2 | 2,030,700 | 154,105 | 76,119 | 5,693 | 50,029 | 3,784 | (329,704 | ) | (24,984 | ) | 1,827,144 | 138,598 | ||||||||||||||||||||||||||||
| Class R-6 | 108,885 | 8,267 | 10,841 | 823 | (10,127 | ) | (773 | ) | 109,599 | 8,317 | ||||||||||||||||||||||||||||||
| Total net increase (decrease) | $ | 4,614,815 | 350,366 | $ | 785,862 | 58,777 | $ | 338,997 | 25,737 | $ | (2,782,045 | ) | (211,384 | ) | $ | 2,957,629 | 223,496 | |||||||||||||||||||||||
| Issued in connection | Issued in connection | |||||||||||||||||||||||||||||||||||||||
| with the merger of | with the merger of | Total issued | ||||||||||||||||||||||||||||||||||||||
| the Tax-Exempt Fund | the Tax-Exempt Fund | in connection | ||||||||||||||||||||||||||||||||||||||
| of Maryland | of Virginia | with the mergers | ||||||||||||||||||||||||||||||||||||||
| Merger details | Amount | Shares | Amount | Shares | Amount | Shares | ||||||||||||||||||||||||||||||||||
| Class A | $ | 236,260 | 17,671 | $ | 372,441 | 27,856 | $ | 608,701 | 45,527 | |||||||||||||||||||||||||||||||
| Class B | 105 | 8 | 231 | 17 | 336 | 25 | ||||||||||||||||||||||||||||||||||
| Class C | 28,452 | 2,128 | 34,975 | 2,616 | 63,427 | 4,744 | ||||||||||||||||||||||||||||||||||
| Class F-1 | 15,686 | 1,173 | 21,593 | 1,615 | 37,279 | 2,788 | ||||||||||||||||||||||||||||||||||
| Class F-2 | 28,222 | 2,111 | 47,897 | 3,582 | 76,119 | 5,693 | ||||||||||||||||||||||||||||||||||
| Total issued | $ | 308,725 | 23,091 | $ | 477,137 | 35,686 | $ | 785,862 | 58,777 | |||||||||||||||||||||||||||||||
American High-Income Municipal Bond Fund
| Sales1 | Reinvestments of dividends | Repurchases1 | Net increase (decrease) | |||||||||||||||||||||||||||||
| Share class | Amount | Shares | Amount | Shares | Amount | Shares | Amount | Shares | ||||||||||||||||||||||||
| Six months ended January 31, 2017 | ||||||||||||||||||||||||||||||||
| Class A | $ | 436,450 | 27,756 | $ | 59,939 | 3,825 | $ | (432,480 | ) | (27,854 | ) | $ | 63,909 | 3,727 | ||||||||||||||||||
| Class B | 31 | 2 | 13 | 1 | (776 | ) | (49 | ) | (732 | ) | (46 | ) | ||||||||||||||||||||
| Class C | 32,222 | 2,037 | 3,369 | 215 | (38,791 | ) | (2,491 | ) | (3,200 | ) | (239 | ) | ||||||||||||||||||||
| Class F-1 | 43,891 | 2,786 | 4,470 | 285 | (95,569 | ) | (6,113 | ) | (47,208 | ) | (3,042 | ) | ||||||||||||||||||||
| Class F-2 | 255,954 | 16,369 | 13,986 | 893 | (187,893 | ) | (12,114 | ) | 82,047 | 5,148 | ||||||||||||||||||||||
| Class F-32 | 10 | 1 | — | — | — | — | 10 | 1 | ||||||||||||||||||||||||
| Class R-6 | 50,753 | 3,243 | 5,775 | 369 | — | — | 56,528 | 3,612 | ||||||||||||||||||||||||
| Total net increase (decrease) | $ | 819,311 | 52,194 | $ | 87,552 | 5,588 | $ | (755,509 | ) | (48,621 | ) | $ | 151,354 | 9,161 | ||||||||||||||||||
| Year ended July 31, 2016 | ||||||||||||||||||||||||||||||||
| Class A | $ | 916,799 | 58,141 | $ | 109,175 | 6,926 | $ | (367,188 | ) | (23,358 | ) | $ | 658,786 | 41,709 | ||||||||||||||||||
| Class B | 256 | 16 | 72 | 4 | (2,546 | ) | (162 | ) | (2,218 | ) | (142 | ) | ||||||||||||||||||||
| Class C | 89,022 | 5,638 | 6,037 | 383 | (41,568 | ) | (2,642 | ) | 53,491 | 3,379 | ||||||||||||||||||||||
| Class F-1 | 121,444 | 7,680 | 8,917 | 566 | (68,553 | ) | (4,339 | ) | 61,808 | 3,907 | ||||||||||||||||||||||
| Class F-2 | 559,242 | 35,343 | 17,128 | 1,084 | (149,558 | ) | (9,505 | ) | 426,812 | 26,922 | ||||||||||||||||||||||
| Class R-6 | 62,899 | 3,986 | 9,230 | 585 | (3,047 | ) | (198 | ) | 69,082 | 4,373 | ||||||||||||||||||||||
| Total net increase (decrease) | $ | 1,749,662 | 110,804 | $ | 150,559 | 9,548 | $ | (632,460 | ) | (40,204 | ) | $ | 1,267,761 | 80,148 | ||||||||||||||||||
| 66 | American Funds Tax-Exempt Funds |
The Tax-Exempt Fund of California
| Sales1 | Reinvestments of dividends | Repurchases1 | Net (decrease) increase | |||||||||||||||||||||||||||||
| Share class | Amount | Shares | Amount | Shares | Amount | Shares | Amount | Shares | ||||||||||||||||||||||||
| Six months ended January 31, 2017 | ||||||||||||||||||||||||||||||||
| Class A | $ | 159,121 | 8,959 | $ | 22,178 | 1,258 | $ | (184,133 | ) | (10,545 | ) | $ | (2,834 | ) | (328 | ) | ||||||||||||||||
| Class B | 1 | — | 3 | 2 | — | 3 | (172 | ) | (9 | ) | (169 | ) | (9 | ) | ||||||||||||||||||
| Class C | 15,485 | 866 | 1,003 | 57 | (19,442 | ) | (1,105 | ) | (2,954 | ) | (182 | ) | ||||||||||||||||||||
| Class F-1 | 13,318 | 749 | 1,075 | 61 | (17,968 | ) | (1,020 | ) | (3,575 | ) | (210 | ) | ||||||||||||||||||||
| Class F-2 | 111,424 | 6,342 | 3,154 | 179 | (61,844 | ) | (3,553 | ) | 52,734 | 2,968 | ||||||||||||||||||||||
| Class F-32 | 10 | 1 | — | — | — | — | 10 | 1 | ||||||||||||||||||||||||
| Total net increase (decrease) | $ | 299,359 | 16,917 | $ | 27,412 | 1,555 | $ | (283,559 | ) | (16,232 | ) | $ | 43,212 | 2,240 | ||||||||||||||||||
| Year ended July 31, 2016 | ||||||||||||||||||||||||||||||||
| Class A | $ | 364,822 | 20,350 | $ | 41,439 | 2,313 | $ | (165,245 | ) | (9,243 | ) | $ | 241,016 | 13,420 | ||||||||||||||||||
| Class B | 36 | 2 | 20 | 1 | (1,162 | ) | (65 | ) | (1,106 | ) | (62 | ) | ||||||||||||||||||||
| Class C | 33,775 | 1,879 | 1,844 | 103 | (18,810 | ) | (1,052 | ) | 16,809 | 930 | ||||||||||||||||||||||
| Class F-1 | 26,848 | 1,496 | 1,985 | 111 | (10,978 | ) | (613 | ) | 17,855 | 994 | ||||||||||||||||||||||
| Class F-2 | 86,120 | 4,793 | 4,508 | 252 | (17,372 | ) | (969 | ) | 73,256 | 4,076 | ||||||||||||||||||||||
| Total net increase (decrease) | $ | 511,601 | 28,520 | $ | 49,796 | 2,780 | $ | (213,567 | ) | (11,942 | ) | $ | 347,830 | 19,358 | ||||||||||||||||||
American Funds Tax-Exempt Fund of New York
| Sales1 | Reinvestments of dividends | Repurchases1 | Net increase (decrease) | |||||||||||||||||||||||||||||
| Share class | Amount | Shares | Amount | Shares | Amount | Shares | Amount | Shares | ||||||||||||||||||||||||
| Six months ended January 31, 2017 | ||||||||||||||||||||||||||||||||
| Class A | $ | 27,451 | 2,538 | $ | 1,515 | 141 | $ | (25,965 | ) | (2,418 | ) | $ | 3,001 | 261 | ||||||||||||||||||
| Class B | 11 | — | 3 | — | 3 | — | 3 | (5 | ) | — | 3 | 6 | — | 3 | ||||||||||||||||||
| Class C | 1,838 | 169 | 113 | 10 | (2,019 | ) | (190 | ) | (68 | ) | (11 | ) | ||||||||||||||||||||
| Class F-1 | 637 | 58 | 20 | 2 | (573 | ) | (53 | ) | 84 | 7 | ||||||||||||||||||||||
| Class F-2 | 4,896 | 452 | 341 | 32 | (8,327 | ) | (788 | ) | (3,090 | ) | (304 | ) | ||||||||||||||||||||
| Class F-32 | 10 | 1 | — | — | — | — | 10 | 1 | ||||||||||||||||||||||||
| Total net increase (decrease) | $ | 34,843 | 3,218 | $ | 1,989 | 185 | $ | (36,889 | ) | (3,449 | ) | $ | (57 | ) | (46 | ) | ||||||||||||||||
| Year ended July 31, 2016 | ||||||||||||||||||||||||||||||||
| Class A | $ | 42,821 | 3,939 | $ | 2,365 | 217 | $ | (13,606 | ) | (1,255 | ) | $ | 31,580 | 2,901 | ||||||||||||||||||
| Class B | 3 | 1 | — | 3 | — | 3 | (33 | ) | (3 | ) | (30 | ) | (2 | ) | ||||||||||||||||||
| Class C | 6,364 | 587 | 195 | 18 | (2,798 | ) | (257 | ) | 3,761 | 348 | ||||||||||||||||||||||
| Class F-1 | 676 | 63 | 25 | 2 | (257 | ) | (24 | ) | 444 | 41 | ||||||||||||||||||||||
| Class F-2 | 13,967 | 1,282 | 540 | 50 | (4,675 | ) | (428 | ) | 9,832 | 904 | ||||||||||||||||||||||
| Total net increase (decrease) | $ | 63,831 | 5,872 | $ | 3,125 | 287 | $ | (21,369 | ) | (1,967 | ) | $ | 45,587 | 4,192 | ||||||||||||||||||
| 1 | Includes exchanges between share classes of the fund. |
| 2 | Class F-3 shares were offered beginning January 27, 2017. |
| 3 | Amount less than one thousand. |
8. Investment transactions
Each fund made purchases and sales of investment securities, excluding short-term securities and U.S. government obligations, if any, during the six months ended January 31, 2017, as follows (dollars in thousands):
| Fund | Purchases | Sales | ||||||
| American Funds Short-Term Tax-Exempt Bond Fund | $ | 171,558 | $ | 115,471 | ||||
| Limited Term Tax-Exempt Bond Fund of America | 648,898 | 464,777 | ||||||
| The Tax-Exempt Bond Fund of America | 1,915,971 | 1,214,720 | ||||||
| American High-Income Municipal Bond Fund | 1,036,009 | 796,072 | ||||||
| The Tax-Exempt Fund of California | 247,351 | 217,926 | ||||||
| American Funds Tax-Exempt Fund of New York | 26,155 | 25,138 | ||||||
| American Funds Tax-Exempt Funds | 67 |
9. Ownership concentration
At January 31, 2017, CRMC held aggregate ownership of 21% of the outstanding shares of American Funds Tax-Exempt Fund of New York. The ownership represents the seed money invested in the fund when it began operations on November 1, 2010.
| 68 | American Funds Tax-Exempt Funds |
Financial highlights
American Funds Short-Term Tax-Exempt Bond Fund
| (Loss) income from investment operations1 | Dividends and distributions | |||||||||||||||||||||||||||||||||||||||||||||||
| Period ended | Net asset value, beginning of period | Net investment income | Net (losses) gains on securities (both realized and unrealized) | Total from investment operation | Dividends (from net investment income) | Distributions (from capital gains) | Total dividends and distributions | Net asset value, end of period | Total return2 | Net assets, end of period (in millions) | Ratio of expenses to average net assets | Ratio of net income to average net assets | ||||||||||||||||||||||||||||||||||||
| Class A: | ||||||||||||||||||||||||||||||||||||||||||||||||
| 1/31/20173,4 | $ | 10.22 | $ | .06 | $ | (.15 | ) | $ | (.09 | ) | $ | (.06 | ) | $ | — | $ | (.06 | ) | $ | 10.07 | (.92 | )%5 | $ | 742 | .58 | %6 | 1.09 | %6 | ||||||||||||||||||||
| 7/31/2016 | 10.17 | .10 | .05 | .15 | (.10 | ) | — | (.10 | ) | 10.22 | 1.51 | 688 | .59 | 1.02 | ||||||||||||||||||||||||||||||||||
| 7/31/2015 | 10.25 | .11 | (.08 | ) | .03 | (.11 | ) | — | (.11 | ) | 10.17 | .26 | 653 | .58 | 1.04 | |||||||||||||||||||||||||||||||||
| 7/31/2014 | 10.21 | .11 | .04 | .15 | (.11 | ) | — | (.11 | ) | 10.25 | 1.43 | 737 | .58 | 1.04 | ||||||||||||||||||||||||||||||||||
| 7/31/2013 | 10.32 | .13 | (.11 | ) | .02 | (.13 | ) | — | 7 | (.13 | ) | 10.21 | .16 | 701 | .59 | 1.21 | ||||||||||||||||||||||||||||||||
| 7/31/2012 | 10.23 | .13 | .09 | .22 | (.13 | ) | — | (.13 | ) | 10.32 | 2.17 | 606 | .59 | 1.27 | ||||||||||||||||||||||||||||||||||
| Class F-1: | ||||||||||||||||||||||||||||||||||||||||||||||||
| 1/31/20173,4 | 10.22 | .04 | (.15 | ) | (.11 | ) | (.04 | ) | — | (.04 | ) | 10.07 | (1.04 | )5 | 12 | .81 | 6 | .86 | 6 | |||||||||||||||||||||||||||||
| 7/31/2016 | 10.17 | .08 | .05 | .13 | (.08 | ) | — | (.08 | ) | 10.22 | 1.29 | 13 | .81 | .80 | ||||||||||||||||||||||||||||||||||
| 7/31/2015 | 10.25 | .08 | (.08 | ) | — | (.08 | ) | — | (.08 | ) | 10.17 | .05 | 9 | .80 | .83 | |||||||||||||||||||||||||||||||||
| 7/31/2014 | 10.21 | .08 | .04 | .12 | (.08 | ) | — | (.08 | ) | 10.25 | 1.19 | 14 | .82 | .80 | ||||||||||||||||||||||||||||||||||
| 7/31/2013 | 10.32 | .10 | (.11 | ) | (.01 | ) | (.10 | ) | — | 7 | (.10 | ) | 10.21 | (.08 | ) | 30 | .84 | .96 | ||||||||||||||||||||||||||||||
| 7/31/2012 | 10.23 | .11 | .09 | .20 | (.11 | ) | — | (.11 | ) | 10.32 | 1.98 | 18 | .78 | 1.09 | ||||||||||||||||||||||||||||||||||
| Class F-2: | ||||||||||||||||||||||||||||||||||||||||||||||||
| 1/31/20173,4 | 10.22 | .06 | (.15 | ) | (.09 | ) | (.06 | ) | — | (.06 | ) | 10.07 | (.91 | )5 | 83 | .55 | 6 | 1.13 | 6 | |||||||||||||||||||||||||||||
| 7/31/2016 | 10.17 | .11 | .05 | .16 | (.11 | ) | — | (.11 | ) | 10.22 | 1.55 | 80 | .56 | 1.06 | ||||||||||||||||||||||||||||||||||
| 7/31/2015 | 10.25 | .11 | (.08 | ) | .03 | (.11 | ) | — | (.11 | ) | 10.17 | .29 | 64 | .55 | 1.08 | |||||||||||||||||||||||||||||||||
| 7/31/2014 | 10.21 | .11 | .04 | .15 | (.11 | ) | — | (.11 | ) | 10.25 | 1.47 | 46 | .54 | 1.07 | ||||||||||||||||||||||||||||||||||
| 7/31/2013 | 10.32 | .13 | (.11 | ) | .02 | (.13 | ) | — | 7 | (.13 | ) | 10.21 | .19 | 37 | .56 | 1.23 | ||||||||||||||||||||||||||||||||
| 7/31/2012 | 10.23 | .14 | .09 | .23 | (.14 | ) | — | (.14 | ) | 10.32 | 2.24 | 15 | .52 | 1.33 | ||||||||||||||||||||||||||||||||||
| Class F-3: | ||||||||||||||||||||||||||||||||||||||||||||||||
| 1/31/20173,4,8 | 10.07 | — | 7 | — | 7 | — | 7 | — | 7 | — | — | 7 | 10.07 | .02 | 5 | — | 9 | — | 5,10 | .02 | 5 | |||||||||||||||||||||||||||
| Six months ended | ||||||||||||||||||||||||
| January 31, | Year ended July 31 | |||||||||||||||||||||||
| 20173,4,5 | 2016 | 2015 | 2014 | 2013 | 2012 | |||||||||||||||||||
| Portfolio turnover rate for all share classes | 16% | 21% | 38% | 20% | 22% | 14% | ||||||||||||||||||
| 1 | Based on average shares outstanding. |
| 2 | Total returns exclude any applicable sales charges, including contingent deferred sales charges. |
| 3 | Based on operations for the period shown and, accordingly, is not representative of a full year. |
| 4 | Unaudited. |
| 5 | Not annualized. |
| 6 | Annualized. |
| 7 | Amount less than $.01. |
| 8 | Class F-3 shares were offered beginning January 27, 2017. |
| 9 | Amount less than $1 million. |
| 10 | Amount less than .01%. |
See Notes to Financial Statements
| American Funds Tax-Exempt Funds | 69 |
Financial highlights (continued)
Limited Term Tax-Exempt Bond Fund of America
| (Loss) income from investment operations1 | Dividends and distributions | |||||||||||||||||||||||||||||||||||||||||||||||
| Period ended | Net asset value, beginning of period | Net investment income | Net (losses) gains on securities (both realized and unrealized) | Total from investment operations | Dividends (from net investment income) | Distributions (from capital gains) | Total dividends and distributions | Net asset value, end of period | Total return2 | Net assets, end of period (in millions) | Ratio of expenses to average net assets | Ratio of net income to average net assets | ||||||||||||||||||||||||||||||||||||
| Class A: | ||||||||||||||||||||||||||||||||||||||||||||||||
| 1/31/20173,4 | $ | 16.04 | $ | .16 | $ | (.44 | ) | $ | (.28 | ) | $ | (.16 | ) | $ | — | $ | (.16 | ) | $ | 15.60 | (1.75 | )%5 | $ | 2,989 | .59 | %6 | 2.00 | %6 | ||||||||||||||||||||
| 7/31/2016 | 15.92 | .35 | .12 | .47 | (.35 | ) | — | (.35 | ) | 16.04 | 2.97 | 3,055 | .59 | 2.17 | ||||||||||||||||||||||||||||||||||
| 7/31/2015 | 16.10 | .38 | (.18 | ) | .20 | (.38 | ) | — | (.38 | ) | 15.92 | 1.23 | 2,670 | .57 | 2.36 | |||||||||||||||||||||||||||||||||
| 7/31/2014 | 15.94 | .40 | .16 | .56 | (.40 | ) | — | (.40 | ) | 16.10 | 3.56 | 2,615 | .60 | 2.51 | ||||||||||||||||||||||||||||||||||
| 7/31/2013 | 16.36 | .40 | (.42 | ) | (.02 | ) | (.40 | ) | — | 7 | (.40 | ) | 15.94 | (.13 | ) | 2,625 | .60 | 2.45 | ||||||||||||||||||||||||||||||
| 7/31/2012 | 15.85 | .44 | .51 | .95 | (.44 | ) | — | (.44 | ) | 16.36 | 6.06 | 2,549 | .60 | 2.72 | ||||||||||||||||||||||||||||||||||
| Class B: | ||||||||||||||||||||||||||||||||||||||||||||||||
| 1/31/20173,4 | 16.04 | .10 | (.44 | ) | (.34 | ) | (.10 | ) | — | (.10 | ) | 15.60 | (2.09 | )5 | — | 8 | 1.28 | 6 | 1.29 | 6 | ||||||||||||||||||||||||||||
| 7/31/2016 | 15.92 | .24 | .12 | .36 | (.24 | ) | — | (.24 | ) | 16.04 | 2.25 | — | 8 | 1.29 | 1.50 | |||||||||||||||||||||||||||||||||
| 7/31/2015 | 16.10 | .26 | (.18 | ) | .08 | (.26 | ) | — | (.26 | ) | 15.92 | .52 | 1 | 1.28 | 1.66 | |||||||||||||||||||||||||||||||||
| 7/31/2014 | 15.94 | .29 | .16 | .45 | (.29 | ) | — | (.29 | ) | 16.10 | 2.85 | 2 | 1.29 | 1.83 | ||||||||||||||||||||||||||||||||||
| 7/31/2013 | 16.36 | .29 | (.42 | ) | (.13 | ) | (.29 | ) | — | 7 | (.29 | ) | 15.94 | (.82 | ) | 3 | 1.29 | 1.78 | ||||||||||||||||||||||||||||||
| 7/31/2012 | 15.85 | .33 | .51 | .84 | (.33 | ) | — | (.33 | ) | 16.36 | 5.33 | 6 | 1.30 | 2.04 | ||||||||||||||||||||||||||||||||||
| Class C: | ||||||||||||||||||||||||||||||||||||||||||||||||
| 1/31/20173,4 | 16.04 | .10 | (.44 | ) | (.34 | ) | (.10 | ) | — | (.10 | ) | 15.60 | (2.12 | )5 | 29 | 1.33 | 6 | 1.27 | 6 | |||||||||||||||||||||||||||||
| 7/31/2016 | 15.92 | .23 | .12 | .35 | (.23 | ) | — | (.23 | ) | 16.04 | 2.20 | 30 | 1.33 | 1.43 | ||||||||||||||||||||||||||||||||||
| 7/31/2015 | 16.10 | .26 | (.18 | ) | .08 | (.26 | ) | — | (.26 | ) | 15.92 | .47 | 30 | 1.33 | 1.60 | |||||||||||||||||||||||||||||||||
| 7/31/2014 | 15.94 | .28 | .16 | .44 | (.28 | ) | — | (.28 | ) | 16.10 | 2.80 | 38 | 1.34 | 1.78 | ||||||||||||||||||||||||||||||||||
| 7/31/2013 | 16.36 | .28 | (.42 | ) | (.14 | ) | (.28 | ) | — | 7 | (.28 | ) | 15.94 | (.87 | ) | 49 | 1.34 | 1.72 | ||||||||||||||||||||||||||||||
| 7/31/2012 | 15.85 | .32 | .51 | .83 | (.32 | ) | — | (.32 | ) | 16.36 | 5.27 | 75 | 1.34 | 1.99 | ||||||||||||||||||||||||||||||||||
| Class F-1: | ||||||||||||||||||||||||||||||||||||||||||||||||
| 1/31/20173,4 | 16.04 | .15 | (.44 | ) | (.29 | ) | (.15 | ) | — | (.15 | ) | 15.60 | (1.79 | )5 | 86 | .67 | 6 | 1.93 | 6 | |||||||||||||||||||||||||||||
| 7/31/2016 | 15.92 | .33 | .12 | .45 | (.33 | ) | — | (.33 | ) | 16.04 | 2.88 | 90 | .67 | 2.09 | ||||||||||||||||||||||||||||||||||
| 7/31/2015 | 16.10 | .36 | (.18 | ) | .18 | (.36 | ) | — | (.36 | ) | 15.92 | 1.13 | 84 | .67 | 2.27 | |||||||||||||||||||||||||||||||||
| 7/31/2014 | 15.94 | .39 | .16 | .55 | (.39 | ) | — | (.39 | ) | 16.10 | 3.49 | 105 | .67 | 2.45 | ||||||||||||||||||||||||||||||||||
| 7/31/2013 | 16.36 | .39 | (.42 | ) | (.03 | ) | (.39 | ) | — | 7 | (.39 | ) | 15.94 | (.22 | ) | 122 | .69 | 2.37 | ||||||||||||||||||||||||||||||
| 7/31/2012 | 15.85 | .43 | .51 | .94 | (.43 | ) | — | (.43 | ) | 16.36 | 6.00 | 132 | .65 | 2.67 | ||||||||||||||||||||||||||||||||||
| 70 | American Funds Tax-Exempt Funds |
Limited Term Tax-Exempt Bond Fund of America
| (Loss) income from investment operations1 | Dividends and distributions | |||||||||||||||||||||||||||||||||||||||||||||||
| Period ended | Net asset value, beginning of period | Net investment income | Net (losses) gains on securities (both realized and unrealized) | Total from investment operations | Dividends (from net investment income) | Distributions (from capital gains) | Total dividends and distributions | Net asset value, end of period | Total return2 | Net assets, end of period (in millions) | Ratio of expenses to average net assets | Ratio of net income to average net assets | ||||||||||||||||||||||||||||||||||||
| Class F-2: | ||||||||||||||||||||||||||||||||||||||||||||||||
| 1/31/20173,4 | $ | 16.04 | $ | .17 | $ | (.44 | ) | $ | (.27 | ) | $ | (.17 | ) | $ | — | $ | (.17 | ) | $ | 15.60 | (1.67 | )%5 | $ | 342 | .41 | %6 | 2.19 | %6 | ||||||||||||||||||||
| 7/31/2016 | 15.92 | .38 | .12 | .50 | (.38 | ) | — | (.38 | ) | 16.04 | 3.15 | 291 | .41 | 2.34 | ||||||||||||||||||||||||||||||||||
| 7/31/2015 | 16.10 | .40 | (.18 | ) | .22 | (.40 | ) | — | (.40 | ) | 15.92 | 1.39 | 208 | .41 | 2.52 | |||||||||||||||||||||||||||||||||
| 7/31/2014 | 15.94 | .43 | .16 | .59 | (.43 | ) | — | (.43 | ) | 16.10 | 3.75 | 183 | .42 | 2.69 | ||||||||||||||||||||||||||||||||||
| 7/31/2013 | 16.36 | .43 | (.42 | ) | .01 | (.43 | ) | — | 7 | (.43 | ) | 15.94 | .05 | 148 | .42 | 2.64 | ||||||||||||||||||||||||||||||||
| 7/31/2012 | 15.85 | .47 | .51 | .98 | (.47 | ) | — | (.47 | ) | 16.36 | 6.28 | 162 | .38 | 2.94 | ||||||||||||||||||||||||||||||||||
| Class F-3: | ||||||||||||||||||||||||||||||||||||||||||||||||
| 1/31/20173,4,9 | 15.59 | — | 7 | .01 | .01 | — | 7 | — | — | 7 | 15.60 | .09 | 5 | — | 8 | — | 5,10 | .03 | 5 | |||||||||||||||||||||||||||||
| Class R-6: | ||||||||||||||||||||||||||||||||||||||||||||||||
| 1/31/20173,4 | 16.04 | .18 | (.44 | ) | (.26 | ) | (.18 | ) | — | (.18 | ) | 15.60 | (1.61 | )5 | 290 | .30 | 6 | 2.30 | 6 | |||||||||||||||||||||||||||||
| 7/31/2016 | 15.92 | .39 | .12 | .51 | (.39 | ) | — | (.39 | ) | 16.04 | 3.26 | 284 | .30 | 2.45 | ||||||||||||||||||||||||||||||||||
| 7/31/2015 | 16.10 | .42 | (.18 | ) | .24 | (.42 | ) | — | (.42 | ) | 15.92 | 1.50 | 190 | .31 | 2.62 | |||||||||||||||||||||||||||||||||
| 7/31/2014 | 15.94 | .45 | .16 | .61 | (.45 | ) | — | (.45 | ) | 16.10 | 3.86 | 133 | .31 | 2.80 | ||||||||||||||||||||||||||||||||||
| 7/31/2013 | 16.36 | .45 | (.42 | ) | .03 | (.45 | ) | — | 7 | (.45 | ) | 15.94 | .16 | 132 | .31 | 2.72 | ||||||||||||||||||||||||||||||||
| 7/31/20123,11 | 16.32 | .10 | .05 | .15 | (.11 | ) | — | (.11 | ) | 16.36 | .90 | 5 | 43 | .07 | 5 | .64 | 5 | |||||||||||||||||||||||||||||||
| Six months ended | ||||||||||||||||||||||||
| January 31, | Year ended July 31 | |||||||||||||||||||||||
| 20173,4,5 | 2016 | 2015 | 2014 | 2013 | 2012 | |||||||||||||||||||
| Portfolio turnover rate for all share classes | 13% | 16 | % | 19 | % | 9 | % | 13 | % | 9 | % | |||||||||||||
| 1 | Based on average shares outstanding. |
| 2 | Total returns exclude any applicable sales charges, including contingent deferred sales charges. |
| 3 | Based on operations for the period shown and, accordingly, is not representative of a full year. |
| 4 | Unaudited. |
| 5 | Not annualized. |
| 6 | Annualized. |
| 7 | Amount less than $.01. |
| 8 | Amount less than $1 million. |
| 9 | Class F-3 shares were offered beginning January 27, 2017. |
| 10 | Amount less than .01%. |
| 11 | Class R-6 shares were offered beginning May 11, 2012. |
See Notes to Financial Statements
| American Funds Tax-Exempt Funds | 71 |
Financial highlights (continued)
The Tax-Exempt Bond Fund of America
| (Loss) income from investment operations1 | ||||||||||||||||||||||||||||||||||||||||
| Period ended | Net asset value, beginning of period | Net investment income | Net (losses) gains on securities (both realized and unrealized) | Total from investment operations | Dividends (from net investment income) | Net asset value, end of period | Total return2 | Net assets, end of period (in millions) | Ratio of expenses to average net assets | Ratio of net income to average net assets | ||||||||||||||||||||||||||||||
| Class A: | ||||||||||||||||||||||||||||||||||||||||
| 1/31/20173,4 | $ | 13.40 | $ | .20 | $ | (.65 | ) | $ | (.45 | ) | $ | (.20 | ) | $ | 12.75 | (3.37 | )%5 | $ | 9,279 | .53 | %6 | 3.07 | %6 | |||||||||||||||||
| 7/31/2016 | 12.96 | .41 | .44 | .85 | (.41 | ) | 13.40 | 6.69 | 9,510 | .54 | 3.15 | |||||||||||||||||||||||||||||
| 7/31/2015 | 12.92 | .42 | .04 | .46 | (.42 | ) | 12.96 | 3.62 | 7,385 | .54 | 3.28 | |||||||||||||||||||||||||||||
| 7/31/2014 | 12.44 | .45 | .48 | .93 | (.45 | ) | 12.92 | 7.60 | 6,772 | .56 | 3.57 | |||||||||||||||||||||||||||||
| 7/31/20133,7 | 13.08 | .40 | (.64 | ) | (.24 | ) | (.40 | ) | 12.44 | (1.93 | )5 | 6,984 | .55 | 6 | 3.35 | 6 | ||||||||||||||||||||||||
| 8/31/2012 | 12.26 | .47 | .82 | 1.29 | (.47 | ) | 13.08 | 10.71 | 7,445 | .55 | 3.73 | |||||||||||||||||||||||||||||
| Class B: | ||||||||||||||||||||||||||||||||||||||||
| 1/31/20173,4 | 13.40 | .15 | (.65 | ) | (.50 | ) | (.15 | ) | 12.75 | (3.71 | )5 | 1 | 1.25 | 6 | 2.34 | 6 | ||||||||||||||||||||||||
| 7/31/2016 | 12.96 | .31 | .44 | .75 | (.31 | ) | 13.40 | 5.90 | 3 | 1.28 | 2.43 | |||||||||||||||||||||||||||||
| 7/31/2015 | 12.92 | .33 | .04 | .37 | (.33 | ) | 12.96 | 2.85 | 7 | 1.28 | 2.55 | |||||||||||||||||||||||||||||
| 7/31/2014 | 12.44 | .35 | .48 | .83 | (.35 | ) | 12.92 | 6.81 | 13 | 1.30 | 2.84 | |||||||||||||||||||||||||||||
| 7/31/20133,7 | 13.08 | .31 | (.64 | ) | (.33 | ) | (.31 | ) | 12.44 | (2.59 | )5 | 20 | 1.30 | 6 | 2.61 | 6 | ||||||||||||||||||||||||
| 8/31/2012 | 12.26 | .38 | .82 | 1.20 | (.38 | ) | 13.08 | 9.90 | 30 | 1.29 | 3.01 | |||||||||||||||||||||||||||||
| Class C: | ||||||||||||||||||||||||||||||||||||||||
| 1/31/20173,4 | 13.40 | .15 | (.65 | ) | (.50 | ) | (.15 | ) | 12.75 | (3.76 | )5 | 491 | 1.32 | 6 | 2.28 | 6 | ||||||||||||||||||||||||
| 7/31/2016 | 12.96 | .31 | .44 | .75 | (.31 | ) | 13.40 | 5.85 | 517 | 1.33 | 2.35 | |||||||||||||||||||||||||||||
| 7/31/2015 | 12.92 | .32 | .04 | .36 | (.32 | ) | 12.96 | 2.80 | 349 | 1.33 | 2.50 | |||||||||||||||||||||||||||||
| 7/31/2014 | 12.44 | .35 | .48 | .83 | (.35 | ) | 12.92 | 6.75 | 325 | 1.35 | 2.79 | |||||||||||||||||||||||||||||
| 7/31/20133,7 | 13.08 | .31 | (.64 | ) | (.33 | ) | (.31 | ) | 12.44 | (2.64 | )5 | 375 | 1.34 | 6 | 2.56 | 6 | ||||||||||||||||||||||||
| 8/31/2012 | 12.26 | .37 | .82 | 1.19 | (.37 | ) | 13.08 | 9.85 | 420 | 1.34 | 2.94 | |||||||||||||||||||||||||||||
| Class F-1: | ||||||||||||||||||||||||||||||||||||||||
| 1/31/20173,4 | 13.40 | .19 | (.65 | ) | (.46 | ) | (.19 | ) | 12.75 | (3.43 | )5 | 478 | .66 | 6 | 2.95 | 6 | ||||||||||||||||||||||||
| 7/31/2016 | 12.96 | .39 | .44 | .83 | (.39 | ) | 13.40 | 6.53 | 518 | .67 | 3.04 | |||||||||||||||||||||||||||||
| 7/31/2015 | 12.92 | .41 | .04 | .45 | (.41 | ) | 12.96 | 3.49 | 1,474 | .67 | 3.16 | |||||||||||||||||||||||||||||
| 7/31/2014 | 12.44 | .43 | .48 | .91 | (.43 | ) | 12.92 | 7.46 | 1,389 | .68 | 3.46 | |||||||||||||||||||||||||||||
| 7/31/20133,7 | 13.08 | .39 | (.64 | ) | (.25 | ) | (.39 | ) | 12.44 | (2.05 | )5 | 1,659 | .68 | 6 | 3.21 | 6 | ||||||||||||||||||||||||
| 8/31/2012 | 12.26 | .46 | .82 | 1.28 | (.46 | ) | 13.08 | 10.59 | 1,526 | .66 | 3.62 | |||||||||||||||||||||||||||||
| 72 | American Funds Tax-Exempt Funds |
The Tax-Exempt Bond Fund of America
| (Loss) income from investment operations1 | ||||||||||||||||||||||||||||||||||||||||
| Period ended | Net asset value, beginning of period | Net investment income | Net (losses) gains on securities (both realized and unrealized) | Total from investment operations | Dividends (from net investment income) | Net asset value, end of period | Total return2 | Net assets, end of period (in millions) | Ratio of expenses to average net assets | Ratio of net income to average net assets | ||||||||||||||||||||||||||||||
| Class F-2: | ||||||||||||||||||||||||||||||||||||||||
| 1/31/20173,4 | $ | 13.40 | $ | .21 | $ | (.65 | ) | $ | (.44 | ) | $ | (.21 | ) | $ | 12.75 | (3.31 | )%5 | $ | 3,043 | .41 | %6 | 3.20 | %6 | |||||||||||||||||
| 7/31/2016 | 12.96 | .43 | .44 | .87 | (.43 | ) | 13.40 | 6.84 | 2,879 | .40 | 3.26 | |||||||||||||||||||||||||||||
| 7/31/2015 | 12.92 | .44 | .04 | .48 | (.44 | ) | 12.96 | 3.76 | 990 | .41 | 3.42 | |||||||||||||||||||||||||||||
| 7/31/2014 | 12.44 | .46 | .48 | .94 | (.46 | ) | 12.92 | 7.74 | 662 | .42 | 3.70 | |||||||||||||||||||||||||||||
| 7/31/20133,7 | 13.08 | .42 | (.64 | ) | (.22 | ) | (.42 | ) | 12.44 | (1.81 | )5 | 327 | .42 | 6 | 3.49 | 6 | ||||||||||||||||||||||||
| 8/31/2012 | 12.26 | .49 | .82 | 1.31 | (.49 | ) | 13.08 | 10.88 | 239 | .40 | 3.87 | |||||||||||||||||||||||||||||
| Class F-3: | ||||||||||||||||||||||||||||||||||||||||
| 1/31/20173,4,8 | 12.75 | — | 9 | — | 9 | — | 9 | — | 9 | 12.75 | .04 | 5 | — | 5,10 | — | 5,11 | .04 | 5 | ||||||||||||||||||||||
| Class R-6: | ||||||||||||||||||||||||||||||||||||||||
| 1/31/20173,4 | 13.40 | .22 | (.65 | ) | (.43 | ) | (.22 | ) | 12.75 | (3.25 | )5 | 433 | .29 | 6 | 3.32 | 6 | ||||||||||||||||||||||||
| 7/31/2016 | 12.96 | .44 | .44 | .88 | (.44 | ) | 13.40 | 6.95 | 391 | .29 | 3.39 | |||||||||||||||||||||||||||||
| 7/31/2015 | 12.92 | .46 | .04 | .50 | (.46 | ) | 12.96 | 3.86 | 270 | .30 | 3.52 | |||||||||||||||||||||||||||||
| 7/31/2014 | 12.44 | .48 | .48 | .96 | (.48 | ) | 12.92 | 7.86 | 165 | .31 | 3.81 | |||||||||||||||||||||||||||||
| 7/31/20133,7 | 13.08 | .43 | (.64 | ) | (.21 | ) | (.43 | ) | 12.44 | (1.71 | )5 | 115 | .31 | 6 | 3.58 | 6 | ||||||||||||||||||||||||
| 8/31/20123,12 | 12.94 | .14 | .15 | .29 | (.15 | ) | 13.08 | 2.25 | 5 | 42 | .09 | 5 | 1.15 | 5 | ||||||||||||||||||||||||||
| Six months ended | Year ended | For the period | Year ended | |||||||||||||||||||||
| January 31 | July 31 | 9/1/2012 to | August 31 | |||||||||||||||||||||
| 20173,4,5 | 2016 | 2015 | 2014 | 7/31/20133,5,7 | 2012 | |||||||||||||||||||
| Portfolio turnover rate for all share classes | 9 | % | 13 | % | 14 | % | 10 | % | 16 | % | 14 | % | ||||||||||||
| 1 | Based on average shares outstanding. |
| 2 | Total returns exclude any applicable sales charges, including contingent deferred sales charges. |
| 3 | Based on operations for the period shown and, accordingly, is not representative of a full year. |
| 4 | Unaudited. |
| 5 | Not annualized. |
| 6 | Annualized. |
| 7 | In 2013, the fund changed its fiscal year-end from August to July. |
| 8 | Class F-3 shares were offered beginning January 27, 2017. |
| 9 | Amount less than $.01. |
| 10 | Amount less than $1 million. |
| 11 | Amount less than .01%. |
| 12 | Class R-6 shares were offered beginning May 11, 2012. |
See Notes to Financial Statements
| American Funds Tax-Exempt Funds | 73 |
Financial highlights (continued)
American High-Income Municipal Bond Fund
| (Loss) income from investment operations1 | ||||||||||||||||||||||||||||||||||||||||
| Net (losses) | ||||||||||||||||||||||||||||||||||||||||
| Net asset | gains on | Dividends | Net asset | Ratio of | Ratio of | |||||||||||||||||||||||||||||||||||
| value, | Net | securities (both | Total from | (from net | value, | Net assets, | expenses | net income | ||||||||||||||||||||||||||||||||
| beginning | investment | realized and | investment | investment | end | Total | end of period | to average | to average | |||||||||||||||||||||||||||||||
| Period ended | of period | income | unrealized) | operations | income) | of period | return2 | (in millions) | net assets | net assets | ||||||||||||||||||||||||||||||
| Class A: | ||||||||||||||||||||||||||||||||||||||||
| 1/31/20173,4 | $ | 16.21 | $ | .30 | $ | (.91 | ) | $ | (.61 | ) | $ | (.29 | ) | $ | 15.31 | (3.77 | )%5 | $ | 3,381 | .70 | %6 | 3.82 | %6 | |||||||||||||||||
| 7/31/2016 | 15.40 | .63 | .79 | 1.42 | (.61 | ) | 16.21 | 9.45 | 3,519 | .67 | 4.02 | |||||||||||||||||||||||||||||
| 7/31/2015 | 15.22 | .64 | .17 | .81 | (.63 | ) | 15.40 | 5.34 | 2,700 | .68 | 4.13 | |||||||||||||||||||||||||||||
| 7/31/2014 | 14.48 | .68 | .73 | 1.41 | (.67 | ) | 15.22 | 9.99 | 2,357 | .68 | 4.59 | |||||||||||||||||||||||||||||
| 7/31/2013 | 15.13 | .63 | (.65 | ) | (.02 | ) | (.63 | ) | 14.48 | (.25 | ) | 2,246 | .69 | 4.14 | ||||||||||||||||||||||||||
| 7/31/2012 | 13.78 | .66 | 1.35 | 2.01 | (.66 | ) | 15.13 | 14.98 | 2,286 | .68 | 4.64 | |||||||||||||||||||||||||||||
| Class B: | ||||||||||||||||||||||||||||||||||||||||
| 1/31/20173,4 | 16.21 | .25 | (.91 | ) | (.66 | ) | (.24 | ) | 15.31 | (4.10 | )5 | — | 7 | 1.39 | 6 | 3.10 | 6 | |||||||||||||||||||||||
| 7/31/2016 | 15.40 | .52 | .79 | 1.31 | (.50 | ) | 16.21 | 8.67 | 1 | 1.38 | 3.36 | |||||||||||||||||||||||||||||
| 7/31/2015 | 15.22 | .53 | .17 | .70 | (.52 | ) | 15.40 | 4.60 | 4 | 1.39 | 3.43 | |||||||||||||||||||||||||||||
| 7/31/2014 | 14.48 | .57 | .73 | 1.30 | (.56 | ) | 15.22 | 9.17 | 6 | 1.44 | 3.87 | |||||||||||||||||||||||||||||
| 7/31/2013 | 15.13 | .52 | (.65 | ) | (.13 | ) | (.52 | ) | 14.48 | (.97 | ) | 10 | 1.42 | 3.42 | ||||||||||||||||||||||||||
| 7/31/2012 | 13.78 | .56 | 1.35 | 1.91 | (.56 | ) | 15.13 | 14.14 | 16 | 1.42 | 3.96 | |||||||||||||||||||||||||||||
| Class C: | ||||||||||||||||||||||||||||||||||||||||
| 1/31/20173,4 | 16.21 | .24 | (.91 | ) | (.67 | ) | (.23 | ) | 15.31 | (4.13 | )5 | 229 | 1.45 | 6 | 3.07 | 6 | ||||||||||||||||||||||||
| 7/31/2016 | 15.40 | .52 | .79 | 1.31 | (.50 | ) | 16.21 | 8.62 | 247 | 1.43 | 3.26 | |||||||||||||||||||||||||||||
| 7/31/2015 | 15.22 | .52 | .17 | .69 | (.51 | ) | 15.40 | 4.55 | 182 | 1.44 | 3.37 | |||||||||||||||||||||||||||||
| 7/31/2014 | 14.48 | .56 | .73 | 1.29 | (.55 | ) | 15.22 | 9.12 | 161 | 1.48 | 3.80 | |||||||||||||||||||||||||||||
| 7/31/2013 | 15.13 | .52 | (.65 | ) | (.13 | ) | (.52 | ) | 14.48 | (1.02 | ) | 161 | 1.46 | 3.37 | ||||||||||||||||||||||||||
| 7/31/2012 | 13.78 | .55 | 1.35 | 1.90 | (.55 | ) | 15.13 | 14.09 | 170 | 1.46 | 3.86 | |||||||||||||||||||||||||||||
| Class F-1: | ||||||||||||||||||||||||||||||||||||||||
| 1/31/20173,4 | 16.21 | .30 | (.91 | ) | (.61 | ) | (.29 | ) | 15.31 | (3.80 | )5 | 219 | .77 | 6 | 3.74 | 6 | ||||||||||||||||||||||||
| 7/31/2016 | 15.40 | .62 | .79 | 1.41 | (.60 | ) | 16.21 | 9.37 | 282 | .74 | 3.95 | |||||||||||||||||||||||||||||
| 7/31/2015 | 15.22 | .62 | .17 | .79 | (.61 | ) | 15.40 | 5.27 | 207 | .75 | 4.06 | |||||||||||||||||||||||||||||
| 7/31/2014 | 14.48 | .66 | .73 | 1.39 | (.65 | ) | 15.22 | 9.87 | 178 | .79 | 4.49 | |||||||||||||||||||||||||||||
| 7/31/2013 | 15.13 | .62 | (.65 | ) | (.03 | ) | (.62 | ) | 14.48 | (.35 | ) | 172 | .79 | 4.04 | ||||||||||||||||||||||||||
| 7/31/2012 | 13.78 | .65 | 1.35 | 2.00 | (.65 | ) | 15.13 | 14.89 | 191 | .76 | 4.56 | |||||||||||||||||||||||||||||
| 74 | American Funds Tax-Exempt Funds |
American High-Income Municipal Bond Fund
| (Loss) income from investment operations1 | ||||||||||||||||||||||||||||||||||||||||
| Net (losses) | ||||||||||||||||||||||||||||||||||||||||
| Net asset | gains on | Dividends | Net asset | Ratio of | Ratio of | |||||||||||||||||||||||||||||||||||
| value, | Net | securities (both | Total from | (from net | value, | Net assets, | expenses | net income | ||||||||||||||||||||||||||||||||
| beginning | investment | realized and | investment | investment | end | Total | end of period | to average | to average | |||||||||||||||||||||||||||||||
| Period ended | of period | income | unrealized) | operations | income) | of period | return2 | (in millions) | net assets | net assets | ||||||||||||||||||||||||||||||
| Class F-2: | ||||||||||||||||||||||||||||||||||||||||
| 1/31/20173,4 | $ | 16.21 | $ | .32 | $ | (.91 | ) | $ | (.59 | ) | $ | (.31 | ) | $ | 15.31 | (3.68 | )%5 | $ | 811 | .51 | %6 | 4.01 | %6 | |||||||||||||||||
| 7/31/2016 | 15.40 | .66 | .79 | 1.45 | (.64 | ) | 16.21 | 9.65 | 775 | .48 | 4.18 | |||||||||||||||||||||||||||||
| 7/31/2015 | 15.22 | .66 | .17 | .83 | (.65 | ) | 15.40 | 5.53 | 321 | .49 | 4.32 | |||||||||||||||||||||||||||||
| 7/31/2014 | 14.48 | .70 | .73 | 1.43 | (.69 | ) | 15.22 | 10.15 | 223 | .53 | 4.71 | |||||||||||||||||||||||||||||
| 7/31/2013 | 15.13 | .66 | (.65 | ) | .01 | (.66 | ) | 14.48 | (.09 | ) | 126 | .52 | 4.31 | |||||||||||||||||||||||||||
| 7/31/2012 | 13.78 | .69 | 1.35 | 2.04 | (.69 | ) | 15.13 | 15.20 | 87 | .49 | 4.81 | |||||||||||||||||||||||||||||
| Class F-3: | ||||||||||||||||||||||||||||||||||||||||
| 1/31/20173,4,8 | 15.30 | .01 | .01 | .02 | (.01 | ) | 15.31 | .12 | 5 | — | 7 | — | 5 | .05 | 5 | |||||||||||||||||||||||||
| Class R-6: | ||||||||||||||||||||||||||||||||||||||||
| 1/31/20173,4 | 16.21 | .33 | (.91 | ) | (.58 | ) | (.32 | ) | 15.31 | (3.62 | )5 | 310 | .40 | 6 | 4.13 | 6 | ||||||||||||||||||||||||
| 7/31/2016 | 15.40 | .68 | .79 | 1.47 | (.66 | ) | 16.21 | 9.76 | 269 | .38 | 4.31 | |||||||||||||||||||||||||||||
| 7/31/2015 | 15.22 | .68 | .17 | .85 | (.67 | ) | 15.40 | 5.64 | 188 | .39 | 4.42 | |||||||||||||||||||||||||||||
| 7/31/2014 | 14.48 | .72 | .73 | 1.45 | (.71 | ) | 15.22 | 10.27 | 108 | .42 | 4.82 | |||||||||||||||||||||||||||||
| 7/31/2013 | 15.13 | .68 | (.65 | ) | .03 | (.68 | ) | 14.48 | .02 | 58 | .40 | 4.44 | ||||||||||||||||||||||||||||
| 7/31/20123,9 | 14.86 | .14 | .28 | .42 | (.15 | ) | 15.13 | 2.85 | 5 | 13 | .08 | 5 | 1.00 | 5 | ||||||||||||||||||||||||||
| Six months ended | ||||||||||||||||||||||||
| January 31, | Year ended July 31 | |||||||||||||||||||||||
| 20173,4,5 | 2016 | 2015 | 2014 | 2013 | 2012 | |||||||||||||||||||
| Portfolio turnover rate for all share classes | 17% | 21% | 23% | 24% | 25% | 20% | ||||||||||||||||||
| 1 | Based on average shares outstanding. |
| 2 | Total returns exclude any applicable sales charges, including contingent deferred sales charges. |
| 3 | Based on operations for the period shown and, accordingly, is not representative of a full year. |
| 4 | Unaudited. |
| 5 | Not annualized. |
| 6 | Annualized. |
| 7 | Amount less than $1 million. |
| 8 | Class F-3 shares were offered beginning January 27, 2017. |
| 9 | Class R-6 shares were offered beginning May 11, 2012. |
See Notes to Financial Statements
| American Funds Tax-Exempt Funds | 75 |
Financial highlights (continued)
The Tax-Exempt Fund of California
| (Loss) income from investment operations1 | ||||||||||||||||||||||||||||||||||||||||
| Net (losses) | ||||||||||||||||||||||||||||||||||||||||
| Net asset | gains on | Dividends | Net asset | Ratio of | Ratio of | |||||||||||||||||||||||||||||||||||
| value, | Net | securities (both | Total from | (from net | value, | Net assets, | expenses | net income | ||||||||||||||||||||||||||||||||
| beginning | investment | realized and | investment | investment | end | Total | end of period | to average | to average | |||||||||||||||||||||||||||||||
| Period ended | of period | income | unrealized) | operations | income) | of period | return2 | (in millions) | net assets | net assets | ||||||||||||||||||||||||||||||
| Class A: | ||||||||||||||||||||||||||||||||||||||||
| 1/31/20173,4 | $ | 18.21 | $ | .27 | $ | (.93 | ) | $ | (.66 | ) | $ | (.27 | ) | $ | 17.28 | (3.66 | )%5 | $ | 1,586 | .59 | %6 | 3.04 | %6 | |||||||||||||||||
| 7/31/2016 | 17.62 | .57 | .58 | 1.15 | (.56 | ) | 18.21 | 6.65 | 1,678 | .60 | 3.17 | |||||||||||||||||||||||||||||
| 7/31/2015 | 17.52 | .60 | .09 | .69 | (.59 | ) | 17.62 | 3.98 | 1,386 | .62 | 3.38 | |||||||||||||||||||||||||||||
| 7/31/2014 | 16.72 | .63 | .80 | 1.43 | (.63 | ) | 17.52 | 8.72 | 1,265 | .63 | 3.72 | |||||||||||||||||||||||||||||
| 7/31/20133,7 | 17.54 | .59 | (.82 | ) | (.23 | ) | (.59 | ) | 16.72 | (1.45 | )5 | 1,250 | .63 | 6 | 3.64 | 6 | ||||||||||||||||||||||||
| 8/31/2012 | 16.32 | .66 | 1.22 | 1.88 | (.66 | ) | 17.54 | 11.70 | 1,334 | .63 | 3.89 | |||||||||||||||||||||||||||||
| Class B: | ||||||||||||||||||||||||||||||||||||||||
| 1/31/20173,4 | 18.21 | .21 | (.94 | ) | (.73 | ) | (.20 | ) | 17.28 | (4.00 | )5 | — | 8 | 1.31 | 6 | 2.31 | 6 | |||||||||||||||||||||||
| 7/31/2016 | 17.62 | .44 | .58 | 1.02 | (.43 | ) | 18.21 | 5.88 | — | 8 | 1.34 | 2.51 | ||||||||||||||||||||||||||||
| 7/31/2015 | 17.52 | .47 | .09 | .56 | (.46 | ) | 17.62 | 3.22 | 1 | 1.35 | 2.65 | |||||||||||||||||||||||||||||
| 7/31/2014 | 16.72 | .51 | .79 | 1.30 | (.50 | ) | 17.52 | 7.93 | 2 | 1.38 | 3.00 | |||||||||||||||||||||||||||||
| 7/31/20133,7 | 17.54 | .47 | (.82 | ) | (.35 | ) | (.47 | ) | 16.72 | (2.12 | )5 | 3 | 1.37 | 6 | 2.90 | 6 | ||||||||||||||||||||||||
| 8/31/2012 | 16.32 | .53 | 1.22 | 1.75 | (.53 | ) | 17.54 | 10.89 | 5 | 1.37 | 3.17 | |||||||||||||||||||||||||||||
| Class C: | ||||||||||||||||||||||||||||||||||||||||
| 1/31/20173,4 | 18.21 | .20 | (.93 | ) | (.73 | ) | (.20 | ) | 17.28 | (4.04 | )5 | 89 | 1.38 | 6 | 2.25 | 6 | ||||||||||||||||||||||||
| 7/31/2016 | 17.62 | .43 | .58 | 1.01 | (.42 | ) | 18.21 | 5.82 | 97 | 1.39 | 2.38 | |||||||||||||||||||||||||||||
| 7/31/2015 | 17.52 | .46 | .09 | .55 | (.45 | ) | 17.62 | 3.16 | 78 | 1.40 | 2.59 | |||||||||||||||||||||||||||||
| 7/31/2014 | 16.72 | .50 | .80 | 1.30 | (.50 | ) | 17.52 | 7.87 | 76 | 1.42 | 2.94 | |||||||||||||||||||||||||||||
| 7/31/20133,7 | 17.54 | .46 | (.82 | ) | (.36 | ) | (.46 | ) | 16.72 | (2.16 | )5 | 87 | 1.42 | 6 | 2.85 | 6 | ||||||||||||||||||||||||
| 8/31/2012 | 16.32 | .52 | 1.22 | 1.74 | (.52 | ) | 17.54 | 10.83 | 101 | 1.42 | 3.10 | |||||||||||||||||||||||||||||
| Class F-1: | ||||||||||||||||||||||||||||||||||||||||
| 1/31/20173,4 | 18.21 | .26 | (.93 | ) | (.67 | ) | (.26 | ) | 17.28 | (3.72 | )5 | 75 | .72 | 6 | 2.91 | 6 | ||||||||||||||||||||||||
| 7/31/2016 | 17.62 | .55 | .58 | 1.13 | (.54 | ) | 18.21 | 6.52 | 83 | .73 | 3.04 | |||||||||||||||||||||||||||||
| 7/31/2015 | 17.52 | .58 | .09 | .67 | (.57 | ) | 17.62 | 3.85 | 63 | .74 | 3.26 | |||||||||||||||||||||||||||||
| 7/31/2014 | 16.72 | .61 | .80 | 1.41 | (.61 | ) | 17.52 | 8.59 | 65 | .76 | 3.60 | |||||||||||||||||||||||||||||
| 7/31/20133,7 | 17.54 | .56 | (.82 | ) | (.26 | ) | (.56 | ) | 16.72 | (1.58 | )5 | 74 | .77 | 6 | 3.50 | 6 | ||||||||||||||||||||||||
| 8/31/2012 | 16.32 | .64 | 1.22 | 1.86 | (.64 | ) | 17.54 | 11.59 | 82 | .73 | 3.79 | |||||||||||||||||||||||||||||
| 76 | American Funds Tax-Exempt Funds |
The Tax-Exempt Fund of California
| (Loss) income from investment operations1 | ||||||||||||||||||||||||||||||||||||||||
| Net (losses) | ||||||||||||||||||||||||||||||||||||||||
| Net asset | gains on | Dividends | Net asset | Ratio of | Ratio of | |||||||||||||||||||||||||||||||||||
| value, | Net | securities (both | Total from | (from net | value, | Net assets, | expenses | net income | ||||||||||||||||||||||||||||||||
| beginning | investment | realized and | investment | investment | end | Total | end of period | to average | to average | |||||||||||||||||||||||||||||||
| Period ended | of period | income | unrealized) | operations | income) | of period | return2 | (in millions) | net assets | net assets | ||||||||||||||||||||||||||||||
| Class F-2: | ||||||||||||||||||||||||||||||||||||||||
| 1/31/20173,4 | $ | 18.21 | $ | .28 | $ | (.93 | ) | $ | (.65 | ) | $ | (.28 | ) | $ | 17.28 | (3.59 | )%5 | $ | 253 | .47 | %6 | 3.17 | %6 | |||||||||||||||||
| 7/31/2016 | 17.62 | .60 | .58 | 1.18 | (.59 | ) | 18.21 | 6.79 | 213 | .48 | 3.29 | |||||||||||||||||||||||||||||
| 7/31/2015 | 17.52 | .62 | .09 | .71 | (.61 | ) | 17.62 | 4.10 | 134 | .49 | 3.51 | |||||||||||||||||||||||||||||
| 7/31/2014 | 16.72 | .65 | .80 | 1.45 | (.65 | ) | 17.52 | 8.85 | 110 | .51 | 3.84 | |||||||||||||||||||||||||||||
| 7/31/20133,7 | 17.54 | .60 | (.82 | ) | (.22 | ) | (.60 | ) | 16.72 | (1.35 | )5 | 91 | .51 | 6 | 3.77 | 6 | ||||||||||||||||||||||||
| 8/31/2012 | 16.32 | .68 | 1.22 | 1.90 | (.68 | ) | 17.54 | 11.87 | 74 | .48 | 4.02 | |||||||||||||||||||||||||||||
| Class F-3: | ||||||||||||||||||||||||||||||||||||||||
| 1/31/20173,4,9 | 17.27 | .01 | .01 | .02 | (.01 | ) | 17.28 | .10 | 5 | — | 8 | — | 5,10 | .04 | 5 | |||||||||||||||||||||||||
| Six months ended | Year ended | For the period | Year ended | |||||||||||||||||||||
| January 31 | July 31 | 9/1/2012 to | August 31 | |||||||||||||||||||||
| 20173,4,5 | 2016 | 2015 | 2014 | 7/31/20133,5,7 | 2012 | |||||||||||||||||||
| Portfolio turnover rate for all share classes | 11% | 11% | 17% | 8% | 12% | 15% | ||||||||||||||||||
| 1 | Based on average shares outstanding. |
| 2 | Total returns exclude any applicable sales charges, including contingent deferred sales charges. |
| 3 | Based on operations for the period shown and, accordingly, is not representative of a full year. |
| 4 | Unaudited. |
| 5 | Not annualized. |
| 6 | Annualized. |
| 7 | In 2013, the fund changed its fiscal year-end from August to July. |
| 8 | Amount less than $1 million. |
| 9 | Class F-3 shares were offered beginning January 27, 2017. |
| 10 | Amount less than .01%. |
See Notes to Financial Statements
| American Funds Tax-Exempt Funds | 77 |
Financial highlights (continued)
American Funds Tax-Exempt Fund of New York
| (Loss) income from investment operations1 | ||||||||||||||||||||||||||||||||||||||||||||
| Net (losses) | Ratio of | Ratio of | ||||||||||||||||||||||||||||||||||||||||||
| Net asset | gains on | Dividends | Net asset | expenses to | expenses to | Ratio of | ||||||||||||||||||||||||||||||||||||||
| value, | Net | securities (both | Total from | (from net | value, | Net assets, | average net | average net | net income | |||||||||||||||||||||||||||||||||||
| beginning | investment | realized and | investment | investment | end | Total | end of year | assets before | assets after | to average | ||||||||||||||||||||||||||||||||||
| Period ended | of year | income | unrealized) | operations | income) | of year | return2,3 | (in millions) | reimbursements | reimbursements3 | net assets3 | |||||||||||||||||||||||||||||||||
| Class A: | ||||||||||||||||||||||||||||||||||||||||||||
| 1/31/20174,5 | $ | 11.12 | $ | .14 | $ | (.53 | ) | $ | (.39 | ) | $ | (.14 | ) | $ | 10.59 | (3.55 | )%6,7 | $ | 156 | .69 | %7,8 | .69 | %7,8 | 2.55 | %7,8 | |||||||||||||||||||
| 7/31/2016 | 10.66 | .28 | .45 | .73 | (.27 | ) | 11.12 | 6.95 | 7 | 161 | .72 | 7 | .69 | 7 | 2.54 | 7 | ||||||||||||||||||||||||||||
| 7/31/2015 | 10.58 | .32 | .07 | .39 | (.31 | ) | 10.66 | 3.65 | 7 | 124 | .72 | 7 | .67 | 7 | 2.91 | 7 | ||||||||||||||||||||||||||||
| 7/31/2014 | 10.21 | .31 | .37 | .68 | (.31 | ) | 10.58 | 6.83 | 7 | 102 | .73 | 7 | .63 | 7 | 3.07 | 7 | ||||||||||||||||||||||||||||
| 7/31/2013 | 10.85 | .31 | (.64 | ) | (.33 | ) | (.31 | ) | 10.21 | (3.16 | )7 | 100 | .66 | 7 | .59 | 7 | 2.88 | 7 | ||||||||||||||||||||||||||
| 7/31/2012 | 9.98 | .32 | .87 | 1.19 | (.32 | ) | 10.85 | 12.11 | 7 | 106 | .76 | 7 | .63 | 7 | 3.06 | 7 | ||||||||||||||||||||||||||||
| Class B: | ||||||||||||||||||||||||||||||||||||||||||||
| 1/31/20174,5 | 11.12 | .14 | (.53 | ) | (.39 | ) | (.14 | ) | 10.59 | (3.48 | )6,7 | — | 9 | .56 | 7,8 | .56 | 7,8 | 2.68 | 7,8 | |||||||||||||||||||||||||
| 7/31/2016 | 10.66 | .25 | .45 | .70 | (.24 | ) | 11.12 | 6.64 | 7 | — | 9 | 1.06 | 7 | 1.03 | 7 | 2.24 | 7 | |||||||||||||||||||||||||||
| 7/31/2015 | 10.58 | .23 | .07 | .30 | (.22 | ) | 10.66 | 2.87 | 7 | — | 9 | 1.49 | 7 | 1.43 | 7 | 2.15 | 7 | |||||||||||||||||||||||||||
| 7/31/2014 | 10.21 | .23 | .37 | .60 | (.23 | ) | 10.58 | 5.98 | 7 | — | 9 | 1.51 | 7 | 1.44 | 7 | 2.29 | 7 | |||||||||||||||||||||||||||
| 7/31/2013 | 10.85 | .22 | (.64 | ) | (.42 | ) | (.22 | ) | 10.21 | (4.00 | )7 | — | 9 | 1.53 | 7 | 1.46 | 7 | 1.99 | 7 | |||||||||||||||||||||||||
| 7/31/2012 | 9.98 | .23 | .87 | 1.10 | (.23 | ) | 10.85 | 11.18 | 7 | — | 9 | 1.59 | 7 | 1.45 | 7 | 2.24 | 7 | |||||||||||||||||||||||||||
| Class C: | ||||||||||||||||||||||||||||||||||||||||||||
| 1/31/20174,5 | 11.12 | .09 | (.53 | ) | (.44 | ) | (.09 | ) | 10.59 | (3.94 | )6 | 13 | 1.48 | 8 | 1.48 | 8 | 1.76 | 8 | ||||||||||||||||||||||||||
| 7/31/2016 | 10.66 | .20 | .45 | .65 | (.19 | ) | 11.12 | 6.11 | 14 | 1.51 | 1.48 | 1.75 | ||||||||||||||||||||||||||||||||
| 7/31/2015 | 10.58 | .23 | .07 | .30 | (.22 | ) | 10.66 | 2.79 | 10 | 1.56 | 1.50 | 2.07 | ||||||||||||||||||||||||||||||||
| 7/31/2014 | 10.21 | .22 | .37 | .59 | (.22 | ) | 10.58 | 5.89 | 8 | 1.60 | 1.51 | 2.19 | ||||||||||||||||||||||||||||||||
| 7/31/2013 | 10.85 | .21 | (.64 | ) | (.43 | ) | (.21 | ) | 10.21 | (4.04 | ) | 8 | 1.58 | 1.50 | 1.96 | |||||||||||||||||||||||||||||
| 7/31/2012 | 9.98 | .23 | .87 | 1.10 | (.23 | ) | 10.85 | 11.12 | 7 | 1.62 | 1.50 | 2.17 | ||||||||||||||||||||||||||||||||
| Class F-1: | ||||||||||||||||||||||||||||||||||||||||||||
| 1/31/20174,5 | 11.12 | .14 | (.53 | ) | (.39 | ) | (.14 | ) | 10.59 | (3.55 | )6,7 | 2 | .67 | 7,8 | .67 | 7,8 | 2.57 | 7,8 | ||||||||||||||||||||||||||
| 7/31/2016 | 10.66 | .29 | .45 | .74 | (.28 | ) | 11.12 | 7.02 | 7 | 2 | .65 | 7 | .62 | 7 | 2.61 | 7 | ||||||||||||||||||||||||||||
| 7/31/2015 | 10.58 | .31 | .07 | .38 | (.30 | ) | 10.66 | 3.58 | 7 | 2 | .80 | 7 | .74 | 7 | 2.83 | 7 | ||||||||||||||||||||||||||||
| 7/31/2014 | 10.21 | .31 | .37 | .68 | (.31 | ) | 10.58 | 6.77 | 7 | 1 | .77 | 7 | .68 | 7 | 3.03 | 7 | ||||||||||||||||||||||||||||
| 7/31/2013 | 10.85 | .29 | (.64 | ) | (.35 | ) | (.29 | ) | 10.21 | (3.36 | )7 | 1 | .86 | 7 | .79 | 7 | 2.67 | 7 | ||||||||||||||||||||||||||
| 7/31/2012 | 9.98 | .31 | .87 | 1.18 | (.31 | ) | 10.85 | 11.95 | 7 | 2 | .86 | 7 | .74 | 7 | 2.94 | 7 | ||||||||||||||||||||||||||||
| 78 | American Funds Tax-Exempt Funds |
American Funds Tax-Exempt Fund of New York
| (Loss) income from investment operations1 | ||||||||||||||||||||||||||||||||||||||||||||
| Net (losses) | Ratio of | Ratio of | ||||||||||||||||||||||||||||||||||||||||||
| Net asset | gains on | Dividends | Net asset | expenses to | expenses to | Ratio of | ||||||||||||||||||||||||||||||||||||||
| value, | Net | securities (both | Total from | (from net | value, | Net assets, | average net | average net | net income | |||||||||||||||||||||||||||||||||||
| beginning | investment | realized and | investment | investment | end | Total | end of year | assets before | assets after | to average | ||||||||||||||||||||||||||||||||||
| Period ended | of year | income | unrealized) | operations | income) | of year | return2,3 | (in millions) | reimbursements | reimbursements3 | net assets3 | |||||||||||||||||||||||||||||||||
| Class F-2: | ||||||||||||||||||||||||||||||||||||||||||||
| 1/31/20174,5 | $ | 11.12 | $ | .14 | $ | (.53 | ) | $ | (.39 | ) | $ | (.14 | ) | $ | 10.59 | (3.49 | )%6 | $ | 27 | .56 | %8 | .56 | %8 | 2.68 | %8 | |||||||||||||||||||
| 7/31/2016 | 10.66 | .30 | .45 | .75 | (.29 | ) | 11.12 | 7.10 | 31 | .58 | .55 | 2.68 | ||||||||||||||||||||||||||||||||
| 7/31/2015 | 10.58 | .33 | .07 | .40 | (.32 | ) | 10.66 | 3.77 | 20 | .61 | .56 | 3.02 | ||||||||||||||||||||||||||||||||
| 7/31/2014 | 10.21 | .32 | .37 | .69 | (.32 | ) | 10.58 | 6.89 | 16 | .66 | .57 | 3.13 | ||||||||||||||||||||||||||||||||
| 7/31/2013 | 10.85 | .31 | (.64 | ) | (.33 | ) | (.31 | ) | 10.21 | (3.14 | ) | 14 | .64 | .57 | 2.90 | |||||||||||||||||||||||||||||
| 7/31/2012 | 9.98 | .33 | .87 | 1.20 | (.33 | ) | 10.85 | 12.21 | 13 | .63 | .53 | 3.13 | ||||||||||||||||||||||||||||||||
| Class F-3: | ||||||||||||||||||||||||||||||||||||||||||||
| 1/31/20174,5,10 | 10.58 | — | 11 | .01 | .01 | — | 11 | 10.59 | .13 | 6 | — | 9 | — | 6,12 | — | 6,12 | .03 | 6 | ||||||||||||||||||||||||||
| Six months ended | ||||||||||||||||||||||||
| January 31, | Year ended July 31 | |||||||||||||||||||||||
| 20174,5,6 | 2016 | 2015 | 2014 | 2013 | 2012 | |||||||||||||||||||
| Portfolio turnover rate for all share classes | 13 | % | 14 | % | 42 | % | 25 | % | 23 | % | 15 | % | ||||||||||||
| 1 | Based on average shares outstanding. |
| 2 | Total returns exclude any applicable sales charges, including contingent deferred sales charges. |
| 3 | This column reflects the impact, if any, of certain reimbursements from CRMC. During some of the periods shown, CRMC reimbursed a portion of miscellaneous fees and expenses. |
| 4 | Based on operations for the period shown and, accordingly, is not representative of a full year. |
| 5 | Unaudited. |
| 6 | Not annualized. |
| 7 | All or a significant portion of assets in this class consisted of seed capital invested by CRMC and/or its affiliates. Fees for distribution services are not charged or accrued on these seed capital assets. If such fees were paid by the fund on seed capital assets, fund expenses would have been higher and net income and total return would have been lower. |
| 8 | Annualized. |
| 9 | Amount less than $1 million. |
| 10 | Class F-3 shares were offered beginning January 27, 2017. |
| 11 | Amount less than $.01. |
| 12 | Amount less than .01%. |
See Notes to Financial Statements
| American Funds Tax-Exempt Funds | 79 |
| Expense example | unaudited |
As a fund shareholder, you incur two types of costs: (1) transaction costs, such as initial sales charges on purchase payments and contingent deferred sales charges on redemptions (loads), and (2) ongoing costs, including management fees, distribution and service (12b-1) fees, and other expenses. This example is intended to help you understand your ongoing costs (in dollars) of investing in the fund so you can compare these costs with the ongoing costs of investing in other mutual funds. The example is based on an investment of $1,000 invested at the beginning of the period and held for the entire six-month period (August 1, 2016, through January 31, 2017).
Actual expenses:
The first line of each share class in the table on the following pages provides information about actual account values and actual expenses. You may use the information in this line, together with the amount you invested, to estimate the expenses that you paid over the period. Simply divide your account value by $1,000 (for example, an $8,600 account value divided by $1,000 = 8.6), then multiply the result by the number in the first line under the heading titled “Expenses paid during period” to estimate the expenses you paid on your account during this period.
Hypothetical example for comparison purposes:
The second line of each share class in the table on the following pages provides information about hypothetical account values and hypothetical expenses based on the actual expense ratio for the share class and an assumed rate of return of 5.00% per year before expenses, which is not the actual return of the share class. The hypothetical account values and expenses may not be used to estimate the actual ending account balance or expenses you paid for the period. You may use this information to compare the ongoing costs of investing in the fund and other funds. To do so, compare this 5.00% hypothetical example with the 5.00% hypothetical examples that appear in the shareholder reports of the other funds.
Notes:
Classes F-1, F-2 and F-3 shareholders may be subject to fees charged by financial intermediaries, typically ranging from 0.75% to 1.50% of assets annually depending on services offered. You can estimate the impact of these fees by adding the amount of the fees to the total estimated expenses you paid on your account during the period as calculated above. In addition, your ending account value would be lower by the amount of these fees.
Note that the expenses shown in the table on the following pages are meant to highlight your ongoing costs only and do not reflect any transactional costs, such as sales charges (loads). Therefore, the second line of each share class in the table is useful in comparing ongoing costs only and will not help you determine the relative total costs of owning different funds. In addition, if these transactional costs were included, your costs would have been higher.
| 80 | American Funds Tax-Exempt Funds |
American Funds Short-Term Tax-Exempt Bond Fund
| Beginning | Ending | |||||||||||||||
| account value | account value | Expenses paid | Annualized | |||||||||||||
| 8/1/2016 | 1/31/2017 | during period* | expense ratio | |||||||||||||
| Class A – actual return | $ | 1,000.00 | $ | 990.79 | $ | 2.91 | .58 | % | ||||||||
| Class A – assumed 5% return | 1,000.00 | 1,022.28 | 2.96 | .58 | ||||||||||||
| Class F-1 – actual return | 1,000.00 | 989.64 | 4.06 | .81 | ||||||||||||
| Class F-1 – assumed 5% return | 1,000.00 | 1,021.12 | 4.13 | .81 | ||||||||||||
| Class F-2 – actual return | 1,000.00 | 990.95 | 2.76 | .55 | ||||||||||||
| Class F-2 – assumed 5% return | 1,000.00 | 1,022.43 | 2.80 | .55 | ||||||||||||
| Class F-3 – actual return† | 1,000.00 | 1,000.15 | .04 | .40 | ||||||||||||
| Class F-3 – assumed 5% return† | 1,000.00 | 1,023.19 | 2.04 | .40 | ||||||||||||
Limited Term Tax-Exempt Bond Fund of America
| Beginning | Ending | |||||||||||||||
| account value | account value | Expenses paid | Annualized | |||||||||||||
| 8/1/2016 | 1/31/2017 | during period* | expense ratio | |||||||||||||
| Class A – actual return | $ | 1,000.00 | $ | 982.46 | $ | 2.95 | .59 | % | ||||||||
| Class A – assumed 5% return | 1,000.00 | 1,022.23 | 3.01 | .59 | ||||||||||||
| Class B – actual return | 1,000.00 | 979.07 | 6.39 | 1.28 | ||||||||||||
| Class B – assumed 5% return | 1,000.00 | 1,018.75 | 6.51 | 1.28 | ||||||||||||
| Class C – actual return | 1,000.00 | 978.81 | 6.63 | 1.33 | ||||||||||||
| Class C – assumed 5% return | 1,000.00 | 1,018.50 | 6.77 | 1.33 | ||||||||||||
| Class F-1 – actual return | 1,000.00 | 982.07 | 3.35 | .67 | ||||||||||||
| Class F-1 – assumed 5% return | 1,000.00 | 1,021.83 | 3.41 | .67 | ||||||||||||
| Class F-2 – actual return | 1,000.00 | 983.35 | 2.05 | .41 | ||||||||||||
| Class F-2 – assumed 5% return | 1,000.00 | 1,023.14 | 2.09 | .41 | ||||||||||||
| Class F-3 – actual return† | 1,000.00 | 1,000.91 | .03 | .26 | ||||||||||||
| Class F-3 – assumed 5% return† | 1,000.00 | 1,023.89 | 1.33 | .26 | ||||||||||||
| Class R-6 – actual return | 1,000.00 | 983.91 | 1.50 | .30 | ||||||||||||
| Class R-6 – assumed 5% return | 1,000.00 | 1,023.69 | 1.53 | .30 | ||||||||||||
The Tax-Exempt Bond Fund of America
| Beginning | Ending | |||||||||||||||
| account value | account value | Expenses paid | Annualized | |||||||||||||
| 8/1/2016 | 1/31/2017 | during period* | expense ratio | |||||||||||||
| Class A – actual return | $ | 1,000.00 | $ | 966.28 | $ | 2.63 | .53 | % | ||||||||
| Class A – assumed 5% return | 1,000.00 | 1,022.53 | 2.70 | .53 | ||||||||||||
| Class B – actual return | 1,000.00 | 962.87 | 6.18 | 1.25 | ||||||||||||
| Class B – assumed 5% return | 1,000.00 | 1,018.90 | 6.36 | 1.25 | ||||||||||||
| Class C – actual return | 1,000.00 | 962.42 | 6.53 | 1.32 | ||||||||||||
| Class C – assumed 5% return | 1,000.00 | 1,018.55 | 6.72 | 1.32 | ||||||||||||
| Class F-1 – actual return | 1,000.00 | 965.67 | 3.27 | .66 | ||||||||||||
| Class F-1 – assumed 5% return | 1,000.00 | 1,021.88 | 3.36 | .66 | ||||||||||||
| Class F-2 – actual return | 1,000.00 | 966.90 | 2.03 | .41 | ||||||||||||
| Class F-2 – assumed 5% return | 1,000.00 | 1,023.14 | 2.09 | .41 | ||||||||||||
| Class F-3 – actual return† | 1,000.00 | 1,000.38 | .03 | .26 | ||||||||||||
| Class F-3 – assumed 5% return† | 1,000.00 | 1,023.89 | 1.33 | .26 | ||||||||||||
| Class R-6 – actual return | 1,000.00 | 967.47 | 1.44 | .29 | ||||||||||||
| Class R-6 – assumed 5% return | 1,000.00 | 1,023.74 | 1.48 | .29 | ||||||||||||
| American Funds Tax-Exempt Funds | 81 |
American High-Income Municipal Bond Fund
| Beginning | Ending | |||||||||||||||
| account value | account value | Expenses paid | Annualized | |||||||||||||
| 8/1/2016 | 1/31/2017 | during period* | expense ratio | |||||||||||||
| Class A – actual return | $ | 1,000.00 | $ | 962.31 | $ | 3.46 | .70 | % | ||||||||
| Class A – assumed 5% return | 1,000.00 | 1,021.68 | 3.57 | .70 | ||||||||||||
| Class B – actual return | 1,000.00 | 958.97 | 6.86 | 1.39 | ||||||||||||
| Class B – assumed 5% return | 1,000.00 | 1,018.20 | 7.07 | 1.39 | ||||||||||||
| Class C – actual return | 1,000.00 | 958.70 | 7.16 | 1.45 | ||||||||||||
| Class C – assumed 5% return | 1,000.00 | 1,017.90 | 7.37 | 1.45 | ||||||||||||
| Class F-1 – actual return | 1,000.00 | 961.96 | 3.81 | .77 | ||||||||||||
| Class F-1 – assumed 5% return | 1,000.00 | 1,021.32 | 3.92 | .77 | ||||||||||||
| Class F-2 – actual return | 1,000.00 | 963.21 | 2.52 | .51 | ||||||||||||
| Class F-2 – assumed 5% return | 1,000.00 | 1,022.63 | 2.60 | .51 | ||||||||||||
| Class F-3 – actual return† | 1,000.00 | 1,001.15 | .04 | .33 | ||||||||||||
| Class F-3 – assumed 5% return† | 1,000.00 | 1,023.54 | 1.68 | .33 | ||||||||||||
| Class R-6 – actual return | 1,000.00 | 963.78 | 1.98 | .40 | ||||||||||||
| Class R-6 – assumed 5% return | 1,000.00 | 1,023.19 | 2.04 | .40 | ||||||||||||
The Tax-Exempt Fund of California
| Beginning | Ending | |||||||||||||||
| account value | account value | Expenses paid | Annualized | |||||||||||||
| 8/1/2016 | 1/31/2017 | during period* | expense ratio | |||||||||||||
| Class A – actual return | $ | 1,000.00 | $ | 963.43 | $ | 2.92 | .59 | % | ||||||||
| Class A – assumed 5% return | 1,000.00 | 1,022.23 | 3.01 | .59 | ||||||||||||
| Class B – actual return | 1,000.00 | 959.99 | 6.47 | 1.31 | ||||||||||||
| Class B – assumed 5% return | 1,000.00 | 1,018.60 | 6.67 | 1.31 | ||||||||||||
| Class C – actual return | 1,000.00 | 959.59 | 6.82 | 1.38 | ||||||||||||
| Class C – assumed 5% return | 1,000.00 | 1,018.25 | 7.02 | 1.38 | ||||||||||||
| Class F-1 – actual return | 1,000.00 | 962.79 | 3.56 | .72 | ||||||||||||
| Class F-1 – assumed 5% return | 1,000.00 | 1,021.58 | 3.67 | .72 | ||||||||||||
| Class F-2 – actual return | 1,000.00 | 964.05 | 2.33 | .47 | ||||||||||||
| Class F-2 – assumed 5% return | 1,000.00 | 1,022.84 | 2.40 | .47 | ||||||||||||
| Class F-3 – actual return† | 1,000.00 | 1,000.96 | .04 | .34 | ||||||||||||
| Class F-3 – assumed 5% return† | 1,000.00 | 1,023.49 | 1.73 | .34 | ||||||||||||
| 82 | American Funds Tax-Exempt Funds |
American Funds Tax-Exempt Fund of New York
| Beginning | Ending | |||||||||||||||
| account value | account value | Expenses paid | Annualized | |||||||||||||
| 8/1/2016 | 1/31/2017 | during period* | expense ratio | |||||||||||||
| Class A – actual return | $ | 1,000.00 | $ | 964.45 | $ | 3.42 | .69 | % | ||||||||
| Class A – assumed 5% return | 1,000.00 | 1,021.73 | 3.52 | .69 | ||||||||||||
| Class B – actual return | 1,000.00 | 965.20 | 2.77 | .56 | ||||||||||||
| Class B – assumed 5% return | 1,000.00 | 1,022.38 | 2.85 | .56 | ||||||||||||
| Class C – actual return | 1,000.00 | 960.61 | 7.31 | 1.48 | ||||||||||||
| Class C – assumed 5% return | 1,000.00 | 1,017.74 | 7.53 | 1.48 | ||||||||||||
| Class F-1 – actual return | 1,000.00 | 964.54 | 3.32 | .67 | ||||||||||||
| Class F-1 – assumed 5% return | 1,000.00 | 1,021.83 | 3.41 | .67 | ||||||||||||
| Class F-2 – actual return | 1,000.00 | 965.12 | 2.77 | .56 | ||||||||||||
| Class F-2 – assumed 5% return | 1,000.00 | 1,022.38 | 2.85 | .56 | ||||||||||||
| Class F-3 – actual return† | 1,000.00 | 1,001.26 | .05 | .43 | ||||||||||||
| Class F-3 – assumed 5% return† | 1,000.00 | 1,023.04 | 2.19 | .43 | ||||||||||||
| * | The “expenses paid during period” are equal to the “annualized expense ratio,” multiplied by the average account value over the period, multiplied by the number of days in the period, and divided by 365 (to reflect the one-half year period). |
| † | The period for the ”annualized expense ratio” and ”actual return” line is based on the number of days since the initial sale of the share class on January 27, 2017. The ”assumed 5% return” line is based on 184 days. |
| American Funds Tax-Exempt Funds | 83 |
Offices of the funds and of the investment adviser
Capital Research and Management Company
333 South Hope Street
Los Angeles, CA 90071-1406
6455 Irvine Center Drive
Irvine, CA 92618-4518
Transfer agent for shareholder accounts
American Funds Service Company
(Write to the address near you.)
P.O. Box 6007
Indianapolis, IN 46206-6007
P.O. Box 2280
Norfolk, VA 23501-2280
Counsel
Morgan, Lewis & Bockius LLP
300 South Grand Avenue, 22nd Floor
Los Angeles, CA 90071-3132
Custodians of assets
Bank of New York Mellon
One Wall Street
New York, NY 10286
JPMorgan Chase Bank
270 Park Avenue
New York, NY 10017-2070
Independent registered public accounting firm
PricewaterhouseCoopers LLP
601 South Figueroa Street
Los Angeles, CA 90017-3874
Principal underwriter
American Funds Distributors, Inc.
333 South Hope Street
Los Angeles, CA 90071-1406
| 84 | American Funds Tax-Exempt Funds |
Investors should carefully consider investment objectives, risks, charges and expenses. This and other important information is contained in the funds’ prospectus and summary prospectuses, which can be obtained from your financial professional and should be read carefully before investing. You may also call American Funds Service Company (AFS) at (800) 421-4225 or visit the American Funds website at americanfunds.com.
“American Funds Proxy Voting Procedures and Principles” — which describes how we vote proxies relating to portfolio securities — is available on the American Funds website or upon request by calling AFS. Each fund files its proxy voting record with the U.S. Securities and Exchange Commission (SEC) for the 12 months ended June 30 by August 31. The proxy voting record is available free of charge on the SEC website at sec.gov and on the American Funds website.
Complete January 31, 2017, portfolios of American Funds Short-Term Tax-Exempt Bond Fund, Limited Term Tax-Exempt Bond Fund of America, The Tax-Exempt Bond Fund of America, American High-Income Municipal Bond Fund, The Tax-Exempt Fund of California and American Funds Tax-Exempt Fund of New York’s investments are available free of charge by calling AFS or visiting the SEC website (where they are part of Form N-CSR).
Each fund files a complete list of its portfolio holdings with the SEC for the first and third quarters of each fiscal year on Form N-Q. This filing is available free of charge on the SEC website. You may also review or, for a fee, copy this filing at the SEC’s Public Reference Room in Washington, D.C. Additional information regarding the operation of the Public Reference Room may be obtained by calling the SEC’s Office of Investor Education and Advocacy at (800) SEC-0330. Additionally, the list of portfolio holdings is available by calling AFS.
This report is for the information of shareholders of American Funds Short-Term Tax-Exempt Bond Fund, Limited Term Tax-Exempt Bond Fund of America, The Tax-Exempt Bond Fund of America, American High-Income Municipal Bond Fund, The Tax-Exempt Fund of California and American Funds Tax-Exempt Fund of New York, but it also may be used as sales literature when preceded or accompanied by the current prospectus or summary prospectuses, which give details about charges, expenses, investment objectives and operating policies of the funds. If used as sales material after March 31, 2017, this report must be accompanied by an American Funds statistical update for the most recently completed calendar quarter.
Bloomberg® is a trademark of Bloomberg Finance L.P. (collectively with its affiliates, “Bloomberg”). Barclays® is a trademark of Barclays Bank Plc (collectively with its affiliates, “Barclays”), used under license. Neither Bloomberg nor Barclays approves or endorses this material, guarantees the accuracy or completeness of any information herein and, to the maximum extent allowed by law, neither shall have any liability or responsibility for injury or damages arising in connection therewith.
American Funds from Capital Group
The Capital AdvantageSM
Since 1931, American Funds, part of Capital Group, has helped investors pursue long-term investment success. Our consistent approach — in combination with The Capital SystemSM — has resulted in a superior long-term track record.
| Aligned with investor success | |
| We base our decisions on a long-term perspective, which we believe aligns our goals with the interests of our clients. Our portfolio managers average 27 years of investment experience, including 21 years at our company, reflecting a career commitment to our long-term approach.1 | |
| The Capital SystemSM | |
| The Capital System combines individual accountability with teamwork. Funds using The Capital System are divided into portions that are managed independently by investment professionals with diverse backgrounds, ages and investment approaches. An extensive global research effort is the backbone of our system. | |
| American Funds’ superior long-term track record | |
| Equity funds have beaten their Lipper peer indexes in 93% of 10-year periods and 98% of 20-year periods. Fixed income funds have beaten their Lipper indexes in 80% of 10-year periods and 80% of 20-year periods.2 Fund management fees have been among the lowest in the industry.3 | |
| 1 | Portfolio manager experience as of December 31, 2016. | |
| 2 | Based on Class F-2 share results for rolling periods through December 31, 2016. Periods covered are the shorter of the fund’s lifetime or since the comparable Lipper index inception date (except Capital Income Builder and SMALLCAP World Fund, for which the Lipper average was used). Expenses differ for each share class, so results will vary. Class F-2 shares were first offered on August 1, 2008. Class F-2 share results prior to the date of first sale are hypothetical based on Class A share results without a sales charge, adjusted for typical estimated expenses. Results for certain funds with an inception date after August 1, 2008, also include hypothetical returns because those funds’ Class F-2 shares sold after the funds’ date of first offering. Please see americanfunds.com for more information on specific expense adjustments and the actual dates of first sale. | |
| 3 | On average, our management fees were in the lowest quintile 73% of the time, based on the 20-year period ended December 31, 2016, versus comparable Lipper categories, excluding funds of funds. |

ITEM 2 – Code of Ethics
Not applicable for filing of semi-annual reports to shareholders.
ITEM 3 – Audit Committee Financial Expert
Not applicable for filing of semi-annual reports to shareholders.
ITEM 4 – Principal Accountant Fees and Services
Not applicable for filing of semi-annual reports to shareholders.
ITEM 5 – Audit Committee of Listed Registrants
Not applicable to this Registrant, insofar as the Registrant is not a listed issuer as defined in Rule 10A-3 under the Securities Exchange Act of 1934.
ITEM 6 – Schedule of Investments

| Bonds, notes & other debt instruments 94.73% Alabama 1.38% | Principal amount (000) | Value (000) |
| Ascension Health, Rev. Bonds (Ascension Senior Credit Group), Series 2016-B, 5.00% 2046 | $500 | $562 |
| Black Belt Energy Gas Dist., Gas Supply Rev. Bonds, Series 2016-A, 4.00% 2046 (put 2021) | 10,000 | 10,721 |
| Houston County, Health Care Auth., Series 2016-A, 5.00% 2030 | 5,000 | 5,370 |
| Jefferson County, Sewer Rev. Warrants, Series 2013-A, Assured Guaranty Municipal insured, 5.00% 2044 | 1,600 | 1,775 |
| Jefferson County, Sewer Rev. Warrants, Series 2013-A, Assured Guaranty Municipal insured, 5.25% 2048 | 700 | 787 |
| Jefferson County, Sewer Rev. Warrants, Series 2013-D, 6.00% 2042 | 6,500 | 7,409 |
| Jefferson County, Sewer Rev. Warrants, Series 2013-D, 6.50% 2053 | 6,000 | 7,037 |
| Jefferson County, Sewer Rev. Warrants, Series 2013-D, 7.00% 2051 | 520 | 630 |
| Jefferson County, Sewer Rev. Warrants, Series 2013-E, 0% 2034 | 2,500 | 771 |
| Jefferson County, Sewer Rev. Warrants, Series 2013-E, 0% 2035 | 17,475 | 4,951 |
| Jefferson County, Sewer Rev. Warrants, Series 2013-E, 0% 2036 | 7,500 | 1,947 |
| Jefferson County, Sewer Rev. Warrants, Series 2013-F, 0% 20461 | 2,500 | 1,879 |
| The Lower Alabama Gas Dist., Gas Project Rev. Bonds, Series 2016-A, 5.00% 2029 | 1,250 | 1,411 |
| The Lower Alabama Gas Dist., Gas Project Rev. Bonds, Series 2016-A, 5.00% 2031 | 5,000 | 5,643 |
| The Lower Alabama Gas Dist., Gas Project Rev. Bonds, Series 2016-A, 5.00% 2046 | 5,355 | 6,136 |
| The Medical Clinic Board of the City of Montgomery, Health Care Fac. Rev. Bonds (Jackson Hospital & Clinic), 5.00% 2033 | 2,500 | 2,693 |
| The Medical Clinic Board of the City of Montgomery, Health Care Fac. Rev. Bonds (Jackson Hospital & Clinic), 5.00% 2036 | 3,400 | 3,604 |
| Industrial Dev. Board of the City of Phenix City, Environmental Improvement Rev. Ref. Bonds (MeadWestvaco-Mead Coated Board Project), Series 2012-A, AMT, 4.125% 2035 | 5,000 | 5,016 |
| 68,342 | ||
| Alaska 0.23% | ||
| Industrial Dev. and Export Auth., Power Rev. Ref. Bonds, AMT, 5.00% 2033 | 2,000 | 2,137 |
| Industrial Dev. and Export Auth., Power Rev. Ref. Bonds, AMT, 5.00% 2034 | 2,000 | 2,127 |
| International Airport System, Rev. Ref. Bonds, Series 2016-D, AMT, 5.00% 2018 | 2,550 | 2,698 |
| International Airport System, Rev. Ref. Bonds, Series 2016-D, AMT, 5.00% 2019 | 2,950 | 3,205 |
| International Airport System, Rev. Ref. Bonds, Series 2016-D, AMT, 5.00% 2020 | 1,000 | 1,111 |
| 11,278 | ||
| Arizona 1.72% | ||
| Health Facs. Auth., Rev. Ref. Bonds (Phoenix Children’s Hospital), Series 2013-A-1, 2.51% 2048 (put 2020)2 | 2,500 | 2,540 |
| City of Glendale, Industrial Dev. Auth., Rev. and Rev. Ref. Bonds (Glencroft Retirement Community Project), Series 2016, 4.25% 2026 | 490 | 457 |
| City of Glendale, Industrial Dev. Auth., Rev. and Rev. Ref. Bonds (Glencroft Retirement Community Project), Series 2016, 5.00% 2036 | 600 | 551 |
| City of Glendale, Industrial Dev. Auth., Rev. and Rev. Ref. Bonds (Glencroft Retirement Community Project), Series 2016, 5.25% 2046 | 1,000 | 916 |
| City of Glendale, Industrial Dev. Auth., Rev. and Rev. Ref. Bonds (Glencroft Retirement Community Project), Series 2016, 5.25% 2051 | 560 | 506 |
| County of Maricopa, Industrial Dev. Auth., Education Rev. Bonds (Paradise Schools Projects), Series 2016, 5.00% 20363 | 2,500 | 2,509 |
| County of Maricopa, Industrial Dev. Auth., Education Rev. Bonds (Paradise Schools Projects), Series 2016, 5.00% 20473 | 4,540 | 4,448 |
| Estrella Mountain Ranch Community Facs. Dist. (City of Goodyear), Special Assessment Rev. Bonds (Montecito Assessment Dist.), Series 2007, 5.70% 2027 | 426 | 428 |
| Bonds, notes & other debt instruments Arizona (continued) | Principal amount (000) | Value (000) |
| Estrella Mountain Ranch Community Facs. Dist. (City of Goodyear), Special Assessment Rev. Bonds (Montecito Assessment Dist.), Series 2007, 5.80% 2032 | $888 | $890 |
| Health Facs. Auth., Rev. Bonds (Banner Health), Series 2007-B, 1.479% 20372 | 6,735 | 5,757 |
| Industrial Dev. Auth., Education Rev. Bonds (Basis School Project), Series 2017-A, 5.25% 20473 | 1,450 | 1,461 |
| Industrial Dev. Auth., Education Rev. Bonds (Basis School Project), Series 2017-A, 5.375% 20503 | 2,000 | 2,019 |
| City of Phoenix, Industrial Dev. Auth., Education Fac. Rev. Bonds (Legacy Traditional Schools Projects), Series 2016-A, 5.00% 20413 | 10,000 | 9,752 |
| City of Phoenix, Industrial Dev. Auth., Education Fac. Rev. Bonds (Legacy Traditional Schools Projects), Series 2016-A, 5.00% 20463 | 2,500 | 2,397 |
| Industrial Dev. Auth. of the City of Phoenix, Education Fac. Rev. Bonds (Legacy Traditional Schools Projects), 5.00% 20353 | 1,590 | 1,571 |
| Industrial Dev. Auth. of the City of Phoenix, Education Fac. Rev. Bonds (Legacy Traditional Schools Projects), 5.00% 20453 | 2,250 | 2,158 |
| Industrial Dev. Auth. of the City of Phoenix, Education Fac. Rev. Bonds (Legacy Traditional Schools Projects), Series 2014-A, 5.75% 20243 | 1,250 | 1,373 |
| Industrial Dev. Auth. of the City of Phoenix, Education Fac. Rev. Bonds (Legacy Traditional Schools Projects), Series 2014-A, 6.50% 20343 | 1,560 | 1,741 |
| Industrial Dev. Auth. of the City of Phoenix, Education Fac. Rev. Bonds (Legacy Traditional Schools Projects), Series 2014-A, 6.75% 20443 | 6,500 | 7,319 |
| Industrial Dev. Auth. of the City of Phoenix, Education Facs. Rev Bonds (Basis Schools, Inc. Project), Series 2015, 5.00% 20453 | 5,500 | 5,410 |
| Industrial Dev. Auth. of the City of Phoenix, Education Facs. Rev Bonds (Basis Schools, Inc. Project), Series 2016-A, 5.00% 20353 | 1,500 | 1,503 |
| Industrial Dev. Auth. of the City of Phoenix, Education Facs. Rev Bonds (Basis Schools, Inc. Project), Series 2016-A, 5.00% 20463 | 7,100 | 6,971 |
| Industrial Dev. of the City of Phoenix, Lease Rev. Bonds (Rowan University Project), Series 2012, 5.00% 2042 | 6,160 | 6,621 |
| Industrial Dev. of the City of Phoenix, Lease Rev. Bonds (Rowan University Project), Series 2012, 5.25% 2034 | 5,000 | 5,504 |
| Industrial Dev. Auth. of the City of Phoenix, Education Facs. Rev Bonds (Basis Schools, Inc. Project), Series 2015, 5.00% 20353 | 4,350 | 4,360 |
| Industrial Dev. Auth. of the City of Tempe, Rev. Ref. Bonds (Friendship Village of Tempe), Series 2012-A, 5.00% 2019 | 500 | 531 |
| Industrial Dev. Auth. of the City of Tempe, Rev. Ref. Bonds (Friendship Village of Tempe), Series 2012-A, 6.25% 2042 | 1,000 | 1,058 |
| University Medical Center Corp. (Tucson), Hospital Rev. Bonds, Series 2009, 6.50% 2039 (preref. 2019) | 1,000 | 1,124 |
| Verrado Dist. 1 Community Facs. Dist. (Town of Buckeye), Dist. G.O. Ref. Bonds, Series 2013-A, 5.00% 2021 | 500 | 521 |
| Verrado Dist. 1 Community Facs. Dist. (Town of Buckeye), Dist. G.O. Ref. Bonds, Series 2013-A, 5.00% 2022 | 500 | 523 |
| Verrado Dist. 1 Community Facs. Dist. (Town of Buckeye), Dist. G.O. Ref. Bonds, Series 2013-B, 5.00% 2023 | 450 | 472 |
| Verrado Dist. 1 Community Facs. Dist. (Town of Buckeye), Dist. G.O. Ref. Bonds, Series 2013-B, 5.70% 2029 | 770 | 814 |
| Verrado Dist. 1 Community Facs. Dist. (Town of Buckeye), Dist. G.O. Ref. Bonds, Series 2013-B, 6.00% 2033 | 700 | 746 |
| 84,951 | ||
| Arkansas 0.02% | ||
| Dev. Fin. Auth., Health Care Rev. Bonds (Baptist Memorial Health Care), Series 2015-B-3, 2.21% 2044 (put 2022)2 | 1,000 | 992 |
| California 8.83% | ||
| Alameda Corridor Transportation Auth., Rev. Ref. Bonds, Series 2016-B, Assured Guaranty Municipal insured, 4.00% 2035 | 2,250 | 2,270 |
| Community Facs. Dist. No. 2013-1, City of Alameda (Alameda Landing Public Improvements), Special Tax Bonds, Series 2016, 4.00% 2030 | 115 | 116 |
| Community Facs. Dist. No. 2013-1, City of Alameda (Alameda Landing Public Improvements), Special Tax Bonds, Series 2016, 5.00% 2027 | 100 | 111 |
| Community Facs. Dist. No. 2013-1, City of Alameda (Alameda Landing Public Improvements), Special Tax Bonds, Series 2016, 5.00% 2031 | 150 | 163 |
| Bonds, notes & other debt instruments California (continued) | Principal amount (000) | Value (000) |
| Community Facs. Dist. No. 2013-1, City of Alameda (Alameda Landing Public Improvements), Special Tax Bonds, Series 2016, 5.00% 2032 | $160 | $174 |
| Community Facs. Dist. No. 2013-1, City of Alameda (Alameda Landing Public Improvements), Special Tax Bonds, Series 2016, 5.00% 2033 | 320 | 345 |
| Community Facs. Dist. No. 2013-1, City of Alameda (Alameda Landing Public Improvements), Special Tax Bonds, Series 2016, 5.00% 2034 | 135 | 145 |
| City of Alhambra, Rev. Bonds (Atherton Baptist Homes Project), Series 2010-A, 7.50% 2030 (preref. 2020) | 3,225 | 3,703 |
| City of Alhambra, Rev. Bonds (Atherton Baptist Homes Project), Series 2010-A, 7.625% 2040 (preref. 2020) | 3,295 | 3,877 |
| Anaheim, Public Fncg. Auth., Lease Rev. Bonds (Anaheim Convention Center Expansion Project), Series 2014-A, 5.00% 2046 | 2,000 | 2,203 |
| Antelope Valley Healthcare Dist., Rev. Bonds, Series 2016-A, 5.25% 2036 | 1,000 | 1,008 |
| City of Azusa, Community Facs. Dist. No. 2005-1 (Rosedale), Improvement Area No. 1, Special Tax Bonds, Series 2007, 5.00% 2020 | 795 | 805 |
| City of Azusa, Community Facs. Dist. No. 2005-1 (Rosedale), Improvement Area No. 1, Special Tax Bonds, Series 2007, 5.00% 2037 | 3,740 | 3,759 |
| Assn. of Bay Area Governments, Fin. Auth. for Nonprofit Corps., Insured Rev. Ref. Bonds (Casa de las Campanas, Inc.), Series 2010, 6.00% 2037 | 500 | 559 |
| Assn. of Bay Area Governments, Fin. Auth. for Nonprofit Corps., Insured Rev. Ref. Bonds (Channing House), Series 2010, 6.00% 2030 | 1,000 | 1,118 |
| Assn. of Bay Area Governments, Fin. Auth. for Nonprofit Corps., Insured Senior Living Rev. Ref. Bonds (Odd Fellows Home of California), Series 2012-A, 5.00% 2032 | 1,000 | 1,129 |
| Assn. of Bay Area Governments, Fin. Auth. for Nonprofit Corps., Rev. Ref. Bonds (Episcopal Senior Communities), Series 2011, 6.00% 2031 | 1,250 | 1,377 |
| Assn. of Bay Area Governments, Fin. Auth. for Nonprofit Corps., Rev. Ref. Bonds (Episcopal Senior Communities), Series 2012-A, 5.00% 2047 | 3,500 | 3,674 |
| Assn. of Bay Area Governments, Fin. Auth. for Nonprofit Corps., Rev. Ref. Bonds (Eskaton Properties Inc. Obligated Group), 5.00% 2023 | 400 | 453 |
| Assn. of Bay Area Governments, Fin. Auth. for Nonprofit Corps., Rev. Ref. Bonds (Eskaton Properties Inc. Obligated Group), Series 2013, 5.00% 2035 | 2,500 | 2,626 |
| Bay Area Toll Auth., San Francisco Bay Area Toll Bridge Rev. Ref. Bonds, Series 2008-B-1, 1.76% 2045 (put 2024)2 | 1,500 | 1,500 |
| Bay Area Toll Auth., San Francisco Bay Area Toll Bridge Rev. Ref. Bonds, Series 2012-D-1, 1.469% 2045 (put 2017)2 | 4,000 | 4,000 |
| Municipal Fin. Auth., Rev. Bonds (California Baptist University), Series 2016-A, 5.00% 20463 | 1,200 | 1,177 |
| City of Carlsbad, Reassessment Dist. No. 2012-1, Limited Obligation Ref. Bonds, 3.70% 2024 | 600 | 617 |
| City of Carlsbad, Reassessment Dist. No. 2012-1, Limited Obligation Ref. Bonds, 3.80% 2025 | 650 | 663 |
| City of Carlsbad, Reassessment Dist. No. 2012-1, Limited Obligation Ref. Bonds, 3.90% 2026 | 625 | 636 |
| Cerritos Public Fin. Auth., Rev. Bonds (Los Coyotes Redev. Project Loan), Series A, AMBAC insured, 6.50% 2023 | 955 | 1,150 |
| Cerritos Public Fin. Auth., Tax Allocation Rev. Bonds (Cerritos Redev. Projects), Series 2002-A, AMBAC insured, 5.00% 2020 | 2,500 | 2,616 |
| Cerritos Public Fncg. Auth., 2002 Tax Allocation Rev. Bonds (Cerritos Redev. Agcy.), Series A, AMBAC insured, 5.00% 2022 | 2,000 | 2,090 |
| Certs. of Part., Palomar Pomerado Health, 6.00% 2030 | 2,500 | 2,701 |
| Certs. of Part., Palomar Pomerado Health, 6.00% 2041 | 2,290 | 2,493 |
| Certs. of Part., Palomar Pomerado Health, 6.75% 2039 (preref. 2019) | 1,500 | 1,726 |
| Chino Public Fncg. Auth., Local Agcy. Rev. Ref. Bonds, Series 2015-A, Assured Guaranty Municipal insured, 5.00% 2028 | 225 | 259 |
| Chino Public Fncg. Auth., Local Agcy. Rev. Ref. Bonds, Series 2015-A, Assured Guaranty Municipal insured, 5.00% 2031 | 345 | 390 |
| Chula Vista Municipal Fncg. Auth., Special Tax Rev. Ref. Bonds, Series 2013, 5.00% 2034 | 945 | 1,037 |
| City of Chula Vista, Industrial Dev. Rev. Ref. Bonds (San Diego Gas & Electric Co.), Series 2004-C, 5.875% 2034 | 1,100 | 1,202 |
| Community Facs. Dist. No. 2002-1, City of Corona (Dos Lagos), Special Tax Bonds (Improvement Area No. 1), Series 2007, 5.00% 2037 | 500 | 507 |
| Bonds, notes & other debt instruments California (continued) | Principal amount (000) | Value (000) |
| Corona-Norco Unified School Dist. Public Fin. Auth., Special Tax Rev. Bonds, Series 2016-05-1, 4.00% 2029 | $615 | $624 |
| Corona-Norco Unified School Dist. Public Fin. Auth., Special Tax Rev. Bonds, Series 2016-05-1, 4.00% 2030 | 640 | 645 |
| Corona-Norco Unified School Dist. Public Fin. Auth., Special Tax Rev. Bonds, Series 2016-05-1, 5.00% 2036 | 1,510 | 1,618 |
| Duarte Unified School Dist., Capital Appreciation Bonds, 2010 Election, Series 2011-A, BAM insured, 0% 2036 | 5,520 | 2,390 |
| Educational Facs. Auth., Rev. Bonds (University of San Francisco), Series 2011, 6.125% 2036 | 1,000 | 1,172 |
| Community Facs. Dist. No. 1, Elk Grove Unified School Dist. (Sacramento County), 2012 Special Tax Ref. Bonds, 4.00% 2033 | 4,000 | 4,056 |
| City of Fontana, Community Facs. Dist. No. 22 (Sierra Hills South), Special Tax Bonds, Series 2014, 5.00% 2030 | 2,080 | 2,251 |
| Foothill/Eastern Transportation Corridor Agcy., Toll Road Rev. Ref. Bonds, Assured Guaranty Municipal insured, 0% 2034 | 10,000 | 4,930 |
| Foothill/Eastern Transportation Corridor Agcy., Toll Road Rev. Ref. Bonds, Assured Guaranty Municipal insured, 0% 2035 | 1,000 | 470 |
| Foothill/Eastern Transportation Corridor Agcy., Toll Road Rev. Ref. Bonds, Series 2013-A, 0% 2042 | 5,000 | 1,511 |
| Foothill/Eastern Transportation Corridor Agcy., Toll Road Rev. Ref. Bonds, Series 2013-A, 0%/6.85% 20421 | 1,250 | 1,009 |
| Foothill/Eastern Transportation Corridor Agcy., Toll Road Rev. Ref. Bonds, Series 2013-A, 5.75% 2046 | 3,000 | 3,430 |
| Foothill/Eastern Transportation Corridor Agcy., Toll Road Rev. Ref. Bonds, Series 2013-A, 6.00% 2053 | 4,000 | 4,571 |
| Foothill/Eastern Transportation Corridor Agcy., Toll Road Rev. Ref. Bonds, Series 2013-C, 6.50% 2043 | 3,500 | 4,172 |
| Golden State Tobacco Securitization Corp., Tobacco Settlement Asset-backed Rev. Ref. Bonds, Series 2007-A-1, 5.75% 2047 | 3,500 | 3,463 |
| Grossmont Union High School Dist., G.O. Bonds (San Diego County), 2004 Election, 0% 2032 | 5,000 | 2,710 |
| Hawthorne School Dist., Capital Appreciation Bonds, 2004 Election, Series 2008-C, Assured Guaranty insured, 0% 2038 | 6,750 | 2,566 |
| Hemet Unified School Dist., Fin. Auth. Special Tax Rev. Ref. Bonds, Series 2015, 5.00% 2024 | 225 | 254 |
| Hemet Unified School Dist., Fin. Auth. Special Tax Rev. Ref. Bonds, Series 2015, 5.00% 2028 | 500 | 546 |
| Hemet Unified School Dist., Fin. Auth. Special Tax Rev. Ref. Bonds, Series 2015, 5.00% 2032 | 540 | 578 |
| Hemet Unified School Dist., Fin. Auth. Special Tax Rev. Ref. Bonds, Series 2015, 5.00% 2033 | 580 | 618 |
| Hemet Unified School Dist., Fin. Auth. Special Tax Rev. Ref. Bonds, Series 2015, 5.00% 2034 | 350 | 371 |
| Independent Cities Fin. Auth., Mobile Home Park Rev. Ref. Bonds (Palomar Estates West), 5.00% 2036 | 1,000 | 1,043 |
| City of Irvine, Limited Obligation Improvement Bonds, Reassessment Dist. No. 15-2, 5.00% 2032 | 350 | 377 |
| City of Irvine, Limited Obligation Improvement Bonds, Reassessment Dist. No. 15-2, 5.00% 2033 | 590 | 631 |
| City of Irvine, Limited Obligation Improvement Bonds, Reassessment Dist. No. 15-2, 5.00% 2034 | 615 | 657 |
| City of Irvine, Limited Obligation Improvement Bonds, Reassessment Dist. No. 15-2, 5.00% 2035 | 375 | 399 |
| City of La Verne, Rev. Certs. of Part. (Brethren Hillcrest Homes), Series 2014, 5.00% 2024 | 310 | 342 |
| City of La Verne, Rev. Certs. of Part. (Brethren Hillcrest Homes), Series 2014, 5.00% 2025 | 550 | 604 |
| City of La Verne, Rev. Certs. of Part. (Brethren Hillcrest Homes), Series 2014, 5.00% 2026 | 350 | 382 |
| Lake Elsinore, Public Fncg. Auth., Local Agcy. Rev. Ref. Bonds, Series 2015, 5.00% 2025 | 1,265 | 1,421 |
| Lake Elsinore, Public Fncg. Auth., Local Agcy. Rev. Ref. Bonds, Series 2015, 5.00% 2031 | 2,920 | 3,157 |
| Lake Elsinore, Public Fncg. Auth., Local Agcy. Rev. Ref. Bonds, Series 2015, 5.00% 2035 | 7,125 | 7,580 |
| Lee Lake Public Fncg. Auth., Special Tax Rev. Ref. Bonds, Series 2013-A, 5.125% 2035 | 1,000 | 1,103 |
| Lee Lake Public Fncg. Auth., Special Tax Rev. Ref. Bonds, Series 2013-A, 5.25% 2025 | 1,000 | 1,146 |
| Lee Lake Public Fncg. Auth., Special Tax Rev. Ref. Bonds, Series 2013-A, 5.25% 2026 | 2,000 | 2,284 |
| Lee Lake Public Fncg. Auth., Special Tax Rev. Ref. Bonds, Series 2013-B, 5.375% 2035 | 885 | 951 |
| City of Long Beach, Marina Rev. Bonds (Alamitos Bay Marina Project), Series 2015, 5.00% 2045 | 500 | 536 |
| Long Beach Community College Dist. (Los Angeles County), G.O. Bonds, 2008 Election, Series 2012-B, 0% 2034 | 1,250 | 614 |
| M-S-R Energy Auth., Gas Rev. Bonds, Series 2009-B, 6.50% 2039 | 4,900 | 6,549 |
| Mendocino-Lake Community College Dist., G.O. Bonds (Mendocino and Lake Counties), 2006 Election, Series 2011-B, Assured Guaranty Municipal insured, 0% 2051 | 3,000 | 624 |
| Moorpark Unified School Dist., G.O. Bonds (Ventura County), 2008 Election, Series 2011-B, Assured Guaranty Municipal insured, 0% 2036 | 4,500 | 1,948 |
| Morongo Band of Mission Indians, Enterprise Rev. Ref. Bonds, Series 2008-B, 5.50% 2018 | 1,320 | 1,356 |
| Morongo Band of Mission Indians, Enterprise Rev. Ref. Bonds, Series 2008-B, 6.50% 2028 | 9,750 | 10,174 |
| Bonds, notes & other debt instruments California (continued) | Principal amount (000) | Value (000) |
| Municipal Fin. Auth., Rev. Bonds (California Baptist University), Series 2015-A, 5.25% 20353 | $2,035 | $2,071 |
| Municipal Fin. Auth., Rev. Bonds (California Baptist University), Series 2015-A, 5.50% 20453 | 5,600 | 5,716 |
| Municipal Fin. Auth., Certs. of Part. (Community Hospitals of Central California Obligated Group), 5.00% 2020 | 1,500 | 1,594 |
| Municipal Fin. Auth., Certs. of Part. (Community Hospitals of Central California Obligated Group), 5.00% 2021 | 1,500 | 1,588 |
| Municipal Fin. Auth., Certs. of Part. (Community Hospitals of Central California Obligated Group), 5.25% 2037 | 585 | 587 |
| Municipal Fin. Auth., Certs. of Part. (Community Hospitals of Central California Obligated Group), 5.25% 2037 (preref. 2017) | 415 | 415 |
| Municipal Fin. Auth., Educational Fac. Rev. Bonds (High Tech High Projects, Chula Vista), Series 2008-B, 6.00% 20283 | 845 | 870 |
| Municipal Fin. Auth., Educational Fac. Rev. Bonds (High Tech High Projects, Chula Vista), Series 2008-B, 6.125% 20383 | 750 | 770 |
| Municipal Fin. Auth., Educational Fac. Rev. Bonds (High Tech High Projects, Chula Vista), Series 2008-B, 6.125% 20483 | 1,000 | 1,025 |
| Municipal Fin. Auth., Educational Rev. Bonds (American Heritage Education Foundation Project), Series 2016-A, 5.00% 2036 | 750 | 795 |
| Municipal Fin. Auth., Educational Rev. Bonds (American Heritage Education Foundation Project), Series 2016-A, 5.00% 2046 | 1,745 | 1,830 |
| Municipal Fin. Auth., Rev. Bonds (Caritas Mobile Home Park), Series 2014-A, 5.25% 2039 | 1,200 | 1,316 |
| Municipal Fin. Auth., Rev. Bonds (Caritas Mobile Home Park), Series 2014-B, 5.875% 2049 | 1,000 | 1,087 |
| Municipal Fin. Auth., Rev. Bonds (Harbor Regional Center Project), Series 2009, 8.00% 2029 (preref. 2019) | 1,420 | 1,678 |
| Municipal Fin. Auth., Rev. Bonds (Harbor Regional Center Project), Series 2009, 8.50% 2039 (preref. 2019) | 2,000 | 2,390 |
| Municipal Fin. Auth., Rev. Bonds (University of La Verne), Series 2010-A, 6.25% 2040 | 1,000 | 1,130 |
| Municipal Fin. Auth., Rev. Ref. Bonds (Azusa Pacific University Project), Series 2011-B, 8.00% 2041 (preref. 2021)3 | 7,500 | 9,441 |
| Municipal Fin. Auth., Rev. Ref. Bonds (Azusa Pacific University Project), Series 2015-B, 5.00% 2026 | 1,065 | 1,168 |
| Municipal Fin. Auth., Rev. Ref. Bonds (Azusa Pacific University Project), Series 2015-B, 5.00% 2030 | 2,505 | 2,679 |
| Municipal Fin. Auth., Rev. Ref. Bonds (Biola University), Series 2008-A, 5.80% 2028 | 500 | 523 |
| Municipal Fin. Auth., Rev. Ref. Bonds (Biola University), Series 2008-A, 5.875% 2034 | 1,500 | 1,568 |
| Municipal Fin. Auth., Rev. Ref. Bonds (NorthBay Healthcare Group), Series 2016-A, 5.00% 2026 | 1,000 | 1,095 |
| Murrieta Public Fncg. Auth., Special Tax Rev. Ref. Bonds, Series 2012, 4.00% 2034 | 1,965 | 1,990 |
| Newport-Mesa Unified School Dist. (County of Orange), G.O. Bonds, Election of 2005, Series 2011, 0% 2038 | 4,000 | 1,729 |
| City of Norco, Community Facs. Dist. No. 2001-1 (Norco Ridge Ranch), Special Tax Ref. Bonds, Issue of 2006, AMBAC insured, 4.875% 2033 | 2,000 | 2,005 |
| Municipal Fin. Auth., Rev. Ref. Bonds (NorthBay Healthcare Group), Series 2016-A, 5.00% 2027 | 1,000 | 1,097 |
| Port of Oakland, Rev. Ref. Bonds, Series 2011-O, AMT, 5.00% 2029 | 2,000 | 2,194 |
| City of Palm Desert, Section 29 Assessment Dist. (No. 2004-02), Limited Obligation Improvement Bonds, Series 2007, 5.05% 2027 | 1,820 | 1,840 |
| Palomar Health, Rev. Ref. Bonds, Series 2016, 5.00% 2027 | 2,000 | 2,195 |
| Palomar Health, Rev. Ref. Bonds, Series 2016, 5.00% 2036 | 500 | 520 |
| Palomar Health, Rev. Ref. Bonds, Series 2016, 5.00% 2039 | 2,750 | 2,842 |
| Palomar Pomerado Health, G.O. Bonds, Election of 2004, Series 2007-A, National insured, 0% 2026 | 3,300 | 2,379 |
| Palomar Pomerado Health, G.O. Bonds, Election of 2004, Series 2009-A, Assured Guaranty insured, 0% 2029 | 9,320 | 5,775 |
| Palomar Pomerado Health, G.O. Bonds, Election of 2004, Series 2009-A, Assured Guaranty insured, 0% 2030 | 9,000 | 5,325 |
| Palomar Pomerado Health, G.O. Bonds, Election of 2004, Series 2009-A, Assured Guaranty insured, 0% 2031 | 2,500 | 1,413 |
| Perris Union High School Dist., Fncg. Auth., Rev. Bonds, Series 2015, 5.00% 2032 | 2,675 | 2,873 |
| Perris Union High School Dist., Fncg. Auth., Rev. Bonds, Series 2015, 5.00% 2035 | 3,175 | 3,374 |
| Perris Union High School Dist., Fncg. Auth., Rev. Bonds, Series 2015, 5.00% 2041 | 2,725 | 2,860 |
| Pollution Control Fin. Auth., Rev. Bonds (San Jose Water Company Project), Series 2016, AMT, 4.75% 2046 | 1,365 | 1,433 |
| Pollution Control Fncg. Auth., Solid Waste Rev. Ref. Bonds (Republic Services, Inc. Project), Series 2010-A, AMT, 0.90% 2023 (put 2017)2,3 | 3,000 | 3,000 |
| Pollution Control Fncg. Auth., Solid Waste Rev. Ref. Bonds (Republic Services, Inc. Project), Series 2010-A, AMT, 0.90% 2023 (put 2017)2,3 | 3,000 | 3,000 |
| Pollution Control Fncg. Auth., Water Furnishing Rev. Bonds (Poseidon Resources (Channelside) LP Desalination Project), Series 2012 Plant Bonds, AMT, 5.00% 20453 | 9,000 | 9,184 |
| Bonds, notes & other debt instruments California (continued) | Principal amount (000) | Value (000) |
| Pomona Unified School Dist. (Los Angeles County), G.O. Bonds, 2008 Election, Series 2016-G, Assured Guaranty Municipal insured, 0.00% 2032 | $1,925 | $996 |
| Pomona Unified School Dist. (Los Angeles County), G.O. Bonds, 2008 Election, Series 2016-G, Assured Guaranty Municipal insured, 0.00% 2034 | 1,000 | 463 |
| Pomona Unified School Dist. (Los Angeles County), G.O. Bonds, 2008 Election, Series 2016-G, Assured Guaranty Municipal insured, 0.00% 2035 | 3,500 | 1,534 |
| Poway Unified School Dist., Public Fncg. Auth., Special Tax Rev. Bonds, Series 2013, 5.00% 2030 | 620 | 689 |
| Poway Unified School Dist., Public Fncg. Auth., Special Tax Rev. Bonds, Series 2013, 5.00% 2032 | 805 | 888 |
| Poway Unified School Dist., Public Fncg. Auth., Special Tax Rev. Ref. Bonds, Series 2011, 5.25% 2029 | 2,285 | 2,385 |
| Poway Unified School Dist., Public Fncg. Auth., Special Tax Rev. Ref. Bonds, Series 2015-A, 5.00% 2030 | 1,350 | 1,470 |
| Poway Unified School Dist., Public Fncg. Auth., Special Tax Rev. Ref. Bonds, Series 2015-A, 5.00% 2031 | 1,200 | 1,298 |
| Poway Unified School Dist., Public Fncg. Auth., Special Tax Rev. Ref. Bonds, Series 2015-A, 5.00% 2036 | 1,500 | 1,598 |
| Public Fin. Auth., Rev. Bonds (Henry Mayo Newhall Memorial Hospital), Series 2017, 5.00% 2047 | 2,300 | 2,425 |
| Public Works Board, Lease Rev. Bonds (Regents of the University of California), Series 2008-A, 5.00% 2033 (preref. 2018) | 50 | 52 |
| Public Works Board, Lease Rev. Bonds (Trustees of the California State University, J. Paul Leonard & Sutro Library), Series 2009-J, 6.00% 2034 (preref. 2019) | 1,500 | 1,697 |
| Public Works Board, Lease Rev. Bonds (Trustees of the California State University, Various California State University Projects), Series 2011-B, 5.00% 2031 (preref. 2021) | 5 | 6 |
| Public Works Board, Lease Rev. Bonds (Various Capital Projects), Series 2009-I-1, 6.125% 2029 (preref. 2019) | 6,000 | 6,806 |
| City of Rancho Cordova, Sunridge Anatolia Community Facs. Dist. No. 2003-1, Special Tax Bonds, Series 2016, 4.00% 2037 | 500 | 482 |
| Rio Elementary School Dist., Community Facs. Dist. #1, Special Tax Bonds, Series 2013, 5.50% 2039 | 3,120 | 3,360 |
| Rio Elementary School Dist., Community Facs. Dist. #1, Special Tax Bonds, Series 2014, 5.00% 2035 | 425 | 450 |
| City of Roseville, Westpark Community Facs. Dist. No. 1, Special Tax Rev. Ref. Bonds, 5.00% 2026 | 500 | 557 |
| City of Roseville, Westpark Community Facs. Dist. No. 1, Special Tax Rev. Ref. Bonds, 5.00% 2027 | 230 | 254 |
| City of Roseville, Westpark Community Facs. Dist. No. 1, Special Tax Rev. Ref. Bonds, 5.00% 2029 | 1,000 | 1,092 |
| City of Roseville, Westpark Community Facs. Dist. No. 1, Special Tax Rev. Ref. Bonds, 5.00% 2030 | 455 | 495 |
| City of Roseville, Westpark Community Facs. Dist. No. 1, Special Tax Rev. Ref. Bonds, 5.00% 2031 | 595 | 642 |
| City of Roseville, Westpark Community Facs. Dist. No. 1, Special Tax Rev. Ref. Bonds, 5.00% 2033 | 500 | 534 |
| Sacramento County, Water Fncg. Auth., Rev. Ref. Bonds (Sacramento County, Water Agcy. Zones 40 and 41 2007 Water System Project), Series 2007-B, FGIC-National insured, 1.174% 20342 | 5,000 | 4,369 |
| Sacremento County, Center Joint Unified School Dist., G.O. Rev. Ref. Bonds, Series 2016, BAM insured, 0% 2029 | 1,000 | 611 |
| Sacremento County, Center Joint Unified School Dist., G.O. Rev. Ref. Bonds, Series 2016, BAM insured, 0% 2030 | 1,000 | 581 |
| Sacremento County, Center Joint Unified School Dist., G.O. Rev. Ref. Bonds, Series 2016, BAM insured, 0% 2031 | 1,000 | 549 |
| City of San Buenaventura, Rev. Bonds (Community Memorial Health System), Series 2011, 7.50% 2041 | 13,040 | 15,201 |
| San Diego City, Community Facs. Dist. No. 4, Special Tax Bonds (Black Mountain Ranch Villages), 5.00% 2027 | 360 | 402 |
| San Diego City, Community Facs. Dist. No. 4, Special Tax Bonds (Black Mountain Ranch Villages), 5.00% 2028 | 800 | 889 |
| San Diego City, Community Facs. Dist. No. 4, Special Tax Bonds (Black Mountain Ranch Villages), 5.00% 2029 | 250 | 276 |
| San Diego City, Community Facs. Dist. No. 4, Special Tax Bonds (Black Mountain Ranch Villages), 5.00% 2030 | 250 | 274 |
| Airport Commission, City and County of San Francisco, San Francisco International Airport, Second Series Rev. Bonds, Series 2009-E, 5.25% 2032 | 3,500 | 3,788 |
| Airport Commission, City and County of San Francisco, San Francisco International Airport, Second Series Rev. Ref. Bonds, Series 2009-A, 4.90% 2029 | 3,000 | 3,264 |
| City and County of San Francisco, Redev. Fin. Auth., Tax Allocation Rev. Bonds (Mission Bay South Redev. Project), Series 2016-B, 5.00% 2034 | 700 | 787 |
| City and County of San Francisco, Redev. Fin. Auth., Tax Allocation Rev. Bonds (Mission Bay South Redev. Project), Series 2016-C, 5.00% 2031 | 665 | 758 |
| City and County of San Francisco, Redev. Fin. Auth., Tax Allocation Rev. Bonds (Mission Bay South Redev. Project), Series 2009-D, 6.625% 2039 (preref. 2019) | 2,500 | 2,836 |
| City and County of San Francisco, Redev. Fin. Auth., Tax Allocation Rev. Bonds (Mission Bay South Redev. Project), Series 2011-D, 7.00% 2041 (preref. 2021) | 2,000 | 2,430 |
| Bonds, notes & other debt instruments California (continued) | Principal amount (000) | Value (000) |
| Redev. Agcy. of the City and County of San Francisco, Community Facs. Dist. No. 6, Special Tax Ref. Bonds (Mission Bay South Public Improvements), Series 2013-A, 5.00% 2029 | $1,300 | $1,394 |
| Redev. Agcy. of the City and County of San Francisco, Community Facs. Dist. No. 6, Special Tax Ref. Bonds (Mission Bay South Public Improvements), Series 2013-A, 5.00% 2031 | 1,140 | 1,213 |
| Redev. Agcy. of the City and County of San Francisco, Community Facs. Dist. No. 6, Special Tax Ref. Bonds (Mission Bay South Public Improvements), Series 2013-A, 5.00% 2033 | 250 | 264 |
| Successor Agcy. to the Redev. Agcy. of the City and County of San Francisco, Community Facs. Dist. No. 7 (Hunters Point Shipyard Phase One Improvements), Special Tax Ref. Bonds, Series 2014, 5.00% 2044 | 1,000 | 1,050 |
| San Joaquin Hills Transportation Corridor Agcy., Toll Road Rev. Ref. Bonds, Series 2014-A, 5.00% 2034 | 2,200 | 2,383 |
| City of San Jose, Airport Rev. Ref. Bonds, Series 2011-A-1, AMT, 5.75% 2034 | 4,000 | 4,521 |
| City of San Jose, Airport Rev. Ref. Bonds, Series 2011-A-1, AMT, 6.25% 2034 | 1,750 | 2,012 |
| Redev. Agcy. of the City of San Jose, Housing Set-Aside Tax Allocation Bonds (Merged Area Redev. Project), Series 2010-A-1, 5.50% 2035 | 1,000 | 1,097 |
| Community Redev. Agcy. of the City of Santa Ana, Tax Allocation Bonds, Series 2011-A, 6.25% 2024 | 1,500 | 1,732 |
| Community Redev. Agcy. of the City of Santa Ana, Tax Allocation Bonds, Series 2011-A, 6.75% 2028 | 810 | 941 |
| Santa Ana Unified School Dist., G.O. Bonds (Orange County), 2008 Election, Series 2009-B, Assured Guaranty insured, 0% 2034 | 10,000 | 4,915 |
| Redev. Agcy. of the City of Santa Clara, 2011 Tax Allocation Bonds (Bayshore North Project), 0% 2024 | 6,070 | 4,323 |
| Redev. Agcy. of the City of Santa Clara, 2011 Tax Allocation Bonds (Bayshore North Project), 0% 2025 | 6,000 | 3,924 |
| Santa Clara County, Mountain View Shoreline Regional Park Community, Rev. Bonds, Series 2011-A, 5.75% 2040 | 3,000 | 3,427 |
| Community Facs. Dist. No. 2 (Santaluz), Improvement Area No. 1, Special Tax Ref. Bonds, Series 2011-A, 5.10% 2030 | 925 | 1,003 |
| Saugus/Hart School Facs. Fin. Auth., Special Tax Rev. Bonds (Community Facs. Dist. No. 2006-1 of the Saugus Union School Dist.), 5.00% 2035 | 1,725 | 1,859 |
| Saugus/Hart School Facs. Fin. Auth., Special Tax Rev. Bonds (Community Facs. Dist. No. 2006-1 of the Saugus Union School Dist.), 5.00% 2036 | 1,780 | 1,915 |
| School Fin. Auth., Charter School Rev. Bonds (Classical Academies Project), Series 2013-A-1, 7.375% 2043 | 6,000 | 6,963 |
| School Fin. Auth., Charter School Rev. Bonds (Downtown College Prep Obligated Group), Series 2016, 4.00% 20263 | 1,260 | 1,226 |
| School Fin. Auth., Charter School Rev. Bonds (Downtown College Prep Obligated Group), Series 2016, 4.50% 20313 | 500 | 482 |
| School Fin. Auth., Charter School Rev. Bonds (Downtown College Prep Obligated Group), Series 2016, 5.00% 20463 | 2,305 | 2,226 |
| School Fin. Auth., Charter School Rev. Bonds (Rocketship Education - Obligated Group), Series 2016-A, 5.00% 20463 | 1,600 | 1,515 |
| School Fin. Auth., Educational Fac. Rev. Bonds (River Springs Charter School Project), Series 2015-A, 6.375% 20463 | 1,250 | 1,278 |
| School Fin. Auth., Educational Fac. Rev. Bonds (River Springs Charter School Project), Series 2015-A, 6.375% 20463 | 7,100 | 7,257 |
| Seal Beach Community Facs. Dist., NO. 05 Special Tax Rev. Ref. Bonds (Pacific Gateway Business), 3.00% 2027 | 100 | 93 |
| Seal Beach Community Facs. Dist., NO. 05 Special Tax Rev. Ref. Bonds (Pacific Gateway Business), 3.00% 2028 | 120 | 110 |
| Seal Beach Community Facs. Dist., NO. 05 Special Tax Rev. Ref. Bonds (Pacific Gateway Business), 3.125% 2030 | 175 | 159 |
| Seal Beach Community Facs. Dist., NO. 05 Special Tax Rev. Ref. Bonds (Pacific Gateway Business), 3.125% 2031 | 460 | 411 |
| Southern California Logistics Airport Auth., Tax Allocation Parity Bonds (Southern California Logistics Airport Project), Series 2005-A, RADIAN insured, 4.50% 2030 | 120 | 120 |
| Southern California Public Power Auth., Gas Project Rev. Bonds (Project No. 1), Series 2007-A, 5.00% 2028 | 2,500 | 2,851 |
| State Public Works Board, Lease Rev. Bonds (Trustees of the California State University), Series 2013-H, 5.00% 2024 (preref. 2023) | 20 | 24 |
| State Public Works Board, Lease Rev. Bonds (Trustees of the California State University), Series 2013-H, 5.00% 2029 (preref. 2023) | 5 | 6 |
| Statewide Communities Dev. Auth., Certs. of Part. (Internext Group), 5.375% 2017 | 30 | 30 |
| Bonds, notes & other debt instruments California (continued) | Principal amount (000) | Value (000) |
| Statewide Communities Dev. Auth., Insured Senior Living Health Fac. Rev. Bonds (Los Angeles Jewish Home for the Aging - Fountainview at Gonda), Series 2014-B, 3.00% 2021 | $700 | $701 |
| Statewide Communities Dev. Auth., Insured Senior Living Health Fac. Rev. Bonds (Los Angeles Jewish Home for the Aging - Fountainview at Gonda), Series 2014-D, 4.75% 2020 | 1,350 | 1,351 |
| Statewide Communities Dev. Auth., Rev. Bonds (California Baptist University), Series 2014-A, 6.125% 2033 | 1,000 | 1,086 |
| Statewide Communities Dev. Auth., Rev. Bonds (California Baptist University), Series 2014-A, 6.375% 2043 | 2,700 | 2,940 |
| Statewide Communities Dev. Auth., Rev. Bonds (California Baptist University), Series 2014-B, 3.50% 2018 | 500 | 504 |
| Statewide Communities Dev. Auth., Rev. Bonds (Daughters of Charity Health System), Series 2005-A, 5.75% 2030 | 170 | 163 |
| Statewide Communities Dev. Auth., Rev. Bonds (Front Porch Communities and Services Project), Series 2007-A, 5.125% 20373 | 5,500 | 5,515 |
| Statewide Communities Dev. Auth., Rev. Bonds (Inland Regional Center Project), Series 2007, 5.375% 2037 (preref. 2017) | 1,000 | 1,037 |
| Statewide Communities Dev. Auth., Rev. Bonds (Lancer Plaza Project), Series 2013, 5.125% 2023 | 1,405 | 1,462 |
| Statewide Communities Dev. Auth., Rev. Bonds (Loma Linda University Medical Center), Series 2014-A, 5.25% 2044 | 5,000 | 5,208 |
| Statewide Communities Dev. Auth., Rev. Bonds (Loma Linda University Medical Center), Series 2016-A, 5.00% 20463 | 1,000 | 1,026 |
| Statewide Communities Dev. Auth., Rev. Bonds (Sutter Health), Series 2011-A, 6.00% 2042 | 1,500 | 1,710 |
| Statewide Communities Dev. Auth., Rev. Bonds (Terraces at San Joaquin Gardens Project), Series 2012-A, 5.625% 2032 | 1,000 | 1,041 |
| Statewide Communities Dev. Auth., Rev. Bonds (Terraces at San Joaquin Gardens Project), Series 2012-A, 6.00% 2042 | 1,000 | 1,051 |
| Statewide Communities Dev. Auth., Rev. Ref. Bonds (American Baptist Homes of the West), Series 2010, 6.00% 2029 | 2,000 | 2,170 |
| Statewide Communities Dev. Auth., Rev. Ref. Bonds (American Baptist Homes of the West), Series 2010, 6.25% 2039 | 2,500 | 2,727 |
| Statewide Communities Dev. Auth., Rev. Ref. Bonds (Catholic Healthcare West), Series 2008-B, 5.50% 2030 (preref. 2017) | 960 | 979 |
| Statewide Communities Dev. Auth., Rev. Ref. Bonds (Catholic Healthcare West), Series 2008-D, 5.50% 2031 (preref. 2017) | 840 | 856 |
| Statewide Communities Dev. Auth., Rev. Ref. Bonds (Lancer Educational Student Housing Project), Series 2016-A, 5.00% 20463 | 3,750 | 3,622 |
| Statewide Communities Dev. Auth., Senior Living Rev. Ref. Bonds (Southern California Presbyterian Homes), Series 2009, 7.00% 20293 | 1,500 | 1,663 |
| Statewide Communities Dev. Auth., Senior Living Rev. Ref. Bonds (Southern California Presbyterian Homes), Series 2009, 7.25% 20413 | 4,500 | 4,977 |
| Statewide Communities Dev. Auth., Student Housing Rev. Bonds (CHF-Irvine, LLC-UCI East Campus Apartments, Phase II), Series 2008, 6.00% 2040 (preref. 2018) | 1,000 | 1,065 |
| Statewide Communities Dev. Auth., Student Housing Rev. Ref. Bonds (CHF-Irvine, LLC - UCI East Campus Apartments, Phase I), Series 2011, 5.375% 2038 | 1,000 | 1,100 |
| Statewide Communities Dev. Auth., Student Housing Rev. Ref. Bonds (CHF-Irvine, LLC-UCI East Campus Apartments, Phase I), Series 2011, 5.125% 2031 | 2,000 | 2,199 |
| Statewide Communities Dev. Auth., Student Housing Rev. Ref. Bonds (University of California, Irvine East Campus Apartments, CHF-Irvine, L.L.C.), Series 2016, 5.00% 2040 | 1,150 | 1,228 |
| Stockton Unified School Dist. (San Joaquin County), G.O. Rev. Ref. Bonds, Series 2016, 5.00% 2031 | 1,700 | 1,949 |
| City of Thousand Oaks Community Facs. Dist. No. 1994-1, Special Tax Ref. Bonds (Marketplace Public Pedestrian, Traffic Circulation and Parking Facs.), Series 2012, 5.00% 2022 | 1,235 | 1,283 |
| Tobacco Securitization Auth. of Southern California, Tobacco Settlement Asset-backed Rev. Ref. Bonds (San Diego County Tobacco Asset Securitization Corp.), Series 2006-A, 5.00% 2037 | 2,000 | 1,950 |
| Tobacco Securitization Auth. of Southern California, Tobacco Settlement Asset-backed Rev. Ref. Bonds (San Diego County Tobacco Asset Securitization Corp.), Series 2006-A, 5.125% 2046 | 1,185 | 1,141 |
| Tuolumne Wind Project Auth., Rev. Bonds (Tuolumne Co. Project), Series 2009-A, 5.625% 2029 (preref. 2019) | 1,000 | 1,087 |
| Twin Rivers Unified School Dist. (County of Sacramento and County of Placer), G.O. Rev. Ref. Bonds (Grant), Series 2016-A, Assured Guaranty Municipal insured, 0% 2036 | 10,000 | 4,231 |
| Bonds, notes & other debt instruments California (continued) | Principal amount (000) | Value (000) |
| Regents of the University of California, Medical Center Pooled Rev. Bonds, Series 2016-L, 4.00% 2037 | $2,300 | $2,348 |
| Walnut Valley Unified School Dist., Capital Appreciation Bonds, 2007 Election, Series 2011-B, BAM insured, 0% 2036 | 5,655 | 2,468 |
| Washington Township Health Care Dist., Rev. Ref. Bonds, Series 2007-A, 5.00% 2037 | 140 | 140 |
| West Hollywood Community Dev. Commission, Tax Allocation Bonds (East Side Redev. Project), Series 2011-A, 7.50% 2042 | 1,950 | 2,376 |
| 436,842 | ||
| Colorado 4.25% | ||
| City of Aurora, Tallyn’s Reach Metropolitan Dist. No. 3, Limited Tax G.O. Bonds, Series 2016-A, 6.75% 20384 | 720 | 696 |
| Base Village Metropolitan Dist. No. 2 (Town of Snowmass Village), G.O. Limited Tax Rev. Ref. Bonds, Series 2016-A, 5.50% 2036 | 4,750 | 4,776 |
| Base Village Metropolitan Dist. No. 2 (Town of Snowmass Village), G.O. Limited Tax Rev. Ref. Bonds, Series 2016-A, 5.75% 2046 | 2,585 | 2,607 |
| City and County of Broomfield, Improvement Rev. Ref. Bonds (Lambertson Farms Metropolitan Distric No. 1), 5.75% 2046 | 4,450 | 4,356 |
| City and County of Broomfield, Improvement Rev. Ref. Bonds (Lambertson Farms Metropolitan Distric No. 1), 6.00% 2050 | 3,700 | 3,611 |
| City and County of Broomfield, Palisade Metropolitan Dist. No. 2, G.O. Limited Tax and Rev. Bonds, Series 2016, 4.375% 2031 | 900 | 816 |
| City and County of Broomfield, Palisade Metropolitan Dist. No. 2, G.O. Limited Tax and Rev. Bonds, Series 2016, 5.00% 2046 | 3,000 | 2,746 |
| Promenade at Castle Rock Metropolitan Dist. No. 1, G. O. Bonds (In the Town of Castle Rock), Series 2015-A, 5.125% 2025 | 1,000 | 1,001 |
| Promenade at Castle Rock Metropolitan Dist. No. 1, G. O. Bonds (In the Town of Castle Rock), Series 2015-A, 5.75% 2039 | 10,300 | 10,338 |
| Central Platte Valley Metropolitan Dist., City and County of Denver, G.O. Ref. Bonds, 5.00% 2043 | 1,250 | 1,268 |
| Central Platte Valley Metropolitan Dist., City and County of Denver, G.O. Ref. Bonds, Series 2013-A, 5.625% 2038 | 1,315 | 1,466 |
| Central Platte Valley Metropolitan Dist., City and County of Denver, G.O. Ref. Bonds, Series 2013-A, 6.00% 2038 | 1,250 | 1,427 |
| City of Aurora, Arapahoe County, Forest Trace Metropolitan Dist. No. 3, G.O. Bonds (Limited Tax Convertible to Unlimited Tax), Series 2016-A, 5.00% 2046 | 2,920 | 2,745 |
| City of Aurora, Arapahoe County, Forest Trace Metropolitan Dist. No. 3, G.O. Limited Tax Bonds, Series 2016-B, 7.25% 20464 | 683 | 620 |
| City of Centennial, Southglenn Metropolitan Dist., Special Rev. Ref. Bonds, 5.00% 2030 | 1,035 | 1,056 |
| City of Centennial, Southglenn Metropolitan Dist., Special Rev. Ref. Bonds, 5.00% 2036 | 810 | 803 |
| City of Centennial, Southglenn Metropolitan Dist., Special Rev. Ref. Bonds, 5.00% 2046 | 2,100 | 2,031 |
| Compark Business Campus Metropolitan Dist., Douglas County, G.O. Ref. and Improvement Bonds, Series 2007-A, RADIAN insured, 5.60% 2034 | 5,610 | 5,637 |
| Copperleaf Metropolitan Dist. No. 2 (Arapahoe County), Limited Tax G.O. Bonds, 5.25% 2030 | 500 | 506 |
| Copperleaf Metropolitan Dist. No. 2 (Arapahoe County), Limited Tax G.O. Bonds, 5.75% 2045 | 1,450 | 1,479 |
| Cross Creek Metropolitan Dist. No. 2 (City of Aurora), Limited Tax G.O. Ref. Bonds, Series 2006, 5.00% 20372 | 3,830 | 3,677 |
| City and County of Denver, Airport System Rev. Ref. Bonds, Series 2012-A, AMT, 5.00% 2024 | 1,000 | 1,124 |
| City and County of Denver, Dept. of Aviation, Special Facs. Airport Rev. Ref. Bonds (United Air Lines Project), Series 2007-A, AMT, 5.25% 2032 | 16,000 | 16,241 |
| City and County of Denver, Dept. of Aviation, Special Facs. Airport Rev. Ref. Bonds (United Air Lines Project), Series 2007-A, AMT, 5.75% 2032 | 5,505 | 5,602 |
| Denver Health and Hospital Auth., Healthcare Rev. Ref. Bonds, Series 2007-B, 1.724% 20332 | 4,740 | 4,304 |
| Denver Urban Renewal Auth., Stapleton Tax Increment Rev. Bonds, Series 2013-A-1, 5.00% 2024 | 2,000 | 2,272 |
| Denver Convention Center Hotel Auth., Rev. Ref. Bonds, Series 2016, 5.00% 2034 | 2,500 | 2,727 |
| Denver Convention Center Hotel Auth., Rev. Ref. Bonds, Series 2016, 5.00% 2040 | 1,000 | 1,082 |
| E-470 Public Highway Auth., Rev. Bonds (Capital Appreciation Bonds), Series 2000-B, National insured, 0% 2031 | 1,325 | 742 |
| E-470 Public Highway Auth., Rev. Bonds, Series 2010, 0% 2040 | 2,375 | 810 |
| Bonds, notes & other debt instruments Colorado (continued) | Principal amount (000) | Value (000) |
| E-470 Public Highway Auth., Rev. Ref. Bonds (Capital Appreciation Bonds), Series 2006-B, National insured, 0% 2037 | $5,065 | $1,921 |
| Educational and Cultural Facs. Auth., Student Housing Rev. Ref. Bonds (Campus Village Apartments Project), Series 2008, 5.375% 2028 | 1,000 | 1,050 |
| Educational and Cultural Facs. Auth., Student Housing Rev. Ref. Bonds (Campus Village Apartments Project), Series 2008, 5.50% 2038 | 1,000 | 1,047 |
| Health Facs. Auth., Health Care Facs. Rev. Bonds (American Baptist Homes of the Midwest Obligated Group), Series 2007-A, 5.90% 2037 | 1,525 | 1,497 |
| Health Facs. Auth., Health Care Facs. Rev. Bonds (American Baptist Homes of the Midwest Obligated Group), Series 2013, 8.00% 2043 | 11,100 | 12,578 |
| Health Facs. Auth., Health Facs. Rev. Ref. Bonds (Evangelical Lutheran Good Samaritan Society Project), Series 2012, 5.00% 2025 | 500 | 538 |
| Health Facs. Auth., Health Facs. Rev. Ref. Bonds (Evangelical Lutheran Good Samaritan Society Project), Series 2012, 5.00% 2042 | 11,555 | 11,793 |
| Health Facs. Auth., Health Facs. Rev. Ref. Bonds (Evangelical Lutheran Good Samaritan Society Project), Series 2013, 5.625% 2043 | 2,000 | 2,115 |
| Health Facs. Auth., Health Facs. Rev. Ref. Bonds (Evangelical Lutheran Good Samaritan Society Project), Series 2015-A, 5.00% 2030 | 2,000 | 2,142 |
| Health Facs. Auth., Health Facs. Rev. Ref. Bonds (Evangelical Lutheran Good Samaritan Society Project), Series 2015-A, 5.00% 2033 | 100 | 105 |
| Health Facs. Auth., Health Facs. Rev. Ref. Bonds (Evangelical Lutheran Good Samaritan Society Project), Series 2015-A, 5.00% 2036 | 2,360 | 2,448 |
| Health Facs. Auth., Health Facs. Rev. Ref. Bonds (Evangelical Lutheran Good Samaritan Society Project), Series 2015-A, 5.00% 2045 | 750 | 772 |
| Health Facs. Auth., Hospital Rev. Bonds (Adventist Health System/Sunbelt Obligated Group), Series 2016-A, 5.00% 2041 | 1,000 | 1,117 |
| Health Facs. Auth., Rev. Bonds (Senior Residences Project), Series 2012, 7.00% 20424 | 2,500 | 1,953 |
| Health Facs. Auth., Rev. Bonds (Senior Residences Project), Series 2012, 7.125% 20474 | 5,500 | 4,411 |
| Health Facs. Auth., Rev. Bonds (Total Longterm Care National Obligated Group Project), Series 2011, 6.00% 2040 (preref. 2021) | 1,250 | 1,495 |
| Health Facs. Auth., Rev. Ref. Bonds (Covenant Retirement Communities, Inc.), Series 2012-A, 5.00% 2033 | 4,750 | 4,982 |
| Health Facs. Auth., Rev. Ref. Bonds (Covenant Retirement Communities, Inc.), Series 2013-A, 5.50% 2028 | 525 | 587 |
| Health Facs. Auth., Rev. Ref. Bonds (Covenant Retirement Communities, Inc.), Series 2013-A, 5.75% 2036 | 1,000 | 1,109 |
| Health Facs. Auth., Rev. Ref. Bonds (Covenant Retirement Communities, Inc.), Series 2015-A, 5.00% 2029 | 1,500 | 1,638 |
| Health Facs. Auth., Rev. Ref. Bonds (Covenant Retirement Communities, Inc.), Series 2015-A, 5.00% 2035 | 2,500 | 2,657 |
| Health Facs. Auth., Rev. Ref. Bonds (Total Longterm Care National Obligated Group Project), Series 2010-A, 6.00% 2030 (preref. 2020) | 350 | 407 |
| Health Facs. Auth., Rev. Ref. Bonds (Total Longterm Care National Obligated Group Project), Series 2010-A, 6.25% 2040 (preref. 2020) | 975 | 1,143 |
| Health Facs. Auth., Rev. Ref. Bonds (Christian Living Neighbourhoods Project), Series 2016, 5.00% 2026 | 750 | 789 |
| Health Facs. Auth., Rev. Ref. Bonds (Christian Living Neighbourhoods Project), Series 2016, 5.00% 2037 | 2,500 | 2,512 |
| International Center Metropolitan Dist. No. 3 (City of Aurora), G.O. Rev. Ref. and Improvement Bonds (Limited Tax Convertible to Unlimited Tax), Series 2016, 4.625% 2031 | 635 | 593 |
| International Center Metropolitan Dist. No. 3 (City of Aurora), G.O. Rev. Ref. and Improvement Bonds (Limited Tax Convertible to Unlimited Tax), Series 2016, 5.00% 2046 | 3,140 | 2,889 |
| City of Lakewood, Plaza Metropolitan Dist. No. 1, Rev. Ref. Bonds, Series 2013, 5.00% 20203 | 1,500 | 1,584 |
| Leyden Rock Metropolitan Dist. No. 10 (in the City of Arvada), Limited Tax (Convertible to Unlimited Tax) G.O. Rev. Ref. and Improvement Bonds, Series 2016-A, 4.00% 2025 | 500 | 475 |
| Leyden Rock Metropolitan Dist. No. 10 (in the City of Arvada), Limited Tax (Convertible to Unlimited Tax) G.O. Rev. Ref. and Improvement Bonds, Series 2016-A, 4.375% 2033 | 750 | 682 |
| Leyden Rock Metropolitan Dist. No. 10 (in the City of Arvada), Limited Tax (Convertible to Unlimited Tax) G.O. Rev. Ref. and Improvement Bonds, Series 2016-A, 5.00% 2045 | 1,000 | 928 |
| Leyden Rock Metropolitan Dist. No. 10 (in the City of Arvada), Limited Tax (Convertible to Unlimited Tax) G.O. Rev. Ref. and Improvement Bonds, Series 2016-B, 7.25% 20454 | 500 | 450 |
| Bonds, notes & other debt instruments Colorado (continued) | Principal amount (000) | Value (000) |
| Midcities Metropolitan Dist. No. 2 (In the City and County of Broomfield), Special Rev. Ref. Bonds, Series 2016-B, 7.75% 20464 | $1,445 | $1,317 |
| Mountain Shadows Metropolitan Dist., Limited Tax G.O. Rev. Ref. and Improvement Bonds, 5.00% 2035 | 2,000 | 1,983 |
| Mountain Shadows Metropolitan Dist., Limited Tax G.O. Rev. Ref. and Improvement Bonds, 5.00% 2046 | 750 | 705 |
| Park Creek Metropolitan Dist., Limited Property Tax Supported Rev. Ref. Bonds, Series 2015-A, 5.00% 2045 | 750 | 800 |
| Park Creek Metropolitan Dist., Limited Property Tax Supported Rev. Ref. Bonds, Series 2015-A, 5.00% 2026 | 2,700 | 3,049 |
| Park Creek Metropolitan Dist., Limited Property Tax Supported Rev. Ref. Bonds, Series 2015-A, 5.00% 2027 | 3,500 | 3,921 |
| Prairie Center Metropolitan Dist. No. 3 (City of Brighton, Adams County), Limited Property Tax Supported Primary Improvements Rev. Bonds, Series 2006-A, 5.40% 2031 | 4,200 | 4,100 |
| Public Auth. for Colorado Energy, Natural Gas Purchase Rev. Bonds, Series 2008, 6.25% 2028 | 2,000 | 2,436 |
| Regional Transportation Dist., Private Activity Bonds (Denver Transit Partners Eagle P3 Project), Series 2010, 6.00% 2034 | 1,700 | 1,888 |
| Regional Transportation Dist., Private Activity Bonds (Denver Transit Partners Eagle P3 Project), Series 2010, 6.00% 2041 | 14,800 | 16,393 |
| Solaris Metropolitan Dist. No. 3 (In the Town of Vail), Limited Tax (Convertible to Unlimited Tax) G.O. Rev. Ref. Bonds, Series 2016-A, 5.00% 2036 | 1,335 | 1,333 |
| Solaris Metropolitan Dist. No. 3 (In the Town of Vail), Limited Tax (Convertible to Unlimited Tax) G.O. Rev. Ref. Bonds, Series 2016-A, 5.00% 2046 | 2,880 | 2,817 |
| Solaris Metropolitan Dist. No. 3 (In the Town of Vail), Limited Tax G.O. Rev. Ref. Bonds, Series 2016-B, 7.00% 20464 | 1,500 | 1,373 |
| Southlands Metropolitan Dist. No. 1 (City of Aurora), G.O. Ref. and Improvement Bonds, Series 2007, RADIAN insured, 5.25% 2034 | 430 | 440 |
| Tallyn’s Reach Metropolitan Dist. No. 3 (City of Aurora), Limited Tax G.O. Bonds (Convertible to Unlimited Tax), Series 2007, 5.20% 2036 | 3,225 | 3,126 |
| Tallyn’s Reach Metropolitan Dist. No. 3 in the City of Aurora, Limited Tax G.O. Ref. and Improvement Bonds, Series 2013, 5.00% 2033 | 505 | 519 |
| Tallyn’s Reach Metropolitan Dist. No. 3 in the City of Aurora, Limited Tax G.O. Ref. and Improvement Bonds, Series 2013, 5.125% 2038 | 2,070 | 2,129 |
| Vista Ridge Metropolitan Dist. (Weld County), Limited Tax G.O. Rev. Ref. Bonds, Series 2006-B, 0% 2040 (preref. 2021)1 | 2,220 | 2,818 |
| 210,120 | ||
| Connecticut 0.94% | ||
| Town of Hamden, Rev. Bonds (Whitney Center Project), Series 2009-A, 7.625% 2030 | 1,105 | 1,140 |
| Town of Hamden, Rev. Bonds (Whitney Center Project), Series 2009-A, 7.75% 2043 | 6,600 | 6,768 |
| Health and Educational Facs. Auth., Rev Bonds, Healthcare Fac. Expansion Issue (Church Home of Hartford Incorporated Project), Series 2016-A, 5.00% 20463 | 1,000 | 945 |
| Health and Educational Facs. Auth., Rev Bonds, Healthcare Fac. Expansion Issue (Church Home of Hartford Incorporated Project), Series 2016-A, 5.00% 20533 | 1,440 | 1,338 |
| Health and Educational Facs. Auth., Rev Bonds, Healthcare Fac. Expansion Issue (Church Home of Hartford Incorporated Project), Series 2016-B-2, 2.875% 20203 | 1,400 | 1,369 |
| Health and Educational Facs. Auth., Rev. Bonds (Hartford Healthcare Issue), Series 2011-A, 5.00% 2032 | 250 | 268 |
| Health and Educational Facs. Auth., Rev. Bonds, Masonicare Issue, Series 2016-F, 5.00% 2037 | 2,000 | 2,034 |
| Health and Educational Facs. Auth., Rev. Bonds, Masonicare Issue, Series 2016-F, 5.00% 2043 | 2,765 | 2,790 |
| Housing Fin. Auth., Housing Mortgage Fin. Program Bonds, Series 2016-B-2, AMT, 3.50% 2039 | 1,330 | 1,387 |
| Housing Fin. Auth., Housing Mortgage Fin. Program Bonds, Series 2016-F-2, AMT, 3.50% 2039 | 1,250 | 1,309 |
| Mohegan Tribe of Indians, Gaming Auth. Priority Distribution Payment, Public Improvement Bonds, Series 2003, 5.125% 2023 | 2,180 | 2,123 |
| Mohegan Tribe of Indians, Gaming Auth. Priority Distribution Payment, Public Improvement Bonds, Series 2016-A, 5.50% 20263 | 7,500 | 7,258 |
| Mohegan Tribe of Indians, Gaming Auth. Priority Distribution Payment, Public Improvement Rev. Ref. Bonds, 7.00% 20453 | 5,000 | 5,187 |
| Bonds, notes & other debt instruments Connecticut (continued) | Principal amount (000) | Value (000) |
| Mohegan Tribe of Indians, Gaming Auth. Priority Distribution Payment, Public Improvement Rev. Ref. Bonds, Series 2015-A, 6.75% 20453 | $7,940 | $8,128 |
| Mohegan Tribe of Indians, Gaming Auth. Priority Distribution Payment, Public Improvement Rev. Ref. Bonds, Series 2015-C, 6.25% 20303 | 4,500 | 4,475 |
| 46,519 | ||
| Delaware 0.00% | ||
| Housing Auth., Single Family Mortgage Rev. Ref. Bonds, Series 2009-A-1, 5.45% 2040 | 195 | 201 |
| District of Columbia 0.74% | ||
| Dist. of Columbia, Rev. Ref. Bonds (Catholic University of America Issue), Series 2007, National insured, 5.00% 2029 | 190 | 191 |
| Dulles Toll Road, Rev. Bonds (Dulles Metrorail and Capital Improvement Projects), Convertible Capital Appreciation Bonds, Series 2010-B, 0% 20441 | 5,000 | 5,537 |
| Dist. of Columbia, Rev. Bonds (Friendship Public Charter School, Inc. Issue), Series 2016-A, 5.00% 2036 | 3,395 | 3,460 |
| Dist. of Columbia, Rev. Bonds (Friendship Public Charter School, Inc. Issue), Series 2016-A, 5.00% 2041 | 1,545 | 1,565 |
| Dist. of Columbia, Rev. Bonds (Friendship Public Charter School, Inc. Issue), Series 2016-A, 5.00% 2046 | 4,170 | 4,207 |
| Metropolitan Washington DC Airports Auth., Dulles Toll Road Rev., Capital Appreciation Bonds, Series 2009-B, Assured Guaranty Municipal insured, 0% 2040 | 15,275 | 5,296 |
| Tobacco Settlement Fncg. Corp., Tobacco Settlement Asset-Backed Bonds, Series 2006-A, 0% 2046 | 145,000 | 16,584 |
| 36,840 | ||
| Florida 6.01% | ||
| Alachua County, Health Facs. Auth., Continuing Care Retirement Community Rev. Ref. Bonds (Oak Hammock at the University of Florida, Inc. Project), Series 2012-A, 8.00% 2032 | 500 | 594 |
| Alachua County, Health Facs. Auth., Continuing Care Retirement Community Rev. Ref. Bonds (Oak Hammock at the University of Florida, Inc. Project), Series 2012-A, 8.00% 2042 | 2,000 | 2,373 |
| Alachua County, Health Facs. Auth., Continuing Care Retirement Community Rev. Ref. Bonds (Oak Hammock at the University of Florida, Inc. Project), Series 2012-A, 8.00% 2046 | 1,500 | 1,777 |
| Alachua County, Health Facs. Auth., Health Facs. Rev. Bonds (Shands HealthCare Project), Series 2007-A, 1.494% 20372 | 415 | 363 |
| Alachua County, Health Facs. Auth., Health Facs. Rev. Ref. Bonds (Shands HealthCare Project), Series 2008-D-2, 6.75% 2030 (preref. 2018) | 900 | 992 |
| Alachua County, Health Facs. Auth., Health Facs. Rev. Ref. Bonds (Shands HealthCare Project), Series 2014-A, 5.00% 2044 | 3,700 | 3,924 |
| City of Atlantic Beach, Health Care Facs. Rev. and Rev. Ref. Bonds (Fleet Landing Project), Series 2013-A, 5.00% 2022 | 100 | 112 |
| City of Atlantic Beach, Health Care Facs. Rev. Bonds (Fleet Landing Project), Series 2013-B, 5.625% 2043 | 1,000 | 1,090 |
| Brevard County Educational Facs. Auth., Demand Rev. Bonds (Florida Institute of Technology Project), Series 2014, 5.00% 2032 | 2,470 | 2,674 |
| Brevard County Educational Facs. Auth., Demand Rev. Bonds (Florida Institute of Technology Project), Series 2014, 5.00% 2039 | 750 | 797 |
| Broward County, Airport System Rev. Ref. Bonds, Series 2012-P-1, AMT, 5.00% 2023 | 4,000 | 4,491 |
| Broward County, Airport System Rev. Ref. Bonds, Series 2013-A, 5.25% 2043 | 2,000 | 2,190 |
| Broward County, Airport System Rev. Ref. Bonds, Series 2015-A, AMT, 5.00% 2034 | 2,000 | 2,194 |
| Broward County, Airport System Rev. Ref. Bonds, Series 2015-A, AMT, 5.00% 2035 | 2,000 | 2,187 |
| City of Cape Coral, Health Facs. Auth., Senior Housing Rev. Bonds (Gulf Care, Inc. Project), 6.00% 20453 | 7,000 | 7,336 |
| Championsgate Community Dev. Dist., Capital Improvement Rev. Bonds, Series 1998-A, 6.25% 2020 | 1,350 | 1,350 |
| Community Redev. Agcy., Tax Increment Rev. Bonds (Southeast Overtown/Park West), Series 2014-A-1, 5.00% 20243 | 1,000 | 1,110 |
| Community Redev. Agcy., Tax Increment Rev. Bonds (Southeast Overtown/Park West), Series 2014-A-1, 5.00% 20303 | 7,000 | 7,545 |
| Dev. Fin. Corp., Healthcare Facs. Rev. Bonds (UF Health - Jacksonville Project), Series 2013-A, 5.50% 2028 | 1,435 | 1,548 |
| Dev. Fin. Corp., Healthcare Facs. Rev. Bonds (UF Health - Jacksonville Project), Series 2013-A, 6.00% 2033 | 11,930 | 13,176 |
| Bonds, notes & other debt instruments Florida (continued) | Principal amount (000) | Value (000) |
| Escambia County, Health Facs. Auth., Health Care Facs. Rev. Bonds (Baptist Hospital, Inc. Project), Series 2010-A, 5.75% 2029 | $5,250 | $5,780 |
| Gramercy Farms Community Dev. Dist. (St. Cloud), Special Assessment Bonds, Series 2007-B, 5.10% 2024 (put 2014)4 | 10,260 | — |
| Gramercy Farms Community Dev. Dist. (St. Cloud), Special Assessment Ref. Bonds, Series 2011, 0% 2039 | 40,185 | 7,265 |
| Greater Orlando Aviation Auth. (City of Orlando), Airport Facs. Rev. Bonds, Series 2016-A, AMT, 5.00% 2046 | 2,000 | 2,201 |
| Greater Orlando Aviation Auth. (City of Orlando), Airport Facs. Rev. Ref. Bonds, Series 2016, AMT, 5.00% 2027 | 1,000 | 1,160 |
| Halifax Hospital Medical Center, Hospital Rev. Ref. Bonds, Series 2016, 5.00% 2028 | 1,000 | 1,127 |
| Halifax Hospital Medical Center, Hospital Rev. Ref. Bonds, Series 2016, 5.00% 2030 | 2,750 | 3,046 |
| Harbor Bay Community Dev. Dist. (Hillsborough County), Capital Improvement Rev. Bonds, Series 2002, 6.75% 2034 | 3,440 | 3,455 |
| Jacksonville Econ. Dev. Commission, Health Care Facs. Rev. Ref. Bonds (Proton Therapy Institute Project), Series 2007-A, 6.25% 20273 | 4,565 | 4,607 |
| Lake Ashton II Community Dev. Dist. (Polk County), Capital Improvement Rev. Bonds, Series 2005-A, 5.375% 2036 | 2,190 | 1,858 |
| Lakewood Ranch Stewardship Dist., Special Assessment Rev. Bonds (Lake Club Project), Series 2006, 5.50% 2036 | 2,695 | 2,703 |
| Lakewood Ranch Stewardship Dist., Special Assessment Rev. Bonds (Lake Club Project), Series 2006-B, 6.77% 2020 | 1,790 | 1,815 |
| Lakewood Ranch Stewardship Dist., Special Assessment Rev. Bonds (Lake Club Project), Series 2015, 4.875% 2045 | 2,160 | 2,093 |
| Lakewood Ranch Stewardship Dist., Special Assessment Rev. Bonds (Lake Club Project), 4.875% 2035 | 500 | 493 |
| Lee County, Industrial Dev. Auth., Healthcare Facs. Rev. Ref. Bonds (Shell Point/Alliance Obligated Group, Shell Point Project), Series 2011-B, 6.50% 2031 | 2,600 | 2,942 |
| Lee County, Airport Rev. Ref. Bonds, Series 2010-A, AMT, Assured Guaranty insured, 5.00% 2022 | 1,860 | 2,012 |
| Lee County, Airport Rev. Ref. Bonds, Series 2011-A, AMT, 5.375% 2032 | 9,935 | 11,011 |
| Lee County, Industrial Dev. Auth., Healthcare Facs. Rev. Ref. Bonds (Shell Point/Alliance Obligated Group, Shell Point Village/Alliance Community Project), Series 2007, 5.00% 2022 | 3,000 | 3,024 |
| Lee County, Industrial Dev. Auth., Healthcare Facs. Rev. Ref. Bonds (Shell Point/Alliance Obligated Group, Shell Point Village/Alliance Community Project), Series 2007, 5.00% 2029 | 13,425 | 13,501 |
| Magnolia Creek Community Dev. Dist. (City of Freeport), Capital Improvement Rev. Bonds, Series 2007-B, 5.60% 20244 | 4,255 | 892 |
| Marshall Creek Community Dev. Dist. (St. Johns County), Special Assessment Bonds, Series 2002, 6.625% 20324 | 3,385 | 3,316 |
| Marshall Creek Community Dev. Dist., Special Assessment Bonds, 6.32% 2045 | 220 | 203 |
| Martin County, Health Facs. Auth., Hospital Rev. Bonds (Martin Memorial Medical Center), 5.00% 2045 | 500 | 527 |
| Martin County, Health Facs. Auth., Hospital Rev. Ref. Bonds (Martin Memorial Medical Center), Series 2012-B, 3.74% 2023 | 250 | 257 |
| Martin County, Health Facs. Auth., Hospital Rev. Bonds (Martin Memorial Medical Center), Series 2012, 5.50% 2042 | 8,445 | 9,056 |
| Meadow Pointe IV, Community Dev. Dist. (Pasco County), Capital Improvement Rev. Bonds, Series 2004-A, 6.00% 20364 | 1,035 | — |
| Meadow Pointe IV, Community Dev. Dist. (Pasco County), Capital Improvement Rev. Bonds, Series 2012-A-1, 6.00% 2036 | 160 | 152 |
| Meadow Pointe IV, Community Dev. Dist. (Pasco County), Capital Improvement Rev. Bonds, Series 2012-A-2, 6.25% 2038 | 290 | 276 |
| Meadow Pointe IV, Community Dev. Dist. (Pasco County), Capital Improvement Rev. Bonds, Series 2012-B, 6.81% 2020 | 240 | 240 |
| Midtown Miami Community Dev. Dist., Special Assessment and Rev. Ref. Bonds (Infrastructure Project), Series 2014-B, 5.00% 2037 | 1,735 | 1,779 |
| Midtown Miami Community Dev. Dist., Special Assessment and Rev. Ref. Bonds (Parking Garage Project), Series 2014-A, 4.25% 2024 | 835 | 863 |
| Midtown Miami Community Dev. Dist., Special Assessment and Rev. Ref. Bonds (Parking Garage Project), Series 2014-A, 5.00% 2037 | 1,490 | 1,528 |
| Bonds, notes & other debt instruments Florida (continued) | Principal amount (000) | Value (000) |
| City of Miami Beach, Health Facs. Auth., Hospital Rev. Ref. Bonds (Mount Sinai Medical Center of Florida), Series 2012, 5.00% 2021 | $1,000 | $1,116 |
| City of Miami Beach, Health Facs. Auth., Hospital Rev. Ref. Bonds (Mount Sinai Medical Center of Florida), Series 2012, 5.00% 2022 | 1,750 | 1,976 |
| City of Miami Beach, Health Facs. Auth., Hospital Rev. Ref. Bonds (Mount Sinai Medical Center of Florida), Series 2012, 5.00% 2023 | 2,250 | 2,517 |
| City of Miami Beach, Health Facs. Auth., Hospital Rev. Ref. Bonds (Mount Sinai Medical Center of Florida), Series 2014, 5.00% 2039 | 1,500 | 1,576 |
| Miami-Dade County, Educational Facs. Auth., Rev. Ref. Bonds (University of Miami Issue), Series 2007-B, AMBAC insured, 5.25% 2024 | 1,000 | 1,171 |
| Miami-Dade County, Aviation Rev. Ref. Bonds, Series 2012-A, AMT, 5.00% 2024 | 2,000 | 2,250 |
| Miami-Dade County, Aviation Rev. Ref. Bonds, Series 2014-A, AMT, 5.00% 2033 | 5,000 | 5,441 |
| Miami-Dade County, Expressway Auth., Toll System Rev. Ref. Bonds, Series 2016-A, 5.00% 2030 | 1,225 | 1,416 |
| Miami-Dade County, Expressway Auth., Toll System Rev. Ref. Bonds, Series 2016-A, 5.00% 2032 | 1,140 | 1,306 |
| Mid-Bay Bridge Auth., Rev. Ref. Bonds, Series 2015-A, 5.00% 2029 | 1,910 | 2,145 |
| Mid-Bay Bridge Auth., Rev. Ref. Bonds, Series 2015-A, 5.00% 2030 | 1,500 | 1,676 |
| Mid-Bay Bridge Auth., Rev. Ref. Bonds, Series 2015-A, 5.00% 2035 | 2,000 | 2,191 |
| Mid-Bay Bridge Auth., Rev. Ref. Bonds, Series 2015-A, 5.00% 2035 | 1,000 | 1,084 |
| Mid-Bay Bridge Auth., Rev. Ref. Bonds, Series 2015-A, 5.00% 2040 | 1,000 | 1,089 |
| Mid-Bay Bridge Auth., Rev. Ref. Bonds, Series 2015-C, 5.00% 2030 | 2,500 | 2,767 |
| Mid-Bay Bridge Auth., Rev. Ref. Bonds, Series 2015-C, 5.00% 2040 | 1,935 | 2,083 |
| Orange County, Health Facs. Auth., Health Care Facs. Rev. Ref. Bonds (Presbyterian Retirement Communities Project), 5.00% 2035 | 1,500 | 1,576 |
| Orange County, Health Facs. Auth., Health Care Facs. Rev. Ref. Bonds (Presbyterian Retirement Communities Project), 5.00% 2040 | 3,000 | 3,122 |
| Orange County, Health Facs. Auth., Health Care Facs. Rev. Ref. Bonds (Presbyterian Retirement Communities Project), 5.00% 2045 | 4,300 | 4,454 |
| Orange County, Industrial Dev. Auth., Industrial Dev. Rev. Bonds (VITAG Florida LLC Project), Series 2014, AMT, 8.00% 20363 | 2,500 | 2,311 |
| Orange County, Health Facs. Auth., Health Care Facs. Rev. Ref. Bonds (Presbyterian Retirement Communities Project), 5.00% 2036 | 1,600 | 1,699 |
| Orange County, Health Facs. Auth., Health Care Facs. Rev. Ref. Bonds (Presbyterian Retirement Communities Project), 5.00% 2041 | 4,380 | 4,617 |
| Orange County, Health Facs. Auth., Health Care Facs. Rev. Ref. Bonds (Presbyterian Retirement Communities Project), 5.00% 2047 | 6,280 | 6,595 |
| Orange County, Health Facs. Auth., Hospital Rev. Ref. Bonds (Orlando Health Obligated Group), Series 2016-A, 5.00% 2033 | 1,240 | 1,386 |
| Orange County, Health Facs. Auth., Rev. Bonds (Presbyterian Retirement Communities Project), Series 2014, 5.00% 2026 | 1,965 | 2,164 |
| Palm Beach County, Health Facs. Auth., Rev. Bonds (Lifespaces Communities, Inc.), Series 2015-C, 5.00% 2028 | 1,875 | 2,126 |
| Palm Beach County, Health Facs. Auth., Rev. Bonds (Lifespaces Communities, Inc.), Series 2016-B, 5.00% 2036 | 1,250 | 1,322 |
| Palm Beach County, Health Facs. Auth., Retirement Communities Rev. Bonds (ACTS Retirement-Life Communities, Inc. Obligated Group), Series 2016, 5.00% 2032 | 11,675 | 12,573 |
| Palm Coast Park Community Dev. Dist. (City of Palm Coast, Flagler County), Special Assessment Bonds, Series 2006, 5.70% 2037 | 3,210 | 3,036 |
| Town Center at Palm Coast Community Dev. Dist. (City of Palm Coast, Flagler County), Capital Improvement Rev. Bonds, Series 2005, 6.00% 2036 | 2,410 | 2,350 |
| Paseo Community Dev. Dist., Fort Myers, Capital Improvement Rev. Bonds, Series 2005-B, 4.875% 2020 (put 2010)4 | 920 | — |
| Paseo Community Dev. Dist., Fort Myers, Capital Improvement Rev. Bonds, Series 2006, 5.00% 2021 (put 2011)4 | 1,385 | — |
| Paseo Community Dev. Dist., Fort Myers, Capital Improvement Rev. Bonds, Series 2011-A-1, 5.40% 2036 | 360 | 357 |
| Paseo Community Dev. Dist., Fort Myers, Capital Improvement Rev. Bonds, Series 2011-A-2, 0% 2036 | 2,985 | 1,164 |
| Bonds, notes & other debt instruments Florida (continued) | Principal amount (000) | Value (000) |
| City of Pompano Beach, Rev. Bonds (John Knox Village Project), Series 2015, 5.00% 2039 | $2,250 | $2,313 |
| City of Pompano Beach, Rev. Bonds (John Knox Village Project), Series 2015, 5.00% 2044 | 2,870 | 2,930 |
| City of Port St. Lucie, Utility System Rev. Ref. Bonds, Series 2016, 4.00% 2036 | 2,000 | 2,043 |
| Ports Fncg. Commission, Rev. Ref. Bonds (State Transportation Trust Fund - Intermodal Program), Series 2011-B, AMT, 5.375% 2029 | 1,000 | 1,131 |
| City of St. Cloud, Stevens Plantation Community Dev. Dist., Special Assessment Rev. Bonds, Series 2003-B, 6.375% 2023 (put 2013)4 | 1,165 | 816 |
| St. Johns County, Industrial Dev. Auth., Health Care Rev. Ref. Bonds (Vicar’s Landing Project), Series 2007, 5.00% 2017 | 340 | 341 |
| St. Johns County, Industrial Dev. Auth., Health Care Rev. Ref. Bonds (Vicar’s Landing Project), Series 2007, 5.00% 2027 | 4,800 | 4,808 |
| St. Johns County, Industrial Dev. Auth., Rev. Ref. Bonds (Presbyterian Retirement Communities Project), Series 2010-A, 5.875% 2040 (preref. 2020) | 3,625 | 4,174 |
| St. Johns County, Industrial Dev. Auth., Rev. Ref. Bonds (Presbyterian Retirement Communities Project), Series 2010-A, 6.00% 2045 (preref. 2020) | 1,600 | 1,849 |
| Seminole Tribe of Florida, Series A, 5.25% 20273 | 7,000 | 7,120 |
| Seminole Tribe of Florida, Series A, 5.50% 20243 | 3,900 | 3,977 |
| Seminole Tribe of Florida, Series A, 5.75% 20223 | 1,175 | 1,200 |
| Stevens Plantation Improvement Project Dependent Special Dist., Rev. Bonds, Series 2003, 6.375% 20234 | 2,035 | 1,425 |
| City of Tallahassee, Health Facs. Rev. Ref. Bonds (Tallahassee Memorial HealthCare, Inc. Project), Series 2016-A, 5.00% 2055 | 11,200 | 11,754 |
| City of Tallahassee, Health Facs. Rev. Ref. Bonds (Tallahassee Memorial HealthCare, Inc. Project), Series 2015-A, 5.00% 2040 | 1,350 | 1,414 |
| City of Tallahassee, Health Facs. Rev. Ref. Bonds (Tallahassee Memorial HealthCare, Inc. Project), Series 2016-A, 5.00% 2041 | 1,250 | 1,324 |
| City of Tampa, Hospital Rev. Ref. Bonds (H. Lee Moffitt Cancer Center Project), Series 2016-B, 5.00% 2037 | 750 | 811 |
| Tampa Rev. Ref. Bonds (University of Tampa Project), 5.00% 2045 | 3,945 | 4,286 |
| Tolomato Community Dev. Dist. (St. Johns County), Special Assessment Bonds, Series 2006, 5.40% 2037 | 1,095 | 1,070 |
| Volusia County, Educational Facs. Auth., Educational Facs. Rev. Ref. Bonds (Embry-Riddle Aeronautical University, Inc. Project), Series 2015-B, 5.00% 2030 | 1,500 | 1,653 |
| Volusia County, Educational Facs. Auth., Educational Facs. Rev. Ref. Bonds (Embry-Riddle Aeronautical University, Inc. Project), Series 2015-B, 5.00% 2031 | 1,520 | 1,668 |
| Volusia County, Educational Facs. Auth., Educational Facs. Rev. Bonds (Stetson University, Inc. Project), Series 2015, 5.00% 2045 | 1,000 | 1,098 |
| Waterset North Community Dev. Dist. (Hillsborough County), Special Assessment Rev. Bonds, Series 2007-A, 6.60% 2039 | 1,515 | 1,537 |
| West Villages Improvement Dist. (North Port), Special Assessment Bonds (Unit of Dev. No. 2), Series 2005, 5.80% 20364 | 5,835 | 3,499 |
| Winter Garden Village at Fowler Groves Community Dev. Dist. (City of Winter Garden), Special Assessment Rev. Ref. Bonds, Series 2016, 3.75% 2031 | 2,000 | 1,845 |
| Winter Garden Village at Fowler Groves Community Dev. Dist. (City of Winter Garden), Special Assessment Rev. Ref. Bonds, Series 2016, 4.125% 2037 | 2,000 | 1,812 |
| 297,559 | ||
| Georgia 1.71% | ||
| Atlanta Dev. Auth., Student Housing Rev. Bonds (ADA/CAU Partners, Inc. Project at Clark Atlanta University), Series 2004-A, ACA insured, 6.25% 2024 | 1,890 | 1,890 |
| Atlanta Dev. Auth., Student Housing Rev. Bonds (ADA/CAU Partners, Inc. Project at Clark Atlanta University), Series 2004-A, ACA insured, 6.25% 2036 | 140 | 137 |
| City of Atlanta, Tax Allocation Bonds (Beltline Project), Series 2008-B, 7.375% 2031 (preref. 2019) | 5,000 | 5,586 |
| Clayton County, Tax Allocation Bonds (Ellenwood Project), Series 2008, 7.50% 2033 | 3,100 | 3,149 |
| Dev. Auth. of Clayton County, Special Facs. Rev. Ref. Bonds (Delta Air Lines, Inc. Project), Series 2009-A, 8.75% 2029 | 5,000 | 5,936 |
| DeKalb County, Hospital Auth., Rev. Ref. Anticipation Certificates (DeKalb Medical Center, Inc. Project), Series 2010, 6.00% 2030 | 9,615 | 10,656 |
| Bonds, notes & other debt instruments Georgia (continued) | Principal amount (000) | Value (000) |
| DeKalb County, Hospital Auth., Rev. Ref. Anticipation Certificates (DeKalb Medical Center, Inc. Project), Series 2010, 6.125% 2040 | $7,315 | $8,003 |
| Joint Dev. Auth. of DeKalb County, Newton County and Gwinnett County, Rev. Bonds (GGC Foundation, LLC Project), Series 2009, 6.00% 2029 | 1,850 | 2,036 |
| Dev. Auth. of Fulton County, Rev. Bonds (TUFF CAUB LLC Project), Series 2007-A, 5.25% 2028 | 3,395 | 3,164 |
| Gainesville and Hall County Dev. Auth., Retirement Community Rev. Ref. Bonds (ACTS Retirement-Life Communities, Inc. Obligated Group), Series 2009-A-2, 6.375% 2029 (preref. 2019) | 710 | 809 |
| Gainesville and Hall County Dev. Auth., Retirement Community Rev. Ref. Bonds (ACTS Retirement-Life Communities, Inc. Obligated Group), Series 2009-A-2, 6.625% 2039 (preref. 2019) | 1,350 | 1,546 |
| Gainesville Redev. Auth., Educational Facs. Rev. Ref. Bonds (Riverside Military Academy Project), Series 2007, 5.00% 2018 | 1,025 | 1,025 |
| Gainesville Redev. Auth., Educational Facs. Rev. Ref. Bonds (Riverside Military Academy Project), Series 2007, 5.125% 2037 | 2,500 | 2,369 |
| Hospital Auth. of Hall County and City of Gainesville, Rev. Anticipation Certificates (Northeast Georgia Health System, Inc. Project), Series 2010-A, 5.00% 2030 | 2,000 | 2,139 |
| Higher Education Facs. Auth., Rev. Bonds (USG Real Estate Foundation II, LLC Project), 6.00% 2034 (preref. 2018) | 3,335 | 3,560 |
| Higher Education Facs. Auth., Rev. Bonds (USG Real Estate Foundation II, LLC Project), 6.00% 2034 (preref. 2018) | 1,085 | 1,158 |
| Higher Education Facs. Auth., Rev. Bonds (USG Real Estate Foundation II, LLC Project), Series 2009-A, 5.50% 2039 | 3,500 | 3,762 |
| Housing and Fin. Auth., Single-family Mortgage Bonds, Series 2016-B-2, AMT, 3.50% 2039 | 3,000 | 3,134 |
| Main Street Natural Gas, Inc., Gas Project Rev. Bonds, Series 2007-A, 5.50% 2023 | 1,000 | 1,158 |
| Main Street Natural Gas, Inc., Gas Project Rev. Bonds, Series 2007-A, 5.50% 2026 | 1,000 | 1,179 |
| Medical Center Hospital Auth., Rev. Ref. Bonds (Spring Harbor at Green Island Project), Series 2007, 5.25% 2027 | 5,250 | 5,255 |
| Medical Center Hospital Auth., Rev. Ref. Bonds (Spring Harbor at Green Island Project), Series 2007, 5.25% 2037 | 1,525 | 1,522 |
| Municipal Electric Auth., Plant Vogtle Units 3 & 4 Project J Bonds, Series 2015-A, 5.00% 2060 | 3,190 | 3,446 |
| Municipal Electric Auth., Series 2015-A, 5.50% 2060 | 2,000 | 2,248 |
| Private Colleges and Universities Auth., Rev. Bonds (The Savannah College of Art and Design Projects), Series 2014, 5.00% 2029 | 1,000 | 1,089 |
| Private Colleges and Universities Auth., Rev. Bonds (The Savannah College of Art and Design Projects), Series 2014, 5.00% 2044 | 2,000 | 2,101 |
| State Road and Tollway Auth., Toll Rev. Convertible CABS (I-75 S Expressway Lanes Project), Series 2014-A, 0% 20243 | 2,115 | 1,349 |
| State Road and Tollway Auth., Toll Rev. Convertible CABS (I-75 S Expressway Lanes Project), Series 2014-A, 0% 20343 | 3,495 | 1,114 |
| State Road and Tollway Auth., Toll Rev. Convertible CABS (I-75 S Expressway Lanes Project), Series 2014-B, 0% 20491,3 | 6,755 | 4,115 |
| 84,635 | ||
| Guam 0.33% | ||
| A.B. Won Pat International Airport Auth., General Rev. Bonds, Series 2013-C, AMT, 6.25% 2034 | 1,500 | 1,710 |
| A.B. Won Pat International Airport Auth., General Rev. Bonds, Series 2013-C, AMT, 6.375% 2043 | 1,500 | 1,719 |
| Government of Guam, Business Privilege Tax Bonds, Series 2011-A, 5.00% 2031 | 500 | 519 |
| Government of Guam, Business Privilege Tax Bonds, Series 2012-B-1, 5.00% 2032 | 2,000 | 2,070 |
| Government of Guam, Hotel Occupancy Tax Rev. Ref. Bonds, Series 2011-A, 6.125% 2031 | 1,000 | 1,157 |
| Government of Guam, Business Privilege Tax Bonds, Series 2015-D, 5.00% 2030 | 2,000 | 2,138 |
| Waterworks Auth., Water and Wastewater System Rev. Bonds, Series 2010, 5.25% 2025 | 2,000 | 2,137 |
| Waterworks Auth., Water and Wastewater System Rev. Bonds, Series 2010, 5.625% 2040 | 500 | 531 |
| Waterworks Auth., Water and Wastewater System Rev. Bonds, Series 2013, 5.50% 2043 | 3,750 | 4,107 |
| 16,088 |
| Bonds, notes & other debt instruments Hawaii 0.12% | Principal amount (000) | Value (000) |
| Dept. of Budget and Fin., Special Purpose Senior Living Rev. Bonds (15 Craigside Project), Series A, 8.75% 2029 (preref. 2019) | $945 | $1,119 |
| Dept. of Budget and Fin., Special Purpose Senior Living Rev. Bonds (15 Craigside Project), Series A, 9.00% 2044 (preref. 2019) | 3,250 | 3,921 |
| Pacific Health Obligated Group, Special Purpose Rev. Bonds (Dept. of Budget and Fin.), Series 2010-B, 5.75% 2040 | 1,000 | 1,084 |
| 6,124 | ||
| Idaho 0.14% | ||
| Health Facs. Auth., Rev. Ref. Bonds (Madison Memorial Hospital Project), Series 2016, 5.00% 2037 | 1,000 | 1,064 |
| Housing and Fin. Auth., Rev Bonds (Terraces of Boise Project), Series 2014-A, 8.00% 2044 | 1,000 | 1,064 |
| Housing and Fin. Auth., Rev Bonds (Terraces of Boise Project), Series 2014-A, 8.125% 2049 | 4,520 | 4,825 |
| 6,953 | ||
| Illinois 11.70% | ||
| Village of Bolingbrook, Will and DuPage Counties, Special Service Area No. 2005-1, Special Tax Bonds (Forest City Project), Series 2005, 5.90% 2027 | 6,000 | 5,924 |
| Board of Education of the City of Chicago, Unlimited Tax G.O. Rev. Ref. Bonds (Dedicated Alternative Rev.), Series 2015-A, 4.66% 2032 (put 2017)2 | 2,500 | 2,499 |
| Board of Education of the City of Chicago, Unlimited Tax G.O. Rev. Ref. Bonds (Dedicated Alternative Rev.), Series 2015-G, 4.66% 2032 (put 2017)2 | 2,500 | 2,499 |
| Board of Education of the City of Chicago, Unlimited Tax G.O. Rev. Ref. Bonds (Dedicated Rev.), Series 2013-A-3, 1.49% 2036 (put 2018)2 | 7,000 | 6,627 |
| Chicago Transit Auth., Sales Tax Receipts Rev. Bonds, Series 2017, 5.00% 2051 | 15,000 | 15,859 |
| City of Chicago, Board of Education, Unlimited Tax G.O. Bonds (Dedicated Rev.), Series 2011-A, 5.50% 2039 | 1,400 | 1,127 |
| City of Chicago, Board of Education, Unlimited Tax G.O. Bonds (Dedicated Rev.), Series 2016-B, 6.50% 2046 | 4,650 | 4,200 |
| City of Chicago, Board of Education, Unlimited Tax G.O. Project Bonds (Dedicated Alternate Rev.), Series 2015-C, 5.25% 2039 | 3,450 | 2,727 |
| City of Chicago, Board of Education, Unlimited Tax G.O. Rev. Ref. Bonds (Dedicated Rev.), Series 2008-C, 5.00% 2029 | 480 | 386 |
| City of Chicago, Board of Education, Unlimited Tax G.O. Rev. Ref. Bonds (Dedicated Rev.), Series 2010-F, 5.00% 2018 | 1,000 | 936 |
| City of Chicago, Chicago Midway Airport, Rev. Ref. Bonds, Series 2014-A, AMT, 5.00% 2030 | 5,000 | 5,422 |
| City of Chicago, Chicago Midway Airport, Rev. Ref. Bonds, Series 2014-A, AMT, 5.00% 2031 | 7,500 | 8,114 |
| City of Chicago, Chicago Midway Airport, Rev. Ref. Bonds, Series 2014-A, AMT, 5.00% 2032 | 5,000 | 5,390 |
| City of Chicago, Chicago Midway Airport, Rev. Ref. Bonds, Series 2014-A, AMT, 5.00% 2041 | 13,000 | 13,778 |
| City of Chicago, Chicago Midway Airport, Rev. Ref. Bonds, Series 2016-A, AMT, 5.00% 2027 | 1,810 | 2,043 |
| City of Chicago, Chicago Midway Airport, Rev. Ref. Bonds, Series 2016-A, AMT, 5.00% 2028 | 1,750 | 1,961 |
| City of Chicago, Chicago Midway Airport, Rev. Ref. Bonds, Series 2016-A, AMT, 5.00% 2029 | 2,500 | 2,783 |
| City of Chicago, Chicago Midway Airport, Rev. Ref. Bonds, Series 2016-A, AMT, 5.00% 2031 | 855 | 942 |
| City of Chicago, G.O. Bonds, Project and Ref. Series 2005-D, 5.50% 2040 | 1,000 | 965 |
| City of Chicago, G.O. Bonds, Ref. Series 2016-C, 5.00% 2035 | 1,290 | 1,210 |
| City of Chicago, G.O. Bonds, Series 2014-A, 5.25% 2029 | 3,400 | 3,318 |
| City of Chicago, G.O. Project and Rev. Ref. Bonds, Series 2014-A, 5.00% 2035 | 2,340 | 2,192 |
| City of Chicago, G.O. Project and Rev. Ref. Bonds, Series 2014-A, 5.25% 2030 | 4,000 | 3,890 |
| City of Chicago, G.O. Project and Rev. Ref. Bonds, Series 2017-A, 6.00% 2038 | 9,500 | 9,528 |
| City of Chicago, O’Hare International Airport, Customer Fac. Charge Rev. Bonds, Series 2013, 5.50% 2025 | 1,000 | 1,149 |
| City of Chicago, O’Hare International Airport, Customer Fac. Charge Rev. Bonds, Series 2013, 5.50% 2026 | 1,680 | 1,926 |
| City of Chicago, O’Hare International Airport, Customer Fac. Charge Rev. Bonds, Series 2013, 5.75% 2038 | 1,000 | 1,127 |
| City of Chicago, O’Hare International Airport, Customer Fac. Charge Rev. Bonds, Series 2013, 5.75% 2043 | 4,250 | 4,781 |
| City of Chicago, O’Hare International Airport, General Airport Rev. Bonds, Series 2011-A, 5.75% 2039 | 3,000 | 3,370 |
| City of Chicago, O’Hare International Airport, General Airport Rev. Bonds, Series 2017-D, 5.00% 2052 | 2,500 | 2,720 |
| City of Chicago, O’Hare International Airport, General Airport Rev. Ref. Bonds, Series 2012-A, AMT, 5.00% 2026 | 3,500 | 3,850 |
| Bonds, notes & other debt instruments Illinois (continued) | Principal amount (000) | Value (000) |
| City of Chicago, O’Hare International Airport, General Airport Rev. Ref. Bonds, Series 2013-A, AMT, 5.00% 2023 | $5,000 | $5,636 |
| City of Chicago, O’Hare International Airport, General Airport Rev. Ref. Bonds, Series 2015-A, AMT, 5.00% 2030 | 1,600 | 1,752 |
| City of Chicago, O’Hare International Airport, General Airport Rev. Ref. Bonds, Series 2015-A, AMT, 5.00% 2032 | 5,745 | 6,249 |
| City of Chicago, O’Hare International Airport, General Airport Rev. Ref. Bonds, Series 2015-A, AMT, 5.00% 2033 | 1,220 | 1,321 |
| City of Chicago, O’Hare International Airport, General Airport Rev. Ref. Bonds, Series 2015-A, AMT, 5.00% 2034 | 3,000 | 3,236 |
| City of Chicago, School Reform Board of Trustees of the Board of Education, Unlimited Tax G.O. Bonds (Dedicated Tax Rev.), Series 2011-A, 5.00% 2041 | 605 | 478 |
| City of Chicago, School Reform Board of Trustees of the Board of Education, Unlimited Tax G.O. Bonds (Dedicated Tax Rev.), Series 2012-A, 5.00% 2042 | 2,135 | 1,689 |
| City of Chicago, Wastewater Transmission Rev. Ref. Bonds, Series 2008-C, 5.00% 2023 | 1,000 | 1,116 |
| City of Chicago, Wastewater Transmission, Rev. Project Bonds, Series 2014, 5.00% 2020 | 460 | 496 |
| City of Chicago, Wastewater Transmission, Rev. Project Bonds, Series 2014, 5.00% 2024 | 1,000 | 1,119 |
| City of Chicago, Water Rev. Bonds, Project Series 2014, 5.00% 2022 | 250 | 280 |
| City of Chicago, Water Rev. Bonds, Series 2000, 5.00% 2028 | 1,000 | 1,117 |
| City of Chicago, Water Rev. Bonds, Series 2000, 5.00% 2029 | 1,000 | 1,109 |
| City of Chicago, Water Rev. Bonds, Series 2000, 5.00% 2030 | 700 | 771 |
| City of Chicago, Water Rev. Bonds, Series 2004, 5.00% 2023 | 2,500 | 2,812 |
| City of Chicago, Water Rev. Bonds, Series 2004, 5.00% 2024 | 2,000 | 2,261 |
| City of Chicago, Water Rev. Bonds, Series 2004, 5.00% 2027 | 1,750 | 1,964 |
| City of Chicago, Water Rev. Bonds, Series 2016-A-1, 5.00% 2031 | 1,000 | 1,094 |
| City of Chicago, Water Rev. Ref. Bonds, 5.00% 2042 | 1,700 | 1,807 |
| City of Chicago, Water Rev. Ref. Bonds, 5.00% 2044 | 500 | 535 |
| Community College Dist. No. 508, County of Cook (City Colleges of Chicago), Unlimited Tax G. O. Bonds, Series 2013, 5.25% 2043 | 3,000 | 3,171 |
| County of Cook, G.O. Rev. Ref. Bonds, Series 2016-A, 5.00% 2031 | 1,000 | 1,090 |
| Regional Transportation Auth. of Cook, DuPage, Kane, Lake, McHenry and Will Counties, G.O. Rev. Ref. Bonds, Series 2003-A, FGIC-National insured, 6.00% 2033 | 3,300 | 4,185 |
| County of DuPage, Special Service Area Number 31, Special Tax Bonds (Monarch Landing Project), Series 2006, 5.625% 2036 | 4,900 | 4,768 |
| Fin. Auth. Rev. Bonds (Silver Cross Hospital and Medical Centers), Series 2009, 7.00% 2044 (preref. 2019) | 1,055 | 1,205 |
| Fin. Auth., Charter School Project and Rev. Ref. Bonds (Chicago Charter School Foundation Project), Series 2007-A, 5.00% 2021 | 1,750 | 1,753 |
| Fin. Auth., Charter School Project and Rev. Ref. Bonds (Chicago Charter School Foundation Project), Series 2007-A, 5.00% 2026 | 1,000 | 1,001 |
| Fin. Auth., Charter School Project and Rev. Ref. Bonds (Chicago Charter School Foundation Project), Series 2007-A, 5.00% 2036 | 4,000 | 4,001 |
| Fin. Auth., Rev. Bonds (Advocate Health Care Network), Series 2014, 5.00% 2038 | 400 | 439 |
| Fin. Auth., Rev. Bonds (Benedictine University Project), Series 2013-A, 6.25% 2033 | 1,000 | 1,101 |
| Fin. Auth., Rev. Bonds (DePaul University), Series 2016, 5.00% 2041 | 1,000 | 1,101 |
| Fin. Auth., Rev. Bonds (Elmhurst Memorial Healthcare), Series 2008-A, 5.625% 2037 (preref. 2018) | 5,540 | 5,771 |
| Fin. Auth., Rev. Bonds (Franciscan Communities, Inc.), Series 2013-A, 5.125% 2043 | 2,405 | 2,391 |
| Fin. Auth., Rev. Bonds (Hospital Sisters Services, Inc. - Obligated Group), Series 2012-C, 5.00% 2020 | 230 | 255 |
| Fin. Auth., Rev. Bonds (Lifespace Communitys), Series 2015-A, 5.00% 2045 | 3,500 | 3,632 |
| Fin. Auth., Rev. Bonds (Mercy Health Corp.), Series 2016, 5.00% 2034 | 3,600 | 3,863 |
| Fin. Auth., Rev. Bonds (Mercy Health Corp.), Series 2016, 5.00% 2040 | 2,000 | 2,114 |
| Fin. Auth., Rev. Bonds (Mercy Health Corp.), Series 2016, 5.00% 2046 | 6,000 | 6,315 |
| Fin. Auth., Rev. Bonds (Northwest Community Hospital), Series 2016-A, 5.00% 2033 | 1,800 | 1,998 |
| Fin. Auth., Rev. Bonds (OSF Healthcare System), Series 2015-A, 4.125% 2037 | 5,410 | 5,306 |
| Fin. Auth., Rev. Bonds (Plymouth Place Inc.), 5.00% 2037 | 1,250 | 1,274 |
| Fin. Auth., Rev. Bonds (Plymouth Place Inc.), 5.25% 2045 | 1,155 | 1,177 |
| Bonds, notes & other debt instruments Illinois (continued) | Principal amount (000) | Value (000) |
| Fin. Auth., Rev. Bonds (Plymouth Place Inc.), 5.25% 2050 | $3,410 | $3,426 |
| Fin. Auth., Rev. Bonds (Presbyterian Homes Obligated Group), Series 2016-A, 5.00% 2025 | 1,060 | 1,215 |
| Fin. Auth., Rev. Bonds (Presbyterian Homes Obligated Group), Series 2016-A, 5.00% 2026 | 1,000 | 1,141 |
| Fin. Auth., Rev. Bonds (Presbyterian Homes Obligated Group), Series 2016-A, 5.00% 2026 | 1,000 | 1,138 |
| Fin. Auth., Rev. Bonds (Presbyterian Homes Obligated Group), Series 2016-A, 5.00% 2028 | 2,240 | 2,490 |
| Fin. Auth., Rev. Bonds (Presbyterian Homes Obligated Group), Series 2016-A, 5.00% 2029 | 3,000 | 3,306 |
| Fin. Auth., Rev. Bonds (Presbyterian Homes Obligated Group), Series 2016-A, 5.00% 2030 | 1,500 | 1,639 |
| Fin. Auth., Rev. Bonds (Presbyterian Homes Obligated Group), Series 2016-A, 5.00% 2031 | 1,000 | 1,084 |
| Fin. Auth., Rev. Bonds (Presbyterian Homes Obligated Group), Series 2016-B, 1.89% 2036 (put 2021)2 | 800 | 801 |
| Fin. Auth., Rev. Bonds (Rehab Institute of Chicago), Series 2013-A, 6.00% 2043 | 2,300 | 2,618 |
| Fin. Auth., Rev. Bonds (Silver Cross Hospital and Medical Centers), Series 2015-C, 5.00% 2035 | 1,500 | 1,605 |
| Fin. Auth., Rev. Bonds (Silver Cross Hospital and Medical Centers), Series 2015-C, 5.00% 2044 | 5,500 | 5,777 |
| Fin. Auth., Rev. Ref. Bonds (Christian Homes Inc.), 5.00% 2031 | 1,875 | 1,966 |
| Fin. Auth., Rev. Ref. Bonds (Christian Homes Inc.), 5.00% 2036 | 1,000 | 1,012 |
| Fin. Auth., Rev. Ref. Bonds (Franciscan Communities, Inc.), Series 2007-A, 5.50% 2027 | 8,550 | 8,606 |
| Fin. Auth., Rev. Ref. Bonds (Franciscan Communities, Inc.), Series 2007-A, 5.50% 2037 | 4,025 | 4,045 |
| Fin. Auth., Rev. Ref. Bonds (Lutheran Hillside Village), Series 2006, 5.125% 2026 | 1,000 | 1,000 |
| Fin. Auth., Rev. Ref. Bonds (Northwestern Memorial Hospital), Series 2009-A, 6.00% 2039 | 6,000 | 6,626 |
| Fin. Auth., Rev. Ref. Bonds (OSF Healthcare System), Series 2007-A, 5.75% 2037 (preref. 2017) | 1,000 | 1,038 |
| Fin. Auth., Rev. Ref. Bonds (OSF Healthcare System), Series 2015-A, 5.00% 2035 | 5,450 | 5,930 |
| Fin. Auth., Rev. Ref. Bonds (OSF Healthcare System), Series 2015-A, 5.00% 2045 | 2,000 | 2,147 |
| Fin. Auth., Rev. Ref. Bonds (Provena Health), Series 2010-A, 6.00% 2028 (preref. 2020) | 2,280 | 2,613 |
| Fin. Auth., Rev. Ref. Bonds (Sherman Health Systems), Series 2007-A, 5.50% 2037 (preref 2017) | 2,000 | 2,046 |
| Fin. Auth., Rev. Ref. Bonds (Silver Cross Hospital and Medical Centers), Series 2015-C, 4.125% 2037 | 8,710 | 8,544 |
| Fin. Auth., Student Housing Rev. Bonds (CHF - Cook, LLC - Northeastern Illinois University Project), Series 2015-A, 5.00% 2023 | 775 | 801 |
| Fin. Auth., Student Housing Rev. Bonds (CHF-DeKalb II, L.L.C. - Northern Illinois University Project), Series 2011, 6.00% 2024 | 1,000 | 1,080 |
| Fin. Auth., Student Housing Rev. Bonds (CHF-Normal, LLC - Illinois State University Project), Series 2011, 7.00% 2043 | 6,765 | 7,488 |
| Fin. Auth., Student Housing Rev. Ref. Bonds (CHF-DeKalb II, LLC - Northern Illinois University Project), Series 2011, 6.875% 2043 | 11,510 | 12,744 |
| Fin. Auth., Student Housing Rev. Ref. Bonds, Educational Advancement Fund, Inc. (University Center), Series 2006-A, 5.25% 2034 | 2,935 | 2,943 |
| Fin. Auth., Student Housing Rev. Ref. Bonds, Educational Advancement Fund, Inc. (University Center), Series 2006-B, 5.00% 2025 | 5,000 | 5,005 |
| Fin. Auth., Student Housing Rev. Ref. Bonds, Educational Advancement Fund, Inc. (University Center), Series 2006-B, 5.25% 2019 | 2,875 | 2,880 |
| Fin. Auth., Rev. Bonds (Centegra Health System), Series 2014-A, 5.00% 2042 | 1,000 | 1,030 |
| Fin. Auth., Rev. Bonds (Edward-Elmhurst Healthcare), Series 2017-A, 5.00% 2032 | 1,000 | 1,089 |
| Fin. Auth., Rev. Bonds (Edward-Elmhurst Healthcare), Series 2017-A, 5.00% 2035 | 3,460 | 3,705 |
| Fin. Auth., Rev. Bonds (Presence Health Network Obligated Group), Series 2016-C, 5.00% 2027 | 875 | 942 |
| Fin. Auth., Rev. Bonds (Rush University Medical Center Obligated Group), Series 2015-A, 5.00% 2032 | 1,100 | 1,207 |
| Fin. Auth., Rev. Bonds (Rush University Medical Center Obligated Group), Series 2015-A, 5.00% 2038 | 1,500 | 1,608 |
| Fin. Auth., Rev. Bonds (Swedish Covenant Hospital), Series 2016-A, 5.00% 2032 | 1,500 | 1,590 |
| Fin. Auth., Rev. Bonds (Swedish Covenant Hospital), Series 2016-A, 5.00% 2033 | 1,500 | 1,578 |
| Fin. Auth., Rev. Bonds (Swedish Covenant Hospital), Series 2016-A, 5.00% 2035 | 1,500 | 1,565 |
| Fin. Auth., Rev. Bonds (Swedish Covenant Hospital), Series 2016-A, 5.00% 2037 | 1,000 | 1,039 |
| Fin. Auth., Rev. Ref. Bonds (OSF Healthcare System Obligated Group), Series 2010-A, 6.00% 2039 | 3,215 | 3,538 |
| Fin. Auth., Rev. Ref. Bonds (OSF Healthcare System Obligated Group), Series 2010-A, 6.00% 2039 (preref. 2020) | 5,765 | 6,612 |
| Fin. Auth., Rev. Ref. Bonds (Provena Health), Series 2009-A, 7.75% 2034 (preref. 2019) | 12,825 | 14,896 |
| Fin. Auth., Rev. Ref. Bonds (Provena Health), Series 2009-A, 7.75% 2034 (preref. 2019) | 125 | 145 |
| Fin. Auth., Rev. Ref. Bonds (University of Chicago Medical Center), Series 2009-B, 5.00% 2025 | 1,995 | 2,177 |
| Bonds, notes & other debt instruments Illinois (continued) | Principal amount (000) | Value (000) |
| Fin. Auth., Rev. Ref. Bonds (University of Chicago Medical Center), Series 2009-B, 5.00% 2025 (preref. 2020) | $1,005 | $1,130 |
| Fin. Auth., Student Housing Rev. Bonds (CHF - Cook, LLC - Northeastern Illinois University Project), Series 2015-A, 5.00% 2024 | 815 | 839 |
| Fin. Auth., Student Housing Rev. Bonds (CHF - Cook, LLC - Northeastern Illinois University Project), Series 2015-A, 5.00% 2025 | 730 | 745 |
| Fin. Auth., Student Housing Rev. Bonds (CHF - Cook, LLC - Northeastern Illinois University Project), Series 2015-A, 5.00% 2030 | 2,465 | 2,425 |
| Fin. Auth., Student Housing Rev. Bonds (CHF - Cook, LLC - Northeastern Illinois University Project), Series 2015-A, 5.00% 2035 | 700 | 669 |
| Fin. Auth., Student Housing Rev. Bonds (CHF - Cook, LLC - Northeastern Illinois University Project), Series 2015-A, 5.00% 2047 | 11,500 | 10,591 |
| Fin. Auth., Student Housing Rev. Ref. Bonds, Educational Advancement Fund, Inc. (University Center), 5.125% 2020 | 1,585 | 1,662 |
| G.O. Bonds, Series 2012-A, 5.00% 2028 | 2,000 | 2,034 |
| G.O. Bonds, Series 2013, 5.50% 2026 | 2,000 | 2,113 |
| G.O. Bonds, Series 2013, 5.50% 2033 | 3,000 | 3,131 |
| G.O. Bonds, Series 2014, 5.00% 2026 | 2,025 | 2,092 |
| G.O. Bonds, Series 2014, 5.00% 2026 | 2,000 | 2,080 |
| G.O. Bonds, Series 2014, 5.00% 2027 | 2,000 | 2,067 |
| G.O. Bonds, Series 2014, 5.00% 2039 | 4,625 | 4,613 |
| G.O. Bonds, Series 2016, 4.00% 2032 | 7,000 | 6,146 |
| G.O. Bonds, Series 2016, 5.00% 2028 | 1,500 | 1,541 |
| G.O. Bonds, Series 2016, 5.00% 2038 | 1,000 | 995 |
| G.O. Bonds, Series 2016, 5.50% 2027 | 2,000 | 2,102 |
| G.O. Bonds, Series of July 2013, 5.50% 2038 | 1,000 | 1,035 |
| G.O. Bonds, Series of March 2012, 5.00% 2037 | 1,980 | 1,970 |
| G.O. Bonds, Series of May 2014, 5.00% 2039 | 2,600 | 2,593 |
| G.O. Ref. Bonds, 5.00% 2030 | 3,000 | 3,045 |
| G.O. Rev. Ref. Bonds, Series 2012, 4.00% 2025 | 405 | 394 |
| G.O. Rev. Ref. Bonds, Series 2016, 5.00% 2026 | 7,250 | 7,545 |
| G.O. Rev. Ref. Bonds, Series 2016, 5.00% 2028 | 5,000 | 5,153 |
| G.O. Rev. Ref. Bonds, Series 2016, Assured Guaranty Municipal insured, 4.00% 2030 | 2,000 | 2,003 |
| Housing Dev. Auth., Homeowner Mortgage Rev. Bonds, Series 2016-B, AMT, 3.50% 2046 | 5,475 | 5,684 |
| Housing Dev. Auth., Homeowner Mortgage Rev. Bonds, Series 2016-C, 3.50% 2046 | 4,775 | 4,978 |
| Housing Dev. Auth., Housing Rev. Ref. Bonds, Series G, 4.80% 2032 | 735 | 736 |
| Fin. Auth., Rev. Bonds (Presence Health Network Obligated Group), Series 2016-C, 5.00% 2029 | 9,000 | 9,534 |
| Fin. Auth., Rev. Bonds (Presence Health Network Obligated Group), Series 2016-C, 5.00% 2032 | 5,000 | 5,200 |
| Fin. Auth., Rev. Bonds (Presence Health Network Obligated Group), Series 2016-C, 5.00% 2034 | 1,265 | 1,297 |
| Fin. Auth., Rev. Bonds (Presence Health Network Obligated Group), Series 2016-C, 5.00% 2036 | 3,820 | 3,880 |
| Fin. Auth., Rev. Bonds (Presence Health Network Obligated Group), Series 2016-C, 5.00% 2041 | 2,000 | 2,014 |
| Board of Trustees of Illinois State University, Auxiliary Facs. System Rev. Bonds, Series 2016, Assured Guaranty Municipal insured, 5.00% 2025 | 3,000 | 3,447 |
| Board of Trustees of Illinois State University, Auxiliary Facs. System Rev. Bonds, Series 2016, Assured Guaranty Municipal insured, 5.00% 2026 | 1,150 | 1,327 |
| Village of Lincolnshire, Special Service Area No. 1, Special Tax Bonds (Sedgebrook Project), Series 2004, 6.25% 2034 | 1,602 | 1,563 |
| Village of Manhattan (Will County), Special Service Area Number 2007-6, Special Tax Bonds (Groebe Farm-Stonegate Project), Series 2007, 5.75% 2022 | 1,900 | 285 |
| Village of Manhattan (Will County), Special Service Area Number 2007-6, Special Tax Bonds (Groebe Farm-Stonegate Project), Series 2007, 6.125% 2040 | 5,000 | 750 |
| Metropolitan Pier and Exposition Auth., McCormick Place Expansion Project Bonds, Series 2002-A, National insured, 0% 2032 | 13,860 | 6,554 |
| Metropolitan Pier and Exposition Auth., McCormick Place Expansion Project Bonds, Series 2002-A, National insured, 0% 2033 | 10,000 | 4,473 |
| Bonds, notes & other debt instruments Illinois (continued) | Principal amount (000) | Value (000) |
| Metropolitan Pier and Exposition Auth., McCormick Place Expansion Project Bonds, Series 2002-A, National insured, 0% 2034 | $10,000 | $4,324 |
| Metropolitan Pier and Exposition Auth., McCormick Place Expansion Project Rev. Bonds, Series 2012-B, Assured Guaranty Municipal insured, 0% 2051 | 7,055 | 1,144 |
| Metropolitan Pier and Exposition Auth., McCormick Place Expansion Project Rev. Ref. Bonds, Series 2002-A, National insured, 0% 2031 | 4,500 | 2,244 |
| Metropolitan Pier and Exposition Auth., McCormick Place Expansion Project Rev. Ref. Bonds, Series 2010-B-2, 5.00% 2050 | 5,000 | 5,044 |
| Metropolitan Pier and Exposition Auth., McCormick Place Expansion Project Rev. Ref. Bonds, Series 2010-E, Assured Guaranty Municipal insured, 0% 2027 | 3,500 | 2,247 |
| Metropolitan Pier and Exposition Auth., McCormick Place Expansion Project Rev. Ref. Bonds, Series 2012-B, 5.00% 2028 | 500 | 523 |
| Metropolitan Pier and Exposition Auth., McCormick Place Expansion Project Rev. Ref. Bonds, Series 2012-B, Assured Guaranty Municipal insured, 0% 2041 | 3,000 | 860 |
| Metropolitan Pier and Exposition Auth., McCormick Place Expansion Project Rev. Ref. Bonds, Series 2015-B, 5.00% 2035 | 3,000 | 3,113 |
| Metropolitan Pier and Exposition Auth., McCormick Place Expansion Project Rev. Ref. Bonds, Series 2015-B, 5.00% 2040 | 5,000 | 5,155 |
| Village of Montgomery, Kane and Kendall Counties, Special Assessment Improvement Ref. Bonds (Lakewood Creek Project), Series 2006, RADIAN insured, 4.70% 2030 | 733 | 734 |
| Municipal Electric Agcy., Power Supply System Rev. Ref. Bonds, Series 2015-A, 5.00% 2031 | 1,000 | 1,127 |
| Board of Trustees of Southern Illinois University, Housing and Auxiliary Facs. System Rev. Bonds, Series 2012-B-1, 5.00% 2022 | 750 | 784 |
| Board of Trustees of Southern Illinois University, Housing and Auxiliary Facs. System Rev. Bonds, Series 2012-B-1, 5.00% 2027 | 2,205 | 2,251 |
| Board of Trustees of Southern Illinois University, Housing and Auxiliary Facs. System Rev. Bonds, Series 2012-B-1, 5.00% 2032 | 2,945 | 2,976 |
| Southwestern Illinois Dev. Auth., Health Fac. Rev. Bonds (Hospital Sisters Services, Inc. - Obligated Group), Series 2017-A, 5.00% 2028 | 550 | 641 |
| Southwestern Illinois Dev. Auth., Health Fac. Rev. Bonds (Memorial Group, Inc.), Series 2013, 7.125% 2043 | 1,570 | 1,998 |
| Southwestern Illinois Dev. Auth., Health Fac. Rev. Bonds (Memorial Group, Inc.), Series 2013, 7.625% 2048 | 11,020 | 14,318 |
| Sports Facs. Auth., Sports Facs. Ref. Bonds (State Tax Supported), Series 2014, Assured Guaranty Municipal insured, 5.25% 2032 | 1,000 | 1,094 |
| Sports Facs. Auth., Sports Facs. Rev. Ref. Bonds (State Tax Supported), Series 2014, Assured Guaranty Municipal insured, 5.25% 2030 | 6,000 | 6,628 |
| Sports Facs. Auth., Sports Facs. Rev. Ref. Bonds (State Tax Supported), Series 2014, Assured Guaranty Municipal insured, 5.25% 2031 | 2,000 | 2,201 |
| City of Springfield, Electric Rev. Bonds, Series 2015, Assured Guaranty Municipal insured, 5.00% 2040 | 1,000 | 1,098 |
| State Toll Highway Auth., Toll Highway Rev. Bonds, Series 2015-B, 5.00% 2040 | 5,000 | 5,522 |
| Toll Highway Auth., Toll Highway Rev. Bonds, Series 2016-B, 5.00% 2041 | 2,750 | 3,048 |
| Board of Trustees of the University of Illinois, University of Illinois Auxiliary Facs. System Rev. Ref. Bonds, Series 2016-A, Assured Guaranty Municipal insured, 4.00% 2036 | 5,000 | 5,030 |
| Village of Volo, Lake County, Special Service Areas Number Three and Number Six, Special Tax Rev. Ref Bonds (Symphony Meadows/Lancaster Falls Projects), Assured Guaranty Municipal insured, 3.125% 2027 | 1,130 | 1,089 |
| Village of Volo, Lake County, Special Service Areas Number Three and Number Six, Special Tax Rev. Ref Bonds (Symphony Meadows/Lancaster Falls Projects), Assured Guaranty Municipal insured, 4.00% 2036 | 1,250 | 1,211 |
| Village of Volo, Lake County, Special Service Areas Number Three and Number Six, Special Tax Rev. Ref Bonds (Symphony Meadows/Lancaster Falls Projects), Assured Guaranty Municipal insured, 5.00% 2034 | 5,000 | 5,526 |
| Bonds, notes & other debt instruments Illinois (continued) | Principal amount (000) | Value (000) |
| United City of Yorkville, Special Tax Rev. Ref. Bonds (Special Service Area Numbers 2005-108 and 2005-109), Assured Guaranty Municipal insured, 4.00% 2036 | $4,830 | $4,624 |
| United City of Yorkville, Special Tax Rev. Ref. Bonds (Special Service Area Numbers 2005-108 and 2005-109), Assured Guaranty Municipal insured, 5.00% 2032 | 4,343 | 4,825 |
| 579,285 | ||
| Indiana 1.65% | ||
| Fin. Auth., Health Facs. Rev. Bonds (Good Samaritan Hospital Project), Series 2016-A, 5.50% 2041 | 2,000 | 2,097 |
| Fin. Auth., Environmental Rev. Ref. Bonds (Duke Energy Indiana, Inc. Project), Series 2009-B, 6.00% 2039 | 9,000 | 9,853 |
| Fin. Auth., Health System Rev. Bonds (Franciscan Alliance, Inc.), Series 2016-A, 5.00% 2051 | 1,500 | 1,640 |
| Fin. Auth., Hospital Rev. Ref. Bonds (Indiana University Health Obligated Group), Series 2011-N, 5.00% 2031 | 4,000 | 4,331 |
| Fin. Auth., Midwestern Disaster Relief Rev. Bonds (Ohio Valley Electric Corp. Project), Series 2012-A, 5.00% 2032 | 8,800 | 8,888 |
| Fin. Auth., Midwestern Disaster Relief Rev. Bonds (Ohio Valley Electric Corp. Project), Series 2012-A, 5.00% 2039 | 4,750 | 4,704 |
| Fin. Auth., Private Activity Bonds (Ohio River Bridges East End Crossing Project), Series 2013-A, AMT, 5.00% 2044 | 7,225 | 7,497 |
| Fin. Auth., Private Activity Bonds (Ohio River Bridges East End Crossing Project), Series 2013-A, AMT, 5.25% 2051 | 3,410 | 3,528 |
| Fin. Auth., Rev. Ref. Bonds (Community Foundation of Northwest Indiana Obligated Group), 5.00% 2036 | 3,730 | 4,028 |
| Fin. Auth., Rev. Bonds (BHI Senior Living Obligated Group), Series 2016-A, 5.25% 2046 | 2,100 | 2,215 |
| Fin. Auth., Rev. Bonds (Greencroft Obligated Group), Series 2013-A, 7.00% 2043 | 3,705 | 4,154 |
| Gary/Chicago International Airport Auth., Airport Dev. Zone Rev. Bonds, Series 2014, AMT, 5.00% 2019 | 760 | 798 |
| Gary/Chicago International Airport Auth., Airport Dev. Zone Rev. Bonds, Series 2014, AMT, 5.00% 2039 | 2,500 | 2,553 |
| Gary/Chicago International Airport Auth., Airport Dev. Zone Rev. Bonds, Series 2014, AMT, 5.25% 2034 | 1,000 | 1,046 |
| Health and Educational Fac. Fncg. Auth., Hospital Rev. Bonds (Community Foundation of Northwest Indiana Obilgated Group), 5.50% 2037 | 485 | 487 |
| Fin. Auth., Hospital Rev. Ref. Bonds (The Methodist Hospitals, Inc.), Series 2014-A, 5.00% 2028 | 750 | 828 |
| Housing and Community Dev. Auth., Single Family Mortgage Rev. Bonds, Series 2016-A-2, AMT, 3.50% 2038 | 4,215 | 4,379 |
| Housing and Community Dev. Auth., Single Family Mortgage Rev. Bonds, Series 2017-A-2, AMT, 4.00% 2039 | 1,000 | 1,063 |
| Indianapolis Airport Auth., Special Fac. Rev. Bonds (United Air Lines, Inc., Indianapolis Maintenance Center Project), Series 1995-A, AMT, 6.50% 20314 | 3,500 | 21 |
| Indianapolis Local Public Improvement, Bond Bank Rev. Ref. Bonds (Indianapolis Airport Auth. Project), Series 2016-A-1, AMT, 5.00% 2030 | 1,115 | 1,250 |
| Jasper County, Pollution Control Rev. Ref. Bonds (Northern Indiana Public Service Co. Project), Series 1988-C, National insured, 5.85% 2019 | 1,000 | 1,079 |
| Knox County, Econ. Dev. Rev. and Ref. Bonds (Good Samaritan Hospital Project), Series 2012-A, 5.00% 2023 | 1,000 | 1,080 |
| Knox County, Econ. Dev. Rev. and Ref. Bonds (Good Samaritan Hospital Project), Series 2012-A, 5.00% 2025 | 1,570 | 1,673 |
| City of Valparaiso, Exempt Facs. Rev Bonds (Pratt Paper, LLC Project), Series 2013, AMT, 7.00% 2044 | 3,080 | 3,678 |
| Hospital Auth. of Vigo County, Hospital Rev. Bonds (Union Hospital, Inc.), 5.50% 2027 (preref. 2017)3 | 800 | 821 |
| Hospital Auth. of Vigo County, Hospital Rev. Bonds (Union Hospital, Inc.), Series 2007, 5.70% 2037 (preref. 2017) | 1,250 | 1,285 |
| City of Whiting, Environmental Facs. Rev. Bonds (BP Products North America Inc. Project), AMT, 5.00% 2045 (put 2022) | 3,000 | 3,397 |
| City of Whiting, Environmental Facs. Rev. Bonds (BP Products North America Inc. Project), Series 2016-A, AMT, 5.00% 2046 (put 2023) | 3,000 | 3,405 |
| 81,778 | ||
| Iowa 0.49% | ||
| Fin. Auth., Retirement Community Rev. Bonds (Edgewater, A Wesley Active Life Community, LLC Project), Series 2007-A, 6.75% 2042 (preref. 2017) | 3,000 | 3,137 |
| Fin. Auth., Midwestern Disaster Area Rev. Ref. Bonds (Iowa Fertilizer Co. Project), Series 2013, 5.875 20263 | 2,320 | 2,351 |
| Fin. Auth., Midwestern Disaster Area Rev. Ref. Bonds (Iowa Fertilizer Co. Project), Series 2013, 5.00% 2019 | 2,695 | 2,709 |
| Fin. Auth., Midwestern Disaster Area Rev. Ref. Bonds (Iowa Fertilizer Co. Project), Series 2013, 5.25% 2025 | 10,000 | 10,013 |
| Fin. Auth., Midwestern Disaster Area Rev. Ref. Bonds (Iowa Fertilizer Co. Project), Series 2013, 5.50% 2022 | 2,000 | 2,011 |
| Bonds, notes & other debt instruments Iowa (continued) | Principal amount (000) | Value (000) |
| Fin. Auth., Rev. Bonds (Lifespace Communities, Inc.), Series 2016-A, 5.00% 2036 | $1,250 | $1,322 |
| Tobacco Settlement Auth., Tobacco Settlement Asset-Backed Bonds, Series 2005-C, 5.50% 2042 | 615 | 600 |
| Tobacco Settlement Auth., Tobacco Settlement Asset-Backed Bonds, Series 2005-C, 5.625% 2046 | 2,105 | 2,067 |
| 24,210 | ||
| Kansas 0.37% | ||
| City of Hutchinson, Hospital Facs. Rev. Bonds (Hutchinson Regional Medical Center, Inc.), Series 2016, 5.00% 2036 | 1,500 | 1,552 |
| City of Hutchinson, Hospital Facs. Rev. Bonds (Hutchinson Regional Medical Center, Inc.), Series 2016, 5.00% 2041 | 1,600 | 1,650 |
| Dev. Fin. Auth., Rev. Ref. Bonds (Lifespace Communities, Inc.), Series 2010-S, 5.00% 2030 | 1,920 | 2,066 |
| City of Lenexa, Health Care Fac. Rev. Bonds (Lakeview Village, Inc. Project), Series 2009, 7.125% 2029 | 250 | 267 |
| City of Lenexa, Health Care Fac. Rev. Bonds (Lakeview Village, Inc. Project), Series 2009, 7.25% 2039 | 750 | 799 |
| City of Lenexa, Health Care Fac. Rev. Ref. and Improvement Bonds (Lakeview Village, Inc. Project), Series 2007, 5.125% 2017 | 1,200 | 1,210 |
| City of Lenexa, Health Care Fac. Rev. Ref. and Improvement Bonds (Lakeview Village, Inc. Project), Series 2007, 5.50% 2039 | 5,250 | 5,259 |
| City of Overland Park, Transportation Dev. Dist. Special Assessment Bonds (Tallgrass Creek Project), Series 2006, 5.125% 2028 | 2,562 | 2,563 |
| Unified Government of Wyandotte County, Special Obligation Improvement Rev. Ref. Bonds (Wyandotte Plaza Redev. Project), 4.00% 2028 | 925 | 874 |
| Unified Government of Wyandotte County, Special Obligation Improvement Rev. Ref. Bonds (Wyandotte Plaza Redev. Project), 5.00% 2034 | 2,125 | 2,067 |
| 18,307 | ||
| Kentucky 0.91% | ||
| County of Christian, Hospital Rev. Bonds (Jennie Stuart Medical Center), Series 2016, 5.50% 2044 | 3,000 | 2,967 |
| City of Ashland, Medical Center Rev. Bonds (Ashland Hospital Corp. d/b/a King’s Daughters Medical Center Project), Series 2016-A, 4.00% 2036 | 1,000 | 938 |
| City of Ashland, Medical Center Rev. Bonds (Ashland Hospital Corp. d/b/a King’s Daughters Medical Center Project), Series 2016-A, 5.00% 2028 | 1,260 | 1,379 |
| City of Ashland, Medical Center Rev. Bonds (Ashland Hospital Corp. d/b/a King’s Daughters Medical Center Project), Series 2016-A, 5.00% 2040 | 2,400 | 2,521 |
| Econ. Dev. Fin. Auth., Healthcare Facs. Rev. Ref. Bonds (Rosedale Green Project), 5.50% 2035 | 1,750 | 1,740 |
| Econ. Dev. Fin. Auth., Healthcare Facs. Rev. Ref. Bonds (Rosedale Green Project), 5.75% 2045 | 5,765 | 5,788 |
| Econ. Dev. Fin. Auth., Healthcare Facs. Rev. Ref. Bonds (Rosedale Green Project), 5.75% 2050 | 2,650 | 2,630 |
| Econ. Dev. Fin. Auth., Hospital Rev. Ref. Bonds (Baptist Healthcare System Obligated Group), Series 2009-A, 5.375% 2024 | 2,000 | 2,105 |
| Econ. Dev. Fin. Auth., Hospital Rev. Ref. Bonds (Baptist Healthcare System Obligated Group), Series 2009-A, 5.625% 2027 | 1,000 | 1,049 |
| Econ. Dev. Fin. Auth., Louisville Arena Project Rev. Bonds (Louisville Arena Auth., Inc.), Series 2008-A-1, Assured Guaranty insured, 5.75% 2028 | 2,500 | 2,604 |
| Econ. Dev. Fin. Auth., Louisville Arena Project Rev. Bonds (Louisville Arena Auth., Inc.), Series 2008-A-1, Assured Guaranty insured, 6.00% 2033 | 1,000 | 1,047 |
| Econ. Dev. Fin. Auth., Louisville Arena Project Rev. Bonds (Louisville Arena Auth., Inc.), Series 2008-A-1, Assured Guaranty insured, 6.00% 2042 | 2,000 | 2,092 |
| Louisville/Jefferson County, Metro Government, Health System Rev. Bonds (Norton Healthcare, Inc.), Series 2016-A, 5.00% 2029 | 2,300 | 2,592 |
| Electric Plant Board of the City of Paducah, Rev. Ref. Bonds, Series 2016-A, Assured Guaranty Municipal insured, 5.00% 2026 | 1,100 | 1,280 |
| Electric Plant Board of the City of Paducah, Rev. Ref. Bonds, Series 2016-A, Assured Guaranty Municipal insured, 5.00% 2028 | 1,500 | 1,718 |
| Electric Plant Board of the City of Paducah, Rev. Ref. Bonds, Series 2016-A, Assured Guaranty Municipal insured, 5.00% 2030 | 2,560 | 2,907 |
| Bonds, notes & other debt instruments Kentucky (continued) | Principal amount (000) | Value (000) |
| Electric Plant Board of the City of Paducah, Rev. Ref. Bonds, Series 2016-A, Assured Guaranty Municipal insured, 5.00% 2035 | $1,500 | $1,671 |
| Public Transportation Infrastructure Auth., Toll Rev. Bonds (Downtown Crossing Project), Series 2013-A, 5.75% 2049 | 1,885 | 2,066 |
| Public Transportation Infrastructure Auth., Toll Rev. Bonds (Downtown Crossing Project), Series 2013-A, 6.00% 2053 | 5,500 | 6,153 |
| 45,247 | ||
| Louisiana 1.78% | ||
| Aviation Board, General Airport Rev. Bonds (North Terminal Project), Series 2015-B, AMT, 5.00% 2031 | 2,160 | 2,360 |
| Aviation Board, General Airport Rev. Bonds (North Terminal Project), Series 2015-B, AMT, 5.00% 2035 | 1,785 | 1,920 |
| Aviation Board, General Airport Rev. Bonds (North Terminal Project), Series 2015-B, AMT, 5.00% 2040 | 8,000 | 8,549 |
| Citizens Property Insurance Corp., Assessment Rev. Ref. Bonds, Series 2016-A, 5.00% 2025 | 5,000 | 5,865 |
| Jefferson Parish Hospital Dist. No. 1, Parish of Jefferson, Hospital Rev. Ref. Bonds (West Jefferson Medical Center), Series 2011-A, 6.00% 2039 (preref. 2021) | 2,365 | 2,760 |
| Juban Crossing, Econ. Dev. Rev. Ref. Bonds (Drainage Project), Series 2015-B, 7.00% 20443 | 2,000 | 1,851 |
| Juban Crossing, Econ. Dev. Rev. Ref. Bonds (Drainage Project), Series 2015-C, 7.00% 20443 | 5,600 | 5,183 |
| Local Government Environmental Facs. and Community Dev. Auth., Rev. Bonds (Westlake Chemical Corp. Projects), Series 2007, 6.75% 2032 | 9,500 | 9,798 |
| Local Government Environmental Facs. and Community Dev. Auth., Rev. Bonds (Westlake Chemical Corp. Projects), Series 2010-A-1, 6.50% 2035 | 5,750 | 6,622 |
| Local Government Environmental Facs. and Community Dev. Auth., Rev. Bonds (Westlake Chemical Corp. Projects), Series 2010-A-2, 6.50% 2035 | 2,850 | 3,261 |
| City of New Orleans, Sewerage Service Rev. and Ref. Bonds, Series 2015, 5.00% 2045 | 500 | 542 |
| Public Facs. Auth., Lease Rev. Bonds (Provident Group - Flagship Properties LLC - Louisiana State University Nicholson Gateway Project), Series 2016-A, 5.00% 2051 | 10,180 | 10,931 |
| Public Facs. Auth., Lease Rev. Bonds (Provident Group - Flagship Properties LLC - Louisiana State University Nicholson Gateway Project), Series 2016-A, 5.00% 2056 | 1,000 | 1,059 |
| Public Facs. Auth., Rev. Bonds (Ochsner Clinic Foundation Project), 5.00% 2047 | 2,500 | 2,669 |
| Public Facs. Auth., Rev. Bonds (Ochsner Clinic Foundation Project), Series 2007-A, 5.25% 2038 | 2,175 | 2,191 |
| Public Facs. Auth., Rev. Bonds (Ochsner Clinic Foundation Project), Series 2007-A, 5.25% 2038 (preref. 2017) | 825 | 836 |
| Public Facs. Auth., Rev. Bonds (Ochsner Clinic Foundation Project), Series 2007-A, 5.375% 2043 | 360 | 363 |
| Public Facs. Auth., Rev. Bonds (Ochsner Clinic Foundation Project), Series 2007-A, 5.375% 2043 (preref. 2017) | 140 | 142 |
| Public Facs. Auth., Rev. Ref. Bonds (CHRISTUS Health), Series 2009-A, 6.00% 2029 | 2,000 | 2,187 |
| Public Facs. Auth., Rev. Ref. Bonds (Entergy Louisiana, LLC Project), Series 2016-A, 3.375% 2028 | 250 | 250 |
| Public Facs. Auth., Rev. Ref. Bonds (Entergy Louisiana, LLC Project), Series 2016-B, 3.50% 2030 | 500 | 497 |
| Public Facs. Auth., Rev. Ref. Bonds (Nineteenth Judicial Dist. Court Building Project), Assured Guaranty Municipal insured, 5.00% 2042 | 1,500 | 1,629 |
| Public Facs. Auth., Rev. Ref. Bonds (Nineteenth Judicial Dist. Court Building Project), Assured Guaranty Municipal insured, 5.25% 2051 | 1,000 | 1,095 |
| Public Facs. Auth., Rev. Ref. Bonds (Ochsner Clinic Foundation Project), Series 2016, 5.00% 2032 | 900 | 991 |
| Public Facs. Auth., Rev. Ref. Bonds (Ochsner Clinic Foundation Project), Series 2016, 5.00% 2033 | 1,635 | 1,790 |
| Parish of St. Charles, Gulf Opportunity Zone Rev. Bonds (Valero Project), Series 2010, 4.00% 2040 (put 2022) | 5,500 | 5,767 |
| Parish of St. John the Baptist, Rev. Bonds (Marathon Oil Corp. Project), Series 2007-A, 5.125% 2037 | 2,170 | 2,175 |
| St. Tammany Public Trust Fncg. Auth., Rev. Ref. Bonds (Christwood Project), 5.00% 2024 | 625 | 657 |
| St. Tammany Public Trust Fncg. Auth., Rev. Ref. Bonds (Christwood Project), 5.25% 2037 | 1,750 | 1,751 |
| Tobacco Settlement Fncg. Corp., Tobacco Settlement Asset-Backed Ref. Bonds, Series 2013-A, 5.00% 2026 | 2,500 | 2,526 |
| 88,217 |
| Bonds, notes & other debt instruments Maine 0.49% | Principal amount (000) | Value (000) |
| Fin. Auth., Solid Waste Disposal Rev. Bonds (Casella Waste Systems, Inc. Project), Series 2005-R-3, AMT, 5.25% 20253 | $2,000 | $2,007 |
| Health and Higher Educational Facs. Auth., Rev. Bonds (Eastern Maine Healthcare Systems Obligated Group Issue), Series 2016-A, 5.00% 2041 | 1,750 | 1,771 |
| Health and Higher Educational Facs. Auth., Rev. Bonds (Eastern Maine Healthcare Systems Obligated Group Issue), Series 2016-A, 5.00% 2046 | 1,000 | 1,008 |
| Health and Higher Educational Facs. Auth., Rev. Bonds (Eastern Maine Medical Center Obligated Group Issue), Series 2013, 5.00% 2027 | 485 | 511 |
| Health and Higher Educational Facs. Auth., Rev. Bonds (Eastern Maine Medical Center Obligated Group Issue), Series 2013, 5.00% 2043 | 3,500 | 3,509 |
| Health and Higher Educational Facs. Auth., Rev. Bonds (MaineGeneral Medical Center Issue), 6.75% 2036 | 4,000 | 4,344 |
| Health and Higher Educational Facs. Auth., Rev. Bonds (MaineGeneral Medical Center Issue), 6.75% 2041 | 3,375 | 3,661 |
| Health and Higher Educational Facs. Auth., Rev. Bonds (MaineGeneral Medical Center Issue), 7.00% 2041 | 1,500 | 1,644 |
| Housing Auth., Mortgage Purchase Rev. Ref. Bonds, Series 2014-C-1, AMT, 3.50% 2044 | 2,225 | 2,323 |
| City of Portland, General Airport Rev. Ref. Bonds, Series 2016, 5.00% 2031 | 1,090 | 1,211 |
| City of Portland, General Airport Rev. Ref. Bonds, Series 2016, 5.00% 2034 | 1,000 | 1,096 |
| City of Portland, General Airport Rev. Ref. Bonds, Series 2016, 5.00% 2035 | 1,000 | 1,092 |
| 24,177 | ||
| Maryland 1.09% | ||
| Baltimore County, Rev. Bonds (Oak Crest Village, Inc. Fac.), 5.00% 2037 | 2,100 | 2,263 |
| Econ. Dev. Corp., Student Housing Rev. Ref. Bonds (Bowie State University Project), Series 2015, 3.00% 20203 | 830 | 821 |
| Community Dev. Administration, Dept. of Housing and Community Dev., Residential Rev. Bonds, Series 2014-B, AMT, 3.25% 2044 | 1,010 | 1,042 |
| Community Dev. Administration, Dept. of Housing and Community Dev., Residential Rev. Ref. Bonds, Series 2014-D, AMT, 4.00% 2036 | 3,795 | 3,988 |
| Econ. Dev. Corp., Student Housing Rev. Bonds (Towson University Project), Series 2007-A, 5.25% 2037 | 500 | 506 |
| Econ. Dev. Corp., Student Housing Rev. Ref. Bonds (Frostburg State University Project), Series 2013, 5.00% 2033 | 1,000 | 1,059 |
| Econ. Dev. Corp., Student Housing Rev. Ref. Bonds (Morgan State University Project), Series 2012, 5.00% 2034 | 1,500 | 1,573 |
| Econ. Dev. Corp., Student Housing Rev. Ref. Bonds (University of Maryland, College Park Projects), Assured Guaranty Municipal insured, 5.00% 2031 | 1,000 | 1,156 |
| Econ. Dev. Corp., Student Housing Rev. Ref. Bonds (Bowie State University Project), Series 2015, 5.00% 20253 | 2,100 | 2,228 |
| Econ. Dev. Corp., Student Housing Rev. Ref. Bonds (Bowie State University Project), Series 2015, 5.00% 20293 | 1,680 | 1,727 |
| City of Gaithersburg, Econ. Dev. Rev. Ref. Bonds (Asbury Maryland Obligated Group), Series 2006-A, 5.125% 2036 | 1,500 | 1,502 |
| Health and Higher Educational Facs. Auth., Rev. Bonds (Adventist HealthCare Issue), Series 2016-A, 5.50% 2036 | 8,000 | 8,864 |
| Health and Higher Educational Facs. Auth., Rev. Bonds (Charlestown Community Issue), Series 2016-A, 5.00% 2045 | 2,390 | 2,566 |
| Health and Higher Educational Facs. Auth., Rev. Bonds (Maryland Institute College of Art Issue), Series 2017, 5.00% 2030 | 425 | 474 |
| Health and Higher Educational Facs. Auth., Rev. Bonds (Maryland Institute College of Art Issue), Series 2017, 5.00% 2031 | 425 | 471 |
| Health and Higher Educational Facs. Auth., Rev. Bonds (Maryland Institute College of Art Issue), Series 2017, 5.00% 2034 | 375 | 409 |
| Health and Higher Educational Facs. Auth., Rev. Bonds (Maryland Institute College of Art Issue), Series 2017, 5.00% 2036 | 325 | 352 |
| Health and Higher Educational Facs. Auth., Rev. Bonds (Maryland Institute College of Art Issue), Series 2017, 5.00% 2042 | 1,000 | 1,078 |
| Health and Higher Educational Facs. Auth., Rev. Bonds (Mercy Medical Center Issue), Series 2007-A, 5.00% 2037 (preref. 2017) | 5,000 | 5,089 |
| Howard County, Retirement Community Rev. Bonds (Vantage House Fac.), Series 2017, 5.00% 2036 | 1,500 | 1,428 |
| Bonds, notes & other debt instruments Maryland (continued) | Principal amount (000) | Value (000) |
| Prince George’s County, Rev. Auth., Special Obligation Bonds (Suitland-Naylor Road Project), Series 2016, 5.00% 20463 | $2,500 | $2,379 |
| Prince George’s County, Special Obligation Bonds (National Harbor Project), Series 2004, 5.20% 2034 | 8,006 | 8,086 |
| Prince George’s County, Special Tax Dist. Bonds (Victoria Falls Project), Series 2005, 5.25% 2035 | 946 | 950 |
| Transportation Auth., Airport Parking Rev. Ref. Bonds (Baltimore/Washington International Thurgood Marshall Airport Projects), Series 2012-B, AMT, 5.00% 2021 | 1,000 | 1,116 |
| Transportation Auth., Passenger Fac. Charge Rev. Bonds (Baltimore/Washington International Thurgood Marshall Airport), Series 2014, AMT, Assured Guaranty Municipal insured, 3.50% 2028 | 1,500 | 1,480 |
| Mayor and Common Council of Westminster, Project and Rev. Ref. Bonds (Carroll Lutheran Village, Inc.), Series 2014, 5.50% 2044 | 1,500 | 1,575 |
| 54,182 | ||
| Massachusetts 2.60% | ||
| Dev. Fin. Agcy., Rev. Bonds (Boston Medical Center Issue), Series 2016-E, 5.00% 2032 | 2,000 | 2,151 |
| Dev. Fin. Agcy., Rev. Bonds (Boston Medical Center Issue), Series 2016-E, 5.00% 2034 | 3,000 | 3,197 |
| Dev. Fin. Agcy., Rev. Bonds (Boston Medical Center Issue), Series 2016-E, 5.00% 2036 | 1,000 | 1,059 |
| Dev. Fin. Agcy., Boston Medical Center Rev. Bonds (Green Bonds), Series 2015-D, 5.00% 2044 | 1,500 | 1,567 |
| Dev. Fin. Agcy., Resource Recovery Rev. Ref. Bonds (Covanta Energy Project), Series 2012-B, 4.875% 20423 | 1,500 | 1,505 |
| Dev. Fin. Agcy., Resource Recovery Rev. Ref. Bonds (Covanta Energy Project), Series 2012-C, AMT, 5.25% 20423 | 9,250 | 9,293 |
| Dev. Fin. Agcy., Rev. Bonds (Emmanuel College Issue), Series 2016-A, 5.00% 2043 | 7,920 | 8,380 |
| Dev. Fin. Agcy., Rev. Bonds (Linden Ponds Inc.), Series 2011-A-2, 5.50% 2046 | 870 | 859 |
| Dev. Fin. Agcy., Rev. Bonds (Linden Ponds Inc.), Series 2011-B, 0% 2056 | 4,159 | 21 |
| Dev. Fin. Agcy., Rev. Bonds (Linden Ponds, Inc. Fac.), Series 2011-A-1, 6.25% 2018 | 26 | 27 |
| Dev. Fin. Agcy., Rev. Bonds (Linden Ponds, Inc. Fac.), Series 2011-A-1, 6.25% 2021 | 797 | 821 |
| Dev. Fin. Agcy., Rev. Bonds (Linden Ponds, Inc. Fac.), Series 2011-A-1, 6.25% 2031 | 3,873 | 3,970 |
| Dev. Fin. Agcy., Rev. Bonds (Linden Ponds, Inc. Fac.), Series 2011-A-1, 6.25% 2039 | 4,565 | 4,679 |
| Dev. Fin. Agcy., Rev. Bonds (Linden Ponds, Inc. Fac.), Series 2011-A-1, 6.25% 2046 | 12,261 | 12,568 |
| Dev. Fin. Agcy., Rev. Bonds (Linden Ponds, Inc. Fac.), Series 2016-A, 4.68% 20213 | 11,440 | 11,388 |
| Dev. Fin. Agcy., Rev. Bonds (Linden Ponds, Inc. Fac.), Series 2016-B, 4.68% 20213 | 470 | 461 |
| Dev. Fin. Agcy., Rev. Bonds (Partners HealthCare System Issue), Series 2012-L, 5.00% 2041 | 1,000 | 1,104 |
| Dev. Fin. Agcy., Rev. Bonds (Umass Memorial Health Care Obligated Group Issue), Series 2016-I, 5.00% 2029 | 1,800 | 2,007 |
| Dev. Fin. Agcy., Rev. Bonds (Umass Memorial Health Care Obligated Group Issue), Series 2016-I, 5.00% 2036 | 5,500 | 5,914 |
| Dev. Fin. Agcy., Rev. Ref. Bonds (Emerson College Issue), Series 2010-A, 5.00% 2040 | 3,265 | 3,401 |
| Dev. Fin. Agcy., Rev. Ref. Bonds (Tufts Medical Center Issue), Series 2011-I, 6.75% 2036 | 11,175 | 12,695 |
| Dev. Fin. Agcy., Rev. Ref. Bonds (Tufts Medical Center Issue), Series 2011-I, 6.875% 2041 | 6,000 | 6,843 |
| Educational Fncg. Auth., Education Loan Rev. Bonds, Series 2016-J, AMT, 3.50% 2033 | 21,000 | 18,761 |
| Educational Fncg. Auth., Education Loan Rev. Bonds, Series 2016-J, AMT, 5.00% 2024 | 5,000 | 5,602 |
| Health and Educational Facs. Auth., Rev. Bonds (Umass Memorial Issue), Series 2010-G, 5.00% 2021 | 140 | 153 |
| Health and Educational Facs. Auth., Rev. Ref. Bonds (Northeastern University Issue), Series 2010-A, 5.00% 2035 | 1,800 | 1,972 |
| Health and Educational Facs. Auth., Rev. Ref. Bonds (Suffolk University Issue), Series 2009-A, 5.75% 2039 (preref. 2019) | 1,000 | 1,076 |
| Health and Educational Facs. Auth., Rev. Ref. Bonds (Suffolk University Issue), Series 2009-A, 6.00% 2024 | 1,500 | 1,645 |
| Health and Educational Facs. Auth., Rev. Ref. Bonds (Suffolk University Issue), Series 2009-A, 6.25% 2030 | 1,000 | 1,099 |
| Housing Fin. Agcy., Single Family Housing Rev. Ref. Bonds, Series 177, AMT, 4.00% 2039 | 2,525 | 2,668 |
| Port Auth., Special Facs. Rev. Bonds (Delta Air Lines, Inc. Project), Series 2001-A, AMT, AMBAC-FGIC insured, 5.00% 2027 | 2,000 | 2,007 |
| 128,893 |
| Bonds, notes & other debt instruments Michigan 4.27% | Principal amount (000) | Value (000) |
| Econ. Dev. Corp. of the City of Dearborn, Limited Obligation Rev. Ref. Bonds (Henry Ford Village, Inc. Project), Series 2008, 7.00% 2038 | $2,500 | $2,303 |
| Econ. Dev. Corp. of the City of Dearborn, Limited Obligation Rev. Ref. Bonds (Henry Ford Village, Inc. Project), Series 2008, 7.125% 2043 | 6,000 | 5,489 |
| City of Detroit, Water and Sewerage Dept., Sewage Disposal System Rev. Ref. Bonds, Series 2012-A, 5.25% 2039 | 4,850 | 5,236 |
| School Dist. of the City of Detroit (Wayne County), School Building and Site Improvement Ref. Bonds (Unlimited Tax G.O.), Series 2012-A, 5.00% 2026 | 1,000 | 1,092 |
| Fin. Auth. Local Government Loan Program Rev. Bonds (Water and Sewerage Dept. Sewage Disposal System Rev. Ref. Local Project), Series 2014-C-1, 5.00% 2044 | 2,625 | 2,790 |
| Fin. Auth. Local Government Loan Program Rev. Bonds (Water and Sewerage Dept. Sewage Disposal System Rev. Ref. Local Project), Series 2014-C-6, 5.00% 2033 | 2,000 | 2,188 |
| Fin. Auth. Local Government Loan Program Rev. Bonds (Water and Sewerage Dept. Water Supply System Rev. Ref. Local Project), Series 2014-D-4, 5.00% 2034 | 1,000 | 1,090 |
| Fin. Auth., Local Government Loan Program Rev. Bonds (Detroit Water and Sewerage Dept., Sewage Disposal System Rev. Ref. Local Project Bonds), Series 2015-C, 5.00% 2032 | 500 | 544 |
| Fin. Auth., Local Government Loan Program Rev. Bonds (Detroit Water and Sewerage Dept., Sewage Disposal System Rev. Ref. Local Project Bonds), Series 2015-C, 5.00% 2034 | 2,000 | 2,159 |
| Fin. Auth., Local Government Loan Program Rev. Bonds (Detroit Water and Sewerage Dept., Sewage Disposal System Rev. Ref. Local Project Bonds), Series 2015-C, 5.00% 2035 | 1,500 | 1,614 |
| Fin. Auth., Local Government Loan Program Rev. Bonds (Detroit Water and Sewerage Dept., Sewage Disposal System Rev. Ref. Local Project Bonds), Series 2015-D-2, 5.00% 2034 | 1,000 | 1,080 |
| Fin. Auth., Hospital Rev. Ref. Bonds (Mclaren Health Care), Series 2015-B, 5.00% 2035 | 750 | 824 |
| Fin. Auth., Hospital Rev. Ref. Bonds (Oakwood Obligated Group), Series 2012, 5.00% 2027 | 1,090 | 1,202 |
| Fin. Auth., Local Government Loan Program Rev. Bonds (City of Detroit Fin. Recovery Income Tax Local Project), Series 2014-F-1, 4.50% 2029 | 2,600 | 2,665 |
| Fin. Auth., Rev. Ref. Bonds (Trinity Health Credit Group), 5.00% 2039 | 1,890 | 2,119 |
| Fin. Auth., Rev. Ref. Bonds (Trinity Health Credit Group), 5.50% 2026 | 1,250 | 1,516 |
| Fin. Auth., Student Loan Rev. Ref. Bonds, Series 25-A, AMT, 4.00% 2030 | 2,550 | 2,565 |
| Fin. Auth., Student Loan Rev. Ref. Bonds, Series 25-A, AMT, 4.00% 2031 | 1,000 | 1,003 |
| Fin. Auth., Student Loan Rev. Ref. Bonds, Series 25-A, AMT, 5.00% 2022 | 1,500 | 1,664 |
| Fin. Auth., Hospital Rev. Ref. Bonds (Crittenton Hospital Medical Center), Series 2012-A, 5.00% 2039 (preref. 2022) | 4,540 | 5,273 |
| Fin. Auth., Hospital Rev. Ref. Bonds (Henry Ford Health System), Series 2016, 5.00% 2037 | 5,000 | 5,427 |
| Fin. Auth., Hospital Rev. Ref. Bonds (Henry Ford Health System), Series 2016, 5.00% 2041 | 2,250 | 2,431 |
| City of Flint, Hospital Building Auth., Rev. Rental Bonds (Hurley Medical Center), 5.84% 2020 | 400 | 421 |
| City of Flint, Hospital Building Auth., Rev. Rental Bonds (Hurley Medical Center), Series 2010, 7.375% 2035 | 1,500 | 1,645 |
| City of Flint, Hospital Building Auth., Rev. Rental Bonds (Hurley Medical Center), Series 2010, 7.50% 2039 | 1,750 | 1,920 |
| City of Flint, Hospital Building Auth., Rev. Rental Bonds (Hurley Medical Center), Series 2013-A, 5.00% 2023 | 2,000 | 2,072 |
| City of Flint, Hospital Building Auth., Rev. Rental Bonds (Hurley Medical Center), Series 2013-A, 5.25% 2028 | 4,000 | 4,109 |
| City of Flint, Hospital Building Auth., Rev. Rental Bonds (Hurley Medical Center), Series 2013-A, 5.25% 2039 | 2,775 | 2,820 |
| County of Genesee, Water Supply System, Rev. and Rev. Ref. Bonds (Limited Tax G.O.), Series 2016-B, BAM insured, 5.00% 2032 | 500 | 555 |
| Great Lakes Water Auth., Water Supply System Rev. Ref. Bonds, Series 2016-B, 5.00% 2046 | 6,000 | 6,447 |
| Fin. Auth., Hospital Rev. Ref. Bonds (Crittenton Hospital Medical Center), Series 2012-A, 5.00% 2027 (preref. 2022) | 1,000 | 1,161 |
| Hospital Fin. Auth., Hospital Rev. Ref. Bonds (Henry Ford Health System), Series 2009, 5.75% 2039 (preref. 2019) | 6,110 | 6,841 |
| Hospital Fin. Auth., Rev. Bonds (Trinity Health Credit Group), Series 2009-B, 5.00% 2048 | 2,000 | 2,130 |
| Housing Dev. Auth., Single-Family Mortgage Rev. Bonds, Series 2016-B, 3.35% 2034 | 2,500 | 2,334 |
| Econ. Dev. Corp. of the City of Kentwood, Limited Obligation Rev. Ref. Bonds (Holland Home Obligated Group), Series 2012, 5.125% 2032 | 1,000 | 1,001 |
| Econ. Dev. Corp. of the City of Kentwood, Limited Obligation Rev. Ref. Bonds (Holland Home Obligated Group), Series 2012, 5.375% 2041 | 1,270 | 1,271 |
| Bonds, notes & other debt instruments Michigan (continued) | Principal amount (000) | Value (000) |
| Econ. Dev. Corp. of the City of Kentwood, Limited Obligation Rev. Ref. Bonds (Holland Home Obligated Group), Series 2012, 5.625% 2041 | $4,750 | $4,994 |
| City of Royal Oak Hospital Fin. Auth., Hospital Rev. Ref. Bonds (William Beaumont Hospital Obligated Group), Series 2009-V, 8.25% 2039 (preref. 2018) | 2,000 | 2,223 |
| City of Royal Oak Hospital Fin. Auth., Hospital Rev. Ref. Bonds (William Beaumont Hospital Obligated Group), Series 2014-D, 5.00% 2039 | 1,250 | 1,338 |
| City of Saginaw Hospital Fin. Auth., Hospital Rev. Ref. Bonds (Covenant Medical Center, Inc.), Series 2010-H, 5.00% 2030 | 2,700 | 2,897 |
| State Building Auth., Rev. Ref. Bonds (Facs. Program), Series 2008-I, 6.00% 2038 | 35 | 38 |
| State Building Auth., Rev. Ref. Bonds (Facs. Program), Series 2008-I, 6.00% 2038 (preref. 2018) | 605 | 655 |
| State Building Auth., Rev. Ref. Bonds (Facs. Program), Series 2008-I, 6.00% 2038 (preref. 2018) | 360 | 389 |
| Housing Dev. Auth., Single-Family Mortgage Rev. Bonds, Series 2016-B, 3.50% 2047 | 2,500 | 2,603 |
| State Strategic Fund, Limited Obligation Rev. Bonds (Detroit Renewable Power Project), Series 2013, AMT, 8.50% 20303 | 2,995 | 2,996 |
| State Strategic Fund, Limited Obligation Rev. Bonds (Detroit Thermal Project), Series 2013, AMT, 8.50% 20303 | 7,165 | 7,168 |
| Strategic Fund, Limited Obligation Rev. Ref. Bonds (Detroit Edison Co. Exempt Facs. Project), Series 2008-ET-2, 1.45% 2029 (put 2021) | 1,950 | 1,892 |
| Strategic Fund, Limited Obligation Rev. Ref. Bonds (Detroit Edison Co. Exempt Facs. Project), Series 2008-KT, 5.625% 2020 | 1,800 | 2,018 |
| Tobacco Settlement Fin. Auth., Tobacco Settlement Asset-backed Bonds, Current Interest Bonds, Series 2007-A, 6.00% 2034 | 4,050 | 3,925 |
| Tobacco Settlement Fin. Auth., Tobacco Settlement Asset-backed Bonds, Current Interest Bonds, Series 2007-A, 6.00% 2048 | 60,385 | 55,778 |
| Tobacco Settlement Fin. Auth., Tobacco Settlement Asset-backed Rev. Ref. Bonds, Current Interest Bonds, Series 2008-A, 6.875% 2042 | 5,440 | 5,473 |
| Wayne County, Airport Auth., Airport Rev. Ref. Bonds (Detroit Metropolitan Wayne County Airport), Series 2015-F, AMT, 5.00% 2033 | 2,000 | 2,190 |
| Wayne County, Airport Auth., Airport Rev. Ref. Bonds (Detroit Metropolitan Wayne County Airport), Series 2015-F, AMT, 5.00% 2034 | 1,500 | 1,636 |
| Wayne County, Airport Auth., Rev. Bonds (Detroit Metropolitan Wayne County Airport), Series 2014-C, AMT, 5.00% 2044 | 1,000 | 1,069 |
| Wayne County, Airport Auth., Airport Rev. Bonds (Detroit Metropolitan Wayne County Airport), Series 2012-B, AMT, 5.00% 2037 | 2,000 | 2,123 |
| Wayne County, Airport Auth., Airport Rev. Ref. Bonds (Detroit Metropolitan Wayne County Airport), Series 2011-A, AMT, 5.00% 2020 | 5,000 | 5,514 |
| Wayne County, Airport Auth., Airport Rev. Ref. Bonds (Detroit Metropolitan Wayne County Airport), Series 2012-D, AMT, 5.00% 2028 | 12,000 | 12,991 |
| Wayne County, Airport Auth., Airport Rev. Ref. Bonds (Detroit Metropolitan Wayne County Airport), Series 2015-F, AMT, 5.00% 2030 | 3,000 | 3,325 |
| Wayne County, Airport Auth., Airport Rev. Ref. Bonds (Detroit Metropolitan Wayne County Airport), Series 2015-F, AMT, 5.00% 2032 | 1,000 | 1,100 |
| 211,336 | ||
| Minnesota 0.14% | ||
| Housing Fin. Agcy., Residential Housing Fin. Bonds, Series 2013-A, AMT, 3.00% 2031 | 745 | 756 |
| Housing Fin. Agcy., Residential Housing Fin. Bonds, Series 2014-C, AMT, 4.00% 2045 | 1,585 | 1,670 |
| Housing Fin. Agcy., Residential Housing Fin. Bonds, Series 2015-E, AMT, 3.50% 2046 | 4,470 | 4,638 |
| 7,064 | ||
| Mississippi 0.26% | ||
| Dev. Bank, Special Obligation Bonds (Municipal Energy Agcy. of Mississippi Power Supply Project), Series 2015-A, Assured Guaranty Municipal insured, 5.00% 2034 | 1,000 | 1,104 |
| Hospital Equipment and Facs. Auth., Rev. Bonds (Baptist Memorial Health Care), Series 2016-A, 5.00% 2036 | 1,800 | 1,926 |
| Hospital Equipment and Facs. Auth., Rev. Bonds (Baptist Memorial Health Care), Series 2016-A, 5.00% 2046 | 2,500 | 2,642 |
| Bonds, notes & other debt instruments Mississippi (continued) | Principal amount (000) | Value (000) |
| Hospital Equipment and Facs. Auth., Rev. Ref. Bonds (Mississippi Baptist Health Systems, Inc.), Series 2007-A, 5.00% 2026 | $1,500 | $1,528 |
| Warren County, Gulf Opportunity Zone Bonds (International Paper Co. Project), Series 2011-A, 5.375% 2035 | 5,100 | 5,616 |
| 12,816 | ||
| Missouri 1.82% | ||
| Industrial Dev. Auth. of the County of Cape Girardeau, Health Facs. Rev. Bonds (Southeast Missouri Hospital Assn.), Series 2007, 5.00% 2019 | 1,885 | 1,896 |
| Industrial Dev. Auth. of the County of Cape Girardeau, Health Facs. Rev. Bonds (Southeast Missouri Hospital Assn.), Series 2007, 5.00% 2027 | 1,270 | 1,271 |
| Industrial Dev. Auth. of the County of Cape Girardeau, Health Facs. Rev. Bonds (Southeast Missouri Hospital Association), Series 2007, 5.00% 2036 | 650 | 634 |
| Industrial Dev. Auth. of the County of Cape Girardeau, Health Facs. Rev. Bonds (Southeast Missouri Hospital Association), Series 2016-A, 6.00% 2033 | 4,980 | 5,139 |
| Hawk Ridge Transportation Dev. Dist. (Lake St. Louis), Transportation Sales Tax Rev. Bonds, Series 2006-A, 4.65% 2017 (escrowed to maturity) | 335 | 335 |
| Health and Educational Facs. Auth., Rev. Ref. Bonds (St Anthony’s Medical Center), Series 2015-B, 5.00% 2045 | 1,320 | 1,396 |
| Health and Educational Facs. Auth., Health Facs. Rev. Bonds (Bethesda Health Group, Inc.), 5.00% 2040 | 1,650 | 1,700 |
| Health and Educational Facs. Auth., Health Facs. Rev. Bonds (Bethesda Health Group, Inc.), 5.00% 2045 | 1,300 | 1,337 |
| Health and Educational Facs. Auth., Senior Living Facs. Rev. Bonds (Lutheran Senior Services Projects), Series 2010, 5.50% 2042 | 2,000 | 2,103 |
| Health and Educational Facs. Auth., Senior Living Facs. Rev. Bonds (Lutheran Senior Services Projects), Series 2011, 6.00% 2041 | 1,000 | 1,095 |
| Health and Educational Facs. Auth., Senior Living Facs. Rev. Bonds (Lutheran Senior Services), Series 2016-B, 5.00% 2035 | 1,100 | 1,144 |
| Health and Educational Facs. Auth., Senior Living Facs. Rev. Ref. Bonds (Lutheran Senior Services), 5.00% 2035 | 1,000 | 1,051 |
| Health and Educational Facs. Auth., Senior Living Facs. Rev. Ref. Bonds (Lutheran Senior Services), Series 2007-B, 4.875% 2038 | 3,000 | 3,000 |
| Health and Educational Facs. Auth., Senior Living Facs. Rev. Ref. Bonds (Lutheran Senior Services), Series 2016-A, 5.00% 2030 | 250 | 268 |
| Health and Educational Facs. Auth., Senior Living Facs. Rev. Ref. Bonds (Lutheran Senior Services), Series 2016-A, 5.00% 2036 | 1,100 | 1,146 |
| Health and Educational Facs. Auth., Senior Living Facs. Rev. Ref. Bonds (Lutheran Senior Services), Series 2016-A, 5.00% 2046 | 1,675 | 1,726 |
| Industrial Dev. Auth. of St. Louis, Senior Living Facs. Rev. Bonds (St. Andrew’s Resources for Seniors Obligated Group), 5.125% 2045 | 4,200 | 4,083 |
| Industrial Dev. Auth. of St. Louis, Senior Living Facs. Rev. Bonds (St. Andrew’s Resources for Seniors Obligated Group), Series 2015-A, 5.00% 2025 | 1,935 | 1,999 |
| Industrial Dev. Auth. of St. Louis, Senior Living Facs. Rev. Bonds (St. Andrew’s Resources for Seniors Obligated Group), Series 2015-A, 5.00% 2035 | 1,260 | 1,234 |
| City of Lee’s Summit, Industrial Dev. Auth., Senior Living Facs. Rev. Bonds (John Knox Village Obligated Group), Series 2016-A, 5.00% 2046 | 4,000 | 3,859 |
| Industrial Dev. Auth. of the City of Lee’s Summit, Senior Living Facs. Rev. Ref. Bonds (John Knox Village Obligated Group), Series 2007-A, 5.125% 2026 | 7,950 | 8,031 |
| Industrial Dev. Auth. of the City of Lee’s Summit, Senior Living Facs. Rev. Ref. Bonds (John Knox Village Obligated Group), Series 2014-A, 5.25% 2039 | 1,250 | 1,299 |
| City of St. Louis, Airport Rev. Bonds (Lambert-St. Louis International Airport), Series 2009-A-1, 6.625% 2034 | 3,000 | 3,336 |
| City of St. Louis, Airport Rev. Ref. Bonds (Lambert-St. Louis International Airport), National insured, 5.50% 2026 | 2,500 | 2,959 |
| City of St. Louis, Airport Rev. Ref. Bonds (Lambert-St. Louis International Airport), National insured, 5.50% 2030 | 2,000 | 2,425 |
| City of St. Louis, Airport Rev. Ref. Bonds (Lambert-St. Louis International Airport), National insured, 5.50% 2031 | 5,000 | 6,074 |
| Bonds, notes & other debt instruments Missouri (continued) | Principal amount (000) | Value (000) |
| City of St. Louis, Airport Rev. Ref. Bonds (Lambert-St. Louis International Airport), Series 2005, National insured, 5.50% 2027 | $3,275 | $3,911 |
| City of St. Louis, Airport Rev. Ref. Bonds (Lambert-St. Louis International Airport), Series 2005, National insured, 5.50% 2028 | 4,480 | 5,380 |
| City of St. Louis, Airport Rev. Ref. Bonds (Lambert-St. Louis International Airport), Series 2005, National insured, 5.50% 2029 | 1,000 | 1,207 |
| City of St. Louis, Airport Rev. Ref. Bonds (Lambert-St. Louis International Airport), Series 2007-B, AMT, Assured Guaranty Municipal insured, 5.00% 2027 | 5,490 | 5,569 |
| City of St. Louis, Airport Rev. Ref. Bonds (Lambert-St. Louis International Airport), Series 2012, AMT, 5.00% 2032 | 1,685 | 1,773 |
| The Industrial Dev. Auth. of the County of St. Louis, Healthcare Facs. Rev. Bonds (Nazareth Living Center), Series 2015-A, 5.00% 2025 | 1,000 | 1,025 |
| The Industrial Dev. Auth. of the County of St. Louis, Healthcare Facs. Rev. Bonds (Nazareth Living Center), Series 2015-A, 5.00% 2030 | 1,000 | 997 |
| The Industrial Dev. Auth. of the County of St. Louis, Healthcare Facs. Rev. Bonds (Nazareth Living Center), Series 2015-A, 5.00% 2035 | 700 | 688 |
| The Industrial Dev. Auth. of the County of St. Louis, Healthcare Facs. Rev. Bonds (Nazareth Living Center), Series 2015-A, 5.125% 2045 | 2,000 | 1,916 |
| Stoddard County Industrial Dev. Auth., Health Facs. Rev. Bonds (Southeast Missouri Hospital Association), Series 2016-B, 6.00% 2037 | 4,220 | 4,299 |
| Transportation Dev. Dist. (Hazelwood, St. Louis County), Transportation Rev. Bonds (Missouri Bottom Road/Taussig Road), Series 2002, 7.20% 2033 | 3,300 | 2,805 |
| 90,110 | ||
| Nebraska 0.05% | ||
| Hospital Auth. No. 2 of Douglas County, Health Facs. Rev. Ref. Bonds (Methodist Health System), Series 2015, 5.00% 2048 | 2,350 | 2,512 |
| Nevada 1.13% | ||
| Clark County, Airport System Rev. Bonds, Series 2007-A-1, AMT, AMBAC insured, 5.00% 2027 | 4,000 | 4,059 |
| Clark County, Jet Aviation Fuel Tax Rev. Ref. Bonds, Series 2013-A, AMT, 5.00% 2027 | 2,415 | 2,642 |
| Clark County, Jet Aviation Fuel Tax Rev. Ref. Bonds, Series 2013-A, AMT, 5.00% 2028 | 2,000 | 2,178 |
| Clark County, Pollution Control Rev. Ref. Bonds (Southern California Edison Company), Series 2010, 1.875% 2031 (put 2020) | 3,000 | 3,011 |
| Clark County, Special Improvement Dist. No. 121 (Southern Highlands Area), Local Improvement Rev. Ref. Bonds, Series 2016, 2.50% 2020 | 465 | 459 |
| Clark County, Special Improvement Dist. No. 121 (Southern Highlands Area), Local Improvement Rev. Ref. Bonds, Series 2016, 2.50% 2021 | 275 | 268 |
| Clark County, Special Improvement Dist. No. 121 (Southern Highlands Area), Local Improvement Rev. Ref. Bonds, Series 2016, 2.75% 2022 | 390 | 379 |
| Clark County, Special Improvement Dist. No. 121 (Southern Highlands Area), Local Improvement Rev. Ref. Bonds, Series 2016, 2.75% 2023 | 400 | 383 |
| Clark County, Special Improvement Dist. No. 121 (Southern Highlands Area), Local Improvement Rev. Ref. Bonds, Series 2016, 3.00% 2024 | 415 | 398 |
| Clark County, Special Improvement Dist. No. 121 (Southern Highlands Area), Local Improvement Rev. Ref. Bonds, Series 2016, 3.00% 2025 | 425 | 400 |
| Clark County, Special Improvement Dist. No. 142 (Mountain’s Edge), Local Improvement Ref. Bonds, Series 2012, 5.00% 2020 | 1,285 | 1,340 |
| Clark County, Special Improvement Dist. No. 142 (Mountain’s Edge), Local Improvement Ref. Bonds, Series 2012, 5.00% 2021 | 1,380 | 1,443 |
| City of Henderson, Health Fac. Rev. Ref. Bonds (Catholic Healthcare West), Series 2007-B, 5.25% 2031 (preref. 2017) | 2,000 | 2,037 |
| City of Henderson, Local Improvement Dist. No. T-16 (Falls at Lake Las Vegas), Limited Obligation Improvement Bonds, 5.00% 2018 | 905 | 899 |
| Bonds, notes & other debt instruments Nevada (continued) | Principal amount (000) | Value (000) |
| City of Henderson, Local Improvement Dist. No. T-16 (Falls at Lake Las Vegas), Limited Obligation Improvement Bonds, 5.00% 2019 | $1,145 | $1,130 |
| City of Henderson, Local Improvement Dist. No. T-16 (Falls at Lake Las Vegas), Limited Obligation Improvement Bonds, 5.125% 2025 | 2,815 | 2,676 |
| City of Henderson, Local Improvement Dist. No. T-17 (Madeira Canyon), Limited Obligation Improvement Bonds, 5.00% 2017 | 900 | 906 |
| City of Henderson, Public Improvement Trust, Touro College and University System Obligated Group Rev. Bonds, 5.50% 2044 | 1,645 | 1,747 |
| City of Las Vegas, Redev. Agcy., Tax Increment Rev. Bonds, Series 2009-A, 8.00% 2030 (preref. 2019) | 4,000 | 4,621 |
| City of Las Vegas, Redev. Agcy., Tax Increment Rev. Ref. Bonds, Series 2016, 5.00% 2030 | 1,375 | 1,542 |
| City of Las Vegas, Redev. Agcy., Tax Increment Rev. Ref. Bonds, Series 2016, 5.00% 2031 | 1,465 | 1,634 |
| City of Las Vegas, Redev. Agcy., Tax Increment Rev. Ref. Bonds, Series 2016, 5.00% 2045 | 1,225 | 1,335 |
| City of Las Vegas, Sales Tax Increment Rev. Bonds, Series 2016, 2.75% 20213 | 760 | 732 |
| City of Las Vegas, Sales Tax Increment Rev. Bonds, Series 2016, 3.50% 20253 | 3,030 | 2,860 |
| City of Las Vegas, Special Improvement Dist. No. 607 (Providence), Local Improvement Ref. Bonds, Series 2013, 4.25% 2024 | 200 | 203 |
| City of Las Vegas, Special Improvement Dist. No. 607 (Providence), Local Improvement Ref. Bonds, Series 2013, 5.00% 2022 | 430 | 457 |
| City of Las Vegas, Special Improvement Dist. No. 607 (Providence), Local Improvement Ref. Bonds, Series 2013, 5.00% 2023 | 380 | 406 |
| City of Las Vegas, Special Improvement Dist. No. 607 (Providence), Local Improvement Ref. Bonds, Series 2013, 5.00% 2024 | 255 | 272 |
| City of Las Vegas, Special Improvement Dist. Nos. 808 and 810 (Summerlin Village 23B), Local Improvement and Ref. Bonds, Series 2014, 5.00% 2026 | 975 | 987 |
| City of Las Vegas, Special Improvement Dist. Nos. 808 and 810 (Summerlin Village 23B), Local Improvement and Ref. Bonds, Series 2014, 5.00% 2028 | 385 | 387 |
| City of Las Vegas, Special Improvement Dist. Nos. 808 and 810 (Summerlin Village 23B), Local Improvement and Ref. Bonds, Series 2014, 5.00% 2029 | 685 | 686 |
| City of Las Vegas, Special Improvement Dist. Nos. 808 and 810 (Summerlin Village 23B), Local Improvement and Ref. Bonds, Series 2014, 5.00% 2031 | 140 | 139 |
| City of Las Vegas, Special Improvement Dist. Nos. 812, Local Improvement and Ref. Bonds (Summerlin Village 24), 5.00% 2026 | 500 | 514 |
| City of Las Vegas, Special Improvement Dist. Nos. 812, Local Improvement and Ref. Bonds (Summerlin Village 24), 5.00% 2029 | 1,650 | 1,669 |
| City of Las Vegas, Special Improvement Dist. Nos. 812, Local Improvement and Ref. Bonds (Summerlin Village 24), 5.00% 2035 | 1,625 | 1,608 |
| Redev. Agcy. of the City of Reno, Tax Increment Bonds, Series 2007-B, 5.00% 2027 | 2,000 | 1,756 |
| Redev. Agcy. of the City of Reno, Tax Increment Bonds, Series 2007-C, 5.40% 2027 | 6,875 | 5,917 |
| Rural Housing Auth., Single Family Mortgage Rev. Bonds (Mortgage-backed Securities Program), Series 2007-B, AMT, 5.70% 2041 | 220 | 226 |
| City of Sparks, Local Improvement Dist. No. 3 (Legends at Sparks Marina), Limited Obligation Improvement Bonds, 6.50% 2020 (preref. 2018) | 620 | 662 |
| City of Sparks, Local Improvement Dist. No. 3 (Legends at Sparks Marina), Limited Obligation Improvement Bonds, 6.75% 2027 (preref. 2018) | 700 | 762 |
| 55,730 | ||
| New Hampshire 0.14% | ||
| Business Fin. Auth., Rev. Bonds (Elliot Hospital Obligated Group Issue), Series 2009-A, 6.125% 2039 (preref. 2019) | 2,445 | 2,755 |
| Health and Education Facs. Auth., Rev. Bonds (Elliot Hospital Issue), Series 2016, 5.00% 2031 | 1,250 | 1,360 |
| Health and Education Facs. Auth., Rev. Bonds (Rivermead Issue), Series 2011-A, 6.875% 2041 | 2,625 | 2,953 |
| 7,068 |
| Bonds, notes & other debt instruments New Jersey 3.85% | Principal amount (000) | Value (000) |
| Camden County, Improvement Auth., Health Care Redev. Project Rev. Bonds (Cooper Health System Obligated Group Issue), Series 2013-A, 5.75% 2042 | $2,665 | $2,949 |
| Camden County, Improvement Auth., Health Care Redev. Project, Rev. Ref. Bonds (The Cooper Health System Obligated Group Issue), Series 2014, 5.00% 2030 | 1,405 | 1,489 |
| Camden County, Improvement Auth., Health Care Redev. Project, Rev. Ref. Bonds (The Cooper Health System Obligated Group Issue), Series 2014, 5.00% 2032 | 555 | 585 |
| Camden County, Improvement Auth., Health Care Redev. Project, Rev. Ref. Bonds (The Cooper Health System Obligated Group Issue), Series 2014-A, 5.00% 2029 | 250 | 267 |
| Casino Reinvestment Dev. Auth., Luxury Tax Rev. Bonds, Series 2014, 5.25% 2039 | 2,500 | 2,495 |
| Casino Reinvestment Dev. Auth., Luxury Tax Rev. Bonds, Series 2014, Assured Guaranty Municipal insured, 5.00% 2024 | 2,250 | 2,508 |
| Casino Reinvestment Dev. Auth., Luxury Tax Rev. Bonds, Series 2014, Assured Guaranty Municipal insured, 5.00% 2026 | 1,500 | 1,646 |
| Casino Reinvestment Dev. Auth., Luxury Tax Rev. Bonds, Series 2014, Assured Guaranty Municipal insured, 5.00% 2027 | 1,000 | 1,091 |
| Casino Reinvestment Dev. Auth., Luxury Tax Rev. Bonds, Series 2014, Assured Guaranty Municipal insured, 5.00% 2029 | 1,180 | 1,270 |
| Econ. Dev. Auth., Energy Fac. Rev. Bonds (UMM Energy Partners, LLC Project), Series 2012-A, AMT, 5.00% 2037 | 7,050 | 7,240 |
| Econ. Dev. Auth., Energy Fac. Rev. Bonds (UMM Energy Partners, LLC Project), Series 2012-A, AMT, 5.125% 2043 | 750 | 769 |
| Econ. Dev. Auth., Private Activity Bonds (Goethals Bridge Replacement Project), Series 2013, AMT, 5.375% 2043 | 7,725 | 8,189 |
| Econ. Dev. Auth., Rev. Bonds (Provident Group - Montclair Properties LLC - Montclair State University Student Housing Project), Series 2010-A, 5.875% 2042 | 3,500 | 3,785 |
| Econ. Dev. Auth., Rev. Ref. Bonds (Provident Group - Rowan Properties L.L.C. - Rowan University Student Housing Project), Series 2015-A, 5.00% 2024 | 1,475 | 1,607 |
| Econ. Dev. Auth., Rev. Ref. Bonds (Provident Group - Rowan Properties L.L.C. - Rowan University Student Housing Project), Series 2015-A, 5.00% 2035 | 3,750 | 3,888 |
| Econ. Dev. Auth., Rev. Ref. Bonds (Provident Group - Rowan Properties LLC - Rowan University Student Housing Project), Series 2015-A, 5.00% 2030 | 1,000 | 1,054 |
| Econ. Dev. Auth., Rev. Ref. Bonds (Provident Group - Rowan Properties LLC - Rowan University Student Housing Project), Series 2015-A, 5.00% 2048 | 2,150 | 2,202 |
| Econ. Dev. Auth., School Facs. Construction Bonds, Series 2015-WW, 5.25% 2033 | 2,500 | 2,556 |
| Econ. Dev. Auth., School Facs. Construction Bonds, Series 2015-WW, 5.25% 2040 | 850 | 863 |
| Econ. Dev. Auth., School Facs. Construction Bonds, Series 2016-AAA, 5.50% 2031 | 2,000 | 2,127 |
| Econ. Dev. Auth., School Facs. Construction Rev. Ref. Bonds, Series 2013-I, 2.26% 20282 | 13,500 | 12,471 |
| Econ. Dev. Auth., Special Fac. Rev. Bonds (Continental Airlines, Inc. Project), Series 1999, AMT, 5.125% 2023 | 3,500 | 3,706 |
| Econ. Dev. Auth., Special Fac. Rev. Bonds (Continental Airlines, Inc. Project), Series 1999, AMT, 5.25% 2029 | 16,300 | 17,194 |
| Econ. Dev. Auth., Special Fac. Rev. Bonds (Continental Airlines, Inc. Project), Series 2000-B, AMT, 5.625% 2030 | 2,500 | 2,721 |
| Econ. Dev. Auth., Special Fac. Rev. Bonds (Continental Airlines, Inc. Project), Series 2003, AMT, 5.50% 2033 | 3,500 | 3,761 |
| Econ. Dev. Auth., Special Fac. Rev. Ref. Bonds (Continental Airlines, Inc. Project), Series 2012, AMT, 5.75% 2027 | 4,500 | 4,825 |
| Educational Facs. Auth., Rev. and Rev. Ref. Bonds (Stockton University Issue), Series 2016-A, 5.00% 2030 | 1,770 | 1,957 |
| Educational Facs. Auth., Rev. and Rev. Ref. Bonds (Stockton University Issue), Series 2016-A, 5.00% 2032 | 1,000 | 1,100 |
| Educational Facs. Auth., Rev. and Rev. Ref. Bonds (Stockton University Issue), Series 2016-A, 5.00% 2027 | 3,000 | 3,375 |
| Educational Facs. Auth., Rev. and Rev. Ref. Bonds (Stockton University Issue), Series 2016-A, 5.00% 2031 | 2,100 | 2,317 |
| The Essex County Improvement Auth., Solid Waste Disposal Rev. Bonds (Covanta Project), AMT, 5.25% 20453 | 600 | 595 |
| Econ. Dev. Auth., Private Activity Bonds (Goethals Bridge Replacement Project), Series 2013, AMT, 5.625% 2052 | 3,940 | 4,351 |
| Health Care Facs. Fncg. Auth., Rev Bonds (Princeton Healthcare Systems Issue), Series 2016-A, 5.00% 2031 | 140 | 158 |
| Health Care Facs. Fncg. Auth., Rev Bonds (Princeton Healthcare Systems Issue), Series 2016-A, 5.00% 2034 | 1,000 | 1,102 |
| Health Care Facs. Fncg. Auth., Rev. and Rev. Ref. Bonds (Trinitas Regional Medical Center Obligated Group Issue), Series 2017-A, 5.00% 2024 | 1,000 | 1,117 |
| Bonds, notes & other debt instruments New Jersey (continued) | Principal amount (000) | Value (000) |
| Health Care Facs. Fncg. Auth., Rev. and Rev. Ref. Bonds (Trinitas Regional Medical Center Obligated Group Issue), Series 2017-A, 5.00% 2027 | $1,000 | $1,109 |
| Health Care Facs. Fncg. Auth., Rev. and Rev. Ref. Bonds (Trinitas Regional Medical Center Obligated Group Issue), Series 2017-A, 5.00% 2030 | 500 | 544 |
| Health Care Facs. Fncg. Auth., Rev. Bonds (AHS Hospital Corp. Issue), Series 2011, 6.00% 2041 (preref. 2021) | 1,000 | 1,188 |
| Health Care Facs. Fncg. Auth., Rev. Bonds (St. Joseph’s Healthcare System Obligated Group Issue), Series 2016, 5.00% 2031 | 1,700 | 1,818 |
| Health Care Facs. Fncg. Auth., Rev. Bonds (St. Joseph’s Healthcare System Obligated Group Issue), Series 2016, 5.00% 2035 | 500 | 528 |
| Health Care Facs. Fncg. Auth., Rev. Bonds (St. Joseph’s Healthcare System Obligated Group Issue), Series 2016, 5.00% 2036 | 1,000 | 1,052 |
| Health Care Facs. Fncg. Auth., Rev. Bonds (St. Joseph’s Healthcare System Obligated Group Issue), Series 2016, 5.00% 2041 | 1,125 | 1,179 |
| Health Care Facs. Fncg. Auth., Rev. Ref. Bonds (Barnabas Health Issue), Series 2011-A, 5.625% 2037 (preref. 2021) | 1,070 | 1,254 |
| Health Care Facs. Fncg. Auth., Rev. Ref. Bonds (RWJ Barnabas Health Obligated Group Issue), Series 2016-A, 5.00% 2043 | 950 | 1,034 |
| Health Care Facs. Fncg. Auth., Rev. Ref. Bonds (St. Peter’s University Hospital Obligated Group Issue), Series 2011, 6.00% 2026 | 2,000 | 2,124 |
| Health Care Facs. Fncg. Auth., Rev. Ref. Bonds (St. Peter’s University Hospital Obligated Group Issue), Series 2011, 6.25% 2035 | 3,000 | 3,205 |
| Health Care Facs. Fncg. Auth., Rev. Ref. Bonds (University Hospital), Series 2015-A, Assured Guaranty Municipal insured, 5.00% 2046 | 1,075 | 1,147 |
| Higher Education Student Assistance Auth., Student Loan Rev. Bonds, Series 2013-1-A, AMT, 3.75% 2026 | 880 | 869 |
| Higher Education Student Assistance Auth., Student Loan Rev. Bonds, Series 2013-1-A, AMT, 4.00% 2020 | 3,000 | 3,142 |
| Higher Education Student Assistance Auth., Student Loan Rev. Bonds, Series 2013-1-A, AMT, 5.00% 2021 | 1,500 | 1,640 |
| Higher Education Student Assistance Auth., Student Loan Rev. Bonds, Series 2013-1-A, AMT, 5.00% 2022 | 1,000 | 1,103 |
| Higher Education Student Assistance Auth., Student Loan Rev. Bonds, Series 2015-1-A, AMT, 4.00% 2027 | 4,000 | 4,096 |
| Higher Education Student Assistance Auth., Student Loan Rev. Bonds, Series 2016-1-A, AMT, 3.50% 2032 | 1,375 | 1,235 |
| Higher Education Student Assistance Auth., Student Loan Rev. Bonds, Series 2016-1-A, AMT, 4.00% 2039 | 1,250 | 1,160 |
| Higher Education Student Assistance Auth., Student Loan Rev. Bonds, Series 2016-1-A, AMT, 5.00% 2022 | 500 | 552 |
| Higher Education Student Assistance Auth., Student Loan Rev. Bonds, Series 2016-1-A, AMT, 5.00% 2023 | 1,000 | 1,108 |
| Higher Education Student Assistance Auth., Student Loan Rev. Bonds, Series 2016-1-A, AMT, 5.00% 2024 | 1,000 | 1,110 |
| Higher Education Student Assistance Auth., Student Loan Rev. Bonds, Series 2016-1-A, AMT, 5.00% 2025 | 1,000 | 1,120 |
| The Pollution Control Fncg. Auth. Of Salem County, Pollution Control Rev. Bonds (Philadelphia Electric Company Project), Series 1993-A, AMT, 2.50% 2025 (put 2019) | 1,000 | 994 |
| South Jersey Transportation Auth., Transportation System Rev. Bonds, Series 2012-A, 5.00% 2026 | 1,920 | 2,099 |
| South Jersey Transportation Auth., Transportation System Rev. Bonds, Series 2014-A, 5.00% 2039 | 12,650 | 13,546 |
| South Jersey Transportation Auth., Transportation System Rev. Bonds, Series 2012-A, 5.00% 2029 | 1,200 | 1,299 |
| South Jersey Transportation Auth., Transportation System Rev. Bonds, Series 2014-A, 5.00% 2025 | 400 | 450 |
| South Jersey Transportation Auth., Transportation System Rev. Bonds, Series 2014-A, 5.00% 2027 | 990 | 1,108 |
| South Jersey Transportation Auth., Transportation System Rev. Bonds, Series 2014-A, 5.00% 2033 | 2,300 | 2,506 |
| Tobacco Settlement Fncg. Corp., Tobacco Settlement Asset-backed Rev. Ref. Bonds, Series 2007-1-A, 5.00% 2041 | 22,860 | 20,575 |
| Transportation Trust Fund Auth., Transportation System Bonds, Series 2006-C, AMBAC insured, 0% 2035 | 13,000 | 5,152 |
| 190,376 | ||
| New Mexico 0.38% | ||
| Dona Ana County, Improvement Dist. Bonds (Santa Teresa Improvement Dist.-Airport Road Business Center, Phase III), Series 2001-A, 8.375% 2021 | 815 | 826 |
| Dona Ana County, Improvement Dist. Bonds (Santa Teresa Improvement Dist.-Border Industrial Park, Phase I & II), Series 2001-B, 8.875% 2021 | 1,895 | 1,923 |
| City of Farmington, Pollution Control Rev. Ref. Bonds (Southern California Edison Company Four Corners Project), Series 2005-B, 1.875% 2029 (put 2020) | 3,000 | 2,994 |
| Bonds, notes & other debt instruments New Mexico (continued) | Principal amount (000) | Value (000) |
| Hospital Equipment Loan Council, Hospital Improvement and Rev. Ref. Bonds (Gerald Champion Regional Medical Center Project), 5.50% 2042 | $3,000 | $3,174 |
| Hospital Equipment Loan Council, Rev. Ref. Bonds (Haverland Charter Lifestyle Group), Series 2012, 5.00% 2032 | 2,000 | 2,085 |
| Hospital Equipment Loan Council, Rev. Ref. Bonds (Haverland Charter Lifestyle Group), Series 2012, 5.00% 2042 | 4,250 | 4,345 |
| Mortgage Fin. Auth., Single Family Mortgage Program Bonds, Series 2008-C, Class I, AMT, 6.95% 2039 | 200 | 206 |
| Mortgage Fin. Auth., Single Family Mortgage Program Bonds, Series 2009-D, Class I, 5.35% 2040 | 150 | 158 |
| Mortgage Fin. Auth., Single Family Mortgage Program Bonds, Series 2016-A-2, Class I, AMT, 3.50% 2046 | 1,630 | 1,697 |
| Mortgage Fin. Auth., Single Family Mortgage Program Class I Bonds, Series 2010-A, 4.625% 2025 | 260 | 270 |
| Mortgage Fin. Auth., Single Family Mortgage Program Rev. Ref. Bonds, Series 2012-B-1, Class I, AMT, 3.75% 2043 | 1,080 | 1,121 |
| 18,799 | ||
| New York 4.33% | ||
| Brooklyn Arena Local Dev. Corp., Pilot Rev. Ref. Bonds (Brooklyn Events Center LLC), Series 2016-A, 5.00% 2030 | 500 | 561 |
| Brooklyn Arena Local Dev. Corp., Pilot Rev. Ref. Bonds (Brooklyn Events Center LLC), Series 2016-A, 5.00% 2042 | 2,500 | 2,715 |
| Brooklyn Arena Local Dev. Corp., Pilot Rev. Ref. Bonds (Brooklyn Events Center LLC), Series 2016-A, 5.00% 2026 | 500 | 577 |
| Buffalo and Erie County, Industrial Land Dev. Corp., Obligated Group Rev. Bonds (Catholic Health System, Inc. Project), Series 2015, 5.00% 2040 | 600 | 639 |
| Buffalo and Erie County, Industrial Land Dev. Corp., Obligated Group Rev. Bonds (Catholic Health System, Inc. Project), Series 2015, 5.25% 2035 | 500 | 548 |
| Build NYC Resource Corp., Rev. Bonds (Bronx Charter School for Excellence Project), Series 2013-A, 5.50% 2043 | 500 | 520 |
| Build NYC Resource Corp., Solid Waste Disposal Rev. Bonds (Pratt Paper (NY), Inc. Project), Series 2014, AMT, 3.75% 20203 | 1,120 | 1,141 |
| Build NYC Resource Corp., Solid Waste Disposal Rev. Bonds (Pratt Paper (NY), Inc. Project), Series 2014, AMT, 4.50% 20253 | 450 | 470 |
| Build NYC Resource Corp., Solid Waste Disposal Rev. Bonds (Pratt Paper (NY), Inc. Project), Series 2014, AMT, 5.00% 20353 | 1,150 | 1,208 |
| Build NYC Resources Corp Rev. Ref. Bonds (Albert Einstein School of Medicine, Inc. Project), 5.50% 20453 | 3,300 | 3,540 |
| County of Chautauqua, Industrial Dev. Agcy., Exempt Fac. Rev. Bonds (NRG Dunkirk Power Project), Series 2009, 5.875% 2042 | 500 | 523 |
| Convention Center Dev. Corp., Rev. Bonds (Hotel Unit Fee Secured), Series 2016-A, 0% 2048 | 5,000 | 1,215 |
| Convention Center Dev. Corp., Rev. Bonds (Hotel Unit Fee Secured), Series 2016-A, 0% 2051 | 10,000 | 2,095 |
| Convention Center Dev. Corp., Rev. Bonds (Hotel Unit Fee Secured), Series 2016-A, 0% 2052 | 5,000 | 996 |
| Convention Center Dev. Corp., Rev. Bonds (Hotel Unit Fee Secured), Series 2016-A, 0% 2054 | 16,000 | 2,908 |
| Convention Center Dev. Corp., Rev. Bonds (Hotel Unit Fee Secured), Series 2016-A, 0% 2055 | 10,000 | 1,735 |
| Dobbs Ferry Local Dev. Corp., Rev. Bonds, Series 2014, 5.00% 2044 | 1,600 | 1,762 |
| Dormitory Auth., Culinary Institute of America Rev. Bonds, Series 2013, 5.50% 2033 | 500 | 554 |
| Dormitory Auth., Icahn School of Medicine at Mount Sinai, Rev. Bonds, Series 2015-A, 5.00% 2040 | 250 | 270 |
| Dormitory Auth., Mental Health Services Facs. Improvement Rev. Ref. Bonds, Series 2010-A, 5.00% 2024 | 1,585 | 1,755 |
| Dormitory Auth., Mental Health Services Facs. Improvement Rev. Ref. Bonds, Series 2010-A, 5.00% 2024 (preref. 2020) | 5 | 6 |
| Dormitory Auth., North Shore-Long Island Jewish Obligated Group, Rev. Ref. Bonds, Series 2011-A, 5.00% 2032 | 4,000 | 4,384 |
| Dormitory Auth., Orange Regional Medical Center Obligated Group Rev. Bonds, Series 2008, 6.25% 2037 | 1,120 | 1,212 |
| Dormitory Auth., Orange Regional Medical Center Obligated Group Rev. Bonds, Series 2015, 5.00% 20313 | 500 | 532 |
| Dormitory Auth., Orange Regional Medical Center Obligated Group Rev. Bonds, Series 2015, 5.00% 20323 | 500 | 532 |
| Dormitory Auth., Orange Regional Medical Center Obligated Group Rev. Bonds, Series 2015, 5.00% 20333 | 1,200 | 1,278 |
| Dormitory Auth., Orange Regional Medical Center Obligated Group Rev. Bonds, Series 2015, 5.00% 20343 | 1,200 | 1,273 |
| Dormitory Auth., Orange Regional Medical Center Obligated Group Rev. Bonds, Series 2015, 5.00% 20353 | 1,000 | 1,061 |
| Bonds, notes & other debt instruments New York (continued) | Principal amount (000) | Value (000) |
| Dormitory Auth., State Personal Income Tax Rev. Bonds (Education), Series 2010-E, 5.00% 2017 | $3,490 | $3,496 |
| Dormitory Auth., State Personal Income Tax Rev. Bonds (Education), Series 2014-C, 5.00% 2044 | 1,430 | 1,599 |
| Dormitory Auth., The New School Rev. Bonds, Series 2015-A, 5.00% 2050 | 1,000 | 1,091 |
| Dormitory Auth., Touro College and University System Obligated Group Rev. Bonds, Series 2014-A, 5.50% 2044 | 1,250 | 1,339 |
| Dutchess County, Local Dev. Corp., Rev. Bonds (Culinary Institute of America Project), Series 2016-A-1, 5.00% 2026 | 150 | 173 |
| Dutchess County, Local Dev. Corp., Rev. Bonds (Culinary Institute of America Project), Series 2016-A-1, 5.00% 2029 | 410 | 464 |
| Dutchess County, Local Dev. Corp., Rev. Bonds (Culinary Institute of America Project), Series 2016-A-1, 5.00% 2030 | 180 | 203 |
| Dutchess County, Local Dev. Corp., Rev. Bonds (Culinary Institute of America Project), Series 2016-A-1, 5.00% 2036 | 170 | 187 |
| Dutchess County, Local Dev. Corp., Rev. Bonds (Culinary Institute of America Project), Series 2016-A-1, 5.00% 2041 | 200 | 218 |
| Various Purpose G.O. Bonds, Series 2016-A, 5.00% 2027 | 825 | 975 |
| Glen Cove Local Econ. Assistance Corp. (Garvies Point Public Improvement Project), Convertible Capital Appreciation Rev. Bonds, Series 2016-C, 0% 20551 | 11,320 | 7,561 |
| Hudson Yards Infrastructure Corp., Rev. Bonds, Fiscal 2012 Series A, 5.25% 2047 | 2,500 | 2,767 |
| Hudson Yards Infrastructure Corp., Rev. Bonds, Fiscal 2012 Series A, 5.75% 2047 | 3,000 | 3,399 |
| Liberty Dev. Corp., Liberty Rev. Ref. Bonds (3 World Trade Center Project), Series 2014, Class 1, 5.00% 20443 | 7,450 | 7,784 |
| Liberty Dev. Corp., Liberty Rev. Ref. Bonds (3 World Trade Center Project), Series 2014, Class 2, 5.15% 20343 | 7,500 | 8,004 |
| Liberty Dev. Corp., Liberty Rev. Ref. Bonds (3 World Trade Center Project), Series 2014, Class 2, 5.375% 20403 | 3,160 | 3,408 |
| Liberty Dev. Corp., Liberty Rev. Ref. Bonds (3 World Trade Center Project), Series 2014, Class 3, 7.25% 20443 | 2,625 | 3,102 |
| Liberty Dev. Corp., Liberty Rev. Ref. Bonds (4 World Trade Center Project), Series 2011, 5.75% 2051 | 1,000 | 1,140 |
| Liberty Dev. Corp., Liberty Rev. Ref. Bonds (Bank of America Tower at One Bryant Park Project), Series 2010, 6.375% 2049 | 13,360 | 14,578 |
| New York City Housing Dev. Corp., Multi-family Housing Rev. Bonds, Series 2007-B-1, AMT, 5.05% 2022 | 1,500 | 1,508 |
| New York City Housing Dev. Corp., Multi-family Housing Rev. Bonds, Series 2007-B-1, AMT, 5.125% 2032 | 1,000 | 1,010 |
| New York City Housing Dev. Corp., Multi-family Housing Rev. Bonds, Series 2007-B-1, AMT, 5.15% 2037 | 500 | 501 |
| New York City Industrial Dev. Agcy., Airport Facs. Rev. Ref. Bonds (Transportation Infrastructure Properties, LLC Obligated Group), Series 2012-A, AMT, 5.00% 2028 | 2,000 | 2,125 |
| New York City Transitional Fin. Auth., Building Aid Rev. Bonds, Fiscal 2012 Series S-1-A, 5.00% 2032 | 750 | 836 |
| New York City Transitional Fin. Auth., Future Tax Secured Bonds, Fiscal 2011 Series C, 5.00% 2039 | 1,000 | 1,110 |
| New York City Transitional Fin. Auth., Future Tax Secured Bonds, Series 2014-D-1, 5.00% 2036 | 2,250 | 2,531 |
| New York City Transitional Fin. Auth., Future Tax Secured Rev. Ref. Bonds, Series 2014-A-1, 5.00% 2037 | 1,000 | 1,131 |
| New York City Transitional Fin. Auth., Future Tax Secured Rev. Ref. Bonds, Series 2015-E-1, 5.00% 2041 | 300 | 337 |
| New York City, Housing Dev. Corp. Multi-Family Rev. Bonds (8 Spruce Street), Series 2014-E, 3.50% 2048 | 1,600 | 1,574 |
| New York City, Housing Dev. Corp. Multi-Family Rev. Bonds (8 Spruce Street), Series 2014-F, 4.50% 2048 | 10,250 | 10,450 |
| Niagara Area Dev. Corp. (New York), Solid Waste Disposal Fac. Rev. Ref. Bonds (Covanta Energy Project), Series 2012-A, AMT, 5.25% 20423 | 2,250 | 2,266 |
| Niagara Frontier Transportation Auth., Airport Rev. Ref. Bonds (Buffalo Niagara International Airport), Series 2014-A, AMT, 5.00% 2029 | 1,200 | 1,318 |
| Onondaga Civic Dev. Corp., Rev. Ref. Bonds (St. Joseph’s Hospital Health Center Project), Series 2012, 5.00% 2042 (preref. 2022) | 1,000 | 1,170 |
| Onondaga County, Resource Recovery Agcy., Rev. Ref. Bonds, Series 2015-A, AMT, Assured Guaranty Municipal insured, 5.00% 2030 | 1,490 | 1,638 |
| Port Auth., Special Project Bonds (JFK International Air Terminal LLC Project), Series 8, 6.00% 2036 | 2,650 | 2,993 |
| Port Auth., Special Project Bonds (JFK International Air Terminal LLC Project), Series 8, 6.00% 2042 | 5,500 | 6,197 |
| County of Rockland G.O. Bonds, Series 2014-A, Assured Guaranty Municipal insured, 5.00% 2024 | 300 | 345 |
| Seneca Nation of Indians, Rev. Bonds, Series A, 5.00% 20233 | 9,590 | 9,658 |
| Transportation Dev. Corp., Special Fac. Rev. Ref. Bonds (American Airlines, Inc. John F. Kennedy International Airport Project), Series 2016, AMT, 5.00% 2020 | 10,000 | 10,478 |
| Transportation Dev. Corp., Special Fac. Rev. Ref. Bonds (American Airlines, Inc. John F. Kennedy International Airport Project), Series 2016, AMT, 5.00% 2026 | 8,220 | 8,582 |
| Bonds, notes & other debt instruments New York (continued) | Principal amount (000) | Value (000) |
| Transportation Dev. Corp., Special Fac. Rev. Ref. Bonds (American Airlines, Inc. John F. Kennedy International Airport Project), Series 2016, AMT, 5.00% 2031 | $4,750 | $4,929 |
| Transportation Dev. Corp., Special Facs. Bonds (Laguardia Airport Terminal B Redev. Project), Series 2016-A, AMT 4.00% 2031 | 4,000 | 4,077 |
| Transportation Dev. Corp., Special Facs. Bonds (Laguardia Airport Terminal B Redev. Project), Series 2016-A, AMT 4.00% 2032 | 2,000 | 1,958 |
| Transportation Dev. Corp., Special Facs. Bonds (Laguardia Airport Terminal B Redev. Project), Series 2016-A, AMT 4.00% 2033 | 4,500 | 4,424 |
| Transportation Dev. Corp., Special Facs. Bonds (LaGuardia Airport Terminal B Redev. Project), Series 2016-A, AMT, 5.00% 2046 | 3,900 | 4,080 |
| Transportation Dev. Corp., Special Facs. Bonds (LaGuardia Airport Terminal B Redev. Project), Series 2016-A, AMT, 5.00% 2041 | 3,250 | 3,440 |
| Transportation Dev. Corp., Special Facs. Bonds (LaGuardia Airport Terminal B Redev. Project), Series 2016-A, AMT, 5.25% 2050 | 21,950 | 23,227 |
| Westchester County, Local Dev. Corp., Rev. Bonds (Westchester Medical Center Obligated Group Project), Series 2016, 5.00% 2046 | 3,000 | 3,161 |
| 214,552 | ||
| North Carolina 0.37% | ||
| Eastern Municipal Power Agcy., Power System Rev. Ref. Bonds, Series 1993-B, 6.00% 2026 (escrowed to maturity) | 1,000 | 1,298 |
| Housing Fin. Agcy., Home Ownership Rev. Ref. Bonds, Series 37-A, AMT, 3.50% 2039 | 1,250 | 1,303 |
| Medical Care Commission, Health Care Facs. First Mortgage Rev. Ref. Bonds (Lutheran Services for the Aging), Series 2012-A, 4.75% 2032 | 1,500 | 1,538 |
| Medical Care Commission, Health Care Facs. First Mortgage Rev. Ref. Bonds (Pennybyrn at Maryfield), 5.00% 2020 | 725 | 765 |
| Medical Care Commission, Health Care Facs. First Mortgage Rev. Ref. Bonds (Pennybyrn at Maryfield), 5.00% 2025 | 1,200 | 1,248 |
| Medical Care Commission, Health Care Facs. First Mortgage Rev. Ref. Bonds (Pennybyrn at Maryfield), 5.00% 2030 | 1,900 | 1,908 |
| Medical Care Commission, Health Care Facs. First Mortgage Rev. Ref. Bonds (Pennybyrn at Maryfield), 5.00% 2035 | 1,000 | 984 |
| Medical Care Commission, Health System Rev. Ref. Bonds (Mission Health Combined Group), Series 2017, 5.00% 2028 | 515 | 602 |
| Medical Care Commission, Health System Rev. Ref. Bonds (Mission Health Combined Group), Series 2017, 5.00% 2029 | 500 | 581 |
| Medical Care Commission, Health System Rev. Ref. Bonds (Mission Health Combined Group), Series 2017, 5.00% 2030 | 780 | 899 |
| Medical Care Commission, Health System Rev. Ref. Bonds (Mission Health Combined Group), Series 2017, 5.00% 2033 | 500 | 567 |
| Medical Care Commission, Health System Rev. Ref. Bonds (Mission Health Combined Group), Series 2017, 5.00% 2035 | 1,000 | 1,124 |
| Medical Care Commission, Retirement Facs. First Mortgage Rev. Bonds (Carolina Village Project), Series 2008-A, 6.00% 2038 | 2,230 | 2,277 |
| Medical Care Commission, Retirement Facs. First Mortgage, Rev. Ref. Bonds (Southminster), Series 2016, 5.00% 2031 | 1,250 | 1,259 |
| Medical Care Commission, Retirement Facs. First Mortgage, Rev. Ref. Bonds (Southminster), Series 2016, 5.00% 2037 | 1,800 | 1,787 |
| 18,140 |
| Bonds, notes & other debt instruments North Dakota 0.18% | Principal amount (000) | Value (000) |
| Burleigh County, Health Care Rev. Bonds (St. Alexius Medical Center Project), Series 2014-A, 5.00% 2031 (preref. 2021) | $1,200 | $1,370 |
| Burleigh County, Health Care Rev. Bonds (St. Alexius Medical Center Project), Series 2014-A, 5.00% 2035 (preref. 2021) | 500 | 571 |
| Housing Fin. Agcy., Housing Fin. Program Bonds (Home Mortgage Fin. Program), Series 2016-B, AMT, 4.00% 2047 | 6,430 | 6,822 |
| 8,763 | ||
| Ohio 5.04% | ||
| Air Quality Dev. Auth., Air Quality Dev. Rev. Bonds (FirstEnergy Generation Corp. Project), Series 2009-A, 5.70% 2020 | 1,500 | 612 |
| Air Quality Dev. Auth., Pollution Control Rev. Ref. Bonds (FirstEnergy Generation Corp. Project), Series 2009-C, 5.625% 2018 | 11,055 | 10,409 |
| Akron, Bath and Copley Joint Township Hospital Dist., Hospital Facs. Rev. Ref. and Improvement Rev. Bonds (Summa Health Obligated Group), Series 2016, 5.25% 2041 | 850 | 926 |
| Akron, Bath and Copley Joint Township Hospital Dist., Hospital Facs. Rev. Ref. and Improvement Rev. Bonds (Summa Health Obligated Group), Series 2016, 5.25% 2046 | 2,200 | 2,386 |
| Akron, Bath, and Copley Joint Township Hospital Dist., Hospital Facs. Rev. Bonds (Akron General Health System), 3.80% 2027 (preref. 2022) | 1,850 | 1,976 |
| Beaver County, Industrial Dev. Auth., Pollution Control Rev. Ref. Bonds (FirstEnergy Nuclear Generation Project), Series 2008-B, 4.25% 2047 (put 2021) | 3,000 | 2,764 |
| Buckeye Tobacco Settlement Fncg. Auth., Tobacco Settlement Asset-backed Bonds, Current Interest Bonds, Series 2007-A-2, 5.875% 2030 | 2,350 | 2,148 |
| Buckeye Tobacco Settlement Fncg. Auth., Tobacco Settlement Asset-backed Bonds, Current Interest Bonds, Series 2007-A-2, 5.875% 2047 | 108,715 | 100,007 |
| Buckeye Tobacco Settlement Fncg. Auth., Tobacco Settlement Asset-backed Bonds, Current Interest Bonds, Series 2007-A-2, 6.50% 2047 | 18,215 | 17,945 |
| County of Butler, Hospital Facs. Rev. Bonds (UC Health), Series 2010, 5.50% 2040 | 3,415 | 3,767 |
| County of Butler, Hospital Facs. Rev. Bonds (UC Health), Series 2010, 5.50% 2040 (preref. 2020) | 1,710 | 1,962 |
| County of Butler, Hospital Facs. Rev. Bonds (UC Health), Series 2010, 5.75% 2040 (preref. 2020) | 1,000 | 1,157 |
| County of Butler, Hospital Facs. Rev. Bonds (UC Health), Series 2016, 5.00% 2045 | 2,650 | 2,887 |
| City of Centerville, Health Care Rev. Ref. Bonds (Bethany Lutheran Village Continuing Care Fac. Expansion Project), Series 2007-A, 6.00% 2038 | 1,000 | 1,005 |
| City of Cleveland, Airport System Rev. Ref. Bonds, Series 2011-A, 5.00% 2020 | 3,535 | 3,844 |
| City of Cleveland, Airport System Rev. Ref. Bonds, Series 2012-A, 5.00% 2025 | 1,095 | 1,219 |
| City of Cleveland, Airport System Rev. Ref. Bonds, Series 2012-A, 5.00% 2026 | 1,000 | 1,108 |
| City of Cleveland, Airport System Rev. Ref. Bonds, Series 2012-A, 5.00% 2027 | 2,300 | 2,536 |
| City of Cleveland, Airport System Rev. Ref. Bonds, Series 2012-A, 5.00% 2030 | 1,000 | 1,092 |
| City of Cleveland, Airport System Rev. Ref. Bonds, Series 2012-A, 5.00% 2031 | 1,000 | 1,089 |
| City of Cleveland, Airport System Rev. Ref. Bonds, Series 2016-A, Assured Guaranty Municipal insured, 5.00% 2027 | 1,000 | 1,146 |
| City of Cleveland, Airport System Rev. Ref. Bonds, Series 2016-A, Assured Guaranty Municipal insured, 5.00% 2029 | 2,000 | 2,257 |
| County of Cuyahoga, Health Care Facs. Rev. Bonds (Franciscan Communities, Inc. - Mount Alverna Project), Series 2004-D, 6.50% 2034 | 1,315 | 1,323 |
| County of Franklin, Health Care Facs. Improvement Rev. Bonds (OPRS Communities), Series 2013-A, 6.125% 2040 | 2,275 | 2,499 |
| County of Franklin, Health Care Facs. Improvement Rev. Bonds (Presbyterian Retirement Services Project), Series 2010-A, 5.625% 2026 | 2,850 | 3,062 |
| County of Franklin, Health Care Facs. Rev. Bonds (OPRS Communities), Series 2016-C, 5.00% 2038 | 3,000 | 3,105 |
| County of Gallia, Hospital Facs. Rev. Ref. and Improvement Bonds (Holzer Health System Obligated Group Project), Series 2012-A, 8.00% 2042 | 8,295 | 9,562 |
| County of Hamilton, Healthcare Facs. Rev. Bonds (Christ Hospital Project), Series 2012, 5.00% 2042 | 1,500 | 1,626 |
| County of Hamilton, Healthcare Improvement and Rev. Ref. Bonds (Life Enriching Communities Project), Series 2016, 5.00% 2031 | 2,855 | 3,004 |
| Bonds, notes & other debt instruments Ohio (continued) | Principal amount (000) | Value (000) |
| County of Hamilton, Healthcare Improvement and Rev. Ref. Bonds (Life Enriching Communities Project), Series 2016, 5.00% 2051 | $3,500 | $3,500 |
| County of Hamilton, Healthcare Rev. Bonds (Life Enriching Communities Project), Series 2011-A, 6.625% 2046 (preref. 2021) | 1,000 | 1,193 |
| Hospital Rev. Ref. Bonds (Cleveland Clinic Health System Obligated Group), Series 2012-A, 5.00% 2038 | 1,000 | 1,104 |
| County of Lake, Hospital Facs. Rev. Ref. Bonds (Lake Hospital System, Inc.), Series 2008-C, 5.625% 2029 (preref. 2018) | 1,680 | 1,798 |
| Licking County, Health Care Facs. Rev. Ref. Bonds (Kendal Granville), Series 2015-A, 6.00% 2050 | 3,470 | 3,592 |
| Licking County, Health Care Facs. Rev. Ref. Bonds (Kendal Granville), Series 2015-A, 6.125% 2042 | 8,500 | 8,894 |
| County of Muskingum, Hospital Facs. Rev. Ref. Bonds (Genesis HealthCare System Obligated Group Project), Series 2013, 5.00% 2033 | 2,585 | 2,687 |
| County of Muskingum, Hospital Facs. Rev. Ref. Bonds (Genesis HealthCare System Obligated Group Project), Series 2013, 5.00% 2044 | 6,000 | 6,204 |
| County of Muskingum, Hospital Facs. Rev. Ref. Bonds (Genesis HealthCare System Obligated Group Project), Series 2013, 5.00% 2048 | 4,000 | 4,121 |
| Solid Waste Disposal Rev. Bonds (USG Corp. Project), Series 1997, AMT, 5.60% 2032 | 950 | 933 |
| Southeastern Ohio Port Auth., Hospital Facs. Rev. Ref. and Improvement Bonds (Memorial Health System Obligated Group Project), Series 2012, 5.75% 2032 | 6,655 | 7,261 |
| Southeastern Ohio Port Auth., Hospital Facs. Rev. Ref. and Improvement Bonds (Memorial Health System Obligated Group Project), Series 2012, 6.00% 2042 | 6,200 | 6,792 |
| Southeastern Ohio Port Auth., Hospital Facs. Rev. Ref. and Improvement Bonds (Memorial Health System Obligated Group Project), Series 2015, 5.00% 2035 | 850 | 860 |
| Southeastern Ohio Port Auth., Hospital Facs. Rev. Ref. and Improvement Bonds (Memorial Health System Obligated Group Project), Series 2015, 5.00% 2043 | 750 | 755 |
| Southeastern Ohio Port Auth., Hospital Facs. Improvement Rev. Bonds (Memorial Health System Obligated Group Project), Series 2015, 5.00% 2020 | 350 | 376 |
| Treasurer of State, Tax-Exempt Private Activity Bonds (Portsmouth Bypass Project), Series 2015, AMT, 5.00% 2053 | 7,500 | 7,894 |
| Warren County, Healthcare Facs., Rev. Ref. Bonds (Otterbein Homes Obligated Group), Series 2016-A, 5.00% 2040 | 1,575 | 1,691 |
| Water Dev. Auth., Pollution Control Rev. Ref. Bonds (FirstEnergy Nuclear Generation Project), Series 2009-A, 4.375% 2033 (put 2022) | 1,500 | 1,383 |
| 249,461 | ||
| Oklahoma 0.87% | ||
| Comanche County, Hospital Auth., Hospital Rev. Ref. Bonds, Series 2015, 5.00% 2025 | 2,115 | 2,240 |
| Comanche County, Hospital Auth., Hospital Rev. Ref. Bonds, Series 2015, 5.00% 2027 | 1,810 | 1,876 |
| Comanche County, Hospital Auth., Hospital Rev. Ref. Bonds, Series 2015, 5.00% 2029 | 945 | 969 |
| Fort Sill Apache Ok Tribe Gaming Enterprise, Econ. Dev. Auth., Series 2011-A, 8.50% 20263 | 6,615 | 7,605 |
| Housing Fin. Agcy., Single Family Mortgage Rev. Bonds (Homeownership Loan Program), Series 2008-A, AMT, 6.80% 2038 | 85 | 85 |
| Municipal Power Auth., Power Supply System Rev. Ref. Bonds, Series 2016-A, 5.00% 2030 | 900 | 1,030 |
| Trustees of the Tulsa Airports Improvement Trust, General Airport Rev. Bonds, Series 2015-A, AMT, BAM insured, 5.00% 2023 | 800 | 894 |
| Trustees of the Tulsa Airports Improvement Trust, General Airport Rev. Bonds, Series 2015-A, AMT, BAM insured, 5.00% 2035 | 1,000 | 1,077 |
| Trustees of the Tulsa Airports Improvement Trust, General Airport Rev. Bonds, Series 2015-A, AMT, BAM insured, 5.00% 2045 | 2,480 | 2,656 |
| Trustees of the Tulsa Municipal Airport Trust, American Airlines Inc. Rev. Ref. Bonds, Series 2001-B, AMT, 5.50% 2035 | 15,875 | 16,839 |
| Trustees of the Tulsa Municipal Airport Trust, American Airlines Inc. Rev. Ref. Bonds, Series 2013-B, AMT, 5.50% 2035 | 120 | 128 |
| Bonds, notes & other debt instruments Oklahoma (continued) | Principal amount (000) | Value (000) |
| Tulsa Industrial Auth., Rev. Ref. Bonds (University of Tulsa), Series 2009, 6.00% 2027 | $1,285 | $1,426 |
| Trustees of the Tulsa Municipal Airport Trust, Series 2015, AMT, 5.00% 2035 (put 2025) | 6,000 | 6,296 |
| 43,121 | ||
| Oregon 0.46% | ||
| Cow Creek Band of Umpqua Tribe of Indians, Tax Rev. Bonds, Series 2006-C, 5.625% 2026 | 9,915 | 9,927 |
| Facs. Auth., Rev. Bonds (University of Portland Projects), Series 2015-A, 5.00% 2034 | 1,000 | 1,124 |
| Facs. Auth., Rev. Bonds (University of Portland Projects), Series 2015-A, 5.00% 2035 | 1,145 | 1,282 |
| Facs. Auth., Rev. Bonds (University of Portland Projects), Series 2015-A, 5.00% 2045 | 1,500 | 1,662 |
| City of Forest Grove, Oregon Campus Improvement Rev. Ref. Bonds (Pacific University Project), Series 2015-A, 5.00% 2030 | 550 | 604 |
| Klamath Falls, Intercommunity Hospital Auth., Rev. Ref. Bonds (Sky Lakes Medical Center Project), Series 2016, 5.00% 2027 | 200 | 232 |
| Klamath Falls, Intercommunity Hospital Auth., Rev. Ref. Bonds (Sky Lakes Medical Center Project), Series 2016, 5.00% 2028 | 265 | 306 |
| Klamath Falls, Intercommunity Hospital Auth., Rev. Ref. Bonds (Sky Lakes Medical Center Project), Series 2016, 5.00% 2029 | 235 | 269 |
| Klamath Falls, Intercommunity Hospital Auth., Rev. Ref. Bonds (Sky Lakes Medical Center Project), Series 2016, 5.00% 2030 | 200 | 227 |
| Klamath Falls, Intercommunity Hospital Auth., Rev. Ref. Bonds (Sky Lakes Medical Center Project), Series 2016, 5.00% 2031 | 200 | 226 |
| Klamath Falls, Intercommunity Hospital Auth., Rev. Ref. Bonds (Sky Lakes Medical Center Project), Series 2016, 5.00% 2032 | 270 | 304 |
| The Hospital Fac. Auth. of Polk County, Rev. Bonds (Dallas Retirement Village Project), Series 2015-A, 5.50% 2050 | 5,080 | 5,003 |
| The Hospital Fac. Auth. of Polk County, Rev. Bonds (Dallas Retirement Village Project), Series 2015-B, 3.625% 2020 | 480 | 476 |
| Yamhill County, Hospital Auth., Rev. and Rev. Ref. Bonds (Friendsview Retirement Community), Series 2016-A, 5.00% 2036 | 325 | 333 |
| Yamhill County, Hospital Auth., Rev. and Rev. Ref. Bonds (Friendsview Retirement Community), Series 2016-A, 5.00% 2046 | 1,000 | 995 |
| 22,970 | ||
| Pennsylvania 5.19% | ||
| Allegheny County, Hospital Dev. Auth., University of Pittsburgh Medical Center Rev. Bonds, Series 2007-A-1, 1.414% 20372 | 6,000 | 5,471 |
| Beaver County, Industrial Dev. Auth., Pollution Control Rev. Ref. Bonds (FirstEnergy Nuclear Generation Project), Series 2006-A, 4.375% 2035 (put 2022) | 3,000 | 2,765 |
| Chester County, Health and Education, Facs. Auth. Rev. Bonds (Simpson Senior Services Project), Series 2015-A, 5.00% 2030 | 1,000 | 1,003 |
| Chester County, Health and Education, Facs. Auth. Rev. Bonds (Simpson Senior Services Project), Series 2015-A, 5.00% 2035 | 1,000 | 976 |
| Chester County, Health and Education, Facs. Auth. Rev. Bonds (Simpson Senior Services Project), Series 2015-A, 5.25% 2045 | 3,800 | 3,714 |
| Crawford County, Hospital Auth., Rev. Bonds (Meadville Medical Center Project), Series 2016-A, 6.00% 2036 | 1,515 | 1,520 |
| Crawford County, Hospital Auth., Rev. Bonds (Meadville Medical Center Project), Series 2016-A, 6.00% 2046 | 3,440 | 3,438 |
| Crawford County, Hospital Auth., Rev. Bonds (Meadville Medical Center Project), Series 2016-A, 6.00% 2051 | 3,715 | 3,706 |
| Cumberland County, Municipal Auth., Rev. Bonds (Diakon Lutheran Social Ministries Project), Series 2016, 5.00% 2030 | 1,000 | 1,097 |
| Cumberland County, Municipal Auth., Rev. Bonds (Diakon Lutheran Social Ministries Project), Series 2016, 5.00% 2032 | 890 | 962 |
| Cumberland County, Municipal Auth., Rev. Bonds (Diakon Lutheran Social Ministries Project), Series 2016, 5.00% 2033 | 1,610 | 1,732 |
| Dauphin County General Auth., Health System Rev. Bonds (Pinnacle Health System Project), Series 2016-A, 5.00% 2034 | 1,245 | 1,385 |
| Bonds, notes & other debt instruments Pennsylvania (continued) | Principal amount (000) | Value (000) |
| Dauphin County, General Auth., Health System Rev. Bonds (Pinnacle Health System Project), Series 2016-A, 5.00% 2036 | $500 | $550 |
| Delaware River Port Auth., Port Dist. Project Rev. Ref. Bonds, Series 2012, 5.00% 2023 | 2,420 | 2,671 |
| Doylestown Hospital Auth. (Commonwealth of Pennsylvania), Doylestown Hospital Rev. Bonds, Series 2016-A, 5.00% 2046 | 6,370 | 6,677 |
| East Hempfield Township Industrial Dev. Auth., Rev. Bonds (Student Services, Inc. Student Housing Project at Millersville University of Pennsylvania), Series 2013, 5.00% 2035 | 1,000 | 1,040 |
| East Hempfield Township Industrial Dev. Auth., Rev. and Ref. Bonds (Willow Valley Communities Project), 5.00% 2027 | 500 | 568 |
| East Hempfield Township Industrial Dev. Auth., Rev. and Ref. Bonds (Willow Valley Communities Project), 5.00% 2028 | 900 | 1,016 |
| East Hempfield Township Industrial Dev. Auth., Rev. and Ref. Bonds (Willow Valley Communities Project), 5.00% 2029 | 300 | 337 |
| East Hempfield Township Industrial Dev. Auth., Rev. Bonds (Student Services, Inc. Student Housing Project at Millersville University of Pennsylvania), Series 2013, 5.00% 2045 | 2,750 | 2,832 |
| East Hempfield Township, Industrial Dev. Auth., Rev. Bonds (Student Services, Inc. Student Housing Project at Millersville University of Pennsylvania), Series 2014, 5.00% 2029 | 730 | 779 |
| East Hempfield Township Industrial Dev. Auth., Rev. Bonds (Student Services, Inc. Student Housing Project at Millersville University of Pennsylvania), Series 2014, 5.00% 2034 | 875 | 915 |
| East Hempfield Township Industrial Dev. Auth., Rev. Bonds (Student Services, Inc. Student Housing Project at Millersville University of Pennsylvania), Series 2014, 5.00% 2039 | 440 | 456 |
| East Hempfield Township, Industrial Dev. Auth., Rev. Bonds (Student Services, Inc. Student Housing Project at Millersville University of Pennsylvania), Series 2014, 5.00% 2046 | 2,850 | 2,937 |
| East Hempfield Township Industrial Dev. Auth., Rev. Bonds (Student Services, Inc. Student Housing Project at Millersville University of Pennsylvania), Series 2015, 5.00% 2025 | 4,905 | 5,409 |
| East Hempfield Township Industrial Dev. Auth., Rev. Bonds (Student Services, Inc. Student Housing Project at Millersville University of Pennsylvania), Series 2015, 5.00% 2030 | 825 | 876 |
| East Hempfield Township Industrial Dev. Auth., Rev. Bonds (Student Services, Inc. Student Housing Project at Millersville University of Pennsylvania), Series 2015, 5.00% 2047 | 2,500 | 2,575 |
| Econ. Dev. Fncg. Auth., Exempt Facs. Rev. Ref. Bonds (PPL Energy Supply, LLC Project), Series 2009-C, 5.00% 2037 (put 2020) | 7,275 | 7,269 |
| Econ. Dev. Fncg. Auth., Private Activity Rev. Bonds (The Pennsylvania Rapid Bridge Replacement Project), Series 2015, AMT, 5.00% 2029 | 7,500 | 8,188 |
| Econ. Dev. Fncg. Auth., Private Activity Rev. Bonds (The Pennsylvania Rapid Bridge Replacement Project), Series 2015, AMT, 5.00% 2034 | 9,200 | 9,841 |
| Econ. Dev. Fncg. Auth., Private Activity Rev. Bonds (The Pennsylvania Rapid Bridge Replacement Project), Series 2015, AMT, 5.00% 2038 | 9,250 | 9,776 |
| Econ. Dev. Fncg. Auth., Private Activity Rev. Bonds (The Pennsylvania Rapid Bridge Replacement Project), Series 2015, AMT, 5.00% 2042 | 1,250 | 1,322 |
| Higher Education Facs. Auth., Rev. Bonds (Thomas Jefferson University), Series 2015-A, 5.25% 2050 | 2,400 | 2,645 |
| Higher Educational Facs. Auth., Rev. Bonds (Edinboro University Foundation Student Housing Project), Series 2008, 6.00% 2042 (preref. 2018) | 1,000 | 1,069 |
| Higher Educational Facs. Auth., Rev. Bonds (Edinboro University Foundation Student Housing Project), Series 2010, 6.00% 2043 (preref. 2020) | 6,700 | 7,710 |
| Higher Educational Facs. Auth., Rev. Bonds (Shippensburg University Student Services, Inc. Student Housing Project at Shippensburg University of Pennsylvania), Series 2011, 6.25% 2043 | 4,690 | 5,159 |
| Higher Educational Facs. Auth., Rev. Bonds (Shippensburg University Student Services, Inc. Student Housing Project at Shippensburg University of Pennsylvania), Series 2012, 5.00% 2030 | 1,000 | 1,052 |
| Higher Educational Facs. Auth., Rev. Bonds (Shippensburg University Student Services, Inc. Student Housing Project at Shippensburg University of Pennsylvania), Series 2012, 5.00% 2044 | 4,260 | 4,394 |
| Higher Educational Facs. Auth., Student Housing Rev. Bonds (University Properties, Inc. Student Housing Project at East Stroudsburg University of Pennsylvania), Series 2010, 5.00% 2031 | 2,375 | 2,452 |
| Higher Educational Facs. Auth., Student Housing Rev. Bonds (University Properties, Inc. Student Housing Project at East Stroudsburg University of Pennsylvania), Series 2010, 5.00% 2042 | 7,890 | 8,079 |
| Bonds, notes & other debt instruments Pennsylvania (continued) | Principal amount (000) | Value (000) |
| Higher Educational Facs. Auth., Student Housing Rev. Bonds (University Properties, Inc. Student Housing Project at East Stroudsburg University of Pennsylvania), Series 2016-A, 5.00% 2026 | $570 | $626 |
| Higher Educational Facs. Auth., Student Housing Rev. Bonds (University Properties, Inc. Student Housing Project at East Stroudsburg University of Pennsylvania), Series 2016-A, 5.00% 2031 | 750 | 800 |
| Higher Educational Facs. Auth., University of Pennsylvania Health System, Rev. Bonds, Series 2011-A, 5.75% 2041 (preref. 2021) | 1,500 | 1,775 |
| Lancaster Industrial Dev. Auth., Rev. Bonds (Garden Spot Village Project), Series 2013, 5.75% 2035 | 1,000 | 1,083 |
| Lehigh County General Purpose Auth., Hospital Rev. Bonds (Saint Luke’s Hospital of Bethlehem Project), Series 2007, 1.524% 20332 | 515 | 449 |
| Lycoming County, Auth., Health System Rev. Bonds (Susquehanna Health System Project), Series 2009-A, 5.75% 2039 | 4,500 | 4,869 |
| Montgomery County, Higher Education and Health Auth., Hospital Rev. Bonds (Abington Memorial Hospital Obligated Group), Series 2012-A, 5.00% 2031 | 520 | 567 |
| Montgomery County, Industrial Dev. Auth., Health Systems Rev. Bonds (Albert Einstein Healthcare Network Issue), Series 2015-A, 5.25% 2036 | 4,690 | 4,974 |
| Montgomery County, Industrial Dev. Auth., Health Systems Rev. Bonds (Albert Einstein Healthcare Network Issue), Series 2015-A, 5.25% 2045 | 9,125 | 9,622 |
| Montgomery County, Industrial Dev. Auth., Health Systems Rev. Bonds (Albert Einstein Healthcare Network Issue), Series 2015-A, 5.25% 2046 | 1,060 | 1,118 |
| Montgomery County, Industrial Dev. Auth., Pollution Control Rev. Ref. Bonds (PECO Energy Company Project), Series 2001-A, AMT, 2.70% 2034 (put 2020) | 1,000 | 994 |
| Montgomery County, Industrial Dev. Auth., Retirement Communities Rev. Ref. Bonds (ACTS Retirement-Life Communities, Inc. Obligated Group), Series 2012, 5.00% 2027 | 2,500 | 2,730 |
| Montgomery County, Industrial Dev. Auth., Retirement Communities Rev. Ref. Bonds (ACTS Retirement-Life Communities, Inc. Obligated Group), Series 2012, 5.00% 2028 | 2,800 | 3,046 |
| Montgomery County, Industrial Dev. Auth., Mortgage Rev. Bonds (Whitemarsh Continuing Care Retirement Community Project), Series 2008, 7.00% 2036 (preref. 2018) | 2,000 | 2,119 |
| Montgomery County, Industrial Dev. Auth., Retirement Communities Rev. Bonds (ACTS Retirement-Life Communities, Inc. Obligated Group), Series 2009-A-1, 6.25% 2029 (preref. 2019) | 725 | 823 |
| Montgomery County, Industrial Dev. Auth., Retirement Communities Rev. Bonds (ACTS Retirement-Life Communities, Inc. Obligated Group), Series 2016, 5.00% 2036 | 6,750 | 7,213 |
| Montgomery County, Industrial Dev. Auth., Rev. Bonds (Foulkeways at Gwynedd Project), Series 2016, 5.00% 2030 | 350 | 378 |
| Montgomery County, Industrial Dev. Auth., Rev. Bonds (Foulkeways at Gwynedd Project), Series 2016, 5.00% 2046 | 325 | 339 |
| Hospitals and Higher Education Facs. Auth. of Philadelphia, Hospital Rev. Bonds (Temple University Health System Obligated Group), Series 2012-A, 5.625% 2042 | 12,320 | 13,160 |
| Hospitals and Higher Education Facs. Auth. of Philadelphia, Hospital Rev. Ref. Bonds (Temple University Health System Obligated Group), Series 2007-A, 5.00% 2034 | 6,380 | 6,407 |
| Hospitals and Higher Education Facs. Auth. of Philadelphia, Hospital Rev. Ref. Bonds (Temple University Health System Obligated Group), Series 2012-A, 5.625% 2036 | 3,885 | 4,163 |
| Hospitals and Higher Education Facs. Auth. of Philadelphia, Hospital Rev. Ref. Bonds (Temple University Health System Obligated Group), Series 2012-B, 5.00% 2017 | 500 | 505 |
| Hospitals and Higher Education Facs. Auth. of Philadelphia, Hospital Rev. Ref. Bonds (Temple University Hospital), Series 2007-B, 5.00% 2017 | 500 | 504 |
| School Dist. of Philadelphia, G.O. Bonds, Series 2016-F, 5.00% 2028 | 4,500 | 5,002 |
| School Dist. of Philadelphia, G.O. Bonds, Series 2016-F, 5.00% 2029 | 6,500 | 7,174 |
| School Dist. of Philadelphia, G.O. Bonds, Series 2016-F, 5.00% 2030 | 2,000 | 2,195 |
| School Dist. of Philadelphia, G.O. Bonds, Series 2016-F, 5.00% 2036 | 1,000 | 1,069 |
| School Dist. of Philadelphia, G.O. Bonds, Series 2016-F, 5.00% 2037 | 1,500 | 1,599 |
| School Dist. of Philadelphia, G.O. Bonds, Series 2016-F, 5.00% 2038 | 1,000 | 1,065 |
| Public Fin. Auth., Exempt Facs. Ref. Rev. Bonds (National Gypsum Company), Series 2014, AMT, 5.50% 2044 | 4,500 | 4,761 |
| State Public School Building Auth., School Lease Rev. Ref. Bonds (School Dist. of Philadelphia Project), Series 2016-A, Assured Guaranty Municipal insured, 5.00% 2030 | 5,000 | 5,500 |
| Susquehanna Area Regional Airport Auth., Airport System Rev. Bonds, Series 2012-A, AMT, 5.00% 2019 | 3,630 | 3,780 |
| Bonds, notes & other debt instruments Pennsylvania (continued) | Principal amount (000) | Value (000) |
| Susquehanna Area Regional Airport Auth., Airport System Rev. Bonds, Series 2012-A, AMT, 5.00% 2020 | $3,855 | $4,078 |
| Susquehanna Area Regional Airport Auth., Airport System Rev. Bonds, Series 2012-A, AMT, 5.00% 2023 | 4,120 | 4,513 |
| Susquehanna Area Regional Airport Auth., Airport System Rev. Bonds, Series 2012-A, AMT, 5.00% 2027 | 10,210 | 10,884 |
| Turnpike Commission, Turnpike Rev. Bonds, Series 2013-A, 1.26% 20172 | 1,000 | 1,000 |
| Turnpike Commission, Turnpike Rev. Bonds, Series 2016-A-2, 1.24% 20182 | 3,000 | 2,983 |
| Redev. Auth. of the County of Washington, Redev. Bonds (Victory Centre Project - Tanger Outlet Dev.), Series 2006-A, 5.45% 2035 | 4,995 | 4,995 |
| West Shore Area Auth., Rev. Bonds (Messiah Village Project), Series 2015-A, 5.00% 2035 | 1,500 | 1,576 |
| 256,801 | ||
| Puerto Rico 3.45% | ||
| Aqueduct and Sewer Auth., Rev. Ref. Bonds, Series 2008-A, Assured Guaranty insured, 5.125% 2047 | 585 | 597 |
| Aqueduct and Sewer Auth., Rev. Ref. Bonds, Series 2012-A, 5.25% 2042 | 26,410 | 20,080 |
| Aqueduct and Sewer Auth., Rev. Ref. Bonds, Series 2012-A, 5.75% 2037 | 100 | 77 |
| Electric Power Auth., Power Rev. Bonds, Series 2003-NN, National insured, 5.25% 2023 | 370 | 393 |
| Electric Power Auth., Power Rev. Bonds, Series 2005-RR, National insured, 5.00% 2023 | 480 | 486 |
| Electric Power Auth., Power Rev. Bonds, Series 2005-SS, Assured Guaranty Municipal insured, 5.00% 2030 | 80 | 81 |
| Electric Power Auth., Power Rev. Bonds, Series 2007-TT, 5.00% 2037 | 2,500 | 1,624 |
| Electric Power Auth., Power Rev. Bonds, Series 2007-VV, National insured, 5.25% 2024 | 520 | 552 |
| Electric Power Auth., Power Rev. Bonds, Series 2007-VV, National insured, 5.25% 2032 | 4,060 | 4,262 |
| Electric Power Auth., Power Rev. Bonds, Series 2010-CCC, 5.25% 2028 | 500 | 325 |
| Electric Power Auth., Power Rev. Bonds, Series 2013-A, 7.00% 2033 | 2,000 | 1,300 |
| Electric Power Auth., Power Rev. Bonds, Series 2013-A, 7.00% 2040 | 295 | 192 |
| Electric Power Auth., Power Rev. Bonds, Series 2013-A, 7.00% 2043 | 405 | 263 |
| Electric Power Auth., Power Rev. Bonds, Series XX, 5.25% 2040 | 2,050 | 1,331 |
| Electric Power Auth., Power Rev. Ref. Bonds, Series 2003-NN, National insured, 4.75% 2033 | 510 | 510 |
| Electric Power Auth., Power Rev. Ref. Bonds, Series UU, Assured Guaranty Municipal insured, 1.189% 20292 | 19,260 | 14,653 |
| Electric Power Auth., Power Rev. Ref. Bonds, Series WW, 5.50% 2038 | 110 | 71 |
| Public Improvement Bonds (G.O. Bonds), Series 2001-A, National insured, 5.50% 2020 | 460 | 488 |
| Public Improvement Rev. Ref. Bonds (G.O. Bonds), Series 2002-A, National insured, 5.50% 2021 | 615 | 652 |
| Highway and Transportation Auth., Transportation Rev. Bonds, Series 1998-A, 4.75% 2038 | 1,277 | 361 |
| Highways and Transportation Auth., Highway Rev. Ref. Bonds, Series 2003-AA-1, Assured Guaranty Municipal insured, 4.95% 2026 | 545 | 555 |
| Highways and Transportation Auth., Highway Rev. Ref. Bonds, Series 2007-CC, Assured Guaranty insured, 5.50% 2031 | 1,755 | 1,957 |
| Highways and Transportation Auth., Transportation Rev. Bonds, Series 2003-G, 5.00% 2028 | 10 | 3 |
| Highways and Transportation Auth., Transportation Rev. Bonds, Series 2003-G, 5.00% 2042 | 6,150 | 1,737 |
| Highways and Transportation Auth., Transportation Rev. Bonds, Series 2004-J, 4.80% 2024 | 30 | 8 |
| Highways and Transportation Auth., Transportation Rev. Bonds, Series 2005-K, 4.50% 2035 | 30 | 8 |
| Highways and Transportation Auth., Transportation Rev. Bonds, Series 2005-K, 5.00% 2017 | 500 | 141 |
| Highways and Transportation Auth., Transportation Rev. Bonds, Series 2005-K, 5.00% 2018 | 140 | 40 |
| Highways and Transportation Auth., Transportation Rev. Bonds, Series 2005-K, 5.00% 2025 | 10 | 3 |
| Highways and Transportation Auth., Transportation Rev. Bonds, Series 2005-K, 5.00% 2027 | 375 | 106 |
| Highways and Transportation Auth., Transportation Rev. Bonds, Series 2005-K, 5.00% 2030 | 9,740 | 2,752 |
| Highways and Transportation Auth., Transportation Rev. Bonds, Series 2007-M, 4.00% 2017 | 100 | 28 |
| Highways and Transportation Auth., Transportation Rev. Bonds, Series 2007-M, 4.125% 2019 | 30 | 8 |
| Highways and Transportation Auth., Transportation Rev. Bonds, Series 2007-M, 5.00% 2024 | 1,350 | 381 |
| Highways and Transportation Auth., Transportation Rev. Bonds, Series 2007-M, 5.00% 2025 | 50 | 14 |
| Highways and Transportation Auth., Transportation Rev. Bonds, Series 2007-M, 5.00% 2032 | 60 | 17 |
| Highways and Transportation Auth., Transportation Rev. Bonds, Series 2007-M, 5.00% 2037 | 405 | 114 |
| Highways and Transportation Auth., Transportation Rev. Bonds, Series 2007-M, 5.00% 2046 | 100 | 28 |
| Highways and Transportation Auth., Transportation Rev. Ref. Bonds, Series 2003-H, 5.00% 2023 | 25 | 7 |
| Highways and Transportation Auth., Transportation Rev. Ref. Bonds, Series 2005-L, National insured 5.25% 2035 | 295 | 305 |
| Highways and Transportation Auth., Transportation Rev. Ref. Bonds, Series 2007-N, 5.50% 2021 | 45 | 13 |
| Bonds, notes & other debt instruments Puerto Rico (continued) | Principal amount (000) | Value (000) |
| Highways and Transportation Auth., Transportation Rev. Ref. Bonds, Series 2007-N, Assured Guaranty insured, 5.25% 2034 | $4,250 | $4,600 |
| Highways and Transportation Auth., Transportation Rev. Ref. Bonds, Series 2007-N, Assured Guaranty insured, 5.25% 2036 | 11,085 | 11,914 |
| Industrial, Tourist, Educational, Medical and Environmental Control Facs. Fncg. Auth., Higher Education Rev. and Rev. Ref. Bonds (Ana G. Méndez University System Project), 5.00% 2036 | 180 | 152 |
| Industrial, Tourist, Educational, Medical and Environmental Control Facs. Fncg. Auth., Higher Education Rev. and Rev. Ref. Bonds (Ana G. Méndez University System Project), 5.50% 2031 | 235 | 217 |
| Industrial, Tourist, Educational, Medical and Environmental Control Facs. Fncg. Auth., Higher Education Rev. and Rev. Ref. Bonds (Ana G. Méndez University System Project), Series 2006, 5.00% 2021 | 2,620 | 2,595 |
| Industrial, Tourist, Educational, Medical and Environmental Control Facs. Fncg. Auth., Higher Education Rev. and Rev. Ref. Bonds (Ana G. Méndez University System Project), Series 2006, 5.00% 2026 | 875 | 824 |
| Industrial, Tourist, Educational, Medical and Environmental Control Facs. Fncg. Auth., Higher Education Rev. and Rev. Ref. Bonds (Ana G. Méndez University System Project), Series 2012, 5.00% 2027 | 1,850 | 1,715 |
| Industrial, Tourist, Educational, Medical and Environmental Control Facs. Fncg. Auth., Higher Education Rev. and Rev. Ref. Bonds (Ana G. Méndez University System Project), Series 2012, 5.375% 2042 | 3,450 | 2,972 |
| Industrial, Tourist, Educational, Medical and Environmental Control Facs. Fncg. Auth., Higher Education Rev. and Rev. Ref. Bonds (Inter American University of Puerto Rico Project), Series 2004, National insured, 4.25% 2024 | 550 | 550 |
| Industrial, Tourist, Educational, Medical and Environmental Control Facs. Fncg. Auth., Higher Education Rev. and Rev. Ref. Bonds (Inter American University of Puerto Rico Project), Series 2012, 5.00% 2018 | 2,500 | 2,541 |
| Industrial, Tourist, Educational, Medical and Environmental Control Facs. Fncg. Auth., Higher Education Rev. and Rev. Ref. Bonds (Inter American University of Puerto Rico Project), Series 2012, 5.00% 2019 | 1,500 | 1,534 |
| Industrial, Tourist, Educational, Medical and Environmental Control Facs. Fncg. Auth., Higher Education Rev. and Rev. Ref. Bonds (Inter American University of Puerto Rico Project), Series 2012, 5.00% 2020 | 3,485 | 3,585 |
| Industrial, Tourist, Educational, Medical and Environmental Control Facs. Fncg. Auth., Higher Education Rev. and Rev. Ref. Bonds (Inter American University of Puerto Rico Project), Series 2012, 5.00% 2021 | 1,985 | 2,052 |
| Industrial, Tourist, Educational, Medical and Environmental Control Facs. Fncg. Auth., Higher Education Rev. and Rev. Ref. Bonds (Inter American University of Puerto Rico Project), Series 2012, 5.00% 2022 | 1,000 | 1,036 |
| Industrial, Tourist, Educational, Medical and Environmental Control Facs. Fncg. Auth., Higher Education Rev. and Rev. Ref. Bonds (Inter American University of Puerto Rico Project), Series 2012, 5.00% 2031 | 1,500 | 1,469 |
| Industrial, Tourist, Educational, Medical and Environmental Control Facs. Fncg. Auth., Higher Education Rev. and Rev. Ref. Bonds (University of the Sacred Heart Project), 4.00% 2024 | 300 | 221 |
| Industrial, Tourist, Educational, Medical and Environmental Control Facs. Fncg. Auth., Higher Education Rev. and Rev. Ref. Bonds (University of the Sacred Heart Project), Series 2012, 3.00% 2018 | 355 | 325 |
| Industrial, Tourist, Educational, Medical and Environmental Control Facs. Fncg. Auth., Higher Education Rev. and Rev. Ref. Bonds (University of the Sacred Heart Project), Series 2012, 4.00% 2023 | 960 | 720 |
| Industrial, Tourist, Educational, Medical and Environmental Control Facs. Fncg. Auth., Higher Education Rev. and Rev. Ref. Bonds (University of the Sacred Heart Project), Series 2012, 4.00% 2026 | 795 | 559 |
| Industrial, Tourist, Educational, Medical and Environmental Control Facs. Fncg. Auth., Higher Education Rev. and Rev. Ref. Bonds (University of the Sacred Heart Project), Series 2012, 4.125% 2027 | 995 | 694 |
| Industrial, Tourist, Educational, Medical and Environmental Control Facs. Fncg. Auth., Higher Education Rev. and Rev. Ref. Bonds (University of the Sacred Heart Project), Series 2012, 4.375% 2031 | 1,200 | 805 |
| Industrial, Tourist, Educational, Medical and Environmental Control Facs. Fncg. Auth., Higher Education Rev. and Rev. Ref. Bonds (University of the Sacred Heart Project), Series 2012, 5.00% 2020 | 50 | 42 |
| Industrial, Tourist, Educational, Medical and Environmental Control Facs. Fncg. Auth., Higher Education Rev. and Rev. Ref. Bonds (University of the Sacred Heart Project), Series 2012, 5.00% 2042 | 2,280 | 1,486 |
| Industrial, Tourist, Educational, Medical and Environmental Control Facs. Fncg. Auth., Higher Education Rev. Ref. Bonds (Ana G. Méndez University System Project), Series 2002, 5.375% 2021 | 85 | 85 |
| Industrial, Tourist, Educational, Medical and Environmental Control Facs. Fncg. Auth., Hospital Rev. and Rev. Ref. Bonds (Hospital Auxilio Mutuo Obligated Group Project), Series 2011-A, 5.00% 2021 | 1,320 | 1,385 |
| Industrial, Tourist, Educational, Medical and Environmental Control Facs. Fncg. Auth., Hospital Rev. and Rev. Ref. Bonds (Hospital Auxilio Mutuo Obligated Group Project), Series 2011-A, 6.00% 2033 | 12,025 | 12,208 |
| Electric Power Auth., Power Rev. Bonds, Series 2005-RR, Assured Guaranty insured, 5.00% 2028 | 135 | 137 |
| Bonds, notes & other debt instruments Puerto Rico (continued) | Principal amount (000) | Value (000) |
| Industrial, Tourist, Educational, Medical and Environmental Control Facs. Fncg. Auth., Hospital Rev. and Rev. Ref. Bonds (Hospital Auxilio Mutuo Obligated Group Project), Series 2011-A, 5.00% 2018 | $355 | $365 |
| Sales Tax Fncg. Corp., Sales Tax Rev. Bonds, Series 2007-A, National insured, 0% 2041 | 11,760 | 2,960 |
| Sales Tax Fncg. Corp., Sales Tax Rev. Bonds, Series 2007-A, AMBAC-BHAC insured, 0% 2054 | 815 | 105 |
| Sales Tax Fncg. Corp., Sales Tax Rev. Bonds, Series 2007-A, National insured, 0% 2042 | 31,640 | 7,363 |
| Sales Tax Fncg. Corp., Sales Tax Rev. Bonds, Series 2007-A, National insured, 0% 2045 | 8,660 | 1,684 |
| Sales Tax Fncg. Corp., Sales Tax Rev. Bonds, Series 2007-A, National insured, 0% 2046 | 4,350 | 796 |
| Sales Tax Fncg. Corp., Sales Tax Rev. Bonds, Series 2011-A-1, 5.25% 2043 | 2,845 | 1,358 |
| Sales Tax Fncg. Corp., Sales Tax Rev. Ref. Bonds, Series 2007-A, National insured, 0% 2043 | 54,000 | 11,837 |
| Sales Tax Fncg. Corp., Sales Tax Rev. Ref. Bonds, Series 2007-A, AMBAC insured, 0% 2047 | 8,000 | 1,235 |
| Sales Tax Fncg. Corp., Sales Tax Rev. Ref. Bonds, Series 2007-A, FGIC-National insured, 0% 2040 | 7,705 | 2,052 |
| Sales Tax Fncg. Corp., Sales Tax Rev. Ref. Bonds, Series 2007-A, National insured, 0% 2044 | 46,595 | 9,620 |
| University of Puerto Rico, University System Rev. Bonds, Series 2006-Q, 5.00% 2024 | 65 | 30 |
| University of Puerto Rico, University System Rev. Bonds, Series 2006-Q, 5.00% 2030 | 10 | 5 |
| University of Puerto Rico, University System Rev. Ref. Bonds, Series 2006-P, 5.00% 2017 | 995 | 950 |
| University of Puerto Rico, University System Rev. Ref. Bonds, Series 2006-P, 5.00% 2019 | 1,530 | 767 |
| University of Puerto Rico, University System Rev. Ref. Bonds, Series 2006-P, 5.00% 2020 | 430 | 208 |
| University of Puerto Rico, University System Rev. Ref. Bonds, Series 2006-P, 5.00% 2022 | 1,570 | 737 |
| University of Puerto Rico, University System Rev. Ref. Bonds, Series 2006-P, 5.00% 2023 | 5,665 | 2,631 |
| University of Puerto Rico, University System Rev. Ref. Bonds, Series 2006-P, 5.00% 2024 | 4,000 | 1,840 |
| University of Puerto Rico, University System Rev. Ref. Bonds, Series 2006-P, 5.00% 2026 | 2,395 | 1,086 |
| University of Puerto Rico, University System Rev. Ref. Bonds, Series 2006-P, 5.00% 2030 | 1,910 | 864 |
| University of Puerto Rico, University System Rev. Ref. Bonds, Series 2006-P, National insured, 5.00% 2024 | 50 | 50 |
| University of Puerto Rico, University System Rev. Ref. Bonds, Series 2006-P, National insured, 5.00% 2025 | 60 | 60 |
| University of Puerto Rico, University System Rev. Ref. Bonds, Series 2006-Q, 5.00% 2017 | 1,125 | 1,074 |
| University of Puerto Rico, University System Rev. Ref. Bonds, Series 2006-Q, 5.00% 2018 | 1,855 | 1,056 |
| University of Puerto Rico, University System Rev. Ref. Bonds, Series 2006-Q, 5.00% 2018 | 600 | 341 |
| University of Puerto Rico, University System Rev. Ref. Bonds, Series 2006-Q, 5.00% 2019 | 2,490 | 1,248 |
| University of Puerto Rico, University System Rev. Ref. Bonds, Series 2006-Q, 5.00% 2020 | 7,130 | 3,450 |
| University of Puerto Rico, University System Rev. Ref. Bonds, Series 2006-Q, 5.00% 2021 | 520 | 247 |
| University of Puerto Rico, University System Rev. Ref. Bonds, Series 2006-Q, 5.00% 2022 | 4,010 | 1,881 |
| 170,846 | ||
| Rhode Island 1.09% | ||
| Commerce Corp., Airport Rev. Bonds, Series 2016-D, 5.00% 2030 | 500 | 561 |
| Commerce Corp., Airport Rev. Bonds, Series 2016-D, 5.00% 2041 | 500 | 549 |
| Health and Educational Building Corp., Hospital Fncg. Rev. Bonds (Care New England Issue), Series 2013-A, 6.00% 2033 (preref. 2023) | 1,250 | 1,543 |
| Health and Educational Building Corp., Hospital Fncg. Rev. Ref. Bonds (Care New England Issue), Series 2016-B, 5.00% 2031 | 11,410 | 11,645 |
| Health and Educational Building Corp., Hospital Fncg. Rev. Ref. Bonds (Care New England Issue), Series 2016-B, 5.00% 2036 | 10,350 | 10,389 |
| Health and Educational Building Corp., Hospital Fncg. Rev. Ref. Bonds (Lifespan Obligated Group Issue), Series 2016, 5.00% 2029 | 1,380 | 1,526 |
| Health and Educational Building Corp., Hospital Fncg. Rev. Ref. Bonds (Lifespan Obligated Group Issue), Series 2016, 5.00% 2031 | 1,000 | 1,088 |
| Health and Educational Building Corp., Hospital Fncg. Rev. Ref. Bonds (Lifespan Obligated Group Issue), Series 2016, 5.00% 2033 | 1,500 | 1,614 |
| Housing and Mortgage Fin. Corp., Homeownership Opportunity Bonds, Series 68-C, AMT, 3.50% 2039 | 13,250 | 13,801 |
| Student Loan Auth., Student Loan Program Rev. Bonds, Series 2014-A, AMT, 4.75% 2028 | 800 | 833 |
| Student Loan Auth., Student Loan Program Rev. Bonds, Series 2014-A, AMT, 4.75% 2029 | 400 | 415 |
| Student Loan Auth., Student Loan Program Rev. Bonds, Series 2015-A, AMT, 3.625% 2026 | 1,000 | 978 |
| Student Loan Auth., Student Loan Program Rev. Bonds, Series 2015-A, AMT, 4.00% 2027 | 2,500 | 2,521 |
| Student Loan Auth., Student Loan Program Rev. Bonds, Series 2015-A, AMT, 4.00% 2028 | 1,000 | 1,003 |
| Student Loan Auth., Student Loan Program Rev. Bonds, Series 2016-A, AMT, 3.125% 2027 | 1,500 | 1,404 |
| Bonds, notes & other debt instruments Rhode Island (continued) | Principal amount (000) | Value (000) |
| Student Loan Auth., Student Loan Program Rev. Bonds, Series 2016-A, AMT, 3.25% 2028 | $1,500 | $1,394 |
| Student Loan Auth., Student Loan Program Rev. Bonds, Series 2016-A, AMT, 3.375% 2029 | 2,815 | 2,622 |
| 53,886 | ||
| South Carolina 0.74% | ||
| Connector 2000 Association Inc., Toll Road Rev., Series 2011-A-1, 0% 2032 | 1,712 | 505 |
| Connector 2000 Association Inc., Toll Road Rev., Series 2011-A-1, 0% 2042 | 19,060 | 2,858 |
| Housing Fin. and Dev. Auth., Mortgage Rev. Bonds, Series 2016-B-2, AMT, 4.00% 2043 | 5,385 | 5,687 |
| Jobs-Econ. Dev. Auth., First Mortgage Health Care Facs., Rev. and Rev. Ref. Bonds (The Lutheran Homes of South Carolina, Inc.), Series 2007, 5.625% 2042 | 6,000 | 5,742 |
| Jobs-Econ. Dev. Auth., Health Facs. Rev. Ref. Bonds (Wesley Commons), Series 2016, 5.00% 20363 | 2,000 | 1,994 |
| Jobs-Econ. Dev. Auth., Health Facs. Rev. Ref. Bonds (Wesley Commons), Series 2016, 5.00% 20413 | 6,000 | 5,765 |
| Jobs-Econ. Dev. Auth., Student Housing Rev. Bonds (Coastal Housing Foundation, LLC Project), Series 2009-A, 6.50% 2042 (preref. 2020) | 6,000 | 6,946 |
| Public Service Auth., Rev. Obligations (Santee Cooper), Series 2014-A, 5.50% 2054 | 2,250 | 2,539 |
| Public Service Auth., Rev. Obligations (Santee Cooper), Series 2015-E, 5.25% 2055 | 1,500 | 1,646 |
| Public Service Auth., Rev. Obligations (Santee Cooper), Tax-Exempt Ref. and Improvement Series 2016-B, 5.00% 2056 | 2,600 | 2,810 |
| 36,492 | ||
| South Dakota 0.08% | ||
| Health and Educational Facs. Auth., Rev. Bonds (Sanford), Series 2014-B, 5.00% 2044 | 800 | 856 |
| Housing Dev. Auth., Homeownership Mortgage Bonds, Series 2014-A, AMT, 4.00% 2044 | 1,830 | 1,908 |
| Housing Dev. Auth., Homeownership Mortgage Rev. Ref. Bonds, Series 2012-D, AMT, 4.00% 2029 | 1,005 | 1,049 |
| 3,813 | ||
| Tennessee 0.54% | ||
| Chattanooga-Hamilton County, Hospital Auth., Hospital Rev. Ref. Bonds (Erlanger Health System), Series 2014, 5.00% 2039 | 4,315 | 4,513 |
| County of Knox, Health, Educational and Housing Fac. Board, Rev. Bonds (University Health System, Inc.), Series 2017, 5.00% 2036 | 500 | 538 |
| Health and Educational Facs. Board of the Metropolitan Government of Nashville and Davidson County, Rev. Bonds (Vanderbilt University Medical Center), Series 2016-A, 5.00% 2035 | 340 | 376 |
| Housing Dev. Agcy., Residential Fin. Program Bonds, Series 2014-2-A, AMT, 4.00% 2045 | 2,985 | 3,151 |
| Housing Dev. Agcy., Residential Fin. Program Bonds, Series 2016-1-A, AMT, 3.50% 2047 | 3,875 | 4,034 |
| Memphis-Shelby County, Airport Auth., Airport Rev. Ref. Bonds, Series 2010-B, AMT, 5.625% 2020 | 1,685 | 1,893 |
| Memphis-Shelby County, Airport Auth., Airport Rev. Ref. Bonds, Series 2010-B, AMT, 5.75% 2024 | 1,000 | 1,101 |
| Memphis-Shelby County, Airport Auth., Airport Rev. Ref. Bonds, Series 2010-B, AMT, 5.75% 2025 | 1,000 | 1,097 |
| Memphis-Shelby County, Airport Auth., Airport Rev. Ref. Bonds, Series 2011-A-1, AMT, 6.00% 2021 | 1,495 | 1,740 |
| Memphis-Shelby County, Airport Auth., Airport Rev. Ref. Bonds, Series 2011-A-1, AMT, 6.00% 2022 | 1,000 | 1,156 |
| Health, Educational and Housing Fac. Board of the County of Shelby, Residential Care Fac. Mortgage Rev. Ref. Bonds (Village at Germantown), Series 2012, 5.375% 2047 | 1,735 | 1,750 |
| Tennessee Energy Acquisition Corp., Gas Project Rev. Bonds, Series 2006-C, 5.00% 2020 | 5,000 | 5,442 |
| 26,791 | ||
| Texas 7.52% | ||
| Arlington Higher Education Fin. Corp., Education Rev. Bonds (Uplift Education), Series 2016-A, 2.75% 2026 | 2,850 | 2,655 |
| Arlington Higher Education Fin. Corp., Education Rev. Bonds (Uplift Education), Series 2016-A, 5.00% 2036 | 315 | 335 |
| Arlington Higher Education Fin. Corp., Education Rev. Bonds (Uplift Education), Series 2016-A, 5.00% 2051 | 1,100 | 1,152 |
| City of Austin, Texas, Airport System Rev. Bonds, Series 2014, AMT, 5.00% 2044 | 2,750 | 2,984 |
| Board of Managers, Joint Guadalupe County - City of Seguin Hospital, Hospital Mortgage Rev. Ref. and Improvement Bonds, 5.00% 2045 | 200 | 202 |
| Brazoria County, Health Facs. Dev. Corp., Hospital Rev. Ref. Bonds (Brazosport Regional Health System), Series 2012, 5.25% 2032 | 750 | 784 |
| Bonds, notes & other debt instruments Texas (continued) | Principal amount (000) | Value (000) |
| Brazos River Harbor Navigation Dist. of Brazoria County, Environmental Facs. Rev. Ref. Bonds (Dow Chemical Co. Project), Series 2002-A-4, AMT, 5.95% 2033 | $24,675 | $26,197 |
| Central Texas Regional Mobility Auth., Rev. Bonds, Series 2011, 6.00% 2041 (preref. 2021) | 3,000 | 3,502 |
| Central Texas Regional Mobility Auth., Rev. Bonds, Series 2011, 6.25% 2046 (preref. 2021) | 2,200 | 2,589 |
| Central Texas Regional Mobility Auth., Rev. Ref. Bonds, Series 2010, 5.75% 2025 (preref. 2020) | 1,000 | 1,125 |
| Central Texas Regional Mobility Auth., Rev. Ref. Bonds, Series 2015-A, 5.00% 2040 | 1,295 | 1,395 |
| Central Texas Regional Mobility Auth., Rev. Ref. Bonds, Series 2015-A, 5.00% 2045 | 1,000 | 1,074 |
| Central Texas Regional Mobility Auth., Rev. Ref. Bonds, Series 2016, 5.00% 2032 | 4,475 | 4,935 |
| HFDC of Central Texas, Inc., Retirement Fac. Rev. Bonds (Village at Gleannloch Farms, Inc. Project), Series 2006-A, 5.50% 2027 (preref. 2017) | 650 | 651 |
| Transportation Commission, Central Texas Turnpike System Rev. Ref. Bonds, Series 2015-C, 5.00% 2030 | 2,000 | 2,206 |
| Transportation Commission, Central Texas Turnpike System Rev. Ref. Bonds, Series 2015-C, 5.00% 2032 | 5,000 | 5,481 |
| Transportation Commission, Central Texas Turnpike System Rev. Ref. Bonds, Series 2015-C, 5.00% 2037 | 5,000 | 5,429 |
| Cities of Dallas and Fort Worth, Dallas/Fort Worth International Airport, Joint Rev. Improvement Bonds, Series 2012-D, AMT, 5.00% 2042 | 9,000 | 9,675 |
| Decatur Hospital Auth., Hospital Rev. Bonds (Wise Regional Health System), Series 2014-A, 5.25% 2044 | 1,500 | 1,562 |
| Decatur Hospital Auth., Hospital Rev. Bonds (Wise Regional Health System), Series 2014-A, 5.00% 2034 | 1,500 | 1,540 |
| Fort Bend County Industrial Dev. Corp., Industrial Dev. Rev. Bonds (NRG Energy, Inc. Project), Series 2012-A, 4.75% 2038 | 4,500 | 4,578 |
| Fort Bend County Industrial Dev. Corp., Industrial Dev. Rev. Bonds (NRG Energy, Inc. Project), Series 2012-B, 4.75% 2042 | 5,000 | 5,061 |
| Gregg County, Health Facs., Dev. Corp., Hospital Rev. Bonds (Good Shepherd Health System Obligated Group), Series 2012-C, 5.00% 2032 | 925 | 935 |
| Gulf Coast Industrial Dev. Auth., Solid Waste Disposal Rev. Bonds (CITGO Petroleum Corp. Project), Series 1995, AMT, 4.875% 2025 | 6,000 | 6,124 |
| Harris County, Cultural Education Facs. Fin. Corp., First Mortgage Rev. Bonds (Brazos Presbyterian Homes, Inc. Project), Series 2013-A, 5.00% 2033 | 275 | 280 |
| Harris County, Cultural Education Facs. Fin. Corp., First Mortgage Rev. Bonds (Brazos Presbyterian Homes, Inc. Project), Series 2013-A, 5.00% 2038 | 510 | 518 |
| Harris County, Cultural Education Facs. Fin. Corp., First Mortgage Rev. Bonds (Brazos Presbyterian Homes, Inc. Project), Series 2013-A, 5.00% 2043 | 1,240 | 1,260 |
| Harris County Cultural Education Facs. Fin. Corp., Rev. Ref. Bonds (Young Men’s Christian Assn. of the Greater Houston Area), Series 2013-A, 5.00% 2033 | 1,400 | 1,490 |
| Harris County Cultural Education Facs. Fin. Corp., Rev. Ref. Bonds (Young Men’s Christian Assn. of the Greater Houston Area), Series 2013-A, 5.00% 2038 | 3,500 | 3,690 |
| Harris County, Health Facs. Dev. Corp., Hospital Rev. Ref. Bonds (Memorial Hermann Healthcare System), Series 2008-B, 7.25% 2035 (preref. 2018) | 2,250 | 2,497 |
| Harris County, Industrial Dev. Corp., Solid Waste Disposal Rev. Bonds (Deer Park Refining Limited Partnership Project), Series 2006, 5.00% 2023 | 1,000 | 1,080 |
| Harris County, Sports Auth., Rev. Ref. Bonds, Series 2014-A, 0% 2042 | 1,000 | 317 |
| Harris County, Sports Auth., Rev. Ref. Bonds, Series 2014-A, 0% 2050 | 1,500 | 311 |
| Harris County, Sports Auth., Rev. Ref. Bonds, Series 2014-A, 5.00% 2053 | 1,000 | 1,073 |
| Harris County, Cultural Education Facs. Fin. Corp., First Mortgage Rev. Bonds (Brazos Presbyterian Homes, Inc. Project), 5.00% 2037 | 2,530 | 2,641 |
| Harris County, Cultural Education Facs. Fin. Corp., First Mortgage Rev. Bonds (Brazos Presbyterian Homes, Inc. Project), 5.00% 2048 | 8,455 | 8,724 |
| Harris County, Cultural Education Facs. Fin. Corp., First Mortgage Rev. Bonds (Brazos Presbyterian Homes, Inc. Project), Series 2013-B, 7.00% 2048 (preref. 2023) | 5,350 | 6,739 |
| Harrison County, Health Facs., Dev. Corp., Hospital Rev. Bonds (Good Shepherd Health System), Series 2010, 4.00% 2017 | 155 | 155 |
| Harrison County, Health Facs., Dev. Corp., Hospital Rev. Bonds (Good Shepherd Health System), Series 2010, 5.25% 2028 | 2,625 | 2,675 |
| Dept. of Housing and Community Affairs, Residential Mortgage Rev. Bonds, Series 2009-A, 5.375% 2039 | 150 | 155 |
| Bonds, notes & other debt instruments Texas (continued) | Principal amount (000) | Value (000) |
| City of Houston, Airport System Rev. Ref. Bonds, Series 2012-A, AMT, 5.00% 2032 | $1,000 | $1,075 |
| City of Houston, Airport System Special Facs. Rev. Bonds (Continental Airlines, Inc. Terminal Improvement Projects), Series 2011, AMT, 6.50% 2030 | 9,300 | 10,224 |
| City of Houston, Airport System Special Facs. Rev. Bonds (Continental Airlines, Inc. Terminal Improvement Projects), Series 2011, AMT, 6.625% 2038 | 3,000 | 3,313 |
| City of Houston, Airport System Special Facs. Rev. Ref. Bonds (United Airlines, Inc. Airport Improvement Projects), Series 2015-B-1, AMT, 5.00% 2030 | 3,000 | 3,150 |
| City of Houston, Airport System Special Facs. Rev. Ref. Bonds (United Airlines, Inc. Airport Improvement Projects), Series 2015-C, AMT, 5.00% 2020 | 7,235 | 7,552 |
| City of Houston, Airport System Special Facs. Rev. Ref. Bonds (United Airlines, Inc. Terminal E Project), Series 2014, AMT, 4.75% 2024 | 5,500 | 5,834 |
| City of Houston, Airport System Special Facs. Rev. Ref. Bonds (United Airlines, Inc. Terminal E Project), Series 2014, AMT, 5.00% 2029 | 6,745 | 7,095 |
| City of Kerrville, Health Facs. Dev. Corp., Hospital Rev. Bonds (Peterson Regional Medical Center Project), 5.00% 2024 | 1,000 | 1,140 |
| City of Kerrville, Health Facs. Dev. Corp., Hospital Rev. Bonds (Peterson Regional Medical Center Project), 5.00% 2025 | 1,000 | 1,145 |
| City of Kerrville, Health Facs. Dev. Corp., Hospital Rev. Bonds (Peterson Regional Medical Center Project), 5.00% 2030 | 3,450 | 3,741 |
| City of Kerrville, Health Facs. Dev. Corp., Hospital Rev. Bonds (Peterson Regional Medical Center Project), 5.00% 2035 | 700 | 745 |
| La Vernia Higher Education Fin. Corp., Education Rev. Bonds (KIPP, Inc.), Series 2009-A, 6.375% 2044 (preref. 2019) | 1,000 | 1,127 |
| Love Field Airport Modernization Corp., Special Facs. Rev. Bonds (Southwest Airlines Co. - Love Field Modernization Program Project), Series 2010, 5.25% 2040 | 2,750 | 2,978 |
| Lower Colorado River Auth., Rev. Ref. Bonds, Series 2015-D, 5.00% 2031 | 2,000 | 2,257 |
| Matagorda County, Navigation Dist. Number One, Rev. Ref. Bonds (Houston Lighting & Power Co. Project), Series 1997, AMT, AMBAC insured, 5.125% 2028 | 3,280 | 3,832 |
| Mission Econ. Dev. Corp., Rev. Bonds (Natgasoline Project), Series 2016-A, AMT, 5.75% 20313 | 3,500 | 3,622 |
| Mission Econ. Dev. Corp., Rev. Bonds (Natgasoline Project), Series 2016-B, AMT, 5.75% 20313 | 14,165 | 14,659 |
| Mission Econ. Dev. Corp., Solid Waste Disposal Rev. Bonds (Waste Management, Inc. Project), Series 2008, AMT, 2.50% 2020 (put 2013) | 2,500 | 2,538 |
| Municipal Gas Acquisition and Supply Corp. III, Gas Supply Rev. Bonds, Series 2012, 5.00% 2026 | 5,000 | 5,461 |
| Municipal Gas Acquisition and Supply Corp. III, Gas Supply Rev. Bonds, Series 2012, 5.00% 2030 | 3,500 | 3,753 |
| Municipal Gas Acquisition and Supply Corp. III, Gas Supply Rev. Bonds, Series 2012, 5.00% 2031 | 1,500 | 1,601 |
| New Hope Cultural Education Facs. Fin. Corp., Retirement Fac. Rev. Bonds (Wesleyan Homes Inc Project), Series 2014, 5.50% 2043 | 3,700 | 3,764 |
| New Hope Cultural Education Facs. Fin. Corp., Retirement Fac. Rev. Bonds (Wesleyan Homes Inc Project), Series 2014, 5.50% 2049 | 600 | 607 |
| New Hope Cultural Education Facs. Fin. Corp., Retirement Fac. Rev. Bonds (Wesleyan Homes Inc. Project), Series 2014, 5.50% 2035 | 100 | 102 |
| New Hope Cultural Education Facs. Fin. Corp., Student Housing Rev. Bonds (CHF - Collegiate Housing Stephenville III, L.L.C. - Tarleton State University Project), Series 2015-A, 5.00% 2030 | 1,800 | 1,912 |
| New Hope Cultural Education Facs. Fin. Corp., Student Housing Rev. Bonds (CHF - Collegiate Housing Stephenville III, L.L.C. - Tarleton State University Project), Series 2015-A, 5.00% 2035 | 1,800 | 1,879 |
| New Hope Cultural Education Facs. Fin. Corp., Student Housing Rev. Bonds (CHF - Collegiate Housing Stephenville III, L.L.C. - Tarleton State University Project), Series 2015-A, 5.00% 2047 | 8,315 | 8,571 |
| New Hope Cultural Education Facs. Fin. Corp., Education Rev. Bonds (Jubilee Academic Center Inc.), Series 2016-A, 5.00% 20363 | 8,710 | 8,349 |
| New Hope Cultural Education Facs. Fin. Corp., Education Rev. Bonds (Jubilee Academic Center Inc.), Series 2016-A, 5.00% 20463 | 3,960 | 3,670 |
| New Hope Cultural Education Facs. Fin. Corp., Retirement Fac. Rev. Bonds (MRC Crestview Project), Series 2016, 5.00% 2031 | 850 | 851 |
| New Hope Cultural Education Facs. Fin. Corp., Retirement Fac. Rev. Bonds (MRC Crestview Project), Series 2016, 5.00% 2046 | 1,350 | 1,305 |
| Bonds, notes & other debt instruments Texas (continued) | Principal amount (000) | Value (000) |
| New Hope Cultural Education Facs. Fin. Corp., Retirement Fac. Rev. Bonds (MRC Senior Living - The Langford Project), Series 2016-A, 5.375% 2036 | $500 | $466 |
| New Hope Cultural Education Facs. Fin. Corp., Retirement Fac. Rev. Bonds (MRC Senior Living - The Langford Project), Series 2016-A, 5.50% 2046 | 800 | 735 |
| New Hope Cultural Education Facs. Fin. Corp., Retirement Fac. Rev. Bonds (MRC Senior Living - The Langford Project), Series 2016-A, 5.50% 2052 | 1,150 | 1,035 |
| New Hope Cultural Education Facs. Fin. Corp., Retirement Fac. Rev. Bonds (MRC Senior Living - The Langford Project), Series 2016-B-2, 3.00% 2021 | 475 | 461 |
| New Hope Cultural Education Facs. Fin. Corp., Retirement Fac. Rev. Bonds (Westminster Project), Series 2016, 5.00% 2025 | 350 | 388 |
| New Hope Cultural Education Facs. Fin. Corp., Retirement Fac. Rev. Bonds (Westminster Project), Series 2016, 5.00% 2026 | 330 | 363 |
| New Hope Cultural Education Facs. Fin. Corp., Retirement Fac. Rev. Bonds (Westminster Project), Series 2016, 5.00% 2031 | 900 | 954 |
| New Hope Cultural Education Facs. Fin. Corp., Retirement Fac. Rev. Bonds (Westminster Project), Series 2016, 5.00% 2040 | 4,375 | 4,487 |
| New Hope Cultural Education Facs. Fin. Corp., Student Housing Rev. Bonds (CHF - Collegiate Housing Stephenville III, LLC - Tarleton State University Project), Series 2014-A, 5.00% 2046 | 1,500 | 1,543 |
| North Harris County, Regional Water Auth., Rev. and Rev. Ref. Bonds, Series 2016, 5.00% 2033 | 500 | 572 |
| North Harris County, Regional Water Auth., Rev. and Rev. Ref. Bonds, Series 2016, 5.00% 2034 | 1,250 | 1,424 |
| North Texas Tollway Auth., System Rev. Ref. Bonds, Capital Appreciation Bonds, Series 2008-D, Assured Guaranty insured, 0% 2032 | 8,000 | 4,447 |
| North Texas Tollway Auth., System Rev. Ref. Bonds, Series 2008-F, 5.75% 2038 (preref. 2018) | 2,000 | 2,087 |
| North Texas Tollway Auth., System Rev. Ref. Bonds, Series 2009-A, 6.00% 2028 | 560 | 608 |
| North Texas Tollway Auth., System Rev. Ref. Bonds, Series 2009-A, 6.00% 2028 (preref. 2019) | 1,220 | 1,332 |
| North Texas Tollway Auth., System Rev. Ref. Bonds, Series 2010, 6.00% 2034 | 1,500 | 1,723 |
| North Texas Tollway Auth., System Rev. Ref. Bonds, Series 2015-A, 5.00% 2032 | 4,500 | 5,042 |
| North Texas Tollway Auth., System Rev. Ref. Bonds, Series 2015-A, 5.00% 2034 | 2,000 | 2,223 |
| North Texas Tollway Auth., System Rev. Ref. Bonds, Series 2015-A, 5.00% 2035 | 1,000 | 1,108 |
| North Texas Tollway Auth., System Rev. Ref. Bonds, Series 2015-A, 5.00% 2038 | 1,000 | 1,101 |
| Private Activity Bond Surface Transportation Corp., Rev. Bonds (Blueridge Transportation Group, LLC SH 288 Toll Lanes Project), Series 2016, AMT, 5.00% 2045 | 1,000 | 1,053 |
| Private Activity Bond Surface Transportation Corp., Rev. Bonds (Blueridge Transportation Group, LLC SH 288 Toll Lanes Project), Series 2016, AMT, 5.00% 2050 | 1,850 | 1,942 |
| Private Activity Bond Surface Transportation Corp., Rev. Bonds (Blueridge Transportation Group, LLC SH 288 Toll Lanes Project), Series 2016, AMT, 5.00% 2055 | 3,060 | 3,186 |
| Public Fin. Auth., Texas Southern University, Rev. Fncg. System Bonds, Series 2016, BAM insured, 4.00% 2031 | 1,165 | 1,180 |
| Red River Education Fin. Corp., Higher Education Rev. Bonds (Saint Edward’s University Project), Series 2016, 4.00% 2036 | 500 | 479 |
| Red River Education Fin. Corp., Higher Education Rev. Bonds (Saint Edward’s University Project), Series 2016, 5.00% 2028 | 1,000 | 1,121 |
| Red River Health Facs. Dev. Corp., Retirement Fac. Rev. Bonds (MRC The Crossing Project), Series 2014-A, 7.75% 2044 | 3,315 | 3,740 |
| Red River Health Facs. Dev. Corp., Retirement Fac. Rev. Bonds (MRC The Crossing Project), Series 2014-A, 8.00% 2049 | 3,355 | 3,830 |
| Regional Mobility Auth., Series 2016-A, 5.00% 2036 | 2,040 | 2,195 |
| SA Energy Acquisition Public Fac. Corp., Gas Supply Rev. Bonds, Series 2007, 5.50% 2019 | 3,000 | 3,279 |
| SA Energy Acquisition Public Fac. Corp., Gas Supply Rev. Bonds, Series 2007, 5.50% 2020 | 1,000 | 1,119 |
| SA Energy Acquisition Public Fac. Corp., Gas Supply Rev. Bonds, Series 2007, 5.50% 2027 | 1,360 | 1,624 |
| Sam Rayburn Municipal Power Agcy., Power Supply System Rev. Ref. Bonds, Series 2012, 5.00% 2021 | 2,875 | 3,227 |
| City of San Antonio, Airport System Rev. Ref. Bonds, AMT, 5.00% 2045 | 1,500 | 1,620 |
| Sanger Texas Industrial Dev. Corp., Industrial Dev. Rev. Ref. Bonds (Texas Pellets Project), Series 2012-B, AMT, 8.00% 2038 | 3,110 | 1,396 |
| Board of Managers, Joint Guadalupe County - City of Seguin Hospital, Hospital Mortgage Rev. Ref. and Improvement Bonds, 5.00% 2023 | 1,000 | 1,077 |
| Bonds, notes & other debt instruments Texas (continued) | Principal amount (000) | Value (000) |
| Tarrant County Cultural Education Facs. Fin. Corp., Hospital Rev. Ref. Bonds (Scott & White Healthcare Project), Series 2008-A, 5.00% 2019 (preref. 2018) | $710 | $753 |
| Tarrant County Cultural Education Facs. Fin. Corp., Hospital Rev. Ref. Bonds (Scott & White Healthcare Project), Series 2008-A, 5.00% 2019 (preref. 2018) | 660 | 700 |
| Tarrant County Cultural Education Facs. Fin. Corp., Retirement Fac. Rev. Bonds (Barton Creek Senior Living Center, Inc. - Querencia Project), 5.00% 2024 | 1,610 | 1,822 |
| Tarrant County Cultural Education Facs. Fin. Corp., Retirement Fac. Rev. Bonds (Barton Creek Senior Living Center, Inc. - Querencia Project), 5.00% 2030 | 1,650 | 1,777 |
| Tarrant County Cultural Education Facs. Fin. Corp., Retirement Fac. Rev. Bonds (Barton Creek Senior Living Center, Inc. - Querencia Project), 5.00% 2040 | 1,350 | 1,416 |
| Tarrant County Cultural Education Facs. Fin. Corp., Retirement Fac. Rev. Ref. Bonds (Buckingham Senior Living Project), Series 2015-A, 5.50% 2045 | 1,475 | 1,522 |
| Tarrant County Cultural Education Facs. Fin. Corp., Retirement Fac. Rev. Ref. Bonds (Buckingham Senior Living Project), Series 2015-B-2, 3.875% 2020 | 1,750 | 1,750 |
| Tarrant County Cultural Education Facs. Fin. Corp., Retirement Fac. Rev. Ref. Bonds (Buckner Retirement Services, Inc. Project), Series 2007, 5.25% 2022 | 1,045 | 1,070 |
| Tarrant County Cultural Education Facs. Fin. Corp., Retirement Fac. Rev. Ref. Bonds (Buckner Retirement Services, Inc. Project), Series 2007, 5.25% 2022 (preref. 2017) | 810 | 838 |
| Tarrant County Cultural Education Facs. Fin. Corp., Retirement Fac. Rev. Ref. Bonds (Buckner Retirement Services, Inc. Project), Series 2007, 5.25% 2027 | 560 | 571 |
| Tarrant County Cultural Education Facs. Fin. Corp., Retirement Fac. Rev. Ref. Bonds (Buckner Retirement Services, Inc. Project), Series 2007, 5.25% 2027 (preref. 2017) | 440 | 455 |
| Tarrant County Cultural Education Facs. Fin. Corp., Rev. Ref. Bonds (Trinity Terrace Project), Series 2015-A-1, 5.00% 2025 | 705 | 768 |
| Tarrant County Cultural Education Facs. Fin. Corp., Rev. Ref. Bonds (Trinity Terrace Project), Series 2015-A-1, 5.00% 2045 | 2,190 | 2,207 |
| Tarrant County, Cultural Education Facs. Fin. Corp., Retirement Fac. Rev. Bonds (Air Force Villages Obligated Group), 5.00% 2037 | 6,000 | 5,932 |
| Tarrant County, Cultural Education Facs. Fin. Corp., Retirement Fac. Rev. Bonds (Air Force Villages Obligated Group), 5.00% 2045 | 12,125 | 11,784 |
| New Hope Cultural Education Facs. Fin. Corp., Student Housing Rev. Bonds (CHF - Collegiate Housing Corpus Christi II, L.L.C. - Texas A&M University-Corpus Christi Project), Series 2016-A, 5.00% 2031 | 335 | 357 |
| New Hope Cultural Education Facs. Fin. Corp., Student Housing Rev. Bonds (CHF - Collegiate Housing Corpus Christi II, L.L.C. - Texas A&M University-Corpus Christi Project), Series 2016-A, 5.00% 2048 | 1,995 | 2,065 |
| New Hope Cultural Education Facs. Fin. Corp., Student Housing Rev. Bonds (CHF - Collegiate Housing Corpus Christi II, LLC - Texas A&M University-Corpus Christi Project), Series 2016-A, 5.00% 2036 | 1,475 | 1,544 |
| Travis County, Health Facs. Dev. Corp., Rev. Bonds (Westminster Manor Project), Series 2010, 7.00% 2030 | 590 | 668 |
| Travis County, Health Facs. Dev. Corp., Rev. Bonds (Westminster Manor Project), Series 2010, 7.00% 2030 (preref. 2020) | 2,410 | 2,848 |
| Travis County, Health Facs. Dev. Corp., Rev. Bonds (Westminster Manor Project), Series 2010, 7.125% 2040 (preref. 2020) | 3,750 | 4,449 |
| Turnpike Auth, Central Texas Turnpike System, Rev. Bonds, Series 2002-A, AMBAC insured, 0% 2028 | 25,800 | 17,159 |
| Tyler Health Facs. Dev. Corp., Hospital Rev. Ref. and Improvement Bonds (East Texas Medical Center Regional Healthcare System Project), Series 2007-A, 5.375% 2037 | 1,615 | 1,613 |
| Tyler Health Facs. Dev. Corp., Hospital Rev. Ref. and Improvement Bonds, (East Texas Medical Center Regional Healthcare System Project), Series 2007-A, 5.25% 2027 | 410 | 411 |
| 372,274 |
| Bonds, notes & other debt instruments Vermont 0.07% | Principal amount (000) | Value (000) |
| Educational and Health Buildings Fncg. Agcy., Rev. Bonds (The University of Vermont Medical Center Project), Series 2016-A, 5.00% 2035 | $1,000 | $1,091 |
| Educational and Health Buildings Fncg. Agcy., Rev. Green Bonds (The University of Vermont Medical Center Project), Series 2016-B, 5.00% 2046 | 1,000 | 1,075 |
| Student Assistance Corp., Education Loan Rev. Notes, Series 2012-B, AMT, 2.499% 20222 | 1,254 | 1,269 |
| 3,435 | ||
| Virgin Islands 0.08% | ||
| Public Fin. Auth., Rev. Bonds (Matching Fund Loan Note - Diageo Project), Series 2009-A, 6.625% 2029 | 2,500 | 1,945 |
| Public Fin. Auth., Rev. Ref. Bonds (Matching Fund Loan Notes), Series 2012-A, 5.00% 20323 | 3,000 | 2,125 |
| 4,070 | ||
| Virginia 0.86% | ||
| Industrial Dev. Auth. of the City of Alexandria, Demand Rev. Ref. Bonds (Goodwin House), Series 2015, 5.00% 2045 | 3,000 | 3,191 |
| Industrial Dev. Auth. of Botetourt County, Residential Care Fac. Rev. Ref. Bonds (Glebe, Inc.), Series 2014-A, 6.00% 2044 | 2,000 | 2,076 |
| City of Chesapeake, Chesapeake Transportation System Toll Road Rev. Ref. Bonds (Capital Appreciation Bonds), Series 2012-B, 0% 20401 | 1,500 | 1,146 |
| City of Chesapeake, Chesapeake Transportation System Toll Road Rev. Ref. Bonds, Series 2012-A, 5.00% 2047 | 2,500 | 2,618 |
| College Building Auth., Educational Facs. Rev. Ref. Bonds (Marymount University Project), Series 2015-B, 5.25% 20353 | 400 | 414 |
| County of Prince William, Industrial Dev. Auth., Residential Care Fac. Rev. and Rev. Ref. Bonds (Westminster at Lake Ridge), Series 2016, 5.00% 2031 | 635 | 653 |
| County of Prince William, Industrial Dev. Auth., Residential Care Fac. Rev. and Rev. Ref. Bonds (Westminster at Lake Ridge), Series 2016, 5.00% 2046 | 880 | 882 |
| Celebrate Virginia South Community Dev. Auth., City of Fredericksburg, Special Assessment Rev. Bonds (Celebrate Virginia South Project), Series 2006, 6.25% 20374 | 4,099 | 2,049 |
| Small Business Fncg. Auth., Rev. Ref. Bonds (Hampton University), Series 2014, 5.25% 2029 | 2,250 | 2,597 |
| Econ. Dev. Auth. of Hanover County, Residential Care Fac. Rev. Ref. Bonds (Covenant Woods), Series 2012-A, 5.00% 2042 | 1,000 | 1,003 |
| Industrial Dev. Auth. of the City of Harrisonburg, Residential Care Fac. Rev. Ref. Bonds (Sunnyside Presbyterian Home), Series 2013-B, 6.50% 2039 | 1,000 | 1,119 |
| Econ. Dev. Auth. of Henrico County, Residential Care Fac. Rev. Ref. Bonds (United Methodist Homes), 5.00% 2020 | 365 | 399 |
| Heritage Hunt Commercial Community Dev. Auth. (Prince William County), Special Assessment Bonds, Series 1999-B, 7.00% 2029 | 459 | 459 |
| Mosaic Dist. Community Dev. Auth. (Fairfax County), Rev. Bonds, Series 2011-A, 6.875% 2036 | 1,210 | 1,336 |
| New Port Community Dev. Auth., Special Assessment Bonds, Series 2006, 5.50% 20264 | 867 | 433 |
| Newport News Industrial Dev. Auth., Health Systems Rev. Ref. Bonds (Custodial Receipts), 5.33% 20453 | 4,500 | 4,537 |
| Peninsula Town Center Community Dev. Auth., Special Obligation Bonds, Series 2007, 6.25% 2024 | 3,900 | 3,931 |
| Peninsula Town Center Community Dev. Auth., Special Obligation Bonds, Series 2007, 6.35% 2028 | 955 | 961 |
| Peninsula Town Center Community Dev. Auth., Special Obligation Bonds, Series 2007, 6.45% 2037 | 3,408 | 3,429 |
| Small Business Fncg. Auth., Rev. Bonds (Elizabeth River Crossings Opco, LLC Project), Series 2012, AMT, 5.25% 2032 | 6,940 | 7,449 |
| Stafford County, Econ. Dev. Auth., Hospital Facs. Rev. Ref. Bonds (Mary Washington Healthcare Obligated Group), Series 2016, 5.00% 2036 | 1,000 | 1,087 |
| Watkins Centre Community Dev. Auth., Rev. Bonds, Series 2007, 5.40% 2020 | 876 | 878 |
| 42,647 | ||
| Washington 1.92% | ||
| Energy Northwest, Electric Rev. Ref. Bonds (Project No. 3), Series 2016-A, 5.00% 2027 | 1,000 | 1,204 |
| Health Care Facs. Auth., Rev. Bonds (Catholic Health Initiatives), Series 2013-B-1, 1.66% 2035 (put 2021)2 | 8,375 | 8,336 |
| Health Care Facs. Auth., Rev. Bonds (Kadlec Regional Medical Center), Series 2012, 5.00% 2042 (preref. 2021) | 1,250 | 1,447 |
| Bonds, notes & other debt instruments Washington (continued) | Principal amount (000) | Value (000) |
| Health Care Facs. Auth., Rev. Bonds (Yakima Valley Memorial Hospital Association), Series 2016, 5.00% 2036 | $2,620 | $2,700 |
| Health Care Facs. Auth., Rev. Bonds (Yakima Valley Memorial Hospital Association), Series 2016, 5.00% 2041 | 1,920 | 1,968 |
| Health Care Facs. Auth., Rev. Ref. Bonds (Virginia Mason Medical Center), Series 2007-A, 6.125% 2037 | 9,500 | 9,692 |
| Higher Education Facs. Auth., Rev. and Rev. Ref. Bonds (Whitworth University Project), Series 2016-A, 5.00% 2033 | 2,705 | 2,931 |
| Higher Education Facs. Auth., Rev. and Rev. Ref. Bonds (Whitworth University Project), Series 2016-A, 5.00% 2040 | 1,500 | 1,603 |
| Housing Fin. Commission, Nonprofit Housing Rev. Ref. Bonds (Herons Key Senior Living Project), Series 2015-A, 6.50% 20303 | 900 | 898 |
| Housing Fin. Commission, Nonprofit Housing Rev. Ref. Bonds (Herons Key Senior Living Project), Series 2015-A, 6.75% 20353 | 1,630 | 1,627 |
| Housing Fin. Commission, Nonprofit Housing Rev. Ref. Bonds (Herons Key Senior Living Project), Series 2015-A, 7.00% 20453 | 4,185 | 4,182 |
| Housing Fin. Commission, Nonprofit Housing Rev. Ref. Bonds (Herons Key Senior Living Project), Series 2015-A, 7.00% 20503 | 2,900 | 2,878 |
| Housing Fin. Commission, Nonprofit Housing Rev. Ref. Bonds (Herons Key Senior Living Project), Series 2015-B-2, 4.875% 20223 | 3,000 | 2,992 |
| Housing Fin. Commission, Nonprofit Housing Rev. Ref. Bonds (Herons Key Senior Living Project), Series 2015-B-3, 4.375% 20213 | 700 | 700 |
| Housing Fin. Commission, Nonprofit Housing Rev. Ref. Bonds (Rockwood Retirement Project), Series 2014-A, 7.375% 20443 | 7,000 | 7,929 |
| Housing Fin. Commission, Nonprofit Housing Rev. Ref. Bonds (Rockwood Retirement Project), Series 2014-A, 7.50% 20493 | 9,090 | 10,300 |
| Housing Fin. Commission, Nonprofit Housing, Rev. and Rev. Ref. Bonds (Bayview Manor Senior Project), Series 2016-A, 5.00% 20363 | 750 | 764 |
| Housing Fin. Commission, Nonprofit Housing, Rev. and Rev. Ref. Bonds (Bayview Manor Senior Project), Series 2016-A, 5.00% 20513 | 2,150 | 2,076 |
| Housing Fin. Commission, Single Family Program Bonds, Series 2014-2A-R, AMT, 3.50% 2044 | 1,870 | 1,936 |
| Port of Seattle, Special Fac. Rev. Ref. Bonds (Seatac Fuel Facs. LLC), AMT, 5.00% 2030 | 2,000 | 2,182 |
| Port of Seattle, Special Fac. Rev. Ref. Bonds (Seatac Fuel Facs. LLC), AMT, 5.00% 2031 | 2,000 | 2,175 |
| Industrial Dev. Corp. of the Port of Seattle, Special Facs. Rev. Ref. Bonds (Delta Air Lines, Inc. Project), Series 2012, AMT, 5.00% 2030 | 6,375 | 6,612 |
| Port of Seattle, Rev. Ref. Bonds, Series 2015-C, AMT, 5.00% 2034 | 1,000 | 1,104 |
| Port of Seattle, Rev. Ref. Bonds, Series 2015-C, AMT, 5.00% 2035 | 1,500 | 1,650 |
| Skagit County, Public Hospital Dist. No. 1, Hospital Improvement Rev. Ref. Bonds (Skagit Regional Health), Series 2013-A, 5.00% 2037 | 4,000 | 4,123 |
| Skagit County, Public Hospital Dist. No. 1, Hospital Rev. Improvement and Rev. Ref. Bonds (Skagit Regional Health), Series 2016, 4.00% 2025 | 500 | 516 |
| Skagit County, Public Hospital Dist. No. 1, Hospital Rev. Improvement and Rev. Ref. Bonds (Skagit Regional Health), Series 2016, 5.00% 2027 | 1,000 | 1,097 |
| Skagit County, Public Hospital Dist. No. 1, Hospital Rev. Improvement and Rev. Ref. Bonds (Skagit Regional Health), Series 2016, 5.00% 2028 | 1,000 | 1,090 |
| Skagit County, Public Hospital Dist. No. 1, Hospital Rev. Improvement and Rev. Ref. Bonds (Skagit Regional Health), Series 2016, 5.00% 2029 | 1,000 | 1,083 |
| Skagit County, Public Hospital Dist. No. 1, Hospital Rev. Improvement and Rev. Ref. Bonds (Skagit Regional Health), Series 2016, 5.00% 2030 | 1,500 | 1,615 |
| Skagit County, Public Hospital Dist. No. 1, Hospital Rev. Improvement and Rev. Ref. Bonds (Skagit Regional Health), Series 2016, 5.00% 2031 | 1,500 | 1,605 |
| Skagit County, Public Hospital Dist. No. 1, Hospital Rev. Improvement and Rev. Ref. Bonds (Skagit Regional Health), Series 2016, 5.00% 2032 | 1,500 | 1,593 |
| Tobacco Settlement Auth., Tobacco Settlement Rev. Ref. Bonds, Series 2013, 5.00% 2027 | 2,550 | 2,578 |
| 95,186 |
| Bonds, notes & other debt instruments West Virginia 0.27% | Principal amount (000) | Value (000) |
| Econ. Dev. Auth., Solid Waste Disposal Facs. Rev. Bonds (Appalachian Power Co. - Amos Project), Series 2011-A, AMT, 1.70% 2041 (put 2020) | $1,600 | $1,557 |
| County Commission of Harrison County, Solid Waste Disposal Rev. Ref. Bonds (Allegheny Energy Supply Co., LLC Harrison Station Project), Series 2007-D, AMT, 5.50% 2037 | 5,000 | 5,046 |
| County Commission of Pleasants County, Pollution Control Rev. Ref. Bonds (Allegheny Energy Supply Co., LLC Pleasants Station Project), Series 2007-F, 5.25% 2037 | 3,760 | 3,613 |
| West Virginia University, Board of Governors Improvement Rev. Bonds (West Virginia University Projects), Series 2014-C, 1.19% 2041 (put 2019)2 | 3,000 | 2,995 |
| 13,211 | ||
| Wisconsin 2.13% | ||
| General Fund Annual Appropriation Rev. Ref. Bonds, Series 2009-A, 6.00% 2036 (preref. 2019) | 1,500 | 1,660 |
| Health and Educational Facs. Auth., Rev. Bonds (Agnesian HealthCare, Inc.), Series 2013-B, 5.00% 2036 | 2,000 | 2,167 |
| Health and Educational Facs. Auth., Rev. Bonds (Ascension Senior Credit Group), Series 2016-A, 4.00% 2039 | 500 | 500 |
| Health and Educational Facs. Auth., Rev. Bonds (Ascension Senior Credit Group), Series 2016-A, 5.00% 2039 | 1,000 | 1,113 |
| Health and Educational Facs. Auth., Rev. Bonds (Marshfield Clinic Health System, Inc.), Series 2016-B, 5.00% 2034 | 1,800 | 1,933 |
| Health and Educational Facs. Auth., Rev. Bonds (Marshfield Clinic Health System, Inc.), Series 2016-B, 5.00% 2042 | 6,190 | 6,559 |
| Health and Educational Facs. Auth., Rev. Bonds (Marshfield Clinic Health System, Inc.), Series 2016-B, 5.00% 2046 | 3,105 | 3,283 |
| Health and Educational Facs. Auth., Rev. Bonds (Saint John’s Communities, Inc.), Series 2015-B, 5.00% 2037 | 185 | 192 |
| Health and Educational Facs. Auth., Rev. Bonds (Saint John’s Communities, Inc.), Series 2015-B, 5.00% 2045 | 1,000 | 1,034 |
| Health and Educational Facs. Auth., Rev. Bonds (Thedacare, Inc.), Series 2015, 5.00% 2044 | 1,000 | 1,082 |
| Health and Educational Facs. Auth., Rev. Ref. Bonds (St. John’s Communities, Inc.), Series 2009-A, 7.25% 2029 (preref. 2019) | 1,000 | 1,151 |
| Health and Educational Facs. Auth., Rev. Ref. Bonds (St. John’s Communities, Inc.), Series 2009-A, 7.625% 2039 (preref. 2019) | 1,000 | 1,161 |
| Health and Educational Facs. Auth., Rev. Ref. Bonds (The Monroe Clinic, Inc.), Series 2016, 4.00% 2033 | 550 | 561 |
| Housing and Econ. Dev. Auth., Home Ownership Rev. Bonds, Series 2016-A, AMT, 3.50% 2046 | 18,330 | 18,991 |
| Milwaukee County, Airport Rev. Ref. Bonds, Series 2016-A, AMT, 5.00% 2028 | 1,780 | 2,031 |
| Public Fin. Auth., Exempt Facs. Rev. Ref. Bonds (Celanese Project), Series 2016-A, AMT, 5.00% 2024 | 1,605 | 1,723 |
| Public Fin. Auth., Tax Increment Fin. Grant Rev. Bonds (Statler Hilton & Dallas Central Library), Series 2016, 0% 2027 | 15,115 | 9,381 |
| Public Fin. Auth., Tax Increment Fin. Grant Rev. Bonds (Statler Hilton & Dallas Central Library), Series 2016, 0% 2028 | 8,975 | 5,275 |
| Public Fin. Auth., Tax Increment Fin. Grant Rev. Bonds (Statler Hilton & Dallas Central Library), Series 2016, 0% 2029 | 12,855 | 7,157 |
| Public Fin. Auth., Airport Facs. Rev. Ref. Bonds (Transportation Infrastructure Properties, LLC Obligated Group), AMT, 5.00% 2022 | 85 | 91 |
| Public Fin. Auth., Airport Facs. Rev. Ref. Bonds (Transportation Infrastructure Properties, LLC Obligated Group), Series 2012-B, AMT, 5.00% 2042 | 450 | 458 |
| Public Fin. Auth., Rev. Bonds (Roseman University of Health Sciences Project), Series 2012, 5.50% 2032 | 500 | 506 |
| Public Fin. Auth., Rev. Bonds (Roseman University of Health Sciences Project), Series 2012, 5.75% 2042 | 5,000 | 5,063 |
| Public Fin. Auth., Rev. Bonds (Roseman University of Health Sciences Project), Series 2015, 5.75% 2035 | 3,000 | 3,078 |
| Public Fin. Auth., Rev. Bonds (Roseman University of Health Sciences Project), Series 2015, 5.875% 2045 | 4,150 | 4,247 |
| Public Fin. Auth., Senior Living Rev. Bonds (Rose Villa Project), Series 2014-A, 5.50% 2034 | 1,000 | 1,041 |
| Public Fin. Auth., Senior Living Rev. Bonds (Rose Villa Project), Series 2014-A, 5.75% 2044 | 1,800 | 1,888 |
| Public Fin. Auth., Solid Waste Disposal Rev. Ref. Bonds (Waste Management, Inc. Project), Series 2016-A-4, AMT, 2.00% 2033 (put 2021) | 1,500 | 1,482 |
| Public Fin. Auth., Student Housing Rev. Bonds (CHF - Cullowhee, LLC - Western Carolina University Project), 5.00% 2035 | 1,000 | 1,046 |
| Public Fin. Auth., Student Housing Rev. Bonds (CHF - Cullowhee, LLC - Western Carolina University Project), 5.25% 2047 | 2,000 | 2,100 |
| Bonds, notes & other debt instruments Wisconsin (continued) | Principal amount (000) | Value (000) |
| Public Fin. Auth., Student Housing Rev. Bonds (CHF - Cullowhee, LLC - Western Carolina University Project), Series 2015-A, 5.00% 2030 | $2,140 | $2,280 |
| Public Fin. Auth., Exempt Facs. Ref. Rev. Bonds (National Gypsum Company), Series 2014, AMT, 5.25% 2030 | 3,000 | 3,162 |
| Public Fin. Auth., Exempt Facs. Ref. Rev. Bonds (National Gypsum Company), Series 2016, AMT, 4.00% 2035 | 9,000 | 8,433 |
| Public Fin. Auth., Hospital Rev. Ref. Bonds (Renown Regional Medical Center Project), Series 2016-A, 5.00% 2028 | 3,000 | 3,434 |
| 105,263 | ||
| Total bonds, notes & other debt instruments (cost: $4,636,125,000) | 4,689,273 | |
| Short-term securities 4.67% | ||
| State of Arizona, City of Phoenix, Industrial Dev. Auth., Health Care Facs. Rev. Bonds (Mayo Clinic), Series 2014-A, 0.47% 20522 | 3,000 | 3,000 |
| State of California, Educational Facs. Auth., Higher Education Commercial Paper, Series 2016-S-3, 0.60% 2/6/2017 | 5,000 | 5,000 |
| State of California, Various Purpose G.O. Commercial Paper, Series 2017-A-7, 0.74% 3/6/2017 | 5,000 | 5,000 |
| State of California, County of Los Angeles, 2016-17 Tax and Rev. Anticipation Notes, 3.00% 6/30/2017 | 14,000 | 14,141 |
| State of California, Pollution Control Fncg. Auth., Pollution Control Rev. Ref. Bonds (Pacific Gas and Electric Co.), Series 1996-C, JPMorgan Chase LOC, 0.59% 20262 | 3,000 | 3,000 |
| State of Colorado, General Fund Tax and Rev. Anticipation Notes, Series 2016-A, 2.00% 6/27/2017 | 50,000 | 50,262 |
| State of Connecticut, Health and Educational Facs. Auth., Higher Education Commercial Paper, Series 2016-2, 0.68% 2/6/2017 | 4,000 | 4,000 |
| State of Connecticut, Health and Educational Facs. Auth., Higher Education Commercial Paper, Series 2017, 0.78% 3/6/2017 | 4,000 | 4,000 |
| State of Idaho, Tax Anticipation Notes, Series 2016, 2.00% 6/30/2017 | 10,000 | 10,051 |
| State of Iowa, Fin. Auth., Demand Private College Rev. Ref. Bonds (Drake University Project), Series 2008, Wells Fargo Bank LOC, 0.63% 20312 | 5,000 | 5,000 |
| State of Louisiana, Parish of East Baton Rouge, Pollution Control Rev. Ref. Bonds (ExxonMobile Project), Series 1989, 0.55% 20192 | 5,000 | 5,000 |
| State of Massachusetts, G.O. Rev. Anticipation Notes, Series 2016-A, 2.00% 4/24/2017 | 6,000 | 6,018 |
| State of Minnesota, Housing and Redev. Auth. of the City of St. Paul, Health Care System Demand Rev. Bonds (Allina Health System), Series 2009-B-1, JPMorgan Chase LOC, 0.52% 20352 | 7,300 | 7,300 |
| State of Mississippi, Business Fin. Corp., Gulf Opportunity Zone Industrial Dev. Rev. Bonds (Chevron U.S.A. Inc. Project), Series 2007-A, 0.58% 20302 | 3,000 | 3,000 |
| State of Mississippi, Business Fin. Corp., Gulf Opportunity Zone Industrial Dev. Rev. Bonds (Chevron U.S.A. Inc. Project), Series 2007-E, 0.60% 20302 | 3,375 | 3,375 |
| State of Mississippi, Business Fin. Corp., Gulf Opportunity Zone Industrial Dev. Rev. Bonds (Chevron U.S.A. Inc. Project), Series 2011-E, 0.58% 20352 | 5,000 | 5,000 |
| State of Missouri, Health and Educational Facs. Auth., Demand Educational Facs. Rev. Bonds (Washington University), Series 1996-A, 0.62% 20302 | 3,800 | 3,800 |
| State of New York, Dormitory Auth., Rev. Bonds (Fordham University), Series 2008-A-2, Bank of America LOC, 0.68% 20322 | 3,175 | 3,175 |
| State of New York, Dormitory Auth., University of Rochester Rev. Bonds, Series 2003-A, JPMorgan Chase LOC, 0.63% 20312 | 6,030 | 6,030 |
| State of New York, Metropolitan Transportation Auth., Dedicated Tax Fund Bond Anticipation Notes, Series 2016-A-1-F, 2.00% 3/1/2017 | 7,500 | 7,508 |
| State of New York, Metropolitan Transportation Auth., Transportation Rev. Bond Anticipation Notes, Series 2016-A-1-E, 2.00% 3/1/2017 | 7,000 | 7,007 |
| State of New York, City of New York, G.O. Bonds, Series 2006-H-1, 0.63% 20362 | 5,000 | 5,000 |
| State of New York, City of New York, G.O. Bonds, Series 2006-L-5, 0.63% 20352 | 15,000 | 15,000 |
| State of New York, City of New York, G.O. Bonds, Series 2008-J-5, 0.63% 20282 | 7,000 | 7,000 |
| State of New York, New York City Transitional Fin. Auth., Future Tax Secured Rev. Ref. Bonds, Series 2016-E-4, 0.63% 20452 | 11,600 | 11,600 |
| Short-term securities | Principal amount (000) | Value (000) |
| State of New York, New York City, Municipal Water Fin. Auth., Water and Sewer System Second General Resolution Rev. Bonds, Fiscal 2006, Series 2005-B, 0.62% 20322 | $3,210 | $3,210 |
| State of Oregon, Full Faith and Credit Tax Anticipation Notes, Series 2016-A, 2.00% 6/30/2017 | 15,000 | 15,079 |
| State of Tennessee, Public Building Auth. of the County of Montgomery, Pooled Fncg. Rev. Bonds (Tennessee County Loan Pool), Series 2004, Bank of America LOC, 0.69% 20342 | 5,000 | 5,000 |
| State of Texas, Brazos River Harbor Navigation Dist. of Brazoria County, Environmental Facs. Rev. Bonds (Merey Sweeny, L.P. Project), AMT, Goldman Sachs LOC, 0.47% 20182 | 3,100 | 3,100 |
| State of Texas, Brazos River Harbor Navigation Dist. of Brazoria County, Environmental Facs. Rev. Bonds (Merey Sweeny, L.P. Project), Series 2001-A, AMT, Bank of America LOC, 0.47% 20212 | 400 | 400 |
| State of Texas, City of Houston, Public Improvement G.O. Bonds, Series 2017-H-2, 0.75% 2/7/2017 | 5,000 | 5,000 |
| Total short-term securities (cost: $231,070,000) | 231,056 | |
| Total investment securities 99.40% (cost: $4,867,195,000) | 4,920,329 | |
| Other assets less liabilities 0.60% | 29,661 | |
| Net assets 100.00% | $4,949,990 |
| 1 | Step bond; coupon rate will increase at a later date. |
| 2 | Coupon rate may change periodically. For short-term securities, the date of the next scheduled coupon rate change is considered to be the maturity date. |
| 3 | Acquired in a transaction exempt from registration under Rule 144A of the Securities Act of 1933. May be resold in the U.S. in transactions exempt from registration, normally to qualified institutional buyers. The total value of all such securities was $382,810,000, which represented 7.73% of the net assets of the fund. |
| 4 | Scheduled interest and/or principal payment was not received. |
| Key to abbreviations | |
| Agcy. = Agency | Fin. = Finance |
| AMT = Alternative Minimum Tax | Fncg. = Financing |
| Auth. = Authority | G.O. = General Obligation |
| Certs. of Part. = Certificates of Participation | LOC = Letter of Credit |
| Dept. = Department | Preref. = Prerefunded |
| Dev. = Development | Redev. = Redevelopment |
| Dist. = District | Ref. = Refunding |
| Econ. = Economic | Rev. = Revenue |
| Fac. = Facility | TECP = Tax-Exempt Commercial Paper |
| Facs. = Facilities |
| MFGEFPX-040-0317O-S54135 | American High-Income Municipal Bond Fund — Page 54 of 54 |
ITEM 7 – Disclosure of Proxy Voting Policies and Procedures for Closed-End Management Investment Companies
Not applicable to this Registrant, insofar as the Registrant is not a closed-end management investment company.
ITEM 8 – Portfolio Managers of Closed-End Management Investment Companies
Not applicable to this Registrant, insofar as the Registrant is not a closed-end management investment company.
ITEM 9 – Purchases of Equity Securities by Closed-End Management Investment Company and Affiliated Purchasers
Not applicable to this Registrant, insofar as the Registrant is not a closed-end management investment company.
ITEM 10 – Submission of Matters to a Vote of Security Holders
There have been no material changes to the procedures by which shareholders may recommend nominees to the Registrant’s board of trustees since the Registrant last submitted a proxy statement to its shareholders. The procedures are as follows. The Registrant has a nominating and governance committee comprised solely of persons who are not considered ‘‘interested persons’’ of the Registrant within the meaning of the Investment Company Act of 1940, as amended. The committee periodically reviews such issues as the board’s composition, responsibilities, committees, compensation and other relevant issues, and recommends any appropriate changes to the full board of trustees. While the committee normally is able to identify from its own resources an ample number of qualified candidates, it will consider shareholder suggestions of persons to be considered as nominees to fill future vacancies on the board. Such suggestions must be sent in writing to the nominating and governance committee of the Registrant, c/o the Registrant’s Secretary, and must be accompanied by complete biographical and occupational data on the prospective nominee, along with a written consent of the prospective nominee for consideration of his or her name by the nominating and governance committee.
ITEM 11 – Controls and Procedures
| (a) | The Registrant’s Principal Executive Officer and Principal Financial Officer have concluded, based on their evaluation of the Registrant’s disclosure controls and procedures (as such term is defined in Rule 30a-3 under the Investment Company Act of 1940), that such controls and procedures are adequate and reasonably designed to achieve the purposes described in paragraph (c) of such rule. |
| (b) | There were no changes in the Registrant’s internal controls over financial reporting (as defined in Rule 30a-3(d) under the Investment Company Act of 1940) that occurred during the Registrant’s second fiscal quarter of the period covered by this report that has materially affected, or is reasonably likely to materially affect, the Registrant’s internal control over financial reporting. |
ITEM 12 – Exhibits
| (a)(1) | Not applicable for filing of semi-annual reports to shareholders. |
| (a)(2) | The certifications required by Rule 30a-2 of the Investment Company Act of 1940 and Sections 302 and 906 of the Sarbanes-Oxley Act of 2002 are attached as exhibits hereto. |
SIGNATURES
Pursuant to the requirements of the Securities Exchange Act of 1934 and the Investment Company Act of 1940, the Registrant has duly caused this report to be signed on its behalf by the undersigned, thereunto duly authorized.
AMERICAN HIGH-INCOME MUNICIPAL BOND FUND | |
| By _/s/ Karl J. Zeile_ | |
Karl J. Zeile, Vice Chairman, President and Principal Executive Officer | |
| Date: March 31, 2017 |
Pursuant to the requirements of the Securities Exchange Act of 1934 and the Investment Company Act of 1940, this report has been signed below by the following persons on behalf of the Registrant and in the capacities and on the dates indicated.
| By _/s/ Karl J. Zeile_ |
Karl J. Zeile, Vice Chairman, President and Principal Executive Officer |
| Date: March 31, 2017 |
| By __/s/ Brian C. Janssen |
Brian C. Janssen, Treasurer and Principal Financial Officer |
| Date: March 31, 2017 |