UNITED STATES
SECURITIES AND EXCHANGE COMMISSION
Washington, D.C. 20549
FORM N-CSR
Certified Shareholder Report of
Registered Management Investment Companies
Investment Company Act File Number: 811-08576
American High-Income Municipal Bond Fund
(Exact Name of Registrant as Specified in Charter)
333 South Hope Street
Los Angeles, California 90071
(Address of Principal Executive Offices)
Registrant's telephone number, including area code: (949) 975-5000
Date of fiscal year end: July 31
Date of reporting period: July 31, 2020
Brian C. Janssen
American High-Income Municipal Bond Fund
6455 Irvine Center Drive
Irvine, California 92620
(Name and Address of Agent for Service)
ITEM 1 – Reports to Stockholders
| American Funds Short-Term Tax-Exempt Bond Fund® Limited Term Tax-Exempt Bond Fund of America® The Tax-Exempt Bond Fund of America® American High-Income Municipal Bond Fund® The Tax-Exempt Fund of California® American Funds Tax-Exempt Fund of New York® | |
| Annual reports for the year ended July 31, 2020 |
![]()
Invest in
municipal bonds
for tax-advantaged
income
Beginning January 1, 2021, as permitted by regulations adopted by the U.S. Securities and Exchange Commission, we intend to no longer mail paper copies of the fund’s shareholder reports, unless specifically requested from American Funds or your financial intermediary, such as a broker-dealer or bank. Instead, the reports will be made available on the Capital Group website (capitalgroup.com); you will be notified by mail and provided with a website link to access the report each time a report is posted. If you have already elected to receive shareholder reports electronically, you will not be affected by this change and do not need to take any action. If you prefer to receive shareholder reports and other communications electronically, you may update your mailing preferences with your financial intermediary, or enroll in e-delivery at capitalgroup.com (for accounts held directly with the fund).
You may elect to receive paper copies of all future reports free of charge. If you invest through a financial intermediary, you may contact your financial intermediary to request that you continue to receive paper copies of your shareholder reports. If you invest directly with the fund, you may inform American Funds that you wish to continue receiving paper copies of your shareholder reports by contacting us at (800) 421-4225. Your election to receive paper reports will apply to all funds held with American Funds or through your financial intermediary.
American Funds Short-Term Tax-Exempt Bond Fund seeks to provide current income exempt from regular federal income tax, consistent with the maturity and quality standards described in the prospectus, and to preserve capital.
Limited Term Tax-Exempt Bond Fund of America seeks to provide current income exempt from regular federal income tax, consistent with the maturity and quality standards described in the prospectus, and to preserve capital.
The Tax-Exempt Bond Fund of America seeks to provide a high level of current income exempt from federal income tax, consistent with the preservation of capital.
American High-Income Municipal Bond Fund seeks to provide a high level of current income exempt from regular federal income tax.
The Tax-Exempt Fund of California seeks to provide a high level of current income exempt from regular federal and California state income taxes. Its secondary objective is preservation of capital.
American Funds Tax-Exempt Fund of New York seeks to provide a high level of current income exempt from regular federal, New York state and New York City income taxes. Its secondary objective is preservation of capital.
Each fund is one of more than 40 offered by Capital Group, home of American Funds, one of the nation’s largest mutual fund families. For nearly 90 years, Capital Group has invested with a long-term focus based on thorough research and attention to risk.
Fund results shown in this report, unless otherwise indicated, are for Class A shares at net asset value. If a sales charge had been deducted (maximum 2.50% for American Funds Short-Term Tax-Exempt Bond Fund and Limited Term Tax-Exempt Bond Fund of America; 3.75% for The Tax-Exempt Bond Fund of America, American High-Income Municipal Bond Fund, The Tax-Exempt Fund of California and American Funds Tax-Exempt Fund of New York), the results would have been lower. Results are for past periods and are not predictive of results for future periods. Current and future results may be lower or higher than those shown. Prices and returns will vary, so investors may lose money. Investing for short periods makes losses more likely. For current information and month-end results, visit capitalgroup.com.
Here are the total returns on a $1,000 investment with all distributions reinvested for periods ended June 30, 2020 (the most recent calendar quarter-end), and the total annual fund operating expense ratios as of the prospectus dated October 1, 2020 (unaudited):
| Cumulative total returns | Average annual total returns | Gross | ||||||||||||||
| Class A shares | 1 year | 5 years | 10 years/Lifetime* | expense ratios | ||||||||||||
| Reflecting 2.50% maximum sales charge | ||||||||||||||||
| American Funds Short-Term Tax-Exempt Bond Fund | 0.35 | % | 1.07 | % | 1.15 | % | 0.58 | % | ||||||||
| Limited Term Tax-Exempt Bond Fund of America | 0.81 | 1.81 | 2.41 | 0.60 | ||||||||||||
| Reflecting 3.75% maximum sales charge | ||||||||||||||||
| The Tax-Exempt Bond Fund of America | –0.48 | 2.81 | 3.86 | 0.52 | ||||||||||||
| American High-Income Municipal Bond Fund | –2.69 | 3.66 | 5.19 | 0.67 | ||||||||||||
| The Tax-Exempt Fund of California | –0.77 | 2.79 | 4.22 | 0.61 | ||||||||||||
| American Funds Tax-Exempt Fund of New York | –1.69 | 2.37 | 3.29 | 0.67 | † | |||||||||||
| * | Applicable only to American Funds Tax-Exempt Fund of New York, which began operations on 11/1/10. All other funds reflect 10-year results. |
| † | The net expense ratio for American Funds Tax-Exempt Fund of New York is 0.63% as of the prospectus dated October 1, 2020 (unaudited). |
For other share class results, visit capitalgroup.com.
Investment results assume all distributions are reinvested and reflect applicable fees and expenses. When applicable, investment results reflect fee waivers and/or expense reimbursements, without which results would have been lower. The investment adviser is currently reimbursing a portion of other expenses for American Funds Tax-Exempt Fund of New York. Investment results and the net expense ratio reflect the reimbursement, without which the results would have been lower and the expense ratio would have been higher. This reimbursement will be in effect through at least October 1, 2021, unless modified or terminated by the fund’s board. The adviser may elect at its discretion to extend, modify or terminate the reimbursement at that time. Visit capitalgroup.com for more information.
A summary of each fund’s 30-day yield can be found on page 3.
Investments are not FDIC-insured, nor are they deposits of or guaranteed by a bank or any other entity, so they may lose value.
We are pleased to present this report for American Funds Short-Term Tax-Exempt Bond Fund, Limited Term Tax-Exempt Bond Fund of America, The Tax-Exempt Bond Fund of America, American High-Income Municipal Bond Fund, The Tax-Exempt Fund of California and American Funds Tax-Exempt Fund of New York. It covers the 12-month period ended July 31, 2020, the conclusion of the funds’ fiscal year.
The past fiscal year was a tale in two parts, with municipal markets enjoying strong market conditions during the first seven months characterized by spread tightening and tight ratios to U.S. Treasurys. By March the full force of the economy’s pandemic-induced shutdown triggered a sharp sell-off. Credit spreads also widened dramatically across the yield curve. By fiscal year-end, the municipal market began to recover and stabilized in line with U.S. Treasury market conditions. This sequence of events ultimately produced total returns that ranged from 4.40% for The Tax-Exempt Bond Fund of America to 2.68% for American High-Income Municipal Bond Fund. (See pages 3 through 10 for fund specific results and information.)
The Bloomberg Barclays High Yield Municipal Bond Index (a market value-weighted index composed of municipal bonds rated below BBB/Baa) returned 3.12%, lagging the 5.36% return posted by the Bloomberg Barclays Municipal Bond Index, a measure of the long-term investment-grade (bonds rated BBB/Baa and above) tax-exempt market.
Economic and market overview
The fiscal year began with the municipal markets and general economy showing strength. Muni/Treasury ratios had reached very tight levels prior to the onset of the pandemic. As COVID-19 began spreading across the U.S. — prompting orders for communities to shelter-in-place, closing businesses and schools — investors sold municipal bonds at a significant pace, which cheapened muni/Treasury ratios to levels not seen since the Great Financial Crisis in 2008. However, by the end of July these ratios tightened significantly, although not to the levels seen in the beginning of the funds’ fiscal year.
In response to market volatility brought on by the pandemic and the subsequent shutdown of communities, the Federal Reserve (Fed) cut the target range for the federal funds rate in March to near zero, at 0.25%. In addition, the Fed has purchased trillions in Treasury and mortgage securities since the spring, sparking a flight to safe, cash-like investments.
In the second quarter, the U.S. economy contracted by the fastest quarterly rate on record, shrinking by 9.5%. On an annual basis, U.S. GDP declined by 32.9% as people stayed home and cut back their spending, triggering a drop in consumption, layoffs and business closures. Unemployment soared from a historically low rate of 3.5% in February to a record high of 14.7% in April to 10.2% in July — comparable to unemployment levels last seen in the Great Depression.
As economic indicators continue to point to weak growth, consumption and investment, Fed officials have signaled that they are inclined to keep the federal funds rate at close-to-zero levels until 2022.
Inside the funds
Municipal bonds, in general, continue to provide stability and diversification in portfolios as price fluctuations have been less pronounced than equities over longer periods. Fund managers took advantage of market volatility to add high conviction investment ideas at material discounts to those offered pre-crisis.
The fund managers’ long-term approach favors sectors such as housing, utilities and
| American Funds Tax-Exempt Funds | 1 |
education, which has resulted in greater exposure to revenue bonds. Managers have also found attractive opportunities in health care bonds despite uncertainty in the industry. In this sector, not-for-profit hospital credit is a focus.
Looking ahead
Concerns surrounding global economic growth amid a pandemic-induced recession continue. Unemployment in the United States remains high, and it is uncertain as to when economic activity will return to more normal levels. We continue to maintain a relatively cautious approach to credit and duration risk in fund portfolios. Any financial market optimism is tempered by concerns over the possibility of additional waves of COVID-19 infections and an ongoing economic slowdown.
At the time of publication, Congressional negotiations had stalled over additional federal aid to state and local governments, many of which are considering layoffs and cuts to essential services.
Longer term, fund managers will continue to monitor COVID-19’s impact across existing and prospective holdings while also balancing fundamental views and unprecedented Fed involvement in the markets when considering municipal bond valuations. The focus is on identifying resilient credits, especially those that reflect unreasonably bearish pandemic outcomes. Fund managers believe that volatility leads to opportunity for active managers.
Duration and yield curve management will remain important investment considerations moving forward. The Fed has indicated it will keep rates near zero for an extended period. Despite this, we expect to continue to uncover potentially compelling investments. We are particularly focused on revenue bond issuers as they are less likely to be directly affected by the long-term liability issues facing state and local governments and may provide a measure of stability for long-term investors.
Thank you for your support. We endeavor to be responsible stewards of your capital.
Sincerely,

Aaron Applebaum
President, American Funds Short-Term Tax-Exempt Bond Fund

Mark Marinella
President, Limited Term Tax-Exempt Bond Fund of America

Chad M. Rach
President, American High-Income Municipal Bond Fund

Jerome Solomon
President, American Funds Tax-Exempt Fund of New York

Karl J. Zeile
President, The Tax-Exempt Bond Fund of America and The Tax-Exempt Fund of California
September 14, 2020
For current information about the funds, visit capitalgroup.com.
| 2 | American Funds Tax-Exempt Funds |
Funds’ 30-day yields
Below is a summary of each fund’s 30-day yield and 12-month distribution rate for Class A shares as of August 31, 2020. Both measures reflect the 2.50%/3.75% maximum sales charge. Each fund’s 30-day yield is calculated in accordance with the U.S. Securities and Exchange Commission (SEC) formula. The SEC yield reflects the rate at which each fund is earning income on its current portfolio of securities while the distribution rate reflects the funds’ past dividends paid to shareholders. Accordingly, the funds’ SEC yields and distribution rates may differ.
| SEC | 12-month | |||||||
| Class A shares | 30-day yield | distribution rate | ||||||
| Reflecting 2.50% maximum sales charge | ||||||||
| American Funds Short-Term Tax-Exempt Bond Fund | 0.12 | % | 1.18 | % | ||||
| Limited Term Tax-Exempt Bond Fund of America | 0.42 | 1.47 | ||||||
| Reflecting 3.75% maximum sales charge | ||||||||
| The Tax-Exempt Bond Fund of America | 1.12 | 2.30 | ||||||
| American High-Income Municipal Bond Fund | 2.32 | 3.22 | ||||||
| The Tax-Exempt Fund of California | 0.87 | 2.27 | ||||||
| American Funds Tax-Exempt Fund of New York | 0.99 | * | 2.30 | |||||
| * | The SEC 30-day yield for American Funds Tax-Exempt Fund of New York is 1.02% with the fund’s reimbursement. |
The return of principal for bond funds and for funds with significant underlying bond holdings is not guaranteed. Fund shares are subject to the same interest rate, inflation and credit risks associated with the underlying bond holdings. Income may be subject to state or local income taxes and/or federal alternative minimum taxes. Also, certain other income (such as distributions from gains on the sale of certain bonds purchased at less than par value), as well as capital gain distributions, may be taxable. High-yield/lower rated bonds are subject to greater fluctuations in value and risk of loss of income and principal than investment-grade/higher rated bonds. The Tax-Exempt Fund of California and American Funds Tax-Exempt Fund of New York are more susceptible to factors adversely affecting issuers of each state’s tax-exempt securities than a more widely diversified municipal bond fund. Refer to the funds’ prospectus and the Risk Factors section of this report for more information on these and other risks associated with investing in the funds.
| American Funds Tax-Exempt Funds | 3 |
American Funds Short-Term Tax-Exempt Bond Fund
The fund registered a total return of 3.07% for the fiscal year, surpassing the 3.01% increase posted by the Bloomberg Barclays Municipal Short 1–5 Years Index, a market value-weighted index that includes investment-grade (rated BBB/Baa and above) tax-exempt bonds with maturities of one to five years. The fund outpaced the 1.78% return of the Lipper Short Municipal Debt Funds Average, a peer group measure. For the fiscal year, the fund paid a dividend of 13 cents a share.
Housing bonds were among the largest contributors to the fund’s returns. The fund uses derivatives to manage its exposure to interest rates and the yield curve. Instruments such as U.S. Treasury futures might be used when cash bonds are unavailable or not attractively priced.
The market index is unmanaged and, therefore, has no expenses. Investors cannot invest directly in an index. Bloomberg Barclays source: Bloomberg Index Services Ltd. Lipper averages reflect the current composition of all eligible mutual funds (all share classes) within a given category. Lipper source: Refinitiv Lipper. Lipper categories are dynamic, and averages may have few funds, especially over longer periods. To see the number of funds included in the Lipper category for each fund’s lifetime, please view the Quarterly Statistical Update, available at capitalgroup.com.
How a hypothetical $10,000 investment has grown

The results shown are before taxes on fund distributions and sale of fund shares.
Average annual total returns based on a hypothetical $1,000 investment
For periods ended July 31, 2020*
| 1 year | 5 years | 10 years | ||||
| Class A shares | 0.50% | 1.15% | 1.13% |
| * | Assumes reinvestment of all distributions and payment of the maximum 2.50% sales charge. |
Investment results assume all distributions are reinvested and reflect applicable fees and expenses. When applicable, investment results reflect expense reimbursements, without which results would have been lower. Visit capitalgroup.com for more information.
| 4 | American Funds Tax-Exempt Funds |
Limited Term Tax-Exempt Bond Fund of America
The fund generated a total return of 3.88% for the fiscal year. This lagged the 4.02% return posted by the Bloomberg Barclays Municipal Short-Intermediate 1–10 Years Index, a market value-weighted index that includes investment-grade (rated BBB/Baa and above) tax-exempt bonds with maturities of one to 10 years. However, the fund outpaced the 3.08% return of the Lipper Short-Intermediate Municipal Debt Funds Average, a peer group measure. The fund paid a dividend of 26 cents a share for the period.
Housing and general obligation bonds aided the fund, although an underweight position in the latter compared to the benchmark proved a drag. The fund uses derivatives to manage its exposure to interest rates and the yield curve. Instruments such as U.S. Treasury futures might be used when cash bonds are unavailable or not attractively priced.
The market index is unmanaged and, therefore, has no expenses. Investors cannot invest directly in an index. Bloomberg Barclays source: Bloomberg Index Services Ltd. Lipper averages reflect the current composition of all eligible mutual funds (all share classes) within a given category. Lipper source: Refinitiv Lipper. Lipper categories are dynamic, and averages may have few funds, especially over longer periods. To see the number of funds included in the Lipper category for each fund’s lifetime, please view the Quarterly Statistical Update, available at capitalgroup.com.
How a hypothetical $10,000 investment has grown

The results shown are before taxes on fund distributions and sale of fund shares.
Average annual total returns based on a hypothetical $1,000 investment
For periods ended July 31, 2020*
| 1 year | 5 years | 10 years | ||||
| Class A shares | 1.27% | 1.92% | 2.37% |
| * | Assumes reinvestment of all distributions and payment of the maximum 2.50% sales charge. |
Investment results assume all distributions are reinvested and reflect applicable fees and expenses. When applicable, investment results reflect fee waivers, without which results would have been lower. Visit capitalgroup.com for more information.
| American Funds Tax-Exempt Funds | 5 |
The Tax-Exempt Bond Fund of America
The fund generated a 4.40% total return for the fiscal year, which lagged the 5.36% return of the Bloomberg Barclays Municipal Bond Index, a market value-weighted index designed to represent the long-term investment grade (bonds rated BBB/Baa and above) tax-exempt bond market. The fund’s return outpaced the 4.14% total return of the Lipper General & Insured Municipal Debt Funds Average, a peer group measure. For the fiscal year, the fund paid a dividend of 33 cents a share.
Health care, housing and utility bonds helped boost fund results. The fund uses derivatives to manage its exposure to interest rates and the yield curve. Instruments such as U.S. Treasury futures might be used when cash bonds are unavailable or not attractively priced.
The market index is unmanaged and, therefore, has no expenses. Investors cannot invest directly in an index. Bloomberg Barclays source: Bloomberg Index Services Ltd. Lipper averages reflect the current composition of all eligible mutual funds (all share classes) within a given category. Lipper source: Refinitiv Lipper. Lipper categories are dynamic, and averages may have few funds, especially over longer periods. To see the number of funds included in the Lipper category for each fund’s lifetime, please view the Quarterly Statistical Update, available at capitalgroup.com.
How a hypothetical $10,000 investment has grown

The results shown are before taxes on fund distributions and sale of fund shares.
Average annual total returns based on a hypothetical $1,000 investment
For periods ended July 31, 2020*
| 1 year | 5 years | 10 years | ||||
| Class A shares | 0.47% | 3.04% | 3.89% |
| * | Assumes reinvestment of all distributions and payment of the maximum 3.75% sales charge. |
Investment results assume all distributions are reinvested and reflect applicable fees and expenses. When applicable, investment results reflect fee waivers, without which results would have been lower. Visit capitalgroup.com for more information.
| 6 | American Funds Tax-Exempt Funds |
American High-Income Municipal Bond Fund
The fund produced a total return of 2.68% for the fiscal year, lagging the 3.12% return of the Bloomberg Barclays High Yield Municipal Bond Index (a market value-weighted index composed of municipal bonds rated below BBB/Baa). By comparison, the Bloomberg Barclays Municipal Bond Index, a measure of the investment-grade municipal market, advanced 5.36%. The fund led the Lipper High Yield Municipal Debt Funds Average (a peer group measure), which returned 1.84%. For the period, the fund paid monthly dividends that totaled 54 cents a share.
The fund uses derivatives to manage its exposure to interest rates and the yield curve. Instruments such as U.S. Treasury futures might be used when cash bonds are unavailable or not attractively priced.
The market indexes are unmanaged and, therefore, have no expenses. Investors cannot invest directly in an index. Bloomberg Barclays source: Bloomberg Index Services Ltd. Lipper averages reflect the current composition of all eligible mutual funds (all share classes) within a given category. Lipper source: Refinitiv Lipper. Lipper categories are dynamic, and averages may have few funds, especially over longer periods. To see the number of funds included in the Lipper category for each fund’s lifetime, please view the Quarterly Statistical Update, available at capitalgroup.com.
How a hypothetical $10,000 investment has grown

The results shown are before taxes on fund distributions and sale of fund shares.
Average annual total returns based on a hypothetical $1,000 investment
For periods ended July 31, 2020*
| 1 year | 5 years | 10 years | ||||
| Class A shares | –1.19% | 4.00% | 5.29% |
| * | Assumes reinvestment of all distributions and payment of the maximum 3.75% sales charge. |
Investment results assume all distributions are reinvested and reflect applicable fees and expenses. When applicable, investment results reflect fee waivers, without which results would have been lower. Visit capitalgroup.com for more information.
| American Funds Tax-Exempt Funds | 7 |
The Tax-Exempt Fund of California
The fund generated a total return of 4.14% for the 12 months ended July 31, which lagged the 5.75% return of the Bloomberg Barclays California Municipal Index, a market value-weighted index that includes only investment-grade (rated BBB/Baa and above) tax-exempt bonds of issuers within the state of California. The fund bested the 3.99% total return of the Lipper California Municipal Debt Funds Average, a peer group measure. The fund paid a yearly dividend of 43 cents a share.
A heavier weighting than the benchmark in special tax bonds bolstered the fund. The fund uses derivatives to manage its exposure to interest rates and the yield curve. Instruments such as U.S. Treasury futures might be used when cash bonds are unavailable or not attractively priced.
The market index is unmanaged and, therefore, has no expenses. Investors cannot invest directly in an index. Bloomberg Barclays source: Bloomberg Index Services Ltd. Lipper averages reflect the current composition of all eligible mutual funds (all share classes) within a given category. Lipper source: Refinitiv Lipper. Lipper categories are dynamic, and averages may have few funds, especially over longer periods. To see the number of funds included in the Lipper category for each fund’s lifetime, please view the Quarterly Statistical Update, available at capitalgroup.com.
How a hypothetical $10,000 investment has grown
![]()
The results shown are before taxes on fund distributions and sale of fund shares.
Average annual total returns based on a hypothetical $1,000 investment
For periods ended July 31, 2020*
| 1 year | 5 years | 10 years | ||||
| Class A shares | 0.26% | 2.99% | 4.26% |
| * | Assumes reinvestment of all distributions and payment of the maximum 3.75% sales charge. |
Investment results assume all distributions are reinvested and reflect applicable fees and expenses. When applicable, investment results reflect fee waivers, without which results would have been lower. Visit capitalgroup.com for more information.
| 8 | American Funds Tax-Exempt Funds |
American Funds Tax-Exempt Fund of New York
The fund recorded a total return of 3.18% for the fiscal year, trailing the 4.30% increase posted by Bloomberg Barclays New York Municipal Index, a market value-weighted index that includes only investment-grade (rated BBB/Baa and above) tax-exempt bonds of issuers within the state of New York. The fund’s result slightly lagged the 3.28% return of the Lipper New York Municipal Debt Funds average, a peer group measure. The fund paid a yearly dividend of 26 cents a share.
The fund was hurt by an underweight position in general obligation and government bonds compared to its benchmark but was helped by an overweighting in health care issuances.
The market index is unmanaged and, therefore, has no expenses. Investors cannot invest directly in an index. Bloomberg Barclays source: Bloomberg Index Services Ltd. Lipper averages reflect the current composition of all eligible mutual funds (all share classes) within a given category. Lipper source: Refinitiv Lipper. Lipper categories are dynamic, and averages may have few funds, especially over longer periods. To see the number of funds included in the Lipper category for each fund’s lifetime, please view the Quarterly Statistical Update, available at capitalgroup.com.
How a hypothetical $10,000 investment has grown
![]()
| * | For the period November 1, 2010 (when the fund began operations), through July 31, 2011. |
The results shown are before taxes on fund distributions and sale of fund shares.
Average annual total returns based on a hypothetical $1,000 investment
For periods ended July 31, 2020*
| 1 year | 5 years | Lifetime | ||||
| Class A shares | –0.70% | 2.57% | 3.44% |
| * | Assumes reinvestment of all distributions and payment of the maximum 3.75% sales charge. |
Investment results assume all distributions are reinvested and reflect applicable fees and expenses. When applicable, investment results reflect expense reimbursements, without which results would have been lower. The investment adviser is currently reimbursing a portion of other expenses. This reimbursement will be in effect through at least October 1, 2021, unless modified or terminated by the fund’s board. The adviser may elect at its discretion to extend, modify or terminate the reimbursement at that time. Visit capitalgroup.com for more information.
| American Funds Tax-Exempt Funds | 9 |
For periods ended July 31, 2020, with distributions reinvested
| Cumulative total returns | Average annual total returns | |||||||||||||||
| 1 year | 5 years | 10 years | Lifetime* | |||||||||||||
| American Funds Short-Term Tax-Exempt Bond Fund (Class A shares) | 3.07 | % | 1.67 | % | 1.39 | % | 1.54 | % | ||||||||
| Bloomberg Barclays Municipal Short 1–5 Years Index | 3.01 | 1.99 | 1.79 | 1.98 | ||||||||||||
| Lipper Short Municipal Debt Funds Average | 1.78 | 1.36 | 1.17 | 1.32 | ||||||||||||
| Limited Term Tax-Exempt Bond Fund of America (Class A shares) | 3.88 | 2.44 | 2.62 | 3.85 | ||||||||||||
| Bloomberg Barclays Municipal Short-Intermediate 1–10 Years Index | 4.02 | 2.85 | 2.80 | 4.11 | ||||||||||||
| Lipper Short-Intermediate Municipal Debt Funds Average | 3.08 | 2.19 | 2.12 | 3.32 | ||||||||||||
| The Tax-Exempt Bond Fund of America (Class A shares) | 4.40 | 3.83 | 4.29 | 6.32 | ||||||||||||
| Bloomberg Barclays Municipal Bond Index | 5.36 | 4.13 | 4.26 | — | † | |||||||||||
| Lipper General & Insured Municipal Debt Funds Average | 4.14 | 3.79 | 4.09 | 6.13 | ||||||||||||
| American High-Income Municipal Bond Fund (Class A shares) | 2.68 | 4.80 | 5.69 | 5.48 | ||||||||||||
| Bloomberg Barclays Municipal Bond Index | 5.36 | 4.13 | 4.26 | 5.33 | ||||||||||||
| Bloomberg Barclays High Yield Municipal Bond Index | 3.12 | 6.45 | 6.26 | — | † | |||||||||||
| Lipper High Yield Municipal Debt Funds Average | 1.84 | 4.42 | 5.15 | 5.00 | ||||||||||||
| The Tax-Exempt Fund of California (Class A shares) | 4.14 | 3.78 | 4.66 | 5.44 | ||||||||||||
| Bloomberg Barclays California Municipal Index | 5.75 | 4.15 | 4.68 | — | † | |||||||||||
| Lipper California Municipal Debt Funds Average | 3.99 | 3.96 | 4.61 | 5.47 | ||||||||||||
| American Funds Tax-Exempt Fund of New York (Class A shares) | 3.18 | 3.37 | — | 3.85 | ||||||||||||
| Bloomberg Barclays New York Municipal Index | 4.30 | 3.76 | — | 3.92 | ||||||||||||
| Lipper New York Municipal Debt Funds Average | 3.28 | 3.58 | — | 3.60 | ||||||||||||
| * | Since 8/7/09 (American Funds Short-Term Tax-Exempt Bond Fund), 10/6/93 (Limited Term Tax-Exempt Bond Fund of America), 10/3/79 (The Tax-Exempt Bond Fund of America), 9/26/94 (American High-Income Municipal Bond Fund), 10/28/86 (The Tax-Exempt Fund of California) and 11/1/10 (American Funds Tax-Exempt Fund of New York). |
| † | This index did not exist at the fund’s inception. |
The market indexes are unmanaged and, therefore, have no expenses. Investors cannot invest directly in an index. Bloomberg Barclays source: Bloomberg Index Services Ltd. Lipper averages reflect the current composition of all eligible mutual funds (all share classes) within a given category. Lipper source: Refinitiv Lipper. Lipper categories are dynamic and averages may have few funds, especially over longer periods. To see the number of funds included in the Lipper category for each fund’s lifetime, please view the Quarterly Statistical Update, available at capitalgroup.com.
| 10 | American Funds Tax-Exempt Funds |
American Funds Short-Term Tax-Exempt Bond Fund
Summary investment portfolio July 31, 2020
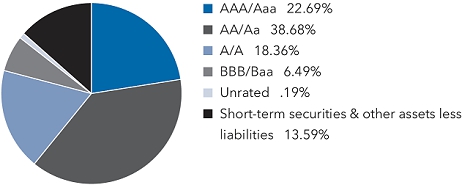
| Portfolio quality summary* | Percent of net assets |
| * | Bond ratings, which typically range from AAA/Aaa (highest) to D (lowest), are assigned by credit rating agencies such as Standard & Poor’s, Moody’s and/or Fitch as an indication of an issuer’s creditworthiness. In assigning a credit rating to a security, the fund looks specifically to the ratings assigned to the issuer of the security by Standard & Poor’s, Moody’s and/or Fitch. If agency ratings differ, the security will be considered to have received the highest of those ratings, consistent with the fund’s investment policies. Securities in the “unrated” category (above) have not been rated by a rating agency; however, the investment adviser performs its own credit analysis and assigns comparable ratings that are used for compliance with the fund’s investment policies. The ratings are not covered by the Report of Independent Registered Public Accounting Firm. |
| Bonds, notes & other debt instruments 86.78% | Principal amount (000) | Value (000) | ||||||
| Alabama 1.09% | ||||||||
| Black Belt Energy Gas Dist., Gas Supply Rev. Bonds, Series 2017-A, 4.00% 2047 (put 2022) | $ | 5,500 | $ | 5,827 | ||||
| Other securities | 9,404 | |||||||
| 15,231 | ||||||||
| Arizona 1.76% | ||||||||
| County of Maricopa, Industrial Dev. Auth., Rev. Bonds (Banner Health), Series 2017-B, 5.00% 2048 (put 2022) | 5,000 | 5,443 | ||||||
| Other securities | 19,289 | |||||||
| 24,732 | ||||||||
| California 3.06% | ||||||||
| Fresno Unified School Dist., G.O. Bonds, 2010 Election, Series 2013-C, 5.50% 2046 | 5,000 | 5,779 | ||||||
| Other securities | 37,163 | |||||||
| 42,942 | ||||||||
| Colorado 1.71% | ||||||||
| Health Facs. Auth., Rev. Ref. Bonds (Sisters of Charity of Leavenworth Health System), Series 2019-A, 5.00% 2025 | 4,475 | 5,310 | ||||||
| Housing and Fin. Auth., Single Family Mortgage Bonds, Series 2019-C, Class I, 4.25% 2049 | 6,030 | 6,724 | ||||||
| Other securities | 11,951 | |||||||
| 23,985 | ||||||||
| District of Columbia 2.14% | ||||||||
| G.O. Bonds, Series 2015-A, 5.00% 2032 | 6,500 | 7,848 | ||||||
| G.O. Rev. Ref. Bonds, Series 2018-B, 5.00% 2026 | 520 | 659 | ||||||
| Income Tax Secured Rev. Bonds, Series 2011-A, 5.00% 2022 | 760 | 809 | ||||||
| Income Tax Secured Rev. Bonds, Series 2020-C, 5.00% 2024 | 1,500 | 1,771 | ||||||
| Income Tax Secured Rev. Bonds, Series 2020-C, 5.00% 2025 | 1,500 | 1,837 | ||||||
| Income Tax Secured Rev. Bonds, Series 2020-C, 5.00% 2026 | 1,115 | 1,410 | ||||||
| Income Tax Secured Rev. Ref. Bonds, Series 2020-B, 5.00% 2022 | 3,000 | 3,314 | ||||||
| Income Tax Secured Rev. Ref. Bonds, Series 2020-B, 5.00% 2026 | 4,000 | 5,121 | ||||||
| Other securities | 7,269 | |||||||
| 30,038 | ||||||||
| Florida 4.55% | ||||||||
| Greater Orlando Aviation Auth., Airport Facs. Rev. Bonds, Series 2019-A, AMT, 5.00% 2023 | 4,500 | 5,102 | ||||||
| Dept. of Transportation, Turnpike Rev. Ref. Bonds, Series 2020-A, 5.00% 2026 | 4,935 | 6,263 | ||||||
| Other securities | 52,461 | |||||||
| 63,826 | ||||||||
| American Funds Tax-Exempt Funds | 11 |
American Funds Short-Term Tax-Exempt Bond Fund
| Bonds, notes & other debt instruments (continued) | Principal amount (000) | Value (000) | ||||||
| Georgia 1.86% | ||||||||
| City of East Point, Housing Auth., Multi Family Housing Rev. Bonds (Hillcrest Senior Apartments Projects), Series 2018, 2.25% 2022 (put 2021)1 | $ | 6,470 | $ | 6,560 | ||||
| G.O. Bonds, Series 2019-A, 5.00% 2023 | 5,000 | 5,703 | ||||||
| Other securities | 13,808 | |||||||
| 26,071 | ||||||||
| Illinois 4.62% | ||||||||
| Housing Dev. Auth., Multi Family Housing Rev. Notes (Marshall Field Garden Apartment Homes), Series 2015, (SIFMA Municipal Swap Index + 1.00%) 1.16% 2050 (put 2025)2 | 5,625 | 5,635 | ||||||
| Railsplitter Tobacco Settlement Auth., Tobacco Settlement Rev. Bonds, Series 2010, 5.25% 2021 | 5,520 | 5,736 | ||||||
| Other securities | 53,298 | |||||||
| 64,669 | ||||||||
| Iowa 0.37% | ||||||||
| Fin. Auth., State Revolving Fund Rev. Bonds, Series 2011, 5.00% 2026 (preref. 2021) | 4,960 | 5,199 | ||||||
| Michigan 2.55% | ||||||||
| Housing Dev. Auth., Single Family Mortgage Rev. Bonds, Series 2014-A, 4.00% 2044 | 450 | 475 | ||||||
| Housing Dev. Auth., Single Family Mortgage Rev. Bonds, Series 2016-B, 3.50% 2047 | 855 | 916 | ||||||
| Housing Dev. Auth., Single Family Mortgage Rev. Bonds, Series 2017-B, 3.50% 2048 | 2,830 | 3,053 | ||||||
| Housing Dev. Auth., Single Family Mortgage Rev. Bonds, Series 2018-A, 4.00% 2048 | 2,295 | 2,521 | ||||||
| Housing Dev. Auth., Single Family Mortgage Rev. Bonds, Series 2018-C, 4.25% 2049 | 6,455 | 7,198 | ||||||
| Housing Dev. Auth., Single Family Mortgage Rev. Bonds, Series 2020-A, 3.50% 2050 | 2,000 | 2,235 | ||||||
| Other securities | 19,405 | |||||||
| 35,803 | ||||||||
| Minnesota 2.37% | ||||||||
| G.O. Bonds, Series 2014-A, 5.00% 2025 | 4,415 | 5,257 | ||||||
| Other securities | 27,891 | |||||||
| 33,148 | ||||||||
| Montana 0.64% | ||||||||
| Fin. Auth., Rev. Bonds (Billings Clinic Obligated Group), Series 2018-C, (SIFMA Municipal Swap Index + 0.55%) 0.71% 2037 (put 2023)2 | 4,980 | 4,975 | ||||||
| Other securities | 3,999 | |||||||
| 8,974 | ||||||||
| Nevada 1.86% | ||||||||
| Housing Division, Single Family Mortgage Rev. Bonds, Series 2019-C, 1.20% 2051 (put 2020) | 6,725 | 6,728 | ||||||
| Las Vegas Valley Water Dist., Limited Tax G.O. Rev. Ref. Bonds, Series 2012-A, 5.00% 2029 | 4,070 | 4,398 | ||||||
| Las Vegas Valley Water Dist., Limited Tax G.O. Water Bonds, Series 2012-B, 5.00% 2025 | 1,000 | 1,085 | ||||||
| Las Vegas Valley Water Dist., Limited Tax G.O. Water Improvement and Rev. Ref. Bonds, Series 2016-A, 5.00% 2023 | 400 | 454 | ||||||
| Las Vegas Valley Water Dist., Limited Tax G.O. Water Rev. Ref. Bonds, Series 2015-B, 5.00% 2023 | 2,500 | 2,898 | ||||||
| Las Vegas Valley Water Dist., Limited Tax G.O. Water Rev. Ref. Bonds, Series 2020-A, 5.00% 2027 | 1,315 | 1,704 | ||||||
| Las Vegas Valley Water Dist., Limited Tax G.O. Water Rev. Ref. Bonds, Series 2020-D, 5.00% 2024 | 1,600 | 1,892 | ||||||
| Las Vegas Valley Water Dist., Limited Tax G.O. Water Rev. Ref. Bonds, Series 2020-D, 5.00% 2026 | 1,475 | 1,859 | ||||||
| Las Vegas Valley Water Dist., Limited Tax G.O. Water Rev. Ref. Bonds, Series 2020-D, 5.00% 2027 | 1,725 | 2,235 | ||||||
| Other securities | 2,796 | |||||||
| 26,049 | ||||||||
| 12 | American Funds Tax-Exempt Funds |
American Funds Short-Term Tax-Exempt Bond Fund
| Principal amount (000) | Value (000) | |||||||
| New Jersey 2.29% | ||||||||
| Housing and Mortgage Fin. Agcy., Single Family Housing Rev. Bonds, Series 2018-A, 4.50% 2048 | $ | 5,155 | $ | 5,822 | ||||
| Other securities | 26,273 | |||||||
| 32,095 | ||||||||
| New York 6.95% | ||||||||
| Dormitory Auth., State Personal Income Tax Rev. Bonds (General Purpose), Series 2017-A, 5.00% 2022 | 1,220 | 1,309 | ||||||
| Dormitory Auth., State Personal Income Tax Rev. Bonds (General Purpose), Series 2017-B, 5.00% 2026 | 1,070 | 1,334 | ||||||
| Dormitory Auth., State Personal Income Tax Rev. Bonds (General Purpose), Series 2019-D, 5.00% 2025 | 1,000 | 1,210 | ||||||
| Dormitory Auth., State Personal Income Tax Rev. Bonds (General Purpose), Series 2019-D, 5.00% 2026 | 1,400 | 1,745 | ||||||
| Dormitory Auth., State Personal Income Tax Rev. Bonds (General Purpose), Series 2019-D, 5.00% 2030 | 1,215 | 1,658 | ||||||
| Dormitory Auth., State Sales Tax Rev. Bonds, Series 2018-C, 5.00% 2024 | 7,500 | 8,793 | ||||||
| Dormitory Auth., State Sales Tax Rev. Bonds, Series 2018-C, 5.00% 2028 | 1,750 | 2,301 | ||||||
| Metropolitan Transportation Auth., Transportation Rev. Bonds, Series 2005-B, AMBAC insured, 5.25% 2023 | 715 | 776 | ||||||
| Metropolitan Transportation Auth., Transportation Rev. Bonds, Series 2013-B, 5.00% 2022 | 650 | 684 | ||||||
| Metropolitan Transportation Auth., Transportation Rev. Bonds, Series 2014-C, 5.00% 2020 | 2,000 | 2,014 | ||||||
| Metropolitan Transportation Auth., Transportation Rev. Bonds, Series 2014-D-2, (SIFMA Municipal Swap Index + 0.45%) 0.61% 2044 (put 2022)2 | 4,000 | 3,784 | ||||||
| Metropolitan Transportation Auth., Transportation Rev. Ref. Bonds, Series 2002-D-2A, Assured Guaranty Municipal insured, (1-month USD-LIBOR x 0.69 + 0.68%) 0.797% 2032 (put 2021)2 | 4,000 | 3,959 | ||||||
| Metropolitan Transportation Auth., Transportation Rev. Ref. Bonds, Series 2016-D, 5.00% 2022 | 1,020 | 1,074 | ||||||
| Metropolitan Transportation Auth., Transportation Rev. Ref. Bonds, Series 2016-D, 5.00% 2027 | 580 | 654 | ||||||
| Metropolitan Transportation Auth., Transportation Rev. Ref. Green Bonds, Series 2017-B, 5.00% 2023 | 1,590 | 1,709 | ||||||
| Metropolitan Transportation Auth., Transportation Rev. Ref. Green Bonds, Series 2017-C-1, 5.00% 2023 | 675 | 726 | ||||||
| New York City Housing Dev. Corp., Multi Family Housing Rev. Bonds (Sustainable Neighborhood Bonds), Series 2017-C-2, 1.70% 2021 | 5,250 | 5,257 | ||||||
| New York City Housing Dev. Corp., Multi Family Housing Rev. Bonds (Sustainable Neighborhood Bonds), Series 2017-G-2-A, 2.00% 2057 (put 2021) | 3,000 | 3,001 | ||||||
| New York City Housing Dev. Corp., Multi Family Housing Rev. Bonds (Sustainable Neighborhood Bonds), Series 2018-L-2, 2.75% 2050 (put 2023) | 3,625 | 3,803 | ||||||
| New York City Housing Dev. Corp., Multi Family Housing Rev. Bonds (Sustainable Neighborhood Bonds), Series 2020-A-3, 1.125% 2060 (put 2024) | 2,000 | 2,019 | ||||||
| Other securities | 49,505 | |||||||
| 97,315 | ||||||||
| North Carolina 2.89% | ||||||||
| G.O. Public Improvement Bonds (Connect NC), Series 2019-B, 5.00% 2021 | 6,225 | 6,478 | ||||||
| Raleigh-Durham Airport Auth., Airport Rev. Ref. Bonds, Series 2020-A, AMT, 5.00% 2021 | 5,000 | 5,153 | ||||||
| University of North Carolina at Chapel Hill, General Rev. Bonds, Series 2012-B, (1-month USD-LIBOR x 0.67 + 0.40%) 0.515% 2041 (put 2022)2 | 5,030 | 5,009 | ||||||
| Other securities | 23,890 | |||||||
| 40,530 | ||||||||
| Oregon 1.79% | ||||||||
| Housing and Community Services Dept., Housing Dev. Rev. Bonds (The Henry Apartments Project), Series 2018-J, 2.20% 2021 (put 2020) | 7,075 | 7,122 | ||||||
| Other securities | 17,975 | |||||||
| 25,097 | ||||||||
| American Funds Tax-Exempt Funds | 13 |
American Funds Short-Term Tax-Exempt Bond Fund
| Bonds, notes & other debt instruments (continued) | Principal amount (000) | Value (000) | ||||||
| Pennsylvania 3.64% | ||||||||
| Housing Fin. Agcy., Single Family Mortgage Rev. Bonds, Series 2015-117-A, AMT, 3.50% 2040 | $ | 785 | $ | 824 | ||||
| Housing Fin. Agcy., Single Family Mortgage Rev. Bonds, Series 2015-118-A, AMT, 3.50% 2040 | 2,845 | 2,948 | ||||||
| Housing Fin. Agcy., Single Family Mortgage Rev. Bonds, Series 2016-119, 3.50% 2041 | 400 | 419 | ||||||
| Housing Fin. Agcy., Single Family Mortgage Rev. Bonds, Series 2016-120, 3.50% 2046 | 505 | 533 | ||||||
| Housing Fin. Agcy., Single Family Mortgage Rev. Bonds, Series 2017-122, 4.00% 2046 | 2,890 | 3,118 | ||||||
| Housing Fin. Agcy., Single Family Mortgage Rev. Bonds, Series 2017-123-A, AMT, 4.00% 2039 | 990 | 1,049 | ||||||
| Housing Fin. Agcy., Single Family Mortgage Rev. Bonds, Series 2019-128-A, AMT, 4.75% 2033 | 1,330 | 1,469 | ||||||
| Housing Fin. Agcy., Single Family Mortgage Rev. Bonds, Series 2020-132-A, 3.50% 2051 | 1,000 | 1,097 | ||||||
| Housing Fin. Agcy., Special Limited Obligation, Multi Family Housing Dev. Bonds (Central Pennsylvania Dev.), Series 2018, 2.45% 2022 (put 2021) | 5,000 | 5,088 | ||||||
| Turnpike Commission, Turnpike Rev. Bonds (Motor License Fund), Series 2012-A, 5.00% 2025 (preref. 2021) | 1,165 | 1,239 | ||||||
| Turnpike Commission, Turnpike Rev. Bonds (Motor License Fund), Series 2012-A, 5.00% 2027 (preref. 2021) | 2,380 | 2,532 | ||||||
| Turnpike Commission, Turnpike Rev. Bonds, Series 2011-E, 5.00% 2026 (preref. 2021) | 1,000 | 1,063 | ||||||
| Turnpike Commission, Turnpike Rev. Bonds, Series 2011-E, 5.00% 2030 (preref. 2021) | 480 | 510 | ||||||
| Turnpike Commission, Turnpike Rev. Bonds, Series 2011-E, 5.00% 2042 (preref. 2022) | 1,150 | 1,278 | ||||||
| Turnpike Commission, Turnpike Rev. Bonds, Series 2014-B-1, (SIFMA Municipal Swap Index + 0.98%) 1.14% 20212 | 1,100 | 1,103 | ||||||
| Turnpike Commission, Turnpike Rev. Bonds, Series 2016, 5.00% 2021 | 2,155 | 2,226 | ||||||
| Turnpike Commission, Turnpike Rev. Bonds, Series 2018-B, (SIFMA Municipal Swap Index + 0.50%) 0.66% 20212 | 3,000 | 2,991 | ||||||
| Turnpike Commission, Turnpike Rev. Bonds, Series 2019-A, 5.00% 2025 | 500 | 611 | ||||||
| Turnpike Commission, Turnpike Rev. Bonds, Series 2019-A, 5.00% 2026 | 400 | 497 | ||||||
| Turnpike Commission, Turnpike Rev. Ref. Bonds, Series 2017-A-2, 5.00% 2024 | 485 | 575 | ||||||
| Other securities | 19,854 | |||||||
| 51,024 | ||||||||
| South Carolina 1.35% | ||||||||
| City of Charleston, Waterworks and Sewer System Capital Improvement Bonds, Series 2006-B, 0.482% 2035 (put 2022)2 | 5,000 | 4,965 | ||||||
| Other securities | 13,929 | |||||||
| 18,894 | ||||||||
| Texas 14.46% | ||||||||
| G.O. Bonds, College Student Loan Bonds, Series 2013-B, AMT, 5.25% 2022 | 3,155 | 3,467 | ||||||
| G.O. Bonds, Water Financial Assistance Bonds (Water Infrastructure Fund), Series 2011-B, 5.00% 2021 | 1,830 | 1,920 | ||||||
| G.O. Bonds, Water Financial Assistance Rev. Ref. Bonds, Series 2019-C-1, 5.00% 2021 | 1,000 | 1,049 | ||||||
| County of Harris, Toll Road Rev. Ref. Bonds, Series 2012-B, (SIFMA Municipal Swap Index + 0.45%) 1.45% 2021 | 6,035 | 6,053 | ||||||
| City of Houston, Combined Utility System Rev. Ref. Bonds, Series 2018-C, (1-month USD-LIBOR x 0.70 + 0.36%) 0.476% 2034 (put 2021)2 | 5,650 | 5,634 | ||||||
| Prosper Independent School Dist., Unlimited Tax School Building Bonds, Series 2019-B, 2.00% 2050 (put 2021) | 6,480 | 6,759 | ||||||
| Transportation Commission, G.O. Mobility Fund Rev. Ref. Bonds, Series 2014-B, 5.00% 2026 | 1,000 | 1,176 | ||||||
| Other securities | 176,548 | |||||||
| 202,606 | ||||||||
| Utah 1.19% | ||||||||
| G.O. Bonds, Series 2020, 5.00% 2026 | 7,535 | 9,629 | ||||||
| G.O. Bonds, Series 2020-B, 5.00% 2025 | 5,750 | 7,098 | ||||||
| 16,727 | ||||||||
| 14 | American Funds Tax-Exempt Funds |
American Funds Short-Term Tax-Exempt Bond Fund
| Principal amount (000) | Value (000) | |||||||
| Virginia 2.38% | ||||||||
| College Building Auth., Educational Facs. Rev. Bonds (21st Century College and Equipment Programs), Series 2013-A, 4.50% 2033 | $ | 3,735 | $ | 4,139 | ||||
| College Building Auth., Educational Facs. Rev. Bonds (21st Century College and Equipment Programs), Series 2013-A, 4.50% 2034 | 1,950 | 2,161 | ||||||
| College Building Auth., Educational Facs. Rev. Bonds (21st Century College and Equipment Programs), Series 2020-A, 5.00% 2025 | 2,400 | 2,910 | ||||||
| College Building Auth., Educational Facs. Rev. Bonds (21st Century College and Equipment Programs), Series 2020-A, 5.00% 2026 | 2,675 | 3,349 | ||||||
| College Building Auth., Educational Facs. Rev. Ref. Bonds (21st Century College and Equipment Programs), Series 2011-A, 4.00% 2032 (preref. 2021) | 1,000 | 1,019 | ||||||
| County of Fairfax, Public Improvement Bonds, Series 2020-A, 4.50% 2027 | 3,865 | 4,970 | ||||||
| Other securities | 14,820 | |||||||
| 33,368 | ||||||||
| Wisconsin 2.80% | ||||||||
| G.O. Bonds, Series 2013-A, 5.00% 2025 (preref. 2022) | 5,000 | 5,423 | ||||||
| G.O. Bonds, Series 2015-A, 5.00% 2031 (preref. 2023) | 5,000 | 5,656 | ||||||
| Health and Educational Facs. Auth., Health Facs. Rev. Bonds (SSM Health Care), Series 2018-B, 5.00% 2038 (put 2023) | 2,700 | 2,956 | ||||||
| Health and Educational Facs. Auth., Rev. Bonds (Advocate Aurora Health Care Credit Group), Series 2018-C-3, (SIFMA Municipal Swap Index + 0.55%) 0.71% 2054 (put 2023)2 | 2,330 | 2,326 | ||||||
| Health and Educational Facs. Auth., Rev. Bonds (Agnesian HealthCare, Inc.), Series 2013-B, 5.00% 2024 (preref. 2023) | 1,015 | 1,153 | ||||||
| Health and Educational Facs. Auth., Rev. Bonds (Ascension Health Alliance Senior Credit Group), Series 2013-B-5, 5.00% 2033 (put 2024) | 2,000 | 2,377 | ||||||
| Health and Educational Facs. Auth., Rev. Bonds (Ascension Health Alliance Senior Credit Group), Series 2019-A, 5.00% 2021 | 670 | 709 | ||||||
| Health and Educational Facs. Auth., Rev. Bonds (Gundersen Lutheran), Series 2020, 5.00% 20263 | 4,000 | 4,713 | ||||||
| Health and Educational Facs. Auth., Rev. Bonds (Marshfield Clinic Health System, Inc.), Series 2020-A, 5.00% 2026 | 600 | 730 | ||||||
| Health and Educational Facs. Auth., Rev. Bonds (Marshfield Clinic Health System, Inc.), Series 2020-A, 5.00% 2027 | 1,500 | 1,861 | ||||||
| Other securities | 11,317 | |||||||
| 39,221 | ||||||||
| Other states & U.S. territories 18.46% | ||||||||
| Other securities | 258,350 | |||||||
| Total bonds, notes & other debt instruments (cost: $1,186,703,000) | 1,215,894 | |||||||
| Short-term securities 14.16% | ||||||||
| State of Alaska, City of Valdez, Marine Terminal Rev. Ref. Bonds (Exxon Pipeline Co. Project), Series 1985, 0.14% 20252 | 5,000 | 5,000 | ||||||
| State of Arizona, City of Phoenix, Industrial Dev. Auth., Health Care Facs. Rev. Bonds (Mayo Clinic), Series 2014-A, 0.12% 20522 | 4,000 | 4,000 | ||||||
| State of Arizona, City of Phoenix, Industrial Dev. Auth., Health Care Facs. Rev. Bonds (Mayo Clinic), Series 2014-B, 0.12% 20522 | 2,700 | 2,700 | ||||||
| State of California, City of Los Angeles, Dept. of Water and Power, Power System Demand Rev. Bonds, Series 2002-A-2, 0.14% 20352 | 5,000 | 5,000 | ||||||
| State of California, City of Los Angeles, Dept. of Water and Power, Water System Bonds, Series 2019-A, 0.14% 20492 | 6,300 | 6,300 | ||||||
| State of Louisiana, Parish of East Baton Rouge, Pollution Control Rev. Ref. Bonds (ExxonMobil Project), Series 1993, 0.14% 20222 | 8,000 | 8,000 | ||||||
| State of Mississippi, Business Fin. Corp., Gulf Opportunity Zone Industrial Dev. Rev. Bonds (Chevron U.S.A. Inc. Project), Series 2009-D, 0.14% 20302 | 4,150 | 4,150 | ||||||
| State of Mississippi, Business Fin. Corp., Gulf Opportunity Zone Industrial Dev. Rev. Bonds (Chevron U.S.A. Inc. Project), Series 2010-I, 0.14% 20352 | 7,000 | 7,000 | ||||||
| State of Mississippi, Business Fin. Corp., Gulf Opportunity Zone Industrial Dev. Rev. Bonds (Chevron U.S.A. Inc. Project), Series 2011-F, 0.14% 20352 | 4,000 | 4,000 | ||||||
| American Funds Tax-Exempt Funds | 15 |
American Funds Short-Term Tax-Exempt Bond Fund
| Short-term securities (continued) | Principal amount (000) | Value (000) | ||||||
| State of Missouri, Health and Educational Facs. Auth., Demand Educational Facs. Rev. Bonds (Washington University), Series 1996-A, 0.14% 20302 | $ | 6,200 | $ | 6,200 | ||||
| State of Missouri, Health and Educational Facs. Auth., Demand Educational Facs. Rev. Bonds (Washington University), Series 2000-B, 0.17% 20402 | 1,900 | 1,900 | ||||||
| State of Missouri, Health and Educational Facs. Auth., Demand Educational Facs. Rev. Bonds (Washington University), Series 2003-B, 0.16% 20332 | 4,500 | 4,500 | ||||||
| State of New York, Dormitory Auth., Rev. Bonds (Cornell University), Series 2019-B, 0.11% 20392 | 1,900 | 1,900 | ||||||
| State of New York, Dormitory Auth., State Personal Income Tax Rev. Anticipation Notes (General Purpose), Series 2020-B, 5.00% 3/31/2021 | 12,035 | 12,418 | ||||||
| State of New York, Metropolitan Transportation Auth., Transportation Rev. Bond Anticipation Notes, Series 2019-D-1, 5.00% 2022 | 1,025 | 1,077 | ||||||
| State of New York, Metropolitan Transportation Auth., Transportation Rev. Bond Anticipation Notes, Series 2020-A-2S, 4.00% 2022 | 2,450 | 2,504 | ||||||
| State of New York, New York City Transitional Fin. Auth., Future Tax Secured Bonds, Fiscal 2016, Series 2016-A-4, 0.16% 20412 | 2,000 | 2,000 | ||||||
| State of New York, New York City Transitional Fin. Auth., Recovery Bonds, Fiscal 2003, Series 2003-C-5, 0.16% 20312 | 7,515 | 7,515 | ||||||
| State of Ohio, Hospital Rev. Bonds (Cleveland Clinic Health System Obligated Group), Series 2019-F, 0.13% 20522 | 6,100 | 6,100 | ||||||
| State of South Carolina, Jobs-Econ. Dev. Auth., Hospital Rev. Bonds (Prisma Health Obligated Group), Series 2018-B, 0.14% 20482 | 6,500 | 6,500 | ||||||
| State of Texas, County of Jefferson, Port Arthur Navigation Dist., Pollution Control Rev. Ref. Bonds (Texaco Inc. Project), Series 1994, 0.14% 20242 | 8,000 | 8,000 | ||||||
| State of Texas, Port Arthur Navigation Dist. Industrial Dev. Corp., Rev. Bonds (Air Products Project), Series 2005, 0.12% 20402 | 4,900 | 4,900 | ||||||
| State of Texas, Tax and Rev. Anticipation Notes, Series 2019, 4.00% 8/27/2020 | 9,165 | 9,187 | ||||||
| State of Texas, Board of Regents of the University of Texas System, IAM Commercial Paper, Series 2020-A, 0.15% 8/18/2020 | 1,000 | 1,000 | ||||||
| State of Texas, Board of Regents of the University of Texas System, IAM Commercial Paper, Series 2020-A, 0.19% 9/11/2020 | 5,000 | 5,000 | ||||||
| State of Texas, Board of Regents of the University of Texas System, IAM Commercial Paper, Series 2020-A, 0.40% 8/10/2020 | 4,500 | 4,500 | ||||||
| State of Virginia, College Building Auth., Educational Facs. Rev. Bonds (University of Richmond Project), Series 2006, 0.15% 20362 | 1,000 | 1,000 | ||||||
| State of Virginia, Small Business Fncg. Auth., Demand Rev. Ref. Bonds (Virginia State University Real Estate Foundation), Series 2008, Bank of America LOC, 0.18% 20302 | 5,435 | 5,435 | ||||||
| State of Wisconsin, Public Fin. Auth., Solid Waste Disposal Rev. Ref. Bonds (Waste Management, Inc. Project), Series 2017-A-1, AMT, 0.45% 2023 (put 2020)4 | 7,065 | 7,065 | ||||||
| Other securities | 53,533 | |||||||
| Total short-term securities (cost: $198,398,000) | 198,384 | |||||||
| Total investment securities 100.94% (cost: $1,385,101,000) | 1,414,278 | |||||||
| Other assets less liabilities (0.94)% | (13,124 | ) | ||||||
| Net assets 100.00% | $ | 1,401,154 | ||||||
This summary investment portfolio is designed to streamline the report and help investors better focus on the fund’s principal holdings. See the inside back cover for details on how to obtain a complete schedule of portfolio holdings.
“Other securities” includes all issues that are not disclosed separately in the summary investment portfolio.
| 1 | Step bond; coupon rate may change at a later date. |
| 2 | Coupon rate may change periodically. Reference rate and spread are as of the most recent information available. Some coupon rates are determined by the issuer or agent based on current market conditions; therefore, the reference rate and spread are not available. For short-term securities, the date of the next scheduled coupon rate change is considered to be the maturity date. |
| 3 | Acquired in a transaction exempt from registration under Rule 144A of the Securities Act of 1933. May be resold in the U.S. in transactions exempt from registration, normally to qualified institutional buyers. The total value of all such securities, including those in “Other securities,” was $10,816,000, which represented .77% of the net assets of the fund. |
| 4 | For short-term securities, the mandatory put date is considered to be the maturity date. |
| 16 | American Funds Tax-Exempt Funds |
American Funds Short-Term Tax-Exempt Bond Fund
Key to abbreviations and symbol
Agcy. = Agency
AMT = Alternative Minimum Tax
Auth. = Authority
Certs. of Part. = Certificates of Participation
Dept. = Department
Dev. = Development
Dist. = District
Econ. = Economic
Fac. = Facility
Facs. = Facilities
Fin. = Finance
Fncg. = Financing
G.O. = General Obligation
IAM = Interest at Maturity
LIBOR = London Interbank Offered Rate
LOC = Letter of Credit
Preref. = Prerefunded
Redev. = Redevelopment
Ref. = Refunding
Rev. = Revenue
SIFMA = Securities Industry and Financial Markets Association
USD/$ = U.S. dollars
See notes to financial statements.
| American Funds Tax-Exempt Funds | 17 |
Limited Term Tax-Exempt Bond Fund of America
Summary investment portfolio July 31, 2020
| Portfolio quality summary* | Percent of net assets |
| * | Bond ratings, which typically range from AAA/Aaa (highest) to D (lowest), are assigned by credit rating agencies such as Standard & Poor’s, Moody’s and/or Fitch as an indication of an issuer’s creditworthiness. In assigning a credit rating to a security, the fund looks specifically to the ratings assigned to the issuer of the security by Standard & Poor’s, Moody’s and/or Fitch. If agency ratings differ, the security will be considered to have received the highest of those ratings, consistent with the fund’s investment policies. Securities in the “unrated” category (above) have not been rated by a rating agency; however, the investment adviser performs its own credit analysis and assigns comparable ratings that are used for compliance with the fund’s investment policies. The ratings are not covered by the Report of Independent Registered Public Accounting Firm. |
| Bonds, notes & other debt instruments 86.41% | Principal amount (000) | Value (000) | ||||||
| Arizona 1.04% | ||||||||
| City of Phoenix, Industrial Dev. Auth., Solid Waste Disposal Rev. Bonds (Republic Services, Inc. Project), Series 2013, AMT, 2.10% 2035 (put 2020) | $ | 15,000 | $ | 15,000 | ||||
| Other securities | 42,508 | |||||||
| 57,508 | ||||||||
| California 4.70% | ||||||||
| Regents of the University of California, G.O. Rev. Bonds, Series 2013-AK, 5.00% 2048 (put 2023) | 7,000 | 7,916 | ||||||
| Other securities | 252,474 | |||||||
| 260,390 | ||||||||
| Colorado 2.46% | ||||||||
| City and County of Denver, Dept. of Aviation, Airport System Rev. Bonds, Series 2018-A, AMT, 5.00% 2026 | 15,000 | 18,591 | ||||||
| Other securities | 117,855 | |||||||
| 136,446 | ||||||||
| Connecticut 1.54% | ||||||||
| Health and Educational Facs. Auth., Rev. Bonds (Yale University Issue), Series 2014-A, 1.10% 2048 (put 2023) | 25,355 | 25,888 | ||||||
| Other securities | 59,711 | |||||||
| 85,599 | ||||||||
| District of Columbia 2.08% | ||||||||
| G.O. Rev. Ref. Bonds, Series 2018-B, 5.00% 2026 | 970 | 1,229 | ||||||
| Hospital Rev. Ref. Bonds (Children’s Hospital Obligated Group Issue), Series 2015, 5.00% 2027 | 1,500 | 1,802 | ||||||
| Income Tax Secured Rev. Bonds, Series 2011-A, 5.00% 2029 | 1,765 | 1,871 | ||||||
| Income Tax Secured Rev. Bonds, Series 2019-A, 5.00% 2030 | 4,185 | 5,781 | ||||||
| Income Tax Secured Rev. Bonds, Series 2020-A, 5.00% 2032 | 6,500 | 8,966 | ||||||
| Income Tax Secured Rev. Bonds, Series 2020-A, 5.00% 2034 | 2,530 | 3,447 | ||||||
| Income Tax Secured Rev. Bonds, Series 2020-C, 5.00% 2023 | 1,400 | 1,586 | ||||||
| Income Tax Secured Rev. Bonds, Series 2020-C, 5.00% 2028 | 1,500 | 2,008 | ||||||
| Income Tax Secured Rev. Bonds, Series 2020-C, 5.00% 2029 | 1,000 | 1,374 | ||||||
| Income Tax Secured Rev. Bonds, Series 2020-C, 5.00% 2030 | 1,115 | 1,566 | ||||||
| Income Tax Secured Rev. Bonds, Series 2020-C, 5.00% 2033 | 2,785 | 3,826 | ||||||
| Income Tax Secured Rev. Ref. Bonds, Series 2019-C, 5.00% 2027 | 6,175 | 8,138 | ||||||
| Income Tax Secured Rev. Ref. Bonds, Series 2020-B, 5.00% 2026 | 6,250 | 8,001 | ||||||
| 18 | American Funds Tax-Exempt Funds |
Limited Term Tax-Exempt Bond Fund of America
| Principal amount (000) | Value (000) | |||||||
| Income Tax Secured Rev. Ref. Bonds, Series 2020-B, 5.00% 2027 | $ | 7,000 | $ | 9,225 | ||||
| Income Tax Secured Rev. Ref. Bonds, Series 2020-B, 5.00% 2029 | 5,535 | 7,684 | ||||||
| Other securities | 49,007 | |||||||
| 115,511 | ||||||||
| Florida 4.62% | ||||||||
| Greater Orlando Aviation Auth., Airport Facs. Rev. Bonds, Series 2019-A, AMT, 5.00% 2028 | 15,000 | 19,404 | ||||||
| Other securities | 236,424 | |||||||
| 255,828 | ||||||||
| Georgia 2.19% | ||||||||
| G.O. Bonds, Series 2019-A, 5.00% 2028 | 11,000 | 14,838 | ||||||
| Main Street Natural Gas, Inc., Gas Supply Rev. Bonds, Series 2018-A, 4.00% 2048 (put 2023) | 15,050 | 16,479 | ||||||
| Other securities | 90,121 | |||||||
| 121,438 | ||||||||
| Illinois 7.78% | ||||||||
| Build Illinois Bonds, Sales Tax Rev. Bonds, Series 2013, 5.00% 2024 | 4,230 | 4,570 | ||||||
| Build Illinois Bonds, Sales Tax Rev. Ref. Bonds, Series 2016-C, 4.00% 2025 | 4,515 | 4,891 | ||||||
| Build Illinois Bonds, Sales Tax Rev. Ref. Bonds, Series 2016-C, 4.00% 2026 | 11,805 | 12,898 | ||||||
| Build Illinois Bonds, Sales Tax Rev. Ref. Bonds, Series 2016-D, 4.00% 2021 | 1,900 | 1,932 | ||||||
| Fin. Auth., Rev. Bonds (Advocate Health Care Network), Series 2008-A-1, 4.00% 2030 | 5,000 | 5,779 | ||||||
| Fin. Auth., Rev. Bonds (Advocate Health Care Network), Series 2014, 5.00% 2021 | 375 | 391 | ||||||
| Fin. Auth., Rev. Bonds (Clean Water Initiative Revolving Fund), Series 2016, 4.00% 2026 | 1,100 | 1,305 | ||||||
| Fin. Auth., Rev. Bonds (Clean Water Initiative Revolving Fund), Series 2016, 5.00% 2026 | 1,000 | 1,248 | ||||||
| Fin. Auth., Rev. Bonds (Clean Water Initiative Revolving Fund), Series 2016, 5.00% 2028 | 10,590 | 13,193 | ||||||
| Fin. Auth., Rev. Bonds (Clean Water Initiative Revolving Fund), Series 2017, 5.00% 2027 | 2,000 | 2,571 | ||||||
| Fin. Auth., Rev. Bonds (Clean Water Initiative Revolving Fund), Series 2017, 5.00% 2033 | 2,500 | 3,135 | ||||||
| Fin. Auth., Rev. Bonds (Lifespace Communities, Inc.), Series 2015-A, 5.00% 2022 | 200 | 207 | ||||||
| Fin. Auth., Rev. Bonds (Lifespace Communities, Inc.), Series 2015-A, 5.00% 2026 | 540 | 582 | ||||||
| Fin. Auth., Rev. Bonds (Lifespace Communities, Inc.), Series 2015-A, 5.00% 2028 | 1,060 | 1,135 | ||||||
| Fin. Auth., Rev. Bonds (Northshore University Heathsystem), Series 2020-A, 5.00% 2026 | 1,500 | 1,840 | ||||||
| Fin. Auth., Rev. Bonds (Northshore University Heathsystem), Series 2020-A, 5.00% 2027 | 2,000 | 2,512 | ||||||
| Fin. Auth., Rev. Bonds (Northshore University Heathsystem), Series 2020-A, 5.00% 2033 | 1,000 | 1,306 | ||||||
| Fin. Auth., Rev. Bonds (Northwest Community Hospital), Series 2016-A, 5.00% 2026 | 1,080 | 1,309 | ||||||
| Fin. Auth., Rev. Bonds (Northwest Community Hospital), Series 2016-A, 5.00% 2027 | 1,000 | 1,203 | ||||||
| Fin. Auth., Rev. Bonds (Presbyterian Homes Obligated Group), Series 2016-A, 5.00% 2024 | 1,920 | 2,124 | ||||||
| Fin. Auth., Rev. Bonds (Presbyterian Homes Obligated Group), Series 2016-B, (1-month USD-LIBOR x 0.70 + 1.35%) 1.469% 2036 (put 2021)1 | 2,275 | 2,276 | ||||||
| Fin. Auth., Rev. Bonds (Presence Health Network), Series 2016-C, 4.00% 2024 | 4,000 | 4,442 | ||||||
| Fin. Auth., Rev. Bonds (Presence Health Network), Series 2016-C, 5.00% 2023 | 1,545 | 1,713 | ||||||
| Fin. Auth., Rev. Bonds (Presence Health Network), Series 2016-C, 5.00% 2024 | 1,425 | 1,639 | ||||||
| Fin. Auth., Rev. Bonds (Presence Health Network), Series 2016-C, 5.00% 2025 | 950 | 1,130 | ||||||
| Fin. Auth., Rev. Bonds (Presence Health Network), Series 2016-C, 5.00% 2026 | 1,215 | 1,487 | ||||||
| Fin. Auth., Rev. Bonds (Presence Health Network), Series 2016-C, 5.00% 2027 | 8,640 | 10,856 | ||||||
| Fin. Auth., Rev. Bonds (Presence Health Network), Series 2016-C, 5.00% 2028 | 3,135 | 3,929 | ||||||
| Fin. Auth., Rev. Bonds (Rehabilitation Institute of Chicago), Series 2013-A, 5.00% 2022 | 1,665 | 1,780 | ||||||
| Fin. Auth., Rev. Bonds (Rush University Medical Center Obligated Group), Series 2015-A, 5.00% 2028 | 4,000 | 4,684 | ||||||
| Fin. Auth., Rev. Bonds (Rush University Medical Center Obligated Group), Series 2015-A, 5.00% 2029 | 9,500 | 11,095 | ||||||
| Fin. Auth., Rev. Bonds (Swedish Covenant Hospital), Series 2016-A, 5.25% 2028 (preref. 2026) | 1,020 | 1,315 | ||||||
| Fin. Auth., Rev. Green Bonds (Clean Water Initiative Revolving Fund), Series 2019, 5.00% 2021 | 4,170 | 4,352 | ||||||
| Fin. Auth., Rev. Ref. Bonds (Loyola University of Chicago), Series 2012-B, 5.00% 2023 | 1,970 | 2,132 | ||||||
| Fin. Auth., Rev. Ref. Bonds (OSF Healthcare System), Series 2015-A, 5.00% 2023 | 750 | 850 | ||||||
| Fin. Auth., Rev. Ref. Bonds (OSF Healthcare System), Series 2015-A, 5.00% 2026 | 1,165 | 1,397 | ||||||
| Fin. Auth., Rev. Ref. Bonds (OSF Healthcare System), Series 2015-A, 5.00% 2029 | 1,500 | 1,783 | ||||||
| G.O. Bonds, Series 2013, 5.00% 2022 | 1,815 | 1,911 | ||||||
| G.O. Bonds, Series 2014, 5.00% 2021 | 535 | 543 | ||||||
| G.O. Bonds, Series 2017-A, 5.00% 2021 | 3,500 | 3,633 | ||||||
| G.O. Bonds, Series 2017-D, BAM insured, 5.00% 2020 | 19,285 | 19,426 | ||||||
| American Funds Tax-Exempt Funds | 19 |
Limited Term Tax-Exempt Bond Fund of America
| Bonds, notes & other debt instruments (continued) | Principal amount (000) | Value (000) | ||||||
| Illinois (continued) | ||||||||
| G.O. Bonds, Series 2017-D, BAM insured, 5.00% 2021 | $ | 20,035 | $ | 20,753 | ||||
| G.O. Bonds, Series 2020, 5.50% 2030 | 11,540 | 14,324 | ||||||
| Other securities | 249,563 | |||||||
| 431,144 | ||||||||
| Maryland 1.39% | ||||||||
| G.O. Bonds, State and Local Facs. Loan of 2020, Series 2020-A-1, 5.00% 2029 | 13,000 | 17,839 | ||||||
| Other securities | 59,243 | |||||||
| 77,082 | ||||||||
| Michigan 2.78% | ||||||||
| Fin. Auth., Hospital Rev. and Rev. Ref. Bonds (Trinity Health Credit Group), Series 2017-A, 5.00% 2024 | 1,000 | 1,181 | ||||||
| Fin. Auth., Hospital Rev. and Rev. Ref. Bonds (Trinity Health Credit Group), Series 2017-A, 5.00% 2025 | 1,000 | 1,216 | ||||||
| Fin. Auth., Hospital Rev. and Rev. Ref. Bonds (Trinity Health Credit Group), Series 2017-A, 5.00% 2026 | 1,000 | 1,248 | ||||||
| Fin. Auth., Hospital Rev. and Rev. Ref. Bonds (Trinity Health Credit Group), Series 2017-A, 5.00% 2047 (preref. 2022) | 17,235 | 19,132 | ||||||
| Fin. Auth., Hospital Rev. Ref. Bonds (Beaumont Health Credit Group), Series 2015-A, 5.00% 2025 | 3,000 | 3,504 | ||||||
| Fin. Auth., Hospital Rev. Ref. Bonds (Henry Ford Health System), Series 2016, 5.00% 2027 | 5,095 | 6,251 | ||||||
| Fin. Auth., Hospital Rev. Ref. Bonds (Oakwood Obligated Group), Series 2012, 5.00% 2022 | 2,500 | 2,745 | ||||||
| Fin. Auth., Local Government Loan Program Rev. Bonds (Detroit Water and Sewerage Dept., Sewage Disposal System Rev. and Rev. Ref. Local Project Bonds), Series 2014-C-3, Assured Guaranty Municipal insured, 5.00% 2022 | 5,000 | 5,457 | ||||||
| Fin. Auth., Local Government Loan Program Rev. Bonds (Detroit Water and Sewerage Dept., Sewage Disposal System Rev. and Rev. Ref. Local Project Bonds), Series 2014-C-3, Assured Guaranty Municipal insured, 5.00% 2023 | 1,215 | 1,382 | ||||||
| Fin. Auth., Local Government Loan Program Rev. Bonds (Detroit Water and Sewerage Dept., Sewage Disposal System Rev. Ref. Local Project Bonds), Series 2015-C, 5.00% 2027 | 1,750 | 2,104 | ||||||
| Fin. Auth., Rev. Ref. Bonds (McLaren Health Care), Series 2015-D-2, (SIFMA Municipal Swap Index x 0.61 + 0.50%) 0.66% 2038 (put 2021)1 | 5,615 | 5,616 | ||||||
| Fin. Auth., Student Loan Rev. Ref. Bonds, Series 25-A, AMT, 5.00% 2020 | 1,750 | 1,764 | ||||||
| Fin. Auth., Student Loan Rev. Ref. Bonds, Series 25-A, AMT, 5.00% 2021 | 1,650 | 1,715 | ||||||
| Housing Dev. Auth., Single Family Mortgage Rev. Bonds, Series 2014-A, 4.00% 2044 | 645 | 681 | ||||||
| Housing Dev. Auth., Single Family Mortgage Rev. Bonds, Series 2016-A, 4.00% 2046 | 565 | 606 | ||||||
| Housing Dev. Auth., Single Family Mortgage Rev. Bonds, Series 2016-B, 3.50% 2047 | 12,640 | 13,546 | ||||||
| Housing Dev. Auth., Single Family Mortgage Rev. Bonds, Series 2017-B, 3.50% 2048 | 2,440 | 2,633 | ||||||
| Housing Dev. Auth., Single Family Mortgage Rev. Bonds, Series 2018-A, 4.00% 2048 | 3,815 | 4,190 | ||||||
| Housing Dev. Auth., Single Family Mortgage Rev. Bonds, Series 2018-C, 4.25% 2049 | 16,160 | 18,020 | ||||||
| Housing Dev. Auth., Single Family Mortgage Rev. Bonds, Series 2019-A, 4.25% 2049 | 7,500 | 8,440 | ||||||
| Housing Dev. Auth., Single Family Mortgage Rev. Bonds, Series 2019-B, 3.75% 2050 | 3,645 | 4,062 | ||||||
| Housing Dev. Auth., Single Family Mortgage Rev. Bonds, Series 2020-A, 3.50% 2050 | 5,300 | 5,924 | ||||||
| Other securities | 42,528 | |||||||
| 153,945 | ||||||||
| New Mexico 1.04% | ||||||||
| City of Farmington, Pollution Control Rev. Ref. Bonds (Public Service Co. of San Juan Project), Series 2010-D, 1.10% 2040 (put 2023) | 15,750 | 15,845 | ||||||
| Other securities | 41,976 | |||||||
| 57,821 | ||||||||
| New York 8.28% | ||||||||
| Dormitory Auth., State Personal Income Tax Rev. Bonds (General Purpose), Series 2017-A, 5.00% 2022 | 4,415 | 4,737 | ||||||
| Dormitory Auth., State Personal Income Tax Rev. Bonds (General Purpose), Series 2017-B, 5.00% 2026 | 4,000 | 4,986 | ||||||
| Dormitory Auth., State Personal Income Tax Rev. Bonds (General Purpose), Series 2017-B, 5.00% 2030 | 9,040 | 11,589 | ||||||
| Dormitory Auth., State Personal Income Tax Rev. Bonds (General Purpose), Series 2018-A, 5.00% 2030 | 12,000 | 15,814 | ||||||
| 20 | American Funds Tax-Exempt Funds |
Limited Term Tax-Exempt Bond Fund of America
| Principal amount (000) | Value (000) | |||||||
| Dormitory Auth., State Personal Income Tax Rev. Bonds (General Purpose), Series 2019-D, 5.00% 2030 | $ | 3,035 | $ | 4,141 | ||||
| Dormitory Auth., State Personal Income Tax Rev. Bonds (General Purpose), Series 2019-D, 5.00% 2033 | 1,000 | 1,338 | ||||||
| Dormitory Auth., State Sales Tax Rev. Bonds, Series 2014-A, 5.00% 2022 | 2,110 | 2,272 | ||||||
| Dormitory Auth., State Sales Tax Rev. Bonds, Series 2014-A, 5.00% 2038 | 1,000 | 1,143 | ||||||
| Dormitory Auth., State Sales Tax Rev. Bonds, Series 2016-A, 5.00% 2028 | 1,740 | 2,173 | ||||||
| Dormitory Auth., State Sales Tax Rev. Bonds, Series 2018-A, 5.00% 2033 | 1,405 | 1,792 | ||||||
| Dormitory Auth., State Sales Tax Rev. Bonds, Series 2018-C, 5.00% 2024 | 12,500 | 14,654 | ||||||
| Dormitory Auth., State Sales Tax Rev. Bonds, Series 2018-C, 5.00% 2028 | 7,500 | 9,862 | ||||||
| Dormitory Auth., State Sales Tax Rev. Bonds, Series 2018-C, 5.00% 2029 | 2,995 | 3,910 | ||||||
| Dormitory Auth., State Sales Tax Rev. Bonds, Series 2018-E, 5.00% 2035 | 3,600 | 4,624 | ||||||
| Metropolitan Transportation Auth., Transportation Rev. Bonds, Series 2003-B, FGIC-National insured, 5.25% 2020 | 5,500 | 5,549 | ||||||
| Metropolitan Transportation Auth., Transportation Rev. Bonds, Series 2008-B-2, 5.00% 2022 | 460 | 484 | ||||||
| Metropolitan Transportation Auth., Transportation Rev. Bonds, Series 2012-E, 5.00% 2020 | 3,250 | 3,273 | ||||||
| Metropolitan Transportation Auth., Transportation Rev. Bonds, Series 2013-E, 5.00% 2023 | 350 | 376 | ||||||
| Metropolitan Transportation Auth., Transportation Rev. Bonds, Series 2014-C, 5.00% 2024 | 5,050 | 5,533 | ||||||
| Metropolitan Transportation Auth., Transportation Rev. Bonds, Series 2014-D-2, (SIFMA Municipal Swap Index + 0.45%) 0.61% 2044 (put 2022)1 | 7,750 | 7,331 | ||||||
| Metropolitan Transportation Auth., Transportation Rev. Bonds, Series 2015-A-1, 5.00% 2027 | 3,150 | 3,462 | ||||||
| Metropolitan Transportation Auth., Transportation Rev. Bonds, Series 2015-A-2, 5.00% 2045 (put 2030) | 17,920 | 20,642 | ||||||
| Metropolitan Transportation Auth., Transportation Rev. Bonds, Series 2015-B, 5.00% 2021 | 250 | 258 | ||||||
| Metropolitan Transportation Auth., Transportation Rev. Bonds, Series 2016-D, 5.00% 2021 | 125 | 129 | ||||||
| Metropolitan Transportation Auth., Transportation Rev. Green Bonds, Series 2016-A-2, 5.00% 2026 | 550 | 620 | ||||||
| Metropolitan Transportation Auth., Transportation Rev. Ref. Bonds, Series 2002-D-2A, Assured Guaranty Municipal insured, (1-month USD-LIBOR x 0.69 + 0.68%) 0.797% 2032 (put 2021)1 | 1,400 | 1,386 | ||||||
| Metropolitan Transportation Auth., Transportation Rev. Ref. Green Bonds, Series 2017-B, 5.00% 2023 | 1,035 | 1,113 | ||||||
| Metropolitan Transportation Auth., Transportation Rev. Ref. Green Bonds, Series 2017-B, 5.00% 2028 | 1,185 | 1,367 | ||||||
| Metropolitan Transportation Auth., Transportation Rev. Ref. Green Bonds, Series 2017-C-1, 5.00% 2025 | 4,250 | 4,741 | ||||||
| Metropolitan Transportation Auth., Transportation Rev. Ref. Green Bonds, Series 2017-C-1, 5.00% 2026 | 9,000 | 10,143 | ||||||
| Metropolitan Transportation Auth., Transportation Rev. Ref. Green Bonds, Series 2017-C-1, 5.00% 2027 | 2,400 | 2,749 | ||||||
| New York City G.O. Bonds, Fiscal 1994, Series 1994-A-4, 5.00% 2021 | 2,420 | 2,536 | ||||||
| New York City G.O. Bonds, Fiscal 2008, Series 2008-L-6, 5.00% 2030 | 2,000 | 2,647 | ||||||
| New York City G.O. Bonds, Fiscal 2014, Series 2014-G, 5.00% 2023 | 1,550 | 1,770 | ||||||
| New York City G.O. Bonds, Fiscal 2015, Series 2015-C, 5.00% 2028 | 1,000 | 1,185 | ||||||
| New York City G.O. Bonds, Fiscal 2016, Series 2016-C, 5.00% 2029 | 1,000 | 1,219 | ||||||
| New York City G.O. Bonds, Fiscal 2017, Series 2017-C, 5.00% 2028 | 4,300 | 5,425 | ||||||
| New York City G.O. Bonds, Fiscal 2018, Series 2018-A, 5.00% 2028 | 3,700 | 4,740 | ||||||
| New York City G.O. Bonds, Fiscal 2018, Series 2018-C, 5.00% 2027 | 1,200 | 1,557 | ||||||
| New York City G.O. Bonds, Fiscal 2020, Series 2020-B-1, 5.00% 2022 | 1,140 | 1,256 | ||||||
| New York City G.O. Bonds, Fiscal 2020, Series 2020-B-1, 5.00% 2028 | 1,400 | 1,856 | ||||||
| New York City G.O. Bonds, Fiscal 2020, Series 2020-B-1, 5.00% 2032 | 2,110 | 2,794 | ||||||
| New York City G.O. Bonds, Fiscal 2020, Series 2020-C-1, 4.00% 2020 | 10,000 | 10,000 | ||||||
| New York City G.O. Bonds, Fiscal 2020, Series 2020-C-1, 5.00% 2028 | 10,000 | 13,200 | ||||||
| New York City G.O. Bonds, Fiscal 2020, Series 2020-C-1, 5.00% 2030 | 17,675 | 24,154 | ||||||
| New York City G.O. Bonds, Fiscal 2020, Series 2020-C-1, 5.00% 2032 | 6,810 | 9,215 | ||||||
| New York City Municipal Water Fin. Auth., Water and Sewer System Second General Resolution Rev. Bonds, Fiscal 2020, Series 2020-EE, 5.00% 2031 | 8,830 | 12,693 | ||||||
| Urban Dev. Corp., State Personal Income Tax Rev. Bonds (General Purpose), Series 2020-C, 5.00% 2032 | 16,000 | 21,889 | ||||||
| Urban Dev. Corp., State Personal Income Tax Rev. Bonds (General Purpose), Series 2020-C, 5.00% 2033 | 10,695 | 14,506 | ||||||
| Other securities | 173,899 | |||||||
| 458,732 | ||||||||
| American Funds Tax-Exempt Funds | 21 |
Limited Term Tax-Exempt Bond Fund of America
| Bonds, notes & other debt instruments (continued) | Principal amount (000) | Value (000) | ||||||
| North Dakota 0.67% | ||||||||
| Housing Fin. Agcy., Homeownership Rev. Bonds (Home Mortgage Fin. Program), Series 2016-D, 3.50% 2046 | $ | 16,600 | $ | 17,886 | ||||
| Other securities | 19,275 | |||||||
| 37,161 | ||||||||
| Ohio 3.44% | ||||||||
| Air Quality Dev. Auth., Air Quality Rev. Ref. Bonds (American Electric Co. Project), Series 2005-A, AMT, 2.10% 2029 (put 2024) | 15,000 | 15,686 | ||||||
| Other securities | 175,133 | |||||||
| 190,819 | ||||||||
| South Carolina 1.15% | ||||||||
| Housing Fin. and Dev. Auth., Mortgage Rev. Bonds, Series 2020-A, 4.00% 2050 | 15,350 | 17,560 | ||||||
| Other securities | 46,191 | |||||||
| 63,751 | ||||||||
| Texas 12.57% | ||||||||
| Dept. of Housing and Community Affairs, Single Family Mortgage Rev. Bonds, Series 2019-A, 4.00% 2050 | 15,070 | 17,241 | ||||||
| North Texas Tollway Auth., System Rev. Ref. Bonds, Series 2016-A, 5.00% 2026 | 12,610 | 14,487 | ||||||
| Wylie Independent School Dist., Unlimited Tax Rev. Ref. Bonds, Series 2020-A, 5.00% 2030 | 13,170 | 18,344 | ||||||
| Other securities | 646,707 | |||||||
| 696,779 | ||||||||
| Virginia 2.30% | ||||||||
| College Building Auth., Educational Facs. Rev. Bonds (21st Century College and Equipment Programs), Series 2013-A, 4.50% 2033 | 14,055 | 15,575 | ||||||
| G.O. Bonds, Series 2015-A, 5.00% 2026 | 11,795 | 14,468 | ||||||
| Other securities | 97,702 | |||||||
| 127,745 | ||||||||
| Washington 2.70% | ||||||||
| G.O. Bonds, Series 2012-D, 5.00% 2023 | 5,015 | 5,378 | ||||||
| G.O. Bonds, Series 2017-D, 5.00% 2028 | 5,000 | 6,426 | ||||||
| G.O. Bonds, Series 2018-C, 5.00% 2027 | 2,020 | 2,606 | ||||||
| G.O. Bonds, Series 2019-A, 5.00% 2033 | 3,500 | 4,585 | ||||||
| G.O. Bonds, Series 2019-C, 5.00% 2031 | 5,000 | 6,735 | ||||||
| G.O. Bonds, Series 2020-A, 5.00% 2025 | 2,095 | 2,588 | ||||||
| G.O. Bonds, Series 2020-D, 5.00% 2033 | 2,225 | 3,023 | ||||||
| G.O. Bonds, Series 2021-A, 5.00% 2028 | 1,935 | 2,598 | ||||||
| G.O. Bonds, Series 2021-A, 5.00% 2029 | 8,535 | 11,765 | ||||||
| G.O. Rev. Ref. Bonds, Series 2016-R-C, 4.00% 2028 | 10,000 | 10,700 | ||||||
| G.O. Rev. Ref. Bonds, Series 2017-R-A, 5.00% 2022 | 2,370 | 2,601 | ||||||
| G.O. Rev. Ref. Bonds, Series 2020-R-A, 5.00% 2026 | 2,500 | 3,127 | ||||||
| G.O. Rev. Ref. Bonds, Series 2020-R-B, 5.00% 2022 | 2,750 | 2,940 | ||||||
| G.O. Rev. Ref. Bonds, Series 2020-R-B, 5.00% 2026 | 2,500 | 3,127 | ||||||
| Health Care Facs. Auth., Rev. Bonds (Catholic Health Initiatives), Series 2013-B-1, (SIFMA Municipal Swap Index + 1.00%) 1.16% 2035 (put 2021)1 | 15,100 | 15,055 | ||||||
| Other securities | 66,429 | |||||||
| 149,683 | ||||||||
| Wisconsin 2.56% | ||||||||
| Health and Educational Facs. Auth., Rev. Bonds (Gundersen Lutheran), Series 2020, 5.00% 20262 | 12,430 | 14,646 | ||||||
| Housing and Econ. Dev. Auth., Home Ownership Rev. Bonds, Series 2019-A, 4.25% 2049 | 17,440 | 19,608 | ||||||
| Other securities | 107,658 | |||||||
| 141,912 | ||||||||
| 22 | American Funds Tax-Exempt Funds |
Limited Term Tax-Exempt Bond Fund of America
| Principal amount (000) | Value (000) | |||||||
| Other states & U.S. territories 21.12% | ||||||||
| Other securities | $ | 1,170,507 | ||||||
| Total bonds, notes & other debt instruments (cost: $4,605,077,000) | 4,789,801 | |||||||
| Short-term securities 14.90% | ||||||||
| State of Arizona, Health Facs. Auth., Rev. Bonds (Banner Health), Series 2015-B, 0.12% 20461 | $ | 20,970 | 20,970 | |||||
| State of California, Regents of the University of California, G.O. Rev. Bonds, Series 2013-AL-2, 0.14% 20481 | 48,500 | 48,500 | ||||||
| State of California, Regents of the University of California, G.O. Rev. Bonds, Series 2013-AL-4, 0.10% 20481 | 7,275 | 7,275 | ||||||
| State of Illinois, Fin. Auth., Demand Rev. Bonds (University of Chicago Medical Center), Series 2010-A, 0.17% 20441 | 8,000 | 8,000 | ||||||
| State of Illinois, Fin. Auth., Demand Rev. Bonds (University of Chicago Medical Center), Series 2011-A, 0.17% 20441 | 5,635 | 5,635 | ||||||
| State of Iowa, Fin. Auth., Rev. Bonds (UnityPoint Health), Series 2018-E, 0.17% 20411 | 13,420 | 13,420 | ||||||
| State of Iowa, Fin. Auth., Rev. Bonds (UnityPoint Health), Series 2018-F, 0.14% 20411 | 10,005 | 10,005 | ||||||
| State of Louisiana, Public Facs. Auth., Rev. Bonds (Air Products and Chemicals Project), Series 2008-A, 0.12% 20431 | 17,500 | 17,500 | ||||||
| State of Maryland, Health and Higher Educational Facs. Auth., Rev. IAM Commercial Paper (John Hopkins Hospital Issue), Series 2020-A, 0.18% 8/18/2020 | 5,000 | 5,000 | ||||||
| State of Maryland, Health and Higher Educational Facs. Auth., Rev. IAM Commercial Paper (John Hopkins Hospital Issue), Series 2020-A, 0.20% 9/3/2020 | 10,000 | 10,000 | ||||||
| State of Maryland, County of Montgomery, G.O. Bonds, Series 2017-E, 0.16% 20371 | 14,100 | 14,100 | ||||||
| State of Maryland, County of Montgomery, IAM Commercial Paper, Series 2009-B, 0.21% 8/26/2020 | 7,500 | 7,500 | ||||||
| State of Massachusetts, Massachusetts Bay Transportation Auth., Sales Tax Bonds, Series 2018-A-1, 0.16% 20261 | 26,650 | 26,650 | ||||||
| State of Michigan, Fin. Auth., State Aid Rev. Bonds, Series 2019-A, 2.00% 8/20/2020 | 3,000 | 3,002 | ||||||
| State of Michigan, Fin. Auth., State Aid Rev. Bonds, Series 2020-A-2, 4.00% 2021 | 7,000 | 7,262 | ||||||
| State of Michigan, Board of Trustees of Michigan State University, General Rev. Bonds, Series 2000-A, 0.23% 20301 | 16,755 | 16,755 | ||||||
| State of Minnesota, City of Rochester, Health Care Facs. Rev. Bonds (Mayo Clinic), Series 2016, 0.15% 20471 | 20,280 | 20,280 | ||||||
| State of Missouri, Health and Educational Facs. Auth., Demand Educational Facs. Rev. Bonds (Washington University), Series 2000-B, 0.17% 20401 | 15,500 | 15,500 | ||||||
| State of New Hampshire, Health and Education Facs. Auth., Rev. Ref. Bonds (Dartmouth College Issue), Series 2007-B, 0.15% 20411 | 32,700 | 32,700 | ||||||
| State of New Hampshire, National Fin. Auth., Exempt Facs. Rev. Ref. Bonds (Emerald Renewable Diesel LLC Project), Series 2019, AMT, 2.00% 2049 (put 2020)2,3 | 15,200 | 15,211 | ||||||
| State of New York, Dormitory Auth., State Personal Income Tax Rev. Anticipation Notes (General Purpose), Series 2020-B, 5.00% 3/31/2021 | 46,335 | 47,815 | ||||||
| State of New York, Metropolitan Transportation Auth., Transportation Rev. Bond Anticipation Notes, Series 2019-D-1, 5.00% 2022 | 12,080 | 12,691 | ||||||
| State of New York, Metropolitan Transportation Auth., Transportation Rev. Bond Anticipation Notes, Series 2020-A-2S, 4.00% 2022 | 17,020 | 17,391 | ||||||
| State of New York, New York City G.O. Bonds, Fiscal 2006, Series 2006-E-2, 0.16% 20341 | 3,625 | 3,625 | ||||||
| State of New York, New York City G.O. Bonds, Fiscal 2006, Series 2006-E-4, 0.16% 20341 | 5,000 | 5,000 | ||||||
| State of New York, New York City G.O. Bonds, Fiscal 2008, Series 2008-L-5, 0.16% 20351 | 22,545 | 22,545 | ||||||
| State of New York, New York City Municipal Water Fin. Auth., Water and Sewer System Rev. Bonds, Fiscal 2012, Series 2012-A-2, 0.14% 20441 | 18,855 | 18,855 | ||||||
| State of New York, New York City Municipal Water Fin. Auth., Water and Sewer System Second General Resolution Rev. Bonds, Fiscal 2011, Series 2011-DD-2, 0.18% 20431 | 9,500 | 9,500 | ||||||
| State of New York, New York City Municipal Water Fin. Auth., Water and Sewer System Second General Resolution Rev. Bonds, Fiscal 2014, Series 2014-AA-2, 0.18% 20501 | 22,750 | 22,750 | ||||||
| State of New York, New York City Municipal Water Fin. Auth., Water and Sewer System Second General Resolution Rev. Bonds, Fiscal 2014, Series 2014-AA-6, 0.18% 20481 | 3,080 | 3,080 | ||||||
| State of New York, New York City Municipal Water Fin. Auth., Water and Sewer System Second General Resolution Rev. Bonds, Fiscal 2015, Series 2015-BB-1, 0.16% 20491 | 7,500 | 7,500 | ||||||
| State of New York, New York City Municipal Water Fin. Auth., Water and Sewer System Second General Resolution Rev. Bonds, Fiscal 2016, Series 2016-AA-1, 0.16% 20481 | 13,300 | 13,300 | ||||||
| American Funds Tax-Exempt Funds | 23 |
Limited Term Tax-Exempt Bond Fund of America
| Short-term securities (continued) | Principal amount (000) | Value (000) | ||||||
| State of New York, New York City Transitional Fin. Auth., Future Tax Secured Bonds, Fiscal 2010, Series 2010-F-5, 0.19% 20351 | $ | 4,900 | $ | 4,900 | ||||
| State of New York, New York City Transitional Fin. Auth., Future Tax Secured Bonds, Fiscal 2016, Series 2016-A-4, 0.16% 20411 | 9,650 | 9,650 | ||||||
| State of New York, New York City Transitional Fin. Auth., Future Tax Secured Rev. Ref. Bonds, Fiscal 2015, Series 2015-E-4, 0.16% 20451 | 7,500 | 7,500 | ||||||
| State of New York, New York City Transitional Fin. Auth., Recovery Bonds, Fiscal 2003, Series 2003-C-5, 0.16% 20311 | 1,000 | 1,000 | ||||||
| State of South Carolina, Jobs-Econ. Dev. Auth., Hospital Rev. Bonds (Prisma Health Obligated Group), Series 2018-B, 0.14% 20481 | 50,875 | 50,875 | ||||||
| State of Texas, County of Harris, IAM Commercial Paper, Series 2020-A-1, 0.20% 8/6/2020 | 1,275 | 1,275 | ||||||
| State of Texas, County of Harris, IAM Commercial Paper, Series 2020-A-1, 0.20% 8/6/2020 | 550 | 550 | ||||||
| State of Texas, County of Harris, IAM Commercial Paper, Series 2020-C, 0.15% 8/6/2020 | 3,850 | 3,850 | ||||||
| State of Texas, County of Harris, IAM Commercial Paper, Series 2020-C, 0.20% 8/6/2020 | 1,600 | 1,600 | ||||||
| State of Texas, County of Harris, IAM Commercial Paper, Series 2020-D, 0.15% 8/6/2020 | 3,950 | 3,950 | ||||||
| State of Texas, County of Harris, IAM Commercial Paper, Series 2020-D, 0.20% 8/6/2020 | 1,570 | 1,570 | ||||||
| State of Texas, County of Harris, IAM Commercial Paper, Series 2020-D-2, 0.17% 8/5/2020 | 13,110 | 13,110 | ||||||
| State of Texas, Tax and Rev. Anticipation Notes, Series 2019, 4.00% 8/27/2020 | 14,555 | 14,591 | ||||||
| State of Texas, Board of Regents of the University of Texas System, IAM Commercial Paper, Series 2020-A, 0.15% 8/18/2020 | 10,000 | 10,000 | ||||||
| State of Texas, Board of Regents of the University of Texas System, IAM Commercial Paper, Series 2020-A, 0.19% 8/11/2020 | 10,000 | 10,000 | ||||||
| State of Texas, Board of Regents of the University of Texas System, IAM Commercial Paper, Series 2020-A, 0.40% 8/10/2020 | 5,500 | 5,500 | ||||||
| State of Texas, Board of Regents of the University of Texas System, Rev. Fncg. System Bonds, Series 2008-B, 0.15% 20251 | 15,000 | 15,000 | ||||||
| State of Texas, Veterans Bonds, Series 2019, 0.28% 20501 | 14,485 | 14,485 | ||||||
| Other securities | 167,331 | |||||||
| Total short-term securities (cost: $826,135,000) | 826,054 | |||||||
| Total investment securities 101.31% (cost: $5,431,212,000) | 5,615,855 | |||||||
| Other assets less liabilities (1.31)% | (72,413 | ) | ||||||
| Net assets 100.00% | $ | 5,543,442 | ||||||
This summary investment portfolio is designed to streamline the report and help investors better focus on the fund’s principal holdings. See the inside back cover for details on how to obtain a complete schedule of portfolio holdings.
“Other securities” includes all issues that are not disclosed separately in the summary investment portfolio.
| 1 | Coupon rate may change periodically. Reference rate and spread are as of the most recent information available. Some coupon rates are determined by the issuer or agent based on current market conditions; therefore, the reference rate and spread are not available. For short-term securities, the date of the next scheduled coupon rate change is considered to be the maturity date. |
| 2 | Acquired in a transaction exempt from registration under Rule 144A of the Securities Act of 1933. May be resold in the U.S. in transactions exempt from registration, normally to qualified institutional buyers. The total value of all such securities, including those in “Other securities,” was $53,688,000, which represented .97% of the net assets of the fund. |
| 3 | For short-term securities, the mandatory put date is considered to be the maturity date. |
| 24 | American Funds Tax-Exempt Funds |
Limited Term Tax-Exempt Bond Fund of America
Key to abbreviations and symbol
Agcy. = Agency
AMT = Alternative Minimum Tax
Auth. = Authority
Certs. of Part. = Certificates of Participation
Dept. = Department
Dev. = Development
Dist. = District
Econ. = Economic
Fac. = Facility
Facs. = Facilities
Fin. = Finance
Fncg. = Financing
G.O. = General Obligation
IAM = Interest at Maturity
LIBOR = London Interbank Offered Rate
LOC = Letter of Credit
Preref. = Prerefunded
Redev. = Redevelopment
Ref. = Refunding
Rev. = Revenue
SIFMA = Securities Industry and Financial Markets Association
USD/$ = U.S. dollars
See notes to financial statements.
| American Funds Tax-Exempt Funds | 25 |
The Tax-Exempt Bond Fund of America
Summary investment portfolio July 31, 2020
| Portfolio quality summary* | Percent of net assets |

| * | Bond ratings, which typically range from AAA/Aaa (highest) to D (lowest), are assigned by credit rating agencies such as Standard & Poor’s, Moody’s and/or Fitch as an indication of an issuer’s creditworthiness. In assigning a credit rating to a security, the fund looks specifically to the ratings assigned to the issuer of the security by Standard & Poor’s, Moody’s and/or Fitch. If agency ratings differ, the security will be considered to have received the highest of those ratings, consistent with the fund’s investment policies. Securities in the “unrated” category (above) have not been rated by a rating agency; however, the investment adviser performs its own credit analysis and assigns comparable ratings that are used for compliance with the fund’s investment policies. The ratings are not covered by the Report of Independent Registered Public Accounting Firm. |
| Bonds, notes & other debt instruments 91.61% | Principal amount (000) | Value (000) | ||||||
| Alabama 1.07% | ||||||||
| Black Belt Energy Gas Dist., Gas Supply Rev. Bonds, Series 2017-A, 4.00% 2047 (put 2022) | $ | 38,750 | $ | 41,053 | ||||
| Other securities | 231,856 | |||||||
| 272,909 | ||||||||
| Arizona 1.72% | ||||||||
| Industrial Dev. Auth., Municipal Certificates, Series 2019-2, Class A, 3.625% 2033 | 45,554 | 48,095 | ||||||
| Other securities | 391,469 | |||||||
| 439,564 | ||||||||
| California 5.73% | ||||||||
| Health Facs. Fncg. Auth., Rev. Bonds (Kaiser Permanente), Series 2017-A-2, 5.00% 2047 | 36,640 | 59,514 | ||||||
| Other securities | 1,404,460 | |||||||
| 1,463,974 | ||||||||
| District of Columbia 1.46% | ||||||||
| Metropolitan Washington DC Airports Auth., Dulles Toll Road Rev. Ref. Bonds (Dulles Metrorail and Capital Improvement Projects), Series 2019-B, Assured Guaranty Municipal insured, 4.00% 2053 | 34,470 | 38,516 | ||||||
| Other securities | 334,406 | |||||||
| 372,922 | ||||||||
| Florida 6.15% | ||||||||
| Central Florida Expressway Auth., Rev. Bonds, Series 2019-B, 5.00% 2044 | 32,000 | 40,630 | ||||||
| County of Miami-Dade, Water and Sewer System Rev. Ref. Bonds, Series 2019-B, 4.00% 2049 | 38,000 | 44,806 | ||||||
| Tampa-Hillsborough County Expressway Auth., Rev. Ref. Bonds, Series 2017-B, 4.00% 2042 | 41,550 | 47,613 | ||||||
| Other securities | 1,438,527 | |||||||
| 1,571,576 | ||||||||
| Georgia 2.51% | ||||||||
| City of Atlanta, Airport Passenger Fac. Charge and General Rev. Bonds, Series 2019-C, 5.00% 2039 | 30,530 | 39,109 | ||||||
| Main Street Natural Gas, Inc., Gas Supply Rev. Bonds, Series 2019-B, 4.00% 2049 (put 2024) | 35,885 | 40,781 | ||||||
| Municipal Electric Auth., Plant Vogtle Units 3 and 4 Project J Bonds, Series 2019-A, 5.00% 2049 | 67,060 | 80,624 | ||||||
| Municipal Electric Auth., Plant Vogtle Units 3 and 4 Project M Bonds, Series 2019-A, 5.00% 2063 | 32,495 | 38,567 | ||||||
| Other securities | 441,738 | |||||||
| 640,819 | ||||||||
| 26 | American Funds Tax-Exempt Funds |
The Tax-Exempt Bond Fund of America
| Principal amount (000) | Value (000) | |||||||
| Illinois 12.13% | ||||||||
| Build Illinois Bonds, Sales Tax Rev. Bonds, Series 2002, FGIC-National insured, 6.00% 2023 | $ | 1,000 | $ | 1,110 | ||||
| Build Illinois Bonds, Sales Tax Rev. Bonds, Series 2010, 5.00% 2021 | 6,030 | 6,184 | ||||||
| Build Illinois Bonds, Sales Tax Rev. Bonds, Series 2013, 5.00% 2026 | 11,040 | 11,860 | ||||||
| Build Illinois Bonds, Sales Tax Rev. Bonds, Series 2018-A, BAM insured, 5.00% 2029 | 3,600 | 4,321 | ||||||
| Build Illinois Bonds, Sales Tax Rev. Bonds, Series 2018-B, 5.00% 2033 | 3,500 | 3,948 | ||||||
| Build Illinois Bonds, Sales Tax Rev. Ref. Bonds, Series 2016-C, 4.00% 2024 | 3,070 | 3,286 | ||||||
| Build Illinois Bonds, Sales Tax Rev. Ref. Bonds, Series 2016-C, 4.00% 2027 | 13,430 | 14,595 | ||||||
| Build Illinois Bonds, Sales Tax Rev. Ref. Bonds, Series 2016-D, 5.00% 2025 | 2,135 | 2,411 | ||||||
| Build Illinois Bonds, Sales Tax Rev. Ref. Bonds, Series 2016-D, 5.00% 2026 | 1,010 | 1,159 | ||||||
| Build Illinois Bonds, Sales Tax Rev. Ref. Bonds, Series 2016-D, 5.00% 2027 | 1,275 | 1,455 | ||||||
| Build Illinois Bonds, Sales Tax Rev. Ref. Bonds, Series 2016-D, 5.00% 2029 | 7,000 | 7,879 | ||||||
| City of Chicago, G.O. Bonds (City Colleges of Chicago Capital Improvement Project), Capital Appreciation Bonds, Series 1999, National insured, 0% 2031 | 7,000 | 5,148 | ||||||
| City of Chicago, G.O. Bonds (Neighborhoods Alive 21 Program), Series 2002-B, 5.00% 2024 | 1,285 | 1,384 | ||||||
| City of Chicago, G.O. Bonds, Series 2003-B, 5.00% 2024 | 2,060 | 2,219 | ||||||
| City of Chicago, G.O. Bonds, Series 2015-A, 5.25% 2028 | 2,000 | 2,187 | ||||||
| City of Chicago, G.O. Bonds, Series 2015-A, 5.50% 2033 | 3,000 | 3,275 | ||||||
| City of Chicago, G.O. Bonds, Series 2019-A, 5.00% 2044 | 5,000 | 5,472 | ||||||
| City of Chicago, G.O. Bonds, Series 2019-A, 5.50% 2035 | 2,000 | 2,300 | ||||||
| City of Chicago, G.O. Project and Rev. Ref. Bonds, Capital Appreciation Bonds, Series 2008-C, 0% 2031 | 110 | 76 | ||||||
| City of Chicago, G.O. Project and Rev. Ref. Bonds, Series 2003-B, 5.00% 2022 | 1,320 | 1,363 | ||||||
| City of Chicago, G.O. Project and Rev. Ref. Bonds, Series 2003-B, 5.00% 2026 | 1,795 | 1,958 | ||||||
| City of Chicago, G.O. Project and Rev. Ref. Bonds, Series 2005-D, 5.50% 2034 | 3,675 | 4,003 | ||||||
| City of Chicago, G.O. Project and Rev. Ref. Bonds, Series 2014-A, 5.00% 2023 | 830 | 876 | ||||||
| City of Chicago, G.O. Project and Rev. Ref. Bonds, Series 2014-A, 5.25% 2030 | 5,490 | 5,870 | ||||||
| City of Chicago, G.O. Project and Rev. Ref. Bonds, Series 2017-A, 5.625% 2029 | 5,755 | 6,667 | ||||||
| City of Chicago, G.O. Project and Rev. Ref. Bonds, Series 2017-A, 5.625% 2030 | 3,000 | 3,463 | ||||||
| City of Chicago, G.O. Project and Rev. Ref. Bonds, Series 2017-A, 6.00% 2038 | 20,000 | 23,221 | ||||||
| City of Chicago, G.O. Rev. Ref. Bonds, Series 2015-C, 5.00% 2024 | 2,500 | 2,692 | ||||||
| City of Chicago, G.O. Rev. Ref. Bonds, Series 2015-C, 5.00% 2025 | 4,000 | 4,380 | ||||||
| City of Chicago, G.O. Rev. Ref. Bonds, Series 2015-C, 5.00% 2027 | 2,000 | 2,204 | ||||||
| City of Chicago, G.O. Rev. Ref. Bonds, Series 2015-C, 5.00% 2038 | 4,730 | 5,066 | ||||||
| City of Chicago, G.O. Rev. Ref. Bonds, Series 2020-A, 5.00% 2025 | 5,000 | 5,476 | ||||||
| City of Chicago, G.O. Rev. Ref. Bonds, Series 2020-A, 5.00% 2026 | 5,000 | 5,550 | ||||||
| City of Chicago, G.O. Rev. Ref. Bonds, Series 2020-A, 5.00% 2028 | 8,000 | 9,017 | ||||||
| City of Chicago, G.O. Rev. Ref. Bonds, Series 2020-A, 5.00% 2029 | 8,450 | 9,580 | ||||||
| City of Chicago, O’Hare International Airport, General Airport Rev. Bonds, Series 2018-B, 5.00% 2053 | 35,025 | 42,346 | ||||||
| City of Chicago, Wastewater Transmission Rev. Bonds, Series 2012, 5.00% 2042 | 7,775 | 8,110 | ||||||
| City of Chicago, Wastewater Transmission Rev. Ref. Bonds, Capital Appreciation Bonds, Series 1998-A, National insured, 0% 2025 | 210 | 191 | ||||||
| City of Chicago, Wastewater Transmission Rev. Ref. Bonds, Capital Appreciation Bonds, Series 1998-A, National insured, 0% 2026 | 20 | 18 | ||||||
| City of Chicago, Wastewater Transmission Rev. Ref. Bonds, Capital Appreciation Bonds, Series 1998-A, National insured, 0% 2027 | 1,760 | 1,505 | ||||||
| City of Chicago, Wastewater Transmission Rev. Ref. Bonds, Capital Appreciation Bonds, Series 1998-A, National insured, 0% 2028 | 4,245 | 3,516 | ||||||
| City of Chicago, Wastewater Transmission Rev. Ref. Bonds, Series 2001, Assured Guaranty Municipal insured, 5.50% 2030 | 800 | 1,037 | ||||||
| City of Chicago, Wastewater Transmission Rev. Ref. Bonds, Series 2008-C, 5.00% 2021 | 1,000 | 1,018 | ||||||
| City of Chicago, Wastewater Transmission Rev. Ref. Bonds, Series 2008-C, 5.00% 2023 | 1,975 | 2,152 | ||||||
| City of Chicago, Wastewater Transmission Rev. Ref. Bonds, Series 2008-C, 5.00% 2024 | 2,500 | 2,813 | ||||||
| City of Chicago, Wastewater Transmission Rev. Ref. Bonds, Series 2008-C, 5.00% 2025 | 4,500 | 5,210 | ||||||
| City of Chicago, Wastewater Transmission Rev. Ref. Bonds, Series 2008-C, 5.00% 2026 | 2,300 | 2,676 | ||||||
| City of Chicago, Wastewater Transmission Rev. Ref. Bonds, Series 2008-C, 5.00% 2027 | 1,000 | 1,161 | ||||||
| City of Chicago, Wastewater Transmission Rev. Ref. Bonds, Series 2008-C, 5.00% 2030 | 1,000 | 1,155 | ||||||
| City of Chicago, Wastewater Transmission Rev. Ref. Bonds, Series 2008-C, 5.00% 2031 | 2,500 | 2,876 | ||||||
| City of Chicago, Wastewater Transmission Rev. Ref. Bonds, Series 2008-C, 5.00% 2032 | 3,000 | 3,439 | ||||||
| City of Chicago, Wastewater Transmission Rev. Ref. Bonds, Series 2008-C, 5.00% 2033 | 2,000 | 2,284 | ||||||
| City of Chicago, Wastewater Transmission Rev. Ref. Bonds, Series 2008-C, 5.00% 2039 | 1,000 | 1,128 | ||||||
| City of Chicago, Wastewater Transmission Rev. Ref. Bonds, Series 2014, 5.00% 2023 | 100 | 109 | ||||||
| City of Chicago, Wastewater Transmission Rev. Ref. Bonds, Series 2017-A, 5.00% 2047 | 21,165 | 24,209 | ||||||
| American Funds Tax-Exempt Funds | 27 |
The Tax-Exempt Bond Fund of America
| Bonds, notes & other debt instruments (continued) | Principal amount (000) | Value (000) | ||||||
| Illinois (continued) | ||||||||
| City of Chicago, Wastewater Transmission Rev. Ref. Bonds, Series 2017-B, 5.00% 2031 | $ | 5,000 | $ | 6,010 | ||||
| City of Chicago, Wastewater Transmission Rev. Ref. Bonds, Series 2017-B, 5.00% 2032 | 7,600 | 9,052 | ||||||
| City of Chicago, Wastewater Transmission Rev. Ref. Bonds, Series 2017-B, 5.00% 2034 | 9,000 | 10,603 | ||||||
| City of Chicago, Wastewater Transmission Rev. Ref. Bonds, Series 2017-B, 5.00% 2038 | 3,915 | 4,572 | ||||||
| City of Chicago, Water Rev. Bonds, Series 2004, 5.00% 2023 | 1,750 | 1,974 | ||||||
| City of Chicago, Water Rev. Bonds, Series 2004, 5.00% 2024 | 1,000 | 1,158 | ||||||
| City of Chicago, Water Rev. Bonds, Series 2004, 5.00% 2025 | 10,275 | 12,108 | ||||||
| City of Chicago, Water Rev. Bonds, Series 2004, 5.00% 2026 | 2,125 | 2,558 | ||||||
| City of Chicago, Water Rev. Bonds, Series 2012, 4.00% 2020 | 625 | 630 | ||||||
| City of Chicago, Water Rev. Bonds, Series 2012, 5.00% 2024 | 1,200 | 1,307 | ||||||
| City of Chicago, Water Rev. Bonds, Series 2012, 5.00% 2026 | 965 | 1,047 | ||||||
| City of Chicago, Water Rev. Bonds, Series 2014, 5.00% 2022 | 530 | 578 | ||||||
| City of Chicago, Water Rev. Bonds, Series 2014, 5.00% 2030 | 4,750 | 5,405 | ||||||
| City of Chicago, Water Rev. Bonds, Series 2014, 5.00% 2031 | 5,135 | 5,825 | ||||||
| City of Chicago, Water Rev. Ref. Bonds, Series 2012, 5.00% 2042 | 21,875 | 23,298 | ||||||
| City of Chicago, Water Rev. Ref. Bonds, Series 2014, 5.00% 2029 | 1,110 | 1,267 | ||||||
| City of Chicago, Water Rev. Ref. Bonds, Series 2014, 5.00% 2039 | 7,500 | 8,374 | ||||||
| City of Chicago, Water Rev. Ref. Bonds, Series 2014, 5.00% 2044 | 3,000 | 3,324 | ||||||
| City of Chicago, Water Rev. Ref. Bonds, Series 2017-2, Assured Guaranty Municipal insured, 5.00% 2031 | 2,000 | 2,414 | ||||||
| Civic Center Bonds, Special State Obligation Bonds, Series 1991, AMBAC insured, 6.25% 2020 | 920 | 934 | ||||||
| Fin. Auth., Academic Fac. Lease Rev. Bonds (Provident Group - UIUC Properties LLC - University of Illinois at Urbana-Champaign Project), Series 2019-A, 5.00% 2032 | 580 | 735 | ||||||
| Fin. Auth., Academic Fac. Lease Rev. Bonds (Provident Group - UIUC Properties LLC - University of Illinois at Urbana-Champaign Project), Series 2019-A, 5.00% 2037 | 780 | 968 | ||||||
| Fin. Auth., Academic Fac. Lease Rev. Bonds (Provident Group - UIUC Properties LLC - University of Illinois at Urbana-Champaign Project), Series 2019-A, 5.00% 2038 | 760 | 941 | ||||||
| Fin. Auth., Academic Fac. Lease Rev. Bonds (Provident Group - UIUC Properties LLC - University of Illinois at Urbana-Champaign Project), Series 2019-A, 5.00% 2044 | 3,250 | 3,953 | ||||||
| Fin. Auth., Academic Fac. Lease Rev. Bonds (Provident Group - UIUC Properties LLC - University of Illinois at Urbana-Champaign Project), Series 2019-A, 5.00% 2049 | 5,455 | 6,593 | ||||||
| Fin. Auth., Academic Fac. Lease Rev. Bonds (Provident Group - UIUC Properties LLC - University of Illinois at Urbana-Champaign Project), Series 2019-A, 5.00% 2051 | 1,000 | 1,207 | ||||||
| Fin. Auth., Charter School Rev. Ref. and Improvement Rev. Bonds (Chicago International Charter School Project), Series 2017, 5.00% 2037 | 1,000 | 1,090 | ||||||
| Fin. Auth., Health Facs. Rev. Bonds (UnityPoint Health), Series 2016-D, 4.00% 2046 | 2,000 | 2,174 | ||||||
| Fin. Auth., Rev. Bonds (Advocate Health Care Network), Series 2008-A-3, 5.00% 2030 | 3,325 | 4,029 | ||||||
| Fin. Auth., Rev. Bonds (Advocate Health Care Network), Series 2012, 5.00% 2042 (preref. 2022) | 1,000 | 1,086 | ||||||
| Fin. Auth., Rev. Bonds (Advocate Health Care Network), Series 2015-B, 5.00% 2027 | 225 | 266 | ||||||
| Fin. Auth., Rev. Bonds (Advocate Health Care Network), Series 2015-B, 5.00% 2027 (preref. 2025) | 765 | 932 | ||||||
| Fin. Auth., Rev. Bonds (Art Institute of Chicago), Series 2012-A, 5.00% 2034 (preref. 2022) | 1,990 | 2,141 | ||||||
| Fin. Auth., Rev. Bonds (Art Institute of Chicago), Series 2012-A, 5.00% 2034 (preref. 2022) | 30 | 32 | ||||||
| Fin. Auth., Rev. Bonds (Art Institute of Chicago), Series 2016, 4.00% 2038 | 3,850 | 4,283 | ||||||
| Fin. Auth., Rev. Bonds (Art Institute of Chicago), Series 2016, 5.00% 2030 | 2,500 | 3,044 | ||||||
| Fin. Auth., Rev. Bonds (Clean Water Initiative Revolving Fund), Series 2016, 4.00% 2025 | 2,915 | 3,427 | ||||||
| Fin. Auth., Rev. Bonds (Clean Water Initiative Revolving Fund), Series 2016, 4.00% 2026 | 5,300 | 6,286 | ||||||
| Fin. Auth., Rev. Bonds (Clean Water Initiative Revolving Fund), Series 2016, 5.00% 2027 | 5,000 | 6,232 | ||||||
| Fin. Auth., Rev. Bonds (Clean Water Initiative Revolving Fund), Series 2016, 5.00% 2028 | 6,410 | 7,978 | ||||||
| Fin. Auth., Rev. Bonds (Clean Water Initiative Revolving Fund), Series 2016, 5.00% 2029 | 8,315 | 10,344 | ||||||
| Fin. Auth., Rev. Bonds (Clean Water Initiative Revolving Fund), Series 2016, 5.00% 2029 | 2,700 | 3,359 | ||||||
| Fin. Auth., Rev. Bonds (Clean Water Initiative Revolving Fund), Series 2016, 5.00% 2030 | 6,200 | 7,690 | ||||||
| Fin. Auth., Rev. Bonds (Clean Water Initiative Revolving Fund), Series 2016, 5.00% 2031 | 3,580 | 4,425 | ||||||
| Fin. Auth., Rev. Bonds (Clean Water Initiative Revolving Fund), Series 2017, 5.00% 2026 | 4,875 | 6,082 | ||||||
| Fin. Auth., Rev. Bonds (Clean Water Initiative Revolving Fund), Series 2017, 5.00% 2029 | 4,000 | 5,106 | ||||||
| Fin. Auth., Rev. Bonds (Clean Water Initiative Revolving Fund), Series 2017, 5.00% 2029 | 2,000 | 2,553 | ||||||
| Fin. Auth., Rev. Bonds (Clean Water Initiative Revolving Fund), Series 2017, 5.00% 2030 | 7,420 | 9,454 | ||||||
| Fin. Auth., Rev. Bonds (Clean Water Initiative Revolving Fund), Series 2017, 5.00% 2030 | 3,500 | 4,450 | ||||||
| Fin. Auth., Rev. Bonds (Clean Water Initiative Revolving Fund), Series 2017, 5.00% 2031 | 6,080 | 7,697 | ||||||
| Fin. Auth., Rev. Bonds (Clean Water Initiative Revolving Fund), Series 2017, 5.00% 2032 | 5,005 | 6,303 | ||||||
| Fin. Auth., Rev. Bonds (Clean Water Initiative Revolving Fund), Series 2017, 5.00% 2033 | 5,000 | 6,269 | ||||||
| Fin. Auth., Rev. Bonds (Clean Water Initiative Revolving Fund), Series 2017, 5.00% 2034 | 5,000 | 6,256 | ||||||
| 28 | American Funds Tax-Exempt Funds |
The Tax-Exempt Bond Fund of America
| Principal amount (000) | Value (000) | |||||||
| Fin. Auth., Rev. Bonds (Clean Water Initiative Revolving Fund), Series 2017, 5.00% 2035 | $ | 8,180 | $ | 10,204 | ||||
| Fin. Auth., Rev. Bonds (Clean Water Initiative Revolving Fund), Series 2017, 5.00% 2036 | 700 | 871 | ||||||
| Fin. Auth., Rev. Bonds (DePaul University), Series 2011-A, 6.125% 2040 (preref. 2021) | 10,000 | 10,392 | ||||||
| Fin. Auth., Rev. Bonds (DePaul University), Series 2016, 5.00% 2030 | 1,000 | 1,194 | ||||||
| Fin. Auth., Rev. Bonds (DePaul University), Series 2016, 5.00% 2032 | 1,000 | 1,183 | ||||||
| Fin. Auth., Rev. Bonds (DePaul University), Series 2016, 5.00% 2033 | 1,150 | 1,355 | ||||||
| Fin. Auth., Rev. Bonds (DePaul University), Series 2016, 5.00% 2034 | 1,310 | 1,541 | ||||||
| Fin. Auth., Rev. Bonds (DePaul University), Series 2016, 5.00% 2036 | 1,000 | 1,169 | ||||||
| Fin. Auth., Rev. Bonds (DePaul University), Series 2016, 5.00% 2041 | 1,000 | 1,158 | ||||||
| Fin. Auth., Rev. Bonds (Edward-Elmhurst Healthcare), Series 2017-A, 5.00% 2027 | 925 | 1,130 | ||||||
| Fin. Auth., Rev. Bonds (Edward-Elmhurst Healthcare), Series 2017-A, 5.00% 2028 | 1,480 | 1,800 | ||||||
| Fin. Auth., Rev. Bonds (Edward-Elmhurst Healthcare), Series 2017-A, 5.00% 2029 | 3,000 | 3,636 | ||||||
| Fin. Auth., Rev. Bonds (Edward-Elmhurst Healthcare), Series 2017-A, 5.00% 2030 | 5,100 | 6,145 | ||||||
| Fin. Auth., Rev. Bonds (Edward-Elmhurst Healthcare), Series 2017-A, 5.00% 2031 | 3,000 | 3,600 | ||||||
| Fin. Auth., Rev. Bonds (Edward-Elmhurst Healthcare), Series 2017-A, 5.00% 2032 | 2,500 | 2,986 | ||||||
| Fin. Auth., Rev. Bonds (Edward-Elmhurst Healthcare), Series 2017-A, 5.00% 2033 | 9,000 | 10,697 | ||||||
| Fin. Auth., Rev. Bonds (Edward-Elmhurst Healthcare), Series 2017-A, 5.00% 2034 | 3,000 | 3,554 | ||||||
| Fin. Auth., Rev. Bonds (Edward-Elmhurst Healthcare), Series 2017-A, 5.00% 2035 | 6,710 | 7,930 | ||||||
| Fin. Auth., Rev. Bonds (Edward-Elmhurst Healthcare), Series 2017-A, 5.00% 2036 | 7,000 | 8,248 | ||||||
| Fin. Auth., Rev. Bonds (Franciscan Communities, Inc.), Series 2013-A, 5.125% 2043 | 1,025 | 1,044 | ||||||
| Fin. Auth., Rev. Bonds (Friendship Village Schaumburg), Series 2017, 5.125% 2045 | 2,225 | 1,964 | ||||||
| Fin. Auth., Rev. Bonds (Ingalls Health System), Series 2013, 5.00% 2043 (preref. 2022) | 2,030 | 2,187 | ||||||
| Fin. Auth., Rev. Bonds (Lifespace Communities, Inc.), Series 2015-A, 5.00% 2024 | 245 | 261 | ||||||
| Fin. Auth., Rev. Bonds (Lifespace Communities, Inc.), Series 2015-A, 5.00% 2025 | 760 | 821 | ||||||
| Fin. Auth., Rev. Bonds (Lifespace Communities, Inc.), Series 2015-A, 5.00% 2030 | 1,180 | 1,256 | ||||||
| Fin. Auth., Rev. Bonds (Lifespace Communities, Inc.), Series 2015-A, 5.00% 2035 | 1,350 | 1,417 | ||||||
| Fin. Auth., Rev. Bonds (Lutheran Life Communities Obligated Group), Series 2019-A, 4.00% 2022 | 390 | 394 | ||||||
| Fin. Auth., Rev. Bonds (Mercy Health Corp.), Series 2016, 4.00% 2036 | 2,420 | 2,631 | ||||||
| Fin. Auth., Rev. Bonds (Mercy Health Corp.), Series 2016, 5.00% 2026 | 3,000 | 3,575 | ||||||
| Fin. Auth., Rev. Bonds (Mercy Health Corp.), Series 2016, 5.00% 2046 | 39,370 | 44,669 | ||||||
| Fin. Auth., Rev. Bonds (Northshore University Heathsystem), Series 2020-A, 4.00% 2036 | 3,000 | 3,530 | ||||||
| Fin. Auth., Rev. Bonds (Northshore University Heathsystem), Series 2020-A, 4.00% 2037 | 3,000 | 3,518 | ||||||
| Fin. Auth., Rev. Bonds (Northshore University Heathsystem), Series 2020-A, 4.00% 2038 | 4,000 | 4,676 | ||||||
| Fin. Auth., Rev. Bonds (Northshore University Heathsystem), Series 2020-A, 4.00% 2039 | 6,000 | 6,993 | ||||||
| Fin. Auth., Rev. Bonds (Northshore University Heathsystem), Series 2020-A, 4.00% 2040 | 3,000 | 3,484 | ||||||
| Fin. Auth., Rev. Bonds (Northshore University Heathsystem), Series 2020-A, 4.00% 2041 | 3,750 | 4,340 | ||||||
| Fin. Auth., Rev. Bonds (Northwest Community Hospital), Series 2016-A, 4.00% 2037 | 11,520 | 12,711 | ||||||
| Fin. Auth., Rev. Bonds (Northwest Community Hospital), Series 2016-A, 4.00% 2038 | 6,140 | 6,761 | ||||||
| Fin. Auth., Rev. Bonds (Northwest Community Hospital), Series 2016-A, 5.00% 2026 | 2,000 | 2,425 | ||||||
| Fin. Auth., Rev. Bonds (Northwest Community Hospital), Series 2016-A, 5.00% 2032 | 3,290 | 3,885 | ||||||
| Fin. Auth., Rev. Bonds (Northwest Community Hospital), Series 2016-A, 5.00% 2033 | 1,425 | 1,676 | ||||||
| Fin. Auth., Rev. Bonds (Northwest Community Hospital), Series 2016-A, 5.00% 2034 | 3,240 | 3,803 | ||||||
| Fin. Auth., Rev. Bonds (Northwest Community Hospital), Series 2016-A, 5.00% 2035 | 3,335 | 3,903 | ||||||
| Fin. Auth., Rev. Bonds (Northwestern Memorial Healthcare), Series 2017-A, 5.00% 2030 | 1,000 | 1,277 | ||||||
| Fin. Auth., Rev. Bonds (Northwestern Memorial Healthcare), Series 2017-A, 5.00% 2042 | 7,000 | 8,600 | ||||||
| Fin. Auth., Rev. Bonds (Northwestern Memorial Healthcare), Series 2017-B, 5.00% 2057 (put 2022) | 8,600 | 9,535 | ||||||
| Fin. Auth., Rev. Bonds (OSF Healthcare System), Series 2012-A, 5.00% 2028 | 2,275 | 2,429 | ||||||
| Fin. Auth., Rev. Bonds (OSF Healthcare System), Series 2016, 3.25% 2039 | 4,000 | 4,133 | ||||||
| Fin. Auth., Rev. Bonds (OSF Healthcare System), Series 2016, 5.00% 2028 | 2,450 | 2,947 | ||||||
| Fin. Auth., Rev. Bonds (Presbyterian Homes Obligated Group), Series 2016-A, 5.00% 2025 | 2,345 | 2,651 | ||||||
| Fin. Auth., Rev. Bonds (Presbyterian Homes Obligated Group), Series 2016-A, 5.00% 2027 | 5,000 | 5,793 | ||||||
| Fin. Auth., Rev. Bonds (Presbyterian Homes Obligated Group), Series 2016-A, 5.00% 2028 | 3,250 | 3,749 | ||||||
| Fin. Auth., Rev. Bonds (Presbyterian Homes Obligated Group), Series 2016-A, 5.00% 2030 | 1,375 | 1,572 | ||||||
| Fin. Auth., Rev. Bonds (Presbyterian Homes Obligated Group), Series 2016-A, 5.00% 2031 | 1,125 | 1,280 | ||||||
| Fin. Auth., Rev. Bonds (Presbyterian Homes Obligated Group), Series 2016-B, (1-month USD-LIBOR x 0.70 + 1.35%) 1.469% 2036 (put 2021)1 | 1,775 | 1,776 | ||||||
| Fin. Auth., Rev. Bonds (Presence Health Network), Series 2016-C, 4.00% 2041 | 17,970 | 20,183 | ||||||
| Fin. Auth., Rev. Bonds (Presence Health Network), Series 2016-C, 4.00% 2041 (preref. 2027) | 730 | 896 | ||||||
| Fin. Auth., Rev. Bonds (Presence Health Network), Series 2016-C, 4.00% 2041 (preref. 2027) | 5 | 6 | ||||||
| Fin. Auth., Rev. Bonds (Presence Health Network), Series 2016-C, 5.00% 2027 | 1,875 | 2,356 | ||||||
| Fin. Auth., Rev. Bonds (Presence Health Network), Series 2016-C, 5.00% 2028 | 5,000 | 6,266 | ||||||
| Fin. Auth., Rev. Bonds (Presence Health Network), Series 2016-C, 5.00% 2029 | 2,000 | 2,499 | ||||||
| American Funds Tax-Exempt Funds | 29 |
The Tax-Exempt Bond Fund of America
| Bonds, notes & other debt instruments (continued) | Principal amount (000) | Value (000) | ||||||
| Illinois (continued) | ||||||||
| Fin. Auth., Rev. Bonds (Presence Health Network), Series 2016-C, 5.00% 2030 | $ | 7,615 | $ | 9,476 | ||||
| Fin. Auth., Rev. Bonds (Presence Health Network), Series 2016-C, 5.00% 2031 | 3,000 | 3,717 | ||||||
| Fin. Auth., Rev. Bonds (Presence Health Network), Series 2016-C, 5.00% 2033 | 2,500 | 3,068 | ||||||
| Fin. Auth., Rev. Bonds (Presence Health Network), Series 2016-C, 5.00% 2034 | 1,895 | 2,316 | ||||||
| Fin. Auth., Rev. Bonds (Presence Health Network), Series 2016-C, 5.00% 2036 | 6,145 | 7,475 | ||||||
| Fin. Auth., Rev. Bonds (Presence Health Network), Series 2016-C, 5.00% 2041 | 2,000 | 2,401 | ||||||
| Fin. Auth., Rev. Bonds (Rehabilitation Institute of Chicago), Series 2013-A, 5.00% 2023 | 100 | 110 | ||||||
| Fin. Auth., Rev. Bonds (Rehabilitation Institute of Chicago), Series 2013-A, 6.00% 2043 | 2,700 | 3,018 | ||||||
| Fin. Auth., Rev. Bonds (Rush University Medical Center Obligated Group), Series 2015-A, 5.00% 2030 | 5,000 | 5,811 | ||||||
| Fin. Auth., Rev. Bonds (Rush University Medical Center Obligated Group), Series 2015-A, 5.00% 2034 | 2,500 | 2,871 | ||||||
| Fin. Auth., Rev. Bonds (Rush University Medical Center Obligated Group), Series 2015-A, 5.00% 2038 | 10,475 | 11,936 | ||||||
| Fin. Auth., Rev. Bonds (Rush University Medical Center Obligated Group), Series 2015-B, 5.00% 2034 | 2,595 | 2,980 | ||||||
| Fin. Auth., Rev. Bonds (Swedish Covenant Hospital), Series 2016-A, 5.00% 2032 | 3,500 | 4,461 | ||||||
| Fin. Auth., Rev. Bonds (The Cable Foundation), Series 2016-A, 5.00% 2045 | 26,575 | 31,588 | ||||||
| Fin. Auth., Rev. Bonds (University of Chicago Medical Center), Series 2016-A, 5.00% 2026 | 1,610 | 1,982 | ||||||
| Fin. Auth., Rev. Bonds (University of Chicago Medical Center), Series 2016-B, 5.00% 2035 | 5,150 | 6,158 | ||||||
| Fin. Auth., Rev. Green Bonds (Clean Water Initiative Revolving Fund), Series 2019, 5.00% 2036 | 7,000 | 9,257 | ||||||
| Fin. Auth., Rev. Ref. Bonds (Advocate Health Care Network), Series 2014, 5.00% 2033 | 8,500 | 10,069 | ||||||
| Fin. Auth., Rev. Ref. Bonds (Anne & Robert H. Lurie Children’s Hospital), Series 2017, 4.00% 2037 | 2,500 | 2,866 | ||||||
| Fin. Auth., Rev. Ref. Bonds (Anne & Robert H. Lurie Children’s Hospital), Series 2017, 5.00% 2034 | 1,000 | 1,206 | ||||||
| Fin. Auth., Rev. Ref. Bonds (Anne & Robert H. Lurie Children’s Hospital), Series 2017, 5.00% 2035 | 5,900 | 7,090 | ||||||
| Fin. Auth., Rev. Ref. Bonds (Ascension Health Senior Credit Group), Series 2012-A, 5.00% 2042 (preref. 2021) | 7,500 | 7,962 | ||||||
| Fin. Auth., Rev. Ref. Bonds (Benedictine University), Series 2017, 5.00% 2027 | 1,095 | 1,195 | ||||||
| Fin. Auth., Rev. Ref. Bonds (Benedictine University), Series 2017, 5.00% 2038 | 1,000 | 1,044 | ||||||
| Fin. Auth., Rev. Ref. Bonds (Christian Homes, Inc.), Series 2016, 5.00% 2040 | 1,275 | 1,321 | ||||||
| Fin. Auth., Rev. Ref. Bonds (DePaul University), Series 2013, 5.00% 2024 | 600 | 670 | ||||||
| Fin. Auth., Rev. Ref. Bonds (DePaul University), Series 2016-A, 4.00% 2040 | 7,500 | 8,172 | ||||||
| Fin. Auth., Rev. Ref. Bonds (DePaul University), Series 2016-A, 5.00% 2030 | 1,000 | 1,194 | ||||||
| Fin. Auth., Rev. Ref. Bonds (DePaul University), Series 2016-A, 5.00% 2035 | 1,000 | 1,173 | ||||||
| Fin. Auth., Rev. Ref. Bonds (Edward-Elmhurst Healthcare), Series 2018-A, 5.00% 2044 | 1,500 | 1,769 | ||||||
| Fin. Auth., Rev. Ref. Bonds (Field Museum of Natural History), Series 2019, 0.616% 2034 (put 2022)1 | 31,825 | 31,450 | ||||||
| Fin. Auth., Rev. Ref. Bonds (Loyola University of Chicago), Series 2012-B, 5.00% 2025 | 1,500 | 1,618 | ||||||
| Fin. Auth., Rev. Ref. Bonds (Loyola University of Chicago), Series 2012-B, 5.00% 2026 | 1,535 | 1,655 | ||||||
| Fin. Auth., Rev. Ref. Bonds (Loyola University of Chicago), Series 2012-B, 5.00% 2042 | 9,385 | 10,092 | ||||||
| Fin. Auth., Rev. Ref. Bonds (OSF Healthcare System), Series 2012-A, 5.00% 2022 | 1,290 | 1,371 | ||||||
| Fin. Auth., Rev. Ref. Bonds (OSF Healthcare System), Series 2015-A, 5.00% 2031 | 3,500 | 4,130 | ||||||
| Fin. Auth., Rev. Ref. Bonds (OSF Healthcare System), Series 2015-A, 5.00% 2032 | 3,500 | 4,113 | ||||||
| Fin. Auth., Rev. Ref. Bonds (OSF Healthcare System), Series 2015-A, 5.00% 2034 | 2,600 | 3,040 | ||||||
| Fin. Auth., Rev. Ref. Bonds (OSF Healthcare System), Series 2015-A, 5.00% 2045 | 26,890 | 30,846 | ||||||
| Fin. Auth., Rev. Ref. Bonds (Silver Cross Hospital and Medical Centers), Series 2015-C, 4.125% 2037 | 1,000 | 1,082 | ||||||
| Fin. Auth., Rev. Ref. Bonds (Silver Cross Hospital and Medical Centers), Series 2015-C, 5.00% 2035 | 6,745 | 7,702 | ||||||
| Fin. Auth., Rev. Ref. Bonds (Silver Cross Hospital and Medical Centers), Series 2015-C, 5.00% 2044 | 10,885 | 12,177 | ||||||
| Fin. Auth., Rev. Ref. Bonds (Southern Illinois Healthcare Enterprises, Inc.), Series 2017-C, 5.00% 2026 | 650 | 791 | ||||||
| Fin. Auth., Rev. Ref. Bonds (Southern Illinois Healthcare Enterprises, Inc.), Series 2017-C, 5.00% 2032 | 1,600 | 1,953 | ||||||
| Fin. Auth., Rev. Ref. Bonds (University of Chicago Medical Center), Series 2009-B, 5.00% 2025 | 6,975 | 6,989 | ||||||
| Fin. Auth., Rev. Ref. Bonds (University of Chicago Medical Center), Series 2009-B, 5.00% 2025 (preref. 2020) | 3,525 | 3,530 | ||||||
| 30 | American Funds Tax-Exempt Funds |
The Tax-Exempt Bond Fund of America
| Principal amount (000) | Value (000) | |||||||
| Fin. Auth., Rev. Ref. Bonds (University of Chicago Medical Center), Series 2009-B, 5.00% 2026 | $ | 2,660 | $ | 2,665 | ||||
| Fin. Auth., Rev. Ref. Bonds (University of Chicago Medical Center), Series 2009-B, 5.00% 2026 (preref. 2020) | 1,340 | 1,342 | ||||||
| Fin. Auth., Student Housing and Academic Fac. Rev. Bonds (CHF-Chicago, LLC - University of Illinois at Chicago Project), Series 2017-A, 5.00% 2047 | 1,200 | 1,217 | ||||||
| Fin. Auth., Student Housing Rev. Bonds (CHF-Cook, LLC - Northeastern Illinois University Project), Series 2015-A, 5.00% 2035 | 2,235 | 2,127 | ||||||
| Fin. Auth., Student Housing Rev. Bonds (CHF-Cook, LLC - Northeastern Illinois University Project), Series 2015-A, 5.00% 2047 | 1,265 | 1,123 | ||||||
| Fin. Auth., Student Housing Rev. Bonds (CHF-DeKalb II, LLC - Northern Illinois University Project), Series 2011, 6.875% 2043 | 40,015 | 41,100 | ||||||
| Fin. Auth., Student Housing Rev. Bonds (CHF-Normal, LLC - Illinois State University Project), Series 2011, 6.75% 2031 (preref. 2021) | 1,000 | 1,042 | ||||||
| Fin. Auth., Student Housing Rev. Bonds (CHF-Normal, LLC - Illinois State University Project), Series 2011, 7.00% 2043 (preref. 2021) | 12,500 | 13,039 | ||||||
| G.O. Bonds, Series 2010, Assured Guaranty Municipal insured, 5.00% 2022 | 590 | 591 | ||||||
| G.O. Bonds, Series 2012, 5.00% 2035 | 1,000 | 1,031 | ||||||
| G.O. Bonds, Series 2013, 5.50% 2024 | 2,500 | 2,733 | ||||||
| G.O. Bonds, Series 2013-A, Assured Guaranty Municipal insured, 5.00% 2022 | 1,055 | 1,104 | ||||||
| G.O. Bonds, Series 2014, 5.00% 2021 | 1,415 | 1,436 | ||||||
| G.O. Bonds, Series 2014, 5.00% 2024 | 2,795 | 3,069 | ||||||
| G.O. Bonds, Series 2014, 5.00% 2024 | 2,000 | 2,180 | ||||||
| G.O. Bonds, Series 2014, 5.00% 2026 | 2,000 | 2,185 | ||||||
| G.O. Bonds, Series 2014, 5.00% 2039 | 6,275 | 6,647 | ||||||
| G.O. Bonds, Series 2014, 5.00% 2039 | 5,100 | 5,425 | ||||||
| G.O. Bonds, Series 2016, 5.00% 2028 | 4,840 | 5,465 | ||||||
| G.O. Bonds, Series 2016, 5.00% 2033 | 7,200 | 7,996 | ||||||
| G.O. Bonds, Series 2016, 5.00% 2034 | 1,925 | 2,131 | ||||||
| G.O. Bonds, Series 2016, 5.00% 2037 | 7,500 | 8,220 | ||||||
| G.O. Bonds, Series 2016, 5.00% 2038 | 14,000 | 15,314 | ||||||
| G.O. Bonds, Series 2016, Assured Guaranty Municipal insured, 5.00% 2030 | 7,700 | 8,579 | ||||||
| G.O. Bonds, Series 2016, Assured Guaranty Municipal insured, 5.00% 2041 | 2,000 | �� | 2,158 | |||||
| G.O. Bonds, Series 2017-A, 5.00% 2023 | 5,875 | 6,395 | ||||||
| G.O. Bonds, Series 2017-A, 5.00% 2036 | 11,500 | 12,804 | ||||||
| G.O. Bonds, Series 2017-C, 5.00% 2029 | 22,440 | 25,622 | ||||||
| G.O. Bonds, Series 2017-D, 5.00% 2022 | 20 | 21 | ||||||
| G.O. Bonds, Series 2017-D, 5.00% 2023 | 10,320 | 11,193 | ||||||
| G.O. Bonds, Series 2017-D, BAM insured, 5.00% 2020 | 4,150 | 4,180 | ||||||
| G.O. Bonds, Series 2017-D, BAM insured, 5.00% 2021 | 26,580 | 27,532 | ||||||
| G.O. Bonds, Series 2017-D, BAM insured, 5.00% 2024 | 8,000 | 8,849 | ||||||
| G.O. Bonds, Series 2017-D, BAM insured, 5.00% 2026 | 35,355 | 40,233 | ||||||
| G.O. Bonds, Series 2017-D, BAM insured, 5.00% 2028 | 13,470 | 15,459 | ||||||
| G.O. Bonds, Series 2018-B, 5.00% 2025 | 5,000 | 5,593 | ||||||
| G.O. Bonds, Series 2019-A, 5.00% 2024 | 4,500 | 4,990 | ||||||
| G.O. Bonds, Series 2019-B, 4.00% 2038 | 2,000 | 2,070 | ||||||
| G.O. Rev. Ref. Bonds, Series 2007, 5.25% 2021 | 2,415 | 2,447 | ||||||
| G.O. Rev. Ref. Bonds, Series 2012, 4.00% 2025 | 1,360 | 1,403 | ||||||
| G.O. Rev. Ref. Bonds, Series 2012, 5.00% 2020 | 5,290 | 5,290 | ||||||
| G.O. Rev. Ref. Bonds, Series 2012, Assured Guaranty Municipal insured, 5.00% 2025 | 5,795 | 6,102 | ||||||
| G.O. Rev. Ref. Bonds, Series 2016, 5.00% 2027 | 8,250 | 9,460 | ||||||
| G.O. Rev. Ref. Bonds, Series 2016, 5.00% 2028 | 3,000 | 3,427 | ||||||
| G.O. Rev. Ref. Bonds, Series 2018-A, 5.00% 2024 | 2,000 | 2,214 | ||||||
| G.O. Rev. Ref. Bonds, Series 2018-A, 5.00% 2025 | 1,320 | 1,487 | ||||||
| G.O. Rev. Ref. Bonds, Series 2018-A, 5.00% 2026 | 3,500 | 3,997 | ||||||
| G.O. Rev. Ref. Bonds, Series 2018-A, 5.00% 2027 | 3,000 | 3,471 | ||||||
| Toll Highway Auth., Toll Highway Rev. Bonds, Series 2013-A, 5.00% 2038 | 40,430 | 43,757 | ||||||
| Other securities | 1,637,791 | |||||||
| 3,099,697 | ||||||||
| American Funds Tax-Exempt Funds | 31 |
The Tax-Exempt Bond Fund of America
| Bonds, notes & other debt instruments (continued) | Principal amount (000) | Value (000) | ||||||
| Kansas 0.52% | ||||||||
| University of Kansas Hospital Auth., Health Facs. and Improvement Rev. Bonds (University of Kansas Health System), Series 2017-A, 5.00% 2047 | $ | 44,740 | $ | 53,565 | ||||
| Other securities | 78,402 | |||||||
| 131,967 | ||||||||
| Massachusetts 1.22% | ||||||||
| Special Obligation Dedicated Tax Rev. Ref. Bonds, Series 2005, FGIC National insured, 5.50% 2034 | 51,335 | 71,095 | ||||||
| Other securities | 240,812 | |||||||
| 311,907 | ||||||||
| Michigan 4.04% | ||||||||
| Fin. Auth., Distributable State Aid Rev. Bonds (Charter County of Wayne Criminal Justice Center Project), Series 2018, 5.00% 2036 | 2,500 | 3,196 | ||||||
| Fin. Auth., Distributable State Aid Rev. Bonds (Charter County of Wayne Criminal Justice Center Project), Series 2018, 5.00% 2037 | 1,000 | 1,271 | ||||||
| Fin. Auth., Distributable State Aid Rev. Bonds (Charter County of Wayne Criminal Justice Center Project), Series 2018, 5.00% 2038 | 1,000 | 1,268 | ||||||
| Fin. Auth., Distributable State Aid Rev. Bonds (Charter County of Wayne Criminal Justice Center Project), Series 2018, 5.00% 2043 | 3,500 | 4,383 | ||||||
| Fin. Auth., Hospital Rev. and Rev. Ref. Bonds (Trinity Health Credit Group), Series 2015, 5.00% 2030 (preref. 2022) | 5,000 | 5,434 | ||||||
| Fin. Auth., Hospital Rev. and Rev. Ref. Bonds (Trinity Health Credit Group), Series 2015, 5.50% 2026 | 750 | 915 | ||||||
| Fin. Auth., Hospital Rev. and Rev. Ref. Bonds (Trinity Health Credit Group), Series 2016, 5.00% 2045 | 1,345 | 1,581 | ||||||
| Fin. Auth., Hospital Rev. and Rev. Ref. Bonds (Trinity Health Credit Group), Series 2017, 5.00% 2028 | 2,000 | 2,518 | ||||||
| Fin. Auth., Hospital Rev. and Rev. Ref. Bonds (Trinity Health Credit Group), Series 2017, 5.00% 2046 | 6,455 | 7,734 | ||||||
| Fin. Auth., Hospital Rev. and Rev. Ref. Bonds (Trinity Health Credit Group), Series 2017-A, 4.00% 2036 | 32,480 | 37,399 | ||||||
| Fin. Auth., Hospital Rev. and Rev. Ref. Bonds (Trinity Health Credit Group), Series 2017-A, 4.00% 2040 | 22,030 | 25,063 | ||||||
| Fin. Auth., Hospital Rev. and Rev. Ref. Bonds (Trinity Health Credit Group), Series 2017-A, 5.00% 2034 | 2,500 | 3,114 | ||||||
| Fin. Auth., Hospital Rev. and Rev. Ref. Bonds (Trinity Health Credit Group), Series 2017-A, 5.00% 2035 | 4,000 | 4,960 | ||||||
| Fin. Auth., Hospital Rev. and Rev. Ref. Bonds (Trinity Health Credit Group), Series 2017-A, 5.00% 2037 | 5,000 | 6,165 | ||||||
| Fin. Auth., Hospital Rev. and Rev. Ref. Bonds (Trinity Health Credit Group), Series 2017-A, 5.00% 2047 (preref. 2022) | 20,220 | 22,445 | ||||||
| Fin. Auth., Hospital Rev. and Rev. Ref. Bonds (Trinity Health Credit Group), Series 2019-1, 5.00% 2048 | 6,560 | 8,064 | ||||||
| Fin. Auth., Hospital Rev. and Rev. Ref. Bonds (Trinity Health Credit Group), Series 2019-2, 4.00% 2049 | 9,015 | 10,339 | ||||||
| Fin. Auth., Hospital Rev. and Rev. Ref. Bonds (Trinity Health Credit Group), Series 2019-2, 5.00% 2044 (put 2025) | 5,000 | 5,954 | ||||||
| Fin. Auth., Hospital Rev. and Rev. Ref. Bonds (Trinity Health Credit Group), Series 2019-A, 5.00% 2041 | 2,485 | 3,136 | ||||||
| Fin. Auth., Hospital Rev. Bonds (CHE Trinity Health Credit Group), Series 2013-MI-4, 4.00% 2038 | 23,250 | 27,357 | ||||||
| Fin. Auth., Hospital Rev. Bonds (Trinity Health Credit Group), Series 2011, 5.00% 2039 | 3,400 | 3,617 | ||||||
| Fin. Auth., Hospital Rev. Bonds (Trinity Health Credit Group), Series 2013-2, 4.00% 2036 | 1,200 | 1,423 | ||||||
| Fin. Auth., Hospital Rev. Ref. Bonds (Beaumont Health Credit Group), Series 2016-A, 5.00% 2044 | 15,010 | 17,255 | ||||||
| Fin. Auth., Hospital Rev. Ref. Bonds (Henry Ford Health System), Series 2016, 4.00% 2035 | 3,595 | 4,035 | ||||||
| Fin. Auth., Hospital Rev. Ref. Bonds (Henry Ford Health System), Series 2016, 5.00% 2031 | 4,300 | 5,211 | ||||||
| Fin. Auth., Hospital Rev. Ref. Bonds (Henry Ford Health System), Series 2016, 5.00% 2032 | 1,500 | 1,809 | ||||||
| Fin. Auth., Hospital Rev. Ref. Bonds (Henry Ford Health System), Series 2016, 5.00% 2034 | 1,540 | 1,847 | ||||||
| Fin. Auth., Hospital Rev. Ref. Bonds (Henry Ford Health System), Series 2019-A, 5.00% 2048 | 2,500 | 3,102 | ||||||
| Fin. Auth., Hospital Rev. Ref. Bonds (McLaren Health Care), Series 2015-D-1, (1-month USD-LIBOR x 0.68 + 0.40%) 0.513% 2030 (put 2021)1 | 13,965 | 13,860 | ||||||
| Fin. Auth., Hospital Rev. Ref. Bonds (McLaren Health Care), Series 2019-A, 4.00% 2044 | 8,450 | 9,677 | ||||||
| 32 | American Funds Tax-Exempt Funds |
The Tax-Exempt Bond Fund of America
| Principal amount (000) | Value (000) | |||||||
| Fin. Auth., Hospital Rev. Ref. Bonds (McLaren Health Care), Series 2019-A, 4.00% 2047 | $ | 3,300 | $ | 3,760 | ||||
| Fin. Auth., Hospital Rev. Ref. Bonds (MidMichigan Health Credit Group), Series 2014, 5.00% 2039 | 1,000 | 1,120 | ||||||
| Fin. Auth., Hospital Rev. Ref. Bonds (Oakwood Obligated Group), Series 2012, 5.00% 2024 | 9,145 | 10,005 | ||||||
| Fin. Auth., Hospital Rev. Ref. Bonds (Oakwood Obligated Group), Series 2012, 5.00% 2027 | 3,000 | 3,263 | ||||||
| Fin. Auth., Hospital Rev. Ref. Bonds (Sparrow Obligated Group), Series 2015, 5.00% 2029 | 3,000 | 3,498 | ||||||
| Fin. Auth., Hospital Rev. Ref. Bonds (Sparrow Obligated Group), Series 2015, 5.00% 2031 | 1,500 | 1,737 | ||||||
| Fin. Auth., Hospital Rev. Ref. Bonds (Sparrow Obligated Group), Series 2015, 5.00% 2033 | 1,500 | 1,726 | ||||||
| Fin. Auth., Hospital Rev. Ref. Bonds (Sparrow Obligated Group), Series 2015, 5.00% 2034 | 1,500 | 1,723 | ||||||
| Fin. Auth., Hospital Rev. Ref. Bonds (Sparrow Obligated Group), Series 2015, 5.00% 2045 | 1,000 | 1,129 | ||||||
| Fin. Auth., Local Government Loan Program Rev. Bonds (Detroit Fin. Recovery Income Tax Local Project Bonds), Series 2014-F-1, 4.50% 2029 | 2,150 | 2,274 | ||||||
| Fin. Auth., Local Government Loan Program Rev. Bonds (Detroit Water and Sewerage Dept., Sewage Disposal System Rev. and Rev. Ref. Local Project Bonds), Series 2014-C-1, 5.00% 2044 (preref. 2022) | 5,050 | 5,512 | ||||||
| Fin. Auth., Local Government Loan Program Rev. Bonds (Detroit Water and Sewerage Dept., Sewage Disposal System Rev. and Rev. Ref. Local Project Bonds), Series 2014-C-3, Assured Guaranty Municipal insured, 5.00% 2023 | 8,000 | 9,100 | ||||||
| Fin. Auth., Local Government Loan Program Rev. Bonds (Detroit Water and Sewerage Dept., Sewage Disposal System Rev. Ref. Local Project Bonds), Series 2014-C-3, Assured Guaranty Municipal insured, 5.00% 2032 | 1,500 | 1,714 | ||||||
| Fin. Auth., Local Government Loan Program Rev. Bonds (Detroit Water and Sewerage Dept., Sewage Disposal System Rev. Ref. Local Project Bonds), Series 2015-C, 5.00% 2028 | 1,415 | 1,698 | ||||||
| Fin. Auth., Local Government Loan Program Rev. Bonds (Detroit Water and Sewerage Dept., Sewage Disposal System Rev. Ref. Local Project Bonds), Series 2015-C, 5.00% 2032 | 1,355 | 1,607 | ||||||
| Fin. Auth., Local Government Loan Program Rev. Bonds (Detroit Water and Sewerage Dept., Sewage Disposal System Rev. Ref. Local Project Bonds), Series 2015-C, 5.00% 2033 | 2,565 | 3,031 | ||||||
| Fin. Auth., Local Government Loan Program Rev. Bonds (Detroit Water and Sewerage Dept., Sewage Disposal System Rev. Ref. Local Project Bonds), Series 2015-C, 5.00% 2034 | 3,000 | 3,539 | ||||||
| Fin. Auth., Local Government Loan Program Rev. Bonds (Detroit Water and Sewerage Dept., Sewage Disposal System Rev. Ref. Local Project Bonds), Series 2015-C, 5.00% 2035 | 3,000 | 3,522 | ||||||
| Fin. Auth., Local Government Loan Program Rev. Bonds (Detroit Water and Sewerage Dept., Water Supply System Rev. Ref. Local Project Bonds), Series 2014-D-4, 5.00% 2034 | 1,425 | 1,616 | ||||||
| City of Lansing, Board of Water and Light, Utility System Rev. Bonds, Series 2019-A, 5.00% 2044 | 42,750 | 55,218 | ||||||
| City of Lansing, Board of Water and Light, Utility System Rev. Bonds, Series 2019-A, 5.00% 2048 | 33,000 | 42,378 | ||||||
| Other securities | 629,261 | |||||||
| 1,032,563 | ||||||||
| New Hampshire 0.34% | ||||||||
| National Fin. Auth., Municipal Certificates, Series 2020-1, Class A, 4.125% 2034 | 51,173 | 56,096 | ||||||
| Other securities | 29,791 | |||||||
| 85,887 | ||||||||
| New Jersey 1.75% | ||||||||
| Housing and Mortgage Fin. Agcy., Single Family Housing Rev. Bonds, Series 2018-A, 4.50% 2048 | 35,080 | 39,619 | ||||||
| Other securities | 408,683 | |||||||
| 448,302 | ||||||||
| American Funds Tax-Exempt Funds | 33 |
The Tax-Exempt Bond Fund of America
| Bonds, notes & other debt instruments (continued) | Principal amount (000) | Value (000) | ||||||
| New York 9.75% | ||||||||
| Brooklyn Arena Local Dev. Corp., PILOT Rev. Ref. Bonds (Barclays Center), Series 2016-A, Assured Guaranty Municipal insured, 5.00% 2042 | $ | 47,260 | $ | 50,810 | ||||
| Dormitory Auth., Mental Health Facs. Improvement Rev. Bonds, Series 2010-A, 5.00% 2021 | 5,000 | 5,018 | ||||||
| Dormitory Auth., Mortgage Hospital Rev. Bonds (Maimonides Medical Center), Series 2020, FHA insured, 4.00% 2043 | 750 | 854 | ||||||
| Dormitory Auth., Rev. Bonds (Icahn School of Medicine at Mount Sinai), Series 2015-A, 5.00% 2031 | 1,000 | 1,157 | ||||||
| Dormitory Auth., Rev. Bonds (Icahn School of Medicine at Mount Sinai), Series 2015-A, 5.00% 2033 | 7,500 | 8,610 | ||||||
| Dormitory Auth., Rev. Bonds (Icahn School of Medicine at Mount Sinai), Series 2015-A, 5.00% 2040 | 500 | 567 | ||||||
| Dormitory Auth., Rev. Bonds (Langone Hospitals Obligated Group), Series 2020-A, 4.00% 2053 | 3,250 | 3,724 | ||||||
| Dormitory Auth., Rev. Bonds (Montefiore Obligated Group), Series 2018-A, 5.00% 2030 | 1,000 | 1,234 | ||||||
| Dormitory Auth., Rev. Bonds (Montefiore Obligated Group), Series 2018-A, 5.00% 2031 | 2,350 | 2,886 | ||||||
| Dormitory Auth., Rev. Bonds (Montefiore Obligated Group), Series 2020-A, 4.00% 2045 | 375 | 413 | ||||||
| Dormitory Auth., Rev. Bonds (Montefiore Obligated Group), Series 2020-A, 4.00% 2050 | 1,250 | 1,372 | ||||||
| Dormitory Auth., Rev. Bonds (New School), Series 2016-A, 5.00% 2032 | 2,250 | 2,643 | ||||||
| Dormitory Auth., Rev. Bonds (New York University), Series 2017-A, 5.00% 2028 | 3,305 | 4,139 | ||||||
| Dormitory Auth., Rev. Bonds (New York University), Series 2018-A, 5.00% 2031 | 1,000 | 1,301 | ||||||
| Dormitory Auth., Rev. Bonds (New York University), Series 2018-A, 5.00% 2036 | 1,500 | 1,893 | ||||||
| Dormitory Auth., Rev. Bonds (New York University), Series 2018-A, 5.00% 2038 | 2,000 | 2,507 | ||||||
| Dormitory Auth., Rev. Bonds (NYU Hospitals Center), Series 2014, 5.00% 2036 | 650 | 732 | ||||||
| Dormitory Auth., Rev. Bonds (Orange Regional Medical Center Obligated Group), Series 2015, 5.00% 20312 | 500 | 573 | ||||||
| Dormitory Auth., Rev. Bonds (State University of New York Dormitory Facs.), Series 2019-A, 4.00% 2038 | 1,070 | 1,228 | ||||||
| Dormitory Auth., Rev. Bonds (State University of New York Dormitory Facs.), Series 2019-A, 4.00% 2043 | 1,200 | 1,360 | ||||||
| Dormitory Auth., Rev. Bonds (State University of New York Dormitory Facs.), Series 2019-A, 4.00% 2049 | 2,625 | 2,947 | ||||||
| Dormitory Auth., School Dist. Rev. Bond Fncg. Program Rev. Bonds, Series 2016-E, BAM insured, 5.00% 2026 | 1,000 | 1,233 | ||||||
| Dormitory Auth., State Personal Income Tax Rev. Bonds (Education), Series 2014-C, Group A, 5.00% 2024 | 5,510 | 6,453 | ||||||
| Dormitory Auth., State Personal Income Tax Rev. Bonds (General Purpose), Series 2011-A, 5.00% 2033 | 8,760 | 8,993 | ||||||
| Dormitory Auth., State Personal Income Tax Rev. Bonds (General Purpose), Series 2011-C, 5.00% 2041 | 1,890 | 1,937 | ||||||
| Dormitory Auth., State Personal Income Tax Rev. Bonds (General Purpose), Series 2014-A, 5.00% 2030 | 2,500 | 2,877 | ||||||
| Dormitory Auth., State Personal Income Tax Rev. Bonds (General Purpose), Series 2015-A, 5.00% 2034 | 4,390 | 5,186 | ||||||
| Dormitory Auth., State Personal Income Tax Rev. Bonds (General Purpose), Series 2016-A, 5.00% 2039 | 1,000 | 1,213 | ||||||
| Dormitory Auth., State Personal Income Tax Rev. Bonds (General Purpose), Series 2017-A, 5.00% 2032 | 1,500 | 1,875 | ||||||
| Dormitory Auth., State Personal Income Tax Rev. Bonds (General Purpose), Series 2017-B, 5.00% 2035 | 17,005 | 21,320 | ||||||
| Dormitory Auth., State Personal Income Tax Rev. Bonds (General Purpose), Series 2018-A, 5.00% 2040 | 2,000 | 2,527 | ||||||
| Dormitory Auth., State Personal Income Tax Rev. Bonds (General Purpose), Series 2019-A, 5.00% 2036 | 2,000 | 2,584 | ||||||
| Dormitory Auth., State Personal Income Tax Rev. Bonds (General Purpose), Series 2019-A, 5.00% 2037 | 1,685 | 2,170 | ||||||
| Dormitory Auth., State Personal Income Tax Rev. Bonds (General Purpose), Series 2019-A, 5.00% 2041 | 8,000 | 10,185 | ||||||
| Dormitory Auth., State Personal Income Tax Rev. Bonds (General Purpose), Series 2019-A, 5.00% 2042 | 5,000 | 6,350 | ||||||
| Dormitory Auth., State Personal Income Tax Rev. Bonds (General Purpose), Series 2019-A, 5.00% 2043 | 15,100 | 19,137 | ||||||
| Dormitory Auth., State Personal Income Tax Rev. Bonds (General Purpose), Series 2019-A, 5.00% 2044 | 10,000 | 12,642 | ||||||
| 34 | American Funds Tax-Exempt Funds |
The Tax-Exempt Bond Fund of America
| Principal amount (000) | Value (000) | |||||||
| Dormitory Auth., State Personal Income Tax Rev. Bonds (General Purpose), Series 2019-A, 5.00% 2046 | $ | 1,300 | $ | 1,637 | ||||
| Dormitory Auth., State Personal Income Tax Rev. Bonds (General Purpose), Series 2019-A, 5.00% 2047 | 15,500 | 19,504 | ||||||
| Dormitory Auth., State Personal Income Tax Rev. Bonds (General Purpose), Series 2019-D, 4.00% 2038 | 6,940 | 8,310 | ||||||
| Dormitory Auth., State Personal Income Tax Rev. Bonds (General Purpose), Series 2019-D, 4.00% 2039 | 1,775 | 2,119 | ||||||
| Dormitory Auth., State Personal Income Tax Rev. Bonds (General Purpose), Series 2019-D, 4.00% 2040 | 12,475 | 14,853 | ||||||
| Dormitory Auth., State Personal Income Tax Rev. Bonds (General Purpose), Series 2019-D, 4.00% 2047 | 61,705 | 72,341 | ||||||
| Dormitory Auth., State Personal Income Tax Rev. Bonds (General Purpose), Series 2019-D, 4.00% 2049 | 21,575 | 25,237 | ||||||
| Dormitory Auth., State Personal Income Tax Rev. Bonds (General Purpose), Series 2019-D, 5.00% 2026 | 660 | 823 | ||||||
| Dormitory Auth., State Personal Income Tax Rev. Bonds (General Purpose), Series 2019-D, 5.00% 2027 | 1,400 | 1,790 | ||||||
| Dormitory Auth., State Personal Income Tax Rev. Bonds (General Purpose), Series 2019-D, 5.00% 2028 | 1,300 | 1,703 | ||||||
| Dormitory Auth., State Personal Income Tax Rev. Bonds (General Purpose), Series 2019-D, 5.00% 2029 | 1,400 | 1,877 | ||||||
| Dormitory Auth., State Sales Tax Rev. Bonds, Series 2014-A, 5.00% 2038 | 3,690 | 4,218 | ||||||
| Dormitory Auth., State Sales Tax Rev. Bonds, Series 2017-B, 5.00% 2033 | 4,000 | 4,978 | ||||||
| Dormitory Auth., State Sales Tax Rev. Bonds, Series 2018-A, 5.00% 2034 | 10,000 | 12,715 | ||||||
| Dormitory Auth., State Sales Tax Rev. Bonds, Series 2018-A, 5.00% 2040 | 1,035 | 1,294 | ||||||
| Dormitory Auth., State Sales Tax Rev. Bonds, Series 2018-A, 5.00% 2045 | 1,480 | 1,831 | ||||||
| Dormitory Auth., State Sales Tax Rev. Bonds, Series 2018-C, 5.00% 2024 | 2,000 | 2,345 | ||||||
| Dormitory Auth., State Sales Tax Rev. Bonds, Series 2018-E, 5.00% 2035 | 5,000 | 6,422 | ||||||
| Dormitory Auth., State Sales Tax Rev. Bonds, Series 2018-E, 5.00% 2048 | 1,200 | 1,497 | ||||||
| Long Island Power Auth., Electric System General Rev. Bonds, Series 2015-C, (1-month USD-LIBOR x 0.70 + 0.75%) 0.869% 2033 (put 2023)1 | 52,600 | 52,491 | ||||||
| Metropolitan Transportation Auth., Dedicated Tax Fund Green Bonds, Series 2016-B-1, 5.00% 2036 | 5,000 | 5,855 | ||||||
| Metropolitan Transportation Auth., Dedicated Tax Fund Rev. Ref. Bonds, Series 2002-B-3D, (SIFMA Municipal Swap Index + 1.00%) 1.16% 20201 | 11,100 | 11,056 | ||||||
| Metropolitan Transportation Auth., Transportation Rev. Bonds, Series 2003-B, FGIC-National insured, 5.25% 2021 | 5,000 | 5,197 | ||||||
| Metropolitan Transportation Auth., Transportation Rev. Bonds, Series 2011-D, 5.00% 2036 (preref. 2021) | 6,000 | 6,375 | ||||||
| Metropolitan Transportation Auth., Transportation Rev. Bonds, Series 2012-A-3, (SIFMA Municipal Swap Index + 0.50%) 0.66% 2042 (put 2022)1 | 7,500 | 7,227 | ||||||
| Metropolitan Transportation Auth., Transportation Rev. Bonds, Series 2014-B, 5.00% 2044 | 11,000 | 11,694 | ||||||
| Metropolitan Transportation Auth., Transportation Rev. Bonds, Series 2014-D-2, (SIFMA Municipal Swap Index + 0.45%) 0.61% 2044 (put 2022)1 | 7,500 | 7,094 | ||||||
| Metropolitan Transportation Auth., Transportation Rev. Bonds, Series 2015-A-1, 5.00% 2035 | 1,625 | 1,753 | ||||||
| Metropolitan Transportation Auth., Transportation Rev. Bonds, Series 2015-A-1, 5.00% 2036 | 2,830 | 3,052 | ||||||
| Metropolitan Transportation Auth., Transportation Rev. Bonds, Series 2015-A-1, 5.00% 2040 | 1,000 | 1,077 | ||||||
| Metropolitan Transportation Auth., Transportation Rev. Bonds, Series 2015-A-1, 5.00% 2045 | 24,145 | 26,004 | ||||||
| Metropolitan Transportation Auth., Transportation Rev. Bonds, Series 2015-A-2, 5.00% 2045 (put 2030) | 8,450 | 9,734 | ||||||
| Metropolitan Transportation Auth., Transportation Rev. Bonds, Series 2015-C-1, 5.00% 2035 | 6,000 | 6,521 | ||||||
| Metropolitan Transportation Auth., Transportation Rev. Green Bonds, Series 2016-A-1, 5.00% 2027 | 1,065 | 1,190 | ||||||
| Metropolitan Transportation Auth., Transportation Rev. Green Bonds, Series 2016-A-1, 5.25% 2056 | 2,500 | 2,736 | ||||||
| Metropolitan Transportation Auth., Transportation Rev. Green Bonds, Series 2017-A-1, 5.00% 2032 | 1,500 | 1,668 | ||||||
| Metropolitan Transportation Auth., Transportation Rev. Green Bonds, Series 2019-B, 4.00% 2050 | 7,525 | 7,812 | ||||||
| Metropolitan Transportation Auth., Transportation Rev. Green Bonds, Series 2019-B, 5.00% 2052 | 4,930 | 5,587 | ||||||
| Metropolitan Transportation Auth., Transportation Rev. Green Bonds, Series 2019-C, Assured Guaranty Municipal insured, 4.00% 2045 | 4,550 | 5,044 | ||||||
| American Funds Tax-Exempt Funds | 35 |
The Tax-Exempt Bond Fund of America
| Bonds, notes & other debt instruments (continued) | Principal amount (000) | Value (000) | ||||||
| New York (continued) | ||||||||
| Metropolitan Transportation Auth., Transportation Rev. Green Bonds, Series 2020-A-1, 4.00% 2053 | $ | 2,000 | $ | 2,079 | ||||
| Metropolitan Transportation Auth., Transportation Rev. Green Bonds, Series 2020-A-1, BAM insured, 4.00% 2053 | 13,320 | 14,714 | ||||||
| Metropolitan Transportation Auth., Transportation Rev. Green Bonds, Series 2020-C-1, 4.75% 2045 | 12,150 | 13,580 | ||||||
| Metropolitan Transportation Auth., Transportation Rev. Green Bonds, Series 2020-C-1, 5.00% 2050 | 12,925 | 14,837 | ||||||
| Metropolitan Transportation Auth., Transportation Rev. Green Bonds, Series 2020-C-1, 5.25% 2055 | 3,000 | 3,423 | ||||||
| Metropolitan Transportation Auth., Transportation Rev. Ref. Bonds, Series 2002-D-2A, Assured Guaranty Municipal insured, (1-month USD-LIBOR x 0.69 + 0.68%) 0.797% 2032 (put 2021)1 | 2,000 | 1,980 | ||||||
| Metropolitan Transportation Auth., Transportation Rev. Ref. Bonds, Series 2005-D-1, (1-month USD-LIBOR x 0.67 + 0.65%) 0.764% 2035 (put 2021)1 | 4,790 | 4,688 | ||||||
| Metropolitan Transportation Auth., Transportation Rev. Ref. Bonds, Series 2011-C, 5.00% 2023 | 3,405 | 3,510 | ||||||
| Metropolitan Transportation Auth., Transportation Rev. Ref. Bonds, Series 2011-C, 5.00% 2023 (preref. 2021) | 1,595 | 1,695 | ||||||
| Metropolitan Transportation Auth., Transportation Rev. Ref. Bonds, Series 2012-D, 5.00% 2024 | 8,000 | 8,427 | ||||||
| Metropolitan Transportation Auth., Transportation Rev. Ref. Bonds, Series 2012-D, 5.00% 2029 | 7,000 | 7,320 | ||||||
| Metropolitan Transportation Auth., Transportation Rev. Ref. Bonds, Series 2012-D, 5.00% 2032 | 3,105 | 3,236 | ||||||
| Metropolitan Transportation Auth., Transportation Rev. Ref. Bonds, Series 2012-F, 5.00% 2030 | 10,000 | 10,442 | ||||||
| Metropolitan Transportation Auth., Transportation Rev. Ref. Bonds, Series 2014-A-2, 5.00% 2028 (preref. 2023) | 3,000 | 3,476 | ||||||
| Metropolitan Transportation Auth., Transportation Rev. Ref. Bonds, Series 2015-C-1, 5.00% 2026 | 4,535 | 5,017 | ||||||
| Metropolitan Transportation Auth., Transportation Rev. Ref. Bonds, Series 2015-C-1, 5.00% 2027 | 2,145 | 2,378 | ||||||
| Metropolitan Transportation Auth., Transportation Rev. Ref. Bonds, Series 2015-F, 5.00% 2027 | 2,230 | 2,472 | ||||||
| Metropolitan Transportation Auth., Transportation Rev. Ref. Bonds, Series 2016-B, 4.00% 2036 | 1,010 | 1,047 | ||||||
| Metropolitan Transportation Auth., Transportation Rev. Ref. Bonds, Series 2016-B, 5.00% 2037 | 12,360 | 13,587 | ||||||
| Metropolitan Transportation Auth., Transportation Rev. Ref. Bonds, Series 2016-D, 5.00% 2027 | 1,510 | 1,702 | ||||||
| Metropolitan Transportation Auth., Transportation Rev. Ref. Bonds, Series 2016-D, 5.00% 2030 | 2,720 | 3,016 | ||||||
| Metropolitan Transportation Auth., Transportation Rev. Ref. Bonds, Series 2017-D, 4.00% 2046 | 3,975 | 4,125 | ||||||
| Metropolitan Transportation Auth., Transportation Rev. Ref. Bonds, Series 2017-D, 5.00% 2033 | 2,225 | 2,502 | ||||||
| Metropolitan Transportation Auth., Transportation Rev. Ref. Bonds, Series 2017-D, 5.00% 2035 | 4,885 | 5,478 | ||||||
| Metropolitan Transportation Auth., Transportation Rev. Ref. Green Bonds, Capital Appreciation Bonds, Series 2017-C-2, 0% 2027 | 1,500 | 1,244 | ||||||
| Metropolitan Transportation Auth., Transportation Rev. Ref. Green Bonds, Capital Appreciation Bonds, Series 2017-C-2, 0% 2029 | 1,500 | 1,113 | ||||||
| Metropolitan Transportation Auth., Transportation Rev. Ref. Green Bonds, Capital Appreciation Bonds, Series 2017-C-2, 0% 2032 | 5,000 | 3,324 | ||||||
| Metropolitan Transportation Auth., Transportation Rev. Ref. Green Bonds, Series 2017-A-2, 5.00% 2026 | 1,000 | 1,127 | ||||||
| Metropolitan Transportation Auth., Transportation Rev. Ref. Green Bonds, Series 2017-A-2, 5.00% 2030 | 1,000 | 1,117 | ||||||
| Metropolitan Transportation Auth., Transportation Rev. Ref. Green Bonds, Series 2017-B, 5.00% 2024 | 4,330 | 4,745 | ||||||
| Metropolitan Transportation Auth., Transportation Rev. Ref. Green Bonds, Series 2017-C-1, 4.00% 2034 | 2,500 | 2,610 | ||||||
| 36 | American Funds Tax-Exempt Funds |
The Tax-Exempt Bond Fund of America
| Principal amount (000) | Value (000) | |||||||
| Metropolitan Transportation Auth., Transportation Rev. Ref. Green Bonds, Series 2017-C-1, 4.00% 2035 | $ | 5,000 | $ | 5,221 | ||||
| Metropolitan Transportation Auth., Transportation Rev. Ref. Green Bonds, Series 2017-C-1, 4.00% 2036 | 3,000 | 3,133 | ||||||
| Metropolitan Transportation Auth., Transportation Rev. Ref. Green Bonds, Series 2017-C-1, 4.00% 2038 | 1,000 | 1,044 | ||||||
| Metropolitan Transportation Auth., Transportation Rev. Ref. Green Bonds, Series 2017-C-1, 5.00% 2025 | 4,500 | 5,020 | ||||||
| Metropolitan Transportation Auth., Transportation Rev. Ref. Green Bonds, Series 2017-C-1, 5.00% 2026 | 10,000 | 11,270 | ||||||
| Metropolitan Transportation Auth., Transportation Rev. Ref. Green Bonds, Series 2017-C-1, 5.00% 2028 | 5,500 | 6,300 | ||||||
| Metropolitan Transportation Auth., Transportation Rev. Ref. Green Bonds, Series 2017-C-1, 5.00% 2029 | 6,000 | 6,822 | ||||||
| Metropolitan Transportation Auth., Transportation Rev. Ref. Green Bonds, Series 2017-C-1, 5.00% 2030 | 1,000 | 1,132 | ||||||
| Metropolitan Transportation Auth., Transportation Rev. Ref. Green Bonds, Series 2017-C-1, 5.00% 2031 | 1,000 | 1,130 | ||||||
| Metropolitan Transportation Auth., Transportation Rev. Ref. Green Bonds, Series 2017-C-1, 5.00% 2033 | 1,000 | 1,125 | ||||||
| Metropolitan Transportation Auth., Transportation Rev. Ref. Green Bonds, Series 2017-C-1, 5.00% 2034 | 2,335 | 2,622 | ||||||
| Metropolitan Transportation Auth., Transportation Rev. Ref. Green Bonds, Series 2019-A-2, 5.00% 2045 | 25,000 | 28,120 | ||||||
| New York City G.O. Bonds, Fiscal 2006, Series 2006-J-2, Assured Guaranty Municipal insured, 0.68% 20361 | 2,625 | 2,625 | ||||||
| New York City G.O. Bonds, Fiscal 2008, Series 2008-J-9, 5.00% 2026 | 2,800 | 3,538 | ||||||
| New York City G.O. Bonds, Fiscal 2013, Series 2013-F-1, 5.00% 2037 | 3,000 | 3,314 | ||||||
| New York City G.O. Bonds, Fiscal 2013, Series 2013-H, 5.00% 2023 | 2,625 | 2,998 | ||||||
| New York City G.O. Bonds, Fiscal 2013, Series 2013-J, 5.00% 2023 | 550 | 628 | ||||||
| New York City G.O. Bonds, Fiscal 2014, Series 2014-G, 5.00% 2023 | 2,500 | 2,855 | ||||||
| New York City G.O. Bonds, Fiscal 2014, Series 2014-J, 5.00% 2030 | 2,000 | 2,336 | ||||||
| New York City G.O. Bonds, Fiscal 2015, Series 2015-A, 5.00% 2024 | 5,500 | 6,527 | ||||||
| New York City G.O. Bonds, Fiscal 2015, Series 2015-C, 5.00% 2028 | 1,000 | 1,185 | ||||||
| New York City G.O. Bonds, Fiscal 2015, Series 2015-C, 5.00% 2030 | 10,000 | 11,815 | ||||||
| New York City G.O. Bonds, Fiscal 2015, Series 2015-C, 5.00% 2032 | 3,500 | 4,098 | ||||||
| New York City G.O. Bonds, Fiscal 2015, Series 2015-C, 5.00% 2033 | 1,000 | 1,168 | ||||||
| New York City G.O. Bonds, Fiscal 2015, Series 2015-D, 5.00% 2030 | 2,560 | 3,025 | ||||||
| New York City G.O. Bonds, Fiscal 2016, Series 2016-A, 5.00% 2026 | 8,000 | 9,767 | ||||||
| New York City G.O. Bonds, Fiscal 2016, Series 2016-C, 5.00% 2021 | 3,500 | 3,668 | ||||||
| New York City G.O. Bonds, Fiscal 2017, Series 2017-A-1, 5.00% 2030 | 815 | 1,003 | ||||||
| New York City G.O. Bonds, Fiscal 2017, Series 2017-A-1, 5.00% 2037 | 2,000 | 2,400 | ||||||
| New York City G.O. Bonds, Fiscal 2017, Series 2017-B-1, 5.00% 2032 | 1,500 | 1,843 | ||||||
| New York City G.O. Bonds, Fiscal 2017, Series 2017-B-1, 5.00% 2034 | 1,000 | 1,220 | ||||||
| New York City G.O. Bonds, Fiscal 2017, Series 2017-B-1, 5.00% 2037 | 2,500 | 3,024 | ||||||
| New York City G.O. Bonds, Fiscal 2017, Series 2017-B-1, 5.00% 2038 | 1,500 | 1,810 | ||||||
| New York City G.O. Bonds, Fiscal 2017, Series 2017-B-1, 5.00% 2041 | 1,500 | 1,803 | ||||||
| New York City G.O. Bonds, Fiscal 2017, Series 2017-C, 5.00% 2026 | 7,185 | 9,078 | ||||||
| New York City G.O. Bonds, Fiscal 2017, Series 2017-C, 5.00% 2028 | 2,200 | 2,776 | ||||||
| New York City G.O. Bonds, Fiscal 2018, Series 2018-A, 5.00% 2026 | 9,000 | 11,371 | ||||||
| New York City G.O. Bonds, Fiscal 2018, Series 2018-A, 5.00% 2027 | 1,500 | 1,947 | ||||||
| New York City G.O. Bonds, Fiscal 2018, Series 2018-A, 5.00% 2028 | 2,000 | 2,562 | ||||||
| New York City G.O. Bonds, Fiscal 2018, Series 2018-B-1, 5.00% 2035 | 2,950 | 3,674 | ||||||
| New York City G.O. Bonds, Fiscal 2018, Series 2018-C, 5.00% 2026 | 1,500 | 1,895 | ||||||
| New York City G.O. Bonds, Fiscal 2018, Series 2018-C, 5.00% 2029 | 4,800 | 6,179 | ||||||
| New York City G.O. Bonds, Fiscal 2018, Series 2018-C, 5.00% 2030 | 8,075 | 10,338 | ||||||
| New York City G.O. Bonds, Fiscal 2018, Series 2018-C, 5.00% 2031 | 3,620 | 4,606 | ||||||
| New York City G.O. Bonds, Fiscal 2018, Series 2018-E-1, 5.00% 2032 | 2,575 | 3,283 | ||||||
| New York City G.O. Bonds, Fiscal 2018, Series 2018-E-1, 5.00% 2037 | 6,345 | 7,912 | ||||||
| New York City G.O. Bonds, Fiscal 2018, Series 2018-F-1, 5.00% 2037 | 2,000 | 2,498 | ||||||
| New York City G.O. Bonds, Fiscal 2019, Series 2019-D-1, 5.00% 2037 | 5,000 | 6,336 | ||||||
| New York City G.O. Bonds, Fiscal 2019, Series 2019-E, 5.00% 2033 | 1,000 | 1,288 | ||||||
| New York City G.O. Bonds, Fiscal 2019, Series 2019-E, 5.00% 2034 | 2,250 | 2,892 | ||||||
| New York City G.O. Bonds, Fiscal 2020, Series 2020-A-1, 5.00% 2041 | 12,400 | 15,776 | ||||||
| American Funds Tax-Exempt Funds | 37 |
The Tax-Exempt Bond Fund of America
| Bonds, notes & other debt instruments (continued) | Principal amount (000) | Value (000) | ||||||
| New York (continued) | ||||||||
| New York City G.O. Bonds, Fiscal 2020, Series 2020-A-1, 5.00% 2043 | $ | 10,000 | $ | 12,667 | ||||
| New York City G.O. Bonds, Fiscal 2020, Series 2020-B-1, 4.00% 2039 | 2,000 | 2,362 | ||||||
| New York City G.O. Bonds, Fiscal 2020, Series 2020-B-1, 4.00% 2040 | 2,500 | 2,945 | ||||||
| New York City G.O. Bonds, Fiscal 2020, Series 2020-B-1, 5.00% 2033 | 1,130 | 1,479 | ||||||
| New York City G.O. Bonds, Fiscal 2020, Series 2020-B-1, 5.00% 2036 | 8,750 | 11,328 | ||||||
| New York City G.O. Bonds, Fiscal 2020, Series 2020-B-1, 5.00% 2038 | 7,500 | 9,652 | ||||||
| New York City G.O. Bonds, Fiscal 2020, Series 2020-B-1, 5.00% 2039 | 6,810 | 8,741 | ||||||
| New York City G.O. Bonds, Fiscal 2020, Series 2020-B-1, 5.00% 2042 | 6,000 | 7,641 | ||||||
| New York City G.O. Bonds, Fiscal 2020, Series 2020-B-1, 5.00% 2043 | 5,000 | 6,353 | ||||||
| New York City G.O. Bonds, Fiscal 2020, Series 2020-C-1, 5.00% 2032 | 6,365 | 8,613 | ||||||
| New York City G.O. Bonds, Fiscal 2020, Series 2020-C-1, 5.00% 2036 | 4,000 | 5,281 | ||||||
| New York City G.O. Bonds, Fiscal 2020, Series 2020-D-1, 4.00% 2041 | 8,000 | 9,432 | ||||||
| New York City G.O. Bonds, Fiscal 2020, Series 2020-D-1, 4.00% 2042 | 7,605 | 8,934 | ||||||
| New York City G.O. Bonds, Fiscal 2020, Series 2020-D-1, 4.00% 2044 | 5,000 | 5,858 | ||||||
| New York City G.O. Bonds, Fiscal 2020, Series 2020-D-1, 4.00% 2050 | 49,370 | 57,337 | ||||||
| New York City G.O. Bonds, Fiscal 2020, Series 2020-D-1, 5.00% 2038 | 7,500 | 9,760 | ||||||
| New York City G.O. Bonds, Fiscal 2020, Series 2020-D-1, 5.00% 2039 | 8,840 | 11,471 | ||||||
| New York City G.O. Bonds, Fiscal 2020, Series 2020-D-1, 5.00% 2040 | 7,000 | 9,059 | ||||||
| New York City G.O. Bonds, Fiscal 2020, Series 2020-D-1, 5.00% 2043 | 2,000 | 2,568 | ||||||
| New York City Municipal Water Fin. Auth., Water and Sewer System Rev. Bonds, Series 2011-EE, 5.375% 2043 | 20,815 | 21,166 | ||||||
| New York City Municipal Water Fin. Auth., Water and Sewer System Rev. Bonds, Series 2011-GG, 5.00% 2026 | 205 | 214 | ||||||
| New York City Municipal Water Fin. Auth., Water and Sewer System Rev. Bonds, Series 2011-GG, 5.00% 2026 (preref. 2021) | 1,810 | 1,886 | ||||||
| New York City Municipal Water Fin. Auth., Water and Sewer System Second General Resolution Rev. Bonds, Fiscal 2013, Series 2013-BB, 5.00% 2047 | 5,000 | 5,466 | ||||||
| New York City Municipal Water Fin. Auth., Water and Sewer System Second General Resolution Rev. Bonds, Fiscal 2017, Series 2017-DD, 5.00% 2047 | 4,000 | 4,899 | ||||||
| New York City Municipal Water Fin. Auth., Water and Sewer System Second General Resolution Rev. Bonds, Fiscal 2017, Series 2017-EE, 5.00% 2033 | 4,560 | 5,816 | ||||||
| New York City Municipal Water Fin. Auth., Water and Sewer System Second General Resolution Rev. Bonds, Fiscal 2017, Series 2017-EE, 5.00% 2037 | 3,000 | 3,759 | ||||||
| New York City Municipal Water Fin. Auth., Water and Sewer System Second General Resolution Rev. Bonds, Fiscal 2018, Series 2018-BB-1, 5.00% 2046 | 12,670 | 15,602 | ||||||
| New York City Municipal Water Fin. Auth., Water and Sewer System Second General Resolution Rev. Bonds, Fiscal 2018, Series 2018-CC-1, 5.00% 2048 | 5,000 | 6,149 | ||||||
| New York City Municipal Water Fin. Auth., Water and Sewer System Second General Resolution Rev. Bonds, Fiscal 2018, Series 2018-DD-1, 5.00% 2048 | 1,500 | 1,868 | ||||||
| New York City Municipal Water Fin. Auth., Water and Sewer System Second General Resolution Rev. Bonds, Fiscal 2018, Series 2018-EE, 5.00% 2040 | 5,000 | 6,309 | ||||||
| New York City Municipal Water Fin. Auth., Water and Sewer System Second General Resolution Rev. Bonds, Fiscal 2019, Series 2019-DD-1, 5.00% 2049 | 9,000 | 11,314 | ||||||
| New York City Municipal Water Fin. Auth., Water and Sewer System Second General Resolution Rev. Bonds, Fiscal 2020, Series 2020-DD-1, 4.00% 2050 | 17,800 | 21,322 | ||||||
| New York City Municipal Water Fin. Auth., Water and Sewer System Second General Resolution Rev. Bonds, Fiscal 2020, Series 2020-DD-3, 4.00% 2042 | 13,750 | 16,701 | ||||||
| New York City Municipal Water Fin. Auth., Water and Sewer System Second General Resolution Rev. Bonds, Fiscal 2020, Series 2020-EE, 4.00% 2042 | 20,000 | 24,292 | ||||||
| New York City Municipal Water Fin. Auth., Water and Sewer System Second General Resolution Rev. Bonds, Fiscal 2020, Series 2020-GG-1, 5.00% 2050 | 12,000 | 15,759 | ||||||
| New York City Transitional Fin. Auth., Building Aid Rev. Bonds, Fiscal 2012, Series 2012-S-1-A, 5.00% 2032 | 6,400 | 6,669 | ||||||
| New York City Transitional Fin. Auth., Building Aid Rev. Bonds, Fiscal 2013, Series 2013-S-1, 5.00% 2033 | 1,825 | 1,982 | ||||||
| New York City Transitional Fin. Auth., Building Aid Rev. Bonds, Fiscal 2018, Series 2018-S-1, 5.00% 2035 | 3,295 | 4,079 | ||||||
| New York City Transitional Fin. Auth., Building Aid Rev. Bonds, Fiscal 2018, Series 2018-S-2, 5.00% 2034 | 4,000 | 5,103 | ||||||
| New York City Transitional Fin. Auth., Building Aid Rev. Bonds, Fiscal 2018, Series 2018-S-3, 5.00% 2033 | 4,320 | 5,525 | ||||||
| New York City Transitional Fin. Auth., Building Aid Rev. Bonds, Fiscal 2018, Series 2018-S-3, 5.00% 2037 | 10,000 | 12,673 | ||||||
| 38 | American Funds Tax-Exempt Funds |
The Tax-Exempt Bond Fund of America
| Principal amount (000) | Value (000) | |||||||
| New York City Transitional Fin. Auth., Building Aid Rev. Bonds, Fiscal 2018, Series 2018-S-3, 5.00% 2038 | $ | 4,000 | $ | 5,032 | ||||
| New York City Transitional Fin. Auth., Building Aid Rev. Bonds, Fiscal 2018, Series 2018-S-4-A, 5.00% 2034 | 4,000 | 5,103 | ||||||
| New York City Transitional Fin. Auth., Building Aid Rev. Bonds, Fiscal 2018, Series 2018-S-4-A, 5.00% 2035 | 3,000 | 3,714 | ||||||
| New York City Transitional Fin. Auth., Building Aid Rev. Bonds, Fiscal 2018, Series 2018-S-4-A, 5.00% 2037 | 19,250 | 24,395 | ||||||
| New York City Transitional Fin. Auth., Building Aid Rev. Bonds, Fiscal 2019, Series 2019-S-1, 4.00% 2037 | 5,135 | 6,026 | ||||||
| New York City Transitional Fin. Auth., Building Aid Rev. Bonds, Fiscal 2019, Series 2019-S-3, 5.00% 2035 | 5,000 | 6,351 | ||||||
| New York City Transitional Fin. Auth., Future Tax Secured Bonds, Fiscal 2013, Series 2013-F-1, 5.00% 2028 | 1,500 | 1,670 | ||||||
| New York City Transitional Fin. Auth., Future Tax Secured Bonds, Fiscal 2013, Series 2013-F-1, 5.00% 2036 | 1,000 | 1,102 | ||||||
| New York City Transitional Fin. Auth., Future Tax Secured Bonds, Fiscal 2015, Series 2015-C, 5.00% 2027 | 5,000 | 6,000 | ||||||
| New York City Transitional Fin. Auth., Future Tax Secured Bonds, Fiscal 2017, Series 2017-A-1, 5.00% 2035 | 1,000 | 1,214 | ||||||
| New York City Transitional Fin. Auth., Future Tax Secured Bonds, Fiscal 2017, Series 2017-B-1, 4.00% 2037 | 2,800 | 3,198 | ||||||
| New York City Transitional Fin. Auth., Future Tax Secured Bonds, Fiscal 2017, Series 2017-C, 5.00% 2031 | 3,750 | 4,719 | ||||||
| New York City Transitional Fin. Auth., Future Tax Secured Bonds, Fiscal 2017, Series 2017-E-1, 5.00% 2043 | 12,500 | 15,125 | ||||||
| New York City Transitional Fin. Auth., Future Tax Secured Bonds, Fiscal 2017, Series 2017-F-1, 5.00% 2034 | 5,000 | 6,222 | ||||||
| New York City Transitional Fin. Auth., Future Tax Secured Bonds, Fiscal 2017, Series 2017-F-1, 5.00% 2035 | 5,000 | 6,200 | ||||||
| New York City Transitional Fin. Auth., Future Tax Secured Bonds, Fiscal 2017, Series 2017-F-1, 5.00% 2039 | 1,750 | 2,147 | ||||||
| New York City Transitional Fin. Auth., Future Tax Secured Bonds, Fiscal 2018, Series 2018-A-2, 5.00% 2035 | 10,000 | 12,475 | ||||||
| New York City Transitional Fin. Auth., Future Tax Secured Bonds, Fiscal 2018, Series 2018-B-1, 4.00% 2042 | 1,350 | 1,544 | ||||||
| New York City Transitional Fin. Auth., Future Tax Secured Bonds, Fiscal 2018, Series 2018-B-1, 5.00% 2033 | 10,000 | 12,549 | ||||||
| New York City Transitional Fin. Auth., Future Tax Secured Bonds, Fiscal 2018, Series 2018-B-1, 5.00% 2045 | 2,500 | 3,049 | ||||||
| New York City Transitional Fin. Auth., Future Tax Secured Bonds, Fiscal 2019, Series 2019-A-1, 5.00% 2023 | 4,300 | 4,914 | ||||||
| New York City Transitional Fin. Auth., Future Tax Secured Bonds, Fiscal 2019, Series 2019-A-1, 5.00% 2035 | 6,000 | 7,676 | ||||||
| New York City Transitional Fin. Auth., Future Tax Secured Bonds, Fiscal 2019, Series 2019-A-1, 5.00% 2037 | 3,000 | 3,811 | ||||||
| New York City Transitional Fin. Auth., Future Tax Secured Bonds, Fiscal 2019, Series 2019-A-1, 5.00% 2038 | 9,660 | 12,239 | ||||||
| New York City Transitional Fin. Auth., Future Tax Secured Bonds, Fiscal 2019, Series 2019-A-1, 5.00% 2042 | 1,500 | 1,880 | ||||||
| New York City Transitional Fin. Auth., Future Tax Secured Bonds, Fiscal 2019, Series 2019-B-1, 5.00% 2035 | 5,000 | 6,397 | ||||||
| New York City Transitional Fin. Auth., Future Tax Secured Bonds, Fiscal 2019, Series 2019-C-1, 5.00% 2034 | 5,000 | 6,540 | ||||||
| New York City Transitional Fin. Auth., Future Tax Secured Bonds, Fiscal 2020, Series 2020-A-2, 5.00% 2040 | 53,000 | 67,994 | ||||||
| New York City Transitional Fin. Auth., Future Tax Secured Bonds, Fiscal 2020, Series 2020-A-3, 4.00% 2042 | 1,510 | 1,773 | ||||||
| New York City Transitional Fin. Auth., Future Tax Secured Bonds, Fiscal 2020, Series 2020-A-3, 4.00% 2043 | 2,900 | 3,399 | ||||||
| New York City Transitional Fin. Auth., Future Tax Secured Bonds, Fiscal 2020, Series 2020-B-1, 4.00% 2043 | 10,000 | 11,794 | ||||||
| New York City Transitional Fin. Auth., Future Tax Secured Bonds, Fiscal 2020, Series 2020-B-1, 5.00% 2034 | 1,175 | 1,557 | ||||||
| American Funds Tax-Exempt Funds | 39 |
The Tax-Exempt Bond Fund of America
| Bonds, notes & other debt instruments (continued) | Principal amount (000) | Value (000) | ||||||
| New York (continued) | ||||||||
| New York City Transitional Fin. Auth., Future Tax Secured Bonds, Fiscal 2020, Series 2020-C-1, 4.00% 2036 | $ | 1,200 | $ | 1,474 | ||||
| New York City Transitional Fin. Auth., Future Tax Secured Bonds, Fiscal 2020, Series 2020-C-1, 4.00% 2037 | 1,000 | 1,223 | ||||||
| New York City Transitional Fin. Auth., Future Tax Secured Bonds, Fiscal 2020, Series 2020-C-1, 4.00% 2038 | 1,000 | 1,216 | ||||||
| New York City Transitional Fin. Auth., Future Tax Secured Bonds, Fiscal 2020, Series 2020-C-1, 4.00% 2039 | 1,410 | 1,710 | ||||||
| New York City Transitional Fin. Auth., Future Tax Secured Bonds, Fiscal 2020, Series 2020-C-1, 4.00% 2040 | 3,000 | 3,627 | ||||||
| New York City Transitional Fin. Auth., Future Tax Secured Bonds, Fiscal 2020, Series 2020-C-1, 4.00% 2045 | 29,740 | 35,482 | ||||||
| New York City Transitional Fin. Auth., Future Tax Secured Bonds, Fiscal 2020, Series 2020-C-1, 5.00% 2041 | 3,000 | 3,967 | ||||||
| New York City Transitional Fin. Auth., Future Tax Secured Rev. Ref. Bonds, Fiscal 2015, Series 2015-E-1, 5.00% 2031 | 5,000 | 5,915 | ||||||
| New York City Transitional Fin. Auth., Future Tax Secured Rev. Ref. Bonds, Fiscal 2016, Series 2016-A-1, 5.00% 2034 | 8,000 | 9,570 | ||||||
| New York City Transitional Fin. Auth., Future Tax Secured Rev. Ref. Bonds, Fiscal 2016, Series 2016-A-1, 5.00% 2036 | 4,000 | 4,761 | ||||||
| New York City Transitional Fin. Auth., Future Tax Secured Rev. Ref. Bonds, Fiscal 2016, Series 2016-A-1, 5.00% 2037 | 2,000 | 2,375 | ||||||
| Power Auth., Rev. Bonds, Series 2020-A, 4.00% 2055 | 47,160 | 56,414 | ||||||
| Other securities | 756,932 | |||||||
| 2,489,831 | ||||||||
| North Carolina 0.76% | ||||||||
| University of North Carolina at Chapel Hill, General Rev. Bonds, Series 2012-B, (1-month USD-LIBOR x 0.67 + 0.40%) 0.515% 2041 (put 2022)1 | 40,050 | 39,885 | ||||||
| Other securities | 154,766 | |||||||
| 194,651 | ||||||||
| Ohio 2.69% | ||||||||
| County of Hamilton, Hospital Facs. Rev. Bonds (UC Health), Series 2020, 5.00% 2050 | 33,570 | 40,404 | ||||||
| Other securities | 647,168 | |||||||
| 687,572 | ||||||||
| Texas 9.62% | ||||||||
| North Texas Tollway Auth., System Rev. and Rev. Ref. Bonds, Series 2017-A, 5.00% 2043 | 35,970 | 43,640 | ||||||
| Other securities | 2,414,435 | |||||||
| 2,458,075 | ||||||||
| Utah 0.39% | ||||||||
| Transit Auth., Sales Tax Rev. and Rev. Ref. Bonds, Series 2007-A, National insured, 5.00% 2035 | 38,270 | 53,781 | ||||||
| Other securities | 45,054 | |||||||
| 98,835 | ||||||||
| Virginia 2.05% | ||||||||
| City of Newport News, Industrial Dev. Auth., Health Systems Rev. Ref. Bonds (Custodial Receipts), Series 2015, 5.33% 20452 | 41,100 | 45,838 | ||||||
| Other securities | 478,593 | |||||||
| 524,431 | ||||||||
| Washington 2.32% | ||||||||
| Health Care Facs. Auth., Rev. Bonds (Catholic Health Initiatives), Series 2013-B-1, (SIFMA Municipal Swap Index + 1.00%) 1.16% 2035 (put 2021)1 | 48,750 | 48,606 | ||||||
| Other securities | 545,046 | |||||||
| 593,652 | ||||||||
| 40 | American Funds Tax-Exempt Funds |
The Tax-Exempt Bond Fund of America
| Principal amount (000) | Value (000) | |||||||
| Other states & U.S. territories 25.39% | ||||||||
| Other securities | $ | 6,485,442 | ||||||
| Total bonds, notes & other debt instruments (cost: $21,985,399,000) | 23,404,576 | |||||||
| Short-term securities 8.18% | ||||||||
| State of Arizona, City of Phoenix, Industrial Dev. Auth., Health Care Facs. Rev. Bonds (Mayo Clinic), Series 2014-A, 0.12% 20521 | $ | 38,643 | 38,643 | |||||
| State of Arizona, City of Phoenix, Industrial Dev. Auth., Health Care Facs. Rev. Bonds (Mayo Clinic), Series 2014-B, 0.12% 20521 | 32,075 | 32,075 | ||||||
| State of California, G.O. Bonds, Series 2004-A-4, 0.13% 20341 | 54,805 | 54,805 | ||||||
| State of California, G.O. Bonds, Series 2004-B-6, 0.08% 20341 | 31,910 | 31,910 | ||||||
| State of California, City of Los Angeles, Dept. of Water and Power, Power System Demand Rev. Bonds, Series 2002-A-1, 0.14% 20351 | 20,550 | 20,550 | ||||||
| State of California, City of Los Angeles, Dept. of Water and Power, Power System Demand Rev. Bonds, Series 2002-A-2, 0.14% 20351 | 8,180 | 8,180 | ||||||
| State of California, City of Los Angeles, Dept. of Water and Power, Power System Demand Rev. Bonds, Series 2002-A-7, 0.14% 20351 | 17,000 | 17,000 | ||||||
| State of California, City of Los Angeles, Dept. of Water and Power, Water System Bonds, Series 2019-A, 0.14% 20491 | 41,130 | 41,130 | ||||||
| State of Illinois, Fin. Auth., Demand Rev. Bonds (University of Chicago Medical Center), Series 2010-A, 0.17% 20441 | 2,840 | 2,840 | ||||||
| State of Illinois, Fin. Auth., Demand Rev. Bonds (University of Chicago Medical Center), Series 2010-B, Wells Fargo LOC, 0.15% 20441 | 17,470 | 17,470 | ||||||
| State of Illinois, Fin. Auth., Demand Rev. Bonds (University of Chicago Medical Center), Series 2011-A, 0.17% 20441 | 29,150 | 29,150 | ||||||
| State of Illinois, Fin. Auth., Rev. Bonds (Lutheran Life Communities Obligated Group), Series 2019-A, 4.00% 11/1/2020 | 315 | 316 | ||||||
| State of Louisiana, Parish of East Baton Rouge, Industrial Dev. Board, Gulf Opportunity Zone Rev. Bonds (ExxonMobil Project), Series 2011, 0.14% 20511 | 12,570 | 12,570 | ||||||
| State of Louisiana, Parish of East Baton Rouge, Pollution Control Rev. Ref. Bonds (ExxonMobil Project), Series 2010-A, 0.14% 20351 | 53,210 | 53,210 | ||||||
| State of Louisiana, Public Facs. Auth., Rev. Bonds (Air Products and Chemicals Project), Series 2007, 0.12% 20421 | 23,325 | 23,325 | ||||||
| State of Louisiana, Public Facs. Auth., Rev. Bonds (Air Products and Chemicals Project), Series 2008, 0.12% 20431 | 34,890 | 34,890 | ||||||
| State of Louisiana, Public Facs. Auth., Rev. Bonds (Air Products and Chemicals Project), Series 2008-A, 0.12% 20431 | 53,000 | 53,000 | ||||||
| State of Maryland, County of Montgomery, G.O. Bonds, Series 2017-E, 0.16% 20371 | 46,820 | 46,820 | ||||||
| State of Maryland, County of Montgomery, IAM Commercial Paper, Series 2009-B, 0.21%8/26/2020 | 5,000 | 5,000 | ||||||
| State of Maryland, County of Montgomery, Rev. Bonds (Trinity Health Credit Group), Series 2013, 0.26% 2041 (put 2020)3 | 3,110 | 3,110 | ||||||
| State of Michigan, Fin. Auth., Hospital Rev. Bonds (CHE Trinity Health Credit Group), Series 2013-1, 0.26% 2034 (put 2020)3 | 3,300 | 3,300 | ||||||
| State of Michigan, Fin. Auth., State Aid Rev. Bonds, Series 2019-A, 2.00% 8/20/2020 | 7,500 | 7,506 | ||||||
| State of Michigan, Fin. Auth., State Aid Rev. Bonds, Series 2020-A-2, 4.00% 2021 | 7,000 | 7,262 | ||||||
| State of Michigan, Strategic Fund, Demand Limited Obligation Rev. Bonds (Air Products and Chemicals, Inc. Project), Series 2007, 0.12% 20421 | 42,650 | 42,650 | ||||||
| State of Mississippi, Business Fin. Corp., Gulf Opportunity Zone Industrial Dev. Rev. Bonds (Chevron U.S.A. Inc. Project), Series 2007-A, 0.14% 20301 | 18,700 | 18,700 | ||||||
| State of Mississippi, Business Fin. Corp., Gulf Opportunity Zone Industrial Dev. Rev. Bonds (Chevron U.S.A. Inc. Project), Series 2007-B, 0.14% 20301 | 5,270 | 5,270 | ||||||
| State of Mississippi, Business Fin. Corp., Gulf Opportunity Zone Industrial Dev. Rev. Bonds (Chevron U.S.A. Inc. Project), Series 2007-C, 0.14% 20301 | 10,500 | 10,500 | ||||||
| State of Mississippi, Business Fin. Corp., Gulf Opportunity Zone Industrial Dev. Rev. Bonds (Chevron U.S.A. Inc. Project), Series 2007-D, 0.14% 20301 | 3,470 | 3,470 | ||||||
| State of Mississippi, Business Fin. Corp., Gulf Opportunity Zone Industrial Dev. Rev. Bonds (Chevron U.S.A. Inc. Project), Series 2007-E, 0.14% 20301 | 12,500 | 12,500 | ||||||
| State of Mississippi, Business Fin. Corp., Gulf Opportunity Zone Industrial Dev. Rev. Bonds (Chevron U.S.A. Inc. Project), Series 2010-E, 0.17% 20301 | 10,150 | 10,150 | ||||||
| American Funds Tax-Exempt Funds | 41 |
The Tax-Exempt Bond Fund of America
| Short-term securities (continued) | Principal amount (000) | Value (000) | ||||||
| State of Mississippi, Business Fin. Corp., Gulf Opportunity Zone Industrial Dev. Rev. Bonds (Chevron U.S.A. Inc. Project), Series 2010-G, 0.14% 20351 | $ | 8,850 | $ | 8,850 | ||||
| State of Mississippi, Business Fin. Corp., Gulf Opportunity Zone Industrial Dev. Rev. Bonds (Chevron U.S.A. Inc. Project), Series 2010-I, 0.14% 20351 | 44,270 | 44,270 | ||||||
| State of Mississippi, Business Fin. Corp., Gulf Opportunity Zone Industrial Dev. Rev. Bonds (Chevron U.S.A. Inc. Project), Series 2010-J, 0.14% 20351 | 6,800 | 6,800 | ||||||
| State of Mississippi, Business Fin. Corp., Gulf Opportunity Zone Industrial Dev. Rev. Bonds (Chevron U.S.A. Inc. Project), Series 2010-K, 0.14% 20351 | 36,150 | 36,150 | ||||||
| State of Mississippi, Business Fin. Corp., Gulf Opportunity Zone Industrial Dev. Rev. Bonds (Chevron U.S.A. Inc. Project), Series 2010-L, 0.14% 20351 | 55,465 | 55,465 | ||||||
| State of Mississippi, Business Fin. Corp., Gulf Opportunity Zone Industrial Dev. Rev. Bonds (Chevron U.S.A. Inc. Project), Series 2010-L, 0.14% 20351 | 4,425 | 4,425 | ||||||
| State of Mississippi, Business Fin. Corp., Gulf Opportunity Zone Industrial Dev. Rev. Bonds (Chevron U.S.A. Inc. Project), Series 2011-E, 0.14% 20351 | 18,700 | 18,700 | ||||||
| State of Mississippi, Business Fin. Corp., Gulf Opportunity Zone Industrial Dev. Rev. Bonds (Chevron U.S.A. Inc. Project), Series 2011-F, 0.14% 20351 | 11,790 | 11,790 | ||||||
| State of New York, Dormitory Auth., IAM Commercial Paper, Series 2020, 0.20% 10/5/2020 | 6,700 | 6,700 | ||||||
| State of New York, Dormitory Auth., Rev. Bonds (Cornell University), Series 2019-B, 0.11% 20391 | 4,400 | 4,400 | ||||||
| State of New York, Dormitory Auth., State Personal Income Tax Rev. Anticipation Notes (General Purpose), Series 2020-B, 5.00% 3/31/2021 | 10,270 | 10,598 | ||||||
| State of New York, Metropolitan Transportation Auth., Transportation Rev. Bond Anticipation Notes, Series 2019-B-1, 5.00% 2022 | 2,000 | 2,086 | ||||||
| State of New York, Metropolitan Transportation Auth., Transportation Rev. Bond Anticipation Notes, Series 2020-A-1, 5.00% 2023 | 785 | 825 | ||||||
| State of New York, Metropolitan Transportation Auth., Transportation Rev. Bond Anticipation Notes, Series 2020-A-2S, 4.00% 2022 | 3,000 | 3,065 | ||||||
| State of New York, New York City G.O. Bonds, Fiscal 2006, Series 2006-E-2, 0.16% 20341 | 21,575 | 21,575 | ||||||
| State of New York, New York City G.O. Bonds, Fiscal 2008, Series 2008-C-4, Assured Guaranty Municipal insured, 0.63% 20271 | 18,175 | 18,175 | ||||||
| State of New York, New York City G.O. Bonds, Fiscal 2008, Series 2008-J-5, 0.16% 20281 | 7,500 | 7,500 | ||||||
| State of New York, New York City G.O. Bonds, Fiscal 2008, Series 2008-L-3, 0.16% 20361 | 10,735 | 10,735 | ||||||
| State of New York, New York City G.O. Bonds, Fiscal 2008, Series 2008-L-5, 0.16% 20351 | 34,265 | 34,265 | ||||||
| State of New York, New York City G.O. Bonds, Fiscal 2013, Series 2013-F-3, 0.16% 20421 | 75,240 | 75,240 | ||||||
| State of New York, New York City Municipal Water Fin. Auth., Water and Sewer System Rev. Bonds, Fiscal 2000, Series 2000-C, 0.17% 20331 | 22,700 | 22,700 | ||||||
| State of New York, New York City Municipal Water Fin. Auth., Water and Sewer System Rev. Bonds, Fiscal 2012, Series 2012-A-2, 0.14% 20441 | 19,545 | 19,545 | ||||||
| State of New York, New York City Municipal Water Fin. Auth., Water and Sewer System Rev. Bonds, Fiscal 2012, Series 2012-B, 0.15% 20451 | 1,240 | 1,240 | ||||||
| State of New York, New York City Municipal Water Fin. Auth., Water and Sewer System Second General Resolution Rev. Bonds, Fiscal 2008, Series 2008-BB-2, 0.16% 20351 | 52,545 | 52,545 | ||||||
| State of New York, New York City Municipal Water Fin. Auth., Water and Sewer System Second General Resolution Rev. Bonds, Fiscal 2011, Series 2011-FF-1, 0.16% 20441 | 37,935 | 37,935 | ||||||
| State of New York, New York City Municipal Water Fin. Auth., Water and Sewer System Second General Resolution Rev. Bonds, Fiscal 2013, Series 2013-AA-2, 0.14% 20461 | 9,000 | 9,000 | ||||||
| State of New York, New York City Municipal Water Fin. Auth., Water and Sewer System Second General Resolution Rev. Bonds, Fiscal 2014, Series 2014-AA-6, 0.18% 20481 | 11,990 | 11,990 | ||||||
| State of New York, New York City Municipal Water Fin. Auth., Water and Sewer System Second General Resolution Rev. Bonds, Fiscal 2015, Series 2015-BB-1, 0.16% 20491 | 17,035 | 17,035 | ||||||
| State of New York, New York City Municipal Water Fin. Auth., Water and Sewer System Second General Resolution Rev. Bonds, Fiscal 2016, Series 2016-AA-1, 0.16% 20481 | 16,225 | 16,225 | ||||||
| State of New York, New York City Transitional Fin. Auth., Future Tax Secured Bonds, Fiscal 2015, Series 2015-A-4, 0.16% 20431 | 16,840 | 16,840 | ||||||
| State of New York, New York City Transitional Fin. Auth., Future Tax Secured Bonds, Fiscal 2016, Series 2016-A-4, 0.16% 20411 | 22,525 | 22,525 | ||||||
| State of New York, New York City Transitional Fin. Auth., Future Tax Secured Bonds, Fiscal 2019, Series 2019-A-4, 0.18% 20451 | 10,605 | 10,605 | ||||||
| State of New York, New York City Transitional Fin. Auth., Future Tax Secured Rev. Ref. Bonds, Fiscal 2015, Series 2015-E-4, 0.16% 20451 | 33,180 | 33,180 | ||||||
| State of New York, New York City Transitional Fin. Auth., Future Tax Secured Rev. Ref. Bonds, Fiscal 2016, Series 2016-E-4, 0.18% 20451 | 4,050 | 4,050 | ||||||
| State of Ohio, Hospital Rev. Bonds (Cleveland Clinic Health System Obligated Group), Series 2019-F, 0.13% 20521 | 53,400 | 53,400 | ||||||
| 42 | American Funds Tax-Exempt Funds |
The Tax-Exempt Bond Fund of America
| Principal amount (000) | Value (000) | |||||||
| State of Texas, Gulf Coast Industrial Dev. Auth., Rev. Bonds (ExxonMobil Project), Series 2012, 0.14% 20411 | $ | 75,500 | $ | 75,500 | ||||
| State of Texas, Tax and Rev. Anticipation Notes, Series 2019, 4.00% 8/27/2020 | 61,830 | 61,981 | ||||||
| State of Wyoming, County of Lincoln, Pollution Control Rev. Ref. Bonds (ExxonMobil Project), Series 2014, 0.14% 20441 | 40,800 | 40,800 | ||||||
| Other securities | 553,703 | |||||||
| Total short-term securities (cost: $2,089,734,000) | 2,089,715 | |||||||
| Total investment securities 99.79% (cost: $24,075,133,000) | 25,494,291 | |||||||
| Other assets less liabilities 0.21% | 54,453 | |||||||
| Net assets 100.00% | $ | 25,548,744 | ||||||
This summary investment portfolio is designed to streamline the report and help investors better focus on the fund’s principal holdings. See the inside back cover for details on how to obtain a complete schedule of portfolio holdings.
“Other securities” includes all issues that are not disclosed separately in the summary investment portfolio. “Other securities” includes a security that was valued under fair value procedures adopted by authority of the board of trustees. The total value of the security that was valued under fair value procedures was $4,990,000, which represented .02% of the net assets of the fund.
Futures contracts
| Contracts | Type | Number of contracts | Expiration | Notional amount (000) | 4 | Value at 7/31/2020 (000) | 5 | Unrealized depreciation at 7/31/2020 (000) | |||||||||||
| 10 Year Ultra U.S. Treasury Note Futures | Short | 151 | September 2020 | $ | (15,100 | ) | $ | (24,047 | ) | $ | (379 | ) | |||||||
| 10 Year U.S. Treasury Note Futures | Short | 5,949 | September 2020 | (594,900 | ) | (833,325 | ) | (7,259 | ) | ||||||||||
| 30 Year Ultra U.S. Treasury Bond Futures | Short | 200 | September 2020 | (20,000 | ) | (45,537 | ) | (2,540 | ) | ||||||||||
| $ | (10,178 | ) | |||||||||||||||||
| 1 | Coupon rate may change periodically. Reference rate and spread are as of the most recent information available. Some coupon rates are determined by the issuer or agent based on current market conditions; therefore, the reference rate and spread are not available. For short-term securities, the date of the next scheduled coupon rate change is considered to be the maturity date. |
| 2 | Acquired in a transaction exempt from registration under Rule 144A of the Securities Act of 1933. May be resold in the U.S. in transactions exempt from registration, normally to qualified institutional buyers. The total value of all such securities, including those in “Other securities,” was $401,523,000, which represented 1.57% of the net assets of the fund. |
| 3 | For short-term securities, the mandatory put date is considered to be the maturity date. |
| 4 | Notional amount is calculated based on the number of contracts and notional contract size. |
| 5 | Value is calculated based on the notional amount and current market price. |
Key to abbreviations and symbol
Agcy. = Agency
Auth. = Authority
Certs. of Part. = Certificates of Participation
Dept. = Department
Dev. = Development
Dist. = District
Econ. = Economic
Fac. = Facility
Facs. = Facilities
Fin. = Finance
Fncg. = Financing
G.O. = General Obligation
IAM = Interest at Maturity
LIBOR = London Interbank Offered Rate
LOC = Letter of Credit
Preref. = Prerefunded
Redev. = Redevelopment
Ref. = Refunding
Rev. = Revenue
SIFMA = Securities Industry and Financial Markets Association
USD/$ = U.S. dollars
See notes to financial statements.
| American Funds Tax-Exempt Funds | 43 |
American High-Income Municipal Bond Fund
Summary investment portfolio July 31, 2020
| Portfolio quality summary* | Percent of net assets |
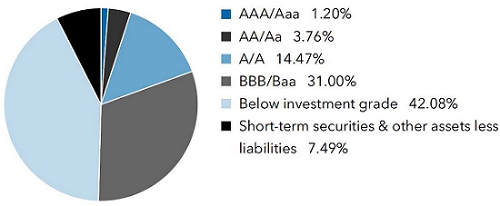
| * | Bond ratings, which typically range from AAA/Aaa (highest) to D (lowest), are assigned by credit rating agencies such as Standard & Poor’s, Moody’s and/or Fitch as an indication of an issuer’s creditworthiness. In assigning a credit rating to a security, the fund looks specifically to the ratings assigned to the issuer of the security by Standard & Poor’s, Moody’s and/or Fitch. If agency ratings differ, the security will be considered to have received the lowest of those ratings, consistent with the fund’s investment policies. The ratings are not covered by the Report of Independent Registered Public Accounting Firm. |
| Bonds, notes & other debt instruments 92.51% | Principal amount (000) | Value (000) | ||||||
| Arizona 3.10% | ||||||||
| Industrial Dev. Auth., Education Facs. Rev. Bonds (Leman Academy of Excellence - East Tucson and Central Tucson Projects), Series 2019-A, 5.00% 20391 | $ | 3,500 | $ | 3,621 | ||||
| Industrial Dev. Auth., Education Facs. Rev. Bonds (Leman Academy of Excellence - East Tucson and Central Tucson Projects), Series 2019-A, 5.00% 20491 | 7,250 | 7,432 | ||||||
| Industrial Dev. Auth., Education Facs. Rev. Bonds (Leman Academy of Excellence - East Tucson and Central Tucson Projects), Series 2019-A, 5.00% 20541 | 6,000 | 6,135 | ||||||
| Industrial Dev. Auth., Education Rev. Bonds (Academies of Math & Science Projects), Series 2017-B, 5.125% 20471 | 2,230 | 2,325 | ||||||
| Industrial Dev. Auth., Education Rev. Bonds (Academies of Math & Science Projects), Series 2017-B, 5.25% 20511 | 570 | 597 | ||||||
| Industrial Dev. Auth., Education Rev. Bonds (Academies of Math & Science Projects), Series 2018-B, 5.50% 20381 | 1,200 | 1,301 | ||||||
| Industrial Dev. Auth., Education Rev. Bonds (Academies of Math & Science Projects), Series 2018-B, 5.625% 20481 | 2,500 | 2,694 | ||||||
| Industrial Dev. Auth., Education Rev. Bonds (Academies of Math & Science Projects), Series 2018-B, 5.75% 20531 | 3,750 | 4,056 | ||||||
| Industrial Dev. Auth., Education Rev. Bonds (Academies of Math & Science Projects), Series 2019, 5.00% 20541 | 1,000 | 1,038 | ||||||
| Industrial Dev. Auth., Education Rev. Bonds (Basis School Project), Series 2017-A, 5.125% 20371 | 1,500 | 1,619 | ||||||
| Industrial Dev. Auth., Education Rev. Bonds (Basis School Project), Series 2017-A, 5.25% 20471 | 3,200 | 3,422 | ||||||
| Industrial Dev. Auth., Education Rev. Bonds (Basis School Project), Series 2017-A, 5.375% 20501 | 9,750 | 10,475 | ||||||
| Industrial Dev. Auth., Education Rev. Bonds (Basis School Project), Series 2017-D, 5.00% 20371 | 675 | 731 | ||||||
| Industrial Dev. Auth., Education Rev. Bonds (Basis School Project), Series 2017-D, 5.00% 20471 | 1,035 | 1,102 | ||||||
| Industrial Dev. Auth., Education Rev. Bonds (Basis School Project), Series 2017-D, 5.00% 20511 | 3,450 | 3,665 | ||||||
| Industrial Dev. Auth., Education Rev. Bonds (Basis School Project), Series 2017-G, 4.00% 20271 | 2,600 | 2,699 | ||||||
| Industrial Dev. Auth., Education Rev. Bonds (Basis School Project), Series 2017-G, 5.00% 20471 | 2,125 | 2,263 | ||||||
| Industrial Dev. Auth., Education Rev. Bonds (Basis School Project), Series 2017-G, 5.00% 20511 | 1,550 | 1,647 | ||||||
| Industrial Dev. Auth., Education Rev. Bonds (Doral Academy of Nevada - Fire Mesa and Red Rock Campus Projects), Series 2019-A, 3.55% 20291 | 985 | 983 | ||||||
| Industrial Dev. Auth., Education Rev. Bonds (Doral Academy of Nevada - Fire Mesa and Red Rock Campus Projects), Series 2019-A, 5.00% 20391 | 1,575 | 1,686 | ||||||
| Industrial Dev. Auth., Education Rev. Bonds (Doral Academy of Nevada - Fire Mesa and Red Rock Campus Projects), Series 2019-A, 5.00% 20491 | 2,250 | 2,346 | ||||||
| Industrial Dev. Auth., Education Rev. Bonds (Leman Academy of Excellence Projects), Series 2017-A, 5.00% 20371 | 1,350 | 1,382 | ||||||
| 44 | American Funds Tax-Exempt Funds |
American High-Income Municipal Bond Fund
| Principal amount (000) | Value (000) | |||||||
| Industrial Dev. Auth., Education Rev. Bonds (Leman Academy of Excellence Projects), Series 2017-A, 5.25% 20471 | $ | 4,830 | $ | 4,941 | ||||
| Industrial Dev. Auth., Education Rev. Bonds (Leman Academy of Excellence Projects), Series 2017-A, 5.25% 20521 | 2,500 | 2,555 | ||||||
| Industrial Dev. Auth., Education Rev. Bonds (Pinecrest Academy of Nevada - Cadence Campus Project), Series 2020-A, 4.00% 20401 | 1,850 | 1,808 | ||||||
| Industrial Dev. Auth., Education Rev. Bonds (Pinecrest Academy of Nevada - Cadence Campus Project), Series 2020-A, 4.00% 20501 | 2,480 | 2,332 | ||||||
| Industrial Dev. Auth., Education Rev. Bonds (Pinecrest Academy of Nevada - Horizon, Inspirada and St. Rose Campus Projects), Series 2018-A, 5.75% 20381 | 1,960 | 2,184 | ||||||
| Industrial Dev. Auth., Education Rev. Bonds (Pinecrest Academy of Nevada - Horizon, Inspirada and St. Rose Campus Projects), Series 2018-A, 5.75% 20481 | 3,230 | 3,555 | ||||||
| Industrial Dev. Auth., Education Rev. Bonds (Somerset Academy of Las Vegas - Lone Mountain Campus Projects), Series 2019-A, 3.75% 20291 | 565 | 559 | ||||||
| Industrial Dev. Auth., Education Rev. Bonds (Somerset Academy of Las Vegas - Lone Mountain Campus Projects), Series 2019-A, 5.00% 20391 | 440 | 452 | ||||||
| Industrial Dev. Auth., Education Rev. Bonds (Somerset Academy of Las Vegas - Lone Mountain Campus Projects), Series 2019-A, 5.00% 20491 | 700 | 710 | ||||||
| Industrial Dev. Auth., Municipal Certificates, Series 2019-2, Class A, 3.625% 2033 | 11,636 | 12,285 | ||||||
| Industrial Dev. Auth., Municipal Certificates, Series 2019-2, Class X, 1.001% 20332 | 164,800 | 10,283 | ||||||
| Industrial Dev. Auth., Student Housing Rev. Bonds (Provident Group - NCCU Properties LLC - North Carolina Central University Project), Series 2019-A, BAM insured, 5.00% 2049 | 1,500 | 1,779 | ||||||
| Industrial Dev. Auth., Student Housing Rev. Bonds (Provident Group - NCCU Properties LLC - North Carolina Central University Project), Series 2019-A, BAM insured, 5.00% 2058 | 3,500 | 4,140 | ||||||
| Other securities | 146,416 | |||||||
| 257,218 | ||||||||
| California 4.14% | ||||||||
| Statewide Communities Dev. Auth., Rev. Bonds (Loma Linda University Medical Center), Series 2016-A, 5.25% 20561 | 16,500 | 17,952 | ||||||
| Other securities | 324,713 | |||||||
| 342,665 | ||||||||
| Colorado 5.54% | ||||||||
| Health Facs. Auth., Health Care Facs. Rev. Bonds (American Baptist Homes of the Midwest Obligated Group), Series 2013, 8.00% 2043 | 11,100 | 11,815 | ||||||
| Health Facs. Auth., Health Facs. Rev. and Rev. Ref. Bonds (Evangelical Lutheran Good Samaritan Society Project), Series 2015-A, 5.00% 2030 (preref. 2025) | 3,000 | 3,675 | ||||||
| Health Facs. Auth., Health Facs. Rev. and Rev. Ref. Bonds (Evangelical Lutheran Good Samaritan Society Project), Series 2015-A, 5.00% 2032 | 1,500 | 1,837 | ||||||
| Health Facs. Auth., Health Facs. Rev. and Rev. Ref. Bonds (Evangelical Lutheran Good Samaritan Society Project), Series 2015-A, 5.00% 2036 | 2,360 | 2,891 | ||||||
| Health Facs. Auth., Health Facs. Rev. and Rev. Ref. Bonds (Evangelical Lutheran Good Samaritan Society Project), Series 2015-A, 5.00% 2045 (preref. 2025) | 1,000 | 1,225 | ||||||
| Health Facs. Auth., Health Facs. Rev. and Rev. Ref. Bonds (Evangelical Lutheran Good Samaritan Society Project), Series 2017, 5.00% 2037 (preref. 2027) | 2,300 | 2,999 | ||||||
| Health Facs. Auth., Health Facs. Rev. and Rev. Ref. Bonds (Evangelical Lutheran Good Samaritan Society Project), Series 2017, 5.00% 2047 (preref. 2027) | 3,520 | 4,590 | ||||||
| Health Facs. Auth., Health Facs. Rev. Bonds (Evangelical Lutheran Good Samaritan Society Project), Series 2012, 5.00% 2042 (preref. 2022) | 4,600 | 5,004 | ||||||
| Health Facs. Auth., Hospital Rev. Bonds (Parkview Medical Center, Inc. Project), Series 2020-A, 4.00% 2050 | 1,150 | 1,273 | ||||||
| Health Facs. Auth., Rev. Bonds (CommonSpirit Health), Series 2019-A-2, 4.00% 2049 | 5,000 | 5,562 | ||||||
| Health Facs. Auth., Rev. Bonds (CommonSpirit Health), Series 2019-A-2, 5.00% 2044 | 2,500 | 3,049 | ||||||
| Health Facs. Auth., Rev. Bonds (CommonSpirit Health), Series 2019-B-2, 5.00% 2049 (put 2026) | 5,000 | 5,959 | ||||||
| Health Facs. Auth., Rev. Bonds (Covenant Retirement Communities, Inc.), Series 2018, 5.00% 2048 | 2,480 | 2,710 | ||||||
| Health Facs. Auth., Rev. Bonds (Senior Residences Project), Series 2012, 7.00% 20423 | 2,500 | 1,375 | ||||||
| Health Facs. Auth., Rev. Bonds (Senior Residences Project), Series 2012, 7.125% 20473 | 5,500 | 3,025 | ||||||
| Health Facs. Auth., Rev. Improvement Bonds (Frasier Meadows Retirement Community Project), Series 2017-B, 5.00% 2027 | 1,055 | 1,111 | ||||||
| Health Facs. Auth., Rev. Improvement Bonds (Frasier Meadows Retirement Community Project), Series 2017-B, 5.00% 2039 | 2,045 | 2,153 | ||||||
| American Funds Tax-Exempt Funds | 45 |
American High-Income Municipal Bond Fund
| Bonds, notes & other debt instruments (continued) | Principal amount (000) | Value (000) | ||||||
| Colorado (continued) | ||||||||
| Health Facs. Auth., Rev. Improvement Bonds (Frasier Meadows Retirement Community Project), Series 2017-B, 5.00% 2048 | $ | 3,890 | $ | 4,096 | ||||
| Health Facs. Auth., Rev. Ref. and Improvement Bonds (Christian Living Neighborhoods Project), Series 2019, 4.00% 2026 | 260 | 256 | ||||||
| Health Facs. Auth., Rev. Ref. and Improvement Bonds (Christian Living Neighborhoods Project), Series 2019, 4.00% 2027 | 590 | 578 | ||||||
| Health Facs. Auth., Rev. Ref. and Improvement Bonds (Christian Living Neighborhoods Project), Series 2019, 4.00% 2028 | 245 | 238 | ||||||
| Health Facs. Auth., Rev. Ref. and Improvement Bonds (Christian Living Neighborhoods Project), Series 2019, 4.00% 2029 | 600 | 580 | ||||||
| Health Facs. Auth., Rev. Ref. and Improvement Bonds (Christian Living Neighborhoods Project), Series 2019, 4.00% 2038 | 1,150 | 990 | ||||||
| Health Facs. Auth., Rev. Ref. and Improvement Bonds (Christian Living Neighborhoods Project), Series 2019, 5.00% 2038 | 1,500 | 1,523 | ||||||
| Health Facs. Auth., Rev. Ref. and Improvement Bonds (Frasier Meadows Retirement Community Project), Series 2017-A, 5.00% 2027 | 455 | 511 | ||||||
| Health Facs. Auth., Rev. Ref. and Improvement Bonds (Frasier Meadows Retirement Community Project), Series 2017-A, 5.25% 2031 | 2,395 | 2,741 | ||||||
| Health Facs. Auth., Rev. Ref. and Improvement Bonds (Frasier Meadows Retirement Community Project), Series 2017-A, 5.25% 2032 | 850 | 973 | ||||||
| Health Facs. Auth., Rev. Ref. and Improvement Bonds (Frasier Meadows Retirement Community Project), Series 2017-A, 5.25% 2037 | 2,300 | 2,632 | ||||||
| Health Facs. Auth., Rev. Ref. and Improvement Bonds (Frasier Meadows Retirement Community Project), Series 2017-A, 5.25% 2047 | 1,500 | 1,716 | ||||||
| Health Facs. Auth., Rev. Ref. Bonds (Christian Living Neighborhoods Project), Series 2016, 5.00% 2026 | 750 | 780 | ||||||
| Health Facs. Auth., Rev. Ref. Bonds (Christian Living Neighborhoods Project), Series 2016, 5.00% 2031 | 3,345 | 3,421 | ||||||
| Health Facs. Auth., Rev. Ref. Bonds (Christian Living Neighborhoods Project), Series 2016, 5.00% 2037 | 7,250 | 7,273 | ||||||
| Health Facs. Auth., Rev. Ref. Bonds (Covenant Retirement Communities, Inc.), Series 2012-A, 5.00% 2033 | 4,750 | 4,951 | ||||||
| Health Facs. Auth., Rev. Ref. Bonds (Covenant Retirement Communities, Inc.), Series 2013-A, 5.75% 2036 | 1,000 | 1,088 | ||||||
| Health Facs. Auth., Rev. Ref. Bonds (Covenant Retirement Communities, Inc.), Series 2015-A, 5.00% 2029 | 1,520 | 1,672 | ||||||
| Health Facs. Auth., Rev. Ref. Bonds (Covenant Retirement Communities, Inc.), Series 2015-A, 5.00% 2035 | 2,500 | 2,697 | ||||||
| Other securities | 360,322 | |||||||
| 459,291 | ||||||||
| Florida 5.09% | ||||||||
| County of Broward, Airport System Rev. Bonds, Series 2019-A, AMT, 4.00% 2044 | 29,215 | 32,886 | ||||||
| North Broward Hospital Dist., Rev. Bonds (Broward Health), Series 2017-B, 5.00% 2042 | 17,500 | 20,324 | ||||||
| Other securities | 368,421 | |||||||
| 421,631 | ||||||||
| Georgia 2.17% | ||||||||
| Municipal Electric Auth., Plant Vogtle Units 3 and 4 Project J Bonds, Series 2015-A, 5.00% 2060 | 6,740 | 7,556 | ||||||
| Municipal Electric Auth., Plant Vogtle Units 3 and 4 Project J Bonds, Series 2015-A, 5.50% 2060 | 19,100 | 21,890 | ||||||
| Municipal Electric Auth., Plant Vogtle Units 3 and 4 Project J Bonds, Series 2019-A, 5.00% 2039 | 3,000 | 3,669 | ||||||
| Municipal Electric Auth., Plant Vogtle Units 3 and 4 Project J Bonds, Series 2019-A, 5.00% 2049 | 22,835 | 27,454 | ||||||
| Municipal Electric Auth., Plant Vogtle Units 3 and 4 Project J Bonds, Series 2019-A, 5.00% 2059 | 15,700 | 18,658 | ||||||
| Municipal Electric Auth., Plant Vogtle Units 3 and 4 Project M Bonds, Series 2019-A, 5.00% 2063 | 10,175 | 12,076 | ||||||
| Municipal Electric Auth., Plant Vogtle Units 3 and 4 Project P Bonds, Series 2019-B, 5.00% 2048 | 5,000 | 6,018 | ||||||
| Municipal Electric Auth., Plant Vogtle Units 3 and 4 Project P Bonds, Series 2019-B, 5.00% 2059 | 8,300 | 9,864 | ||||||
| 46 | American Funds Tax-Exempt Funds |
American High-Income Municipal Bond Fund
| Principal amount (000) | Value (000) | |||||||
| Municipal Electric Auth., Project One Bonds, Series 2019-A, 4.00% 2049 | $ | 4,200 | $ | 4,723 | ||||
| Municipal Electric Auth., Project One Bonds, Series 2019-A, 5.00% 2034 | 2,300 | 2,888 | ||||||
| Other securities | 65,062 | |||||||
| 179,858 | ||||||||
| Illinois 15.47% | ||||||||
| Build Illinois Bonds, Sales Tax Rev. Bonds, Series 2016-A, 4.00% 2028 | 4,685 | 5,052 | ||||||
| City of Chicago, Board of Education, Capital Improvement Tax Bonds (Dedicated Rev.), Series 2018, 5.00% 2034 | 1,535 | 1,712 | ||||||
| City of Chicago, Board of Education, Unlimited Tax G.O. Bonds (Dedicated Rev.), Series 2015-C, 5.25% 2039 | 6,355 | 6,654 | ||||||
| City of Chicago, Board of Education, Unlimited Tax G.O. Bonds (Dedicated Rev.), Series 2016-B, 6.50% 2046 | 7,910 | 9,282 | ||||||
| City of Chicago, Board of Education, Unlimited Tax G.O. Bonds (Dedicated Rev.), Series 2017-A, 7.00% 20461 | 26,470 | 32,737 | ||||||
| City of Chicago, Board of Education, Unlimited Tax G.O. Bonds (Dedicated Rev.), Series 2018-A, Assured Guaranty Municipal insured, 5.00% 2026 | 2,500 | 2,912 | ||||||
| City of Chicago, Board of Education, Unlimited Tax G.O. Bonds (Dedicated Rev.), Series 2018-D, 5.00% 2046 | 8,165 | 8,898 | ||||||
| City of Chicago, Board of Education, Unlimited Tax G.O. Rev. Ref. Bonds (Dedicated Rev.), Capital Appreciation Bonds, Series 1998-B-1, FGIC insured, 0% 2028 | 6,125 | 4,780 | ||||||
| City of Chicago, Board of Education, Unlimited Tax G.O. Rev. Ref. Bonds (Dedicated Rev.), Capital Appreciation Bonds, Series 2019-A, 0% 2025 | 2,000 | 1,668 | ||||||
| City of Chicago, Board of Education, Unlimited Tax G.O. Rev. Ref. Bonds (Dedicated Rev.), Series 2005-A, AMBAC insured, 5.50% 2020 | 260 | 262 | ||||||
| City of Chicago, Board of Education, Unlimited Tax G.O. Rev. Ref. Bonds (Dedicated Rev.), Series 2005-A, AMBAC insured, 5.50% 2024 | 2,425 | 2,680 | ||||||
| City of Chicago, Board of Education, Unlimited Tax G.O. Rev. Ref. Bonds (Dedicated Rev.), Series 2010-F, 5.00% 2020 | 405 | 408 | ||||||
| City of Chicago, Board of Education, Unlimited Tax G.O. Rev. Ref. Bonds (Dedicated Rev.), Series 2012-B, 4.00% 2035 | 5,000 | 5,055 | ||||||
| City of Chicago, Board of Education, Unlimited Tax G.O. Rev. Ref. Bonds (Dedicated Rev.), Series 2017-B, 6.75% 20301 | 3,500 | 4,351 | ||||||
| City of Chicago, Board of Education, Unlimited Tax G.O. Rev. Ref. Bonds (Dedicated Rev.), Series 2017-B, 7.00% 20421 | 28,185 | 34,929 | ||||||
| City of Chicago, Board of Education, Unlimited Tax G.O. Rev. Ref. Bonds (Dedicated Rev.), Series 2017-C, 5.00% 2021 | 2,000 | 2,059 | ||||||
| City of Chicago, Board of Education, Unlimited Tax G.O. Rev. Ref. Bonds (Dedicated Rev.), Series 2017-C, 5.00% 2024 | 2,000 | 2,179 | ||||||
| City of Chicago, Board of Education, Unlimited Tax G.O. Rev. Ref. Bonds (Dedicated Rev.), Series 2017-C, 5.00% 2025 | 4,000 | 4,416 | ||||||
| City of Chicago, Board of Education, Unlimited Tax G.O. Rev. Ref. Bonds (Dedicated Rev.), Series 2017-D, 5.00% 2021 | 1,500 | 1,544 | ||||||
| City of Chicago, Board of Education, Unlimited Tax G.O. Rev. Ref. Bonds (Dedicated Rev.), Series 2017-F, 5.00% 2024 | 2,000 | 2,179 | ||||||
| City of Chicago, Board of Education, Unlimited Tax G.O. Rev. Ref. Bonds (Dedicated Rev.), Series 2017-G, 5.00% 2034 | 4,000 | 4,404 | ||||||
| City of Chicago, Board of Education, Unlimited Tax G.O. Rev. Ref. Bonds (Dedicated Rev.), Series 2017-H, 5.00% 2036 | 10,000 | 10,939 | ||||||
| City of Chicago, Board of Education, Unlimited Tax G.O. Rev. Ref. Bonds (Dedicated Rev.), Series 2017-H, 5.00% 2046 | 13,780 | 14,887 | ||||||
| City of Chicago, Board of Education, Unlimited Tax G.O. Rev. Ref. Bonds (Dedicated Rev.), Series 2018-A, Assured Guaranty Municipal insured, 5.00% 2035 | 3,105 | 3,442 | ||||||
| City of Chicago, Board of Education, Unlimited Tax G.O. Rev. Ref. Bonds (Dedicated Rev.), Series 2018-C, Assured Guaranty Municipal insured, 5.00% 2023 | 5,500 | 5,895 | ||||||
| City of Chicago, Board of Education, Unlimited Tax G.O. Rev. Ref. Bonds (Dedicated Rev.), Series 2018-C, Assured Guaranty Municipal insured, 5.00% 2028 | 2,250 | 2,685 | ||||||
| City of Chicago, G.O. Bonds (City Colleges of Chicago Capital Improvement Project), Capital Appreciation Bonds, Series 1999, National insured, 0% 2031 | 7,000 | 5,148 | ||||||
| City of Chicago, G.O. Bonds (City Colleges of Chicago Capital Improvement Project), Capital Appreciation Bonds, Series 1999, National insured, 0% 2034 | 2,090 | 1,331 | ||||||
| City of Chicago, G.O. Bonds (Neighborhoods Alive 21 Program), Series 2002-B, 5.50% 2034 | 500 | 545 | ||||||
| City of Chicago, G.O. Bonds, Series 2003-B, 5.00% 2024 | 1,000 | 1,077 | ||||||
| American Funds Tax-Exempt Funds | 47 |
American High-Income Municipal Bond Fund
| Bonds, notes & other debt instruments (continued) | Principal amount (000) | Value (000) | ||||||
| Illinois (continued) | ||||||||
| City of Chicago, G.O. Bonds, Series 2012-A, 5.00% 2033 | $ | 585 | $ | 602 | ||||
| City of Chicago, G.O. Bonds, Series 2012-C, 5.00% 2023 | 435 | 449 | ||||||
| City of Chicago, G.O. Bonds, Series 2014-A, 5.25% 2029 | 3,895 | 4,174 | ||||||
| City of Chicago, G.O. Bonds, Series 2015-A, 5.25% 2028 | 3,230 | 3,532 | ||||||
| City of Chicago, G.O. Bonds, Series 2015-A, 5.50% 2034 | 200 | 218 | ||||||
| City of Chicago, G.O. Bonds, Series 2017-A, 5.75% 2033 | 465 | 538 | ||||||
| City of Chicago, G.O. Bonds, Series 2019-A, 5.00% 2044 | 3,000 | 3,283 | ||||||
| City of Chicago, G.O. Bonds, Series 2019-A, 5.50% 2035 | 7,200 | 8,280 | ||||||
| City of Chicago, G.O. Bonds, Series 2019-A, 5.50% 2049 | 2,500 | 2,813 | ||||||
| City of Chicago, G.O. Project and Rev. Ref. Bonds, Capital Appreciation Bonds, Series 2008-C, 0% 2030 | 8,000 | 5,794 | ||||||
| City of Chicago, G.O. Project and Rev. Ref. Bonds, Capital Appreciation Bonds, Series 2008-C, 0% 2031 | 2,105 | 1,454 | ||||||
| City of Chicago, G.O. Project and Rev. Ref. Bonds, Capital Appreciation Bonds, Series 2008-C, 0% 2032 | 725 | 477 | ||||||
| City of Chicago, G.O. Project and Rev. Ref. Bonds, Series 2003-B, 5.00% 2022 | 1,000 | 1,033 | ||||||
| City of Chicago, G.O. Project and Rev. Ref. Bonds, Series 2005-D, 5.50% 2037 | 260 | 282 | ||||||
| City of Chicago, G.O. Project and Rev. Ref. Bonds, Series 2014-A, 5.00% 2022 | 100 | 103 | ||||||
| City of Chicago, G.O. Project and Rev. Ref. Bonds, Series 2014-A, 5.00% 2035 | 1,600 | 1,690 | ||||||
| City of Chicago, G.O. Project and Rev. Ref. Bonds, Series 2014-A, 5.25% 2030 | 4,885 | 5,223 | ||||||
| City of Chicago, G.O. Project and Rev. Ref. Bonds, Series 2017-A, 5.625% 2029 | 6,500 | 7,530 | ||||||
| City of Chicago, G.O. Project and Rev. Ref. Bonds, Series 2017-A, 5.625% 2030 | 7,300 | 8,426 | ||||||
| City of Chicago, G.O. Project and Rev. Ref. Bonds, Series 2017-A, 6.00% 2038 | 12,170 | 14,130 | ||||||
| City of Chicago, G.O. Rev. Ref. Bonds, Series 2015-A, 5.375% 2029 | 1,000 | 1,096 | ||||||
| City of Chicago, G.O. Rev. Ref. Bonds, Series 2015-C, 5.00% 2024 | 2,020 | 2,175 | ||||||
| City of Chicago, G.O. Rev. Ref. Bonds, Series 2015-C, 5.00% 2027 | 3,105 | 3,421 | ||||||
| City of Chicago, G.O. Rev. Ref. Bonds, Series 2015-C, 5.00% 2035 | 1,670 | 1,798 | ||||||
| City of Chicago, G.O. Rev. Ref. Bonds, Series 2015-C, 5.00% 2038 | 5,500 | 5,891 | ||||||
| City of Chicago, G.O. Rev. Ref. Bonds, Series 2020-A, 5.00% 2027 | 9,200 | 10,295 | ||||||
| City of Chicago, Sales Tax Rev. Ref. Bonds, Series 2002, 5.00% 2032 (preref. 2025) | 145 | 175 | ||||||
| City of Chicago, School Reform Board of Trustees of the Board of Education, Unlimited Tax G.O. Bonds (Dedicated Tax Rev.), Capital Appreciation Bonds, Series 1998-B-1, National insured, 0% 2029 | 3,790 | 2,847 | ||||||
| City of Chicago, School Reform Board of Trustees of the Board of Education, Unlimited Tax G.O. Bonds (Dedicated Tax Rev.), Capital Appreciation Bonds, Series 1998-B-1, National insured, 0% 2031 | 6,440 | 4,445 | ||||||
| City of Chicago, School Reform Board of Trustees of the Board of Education, Unlimited Tax G.O. Bonds (Dedicated Tax Rev.), Capital Appreciation Bonds, Series 1999-A, National insured, 0% 2024 | 2,070 | 1,855 | ||||||
| City of Chicago, School Reform Board of Trustees of the Board of Education, Unlimited Tax G.O. Bonds (Dedicated Tax Rev.), Capital Appreciation Bonds, Series 1999-A, National insured, 0% 2025 | 1,410 | 1,224 | ||||||
| City of Chicago, School Reform Board of Trustees of the Board of Education, Unlimited Tax G.O. Bonds (Dedicated Tax Rev.), Capital Appreciation Bonds, Series 1999-A, National insured, 0% 2031 | 3,900 | 2,692 | ||||||
| City of Chicago, School Reform Board of Trustees of the Board of Education, Unlimited Tax G.O. Bonds (Dedicated Tax Rev.), Series 2011-A, 5.00% 2041 | 10,165 | 10,278 | ||||||
| City of Chicago, School Reform Board of Trustees of the Board of Education, Unlimited Tax G.O. Bonds (Dedicated Tax Rev.), Series 2012-A, 5.00% 2042 | 7,100 | 7,237 | ||||||
| City of Chicago, School Reform Board of Trustees of the Board of Education, Unlimited Tax G.O. Bonds (Dedicated Tax Rev.), Series 2016-A, 7.00% 2044 | 23,050 | 27,182 | ||||||
| City of Chicago, Transit Auth., Sales Tax Receipts Rev. Bonds, Series 2017, Assured Guaranty Municipal insured, 5.00% 2051 | 19,750 | 22,160 | ||||||
| City of Chicago, Wastewater Transmission Rev. Bonds, Series 2012, 5.00% 2042 | 6,000 | 6,258 | ||||||
| City of Chicago, Wastewater Transmission Rev. Bonds, Series 2014, 5.00% 2024 | 1,000 | 1,125 | ||||||
| City of Chicago, Wastewater Transmission Rev. Bonds, Series 2017-A, 5.00% 2037 | 3,000 | 3,512 | ||||||
| City of Chicago, Wastewater Transmission Rev. Ref. Bonds, Capital Appreciation Bonds, Series 1998-A, National insured, 0% 2026 | 560 | 494 | ||||||
| City of Chicago, Wastewater Transmission Rev. Ref. Bonds, Capital Appreciation Bonds, Series 1998-A, National insured, 0% 2027 | 5,000 | 4,274 | ||||||
| City of Chicago, Wastewater Transmission Rev. Ref. Bonds, Series 2008-C, 5.00% 2023 | 1,000 | 1,090 | ||||||
| City of Chicago, Water Rev. Bonds, Series 2004, 5.00% 2023 | 2,575 | 2,904 | ||||||
| City of Chicago, Water Rev. Bonds, Series 2004, 5.00% 2024 | 2,000 | 2,317 | ||||||
| City of Chicago, Water Rev. Bonds, Series 2004, 5.00% 2027 | 1,750 | 2,118 | ||||||
| 48 | American Funds Tax-Exempt Funds |
American High-Income Municipal Bond Fund
| Principal amount (000) | Value (000) | |||||||
| City of Chicago, Water Rev. Bonds, Series 2014, 5.00% 2022 | $ | 250 | $ | 273 | ||||
| City of Chicago, Water Rev. Bonds, Series 2014, 5.00% 2033 | 6,200 | 6,991 | ||||||
| City of Chicago, Water Rev. Ref. Bonds, Series 2001, 5.75% 2030 | 3,000 | 3,785 | ||||||
| City of Chicago, Water Rev. Ref. Bonds, Series 2012, 5.00% 2042 | 4,370 | 4,654 | ||||||
| City of Chicago, Water Rev. Ref. Bonds, Series 2014, 5.00% 2029 | 1,605 | 1,832 | ||||||
| City of Chicago, Water Rev. Ref. Bonds, Series 2014, 5.00% 2044 | 500 | 554 | ||||||
| Fin. Auth., Charter School Rev. Ref. and Improvement Rev. Bonds (Chicago International Charter School Project), Series 2017, 5.00% 2037 | 2,030 | 2,212 | ||||||
| Fin. Auth., Charter School Rev. Ref. and Improvement Rev. Bonds (Chicago International Charter School Project), Series 2017, 5.00% 2047 | 3,180 | 3,398 | ||||||
| Fin. Auth., Recovery Zone Fac. Rev. Ref. Bonds (Navistar International Corp. Project), Series 2020, 4.75% 2040 (put 2030)1 | 24,340 | 24,963 | ||||||
| Fin. Auth., Rev. Bonds (Benedictine University Project), Series 2013-A, 6.25% 2033 | 4,010 | 4,026 | ||||||
| Fin. Auth., Rev. Bonds (Centegra Health System), Series 2014-A, 5.00% 2022 | 40 | 44 | ||||||
| Fin. Auth., Rev. Bonds (Centegra Health System), Series 2014-A, 5.00% 2042 | 1,000 | 1,128 | ||||||
| Fin. Auth., Rev. Bonds (Clean Water Initiative Revolving Fund), Series 2017, 5.00% 2036 | 7,530 | 9,365 | ||||||
| Fin. Auth., Rev. Bonds (DePaul University), Series 2016, 5.00% 2041 | 1,000 | 1,158 | ||||||
| Fin. Auth., Rev. Bonds (Edward-Elmhurst Healthcare), Series 2017-A, 5.00% 2032 | 1,285 | 1,535 | ||||||
| Fin. Auth., Rev. Bonds (Edward-Elmhurst Healthcare), Series 2017-A, 5.00% 2035 | 3,750 | 4,432 | ||||||
| Fin. Auth., Rev. Bonds (Franciscan Communities, Inc.), Series 2013-A, 5.125% 2043 | 4,000 | 4,076 | ||||||
| Fin. Auth., Rev. Bonds (Franciscan Communities, Inc.), Series 2013-A, 5.125% 2043 (preref. 2023) | 430 | 487 | ||||||
| Fin. Auth., Rev. Bonds (Friendship Village Schaumburg), Series 2017, 5.125% 2045 | 6,775 | 5,979 | ||||||
| Fin. Auth., Rev. Bonds (Hospital Sisters Services, Inc. Obligated Group), Series 2012-C, 5.00% 2020 | 230 | 230 | ||||||
| Fin. Auth., Rev. Bonds (Lifespace Communities, Inc.), Series 2015-A, 5.00% 2045 | 3,500 | 3,620 | ||||||
| Fin. Auth., Rev. Bonds (Mercy Health Corp.), Series 2016, 5.00% 2046 | 17,165 | 19,475 | ||||||
| Fin. Auth., Rev. Bonds (Northwest Community Hospital), Series 2016-A, 5.00% 2033 | 1,800 | 2,117 | ||||||
| Fin. Auth., Rev. Bonds (OSF Healthcare System), Series 2012-A, 5.00% 2028 | 1,500 | 1,602 | ||||||
| Fin. Auth., Rev. Bonds (OSF Healthcare System), Series 2015-A, 4.125% 2037 | 1,220 | 1,334 | ||||||
| Fin. Auth., Rev. Bonds (Presbyterian Homes Obligated Group), Series 2016-A, 5.00% 2025 | 1,135 | 1,298 | ||||||
| Fin. Auth., Rev. Bonds (Presbyterian Homes Obligated Group), Series 2016-A, 5.00% 2026 | 1,000 | 1,164 | ||||||
| Fin. Auth., Rev. Bonds (Presbyterian Homes Obligated Group), Series 2016-A, 5.00% 2026 | 1,000 | 1,151 | ||||||
| Fin. Auth., Rev. Bonds (Presbyterian Homes Obligated Group), Series 2016-A, 5.00% 2028 | 2,240 | 2,584 | ||||||
| Fin. Auth., Rev. Bonds (Presbyterian Homes Obligated Group), Series 2016-A, 5.00% 2029 | 3,090 | 3,555 | ||||||
| Fin. Auth., Rev. Bonds (Presbyterian Homes Obligated Group), Series 2016-A, 5.00% 2030 | 1,500 | 1,714 | ||||||
| Fin. Auth., Rev. Bonds (Presbyterian Homes Obligated Group), Series 2016-A, 5.00% 2031 | 2,270 | 2,583 | ||||||
| Fin. Auth., Rev. Bonds (Presbyterian Homes Obligated Group), Series 2016-B, (1-month USD-LIBOR x 0.70 + 1.35%) 1.469% 2036 (put 2021)2 | 800 | 800 | ||||||
| Fin. Auth., Rev. Bonds (Presence Health Network), Series 2016-C, 3.75% 2034 | 250 | 280 | ||||||
| Fin. Auth., Rev. Bonds (Presence Health Network), Series 2016-C, 4.00% 2041 | 2,150 | 2,415 | ||||||
| Fin. Auth., Rev. Bonds (Presence Health Network), Series 2016-C, 4.00% 2041 (preref. 2027) | 80 | 98 | ||||||
| Fin. Auth., Rev. Bonds (Presence Health Network), Series 2016-C, 4.00% 2041 (preref. 2027) | 5 | 6 | ||||||
| Fin. Auth., Rev. Bonds (Presence Health Network), Series 2016-C, 5.00% 2027 | 1,875 | 2,356 | ||||||
| Fin. Auth., Rev. Bonds (Presence Health Network), Series 2016-C, 5.00% 2029 | 4,500 | 5,622 | ||||||
| Fin. Auth., Rev. Bonds (Presence Health Network), Series 2016-C, 5.00% 2032 | 4,500 | 5,549 | ||||||
| Fin. Auth., Rev. Bonds (Presence Health Network), Series 2016-C, 5.00% 2034 | 1,265 | 1,546 | ||||||
| Fin. Auth., Rev. Bonds (Presence Health Network), Series 2016-C, 5.00% 2036 | 2,250 | 2,737 | ||||||
| Fin. Auth., Rev. Bonds (Presence Health Network), Series 2016-C, 5.00% 2041 | 2,000 | 2,401 | ||||||
| Fin. Auth., Rev. Bonds (Rehabilitation Institute of Chicago), Series 2013-A, 6.00% 2043 | 2,300 | 2,571 | ||||||
| Fin. Auth., Rev. Bonds (Rosalind Franklin University Research Building Project), Series 2017-C, 5.00% 2046 | 900 | 979 | ||||||
| Fin. Auth., Rev. Bonds (Rosalind Franklin University Research Building Project), Series 2017-C, 5.00% 2049 | 1,250 | 1,356 | ||||||
| Fin. Auth., Rev. Bonds (Rush University Medical Center Obligated Group), Series 2015-A, 5.00% 2032 | 1,100 | 1,269 | ||||||
| Fin. Auth., Rev. Bonds (Rush University Medical Center Obligated Group), Series 2015-A, 5.00% 2038 | 1,500 | 1,709 | ||||||
| Fin. Auth., Rev. Bonds (Swedish Covenant Hospital), Series 2016-A, 5.00% 2032 | 2,000 | 2,549 | ||||||
| Fin. Auth., Rev. Bonds (Swedish Covenant Hospital), Series 2016-A, 5.00% 2033 | 2,000 | 2,549 | ||||||
| Fin. Auth., Rev. Bonds (Swedish Covenant Hospital), Series 2016-A, 5.00% 2035 | 2,000 | 2,549 | ||||||
| Fin. Auth., Rev. Bonds (Swedish Covenant Hospital), Series 2016-A, 5.00% 2037 | 1,800 | 2,294 | ||||||
| Fin. Auth., Rev. Bonds (The Cable Foundation), Series 2016-A, 5.00% 2045 | 6,880 | 8,178 | ||||||
| American Funds Tax-Exempt Funds | 49 |
American High-Income Municipal Bond Fund
| Bonds, notes & other debt instruments (continued) | Principal amount (000) | Value (000) | ||||||
| Illinois (continued) | ||||||||
| Fin. Auth., Rev. Ref. Bonds (Anne & Robert H. Lurie Children’s Hospital), Series 2017, 5.00% 2034 | $ | 1,000 | $ | 1,206 | ||||
| Fin. Auth., Rev. Ref. Bonds (Benedictine University), Series 2017, 5.00% 2026 | 1,065 | 1,155 | ||||||
| Fin. Auth., Rev. Ref. Bonds (Benedictine University), Series 2017, 5.00% 2030 | 1,900 | 2,043 | ||||||
| Fin. Auth., Rev. Ref. Bonds (Benedictine University), Series 2017, 5.00% 2033 | 3,000 | 3,176 | ||||||
| Fin. Auth., Rev. Ref. Bonds (Benedictine University), Series 2017, 5.00% 2038 | 11,080 | 11,570 | ||||||
| Fin. Auth., Rev. Ref. Bonds (Christian Homes, Inc.), Series 2016, 5.00% 2031 | 1,875 | 1,987 | ||||||
| Fin. Auth., Rev. Ref. Bonds (Christian Homes, Inc.), Series 2016, 5.00% 2036 | 2,400 | 2,506 | ||||||
| Fin. Auth., Rev. Ref. Bonds (Christian Homes, Inc.), Series 2016, 5.00% 2040 | 2,275 | 2,357 | ||||||
| Fin. Auth., Rev. Ref. Bonds (Illinois Institute of Technology), Series 2019, 5.00% 2034 | 1,100 | 1,273 | ||||||
| Fin. Auth., Rev. Ref. Bonds (Illinois Institute of Technology), Series 2019, 5.00% 2036 | 1,000 | 1,150 | ||||||
| Fin. Auth., Rev. Ref. Bonds (Illinois Institute of Technology), Series 2019, 5.00% 2038 | 1,000 | 1,143 | ||||||
| Fin. Auth., Rev. Ref. Bonds (Illinois Institute of Technology), Series 2019, 5.00% 2040 | 1,500 | 1,705 | ||||||
| Fin. Auth., Rev. Ref. Bonds (OSF Healthcare System), Series 2015-A, 5.00% 2035 | 5,450 | 6,351 | ||||||
| Fin. Auth., Rev. Ref. Bonds (OSF Healthcare System), Series 2015-A, 5.00% 2045 | 2,000 | 2,294 | ||||||
| Fin. Auth., Rev. Ref. Bonds (OSF Healthcare System), Series 2018-A, 4.125% 2047 | 2,000 | 2,220 | ||||||
| Fin. Auth., Rev. Ref. Bonds (Silver Cross Hospital and Medical Centers), Series 2015-C, 4.125% 2037 | 8,710 | 9,425 | ||||||
| Fin. Auth., Rev. Ref. Bonds (Silver Cross Hospital and Medical Centers), Series 2015-C, 5.00% 2035 | 3,950 | 4,510 | ||||||
| Fin. Auth., Rev. Ref. Bonds (Silver Cross Hospital and Medical Centers), Series 2015-C, 5.00% 2044 | 6,400 | 7,160 | ||||||
| Fin. Auth., Rev. Ref. Bonds (Southern Illinois Healthcare Enterprises, Inc.), Series 2017-C, 5.00% 2026 | 250 | 304 | ||||||
| Fin. Auth., Rev. Ref. Bonds (University of Chicago Medical Center), Series 2009-B, 5.00% 2025 | 1,995 | 1,999 | ||||||
| Fin. Auth., Rev. Ref. Bonds (University of Chicago Medical Center), Series 2009-B, 5.00% 2025 (preref. 2020) | 1,005 | 1,006 | ||||||
| Fin. Auth., Student Housing and Academic Fac. Rev. Bonds (CHF-Chicago, LLC - University of Illinois at Chicago Project), Series 2017-A, 5.00% 2047 | 2,365 | 2,399 | ||||||
| Fin. Auth., Student Housing Rev. Bonds (CHF-Cook, LLC - Northeastern Illinois University Project), Series 2015-A, 5.00% 2023 | 775 | 785 | ||||||
| Fin. Auth., Student Housing Rev. Bonds (CHF-Cook, LLC - Northeastern Illinois University Project), Series 2015-A, 5.00% 2024 | 815 | 826 | ||||||
| Fin. Auth., Student Housing Rev. Bonds (CHF-Cook, LLC - Northeastern Illinois University Project), Series 2015-A, 5.00% 2025 | 730 | 738 | ||||||
| Fin. Auth., Student Housing Rev. Bonds (CHF-Cook, LLC - Northeastern Illinois University Project), Series 2015-A, 5.00% 2030 | 3,965 | 3,937 | ||||||
| Fin. Auth., Student Housing Rev. Bonds (CHF-Cook, LLC - Northeastern Illinois University Project), Series 2015-A, 5.00% 2035 | 2,800 | 2,664 | ||||||
| Fin. Auth., Student Housing Rev. Bonds (CHF-Cook, LLC - Northeastern Illinois University Project), Series 2015-A, 5.00% 2047 | 12,500 | 11,099 | ||||||
| Fin. Auth., Student Housing Rev. Bonds (CHF-DeKalb II, LLC - Northern Illinois University Project), Series 2011, 5.125% 2020 | 2,275 | 2,281 | ||||||
| Fin. Auth., Student Housing Rev. Bonds (CHF-DeKalb II, LLC - Northern Illinois University Project), Series 2011, 5.75% 2021 | 2,000 | 2,051 | ||||||
| Fin. Auth., Student Housing Rev. Bonds (CHF-DeKalb II, LLC - Northern Illinois University Project), Series 2011, 6.00% 2024 | 1,000 | 1,031 | ||||||
| Fin. Auth., Student Housing Rev. Bonds (CHF-DeKalb II, LLC - Northern Illinois University Project), Series 2011, 6.875% 2043 | 19,125 | 19,643 | ||||||
| Fin. Auth., Student Housing Rev. Bonds (CHF-Normal, LLC - Illinois State University Project), Series 2011, 7.00% 2043 (preref. 2021) | 4,265 | 4,449 | ||||||
| G.O. Bonds, Series 2010, Assured Guaranty Municipal insured, 5.00% 2022 | 50 | 50 | ||||||
| G.O. Bonds, Series 2012-A, 5.00% 2028 | 1,000 | 1,035 | ||||||
| G.O. Bonds, Series 2013, 5.00% 2021 | 875 | 898 | ||||||
| G.O. Bonds, Series 2013, 5.00% 2023 | 740 | 798 | ||||||
| G.O. Bonds, Series 2013, 5.50% 2033 | 3,715 | 3,996 | ||||||
| G.O. Bonds, Series 2013, 5.50% 2038 | 1,000 | 1,068 | ||||||
| G.O. Bonds, Series 2014, 5.00% 2022 | 885 | 922 | ||||||
| G.O. Bonds, Series 2014, 5.00% 2024 | 3,000 | 3,270 | ||||||
| G.O. Bonds, Series 2014, 5.00% 2026 | 2,025 | 2,203 | ||||||
| G.O. Bonds, Series 2014, 5.00% 2027 | 2,000 | 2,248 | ||||||
| G.O. Bonds, Series 2014, 5.00% 2039 | 13,550 | 14,354 | ||||||
| G.O. Bonds, Series 2014, 5.00% 2039 | 4,100 | 4,361 | ||||||
| 50 | American Funds Tax-Exempt Funds |
American High-Income Municipal Bond Fund
| Principal amount (000) | Value (000) | |||||||
| G.O. Bonds, Series 2016, 4.00% 2036 | $ | 2,545 | $ | 2,617 | ||||
| G.O. Bonds, Series 2016, 5.00% 2025 | 1,000 | 1,114 | ||||||
| G.O. Bonds, Series 2016, 5.00% 2027 | 3,065 | 3,492 | ||||||
| G.O. Bonds, Series 2016, 5.00% 2028 | 1,500 | 1,694 | ||||||
| G.O. Bonds, Series 2016, 5.00% 2033 | 4,000 | 4,442 | ||||||
| G.O. Bonds, Series 2016, 5.00% 2038 | 1,000 | 1,094 | ||||||
| G.O. Bonds, Series 2016, Assured Guaranty Municipal insured, 5.00% 2030 | 3,000 | 3,343 | ||||||
| G.O. Bonds, Series 2016, Assured Guaranty Municipal insured, 5.00% 2041 | 2,125 | 2,293 | ||||||
| G.O. Bonds, Series 2017-A, 5.00% 2023 | 2,500 | 2,721 | ||||||
| G.O. Bonds, Series 2017-A, 5.00% 2025 | 2,500 | 2,823 | ||||||
| G.O. Bonds, Series 2017-A, 5.00% 2035 | 3,145 | 3,516 | ||||||
| G.O. Bonds, Series 2017-A, 5.00% 2036 | 3,000 | 3,340 | ||||||
| G.O. Bonds, Series 2017-C, 5.00% 2029 | 9,820 | 11,212 | ||||||
| G.O. Bonds, Series 2017-D, 5.00% 2027 | 23,990 | 27,620 | ||||||
| G.O. Bonds, Series 2017-D, BAM insured, 5.00% 2021 | 5,095 | 5,278 | ||||||
| G.O. Bonds, Series 2017-D, BAM insured, 5.00% 2026 | 11,980 | 13,633 | ||||||
| G.O. Bonds, Series 2017-D, BAM insured, 5.00% 2028 | 27,175 | 31,187 | ||||||
| G.O. Bonds, Series 2018-A, 5.00% 2034 | 2,145 | 2,427 | ||||||
| G.O. Bonds, Series 2020, 5.50% 2039 | 7,000 | 8,352 | ||||||
| G.O. Bonds, Series 2020, 5.75% 2045 | 2,500 | 3,000 | ||||||
| G.O. Rev. Ref. Bonds, Series 2012, 4.00% 2025 | 405 | 418 | ||||||
| G.O. Rev. Ref. Bonds, Series 2012, 5.00% 2021 | 600 | 617 | ||||||
| G.O. Rev. Ref. Bonds, Series 2012, Assured Guaranty Municipal insured, 5.00% 2025 | 4,250 | 4,475 | ||||||
| G.O. Rev. Ref. Bonds, Series 2016, 5.00% 2026 | 3,000 | 3,394 | ||||||
| G.O. Rev. Ref. Bonds, Series 2016, 5.00% 2028 | 5,150 | 5,883 | ||||||
| G.O. Rev. Ref. Bonds, Series 2016, Assured Guaranty Municipal insured, 4.00% 2030 | 750 | 825 | ||||||
| G.O. Rev. Ref. Bonds, Series 2018-A, 5.00% 2023 | 2,500 | 2,711 | ||||||
| G.O. Rev. Ref. Bonds, Series 2018-A, 5.00% 2025 | 3,750 | 4,224 | ||||||
| G.O. Rev. Ref. Bonds, Series 2018-A, 5.00% 2026 | 5,500 | 6,281 | ||||||
| G.O. Rev. Ref. Bonds, Series 2018-A, 5.00% 2027 | 2,000 | 2,314 | ||||||
| G.O. Rev. Ref. Bonds, Series 2018-A, 5.00% 2029 | 2,000 | 2,335 | ||||||
| G.O. Rev. Ref. Bonds, Series 2018-B, 5.00% 2029 | 6,200 | 7,239 | ||||||
| Metropolitan Pier and Exposition Auth., Dedicated State Tax Rev. Bonds, Capital Appreciation Bonds, Series 1994, BAM insured, 0% 2028 | 3,185 | 2,646 | ||||||
| Metropolitan Pier and Exposition Auth., Dedicated State Tax Rev. Bonds, Capital Appreciation Bonds, Series 2002-A, National insured, 0% 2030 | 2,435 | 1,808 | ||||||
| Metropolitan Pier and Exposition Auth., Dedicated State Tax Rev. Bonds, Capital Appreciation Bonds, Series 2002-A, National insured, 0% 2030 (escrowed to maturity) | 130 | 117 | ||||||
| Metropolitan Pier and Exposition Auth., McCormick Place Expansion Project Bonds, Capital Appreciation Bonds, Series 2002-A, National insured, 0% 2032 | 8,860 | 5,932 | ||||||
| Metropolitan Pier and Exposition Auth., McCormick Place Expansion Project Bonds, Capital Appreciation Bonds, Series 2002-A, National insured, 0% 2033 | 10,230 | 6,561 | ||||||
| Metropolitan Pier and Exposition Auth., McCormick Place Expansion Project Bonds, Capital Appreciation Bonds, Series 2002-A, National insured, 0% 2034 | 10,000 | 6,285 | ||||||
| Metropolitan Pier and Exposition Auth., McCormick Place Expansion Project Bonds, Capital Appreciation Bonds, Series 2002-A, National insured, 0% 2039 | 3,800 | 1,873 | ||||||
| Metropolitan Pier and Exposition Auth., McCormick Place Expansion Project Bonds, Capital Appreciation Bonds, Series 2012-B, 0% 2050 | 4,620 | 1,252 | ||||||
| Metropolitan Pier and Exposition Auth., McCormick Place Expansion Project Bonds, Capital Appreciation Bonds, Series 2012-B, 0% 2051 | 28,865 | 7,471 | ||||||
| Metropolitan Pier and Exposition Auth., McCormick Place Expansion Project Rev. Bonds, Series 2002-A, Assured Guaranty Municipal insured, 5.50% 2023 | 450 | 484 | ||||||
| Metropolitan Pier and Exposition Auth., McCormick Place Expansion Project Rev. Bonds, Series 2012-A, 5.00% 2042 | 1,500 | 1,534 | ||||||
| Metropolitan Pier and Exposition Auth., McCormick Place Expansion Project Rev. Bonds, Series 2015-A, 5.00% 2053 | 5,950 | 6,254 | ||||||
| Metropolitan Pier and Exposition Auth., McCormick Place Expansion Project Rev. Ref. Bonds, Capital Appreciation Bonds, Series 1994, National insured, 0% 2029 | 4,000 | 3,091 | ||||||
| Metropolitan Pier and Exposition Auth., McCormick Place Expansion Project Rev. Ref. Bonds, Capital Appreciation Bonds, Series 1996-A, National insured, 0% 2025 | 2,535 | 2,245 | ||||||
| Metropolitan Pier and Exposition Auth., McCormick Place Expansion Project Rev. Ref. Bonds, Capital Appreciation Bonds, Series 2010-B-1, Assured Guaranty Municipal insured, 0% 2027 | 3,500 | 2,996 | ||||||
| American Funds Tax-Exempt Funds | 51 |
American High-Income Municipal Bond Fund
| Bonds, notes & other debt instruments (continued) | Principal amount (000) | Value (000) | ||||||
| Illinois (continued) | ||||||||
| Metropolitan Pier and Exposition Auth., McCormick Place Expansion Project Rev. Ref. Bonds, Capital Appreciation Bonds, Series 2010-B-1, Assured Guaranty Municipal insured, 0% 2043 | $ | 800 | $ | 381 | ||||
| Metropolitan Pier and Exposition Auth., McCormick Place Expansion Project Rev. Ref. Bonds, Capital Appreciation Bonds, Series 2010-B-1, Assured Guaranty Municipal insured, 0% 2044 | 25,395 | 11,602 | ||||||
| Metropolitan Pier and Exposition Auth., McCormick Place Expansion Project Rev. Ref. Bonds, Capital Appreciation Bonds, Series 2010-B-1, Assured Guaranty Municipal insured, 0% 2046 | 3,300 | 1,395 | ||||||
| Metropolitan Pier and Exposition Auth., McCormick Place Expansion Project Rev. Ref. Bonds, Capital Appreciation Bonds, Series 2017-A, 0% 2056 | 37,160 | 7,600 | ||||||
| Metropolitan Pier and Exposition Auth., McCormick Place Expansion Project Rev. Ref. Bonds, Capital Appreciation Bonds, Series 2017-A, Assured Guaranty Municipal insured, 0% 2056 | 13,250 | 3,803 | ||||||
| Metropolitan Pier and Exposition Auth., McCormick Place Expansion Project Rev. Ref. Bonds, Capital Appreciation Bonds, Series 2017-B, 0% 2054 | 27,760 | 6,229 | ||||||
| Metropolitan Pier and Exposition Auth., McCormick Place Expansion Project Rev. Ref. Bonds, Capital Appreciation Bonds, Series 2017-B, Assured Guaranty Municipal insured, 0% 2056 | 38,865 | 11,154 | ||||||
| Metropolitan Pier and Exposition Auth., McCormick Place Expansion Project Rev. Ref. Bonds, Capital Appreciation Bonds, Series 2017-B, BAM insured, 0% 2054 | 16,785 | 5,170 | ||||||
| Metropolitan Pier and Exposition Auth., McCormick Place Expansion Project Rev. Ref. Bonds, Series 2012-B, 5.00% 2028 | 500 | 520 | ||||||
| Metropolitan Pier and Exposition Auth., McCormick Place Expansion Project Rev. Ref. Bonds, Series 2012-B, 5.00% 2052 | 1,470 | 1,498 | ||||||
| Metropolitan Pier and Exposition Auth., McCormick Place Expansion Project Rev. Ref. Bonds, Series 2015-B, 5.00% 2035 | 3,000 | 3,206 | ||||||
| Metropolitan Pier and Exposition Auth., McCormick Place Expansion Project Rev. Ref. Bonds, Series 2015-B, 5.00% 2040 | 4,000 | 4,227 | ||||||
| Metropolitan Pier and Exposition Auth., McCormick Place Expansion Project Rev. Ref. Bonds, Series 2017-A, 5.00% 2057 | 7,000 | 7,657 | ||||||
| Metropolitan Pier and Exposition Auth., McCormick Place Expansion Project Rev. Ref. Bonds, Series 2020-A, 4.00% 2050 | 7,500 | 7,487 | ||||||
| Metropolitan Pier and Exposition Auth., McCormick Place Expansion Project Rev. Ref. Bonds, Series 2020-A, 5.00% 2050 | 9,500 | 10,638 | ||||||
| Other securities | 263,206 | |||||||
| 1,282,018 | ||||||||
| Indiana 1.30% | ||||||||
| Fin. Auth., Health System Rev. Bonds (Franciscan Alliance, Inc.), Series 2016-A, 5.00% 2051 | 1,500 | 1,719 | ||||||
| Fin. Auth., Hospital Rev. Bonds (Goshen Health), Series 2019-A, 4.00% 2043 | 2,000 | 2,248 | ||||||
| Fin. Auth., Hospital Rev. Ref. Bonds (The Methodist Hospitals, Inc.), Series 2014-A, 5.00% 2028 | 2,500 | 2,805 | ||||||
| Fin. Auth., Midwestern Disaster Relief Rev. Bonds (Ohio Valley Electric Corp. Project), Series 2012-A, 5.00% 2032 | 17,560 | 18,355 | ||||||
| Fin. Auth., Midwestern Disaster Relief Rev. Bonds (Ohio Valley Electric Corp. Project), Series 2012-A, 5.00% 2039 | 10,100 | 10,500 | ||||||
| Fin. Auth., Midwestern Disaster Relief Rev. Bonds (Ohio Valley Electric Corp. Project), Series 2012-B, 3.00% 2030 | 2,500 | 2,626 | ||||||
| Fin. Auth., Private Activity Bonds (Ohio River Bridges East End Crossing Project), Series 2013-A, AMT, 5.00% 2035 | 3,000 | 3,249 | ||||||
| Fin. Auth., Private Activity Bonds (Ohio River Bridges East End Crossing Project), Series 2013-A, AMT, 5.00% 2044 | 7,225 | 7,747 | ||||||
| Fin. Auth., Private Activity Bonds (Ohio River Bridges East End Crossing Project), Series 2013-A, AMT, 5.00% 2048 | 3,250 | 3,478 | ||||||
| Fin. Auth., Private Activity Bonds (Ohio River Bridges East End Crossing Project), Series 2013-A, AMT, 5.25% 2051 | 3,410 | 3,669 | ||||||
| Fin. Auth., Rev. Bonds (BHI Senior Living Obligated Group), Series 2016-A, 5.25% 2046 | 6,750 | 7,187 | ||||||
| Fin. Auth., Rev. Bonds (BHI Senior Living Obligated Group), Series 2018-A, 5.00% 2033 | 2,410 | 2,633 | ||||||
| Fin. Auth., Rev. Bonds (BHI Senior Living Obligated Group), Series 2018-A, 5.00% 2038 | 2,395 | 2,588 | ||||||
| Fin. Auth., Rev. Bonds (BHI Senior Living Obligated Group), Series 2018-A, 5.00% 2043 | 4,000 | 4,276 | ||||||
| Fin. Auth., Rev. Bonds (BHI Senior Living Obligated Group), Series 2018-A, 5.00% 2048 | 4,500 | 4,785 | ||||||
| Fin. Auth., Rev. Bonds (Greencroft Obligated Group), Series 2013-A, 5.75% 2028 | 255 | 269 | ||||||
| Fin. Auth., Rev. Bonds (Greencroft Obligated Group), Series 2013-A, 6.50% 2033 | 215 | 230 | ||||||
| 52 | American Funds Tax-Exempt Funds |
American High-Income Municipal Bond Fund
| Principal amount (000) | Value (000) | |||||||
| Fin. Auth., Rev. Bonds (Greencroft Obligated Group), Series 2013-A, 7.00% 2043 | $ | 3,710 | $ | 3,980 | ||||
| Fin. Auth., Rev. Ref. Bonds (Community Foundation of Northwest Indiana Obligated Group), Series 2015, 5.00% 2036 | 3,730 | 4,295 | ||||||
| Other securities | 21,351 | |||||||
| 107,990 | ||||||||
| Missouri 1.54% | ||||||||
| County of St. Louis, Industrial Dev. Auth., Senior Living Facs. Rev. Bonds (Friendship Village St. Louis Obligated Group), Series 2018, 5.25% 2053 | 18,710 | 19,664 | ||||||
| Other securities | 107,814 | |||||||
| 127,478 | ||||||||
| New Hampshire 0.45% | ||||||||
| National Fin. Auth., Municipal Certificates, Series 2020-1, Class A, 4.125% 2034 | 15,995 | 17,533 | ||||||
| Other securities | 19,327 | |||||||
| 36,860 | ||||||||
| New Jersey 4.03% | ||||||||
| Econ. Dev. Auth., Energy Fac. Rev. Bonds (UMM Energy Partners, LLC Project), Series 2012-A, AMT, 5.00% 2037 | 7,085 | 7,510 | ||||||
| Econ. Dev. Auth., Energy Fac. Rev. Bonds (UMM Energy Partners, LLC Project), Series 2012-A, AMT, 5.125% 2043 | 750 | 795 | ||||||
| Econ. Dev. Auth., Motor Vehicle Surcharges Rev. Ref. Bonds, Series 2017-A, BAM insured, 4.00% 2034 | 2,210 | 2,353 | ||||||
| Econ. Dev. Auth., Motor Vehicle Surcharges Rev. Ref. Bonds, Series 2017-A, BAM insured, 5.00% 2027 | 3,250 | 3,908 | ||||||
| Econ. Dev. Auth., Private Activity Bonds (Goethals Bridge Replacement Project), Series 2013, AMT, 5.375% 2043 | 7,725 | 8,531 | ||||||
| Econ. Dev. Auth., Private Activity Bonds (Goethals Bridge Replacement Project), Series 2013, AMT, 5.625% 2052 | 3,940 | 4,373 | ||||||
| Econ. Dev. Auth., Rev. Bonds (Foundation Academy Charter School Project), Series 2018-A, 5.00% 2050 | 1,100 | 1,212 | ||||||
| Econ. Dev. Auth., Rev. Bonds (Provident Group - Kean Properties LLC - Kean University Student Housing Project), Series 2017-A, 5.00% 2037 | 1,250 | 1,193 | ||||||
| Econ. Dev. Auth., Rev. Bonds (Provident Group - Kean Properties LLC - Kean University Student Housing Project), Series 2017-A, 5.00% 2047 | 3,500 | 3,165 | ||||||
| Econ. Dev. Auth., Rev. Bonds (Provident Group - Kean Properties LLC - Kean University Student Housing Project), Series 2017-A, 5.00% 2050 | 1,590 | 1,426 | ||||||
| Econ. Dev. Auth., Rev. Ref. Bonds (Cranes Mill Project), Series 2018, 5.00% 2029 | 1,200 | 1,277 | ||||||
| Econ. Dev. Auth., Rev. Ref. Bonds (Cranes Mill Project), Series 2018, 5.00% 2034 | 2,025 | 2,089 | ||||||
| Econ. Dev. Auth., Rev. Ref. Bonds (Cranes Mill Project), Series 2018, 5.00% 2039 | 1,685 | 1,714 | ||||||
| Econ. Dev. Auth., Rev. Ref. Bonds (Cranes Mill Project), Series 2018, 5.00% 2049 | 3,810 | 3,793 | ||||||
| Econ. Dev. Auth., Rev. Ref. Bonds (Provident Group - Montclair Properties LLC - Montclair State University Student Housing Project), Series 2017, Assured Guaranty Municipal insured, 5.00% 2037 | 2,750 | 3,292 | ||||||
| Econ. Dev. Auth., Rev. Ref. Bonds (Provident Group - Rowan Properties LLC - Rowan University Student Housing Project), Series 2015-A, 5.00% 2035 | 3,750 | 3,540 | ||||||
| Econ. Dev. Auth., Rev. Ref. Bonds (Provident Group - Rowan Properties LLC - Rowan University Student Housing Project), Series 2015-A, 5.00% 2048 | 2,150 | 1,990 | ||||||
| Econ. Dev. Auth., School Facs. Construction Bonds, Series 2015-WW, 5.25% 2029 | 2,500 | 2,848 | ||||||
| Econ. Dev. Auth., School Facs. Construction Bonds, Series 2015-WW, 5.25% 2033 | 2,500 | 2,810 | ||||||
| Econ. Dev. Auth., School Facs. Construction Bonds, Series 2016-AAA, 5.50% 2031 | 2,000 | 2,370 | ||||||
| Econ. Dev. Auth., School Facs. Construction Bonds, Series 2017-DDD, 5.00% 2034 | 1,500 | 1,728 | ||||||
| Econ. Dev. Auth., School Facs. Construction Bonds, Series 2017-DDD, 5.00% 2035 | 1,275 | 1,465 | ||||||
| Econ. Dev. Auth., School Facs. Construction Bonds, Series 2018-EEE, 5.00% 2043 | 3,500 | 4,036 | ||||||
| Econ. Dev. Auth., School Facs. Construction Bonds, Series 2018-FFF, 5.00% 2026 | 3,235 | 3,799 | ||||||
| Econ. Dev. Auth., School Facs. Construction Bonds, Series 2019-LLL, 4.00% 2044 | 3,500 | 3,784 | ||||||
| Econ. Dev. Auth., School Facs. Construction Bonds, Series 2019-LLL, 5.00% 2037 | 2,000 | 2,375 | ||||||
| Econ. Dev. Auth., School Facs. Construction Rev. Bonds, Series 2013-NN, 5.00% 2024 | 2,000 | 2,178 | ||||||
| Econ. Dev. Auth., School Facs. Construction Rev. Ref. Bonds, Series 2013-I, (SIFMA Municipal Swap Index + 1.60%) 1.76% 20282 | 13,970 | 13,621 | ||||||
| Econ. Dev. Auth., School Facs. Construction Rev. Ref. Bonds, Series 2015-XX, 5.00% 2021 | 125 | 130 | ||||||
| Econ. Dev. Auth., School Facs. Construction Rev. Ref. Bonds, Series 2015-XX, 5.00% 2025 | 10,500 | 12,133 | ||||||
| American Funds Tax-Exempt Funds | 53 |
American High-Income Municipal Bond Fund
| Bonds, notes & other debt instruments (continued) | Principal amount (000) | Value (000) | ||||||
| New Jersey (continued) | ||||||||
| Econ. Dev. Auth., School Facs. Rev. Bonds (Beloved Community Charter School), Series 2019-A, 4.00% 20291 | $ | 670 | $ | 700 | ||||
| Econ. Dev. Auth., School Facs. Rev. Bonds (Beloved Community Charter School), Series 2019-A, 5.00% 20391 | 825 | 866 | ||||||
| Econ. Dev. Auth., School Facs. Rev. Bonds (Beloved Community Charter School), Series 2019-A, 5.00% 20491 | 930 | 970 | ||||||
| Econ. Dev. Auth., School Facs. Rev. Bonds (Beloved Community Charter School), Series 2019-A, 5.00% 20541 | 725 | 751 | ||||||
| Econ. Dev. Auth., Special Fac. Rev. Bonds (Continental Airlines, Inc. Project), Series 1999, AMT, 5.125% 2023 | 1,500 | 1,537 | ||||||
| Econ. Dev. Auth., Special Fac. Rev. Bonds (Continental Airlines, Inc. Project), Series 1999, AMT, 5.25% 2029 | 23,275 | 23,847 | ||||||
| Econ. Dev. Auth., Special Fac. Rev. Bonds (Continental Airlines, Inc. Project), Series 2003, AMT, 5.50% 2033 | 3,500 | 3,590 | ||||||
| Econ. Dev. Auth., Transit Transportation Project Bonds, Series 2020-A, 4.00% 2037 | 1,850 | 2,019 | ||||||
| Econ. Dev. Auth., Transit Transportation Project Bonds, Series 2020-A, 4.00% 2038 | 6,600 | 7,190 | ||||||
| Econ. Dev. Auth., Transit Transportation Project Bonds, Series 2020-A, 4.00% 2039 | 4,550 | 4,947 | ||||||
| Econ. Dev. Auth., Transit Transportation Project Bonds, Series 2020-A, 5.00% 2044 | 3,000 | 3,490 | ||||||
| Transportation Trust Fund Auth., Transportation Program Bonds, Series 2019-AA, 5.00% 2037 | 1,500 | 1,755 | ||||||
| Transportation Trust Fund Auth., Transportation Program Bonds, Series 2019-BB, 5.00% 2044 | 4,575 | 5,263 | ||||||
| Transportation Trust Fund Auth., Transportation Program Bonds, Series 2019-BB, 5.00% 2050 | 2,500 | 2,857 | ||||||
| Transportation Trust Fund Auth., Transportation System Bonds, Capital Appreciation Bonds, Series 2006-C, AMBAC insured, 0% 2026 | 630 | 544 | ||||||
| Transportation Trust Fund Auth., Transportation System Bonds, Capital Appreciation Bonds, Series 2006-C, AMBAC insured, 0% 2035 | 3,375 | 2,114 | ||||||
| Transportation Trust Fund Auth., Transportation System Bonds, Capital Appreciation Bonds, Series 2006-C, AMBAC insured, 0% 2036 | 9,730 | 5,838 | ||||||
| Transportation Trust Fund Auth., Transportation System Bonds, Capital Appreciation Bonds, Series 2006-C, Assured Guaranty Municipal insured, 0% 2034 | 17,245 | 11,611 | ||||||
| Transportation Trust Fund Auth., Transportation System Bonds, Capital Appreciation Bonds, Series 2006-C, National insured, 0% 2031 | 12,480 | 9,126 | ||||||
| Transportation Trust Fund Auth., Transportation System Bonds, Capital Appreciation Bonds, Series 2008-A, 0% 2035 | 4,000 | 2,468 | ||||||
| Transportation Trust Fund Auth., Transportation System Bonds, Capital Appreciation Bonds, Series 2009-A, 0% 2039 | 11,215 | 5,819 | ||||||
| Transportation Trust Fund Auth., Transportation System Bonds, Capital Appreciation Bonds, Series 2009-C, BAM insured, 0% 2032 | 1,825 | 1,318 | ||||||
| Transportation Trust Fund Auth., Transportation System Bonds, Capital Appreciation Bonds, Series 2010-A, BAM insured, 0% 2027 | 8,245 | 7,055 | ||||||
| Transportation Trust Fund Auth., Transportation System Bonds, Capital Appreciation Bonds, Series 2010-A, BAM insured, 0% 2028 | 9,800 | 7,921 | ||||||
| Transportation Trust Fund Auth., Transportation System Bonds, Capital Appreciation Bonds, Series 2010-B, 0% 2027 | 965 | 804 | ||||||
| Transportation Trust Fund Auth., Transportation System Bonds, Series 2005-B, National insured, 5.50% 2021 | 5,975 | 6,352 | ||||||
| Transportation Trust Fund Auth., Transportation System Bonds, Series 2018-A, 5.00% 2030 | 2,000 | 2,406 | ||||||
| Transportation Trust Fund Auth., Transportation System Bonds, Series 2018-A, 5.00% 2032 | 2,240 | 2,663 | ||||||
| Transportation Trust Fund Auth., Transportation System Bonds, Series 2018-A, 5.00% 2033 | 2,500 | 2,959 | ||||||
| Transportation Trust Fund Auth., Transportation System Bonds, Series 2019-A, 4.00% 2039 | 3,000 | 3,264 | ||||||
| Transportation Trust Fund Auth., Transportation System Bonds, Series 2019-AA, 5.00% 2046 | 4,500 | 5,161 | ||||||
| Transportation Trust Fund Auth., Transportation System Bonds, Series 2019-BB, 4.00% 2037 | 5,000 | 5,425 | ||||||
| Other securities | 86,046 | |||||||
| 334,114 | ||||||||
| 54 | American Funds Tax-Exempt Funds |
American High-Income Municipal Bond Fund
| Principal amount (000) | Value (000) | |||||||
| New York 4.28% | ||||||||
| Brooklyn Arena Local Dev. Corp., PILOT Rev. Ref. Bonds (Barclays Center), Series 2016-A, Assured Guaranty Municipal insured, 5.00% 2042 | $ | 27,830 | $ | 29,921 | ||||
| New York City Municipal Water Fin. Auth., Water and Sewer System Second General Resolution Rev. Bonds, Fiscal 2020, Series 2020-DD-1, 4.00% 2050 | 8,750 | 10,482 | ||||||
| Transportation Dev. Corp., Special Fac. Rev. Bonds (American Airlines, Inc. John F. Kennedy International Airport Project), Series 2020, AMT, 5.25% 2031 | 11,870 | 12,395 | ||||||
| Transportation Dev. Corp., Special Fac. Rev. Bonds (American Airlines, Inc. John F. Kennedy International Airport Project), Series 2020, AMT, 5.375% 2036 | 5,900 | 6,171 | ||||||
| Transportation Dev. Corp., Special Fac. Rev. Ref. Bonds (American Airlines, Inc. John F. Kennedy International Airport Project), Series 2016, AMT, 5.00% 2020 (escrowed to maturity) | 3,970 | 3,970 | ||||||
| Transportation Dev. Corp., Special Fac. Rev. Ref. Bonds (American Airlines, Inc. John F. Kennedy International Airport Project), Series 2016, AMT, 5.00% 2026 | 14,220 | 14,262 | ||||||
| Transportation Dev. Corp., Special Fac. Rev. Ref. Bonds (American Airlines, Inc. John F. Kennedy International Airport Project), Series 2016, AMT, 5.00% 2031 | 4,000 | 4,000 | ||||||
| Transportation Dev. Corp., Special Fac. Rev. Ref. Bonds (Terminal One Group Association, LP Project), Series 2015, AMT, 5.00% 2023 | 560 | 598 | ||||||
| Transportation Dev. Corp., Special Facs. Bonds (LaGuardia Airport Terminal B Redev. Project), Series 2016-A, AMT, 4.00% 2032 | 2,000 | 2,109 | ||||||
| Transportation Dev. Corp., Special Facs. Bonds (LaGuardia Airport Terminal B Redev. Project), Series 2016-A, AMT, 4.00% 2033 | 4,500 | 4,732 | ||||||
| Transportation Dev. Corp., Special Facs. Bonds (LaGuardia Airport Terminal B Redev. Project), Series 2016-A, AMT, 5.00% 2041 | 3,250 | 3,551 | ||||||
| Transportation Dev. Corp., Special Facs. Bonds (LaGuardia Airport Terminal B Redev. Project), Series 2016-A, AMT, 5.00% 2046 | 3,300 | 3,588 | ||||||
| Transportation Dev. Corp., Special Facs. Bonds (LaGuardia Airport Terminal B Redev. Project), Series 2016-A, AMT, 5.25% 2050 | 16,950 | 18,552 | ||||||
| Transportation Dev. Corp., Special Facs. Rev. Bonds (Delta Air Lines, Inc. LaGuardia Airport Terminals C & D Redev. Project), Series 2018, AMT, 4.00% 2036 | 7,000 | 7,146 | ||||||
| Transportation Dev. Corp., Special Facs. Rev. Bonds (Delta Air Lines, Inc. LaGuardia Airport Terminals C & D Redev. Project), Series 2018, AMT, 5.00% 2026 | 1,110 | 1,216 | ||||||
| Transportation Dev. Corp., Special Facs. Rev. Bonds (Delta Air Lines, Inc. LaGuardia Airport Terminals C & D Redev. Project), Series 2018, AMT, 5.00% 2028 | 650 | 724 | ||||||
| Transportation Dev. Corp., Special Facs. Rev. Bonds (Delta Air Lines, Inc. LaGuardia Airport Terminals C & D Redev. Project), Series 2018, AMT, 5.00% 2030 | 3,500 | 3,869 | ||||||
| Transportation Dev. Corp., Special Facs. Rev. Bonds (Delta Air Lines, Inc. LaGuardia Airport Terminals C & D Redev. Project), Series 2018, AMT, 5.00% 2031 | 10,725 | 11,799 | ||||||
| Transportation Dev. Corp., Special Facs. Rev. Bonds (Delta Air Lines, Inc. LaGuardia Airport Terminals C & D Redev. Project), Series 2018, AMT, 5.00% 2032 | 9,000 | 9,863 | ||||||
| Transportation Dev. Corp., Special Facs. Rev. Bonds (Delta Air Lines, Inc. LaGuardia Airport Terminals C & D Redev. Project), Series 2018, AMT, 5.00% 2034 | 5,000 | 5,473 | ||||||
| Other securities | 200,156 | |||||||
| 354,577 | ||||||||
| Ohio 4.68% | ||||||||
| Buckeye Tobacco Settlement Fncg. Auth., Tobacco Settlement Asset-Backed Rev. Ref. Bonds, Capital Appreciation Bonds, Series 2020-B-3, 0% 2057 | 344,335 | 49,870 | ||||||
| Buckeye Tobacco Settlement Fncg. Auth., Tobacco Settlement Asset-Backed Rev. Ref. Bonds, Series 2020-A-2, 4.00% 2048 | 1,500 | 1,680 | ||||||
| Buckeye Tobacco Settlement Fncg. Auth., Tobacco Settlement Asset-Backed Rev. Ref. Bonds, Series 2020-B-2, 5.00% 2055 | 51,280 | 56,601 | ||||||
| County of Lucas, Hospital Rev. Bonds (Promedica Healthcare Obligated Group), Series 2018-A, 5.25% 2048 | 17,675 | 20,022 | ||||||
| Private Activity Bonds (Portsmouth Bypass Project), Series 2015, AMT, Assured Guaranty Municipal insured, 5.00% 2053 | 20,455 | 22,916 | ||||||
| Southeastern Ohio Port Auth., Hospital Facs. Rev. Ref. and Improvement Bonds (Memorial Health System Obligated Group Project), Series 2012, 6.00% 2042 | 16,450 | 17,277 | ||||||
| Other securities | 219,460 | |||||||
| 387,826 | ||||||||
| American Funds Tax-Exempt Funds | 55 |
American High-Income Municipal Bond Fund
| Bonds, notes & other debt instruments (continued) | Principal amount (000) | Value (000) | ||||||
| Pennsylvania 5.54% | ||||||||
| Econ. Dev. Fncg. Auth., Exempt Facs. Rev. Ref. Bonds (National Gypsum Co.), Series 2014, AMT, 5.50% 2044 | $ | 4,500 | $ | 4,630 | ||||
| Econ. Dev. Fncg. Auth., Exempt Facs. Rev. Ref. Bonds (PPL Energy Supply, LLC Project), Series 2009-C, 5.00% 2037 (put 2020) | 17,275 | 17,276 | ||||||
| Econ. Dev. Fncg. Auth., Private Activity Rev. Bonds (The Pennsylvania Rapid Bridge Replacement Project), Series 2015, AMT, 5.00% 2029 | 5,000 | 5,727 | ||||||
| Econ. Dev. Fncg. Auth., Private Activity Rev. Bonds (The Pennsylvania Rapid Bridge Replacement Project), Series 2015, AMT, 5.00% 2034 | 16,300 | 18,140 | ||||||
| Econ. Dev. Fncg. Auth., Private Activity Rev. Bonds (The Pennsylvania Rapid Bridge Replacement Project), Series 2015, AMT, 5.00% 2038 | 14,490 | 15,994 | ||||||
| Econ. Dev. Fncg. Auth., Private Activity Rev. Bonds (The Pennsylvania Rapid Bridge Replacement Project), Series 2015, AMT, 5.00% 2042 | 1,000 | 1,097 | ||||||
| Econ. Dev. Fncg. Auth., Solid Waste Disposal Rev. Bonds (CarbonLite P, LLC Project), Series 2019, AMT, 5.25% 20261 | 2,500 | 2,496 | ||||||
| Econ. Dev. Fncg. Auth., Solid Waste Disposal Rev. Bonds (CarbonLite P, LLC Project), Series 2019, AMT, 5.75% 20361 | 7,290 | 7,193 | ||||||
| Econ. Dev. Fncg. Auth., Solid Waste Disposal Rev. Bonds (Waste Management, Inc. Project), Series 2011, AMT, 2.15% 2041 (put 2024) | 3,000 | 3,127 | ||||||
| Econ. Dev. Fncg. Auth., Solid Waste Disposal Rev. Green Bonds (Covanta Project), Series 2019, AMT, 3.25% 20391 | 5,750 | 5,288 | ||||||
| City of Philadelphia, Industrial Dev. Auth., Rev. Bonds (Mast III Charter School Project), Series 2019-A, 6.50% 2054 | 17,910 | 18,628 | ||||||
| Other securities | 359,678 | |||||||
| 459,274 | ||||||||
| Puerto Rico 5.20% | ||||||||
| Aqueduct and Sewer Auth., Rev. Bonds, Series 2012-A, 5.25% 2042 | 48,205 | 49,711 | ||||||
| Sales Tax Fncg. Corp., Sales Tax Rev. Restructured Bonds, Capital Appreciation Bonds, Series 2018-A-1, 0% 2024 | 301 | 275 | ||||||
| Sales Tax Fncg. Corp., Sales Tax Rev. Restructured Bonds, Capital Appreciation Bonds, Series 2018-A-1, 0% 2027 | 511 | 429 | ||||||
| Sales Tax Fncg. Corp., Sales Tax Rev. Restructured Bonds, Capital Appreciation Bonds, Series 2018-A-1, 0% 2029 | 498 | 392 | ||||||
| Sales Tax Fncg. Corp., Sales Tax Rev. Restructured Bonds, Capital Appreciation Bonds, Series 2018-A-1, 0% 2031 | 641 | 465 | ||||||
| Sales Tax Fncg. Corp., Sales Tax Rev. Restructured Bonds, Capital Appreciation Bonds, Series 2018-A-1, 0% 2033 | 723 | 485 | ||||||
| Sales Tax Fncg. Corp., Sales Tax Rev. Restructured Bonds, Capital Appreciation Bonds, Series 2018-A-1, 0% 2046 | 11,000 | 3,217 | ||||||
| Sales Tax Fncg. Corp., Sales Tax Rev. Restructured Bonds, Capital Appreciation Bonds, Series 2018-A-1, 0% 2051 | 100,270 | 21,149 | ||||||
| Sales Tax Fncg. Corp., Sales Tax Rev. Restructured Bonds, Series 2018-A-1, 4.75% 2053 | 14,201 | 15,130 | ||||||
| Sales Tax Fncg. Corp., Sales Tax Rev. Restructured Bonds, Series 2018-A-1, 5.00% 2058 | 48,813 | 52,867 | ||||||
| Sales Tax Fncg. Corp., Sales Tax Rev. Restructured Bonds, Series 2019-A-2, 4.329% 2040 | 11,158 | 11,647 | ||||||
| Sales Tax Fncg. Corp., Sales Tax Rev. Restructured Bonds, Series 2019-A-2, 4.536% 2053 | 1,022 | 1,074 | ||||||
| Sales Tax Fncg. Corp., Sales Tax Rev. Restructured Bonds, Series 2019-A-2, 4.784% 2058 | 25,200 | 26,924 | ||||||
| Other securities | 247,403 | |||||||
| 431,168 | ||||||||
| Rhode Island 0.92% | ||||||||
| Tobacco Settlement Fin. Corp., Tobacco Settlement Asset-Backed Bonds, Capital Appreciation Bonds, Series 2007-A, 0% 2052 | 119,630 | 18,230 | ||||||
| Other securities | 57,852 | |||||||
| 76,082 | ||||||||
| South Carolina 2.20% | ||||||||
| Public Service Auth., Rev. Obligations (Santee Cooper), Series 2011-C, 5.00% 2036 | 6,700 | 7,017 | ||||||
| Public Service Auth., Rev. Obligations (Santee Cooper), Series 2012-D, 5.00% 2043 | 6,420 | 6,792 | ||||||
| Public Service Auth., Rev. Obligations (Santee Cooper), Series 2013-E, 5.00% 2048 | 2,055 | 2,262 | ||||||
| Public Service Auth., Rev. Obligations (Santee Cooper), Series 2014-A, 5.00% 2049 | 1,000 | 1,114 | ||||||
| Public Service Auth., Rev. Obligations (Santee Cooper), Series 2014-A, 5.50% 2054 | 2,950 | 3,333 | ||||||
| Public Service Auth., Rev. Obligations (Santee Cooper), Series 2014-C, 5.00% 2046 | 100 | 113 | ||||||
| Public Service Auth., Rev. Obligations (Santee Cooper), Series 2015-A, 5.00% 2055 | 3,555 | 4,050 | ||||||
| Public Service Auth., Rev. Obligations (Santee Cooper), Series 2015-E, 5.25% 2055 | 10,280 | 11,981 | ||||||
| 56 | American Funds Tax-Exempt Funds |
American High-Income Municipal Bond Fund
| Principal amount (000) | Value (000) | |||||||
| Public Service Auth., Rev. Obligations (Santee Cooper), Series 2016-A, 5.00% 2032 | $ | 965 | $ | 1,152 | ||||
| Public Service Auth., Rev. Obligations (Santee Cooper), Series 2016-B, 5.00% 2035 | 250 | 300 | ||||||
| Public Service Auth., Rev. Obligations (Santee Cooper), Series 2016-B, 5.00% 2041 | 14,850 | 17,582 | ||||||
| Public Service Auth., Rev. Obligations (Santee Cooper), Series 2016-B, 5.00% 2056 | 45 | 53 | ||||||
| Public Service Auth., Rev. Ref. Obligations (Santee Cooper), Series 2013-B, 5.125% 2043 | 2,215 | 2,455 | ||||||
| Public Service Auth., Rev. Ref. Obligations (Santee Cooper), Series 2014-B, 5.00% 2038 | 3,000 | 3,372 | ||||||
| Public Service Auth., Rev. Ref. Obligations (Santee Cooper), Series 2014-C, 5.00% 2039 | 505 | 575 | ||||||
| Public Service Auth., Rev. Ref. Obligations (Santee Cooper), Series 2015-A, 5.00% 2034 | 6,275 | 7,453 | ||||||
| Public Service Auth., Rev. Ref. Obligations (Santee Cooper), Series 2016-A, 5.00% 2029 | 15 | 18 | ||||||
| Public Service Auth., Rev. Ref. Obligations (Santee Cooper), Series 2016-B, 2.75% 2051 (3.00% on 12/1/2022)4 | 15,255 | 15,215 | ||||||
| Public Service Auth., Rev. Ref. Obligations (Santee Cooper), Series 2016-C, 5.00% 2031 | 2,010 | 2,444 | ||||||
| Other securities | 95,344 | |||||||
| 182,625 | ||||||||
| Texas 5.40% | ||||||||
| Grand Parkway Transportation Corp., Grand Parkway System Toll Rev. Ref. Bonds, Series 2020-C, 4.00% 2049 | 15,220 | 17,993 | ||||||
| County of Harris, Cultural Education Facs. Fin. Corp., First Mortgage Rev. Bonds (Brazos Presbyterian Homes, Inc. Project), Series 2016, 5.00% 2048 | 22,705 | 23,368 | ||||||
| Other securities | 406,416 | |||||||
| 447,777 | ||||||||
| Utah 0.41% | ||||||||
| Hideout Local Dist. No. 1, Special Assessment Bonds, Series 2017, 6.75% 20371 | 26,595 | 25,976 | ||||||
| Other securities | 7,571 | |||||||
| 33,547 | ||||||||
| Virginia 2.74% | ||||||||
| Town of Farmville, Industrial Dev. Auth., Educational Facs. Rev. Ref. Bonds (Longwood University Student Housing Project), Series 2018-A, 5.00% 2055 | 18,305 | 19,628 | ||||||
| City of Newport News, Industrial Dev. Auth., Health Systems Rev. Ref. Bonds (Custodial Receipts), Series 2015, 5.33% 20451 | 27,900 | 31,116 | ||||||
| Other securities | 176,008 | |||||||
| 226,752 | ||||||||
| Wisconsin 1.98% | ||||||||
| Public Fin. Auth., Airport Facs. Rev. Ref. Bonds (Transportation Infrastructure Properties, LLC Obligated Group), Series 2012-B, AMT, 5.00% 2022 | 25 | 26 | ||||||
| Public Fin. Auth., Airport Facs. Rev. Ref. Bonds (Transportation Infrastructure Properties, LLC Obligated Group), Series 2012-B, AMT, 5.00% 2042 | 450 | 467 | ||||||
| Public Fin. Auth., Charter School Rev. Bonds (American Preparatory Academy - Las Vegas 2 Project), Series 2019-A, 4.00% 20291 | 645 | 650 | ||||||
| Public Fin. Auth., Charter School Rev. Bonds (American Preparatory Academy - Las Vegas 2 Project), Series 2019-A, 5.00% 20391 | 1,380 | 1,432 | ||||||
| Public Fin. Auth., Charter School Rev. Bonds (American Preparatory Academy - Las Vegas 2 Project), Series 2019-A, 5.00% 20491 | 3,360 | 3,437 | ||||||
| Public Fin. Auth., Charter School Rev. Bonds (American Preparatory Academy - Las Vegas 2 Project), Series 2019-A, 5.00% 20541 | 1,605 | 1,637 | ||||||
| Public Fin. Auth., Charter School Rev. Bonds (American Preparatory Academy - Las Vegas Project), Series 2017-A, 5.125% 20371 | 1,000 | 1,050 | ||||||
| Public Fin. Auth., Charter School Rev. Bonds (American Preparatory Academy - Las Vegas Project), Series 2017-A, 5.375% 20471 | 6,375 | 6,670 | ||||||
| Public Fin. Auth., Charter School Rev. Bonds (American Preparatory Academy - Las Vegas Project), Series 2017-B, 5.375% 20521 | 2,000 | 2,086 | ||||||
| Public Fin. Auth., Charter School Rev. Bonds (Coral Academy of Science Reno), Series 2019-A, 5.00% 20391 | 710 | 737 | ||||||
| Public Fin. Auth., Charter School Rev. Bonds (Coral Academy of Science Reno), Series 2019-A, 5.00% 20501 | 1,950 | 2,002 | ||||||
| Public Fin. Auth., Education Rev. Bonds (North Carolina Leadership Academy), Series 2019-A, 5.00% 20391 | 820 | 847 | ||||||
| Public Fin. Auth., Education Rev. Bonds (North Carolina Leadership Academy), Series 2019-A, 5.00% 20491 | 520 | 531 | ||||||
| American Funds Tax-Exempt Funds | 57 |
American High-Income Municipal Bond Fund
| Bonds, notes & other debt instruments (continued) | Principal amount (000) | Value (000) | ||||||
| Wisconsin (continued) | ||||||||
| Public Fin. Auth., Education Rev. Bonds (North Carolina Leadership Academy), Series 2019-A, 5.00% 20541 | $ | 1,365 | $ | 1,390 | ||||
| Public Fin. Auth., Exempt Facs. Rev. Ref. Bonds (Celanese Project), Series 2016-A, AMT, 5.00% 20241 | 1,605 | 1,765 | ||||||
| Public Fin. Auth., Exempt Facs. Rev. Ref. Bonds (Celanese Project), Series 2016-A, AMT, 5.00% 20251 | 1,000 | 1,143 | ||||||
| Public Fin. Auth., Exempt Facs. Rev. Ref. Bonds (National Gypsum Co.), Series 2016, AMT, 4.00% 2035 | 9,200 | 8,799 | ||||||
| Public Fin. Auth., Retirement Community Rev. Bonds (Evergreens Obligated Group), Series 2019-A, 5.00% 2044 | 1,750 | 1,855 | ||||||
| Public Fin. Auth., Retirement Community Rev. Bonds (Evergreens Obligated Group), Series 2019-A, 5.00% 2049 | 1,500 | 1,582 | ||||||
| Public Fin. Auth., Retirement Community Rev. Bonds (Lifespace Communities, Inc.), Series 2020-A, 4.00% 2037 | 600 | 667 | ||||||
| Public Fin. Auth., Retirement Community Rev. Bonds (Lifespace Communities, Inc.), Series 2020-A, 5.00% 2041 | 2,000 | 2,368 | ||||||
| Public Fin. Auth., Retirement Fac. Rev. Bonds (Penick Village), Series 2019, 4.00% 20291 | 600 | 589 | ||||||
| Public Fin. Auth., Retirement Fac. Rev. Bonds (Penick Village), Series 2019, 5.00% 20391 | 775 | 788 | ||||||
| Public Fin. Auth., Retirement Fac. Rev. Bonds (Penick Village), Series 2019, 5.00% 20491 | 1,300 | 1,300 | ||||||
| Public Fin. Auth., Retirement Fac. Rev. Bonds (Penick Village), Series 2019, 5.00% 20541 | 1,360 | 1,349 | ||||||
| Public Fin. Auth., Retirement Facs. Rev. Bonds (Friends Homes), Series 2019, 4.00% 20291 | 1,250 | 1,246 | ||||||
| Public Fin. Auth., Retirement Facs. Rev. Bonds (Friends Homes), Series 2019, 5.00% 20391 | 2,230 | 2,302 | ||||||
| Public Fin. Auth., Retirement Facs. Rev. Bonds (Friends Homes), Series 2019, 5.00% 20491 | 6,000 | 6,092 | ||||||
| Public Fin. Auth., Retirement Facs. Rev. Bonds (Friends Homes), Series 2019, 5.00% 20541 | 2,320 | 2,338 | ||||||
| Public Fin. Auth., Rev. Bonds (Roseman University of Health Sciences Project), Series 2012, 5.50% 2032 | 500 | 517 | ||||||
| Public Fin. Auth., Rev. Bonds (Roseman University of Health Sciences Project), Series 2012, 5.75% 2042 | 3,500 | 3,609 | ||||||
| Public Fin. Auth., Rev. Bonds (Roseman University of Health Sciences Project), Series 2015, 5.875% 2045 | 6,250 | 6,774 | ||||||
| Public Fin. Auth., Rev. Bonds (Roseman University of Health Sciences Project), Series 2020, 3.00% 20251 | 425 | 423 | ||||||
| Public Fin. Auth., Rev. Bonds (Roseman University of Health Sciences Project), Series 2020, 5.00% 20301 | 500 | 553 | ||||||
| Public Fin. Auth., Rev. Bonds (Roseman University of Health Sciences Project), Series 2020, 5.00% 20401 | 1,175 | 1,271 | ||||||
| Public Fin. Auth., Rev. Bonds (Wilson Preparatory Academy), Series 2019-A, 4.125% 20291 | 515 | 523 | ||||||
| Public Fin. Auth., Rev. Bonds (Wilson Preparatory Academy), Series 2019-A, 5.00% 20391 | 500 | 512 | ||||||
| Public Fin. Auth., Rev. Bonds (Wilson Preparatory Academy), Series 2019-A, 5.00% 20491 | 1,100 | 1,113 | ||||||
| Public Fin. Auth., Rev. Bonds (Wonderful Foundations Charter School Portfolio Project), Series 2020-A-1, 5.00% 20551 | 5,500 | 5,615 | ||||||
| Public Fin. Auth., Senior Living Rev. Bonds (Mary’s Woods at Marylhurst Project), Series 2017-A, 5.00% 20321 | 1,280 | 1,362 | ||||||
| Public Fin. Auth., Senior Living Rev. Bonds (Mary’s Woods at Marylhurst Project), Series 2017-A, 5.25% 20371 | 650 | 692 | ||||||
| Public Fin. Auth., Senior Living Rev. Bonds (Mary’s Woods at Marylhurst Project), Series 2017-A, 5.25% 20421 | 250 | 264 | ||||||
| Public Fin. Auth., Senior Living Rev. Bonds (Mary’s Woods at Marylhurst Project), Series 2017-A, 5.25% 20471 | 900 | 945 | ||||||
| Public Fin. Auth., Senior Living Rev. Bonds (Mary’s Woods at Marylhurst Project), Series 2017-A, 5.25% 20521 | 2,300 | 2,409 | ||||||
| Public Fin. Auth., Senior Living Rev. Bonds (Rose Villa Project), Series 2014-A, 5.50% 20341 | 1,000 | 1,066 | ||||||
| Public Fin. Auth., Senior Living Rev. Bonds (Rose Villa Project), Series 2014-A, 5.75% 20441 | 1,800 | 1,916 | ||||||
| Public Fin. Auth., Senior Living Rev. Ref. Bonds (Fellowship Senior Living Project), Series 2019-A, 4.00% 2046 | 1,000 | 939 | ||||||
| Public Fin. Auth., Senior Living Rev. Ref. Bonds (Fellowship Senior Living Project), Series 2019-A, 4.00% 2052 | 2,000 | 1,830 | ||||||
| Public Fin. Auth., Student Housing Rev. Bonds (Beyond Boone, LLC - Appalachian State University Project), Series 2019-A, Assured Guaranty Municipal insured, 5.00% 2054 | 1,700 | 1,992 | ||||||
| Public Fin. Auth., Student Housing Rev. Bonds (Beyond Boone, LLC - Appalachian State University Project), Series 2020-A, Assured Guaranty Municipal insured, 4.00% 2059 | 2,400 | 2,622 | ||||||
| Public Fin. Auth., Student Housing Rev. Bonds (CHF-Cullowhee, LLC - Western Carolina University Project), Series 2015, 5.00% 2035 | 1,000 | 1,046 | ||||||
| 58 | American Funds Tax-Exempt Funds |
American High-Income Municipal Bond Fund
| Principal amount (000) | Value (000) | |||||||
| Public Fin. Auth., Student Housing Rev. Bonds (CHF-Cullowhee, LLC - Western Carolina University Project), Series 2015, 5.25% 2047 | $ | 2,000 | $ | 2,078 | ||||
| Public Fin. Auth., Student Housing Rev. Bonds (CHF-Cullowhee, LLC - Western Carolina University Project), Series 2015-A, 5.00% 2030 | 2,140 | 2,275 | ||||||
| Public Fin. Auth., Student Housing Rev. Bonds (CHF-Wilmington, LLC - University of North Carolina Project), Series 2018, Assured Guaranty Municipal insured, 5.00% 2053 | 9,130 | 10,700 | ||||||
| Public Fin. Auth., Student Housing Rev. Bonds (NC A&T Real Estate Foundation, LLC Project), Series 2019-A, 5.00% 2034 | 4,045 | 4,342 | ||||||
| Public Fin. Auth., Student Housing Rev. Bonds (NC A&T Real Estate Foundation, LLC Project), Series 2019-A, 5.00% 2039 | 2,045 | 2,157 | ||||||
| Public Fin. Auth., Student Housing Rev. Bonds (NC A&T Real Estate Foundation, LLC Project), Series 2019-A, 5.00% 2044 | 1,350 | 1,409 | ||||||
| Public Fin. Auth., Student Housing Rev. Bonds (NC A&T Real Estate Foundation, LLC Project), Series 2019-A, 5.00% 2049 | 3,625 | 3,763 | ||||||
| Public Fin. Auth., Student Housing Rev. Bonds (NC A&T Real Estate Foundation, LLC Project), Series 2019-B, 5.00% 2034 | 1,295 | 1,391 | ||||||
| Public Fin. Auth., Student Housing Rev. Bonds (NC A&T Real Estate Foundation, LLC Project), Series 2019-B, 5.00% 2039 | 1,595 | 1,682 | ||||||
| Public Fin. Auth., Student Housing Rev. Bonds (NC A&T Real Estate Foundation, LLC Project), Series 2019-B, 5.00% 2049 | 1,340 | 1,391 | ||||||
| Other securities | 37,366 | |||||||
| 163,692 | ||||||||
| Other states & U.S. territories 16.33% | ||||||||
| Other securities | 1,352,319 | |||||||
| Total bonds, notes & other debt instruments (cost: $7,401,287,000) | 7,664,762 | |||||||
| Short-term securities 6.89% | ||||||||
| State of Colorado, Regents of the University of Colorado, University Enterprise Rev. and Rev. Ref. Bonds, Series 2020-A-2, 0.02% 20502 | 6,100 | 6,100 | ||||||
| State of Colorado, Regents of the University of Colorado, University Enterprise Rev. and Rev. Ref. Bonds, Series 2020-B-1, 0.17% 20502 | 16,000 | 16,000 | ||||||
| State of Illinois, Fin. Auth., Demand Rev. Bonds (University of Chicago Medical Center), Series 2009-E-1, JPMorgan Chase LOC, 0.15% 20432 | 6,270 | 6,270 | ||||||
| State of Illinois, Fin. Auth., Demand Rev. Bonds (University of Chicago Medical Center), Series 2010-A, 0.17% 20442 | 5,900 | 5,900 | ||||||
| State of Illinois, Fin. Auth., Demand Rev. Bonds (University of Chicago Medical Center), Series 2011-A, 0.17% 20442 | 5,600 | 5,600 | ||||||
| State of Massachusetts, Massachusetts Bay Transportation Auth., Sales Tax Bonds, Series 2018-A-1, 0.16% 20262 | 27,290 | 27,290 | ||||||
| State of Michigan, Strategic Fund, Demand Limited Obligation Rev. Bonds (Air Products and Chemicals, Inc. Project), Series 2007, 0.12% 20422 | 30,040 | 30,040 | ||||||
| State of Mississippi, Business Fin. Corp., Gulf Opportunity Zone Industrial Dev. Rev. Bonds (Chevron U.S.A. Inc. Project), Series 2007-E, 0.14% 20302 | 7,500 | 7,500 | ||||||
| State of Mississippi, Business Fin. Corp., Gulf Opportunity Zone Industrial Dev. Rev. Bonds (Chevron U.S.A. Inc. Project), Series 2010-J, 0.14% 20352 | 7,010 | 7,010 | ||||||
| State of Mississippi, Business Fin. Corp., Gulf Opportunity Zone Industrial Dev. Rev. Bonds (Chevron U.S.A. Inc. Project), Series 2011-F, 0.14% 20352 | 2,400 | 2,400 | ||||||
| State of Mississippi, Business Fin. Corp., Gulf Opportunity Zone Industrial Dev. Rev. Bonds (Chevron U.S.A. Inc. Project), Series 2011-G, 0.14% 20352 | 8,900 | 8,900 | ||||||
| State of New York, New York City G.O. Bonds, Fiscal 2006, Series 2006-E-4, 0.16% 20342 | 4,425 | 4,425 | ||||||
| State of New York, New York City G.O. Bonds, Fiscal 2006, Series 2006-I-7, 0.13% 20362 | 8,055 | 8,055 | ||||||
| State of New York, New York City G.O. Bonds, Fiscal 2008, Series 2008-L-3, 0.16% 20362 | 2,100 | 2,100 | ||||||
| State of New York, New York City G.O. Bonds, Fiscal 2008, Series 2008-L-5, 0.16% 20352 | 5,000 | 5,000 | ||||||
| State of New York, New York City G.O. Bonds, Fiscal 2013, Series 2013-F-3, 0.16% 20422 | 15,500 | 15,500 | ||||||
| State of New York, New York City Municipal Water Fin. Auth., Water and Sewer System Second General Resolution Rev. Bonds, Fiscal 2011, Series 2011-DD-2, 0.18% 20432 | 17,050 | 17,050 | ||||||
| State of New York, New York City Municipal Water Fin. Auth., Water and Sewer System Second General Resolution Rev. Bonds, Fiscal 2011, Series 2011-FF-1, 0.16% 20442 | 7,850 | 7,850 | ||||||
| American Funds Tax-Exempt Funds | 59 |
American High-Income Municipal Bond Fund
| Short-term securities (continued) | Principal amount (000) | Value (000) | ||||||
| State of New York, New York City Municipal Water Fin. Auth., Water and Sewer System Second General Resolution Rev. Bonds, Fiscal 2014, Series 2014-AA-2, 0.18% 20502 | $ | 27,975 | $ | 27,975 | ||||
| State of New York, New York City Municipal Water Fin. Auth., Water and Sewer System Second General Resolution Rev. Bonds, Fiscal 2015, Series 2015-BB-1, 0.16% 20492 | 15,080 | 15,080 | ||||||
| State of New York, New York City Municipal Water Fin. Auth., Water and Sewer System Second General Resolution Rev. Bonds, Fiscal 2016, Series 2016-AA-1, 0.16% 20482 | 26,125 | 26,125 | ||||||
| State of New York, New York City Transitional Fin. Auth., Future Tax Secured Bonds, Fiscal 2016, Series 2016-A-4, 0.16% 20412 | 5,075 | 5,075 | ||||||
| State of New York, New York City Transitional Fin. Auth., Future Tax Secured Rev. Ref. Bonds, Fiscal 2015, Series 2015-E-3, 0.18% 20452 | 1,875 | 1,875 | ||||||
| State of New York, New York City Transitional Fin. Auth., Future Tax Secured Rev. Ref. Bonds, Fiscal 2015, Series 2015-E-4, 0.16% 20452 | 15,650 | 15,650 | ||||||
| State of Ohio, Hospital Rev. Bonds (Cleveland Clinic Health System Obligated Group), Series 2013-B-3, 0.13% 20392 | 18,385 | 18,385 | ||||||
| State of Pennsylvania, Econ. Dev. Fncg. Auth., Solid Waste Disposal Rev. Bonds (Republic Services, Inc. Project), Series 2014, AMT, 0.65% 2044 (put 2020)5 | 11,625 | 11,627 | ||||||
| State of Texas, Public Service Auth., IAM Commercial Paper (Santee Cooper), Series 2020-D, 0.30% 9/2/2020 | 10,103 | 10,103 | ||||||
| State of Texas, Tax and Rev. Anticipation Notes, Series 2019, 4.00% 8/27/2020 | 17,625 | 17,668 | ||||||
| State of Texas, Board of Regents of the University of Texas System, IAM Commercial Paper, Series 2020-A, 0.15% 8/18/2020 | 3,000 | 3,000 | ||||||
| State of Texas, Board of Regents of the University of Texas System, IAM Commercial Paper, Series 2020-A, 0.19% 8/11/2020 | 5,000 | 5,000 | ||||||
| State of Texas, Board of Regents of the University of Texas System, IAM Commercial Paper, Series 2020-A, 0.40% 8/10/2020 | 5,000 | 5,000 | ||||||
| State of Texas, Board of Regents of the University of Texas System, Rev. Fncg. System Bonds, Series 2008-B, 0.15% 20252 | 18,195 | 18,195 | ||||||
| State of Texas, Veterans Bonds, Series 2019, 0.28% 20502 | 10,000 | 10,000 | ||||||
| Other securities | 197,105 | |||||||
| Total short-term securities (cost: $570,960,000) | 570,853 | |||||||
| Total investment securities 99.40% (cost: $7,972,247,000) | 8,235,615 | |||||||
| Other assets less liabilities 0.60% | 49,314 | |||||||
| Net assets 100.00% | $ | 8,284,929 | ||||||
This summary investment portfolio is designed to streamline the report and help investors better focus on the fund’s principal holdings. See the inside back cover for details on how to obtain a complete schedule of portfolio holdings.
“Other securities” includes all issues that are not disclosed separately in the summary investment portfolio. “Other securities” includes securities that were valued under fair value procedures adopted by authority of the board of trustees. The total value of securities that were valued under fair value procedures was $9,616,000, which represented .12% of the net assets of the fund. Some securities in “Other securities” (with an aggregate value of $2,726,000, an aggregate cost of $2,963,000, and which represented .03% of the net assets of the fund) were acquired from 8/1/2019 to 6/19/2020 through private placement transactions exempt from registration under the Securities Act of 1933, which may subject them to legal or contractual restrictions on resale.
Futures contracts
| Contracts | Type | Number of contracts | Expiration | Notional amount (000) | 6 | Value at 7/31/2020 (000) | 7 | Unrealized depreciation at 7/31/2020 (000) | |||||||||||||
| 10 Year U.S. Treasury Note Futures | Short | 1,850 | September 2020 | $ | (185,000 | ) | $ | (259,144 | ) | $ | (2,378 | ) | |||||||||
| 30 Year Ultra U.S. Treasury Bond Futures | Short | 13 | September 2020 | (1,300 | ) | (2,960 | ) | (214 | ) | ||||||||||||
| $ | (2,592 | ) | |||||||||||||||||||
| 60 | American Funds Tax-Exempt Funds |
American High-Income Municipal Bond Fund
| 1 | Acquired in a transaction exempt from registration under Rule 144A of the Securities Act of 1933. May be resold in the U.S. in transactions exempt from registration, normally to qualified institutional buyers. The total value of all such securities, including those in “Other securities,” was $1,182,094,000, which represented 14.27% of the net assets of the fund. |
| 2 | Coupon rate may change periodically. Reference rate and spread are as of the most recent information available. Some coupon rates are determined by the issuer or agent based on current market conditions; therefore, the reference rate and spread are not available. For short-term securities, the date of the next scheduled coupon rate change is considered to be the maturity date. |
| 3 | Scheduled interest and/or principal payment was not received. |
| 4 | Step bond; coupon rate may change at a later date. |
| 5 | For short-term securities, the mandatory put date is considered to be the maturity date. |
| 6 | Notional amount is calculated based on the number of contracts and notional contract size. |
| 7 | Value is calculated based on the notional amount and current market price. |
Key to abbreviations and symbol
Agcy. = Agency
AMT = Alternative Minimum Tax
Auth. = Authority
Certs. of Part. = Certificates of Participation
Dept. = Department
Dev. = Development
Dist. = District
Econ. = Economic
Fac. = Facility
Facs. = Facilities
Fin. = Finance
Fncg. = Financing
G.O. = General Obligation
IAM = Interest at Maturity
LIBOR = London Interbank Offered Rate
LOC = Letter of Credit
Preref. = Prerefunded
Redev. = Redevelopment
Ref. = Refunding
Rev. = Revenue
SIFMA = Securities Industry and Financial Markets Association
USD/$ = U.S. dollars
See notes to financial statements.
| American Funds Tax-Exempt Funds | 61 |
The Tax-Exempt Fund of California
Summary investment portfolio July 31, 2020
| Portfolio quality summary* | Percent of net assets |
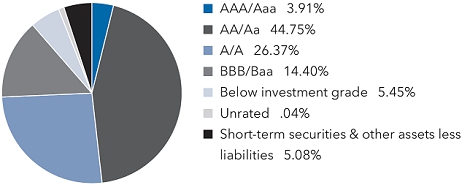
| * | Bond ratings, which typically range from AAA/Aaa (highest) to D (lowest), are assigned by credit rating agencies such as Standard & Poor’s, Moody’s and/or Fitch as an indication of an issuer’s creditworthiness. In assigning a credit rating to a security, the fund looks specifically to the ratings assigned to the issuer of the security by Standard & Poor’s, Moody’s and/or Fitch. If agency ratings differ, the security will be considered to have received the highest of those ratings, consistent with the fund’s investment policies. Securities in the “unrated” category (above) have not been rated by a rating agency; however, the investment adviser performs its own credit analysis and assigns comparable ratings that are used for compliance with the fund’s investment policies. The ratings are not covered by the Report of Independent Registered Public Accounting Firm. |
| Bonds, notes & other debt instruments 94.92% | Principal amount (000) | Value (000) | ||||||
| California 93.33% | ||||||||
| State issuers 34.80% | ||||||||
| Educational Facs. Auth., Rev. Bonds (Art Center College of Design), Series 2018-A, 5.00% 2033 | $ | 1,515 | $ | 1,788 | ||||
| Educational Facs. Auth., Rev. Bonds (Art Center College of Design), Series 2018-A, 5.00% 2034 | 760 | 895 | ||||||
| Educational Facs. Auth., Rev. Bonds (Art Center College of Design), Series 2018-A, 5.00% 2035 | 1,300 | 1,525 | ||||||
| Educational Facs. Auth., Rev. Bonds (Art Center College of Design), Series 2018-A, 5.00% 2036 | 1,000 | 1,170 | ||||||
| Educational Facs. Auth., Rev. Bonds (Art Center College of Design), Series 2018-A, 5.00% 2038 | 1,140 | 1,327 | ||||||
| Educational Facs. Auth., Rev. Bonds (Chapman University), Series 2017-B, 4.00% 2047 | 7,425 | 8,063 | ||||||
| Educational Facs. Auth., Rev. Bonds (Stanford University), Series 2019-V-1, 5.00% 2049 | 1,000 | 1,730 | ||||||
| Educational Facs. Auth., Rev. Bonds (University of San Francisco), Series 2018-A, 5.00% 2053 | 3,985 | 4,724 | ||||||
| Educational Facs. Auth., Rev. Ref. Bonds (Chapman University), Series 2011, 5.00% 2026 | 3,000 | 3,079 | ||||||
| Educational Facs. Auth., Rev. Ref. Bonds (Chapman University), Series 2011, 5.00% 2031 | 11,795 | 12,073 | ||||||
| Educational Facs. Auth., Rev. Ref. Bonds (Chapman University), Series 2015, 5.00% 2032 | 2,500 | 2,864 | ||||||
| Educational Facs. Auth., Rev. Ref. Bonds (Loyola Marymount University), Capital Appreciation Bonds, Series 2001-A, National insured, 0% 2033 | 2,000 | 1,560 | ||||||
| Educational Facs. Auth., Rev. Ref. Bonds (Occidental College), Series 2013-A, 5.00% 2029 (preref. 2023) | 3,265 | 3,753 | ||||||
| Educational Facs. Auth., Rev. Ref. Bonds (University of the Pacific), Series 2015, 5.00% 2030 | 1,000 | 1,175 | ||||||
| Educational Facs. Auth., Rev. Ref. Bonds (University of the Pacific), Series 2015, 5.00% 2032 | 2,500 | 2,909 | ||||||
| G.O. Bonds, Series 2011, 5.25% 2028 | 2,000 | 2,107 | ||||||
| G.O. Bonds, Series 2013-B, (SIFMA Municipal Swap Index + 0.38%) 0.54% 2027 (put 2022)1 | 2,000 | 1,984 | ||||||
| G.O. Bonds, Series 2013-E, (1-month USD-LIBOR + 0.43%) 0.59% 2029 (put 2023)1 | 1,500 | 1,486 | ||||||
| G.O. Bonds, Series 2015, 5.25% 2032 | 5,000 | 6,119 | ||||||
| G.O. Bonds, Series 2019, 5.00% 2029 | 1,000 | 1,392 | ||||||
| G.O. Bonds, Series 2020, 4.00% 2046 | 6,000 | 7,279 | ||||||
| G.O. Bonds, Series 2020, 5.00% 2030 | 1,000 | 1,400 | ||||||
| G.O. Bonds, Series 2020, 5.00% 2035 | 2,500 | 3,404 | ||||||
| G.O. Bonds, Series 2020, 5.00% 2036 | 2,545 | 3,451 | ||||||
| G.O. Rev. Ref. Bonds, Series 2007, Assured Guaranty Municipal insured, 5.25% 2032 | 10,000 | 14,569 | ||||||
| G.O. Rev. Ref. Bonds, Series 2019, 5.00% 2027 | 2,000 | 2,646 | ||||||
| G.O. Rev. Ref. Bonds, Series 2019, 5.00% 2028 | 3,000 | 4,010 | ||||||
| G.O. Rev. Ref. Bonds, Series 2019, 5.00% 2029 | 5,845 | 8,120 | ||||||
| G.O. Rev. Ref. Bonds, Series 2020, 5.00% 2035 | 3,000 | 4,085 | ||||||
| Golden State Tobacco Securitization Corp., Enhanced Tobacco Settlement Asset-Backed Bonds, Capital Appreciation Bonds, Series 2005-A, AMBAC insured, 0% 2027 | 2,730 | 2,520 | ||||||
| 62 | American Funds Tax-Exempt Funds |
The Tax-Exempt Fund of California
| Principal amount (000) | Value (000) | |||||||
| Golden State Tobacco Securitization Corp., Enhanced Tobacco Settlement Asset-Backed Bonds, Capital Appreciation Bonds, Series 2005-A, Assured Guaranty Municipal insured, 0% 2026 | $ | 12,600 | $ | 11,931 | ||||
| Golden State Tobacco Securitization Corp., Enhanced Tobacco Settlement Asset-Backed Bonds, Series 2015-A, 5.00% 2032 | 3,250 | 3,883 | ||||||
| Golden State Tobacco Securitization Corp., Enhanced Tobacco Settlement Asset-Backed Bonds, Series 2015-A, 5.00% 2033 | 1,950 | 2,322 | ||||||
| Golden State Tobacco Securitization Corp., Enhanced Tobacco Settlement Asset-Backed Bonds, Series 2015-A, 5.00% 2045 | 3,580 | 4,178 | ||||||
| Golden State Tobacco Securitization Corp., Enhanced Tobacco Settlement Asset-Backed Bonds, Series 2018-A, 5.00% 2022 | 2,550 | 2,774 | ||||||
| Golden State Tobacco Securitization Corp., Enhanced Tobacco Settlement Asset-Backed Bonds, Series 2018-A-1, 5.00% 2047 | 2,450 | 2,504 | ||||||
| Health Facs. Fncg. Auth., Insured Rev. Bonds (Marshal Medical Center), Series 2020-A, 4.00% 2040 | 4,500 | 5,298 | ||||||
| Health Facs. Fncg. Auth., Insured Rev. Bonds (Marshal Medical Center), Series 2020-A, 5.00% 2050 | 1,000 | 1,269 | ||||||
| Health Facs. Fncg. Auth., Rev. Bonds (Cedars-Sinai Medical Center), Series 2016-A, 5.00% 2036 | 500 | 608 | ||||||
| Health Facs. Fncg. Auth., Rev. Bonds (Children’s Hospital of Orange County), Series 2011-A, 5.25% 2041 | 2,000 | 2,102 | ||||||
| Health Facs. Fncg. Auth., Rev. Bonds (El Camino Hospital), Series 2017, 5.00% 2042 | 2,500 | 2,981 | ||||||
| Health Facs. Fncg. Auth., Rev. Bonds (Kaiser Permanente), Series 2017-A-2, 4.00% 2044 | 12,940 | 14,619 | ||||||
| Health Facs. Fncg. Auth., Rev. Bonds (Kaiser Permanente), Series 2017-A-2, 5.00% 2047 | 1,500 | 2,436 | ||||||
| Health Facs. Fncg. Auth., Rev. Bonds (Lucile Salter Packard Children’s Hospital at Stanford), Series 2014-A, 5.00% 2043 | 1,000 | 1,124 | ||||||
| Health Facs. Fncg. Auth., Rev. Bonds (Lucile Salter Packard Children’s Hospital at Stanford), Series 2016-B, 5.00% 2055 | 2,000 | 2,339 | ||||||
| Health Facs. Fncg. Auth., Rev. Bonds (Lucile Salter Packard Children’s Hospital at Stanford), Series 2017-A, 5.00% 2042 | 1,475 | 1,790 | ||||||
| Health Facs. Fncg. Auth., Rev. Bonds (Lucile Salter Packard Children’s Hospital at Stanford), Series 2017-A, 5.00% 2056 | 2,000 | 2,397 | ||||||
| Health Facs. Fncg. Auth., Rev. Bonds (Presbyterian Homes and Services, Inc.), Series 2015, 5.00% 2022 | 100 | 109 | ||||||
| Health Facs. Fncg. Auth., Rev. Bonds (Presbyterian Homes and Services, Inc.), Series 2015, 5.00% 2031 | 400 | 473 | ||||||
| Health Facs. Fncg. Auth., Rev. Bonds (Presbyterian Homes and Services, Inc.), Series 2015, 5.00% 2039 | 400 | 463 | ||||||
| Health Facs. Fncg. Auth., Rev. Bonds (Providence St. Joseph Health), Series 2016-A, 4.00% 2034 | 500 | 574 | ||||||
| Health Facs. Fncg. Auth., Rev. Bonds (Providence St. Joseph Health), Series 2016-A, 4.00% 2036 | 650 | 739 | ||||||
| Health Facs. Fncg. Auth., Rev. Bonds (Providence St. Joseph Health), Series 2016-B-2, 4.00% 2036 (put 2024) | 2,000 | 2,281 | ||||||
| Health Facs. Fncg. Auth., Rev. Bonds (Rady Children’s Hospital - San Diego), Series 2011, 5.25% 2041 | 5,000 | 5,213 | ||||||
| Health Facs. Fncg. Auth., Rev. Bonds (St. Joseph Health System), Series 2013-A, 5.00% 2024 | 405 | 458 | ||||||
| Health Facs. Fncg. Auth., Rev. Bonds (Sutter Health), Series 2011-D, 5.25% 2031 | 2,000 | 2,099 | ||||||
| Health Facs. Fncg. Auth., Rev. Bonds (Sutter Health), Series 2018-A, 5.00% 2035 | 1,500 | 1,869 | ||||||
| Health Facs. Fncg. Auth., Rev. Bonds (Sutter Health), Series 2018-A, 5.00% 2036 | 2,000 | 2,484 | ||||||
| Health Facs. Fncg. Auth., Rev. Bonds (Sutter Health), Series 2018-A, 5.00% 2037 | 1,000 | 1,239 | ||||||
| Health Facs. Fncg. Auth., Rev. Green Bonds (Kaiser Permanente), Series 2017-A-1, 5.00% 2027 | 1,250 | 1,612 | ||||||
| Health Facs. Fncg. Auth., Rev. Green Bonds (Kaiser Permanente), Series 2017-C, 5.00% 2031 (put 2022) | 3,020 | 3,339 | ||||||
| Health Facs. Fncg. Auth., Rev. Ref. Bonds (Catholic Healthcare West), Series 2011-A, 5.25% 2041 | 2,000 | 2,048 | ||||||
| Health Facs. Fncg. Auth., Rev. Ref. Bonds (Cedars-Sinai Medical Center), Series 2015, 5.00% 2030 | 500 | 606 | ||||||
| Health Facs. Fncg. Auth., Rev. Ref. Bonds (Cedars-Sinai Medical Center), Series 2015, 5.00% 2031 | 1,300 | 1,571 | ||||||
| Health Facs. Fncg. Auth., Rev. Ref. Bonds (El Camino Hospital), Series 2015-A, 5.00% 2030 | 3,000 | 3,516 | ||||||
| Health Facs. Fncg. Auth., Rev. Ref. Bonds (El Camino Hospital), Series 2015-A, 5.00% 2040 | 8,700 | 9,907 | ||||||
| American Funds Tax-Exempt Funds | 63 |
The Tax-Exempt Fund of California
| Bonds, notes & other debt instruments (continued) | Principal amount (000) | Value (000) | ||||||
| California (continued) | ||||||||
| State issuers (continued) | ||||||||
| Health Facs. Fncg. Auth., Rev. Ref. Bonds (Memorial Health Services), Series 2012-A, 5.00% 2033 | $ | 1,000 | $ | 1,084 | ||||
| Health Facs. Fncg. Auth., Rev. Ref. Bonds (St. Joseph Health System), Series 2009-D, 1.70% 2033 (put 2022) | 1,000 | 1,027 | ||||||
| Health Facs. Fncg. Auth., Rev. Ref. Bonds (Stanford Health Care), Series 2017-A, 5.00% 2034 | 9,000 | 11,307 | ||||||
| Health Facs. Fncg. Auth., Rev. Ref. Bonds (Sutter Health), Series 2008-A, 5.25% 2022 | 1,700 | 1,748 | ||||||
| Health Facs. Fncg. Auth., Rev. Ref. Bonds (Sutter Health), Series 2016-A, 5.00% 2034 | 2,000 | 2,392 | ||||||
| Health Facs. Fncg. Auth., Rev. Ref. Bonds (Sutter Health), Series 2016-A, 5.00% 2035 | 2,000 | 2,386 | ||||||
| Health Facs. Fncg. Auth., Rev. Ref. Bonds (Sutter Health), Series 2016-B, 4.00% 2038 | 4,165 | 4,747 | ||||||
| Health Facs. Fncg. Auth., Rev. Ref. Bonds (Sutter Health), Series 2016-B, 5.00% 2035 | 1,000 | 1,213 | ||||||
| Health Facs. Fncg. Auth., Rev. Ref. Bonds (Sutter Health), Series 2016-B, 5.00% 2046 | 8,740 | 10,399 | ||||||
| Housing Fin. Agcy., Municipal Certificates, Series 2019-A-2, 4.00% 2033 | 25,629 | 28,132 | ||||||
| Imperial Irrigation Dist., Electric System Rev. Ref. Bonds, Series 2017, 4.00% 2036 | 6,915 | 8,159 | ||||||
| Imperial Irrigation Dist., Electric System Rev. Ref. Bonds, Series 2017, 4.00% 2041 | 7,200 | 8,342 | ||||||
| Infrastructure and Econ. Dev. Bank, Charter School Rev. Bonds (Equitable School Revolving Fund), Series 2019-B, 5.00% 2039 | 300 | 362 | ||||||
| Infrastructure and Econ. Dev. Bank, Charter School Rev. Bonds (Equitable School Revolving Fund), Series 2019-B, 5.00% 2044 | 350 | 419 | ||||||
| Infrastructure and Econ. Dev. Bank, Charter School Rev. Bonds (Equitable School Revolving Fund), Series 2019-B, 5.00% 2049 | 875 | 1,039 | ||||||
| Infrastructure and Econ. Dev. Bank, Rev. Bonds (Performing Arts Center of Los Angeles County), Series 2007, 5.00% 2027 | 1,000 | 1,003 | ||||||
| Infrastructure and Econ. Dev. Bank, Rev. Bonds (Performing Arts Center of Los Angeles County), Series 2007, 5.00% 2037 | 1,500 | 1,504 | ||||||
| Infrastructure and Econ. Dev. Bank, Rev. Bonds (Stanford Consortium Project), Series 2016-A, 5.00% 2030 | 1,080 | 1,342 | ||||||
| Infrastructure and Econ. Dev. Bank, Rev. Bonds (Stanford Consortium Project), Series 2016-A, 5.00% 2031 | 1,230 | 1,521 | ||||||
| Infrastructure and Econ. Dev. Bank, Rev. Bonds (Stanford Consortium Project), Series 2016-A, 5.00% 2032 | 1,140 | 1,405 | ||||||
| Infrastructure and Econ. Dev. Bank, Rev. Bonds (Stanford Consortium Project), Series 2016-A, 5.00% 2033 | 1,105 | 1,359 | ||||||
| Infrastructure and Econ. Dev. Bank, Rev. Bonds (The Colburn School), Series 2015-B, (SIFMA Municipal Swap Index + 1.20%) 1.36% 2037 (put 2022)1 | 8,500 | 8,541 | ||||||
| Infrastructure and Econ. Dev. Bank, Rev. Bonds (The Colburn School), Series 2019, 1.75% 2055 (put 2026) | 8,000 | 8,135 | ||||||
| Infrastructure and Econ. Dev. Bank, Rev. Ref. Bonds (Academy of Sciences, San Francisco), Series 2018-C, (3-month USD-LIBOR x 0.70 + 0.38%) 0.496% 2047 (put 2021)1 | 4,925 | 4,890 | ||||||
| Infrastructure and Econ. Dev. Bank, Rev. Ref. Bonds (J. Paul Getty Trust), Series 2011-A-1, (3-month USD-LIBOR x 0.70 + 0.20%) 0.319% 2038 (put 2021)1 | 5,000 | 4,991 | ||||||
| Infrastructure and Econ. Dev. Bank, Rev. Ref. Bonds (J. Paul Getty Trust), Series 2013-A-2, (3-month USD-LIBOR x 0.70 + 0.33%) 0.449% 2047 (put 2022)1 | 3,000 | 2,990 | ||||||
| Infrastructure and Econ. Dev. Bank, Rev. Ref. Bonds (Segerstrom Center for the Arts), Series 2016-B, 5.00% 2026 | 2,000 | 2,264 | ||||||
| Infrastructure and Econ. Dev. Bank, Rev. Ref. Bonds (Segerstrom Center for the Arts), Series 2016-B, 5.00% 2023 | 1,050 | 1,133 | ||||||
| Municipal Fin. Auth., Educational Rev. Bonds (American Heritage Education Foundation Project), Series 2016-A, 5.00% 2036 | 500 | 562 | ||||||
| Municipal Fin. Auth., Educational Rev. Bonds (American Heritage Education Foundation Project), Series 2016-A, 5.00% 2046 | 2,745 | 3,031 | ||||||
| Municipal Fin. Auth., Insured Rev. Bonds (Inland Christian Home), Series 2020, 4.00% 2030 | 1,225 | 1,522 | ||||||
| Municipal Fin. Auth., Insured Rev. Bonds (Inland Christian Home), Series 2020, 4.00% 2039 | 1,225 | 1,453 | ||||||
| Municipal Fin. Auth., Insured Rev. Bonds (Inland Christian Home), Series 2020, 4.00% 2049 | 2,665 | 3,078 | ||||||
| Municipal Fin. Auth., Insured Senior Living Rev. Ref. Bonds (Pilgrim Place in Claremont), Series 2016-A, 5.00% 2031 | 500 | 608 | ||||||
| Municipal Fin. Auth., Jurupa Lease Rev. Ref. Bonds (Wineville Unified School Dist.), Series 2015-A, BAM insured, 5.00% 2042 | 4,500 | 5,196 | ||||||
| Municipal Fin. Auth., Rev. Bonds (Biola University), Series 2013, 5.00% 2042 | 1,000 | 1,078 | ||||||
| Municipal Fin. Auth., Rev. Bonds (California Baptist University), Series 2015-A, 5.375% 20402 | 2,335 | 2,477 | ||||||
| Municipal Fin. Auth., Rev. Bonds (California Baptist University), Series 2015-A, 5.50% 20452 | 2,800 | 2,968 | ||||||
| Municipal Fin. Auth., Rev. Bonds (California Baptist University), Series 2016-A, 4.00% 20212 | 600 | 605 | ||||||
| Municipal Fin. Auth., Rev. Bonds (California Baptist University), Series 2016-A, 5.00% 20362 | 3,500 | 3,693 | ||||||
| 64 | American Funds Tax-Exempt Funds |
The Tax-Exempt Fund of California
| Principal amount (000) | Value (000) | |||||||
| Municipal Fin. Auth., Rev. Bonds (California Baptist University), Series 2016-A, 5.00% 20462 | $ | 750 | $ | 778 | ||||
| Municipal Fin. Auth., Rev. Bonds (California Lutheran University), Series 2018, 5.00% 2027 | 300 | 360 | ||||||
| Municipal Fin. Auth., Rev. Bonds (California Lutheran University), Series 2018, 5.00% 2028 | 150 | 183 | ||||||
| Municipal Fin. Auth., Rev. Bonds (California Lutheran University), Series 2018, 5.00% 2029 | 225 | 274 | ||||||
| Municipal Fin. Auth., Rev. Bonds (California Lutheran University), Series 2018, 5.00% 2030 | 225 | 272 | ||||||
| Municipal Fin. Auth., Rev. Bonds (California Lutheran University), Series 2018, 5.00% 2031 | 200 | 241 | ||||||
| Municipal Fin. Auth., Rev. Bonds (California Lutheran University), Series 2018, 5.00% 2032 | 225 | 269 | ||||||
| Municipal Fin. Auth., Rev. Bonds (California Lutheran University), Series 2018, 5.00% 2033 | 225 | 268 | ||||||
| Municipal Fin. Auth., Rev. Bonds (Caritas Mobile Home Park), Series 2014-A, 5.25% 2049 | 1,750 | 1,924 | ||||||
| Municipal Fin. Auth., Rev. Bonds (Caritas Mobile Home Park), Series 2014-B, 5.875% 2049 | 490 | 533 | ||||||
| Municipal Fin. Auth., Rev. Bonds (Clinicas Del Camino Real, Inc.), Series 2020, 3.00% 2022 | 965 | 994 | ||||||
| Municipal Fin. Auth., Rev. Bonds (Clinicas Del Camino Real, Inc.), Series 2020, 4.00% 2023 | 1,195 | 1,283 | ||||||
| Municipal Fin. Auth., Rev. Bonds (Clinicas Del Camino Real, Inc.), Series 2020, 4.00% 2025 | 1,295 | 1,454 | ||||||
| Municipal Fin. Auth., Rev. Bonds (Clinicas Del Camino Real, Inc.), Series 2020, 4.00% 2033 | 1,170 | 1,346 | ||||||
| Municipal Fin. Auth., Rev. Bonds (Clinicas Del Camino Real, Inc.), Series 2020, 4.00% 2035 | 500 | 569 | ||||||
| Municipal Fin. Auth., Rev. Bonds (Clinicas Del Camino Real, Inc.), Series 2020, 4.00% 2040 | 2,750 | 3,061 | ||||||
| Municipal Fin. Auth., Rev. Bonds (Clinicas Del Camino Real, Inc.), Series 2020, 4.00% 2050 | 4,000 | 4,370 | ||||||
| Municipal Fin. Auth., Rev. Bonds (Community Medical Centers), Series 2017-A, 5.00% 2022 | 1,300 | 1,379 | ||||||
| Municipal Fin. Auth., Rev. Bonds (Community Medical Centers), Series 2017-A, 5.00% 2027 | 715 | 875 | ||||||
| Municipal Fin. Auth., Rev. Bonds (John Adams Academies Inc.), Series 2019-A, 5.00% 20392 | 915 | 960 | ||||||
| Municipal Fin. Auth., Rev. Bonds (John Adams Academies Inc.), Series 2019-A, 5.00% 20572 | 1,890 | 1,948 | ||||||
| Municipal Fin. Auth., Rev. Bonds (LINXS APM Project), Series 2018-A, AMT, 4.00% 2047 | 3,900 | 4,209 | ||||||
| Municipal Fin. Auth., Rev. Bonds (LINXS APM Project), Series 2018-A, AMT, 5.00% 2025 | 1,585 | 1,854 | ||||||
| Municipal Fin. Auth., Rev. Bonds (LINXS APM Project), Series 2018-A, AMT, 5.00% 2031 | 2,695 | 3,262 | ||||||
| Municipal Fin. Auth., Rev. Bonds (LINXS APM Project), Series 2018-A, AMT, 5.00% 2034 | 1,320 | 1,576 | ||||||
| Municipal Fin. Auth., Rev. Bonds (LINXS APM Project), Series 2018-A, AMT, 5.00% 2035 | 1,000 | 1,189 | ||||||
| Municipal Fin. Auth., Rev. Bonds (LINXS APM Project), Series 2018-A, AMT, 5.00% 2043 | 3,340 | 3,888 | ||||||
| Municipal Fin. Auth., Rev. Bonds (LINXS APM Project), Series 2018-A, AMT, 5.00% 2047 | 9,115 | 10,560 | ||||||
| Municipal Fin. Auth., Rev. Bonds (Mt. San Antonio Gardens Project), Series 2019, 4.00% 2020 | 260 | 261 | ||||||
| Municipal Fin. Auth., Rev. Bonds (Pomona College), Series 2017, 4.00% 2048 | 1,550 | 1,813 | ||||||
| Municipal Fin. Auth., Rev. Bonds (Retirement Housing Foundation Obligated Group), Series 2017-A, 5.00% 2029 | 390 | 459 | ||||||
| Municipal Fin. Auth., Rev. Bonds (Retirement Housing Foundation Obligated Group), Series 2017-A, 5.00% 2030 | 250 | 297 | ||||||
| Municipal Fin. Auth., Rev. Bonds (Retirement Housing Foundation Obligated Group), Series 2017-A, 5.00% 2031 | 1,250 | 1,494 | ||||||
| Municipal Fin. Auth., Rev. Bonds (Retirement Housing Foundation Obligated Group), Series 2017-A, 5.00% 2032 | 1,175 | 1,406 | ||||||
| Municipal Fin. Auth., Rev. Bonds (Social Bonds - HealthRIGHT 360), Series 2019-A, 5.00% 20392 | 1,250 | 1,370 | ||||||
| Municipal Fin. Auth., Rev. Bonds (Social Bonds - HealthRIGHT 360), Series 2019-A, 5.00% 20492 | 575 | 617 | ||||||
| Municipal Fin. Auth., Rev. Bonds (University of La Verne), Series 2017-A, 5.00% 2029 | 1,000 | 1,224 | ||||||
| Municipal Fin. Auth., Rev. Bonds (University of La Verne), Series 2017-A, 5.00% 2030 | 1,500 | 1,823 | ||||||
| Municipal Fin. Auth., Rev. Bonds (University of La Verne), Series 2017-A, 5.00% 2031 | 650 | 784 | ||||||
| Municipal Fin. Auth., Rev. Bonds (University of La Verne), Series 2017-A, 5.00% 2032 | 1,000 | 1,196 | ||||||
| Municipal Fin. Auth., Rev. Bonds (University of La Verne), Series 2017-A, 5.00% 2033 | 1,000 | 1,191 | ||||||
| Municipal Fin. Auth., Rev. Bonds (University of La Verne), Series 2017-A, 5.00% 2035 | 1,000 | 1,184 | ||||||
| Municipal Fin. Auth., Rev. Bonds (University of La Verne), Series 2017-A, 5.00% 2036 | 1,150 | 1,358 | ||||||
| Municipal Fin. Auth., Rev. Bonds (University of La Verne), Series 2017-A, 5.00% 2043 | 4,380 | 5,095 | ||||||
| Municipal Fin. Auth., Rev. Bonds (University of San Diego), Series 2019-A, 5.00% 2049 | 1,600 | 2,013 | ||||||
| Municipal Fin. Auth., Rev. Ref. Bonds (Azusa Pacific University Project), Series 2015-B, 5.00% 2023 | 600 | 636 | ||||||
| Municipal Fin. Auth., Rev. Ref. Bonds (Azusa Pacific University Project), Series 2015-B, 5.00% 2024 | 600 | 646 | ||||||
| Municipal Fin. Auth., Rev. Ref. Bonds (Azusa Pacific University Project), Series 2015-B, 5.00% 2041 | 2,500 | 2,592 | ||||||
| Municipal Fin. Auth., Rev. Ref. Bonds (Biola University), Series 2017, 5.00% 2030 | 750 | 894 | ||||||
| Municipal Fin. Auth., Rev. Ref. Bonds (Biola University), Series 2017, 5.00% 2033 | 500 | 587 | ||||||
| Municipal Fin. Auth., Rev. Ref. Bonds (Biola University), Series 2017, 5.00% 2034 | 440 | 514 | ||||||
| Municipal Fin. Auth., Rev. Ref. Bonds (Biola University), Series 2017, 5.00% 2039 | 615 | 705 | ||||||
| Municipal Fin. Auth., Rev. Ref. Bonds (Eisenhower Medical Center), Series 2017-A, 5.00% 2033 | 650 | 771 | ||||||
| American Funds Tax-Exempt Funds | 65 |
The Tax-Exempt Fund of California
| Bonds, notes & other debt instruments (continued) | Principal amount (000) | Value (000) | ||||||
| California (continued) | ||||||||
| State issuers (continued) | ||||||||
| Municipal Fin. Auth., Rev. Ref. Bonds (Eisenhower Medical Center), Series 2017-A, 5.00% 2034 | $ | 2,675 | $ | 3,168 | ||||
| Municipal Fin. Auth., Rev. Ref. Bonds (Eisenhower Medical Center), Series 2017-A, 5.00% 2035 | 2,000 | 2,352 | ||||||
| Municipal Fin. Auth., Rev. Ref. Bonds (Eisenhower Medical Center), Series 2017-A, 5.00% 2036 | 1,000 | 1,172 | ||||||
| Municipal Fin. Auth., Rev. Ref. Bonds (Eisenhower Medical Center), Series 2017-A, 5.00% 2037 | 1,250 | 1,462 | ||||||
| Municipal Fin. Auth., Rev. Ref. Bonds (Eisenhower Medical Center), Series 2017-A, 5.00% 2042 | 1,250 | 1,436 | ||||||
| Municipal Fin. Auth., Rev. Ref. Bonds (Eisenhower Medical Center), Series 2017-A, 5.00% 2047 | 1,000 | 1,135 | ||||||
| Municipal Fin. Auth., Rev. Ref. Bonds (Eisenhower Medical Center), Series 2017-B, 5.00% 2033 | 1,450 | 1,721 | ||||||
| Municipal Fin. Auth., Rev. Ref. Bonds (Eisenhower Medical Center), Series 2017-B, 5.00% 2034 | 600 | 711 | ||||||
| Municipal Fin. Auth., Rev. Ref. Bonds (Eisenhower Medical Center), Series 2017-B, 5.00% 2035 | 625 | 735 | ||||||
| Municipal Fin. Auth., Rev. Ref. Bonds (Eisenhower Medical Center), Series 2017-B, 5.00% 2036 | 600 | 703 | ||||||
| Municipal Fin. Auth., Rev. Ref. Bonds (Eisenhower Medical Center), Series 2017-B, 5.00% 2037 | 600 | 702 | ||||||
| Municipal Fin. Auth., Rev. Ref. Bonds (Eisenhower Medical Center), Series 2017-B, 5.00% 2042 | 1,000 | 1,149 | ||||||
| Municipal Fin. Auth., Rev. Ref. Bonds (Eisenhower Medical Center), Series 2017-B, 5.00% 2047 | 4,010 | 4,553 | ||||||
| Municipal Fin. Auth., Rev. Ref. Bonds (Harbor Regional Center Project), Series 2015, 5.00% 2032 | 1,500 | 1,791 | ||||||
| Municipal Fin. Auth., Rev. Ref. Bonds (Harbor Regional Center Project), Series 2015, 5.00% 2039 | 1,000 | 1,179 | ||||||
| Municipal Fin. Auth., Rev. Ref. Bonds (HumanGood Obligated Group), Series 2019-A, 4.00% 2031 | 1,175 | 1,305 | ||||||
| Municipal Fin. Auth., Rev. Ref. Bonds (HumanGood Obligated Group), Series 2019-A, 4.00% 2032 | 500 | 554 | ||||||
| Municipal Fin. Auth., Rev. Ref. Bonds (HumanGood Obligated Group), Series 2019-A, 4.00% 2033 | 1,250 | 1,380 | ||||||
| Municipal Fin. Auth., Rev. Ref. Bonds (HumanGood Obligated Group), Series 2019-A, 4.00% 2034 | 750 | 824 | ||||||
| Municipal Fin. Auth., Rev. Ref. Bonds (HumanGood Obligated Group), Series 2019-A, 4.00% 2035 | 1,185 | 1,299 | ||||||
| Municipal Fin. Auth., Rev. Ref. Bonds (HumanGood Obligated Group), Series 2019-A, 4.00% 2036 | 2,120 | 2,318 | ||||||
| Municipal Fin. Auth., Rev. Ref. Bonds (HumanGood Obligated Group), Series 2019-A, 4.00% 2037 | 2,850 | 3,111 | ||||||
| Municipal Fin. Auth., Rev. Ref. Bonds (HumanGood Obligated Group), Series 2019-A, 4.00% 2039 | 2,750 | 2,987 | ||||||
| Municipal Fin. Auth., Rev. Ref. Bonds (HumanGood Obligated Group), Series 2019-A, 4.00% 2044 | 300 | 323 | ||||||
| Municipal Fin. Auth., Rev. Ref. Bonds (HumanGood Obligated Group), Series 2019-A, 5.00% 2044 | 6,500 | 7,486 | ||||||
| Municipal Fin. Auth., Rev. Ref. Bonds (Inland Regional Center Project), Series 2015, 5.00% 2032 | 3,000 | 3,603 | ||||||
| Municipal Fin. Auth., Rev. Ref. Bonds (Inland Regional Center Project), Series 2015, 5.00% 2037 | 4,000 | 4,753 | ||||||
| Municipal Fin. Auth., Rev. Ref. Bonds (Inland Regional Center Project), Series 2015, 5.00% 2045 | 4,000 | 4,697 | ||||||
| Municipal Fin. Auth., Rev. Ref. Bonds (University of San Diego), Series 2011-B, 5.00% 2031 | 1,750 | 1,848 | ||||||
| Municipal Fin. Auth., Rev. Ref. Bonds (University of San Diego), Series 2012-A, 5.00% 2031 | 1,475 | 1,621 | ||||||
| Municipal Fin. Auth., Rev. Ref. Bonds (University of San Diego), Series 2012-A, 5.00% 2032 | 1,000 | 1,099 | ||||||
| Municipal Fin. Auth., Solid Waste Disposal Rev. Bonds (Waste Management, Inc. Project), Series 2009-A, 1.30% 2039 (put 2025)2 | 1,450 | 1,469 | ||||||
| Municipal Fin. Auth., Solid Waste Disposal Rev. Bonds (Waste Management, Inc. Project), Series 2017-A, AMT, 2.00% 2044 (put 2020) | 4,900 | 4,926 | ||||||
| 66 | American Funds Tax-Exempt Funds |
The Tax-Exempt Fund of California
| Principal amount (000) | Value (000) | |||||||
| Municipal Fin. Auth., Student Housing Rev. Bonds (CHF-Davis I, LLC - West Village Student Housing Project), Series 2018, 5.00% 2038 | $ | 1,000 | $ | 1,157 | ||||
| Municipal Fin. Auth., Student Housing Rev. Bonds (CHF-Davis I, LLC - West Village Student Housing Project), Series 2018, 5.00% 2040 | 4,610 | 5,305 | ||||||
| Municipal Fin. Auth., Student Housing Rev. Bonds (CHF-Davis I, LLC - West Village Student Housing Project), Series 2018, 5.00% 2043 | 6,525 | 7,458 | ||||||
| Municipal Fin. Auth., Student Housing Rev. Bonds (CHF-Riverside I, LLC - UCR Student Housing Project), Series 2018, 5.00% 2043 | 2,000 | 2,287 | ||||||
| Municipal Fin. Auth., Student Housing Rev. Bonds (CHF-Riverside I, LLC - UCR Student Housing Project), Series 2018, 5.00% 2052 | 7,500 | 8,501 | ||||||
| Municipal Fin. Auth., Student Housing Rev. Bonds (CHF-Riverside II, LLC - UCR Student Housing Project), Series 2019, 5.00% 2049 | 2,510 | 2,885 | ||||||
| Municipal Fin. Auth., Student Housing Rev. Bonds (CHF-Riverside II, LLC - UCR Student Housing Project), Series 2019, 5.00% 2052 | 3,500 | 4,016 | ||||||
| Pollution Control Fncg. Auth., Rev. Bonds (San Jose Water Co. Project), Series 2016, AMT, 4.75% 2046 | 11,475 | 13,237 | ||||||
| School Fin. Auth., Charter School Rev. Bonds (Classical Academies Project), Series 2013-A-1, 7.375% 2043 (preref. 2022) | 3,420 | 3,878 | ||||||
| School Fin. Auth., Charter School Rev. Bonds (Classical Academies Project), Series 2017-A, 4.00% 20272 | 750 | 775 | ||||||
| School Fin. Auth., Charter School Rev. Bonds (Classical Academies Project), Series 2017-A, 5.00% 20322 | 2,500 | 2,688 | ||||||
| School Fin. Auth., Charter School Rev. Bonds (Classical Academies Project), Series 2017-A, 5.00% 20372 | 1,485 | 1,578 | ||||||
| School Fin. Auth., Charter School Rev. Bonds (Classical Academies Project), Series 2017-A, 5.00% 20442 | 2,805 | 2,937 | ||||||
| School Fin. Auth., Charter School Rev. Bonds (Downtown College Prep Obligated Group), Series 2016, 4.75% 20362 | 1,365 | 1,426 | ||||||
| School Fin. Auth., Charter School Rev. Bonds (Equitas Academy Obligated Group), Series 2018-A, 5.00% 20292 | 3,345 | 3,746 | ||||||
| School Fin. Auth., Charter School Rev. Bonds (Equitas Academy Obligated Group), Series 2018-A, 5.00% 20412 | 3,000 | 3,196 | ||||||
| School Fin. Auth., Charter School Rev. Bonds (Equitas Academy Obligated Group), Series 2018-A, 5.00% 20482 | 2,795 | 2,960 | ||||||
| School Fin. Auth., Charter School Rev. Bonds (Equitas Academy Obligated Group), Series 2018-A, 5.00% 20352 | 500 | 540 | ||||||
| School Fin. Auth., Charter School Rev. Bonds (Fenton Charter Public Schools Obligated Group), Series 2020-A, 5.00% 20402 | 750 | 800 | ||||||
| School Fin. Auth., Charter School Rev. Bonds (Fenton Charter Public Schools Obligated Group), Series 2020-A, 5.00% 20502 | 750 | 792 | ||||||
| School Fin. Auth., Charter School Rev. Bonds (Fenton Charter Public Schools Obligated Group), Series 2020-A, 5.00% 20582 | 1,000 | 1,048 | ||||||
| School Fin. Auth., Charter School Rev. Bonds (Larchmont Charter School Project), Series 2018-A, 5.00% 20552 | 1,000 | 1,036 | ||||||
| School Fin. Auth., Charter School Rev. Bonds (Rocketship Education Obligated Group), Series 2016-A, 5.00% 20362 | 1,000 | 1,054 | ||||||
| School Fin. Auth., Charter School Rev. Bonds (Rocketship Education Obligated Group), Series 2016-A, 5.00% 20462 | 750 | 780 | ||||||
| School Fin. Auth., Charter School Rev. Bonds (Rocketship Education Obligated Group), Series 2017-A, 5.00% 20342 | 750 | 801 | ||||||
| School Fin. Auth., Charter School Rev. Bonds (Rocketship Public Schools Obligated Group), Series 2017-G, 5.00% 20302 | 315 | 345 | ||||||
| School Fin. Auth., Charter School Rev. Bonds (Rocketship Public Schools Obligated Group), Series 2017-G, 5.00% 20472 | 250 | 263 | ||||||
| School Fin. Auth., Educational Facs. Rev. Bonds (River Springs Charter School Project), Series 2015-A, 6.375% 20462 | 4,300 | 4,806 | ||||||
| School Fin. Auth., Educational Facs. Rev. Bonds (River Springs Charter School Project), Series 2017-A, 5.00% 20302 | 1,890 | 2,046 | ||||||
| School Fin. Auth., Educational Facs. Rev. Bonds (River Springs Charter School Project), Series 2017-A, 5.00% 20372 | 2,105 | 2,197 | ||||||
| School Fin. Auth., School Fac. Rev. Bonds (Granada Hills Charter Obligated Group), Series 2019, 5.00% 20432 | 1,750 | 1,935 | ||||||
| School Fin. Auth., School Fac. Rev. Bonds (Granada Hills Charter Obligated Group), Series 2019, 5.00% 20492 | 1,900 | 2,090 | ||||||
| American Funds Tax-Exempt Funds | 67 |
The Tax-Exempt Fund of California
| Bonds, notes & other debt instruments (continued) | Principal amount (000) | Value (000) | ||||||
| California (continued) | ||||||||
| State issuers (continued) | ||||||||
| School Fin. Auth., School Fac. Rev. Bonds (Granada Hills Charter Obligated Group), Series 2019, 5.00% 20542 | $ | 5,000 | $ | 5,489 | ||||
| School Fin. Auth., School Fac. Rev. Bonds (KIPP LA Projects), Series 2017-A, 5.00% 20372 | 675 | 783 | ||||||
| School Fin. Auth., School Fac. Rev. Bonds (KIPP SoCal Projects), Series 2019-A, 5.00% 20542 | 2,150 | 2,517 | ||||||
| School Fin. Auth., School Fac. Rev. Ref. Bonds (High Tech High Learning Project), Series 2017-A, 5.00% 20372 | 1,455 | 1,645 | ||||||
| School Fin. Auth., School Fac. Rev. Ref. Bonds (High Tech High Learning Project), Series 2017-A, 5.00% 20492 | 5,400 | 6,030 | ||||||
| Statewide Communities Dev. Auth., Health Fac. Rev. Ref. Bonds (Los Angeles Jewish Home for the Aging), Series 2019-A, 5.00% 2034 | 750 | 963 | ||||||
| Statewide Communities Dev. Auth., Health Fac. Rev. Ref. Bonds (Los Angeles Jewish Home for the Aging), Series 2019-A, 5.00% 2037 | 735 | 933 | ||||||
| Statewide Communities Dev. Auth., Health Fac. Rev. Ref. Bonds (Los Angeles Jewish Home for the Aging), Series 2019-B, 5.00% 2031 | 1,300 | 1,693 | ||||||
| Statewide Communities Dev. Auth., Health Fac. Rev. Ref. Bonds (Los Angeles Jewish Home for the Aging), Series 2019-B, 5.00% 2032 | 500 | 647 | ||||||
| Statewide Communities Dev. Auth., Health Fac. Rev. Ref. Bonds (Los Angeles Jewish Home for the Aging), Series 2019-B, 5.00% 2033 | 1,000 | 1,287 | ||||||
| Statewide Communities Dev. Auth., Hospital Rev. Ref. Bonds (Methodist Hospital of Southern California), Series 2018, 5.00% 2030 | 2,585 | 3,197 | ||||||
| Statewide Communities Dev. Auth., Hospital Rev. Ref. Bonds (Methodist Hospital of Southern California), Series 2018, 5.00% 2038 | 1,000 | 1,194 | ||||||
| Statewide Communities Dev. Auth., Hospital Rev. Ref. Bonds (Methodist Hospital of Southern California), Series 2018, 5.00% 2043 | 2,000 | 2,351 | ||||||
| Statewide Communities Dev. Auth., Hospital Rev. Ref. Bonds (Methodist Hospital of Southern California), Series 2018, 5.00% 2048 | 1,500 | 1,744 | ||||||
| Statewide Communities Dev. Auth., Multi Family Housing Rev. Bonds (La Mesa Springs Apartments), Series 2019-E, 1.78% 2021 (put 2020) | 7,000 | 7,034 | ||||||
| Statewide Communities Dev. Auth., Multi Family Housing Rev. Bonds (Miramar Tower Apartments), Series 2019-M, 1.30% 2022 (put 2021) | 1,500 | 1,510 | ||||||
| Statewide Communities Dev. Auth., Multi Family Housing Rev. Bonds (Robert Farrell Manor and Western Gardens Apartments), Series 2019-T-1, 1.25% 2021 (put 2021) | 2,310 | 2,322 | ||||||
| Statewide Communities Dev. Auth., Pollution Control Rev. Ref. Bonds (Southern California Edison Co.), Series 2010-A, 4.50% 2029 | 2,905 | 2,912 | ||||||
| Statewide Communities Dev. Auth., Rev. Bonds (Adventist Health System/West), Series 2015-A, 5.00% 2031 | 2,000 | 2,404 | ||||||
| Statewide Communities Dev. Auth., Rev. Bonds (Adventist Health System/West), Series 2015-A, 5.00% 2032 | 2,115 | 2,532 | ||||||
| Statewide Communities Dev. Auth., Rev. Bonds (Adventist Health System/West), Series 2015-A, 5.00% 2035 | 3,000 | 3,559 | ||||||
| Statewide Communities Dev. Auth., Rev. Bonds (Adventist Health System/West), Series 2018-A, 4.00% 2042 | 1,240 | 1,410 | ||||||
| Statewide Communities Dev. Auth., Rev. Bonds (Adventist Health System/West), Series 2018-A, 5.00% 2032 | 1,000 | 1,256 | ||||||
| Statewide Communities Dev. Auth., Rev. Bonds (Adventist Health System/West), Series 2018-A, 5.00% 2033 | 1,150 | 1,437 | ||||||
| Statewide Communities Dev. Auth., Rev. Bonds (Adventist Health System/West), Series 2018-A, 5.00% 2035 | 1,465 | 1,818 | ||||||
| Statewide Communities Dev. Auth., Rev. Bonds (American Baptist Homes of the West), Series 2015, 5.00% 2020 | 15 | 15 | ||||||
| Statewide Communities Dev. Auth., Rev. Bonds (American Baptist Homes of the West), Series 2015, 5.00% 2021 | 335 | 348 | ||||||
| Statewide Communities Dev. Auth., Rev. Bonds (American Baptist Homes of the West), Series 2015, 5.00% 2022 | 270 | 289 | ||||||
| Statewide Communities Dev. Auth., Rev. Bonds (American Baptist Homes of the West), Series 2015, 5.00% 2026 | 75 | 85 | ||||||
| Statewide Communities Dev. Auth., Rev. Bonds (American Baptist Homes of the West), Series 2015, 5.00% 2045 | 1,700 | 1,854 | ||||||
| Statewide Communities Dev. Auth., Rev. Bonds (Buck Institute for Research on Aging), Series 2014, Assured Guaranty Municipal insured, 5.00% 2049 | 5,250 | 5,996 | ||||||
| Statewide Communities Dev. Auth., Rev. Bonds (Covenant Retirement Communities, Inc.), Series 2013-C, 5.625% 2036 | 2,000 | 2,184 | ||||||
| 68 | American Funds Tax-Exempt Funds |
The Tax-Exempt Fund of California
| Principal amount (000) | Value (000) | |||||||
| Statewide Communities Dev. Auth., Rev. Bonds (Front Porch Communities and Services), Series 2017-A, 5.00% 2029 | $ | 405 | $ | 491 | ||||
| Statewide Communities Dev. Auth., Rev. Bonds (Front Porch Communities and Services), Series 2017-A, 5.00% 2047 | 1,815 | 2,061 | ||||||
| Statewide Communities Dev. Auth., Rev. Bonds (Hebrew Home for Aged Disabled), Series 2016, 5.00% 2036 | 3,500 | 4,212 | ||||||
| Statewide Communities Dev. Auth., Rev. Bonds (Huntington Memorial Hospital), Series 2014, 5.00% 2044 | 8,500 | 9,487 | ||||||
| Statewide Communities Dev. Auth., Rev. Bonds (Huntington Memorial Hospital), Series 2018, 4.00% 2048 | 500 | 563 | ||||||
| Statewide Communities Dev. Auth., Rev. Bonds (Kaiser Permanente), Series 2004-L, 5.00% 2038 (put 2029) | 5,000 | 6,778 | ||||||
| Statewide Communities Dev. Auth., Rev. Bonds (Kaiser Permanente), Series 2004-M, 5.00% 2038 (put 2029) | 4,000 | 5,423 | ||||||
| Statewide Communities Dev. Auth., Rev. Bonds (Kaiser Permanente), Series 2012-A, 5.00% 2042 | 6,500 | 6,882 | ||||||
| Statewide Communities Dev. Auth., Rev. Bonds (Lancer Educational Student Housing Project), Series 2019-A, 5.00% 20342 | 100 | 105 | ||||||
| Statewide Communities Dev. Auth., Rev. Bonds (Lancer Educational Student Housing Project), Series 2019-A, 5.00% 20392 | 105 | 109 | ||||||
| Statewide Communities Dev. Auth., Rev. Bonds (Lancer Educational Student Housing Project), Series 2019-A, 5.00% 20512 | 1,590 | 1,617 | ||||||
| Statewide Communities Dev. Auth., Rev. Bonds (Lancer Plaza Project), Series 2013, 5.625% 2033 | 1,350 | 1,428 | ||||||
| Statewide Communities Dev. Auth., Rev. Bonds (Lancer Plaza Project), Series 2013, 5.875% 2043 | 935 | 985 | ||||||
| Statewide Communities Dev. Auth., Rev. Bonds (Loma Linda University Medical Center), Series 2014-A, 5.25% 2044 | 2,925 | 3,171 | ||||||
| Statewide Communities Dev. Auth., Rev. Bonds (Loma Linda University Medical Center), Series 2016-A, 5.25% 20562 | 1,400 | 1,523 | ||||||
| Statewide Communities Dev. Auth., Rev. Bonds (Loma Linda University Medical Center), Series 2018-A, 5.50% 20582 | 1,000 | 1,114 | ||||||
| Statewide Communities Dev. Auth., Rev. Bonds (Redlands Community Hospital), Series 2016, 4.00% 2041 | 1,000 | 1,083 | ||||||
| Statewide Communities Dev. Auth., Rev. Bonds (Redlands Community Hospital), Series 2016, 5.00% 2029 | 625 | 761 | ||||||
| Statewide Communities Dev. Auth., Rev. Bonds (Redlands Community Hospital), Series 2016, 5.00% 2031 | 1,135 | 1,365 | ||||||
| Statewide Communities Dev. Auth., Rev. Bonds (Redlands Community Hospital), Series 2016, 5.00% 2032 | 1,500 | 1,795 | ||||||
| Statewide Communities Dev. Auth., Rev. Bonds (Terraces at San Joaquin Gardens Project), Series 2012-A, 6.00% 2042 | 1,750 | 1,835 | ||||||
| Statewide Communities Dev. Auth., Rev. Bonds (Terraces at San Joaquin Gardens Project), Series 2012-A, 6.00% 2047 | 2,000 | 2,093 | ||||||
| Statewide Communities Dev. Auth., Rev. Bonds (Viamonte Senior Living 1 Project), Series 2018-B, 3.00% 2025 | 1,500 | 1,515 | ||||||
| Statewide Communities Dev. Auth., Rev. Bonds (Viamonte Senior Living 1 Project), Series 2018-B, 3.00% 2026 | 4,000 | 4,039 | ||||||
| Statewide Communities Dev. Auth., Rev. Ref. Bonds (California Baptist University), Series 2017-A, 5.00% 20322 | 2,025 | 2,183 | ||||||
| Statewide Communities Dev. Auth., Rev. Ref. Bonds (California Baptist University), Series 2017-A, 5.00% 20412 | 11,920 | 12,517 | ||||||
| Statewide Communities Dev. Auth., Rev. Ref. Bonds (Enloe Medical Center), Series 2015, 5.00% 2025 | 755 | 900 | ||||||
| Statewide Communities Dev. Auth., Rev. Ref. Bonds (Enloe Medical Center), Series 2015, 5.00% 2031 | 1,000 | 1,223 | ||||||
| Statewide Communities Dev. Auth., Rev. Ref. Bonds (Enloe Medical Center), Series 2015, 5.00% 2034 | 500 | 606 | ||||||
| Statewide Communities Dev. Auth., Rev. Ref. Bonds (Enloe Medical Center), Series 2015, 5.00% 2035 | 5,050 | 6,098 | ||||||
| Statewide Communities Dev. Auth., Rev. Ref. Bonds (Episcopal Communities and Services), Series 2012, 5.00% 2032 | 700 | 737 | ||||||
| Statewide Communities Dev. Auth., Rev. Ref. Bonds (Episcopal Communities and Services), Series 2012, 5.00% 2047 | 2,100 | 2,199 | ||||||
| American Funds Tax-Exempt Funds | 69 |
The Tax-Exempt Fund of California
| Bonds, notes & other debt instruments (continued) | Principal amount (000) | Value (000) | ||||||
| California (continued) | ||||||||
| State issuers (continued) | ||||||||
| Statewide Communities Dev. Auth., Rev. Ref. Bonds (Huntington Memorial Hospital), Series 2014-B, 5.00% 2030 | $ | 500 | $ | 572 | ||||
| Statewide Communities Dev. Auth., Rev. Ref. Bonds (Huntington Memorial Hospital), Series 2014-B, 5.00% 2031 | 1,750 | 1,996 | ||||||
| Statewide Communities Dev. Auth., Rev. Ref. Bonds (Lancer Educational Student Housing Project), Series 2016-A, 4.00% 20262 | 3,385 | 3,414 | ||||||
| Statewide Communities Dev. Auth., Rev. Ref. Bonds (Lancer Educational Student Housing Project), Series 2016-A, 5.00% 20362 | 3,500 | 3,608 | ||||||
| Statewide Communities Dev. Auth., Rev. Ref. Bonds (Lancer Educational Student Housing Project), Series 2016-A, 5.00% 20462 | 2,250 | 2,283 | ||||||
| Statewide Communities Dev. Auth., Rev. Ref. Bonds (Rady Children’s Hospital), Series 2016-B, 5.00% 2027 | 640 | 823 | ||||||
| Statewide Communities Dev. Auth., Rev. Ref. Bonds (Trinity Health Credit Group), Series 2011, 5.00% 2041 (preref. 2021) | 1,500 | 1,594 | ||||||
| Statewide Communities Dev. Auth., Senior Living Health Fac. Rev. Bonds (Los Angeles Jewish Home for the Aging - Fountainview at Gonda), Series 2014-A, 5.00% 2044 | 1,000 | 1,086 | ||||||
| Statewide Communities Dev. Auth., Student Housing Rev. Bonds (Custodial Receipts), Series 2017, 4.305% 2032 | 9,295 | 9,527 | ||||||
| Statewide Communities Dev. Auth., Student Housing Rev. Ref. Bonds (CHF-Irvine, LLC - University of California, Irvine East Campus Apartments), Series 2016, 5.00% 2029 | 1,000 | 1,147 | ||||||
| Statewide Communities Dev. Auth., Student Housing Rev. Ref. Bonds (CHF-Irvine, LLC - University of California, Irvine East Campus Apartments), Series 2016, 5.00% 2030 | 1,500 | 1,715 | ||||||
| Statewide Communities Dev. Auth., Student Housing Rev. Ref. Bonds (CHF-Irvine, LLC - University of California, Irvine East Campus Apartments), Series 2016, 5.00% 2035 | 1,250 | 1,397 | ||||||
| Statewide Communities Dev. Auth., Student Housing Rev. Ref. Bonds (CHF-Irvine, LLC - University of California, Irvine East Campus Apartments, Phase I), Series 2011, 5.375% 2038 | 1,260 | 1,289 | ||||||
| Regents of the University of California, G.O. Rev. Bonds, Series 2013-AK, 5.00% 2048 (put 2023) | 3,490 | 3,947 | ||||||
| Regents of the University of California, G.O. Rev. Bonds, Series 2018-AZ, 5.00% 2048 | 10,230 | 12,903 | ||||||
| Regents of the University of California, G.O. Rev. Bonds, Series 2020-BE, 4.00% 2050 | 5,000 | 5,997 | ||||||
| Regents of the University of California, Limited Project Rev. Bonds, Series 2016-K, 5.00% 2034 | 750 | 924 | ||||||
| Regents of the University of California, Limited Project Rev. Bonds, Series 2016-K, 5.00% 2035 | 3,750 | 4,609 | ||||||
| Regents of the University of California, Limited Project Rev. Ref. Bonds, Series 2018-O, 5.00% 2048 | 1,900 | 2,389 | ||||||
| Regents of the University of California, Medical Center Pooled Rev. Bonds, Series 2016-L, 4.00% 2038 | 1,000 | 1,116 | ||||||
| Dept. of Veterans Affairs, Veterans G.O. Bonds, Series 2018-CR, 4.00% 2048 | 16,680 | 18,437 | ||||||
| Dept. of Veterans Affairs, Veterans G.O. Bonds, Series 2019-CS, 4.00% 2049 | 15,685 | 17,487 | ||||||
| Dept. of Veterans Affairs, Veterans G.O. Rev. Ref. Bonds, Series 2015-CM, AMT, 2.45% 2031 | 2,525 | 2,575 | ||||||
| Dept. of Veterans Affairs, Veterans G.O. Rev. Ref. Bonds, Series 2016-CN, 3.50% 2045 | 5,820 | 6,161 | ||||||
| Dept. of Water Resources, Water System Rev. Bonds (Central Valley Project), Series 2016-AW, 4.00% 2035 | 20,840 | 24,543 | ||||||
| Dept. of Water Resources, Water System Rev. Bonds (Central Valley Project), Series 2020-BB, 5.00% 2028 | 8,000 | 11,001 | ||||||
| Dept. of Water Resources, Water System Rev. Bonds (Central Valley Project), Series 2020-BB, 5.00% 2034 | 3,500 | 4,919 | ||||||
| Dept. of Water Resources, Water System Rev. Bonds (Central Valley Project), Series 2020-BB, 5.00% 2035 | 190 | 266 | ||||||
| Other securities | 111,530 | |||||||
| 1,023,002 | ||||||||
| 70 | American Funds Tax-Exempt Funds |
The Tax-Exempt Fund of California
| Principal amount (000) | Value (000) | |||||||
| City, county & other issuers 58.53% | ||||||||
| Bay Area Toll Auth., San Francisco Bay Area Toll Bridge Rev. Bonds, Series 2006-C-1, (SIFMA Municipal Swap Index + 0.90%) 1.06% 2045 (put 2023)1 | $ | 1,400 | $ | 1,404 | ||||
| Bay Area Toll Auth., San Francisco Bay Area Toll Bridge Rev. Bonds, Series 2008-B-1, (SIFMA Municipal Swap Index + 1.10%) 1.26% 2045 (put 2024)1 | 5,675 | 5,712 | ||||||
| Bay Area Toll Auth., San Francisco Bay Area Toll Bridge Rev. Bonds, Series 2014-H, (SIFMA Municipal Swap Index + 0.70%) 0.86% 2034 (put 2021)1 | 2,825 | 2,826 | ||||||
| Bay Area Toll Auth., San Francisco Bay Area Toll Bridge Rev. Bonds, Series 2017-D, (3-month USD-LIBOR x 0.70 + 0.55%) 0.757% 2045 (put 2021)1 | 2,100 | 2,090 | ||||||
| Bay Area Toll Auth., San Francisco Bay Area Toll Bridge Rev. Bonds, Series 2017-F-1, 5.00% 2056 | 3,510 | 4,155 | ||||||
| Bay Area Toll Auth., San Francisco Bay Area Toll Bridge Rev. Bonds, Series 2019-S-8, 5.00% 2056 | 20,000 | 24,431 | ||||||
| Bay Area Toll Auth., San Francisco Bay Area Toll Bridge Rev. Ref. Bonds, Series 2014-F-1, 5.00% 2054 (preref. 2024) | 1,475 | 1,733 | ||||||
| Brentwood Unified School Dist., G.O. Bonds, 2016 Election, Series 2019, 4.00% 2048 | 9,940 | 11,526 | ||||||
| County of Contra Costa, Transportation Auth., Sales Tax Rev. Ref. Bonds, Series 2018-A, (1-month USD-LIBOR x 0.70 + 0.25%) 0.369% 2034 (put 2021)1 | 11,675 | 11,633 | ||||||
| City of Elk Grove, Fin. Auth., Special Tax Rev. Bonds, Series 2015, BAM insured, 5.00% 2032 | 1,000 | 1,212 | ||||||
| City of Elk Grove, Fin. Auth., Special Tax Rev. Bonds, Series 2015, BAM insured, 5.00% 2033 | 1,000 | 1,209 | ||||||
| City of Elk Grove, Fin. Auth., Special Tax Rev. Bonds, Series 2015, BAM insured, 5.00% 2034 | 1,000 | 1,205 | ||||||
| City of Elk Grove, Fin. Auth., Special Tax Rev. Bonds, Series 2015, BAM insured, 5.00% 2035 | 1,000 | 1,204 | ||||||
| City of Elk Grove, Fin. Auth., Special Tax Rev. Bonds, Series 2016, 4.00% 2020 | 250 | 251 | ||||||
| City of Elk Grove, Fin. Auth., Special Tax Rev. Bonds, Series 2016, 4.00% 2032 | 2,500 | 2,740 | ||||||
| City of Elk Grove, Fin. Auth., Special Tax Rev. Bonds, Series 2016, 5.00% 2041 | 4,680 | 5,301 | ||||||
| City of Elk Grove, Fin. Auth., Special Tax Rev. Bonds, Series 2016, 5.00% 2046 | 8,065 | 9,045 | ||||||
| City of Elk Grove, Fin. Auth., Special Tax Rev. Bonds, Series 2018, 5.00% 2033 | 945 | 1,096 | ||||||
| City of Elk Grove, Fin. Auth., Special Tax Rev. Bonds, Series 2018, 5.00% 2035 | 1,150 | 1,323 | ||||||
| City of Elk Grove, Fin. Auth., Special Tax Rev. Bonds, Series 2018, 5.00% 2043 | 2,890 | 3,263 | ||||||
| City of Elk Grove, Fin. Auth., Special Tax Rev. Bonds, Series 2018, 5.00% 2048 | 2,500 | 2,800 | ||||||
| Folsom Cordova Unified School Dist., School Facs. Improvement Dist. No. 3, G.O. Bonds, 2007 Election, Series 2019-D, Assured Guaranty Municipal insured, 4.00% 2040 | 8,715 | 9,978 | ||||||
| Hayward Unified School Dist., G.O. Bonds, 2019 Election, Series 2019-A, BAM insured, 5.00% 2044 | 8,000 | 10,098 | ||||||
| City of Irvine, Community Facs. Dist. No. 2013-3 (Great Park), Improvement Area No. 1, Special Tax Bonds, Series 2014, 5.00% 2044 | 2,705 | 2,970 | ||||||
| City of Irvine, Community Facs. Dist. No. 2013-3 (Great Park), Improvement Area No. 1, Special Tax Bonds, Series 2014, 5.00% 2049 | 1,000 | 1,095 | ||||||
| City of Irvine, Community Facs. Dist. No. 2013-3 (Great Park), Improvement Area No. 4, Special Tax Bonds, Series 2016, 4.00% 2028 | 825 | 908 | ||||||
| City of Irvine, Community Facs. Dist. No. 2013-3 (Great Park), Improvement Area No. 4, Special Tax Bonds, Series 2016, 4.00% 2031 | 400 | 437 | ||||||
| City of Irvine, Community Facs. Dist. No. 2013-3 (Great Park), Improvement Area No. 4, Special Tax Bonds, Series 2016, 4.00% 2033 | 1,615 | 1,756 | ||||||
| City of Irvine, Community Facs. Dist. No. 2013-3 (Great Park), Improvement Area No. 8, Special Tax Bonds, Series 2018, 5.00% 2035 | 550 | 641 | ||||||
| City of Irvine, Community Facs. Dist. No. 2013-3 (Great Park), Improvement Area No. 8, Special Tax Bonds, Series 2018, 5.00% 2037 | 650 | 754 | ||||||
| City of Irvine, Community Facs. Dist. No. 2013-3 (Great Park), Improvement Area No. 8, Special Tax Bonds, Series 2018, 5.00% 2038 | 1,000 | 1,157 | ||||||
| City of Irvine, Community Facs. Dist. No. 2013-3 (Great Park), Improvement Area No. 8, Special Tax Bonds, Series 2018, 5.00% 2043 | 2,670 | 3,062 | ||||||
| City of Irvine, Community Facs. Dist. No. 2013-3 (Great Park), Improvement Area No. 8, Special Tax Bonds, Series 2018, 5.00% 2048 | 5,250 | 5,986 | ||||||
| City of Irvine, Community Facs. Dist. No. 2013-3 (Great Park), Improvement Area No. 8, Special Tax Bonds, Series 2018, Assured Guaranty Municipal insured, 5.00% 2051 | 1,250 | 1,470 | ||||||
| City of Irvine, Reassessment Dist. No. 12-1, Limited Obligation Improvement Bonds, Series 2012, 4.00% 2020 | 1,000 | 1,003 | ||||||
| City of Irvine, Reassessment Dist. No. 12-1, Limited Obligation Improvement Bonds, Series 2013, 5.00% 2024 | 825 | 937 | ||||||
| City of Irvine, Reassessment Dist. No. 12-1, Limited Obligation Improvement Bonds, Series 2013, 5.00% 2025 | 710 | 804 | ||||||
| City of Irvine, Reassessment Dist. No. 12-1, Limited Obligation Improvement Bonds, Series 2013, 5.00% 2028 | 1,050 | 1,182 | ||||||
| American Funds Tax-Exempt Funds | 71 |
The Tax-Exempt Fund of California
| Bonds, notes & other debt instruments (continued) | Principal amount (000) | Value (000) | ||||||
| California (continued) | ||||||||
| City, county & other issuers (continued) | ||||||||
| City of Irvine, Reassessment Dist. No. 12-1, Limited Obligation Improvement Bonds, Series 2015, 5.00% 2029 | $ | 2,600 | $ | 3,054 | ||||
| City of Irvine, Reassessment Dist. No. 12-1, Limited Obligation Improvement Bonds, Series 2015, 5.00% 2030 | 1,700 | 1,974 | ||||||
| City of Irvine, Reassessment Dist. No. 12-1, Limited Obligation Improvement Bonds, Series 2015, 5.00% 2031 | 1,500 | 1,733 | ||||||
| City of Irvine, Reassessment Dist. No. 12-1, Limited Obligation Improvement Bonds, Series 2015, 5.00% 2024 | 2,250 | 2,668 | ||||||
| City of Irvine, Reassessment Dist. No. 15-2, Limited Obligation Improvement Bonds, Series 2015, 5.00% 2032 | 800 | 920 | ||||||
| City of Irvine, Reassessment Dist. No. 15-2, Limited Obligation Improvement Bonds, Series 2015, 5.00% 2042 | 1,000 | 1,124 | ||||||
| City of Irvine, Reassessment Dist. No. 19-1, Limited Obligation Improvement Bonds, Series 2019, 4.00% 2036 | 1,840 | 2,213 | ||||||
| City of Irvine, Reassessment Dist. No. 19-1, Limited Obligation Improvement Bonds, Series 2019, 4.00% 2037 | 1,285 | 1,542 | ||||||
| City of Irvine, Reassessment Dist. No. 19-1, Limited Obligation Improvement Bonds, Series 2019, 5.00% 2026 | 330 | 419 | ||||||
| City of Irvine, Reassessment Dist. No. 19-1, Limited Obligation Improvement Bonds, Series 2019, 5.00% 2027 | 375 | 491 | ||||||
| City of Irvine, Reassessment Dist. No. 19-1, Limited Obligation Improvement Bonds, Series 2019, 5.00% 2028 | 525 | 705 | ||||||
| City of Irvine, Reassessment Dist. No. 19-1, Limited Obligation Improvement Bonds, Series 2019, 5.00% 2029 | 500 | 688 | ||||||
| City of Irvine, Reassessment Dist. No. 19-1, Limited Obligation Improvement Bonds, Series 2019, 5.00% 2030 | 350 | 476 | ||||||
| City of Irvine, Reassessment Dist. No. 19-1, Limited Obligation Improvement Bonds, Series 2019, 5.00% 2031 | 635 | 854 | ||||||
| City of Irvine, Reassessment Dist. No. 19-1, Limited Obligation Improvement Bonds, Series 2019, 5.00% 2032 | 680 | 905 | ||||||
| City of Irvine, Reassessment Dist. No. 19-1, Limited Obligation Improvement Bonds, Series 2019, 5.00% 2034 | 1,155 | 1,524 | ||||||
| City of Irvine, Reassessment Dist. No. 19-1, Limited Obligation Improvement Bonds, Series 2019, 5.00% 2044 | 1,000 | 1,269 | ||||||
| Irvine Unified School Dist., Community Facs. Dist. No. 01-1, Special Tax Rev. Ref. Bonds, Series 2015, BAM insured, 5.00% 2031 | 2,000 | 2,351 | ||||||
| Irvine Unified School Dist., Community Facs. Dist. No. 09-1, Special Tax Bonds, Series 2017-A, BAM insured, 5.00% 2023 | 1,000 | 1,126 | ||||||
| Irvine Unified School Dist., Community Facs. Dist. No. 09-1, Special Tax Bonds, Series 2017-A, BAM insured, 5.00% 2024 | 2,000 | 2,326 | ||||||
| Irvine Unified School Dist., Community Facs. Dist. No. 09-1, Special Tax Bonds, Series 2017-A, BAM insured, 5.00% 2029 | 200 | 248 | ||||||
| Irvine Unified School Dist., Community Facs. Dist. No. 09-1, Special Tax Bonds, Series 2017-A, BAM insured, 5.00% 2030 | 370 | 457 | ||||||
| Irvine Unified School Dist., Community Facs. Dist. No. 09-1, Special Tax Bonds, Series 2017-A, BAM insured, 5.00% 2031 | 420 | 516 | ||||||
| Irvine Unified School Dist., Community Facs. Dist. No. 09-1, Special Tax Bonds, Series 2017-A, BAM insured, 5.00% 2032 | 450 | 550 | ||||||
| Irvine Unified School Dist., Community Facs. Dist. No. 09-1, Special Tax Bonds, Series 2017-B, BAM insured, 5.00% 2032 | 175 | 214 | ||||||
| Irvine Unified School Dist., Community Facs. Dist. No. 09-1, Special Tax Bonds, Series 2017-B, BAM insured, 5.00% 2033 | 245 | 297 | ||||||
| Irvine Unified School Dist., Community Facs. Dist. No. 09-1, Special Tax Bonds, Series 2017-B, BAM insured, 5.00% 2034 | 250 | 303 | ||||||
| Irvine Unified School Dist., Community Facs. Dist. No. 09-1, Special Tax Bonds, Series 2017-B, BAM insured, 5.00% 2035 | 250 | 301 | ||||||
| Irvine Unified School Dist., Community Facs. Dist. No. 09-1, Special Tax Bonds, Series 2017-B, BAM insured, 5.00% 2036 | 350 | 419 | ||||||
| Irvine Unified School Dist., Community Facs. Dist. No. 09-1, Special Tax Bonds, Series 2017-B, BAM insured, 5.00% 2037 | 270 | 322 | ||||||
| Irvine Unified School Dist., Community Facs. Dist. No. 09-1, Special Tax Bonds, Series 2017-B, BAM insured, 5.00% 2042 | 1,000 | 1,177 | ||||||
| 72 | American Funds Tax-Exempt Funds |
The Tax-Exempt Fund of California
| Principal amount (000) | Value (000) | |||||||
| Irvine Unified School Dist., Community Facs. Dist. No. 09-1, Special Tax Bonds, Series 2017-C, BAM insured, 4.00% 2053 | $ | 1,250 | $ | 1,355 | ||||
| Irvine Unified School Dist., Community Facs. Dist. No. 09-1, Special Tax Bonds, Series 2017-C, BAM insured, 5.00% 2042 | 1,000 | 1,177 | ||||||
| Irvine Unified School Dist., Community Facs. Dist. No. 09-1, Special Tax Bonds, Series 2017-D, BAM insured, 5.00% 2057 | 1,665 | 1,927 | ||||||
| Irvine Unified School Dist., Community Facs. Dist. No. 09-1, Special Tax Bonds, Series 2018-A, BAM insured, 5.00% 2039 | 820 | 972 | ||||||
| Irvine Unified School Dist., Community Facs. Dist. No. 09-1, Special Tax Bonds, Series 2018-A, BAM insured, 5.00% 2040 | 810 | 957 | ||||||
| Irvine Unified School Dist., Community Facs. Dist. No. 09-1, Special Tax Bonds, Series 2018-A, BAM insured, 5.00% 2045 | 1,500 | 1,753 | ||||||
| Irvine Unified School Dist., Community Facs. Dist. No. 09-1, Special Tax Bonds, Series 2019-A, BAM insured, 4.00% 2037 | 570 | 655 | ||||||
| Irvine Unified School Dist., Community Facs. Dist. No. 09-1, Special Tax Bonds, Series 2019-A, BAM insured, 4.00% 2038 | 550 | 629 | ||||||
| Irvine Unified School Dist., Community Facs. Dist. No. 09-1, Special Tax Bonds, Series 2019-A, BAM insured, 4.00% 2039 | 635 | 724 | ||||||
| Irvine Unified School Dist., Community Facs. Dist. No. 09-1, Special Tax Bonds, Series 2019-A, BAM insured, 4.00% 2044 | 2,400 | 2,795 | ||||||
| Irvine Unified School Dist., Community Facs. Dist. No. 09-1, Special Tax Bonds, Series 2019-A, BAM insured, 4.00% 2049 | 3,000 | 3,495 | ||||||
| Irvine Unified School Dist., Community Facs. Dist. No. 09-1, Special Tax Bonds, Series 2019-A, BAM insured, 4.00% 2054 | 12,170 | 14,024 | ||||||
| Irvine Unified School Dist., Community Facs. Dist. No. 09-1, Special Tax Bonds, Series 2019-A, BAM insured, 5.00% 2032 | 365 | 469 | ||||||
| Irvine Unified School Dist., Community Facs. Dist. No. 09-1, Special Tax Bonds, Series 2019-A, BAM insured, 5.00% 2034 | 435 | 552 | ||||||
| Irvine Unified School Dist., Community Facs. Dist. No. 09-1, Special Tax Bonds, Series 2019-A, BAM insured, 5.00% 2035 | 250 | 316 | ||||||
| Irvine Unified School Dist., Community Facs. Dist. No. 09-1, Special Tax Bonds, Series 2019-A, BAM insured, 5.00% 2036 | 270 | 339 | ||||||
| Irvine Unified School Dist., Community Facs. Dist. No. 09-1, Special Tax Bonds, Series 2020-A, BAM insured, 4.00% 2050 | 8,000 | 9,371 | ||||||
| Irvine Unified School Dist., Community Facs. Dist. No. 09-1, Special Tax Bonds, Series 2020-A, BAM insured, 4.00% 2054 | 3,000 | 3,502 | ||||||
| City of Long Beach, Harbor Rev. Ref. Bonds, Series 2020-B, AMT, 4.00% 2022 | 7,825 | 8,272 | ||||||
| City of Los Angeles, Dept. of Airports, Los Angeles International Airport, Rev. Bonds, Series 2010-B, 5.00% 2035 | 1,000 | 1,010 | ||||||
| City of Los Angeles, Dept. of Airports, Los Angeles International Airport, Rev. Bonds, Series 2015-A, AMT, 5.00% 2027 | 1,250 | 1,482 | ||||||
| City of Los Angeles, Dept. of Airports, Los Angeles International Airport, Rev. Bonds, Series 2015-A, AMT, 5.00% 2029 | 1,560 | 1,836 | ||||||
| City of Los Angeles, Dept. of Airports, Los Angeles International Airport, Rev. Bonds, Series 2016-A, AMT, 4.00% 2034 | 1,000 | 1,117 | ||||||
| City of Los Angeles, Dept. of Airports, Los Angeles International Airport, Rev. Bonds, Series 2016-A, AMT, 5.00% 2035 | 1,000 | 1,192 | ||||||
| City of Los Angeles, Dept. of Airports, Los Angeles International Airport, Rev. Bonds, Series 2016-A, AMT, 5.00% 2042 | 1,000 | 1,175 | ||||||
| City of Los Angeles, Dept. of Airports, Los Angeles International Airport, Rev. Bonds, Series 2016-B, AMT, 5.00% 2029 | 1,450 | 1,765 | ||||||
| City of Los Angeles, Dept. of Airports, Los Angeles International Airport, Rev. Bonds, Series 2016-B, AMT, 5.00% 2031 | 2,395 | 2,894 | ||||||
| City of Los Angeles, Dept. of Airports, Los Angeles International Airport, Rev. Bonds, Series 2016-B, AMT, 5.00% 2033 | 500 | 599 | ||||||
| City of Los Angeles, Dept. of Airports, Los Angeles International Airport, Rev. Bonds, Series 2017-A, AMT, 5.00% 2032 | 1,000 | 1,228 | ||||||
| City of Los Angeles, Dept. of Airports, Los Angeles International Airport, Rev. Bonds, Series 2017-A, AMT, 5.00% 2033 | 1,000 | 1,222 | ||||||
| City of Los Angeles, Dept. of Airports, Los Angeles International Airport, Rev. Bonds, Series 2017-A, AMT, 5.00% 2034 | 1,250 | 1,524 | ||||||
| City of Los Angeles, Dept. of Airports, Los Angeles International Airport, Rev. Bonds, Series 2017-A, AMT, 5.00% 2035 | 1,000 | 1,216 | ||||||
| American Funds Tax-Exempt Funds | 73 |
The Tax-Exempt Fund of California
| Bonds, notes & other debt instruments (continued) | Principal amount (000) | Value (000) | ||||||
| California (continued) | ||||||||
| City, county & other issuers (continued) | ||||||||
| City of Los Angeles, Dept. of Airports, Los Angeles International Airport, Rev. Bonds, Series 2017-A, AMT, 5.00% 2037 | $ | 1,260 | $ | 1,523 | ||||
| City of Los Angeles, Dept. of Airports, Los Angeles International Airport, Rev. Bonds, Series 2018-A, AMT, 5.00% 2033 | 1,255 | 1,573 | ||||||
| City of Los Angeles, Dept. of Airports, Los Angeles International Airport, Rev. Bonds, Series 2018-A, AMT, 5.00% 2036 | 1,345 | 1,669 | ||||||
| City of Los Angeles, Dept. of Airports, Los Angeles International Airport, Rev. Bonds, Series 2018-A, AMT, 5.00% 2037 | 1,450 | 1,795 | ||||||
| City of Los Angeles, Dept. of Airports, Los Angeles International Airport, Rev. Bonds, Series 2018-A, AMT, 5.00% 2044 | 2,880 | 3,507 | ||||||
| City of Los Angeles, Dept. of Airports, Los Angeles International Airport, Rev. Bonds, Series 2018-B, AMT, 5.00% 2032 | 3,825 | 4,820 | ||||||
| City of Los Angeles, Dept. of Airports, Los Angeles International Airport, Rev. Bonds, Series 2018-C, AMT, 5.00% 2032 | 3,450 | 4,293 | ||||||
| City of Los Angeles, Dept. of Airports, Los Angeles International Airport, Rev. Bonds, Series 2018-D, AMT, 5.00% 2030 | 3,570 | 4,670 | ||||||
| City of Los Angeles, Dept. of Airports, Los Angeles International Airport, Rev. Bonds, Series 2018-D, AMT, 5.00% 2033 | 5,880 | 7,548 | ||||||
| City of Los Angeles, Dept. of Airports, Los Angeles International Airport, Rev. Bonds, Series 2018-D, AMT, 5.00% 2043 | 3,000 | 3,740 | ||||||
| City of Los Angeles, Dept. of Airports, Los Angeles International Airport, Rev. Bonds, Series 2019-A, AMT, 5.00% 2031 | 2,345 | 3,048 | ||||||
| City of Los Angeles, Dept. of Airports, Los Angeles International Airport, Rev. Bonds, Series 2019-E, 5.00% 2039 | 2,000 | 2,533 | ||||||
| City of Los Angeles, Dept. of Airports, Los Angeles International Airport, Rev. Bonds, Series 2019-E, AMT, 5.00% 2044 | 1,975 | 2,472 | ||||||
| City of Los Angeles, Dept. of Airports, Los Angeles International Airport, Rev. Ref. Bonds, Series 2010-A, 5.00% 2029 | 780 | 788 | ||||||
| City of Los Angeles, Dept. of Water and Power, Power System Rev. Bonds, Series 2017-B, 5.00% 2029 | 2,000 | 2,574 | ||||||
| City of Los Angeles, Dept. of Water and Power, Power System Rev. Bonds, Series 2019-A, 5.00% 2049 | 5,000 | 6,405 | ||||||
| City of Los Angeles, Dept. of Water and Power, Power System Rev. Bonds, Series 2020-A, 5.00% 2026 | 4,500 | 5,769 | ||||||
| City of Los Angeles, Dept. of Water and Power, Power System Rev. Bonds, Series 2020-B, 5.00% 2050 | 1,000 | 1,321 | ||||||
| Los Angeles Unified School Dist., G.O. Dedicated Unlimited Ad Valorem Property Tax Bonds, Series 2020-RYQ, 4.00% 2040 | 6,935 | 8,408 | ||||||
| North Orange County Community College Dist., G.O. Bonds, 2014 Election, Series 2019-B, 4.00% 2044 | 8,575 | 10,209 | ||||||
| Oakland Unified School Dist., G.O. Bonds, 2006 Election, Series 2016-A, 5.00% 2026 | 6,250 | 7,649 | ||||||
| Oakland Unified School Dist., G.O. Bonds, 2012 Election, Series 2013, 6.625% 2038 (preref. 2021) | 1,200 | 1,276 | ||||||
| Oakland Unified School Dist., G.O. Bonds, 2012 Election, Series 2015-A, 5.00% 2030 | 1,250 | 1,477 | ||||||
| Oakland Unified School Dist., G.O. Bonds, 2012 Election, Series 2015-A, 5.00% 2031 | 1,500 | 1,766 | ||||||
| Oakland Unified School Dist., G.O. Bonds, 2012 Election, Series 2015-A, 5.00% 2040 | 5,550 | 6,447 | ||||||
| Oakland Unified School Dist., G.O. Bonds, 2012 Election, Series 2019-A, Assured Guaranty Municipal insured, 3.00% 2040 | 6,000 | 6,403 | ||||||
| Oakland Unified School Dist., G.O. Bonds, 2012 Election, Series 2019-A, Assured Guaranty Municipal insured, 4.00% 2033 | 4,365 | 5,141 | ||||||
| Oakland Unified School Dist., G.O. Bonds, 2012 Election, Series 2019-A, Assured Guaranty Municipal insured, 5.00% 2027 | 1,340 | 1,711 | ||||||
| Oakland Unified School Dist., G.O. Rev. Ref. Bonds (Measure J), Series 2017-C, 5.00% 2031 | 2,015 | 2,479 | ||||||
| Oakland Unified School Dist., G.O. Rev. Ref. Bonds (Measure J), Series 2017-C, 5.00% 2035 | 3,245 | 3,923 | ||||||
| Oakland Unified School Dist., G.O. Rev. Ref. Bonds (Measure J), Series 2017-C, 5.00% 2036 | 2,000 | 2,407 | ||||||
| Oakland Unified School Dist., G.O. Rev. Ref. Bonds, Series 2015, Assured Guaranty Municipal insured, 5.00% 2024 | 2,225 | 2,609 | ||||||
| Oakland Unified School Dist., G.O. Rev. Ref. Bonds, Series 2016, 5.00% 2027 | 2,000 | 2,438 | ||||||
| Oakland Unified School Dist., G.O. Rev. Ref. Bonds, Series 2016, 5.00% 2028 | 1,200 | 1,460 | ||||||
| Oakland Unified School Dist., G.O. Rev. Ref. Bonds, Series 2016, 5.00% 2031 | 2,145 | 2,592 | ||||||
| Oakland Unified School Dist., G.O. Rev. Ref. Bonds, Series 2017-A, 5.00% 2022 | 3,000 | 3,257 | ||||||
| Oakland Unified School Dist., G.O. Rev. Ref. Bonds, Series 2019-A, Assured Guaranty Municipal insured, 4.00% 2035 | 1,000 | 1,171 | ||||||
| 74 | American Funds Tax-Exempt Funds |
The Tax-Exempt Fund of California
| Principal amount (000) | Value (000) | |||||||
| Peninsula Corridor Joint Powers Board, Farebox Rev. Bonds, Series 2019-A, 5.00% 2049 | $ | 9,035 | $ | 10,157 | ||||
| County of Sacramento, Sanitation Dist. Fncg. Auth., Rev. Ref. Bonds (Sacramento Regional County Sanitation Dist.), Series 2007-B, FGIC-National insured, (3-month USD-LIBOR + 0.53%) 0.764% 20351 | 13,500 | 11,774 | ||||||
| City of San Buenaventura, Rev. Bonds (Community Memorial Health System), Series 2011, 7.50% 2041 | 10,825 | 11,457 | ||||||
| County of San Diego, Association of Governments Capital Grant Receipts, Rev. Green Bonds (Mid-Coast Corridor Transit Project), Series 2019-A, 5.00% 2025 | 9,000 | 10,602 | ||||||
| County of San Diego, Regional Airport Auth., Airport Rev. and Rev. Ref. Bonds, Series 2019-A, 4.00% 2037 | 1,000 | 1,180 | ||||||
| County of San Diego, Regional Airport Auth., Airport Rev. and Rev. Ref. Bonds, Series 2019-A, 5.00% 2044 | 8,965 | 11,273 | ||||||
| County of San Diego, Regional Airport Auth., Airport Rev. and Rev. Ref. Bonds, Series 2019-A, 5.00% 2049 | 2,000 | 2,500 | ||||||
| County of San Diego, Regional Airport Auth., Airport Rev. Bonds, Series 2013-B, AMT, 5.00% 2043 | 2,000 | 2,166 | ||||||
| County of San Diego, Regional Airport Auth., Airport Rev. Bonds, Series 2017-A, 5.00% 2035 | 1,000 | 1,228 | ||||||
| County of San Diego, Regional Airport Auth., Airport Rev. Bonds, Series 2017-B, AMT, 5.00% 2047 | 1,000 | 1,179 | ||||||
| County of San Diego, Regional Airport Auth., Airport Rev. Bonds, Series 2017-B, AMT, 5.00% 2029 | 1,980 | 2,450 | ||||||
| County of San Diego, Regional Airport Auth., Airport Rev. Bonds, Series 2017-B, AMT, 5.00% 2035 | 2,495 | 3,011 | ||||||
| County of San Diego, Regional Airport Auth., Airport Rev. Bonds, Series 2017-B, AMT, 5.00% 2036 | 750 | 902 | ||||||
| County of San Diego, Regional Airport Auth., Airport Rev. Bonds, Series 2017-B, AMT, 5.00% 2037 | 750 | 900 | ||||||
| County of San Diego, Regional Airport Auth., Airport Rev. Bonds, Series 2017-B, AMT, 5.00% 2042 | 1,500 | 1,781 | ||||||
| County of San Diego, Regional Airport Auth., Airport Rev. Bonds, Series 2019-B, AMT, 5.00% 2026 | 760 | 929 | ||||||
| County of San Diego, Regional Airport Auth., Airport Rev. Bonds, Series 2019-B, AMT, 5.00% 2027 | 750 | 937 | ||||||
| County of San Diego, Regional Airport Auth., Airport Rev. Bonds, Series 2019-B, AMT, 5.00% 2029 | 1,255 | 1,630 | ||||||
| County of San Diego, Regional Airport Auth., Airport Rev. Bonds, Series 2019-B, AMT, 5.00% 2030 | 1,785 | 2,303 | ||||||
| County of San Diego, Regional Airport Auth., Airport Rev. Bonds, Series 2019-B, AMT, 5.00% 2033 | 2,280 | 2,886 | ||||||
| County of San Diego, Regional Airport Auth., Airport Rev. Bonds, Series 2019-B, AMT, 5.00% 2049 | 3,375 | 4,111 | ||||||
| County of San Diego, Regional Airport Auth., Airport Rev. Ref. Bonds, Series 2020-B, 5.00% 2035 | 1,000 | 1,320 | ||||||
| City and County of San Francisco, Airport Commission, San Francisco International Airport, Second Series Rev. Bonds, Series 2010-F, 5.00% 2040 | 2,995 | 3,004 | ||||||
| City and County of San Francisco, Airport Commission, San Francisco International Airport, Second Series Rev. Bonds, Series 2016-B, AMT, 5.00% 2046 | 4,000 | 4,628 | ||||||
| City and County of San Francisco, Airport Commission, San Francisco International Airport, Second Series Rev. Bonds, Series 2019-A, AMT, 5.00% 2049 | 4,000 | 4,880 | ||||||
| City and County of San Francisco, Airport Commission, San Francisco International Airport, Second Series Rev. Bonds, Series 2019-E, AMT, 4.00% 2050 | 2,000 | 2,244 | ||||||
| City and County of San Francisco, Airport Commission, San Francisco International Airport, Second Series Rev. Bonds, Series 2019-E, AMT, 5.00% 2050 | 2,000 | 2,438 | ||||||
| City and County of San Francisco, Airport Commission, San Francisco International Airport, Second Series Rev. Bonds, Series 2019-F, 5.00% 2050 | 1,990 | 2,485 | ||||||
| City and County of San Francisco, Airport Commission, San Francisco International Airport, Second Series Rev. Bonds, Series 2019-H, AMT, 5.00% 2026 | 5,545 | 6,801 | ||||||
| City and County of San Francisco, Airport Commission, San Francisco International Airport, Second Series Rev. Ref. Bonds, Series 2011-F, AMT, 5.00% 2028 | 2,630 | 2,711 | ||||||
| City and County of San Francisco, Airport Commission, San Francisco International Airport, Second Series Rev. Ref. Bonds, Series 2012-A, AMT, 5.00% 2028 | 1,000 | 1,068 | ||||||
| City and County of San Francisco, Airport Commission, San Francisco International Airport, Second Series Rev. Ref. Bonds, Series 2012-A, AMT, 5.00% 2030 | 1,000 | 1,067 | ||||||
| American Funds Tax-Exempt Funds | 75 |
The Tax-Exempt Fund of California
| Bonds, notes & other debt instruments (continued) | Principal amount (000) | Value (000) | ||||||
| California (continued) | ||||||||
| City, county & other issuers (continued) | ||||||||
| City and County of San Francisco, Airport Commission, San Francisco International Airport, Second Series Rev. Ref. Bonds, Series 2016-A, 5.00% 2029 | $ | 1,375 | $ | 1,697 | ||||
| City and County of San Francisco, Airport Commission, San Francisco International Airport, Second Series Rev. Ref. Bonds, Series 2017-A, AMT, 5.00% 2042 | 2,000 | 2,374 | ||||||
| City and County of San Francisco, Airport Commission, San Francisco International Airport, Second Series Rev. Ref. Bonds, Series 2017-A, AMT, 5.00% 2047 | 3,000 | 3,535 | ||||||
| City and County of San Francisco, Airport Commission, San Francisco International Airport, Second Series Rev. Ref. Bonds, Series 2017-D, AMT, 5.00% 2027 | 1,000 | 1,254 | ||||||
| City and County of San Francisco, Airport Commission, San Francisco International Airport, Second Series Rev. Ref. Bonds, Series 2019-A, AMT, 5.00% 2036 | 4,230 | 5,302 | ||||||
| City and County of San Francisco, Airport Commission, San Francisco International Airport, Second Series Rev. Ref. Bonds, Series 2019-A, AMT, 5.00% 2044 | 3,000 | 3,682 | ||||||
| City of San Jose, Airport Rev. Ref. Bonds, Series 2011-A-1, AMT, 5.50% 2030 | 8,000 | 8,203 | ||||||
| City of San Jose, Airport Rev. Ref. Bonds, Series 2017-A, AMT, 5.00% 2047 | 10,000 | 11,695 | ||||||
| Stockton Unified School Dist., G.O. Rev. Ref. Bonds, Series 2016, 5.00% 2031 | 7,800 | 9,421 | ||||||
| City of Whittier, Health Fac. Rev. Bonds (PIH Health), Series 2014, 5.00% 2044 | 10,000 | 11,092 | ||||||
| Other securities | 1,166,027 | |||||||
| 1,720,262 | ||||||||
| Guam 0.20% | ||||||||
| Other securities | 5,988 | |||||||
| Puerto Rico 0.71% | ||||||||
| Other securities | 20,800 | |||||||
| United States 0.68% | ||||||||
| Freddie Mac, Multi Family Mortgage Bonds, Series 2019-ML-05, Class CA, 3.35% 2033 | 15,331 | 17,707 | ||||||
| Other securities | 2,268 | |||||||
| 19,975 | ||||||||
| Total bonds, notes & other debt instruments (cost: $2,634,125,000) | 2,790,027 | |||||||
| Short-term securities 5.03% | ||||||||
| Educational Facs. Auth., Rev. IAM Commercial Paper, Series 2020, 0.10% 8/3/2020 | 4,000 | 4,000 | ||||||
| Fin. Auth., Recovery Zone Fac. Bonds (Chevron U.S.A. Inc. Project), Series 2010-A, 0.14% 20351 | 9,100 | 9,100 | ||||||
| G.O. Bonds, Series 2004-A-4, 0.13% 20341 | 1,500 | 1,500 | ||||||
| City of Los Angeles, Dept. of Water and Power, Power System Demand Rev. Bonds, Series 2002-A-1, 0.14% 20351 | 3,000 | 3,000 | ||||||
| City of Los Angeles, Dept. of Water and Power, Power System Demand Rev. Bonds, Series 2002-A-6, 0.14% 20351 | 2,425 | 2,425 | ||||||
| City of Los Angeles, Dept. of Water and Power, Power System Rev. Ref. Bonds, Series 2001-B-3, Subseries B-3, 0.12% 20341 | 7,600 | 7,600 | ||||||
| City of Los Angeles, Dept. of Water and Power, Water System Bonds, Series 2019-A, 0.14% 20491 | 7,975 | 7,975 | ||||||
| Metropolitan Water Dist. of Southern California, Water Rev. Ref. Bonds, Series 2016-B-1, 0.15% 20371 | 17,470 | 17,470 | ||||||
| Metropolitan Water Dist. of Southern California, Water Rev. Ref. Bonds, Series 2016-B-2, 0.15% 20371 | 9,400 | 9,400 | ||||||
| Municipal Fin. Auth., Pollution Control Rev. Ref. Bonds (Chevron U.S.A. Inc. Project), Series 2005, 0.14% 20251 | 5,500 | 5,500 | ||||||
| Municipal Fin. Auth., Rev. Bonds (Clinicas Del Camino Real, Inc.), Series 2020, 3.00% 3/1/2021 | 955 | 962 | ||||||
| City of Riverside, Electric Rev. Ref. Bonds, Series 2011-A, 0.17% 20351 | 11,225 | 11,225 | ||||||
| Statewide Communities Dev. Auth., Pollution Control Rev. Ref. Bonds (Chevron U.S.A. Inc. Project), Series 2002, 0.14% 20241 | 6,900 | 6,900 | ||||||
| Statewide Communities Dev. Auth., Rev. IAM Commercial Paper, Series 2008-C, 0.16% 8/18/2020 | 3,000 | 3,000 | ||||||
| 76 | American Funds Tax-Exempt Funds |
The Tax-Exempt Fund of California
| Principal amount (000) | Value (000) | |||||||
| City of Stockton, Public Fncg. Auth., Wastewater Bond Anticipation Notes, Series 2019, 1.40% 2022 | $ | 9,750 | $ | 9,760 | ||||
| Regents of the University of California, G.O. Rev. Bonds, Series 2013-AL-2, 0.14% 20481 | 3,240 | 3,240 | ||||||
| Regents of the University of California, G.O. Rev. Bonds, Series 2013-AL-4, 0.10% 20481 | 2,230 | 2,230 | ||||||
| Regents of the University of California, IAM Commercial Paper, Series 2020-A, 0.20% 8/6/2020 | 3,300 | 3,300 | ||||||
| Regents of the University of California, IAM Commercial Paper, Series 2020-A, 0.22% 9/3/2020 | 6,350 | 6,350 | ||||||
| Dept. of Water Resources, Water Rev. IAM Commercial Paper, Series 2020-A-2, 0.18% 9/24/2020 | 7,000 | 7,000 | ||||||
| Other securities | 25,850 | |||||||
| Total short-term securities (cost: $147,685,000) | 147,787 | |||||||
| Total investment securities 99.95% (cost: $2,781,810,000) | 2,937,814 | |||||||
| Other assets less liabilities 0.05% | 1,497 | |||||||
| Net assets 100.00% | $ | 2,939,311 | ||||||
This summary investment portfolio is designed to streamline the report and help investors better focus on the fund’s principal holdings. See the inside back cover for details on how to obtain a complete schedule of portfolio holdings.
“Other securities” includes all issues that are not disclosed separately in the summary investment portfolio.
| 1 | Coupon rate may change periodically. Reference rate and spread are as of the most recent information available. Some coupon rates are determined by the issuer or agent based on current market conditions; therefore, the reference rate and spread are not available. For short-term securities, the date of the next scheduled coupon rate change is considered to be the maturity date. |
| 2 | Acquired in a transaction exempt from registration under Rule 144A of the Securities Act of 1933. May be resold in the U.S. in transactions exempt from registration, normally to qualified institutional buyers. The total value of all such securities, including those in “Other securities,” was $131,281,000, which represented 4.47% of the net assets of the fund. |
Key to abbreviations and symbol
Agcy. = Agency
AMT = Alternative Minimum Tax
Auth. = Authority
Certs. of Part. = Certificates of Participation
Dept. = Department
Dev. = Development
Dist. = District
Econ. = Economic
Fac. = Facility
Facs. = Facilities
Fin. = Finance
Fncg. = Financing
G.O. = General Obligation
IAM = Interest at Maturity
LIBOR = London Interbank Offered Rate
LOC = Letter of Credit
Preref. = Prerefunded
Redev. = Redevelopment
Ref. = Refunding
Rev. = Revenue
SIFMA = Securities Industry and Financial Markets Association
USD/$ = U.S. dollars
See notes to financial statements.
| American Funds Tax-Exempt Funds | 77 |
American Funds Tax-Exempt Fund of New York
Summary investment portfolio July 31, 2020
| Portfolio quality summary* | Percent of net assets |

| * | Bond ratings, which typically range from AAA/Aaa (highest) to D (lowest), are assigned by credit rating agencies such as Standard & Poor’s, Moody’s and/or Fitch as an indication of an issuer’s creditworthiness. In assigning a credit rating to a security, the fund looks specifically to the ratings assigned to the issuer of the security by Standard & Poor’s, Moody’s and/or Fitch. If agency ratings differ, the security will be considered to have received the highest of those ratings, consistent with the fund’s investment policies. The ratings are not covered by the Report of Independent Registered Public Accounting Firm. |
| Bonds, notes & other debt instruments 96.44% | Principal amount (000) | Value (000) | ||||||
| New York 93.82% | ||||||||
| State issuers 48.72% | ||||||||
| Convention Center Dev. Corp., Rev. Bonds (Hotel Unit Fee Secured), Capital Appreciation Bonds, Series 2016-B, 0% 2048 | $ | 3,540 | $ | 1,285 | ||||
| Convention Center Dev. Corp., Rev. Bonds (Hotel Unit Fee Secured), Capital Appreciation Bonds, Series 2016-B, BAM insured, 0% 2039 | 2,300 | 1,311 | ||||||
| Convention Center Dev. Corp., Rev. Ref. Bonds (Hotel Unit Fee Secured), Series 2015, 5.00% 2030 | 300 | 338 | ||||||
| Convention Center Dev. Corp., Rev. Ref. Bonds (Hotel Unit Fee Secured), Series 2015, 5.00% 2035 | 840 | 933 | ||||||
| Dormitory Auth., Mortgage Hospital Rev. Bonds (Maimonides Medical Center), Series 2020, FHA insured, 4.00% 2033 | 400 | 467 | ||||||
| Dormitory Auth., Mortgage Hospital Rev. Bonds (Maimonides Medical Center), Series 2020, FHA insured, 4.00% 2034 | 350 | 408 | ||||||
| Dormitory Auth., Mortgage Hospital Rev. Bonds (Maimonides Medical Center), Series 2020, FHA insured, 4.00% 2043 | 500 | 570 | ||||||
| Dormitory Auth., Rev. Bonds (Catholic Health System Obligated Group), Series 2019-A, 4.00% 2037 | 1,000 | 1,097 | ||||||
| Dormitory Auth., Rev. Bonds (Cornell University), Series 2020-A-2, 5.00% 2030 | 1,000 | 1,418 | ||||||
| Dormitory Auth., Rev. Bonds (Cornell University), Series 2020-A-2, 5.00% 2031 | 725 | 1,024 | ||||||
| Dormitory Auth., Rev. Bonds (Culinary Institute of America), Series 2013, 5.50% 2033 | 500 | 543 | ||||||
| Dormitory Auth., Rev. Bonds (Fordham University), Series 2017, 4.00% 2034 | 885 | 1,031 | ||||||
| Dormitory Auth., Rev. Bonds (Icahn School of Medicine at Mount Sinai), Series 2015-A, 5.00% 2031 | 500 | 578 | ||||||
| Dormitory Auth., Rev. Bonds (Icahn School of Medicine at Mount Sinai), Series 2015-A, 5.00% 2035 | 1,000 | 1,143 | ||||||
| Dormitory Auth., Rev. Bonds (Icahn School of Medicine at Mount Sinai), Series 2015-A, 5.00% 2040 | 250 | 283 | ||||||
| Dormitory Auth., Rev. Bonds (Langone Hospitals Obligated Group), Series 2020-A, 4.00% 2053 | 1,625 | 1,862 | ||||||
| Dormitory Auth., Rev. Bonds (Memorial Sloan-Kettering Cancer Center), Series 2017-1, 5.00% 2027 | 750 | 971 | ||||||
| Dormitory Auth., Rev. Bonds (Montefiore Obligated Group), Series 2018-A, 5.00% 2030 | 785 | 969 | ||||||
| Dormitory Auth., Rev. Bonds (Montefiore Obligated Group), Series 2018-A, 5.00% 2031 | 1,000 | 1,228 | ||||||
| Dormitory Auth., Rev. Bonds (Montefiore Obligated Group), Series 2020-A, 4.00% 2036 | 400 | 452 | ||||||
| Dormitory Auth., Rev. Bonds (Montefiore Obligated Group), Series 2020-A, 4.00% 2050 | 1,250 | 1,372 | ||||||
| Dormitory Auth., Rev. Bonds (New School), Series 2015-A, 5.00% 2032 | 1,000 | 1,136 | ||||||
| Dormitory Auth., Rev. Bonds (New School), Series 2016-A, 5.00% 2032 | 1,000 | 1,175 | ||||||
| Dormitory Auth., Rev. Bonds (New School), Series 2016-A, 5.00% 2035 | 500 | 582 | ||||||
| Dormitory Auth., Rev. Bonds (New York University), Series 2018-A, 5.00% 2032 | 500 | 646 | ||||||
| Dormitory Auth., Rev. Bonds (Northwell Health Obligated Group), Series 2019-B-3, 5.00% 2048 (put 2026) | 1,000 | 1,191 | ||||||
| Dormitory Auth., Rev. Bonds (NYU Hospitals Center), Series 2014, 5.00% 2022 | 200 | 216 | ||||||
| Dormitory Auth., Rev. Bonds (NYU Hospitals Center), Series 2014, 5.00% 2034 | 1,000 | 1,131 | ||||||
| 78 | American Funds Tax-Exempt Funds |
American Funds Tax-Exempt Fund of New York
| Principal amount (000) | Value (000) | |||||||
| Dormitory Auth., Rev. Bonds (NYU Hospitals Center), Series 2016-A, 5.00% 2033 | $ | 400 | $ | 476 | ||||
| Dormitory Auth., Rev. Bonds (Orange Regional Medical Center Obligated Group), Series 2015, 5.00% 20321 | 600 | 685 | ||||||
| Dormitory Auth., Rev. Bonds (Orange Regional Medical Center Obligated Group), Series 2015, 5.00% 20401 | 1,000 | 1,118 | ||||||
| Dormitory Auth., Rev. Bonds (Orange Regional Medical Center Obligated Group), Series 2017, 5.00% 20311 | 1,000 | 1,190 | ||||||
| Dormitory Auth., Rev. Bonds (Orange Regional Medical Center Obligated Group), Series 2017, 5.00% 20351 | 1,300 | 1,524 | ||||||
| Dormitory Auth., Rev. Bonds (Skidmore College), Series 2011-A, 5.50% 2041 | 1,110 | 1,151 | ||||||
| Dormitory Auth., Rev. Bonds (State University of New York Dormitory Facs.), Series 2017-A, 5.00% 2030 | 750 | 930 | ||||||
| Dormitory Auth., Rev. Bonds (State University of New York Dormitory Facs.), Series 2017-A, 5.00% 2032 | 500 | 612 | ||||||
| Dormitory Auth., Rev. Bonds (State University of New York Dormitory Facs.), Series 2019-A, 4.00% 2049 | 1,000 | 1,123 | ||||||
| Dormitory Auth., Rev. Bonds (Touro College and University System Obligated Group), Series 2017, 5.00% 2038 | 500 | 544 | ||||||
| Dormitory Auth., School Dist. Rev. Bond Fncg. Program Rev. Bonds, Series 2011-A, 5.00% 2024 | 25 | 26 | ||||||
| Dormitory Auth., School Dist. Rev. Bond Fncg. Program Rev. Bonds, Series 2011-A, 5.00% 2024 (preref. 2021) | 475 | 502 | ||||||
| Dormitory Auth., School Dist. Rev. Bond Fncg. Program Rev. Bonds, Series 2013-E, Assured Guaranty Municipal insured, 5.00% 2022 | 1,000 | 1,098 | ||||||
| Dormitory Auth., State Personal Income Tax Rev. Bonds (Education), Series 2014-E, 5.00% 2032 | 750 | 887 | ||||||
| Dormitory Auth., State Personal Income Tax Rev. Bonds (General Purpose), Series 2017-B, 5.00% 2041 | 750 | 924 | ||||||
| Dormitory Auth., State Personal Income Tax Rev. Bonds (General Purpose), Series 2017-B, 5.00% 2042 | 1,130 | 1,389 | ||||||
| Dormitory Auth., State Personal Income Tax Rev. Bonds (General Purpose), Series 2018-A, 5.25% 2037 | 1,000 | 1,297 | ||||||
| Dormitory Auth., State Personal Income Tax Rev. Bonds (General Purpose), Series 2019-A, 5.00% 2028 | 1,000 | 1,313 | ||||||
| Dormitory Auth., State Personal Income Tax Rev. Bonds (General Purpose), Series 2019-A, 5.00% 2044 | 1,000 | 1,264 | ||||||
| Dormitory Auth., State Sales Tax Rev. Bonds, Series 2014-A, 5.00% 2038 | 1,000 | 1,143 | ||||||
| Dormitory Auth., State Sales Tax Rev. Bonds, Series 2018-A, 5.00% 2039 | 2,275 | 2,851 | ||||||
| Dormitory Auth., State Sales Tax Rev. Bonds, Series 2018-E, 5.00% 2035 | 1,000 | 1,284 | ||||||
| Dormitory Auth., State Sales Tax Rev. Bonds, Series 2018-E, 5.00% 2039 | 800 | 1,015 | ||||||
| Dormitory Auth., State Sales Tax Rev. Bonds, Series 2018-E, 5.00% 2048 | 1,500 | 1,872 | ||||||
| Environmental Facs. Corp., Rev. Green Bonds (Revolving Funds), Series 2016-B, 4.00% 2036 | 1,950 | 2,254 | ||||||
| Environmental Facs. Corp., Solid Waste Disposal Rev. Bonds (Casella Waste Systems, Inc. Project), Series 2014-R-2, AMT, 3.125% 2044 (put 2026)1 | 500 | 502 | ||||||
| Environmental Facs. Corp., Solid Waste Disposal Rev. Bonds (Casella Waste Systems, Inc. Project), Series 2017, AMT, 2.875% 2044 (put 2029)1 | 1,500 | 1,453 | ||||||
| Liberty Dev. Corp., Liberty Rev. Ref. Bonds (4 World Trade Center Project), Series 2011, 5.00% 2031 | 1,500 | 1,572 | ||||||
| Long Island Power Auth., Electric System General Rev. Bonds, Series 2015-B, 5.00% 2035 | 1,315 | 1,552 | ||||||
| Long Island Power Auth., Electric System General Rev. Bonds, Series 2015-B, 5.00% 2038 | 750 | 881 | ||||||
| Long Island Power Auth., Electric System General Rev. Bonds, Series 2015-C, (1-month USD-LIBOR x 0.70 + 0.75%) 0.869% 2033 (put 2023)2 | 1,500 | 1,497 | ||||||
| Long Island Power Auth., Electric System General Rev. Bonds, Series 2017, 5.00% 2035 | 1,000 | 1,240 | ||||||
| Long Island Power Auth., Electric System General Rev. Bonds, Series 2017, 5.00% 2047 | 3,225 | 3,905 | ||||||
| Long Island Power Auth., Electric System General Rev. Bonds, Series 2018, 5.00% 2036 | 500 | 632 | ||||||
| Metropolitan Transportation Auth., Dedicated Tax Fund Rev. Ref. Bonds, Series 2002-B-3D, (SIFMA Municipal Swap Index + 1.00%) 1.16% 20202 | 2,000 | 1,992 | ||||||
| Metropolitan Transportation Auth., Transportation Rev. Bonds, Series 2014-D-1, 5.00% 2039 | 250 | 267 | ||||||
| Metropolitan Transportation Auth., Transportation Rev. Bonds, Series 2015-C-1, 5.25% 2030 | 280 | 311 | ||||||
| Metropolitan Transportation Auth., Transportation Rev. Green Bonds, Series 2016-A-2, 5.00% 2026 | 560 | 631 | ||||||
| Metropolitan Transportation Auth., Transportation Rev. Green Bonds, Series 2017-A-1, 5.00% 2027 | 700 | 802 | ||||||
| American Funds Tax-Exempt Funds | 79 |
American Funds Tax-Exempt Fund of New York
| Bonds, notes & other debt instruments (continued) | Principal amount (000) | Value (000) | ||||||
| New York (continued) | ||||||||
| State issuers (continued) | ||||||||
| Metropolitan Transportation Auth., Transportation Rev. Green Bonds, Series 2017-A-1, 5.25% 2057 | $ | 750 | $ | 832 | ||||
| Metropolitan Transportation Auth., Transportation Rev. Green Bonds, Series 2019-B, 5.00% 2052 | 1,075 | 1,218 | ||||||
| Metropolitan Transportation Auth., Transportation Rev. Green Bonds, Series 2019-C-1, 5.00% 2039 | 1,640 | 1,864 | ||||||
| Metropolitan Transportation Auth., Transportation Rev. Green Bonds, Series 2020-A-1, BAM insured, 4.00% 2053 | 1,000 | 1,105 | ||||||
| Metropolitan Transportation Auth., Transportation Rev. Ref. Bonds, Series 2002-D-2A, Assured Guaranty Municipal insured, (1-month USD-LIBOR x 0.69 + 0.68%) 0.797% 2032 (put 2021)2 | 600 | 594 | ||||||
| Metropolitan Transportation Auth., Transportation Rev. Ref. Green Bonds, Capital Appreciation Bonds, Series 2017-C-2, 0% 2029 | 1,500 | 1,112 | ||||||
| Metropolitan Transportation Auth., Transportation Rev. Ref. Green Bonds, Series 2017-C-1, 4.00% 2034 | 1,000 | 1,044 | ||||||
| Metropolitan Transportation Auth., Transportation Rev. Ref. Green Bonds, Series 2017-C-1, 5.00% 2026 | 565 | 637 | ||||||
| Mortgage Agcy., Homeowner Mortgage Rev. Bonds, Series 178, 3.50% 2043 | 190 | 200 | ||||||
| Mortgage Agcy., Homeowner Mortgage Rev. Bonds, Series 191, AMT, 3.50% 2034 | 180 | 188 | ||||||
| Mortgage Agcy., Homeowner Mortgage Rev. Bonds, Series 194, AMT, 3.50% 2035 | 310 | 323 | ||||||
| Mortgage Agcy., Homeowner Mortgage Rev. Bonds, Series 195, 4.00% 2046 | 1,095 | 1,171 | ||||||
| Mortgage Agcy., Homeowner Mortgage Rev. Bonds, Series 197, 3.50% 2044 | 555 | 590 | ||||||
| Mortgage Agcy., Homeowner Mortgage Rev. Bonds, Series 200, 3.50% 2045 | 205 | 217 | ||||||
| Mortgage Agcy., Homeowner Mortgage Rev. Bonds, Series 203, 3.50% 2047 | 755 | 808 | ||||||
| Mortgage Agcy., Homeowner Mortgage Rev. Bonds, Series 206, AMT, 4.00% 2037 | 520 | 560 | ||||||
| Mortgage Agcy., Homeowner Mortgage Rev. Bonds, Series 213, 4.25% 2047 | 465 | 517 | ||||||
| Mortgage Agcy., Homeowner Mortgage Rev. Bonds, Series 217, 4.00% 2049 | 995 | 1,105 | ||||||
| Mortgage Agcy., Homeowner Mortgage Rev. Bonds, Series 46, 5.00% 2029 | 5 | 5 | ||||||
| Mortgage Agcy., Homeowner Mortgage Rev. Bonds, Series 48, 2.625% 2041 | 755 | 776 | ||||||
| Mortgage Agcy., Homeowner Mortgage Rev. Bonds, Series 52, AMT, 3.50% 2030 | 550 | 578 | ||||||
| Mortgage Agcy., Homeowner Mortgage Rev. Bonds, Series 54, 4.00% 2047 | 1,285 | 1,389 | ||||||
| Mortgage Agcy., Homeowner Mortgage Rev. Ref. Bonds, Series 45, 4.50% 2029 | 10 | 10 | ||||||
| Port Auth., Consolidated Bonds, Series 166, 5.00% 2031 | 1,000 | 1,018 | ||||||
| Port Auth., Consolidated Bonds, Series 205, 5.00% 2047 | 1,000 | 1,214 | ||||||
| Port Auth., Consolidated Bonds, Series 212, 4.00% 2038 | 1,000 | 1,181 | ||||||
| Port Auth., Consolidated Bonds, Series 217, 5.00% 2044 | 1,500 | 1,898 | ||||||
| Port Auth., Consolidated Rev. Ref. Bonds, Series 172, AMT, 5.00% 2034 | 500 | 531 | ||||||
| Port Auth., Consolidated Rev. Ref. Bonds, Series 186, AMT, 5.00% 2044 | 500 | 568 | ||||||
| Port Auth., Special Project Bonds (John F. Kennedy International Air Terminal LLC Project), Series 8, 5.00% 2020 | 350 | 352 | ||||||
| Power Auth., Rev. Bonds, Series 2020-A, 4.00% 2055 | 2,500 | 2,991 | ||||||
| Power Auth., Rev. Ref. Bonds, Series 2011-A, 5.00% 2038 | 1,500 | 1,588 | ||||||
| Thruway Auth., General Rev. Bonds, Series 2020-N, 4.00% 2047 | 1,500 | 1,749 | ||||||
| Thruway Auth., General Rev. Indebtedness Obligations, Series 2016-A, 5.25% 2056 | 250 | 290 | ||||||
| Thruway Auth., General Rev. Indebtedness Obligations, Series 2019-B, 4.00% 2039 | 1,000 | 1,170 | ||||||
| Thruway Auth., General Rev. Indebtedness Obligations, Series 2019-B, 4.00% 2045 | 3,160 | 3,642 | ||||||
| Thruway Auth., General Rev. Indebtedness Obligations, Series 2019-B, Assured Guaranty Municipal insured, 4.00% 2053 | 1,015 | 1,164 | ||||||
| Thruway Auth., General Rev. Indebtedness Obligations, Series 2019-B, BAM insured, 4.00% 2050 | 615 | 709 | ||||||
| Transportation Dev. Corp., Special Fac. Rev. Bonds (American Airlines, Inc. John F. Kennedy International Airport Project), Series 2020, AMT, 5.375% 2036 | 1,000 | 1,046 | ||||||
| Transportation Dev. Corp., Special Fac. Rev. Ref. Bonds (Terminal One Group Association, LP Project), Series 2015, AMT, 5.00% 2021 | 330 | 334 | ||||||
| Transportation Dev. Corp., Special Fac. Rev. Ref. Bonds (Terminal One Group Association, LP Project), Series 2015, AMT, 5.00% 2022 | 1,000 | 1,041 | ||||||
| Transportation Dev. Corp., Special Fac. Rev. Ref. Bonds (Terminal One Group Association, LP Project), Series 2015, AMT, 5.00% 2023 | 500 | 534 | ||||||
| Transportation Dev. Corp., Special Facs. Bonds (LaGuardia Airport Terminal B Redev. Project), Series 2016-A, AMT, 5.00% 2034 | 500 | 552 | ||||||
| Transportation Dev. Corp., Special Facs. Bonds (LaGuardia Airport Terminal B Redev. Project), Series 2016-A, AMT, 5.00% 2046 | 1,000 | 1,087 | ||||||
| 80 | American Funds Tax-Exempt Funds |
American Funds Tax-Exempt Fund of New York
| Principal amount (000) | Value (000) | |||||||
| Transportation Dev. Corp., Special Facs. Bonds (LaGuardia Airport Terminal B Redev. Project), Series 2016-A, AMT, 5.25% 2050 | $ | 500 | $ | 547 | ||||
| Transportation Dev. Corp., Special Facs. Rev. Bonds (Delta Air Lines, Inc. LaGuardia Airport Terminals C & D Redev. Project), Series 2018, AMT, 4.00% 2036 | 500 | 510 | ||||||
| Transportation Dev. Corp., Special Facs. Rev. Bonds (Delta Air Lines, Inc. LaGuardia Airport Terminals C & D Redev. Project), Series 2018, AMT, 5.00% 2036 | 1,045 | 1,144 | ||||||
| Triborough Bridge and Tunnel Auth., General Rev. Bonds (MTA Bridges and Tunnels), Series 2018-A, 5.00% 2030 | 650 | 892 | ||||||
| Triborough Bridge and Tunnel Auth., General Rev. Bonds (MTA Bridges and Tunnels), Series 2018-A, 5.00% 2046 | 1,000 | 1,228 | ||||||
| Triborough Bridge and Tunnel Auth., General Rev. Bonds (MTA Bridges and Tunnels), Series 2019-A, 5.00% 2041 | 600 | 759 | ||||||
| Triborough Bridge and Tunnel Auth., General Rev. Bonds (MTA Bridges and Tunnels), Series 2020-A, 5.00% 2054 | 1,250 | 1,597 | ||||||
| Urban Dev. Corp., State Personal Income Tax Rev. Bonds (General Purpose), Series 2014-A, 5.00% 2027 | 750 | 871 | ||||||
| Urban Dev. Corp., State Personal Income Tax Rev. Bonds (General Purpose), Series 2016-A, 5.00% 2026 | 1,500 | 1,870 | ||||||
| Urban Dev. Corp., State Personal Income Tax Rev. Bonds (General Purpose), Series 2016-A, 5.00% 2032 | 1,000 | 1,221 | ||||||
| Urban Dev. Corp., State Personal Income Tax Rev. Bonds (General Purpose), Series 2019-A, 5.00% 2036 | 1,500 | 1,913 | ||||||
| Urban Dev. Corp., State Personal Income Tax Rev. Bonds (General Purpose), Series 2020-C, 4.00% 2037 | 500 | 606 | ||||||
| Urban Dev. Corp., State Personal Income Tax Rev. Bonds (General Purpose), Series 2020-C, 4.00% 2042 | 1,000 | 1,189 | ||||||
| Urban Dev. Corp., State Sales Tax Rev. Bonds, Series 2019-A, 4.00% 2043 | 1,785 | 2,095 | ||||||
| Urban Dev. Corp., State Sales Tax Rev. Bonds, Series 2019-A, 5.00% 2039 | 1,500 | 1,947 | ||||||
| Utility Debt Securitization Auth., Restructuring Bonds, Series 2016-A, 5.00% 2035 | 1,170 | 1,433 | ||||||
| Utility Debt Securitization Auth., Restructuring Bonds, Series 2017, 5.00% 2040 | 750 | 951 | ||||||
| Utility Debt Securitization Auth., Restructuring Bonds, Series 2017, 5.00% 2041 | 1,500 | 1,898 | ||||||
| Other securities | 7,216 | |||||||
| 142,458 | ||||||||
| City, county & other issuers 45.10% | ||||||||
| Brooklyn Arena Local Dev. Corp., PILOT Rev. Ref. Bonds (Barclays Center), Series 2016-A, Assured Guaranty Municipal insured, 4.00% 2034 | 240 | 261 | ||||||
| Brooklyn Arena Local Dev. Corp., PILOT Rev. Ref. Bonds (Barclays Center), Series 2016-A, Assured Guaranty Municipal insured, 5.00% 2026 | 500 | 563 | ||||||
| Brooklyn Arena Local Dev. Corp., PILOT Rev. Ref. Bonds (Barclays Center), Series 2016-A, Assured Guaranty Municipal insured, 5.00% 2027 | 750 | 848 | ||||||
| Brooklyn Arena Local Dev. Corp., PILOT Rev. Ref. Bonds (Barclays Center), Series 2016-A, Assured Guaranty Municipal insured, 5.00% 2042 | 1,600 | 1,720 | ||||||
| Buffalo and Erie County Industrial Land Dev. Corp., Rev. Bonds (Buffalo State College Foundation Housing Corp. Project), Series 2011-A, 5.375% 2041 | 1,400 | 1,448 | ||||||
| Buffalo and Erie County Industrial Land Dev. Corp., Rev. Bonds (Catholic Health System Obligated Group Project), Series 2015, 5.00% 2023 | 1,600 | 1,762 | ||||||
| Buffalo and Erie County Industrial Land Dev. Corp., Rev. Bonds (Catholic Health System Obligated Group Project), Series 2015, 5.00% 2024 | 475 | 538 | ||||||
| Buffalo and Erie County Industrial Land Dev. Corp., Rev. Bonds (Catholic Health System Obligated Group Project), Series 2015, 5.00% 2040 | 1,050 | 1,163 | ||||||
| Buffalo and Erie County Industrial Land Dev. Corp., Rev. Bonds (Catholic Health System Obligated Group Project), Series 2015, 5.25% 2035 | 725 | 822 | ||||||
| Build NYC Resource Corp., Rev. Bonds (Bronx Charter School for Excellence Project), Series 2013-A, 4.00% 2021 | 525 | 531 | ||||||
| Build NYC Resource Corp., Rev. Bonds (Bronx Charter School for Excellence Project), Series 2013-A, 4.00% 2022 | 545 | 560 | ||||||
| Build NYC Resource Corp., Rev. Bonds (Bronx Charter School for Excellence Project), Series 2013-A, 5.50% 2043 | 1,500 | 1,591 | ||||||
| Build NYC Resource Corp., Rev. Bonds (YMCA of Greater New York Project), Series 2015, 5.00% 2040 | 500 | 558 | ||||||
| Build NYC Resource Corp., Rev. Ref. Bonds (Albert Einstein School of Medicine, Inc. Project), Series 2015, 5.50% 20451 | 300 | 326 | ||||||
| American Funds Tax-Exempt Funds | 81 |
American Funds Tax-Exempt Fund of New York
| Bonds, notes & other debt instruments (continued) | Principal amount (000) | Value (000) | ||||||
| New York (continued) | ||||||||
| City, county & other issuers (continued) | ||||||||
| Build NYC Resource Corp., Solid Waste Disposal Rev. Bonds (Pratt Paper (NY), Inc. Project), Series 2014, AMT, 4.50% 20251 | $ | 350 | $ | 369 | ||||
| Build NYC Resource Corp., Solid Waste Disposal Rev. Bonds (Pratt Paper (NY), Inc. Project), Series 2014, AMT, 5.00% 20351 | 950 | 1,019 | ||||||
| Village of Dobbs Ferry, Local Dev. Corp., Rev. Bonds (Mercy College Project), Series 2014, 5.00% 2039 | 1,625 | 1,794 | ||||||
| County of Dutchess, Local Dev. Corp., Rev. Bonds (Health Quest Systems, Inc. Project), Series 2016-B, 4.00% 2041 | 750 | 799 | ||||||
| County of Dutchess, Local Dev. Corp., Rev. Bonds (Health Quest Systems, Inc. Project), Series 2016-B, 5.00% 2046 | 1,500 | 1,685 | ||||||
| County of Dutchess, Local Dev. Corp., Rev. Bonds (Nuvance Health Issue), Series 2019-B, 4.00% 2049 | 1,000 | 1,099 | ||||||
| County of Dutchess, Local Dev. Corp., Rev. Bonds (Nuvance Health Issue), Series 2019-B, 5.00% 2032 | 905 | 1,130 | ||||||
| County of Dutchess, Local Dev. Corp., Rev. Ref. Bonds (Health Quest Systems, Inc. Project), Series 2014-A, 5.00% 2028 | 430 | 509 | ||||||
| Town of Hempstead, Local Dev. Corp., Rev. Bonds (Hofstra University Project), Series 2011, 5.00% 2027 | 800 | 828 | ||||||
| Town of Hempstead, Local Dev. Corp., Rev. Bonds (Hofstra University Project), Series 2011, 5.00% 2041 | 800 | 822 | ||||||
| Town of Hempstead, Local Dev. Corp., Rev. Ref. Bonds (Molloy College Project), Series 2017, 5.00% 2033 | 480 | 554 | ||||||
| Town of Hempstead, Local Dev. Corp., Rev. Ref. Bonds (Molloy College Project), Series 2017, 5.00% 2034 | 810 | 933 | ||||||
| Town of Hempstead, Local Dev. Corp., Rev. Ref. Bonds (Molloy College Project), Series 2017, 5.00% 2037 | 630 | 720 | ||||||
| Hudson Yards Infrastructure Corp., Rev. Bonds, Fiscal 2012, Series 2012-A, 5.25% 2047 | 955 | 978 | ||||||
| Hudson Yards Infrastructure Corp., Rev. Bonds, Fiscal 2012, Series 2012-A, 5.25% 2047 (preref. 2021) | 45 | 46 | ||||||
| Hudson Yards Infrastructure Corp., Rev. Bonds, Fiscal 2012, Series 2012-A, 5.75% 2047 | 435 | 447 | ||||||
| Hudson Yards Infrastructure Corp., Rev. Bonds, Fiscal 2012, Series 2012-A, 5.75% 2047 (preref. 2021) | 565 | 582 | ||||||
| Hudson Yards Infrastructure Corp., Rev. Bonds, Fiscal 2017, Series 2017-A, 5.00% 2033 | 2,700 | 3,319 | ||||||
| Hudson Yards Infrastructure Corp., Rev. Bonds, Fiscal 2017, Series 2017-A, 5.00% 2035 | 1,000 | 1,221 | ||||||
| County of Monroe, Industrial Dev. Corp., Rev. Bonds (Highland Hospital of Rochester Project), Series 2015, 5.00% 2025 | 325 | 386 | ||||||
| County of Monroe, Industrial Dev. Corp., Rev. Bonds (Highland Hospital of Rochester Project), Series 2015, 5.00% 2033 | 430 | 497 | ||||||
| County of Monroe, Industrial Dev. Corp., Rev. Bonds (Highland Hospital of Rochester Project), Series 2015, 5.00% 2034 | 380 | 438 | ||||||
| County of Monroe, Industrial Dev. Corp., Rev. Bonds (St. Ann’s of Greater Rochester, Inc.), Series 2019, 5.00% 2050 | 1,500 | 1,353 | ||||||
| County of Monroe, Industrial Dev. Corp., Rev. Bonds (University of Rochester Project), Series 2017-C, 4.00% 2036 | 1,275 | 1,473 | ||||||
| County of Nassau, G.O. General Improvement Bonds, Series 2017-A, 5.00% 2030 | 1,000 | 1,229 | ||||||
| County of Nassau, G.O. General Improvement Rev. Ref. Bonds, Series 2016-A, 5.00% 2030 | 1,795 | 2,155 | ||||||
| New York City G.O. Bonds, Fiscal 2015, Series 2015-C, 5.00% 2033 | 1,000 | 1,167 | ||||||
| New York City G.O. Bonds, Fiscal 2016, Series 2016-A, 5.00% 2026 | 1,000 | 1,221 | ||||||
| New York City G.O. Bonds, Fiscal 2016, Series 2016-C, 5.00% 2031 | 1,000 | 1,207 | ||||||
| New York City G.O. Bonds, Fiscal 2017, Series 2017-A-1, 5.00% 2034 | 1,000 | 1,210 | ||||||
| New York City G.O. Bonds, Fiscal 2018, Series 2018-A, 5.00% 2027 | 1,500 | 1,946 | ||||||
| New York City G.O. Bonds, Fiscal 2018, Series 2018-C, 5.00% 2032 | 1,720 | 2,182 | ||||||
| New York City G.O. Bonds, Fiscal 2019, Series 2019-D-1, 5.00% 2037 | 750 | 950 | ||||||
| New York City G.O. Bonds, Fiscal 2020, Series 2020-B-1, 4.00% 2040 | 1,250 | 1,473 | ||||||
| New York City Housing Dev. Corp., Multi Family Housing Rev. Bonds (8 Spruce Street), Series 2014-E, 3.50% 2048 | 1,670 | 1,736 | ||||||
| New York City Housing Dev. Corp., Multi Family Housing Rev. Bonds (Sustainable Neighborhood Bonds), Series 2015-H, 2.95% 2045 (put 2026) | 750 | 821 | ||||||
| New York City Housing Dev. Corp., Multi Family Housing Rev. Bonds (Sustainable Neighborhood Bonds), Series 2017-A-1-A, 3.80% 2037 | 885 | 973 | ||||||
| New York City Housing Dev. Corp., Multi Family Housing Rev. Bonds (Sustainable Neighborhood Bonds), Series 2017-C-2, 1.70% 2021 | 400 | 401 | ||||||
| 82 | American Funds Tax-Exempt Funds |
American Funds Tax-Exempt Fund of New York
| Principal amount (000) | Value (000) | |||||||
| New York City Housing Dev. Corp., Multi Family Housing Rev. Bonds (Sustainable Neighborhood Bonds), Series 2018-L-2, 2.75% 2050 (put 2023) | $ | 500 | $ | 524 | ||||
| New York City Housing Dev. Corp., Multi Family Housing Rev. Bonds (Sustainable Neighborhood Bonds), Series 2019-E-2, 1.75% 2059 (put 2023) | 1,000 | 1,014 | ||||||
| New York City Housing Dev. Corp., Multi Family Housing Rev. Bonds (Sustainable Neighborhood Bonds), Series 2020-A-3, 1.125% 2060 (put 2024) | 750 | 757 | ||||||
| New York City Municipal Water Fin. Auth., Water and Sewer System Rev. Bonds, Series 2011-EE, 5.375% 2043 | 590 | 600 | ||||||
| New York City Municipal Water Fin. Auth., Water and Sewer System Second General Resolution Rev. Bonds, Fiscal 2015, Series 2015-EE, 5.00% 2045 | 500 | 574 | ||||||
| New York City Municipal Water Fin. Auth., Water and Sewer System Second General Resolution Rev. Bonds, Fiscal 2015, Series 2015-HH, 5.00% 2039 | 500 | 596 | ||||||
| New York City Municipal Water Fin. Auth., Water and Sewer System Second General Resolution Rev. Bonds, Fiscal 2017, Series 2017-CC-1, 4.00% 2046 | 1,000 | 1,127 | ||||||
| New York City Municipal Water Fin. Auth., Water and Sewer System Second General Resolution Rev. Bonds, Fiscal 2017, Series 2017-DD, 5.00% 2047 | 1,055 | 1,292 | ||||||
| New York City Municipal Water Fin. Auth., Water and Sewer System Second General Resolution Rev. Bonds, Fiscal 2017, Series 2017-EE, 5.00% 2033 | 750 | 957 | ||||||
| New York City Municipal Water Fin. Auth., Water and Sewer System Second General Resolution Rev. Bonds, Fiscal 2018, Series 2018-BB-1, 5.00% 2046 | 1,250 | 1,539 | ||||||
| New York City Municipal Water Fin. Auth., Water and Sewer System Second General Resolution Rev. Bonds, Fiscal 2019, Series 2019-FF-2, 5.00% 2040 | 1,000 | 1,305 | ||||||
| New York City Municipal Water Fin. Auth., Water and Sewer System Second General Resolution Rev. Bonds, Fiscal 2020, Series 2020-GG-1, 4.00% 2050 | 2,000 | 2,396 | ||||||
| New York City Municipal Water Fin. Auth., Water and Sewer System Second General Resolution Rev. Ref. Bonds, Fiscal 2017, Series 2017-EE, 5.00% 2036 | 750 | 948 | ||||||
| New York City Transitional Fin. Auth., Building Aid Rev. Bonds, Fiscal 2018, Series 2018-S-2, 5.00% 2036 | 590 | 728 | ||||||
| New York City Transitional Fin. Auth., Building Aid Rev. Bonds, Fiscal 2018, Series 2018-S-4-A, 5.00% 2037 | 750 | 950 | ||||||
| New York City Transitional Fin. Auth., Building Aid Rev. Bonds, Fiscal 2019, Series 2019-S-1, 5.00% 2043 | 1,000 | 1,243 | ||||||
| New York City Transitional Fin. Auth., Building Aid Rev. Bonds, Fiscal 2019, Series 2019-S-3, 5.00% 2036 | 1,000 | 1,266 | ||||||
| New York City Transitional Fin. Auth., Future Tax Secured Bonds, Fiscal 2011, Series 2011-C, 5.25% 2025 | 700 | 708 | ||||||
| New York City Transitional Fin. Auth., Future Tax Secured Bonds, Fiscal 2017, Series 2017-C, 5.00% 2032 | 1,000 | 1,251 | ||||||
| New York City Transitional Fin. Auth., Future Tax Secured Bonds, Fiscal 2017, Series 2017-E-1, 5.00% 2043 | 1,000 | 1,210 | ||||||
| New York City Transitional Fin. Auth., Future Tax Secured Bonds, Fiscal 2017, Series 2017-F-1, 5.00% 2039 | 750 | 920 | ||||||
| New York City Transitional Fin. Auth., Future Tax Secured Bonds, Fiscal 2017, Series 2017-F-1, 5.00% 2042 | 1,000 | 1,219 | ||||||
| New York City Transitional Fin. Auth., Future Tax Secured Bonds, Fiscal 2018, Series 2018-A-3, 4.00% 2042 | 2,925 | 3,346 | ||||||
| New York City Transitional Fin. Auth., Future Tax Secured Bonds, Fiscal 2019, Series 2019-A-1, 5.00% 2036 | 2,380 | 3,034 | ||||||
| New York City Transitional Fin. Auth., Future Tax Secured Bonds, Fiscal 2019, Series 2019-C-1, 5.00% 2034 | 750 | 981 | ||||||
| New York City Transitional Fin. Auth., Future Tax Secured Bonds, Fiscal 2020, Series 2020-A-3, 4.00% 2042 | 1,500 | 1,762 | ||||||
| New York City Transitional Fin. Auth., Future Tax Secured Bonds, Fiscal 2020, Series 2020-B-1, 4.00% 2040 | 1,500 | 1,783 | ||||||
| Niagara Frontier Transportation Auth., Airport Rev. Ref. Bonds (Buffalo Niagara International Airport), Series 2014-A, AMT, 5.00% 2027 | 600 | 681 | ||||||
| Niagara Frontier Transportation Auth., Airport Rev. Ref. Bonds (Buffalo Niagara International Airport), Series 2014-A, AMT, 5.00% 2028 | 500 | 566 | ||||||
| Niagara Frontier Transportation Auth., Airport Rev. Ref. Bonds (Buffalo Niagara International Airport), Series 2014-A, AMT, 5.00% 2029 | 700 | 791 | ||||||
| Niagara Frontier Transportation Auth., Airport Rev. Ref. Bonds (Buffalo Niagara International Airport), Series 2019-A, AMT, 5.00% 2031 | 1,000 | 1,266 | ||||||
| County of Onondaga, Resource Recovery Agcy., Rev. Ref. Bonds, Series 2015-A, AMT, Assured Guaranty Municipal insured, 5.00% 2030 | 1,750 | 2,059 | ||||||
| American Funds Tax-Exempt Funds | 83 |
American Funds Tax-Exempt Fund of New York
| Bonds, notes & other debt instruments (continued) | Principal amount (000) | Value (000) | ||||||
| New York (continued) | ||||||||
| City, county & other issuers (continued) | ||||||||
| Town of Southold, Local Dev. Corp., Rev. Bonds (Peconic Landing at Southold, Inc. Project), Series 2015, 5.00% 2045 | $ | 1,500 | $ | 1,565 | ||||
| City of Troy, Capital Resource Corp., Rev. Bonds (Rensselaer Polytechnic Institute Project), Series 2015, 5.00% 2027 | 800 | 939 | ||||||
| City of Troy, Capital Resource Corp., Rev. Ref. Bonds (Rensselaer Polytechnic Institute Project), Series 2020-A, 5.00% 2023 | 600 | 667 | ||||||
| City of Troy, Capital Resource Corp., Rev. Ref. Bonds (Rensselaer Polytechnic Institute Project), Series 2020-A, 5.00% 2038 | 1,500 | 1,850 | ||||||
| County of Westchester, Local Dev. Corp., Rev. Bonds (Purchase Housing Corp. II Project), Series 2017, 5.00% 2037 | 1,000 | 1,080 | ||||||
| County of Westchester, Local Dev. Corp., Rev. Bonds (Purchase Housing Corp. II Project), Series 2017, 5.00% 2047 | 1,000 | 1,064 | ||||||
| County of Westchester, Local Dev. Corp., Rev. Bonds (Westchester Medical Center Obligated Group Project), Series 2016, 5.00% 2034 | 1,150 | 1,273 | ||||||
| County of Westchester, Local Dev. Corp., Rev. Bonds (Westchester Medical Center Obligated Group Project), Series 2016, 5.00% 2046 | 1,250 | 1,332 | ||||||
| County of Westchester, Local Dev. Corp., Rev. Ref. Bonds (Pace University), Series 2014-A, 5.50% 2042 | 450 | 492 | ||||||
| Other securities | 27,835 | |||||||
| 131,853 | ||||||||
| Other U.S. territories 2.62% | ||||||||
| Other securities | 7,642 | |||||||
| Total bonds, notes & other debt instruments (cost: $267,723,000) | 281,953 | |||||||
| Short-term securities 3.15% | ||||||||
| Dormitory Auth., Rev. Bonds (Cornell University), Series 2019-B, 0.11% 20392 | 4,100 | 4,100 | ||||||
| Dormitory Auth., Rev. Bonds (University of Rochester), Series 2003-A, JPMorgan Chase LOC, 0.18% 20312 | 900 | 900 | ||||||
| City of Syracuse, Industrial Dev. Agcy., Civic Fac. Rev. Bonds (Syracuse University Project), Series 2008-A-2, JPMorgan Chase LOC, 0.13% 20372 | 4,220 | �� | 4,220 | |||||
| Total short-term securities (cost: $9,220,000) | 9,220 | |||||||
| Total investment securities 99.59% (cost: $276,943,000) | 291,173 | |||||||
| Other assets less liabilities 0.41% | 1,204 | |||||||
| Net assets 100.00% | $ | 292,377 | ||||||
This summary investment portfolio is designed to streamline the report and help investors better focus on the fund’s principal holdings. See the inside back cover for details on how to obtain a complete schedule of portfolio holdings.
“Other securities” includes all issues that are not disclosed separately in the summary investment portfolio.
| 1 | Acquired in a transaction exempt from registration under Rule 144A of the Securities Act of 1933. May be resold in the U.S. in transactions exempt from registration, normally to qualified institutional buyers. The total value of all such securities, including those in “Other securities,” was $11,174,000, which represented 3.82% of the net assets of the fund. |
| 2 | Coupon rate may change periodically. Reference rate and spread are as of the most recent information available. Some coupon rates are determined by the issuer or agent based on current market conditions; therefore, the reference rate and spread are not available. For short-term securities, the date of the next scheduled coupon rate change is considered to be the maturity date. |
| 84 | American Funds Tax-Exempt Funds |
American Funds Tax-Exempt Fund of New York
Key to abbreviations and symbol
Agcy. = Agency
AMT = Alternative Minimum Tax
Auth. = Authority
Certs. of Part. = Certificates of Participation
Dept. = Department
Dev. = Development
Dist. = District
Econ. = Economic
Fac. = Facility
Facs. = Facilities
Fin. = Finance
Fncg. = Financing
G.O. = General Obligation
IAM = Interest at Maturity
LIBOR = London Interbank Offered Rate
LOC = Letter of Credit
Preref. = Prerefunded
Redev. = Redevelopment
Ref. = Refunding
Rev. = Revenue
SIFMA = Securities Industry and Financial Markets Association
USD/$ = U.S. dollars
| American Funds Tax-Exempt Funds | 85 |
Statements of assets and liabilities
at July 31, 2020
| American Funds Short-Term Tax-Exempt Bond Fund | Limited Term Tax-Exempt Bond Fund of America | |||||||
| Assets: | ||||||||
| Investment securities of unaffiliated issuers, at value | $ | 1,414,278 | $ | 5,615,855 | ||||
| Cash | 2,673 | 3,673 | ||||||
| Cash collateral pledged for futures contracts | 10 | 10 | ||||||
| Receivables for: | ||||||||
| Sales of investments | — | — | ||||||
| Sales of fund’s shares | 6,552 | 22,023 | ||||||
| Interest | 11,543 | 43,786 | ||||||
| Variation margin on futures contracts | — | — | ||||||
| 1,435,056 | 5,685,347 | |||||||
| Liabilities: | ||||||||
| Payables for: | ||||||||
| Purchases of investments | 32,377 | 135,521 | ||||||
| Repurchases of fund’s shares | 926 | 4,124 | ||||||
| Dividends on fund’s shares | 33 | 361 | ||||||
| Investment advisory services | 395 | 952 | ||||||
| Services provided by related parties | 136 | 814 | ||||||
| Trustees’ deferred compensation | 34 | 131 | ||||||
| Variation margin on futures contracts | — | — | ||||||
| Other | 1 | 2 | ||||||
| 33,902 | 141,905 | |||||||
| Net assets at July 31, 2020 | $ | 1,401,154 | $ | 5,543,442 | ||||
| Net assets consist of: | ||||||||
| Capital paid in on shares of beneficial interest | $ | 1,368,485 | $ | 5,327,471 | ||||
| Total distributable earnings | 32,669 | 215,971 | ||||||
| Net assets at July 31, 2020 | $ | 1,401,154 | $ | 5,543,442 | ||||
| Investment securities of unaffiliated issuers, at cost | $ | 1,385,101 | $ | 5,431,212 | ||||
| * | Amount less than one thousand. |
See notes to financial statements.
| 86 | American Funds Tax-Exempt Funds |
(dollars in thousands)
| The Tax-Exempt Bond Fund of America | American High-Income Municipal Bond Fund | The Tax-Exempt Fund of California | American Funds Tax-Exempt Fund of New York | |||||||||||
| $ | 25,494,291 | $ | 8,235,615 | $ | 2,937,814 | $ | 291,173 | |||||||
| 2,363 | 4,132 | 265 | 482 | |||||||||||
| 11,609 | 3,008 | 10 | — | |||||||||||
| 13,033 | 5,137 | 169 | — | |||||||||||
| 77,680 | 17,259 | 3,541 | 466 | |||||||||||
| 206,593 | 71,833 | 33,770 | 2,613 | |||||||||||
| 6 | 1 | — | — | |||||||||||
| 25,805,575 | 8,336,985 | 2,975,569 | 294,734 | |||||||||||
| 218,578 | 35,411 | 29,391 | 1,415 | |||||||||||
| 27,789 | 11,872 | 5,015 | 736 | |||||||||||
| 2,148 | 1,377 | 539 | 90 | |||||||||||
| 4,009 | 1,925 | 663 | 72 | |||||||||||
| 3,204 | 1,216 | 525 | 42 | |||||||||||
| 709 | 138 | 124 | 2 | |||||||||||
| 384 | 116 | — | — | |||||||||||
| 10 | 1 | 1 | — | * | ||||||||||
| 256,831 | 52,056 | 36,258 | 2,357 | |||||||||||
| $ | 25,548,744 | $ | 8,284,929 | $ | 2,939,311 | $ | 292,377 | |||||||
| $ | 24,125,132 | $ | 7,998,893 | $ | 2,775,102 | $ | 277,995 | |||||||
| 1,423,612 | 286,036 | 164,209 | 14,382 | |||||||||||
| $ | 25,548,744 | $ | 8,284,929 | $ | 2,939,311 | $ | 292,377 | |||||||
| $ | 24,075,133 | $ | 7,972,247 | $ | 2,781,810 | $ | 276,943 | |||||||
| American Funds Tax-Exempt Funds | 87 |
Statements of assets and liabilities
at July 31, 2020
| American Funds Short-Term Tax-Exempt Bond Fund | Limited Term Tax-Exempt Bond Fund of America | |||||||||
| Shares of beneficial interest issued and outstanding (no stated par value) — unlimited shares authorized | ||||||||||
| Class A: | Net assets | $ | 937,971 | $ | 3,539,063 | |||||
| Shares outstanding | 90,466 | 218,020 | ||||||||
| Net asset value per share | $ | 10.37 | $ | 16.23 | ||||||
| Class C: | Net assets | $ | 16,124 | |||||||
| Shares outstanding | Not applicable | 993 | ||||||||
| Net asset value per share | $ | 16.23 | ||||||||
| Class T: | Net assets | $ | 10 | $ | 10 | |||||
| Shares outstanding | 1 | 1 | ||||||||
| Net asset value per share | $ | 10.37 | $ | 16.23 | ||||||
| Class F-1: | Net assets | $ | 8,496 | $ | 96,960 | |||||
| Shares outstanding | 819 | 5,973 | ||||||||
| Net asset value per share | $ | 10.37 | $ | 16.23 | ||||||
| Class F-2: | Net assets | $ | 218,130 | $ | 777,269 | |||||
| Shares outstanding | 21,039 | 47,883 | ||||||||
| Net asset value per share | $ | 10.37 | $ | 16.23 | ||||||
| Class F-3: | Net assets | $ | 74,200 | $ | 422,222 | |||||
| Shares outstanding | 7,157 | 26,011 | ||||||||
| Net asset value per share | $ | 10.37 | $ | 16.23 | ||||||
| Class R-6: | Net assets | $ | 162,347 | $ | 691,794 | |||||
| Shares outstanding | 15,658 | 42,617 | ||||||||
| Net asset value per share | $ | 10.37 | $ | 16.23 | ||||||
See notes to financial statements.
| 88 | American Funds Tax-Exempt Funds |
(dollars and shares in thousands, except per-share amounts)
| The Tax-Exempt Bond Fund of America | American High-Income Municipal Bond Fund | The Tax-Exempt Fund of California | American Funds Tax-Exempt Fund of New York | |||||||||||
| $ | 12,623,225 | $ | 4,870,492 | $ | 1,940,724 | $ | 219,678 | |||||||
| 932,520 | 300,846 | 106,132 | 19,796 | |||||||||||
| $ | 13.54 | $ | 16.20 | $ | 18.29 | $ | 11.10 | |||||||
| $ | 376,260 | $ | 203,467 | $ | 60,084 | $ | 10,075 | |||||||
| 27,796 | 12,568 | 3,286 | 908 | |||||||||||
| $ | 13.54 | $ | 16.20 | $ | 18.29 | $ | 11.10 | |||||||
| $ | 10 | $ | 10 | $ | 10 | $ | 10 | |||||||
| 1 | 1 | 1 | 1 | |||||||||||
| $ | 13.54 | $ | 16.20 | $ | 18.29 | $ | 11.10 | |||||||
| $ | 313,080 | $ | 146,465 | $ | 71,553 | $ | 2,357 | |||||||
| 23,128 | 9,047 | 3,913 | 212 | |||||||||||
| $ | 13.54 | $ | 16.20 | $ | 18.29 | $ | 11.10 | |||||||
| $ | 3,813,920 | $ | 1,185,507 | $ | 546,727 | $ | 27,369 | |||||||
| 281,747 | 73,228 | 29,898 | 2,467 | |||||||||||
| $ | 13.54 | $ | 16.20 | $ | 18.29 | $ | 11.10 | |||||||
| $ | 7,949,734 | $ | 1,085,433 | $ | 320,213 | $ | 32,888 | |||||||
| 587,273 | 67,046 | 17,511 | 2,964 | |||||||||||
| $ | 13.54 | $ | 16.20 | $ | 18.29 | $ | 11.10 | |||||||
| $ | 472,515 | $ | 793,555 | |||||||||||
| 34,906 | 49,017 | Not applicable | Not applicable | |||||||||||
| $ | 13.54 | $ | 16.20 | |||||||||||
| American Funds Tax-Exempt Funds | 89 |
Statements of operations
for the year ended July 31, 2020
| American Funds Short-Term Tax-Exempt Bond Fund | Limited Term Tax-Exempt Bond Fund of America | |||||||
| Investment income: | ||||||||
| Income: | ||||||||
| Interest | $ | 22,699 | $ | 100,977 | ||||
| Fees and expenses*: | ||||||||
| Investment advisory services | 4,190 | 10,058 | ||||||
| Distribution services | 1,258 | 10,051 | ||||||
| Transfer agent services | 444 | 1,866 | ||||||
| Administrative services | 369 | 1,392 | ||||||
| Reports to shareholders | 27 | 106 | ||||||
| Registration statement and prospectus | 166 | 430 | ||||||
| Trustees’ compensation | 7 | 29 | ||||||
| Auditing and legal | 50 | 65 | ||||||
| Custodian | 3 | 11 | ||||||
| Federal, state and local taxes | 3 | 1 | ||||||
| Other | 13 | 29 | ||||||
| Total fees and expenses before reimbursements | 6,530 | 24,038 | ||||||
| Miscellaneous fee reimbursements | 23 | — | ||||||
| Total fees and expenses after reimbursements | 6,507 | 24,038 | ||||||
| Net investment income | 16,192 | 76,939 | ||||||
| Net realized gain and unrealized appreciation (depreciation): | ||||||||
| Net realized gain (loss) on: | ||||||||
| Investments in unaffiliated issuers | 2,704 | 24,535 | ||||||
| Futures contracts | 4,135 | 11,248 | ||||||
| 6,839 | 35,783 | |||||||
| Net unrealized appreciation (depreciation) on: | ||||||||
| Investments in unaffiliated issuers | 15,849 | 76,353 | ||||||
| Futures contracts | (9 | ) | 1,795 | |||||
| 15,840 | 78,148 | |||||||
| Net realized gain and unrealized appreciation (depreciation) | 22,679 | 113,931 | ||||||
| Net increase in net assets resulting from operations | $ | 38,871 | $ | 190,870 | ||||
| * | Additional information related to class-specific fees and expenses is included in the notes to financial statements. |
See notes to financial statements.
| 90 | American Funds Tax-Exempt Funds |
(dollars in thousands)
| The Tax-Exempt Bond Fund of America | American High-Income Municipal Bond Fund | The Tax-Exempt Fund of California | American Funds Tax-Exempt Fund of New York | |||||||||||
| $ | 701,693 | $ | 348,287 | $ | 83,200 | $ | 8,819 | |||||||
| 45,861 | 22,212 | 7,617 | 854 | |||||||||||
| 34,025 | 17,159 | 5,547 | 650 | |||||||||||
| 7,932 | 3,831 | 895 | 96 | |||||||||||
| 7,056 | 2,428 | 831 | 87 | |||||||||||
| 551 | 211 | 54 | 7 | |||||||||||
| 1,239 | 578 | 137 | 96 | |||||||||||
| 148 | 48 | 19 | 1 | |||||||||||
| 120 | 78 | 85 | 59 | |||||||||||
| 55 | 20 | 6 | 1 | |||||||||||
| 936 | 914 | 504 | 2 | |||||||||||
| 43 | 175 | 27 | 12 | |||||||||||
| 97,966 | 47,654 | 15,722 | 1,865 | |||||||||||
| — | — | — | 121 | |||||||||||
| 97,966 | 47,654 | 15,722 | 1,744 | |||||||||||
| 603,727 | 300,633 | 67,478 | 7,075 | |||||||||||
| 54,645 | 11,664 | 12,185 | 145 | |||||||||||
| (54,104 | ) | (10,426 | ) | 3,981 | (44 | ) | ||||||||
| 541 | 1,238 | 16,166 | 101 | |||||||||||
| 426,107 | (121,031 | ) | 26,478 | 1,241 | ||||||||||
| (991 | ) | (2,227 | ) | 1,166 | 2 | |||||||||
| 425,116 | (123,258 | ) | 27,644 | 1,243 | ||||||||||
| 425,657 | (122,020 | ) | 43,810 | 1,344 | ||||||||||
| $ | 1,029,384 | $ | 178,613 | $ | 111,288 | $ | 8,419 | |||||||
| American Funds Tax-Exempt Funds | 91 |
Statements of changes in net assets
| American Funds Short-Term Tax-Exempt Bond Fund | Limited Term Tax-Exempt Bond Fund of America | The Tax-Exempt Bond Fund of America | ||||||||||||||||||||||
| Year ended July 31, | Year ended July 31, | Year ended July 31, | ||||||||||||||||||||||
| 2020 | 2019 | 2020 | 2019 | 2020 | 2019 | |||||||||||||||||||
| Operations: | ||||||||||||||||||||||||
| Net investment income | $ | 16,192 | $ | 17,329 | $ | 76,939 | $ | 82,425 | $ | 603,727 | $ | 574,456 | ||||||||||||
| Net realized gain (loss) | 6,839 | 62 | 35,783 | 13,065 | 541 | 11,303 | ||||||||||||||||||
| Net unrealized appreciation (depreciation) | 15,840 | 18,116 | 78,148 | 94,262 | 425,116 | 726,430 | ||||||||||||||||||
| Net increase in net assets resulting from operations | 38,871 | 35,507 | 190,870 | 189,752 | 1,029,384 | 1,312,189 | ||||||||||||||||||
| Distributions paid or accrued to shareholders | (16,095 | ) | (17,259 | ) | (92,783 | ) | (82,197 | ) | (600,402 | ) | (570,280 | ) | ||||||||||||
| Net capital share transactions | 238,000 | 143,943 | 1,192,547 | 179,942 | 3,474,125 | 1,875,666 | ||||||||||||||||||
| Total increase in net assets | 260,776 | 162,191 | 1,290,634 | 287,497 | 3,903,107 | 2,617,575 | ||||||||||||||||||
| Net assets: | ||||||||||||||||||||||||
| Beginning of year | 1,140,378 | 978,187 | 4,252,808 | 3,965,311 | 21,645,637 | 19,028,062 | ||||||||||||||||||
| End of year | $ | 1,401,154 | $ | 1,140,378 | $ | 5,543,442 | $ | 4,252,808 | $ | 25,548,744 | $ | 21,645,637 | ||||||||||||
See notes to financial statements.
| 92 | American Funds Tax-Exempt Funds |
(dollars in thousands)
| American High-Income Municipal Bond Fund | The Tax-Exempt Fund of California | American Funds Tax-Exempt Fund of New York | ||||||||||||||||||||
| Year ended July 31, | Year ended July 31, | Year ended July 31, | ||||||||||||||||||||
| 2020 | 2019 | 2020 | 2019 | 2020 | 2019 | |||||||||||||||||
| $ | 300,633 | $ | 257,928 | $ | 67,478 | $ | 67,429 | $ | 7,075 | $ | 6,510 | |||||||||||
| 1,238 | (4,530 | ) | 16,166 | 4,454 | 101 | 73 | ||||||||||||||||
| (123,258 | ) | 249,037 | 27,644 | 82,681 | 1,243 | 9,697 | ||||||||||||||||
| 178,613 | 502,435 | 111,288 | 154,564 | 8,419 | 16,280 | |||||||||||||||||
| (286,652 | ) | (253,695 | ) | (81,555 | ) | (66,970 | ) | (7,018 | ) | (6,466 | ) | |||||||||||
| 640,714 | 1,012,098 | 332,697 | 233,925 | 16,022 | 26,639 | |||||||||||||||||
| 532,675 | 1,260,838 | 362,430 | 321,519 | 17,423 | 36,453 | |||||||||||||||||
| 7,752,254 | 6,491,416 | 2,576,881 | 2,255,362 | 274,954 | 238,501 | |||||||||||||||||
| $ | 8,284,929 | $ | 7,752,254 | $ | 2,939,311 | $ | 2,576,881 | $ | 292,377 | $ | 274,954 | |||||||||||
| American Funds Tax-Exempt Funds | 93 |
Notes to financial statements
1. Organization
American Funds Short-Term Tax-Exempt Bond Fund, Limited Term Tax-Exempt Bond Fund of America, The Tax-Exempt Bond Fund of America, American High-Income Municipal Bond Fund, The Tax-Exempt Fund of California, which is presently the only series of The American Funds Tax-Exempt Series II, and American Funds Tax-Exempt Fund of New York (each a “fund” or collectively, the “funds”), are registered under the Investment Company Act of 1940 as open-end, diversified management investment companies.
Each fund’s investment objectives are as follows:
American Funds Short-Term Tax-Exempt Bond Fund — Seeks to provide current income exempt from regular federal income tax, consistent with the maturity and quality standards described in the prospectus, and to preserve capital.
Limited Term Tax-Exempt Bond Fund of America — Seeks to provide current income exempt from regular federal income tax, consistent with the maturity and quality standards described in the prospectus, and to preserve capital.
The Tax-Exempt Bond Fund of America — Seeks to provide a high level of current income exempt from federal income tax, consistent with the preservation of capital.
American High-Income Municipal Bond Fund — Seeks to provide a high level of current income exempt from regular federal income tax.
The Tax-Exempt Fund of California — Seeks to provide a high level of current income exempt from regular federal and California state income taxes. Its secondary objective is preservation of capital.
American Funds Tax-Exempt Fund of New York — Seeks to provide a high level of current income exempt from regular federal, New York state and New York City income taxes. Its secondary objective is preservation of capital.
American Funds Short-Term Tax-Exempt Bond Fund has six share classes consisting of five retail share classes (Classes A and T, as well as three F share classes, F-1, F-2 and F-3) and one share class that is only available to the American Funds Portfolio Series (Class R-6). Limited Term Tax-Exempt Bond Fund of America, The Tax-Exempt Bond Fund of America and American High-Income Municipal Bond Fund each have seven share classes consisting of six retail share classes (Classes A, C and T, as well as three F share classes, F-1, F-2 and F-3) and one share class that is only available to the American Funds Portfolio Series (Class R-6). The Tax-Exempt Fund of California and American Funds Tax-Exempt Fund of New York each have six retail share classes (Classes A, C and T, as well as three F share classes, F-1, F-2 and F-3). Some share classes are only available to limited categories of investors. The funds’ share classes are described further in the following table:
| Share class | Initial sales charge | Contingent deferred sales charge upon redemption | Conversion feature | |||
| Class A | Up to 2.50% for American Funds Short-Term Tax-Exempt Bond Fund and Limited Term Tax-Exempt Bond Fund of America; up to 3.75% for all other funds | None (except 1% for certain redemptions within 18 months of purchase without an initial sales charge) | None | |||
| Class C1 | None | 1% for redemptions within one year of purchase | Class C converts to Class F-1 after 10 years2 | |||
| Class T3 | Up to 2.50% | None | None | |||
| Classes F-1, F-2 and F-3 | None | None | None | |||
| Class R-6 | None | None | None |
| 1 | Class C shares are not available for purchase in Limited Term Tax-Exempt Bond Fund of America. |
| 2 | Effective June 30, 2020, Class C converts to Class A after 8 years. |
| 3 | Class T shares are not available for purchase. |
Holders of all share classes of each fund have equal pro rata rights to the assets, dividends and liquidation proceeds of each fund held. Each share class of each fund has identical voting rights, except for the exclusive right to vote on matters affecting only its class. Share classes have different fees and expenses (“class-specific fees and expenses”), primarily due to different arrangements for distribution, transfer agent and administrative services. Differences in class-specific fees and expenses will result in differences in net investment income and, therefore, the payment of different per-share dividends by each share class of each fund.
| 94 | American Funds Tax-Exempt Funds |
2. Significant accounting policies
Each fund is an investment company that applies the accounting and reporting guidance issued in Topic 946 by the U.S. Financial Accounting Standards Board. Each fund’s financial statements have been prepared to comply with U.S. generally accepted accounting principles (“U.S. GAAP”). These principles require the funds’ investment adviser to make estimates and assumptions that affect reported amounts and disclosures. Actual results could differ from those estimates. Subsequent events, if any, have been evaluated through the date of issuance in the preparation of the financial statements. The funds follow the significant accounting policies described in this section, as well as the valuation policies described in the next section on valuation.
Security transactions and related investment income — Security transactions are recorded by the funds as of the date the trades are executed with brokers. Realized gains and losses from security transactions are determined based on the specific identified cost of the securities. In the event a security is purchased with a delayed payment date, the funds will segregate liquid assets sufficient to meet their payment obligations. Interest income is recognized on an accrual basis. Market discounts, premiums and original issue discounts on fixed-income securities are amortized daily over the expected life of the security.
Class allocations — Income, fees and expenses (other than class-specific fees and expenses) are allocated daily among the various share classes of each fund based on the relative value of their settled shares. Realized gains and losses and unrealized appreciation and depreciation are allocated daily among the various share classes of each fund based on their relative net assets. Class-specific fees and expenses, such as distribution, transfer agent and administrative services, are charged directly to the respective share class of each fund.
Distributions paid or accrued to shareholders — Income dividends are declared daily after the determination of each fund’s net investment income and are paid to shareholders monthly. Capital gain distributions are recorded on each fund’s ex-dividend date.
3. Valuation
Capital Research and Management Company (“CRMC”), the funds’ investment adviser, values each fund’s investments at fair value as defined by U.S. GAAP. The net asset value of each share class of each fund is generally determined as of approximately 4:00 p.m. New York time each day the New York Stock Exchange is open.
Methods and inputs — The funds’ investment adviser uses the following methods and inputs to establish the fair value of each fund’s assets and liabilities. Use of particular methods and inputs may vary over time based on availability and relevance as market and economic conditions evolve.
Fixed-income securities, including short-term securities, are generally valued at prices obtained from one or more pricing vendors. Vendors value such securities based on one or more of the following inputs: benchmark yields, transactions, bids, offers, quotations from dealers and trading systems, new issues, spreads and other relationships observed in the markets among comparable securities; and proprietary pricing models such as yield measures calculated using factors such as cash flows, financial or collateral performance and other reference data. For certain distressed securities, valuations may include cash flows or liquidation values using a net present value calculation based on inputs that include, but are not limited to, financial statements and debt contracts.
When the funds’ investment adviser deems it appropriate to do so (such as when vendor prices are unavailable or not deemed to be representative), fixed-income securities will be valued in good faith at the mean quoted bid and ask prices that are reasonably and timely available (or bid prices, if ask prices are not available) or at prices for securities of comparable maturity, quality and type. Some securities may be valued based on their effective maturity or average life, which may be shorter than the stated maturity.
Exchange-traded futures are generally valued at the official settlement price of the exchange or market on which such instruments are traded, as of the close of business on the day the futures are being valued.
Securities and other assets for which representative market quotations are not readily available or are considered unreliable by the funds’ investment adviser are fair valued as determined in good faith under fair valuation guidelines adopted by authority of each fund’s board of trustees as further described. The investment adviser follows fair valuation guidelines, consistent with U.S. Securities and Exchange Commission rules and guidance, to consider relevant principles and factors when making fair value determinations. The investment adviser considers relevant indications of value that are reasonably and timely available to it in determining the fair value to be assigned to a particular security, such as the type and cost of the security; contractual or legal restrictions on resale of the security; relevant financial or business developments of the issuer; actively traded similar or related securities; conversion or exchange rights on the security; related corporate actions; significant events occurring after the close of trading in the security; and changes in overall market conditions. In addition, the closing prices of equity securities that trade in markets outside U.S. time zones may be adjusted to reflect significant events that occur after the close of local trading but before the net asset value of each share class of the fund is determined. Fair valuations and valuations of investments that are not actively trading involve judgment and may differ materially from valuations that would have been used had greater market activity occurred.
| American Funds Tax-Exempt Funds | 95 |
Processes and structure — Each fund’s board of trustees has delegated authority to the funds’ investment adviser to make fair value determinations, subject to board oversight. The investment adviser has established a Joint Fair Valuation Committee (the “Fair Valuation Committee”) to administer, implement and oversee the fair valuation process, and to make fair value decisions. The Fair Valuation Committee regularly reviews its own fair value decisions, as well as decisions made under its standing instructions to the investment adviser’s valuation teams. The Fair Valuation Committee reviews changes in fair value measurements from period to period and may, as deemed appropriate, update the fair valuation guidelines to better reflect the results of back testing and address new or evolving issues. The Fair Valuation Committee reports any changes to the fair valuation guidelines to the boards of trustees. Each fund’s board and audit committee also regularly review reports that describe fair value determinations and methods.
The funds’ investment adviser has also established a Fixed-Income Pricing Review Group to administer and oversee the fixed-income valuation process, including the use of fixed-income pricing vendors. This group regularly reviews pricing vendor information and market data. Pricing decisions, processes and controls over security valuation are also subject to additional internal reviews, including an annual control self-evaluation program facilitated by the investment adviser’s compliance group.
Classifications — The funds’ investment adviser classifies each fund’s assets and liabilities into three levels based on the inputs used to value the assets or liabilities. Level 1 values are based on quoted prices in active markets for identical securities. Level 2 values are based on significant observable market inputs, such as quoted prices for similar securities and quoted prices in inactive markets. Certain securities trading outside the U.S. may transfer between Level 1 and Level 2 due to valuation adjustments resulting from significant market movements following the close of local trading. Level 3 values are based on significant unobservable inputs that reflect the investment adviser’s determination of assumptions that market participants might reasonably use in valuing the securities. The valuation levels are not necessarily an indication of the risk or liquidity associated with the underlying investment. For example, U.S. government securities are reflected as Level 2 because the inputs used to determine fair value may not always be quoted prices in an active market.
The funds’ valuation levels as of July 31, 2020 are as follows (dollars in thousands):
American Funds Short-Term Tax-Exempt Bond Fund
At July 31, 2020, all of the fund’s investment securities were classified as Level 2.
Limited Term Tax-Exempt Bond Fund of America
At July 31, 2020, all of the fund’s investment securities were classified as Level 2.
The Tax-Exempt Bond Fund of America
| Investment securities | ||||||||||||||||
| Level 1 | Level 2 | Level 3 | Total | |||||||||||||
| Assets: | ||||||||||||||||
| Bonds, notes & other debt instruments: | ||||||||||||||||
| Illinois | $ | — | $ | 3,099,697 | $ | — | $ | 3,099,697 | ||||||||
| New York | — | 2,489,831 | — | 2,489,831 | ||||||||||||
| Texas | — | 2,458,075 | — | 2,458,075 | ||||||||||||
| Florida | — | 1,566,586 | 4,990 | 1,571,576 | ||||||||||||
| California | — | 1,463,974 | — | 1,463,974 | ||||||||||||
| Pennsylvania | — | 1,273,295 | — | 1,273,295 | ||||||||||||
| Michigan | — | 1,032,563 | — | 1,032,563 | ||||||||||||
| Ohio | — | 687,572 | — | 687,572 | ||||||||||||
| Georgia | — | 640,819 | — | 640,819 | ||||||||||||
| Washington | — | 593,652 | — | 593,652 | ||||||||||||
| Other | — | 8,093,522 | — | 8,093,522 | ||||||||||||
| Short-term securities | — | 2,089,715 | — | 2,089,715 | ||||||||||||
| Total | $ | — | $ | 25,489,301 | $ | 4,990 | $ | 25,494,291 | ||||||||
| Other investments* | ||||||||||||||||
| Level 1 | Level 2 | Level 3 | Total | |||||||||||||
| Liabilities: | ||||||||||||||||
| Unrealized depreciation on futures contracts | $ | (10,178 | ) | $ | — | $ | — | $ | (10,178 | ) | ||||||
| 96 | American Funds Tax-Exempt Funds |
American High-Income Municipal Bond Fund
| Investment securities | ||||||||||||||||
| Level 1 | Level 2 | Level 3 | Total | |||||||||||||
| Assets: | ||||||||||||||||
| Bonds, notes & other debt instruments: | ||||||||||||||||
| Illinois | $ | — | $ | 1,282,018 | $ | — | $ | 1,282,018 | ||||||||
| Colorado | — | 459,291 | — | 459,291 | ||||||||||||
| Pennsylvania | — | 459,274 | — | 459,274 | ||||||||||||
| Texas | — | 447,777 | — | 447,777 | ||||||||||||
| Puerto Rico | — | 431,168 | — | 431,168 | ||||||||||||
| Florida | — | 416,575 | 5,056 | 421,631 | ||||||||||||
| Ohio | — | 387,826 | — | 387,826 | ||||||||||||
| New York | — | 354,577 | — | 354,577 | ||||||||||||
| California | — | 342,665 | — | 342,665 | ||||||||||||
| New Jersey | — | 334,114 | — | 334,114 | ||||||||||||
| Other | — | 2,741,291 | 3,130 | 2,744,421 | ||||||||||||
| Short-term securities | — | 569,423 | 1,430 | 570,853 | ||||||||||||
| Total | $ | — | $ | 8,225,999 | $ | 9,616 | $ | 8,235,615 | ||||||||
| Other investments* | ||||||||||||||||
| Level 1 | Level 2 | Level 3 | Total | |||||||||||||
| Liabilities: | ||||||||||||||||
| Unrealized depreciation on futures contracts | $ | (2,592 | ) | $ | — | $ | — | $ | (2,592 | ) | ||||||
| * | Futures contracts are not included in the investment portfolio. |
The Tax-Exempt Fund of California
At July 31, 2020, all of the fund’s investment securities were classified as Level 2.
American Funds Tax-Exempt Fund of New York
At July 31, 2020, all of the fund’s investment securities were classified as Level 2.
4. Risk factors
Investing in each fund may involve certain risks including, but not limited to, those described below.
Market conditions — The prices of, and the income generated by, the securities held by the funds may decline — sometimes rapidly or unpredictably — due to various factors, including events or conditions affecting the general economy or particular industries; overall market changes; local, regional or global political, social or economic instability; governmental, governmental agency or central bank responses to economic conditions; and currency exchange rate, interest rate and commodity price fluctuations.
Economies and financial markets throughout the world are highly interconnected. Economic, financial or political events, trading and tariff arrangements, wars, terrorism, cybersecurity events, natural disasters, public health emergencies (such as the spread of infectious disease) and other circumstances in one country or region could have impacts on global economies or markets. As a result, whether or not the fund invests in securities of issuers located in or with significant exposure to the countries affected, the value and liquidity of the funds’ investments may be negatively affected by developments in other countries and regions.
Issuer risks — The prices of, and the income generated by, securities held by the funds may decline in response to various factors directly related to the issuers of such securities, including reduced demand for an issuer’s goods or services, poor management performance, major litigation related to the issuer, changes in government regulations affecting the issuer or its competitive environment and strategic initiatives such as mergers, acquisitions or dispositions and the market response to any such initiatives.
Investing in municipal securities — The yield and/or value of the funds’ investments in municipal securities may be adversely affected by events tied to the municipal securities markets, which can be very volatile and significantly impacted by unfavorable legislative or political developments and negative changes in the financial conditions of municipal securities issuers and the economy. To the extent the funds invest in obligations of a municipal issuer, the volatility, credit quality and performance of the funds may be adversely impacted by local political and economic conditions of the issuer. For example, a credit rating downgrade, bond default or bankruptcy involving an issuer
| American Funds Tax-Exempt Funds | 97 |
within a particular state or territory could affect the market values and marketability of many or all municipal obligations of that state or territory. Income from municipal securities held by the funds could also be declared taxable because of changes in tax laws or interpretations by taxing authorities or as a result of noncompliant conduct of a municipal issuer. Additionally, the relative amount of publicly available information about municipal securities is generally less than that for corporate securities.
Investing in debt instruments — The prices of, and the income generated by, bonds and other debt securities held by the funds may be affected by changing interest rates and by changes in the effective maturities and credit ratings of these securities.
Rising interest rates will generally cause the prices of bonds and other debt securities to fall. A general rise in interest rates may cause investors to sell debt securities on a large scale, which could also adversely affect the price and liquidity of debt securities and could also result in increased redemptions from the funds. Falling interest rates may cause an issuer to redeem, call or refinance a debt security before its stated maturity, which may result in the funds failing to recoup the full amount of its initial investment and having to reinvest the proceeds in lower yielding securities. Longer maturity debt securities generally have greater sensitivity to changes in interest rates and may be subject to greater price fluctuations than shorter maturity debt securities.
Bonds and other debt securities are also subject to credit risk, which is the possibility that the credit strength of an issuer or guarantor will weaken or be perceived to be weaker, and/or an issuer of a debt security will fail to make timely payments of principal or interest and the security will go into default. A downgrade or default affecting any of the fund’s securities could cause the value of the fund’s shares to decrease. Lower quality debt securities generally have higher rates of interest and may be subject to greater price fluctuations than higher quality debt securities. Credit risk is gauged, in part, by the credit ratings of the debt securities in which the funds invest. However, ratings are only the opinions of the rating agencies issuing them and are not guarantees as to credit quality or an evaluation of market risk. The funds’ investment adviser relies on its own credit analysts to research issuers and issues in seeking to assess credit and default risks.
Liquidity risk — Certain fund holdings may be or may become difficult or impossible to sell, particularly during times of market turmoil. Liquidity may be impacted by the lack of an active market for a holding, legal or contractual restrictions on resale, or the reduced number and capacity of market participants to make a market in such holding. Market prices for less liquid or illiquid holdings may be volatile, and reduced liquidity may have an adverse impact on the market price of such holdings. Additionally, the sale of less liquid or illiquid holdings may involve substantial delays (including delays in settlement) and additional costs and the fund may be unable to sell such holdings when necessary to meet its liquidity needs or may be forced to sell at a loss.
Credit and liquidity support — Changes in the credit quality of banks and financial institutions providing credit and liquidity support features with respect to securities held by the funds could cause the values of these securities to decline.
Investing in lower rated debt instruments — Lower rated bonds and other lower rated debt securities generally have higher rates of interest and involve greater risk of default or price declines due to changes in the issuer’s creditworthiness than those of higher quality debt securities. The market prices of these securities may fluctuate more than the prices of higher quality debt securities and may decline significantly in periods of general economic difficulty. These risks may be increased with respect to investments in junk bonds.
Investing in similar municipal bonds — Investing significantly in municipal obligations of multiple issuers in the same state or backed by revenues of similar types of projects or industries may make the funds more susceptible to certain economic, political or regulatory occurrences. As a result, the funds have greater risk of volatility, and greater risk of loss, from the investments.
Risks of investing in municipal bonds of issuers within the state of California — Because The Tax-Exempt Fund of California invests primarily in securities of issuers within the state of California, the fund is more susceptible to factors adversely affecting issuers of California securities than a comparable municipal bond mutual fund that does not concentrate its investments in a single state. For example, in the past, California voters have passed amendments to the state’s constitution and other measures that limit the taxing and spending authority of California governmental entities, and future voter initiatives may adversely affect California municipal bonds.
Risks of investing in municipal bonds of issuers within the state of New York — Because American Funds Tax-Exempt Fund of New York invests primarily in securities of issuers within the state of New York, the fund is more susceptible to factors adversely affecting issuers of New York securities than a comparable municipal bond mutual fund that does not concentrate its investments in a single state. For example, such factors may include political policy changes, tax base erosion, state constitutional limits on tax increases, budget deficits and other financial or economic difficulties, and changes in the credit ratings assigned to New York’s municipal issuers. New York’s economy and finances may be especially vulnerable to changes in the performance of the financial services sector, which historically has been volatile.
| 98 | American Funds Tax-Exempt Funds |
Management — The investment adviser to the funds actively manages the funds’ investments. Consequently, the funds are subject to the risk that the methods and analyses, including models, tools and data, employed by the investment adviser in this process may be flawed or incorrect and may not produce the desired results. This could cause the funds to lose value or their investment results to lag relevant benchmarks or other funds with similar objectives.
5. Certain investment techniques
Unfunded commitments — American High-Income Municipal Bond Fund has participated in transactions that involve unfunded commitments, which may obligate the fund to purchase new or additional bonds if certain contingencies are met. As of July 31, 2020, the maximum exposure of unfunded bond commitments for American High-Income Municipal Bond Fund was $20,355,000, which would represent .25% of the net assets of the fund should such commitments become due.
Futures contracts — Each fund has entered into futures contracts, which provide for the future sale by one party and purchase by another party of a specified amount of a specific financial instrument for a specified price, date, time and place designated at the time the contract is made. Futures contracts are used to strategically manage the fund’s interest rate sensitivity by increasing or decreasing the duration of the fund or a portion of the fund’s portfolio.
Upon entering into futures contracts, and to maintain the fund’s open positions in futures contracts, each fund is required to deposit with a futures broker, known as a futures commission merchant (“FCM”), in a segregated account in the name of the FCM an amount of cash, U.S. government securities or other liquid securities, known as initial margin. The margin required for a particular futures contract is set by the exchange on which the contract is traded to serve as collateral, and may be significantly modified from time to time by the exchange during the term of the contract.
On a daily basis, each fund pays or receives variation margin based on the increase or decrease in the value of the futures contracts and records variation margin on futures contracts in the statement of assets and liabilities. In addition, each fund segregates liquid assets equivalent to each fund’s outstanding obligations under the contract in excess of the initial margin and variation margin, if any. Futures contracts may involve a risk of loss in excess of the variation margin shown on each fund’s statement of assets and liabilities. Each fund records realized gains or losses at the time the futures contract is closed or expires. Net realized gains or losses and net unrealized appreciation or depreciation from futures contracts are recorded in each fund’s statement of operations.
The following table presents the average month-end notional amount of futures contracts while held for each fund (dollars in thousands):
| Futures contracts | ||||
| American Funds Short-Term Tax-Exempt Bond Fund | $ | 148,525 | * | |
| Limited Term Tax-Exempt Bond Fund of America | 431,010 | * | ||
| The Tax-Exempt Bond Fund of America | 1,562,192 | |||
| American High-Income Municipal Bond Fund | 432,683 | |||
| The Tax-Exempt Fund of California | 91,509 | * | ||
| American Funds Tax-Exempt Fund of New York | 2,560 | * | ||
| * | No contracts were held at the end of the reporting period; amount represents the average month-end notional amount of contracts while they were held. |
The following tables identify the location of and fair value amounts on each fund’s statement of assets and liabilities and/or the effect on each fund’s statement of operations resulting from the funds’ use of futures contracts as of, or for the year ended, July 31, 2020 (dollars in thousands):
American Funds Short-Term Tax-Exempt Bond Fund
| Net realized gain | Net unrealized depreciation | |||||||||||||
| Contracts | Risk type | Location on statement of operations | Value | Location on statement of operations | Value | |||||||||
| Futures | Interest | Net realized gain on futures contracts | $ | 4,135 | Net unrealized depreciation on futures contracts | $ | (9 | ) | ||||||
| American Funds Tax-Exempt Funds | 99 |
Limited Term Tax-Exempt Bond Fund of America
| Net realized gain | Net unrealized appreciation | |||||||||||||
| Contracts | Risk type | Location on statement of operations | Value | Location on statement of operations | Value | |||||||||
| Futures | Interest | Net realized gain on futures contracts | $ | 11,248 | Net unrealized appreciation on futures contracts | $ | 1,795 | |||||||
| The Tax-Exempt Bond Fund of America | ||||||||||||||
| Assets | Liabilities | |||||||||||||
| Contracts | Risk type | Location on statement of assets and liabilities | Value | Location on statement of assets and liabilities | Value | |||||||||
| Futures | Interest | Unrealized appreciation* | $ | — | Unrealized depreciation* | $ | 10,178 | |||||||
| Net realized loss | Net unrealized depreciation | |||||||||||||
| Contracts | Risk type | Location on statement of operations | Value | Location on statement of operations | Value | |||||||||
| Futures | Interest | Net realized loss on futures contracts | $ | (54,104 | ) | Net unrealized depreciation on futures contracts | $ | (991 | ) | |||||
| American High-Income Municipal Bond Fund | ||||||||||||||
| Assets | Liabilities | |||||||||||||
| Contracts | Risk type | Location on statement of assets and liabilities | Value | Location on statement of assets and liabilities | Value | |||||||||
| Futures | Interest | Unrealized appreciation* | $ | — | Unrealized depreciation* | $ | 2,592 | |||||||
| Net realized loss | Net unrealized depreciation | |||||||||||||
| Contracts | Risk type | Location on statement of operations | Value | Location on statement of operations | Value | |||||||||
| Futures | Interest | Net realized loss on futures contracts | $ | (10,426 | ) | Net unrealized depreciation on futures contracts | $ | (2,227 | ) | |||||
| The Tax-Exempt Fund of California | ||||||||||||||
| Net realized gain | Net unrealized appreciation | |||||||||||||
| Contracts | Risk type | Location on statement of operations | Value | Location on statement of operations | Value | |||||||||
| Futures | Interest | Net realized gain on futures contracts | $ | 3,981 | Net unrealized appreciation on futures contracts | $ | 1,166 | |||||||
| American Funds Tax-Exempt Fund of New York | ||||||||||||||
| Net realized loss | Net unrealized appreciation | |||||||||||||
| Contracts | Risk type | Location on statement of operations | Value | Location on statement of operations | Value | |||||||||
| Futures | Interest | Net realized loss on futures contracts | $ | (44 | ) | Net unrealized appreciation on futures contracts | $ | 2 | ||||||
| * | Includes cumulative appreciation/depreciation on futures contracts as reported in the applicable table following each fund’s investment portfolio. Only current day’s variation margin is reported within each fund’s statement of assets and liabilities. |
| 100 | American Funds Tax-Exempt Funds |
Collateral — Each fund participates in a collateral program due to its use of futures contracts that calls for each fund to either receive or pledge highly liquid assets, such as cash or U.S. government securities, as collateral for initial and variation margin by contract. The purpose of the collateral is to cover potential losses that could occur in the event that either party cannot meet its contractual obligation. Non-cash collateral pledged by each fund, if any, is disclosed in each fund’s investment portfolio, and cash collateral pledged by each fund, if any, is held in a segregated account with each fund’s custodian, which is reflected as pledged cash collateral in each fund’s statement of assets and liabilities.
6. Taxation and distributions
Federal income taxation — Each fund complies with the requirements under Subchapter M of the Internal Revenue Code applicable to mutual funds and intends to distribute substantially all of its net tax-exempt income and net capital gains each year. Generally, income earned by each fund is exempt from federal income taxes; however, each fund may earn taxable income from certain investments. The funds are not subject to income taxes to the extent such taxable income and net capital gains are distributed. To the extent the funds recognize taxable income, the funds may pay tax on such income in lieu of making distributions; amounts paid are included within federal, state and local taxes on the funds’ statements of operations.
As of and during the period ended July 31, 2020, none of the funds had a liability for any unrecognized tax benefits. Each fund recognizes interest and penalties, if any, related to unrecognized tax benefits as income tax expense in their respective statements of operations. During the period, none of the funds incurred any significant interest or penalties.
Each fund’s tax returns are not subject to examination by federal, state and, if applicable, non-U.S. tax authorities after the expiration of each jurisdiction’s statute of limitations, which is generally three years after the date of filing but can be extended in certain jurisdictions.
Distributions — Distributions paid to shareholders are based on each fund’s net investment income and net realized gains determined on a tax basis, which may differ from net investment income and net realized gains for financial reporting purposes. These differences are due primarily to different treatment for items such as short-term capital gains and losses; capital losses related to sales of certain securities within 30 days of purchase; deferred expenses; cost of investments sold; net capital losses; amortization of premiums and discounts and income on certain investments. The fiscal year in which amounts are distributed may differ from the year in which the net investment income and net realized gains are recorded by the funds for financial reporting purposes. The funds may also designate a portion of the amount paid to redeeming shareholders as a distribution for tax purposes.
Additional tax basis disclosures for each fund as of July 31, 2020, were as follows (dollars in thousands):
| American Funds Short-Term Tax-Exempt Bond Fund | Limited Term Tax-Exempt Bond Fund of America | The Tax-Exempt Bond Fund of America | American High-Income Municipal Bond Fund | The Tax-Exempt Fund of California | American Funds Tax-Exempt Fund of New York | |||||||||||||||||||
| Undistributed ordinary income | $ | 3,418 | $ | 14,816 | $ | — | $ | — | $ | — | $ | — | ||||||||||||
| Undistributed tax-exempt income | 161 | 382 | 3,438 | 2,441 | 720 | 143 | ||||||||||||||||||
| Undistributed long-term capital gains | — | 16,997 | — | — | 7,585 | 102 | ||||||||||||||||||
| Capital loss carryforward* | — | — | (3,464 | ) | (1,025 | ) | — | — | ||||||||||||||||
| Capital loss carryforward utilized | 3,213 | — | 621 | 5,472 | — | 5 | ||||||||||||||||||
| Gross unrealized appreciation on investments | 29,833 | 186,412 | 1,480,480 | 395,786 | 161,795 | 15,174 | ||||||||||||||||||
| Gross unrealized depreciation on investments | (676 | ) | (2,144 | ) | (51,325 | ) | (105,661 | ) | (5,227 | ) | (944 | ) | ||||||||||||
| Net unrealized appreciation on investments | 29,157 | 184,268 | 1,429,155 | 290,125 | 156,568 | 14,230 | ||||||||||||||||||
| Cost of investments | 1,385,121 | 5,431,587 | 24,054,958 | 7,942,898 | 2,781,246 | 276,943 | ||||||||||||||||||
| Reclassification from (to) total distributable earnings to (from) capital paid in on shares of beneficial interest | 274 | 1,870 | 1,085 | (3,517 | ) | (1,509 | ) | 117 | ||||||||||||||||
| * | Capital loss carryforwards will be used to offset any capital gains realized by the funds in future years. The funds will not make distributions from capital gains while a capital loss carryforward remains. |
| American Funds Tax-Exempt Funds | 101 |
The tax character of distributions paid or accrued to shareholders was as follows (dollars in thousands):
American Funds Short-Term Tax-Exempt Bond Fund
| Year ended July 31, 2020 | Year ended July 31, 2019 | |||||||||||||||||||||||||||||||
| Share class | Tax-exempt income | Ordinary income | Long-term capital gains | Total distributions paid or accrued | Tax-exempt income | Ordinary income | Long-term capital gains | Total distributions paid or accrued | ||||||||||||||||||||||||
| Class A | $ | 10,432 | $ | — | $ | — | $ | 10,432 | $ | 11,676 | $ | — | $ | — | $ | 11,676 | ||||||||||||||||
| Class T | — | † | — | — | — | † | — | † | — | — | — | † | ||||||||||||||||||||
| Class F-1 | 76 | — | — | 76 | 90 | — | — | 90 | ||||||||||||||||||||||||
| Class F-2 | 2,767 | — | — | 2,767 | 2,521 | — | — | 2,521 | ||||||||||||||||||||||||
| Class F-3 | 820 | — | — | 820 | 825 | — | — | 825 | ||||||||||||||||||||||||
| Class R-6 | 2,000 | — | — | 2,000 | 2,147 | — | — | 2,147 | ||||||||||||||||||||||||
| Total | $ | 16,095 | $ | — | $ | — | $ | 16,095 | $ | 17,259 | $ | — | $ | — | $ | 17,259 | ||||||||||||||||
| Limited Term Tax-Exempt Bond Fund of America | ||||||||||||||||||||||||||||||||
| Year ended July 31, 2020 | Year ended July 31, 2019 | |||||||||||||||||||||||||||||||
| Share class | Tax-exempt income | Ordinary income | Long-term capital gains | Total distributions paid or accrued | Tax-exempt income | Ordinary income | Long-term capital gains | Total distributions paid or accrued | ||||||||||||||||||||||||
| Class A | $ | 51,681 | $ | 6,786 | $ | 4,004 | $ | 62,471 | $ | 58,861 | $ | — | $ | — | $ | 58,861 | ||||||||||||||||
| Class C | 155 | 36 | 21 | 212 | 241 | — | — | 241 | ||||||||||||||||||||||||
| Class T | — | † | — | † | — | † | — | † | — | † | — | — | — | † | ||||||||||||||||||
| Class F-1 | 1,070 | 135 | 80 | 1,285 | 1,133 | — | — | 1,133 | ||||||||||||||||||||||||
| Class F-2 | 10,761 | 1,194 | 704 | 12,659 | 9,544 | — | — | 9,544 | ||||||||||||||||||||||||
| Class F-3 | 6,719 | 721 | 425 | 7,865 | 5,689 | — | — | 5,689 | ||||||||||||||||||||||||
| Class R-6 | 7,229 | 668 | 394 | 8,291 | 6,729 | — | — | 6,729 | ||||||||||||||||||||||||
| Total | $ | 77,615 | $ | 9,540 | $ | 5,628 | $ | 92,783 | $ | 82,197 | $ | — | $ | — | $ | 82,197 | ||||||||||||||||
| The Tax-Exempt Bond Fund of America | ||||||||||||||||||||||||||||||||
| Year ended July 31, 2020 | Year ended July 31, 2019 | |||||||||||||||||||||||||||||||
| Share class | Tax-exempt income | Ordinary income | Long-term capital gains | Total distributions paid or accrued | Tax-exempt income | Ordinary income | Long-term capital gains | Total distributions paid or accrued | ||||||||||||||||||||||||
| Class A | $ | 285,421 | $ | — | $ | — | $ | 285,421 | $ | 285,802 | $ | — | $ | — | $ | 285,802 | ||||||||||||||||
| Class C | 7,039 | — | — | 7,039 | 8,239 | — | — | 8,239 | ||||||||||||||||||||||||
| Class T | — | † | — | — | — | † | — | † | — | — | — | † | ||||||||||||||||||||
| Class F-1 | 7,958 | — | — | 7,958 | 9,154 | — | — | 9,154 | ||||||||||||||||||||||||
| Class F-2 | 83,501 | — | — | 83,501 | 70,312 | — | — | 70,312 | ||||||||||||||||||||||||
| Class F-3 | 197,407 | — | — | 197,407 | 178,363 | — | — | 178,363 | ||||||||||||||||||||||||
| Class R-6 | 19,076 | — | — | 19,076 | 18,410 | — | — | 18,410 | ||||||||||||||||||||||||
| Total | $ | 600,402 | $ | — | $ | — | $ | 600,402 | $ | 570,280 | $ | — | $ | — | $ | 570,280 | ||||||||||||||||
| 102 | American Funds Tax-Exempt Funds |
American High-Income Municipal Bond Fund
| Year ended July 31, 2020 | Year ended July 31, 2019 | |||||||||||||||||||||||||||||||
| Share class | Tax-exempt income | Ordinary income | Long-term capital gains | Total distributions paid or accrued | Tax-exempt income | Ordinary income | Long-term capital gains | Total distributions paid or accrued | ||||||||||||||||||||||||
| Class A | $ | 161,489 | $ | — | $ | 4,226 | $ | 165,715 | $ | 151,825 | $ | — | $ | — | $ | 151,825 | ||||||||||||||||
| Class C | 6,235 | — | 207 | 6,442 | 6,528 | — | — | 6,528 | ||||||||||||||||||||||||
| Class T | — | † | — | — | † | — | † | — | † | — | — | — | † | |||||||||||||||||||
| Class F-1 | 5,712 | — | 158 | 5,870 | 6,426 | — | — | 6,426 | ||||||||||||||||||||||||
| Class F-2 | 41,771 | — | 1,027 | 42,798 | 36,440 | — | — | 36,440 | ||||||||||||||||||||||||
| Class F-3 | 36,247 | — | 852 | 37,099 | 28,978 | — | — | 28,978 | ||||||||||||||||||||||||
| Class R-6 | 28,067 | — | 661 | 28,728 | 23,498 | — | — | 23,498 | ||||||||||||||||||||||||
| Total | $ | 279,521 | $ | — | $ | 7,131 | $ | 286,652 | $ | 253,695 | $ | — | $ | — | $ | 253,695 | ||||||||||||||||
| The Tax-Exempt Fund of California | ||||||||||||||||||||||||||||||||
| Year ended July 31, 2020 | Year ended July 31, 2019 | |||||||||||||||||||||||||||||||
| Share class | Tax-exempt income | Ordinary income | Long-term capital gains | Total distributions paid or accrued | Tax-exempt income | Ordinary income | Long-term capital gains | Total distributions paid or accrued | ||||||||||||||||||||||||
| Class A | $ | 45,105 | $ | 1,734 | $ | 7,730 | $ | 54,569 | $ | 47,435 | $ | — | $ | — | $ | 47,435 | ||||||||||||||||
| Class C | 1,131 | 63 | 282 | 1,476 | 1,394 | — | — | 1,394 | ||||||||||||||||||||||||
| Class T | — | † | — | † | — | † | — | † | — | † | — | — | — | † | ||||||||||||||||||
| Class F-1 | 1,671 | 68 | 301 | 2,040 | 1,952 | — | — | 1,952 | ||||||||||||||||||||||||
| Class F-2 | 12,097 | 415 | 1,851 | 14,363 | 10,366 | — | — | 10,366 | ||||||||||||||||||||||||
| Class F-3 | 7,654 | 266 | 1,187 | 9,107 | 5,823 | — | — | 5,823 | ||||||||||||||||||||||||
| Total | $ | 67,658 | $ | 2,546 | $ | 11,351 | $ | 81,555 | $ | 66,970 | $ | — | $ | — | $ | 66,970 | ||||||||||||||||
| American Funds Tax-Exempt Fund of New York | ||||||||||||||||||||||||||||||||
| Year ended July 31, 2020 | Year ended July 31, 2019 | |||||||||||||||||||||||||||||||
| Share class | Tax-exempt income | Ordinary income | Long-term capital gains | Total distributions paid or accrued | Tax-exempt income | Ordinary income | Long-term capital gains | Total distributions paid or accrued | ||||||||||||||||||||||||
| Class A | $ | 5,125 | $ | — | $ | — | $ | 5,125 | $ | 4,715 | $ | — | $ | — | $ | 4,715 | ||||||||||||||||
| Class C | 189 | — | — | 189 | 201 | — | — | 201 | ||||||||||||||||||||||||
| Class T | — | † | — | — | — | † | — | † | — | — | — | † | ||||||||||||||||||||
| Class F-1 | 54 | — | — | 54 | 50 | — | — | 50 | ||||||||||||||||||||||||
| Class F-2 | 787 | — | — | 787 | 687 | — | — | 687 | ||||||||||||||||||||||||
| Class F-3 | 863 | — | — | 863 | 813 | — | — | 813 | ||||||||||||||||||||||||
| Total | $ | 7,018 | $ | — | $ | — | $ | 7,018 | $ | 6,466 | $ | — | $ | — | $ | 6,466 | ||||||||||||||||
| † | Amount less than one thousand. |
| American Funds Tax-Exempt Funds | 103 |
7. Fees and transactions with related parties
CRMC, the funds’ investment adviser, is the parent company of American Funds Distributors®, Inc. (“AFD”), the principal underwriter of the funds’ shares, and American Funds Service Company® (“AFS”), the funds’ transfer agent. CRMC, AFD and AFS are considered related parties to each fund.
Investment advisory services — Each fund has an investment advisory and service agreement with CRMC that provides for monthly fees accrued daily. These fees are based on annual rates that generally decrease as net asset levels increase. On March 4, 2020, the boards of trustees of American Funds Short-Term Tax-Exempt Bond Fund, The Tax-Exempt Bond Fund of America, American High-Income Municipal Bond Fund and The Tax-Exempt Fund of California approved amended investment advisory and service agreements effective May 1, 2020, decreasing the annual rate to 0.261% on daily net assets in excess of $1.5 billion for American Funds Short-Term Tax-Exempt Bond Fund, 0.105% on daily net asset in excess of $28 billion for The Tax-Exempt Bond Fund of America, 0.135% on daily net assets in excess of $10 billion for American High-Income Municipal Bond Fund and 0.160% on daily net assets in excess of $3 billion for The Tax-Exempt Fund of California. The amended agreement for each fund, except American Funds Short-Term Tax-Exempt Bond Fund, also provides for monthly fees accrued daily based on a series of decreasing rates on each fund’s monthly gross income.
The range of rates, net asset levels, gross income levels and annualized rates of average net assets for each fund are as follows:
| Rates | Net asset level (in billions) | Rates | Monthly gross income | Annualized rates for the year ended | ||||||||||||||||||||||||||||||||
| Beginning | Ending | In excess | Beginning | Ending | In excess | July 31, | ||||||||||||||||||||||||||||||
| Fund | with | with | Up to | of | with | with | Up to | of | 2020 | |||||||||||||||||||||||||||
| American Funds Short-Term Tax-Exempt Bond Fund | .341 | % | .261 | % | $ | 1.5 | $ | 1.5 | .341 | % | ||||||||||||||||||||||||||
| Limited Term Tax-Exempt Bond Fund of America | .300 | .150 | .06 | 1.0 | 3.00 | % | 2.50 | % | $ | 3,333,333 | $ | 3,333,333 | .217 | |||||||||||||||||||||||
| The Tax-Exempt Bond Fund of America | .300 | .105 | .06 | 28.0 | 3.00 | 2.00 | 3,333,333 | 8,333,333 | .195 | |||||||||||||||||||||||||||
| American High-Income Municipal Bond Fund | .300 | .135 | .06 | 10.0 | 3.00 | 2.50 | 3,333,333 | 3,333,333 | .274 | |||||||||||||||||||||||||||
| The Tax-Exempt Fund of California | .300 | .160 | .06 | 3.0 | 3.00 | 2.50 | 3,333,333 | 3,333,333 | .275 | |||||||||||||||||||||||||||
| American Funds Tax-Exempt Fund of New York | .204 | all | 3.00 | 2.50 | 3,333,333 | 3,333,333 | .296 | |||||||||||||||||||||||||||||
Class-specific fees and expenses — Expenses that are specific to individual share classes are accrued directly to the respective share class of each fund. The principal class-specific fees and expenses are described below:
Distribution services — Each fund has plans of distribution for all share classes, except Class F-2, F-3 and R-6 shares, if applicable. Under the plans, each fund’s board of trustees approves certain categories of expenses that are used to finance activities primarily intended to sell fund shares and service existing accounts. The plans provide for payments based on an annualized percentage of average daily net assets. In some cases, the boards of trustees have limited the amounts that may be paid to less than the maximum allowed by the plans. All share classes with a plan may use the allotted percentage of average daily net assets to pay service fees, or to compensate AFD for paying service fees, to firms that have entered into agreements with AFD to provide certain shareholder services. The remaining amounts available to be paid under each plan are paid to dealers to compensate them for their sales activities.
| American Funds Short-Term Tax-Exempt Bond Fund | Limited Term Tax-Exempt Bond Fund of America | The Tax-Exempt Bond Fund of America | ||||||||||||||||||||
| Share class | Currently approved limits | Plan limits | Currently approved limits | Plan limits | Currently approved limits | Plan limits | ||||||||||||||||
| Class A | 0.15% | 0.15 | % | 0.30 | % | 0.30 | % | 0.25 | % | 0.25 | % | |||||||||||
| Class C | Not applicable | Not applicable | 1.00 | 1.00 | 1.00 | 1.00 | ||||||||||||||||
| Classes T and F-1 | 0.25 | 0.50 | 0.25 | 0.50 | 0.25 | 0.50 | ||||||||||||||||
| 104 | American Funds Tax-Exempt Funds |
| American High-Income Municipal Bond Fund | The Tax-Exempt Fund of California | American Funds Tax-Exempt Fund of New York | ||||||||||||||||||||||
| Share class | Currently approved limits | Plan limits | Currently approved limits | Plan limits | Currently approved limits | Plan limits | ||||||||||||||||||
| Class A | 0.30 | % | 0.30 | % | 0.25 | % | 0.25 | % | 0.25 | % | 0.30 | % | ||||||||||||
| Class C | 1.00 | 1.00 | 1.00 | 1.00 | 1.00 | 1.00 | ||||||||||||||||||
| Classes T and F-1 | 0.25 | 0.50 | 0.25 | 0.50 | 0.25 | 0.50 | ||||||||||||||||||
For Class A shares, distribution-related expenses include the reimbursement of dealer and wholesaler commissions paid by AFD for certain shares sold without a sales charge. This share class of each fund reimburses AFD for amounts billed within the prior 15 months but only to the extent that the overall annual expense limit is not exceeded. As of July 31, 2020, unreimbursed expenses subject to reimbursement for Class A shares of each fund were as follows (dollars in thousands):
| Fund | Class A | |||
| American Funds Short-Term Tax-Exempt Bond Fund | $ | 1,444 | ||
| Limited-Term Tax-Exempt Bond Fund of America | 1,241 | |||
| The Tax-Exempt Bond Fund of America | 12,693 | |||
| American High-Income Municipal Bond Fund | 653 | |||
| The Tax-Exempt Fund of California | 2,069 | |||
| American Funds Tax-Exempt Fund of New York | 129 | |||
Transfer agent services — Each fund has a shareholder services agreement with AFS under which each fund compensates AFS for providing transfer agent services to each of the funds’ share classes. These services include recordkeeping, shareholder communications and transaction processing. In addition, each fund reimburses AFS for amounts paid to third parties for performing transfer agent services on behalf of its respective fund shareholders.
Administrative services — Each fund has an administrative services agreement with CRMC under which each fund compensates CRMC for providing administrative services to each of the funds’ share classes. Administrative services are provided by CRMC and its affiliates to help assist third parties providing non-distribution services to fund shareholders. These services include providing in depth information on each fund and market developments that impact each fund’s investments. Administrative services also include, but are not limited to, coordinating, monitoring and overseeing third parties that provide services to each fund’s shareholders. The agreement provides each fund the ability to charge an administrative services fee at the annual rate of 0.05% of the daily net assets attributable to each share class of each fund. Currently the funds pay an administrative services fee at the annual rate of 0.03% of the daily net assets attributable to each share class of each fund for CRMC’s provision of administrative services.
For the year ended July 31, 2020, class-specific expenses under the agreements for each fund were as follows (dollars in thousands):
American Funds Short-Term Tax-Exempt Bond Fund
| Share class | Distribution services | Transfer agent services | Administrative services | |||||||||
| Class A | $1,241 | $308 | $248 | |||||||||
| Class T | — | — | * | — | * | |||||||
| Class F-1 | 17 | 9 | 2 | |||||||||
| Class F-2 | Not applicable | 125 | 60 | |||||||||
| Class F-3 | Not applicable | 2 | 17 | |||||||||
| Class R-6 | Not applicable | — | * | 42 | ||||||||
| Total class-specific expenses | $1,258 | $444 | $369 | |||||||||
See end of tables for footnote.
Limited Term Tax-Exempt Bond Fund of America
| Share class | Distribution services | Transfer agent services | Administrative services | |||||||||
| Class A | $9,707 | $1,199 | $971 | |||||||||
| Class C | 172 | 7 | 5 | |||||||||
| Class T | — | — | * | — | * | |||||||
| Class F-1 | 172 | 77 | 20 | |||||||||
| Class F-2 | Not applicable | 576 | 177 | |||||||||
| Class F-3 | Not applicable | 7 | 105 | |||||||||
| Class R-6 | Not applicable | — | 114 | |||||||||
| Total class-specific expenses | $10,051 | $1,866 | $1,392 | |||||||||
| American Funds Tax-Exempt Funds | 105 |
The Tax-Exempt Bond Fund of America
| Share class | Distribution services | Transfer agent services | Administrative services | |||||||||
| Class A | $29,148 | $3,859 | $3,498 | |||||||||
| Class C | 4,048 | 138 | 123 | |||||||||
| Class T | — | — | * | — | * | |||||||
| Class F-1 | 829 | 397 | 101 | |||||||||
| Class F-2 | Not applicable | 3,387 | 956 | |||||||||
| Class F-3 | Not applicable | 151 | 2,170 | |||||||||
| Class R-6 | Not applicable | — | 208 | |||||||||
| Total class-specific expenses | $34,025 | $7,932 | $7,056 | |||||||||
American High-Income Municipal Bond Fund
| Share class | Distribution services | Transfer agent services | Administrative services | |||||||||
| Class A | $14,394 | $2,219 | $1,439 | |||||||||
| Class C | 2,338 | 109 | 70 | |||||||||
| Class T | — | — | * | — | * | |||||||
| Class F-1 | 427 | 209 | 52 | |||||||||
| Class F-2 | Not applicable | 1,263 | 348 | |||||||||
| Class F-3 | Not applicable | 31 | 293 | |||||||||
| Class R-6 | Not applicable | — | 226 | |||||||||
| Total class-specific expenses | $17,159 | $3,831 | $2,428 | |||||||||
The Tax-Exempt Fund of California
| Share class | Distribution services | Transfer agent services | Administrative services | |||||||||
| Class A | $4,685 | $378 | $562 | |||||||||
| Class C | 682 | 14 | 21 | |||||||||
| Class T | — | — | * | — | * | |||||||
| Class F-1 | 180 | 81 | 22 | |||||||||
| Class F-2 | Not applicable | 421 | 140 | |||||||||
| Class F-3 | Not applicable | 1 | 86 | |||||||||
| Total class-specific expenses | $5,547 | $895 | $831 | |||||||||
American Funds Tax-Exempt Fund of New York
| Share class | Distribution services | Transfer agent services | Administrative services | |||||||||
| Class A | $532 | $59 | $64 | |||||||||
| Class C | 114 | 3 | 3 | |||||||||
| Class T | — | — | * | — | * | |||||||
| Class F-1 | 4 | 2 | 1 | |||||||||
| Class F-2 | Not applicable | 32 | 9 | |||||||||
| Class F-3 | Not applicable | — | * | 10 | ||||||||
| Total class-specific expenses | $650 | $96 | $87 | |||||||||
| * | Amount less than one thousand. |
Miscellaneous fee reimbursements — CRMC has agreed to reimburse a portion of miscellaneous fees and expenses of American Funds Short-Term Tax-Exempt Bond Fund and American Funds Tax-Exempt Fund of New York. Miscellaneous expenses exclude investment advisory services and distribution services fees. For the year ended July 31, 2020, total fees and expenses reimbursed by CRMC were $23,000 and $121,000 for American Funds Short-Term Tax-Exempt Bond Fund and American Funds Tax-Exempt Fund of New York, respectively, which CRMC does not intend to recoup. These reimbursements may be adjusted or discontinued by CRMC, subject to any restrictions in the series’ prospectus. Fees and expenses in each fund’s statement of operations are presented gross of any reimbursements from CRMC.
Trustees’ deferred compensation — Trustees who are unaffiliated with CRMC may elect to defer the cash payment of part or all of their compensation. These deferred amounts, which remain as liabilities of each fund, are treated as if invested in shares of the funds or other American Funds. These amounts represent general, unsecured liabilities of each fund and vary according to the total returns of the selected funds. Trustees’ compensation in the funds’ statements of operations reflects the current fees (either paid in cash or deferred) and a net increase in the value of the following deferred amounts (dollars in thousands):
| Fund | Current fees | Increase in value of deferred amounts | Total trustees’ compensation | |||||||||
| American Funds Short-Term Tax-Exempt Bond Fund | $ | 6 | $ | 1 | $ | 7 | ||||||
| Limited Term Tax-Exempt Bond Fund of America | 23 | 6 | 29 | |||||||||
| The Tax-Exempt Bond Fund of America | 116 | 32 | 148 | |||||||||
| American High-Income Municipal Bond Fund | 41 | 7 | 48 | |||||||||
| The Tax-Exempt Fund of California | 14 | 5 | 19 | |||||||||
| American Funds Tax-Exempt Fund of New York | 1 | — | * | 1 | ||||||||
| * | Amount less than one thousand. |
Affiliated officers and trustees — Officers and certain trustees of the funds are or may be considered to be affiliated with CRMC, AFD and AFS. No affiliated officers or trustees received any compensation directly from the funds.
| 106 | American Funds Tax-Exempt Funds |
Security transactions with related funds — Each fund may purchase securities from, or sell securities to, other CRMC-managed funds (or funds managed by certain affiliates of CRMC) under procedures adopted by each fund’s board of trustees. The funds involved in such transactions are considered related by virtue of having a common investment adviser (or affiliated investment advisers), common trustees and/or common officers. When such transactions occur, each transaction is executed at the current market price of the security and no brokerage commissions or fees are paid in accordance with Rule 17a-7 of the 1940 Act.
The following table presents purchase and sale transactions between each fund and related funds as of July 31, 2020 (dollars in thousands):
| Fund | Purchases | Sales | Net realized gain | |||||||||
| American Funds Short-Term Tax-Exempt Bond Fund | $ | 6,262 | $ | 11,042 | $ | 133 | ||||||
| Limited Term Tax-Exempt Bond Fund of America | 25,059 | 38,540 | 661 | |||||||||
| The Tax-Exempt Bond Fund of America | 146,700 | 107,342 | 9,682 | |||||||||
| American High-Income Municipal Bond Fund | 8,689 | 114,948 | 5,281 | |||||||||
| The Tax-Exempt Fund of California | 26,681 | 13,863 | 164 | |||||||||
Interfund lending — Pursuant to an exemptive order issued by the SEC, the funds, along with other CRMC-managed funds (or funds managed by certain affiliates of CRMC), may participate in an interfund lending program. The program provides an alternate credit facility that permits the funds to lend or borrow cash for temporary purposes directly to or from one another, subject to the conditions of the exemptive order. None of the funds lent or borrowed cash during the year ended July 31, 2020.
8. Committed line of credit
American High-Income Municipal Bond Fund participates with other funds managed by CRMC (or funds managed by certain affiliates of CRMC) in a $1.5 billion credit facility (the “line of credit”) to be utilized for temporary purposes to support shareholder redemptions. The fund has agreed to pay commitment fees on its pro-rata portion of the line of credit, which are reflected in other expenses in the fund’s statement of operations. The fund did not borrow on this line of credit at any time during the year ended July 31, 2020.
| American Funds Tax-Exempt Funds | 107 |
9. Capital share transactions
Capital share transactions in the funds were as follows (dollars and shares in thousands):
American Funds Short-Term Tax-Exempt Bond Fund
| Sales* | Reinvestments of distributions | Repurchases* | Net increase (decrease) | |||||||||||||||||||||||||||||
| Share class | Amount | Shares | Amount | Shares | Amount | Shares | Amount | Shares | ||||||||||||||||||||||||
| Year ended July 31, 2020 | ||||||||||||||||||||||||||||||||
| Class A | $ | 373,979 | 36,640 | $ | 10,226 | 1,000 | $ | (228,884 | ) | (22,440 | ) | $ | 155,321 | 15,200 | ||||||||||||||||||
| Class T | — | — | — | — | — | — | — | — | ||||||||||||||||||||||||
| Class F-1 | 4,080 | 401 | 75 | 7 | (2,707 | ) | (265 | ) | 1,448 | 143 | ||||||||||||||||||||||
| Class F-2 | 116,260 | 11,402 | 2,615 | 256 | (86,597 | ) | (8,506 | ) | 32,278 | 3,152 | ||||||||||||||||||||||
| Class F-3 | 52,549 | 5,138 | 805 | 79 | (32,828 | ) | (3,208 | ) | 20,526 | 2,009 | ||||||||||||||||||||||
| Class R-6 | 39,953 | 3,893 | 2,000 | 196 | (13,526 | ) | (1,333 | ) | 28,427 | 2,756 | ||||||||||||||||||||||
| Total net increase (decrease) | $ | 586,821 | 57,474 | $ | 15,721 | 1,538 | $ | (364,542 | ) | (35,752 | ) | $ | 238,000 | 23,260 | ||||||||||||||||||
| Year ended July 31, 2019 | ||||||||||||||||||||||||||||||||
| Class A | $ | 446,679 | 44,559 | $ | 11,322 | 1,124 | $ | (454,662 | ) | (45,326 | ) | $ | 3,339 | 357 | ||||||||||||||||||
| Class T | — | — | — | — | — | — | — | — | ||||||||||||||||||||||||
| Class F-1 | 1,942 | 194 | 89 | 9 | (2,196 | ) | (219 | ) | (165 | ) | (16 | ) | ||||||||||||||||||||
| Class F-2 | 183,142 | 18,317 | 2,421 | 240 | (59,423 | ) | (5,910 | ) | 126,140 | 12,647 | ||||||||||||||||||||||
| Class F-3 | 48,796 | 4,855 | 787 | 78 | (42,824 | ) | (4,276 | ) | 6,759 | 657 | ||||||||||||||||||||||
| Class R-6 | 23,958 | 2,386 | 2,147 | 214 | (18,235 | ) | (1,816 | ) | 7,870 | 784 | ||||||||||||||||||||||
| Total net increase (decrease) | $ | 704,517 | 70,311 | $ | 16,766 | 1,665 | $ | (577,340 | ) | (57,547 | ) | $ | 143,943 | 14,429 | ||||||||||||||||||
Limited Term Tax-Exempt Bond Fund of America
| Sales* | Reinvestments of distributions | Repurchases* | Net increase (decrease) | |||||||||||||||||||||||||||||
| Share class | Amount | Shares | Amount | Shares | Amount | Shares | Amount | Shares | ||||||||||||||||||||||||
| Year ended July 31, 2020 | ||||||||||||||||||||||||||||||||
| Class A | $ | 922,993 | 57,964 | $ | 60,685 | 3,807 | $ | (568,450 | ) | (35,807 | ) | $ | 415,228 | 25,964 | ||||||||||||||||||
| Class C | 6,327 | 399 | 211 | 13 | (8,321 | ) | (521 | ) | (1,783 | ) | (109 | ) | ||||||||||||||||||||
| Class T | — | — | — | — | — | — | — | — | ||||||||||||||||||||||||
| Class F-1 | 56,211 | 3,517 | 1,237 | 78 | (22,421 | ) | (1,411 | ) | 35,027 | 2,184 | ||||||||||||||||||||||
| Class F-2 | 451,876 | 28,341 | 11,497 | 721 | (199,074 | ) | (12,585 | ) | 264,299 | 16,477 | ||||||||||||||||||||||
| Class F-3 | 202,780 | 12,748 | 7,712 | 484 | (103,320 | ) | (6,523 | ) | 107,172 | 6,709 | ||||||||||||||||||||||
| Class R-6 | 396,036 | 24,844 | 8,293 | 519 | (31,725 | ) | (2,004 | ) | 372,604 | 23,359 | ||||||||||||||||||||||
| Total net increase (decrease) | $ | 2,036,223 | 127,813 | $ | 89,635 | 5,622 | $ | (933,311 | ) | (58,851 | ) | $ | 1,192,547 | 74,584 | ||||||||||||||||||
| Year ended July 31, 2019 | ||||||||||||||||||||||||||||||||
| Class A | $ | 817,031 | 52,517 | $ | 56,604 | 3,625 | $ | (947,434 | ) | (61,011 | ) | $ | (73,799 | ) | (4,869 | ) | ||||||||||||||||
| Class C | 5,804 | 374 | 237 | 15 | (9,333 | ) | (599 | ) | (3,292 | ) | (210 | ) | ||||||||||||||||||||
| Class T | — | — | — | — | — | — | — | — | ||||||||||||||||||||||||
| Class F-1 | 12,716 | 814 | 1,084 | 69 | (18,544 | ) | (1,193 | ) | (4,744 | ) | (310 | ) | ||||||||||||||||||||
| Class F-2 | 337,537 | 21,741 | 8,588 | 550 | (211,713 | ) | (13,615 | ) | 134,412 | 8,676 | ||||||||||||||||||||||
| Class F-3 | 224,267 | 14,414 | 4,980 | 318 | (116,914 | ) | (7,517 | ) | 112,333 | 7,215 | ||||||||||||||||||||||
| Class R-6 | 52,433 | 3,374 | 6,729 | 431 | (44,130 | ) | (2,837 | ) | 15,032 | 968 | ||||||||||||||||||||||
| Total net increase (decrease) | $ | 1,449,788 | 93,234 | $ | 78,222 | 5,008 | $ | (1,348,068 | ) | (86,772 | ) | $ | 179,942 | 11,470 | ||||||||||||||||||
| 108 | American Funds Tax-Exempt Funds |
The Tax-Exempt Bond Fund of America
| Sales* | Reinvestments of distributions | Repurchases* | Net increase (decrease) | |||||||||||||||||||||||||||||
| Share class | Amount | Shares | Amount | Shares | Amount | Shares | Amount | Shares | ||||||||||||||||||||||||
| Year ended July 31, 2020 | ||||||||||||||||||||||||||||||||
| Class A | $ | 2,817,721 | 211,572 | $ | 271,853 | 20,392 | $ | (1,548,830 | ) | (117,338 | ) | $ | 1,540,744 | 114,626 | ||||||||||||||||||
| Class C | 111,932 | 8,405 | 6,792 | 510 | (156,387 | ) | (11,749 | ) | (37,663 | ) | (2,834 | ) | ||||||||||||||||||||
| Class T | — | — | — | — | — | — | — | — | ||||||||||||||||||||||||
| Class F-1 | 88,172 | 6,632 | 7,560 | 567 | (125,359 | ) | (9,496 | ) | (29,627 | ) | (2,297 | ) | ||||||||||||||||||||
| Class F-2 | 1,761,475 | 133,004 | 79,161 | 5,938 | (872,987 | ) | (66,239 | ) | 967,649 | 72,703 | ||||||||||||||||||||||
| Class F-3 | 2,467,620 | 185,647 | 194,954 | 14,623 | (1,414,411 | ) | (107,484 | ) | 1,248,163 | 92,786 | ||||||||||||||||||||||
| Class R-6 | 126,083 | 9,436 | 19,074 | 1,430 | (360,298 | ) | (27,543 | ) | (215,141 | ) | (16,677 | ) | ||||||||||||||||||||
| Total net increase (decrease) | $ | 7,373,003 | 554,696 | $ | 579,394 | 43,460 | $ | (4,478,272 | ) | (339,849 | ) | $ | 3,474,125 | 258,307 | ||||||||||||||||||
| Year ended July 31, 2019 | ||||||||||||||||||||||||||||||||
| Class A | $ | 1,913,815 | 148,284 | $ | 270,339 | 20,936 | $ | (1,793,783 | ) | (140,013 | ) | $ | 390,371 | 29,207 | ||||||||||||||||||
| Class C | 69,698 | 5,391 | 7,921 | 614 | (116,360 | ) | (9,053 | ) | (38,741 | ) | (3,048 | ) | ||||||||||||||||||||
| Class T | — | — | — | — | — | — | — | — | ||||||||||||||||||||||||
| Class F-1 | 66,051 | 5,127 | 8,750 | 678 | (118,439 | ) | (9,234 | ) | (43,638 | ) | (3,429 | ) | ||||||||||||||||||||
| Class F-2 | 1,319,680 | 102,510 | 66,204 | 5,123 | (877,784 | ) | (68,563 | ) | 508,100 | 39,070 | ||||||||||||||||||||||
| Class F-3 | 2,078,370 | 161,360 | 175,472 | 13,579 | (1,306,234 | ) | (101,826 | ) | 947,608 | 73,113 | ||||||||||||||||||||||
| Class R-6 | 108,442 | 8,367 | 18,410 | 1,425 | (14,886 | ) | (1,168 | ) | 111,966 | 8,624 | ||||||||||||||||||||||
| Total net increase (decrease) | $ | 5,556,056 | 431,039 | $ | 547,096 | 42,355 | $ | (4,227,486 | ) | (329,857 | ) | $ | 1,875,666 | 143,537 | ||||||||||||||||||
American High-Income Municipal Bond Fund
| Sales* | Reinvestments of distributions | Repurchases* | Net increase (decrease) | |||||||||||||||||||||||||||||
| Share class | Amount | Shares | Amount | Shares | Amount | Shares | Amount | Shares | ||||||||||||||||||||||||
| Year ended July 31, 2020 | ||||||||||||||||||||||||||||||||
| Class A | $ | 1,035,359 | 63,794 | $ | 158,347 | 9,809 | $ | (898,727 | ) | (56,751 | ) | $ | 294,979 | 16,852 | ||||||||||||||||||
| Class C | 54,928 | 3,369 | 6,131 | 380 | (92,269 | ) | (5,763 | ) | (31,210 | ) | (2,014 | ) | ||||||||||||||||||||
| Class T | — | — | — | — | — | — | — | — | ||||||||||||||||||||||||
| Class F-1 | 46,431 | 2,885 | 5,688 | 352 | (82,518 | ) | (5,225 | ) | (30,399 | ) | (1,988 | ) | ||||||||||||||||||||
| Class F-2 | 567,327 | 35,284 | 38,415 | 2,379 | (514,100 | ) | (32,628 | ) | 91,642 | 5,035 | ||||||||||||||||||||||
| Class F-3 | 427,367 | 26,650 | 36,287 | 2,248 | (264,769 | ) | (16,777 | ) | 198,885 | 12,121 | ||||||||||||||||||||||
| Class R-6 | 120,984 | 7,352 | 28,726 | 1,781 | (32,893 | ) | (2,120 | ) | 116,817 | 7,013 | ||||||||||||||||||||||
| Total net increase (decrease) | $ | 2,252,396 | 139,334 | $ | 273,594 | 16,949 | $ | (1,885,276 | ) | (119,264 | ) | $ | 640,714 | 37,019 | ||||||||||||||||||
| Year ended July 31, 2019 | ||||||||||||||||||||||||||||||||
| Class A | $ | 966,900 | 61,009 | $ | 144,057 | 9,079 | $ | (684,496 | ) | (43,449 | ) | $ | 426,461 | 26,639 | ||||||||||||||||||
| Class C | 50,981 | 3,214 | 6,195 | 390 | (53,367 | ) | (3,374 | ) | 3,809 | 230 | ||||||||||||||||||||||
| Class T | — | — | — | — | — | — | — | — | ||||||||||||||||||||||||
| Class F-1 | 48,091 | 3,037 | 6,254 | 395 | (87,411 | ) | (5,545 | ) | (33,066 | ) | (2,113 | ) | ||||||||||||||||||||
| Class F-2 | 563,308 | 35,694 | 32,471 | 2,046 | (317,468 | ) | (20,134 | ) | 278,311 | 17,606 | ||||||||||||||||||||||
| Class F-3 | 331,973 | 20,911 | 25,362 | 1,597 | (134,406 | ) | (8,510 | ) | 222,929 | 13,998 | ||||||||||||||||||||||
| Class R-6 | 102,098 | 6,412 | 23,498 | 1,480 | (11,942 | ) | (764 | ) | 113,654 | 7,128 | ||||||||||||||||||||||
| Total net increase (decrease) | $ | 2,063,351 | 130,277 | $ | 237,837 | 14,987 | $ | (1,289,090 | ) | (81,776 | ) | $ | 1,012,098 | 63,488 | ||||||||||||||||||
See end of tables for footnote.
| American Funds Tax-Exempt Funds | 109 |
The Tax-Exempt Fund of California
| Sales* | Reinvestments of distributions | Repurchases* | Net increase (decrease) | |||||||||||||||||||||||||||||
| Share class | Amount | Shares | Amount | Shares | Amount | Shares | Amount | Shares | ||||||||||||||||||||||||
| Year ended July 31, 2020 | ||||||||||||||||||||||||||||||||
| Class A | $ | 340,364 | 18,822 | $ | 50,595 | 2,800 | $ | (253,642 | ) | (14,179 | ) | $ | 137,317 | 7,443 | ||||||||||||||||||
| Class C | 17,175 | 948 | 1,431 | 79 | (28,233 | ) | (1,567 | ) | (9,627 | ) | (540 | ) | ||||||||||||||||||||
| Class T | — | — | — | — | — | — | — | — | ||||||||||||||||||||||||
| Class F-1 | 16,516 | 919 | 1,900 | 105 | (19,228 | ) | (1,075 | ) | (812 | ) | (51 | ) | ||||||||||||||||||||
| Class F-2 | 242,937 | 13,502 | 12,688 | 703 | (126,109 | ) | (7,059 | ) | 129,516 | 7,146 | ||||||||||||||||||||||
| Class F-3 | 115,794 | 6,435 | 9,083 | 502 | (48,574 | ) | (2,741 | ) | 76,303 | 4,196 | ||||||||||||||||||||||
| Total net increase (decrease) | $ | 732,786 | 40,626 | $ | 75,697 | 4,189 | $ | (475,786 | ) | (26,621 | ) | $ | 332,697 | 18,194 | ||||||||||||||||||
| Year ended July 31, 2019 | ||||||||||||||||||||||||||||||||
| Class A | $ | 354,297 | 20,195 | $ | 43,242 | 2,463 | $ | (351,468 | ) | (20,231 | ) | $ | 46,071 | 2,427 | ||||||||||||||||||
| Class C | 11,571 | 657 | 1,339 | 76 | (17,470 | ) | (1,000 | ) | (4,560 | ) | (267 | ) | ||||||||||||||||||||
| Class T | — | — | — | — | — | — | — | — | ||||||||||||||||||||||||
| Class F-1 | 10,762 | 614 | 1,815 | 104 | (18,340 | ) | (1,050 | ) | (5,763 | ) | (332 | ) | ||||||||||||||||||||
| Class F-2 | 241,537 | 13,875 | 9,002 | 512 | (111,887 | ) | (6,404 | ) | 138,652 | 7,983 | ||||||||||||||||||||||
| Class F-3 | 105,180 | 5,967 | 5,174 | 294 | (50,829 | ) | (2,924 | ) | 59,525 | 3,337 | ||||||||||||||||||||||
| Total net increase (decrease) | $ | 723,347 | 41,308 | $ | 60,572 | 3,449 | $ | (549,994 | ) | (31,609 | ) | $ | 233,925 | 13,148 | ||||||||||||||||||
American Funds Tax-Exempt Fund of New York
| Sales* | Reinvestments of distributions | Repurchases* | Net increase (decrease) | |||||||||||||||||||||||||||||
| Share class | Amount | Shares | Amount | Shares | Amount | Shares | Amount | Shares | ||||||||||||||||||||||||
| Year ended July 31, 2020 | ||||||||||||||||||||||||||||||||
| Class A | $ | 42,411 | 3,853 | $ | 4,143 | 377 | $ | (28,234 | ) | (2,593 | ) | $ | 18,320 | 1,637 | ||||||||||||||||||
| Class C | 2,562 | 232 | 173 | 16 | (4,294 | ) | (391 | ) | (1,559 | ) | (143 | ) | ||||||||||||||||||||
| Class T | — | — | — | — | — | — | — | — | ||||||||||||||||||||||||
| Class F-1 | 2,867 | 258 | 42 | 4 | (2,544 | ) | (229 | ) | 365 | 33 | ||||||||||||||||||||||
| Class F-2 | 11,748 | 1,072 | 761 | 69 | (13,850 | ) | (1,282 | ) | (1,341 | ) | (141 | ) | ||||||||||||||||||||
| Class F-3 | 8,370 | 762 | 863 | 78 | (8,996 | ) | (828 | ) | 237 | 12 | ||||||||||||||||||||||
| Total net increase (decrease) | $ | 67,958 | 6,177 | $ | 5,982 | 544 | $ | (57,918 | ) | (5,323 | ) | $ | 16,022 | 1,398 | ||||||||||||||||||
| Year ended July 31, 2019 | ||||||||||||||||||||||||||||||||
| Class A | $ | 43,401 | 4,058 | $ | 3,742 | 349 | $ | (36,741 | ) | (3,477 | ) | $ | 10,402 | 930 | ||||||||||||||||||
| Class C | 1,713 | 160 | 190 | 18 | (2,452 | ) | (231 | ) | (549 | ) | (53 | ) | ||||||||||||||||||||
| Class T | — | — | — | — | — | — | — | — | ||||||||||||||||||||||||
| Class F-1 | 409 | 38 | 38 | 4 | (561 | ) | (53 | ) | (114 | ) | (11 | ) | ||||||||||||||||||||
| Class F-2 | 21,136 | 2,004 | 685 | 64 | (10,147 | ) | (952 | ) | 11,674 | 1,116 | ||||||||||||||||||||||
| Class F-3 | 16,808 | 1,584 | 570 | 53 | (12,152 | ) | (1,148 | ) | 5,226 | 489 | ||||||||||||||||||||||
| Total net increase (decrease) | $ | 83,467 | 7,844 | $ | 5,225 | 488 | $ | (62,053 | ) | (5,861 | ) | $ | 26,639 | 2,471 | ||||||||||||||||||
| * | Includes exchanges between share classes of the fund. |
| 110 | American Funds Tax-Exempt Funds |
10. Investment transactions
Each fund made purchases and sales of investment securities, excluding short-term securities and U.S. government obligations, if any, during the year ended July 31, 2020, as follows (dollars in thousands):
| Fund | Purchases | Sales | ||||||
| American Funds Short-Term Tax-Exempt Bond Fund | $ | 902,816 | $ | 726,216 | ||||
| Limited Term Tax-Exempt Bond Fund of America | 3,108,914 | 2,365,830 | ||||||
| The Tax-Exempt Bond Fund of America | 8,051,763 | 5,506,022 | ||||||
| American High-Income Municipal Bond Fund | 3,230,131 | 2,638,816 | ||||||
| The Tax-Exempt Fund of California | 999,263 | 695,530 | ||||||
| American Funds Tax-Exempt Fund of New York | 99,828 | 75,235 | ||||||
11. Ownership concentration
At July 31, 2020, CRMC held aggregate ownership of 11% of the outstanding shares of American Funds Tax-Exempt Fund of New York. The ownership represents the seed money invested in the fund when it began operations on November 1, 2010. In addition, American Funds Tax-Exempt Preservation Portfolio held 12% of the outstanding shares of American Funds Short-Term Tax-Exempt Bond Fund. CRMC is the investment adviser to both of the funds.
| American Funds Tax-Exempt Funds | 111 |
Financial highlights
American Funds Short-Term Tax-Exempt Bond Fund
| Income from investment operations1 | ||||||||||||||||||||||||||||||||||||||||||||
| Period ended | Net asset value, beginning of period | Net investment income | Net gains (losses) on securities (both realized and unrealized) | Total from investment operations | Dividends (from net investment income) | Net asset value, end of period | Total return2,3 | Net assets, end of period (in millions) | Ratio of expenses to average net assets before reimbursements | Ratio of expenses to average net assets after reimbursements3 | Ratio of net income to average net assets3 | |||||||||||||||||||||||||||||||||
| Class A: | ||||||||||||||||||||||||||||||||||||||||||||
| 7/31/2020 | $ | 10.19 | $ | .13 | $ | .18 | $ | .31 | $ | (.13 | ) | $ | 10.37 | 3.07 | % | $ | 938 | .58 | % | .58 | % | 1.27 | % | |||||||||||||||||||||
| 7/31/2019 | 10.04 | .16 | .15 | .31 | (.16 | ) | 10.19 | 3.09 | 767 | .59 | .59 | 1.56 | ||||||||||||||||||||||||||||||||
| 7/31/2018 | 10.15 | .13 | (.11 | ) | .02 | (.13 | ) | 10.04 | .24 | 752 | .58 | .58 | 1.33 | |||||||||||||||||||||||||||||||
| 7/31/2017 | 10.22 | .12 | (.07 | ) | .05 | (.12 | ) | 10.15 | .46 | 739 | .59 | .59 | 1.15 | |||||||||||||||||||||||||||||||
| 7/31/2016 | 10.17 | .10 | .05 | .15 | (.10 | ) | 10.22 | 1.51 | 688 | .59 | .59 | 1.02 | ||||||||||||||||||||||||||||||||
| Class T: | ||||||||||||||||||||||||||||||||||||||||||||
| 7/31/2020 | 10.19 | .15 | .18 | .33 | (.15 | ) | 10.37 | 3.22 | 4 | — | 5 | .43 | 4 | .42 | 4 | 1.43 | 4 | |||||||||||||||||||||||||||
| 7/31/2019 | 10.04 | .17 | .15 | .32 | (.17 | ) | 10.19 | 3.20 | 4 | — | 5 | .47 | 4 | .47 | 4 | 1.67 | 4 | |||||||||||||||||||||||||||
| 7/31/2018 | 10.15 | .15 | (.11 | ) | .04 | (.15 | ) | 10.04 | .36 | 4 | — | 5 | .47 | 4 | .47 | 4 | 1.44 | 4 | ||||||||||||||||||||||||||
| 7/31/20176,7 | 10.11 | .04 | .04 | .08 | (.04 | ) | 10.15 | .82 | 4,8 | — | 5 | .15 | 4,8 | .15 | 4,8 | .42 | 4,8 | |||||||||||||||||||||||||||
| Class F-1: | ||||||||||||||||||||||||||||||||||||||||||||
| 7/31/2020 | 10.19 | .11 | .18 | .29 | (.11 | ) | 10.37 | 2.87 | 9 | .77 | .76 | 1.08 | ||||||||||||||||||||||||||||||||
| 7/31/2019 | 10.04 | .13 | .15 | .28 | (.13 | ) | 10.19 | 2.85 | 7 | .81 | .81 | 1.34 | ||||||||||||||||||||||||||||||||
| 7/31/2018 | 10.15 | .11 | (.11 | ) | — | 9 | (.11 | ) | 10.04 | .02 | 7 | .80 | .80 | 1.10 | ||||||||||||||||||||||||||||||
| 7/31/2017 | 10.22 | .09 | (.07 | ) | .02 | (.09 | ) | 10.15 | .23 | 9 | .82 | .82 | .92 | |||||||||||||||||||||||||||||||
| 7/31/2016 | 10.17 | .08 | .05 | .13 | (.08 | ) | 10.22 | 1.29 | 13 | .81 | .81 | .80 | ||||||||||||||||||||||||||||||||
| Class F-2: | ||||||||||||||||||||||||||||||||||||||||||||
| 7/31/2020 | 10.19 | .14 | .18 | .32 | (.14 | ) | 10.37 | 3.19 | 218 | .46 | .45 | 1.40 | ||||||||||||||||||||||||||||||||
| 7/31/2019 | 10.04 | .17 | .15 | .32 | (.17 | ) | 10.19 | 3.17 | 182 | .49 | .49 | 1.67 | ||||||||||||||||||||||||||||||||
| 7/31/2018 | 10.15 | .14 | (.11 | ) | .03 | (.14 | ) | 10.04 | .28 | 52 | .54 | .54 | 1.37 | |||||||||||||||||||||||||||||||
| 7/31/2017 | 10.22 | .12 | (.07 | ) | .05 | (.12 | ) | 10.15 | .49 | 47 | .57 | .57 | 1.17 | |||||||||||||||||||||||||||||||
| 7/31/2016 | 10.17 | .11 | .05 | .16 | (.11 | ) | 10.22 | 1.55 | 80 | .56 | .56 | 1.06 | ||||||||||||||||||||||||||||||||
| 112 | American Funds Tax-Exempt Funds |
| Income from investment operations1 | ||||||||||||||||||||||||||||||||||||||||||||
| Period ended | Net asset value, beginning of period | Net investment income | Net gains (losses) on securities (both realized and unrealized) | Total from investment operations | Dividends (from net investment income) | Net asset value, end of period | Total return2,3 | Net assets, end of period (in millions) | Ratio of expenses to average net assets before reimbursements | Ratio of expenses to average net assets after reimbursements3 | Ratio of net income to average net assets3 | |||||||||||||||||||||||||||||||||
| Class F-3: | ||||||||||||||||||||||||||||||||||||||||||||
| 7/31/2020 | $ | 10.19 | $ | .15 | $ | .18 | $ | .33 | $ | (.15 | ) | $ | 10.37 | 3.25 | % | $ | 74 | .40 | % | .39 | % | 1.44 | % | |||||||||||||||||||||
| 7/31/2019 | 10.04 | .17 | .15 | .32 | (.17 | ) | 10.19 | 3.23 | 52 | .44 | .44 | 1.71 | ||||||||||||||||||||||||||||||||
| 7/31/2018 | 10.15 | .15 | (.11 | ) | .04 | (.15 | ) | 10.04 | .38 | 45 | .44 | .44 | 1.45 | |||||||||||||||||||||||||||||||
| 7/31/20176,10 | 10.07 | .07 | .08 | .15 | (.07 | ) | 10.15 | 1.49 | 8 | 77 | .47 | 11 | .47 | 11 | 1.35 | 11 | ||||||||||||||||||||||||||||
| Class R-6: | ||||||||||||||||||||||||||||||||||||||||||||
| 7/31/2020 | 10.19 | .15 | .18 | .33 | (.15 | ) | 10.37 | 3.26 | 162 | .39 | .39 | 1.46 | ||||||||||||||||||||||||||||||||
| 7/31/2019 | 10.04 | .17 | .15 | .32 | (.17 | ) | 10.19 | 3.24 | 132 | .43 | .43 | 1.71 | ||||||||||||||||||||||||||||||||
| 7/31/2018 | 10.15 | .15 | (.11 | ) | .04 | (.15 | ) | 10.04 | .38 | 122 | .44 | .44 | 1.48 | |||||||||||||||||||||||||||||||
| 7/31/20176,12 | 10.09 | .05 | .06 | .11 | (.05 | ) | 10.15 | 1.20 | 8 | 127 | .17 | 8 | .17 | 8 | .51 | 8 | ||||||||||||||||||||||||||||
| Year ended July 31, | ||||||||||
| 2020 | 2019 | 2018 | 2017 | 2016 | ||||||
| Portfolio turnover rate for all share classes | 65% | 50% | 34% | 26% | 21% | |||||
| 1 | Based on average shares outstanding. |
| 2 | Total returns exclude any applicable sales charges, including contingent deferred sales charges. |
| 3 | This column reflects the impact, if any, of certain reimbursements from CRMC and/or the fund’s transfer agent. During one of the periods shown, CRMC reimbursed a portion of miscellaneous fees and expenses. In addition, during one of the periods shown, the fund’s transfer agent waived a portion of the fund’s transfer agent services fees for Class F-3 shares. |
| 4 | All or a significant portion of assets in this class consisted of seed capital invested by CRMC and/or its affiliates. Fees for distribution services are not charged or accrued on these seed capital assets. If such fees were paid by the fund on seed capital assets, fund expenses would have been higher and net income and total return would have been lower. |
| 5 | Amount less than $1 million. |
| 6 | Based on operations for a period that is less than a full year. |
| 7 | Class T shares began investment operations on April 7, 2017. |
| 8 | Not annualized. |
| 9 | Amount less than $.01. |
| 10 | Class F-3 shares began investment operations on January 27, 2017. |
| 11 | Annualized. |
| 12 | Class R-6 shares began investment operations on March 17, 2017. |
See notes to financial statements.
| American Funds Tax-Exempt Funds | 113 |
Financial highlights (continued)
Limited Term Tax-Exempt Bond Fund of America
| Income (loss) from investment operations1 | Dividends and distributions | |||||||||||||||||||||||||||||||||||||||||||||||
| Period ended | Net asset value, beginning of period | Net investment income | Net gains (losses) on securities (both realized and unrealized) | Total from investment operations | Dividends (from net investment income) | Distributions (from capital gains) | Total dividends and distributions | Net asset value, end of period | Total return2 | Net assets, end of period (in millions) | Ratio of expenses to average net assets | Ratio of net income to average net assets | ||||||||||||||||||||||||||||||||||||
| Class A: | ||||||||||||||||||||||||||||||||||||||||||||||||
| 7/31/2020 | $ | 15.93 | $ | .25 | $ | .36 | $ | .61 | $ | (.26 | ) | $ | (.05 | ) | $ | (.31 | ) | $ | 16.23 | 3.88 | % | $ | 3,539 | .60 | % | 1.58 | % | |||||||||||||||||||||
| 7/31/2019 | 15.52 | .31 | .41 | .72 | (.31 | ) | — | (.31 | ) | 15.93 | 4.71 | 3,060 | .59 | 2.00 | ||||||||||||||||||||||||||||||||||
| 7/31/2018 | 15.77 | .31 | (.25 | ) | .06 | (.31 | ) | — | (.31 | ) | 15.52 | .40 | 3,057 | .59 | 2.00 | |||||||||||||||||||||||||||||||||
| 7/31/2017 | 16.04 | .32 | (.27 | ) | .05 | (.32 | ) | — | (.32 | ) | 15.77 | .34 | 3,038 | .59 | 2.04 | |||||||||||||||||||||||||||||||||
| 7/31/2016 | 15.92 | .35 | .12 | .47 | (.35 | ) | — | (.35 | ) | 16.04 | 2.97 | 3,055 | .59 | 2.17 | ||||||||||||||||||||||||||||||||||
| Class C: | ||||||||||||||||||||||||||||||||||||||||||||||||
| 7/31/2020 | 15.93 | .13 | .36 | .49 | (.14 | ) | (.05 | ) | (.19 | ) | 16.23 | 3.16 | 16 | 1.30 | .89 | |||||||||||||||||||||||||||||||||
| 7/31/2019 | 15.52 | .20 | .41 | .61 | (.20 | ) | — | (.20 | ) | 15.93 | 3.94 | 18 | 1.33 | 1.27 | ||||||||||||||||||||||||||||||||||
| 7/31/2018 | 15.77 | .20 | (.25 | ) | (.05 | ) | (.20 | ) | — | (.20 | ) | 15.52 | (.34 | ) | 20 | 1.34 | 1.26 | |||||||||||||||||||||||||||||||
| 7/31/2017 | 16.04 | .20 | (.27 | ) | (.07 | ) | (.20 | ) | — | (.20 | ) | 15.77 | (.40 | ) | 25 | 1.33 | 1.30 | |||||||||||||||||||||||||||||||
| 7/31/2016 | 15.92 | .23 | .12 | .35 | (.23 | ) | — | (.23 | ) | 16.04 | 2.20 | 30 | 1.33 | 1.43 | ||||||||||||||||||||||||||||||||||
| Class T: | ||||||||||||||||||||||||||||||||||||||||||||||||
| 7/31/2020 | 15.93 | .29 | .36 | .65 | (.30 | ) | (.05 | ) | (.35 | ) | 16.23 | 4.18 | 3 | — | 4 | .30 | 3 | 1.89 | 3 | |||||||||||||||||||||||||||||
| 7/31/2019 | 15.52 | .35 | .41 | .76 | (.35 | ) | — | (.35 | ) | 15.93 | 4.99 | 3 | — | 4 | .33 | 3 | 2.27 | 3 | ||||||||||||||||||||||||||||||
| 7/31/2018 | 15.77 | .36 | (.25 | ) | .11 | (.36 | ) | — | (.36 | ) | 15.52 | .68 | 3 | — | 4 | .33 | 3 | 2.26 | 3 | |||||||||||||||||||||||||||||
| 7/31/20175,6 | 15.68 | .12 | .09 | .21 | (.12 | ) | — | (.12 | ) | 15.77 | 1.32 | 3,7 | — | 4 | .10 | 3,7 | .74 | 3,7 | ||||||||||||||||||||||||||||||
| Class F-1: | ||||||||||||||||||||||||||||||||||||||||||||||||
| 7/31/2020 | 15.93 | .24 | .36 | .60 | (.25 | ) | (.05 | ) | (.30 | ) | 16.23 | 3.85 | 97 | .62 | 1.54 | |||||||||||||||||||||||||||||||||
| 7/31/2019 | 15.52 | .30 | .41 | .71 | (.30 | ) | — | (.30 | ) | 15.93 | 4.63 | 60 | .67 | 1.93 | ||||||||||||||||||||||||||||||||||
| 7/31/2018 | 15.77 | .30 | (.25 | ) | .05 | (.30 | ) | — | (.30 | ) | 15.52 | .33 | 64 | .66 | 1.93 | |||||||||||||||||||||||||||||||||
| 7/31/2017 | 16.04 | .31 | (.27 | ) | .04 | (.31 | ) | — | (.31 | ) | 15.77 | .26 | 83 | .67 | 1.96 | |||||||||||||||||||||||||||||||||
| 7/31/2016 | 15.92 | .33 | .12 | .45 | (.33 | ) | — | (.33 | ) | 16.04 | 2.88 | 90 | .67 | 2.09 | ||||||||||||||||||||||||||||||||||
| 114 | American Funds Tax-Exempt Funds |
| Income (loss) from investment operations1 | Dividends and distributions | |||||||||||||||||||||||||||||||||||||||||||||||
| Period ended | Net asset value, beginning of period | Net investment income | Net gains (losses) on securities (both realized and unrealized) | Total from investment operations | Dividends (from net investment income) | Distributions (from capital gains) | Total dividends and distributions | Net asset value, end of period | Total return2 | Net assets, end of period (in millions) | Ratio of expenses to average net assets | Ratio of net income to average net assets | ||||||||||||||||||||||||||||||||||||
| Class F-2: | ||||||||||||||||||||||||||||||||||||||||||||||||
| 7/31/2020 | $ | 15.93 | $ | .28 | $ | .36 | $ | .64 | $ | (.29 | ) | $ | (.05 | ) | $ | (.34 | ) | $ | 16.23 | 4.12 | % | $ | 777 | .36 | % | 1.81 | % | |||||||||||||||||||||
| 7/31/2019 | 15.52 | .34 | .41 | .75 | (.34 | ) | — | (.34 | ) | 15.93 | 4.91 | 500 | .39 | 2.20 | ||||||||||||||||||||||||||||||||||
| 7/31/2018 | 15.77 | .34 | (.25 | ) | .09 | (.34 | ) | — | (.34 | ) | 15.52 | .58 | 353 | .41 | 2.18 | |||||||||||||||||||||||||||||||||
| 7/31/2017 | 16.04 | .35 | (.27 | ) | .08 | (.35 | ) | — | (.35 | ) | 15.77 | .51 | 309 | .42 | 2.22 | |||||||||||||||||||||||||||||||||
| 7/31/2016 | 15.92 | .38 | .12 | .50 | (.38 | ) | — | (.38 | ) | 16.04 | 3.15 | 291 | .41 | 2.34 | ||||||||||||||||||||||||||||||||||
| Class F-3: | ||||||||||||||||||||||||||||||||||||||||||||||||
| 7/31/2020 | 15.93 | .30 | .36 | .66 | (.31 | ) | (.05 | ) | (.36 | ) | 16.23 | 4.23 | 422 | .26 | 1.91 | |||||||||||||||||||||||||||||||||
| 7/31/2019 | 15.52 | .36 | .41 | .77 | (.36 | ) | — | (.36 | ) | 15.93 | 5.02 | 308 | .30 | 2.29 | ||||||||||||||||||||||||||||||||||
| 7/31/2018 | 15.77 | .36 | (.25 | ) | .11 | (.36 | ) | — | (.36 | ) | 15.52 | .70 | 187 | .30 | 2.29 | |||||||||||||||||||||||||||||||||
| 7/31/20175,8 | 15.59 | .19 | .18 | .37 | (.19 | ) | — | (.19 | ) | 15.77 | 2.37 | 7 | 112 | .30 | 9 | 2.36 | 9 | |||||||||||||||||||||||||||||||
| Class R-6: | ||||||||||||||||||||||||||||||||||||||||||||||||
| 7/31/2020 | 15.93 | .30 | .36 | .66 | (.31 | ) | (.05 | ) | (.36 | ) | 16.23 | 4.23 | 692 | .26 | 1.88 | |||||||||||||||||||||||||||||||||
| 7/31/2019 | 15.52 | .36 | .41 | .77 | (.36 | ) | — | (.36 | ) | 15.93 | 5.02 | 307 | .29 | 2.30 | ||||||||||||||||||||||||||||||||||
| 7/31/2018 | 15.77 | .36 | (.25 | ) | .11 | (.36 | ) | — | (.36 | ) | 15.52 | .70 | 284 | .30 | 2.29 | |||||||||||||||||||||||||||||||||
| 7/31/2017 | 16.04 | .37 | (.27 | ) | .10 | (.37 | ) | — | (.37 | ) | 15.77 | .63 | 296 | .30 | 2.33 | |||||||||||||||||||||||||||||||||
| 7/31/2016 | 15.92 | .39 | .12 | .51 | (.39 | ) | — | (.39 | ) | 16.04 | 3.26 | 284 | .30 | 2.45 | ||||||||||||||||||||||||||||||||||
| Year ended July 31, | ||||||||||
| 2020 | 2019 | 2018 | 2017 | 2016 | ||||||
| Portfolio turnover rate for all share classes | 56% | 42% | 28% | 27% | 16% | |||||
| 1 | Based on average shares outstanding. |
| 2 | Total returns exclude any applicable sales charges, including contingent deferred sales charges. |
| 3 | All or a significant portion of assets in this class consisted of seed capital invested by CRMC and/or its affiliates. Fees for distribution services are not charged or accrued on these seed capital assets. If such fees were paid by the fund on seed capital assets, fund expenses would have been higher and net income and total return would have been lower. |
| 4 | Amount less than $1 million. |
| 5 | Based on operations for a period that is less than a full year. |
| 6 | Class T shares began investment operations on April 7, 2017. |
| 7 | Not annualized. |
| 8 | Class F-3 shares began investment operations on January 27, 2017. |
| 9 | Annualized. |
See notes to financial statements.
| American Funds Tax-Exempt Funds | 115 |
Financial highlights (continued)
The Tax-Exempt Bond Fund of America
| Income (loss) from investment operations1 | ||||||||||||||||||||||||||||||||||||||||
| Period ended | Net asset value, beginning of period | Net investment income | Net gains (losses) on securities (both realized and unrealized) | Total from investment operations | Dividends (from net investment income) | Net asset value, end of period | Total return2 | Net assets, end of period (in millions) | Ratio of expenses to average net assets | Ratio of net income to average net assets | ||||||||||||||||||||||||||||||
| Class A: | ||||||||||||||||||||||||||||||||||||||||
| 7/31/2020 | $ | 13.29 | $ | .33 | $ | .25 | $ | .58 | $ | (.33 | ) | $ | 13.54 | 4.40 | % | $ | 12,623 | .52 | % | 2.46 | % | |||||||||||||||||||
| 7/31/2019 | 12.81 | .37 | .47 | .84 | (.36 | ) | 13.29 | 6.71 | 10,868 | .52 | 2.84 | |||||||||||||||||||||||||||||
| 7/31/2018 | 12.98 | .38 | (.17 | ) | .21 | (.38 | ) | 12.81 | 1.60 | 10,102 | .53 | 2.91 | ||||||||||||||||||||||||||||
| 7/31/2017 | 13.40 | .40 | (.42 | ) | (.02 | ) | (.40 | ) | 12.98 | (.09 | ) | 9,692 | .53 | 3.12 | ||||||||||||||||||||||||||
| 7/31/2016 | 12.96 | .41 | .44 | .85 | (.41 | ) | 13.40 | 6.69 | 9,510 | .54 | 3.15 | |||||||||||||||||||||||||||||
| Class C: | ||||||||||||||||||||||||||||||||||||||||
| 7/31/2020 | 13.29 | .23 | .25 | .48 | (.23 | ) | 13.54 | 3.64 | 376 | 1.26 | 1.73 | |||||||||||||||||||||||||||||
| 7/31/2019 | 12.81 | .27 | .47 | .74 | (.26 | ) | 13.29 | 5.88 | 407 | 1.31 | 2.06 | |||||||||||||||||||||||||||||
| 7/31/2018 | 12.98 | .27 | (.17 | ) | .10 | (.27 | ) | 12.81 | .80 | 432 | 1.32 | 2.12 | ||||||||||||||||||||||||||||
| 7/31/2017 | 13.40 | .30 | (.42 | ) | (.12 | ) | (.30 | ) | 12.98 | (.88 | ) | 474 | 1.32 | 2.33 | ||||||||||||||||||||||||||
| 7/31/2016 | 12.96 | .31 | .44 | .75 | (.31 | ) | 13.40 | 5.85 | 517 | 1.33 | 2.35 | |||||||||||||||||||||||||||||
| Class T: | ||||||||||||||||||||||||||||||||||||||||
| 7/31/2020 | 13.29 | .36 | .25 | .61 | (.36 | ) | 13.54 | 4.65 | 3 | — | 4 | .27 | 3 | 2.70 | 3 | |||||||||||||||||||||||||
| 7/31/2019 | 12.81 | .40 | .47 | .87 | (.39 | ) | 13.29 | 6.93 | 3 | — | 4 | .32 | 3 | 3.05 | 3 | |||||||||||||||||||||||||
| 7/31/2018 | 12.98 | .40 | (.17 | ) | .23 | (.40 | ) | 12.81 | 1.83 | 3 | — | 4 | .32 | 3 | 3.12 | 3 | ||||||||||||||||||||||||
| 7/31/20175,6 | 12.85 | .14 | .13 | .27 | (.14 | ) | 12.98 | 2.07 | 3,7 | — | 4 | .10 | 3,7 | 1.06 | 3,7 | |||||||||||||||||||||||||
| Class F-1: | ||||||||||||||||||||||||||||||||||||||||
| 7/31/2020 | 13.29 | .32 | .25 | .57 | (.32 | ) | 13.54 | 4.31 | 313 | .60 | 2.39 | |||||||||||||||||||||||||||||
| 7/31/2019 | 12.81 | .36 | .47 | .83 | (.35 | ) | 13.29 | 6.58 | 338 | .64 | 2.72 | |||||||||||||||||||||||||||||
| 7/31/2018 | 12.98 | .36 | (.17 | ) | .19 | (.36 | ) | 12.81 | 1.48 | 370 | .65 | 2.80 | ||||||||||||||||||||||||||||
| 7/31/2017 | 13.40 | .39 | (.43 | ) | (.04 | ) | (.38 | ) | 12.98 | (.22 | ) | 461 | .66 | 2.99 | ||||||||||||||||||||||||||
| 7/31/2016 | 12.96 | .39 | .44 | .83 | (.39 | ) | 13.40 | 6.53 | 518 | .67 | 3.04 | |||||||||||||||||||||||||||||
| 116 | American Funds Tax-Exempt Funds |
| Income (loss) from investment operations1 | ||||||||||||||||||||||||||||||||||||||||
| Period ended | Net asset value, beginning of period | Net investment income | Net gains (losses) on securities (both realized and unrealized) | Total from investment operations | Dividends (from net investment income) | Net asset value, end of period | Total return2 | Net assets, end of period (in millions) | Ratio of expenses to average net assets | Ratio of net income to average net assets | ||||||||||||||||||||||||||||||
| Class F-2: | ||||||||||||||||||||||||||||||||||||||||
| 7/31/2020 | $ | 13.29 | $ | .35 | $ | .25 | $ | .60 | $ | (.35 | ) | $ | 13.54 | 4.59 | % | $ | 3,814 | .34 | % | 2.63 | % | |||||||||||||||||||
| 7/31/2019 | 12.81 | .39 | .47 | .86 | (.38 | ) | 13.29 | 6.86 | 2,778 | .38 | 2.98 | |||||||||||||||||||||||||||||
| 7/31/2018 | 12.98 | .39 | (.17 | ) | .22 | (.39 | ) | 12.81 | 1.74 | 2,177 | .39 | 3.05 | ||||||||||||||||||||||||||||
| 7/31/2017 | 13.40 | .42 | (.42 | ) | — | 8 | (.42 | ) | 12.98 | .03 | 1,909 | .41 | 3.24 | |||||||||||||||||||||||||||
| 7/31/2016 | 12.96 | .43 | .44 | .87 | (.43 | ) | 13.40 | 6.84 | 2,879 | .40 | 3.26 | |||||||||||||||||||||||||||||
| Class F-3: | ||||||||||||||||||||||||||||||||||||||||
| 7/31/2020 | 13.29 | .36 | .25 | .61 | (.36 | ) | 13.54 | 4.70 | 7,950 | .24 | 2.74 | |||||||||||||||||||||||||||||
| 7/31/2019 | 12.81 | .41 | .47 | .88 | (.40 | ) | 13.29 | 6.97 | 6,570 | .27 | 3.09 | |||||||||||||||||||||||||||||
| 7/31/2018 | 12.98 | .41 | (.17 | ) | .24 | (.41 | ) | 12.81 | 1.84 | 5,397 | .28 | 3.11 | ||||||||||||||||||||||||||||
| 7/31/20175,9 | 12.75 | .22 | .23 | .45 | (.22 | ) | 12.98 | 3.54 | 7 | 1,555 | .29 | 10 | 3.34 | 10 | ||||||||||||||||||||||||||
| Class R-6: | ||||||||||||||||||||||||||||||||||||||||
| 7/31/2020 | 13.29 | .36 | .25 | .61 | (.36 | ) | 13.54 | 4.70 | 473 | .24 | 2.76 | |||||||||||||||||||||||||||||
| 7/31/2019 | 12.81 | .41 | .47 | .88 | (.40 | ) | 13.29 | 6.97 | 685 | .27 | 3.09 | |||||||||||||||||||||||||||||
| 7/31/2018 | 12.98 | .41 | (.17 | ) | .24 | (.41 | ) | 12.81 | 1.85 | 550 | .28 | 3.15 | ||||||||||||||||||||||||||||
| 7/31/2017 | 13.40 | .44 | (.43 | ) | .01 | (.43 | ) | 12.98 | .15 | 380 | .29 | 3.36 | ||||||||||||||||||||||||||||
| 7/31/2016 | 12.96 | .44 | .44 | .88 | (.44 | ) | 13.40 | 6.95 | 391 | .29 | 3.39 | |||||||||||||||||||||||||||||
| Year ended July 31, | ||||||||||
| 2020 | 2019 | 2018 | 2017 | 2016 | ||||||
| Portfolio turnover rate for all share classes | 24% | 20% | 17% | 20% | 13% | |||||
| 1 | Based on average shares outstanding. |
| 2 | Total returns exclude any applicable sales charges, including contingent deferred sales charges. |
| 3 | All or a significant portion of assets in this class consisted of seed capital invested by CRMC and/or its affiliates. Fees for distribution services are not charged or accrued on these seed capital assets. If such fees were paid by the fund on seed capital assets, fund expenses would have been higher and net income and total return would have been lower. |
| 4 | Amount less than $1 million. |
| 5 | Based on operations for a period that is less than a full year. |
| 6 | Class T shares began investment operations on April 7, 2017. |
| 7 | Not annualized. |
| 8 | Amount less than $.01. |
| 9 | Class F-3 shares began investment operations on January 27, 2017. |
| 10 | Annualized. |
See notes to financial statements.
| American Funds Tax-Exempt Funds | 117 |
Financial highlights (continued)
American High-Income Municipal Bond Fund
| Income (loss) from investment operations1 | Dividends and distributions | |||||||||||||||||||||||||||||||||||||||||||||||
| Period ended | Net asset value, beginning of period | Net investment income | Net (losses) gains on securities (both realized and unrealized) | Total from investment operations | Dividends (from net investment income) | Distributions (from capital gains) | Total dividends and distributions | Net asset value, end of period | Total return2 | Net assets, end of period (in millions) | Ratio of expenses to average net assets | Ratio of net income to average net assets | ||||||||||||||||||||||||||||||||||||
| Class A: | ||||||||||||||||||||||||||||||||||||||||||||||||
| 7/31/2020 | $ | 16.33 | $ | .59 | $ | (.17 | ) | $ | .42 | $ | (.54 | ) | $ | (.01 | ) | $ | (.55 | ) | $ | 16.20 | 2.68 | % | $ | 4,871 | .68 | % | 3.63 | % | ||||||||||||||||||||
| 7/31/2019 | 15.78 | .58 | .54 | 1.12 | (.57 | ) | — | (.57 | ) | 16.33 | 7.28 | 4,637 | .68 | 3.67 | ||||||||||||||||||||||||||||||||||
| 7/31/2018 | 15.73 | .59 | .04 | .63 | (.58 | ) | — | (.58 | ) | 15.78 | 4.05 | 4,062 | .69 | 3.72 | ||||||||||||||||||||||||||||||||||
| 7/31/2017 | 16.21 | .60 | (.49 | ) | .11 | (.59 | ) | — | (.59 | ) | 15.73 | .76 | 3,645 | .67 | 3.86 | |||||||||||||||||||||||||||||||||
| 7/31/2016 | 15.40 | .63 | .79 | 1.42 | (.61 | ) | — | (.61 | ) | 16.21 | 9.45 | 3,519 | .67 | 4.02 | ||||||||||||||||||||||||||||||||||
| Class C: | ||||||||||||||||||||||||||||||||||||||||||||||||
| 7/31/2020 | 16.33 | .48 | (.17 | ) | .31 | (.43 | ) | (.01 | ) | (.44 | ) | 16.20 | 1.97 | 203 | 1.38 | 2.93 | ||||||||||||||||||||||||||||||||
| 7/31/2019 | 15.78 | .47 | .54 | 1.01 | (.46 | ) | — | (.46 | ) | 16.33 | 6.49 | 238 | 1.41 | 2.94 | ||||||||||||||||||||||||||||||||||
| 7/31/2018 | 15.73 | .47 | .04 | .51 | (.46 | ) | — | (.46 | ) | 15.78 | 3.29 | 227 | 1.43 | 2.97 | ||||||||||||||||||||||||||||||||||
| 7/31/2017 | 16.21 | .48 | (.49 | ) | (.01 | ) | (.47 | ) | — | (.47 | ) | 15.73 | — | 229 | 1.43 | 3.10 | ||||||||||||||||||||||||||||||||
| 7/31/2016 | 15.40 | .52 | .79 | 1.31 | (.50 | ) | — | (.50 | ) | 16.21 | 8.62 | 247 | 1.43 | 3.26 | ||||||||||||||||||||||||||||||||||
| Class T: | ||||||||||||||||||||||||||||||||||||||||||||||||
| 7/31/2020 | 16.33 | .64 | (.17 | ) | .47 | (.59 | ) | (.01 | ) | (.60 | ) | 16.20 | 2.99 | 3 | — | 4 | .38 | 3 | 3.92 | 3 | ||||||||||||||||||||||||||||
| 7/31/2019 | 15.78 | .62 | .54 | 1.16 | (.61 | ) | — | (.61 | ) | 16.33 | 7.55 | 3 | — | 4 | .42 | 3 | 3.93 | 3 | ||||||||||||||||||||||||||||||
| 7/31/2018 | 15.73 | .63 | .04 | .67 | (.62 | ) | — | (.62 | ) | 15.78 | 4.34 | 3 | — | 4 | .43 | 3 | 3.98 | 3 | ||||||||||||||||||||||||||||||
| 7/31/20175,6 | 15.50 | .20 | .23 | .43 | (.20 | ) | — | (.20 | ) | 15.73 | 2.77 | 3,7 | — | 4 | .12 | 3,7 | 1.28 | 3,7 | ||||||||||||||||||||||||||||||
| Class F-1: | ||||||||||||||||||||||||||||||||||||||||||||||||
| 7/31/2020 | 16.33 | .59 | (.17 | ) | .42 | (.54 | ) | (.01 | ) | (.55 | ) | 16.20 | 2.66 | 146 | .70 | 3.60 | ||||||||||||||||||||||||||||||||
| 7/31/2019 | 15.78 | .57 | .54 | 1.11 | (.56 | ) | — | (.56 | ) | 16.33 | 7.21 | 180 | .74 | 3.61 | ||||||||||||||||||||||||||||||||||
| 7/31/2018 | 15.73 | .58 | .04 | .62 | (.57 | ) | — | (.57 | ) | 15.78 | 3.99 | 208 | .75 | 3.65 | ||||||||||||||||||||||||||||||||||
| 7/31/2017 | 16.21 | .59 | (.49 | ) | .10 | (.58 | ) | — | (.58 | ) | 15.73 | .68 | 234 | .75 | 3.77 | |||||||||||||||||||||||||||||||||
| 7/31/2016 | 15.40 | .62 | .79 | 1.41 | (.60 | ) | — | (.60 | ) | 16.21 | 9.37 | 282 | .74 | 3.95 | ||||||||||||||||||||||||||||||||||
| 118 | American Funds Tax-Exempt Funds |
| Income (loss) from investment operations1 | Dividends and distributions | |||||||||||||||||||||||||||||||||||||||||||||||
| Period ended | Net asset value, beginning of period | Net investment income | Net (losses) gains on securities (both realized and unrealized) | Total from investment operations | Dividends (from net investment income) | Distributions (from capital gains) | Total dividends and distributions | Net asset value, end of period | Total return2 | Net assets, end of period (in millions) | Ratio of expenses to average net assets | Ratio of net income to average net assets | ||||||||||||||||||||||||||||||||||||
| Class F-2: | ||||||||||||||||||||||||||||||||||||||||||||||||
| 7/31/2020 | $ | 16.33 | $ | .63 | $ | (.17 | ) | $ | .46 | $ | (.58 | ) | $ | (.01 | ) | $ | (.59 | ) | $ | 16.20 | 2.93 | % | $ | 1,186 | .44 | % | 3.86 | % | ||||||||||||||||||||
| 7/31/2019 | 15.78 | .61 | .54 | 1.15 | (.60 | ) | — | (.60 | ) | 16.33 | 7.49 | 1,114 | .47 | 3.87 | ||||||||||||||||||||||||||||||||||
| 7/31/2018 | 15.73 | .62 | .04 | .66 | (.61 | ) | — | (.61 | ) | 15.78 | 4.26 | 798 | .49 | 3.91 | ||||||||||||||||||||||||||||||||||
| 7/31/2017 | 16.21 | .63 | (.49 | ) | .14 | (.62 | ) | — | (.62 | ) | 15.73 | .93 | 605 | .50 | 4.05 | |||||||||||||||||||||||||||||||||
| 7/31/2016 | 15.40 | .66 | .79 | 1.45 | (.64 | ) | — | (.64 | ) | 16.21 | 9.65 | 775 | .48 | 4.18 | ||||||||||||||||||||||||||||||||||
| Class F-3: | ||||||||||||||||||||||||||||||||||||||||||||||||
| 7/31/2020 | 16.33 | .65 | (.17 | ) | .48 | (.60 | ) | (.01 | ) | (.61 | ) | 16.20 | 3.04 | 1,085 | .33 | 3.97 | ||||||||||||||||||||||||||||||||
| 7/31/2019 | 15.78 | .63 | .54 | 1.17 | (.62 | ) | — | (.62 | ) | 16.33 | 7.60 | 897 | .37 | 3.97 | ||||||||||||||||||||||||||||||||||
| 7/31/2018 | 15.73 | .64 | .04 | .68 | (.63 | ) | — | (.63 | ) | 15.78 | 4.37 | 646 | .38 | 4.02 | ||||||||||||||||||||||||||||||||||
| 7/31/20175,8 | 15.30 | .32 | .43 | .75 | (.32 | ) | — | (.32 | ) | 15.73 | 4.96 | 7 | 421 | .37 | 9 | 4.04 | 9 | |||||||||||||||||||||||||||||||
| Class R-6: | ||||||||||||||||||||||||||||||||||||||||||||||||
| 7/31/2020 | 16.33 | .65 | (.17 | ) | .48 | (.60 | ) | (.01 | ) | (.61 | ) | 16.20 | 3.04 | 794 | .33 | 3.98 | ||||||||||||||||||||||||||||||||
| 7/31/2019 | 15.78 | .63 | .54 | 1.17 | (.62 | ) | — | (.62 | ) | 16.33 | 7.61 | 686 | .37 | 3.98 | ||||||||||||||||||||||||||||||||||
| 7/31/2018 | 15.73 | .64 | .04 | .68 | (.63 | ) | — | (.63 | ) | 15.78 | 4.37 | 550 | .38 | 4.02 | ||||||||||||||||||||||||||||||||||
| 7/31/2017 | 16.21 | .64 | (.49 | ) | .15 | (.63 | ) | — | (.63 | ) | 15.73 | 1.05 | 380 | .38 | 4.16 | |||||||||||||||||||||||||||||||||
| 7/31/2016 | 15.40 | .68 | .79 | 1.47 | (.66 | ) | — | (.66 | ) | 16.21 | 9.76 | 269 | .38 | 4.31 | ||||||||||||||||||||||||||||||||||
| Year ended July 31, | ||||||||||
| 2020 | 2019 | 2018 | 2017 | 2016 | ||||||
| Portfolio turnover rate for all share classes | 35% | 20% | 24% | 30% | 21% | |||||
| 1 | Based on average shares outstanding. |
| 2 | Total returns exclude any applicable sales charges, including contingent deferred sales charges. |
| 3 | All or a significant portion of assets in this class consisted of seed capital invested by CRMC and/or its affiliates. Fees for distribution services are not charged or accrued on these seed capital assets. If such fees were paid by the fund on seed capital assets, fund expenses would have been higher and net income and total return would have been lower. |
| 4 | Amount less than $1 million. |
| 5 | Based on operations for a period that is less than a full year. |
| 6 | Class T shares began investment operations on April 7, 2017. |
| 7 | Not annualized. |
| 8 | Class F-3 shares began investment operations on January 27, 2017. |
| 9 | Annualized. |
See notes to financial statements.
| American Funds Tax-Exempt Funds | 119 |
Financial highlights (continued)
The Tax-Exempt Fund of California
| Income (loss) from investment operations1 | Dividends and distributions | |||||||||||||||||||||||||||||||||||||||||||||||
| Period ended | Net asset value, beginning of period | Net investment income | Net gains (losses) on securities (both realized and unrealized) | Total from investment operations | Dividends (from net investment income) | Distributions (from capital gains) | Total dividends and distributions | Net asset value, end of period | Total return2 | Net assets, end of period (in millions) | Ratio of expenses to average net assets | Ratio of net income to average net assets | ||||||||||||||||||||||||||||||||||||
| Class A: | ||||||||||||||||||||||||||||||||||||||||||||||||
| 7/31/2020 | $ | 18.08 | $ | .43 | $ | .30 | $ | .73 | $ | (.43 | ) | $ | (.09 | ) | $ | (.52 | ) | $ | 18.29 | 4.14 | % | $ | 1,941 | .61 | % | 2.40 | % | |||||||||||||||||||||
| 7/31/2019 | 17.43 | .50 | .65 | 1.15 | (.50 | ) | — | (.50 | ) | 18.08 | 6.73 | 1,784 | .59 | 2.88 | ||||||||||||||||||||||||||||||||||
| 7/31/2018 | 17.63 | .51 | (.20 | ) | .31 | (.51 | ) | — | (.51 | ) | 17.43 | 1.77 | 1,678 | .61 | 2.90 | |||||||||||||||||||||||||||||||||
| 7/31/2017 | 18.21 | .54 | (.59 | ) | (.05 | ) | (.53 | ) | — | (.53 | ) | 17.63 | (.22 | ) | 1,641 | .60 | 3.05 | |||||||||||||||||||||||||||||||
| 7/31/2016 | 17.62 | .57 | .58 | 1.15 | (.56 | ) | — | (.56 | ) | 18.21 | 6.65 | 1,678 | .60 | 3.17 | ||||||||||||||||||||||||||||||||||
| Class C: | ||||||||||||||||||||||||||||||||||||||||||||||||
| 7/31/2020 | 18.08 | .30 | .30 | .60 | (.30 | ) | (.09 | ) | (.39 | ) | 18.29 | 3.36 | 60 | 1.36 | 1.65 | |||||||||||||||||||||||||||||||||
| 7/31/2019 | 17.43 | .36 | .65 | 1.01 | (.36 | ) | — | (.36 | ) | 18.08 | 5.90 | 69 | 1.38 | 2.10 | ||||||||||||||||||||||||||||||||||
| 7/31/2018 | 17.63 | .37 | (.20 | ) | .17 | (.37 | ) | — | (.37 | ) | 17.43 | .97 | 71 | 1.40 | 2.11 | |||||||||||||||||||||||||||||||||
| 7/31/2017 | 18.21 | .40 | (.59 | ) | (.19 | ) | (.39 | ) | — | (.39 | ) | 17.63 | (1.00 | ) | 83 | 1.39 | 2.26 | |||||||||||||||||||||||||||||||
| 7/31/2016 | 17.62 | .43 | .58 | 1.01 | (.42 | ) | — | (.42 | ) | 18.21 | 5.82 | 97 | 1.39 | 2.38 | ||||||||||||||||||||||||||||||||||
| Class T: | ||||||||||||||||||||||||||||||||||||||||||||||||
| 7/31/2020 | 18.08 | .48 | .30 | .78 | (.48 | ) | (.09 | ) | (.57 | ) | 18.29 | 4.38 | 3 | — | 4 | .37 | 3 | 2.62 | 3 | |||||||||||||||||||||||||||||
| 7/31/2019 | 17.43 | .54 | .65 | 1.19 | (.54 | ) | — | (.54 | ) | 18.08 | 6.95 | 3 | — | 4 | .39 | 3 | 3.09 | 3 | ||||||||||||||||||||||||||||||
| 7/31/2018 | 17.63 | .54 | (.20 | ) | .34 | (.54 | ) | — | (.54 | ) | 17.43 | 1.98 | 3 | — | 4 | .40 | 3 | 3.10 | 3 | |||||||||||||||||||||||||||||
| 7/31/20175,6 | 17.42 | .18 | .21 | .39 | (.18 | ) | — | (.18 | ) | 17.63 | 2.24 | 3,7 | — | 4 | .12 | 3,7 | 1.02 | 3,7 | ||||||||||||||||||||||||||||||
| Class F-1: | ||||||||||||||||||||||||||||||||||||||||||||||||
| 7/31/2020 | 18.08 | .42 | .30 | .72 | (.42 | ) | (.09 | ) | (.51 | ) | 18.29 | 4.05 | 71 | .70 | 2.31 | |||||||||||||||||||||||||||||||||
| 7/31/2019 | 17.43 | .48 | .65 | 1.13 | (.48 | ) | — | (.48 | ) | 18.08 | 6.59 | 72 | .72 | 2.76 | ||||||||||||||||||||||||||||||||||
| 7/31/2018 | 17.63 | .49 | (.20 | ) | .29 | (.49 | ) | — | (.49 | ) | 17.43 | 1.64 | 75 | .73 | 2.77 | |||||||||||||||||||||||||||||||||
| 7/31/2017 | 18.21 | .51 | (.58 | ) | (.07 | ) | (.51 | ) | — | (.51 | ) | 17.63 | (.35 | ) | 76 | .73 | 2.93 | |||||||||||||||||||||||||||||||
| 7/31/2016 | 17.62 | .55 | .58 | 1.13 | (.54 | ) | — | (.54 | ) | 18.21 | 6.52 | 83 | .73 | 3.04 | ||||||||||||||||||||||||||||||||||
| 120 | American Funds Tax-Exempt Funds |
| Income (loss) from investment operations1 | Dividends and distributions | |||||||||||||||||||||||||||||||||||||||||||||||
| Period ended | Net asset value, beginning of period | Net investment income | Net gains (losses) on securities (both realized and unrealized) | Total from investment operations | Dividends (from net investment income) | Distributions (from capital gains) | Total dividends and distributions | Net asset value, end of period | Total return2 | Net assets, end of period (in millions) | Ratio of expenses to average net assets | Ratio of net income to average net assets | ||||||||||||||||||||||||||||||||||||
| Class F-2: | ||||||||||||||||||||||||||||||||||||||||||||||||
| 7/31/2020 | $ | 18.08 | $ | .47 | $ | .30 | $ | .77 | $ | (.47 | ) | $ | (.09 | ) | $ | (.56 | ) | $ | 18.29 | 4.33 | % | $ | 547 | .42 | % | 2.58 | % | |||||||||||||||||||||
| 7/31/2019 | 17.43 | .53 | .65 | 1.18 | (.53 | ) | — | (.53 | ) | 18.08 | 6.88 | 411 | .45 | 3.02 | ||||||||||||||||||||||||||||||||||
| 7/31/2018 | 17.63 | .53 | (.20 | ) | .33 | (.53 | ) | — | (.53 | ) | 17.43 | 1.89 | 257 | .48 | 3.03 | |||||||||||||||||||||||||||||||||
| 7/31/2017 | 18.21 | .56 | (.59 | ) | (.03 | ) | (.55 | ) | — | (.55 | ) | 17.63 | (.09 | ) | 200 | .48 | 3.18 | |||||||||||||||||||||||||||||||
| 7/31/2016 | 17.62 | .60 | .58 | 1.18 | (.59 | ) | — | (.59 | ) | 18.21 | 6.79 | 213 | .48 | 3.29 | ||||||||||||||||||||||||||||||||||
| Class F-3: | ||||||||||||||||||||||||||||||||||||||||||||||||
| 7/31/2020 | 18.08 | .48 | .30 | .78 | (.48 | ) | (.09 | ) | (.57 | ) | 18.29 | 4.42 | 320 | .33 | 2.67 | |||||||||||||||||||||||||||||||||
| 7/31/2019 | 17.43 | .55 | .64 | 1.19 | (.54 | ) | — | (.54 | ) | 18.08 | 6.98 | 241 | .36 | 3.11 | ||||||||||||||||||||||||||||||||||
| 7/31/2018 | 17.63 | .55 | (.20 | ) | .35 | (.55 | ) | — | (.55 | ) | 17.43 | 2.01 | 174 | .37 | 3.13 | |||||||||||||||||||||||||||||||||
| 7/31/20175,8 | 17.27 | .29 | .36 | .65 | (.29 | ) | — | (.29 | ) | 17.63 | 3.79 | 7 | 124 | .38 | 9 | 3.25 | 9 | |||||||||||||||||||||||||||||||
| Year ended July 31, | ||||||||||
| 2020 | 2019 | 2018 | 2017 | 2016 | ||||||
| Portfolio turnover rate for all share classes | 26% | 27% | 14% | 21% | 11% | |||||
| 1 | Based on average shares outstanding. |
| 2 | Total returns exclude any applicable sales charges, including contingent deferred sales charges. |
| 3 | All or a significant portion of assets in this class consisted of seed capital invested by CRMC and/or its affiliates. Fees for distribution services are not charged or accrued on these seed capital assets. If such fees were paid by the fund on seed capital assets, fund expenses would have been higher and net income and total return would have been lower. |
| 4 | Amount less than $1 million. |
| 5 | Based on operations for a period that is less than a full year. |
| 6 | Class T shares began investment operations on April 7, 2017. |
| 7 | Not annualized. |
| 8 | Class F-3 shares began investment operations on January 27, 2017. |
| 9 | Annualized. |
See notes to financial statements.
| American Funds Tax-Exempt Funds | 121 |
Financial highlights (continued)
American Funds Tax-Exempt Fund of New York
| Income (loss) from investment operations1 | ||||||||||||||||||||||||||||||||||||||||||||
| Period ended | Net asset value, beginning of period | Net investment income | Net gains (losses) on securities (both realized and unrealized) | Total from investment operations | Dividends (from net investment income) | Net asset value, end of period | Total return2,3 | Net assets, end of period (in millions) | Ratio of expenses to average net assets before reimbursements | Ratio of expenses to average net assets after reimbursements3 | Ratio of net income to average net assets3 | |||||||||||||||||||||||||||||||||
| Class A: | ||||||||||||||||||||||||||||||||||||||||||||
| 7/31/2020 | $ | 11.02 | $ | .27 | $ | .07 | $ | .34 | $ | (.26 | ) | $ | 11.10 | 3.18 | % | $ | 220 | .67 | % | .62 | % | 2.43 | % | |||||||||||||||||||||
| 7/31/2019 | 10.61 | .28 | .41 | .69 | (.28 | ) | 11.02 | 6.57 | 200 | .67 | .67 | 2.60 | ||||||||||||||||||||||||||||||||
| 7/31/2018 | 10.80 | .27 | (.19 | ) | .08 | (.27 | ) | 10.61 | .75 | 4 | 183 | .72 | 4 | .69 | 4 | 2.52 | 4 | |||||||||||||||||||||||||||
| 7/31/2017 | 11.12 | .27 | (.32 | ) | (.05 | ) | (.27 | ) | 10.80 | (.39 | )4 | 169 | .74 | 4 | .69 | 4 | 2.55 | 4 | ||||||||||||||||||||||||||
| 7/31/2016 | 10.66 | .28 | .45 | .73 | (.27 | ) | 11.12 | 6.95 | 4 | 161 | .72 | 4 | .69 | 4 | 2.54 | 4 | ||||||||||||||||||||||||||||
| Class C: | ||||||||||||||||||||||||||||||||||||||||||||
| 7/31/2020 | 11.02 | .19 | .07 | .26 | (.18 | ) | 11.10 | 2.41 | 10 | 1.42 | 1.37 | 1.68 | ||||||||||||||||||||||||||||||||
| 7/31/2019 | 10.61 | .19 | .41 | .60 | (.19 | ) | 11.02 | 5.74 | 12 | 1.46 | 1.45 | 1.81 | ||||||||||||||||||||||||||||||||
| 7/31/2018 | 10.80 | .19 | (.19 | ) | — | 5 | (.19 | ) | 10.61 | (.04 | ) | 12 | 1.52 | 1.48 | 1.73 | |||||||||||||||||||||||||||||
| 7/31/2017 | 11.12 | .19 | (.32 | ) | (.13 | ) | (.19 | ) | 10.80 | (1.17 | ) | 12 | 1.52 | 1.48 | 1.76 | |||||||||||||||||||||||||||||
| 7/31/2016 | 10.66 | .20 | .45 | .65 | (.19 | ) | 11.12 | 6.11 | 14 | 1.51 | 1.48 | 1.75 | ||||||||||||||||||||||||||||||||
| Class T: | ||||||||||||||||||||||||||||||||||||||||||||
| 7/31/2020 | 11.02 | .30 | .07 | .37 | (.29 | ) | 11.10 | 3.42 | 4 | — | 6 | .42 | 4 | .38 | 4 | 2.66 | 4 | |||||||||||||||||||||||||||
| 7/31/2019 | 10.61 | .30 | .41 | .71 | (.30 | ) | 11.02 | 6.78 | 4 | — | 6 | .47 | 4 | .46 | 4 | 2.79 | 4 | |||||||||||||||||||||||||||
| 7/31/2018 | 10.80 | .29 | (.19 | ) | .10 | (.29 | ) | 10.61 | .98 | 4 | — | 6 | .52 | 4 | .48 | 4 | 2.73 | 4 | ||||||||||||||||||||||||||
| 7/31/20177,8 | 10.68 | .09 | .13 | .22 | (.10 | ) | 10.80 | 2.02 | 4,9 | — | 6 | .19 | 4,9 | .15 | 4,9 | .87 | 4,9 | |||||||||||||||||||||||||||
| Class F-1: | ||||||||||||||||||||||||||||||||||||||||||||
| 7/31/2020 | 11.02 | .27 | .07 | .34 | (.26 | ) | 11.10 | 3.16 | 4 | 2 | .68 | 4 | .64 | 4 | 2.41 | 4 | ||||||||||||||||||||||||||||
| 7/31/2019 | 10.61 | .27 | .41 | .68 | (.27 | ) | 11.02 | 6.52 | 4 | 2 | .72 | 4 | .71 | 4 | 2.55 | 4 | ||||||||||||||||||||||||||||
| 7/31/2018 | 10.80 | .26 | (.19 | ) | .07 | (.26 | ) | 10.61 | .69 | 4 | 2 | .79 | 4 | .75 | 4 | 2.45 | 4 | |||||||||||||||||||||||||||
| 7/31/2017 | 11.12 | .27 | (.32 | ) | (.05 | ) | (.27 | ) | 10.80 | (.38 | )4 | 3 | .73 | 4 | .68 | 4 | 2.56 | 4 | ||||||||||||||||||||||||||
| 7/31/2016 | 10.66 | .29 | .45 | .74 | (.28 | ) | 11.12 | 7.02 | 4 | 2 | .65 | 4 | .62 | 4 | 2.61 | 4 | ||||||||||||||||||||||||||||
| 122 | American Funds Tax-Exempt Funds |
| Income (loss) from investment operations1 | ||||||||||||||||||||||||||||||||||||||||||||
| Period ended | Net asset value, beginning of period | Net investment income | Net gains (losses) on securities (both realized and unrealized) | Total from investment operations | Dividends (from net investment income) | Net asset value, end of period | Total return2,3 | Net assets, end of period (in millions) | Ratio of expenses to average net assets before reimbursements | Ratio of expenses to average net assets after reimbursements3 | Ratio of net income to average net assets3 | |||||||||||||||||||||||||||||||||
| Class F-2: | ||||||||||||||||||||||||||||||||||||||||||||
| 7/31/2020 | $ | 11.02 | $ | .29 | $ | .07 | $ | .36 | $ | (.28 | ) | $ | 11.10 | 3.36 | % | $ | 27 | .49 | % | .45 | % | 2.60 | % | |||||||||||||||||||||
| 7/31/2019 | 10.61 | .29 | .41 | .70 | (.29 | ) | 11.02 | 6.74 | 29 | .51 | .51 | 2.75 | ||||||||||||||||||||||||||||||||
| 7/31/2018 | 10.80 | .29 | (.19 | ) | .10 | (.29 | ) | 10.61 | .89 | 16 | .59 | .54 | 2.67 | |||||||||||||||||||||||||||||||
| 7/31/2017 | 11.12 | .29 | (.32 | ) | (.03 | ) | (.29 | ) | 10.80 | (.26 | ) | 11 | .58 | .56 | 2.68 | |||||||||||||||||||||||||||||
| 7/31/2016 | 10.66 | .30 | .45 | .75 | (.29 | ) | 11.12 | 7.10 | 31 | .58 | .55 | 2.68 | ||||||||||||||||||||||||||||||||
| Class F-3: | ||||||||||||||||||||||||||||||||||||||||||||
| 7/31/2020 | 11.02 | .31 | .07 | .38 | (.30 | ) | 11.10 | 3.46 | 33 | .39 | .35 | 2.71 | ||||||||||||||||||||||||||||||||
| 7/31/2019 | 10.61 | .30 | .41 | .71 | (.30 | ) | 11.02 | 6.83 | 32 | .42 | .42 | 2.84 | ||||||||||||||||||||||||||||||||
| 7/31/2018 | 10.80 | .30 | (.19 | ) | .11 | (.30 | ) | 10.61 | 1.00 | 26 | .48 | .44 | 2.78 | |||||||||||||||||||||||||||||||
| 7/31/20177,10 | 10.58 | .15 | .22 | .37 | (.15 | ) | 10.80 | 3.54 | 9 | 16 | .58 | 11 | .45 | 11 | 2.79 | 11 | ||||||||||||||||||||||||||||
| Year ended July 31, | ||||||||||
| 2020 | 2019 | 2018 | 2017 | 2016 | ||||||
| Portfolio turnover rate for all share classes | 27% | 16% | 21% | 27% | 14% | |||||
| 1 | Based on average shares outstanding. |
| 2 | Total returns exclude any applicable sales charges, including contingent deferred sales charges. |
| 3 | This column reflects the impact, if any, of certain reimbursements from CRMC. During the periods shown, CRMC reimbursed a portion of miscellaneous fees and expenses. |
| 4 | All or a significant portion of assets in this class consisted of seed capital invested by CRMC and/or its affiliates. Fees for distribution services are not charged or accrued on these seed capital assets. If such fees were paid by the fund on seed capital assets, fund expenses would have been higher and net income and total return would have been lower. |
| 5 | Amount less than $.01. |
| 6 | Amount less than $1 million. |
| 7 | Based on operations for a period that is less than a full year. |
| 8 | Class T shares began investment operations on April 7, 2017. |
| 9 | Not annualized. |
| 10 | Class F-3 shares began investment operations on January 27, 2017. |
| 11 | Annualized. |
See notes to financial statements.
| American Funds Tax-Exempt Funds | 123 |
Report of Independent Registered Public Accounting Firm
To the Board of Trustees and Shareholders of American Funds Short-Term Tax-Exempt Bond Fund, Limited Term Tax-Exempt Bond Fund of America, The Tax-Exempt Bond Fund of America, American High-Income Municipal Bond Fund and American Funds Tax-Exempt Fund of New York and to the Board of Trustees of The American Funds Tax-Exempt Series II and Shareholders of The Tax-Exempt Fund of California
Opinions on the Financial Statements
We have audited the accompanying statements of assets and liabilities, including the summary investment portfolios, of American Funds Short-Term Tax-Exempt Bond Fund, Limited Term Tax-Exempt Bond Fund of America, The Tax-Exempt Bond Fund of America, American High-Income Municipal Bond Fund, The Tax-Exempt Fund of California (the sole fund constituting The American Funds Tax-Exempt Series II) and American Funds Tax-Exempt Fund of New York (hereafter collectively referred to as the “Funds”) as of July 31, 2020, the related statements of operations for the year ended July 31, 2020, the statements of changes in net assets for each of the two years in the period ended July 31, 2020, including the related notes, and the financial highlights for each of the periods indicated therein (collectively referred to as the “financial statements”). In our opinion, the financial statements present fairly, in all material respects, the financial position of each of the Funds as of July 31, 2020, the results of each of their operations for the year then ended, the changes in each of their net assets for each of the two years in the period ended July 31, 2020 and each of the financial highlights for each of the periods indicated therein in conformity with accounting principles generally accepted in the United States of America.
Basis for Opinions
These financial statements are the responsibility of the Funds’ management. Our responsibility is to express an opinion on the Funds’ financial statements based on our audits. We are a public accounting firm registered with the Public Company Accounting Oversight Board (United States) (PCAOB) and are required to be independent with respect to the Funds in accordance with the U.S. federal securities laws and the applicable rules and regulations of the Securities and Exchange Commission and the PCAOB.
We conducted our audits of these financial statements in accordance with the standards of the PCAOB. Those standards require that we plan and perform the audit to obtain reasonable assurance about whether the financial statements are free of material misstatement, whether due to error or fraud.
Our audits included performing procedures to assess the risks of material misstatement of the financial statements, whether due to error or fraud, and performing procedures that respond to those risks. Such procedures included examining, on a test basis, evidence regarding the amounts and disclosures in the financial statements. Our audits also included evaluating the accounting principles used and significant estimates made by management, as well as evaluating the overall presentation of the financial statements. Our procedures included confirmation of securities owned as of July 31, 2020 by correspondence with the custodians and brokers; when replies were not received from brokers, we performed other auditing procedures. We believe that our audits provide a reasonable basis for our opinions.
/s/ PricewaterhouseCoopers LLP
Los Angeles, California
September 14, 2020
We have served as the auditor of one or more investment companies in The Capital Group Companies Investment Company Complex since 1934.
| 124 | American Funds Tax-Exempt Funds |
| Expense example | unaudited |
As a fund shareholder, you incur two types of costs: (1) transaction costs, such as initial sales charges on purchase payments and contingent deferred sales charges on redemptions (loads), and (2) ongoing costs, including management fees, distribution and service (12b-1) fees, and other expenses. This example is intended to help you understand your ongoing costs (in dollars) of investing in the fund so you can compare these costs with the ongoing costs of investing in other mutual funds. The example is based on an investment of $1,000 invested at the beginning of the period and held for the entire six-month period (February 1, 2020, through July 31, 2020).
Actual expenses:
The first line of each share class in the tables on the following pages provides information about actual account values and actual expenses. You may use the information in this line, together with the amount you invested, to estimate the expenses that you paid over the period. Simply divide your account value by $1,000 (for example, an $8,600 account value divided by $1,000 = 8.6), then multiply the result by the number in the first line under the heading titled “Expenses paid during period” to estimate the expenses you paid on your account during this period.
Hypothetical example for comparison purposes:
The second line of each share class in the tables on the following pages provides information about hypothetical account values and hypothetical expenses based on the actual expense ratio for the share class and an assumed rate of return of 5.00% per year before expenses, which is not the actual return of the share class. The hypothetical account values and expenses may not be used to estimate the actual ending account balance or expenses you paid for the period. You may use this information to compare the ongoing costs of investing in the fund and other funds. To do so, compare this 5.00% hypothetical example with the 5.00% hypothetical examples that appear in the shareholder reports of the other funds.
Notes:
Class F-1, F-2 and F-3 shareholders may be subject to fees charged by financial intermediaries, typically ranging from 0.75% to 1.50% of assets annually depending on services offered. You can estimate the impact of these fees by adding the amount of the fees to the total estimated expenses you paid on your account during the period as calculated above. In addition, your ending account value would be lower by the amount of these fees.
Note that the expenses shown in the tables on the following pages are meant to highlight your ongoing costs only and do not reflect any transactional costs, such as sales charges (loads). Therefore, the second line of each share class in the tables is useful in comparing ongoing costs only and will not help you determine the relative total costs of owning different funds. In addition, if these transactional costs were included, your costs would have been higher.
| American Funds Tax-Exempt Funds | 125 |
American Funds Short-Term Tax-Exempt Bond Fund
| Beginning account value 2/1/2020 | Ending account value 7/31/2020 | Expenses paid during period* | Annualized expense ratio | |||||||||||||
| Class A – actual return | $ | 1,000.00 | $ | 1,019.53 | $ | 2.91 | .58 | % | ||||||||
| Class A – assumed 5% return | 1,000.00 | 1,021.98 | 2.92 | .58 | ||||||||||||
| Class T – actual return | 1,000.00 | 1,020.28 | 2.16 | .43 | ||||||||||||
| Class T – assumed 5% return | 1,000.00 | 1,022.73 | 2.16 | .43 | ||||||||||||
| Class F-1 – actual return | 1,000.00 | 1,018.61 | 3.81 | .76 | ||||||||||||
| Class F-1 – assumed 5% return | 1,000.00 | 1,021.08 | 3.82 | .76 | ||||||||||||
| Class F-2 – actual return | 1,000.00 | 1,020.16 | 2.31 | .46 | ||||||||||||
| Class F-2 – assumed 5% return | 1,000.00 | 1,022.58 | 2.31 | .46 | ||||||||||||
| Class F-3 – actual return | 1,000.00 | 1,020.47 | 2.01 | .40 | ||||||||||||
| Class F-3 – assumed 5% return | 1,000.00 | 1,022.87 | 2.01 | .40 | ||||||||||||
| Class R-6 – actual return | 1,000.00 | 1,020.47 | 1.96 | .39 | ||||||||||||
| Class R-6 – assumed 5% return | 1,000.00 | 1,022.92 | 1.96 | .39 | ||||||||||||
Limited Term Tax-Exempt Bond Fund of America
| Beginning account value 2/1/2020 | Ending account value 7/31/2020 | Expenses paid during period* | Annualized expense ratio | |||||||||||||
| Class A – actual return | $ | 1,000.00 | $ | 1,020.04 | $ | 2.96 | .59 | % | ||||||||
| Class A – assumed 5% return | 1,000.00 | 1,021.93 | 2.97 | .59 | ||||||||||||
| Class C – actual return | 1,000.00 | 1,016.50 | 6.47 | 1.29 | ||||||||||||
| Class C – assumed 5% return | 1,000.00 | 1,018.45 | 6.47 | 1.29 | ||||||||||||
| Class T – actual return | 1,000.00 | 1,021.50 | 1.46 | .29 | ||||||||||||
| Class T – assumed 5% return | 1,000.00 | 1,023.42 | 1.46 | .29 | ||||||||||||
| Class F-1 – actual return | 1,000.00 | 1,019.93 | 3.06 | .61 | ||||||||||||
| Class F-1 – assumed 5% return | 1,000.00 | 1,021.83 | 3.07 | .61 | ||||||||||||
| Class F-2 – actual return | 1,000.00 | 1,021.27 | 1.76 | .35 | ||||||||||||
| Class F-2 – assumed 5% return | 1,000.00 | 1,023.12 | 1.76 | .35 | ||||||||||||
| Class F-3 – actual return | 1,000.00 | 1,021.76 | 1.31 | .26 | ||||||||||||
| Class F-3 – assumed 5% return | 1,000.00 | 1,023.57 | 1.31 | .26 | ||||||||||||
| Class R-6 – actual return | 1,000.00 | 1,021.76 | 1.31 | .26 | ||||||||||||
| Class R-6 – assumed 5% return | 1,000.00 | 1,023.57 | 1.31 | .26 | ||||||||||||
The Tax-Exempt Bond Fund of America
| Beginning account value 2/1/2020 | Ending account value 7/31/2020 | Expenses paid during period* | Annualized expense ratio | |||||||||||||
| Class A – actual return | $ | 1,000.00 | $ | 1,012.74 | $ | 2.55 | .51 | % | ||||||||
| Class A – assumed 5% return | 1,000.00 | 1,022.33 | 2.56 | .51 | ||||||||||||
| Class C – actual return | 1,000.00 | 1,008.97 | 6.29 | 1.26 | ||||||||||||
| Class C – assumed 5% return | 1,000.00 | 1,018.60 | 6.32 | 1.26 | ||||||||||||
| Class T – actual return | 1,000.00 | 1,013.96 | 1.30 | .26 | ||||||||||||
| Class T – assumed 5% return | 1,000.00 | 1,023.57 | 1.31 | .26 | ||||||||||||
| Class F-1 – actual return | 1,000.00 | 1,012.32 | 3.00 | .60 | ||||||||||||
| Class F-1 – assumed 5% return | 1,000.00 | 1,021.88 | 3.02 | .60 | ||||||||||||
| Class F-2 – actual return | 1,000.00 | 1,013.63 | 1.70 | .34 | ||||||||||||
| Class F-2 – assumed 5% return | 1,000.00 | 1,023.17 | 1.71 | .34 | ||||||||||||
| Class F-3 – actual return | 1,000.00 | 1,014.16 | 1.15 | .23 | ||||||||||||
| Class F-3 – assumed 5% return | 1,000.00 | 1,023.72 | 1.16 | .23 | ||||||||||||
| Class R-6 – actual return | 1,000.00 | 1,014.17 | 1.15 | .23 | ||||||||||||
| Class R-6 – assumed 5% return | 1,000.00 | 1,023.72 | 1.16 | .23 | ||||||||||||
| 126 | American Funds Tax-Exempt Funds |
American High-Income Municipal Bond Fund
| Beginning account value 2/1/2020 | Ending account value 7/31/2020 | Expenses paid during period* | Annualized expense ratio | |||||||||||||
| Class A – actual return | $ | 1,000.00 | $ | 988.15 | $ | 3.31 | .67 | % | ||||||||
| Class A – assumed 5% return | 1,000.00 | 1,021.53 | 3.37 | .67 | ||||||||||||
| Class C – actual return | 1,000.00 | 984.72 | 6.76 | 1.37 | ||||||||||||
| Class C – assumed 5% return | 1,000.00 | 1,018.05 | 6.87 | 1.37 | ||||||||||||
| Class T – actual return | 1,000.00 | 989.64 | 1.83 | .37 | ||||||||||||
| Class T – assumed 5% return | 1,000.00 | 1,023.02 | 1.86 | .37 | ||||||||||||
| Class F-1 – actual return | 1,000.00 | 988.02 | 3.46 | .70 | ||||||||||||
| Class F-1 – assumed 5% return | 1,000.00 | 1,021.38 | 3.52 | .70 | ||||||||||||
| Class F-2 – actual return | 1,000.00 | 989.33 | 2.13 | .43 | ||||||||||||
| Class F-2 – assumed 5% return | 1,000.00 | 1,022.73 | 2.16 | .43 | ||||||||||||
| Class F-3 – actual return | 1,000.00 | 989.84 | 1.58 | .32 | ||||||||||||
| Class F-3 – assumed 5% return | 1,000.00 | 1,023.27 | 1.61 | .32 | ||||||||||||
| Class R-6 – actual return | 1,000.00 | 989.87 | 1.58 | .32 | ||||||||||||
| Class R-6 – assumed 5% return | 1,000.00 | 1,023.27 | 1.61 | .32 | ||||||||||||
The Tax-Exempt Fund of California
| Beginning account value 2/1/2020 | Ending account value 7/31/2020 | Expenses paid during period* | Annualized expense ratio | |||||||||||||
| Class A – actual return | $ | 1,000.00 | $ | 1,009.57 | $ | 2.90 | .58 | % | ||||||||
| Class A – assumed 5% return | 1,000.00 | 1,021.98 | 2.92 | .58 | ||||||||||||
| Class C – actual return | 1,000.00 | 1,005.84 | 6.63 | 1.33 | ||||||||||||
| Class C – assumed 5% return | 1,000.00 | 1,018.25 | 6.67 | 1.33 | ||||||||||||
| Class T – actual return | 1,000.00 | 1,010.72 | 1.70 | .34 | ||||||||||||
| Class T – assumed 5% return | 1,000.00 | 1,023.17 | 1.71 | .34 | ||||||||||||
| Class F-1 – actual return | 1,000.00 | 1,009.11 | 3.35 | .67 | ||||||||||||
| Class F-1 – assumed 5% return | 1,000.00 | 1,021.53 | 3.37 | .67 | ||||||||||||
| Class F-2 – actual return | 1,000.00 | 1,010.47 | 2.00 | .40 | ||||||||||||
| Class F-2 – assumed 5% return | 1,000.00 | 1,022.87 | 2.01 | .40 | ||||||||||||
| Class F-3 – actual return | 1,000.00 | 1,010.92 | 1.55 | .31 | ||||||||||||
| Class F-3 – assumed 5% return | 1,000.00 | 1,023.32 | 1.56 | .31 | ||||||||||||
American Funds Tax-Exempt Fund of New York
| Beginning account value 2/1/2020 | Ending account value 7/31/2020 | Expenses paid during period* | Annualized expense ratio | |||||||||||||
| Class A – actual return | $ | 1,000.00 | $ | 1,001.23 | $ | 3.04 | .61 | % | ||||||||
| Class A – assumed 5% return | 1,000.00 | 1,021.83 | 3.07 | .61 | ||||||||||||
| Class C – actual return | 1,000.00 | 997.50 | 6.75 | 1.36 | ||||||||||||
| Class C – assumed 5% return | 1,000.00 | 1,018.10 | 6.82 | 1.36 | ||||||||||||
| Class T – actual return | 1,000.00 | 1,002.44 | 1.84 | .37 | ||||||||||||
| Class T – assumed 5% return | 1,000.00 | 1,023.02 | 1.86 | .37 | ||||||||||||
| Class F-1 – actual return | 1,000.00 | 1,001.12 | 3.13 | .63 | ||||||||||||
| Class F-1 – assumed 5% return | 1,000.00 | 1,021.73 | 3.17 | .63 | ||||||||||||
| Class F-2 – actual return | 1,000.00 | 1,002.06 | 2.19 | .44 | ||||||||||||
| Class F-2 – assumed 5% return | 1,000.00 | 1,022.68 | 2.21 | .44 | ||||||||||||
| Class F-3 – actual return | 1,000.00 | 1,002.60 | 1.64 | .33 | ||||||||||||
| Class F-3 – assumed 5% return | 1,000.00 | 1,023.22 | 1.66 | .33 | ||||||||||||
| * | The “expenses paid during period” are equal to the “annualized expense ratio,” multiplied by the average account value over the period, multiplied by the number of days in the period, and divided by 366 (to reflect the one-half year period). |
| American Funds Tax-Exempt Funds | 127 |
| Tax information | unaudited |
We are required to advise you of the federal tax status of certain distributions received by shareholders during the fiscal year. The funds hereby designate the following amounts for the funds’ fiscal year ended July 31, 2020 (dollars in thousands):
| Fund | Long-term capital gain distributions | Exempt interest dividends | ||||||
| American Funds Short-Term Tax-Exempt Bond Fund | — | $ | 16,095 | |||||
| Limited Term Tax-Exempt Bond Fund of America | $ | 5,628 | 77,615 | |||||
| The Tax-Exempt Bond Fund of America | — | 600,402 | ||||||
| American High-Income Municipal Bond Fund | 7,131 | 100.00 | % | |||||
| The Tax-Exempt Fund of California | 12,324 | $ | 67,658 | |||||
| American Funds Tax-Exempt Fund of New York | — | 7,018 | ||||||
Individual shareholders should refer to their Form 1099 or other tax information, which will be mailed in January 2021, to determine the calendar year amounts to be included on their 2020 tax returns. Shareholders should consult their tax advisors.
| 128 | American Funds Tax-Exempt Funds |
Approval of Investment Advisory and Service Agreement
American Funds Short-Term Tax-Exempt Bond Fund, Limited Term Tax-Exempt Bond Fund of America, The Tax-Exempt Bond Fund of America, American High-Income Municipal Bond Fund, The Tax-Exempt Fund of California, American Funds Tax-Exempt Fund of New York
The boards of American Funds Short-Term Tax-Exempt Bond Fund, Limited Term Tax-Exempt Bond Fund of America, The Tax-Exempt Bond Fund of America, American High-Income Municipal Bond Fund, The Tax-Exempt Fund of California and American Funds Tax-Exempt Fund of New York (the “board”) have approved the continuation of each fund’s Investment Advisory and Service Agreement (the “agreement”) with Capital Research and Management Company (“CRMC”) for an additional one-year term through April 30, 2021. The agreement for American Funds Short-Term Tax-Exempt Bond Fund was amended to add an additional advisory fee breakpoint if and when the fund’s net assets exceed $1.5 billion, the agreement for The Tax-Exempt Bond Fund of America was amended to add an additional advisory fee breakpoint if and when the fund’s net assets exceed $28 billion, the agreement for American High-Income Municipal Bond Fund was amended to add an additional advisory fee breakpoint if and when the fund’s net assets exceed $10 billion, and the agreement for The Tax-Exempt Fund of California was amended to add an additional advisory fee breakpoint if and when the fund’s net assets exceed $3 billion. The board approved the agreement following the recommendation of each fund’s Contracts Committee (the “committee”), which is composed of all the fund’s independent board members. The board and the committee determined in the exercise of their business judgment that each fund’s advisory fee structure was fair and reasonable in relation to the services provided, and that approving the agreement was in the best interests of each fund and its shareholders.
In reaching this decision, the board and the committee took into account their interaction with CRMC as well as information furnished to them throughout the year and otherwise provided to them, as well as information prepared specifically in connection with their review of the agreement, and were advised by their independent counsel with respect to the matters considered. They considered the following factors, among others, but did not identify any single issue or particular piece of information that, in isolation, was the controlling factor, and each board and committee member did not necessarily attribute the same weight to each factor.
1. Nature, extent and quality of services
The board and the committee considered the depth and quality of CRMC’s investment management process, including its global research capabilities; the experience, capability and integrity of its senior management and other personnel; the low turnover rates of its key personnel; the overall financial strength and stability of CRMC and the Capital Group organization; the resources and systems CRMC devotes to investment management (the manner in which each fund’s assets are managed, including liquidity management), financial, investment operations, compliance, trading, proxy voting, shareholder communications, and other services; and the ongoing evolution of CRMC’s organizational structure designed to maintain and strengthen these qualities. The board and the committee also considered the nature, extent and quality of administrative and shareholder services provided by CRMC to each fund under the agreement and other agreements, as well as the benefits to fund shareholders from investing in a fund that is part of a large family of funds. The board considered the risks
| American Funds Tax-Exempt Funds | 129 |
assumed by CRMC in providing services to each fund, including operational, business, financial, reputational, regulatory and litigation risks. The board and the committee concluded that the nature, extent and quality of the services provided by CRMC have benefited and should continue to benefit each fund and its shareholders.
2. Investment results
The board and the committee considered the investment results of each fund in light of its objective. They compared each fund’s investment results with those of other funds (including funds that currently form the basis of the Lipper index for the category in which each fund is included), and data such as relevant market and fund indexes over various periods (including each fund’s lifetime) through September 30, 2019. They generally placed greater emphasis on longer term periods. On the basis of this evaluation and the board’s and the committee’s ongoing review of investment results, and considering the relative market conditions during certain of the reporting periods, the board and the committee concluded that each fund’s investment results have been satisfactory for renewal of the agreement, and that CRMC’s record in managing each fund indicated that its continued management should benefit each fund and its shareholders.
3. Advisory fees and total expenses
The board and the committee compared the advisory fees and total expense levels of each fund to those of other relevant funds. They observed that each fund’s advisory fees and expenses are competitive with those of other similar funds included in the comparable Lipper category. The board and the committee also considered the breakpoint discounts in each fund’s advisory fee structure that reduce the level of fees charged by CRMC to each fund as fund assets increase. In addition, they reviewed information regarding the effective advisory fees charged to non-mutual fund clients by CRMC and its affiliates. They noted that, to the extent there were differences between the advisory fees paid by each fund and the advisory fees paid by those clients, the differences appropriately reflected the investment, operational, regulatory and market differences between advising each fund and the other clients. The board and the committee concluded that each fund’s cost structure was fair and reasonable in relation to the services provided, as well as the risks assumed by the adviser, and that each fund’s shareholders receive reasonable value in return for the advisory fees and other amounts paid to CRMC by each fund.
4. Ancillary benefits
The board and the committee considered a variety of other benefits that CRMC and its affiliates receive as a result of CRMC’s relationship with each fund and other American Funds, including fees for administrative services provided to certain share classes; fees paid to CRMC’s affiliated transfer agent; sales charges and distribution fees received and retained by each fund’s principal underwriter, an affiliate of CRMC; and possible ancillary benefits to CRMC and its institutional management affiliates in managing other investment vehicles. The board and the committee reviewed CRMC’s portfolio trading practices, noting that through December 31, 2018, CRMC benefited from research obtained with commissions from portfolio transactions made on behalf of each fund, and since that time has undertaken to bear the cost of obtaining such research. The board and the committee took these ancillary benefits into account in evaluating the reasonableness of the advisory fees and other amounts paid to CRMC by each fund.
| 130 | American Funds Tax-Exempt Funds |
5. Adviser financial information
The board and the committee reviewed information regarding CRMC’s costs of providing services to the American Funds, including personnel, systems and resources of investment, compliance, trading, accounting and other administrative operations. They considered CRMC’s costs and related cost allocation methodology as well as its track record of investing in technology, infrastructure and staff to maintain and expand services and capabilities, respond to industry and regulatory developments, and attract and retain qualified personnel. They noted information regarding the compensation structure for CRMC’s investment professionals. They reviewed information on the profitability of the investment adviser and its affiliates. The board and the committee also compared CRMC’s profitability and compensation data to the reported results and data of several large, publicly held investment management companies. The board and the committee noted the competitiveness and cyclicality of both the mutual fund industry and the capital markets, and the importance in that environment of CRMC’s long-term profitability for maintaining its independence, company culture and management continuity. They further considered the breakpoint discounts in each fund’s advisory fee structure and CRMC’s sharing of potential economies of scale, or efficiencies, through breakpoints and other fee reductions and costs voluntarily absorbed. The board and the committee concluded that each fund’s advisory fee structure reflected a reasonable sharing of benefits between CRMC and each fund’s shareholders.
| American Funds Tax-Exempt Funds | 131 |
Boards of trustees and other officers
Independent trustees1
| Name and year of birth | Year first elected a trustee of the fund2 | Principal occupation(s) during past five years | Number of portfolios in fund complex overseen by trustee | Other directorships3 held by trustee | |||||
| William H. Baribault, 1945 | STEX | 2010 | Chairman of the Board and CEO, Oakwood Advisors (private investment and consulting); former CEO and President, Richard Nixon Foundation | 89 | General Finance Corporation | ||||
| LTEX | 2010 | ||||||||
| TEBF | 2010 | ||||||||
| AHIM | 2010 | ||||||||
| TEFCA | 2010 | ||||||||
| TEFNY | 2010 | ||||||||
| James G. Ellis, 1947 | STEX | 2009 | Professor of Marketing and former Dean, Marshall School of Business, University of Southern California | 98 | Mercury General Corporation | ||||
| LTEX | 2006 | ||||||||
| TEBF | 2006 | ||||||||
| AHIM | 2006 | ||||||||
| TEFCA | 2006 | ||||||||
| TEFNY | 2010 | ||||||||
| Nariman Farvardin, 1956 | STEX | 2018 | President, Stevens Institute of Technology | 86 | None | ||||
| LTEX | 2018 | ||||||||
| TEBF | 2018 | ||||||||
| AHIM | 2018 | ||||||||
| TEFCA | 2018 | ||||||||
| TEFNY | 2018 | ||||||||
| Mary Davis Holt, 1950 | STEX | Principal, Mary Davis Holt Enterprises, LLC (leadership development consulting); former Partner, Flynn Heath Holt Leadership, LLC (leadership consulting); former COO, Time Life Inc. (1993–2003) | 86 | None | |||||
| 2015–2016; 2017 | |||||||||
| LTEX | |||||||||
| 2015–2016; 2017 | |||||||||
| TEBF | |||||||||
| 2015–2016; 2017 | |||||||||
| AHIM | |||||||||
| 2015–2016; 2017 | |||||||||
| TEFCA | |||||||||
| 2015–2016; 2017 | |||||||||
| TEFNY | |||||||||
| 2015–2016; 2017 | |||||||||
| R. Clark Hooper, 1946 | STEX | 2005 | Private investor | 89 | None | ||||
| LTEX | 2005 | ||||||||
| TEBF | 2005 | ||||||||
| AHIM | 2005 | ||||||||
| TEFCA | 2005 | ||||||||
| TEFNY | 2010 | ||||||||
| Merit E. Janow, 1958 | STEX | 2010 | Dean and Professor, Columbia University, School of International and Public Affairs | 88 | Mastercard Incorporated; Trimble Inc. | ||||
| LTEX | 2010 | ||||||||
| TEBF | 2010 | ||||||||
| AHIM | 2010 | ||||||||
| TEFCA | 2010 | ||||||||
| TEFNY | 2010 | ||||||||
| Margaret Spellings, 1957 Chairman of the Boards (Independent and Non-Executive) | STEX | 2009 | President and CEO, Texas 2036; former President, Margaret Spellings & Company (public policy and strategic consulting); former President, The University of North Carolina; former President, George W. Bush Foundation | 90 | None | ||||
| LTEX | 2010 | ||||||||
| TEBF | 2010 | ||||||||
| AHIM | 2010 | ||||||||
| TEFCA | 2010 | ||||||||
| TEFNY | 2010 | ||||||||
See page 135 for footnotes.
| 132 | American Funds Tax-Exempt Funds |
Independent trustees1 (continued)
| Name and year of birth | Year first elected a trustee of the fund2 | Principal occupation(s) during past five years | Number of portfolios in fund complex overseen by trustee | Other directorships3 held by trustee | |||||
| Alexandra Trower, 1964 | STEX | 2019 | Executive Vice President, Global Communications and Corporate Officer, The Estée Lauder Companies | 85 | None | ||||
| LTEX | 2019 | ||||||||
| TEBF | 2019 | ||||||||
| AHIM | 2018 | ||||||||
| TEFCA | 2019 | ||||||||
| TEFNY | 2018 | ||||||||
| Paul S. Williams, 1959 | STEX | 2020 | Former Partner/Managing Director, Major, Lindsey & Africa (executive recruiting firm) | 85 | Compass Minerals, Inc. (producer of salt and specialty fertilizers) | ||||
| LTEX | 2020 | ||||||||
| TEBF | 2020 | ||||||||
| AHIM | 2020 | ||||||||
| TEFCA | 2020 | ||||||||
| TEFNY | 2020 | ||||||||
Interested trustees4,5
| Name, year of birth and position with fund | Year first elected a trustee or officer of the fund2 | Principal occupation(s) during past five years and positions held with affiliated entities or the principal underwriter of the fund | Number of portfolios in fund complex overseen by trustee | Other directorships3 held by trustee | |||||
| Michael C. Gitlin, 1970 | STEX | 2015 | Vice Chairman and Director, Capital Research and Management Company; Partner — Capital Fixed Income Investors, Capital Research and Management Company; Director, The Capital Group Companies, Inc.;6 served as Head of Fixed Income at a large investment management firm prior to joining Capital Research and Management Company in 2015 | 85 | None | ||||
| LTEX | 2015 | ||||||||
| TEBF | 2015 | ||||||||
| AHIM | 2015 | ||||||||
| TEFCA | 2015 | ||||||||
| TEFNY | 2015 | ||||||||
| Karl J. Zeile, 1966 President: TEBF, TEFCA Senior Vice President: AHIM, TEFNY | STEX | 2011 | Partner — Capital Fixed Income Investors, Capital Research and Management Company | 20 | None | ||||
| LTEX | 2004 | ||||||||
| TEBF | 2009 | ||||||||
| AHIM | 2008 | ||||||||
| TEFCA | 2009 | ||||||||
| TEFNY | 2010 | ||||||||
The funds’ statement of additional information includes further details about fund trustees and is available without charge upon request by calling American Funds Service Company at (800) 421-4225 or by visiting the Capital Group website at capitalgroup.com. The address for all trustees and officers of the funds is 333 South Hope Street, Los Angeles, CA 90071, Attention: Secretary.
| STEX | American Funds Short-Term Tax-Exempt Bond Fund |
| LTEX | Limited Term Tax-Exempt Bond Fund of America |
| TEBF | The Tax-Exempt Bond Fund of America |
| AHIM | American High-Income Municipal Bond Fund |
| TEFCA | The Tax-Exempt Fund of California |
| TEFNY | American Funds Tax-Exempt Fund of New York |
| American Funds Tax-Exempt Funds | 133 |
Other officers5
| Name, year of birth and position with fund | Year first elected an officer of the fund2 | Principal occupation(s) during past five years and positions held with affiliated entities or the principal underwriter of the fund | |||
| Aaron Applebaum, 1979 President: STEX Senior Vice President: LTEX | STEX LTEX | 2016 2016 | Partner — Capital Fixed Income Investors, Capital Research and Management Company | ||
| Mark Marinella, 1958 President: LTEX Senior Vice President: STEX, TEFCA | STEX LTEX TEFCA | 2019 2019 2019 | Partner — Capital Fixed Income Investors, Capital Research and Management Company | ||
| Chad M. Rach, 1972 President: AHIM Senior Vice President: TEBF | AHIM TEBF | 2015 2016 | Partner — Capital Fixed Income Investors, Capital Research and Management Company; Director, Capital Research and Management Company | ||
| Jerome Solomon, 1963 President: TEFNY Senior Vice President: AHIM | TEFNY AHIM | 2011 2017 | Partner — Capital Fixed Income Investors, Capital Research and Management Company | ||
| Kristine M. Nishiyama, 1970 Executive Vice President | STEX LTEX TEBF AHIM TEFCA TEFNY | 2003 2003 2003 2003 2003 2010 | Senior Vice President and Senior Counsel — Fund Business Management Group, Capital Research and Management Company; Chair, Senior Vice President, General Counsel and Director, Capital Bank and Trust Company6 | ||
| Steven I. Koszalka, 1964 Secretary | STEX LTEX TEBF AHIM TEFCA TEFNY | 2010 2010 2010 2010 2010 2010 | Vice President — Fund Business Management Group, Capital Research and Management Company | ||
| Brian C. Janssen, 1972 Treasurer | STEX LTEX TEBF AHIM TEFCA TEFNY | 2015 2015 2012 2015 2012 2012 | Vice President — Investment Operations, Capital Research and Management Company | ||
| Jane Y. Chung, 1974 Assistant Secretary | STEX LTEX TEBF AHIM TEFCA TEFNY | 2014 2014 2014 2014 2014 2014 | Associate — Fund Business Management Group, Capital Research and Management Company | ||
| Sandra Chuon, 1972 Assistant Treasurer | STEX LTEX TEBF AHIM TEFCA TEFNY | 2019 2019 2019 2019 2019 2019 | Assistant Vice President — Investment Operations, Capital Research and Management Company | ||
| Gregory F. Niland, 1971 Assistant Treasurer | STEX LTEX TEBF AHIM TEFCA TEFNY | 2015 2015 2015 2015 2015 2015 | Vice President — Investment Operations, Capital Research and Management Company | ||
See page 135 for footnotes.
| 134 | American Funds Tax-Exempt Funds |
| 1 | The term independent trustee refers to a trustee who is not an “interested person” of the funds within the meaning of the Investment Company Act of 1940. |
| 2 | Includes service as a director/trustee or officer of the fund’s predecessor, The Tax-Exempt Bond Fund of America, Inc. or American High-Income Municipal Bond Fund, Inc., each a Maryland corporation, or Limited Term Tax-Exempt Bond Fund of America or The Tax-Exempt Fund of California, each a Massachusetts business trust. Trustees and officers of the funds serve until their resignation, removal or retirement. |
| 3 | This includes all directorships/trusteeships (other than those in the American Funds or other funds managed by Capital Research and Management Company or its affiliates) that are held by each trustee as a trustee or director of a public company or a registered investment company. |
| 4 | The term interested trustee refers to a trustee who is an “interested person” within the meaning of the Investment Company Act of 1940, on the basis of their current or former affiliation with the funds’ investment adviser, Capital Research and Management Company, or affiliated entities (including the funds’ principal underwriter). |
| 5 | All of the trustees and/or officers listed are officers and/or directors/trustees of one or more of the other funds for which Capital Research and Management Company serves as investment adviser. |
| 6 | Company affiliated with Capital Research and Management Company. |
| American Funds Tax-Exempt Funds | 135 |
This page was intentionally left blank.
| 136 | American Funds Tax-Exempt Funds |
This page was intentionally left blank.
| American Funds Tax-Exempt Funds | 137 |
This page was intentionally left blank.
| 138 | American Funds Tax-Exempt Funds |
This page was intentionally left blank.
| American Funds Tax-Exempt Funds | 139 |
Offices of the funds
STEX, LTEX, TEBF, AHIM, TEFCA
333 South Hope Street
Los Angeles, CA 90071-1406
TEFNY
6455 Irvine Center Drive
Irvine, CA 92618-4518
Investment adviser
Capital Research and Management Company
333 South Hope Street
Los Angeles, CA 90071-1406
Transfer agent for shareholder accounts
American Funds Service Company
(Write to the address near you.)
P.O. Box 6007
Indianapolis, IN 46206-6007
P.O. Box 2280
Norfolk, VA 23501-2280
Counsel
Morgan, Lewis & Bockius LLP
One Federal Street
Boston, MA 02110-1726
Custodians of assets
STEX, LTEX, TEBF, AHIM, TEFCA
JPMorgan Chase Bank
270 Park Avenue
New York, NY 10017-2070
TEFNY
Bank of New York Mellon
240 Greenwich Street
New York, NY 10286
Independent registered public accounting firm
PricewaterhouseCoopers LLP
601 South Figueroa Street
Los Angeles, CA 90017-3874
Principal underwriter
American Funds Distributors, Inc.
333 South Hope Street
Los Angeles, CA 90071-1406
| 140 | American Funds Tax-Exempt Funds |
Investors should carefully consider investment objectives, risks, charges and expenses. This and other important information is contained in the funds’ prospectus and summary prospectuses, which can be obtained from your financial professional and should be read carefully before investing. You may also call American Funds Service Company (AFS) at (800) 421-4225 or visit the Capital Group website at capitalgroup.com.
“American Funds Proxy Voting Procedures and Principles” — which describes how we vote proxies relating to portfolio securities — is available on our website or upon request by calling AFS. Each fund files its proxy voting record with the U.S. Securities and Exchange Commission (SEC) for the 12 months ended June 30 by August 31. The proxy voting record is available free of charge on the SEC website at sec.gov and on our website.
Complete July 31, 2020, portfolios of American Funds Short-Term Tax-Exempt Bond Fund, Limited Term Tax-Exempt Bond Fund of America, The Tax-Exempt Bond Fund of America, American High-Income Municipal Bond Fund, The Tax-Exempt Fund of California and American Funds Tax-Exempt Fund of New York’s investments are available free of charge by calling AFS or visiting the SEC website (where they are part of Form N-CSR).
Each fund files a complete list of its portfolio holdings with the SEC for the first and third quarters of each fiscal year on Form NPORT-P. This filing is available free of charge on the SEC website. Additionally, the list of portfolio holdings is available by calling AFS.
This report is for the information of shareholders of American Funds Short-Term Tax-Exempt Bond Fund, Limited Term Tax-Exempt Bond Fund of America, The Tax-Exempt Bond Fund of America, American High-Income Municipal Bond Fund, The Tax-Exempt Fund of California and American Funds Tax-Exempt Fund of New York, but it also may be used as sales literature when preceded or accompanied by the current prospectus or summary prospectus, which gives details about charges, expenses, investment objectives and operating policies of the funds. If used as sales material after September 30, 2020, this report must be accompanied by an American Funds statistical update for the most recently completed calendar quarter.
Bloomberg® is a trademark of Bloomberg Finance L.P. (collectively with its affiliates, “Bloomberg”). Barclays® is a trademark of Barclays Bank Plc (collectively with its affiliates, “Barclays”), used under license. Neither Bloomberg nor Barclays approves or endorses this material, guarantees the accuracy or completeness of any information herein and, to the maximum extent allowed by law, neither shall have any liability or responsibility for injury or damages arising in connection therewith. The Standard & Poor’s 500 Composite Index (“Index”) is a product of S&P Dow Jones Indices LLC and/or its affiliates and has been licensed for use by Capital Group. Copyright © 2020 S&P Dow Jones Indices LLC, and/or its affiliates. All rights reserved. Redistribution or reproduction in whole or in part are prohibited without written permission of S&P Dow Jones Indices LLC.
American Funds Distributors, Inc., member FINRA.
The Capital Advantage®
Since 1931, Capital Group, home of American Funds, has helped investors pursue long-term investment success. Our consistent approach — in combination with The Capital SystemSM — has resulted in superior outcomes.
Aligned with investor success
We base our decisions on a long-term perspective, which we believe aligns our goals with the interests of our clients. Our portfolio managers average 28 years of investment industry experience, including 22 years at our company, reflecting a career commitment to our long-term approach.1
The Capital System
The Capital System combines individual accountability with teamwork. Funds using The Capital System are divided into portions that are managed independently by investment professionals with diverse backgrounds, ages and investment approaches. An extensive global research effort is the backbone of our system.
American Funds’ superior outcomes
Equity funds have beaten their Lipper peer indexes in 92% of 10-year periods and 99% of 20-year periods.2 Fixed income funds have helped investors achieve diversification through attention to correlation between bonds and equities.3 Fund management fees have been among the lowest in the industry.4
| 1 | Investment industry experience as of December 31, 2019. | |
| 2 | Based on Class F-2 share results for rolling periods through December 31, 2019. Periods covered are the shorter of the fund’s lifetime or since the comparable Lipper index inception date (except Capital Income Builder and SMALLCAP World Fund, for which the Lipper average was used). Expenses differ for each share class, so results will vary. | |
| 3 | Based on Class F-2 share results as of December 31, 2019. Fifteen of the 17 fixed income American Funds that have been in existence for the three-year period showed a three-year correlation below 0.2. Standard & Poor’s 500 Composite Index was used as an equity market proxy. Correlation based on monthly total returns. Correlation is a statistical measure of how two securities move in relation to each other. A correlation ranges from –1 to 1. A positive correlation close to 1 implies that as one security moves, either up or down, the other security will move in “lockstep,” in the same direction. A negative correlation close to –1 indicates that the securities have moved in the opposite direction. | |
| 4 | On average, our management fees were in the lowest quintile 65% of the time, based on the 20-year period ended December 31, 2019, versus comparable Lipper categories, excluding funds of funds. | |
| Class F-2 shares were first offered on August 1, 2008. Class F-2 share results prior to the date of first sale are hypothetical based on the results of the original share class of the fund without a sales charge, adjusted for typical estimated expenses. Results for certain funds with an inception date after August 1, 2008, also include hypothetical returns because those funds’ Class F-2 shares sold after the funds’ date of first offering. Please see capitalgroup.com for more information on specific expense adjustments and the actual dates of first sale. | ||
All Capital Group trademarks mentioned are owned by The Capital Group Companies, Inc., an affiliated company or fund. All other company and product names mentioned are the property of their respective companies.
![]()
ITEM 2 – Code of Ethics
The Registrant has adopted a Code of Ethics that applies to its Principal Executive Officer and Principal Financial Officer. The Registrant undertakes to provide to any person without charge, upon request, a copy of the Code of Ethics. Such request can be made by calling 800/421-4225 or to the Secretary of the Registrant, 333 South Hope Street, Los Angeles, California 90071.
ITEM 3 – Audit Committee Financial Expert
The Registrant’s board has determined that James G. Ellis, a member of the Registrant’s audit committee, is an “audit committee financial expert” and "independent," as such terms are defined in this Item. This designation will not increase the designee’s duties, obligations or liability as compared to his or her duties, obligations and liability as a member of the audit committee and of the board, nor will it reduce the responsibility of the other audit committee members. There may be other individuals who, through education or experience, would qualify as "audit committee financial experts" if the board had designated them as such. Most importantly, the board believes each member of the audit committee contributes significantly to the effective oversight of the Registrant’s financial statements and condition.
ITEM 4 – Principal Accountant Fees and Services
| AHIM | ||
| Registrant: | ||
| a) Audit Fees: | ||
| Audit | 2019 | 8,000 |
| 2020 | 60,000 | |
| b) Audit-Related Fees: | ||
| 2019 | None | |
| 2020 | None | |
| c) Tax Fees: | ||
| 2019 | 8,000 | |
| 2020 | 8,000 | |
| The tax fees consist of professional services relating to the preparation of the Registrant’s tax returns. | ||
| d) All Other Fees: | ||
| 2019 | None | |
| 2020 | None | |
| Adviser and affiliates (includes only fees for non-audit services billed to the adviser and affiliates for engagements that relate directly to the operations and financial reporting of the Registrant and were subject to the pre-approval policies described below): | ||
| a) Audit Fees: | ||
| Not Applicable | ||
| b) Audit-Related Fees: | ||
| 2019 | None | |
| 2020 | None | |
| The audit-related fees consist of assurance and related services relating to the examination of the Registrant’s transfer agent, principal underwriter and investment adviser conducted in accordance with Statement on Standards for Attestation Engagements Number 18 issued by the American Institute of Certified Public Accountants. | ||
| c) Tax Fees: | ||
| 2019 | None | |
| 2020 | 15,000 |
| The tax fees consist of consulting services relating to the Registrant’s investments. | ||
| d) All Other Fees: | ||
| 2019 | 2,000 | |
| 2020 | 12,000 | |
| The other fees consist of subscription services related to an accounting research tool. | ||
| All audit and permissible non-audit services that the Registrant’s audit committee considers compatible with maintaining the independent registered public accounting firm’s independence are required to be pre-approved by the committee. The pre-approval requirement will extend to all non-audit services provided to the Registrant, the investment adviser, and any entity controlling, controlled by, or under common control with the investment adviser that provides ongoing services to the Registrant, if the engagement relates directly to the operations and financial reporting of the Registrant. The committee will not delegate its responsibility to pre-approve these services to the investment adviser. The committee may delegate to one or more committee members the authority to review and pre-approve audit and permissible non-audit services. Actions taken under any such delegation will be reported to the full committee at its next meeting. The pre-approval requirement is waived with respect to non-audit services if certain conditions are met. The pre-approval requirement was not waived for any of the non-audit services listed above provided to the Registrant, adviser and affiliates. | ||
| Aggregate non-audit fees paid to the Registrant’s auditors, including fees for all services billed to the Registrant, adviser and affiliates that provide ongoing services to the Registrant, were $10,000 for fiscal year 2019 and $36,000 for fiscal year 2020. The non-audit services represented by these amounts were brought to the attention of the committee and considered to be compatible with maintaining the auditors’ independence. |
ITEM 5 – Audit Committee of Listed Registrants
Not applicable to this Registrant, insofar as the Registrant is not a listed issuer as defined in Rule 10A-3 under the Securities Exchange Act of 1934.
ITEM 6 – Schedule of Investments

American High-Income Municipal Bond Fund®
Investment portfolio
July 31, 2020
| Bonds, notes & other debt instruments 92.51% Alabama 0.84% | Principal amount (000) | Value (000) |
| City of Birmingham, Special Care Facs. Fncg. Auth., Rev. Bonds (Ascension Health Senior Credit Group), Series 2016-B, 5.00% 2046 | $500 | $589 |
| Black Belt Energy Gas Dist., Gas Supply Rev. Bonds, Series 2017-A, 4.00% 2047 (put 2022) | 5,000 | 5,297 |
| County of Houston, Health Care Auth., Hospital Rev. Bonds, Series 2016-A, 5.00% 2030 | 5,050 | 5,926 |
| County of Jefferson, Limited Obligation Rev. Ref. Bonds, Series 2017, 5.00% 2032 | 1,000 | 1,239 |
| County of Jefferson, Limited Obligation Rev. Ref. Bonds, Series 2017, 5.00% 2033 | 2,000 | 2,468 |
| County of Jefferson, Sewer Rev. Warrants, Capital Appreciation Warrants, Series 2013-E, 0% 2028 | 250 | 174 |
| County of Jefferson, Sewer Rev. Warrants, Capital Appreciation Warrants, Series 2013-E, 0% 2034 | 2,500 | 1,047 |
| County of Jefferson, Sewer Rev. Warrants, Capital Appreciation Warrants, Series 2013-E, 0% 2035 | 17,475 | 6,724 |
| County of Jefferson, Sewer Rev. Warrants, Capital Appreciation Warrants, Series 2013-E, 0% 2036 | 7,500 | 2,636 |
| County of Jefferson, Sewer Rev. Warrants, Capital Appreciation Warrants, Series 2013-F, 0% 2046 (7.75% on 10/1/2023)1 | 2,500 | 2,452 |
| County of Jefferson, Sewer Rev. Warrants, Series 2013-A, Assured Guaranty Municipal insured, 5.00% 2044 | 1,600 | 1,781 |
| County of Jefferson, Sewer Rev. Warrants, Series 2013-A, Assured Guaranty Municipal insured, 5.25% 2048 | 700 | 783 |
| County of Jefferson, Sewer Rev. Warrants, Series 2013-D, 6.00% 2042 | 7,175 | 8,278 |
| County of Jefferson, Sewer Rev. Warrants, Series 2013-D, 6.50% 2053 | 5,530 | 6,452 |
| County of Jefferson, Sewer Rev. Warrants, Series 2013-D, 7.00% 2051 | 520 | 615 |
| City of Montgomery, Medical Clinic Board, Health Care Fac. Rev. Bonds (Jackson Hospital & Clinic), Series 2015, 5.00% 2033 | 2,500 | 2,842 |
| City of Montgomery, Medical Clinic Board, Health Care Fac. Rev. Bonds (Jackson Hospital & Clinic), Series 2016, 5.00% 2036 | 3,400 | 3,827 |
| City of Phenix, Industrial Dev. Board, Environmental Improvement Rev. Ref. Bonds (MeadWestvaco-Mead Coated Board Project), Series 2012-A, AMT, 4.125% 2035 | 6,155 | 6,330 |
| County of Tuscaloosa, Industrial Dev. Auth., Gulf Opportunity Zone Rev. Ref. Bonds (Hunt Refining Co. Project), Series 2019-A, 4.50% 20322 | 5,000 | 5,500 |
| County of Tuscaloosa, Industrial Dev. Auth., Gulf Opportunity Zone Rev. Ref. Bonds (Hunt Refining Co. Project), Series 2019-A, 5.25% 20442 | 4,100 | 4,577 |
| 69,537 | ||
| Alaska 0.10% | ||
| Housing Fin. Corp., General Mortgage Rev. Bonds, Series 2018-A, 4.00% 2048 | 3,435 | 3,825 |
| Industrial Dev. and Export Auth., Power Rev. Ref. Bonds, Series 2015, AMT, 5.00% 2033 | 2,000 | 2,231 |
| Industrial Dev. and Export Auth., Power Rev. Ref. Bonds, Series 2015, AMT, 5.00% 2034 | 2,000 | 2,224 |
| 8,280 | ||
| American Samoa 0.17% | ||
| Econ. Dev. Auth., Rev. Ref. Bonds, Series 2015-A, 7.125% 20382 | 11,000 | 14,048 |
| Arizona 3.10% | ||
| Town of Buckeye, Community Facs. Dist. No. 1 (Verrado), G.O. Rev. Ref. Bonds, Series 2013-A, 5.00% 20212 | 500 | 506 |
| Town of Buckeye, Community Facs. Dist. No. 1 (Verrado), G.O. Rev. Ref. Bonds, Series 2013-A, 5.00% 20222 | 500 | 510 |
| Town of Buckeye, Community Facs. Dist. No. 1 (Verrado), G.O. Rev. Ref. Bonds, Series 2013-B, 5.00% 20232 | 180 | 185 |
| Town of Buckeye, Community Facs. Dist. No. 1 (Verrado), G.O. Rev. Ref. Bonds, Series 2013-B, 5.70% 20292 | 770 | 797 |
| Town of Buckeye, Community Facs. Dist. No. 1 (Verrado), G.O. Rev. Ref. Bonds, Series 2013-B, 6.00% 20332 | 700 | 722 |
| Town of Florence, Industrial Dev. Auth., Education Rev. Bonds (Legacy Traditional School Project - Queen Creek and Casa Grande Campuses), Series 2013, 5.75% 2033 | 250 | 268 |
American High-Income Municipal Bond Fund — Page 1 of 77
| Bonds, notes & other debt instruments (continued) Arizona (continued) | Principal amount (000) | Value (000) |
| City of Glendale, Industrial Dev. Auth., Rev. and Rev. Ref. Bonds (Glencroft Retirement Community Project), Series 2016, 4.25% 2026 | $595 | $577 |
| City of Glendale, Industrial Dev. Auth., Rev. and Rev. Ref. Bonds (Glencroft Retirement Community Project), Series 2016, 5.00% 2036 | 600 | 585 |
| City of Glendale, Industrial Dev. Auth., Rev. and Rev. Ref. Bonds (Glencroft Retirement Community Project), Series 2016, 5.25% 2046 | 1,545 | 1,483 |
| City of Glendale, Industrial Dev. Auth., Rev. Ref. Bonds (The Terraces of Phoenix Project), Series 2018-A, 5.00% 2048 | 750 | 750 |
| City of Glendale, Industrial Dev. Auth., Senior Living Rev. Bonds (Royal Oaks Life Care Community), Series 2016, 5.00% 2039 | 2,250 | 2,382 |
| Industrial Dev. Auth., Education Facs. Rev. Bonds (Leman Academy of Excellence - East Tucson and Central Tucson Projects), Series 2019-A, 5.00% 20392 | 3,500 | 3,621 |
| Industrial Dev. Auth., Education Facs. Rev. Bonds (Leman Academy of Excellence - East Tucson and Central Tucson Projects), Series 2019-A, 5.00% 20492 | 7,250 | 7,432 |
| Industrial Dev. Auth., Education Facs. Rev. Bonds (Leman Academy of Excellence - East Tucson and Central Tucson Projects), Series 2019-A, 5.00% 20542 | 6,000 | 6,135 |
| Industrial Dev. Auth., Education Rev. Bonds (Academies of Math & Science Projects), Series 2017-B, 5.125% 20472 | 2,230 | 2,325 |
| Industrial Dev. Auth., Education Rev. Bonds (Academies of Math & Science Projects), Series 2017-B, 5.25% 20512 | 570 | 597 |
| Industrial Dev. Auth., Education Rev. Bonds (Academies of Math & Science Projects), Series 2018-B, 5.50% 20382 | 1,200 | 1,301 |
| Industrial Dev. Auth., Education Rev. Bonds (Academies of Math & Science Projects), Series 2018-B, 5.625% 20482 | 2,500 | 2,694 |
| Industrial Dev. Auth., Education Rev. Bonds (Academies of Math & Science Projects), Series 2018-B, 5.75% 20532 | 3,750 | 4,056 |
| Industrial Dev. Auth., Education Rev. Bonds (Academies of Math & Science Projects), Series 2019, 5.00% 20542 | 1,000 | 1,038 |
| Industrial Dev. Auth., Education Rev. Bonds (Basis School Project), Series 2017-A, 5.125% 20372 | 1,500 | 1,619 |
| Industrial Dev. Auth., Education Rev. Bonds (Basis School Project), Series 2017-A, 5.25% 20472 | 3,200 | 3,422 |
| Industrial Dev. Auth., Education Rev. Bonds (Basis School Project), Series 2017-A, 5.375% 20502 | 9,750 | 10,475 |
| Industrial Dev. Auth., Education Rev. Bonds (Basis School Project), Series 2017-D, 5.00% 20372 | 675 | 731 |
| Industrial Dev. Auth., Education Rev. Bonds (Basis School Project), Series 2017-D, 5.00% 20472 | 1,035 | 1,102 |
| Industrial Dev. Auth., Education Rev. Bonds (Basis School Project), Series 2017-D, 5.00% 20512 | 3,450 | 3,665 |
| Industrial Dev. Auth., Education Rev. Bonds (Basis School Project), Series 2017-G, 4.00% 20272 | 2,600 | 2,699 |
| Industrial Dev. Auth., Education Rev. Bonds (Basis School Project), Series 2017-G, 5.00% 20472 | 2,125 | 2,263 |
| Industrial Dev. Auth., Education Rev. Bonds (Basis School Project), Series 2017-G, 5.00% 20512 | 1,550 | 1,647 |
| Industrial Dev. Auth., Education Rev. Bonds (Doral Academy of Nevada - Fire Mesa and Red Rock Campus Projects), Series 2019-A, 5.00% 20492 | 2,250 | 2,346 |
| Industrial Dev. Auth., Education Rev. Bonds (Doral Academy of Nevada - Fire Mesa and Red Rock Campus Projects), Series 2019-A, 3.55% 20292 | 985 | 983 |
| Industrial Dev. Auth., Education Rev. Bonds (Doral Academy of Nevada - Fire Mesa and Red Rock Campus Projects), Series 2019-A, 5.00% 20392 | 1,575 | 1,686 |
| Industrial Dev. Auth., Education Rev. Bonds (Leman Academy of Excellence Projects), Series 2017-A, 5.00% 20372 | 1,350 | 1,382 |
| Industrial Dev. Auth., Education Rev. Bonds (Leman Academy of Excellence Projects), Series 2017-A, 5.25% 20472 | 4,830 | 4,941 |
| Industrial Dev. Auth., Education Rev. Bonds (Leman Academy of Excellence Projects), Series 2017-A, 5.25% 20522 | 2,500 | 2,555 |
| Industrial Dev. Auth., Education Rev. Bonds (Pinecrest Academy of Nevada - Cadence Campus Project), Series 2020-A, 4.00% 20402 | 1,850 | 1,808 |
| Industrial Dev. Auth., Education Rev. Bonds (Pinecrest Academy of Nevada - Cadence Campus Project), Series 2020-A, 4.00% 20502 | 2,480 | 2,332 |
| Industrial Dev. Auth., Education Rev. Bonds (Pinecrest Academy of Nevada - Horizon, Inspirada and St. Rose Campus Projects), Series 2018-A, 5.75% 20382 | 1,960 | 2,184 |
American High-Income Municipal Bond Fund — Page 2 of 77
| Bonds, notes & other debt instruments (continued) Arizona (continued) | Principal amount (000) | Value (000) |
| Industrial Dev. Auth., Education Rev. Bonds (Pinecrest Academy of Nevada - Horizon, Inspirada and St. Rose Campus Projects), Series 2018-A, 5.75% 20482 | $3,230 | $3,555 |
| Industrial Dev. Auth., Education Rev. Bonds (Somerset Academy of Las Vegas - Lone Mountain Campus Projects), Series 2019-A, 3.75% 20292 | 565 | 559 |
| Industrial Dev. Auth., Education Rev. Bonds (Somerset Academy of Las Vegas - Lone Mountain Campus Projects), Series 2019-A, 5.00% 20392 | 440 | 452 |
| Industrial Dev. Auth., Education Rev. Bonds (Somerset Academy of Las Vegas - Lone Mountain Campus Projects), Series 2019-A, 5.00% 20492 | 700 | 710 |
| Industrial Dev. Auth., Municipal Certificates, Series 2019-2, Class A, 3.625% 2033 | 11,636 | 12,285 |
| Industrial Dev. Auth., Municipal Certificates, Series 2019-2, Class X, 1.001% 20333 | 164,800 | 10,283 |
| Industrial Dev. Auth., Student Housing Rev. Bonds (Provident Group - NCCU Properties LLC - North Carolina Central University Project), Series 2019-A, BAM insured, 5.00% 2049 | 1,500 | 1,779 |
| Industrial Dev. Auth., Student Housing Rev. Bonds (Provident Group - NCCU Properties LLC - North Carolina Central University Project), Series 2019-A, BAM insured, 5.00% 2058 | 3,500 | 4,140 |
| County of Maricopa, Industrial Dev. Auth., Education Rev. Bonds (Benjamin Franklin Charter School Projects), Series 2018-A, 6.00% 20382 | 2,000 | 2,307 |
| County of Maricopa, Industrial Dev. Auth., Education Rev. Bonds (Benjamin Franklin Charter School Projects), Series 2018-A, 6.00% 20522 | 3,625 | 4,102 |
| County of Maricopa, Industrial Dev. Auth., Education Rev. Bonds (Legacy Traditional Schools Projects), Series 2019-B, 5.00% 20392 | 3,500 | 3,800 |
| County of Maricopa, Industrial Dev. Auth., Education Rev. Bonds (Legacy Traditional Schools Projects), Series 2019-B, 5.00% 20492 | 3,500 | 3,741 |
| County of Maricopa, Industrial Dev. Auth., Education Rev. Bonds (Legacy Traditional Schools Projects), Series 2019-B, 5.00% 20542 | 2,500 | 2,663 |
| County of Maricopa, Industrial Dev. Auth., Education Rev. Bonds (Paradise Schools Projects), Series 2016, 5.00% 20362 | 2,750 | 2,953 |
| County of Maricopa, Industrial Dev. Auth., Education Rev. Bonds (Paradise Schools Projects), Series 2016, 5.00% 20472 | 10,580 | 11,171 |
| County of Maricopa, Pollution Control Rev. Ref. Bonds (El Paso Electric Co. Palo Verde Project), Series 2009-A, 3.60% 2040 | 2,000 | 2,189 |
| County of Maricopa, Pollution Control Rev. Ref. Bonds (Southern California Edison Co.), Series 2000-B, 5.00% 2035 | 3,000 | 3,009 |
| City of Phoenix, Civic Improvement Corp., Airport Rev. Bonds, Series 2019-B, AMT, 4.00% 2039 | 2,000 | 2,269 |
| City of Phoenix, Civic Improvement Corp., Airport Rev. Bonds, Series 2019-B, AMT, 4.00% 2044 | 2,000 | 2,240 |
| City of Phoenix, Industrial Dev. Auth., Education Fac. Rev. Bonds (Basis Schools, Inc. Project), Series 2015, 5.00% 20352 | 6,080 | 6,477 |
| City of Phoenix, Industrial Dev. Auth., Education Fac. Rev. Bonds (Basis Schools, Inc. Project), Series 2015, 5.00% 20452 | 5,500 | 5,768 |
| City of Phoenix, Industrial Dev. Auth., Education Fac. Rev. Bonds (Basis Schools, Inc. Project), Series 2016-A, 5.00% 20352 | 1,500 | 1,598 |
| City of Phoenix, Industrial Dev. Auth., Education Fac. Rev. Bonds (Basis Schools, Inc. Project), Series 2016-A, 5.00% 20462 | 7,100 | 7,442 |
| City of Phoenix, Industrial Dev. Auth., Education Fac. Rev. Bonds (Legacy Traditional Schools Projects), Series 2014-A, 5.75% 20242 | 1,025 | 1,112 |
| City of Phoenix, Industrial Dev. Auth., Education Fac. Rev. Bonds (Legacy Traditional Schools Projects), Series 2014-A, 6.50% 20342 | 1,560 | 1,765 |
| City of Phoenix, Industrial Dev. Auth., Education Fac. Rev. Bonds (Legacy Traditional Schools Projects), Series 2014-A, 6.75% 20442 | 6,900 | 7,766 |
| City of Phoenix, Industrial Dev. Auth., Education Fac. Rev. Bonds (Legacy Traditional Schools Projects), Series 2015, 5.00% 20352 | 1,590 | 1,683 |
| City of Phoenix, Industrial Dev. Auth., Education Fac. Rev. Bonds (Legacy Traditional Schools Projects), Series 2015, 5.00% 20452 | 2,250 | 2,346 |
| City of Phoenix, Industrial Dev. Auth., Education Fac. Rev. Bonds (Legacy Traditional Schools Projects), Series 2016-A, 4.00% 20262 | 3,020 | 3,130 |
American High-Income Municipal Bond Fund — Page 3 of 77
| Bonds, notes & other debt instruments (continued) Arizona (continued) | Principal amount (000) | Value (000) |
| City of Phoenix, Industrial Dev. Auth., Education Fac. Rev. Bonds (Legacy Traditional Schools Projects), Series 2016-A, 5.00% 20412 | $10,000 | $10,564 |
| City of Phoenix, Industrial Dev. Auth., Education Fac. Rev. Bonds (Legacy Traditional Schools Projects), Series 2016-A, 5.00% 20462 | 2,500 | 2,625 |
| City of Phoenix, Industrial Dev. Auth., Education Fac. Rev. Bonds (Leman Academy of Exellence - Oro Valley Projects), Series 2018-A, 5.00% 20382 | 3,100 | 3,172 |
| City of Phoenix, Industrial Dev. Auth., Education Fac. Rev. Bonds (Leman Academy of Exellence - Oro Valley Projects), Series 2018-A, 5.25% 20482 | 3,000 | 3,068 |
| City of Phoenix, Industrial Dev. Auth., Education Fac. Rev. Bonds (Leman Academy of Exellence - Oro Valley Projects), Series 2018-A, 5.25% 20532 | 4,980 | 5,088 |
| City of Phoenix, Industrial Dev. Auth., Education Fac. Rev. Bonds (Leman Academy of Exellence - Oro Valley Projects), Series 2019-A, 5.00% 20392 | 410 | 419 |
| City of Phoenix, Industrial Dev. Auth., Education Fac. Rev. Bonds (Leman Academy of Exellence - Oro Valley Projects), Series 2019-A, 5.00% 20492 | 1,185 | 1,206 |
| City of Phoenix, Industrial Dev. Auth., Lease Rev. Bonds (Rowan University Project), Series 2012, 5.25% 2034 | 5,000 | 5,266 |
| County of Pima, Industrial Dev. Auth., Education Fac. Rev. Bonds (American Leadership Academy), Series 2019, 5.00% 20342 | 725 | 745 |
| County of Pima, Industrial Dev. Auth., Education Fac. Rev. Bonds (American Leadership Academy), Series 2019, 5.00% 20392 | 655 | 667 |
| County of Pima, Industrial Dev. Auth., Education Fac. Rev. Bonds (American Leadership Academy), Series 2019, 5.00% 20492 | 1,100 | 1,109 |
| County of Pima, Industrial Dev. Auth., Education Fac. Rev. Bonds (American Leadership Academy), Series 2019, 5.00% 20522 | 2,150 | 2,165 |
| County of Pima, Industrial Dev. Auth., Education Fac. Rev. Bonds (Imagine East Mesa Charter Schools Project), Series 2019, 3.25% 20242 | 285 | 287 |
| County of Pima, Industrial Dev. Auth., Education Fac. Rev. Bonds (Imagine East Mesa Charter Schools Project), Series 2019, 5.00% 20292 | 300 | 320 |
| County of Pima, Industrial Dev. Auth., Education Fac. Rev. Bonds (Imagine East Mesa Charter Schools Project), Series 2019, 5.00% 20342 | 400 | 417 |
| County of Pima, Industrial Dev. Auth., Education Fac. Rev. Bonds (Imagine East Mesa Charter Schools Project), Series 2019, 5.00% 20392 | 500 | 516 |
| County of Pima, Industrial Dev. Auth., Education Fac. Rev. Bonds (Imagine East Mesa Charter Schools Project), Series 2019, 5.00% 20492 | 1,500 | 1,529 |
| County of Pinal, Industrial Dev. Auth., Environmental Facs. Rev. Green Bonds (WOF SW GGP 1 LLC Project), Series 2018, AMT, 7.25% 20332 | 13,000 | 10,559 |
| City of Tempe, Industrial Dev. Auth., Rev. Bonds (Friendship Village of Tempe), Series 2019, 5.00% 2050 | 1,600 | 1,568 |
| City of Tempe, Industrial Dev. Auth., Rev. Bonds (Friendship Village of Tempe), Series 2019, 5.00% 2054 | 1,850 | 1,800 |
| City of Tempe, Industrial Dev. Auth., Rev. Bonds (Mirabella at ASU Project), Series 2017-A, 6.00% 20372 | 700 | 729 |
| City of Tempe, Industrial Dev. Auth., Rev. Bonds (Mirabella at ASU Project), Series 2017-A, 6.125% 20472 | 1,900 | 1,959 |
| City of Tempe, Industrial Dev. Auth., Rev. Ref. Bonds (Friendship Village of Tempe), Series 2012-A, 6.25% 2042 | 1,000 | 1,016 |
| County of Yavapai, Industrial Dev. Auth., Solid Waste Disposal Rev. Bonds (Waste Management, Inc. Project), Series 2002, AMT, 2.80% 2027 (put 2021) | 1,300 | 1,326 |
| 257,218 | ||
| Arkansas 0.05% | ||
| Dev. Fin. Auth., Health Care Rev. Bonds (Baptist Memorial Health Care), Series 2015-B-3, (SIFMA Municipal Swap Index + 1.55%) 1.71% 2044 (put 2022)3 | 1,600 | 1,586 |
| Dev. Fin. Auth., Industrial Dev. Rev. Bonds (Big River Steel Project), Series 2019, AMT, 4.50% 20492 | 2,735 | 2,778 |
| 4,364 |
American High-Income Municipal Bond Fund — Page 4 of 77
| Bonds, notes & other debt instruments (continued) California 4.14% | Principal amount (000) | Value (000) |
| City of Alameda, Community Facs. Dist. No. 2013-1 (Alameda Landing Public Improvements), Special Tax Bonds, Series 2016, 5.00% 2027 | $100 | $116 |
| City of Alameda, Community Facs. Dist. No. 2013-1 (Alameda Landing Public Improvements), Special Tax Bonds, Series 2016, 5.00% 2031 | 150 | 171 |
| City of Alameda, Community Facs. Dist. No. 2013-1 (Alameda Landing Public Improvements), Special Tax Bonds, Series 2016, 5.00% 2032 | 160 | 181 |
| City of Alameda, Community Facs. Dist. No. 2013-1 (Alameda Landing Public Improvements), Special Tax Bonds, Series 2016, 5.00% 2033 | 320 | 362 |
| City of Anaheim, Public Fncg. Auth., Lease Rev. Bonds (Anaheim Convention Center Expansion Project), Series 2014-A, 5.00% 2046 | 2,000 | 2,212 |
| Assn. of Bay Area Governments, Fin. Auth. for Nonprofit Corps., Rev. Ref. Bonds (Episcopal Senior Communities), Series 2011, 6.00% 2031 | 1,250 | 1,282 |
| Assn. of Bay Area Governments, Fin. Auth. for Nonprofit Corps., Rev. Ref. Bonds (Episcopal Senior Communities), Series 2012-A, 5.00% 2047 | 3,500 | 3,637 |
| California County Tobacco Securitization Agcy., Tobacco Settlement Rev. Bonds, Capital Appreciation Bonds, Series 2020-B-1, 0% 2055 | 9,000 | 1,574 |
| California County Tobacco Securitization Agcy., Tobacco Settlement Rev. Bonds, Series 2020-B-1, 5.00% 2049 | 2,000 | 2,366 |
| City of Carlsbad, Reassessment Dist. No. 2012-1, Limited Obligation Rev. Ref. Bonds, Series 2013, 3.70% 2024 | 600 | 626 |
| City of Carlsbad, Reassessment Dist. No. 2012-1, Limited Obligation Rev. Ref. Bonds, Series 2013, 3.80% 2025 | 650 | 679 |
| City of Carlsbad, Reassessment Dist. No. 2012-1, Limited Obligation Rev. Ref. Bonds, Series 2013, 3.90% 2026 | 625 | 652 |
| Center Joint Unified School Dist., G.O. Rev. Ref. Bonds, Capital Appreciation Bonds, Series 2016, BAM insured, 0% 2029 | 1,000 | 849 |
| Center Joint Unified School Dist., G.O. Rev. Ref. Bonds, Capital Appreciation Bonds, Series 2016, BAM insured, 0% 2030 | 1,100 | 895 |
| Center Joint Unified School Dist., G.O. Rev. Ref. Bonds, Capital Appreciation Bonds, Series 2016, BAM insured, 0% 2031 | 2,000 | 1,562 |
| City of Cerritos, Public Fncg. Auth., Rev. Bonds (Los Coyotes Redev. Project Loan), Series 1993-A, AMBAC insured, 6.50% 2023 | 955 | 1,100 |
| City of Cerritos, Public Fncg. Auth., Tax Allocation Rev. Bonds (Cerritos Redev. Projects), Series 2002-A, AMBAC insured, 5.00% 2020 | 2,500 | 2,509 |
| City of Chula Vista, Industrial Dev. Rev. Ref. Bonds (San Diego Gas & Electric Co.), Series 2004-C, 5.875% 2034 | 1,100 | 1,104 |
| Coast Community College Dist., G.O. Bonds, Capital Appreciation Bonds, 2012 Election, Series 2019-F, 0% 2040 | 5,000 | 2,937 |
| Coast Community College Dist., G.O. Bonds, Capital Appreciation Bonds, 2012 Election, Series 2019-F, 0% 2042 | 5,000 | 2,726 |
| Compton Unified School Dist., G.O. Bonds, Capital Appreciation Bonds, 2015 Election, Series 2019-B, BAM insured, 0% 2034 | 1,000 | 732 |
| Compton Unified School Dist., G.O. Bonds, Capital Appreciation Bonds, 2015 Election, Series 2019-B, BAM insured, 0% 2036 | 1,100 | 749 |
| Compton Unified School Dist., G.O. Bonds, Capital Appreciation Bonds, 2015 Election, Series 2019-B, BAM insured, 0% 2039 | 3,765 | 2,294 |
| Compton Unified School Dist., G.O. Bonds, Capital Appreciation Bonds, 2015 Election, Series 2019-B, BAM insured, 0% 2040 | 5,000 | 2,933 |
| Corona-Norco Unified School Dist., Public Fin. Auth., Special Tax Rev. Bonds, Series 2016-05-1, 4.00% 2029 | 615 | 697 |
| Corona-Norco Unified School Dist., Public Fin. Auth., Special Tax Rev. Bonds, Series 2016-05-1, 4.00% 2030 | 640 | 718 |
| Duarte Unified School Dist., G.O. Bonds, Capital Appreciation Bonds, 2010 Election, Series 2011-A, BAM insured, 0% 2036 | 5,520 | 3,669 |
| Educational Facs. Auth., Rev. Bonds (Chapman University), Series 2017-B, 4.00% 2047 | 3,150 | 3,421 |
| Elk Grove Unified School Dist., Community Facs. Dist. No. 1, Special Tax Rev. Ref. Bonds, Series 2012, Assured Guaranty Municipal insured, 4.00% 2033 | 4,000 | 4,257 |
| Etiwanda School Dist., G.O. Bonds, Capital Appreciation Bonds, 2016 Election, Series 2020-A, 0% 2038 | 1,210 | 718 |
American High-Income Municipal Bond Fund — Page 5 of 77
| Bonds, notes & other debt instruments (continued) California (continued) | Principal amount (000) | Value (000) |
| Etiwanda School Dist., G.O. Bonds, Capital Appreciation Bonds, 2016 Election, Series 2020-A, 0% 2039 | $1,000 | $570 |
| Etiwanda School Dist., G.O. Bonds, Capital Appreciation Bonds, 2016 Election, Series 2020-A, 0% 2040 | 1,000 | 547 |
| Foothill/Eastern Transportation Corridor Agcy., Toll Road Rev. Ref. Bonds, Capital Appreciation Bonds, Series 2013-A, 0% 2042 | 5,000 | 2,498 |
| Foothill/Eastern Transportation Corridor Agcy., Toll Road Rev. Ref. Bonds, Capital Appreciation Bonds, Series 2015-A, Assured Guaranty Municipal insured, 0% 2034 | 1,000 | 718 |
| Foothill/Eastern Transportation Corridor Agcy., Toll Road Rev. Ref. Bonds, Capital Appreciation Bonds, Series 2015-A, Assured Guaranty Municipal insured, 0% 2035 | 1,000 | 693 |
| Foothill/Eastern Transportation Corridor Agcy., Toll Road Rev. Ref. Bonds, Series 2013-C, 6.50% 2043 | 3,500 | 3,994 |
| Golden State Tobacco Securitization Corp., Enhanced Tobacco Settlement Asset-Backed Bonds, Capital Appreciation Bonds, Series 2007-B, 0% 2047 | 29,200 | 6,137 |
| Golden State Tobacco Securitization Corp., Enhanced Tobacco Settlement Asset-Backed Bonds, Series 2018-A-1, 5.00% 2047 | 1,300 | 1,329 |
| Golden State Tobacco Securitization Corp., Enhanced Tobacco Settlement Asset-Backed Bonds, Series 2018-A-2, 5.00% 2047 | 2,250 | 2,300 |
| Grossmont Union High School Dist., G.O. Bonds, Capital Appreciation Bonds, 2004 Election, Series 2008, 0% 2032 | 5,000 | 4,139 |
| Housing Fin. Agcy., Municipal Certificates, Series 2019-A-1, 4.25% 2035 | 4,610 | 5,158 |
| Housing Fin. Agcy., Municipal Certificates, Series 2019-X-1, 0.29% 20353 | 28,600 | 578 |
| Independent Cities Lease Fin. Auth., Mobile Home Park Rev. Ref. Bonds (Palomar Estates West), Series 2015, 5.00% 2036 | 1,000 | 1,088 |
| City of Irvine, Reassessment Dist. No. 15-2, Limited Obligation Improvement Bonds, Series 2015, 5.00% 2032 | 350 | 403 |
| City of Irvine, Reassessment Dist. No. 15-2, Limited Obligation Improvement Bonds, Series 2015, 5.00% 2033 | 590 | 676 |
| City of Irvine, Reassessment Dist. No. 15-2, Limited Obligation Improvement Bonds, Series 2015, 5.00% 2034 | 615 | 702 |
| City of Irvine, Reassessment Dist. No. 15-2, Limited Obligation Improvement Bonds, Series 2015, 5.00% 2035 | 375 | 427 |
| City of La Verne, Rev. Certs. of Part. (Brethren Hillcrest Homes), Series 2014, 5.00% 2024 (preref. 2022) | 310 | 339 |
| City of La Verne, Rev. Certs. of Part. (Brethren Hillcrest Homes), Series 2014, 5.00% 2025 (preref. 2022) | 550 | 602 |
| City of La Verne, Rev. Certs. of Part. (Brethren Hillcrest Homes), Series 2014, 5.00% 2026 (preref. 2022) | 350 | 383 |
| City of Lake Elsinore, Public Fncg. Auth., Local Agcy. Rev. Ref. Bonds, Series 2015, 5.00% 2027 | 70 | 82 |
| City of Lake Elsinore, Public Fncg. Auth., Local Agcy. Rev. Ref. Bonds, Series 2015, 5.00% 2031 | 2,685 | 3,086 |
| City of Lake Elsinore, Public Fncg. Auth., Local Agcy. Rev. Ref. Bonds, Series 2015, 5.00% 2035 | 3,330 | 3,751 |
| Lammersville Joint Unified School Dist., Community Facs. Dist. No. 2014-1, Special Tax Bonds, Series 2020, 4.00% 2040 | 120 | 133 |
| Lammersville Joint Unified School Dist., Community Facs. Dist. No. 2014-1, Special Tax Bonds, Series 2020, 4.00% 2045 | 275 | 301 |
| Lammersville Joint Unified School Dist., Community Facs. Dist. No. 2014-1, Special Tax Bonds, Series 2020, 4.00% 2049 | 675 | 737 |
| City of Lee Lake, Public Fncg. Auth., Special Tax Rev. Ref. Bonds, Series 2013-B, 5.375% 2035 | 730 | 789 |
| City of Long Beach, Marina Rev. Bonds (Alamitos Bay Marina Project), Series 2015, 5.00% 2045 | 500 | 533 |
| M-S-R Energy Auth., Gas Rev. Bonds, Series 2009-B, 6.50% 2039 | 1,800 | 2,934 |
| Madera Unified School Dist., G.O. Bonds, Capital Appreciation Bonds, 2002 Election, Series 2005, National insured, 0% 2030 | 4,000 | 3,524 |
| Moorpark Unified School Dist., G.O. Bonds, Capital Appreciation Bonds, 2008 Election, Series 2011-B, Assured Guaranty Municipal insured, 0% 2036 | 5,730 | 3,903 |
| Morongo Band of Mission Indians, Rev. Ref. Bonds, Series 2018-B, 5.00% 20422 | 11,415 | 12,578 |
| Municipal Fin. Auth., Charter School Rev. Bonds (Rocketship Education - Multiple Projects), Series 2014-A, 6.00% 2023 | 500 | 531 |
| Municipal Fin. Auth., Educational Rev. Bonds (American Heritage Education Foundation Project), Series 2016-A, 5.00% 2036 | 750 | 843 |
| Municipal Fin. Auth., Educational Rev. Bonds (American Heritage Education Foundation Project), Series 2016-A, 5.00% 2046 | 1,745 | 1,927 |
| Municipal Fin. Auth., Rev. Bonds (California Baptist University), Series 2015-A, 5.25% 20352 | 2,035 | 2,170 |
| Municipal Fin. Auth., Rev. Bonds (California Baptist University), Series 2015-A, 5.50% 20452 | 5,600 | 5,936 |
| Municipal Fin. Auth., Rev. Bonds (California Baptist University), Series 2016-A, 5.00% 20462 | 750 | 778 |
| Municipal Fin. Auth., Rev. Bonds (Caritas Mobile Home Park), Series 2014-A, 5.25% 2039 | 1,200 | 1,330 |
American High-Income Municipal Bond Fund — Page 6 of 77
| Bonds, notes & other debt instruments (continued) California (continued) | Principal amount (000) | Value (000) |
| Municipal Fin. Auth., Rev. Bonds (Caritas Mobile Home Park), Series 2014-B, 5.875% 2049 | $1,000 | $1,087 |
| Municipal Fin. Auth., Rev. Bonds (John Adams Academies Inc.), Series 2019-A, 4.00% 20292 | 420 | 429 |
| Municipal Fin. Auth., Rev. Bonds (John Adams Academies Inc.), Series 2019-A, 5.00% 20492 | 1,525 | 1,580 |
| Municipal Fin. Auth., Rev. Bonds (John Adams Academies Inc.), Series 2019-A, 5.00% 20572 | 1,100 | 1,134 |
| Municipal Fin. Auth., Rev. Bonds (LINXS APM Project), Series 2018-A, AMT, 4.00% 2047 | 11,455 | 12,361 |
| Municipal Fin. Auth., Rev. Bonds (LINXS APM Project), Series 2018-A, AMT, 5.00% 2047 | 4,005 | 4,640 |
| Municipal Fin. Auth., Rev. Bonds (Social Bonds - HealthRIGHT 360), Series 2019-A, 5.00% 20392 | 525 | 575 |
| Municipal Fin. Auth., Rev. Bonds (Social Bonds - HealthRIGHT 360), Series 2019-A, 5.00% 20492 | 2,000 | 2,148 |
| Municipal Fin. Auth., Rev. Ref. Bonds (Azusa Pacific University Project), Series 2015-B, 5.00% 2026 | 1,065 | 1,160 |
| Municipal Fin. Auth., Rev. Ref. Bonds (Azusa Pacific University Project), Series 2015-B, 5.00% 2030 | 2,505 | 2,690 |
| Municipal Fin. Auth., Solid Waste Disposal Rev. Bonds (Waste Management, Inc. Project), Series 2017-A, AMT, 2.00% 2044 (put 2020) | 1,000 | 1,005 |
| Northern California Gas Auth. No. 1, Gas Project Rev. Bonds, Series 2007-B, (3-month USD-LIBOR + 0.67%) 0.918% 20273 | 11,055 | 10,865 |
| County of Orange, Community Facs. Dist. No. 2015-1 (Esencia Village), Special Tax Rev. Ref. Bonds, Series 2015-A, 5.25% 2045 | 560 | 629 |
| City of Oroville, Hospital Rev. Bonds (Oroville Hospital), Series 2019, 5.25% 2039 | 2,500 | 2,732 |
| City of Oroville, Hospital Rev. Bonds (Oroville Hospital), Series 2019, 5.25% 2049 | 7,335 | 7,892 |
| City of Oroville, Hospital Rev. Bonds (Oroville Hospital), Series 2019, 5.25% 2054 | 6,800 | 7,243 |
| City of Palm Desert, Section 29 Assessment Dist. No. 2004-02, Limited Obligation Improvement Bonds, Series 2007, 5.05% 2027 | 1,820 | 1,825 |
| Palomar Health, Rev. Ref. Bonds, Series 2016, 5.00% 2027 | 2,160 | 2,637 |
| Palomar Pomerado Health, Certs. of Part., Series 2010, 6.00% 2041 (preref. 2020) | 1,000 | 1,014 |
| Palomar Pomerado Health, G.O. Bonds, Capital Appreciation Bonds, 2004 Election, Series 2009-A, Assured Guaranty insured, 0% 2029 | 2,750 | 2,418 |
| Palomar Pomerado Health, G.O. Bonds, Capital Appreciation Bonds, 2004 Election, Series 2009-A, Assured Guaranty insured, 0% 2030 | 9,000 | 7,703 |
| Palomar Pomerado Health, G.O. Bonds, Capital Appreciation Bonds, 2004 Election, Series 2009-A, Assured Guaranty insured, 0% 2031 | 2,500 | 2,083 |
| Pollution Control Fncg. Auth., Solid Waste Disposal Rev. Bonds (Republic Services, Inc. Project), Series 2017-A-1, AMT, 1.50% 2042 (put 2020)2 | 2,700 | 2,700 |
| Pollution Control Fncg. Auth., Water Furnishing Rev. Bonds (Poseidon Resources (Channelside) LP Desalination Project), Series 2012 Plant Bonds, AMT, 5.00% 20452 | 6,000 | 6,248 |
| Public Works Board, Lease Rev. Bonds (Trustees of the California State University), Series 2013-H, 5.00% 2024 (preref. 2023) | 20 | 23 |
| Public Works Board, Lease Rev. Bonds (Trustees of the California State University), Series 2013-H, 5.00% 2029 (preref. 2023) | 5 | 6 |
| Public Works Board, Lease Rev. Bonds (Trustees of the California State University, Various California State University Projects), Series 2011-B, 5.00% 2031 (preref. 2021) | 5 | 5 |
| City of Rancho Cordova, Community Facs. Dist. No. 2003-1 (Sunridge Anatolia), Special Tax Bonds, Series 2016, 4.00% 2037 | 500 | 541 |
| Rio Elementary School Dist., Community Facs. Dist. No. 1, Special Tax Bonds, Series 2013, 5.50% 2039 | 1,785 | 2,069 |
| Rio Elementary School Dist., Community Facs. Dist. No. 1, Special Tax Rev. Ref. Bonds, Series 2014, 5.00% 2035 | 425 | 469 |
| River Islands Public Fncg. Auth., Community Facs. Dist. No. 2003-1 (Public Improvements), Special Tax Bonds, Series 2019-A, 5.00% 2038 | 3,750 | 4,273 |
| River Islands Public Fncg. Auth., Community Facs. Dist. No. 2003-1 (Public Improvements), Special Tax Bonds, Series 2019-A, 5.00% 2048 | 4,545 | 5,108 |
| County of Riverside, Redev. Agcy., Tax Allocation Bonds (Jurupa Valley Redev. Project Area), Capital Appreciation Bonds, Series 2011-B, 0% 2039 | 4,000 | 2,630 |
| City of Roseville, Community Facs. Dist. No. 1 (Westpark), Special Tax Rev. Ref. Bonds, Series 2015, 5.00% 2029 | 1,000 | 1,166 |
| City of Roseville, Community Facs. Dist. No. 1 (Westpark), Special Tax Rev. Ref. Bonds, Series 2015, 5.00% 2030 | 455 | 527 |
American High-Income Municipal Bond Fund — Page 7 of 77
| Bonds, notes & other debt instruments (continued) California (continued) | Principal amount (000) | Value (000) |
| City of Roseville, Community Facs. Dist. No. 1 (Westpark), Special Tax Rev. Ref. Bonds, Series 2015, 5.00% 2031 | $595 | $685 |
| City of Roseville, Community Facs. Dist. No. 1 (Westpark), Special Tax Rev. Ref. Bonds, Series 2015, 5.00% 2033 | 500 | 570 |
| County of Sacramento, Water Fncg. Auth., Rev. Ref. Bonds (Water Agcy. Zones 40 and 41), Series 2007-B, FGIC-National insured, (3-month USD-LIBOR + 0.55%) 0.784% 20343 | 5,000 | 4,651 |
| City of San Buenaventura, Rev. Bonds (Community Memorial Health System), Series 2011, 7.50% 2041 | 10,290 | 10,891 |
| City of San Diego, Community Facs. Dist. No. 2 (Santaluz), Improvement Area No. 1, Special Tax Rev. Ref. Bonds, Series 2011-A, 5.10% 2030 | 920 | 968 |
| City of San Diego, Community Facs. Dist. No. 4 (Black Mountain Ranch Villages), Special Tax Bonds, Series 2016, 5.00% 2027 | 355 | 425 |
| City of San Diego, Community Facs. Dist. No. 4 (Black Mountain Ranch Villages), Special Tax Bonds, Series 2016, 5.00% 2028 | 785 | 933 |
| City of San Diego, Community Facs. Dist. No. 4 (Black Mountain Ranch Villages), Special Tax Bonds, Series 2016, 5.00% 2029 | 245 | 292 |
| City of San Diego, Community Facs. Dist. No. 4 (Black Mountain Ranch Villages), Special Tax Bonds, Series 2016, 5.00% 2030 | 245 | 289 |
| City and County of San Francisco, Airport Commission, San Francisco International Airport, Second Series Rev. Bonds, Series 2019-A, AMT, 5.00% 2049 | 5,000 | 6,100 |
| City and County of San Francisco, Redev. Fin. Auth., Tax Allocation Rev. Bonds (Mission Bay South Redev. Project), Series 2011-D, 7.00% 2041 (preref. 2021) | 1,000 | 1,033 |
| City and County of San Francisco, Redev. Fin. Auth., Tax Allocation Rev. Bonds (Mission Bay South Redev. Project), Series 2016-C, 5.00% 2031 | 665 | 820 |
| City and County of San Francisco, Successor Agcy. to the Redev. Agcy., Community Facs. Dist. No. 6 (Mission Bay South Public Improvements), Special Tax Rev. Ref. Bonds, Series 2013-A, 5.00% 2031 | 500 | 531 |
| City and County of San Francisco, Successor Agcy. to the Redev. Agcy., Community Facs. Dist. No. 7 (Hunters Point Shipyard Phase 1 Improvements), Special Tax Rev. Ref. Bonds, Series 2014, 5.00% 2044 | 935 | 992 |
| City of Santa Ana, Redev. Agcy., Tax Allocation Bonds, Series 2011-A, 6.25% 2024 | 1,500 | 1,553 |
| City of Santa Clara, Redev. Agcy., Tax Allocation Bonds (Bayshore North Project), Capital Appreciation Bonds, Series 2011, 0% 2024 (preref. 2021) | 1,700 | 1,359 |
| City of Santa Clara, Redev. Agcy., Tax Allocation Bonds (Bayshore North Project), Capital Appreciation Bonds, Series 2011, 0% 2025 (preref. 2021) | 4,000 | 2,948 |
| School Fin. Auth., Charter School Rev. Bonds (Classical Academies Project), Series 2013-A-1, 7.375% 2043 (preref. 2022) | 2,920 | 3,311 |
| School Fin. Auth., Charter School Rev. Bonds (Classical Academies Project), Series 2017-A, 4.00% 20272 | 1,000 | 1,033 |
| School Fin. Auth., Charter School Rev. Bonds (Classical Academies Project), Series 2017-A, 5.00% 20442 | 2,000 | 2,094 |
| School Fin. Auth., Charter School Rev. Bonds (Equitas Academy Obligated Group), Series 2018-A, 5.00% 20292 | 1,000 | 1,120 |
| School Fin. Auth., Charter School Rev. Bonds (Equitas Academy Obligated Group), Series 2018-A, 5.00% 20482 | 1,000 | 1,059 |
| School Fin. Auth., Charter School Rev. Bonds (Larchmont Charter School Project), Series 2018-A, 5.00% 20282 | 595 | 650 |
| School Fin. Auth., Charter School Rev. Bonds (Larchmont Charter School Project), Series 2018-A, 5.00% 20432 | 760 | 794 |
| School Fin. Auth., Charter School Rev. Bonds (Rocketship Education Obligated Group), Series 2016-A, 5.00% 20462 | 1,850 | 1,923 |
| School Fin. Auth., Charter School Rev. Bonds (Rocketship Education Obligated Group), Series 2017-A, 5.125% 20472 | 750 | 789 |
| School Fin. Auth., Charter School Rev. Bonds (Rocketship Education Obligated Group), Series 2017-A, 5.25% 20522 | 250 | 264 |
| School Fin. Auth., Charter School Rev. Bonds (Rocketship Public Schools Obligated Group), Series 2017-G, 5.00% 20472 | 1,470 | 1,548 |
| School Fin. Auth., Charter School Rev. Bonds (Rocketship Public Schools Obligated Group), Series 2017-G, 5.00% 20372 | 360 | 386 |
| School Fin. Auth., Educational Facs. Rev. Bonds (River Springs Charter School Project), Series 2015-A, 6.375% 20462 | 7,100 | 7,935 |
American High-Income Municipal Bond Fund — Page 8 of 77
| Bonds, notes & other debt instruments (continued) California (continued) | Principal amount (000) | Value (000) |
| School Fin. Auth., Educational Facs. Rev. Bonds (River Springs Charter School Project), Series 2015-A, 6.375% 20462 | $440 | $492 |
| School Fin. Auth., Educational Facs. Rev. Bonds (River Springs Charter School Project), Series 2017-A, 5.00% 20522 | 1,350 | 1,383 |
| School Fin. Auth., School Fac. Rev. Ref. Bonds (High Tech High Learning Project), Series 2017-A, 4.00% 20212 | 370 | 382 |
| School Fin. Auth., School Fac. Rev. Ref. Bonds (High Tech High Learning Project), Series 2017-A, 4.00% 20222 | 385 | 404 |
| School Fin. Auth., School Fac. Rev. Ref. Bonds (High Tech High Learning Project), Series 2017-A, 4.00% 20232 | 400 | 428 |
| School Fin. Auth., School Fac. Rev. Ref. Bonds (High Tech High Learning Project), Series 2017-A, 4.00% 20242 | 420 | 458 |
| School Fin. Auth., School Fac. Rev. Ref. Bonds (High Tech High Learning Project), Series 2017-A, 4.00% 20252 | 235 | 259 |
| School Fin. Auth., School Fac. Rev. Ref. Bonds (High Tech High Learning Project), Series 2017-A, 5.00% 20492 | 1,000 | 1,117 |
| City of Seal Beach, Community Facs. Dist. No. 2005-1 (Pacific Gateway Business Center), Special Tax Rev. Ref. Bonds, Series 2016, 3.00% 2027 | 100 | 103 |
| City of Seal Beach, Community Facs. Dist. No. 2005-1 (Pacific Gateway Business Center), Special Tax Rev. Ref. Bonds, Series 2016, 3.00% 2028 | 120 | 124 |
| City of Seal Beach, Community Facs. Dist. No. 2005-1 (Pacific Gateway Business Center), Special Tax Rev. Ref. Bonds, Series 2016, 3.125% 2030 | 175 | 180 |
| City of Seal Beach, Community Facs. Dist. No. 2005-1 (Pacific Gateway Business Center), Special Tax Rev. Ref. Bonds, Series 2016, 3.125% 2031 | 460 | 474 |
| Southern California Logistics Airport Auth., Tax Allocation Parity Bonds (Southern California Logistics Airport Project), Series 2005-A, RADIAN insured, 4.50% 2030 | 120 | 120 |
| Statewide Communities Dev. Auth., Pollution Control Rev. Ref. Bonds (Southern California Edison Co.), Series 2010-A, 4.50% 2029 | 3,320 | 3,329 |
| Statewide Communities Dev. Auth., Rev. Bonds (American Baptist Homes of the West), Series 2015, 5.00% 2045 | 850 | 927 |
| Statewide Communities Dev. Auth., Rev. Bonds (California Baptist University), Series 2014-A, 6.375% 2043 | 2,700 | 2,948 |
| Statewide Communities Dev. Auth., Rev. Bonds (Lancer Educational Student Housing Project), Series 2019-A, 5.00% 20342 | 275 | 289 |
| Statewide Communities Dev. Auth., Rev. Bonds (Lancer Educational Student Housing Project), Series 2019-A, 5.00% 20392 | 370 | 383 |
| Statewide Communities Dev. Auth., Rev. Bonds (Lancer Plaza Project), Series 2013, 5.125% 2023 | 860 | 890 |
| Statewide Communities Dev. Auth., Rev. Bonds (Loma Linda University Medical Center), Series 2014-A, 5.25% 2044 | 5,000 | 5,421 |
| Statewide Communities Dev. Auth., Rev. Bonds (Loma Linda University Medical Center), Series 2016-A, 5.25% 20562 | 16,500 | 17,952 |
| Statewide Communities Dev. Auth., Rev. Bonds (Terraces at San Joaquin Gardens Project), Series 2012-A, 6.00% 2042 | 1,000 | 1,049 |
| Statewide Communities Dev. Auth., Rev. Bonds (Terraces at San Joaquin Gardens Project), Series 2012-A, 5.625% 2032 | 1,000 | 1,046 |
| Statewide Communities Dev. Auth., Rev. Ref. Bonds (California Baptist University), Series 2017-A, 5.00% 20322 | 720 | 776 |
| Statewide Communities Dev. Auth., Rev. Ref. Bonds (Lancer Educational Student Housing Project), Series 2016-A, 5.00% 20462 | 3,750 | 3,805 |
| Statewide Communities Dev. Auth., Student Housing Rev. Bonds (CHF-Irvine, LLC - University of California, Irvine East Campus Apartments), Series 2016, 5.00% 2040 | 1,150 | 1,272 |
| Statewide Communities Dev. Auth., Student Housing Rev. Bonds (Custodial Receipts), Series 2017, 4.305% 2032 | 5,005 | 5,130 |
| City of Thousand Oaks, Community Facs. Dist. No. 1994-1 (Marketplace Public Pedestrian, Traffic Circulation and Parking Facs.), Special Tax Rev. Ref. Bonds, Series 2012, 5.00% 2022 | 660 | 695 |
| Tobacco Securitization Auth. of Southern California, Tobacco Settlement Asset-Backed Rev. Ref. Bonds (San Diego County Tobacco Asset Securitization Corp.), Capital Appreciation Bonds, Series 2019-B2-2, 0% 2054 | 10,735 | 1,814 |
| Regents of the University of California, Medical Center Pooled Rev. Bonds, Series 2016-L, 4.00% 2037 | 2,300 | 2,579 |
| 342,665 |
American High-Income Municipal Bond Fund — Page 9 of 77
| Bonds, notes & other debt instruments (continued) Colorado 5.54% | Principal amount (000) | Value (000) |
| County of Adams, Amber Creek Metropolitan Dist., Limited Tax G.O. Bonds, Series 2017-B, 7.75% 20474 | $515 | $522 |
| County of Adams, Amber Creek Metropolitan Dist., Limited Tax G.O. Rev. Ref. and Improvement Bonds, Series 2017-A, 5.00% 2037 | 1,585 | 1,608 |
| County of Adams, Amber Creek Metropolitan Dist., Limited Tax G.O. Rev. Ref. and Improvement Bonds, Series 2017-A, 5.125% 2047 | 575 | 579 |
| County of Adams, Bradburn Metropolitan Dist. No. 2, Limited Tax G.O. Bonds, Series 2018-B, 7.25% 20474 | 2,488 | 2,535 |
| County of Adams, Bradburn Metropolitan Dist. No. 2, Limited Tax G.O. Rev. Ref. and Improvement Bonds (Convertible to Unlimited Tax), Series 2018-A, 5.00% 2038 | 840 | 903 |
| County of Adams, Bradburn Metropolitan Dist. No. 2, Limited Tax G.O. Rev. Ref. and Improvement Bonds (Convertible to Unlimited Tax), Series 2018-A, 5.00% 2047 | 1,200 | 1,271 |
| County of Adams, Brighton Crossing Metropolitan Dist. No. 4, Limited Tax G.O. Bonds, Series 2017-B, 7.00% 20474 | 670 | 679 |
| County of Adams, Brighton Crossing Metropolitan Dist. No. 4, Limited Tax G.O. Bonds (Convertible to Unlimited Tax), Series 2017-A, 4.00% 2027 | 1,030 | 1,051 |
| County of Adams, Brighton Crossing Metropolitan Dist. No. 4, Limited Tax G.O. Bonds (Convertible to Unlimited Tax), Series 2017-A, 5.00% 2037 | 1,055 | 1,095 |
| County of Adams, Brighton Crossing Metropolitan Dist. No. 4, Limited Tax G.O. Bonds (Convertible to Unlimited Tax), Series 2017-A, 5.00% 2047 | 3,170 | 3,244 |
| County of Adams, Clear Creek Station Metropolitan Dist., Limited Tax G.O. Bonds, Series 2017-B, 7.375% 20474 | 500 | 511 |
| County of Adams, Clear Creek Station Metropolitan Dist., Limited Tax G.O. Rev. Ref. and Improvement Bonds, Series 2017-A, 4.375% 2032 | 790 | 801 |
| County of Adams, Clear Creek Station Metropolitan Dist., Limited Tax G.O. Rev. Ref. and Improvement Bonds, Series 2017-A, 5.00% 2047 | 7,250 | 7,373 |
| County of Adams, DIATC Metropolitan Dist., Limited Tax G.O. Rev. Ref. and Improvement Bonds, Series 2019, 5.00% 20392 | 1,245 | 1,283 |
| County of Adams, DIATC Metropolitan Dist., Limited Tax G.O. Rev. Ref. and Improvement Bonds, Series 2019, 5.00% 20492 | 2,000 | 2,039 |
| County of Adams, Pomponio Terrace Metropolitan Dist., Limited Tax G.O. Bonds, Series 2019-A, 5.00% 2049 | 1,475 | 1,500 |
| County of Adams, Pomponio Terrace Metropolitan Dist., Limited Tax G.O. Bonds, Series 2019-B, 7.75% 20494 | 816 | 831 |
| County of Adams, The Village at Dry Creek Metropolitan Dist. No. 2, Limited Tax G.O. and Special Rev. Bonds, Series 2019, 4.375% 2044 | 1,870 | 1,782 |
| County of Arapahoe, Copperleaf Metropolitan Dist. No. 2, Limited Tax G.O. Bonds, Series 2015, 5.25% 2030 | 500 | 517 |
| County of Arapahoe, Copperleaf Metropolitan Dist. No. 2, Limited Tax G.O. Bonds, Series 2015, 5.75% 2045 | 1,450 | 1,490 |
| County of Arapahoe, Copperleaf Metropolitan Dist. No. 2, Limited Tax G.O. Bonds, Series 2019-B, 5.00% 2049 | 510 | 519 |
| County of Arapahoe, Copperleaf Metropolitan Dist. No. 4, Limited Tax G.O. Bonds (Convertible to Unlimited Tax), Series 2020-A, 5.00% 2049 | 1,500 | 1,514 |
| County of Arapahoe, Cornerstar Metropolitan Dist., Limited Tax G.O. Rev. Ref. Bonds (Convertible to Unlimited Tax), Series 2017-A, 4.50% 2027 | 1,500 | 1,546 |
| County of Arapahoe, Fitzsimons Village Metropolitan Dist. No. 1, Limited Tax G.O. and Special Rev. Ref. Bonds, Series 2020-A, 5.00% 2049 | 2,090 | 2,099 |
| County of Arapahoe, Gardens of Havana Metropolitan Dist. No. 3, Special Rev. Ref. Bonds, Series 2017-A, 4.625% 2027 | 2,690 | 2,775 |
| County of Arapahoe, Wild Plum Metropolitan Dist., Limited Tax G.O. Bonds, Series 2019-B, 5.00% 2049 | 595 | 628 |
| Arkansas River Power Auth., Power Supply System Rev. Ref. Bonds, Series 2018-A, 5.00% 2033 | 1,685 | 1,907 |
| Arkansas River Power Auth., Power Supply System Rev. Ref. Bonds, Series 2018-A, 5.00% 2038 | 3,345 | 3,727 |
| Arkansas River Power Auth., Power Supply System Rev. Ref. Bonds, Series 2018-A, 5.00% 2043 | 6,000 | 6,565 |
| City of Arvada, Leyden Ranch Metropolitan Dist., Limited Tax G.O. Tax Bonds, Series 2017-A, 5.125% 2047 | 1,131 | 1,155 |
| City of Arvada, Leyden Ranch Metropolitan Dist., Limited Tax G.O. Tax Bonds, Series 2017-B, 7.00% 20474 | 500 | 509 |
| City of Arvada, Leyden Rock Metropolitan Dist. No. 10, Limited Tax G.O. Bonds, Series 2017-C, 10.75% 20494 | 1,026 | 1,030 |
| City of Arvada, Leyden Rock Metropolitan Dist. No. 10, Limited Tax G.O. Rev. Ref. and Improvement Bonds (Convertible to Unlimited Tax), Series 2016-A, 4.00% 2025 | 1,000 | 1,025 |
American High-Income Municipal Bond Fund — Page 10 of 77
| Bonds, notes & other debt instruments (continued) Colorado (continued) | Principal amount (000) | Value (000) |
| City of Arvada, Leyden Rock Metropolitan Dist. No. 10, Limited Tax G.O. Rev. Ref. and Improvement Bonds (Convertible to Unlimited Tax), Series 2016-A, 4.375% 2033 | $2,750 | $2,809 |
| City of Arvada, Leyden Rock Metropolitan Dist. No. 10, Limited Tax G.O. Rev. Ref. and Improvement Bonds (Convertible to Unlimited Tax), Series 2016-A, 5.00% 2045 | 2,250 | 2,308 |
| City of Arvada, Leyden Rock Metropolitan Dist. No. 10, Limited Tax G.O. Rev. Ref. and Improvement Bonds (Convertible to Unlimited Tax), Series 2016-B, 7.25% 20454 | 1,000 | 1,024 |
| City of Arvada, Mountain Shadows Metropolitan Dist., Limited Tax G.O. Rev. Ref. and Improvement Bonds, Series 2016, 5.00% 2035 | 2,000 | 2,066 |
| City of Arvada, Mountain Shadows Metropolitan Dist., Limited Tax G.O. Rev. Ref. and Improvement Bonds, Series 2016, 5.00% 2046 | 1,000 | 1,019 |
| City of Arvada, Sabell Metropolitan Dist., Limited Tax G.O. Bonds (Convertible to Unlimited Tax), Series 2020-A, 5.00% 20502 | 1,060 | 1,073 |
| City of Arvada, Sabell Metropolitan Dist., Limited Tax G.O. Bonds, Series 2020-B-3, 8.25% 20502 | 606 | 584 |
| City of Arvada, Westown Metropolitan Dist., Limited Tax G.O. Bonds (Convertible to Unlimited Tax), Series 2017-A, 5.00% 2047 | 1,400 | 1,422 |
| County of Arvada, Haskins Station Metropolitan Dist., Limited Tax G.O. and Special Rev. Bonds, Series 2019-A, 5.00% 2039 | 650 | 661 |
| County of Arvada, Haskins Station Metropolitan Dist., Limited Tax G.O. and Special Rev. Bonds, Series 2019-A, 5.00% 2049 | 925 | 927 |
| City of Aurora, Forest Trace Metropolitan Dist. No. 3, Limited Tax G.O. Bonds, Series 2020-B, 7.875% 2049 | 933 | 940 |
| City of Aurora, International Center Metropolitan Dist. No. 3, Limited Tax G.O. Rev. Ref. and Improvement Bonds (Convertible to Unlimited Tax), Series 2016, 4.625% 2031 | 635 | 643 |
| City of Aurora, International Center Metropolitan Dist. No. 3, Limited Tax G.O. Rev. Ref. and Improvement Bonds (Convertible to Unlimited Tax), Series 2016, 5.00% 2046 | 3,140 | 3,185 |
| City of Aurora, Parkside at City Centre Business Improvement Dist., Special Rev. and Tax Supported Senior Bonds, Series 2019-A, 6.25% 2048 | 13,490 | 13,758 |
| City of Aurora, Serenity Ridge Metropolitan Dist. No. 2, Limited Tax G.O. Rev. Ref. & Improvement Bonds, Series 2018-B, 7.25% 20354 | 636 | 653 |
| City of Aurora, Serenity Ridge Metropolitan Dist. No. 2, Limited Tax Rev. Ref. & Improvement Bonds (Convertible to Unlimited Tax), Series 2018-A, 4.50% 2028 | 534 | 544 |
| City of Aurora, Serenity Ridge Metropolitan Dist. No. 2, Limited Tax Rev. Ref. & Improvement Bonds (Convertible to Unlimited Tax), Series 2018-A, 5.125% 2037 | 550 | 568 |
| City of Aurora, Serenity Ridge Metropolitan Dist. No. 2, Limited Tax Rev. Ref. & Improvement Bonds (Convertible to Unlimited Tax), Series 2018-A, 5.125% 2043 | 500 | 511 |
| City of Aurora, Southlands Metropolitan Dist. No. 1, G.O. Rev. Ref. Bonds, Series 2017-A-1, 5.00% 2037 | 2,265 | 2,417 |
| City of Aurora, Southlands Metropolitan Dist. No. 1, G.O. Rev. Ref. Bonds, Series 2017-A-1, 5.00% 2047 | 3,085 | 3,239 |
| City of Aurora, Southlands Metropolitan Dist. No. 1, G.O. Rev. Ref. Bonds, Series 2017-A-2, 5.00% 2037 | 600 | 640 |
| City of Aurora, Tallyn’s Reach Metropolitan Dist. No. 3, Limited Tax G.O. Rev. Ref. and Improvement Bonds, Series 2013, 5.00% 2033 | 504 | 516 |
| City of Aurora, Tallyn’s Reach Metropolitan Dist. No. 3, Limited Tax G.O. Rev. Ref. and Improvement Bonds, Series 2013, 5.125% 2038 | 2,070 | 2,109 |
| City of Aurora, Tallyn’s Reach Metropolitan Dist. No. 3, Limited Tax G.O. Rev. Ref. and Improvement Bonds, Series 2016-A, 6.75% 2038 | 715 | 729 |
| City of Brighton, Bromley Park Metropolitan Dist. No. 2, Limited Tax G.O. Rev. Ref. Bonds, Series 2018-B, 6.375% 2047 | 1,000 | 1,023 |
| City and County of Broomfield, Arista Metropolitan Dist., Limited Tax G.O. Rev. Ref. Bonds (Convertible to Unlimited Tax), Series 2018-A, 5.00% 2038 | 6,700 | 6,915 |
| City and County of Broomfield, Arista Metropolitan Dist., Limited Tax G.O. Rev. Ref. Bonds (Convertible to Unlimited Tax), Series 2018-A, 5.125% 2048 | 10,325 | 10,580 |
| City and County of Broomfield, Lambertson Farms Metropolitan Dist. No. 1, Improvement Rev. Ref. Bonds, Series 2015, 5.00% 2025 | 1,915 | 1,724 |
| City and County of Broomfield, Lambertson Farms Metropolitan Dist. No. 1, Improvement Rev. Ref. Bonds, Series 2015, 5.75% 2046 | 4,450 | 3,547 |
American High-Income Municipal Bond Fund — Page 11 of 77
| Bonds, notes & other debt instruments (continued) Colorado (continued) | Principal amount (000) | Value (000) |
| City and County of Broomfield, Lambertson Farms Metropolitan Dist. No. 1, Improvement Rev. Ref. Bonds, Series 2015, 6.00% 2050 | $3,700 | $2,954 |
| City and County of Broomfield, Midcities Metropolitan Dist. No. 2, Special Rev. Ref. Bonds, Series 2016-B, 7.75% 20464 | 1,428 | 1,451 |
| City and County of Broomfield, Palisade Metropolitan Dist. No. 2, Limited Tax G.O. and Rev. Bonds, Series 2016, 4.375% 2031 | 883 | 889 |
| City and County of Broomfield, Palisade Metropolitan Dist. No. 2, Limited Tax G.O. and Rev. Bonds, Series 2016, 5.00% 2046 | 3,000 | 3,042 |
| City and County of Broomfield, Palisade Metropolitan Dist. No. 2, Limited Tax G.O. and Rev. Bonds, Series 2019, 7.25% 20494 | 4,712 | 4,720 |
| Town of Castle Rock, Promenade at Castle Rock Metropolitan Dist. No. 1, Limited Tax G.O. Bonds, Series 2015-A, 5.75% 2039 | 9,300 | 9,621 |
| City of Centennial, Southglenn Metropolitan Dist., Special Rev. Ref. Bonds, Series 2016, 3.00% 2021 | 289 | 288 |
| City of Centennial, Southglenn Metropolitan Dist., Special Rev. Ref. Bonds, Series 2016, 3.50% 2026 | 500 | 492 |
| City of Centennial, Southglenn Metropolitan Dist., Special Rev. Ref. Bonds, Series 2016, 5.00% 2030 | 5,140 | 5,300 |
| City of Centennial, Southglenn Metropolitan Dist., Special Rev. Ref. Bonds, Series 2016, 5.00% 2036 | 1,620 | 1,649 |
| City of Centennial, Southglenn Metropolitan Dist., Special Rev. Ref. Bonds, Series 2016, 5.00% 2046 | 5,200 | 5,264 |
| Colorado Bridge Enterprise, Rev. Bonds (Central 70 Project), Series 2017, AMT, 4.00% 2030 | 1,505 | 1,772 |
| Colorado Bridge Enterprise, Rev. Bonds (Central 70 Project), Series 2017, AMT, 4.00% 2051 | 4,000 | 4,429 |
| Colorado Science and Technology Park Metropolitan Dist. No.1, Special Rev. Ref. and Improvement Bonds, Series 2018, 4.375% 2026 | 3,545 | 3,659 |
| Colorado Science and Technology Park Metropolitan Dist. No.1, Special Rev. Ref. and Improvement Bonds, Series 2018, 5.00% 2033 | 3,040 | 3,144 |
| Colorado Science and Technology Park Metropolitan Dist. No.1, Special Rev. Ref. and Improvement Bonds, Series 2018, 5.25% 2048 | 3,125 | 3,196 |
| City of Colorado Springs, Copper Ridge Metropolitan Dist., Tax Increment and Sales Tax Rev. Bonds, Series 2019, 4.00% 2029 | 5,650 | 5,382 |
| City of Commerce, Buffalo Ridge Metropolitan Dist., Limited Tax G.O. Bonds, Series 2018-B, 7.375% 20474 | 3,488 | 3,546 |
| City and County of Denver, 9th Avenue Metropolitan Dist. No. 2, Limited Tax G.O. Bonds, Series 2018, 5.00% 2048 | 2,475 | 2,558 |
| City and County of Denver, Belleview Station Metropolitan Dist. No. 2, Limited Tax G.O. Rev. Ref. and Improvement Bonds (Convertible to Unlimited Tax), Series 2017, 4.50% 2029 | 1,287 | 1,306 |
| City and County of Denver, Belleview Station Metropolitan Dist. No. 2, Limited Tax G.O. Rev. Ref. and Improvement Bonds (Convertible to Unlimited Tax), Series 2017, 5.00% 2036 | 605 | 614 |
| City and County of Denver, Belleview Station Metropolitan Dist. No. 2, Limited Tax G.O. Rev. Ref. and Improvement Bonds (Convertible to Unlimited Tax), Series 2017, 5.125% 2046 | 2,375 | 2,405 |
| City and County of Denver, Broadway Station Metropolitan Dist. No. 3, Limited Tax G.O. Bonds (Convertible to Unlimited Tax), Capital Appreciation Bonds, Series 2019-B, 0% 2049 (7.50% on 12/1/2027)1 | 20,665 | 11,511 |
| City and County of Denver, Broadway Station Metropolitan Dist. No. 3, Limited Tax G.O. Bonds (Convertible to Unlimited Tax), Series 2019-A, 5.00% 2039 | 3,080 | 3,116 |
| City and County of Denver, Broadway Station Metropolitan Dist. No. 3, Limited Tax G.O. Bonds (Convertible to Unlimited Tax), Series 2019-A, 5.00% 2049 | 11,775 | 11,793 |
| City and County of Denver, Dept. of Aviation, Special Facs. Airport Rev. Ref. Bonds (United Air Lines Project), Series 2017, AMT, 5.00% 2032 | 1,655 | 1,672 |
| City and County of Denver, International Center Metropolitan Dist. No. 14, Limited Tax G.O. Rev. Ref. and Improvement Bonds, Series 2018, 5.875% 2046 | 6,475 | 6,816 |
| City and County of Denver, Park Creek Metropolitan Dist., Limited Property Tax Supported Rev. Ref. Bonds, Series 2015-A, 5.00% 2026 | 2,700 | 3,274 |
| City and County of Denver, Park Creek Metropolitan Dist., Limited Property Tax Supported Rev. Ref. Bonds, Series 2015-A, 5.00% 2027 | 3,500 | 4,232 |
| City and County of Denver, Park Creek Metropolitan Dist., Limited Property Tax Supported Rev. Ref. Bonds, Series 2015-A, 5.00% 2033 | 1,000 | 1,181 |
| City of Denver, Urban Renewal Auth., Stapleton Tax Increment Rev. Bonds, Series 2013-A-1, 5.00% 2024 | 2,000 | 2,152 |
| City of Denver, Urban Renewal Auth., Stapleton Tax Increment Rev. Bonds, Series 2018-A, 5.25% 20392 | 3,750 | 3,835 |
American High-Income Municipal Bond Fund — Page 12 of 77
| Bonds, notes & other debt instruments (continued) Colorado (continued) | Principal amount (000) | Value (000) |
| City of Denver, Urban Renewal Auth., Stapleton Tax Increment Rev. Bonds, Series 2018-A, 5.25% 20392 | $3,430 | $3,507 |
| E-470 Public Highway Auth., Rev. Bonds, Capital Appreciation Bonds, Series 2006-B, National insured, 0% 2037 | 5,065 | 2,653 |
| E-470 Public Highway Auth., Rev. Bonds, Capital Appreciation Bonds, Series 2010, 0% 2040 | 3,610 | 2,253 |
| E-470 Public Highway Auth., Rev. Bonds, Series 2010-C, 5.375% 2026 | 1,000 | 1,004 |
| E-470 Public Highway Auth., Rev. Bonds, Series 2017-B, (1-month USD-LIBOR x 0.67 + 1.05%) 1.161% 2039 (put 2021)3 | 1,000 | 1,000 |
| County of El Paso, Flying Horse Metropolitan Dist. No. 3, Limited Tax G.O. Rev. Ref. Bonds, Series 2019, 6.00% 20492,4 | 2,965 | 3,002 |
| County of Elbert, Independence Metropolitan Dist. No. 3, Limited Tax G.O. Bonds, Series 2019-A, 6.25% 2049 | 4,700 | 4,938 |
| Town of Erie, Erie Commons Metropolitan Dist. No. 2, Limited Tax G.O. Bonds, Series 2019-B, 6.95% 2054 | 3,100 | 3,059 |
| City of Fort Collins, Harmony Technology Park Metropolitan Dist. No. 2, Limited Tax G.O. Bonds (Convertible to Unlimited Tax), Series 2017, 5.00% 2047 | 5,270 | 5,358 |
| Health Facs. Auth., Health Care Facs. Rev. Bonds (American Baptist Homes of the Midwest Obligated Group), Series 2013, 8.00% 2043 | 11,100 | 11,815 |
| Health Facs. Auth., Health Facs. Rev. and Rev. Ref. Bonds (Evangelical Lutheran Good Samaritan Society Project), Series 2015-A, 5.00% 2030 (preref. 2025) | 3,000 | 3,675 |
| Health Facs. Auth., Health Facs. Rev. and Rev. Ref. Bonds (Evangelical Lutheran Good Samaritan Society Project), Series 2015-A, 5.00% 2032 | 1,500 | 1,837 |
| Health Facs. Auth., Health Facs. Rev. and Rev. Ref. Bonds (Evangelical Lutheran Good Samaritan Society Project), Series 2015-A, 5.00% 2036 | 2,360 | 2,891 |
| Health Facs. Auth., Health Facs. Rev. and Rev. Ref. Bonds (Evangelical Lutheran Good Samaritan Society Project), Series 2015-A, 5.00% 2045 (preref. 2025) | 1,000 | 1,225 |
| Health Facs. Auth., Health Facs. Rev. and Rev. Ref. Bonds (Evangelical Lutheran Good Samaritan Society Project), Series 2017, 5.00% 2037 (preref. 2027) | 2,300 | 2,999 |
| Health Facs. Auth., Health Facs. Rev. and Rev. Ref. Bonds (Evangelical Lutheran Good Samaritan Society Project), Series 2017, 5.00% 2047 (preref. 2027) | 3,520 | 4,590 |
| Health Facs. Auth., Health Facs. Rev. Bonds (Evangelical Lutheran Good Samaritan Society Project), Series 2012, 5.00% 2042 (preref. 2022) | 4,600 | 5,004 |
| Health Facs. Auth., Hospital Rev. Bonds (Parkview Medical Center, Inc. Project), Series 2020-A, 4.00% 2050 | 1,150 | 1,273 |
| Health Facs. Auth., Rev. Bonds (CommonSpirit Health), Series 2019-A-2, 4.00% 2049 | 5,000 | 5,562 |
| Health Facs. Auth., Rev. Bonds (CommonSpirit Health), Series 2019-A-2, 5.00% 2044 | 2,500 | 3,049 |
| Health Facs. Auth., Rev. Bonds (CommonSpirit Health), Series 2019-B-2, 5.00% 2049 (put 2026) | 5,000 | 5,959 |
| Health Facs. Auth., Rev. Bonds (Covenant Retirement Communities, Inc.), Series 2018, 5.00% 2048 | 2,480 | 2,710 |
| Health Facs. Auth., Rev. Bonds (Senior Residences Project), Series 2012, 7.00% 20425 | 2,500 | 1,375 |
| Health Facs. Auth., Rev. Bonds (Senior Residences Project), Series 2012, 7.125% 20475 | 5,500 | 3,025 |
| Health Facs. Auth., Rev. Improvement Bonds (Frasier Meadows Retirement Community Project), Series 2017-B, 5.00% 2027 | 1,055 | 1,111 |
| Health Facs. Auth., Rev. Improvement Bonds (Frasier Meadows Retirement Community Project), Series 2017-B, 5.00% 2039 | 2,045 | 2,153 |
| Health Facs. Auth., Rev. Improvement Bonds (Frasier Meadows Retirement Community Project), Series 2017-B, 5.00% 2048 | 3,890 | 4,096 |
| Health Facs. Auth., Rev. Ref. and Improvement Bonds (Christian Living Neighborhoods Project), Series 2019, 4.00% 2026 | 260 | 256 |
| Health Facs. Auth., Rev. Ref. and Improvement Bonds (Christian Living Neighborhoods Project), Series 2019, 4.00% 2027 | 590 | 578 |
| Health Facs. Auth., Rev. Ref. and Improvement Bonds (Christian Living Neighborhoods Project), Series 2019, 4.00% 2028 | 245 | 238 |
| Health Facs. Auth., Rev. Ref. and Improvement Bonds (Christian Living Neighborhoods Project), Series 2019, 4.00% 2029 | 600 | 580 |
| Health Facs. Auth., Rev. Ref. and Improvement Bonds (Christian Living Neighborhoods Project), Series 2019, 4.00% 2038 | 1,150 | 990 |
| Health Facs. Auth., Rev. Ref. and Improvement Bonds (Christian Living Neighborhoods Project), Series 2019, 5.00% 2038 | 1,500 | 1,523 |
American High-Income Municipal Bond Fund — Page 13 of 77
| Bonds, notes & other debt instruments (continued) Colorado (continued) | Principal amount (000) | Value (000) |
| Health Facs. Auth., Rev. Ref. and Improvement Bonds (Frasier Meadows Retirement Community Project), Series 2017-A, 5.00% 2027 | $455 | $511 |
| Health Facs. Auth., Rev. Ref. and Improvement Bonds (Frasier Meadows Retirement Community Project), Series 2017-A, 5.25% 2031 | 2,395 | 2,741 |
| Health Facs. Auth., Rev. Ref. and Improvement Bonds (Frasier Meadows Retirement Community Project), Series 2017-A, 5.25% 2032 | 850 | 973 |
| Health Facs. Auth., Rev. Ref. and Improvement Bonds (Frasier Meadows Retirement Community Project), Series 2017-A, 5.25% 2037 | 2,300 | 2,632 |
| Health Facs. Auth., Rev. Ref. and Improvement Bonds (Frasier Meadows Retirement Community Project), Series 2017-A, 5.25% 2047 | 1,500 | 1,716 |
| Health Facs. Auth., Rev. Ref. Bonds (Christian Living Neighborhoods Project), Series 2016, 5.00% 2026 | 750 | 780 |
| Health Facs. Auth., Rev. Ref. Bonds (Christian Living Neighborhoods Project), Series 2016, 5.00% 2031 | 3,345 | 3,421 |
| Health Facs. Auth., Rev. Ref. Bonds (Christian Living Neighborhoods Project), Series 2016, 5.00% 2037 | 7,250 | 7,273 |
| Health Facs. Auth., Rev. Ref. Bonds (Covenant Retirement Communities, Inc.), Series 2012-A, 5.00% 2033 | 4,750 | 4,951 |
| Health Facs. Auth., Rev. Ref. Bonds (Covenant Retirement Communities, Inc.), Series 2013-A, 5.75% 2036 | 1,000 | 1,088 |
| Health Facs. Auth., Rev. Ref. Bonds (Covenant Retirement Communities, Inc.), Series 2015-A, 5.00% 2029 | 1,520 | 1,672 |
| Health Facs. Auth., Rev. Ref. Bonds (Covenant Retirement Communities, Inc.), Series 2015-A, 5.00% 2035 | 2,500 | 2,697 |
| Housing and Fin. Auth., Single Family Mortgage Bonds, Series 2018-C, Class I, 4.25% 2048 | 1,320 | 1,467 |
| City and County of Jefferson, Dinosaur Ridge Metropolitan Dist., Special Rev. Ref. and Improvement Bonds, Series 2019, 5.00% 2049 | 3,500 | 3,522 |
| Town of Johnstown, Thompson Crossing Metropolitan Dist. No. 4, Limited Tax G.O. Rev. Ref. and Improvement Bonds (Convertible to Unlimited Tax), Series 2019, 5.00% 2039 | 1,400 | 1,467 |
| Town of Johnstown, Thompson Crossing Metropolitan Dist. No. 4, Limited Tax G.O. Rev. Ref. and Improvement Bonds (Convertible to Unlimited Tax), Series 2019, 5.00% 2049 | 6,875 | 7,002 |
| City of Lakewood, Plaza Metropolitan Dist. No. 1, Rev. Ref. Bonds, Series 2013, 5.00% 20202 | 1,500 | 1,512 |
| City of Littleton, Littleton Village Metropolitan Dist. No. 2, Special Rev. Ref. Bonds, Series 2018-B, 7.625% 20284 | 1,140 | 1,179 |
| City of Loveland, Centerra Metropolitan Dist. No. 1, Special Rev. Ref. and Improvement Bonds, Series 2017, 5.00% 20212 | 1,500 | 1,534 |
| City of Loveland, Centerra Metropolitan Dist. No. 1, Special Rev. Ref. and Improvement Bonds, Series 2017, 5.00% 20222 | 1,900 | 1,967 |
| Town of Parker, Cottonwood Highlands Metropolitan Dist. No. 1, Limited Tax G.O. Bonds (Convertible to Unlimited Tax), Series 2019-A, 5.00% 2049 | 900 | 912 |
| Town of Parker, Retta Ridge Village Metropolitan Dist. No. 2, Limited Tax G.O. Bonds, Series 2019-A, 5.00% 2049 | 905 | 922 |
| Town of Parker, Retta Ridge Village Metropolitan Dist. No. 2, Limited Tax G.O. Bonds, Series 2019-B, 8.00% 2049 | 614 | 617 |
| Town of Parker, Westcreek Metropolitan Dist. No. 2, Limited Tax G.O. Bonds, Series 2019-A, 5.375% 2048 | 800 | 820 |
| Public Auth. for Colorado Energy, Natural Gas Purchase Rev. Bonds, Series 2008, 6.25% 2028 | 2,000 | 2,566 |
| Regional Transportation Dist., Private Activity Bonds (Denver Transit Partners Eagle P3 Project), Series 2010, 6.00% 2034 | 1,700 | 1,703 |
| Regional Transportation Dist., Private Activity Bonds (Denver Transit Partners Eagle P3 Project), Series 2010, 6.00% 2041 | 13,800 | 13,825 |
| Town of Severance, Hunters Overlook Metropolitan Dist. No. 5, Limited Tax G.O. Bonds, Series 2019-A, 5.00% 2039 | 910 | 938 |
| Town of Severance, Hunters Overlook Metropolitan Dist. No. 5, Limited Tax G.O. Bonds, Series 2019-A, 5.00% 2049 | 1,235 | 1,262 |
| Town of Severance, Hunters Overlook Metropolitan Dist. No. 5, Limited Tax G.O. Bonds, Series 2019-B, 8.50% 20494 | 1,825 | 1,839 |
| Town of Snowmass Village, Base Village Metropolitan Dist. No. 2, Limited Tax G.O. Rev. Ref. Bonds, Series 2016-A, 5.50% 2036 | 4,750 | 4,916 |
| Town of Snowmass Village, Base Village Metropolitan Dist. No. 2, Limited Tax G.O. Rev. Ref. Bonds, Series 2016-A, 5.75% 2046 | 2,585 | 2,671 |
| Town of Superior, STC Metropolitan Dist. No. 2, Limited Tax G.O. and Special Rev. Bonds, Series 2019-B, 8.00% 2049 | 3,954 | 3,888 |
American High-Income Municipal Bond Fund — Page 14 of 77
| Bonds, notes & other debt instruments (continued) Colorado (continued) | Principal amount (000) | Value (000) |
| Town of Superior, STC Metropolitan Dist. No. 2, Limited Tax G.O. and Special Rev. Ref. and Improvement Bonds, Series 2019-A, 4.00% 2029 | $1,870 | $1,873 |
| Town of Superior, STC Metropolitan Dist. No. 2, Limited Tax G.O. and Special Rev. Ref. and Improvement Bonds, Series 2019-A, 5.00% 2038 | 5,705 | 5,831 |
| Town of Superior, STC Metropolitan Dist. No. 2, Limited Tax G.O. and Special Rev. Ref. and Improvement Bonds, Series 2019-A, 5.00% 2049 | 6,095 | 6,160 |
| City of Thornton, Big Dry Creek Metropolitan Dist., Limited Tax G.O. Bonds (Convertible to Unlimited Tax), Series 2017-A, 5.75% 2047 | 2,415 | 2,508 |
| City of Thornton, Big Dry Creek Metropolitan Dist., Limited Tax G.O. Bonds, Series 2017-B, 7.75% 20474 | 644 | 662 |
| Town of Vail, Solaris Metropolitan Dist. No. 3, Limited Tax G.O. Rev. Ref. Bonds (Convertible to Unlimited Tax), Series 2016-A, 5.00% 2036 | 1,835 | 1,889 |
| Town of Vail, Solaris Metropolitan Dist. No. 3, Limited Tax G.O. Rev. Ref. Bonds (Convertible to Unlimited Tax), Series 2016-A, 5.00% 2046 | 9,385 | 9,611 |
| Town of Vail, Solaris Metropolitan Dist. No. 3, Limited Tax G.O. Rev. Ref. Bonds, Series 2016-B, 7.00% 20464 | 1,500 | 1,511 |
| County of Weld, Vista Ridge Metropolitan Dist., Limited Tax G.O. Rev. Ref. Bonds, Series 2006-B, 9.50% 2040 (preref. 2021)1 | 985 | 1,118 |
| Town of Windsor, Iron Mountain Metropolitan Dist. No. 2, Limited Tax G.O. Bonds, Series 2019-B, 8.00% 2049 | 1,000 | 1,004 |
| Town of Windsor, Iron Mountain Metropolitan Dist. No. 2, Limited Tax G.O. Rev. Ref. and Improvement Bonds, Series 2019-A, 5.00% 2039 | 1,000 | 1,023 |
| Town of Windsor, Iron Mountain Metropolitan Dist. No. 2, Limited Tax G.O. Rev. Ref. and Improvement Bonds, Series 2019-A, 5.00% 2049 | 1,800 | 1,819 |
| 459,291 | ||
| Connecticut 0.80% | ||
| G.O. Bonds, Series 2018-E, 5.00% 2028 | 1,000 | 1,309 |
| Harbor Point Infrastructure Improvement Dist., Special Obligation Rev. Ref. Bonds (Harbor Point Project), Series 2017, 5.00% 20302 | 3,250 | 3,598 |
| Harbor Point Infrastructure Improvement Dist., Special Obligation Rev. Ref. Bonds (Harbor Point Project), Series 2017, 5.00% 20392 | 11,055 | 11,875 |
| Health and Educational Facs. Auth., Rev. Bonds (Griffin Hospital Issue), Series 2020-G-1, 5.00% 20392 | 1,000 | 1,108 |
| Health and Educational Facs. Auth., Rev. Bonds (Griffin Hospital Issue), Series 2020-G-1, 5.00% 20442 | 1,000 | 1,082 |
| Health and Educational Facs. Auth., Rev. Bonds (Healthcare Fac. Expansion Issue - Church Home of Hartford Inc. Project), Series 2016-A, 5.00% 20532 | 1,640 | 1,673 |
| Health and Educational Facs. Auth., Rev. Bonds (Mary Wade Home Obligated Group), Series 2019-A-1, 5.00% 20392 | 1,000 | 1,020 |
| Health and Educational Facs. Auth., Rev. Bonds (Mary Wade Home Obligated Group), Series 2019-A-1, 5.00% 20542 | 12,000 | 12,015 |
| Health and Educational Facs. Auth., Rev. Bonds (McLean Affiliates Inc.), Series 2020-A, 5.00% 20452 | 1,455 | 1,535 |
| Health and Educational Facs. Auth., Rev. Bonds (McLean Affiliates Inc.), Series 2020-A, 5.00% 20552 | 1,625 | 1,699 |
| Higher Education Supplemental Loan Auth., Rev. Bonds (Chesla Loan Program), Series 2017-A, AMT, 4.00% 2030 | 840 | 906 |
| Higher Education Supplemental Loan Auth., Rev. Bonds (Chesla Loan Program), Series 2017-A, AMT, 4.00% 2031 | 840 | 902 |
| Higher Education Supplemental Loan Auth., Rev. Bonds (Chesla Loan Program), Series 2017-A, AMT, 4.125% 2032 | 830 | 893 |
| Higher Education Supplemental Loan Auth., Rev. Bonds (Chesla Loan Program), Series 2017-A, AMT, 4.125% 2033 | 415 | 445 |
| Higher Education Supplemental Loan Auth., Rev. Bonds (Chesla Loan Program), Series 2020-B, AMT, 3.25% 2036 | 1,700 | 1,724 |
| Housing Fin. Auth., Housing Mortgage Fin. Program Bonds, Series 2018-A-2, AMT, 4.00% 2041 | 1,595 | 1,735 |
| Mohegan Tribe of Indians, Gaming Auth., Priority Distribution Payment Bonds, Series 2016-A, 5.50% 20262 | 5,610 | 5,859 |
| Mohegan Tribe of Indians, Gaming Auth., Priority Distribution Payment Rev. Ref. Bonds, Series 2015, 7.00% 20452 | 2,490 | 2,444 |
American High-Income Municipal Bond Fund — Page 15 of 77
| Bonds, notes & other debt instruments (continued) Connecticut (continued) | Principal amount (000) | Value (000) |
| Mohegan Tribe of Indians, Gaming Auth., Priority Distribution Payment Rev. Ref. Bonds, Series 2015-A, 6.75% 20452 | $9,305 | $9,636 |
| Mohegan Tribe of Indians, Gaming Auth., Priority Distribution Payment Rev. Ref. Bonds, Series 2015-C, 6.25% 20302 | 4,500 | 4,898 |
| 66,356 | ||
| Delaware 0.03% | ||
| Health Facs. Auth., Rev. Bonds (Beebe Medical Center Project), Series 2018, 5.00% 2050 | 2,235 | 2,598 |
| District of Columbia 0.64% | ||
| Dulles Toll Road Rev. Bonds (Dulles Metrorail and Capital Improvement Projects), Series 2010-B, 6.50% 20441 | 5,000 | 6,572 |
| Metropolitan Washington DC Airports Auth., Dulles Toll Road Rev. Bonds, Capital Appreciation Bonds, Series 2009-B, Assured Guaranty Municipal insured, 0% 2035 | 6,000 | 4,046 |
| Metropolitan Washington DC Airports Auth., Dulles Toll Road Rev. Bonds, Capital Appreciation Bonds, Series 2010-A, Assured Guaranty Municipal insured, 0% 2037 | 10,255 | 6,453 |
| Metropolitan Washington DC Airports Auth., Dulles Toll Road Rev. Ref. Bonds (Dulles Metrorail and Capital Improvement Projects), Series 2019-B, 4.00% 2053 | 8,000 | 8,802 |
| Rev. Bonds (DC International School Issue), Series 2019, 5.00% 2039 | 1,000 | 1,142 |
| Rev. Bonds (DC International School Issue), Series 2019, 5.00% 2049 | 1,275 | 1,424 |
| Rev. Bonds (Friendship Public Charter School, Inc. Issue), Series 2016-A, 5.00% 2036 | 1,295 | 1,450 |
| Rev. Bonds (Friendship Public Charter School, Inc. Issue), Series 2016-A, 5.00% 2041 | 1,545 | 1,708 |
| Rev. Bonds (Friendship Public Charter School, Inc. Issue), Series 2016-A, 5.00% 2046 | 1,850 | 2,030 |
| Rev. Bonds (Ingleside at Rock Creek Project), Series 2017-A, 5.00% 2032 | 1,000 | 997 |
| Rev. Bonds (Ingleside at Rock Creek Project), Series 2017-A, 5.00% 2052 | 1,750 | 1,580 |
| Rev. Ref. Bonds (KIPP DC Issue), Series 2017-B, 5.00% 2048 | 4,220 | 4,813 |
| Tobacco Settlement Fncg. Corp., Tobacco Settlement Asset-Backed Bonds, Capital Appreciation Bonds, Series 2006-A, 0% 2046 | 60,820 | 12,382 |
| 53,399 | ||
| Florida 5.09% | ||
| County of Alachua, Health Facs. Auth., Continuing Care Retirement Community Rev. Ref. Bonds (Oak Hammock at the University of Florida, Inc. Project), Series 2012-A, 8.00% 2032 | 500 | 555 |
| County of Alachua, Health Facs. Auth., Continuing Care Retirement Community Rev. Ref. Bonds (Oak Hammock at the University of Florida, Inc. Project), Series 2012-A, 8.00% 2042 | 2,000 | 2,200 |
| County of Alachua, Health Facs. Auth., Continuing Care Retirement Community Rev. Ref. Bonds (Oak Hammock at the University of Florida, Inc. Project), Series 2012-A, 8.00% 2046 | 1,500 | 1,647 |
| County of Alachua, Health Facs. Auth., Health Facs. Rev. Bonds (Shands HealthCare Project), Series 2007-A, (3-month USD-LIBOR x 0.67 + 0.87%) 1.104% 20373 | 1,745 | 1,685 |
| County of Alachua, Health Facs. Auth., Health Facs. Rev. Ref. Bonds (Shands HealthCare Project), Series 2014-A, 5.00% 2044 | 3,700 | 4,121 |
| County of Alachua, Health Facs. Auth., Health Facs. Rev. Ref. Bonds, Series 2019-A, 4.00% 2049 | 2,500 | 2,800 |
| County of Alachua, Parker Road Community Dev. Dist., Capital Improvement Rev. Ref. and Rev. Bonds, Series 2020, 3.10% 2025 | 275 | 276 |
| County of Alachua, Parker Road Community Dev. Dist., Capital Improvement Rev. Ref. and Rev. Bonds, Series 2020, 3.375% 2030 | 335 | 335 |
| County of Alachua, Parker Road Community Dev. Dist., Capital Improvement Rev. Ref. and Rev. Bonds, Series 2020, 3.875% 2040 | 900 | 894 |
| County of Alachua, Parker Road Community Dev. Dist., Capital Improvement Rev. Ref. and Rev. Bonds, Series 2020, 4.10% 2050 | 1,000 | 1,002 |
| City of Atlantic Beach, Health Care Facs. Rev. Bonds (Fleet Landing Project), Series 2018-A, 5.00% 2043 | 365 | 385 |
| City of Atlantic Beach, Health Care Facs. Rev. Bonds (Fleet Landing Project), Series 2018-A, 5.00% 2048 | 3,000 | 3,151 |
| City of Atlantic Beach, Health Care Facs. Rev. Bonds (Fleet Landing Project), Series 2018-A, 5.00% 2053 | 2,450 | 2,565 |
| County of Brevard, Educational Facs. Auth., Demand Rev. Bonds (Florida Institute of Technology Project), Series 2014, 5.00% 2032 | 2,470 | 2,778 |
American High-Income Municipal Bond Fund — Page 16 of 77
| Bonds, notes & other debt instruments (continued) Florida (continued) | Principal amount (000) | Value (000) |
| County of Brevard, Educational Facs. Auth., Demand Rev. Bonds (Florida Institute of Technology Project), Series 2014, 5.00% 2039 | $750 | $833 |
| County of Broward, Airport System Rev. Bonds, Series 2019-A, AMT, 4.00% 2044 | 29,215 | 32,886 |
| County of Broward, Airport System Rev. Ref. Bonds, Series 2013-A, 5.25% 2043 (preref. 2023) | 2,000 | 2,303 |
| County of Broward, Airport System Rev. Ref. Bonds, Series 2015-A, AMT, 5.00% 2034 | 2,000 | 2,316 |
| County of Broward, Airport System Rev. Ref. Bonds, Series 2015-A, AMT, 5.00% 2035 | 2,000 | 2,309 |
| Capital Trust Agcy., Educational Facs. Rev. Bonds (Advantage Academy of Hillborough), Series 2019, 4.00% 2024 | 215 | 228 |
| Capital Trust Agcy., Educational Facs. Rev. Bonds (Advantage Academy of Hillborough), Series 2019, 5.00% 2029 | 405 | 462 |
| Capital Trust Agcy., Educational Facs. Rev. Bonds (Advantage Academy of Hillborough), Series 2019, 5.00% 2039 | 1,770 | 1,955 |
| Capital Trust Agcy., Educational Facs. Rev. Bonds (Advantage Academy of Hillborough), Series 2019, 5.00% 2054 | 1,400 | 1,520 |
| Capital Trust Agcy., Educational Facs. Rev. Bonds (Charter Educational Foundation Inc.), Series 2018-A, 5.375% 20382 | 1,105 | 1,178 |
| Capital Trust Agcy., Educational Facs. Rev. Bonds (Charter Educational Foundation Inc.), Series 2018-A, 5.375% 20482 | 2,595 | 2,725 |
| Capital Trust Agcy., Educational Facs. Rev. Bonds (Franklin Academy Projects), Series 2020, 5.00% 20352 | 1,085 | 1,168 |
| Capital Trust Agcy., Educational Facs. Rev. Bonds (Franklin Academy Projects), Series 2020, 5.00% 20402 | 1,220 | 1,300 |
| Capital Trust Agcy., Educational Facs. Rev. Bonds (Franklin Academy Projects), Series 2020, 5.00% 20502 | 3,695 | 3,896 |
| Capital Trust Agcy., Educational Facs. Rev. Bonds (Franklin Academy Projects), Series 2020, 5.00% 20552 | 2,845 | 2,992 |
| Capital Trust Agcy., Educational Facs. Rev. Bonds (Imagine School at Land O’ Lakes Project), Series 2020-A, 5.00% 20392 | 1,285 | 1,368 |
| Capital Trust Agcy., Educational Facs. Rev. Bonds (Imagine School at Land O’ Lakes Project), Series 2020-A, 5.00% 20542 | 1,075 | 1,119 |
| Capital Trust Agcy., Educational Facs. Rev. Bonds (Odyssey Charter School), Series 2019, 5.00% 20492 | 1,280 | 1,338 |
| Capital Trust Agcy., Educational Facs. Rev. Bonds (Odyssey Charter School), Series 2019, 5.00% 20542 | 2,385 | 2,484 |
| Capital Trust Agcy., Educational Facs. Rev. Bonds (Renaissance Charter School), Series 2017-A, 5.125% 20372 | 5,225 | 5,613 |
| Capital Trust Agcy., Educational Facs. Rev. Bonds (Renaissance Charter School), Series 2017-A, 5.25% 20472 | 9,900 | 10,583 |
| Capital Trust Agcy., Educational Facs. Rev. Bonds (Viera Charter Schools Inc. Project), Series 2017-A, 5.00% 20372 | 1,370 | 1,420 |
| Capital Trust Agcy., Educational Facs. Rev. Bonds (Viera Charter Schools Inc. Project), Series 2017-A, 5.00% 20472 | 3,070 | 3,133 |
| Capital Trust Agcy., Educational Facs. Rev. Bonds (Viera Charter Schools Inc. Project), Series 2017-A, 5.00% 20522 | 1,790 | 1,820 |
| Capital Trust Agcy., Educational Facs. Rev. Bonds (Viera Charter Schools Inc. Project), Series 2019-A, 4.00% 20292 | 445 | 455 |
| Capital Trust Agcy., Educational Facs. Rev. Bonds (Viera Charter Schools Inc. Project), Series 2019-A, 5.00% 20392 | 1,125 | 1,163 |
| Capital Trust Agcy., Educational Facs. Rev. Bonds (Viera Charter Schools Inc. Project), Series 2019-A, 5.00% 20492 | 1,610 | 1,641 |
| Capital Trust Agcy., Educational Facs. Rev. Bonds (Viera Charter Schools Inc. Project), Series 2019-A, 5.00% 20542 | 1,340 | 1,361 |
| Central Florida Expressway Auth., Rev. Ref. Bonds, Series 2017, 5.00% 2039 | 1,000 | 1,226 |
| County of Collier, Health Facs. Auth., Residential Care Fac. Rev. Bonds (Moorings Inc.), Series 2015-A, 5.00% 2048 | 5,000 | 5,875 |
| Town of Davie, Educational Facs. Rev. Bonds (Nova Southeastern University Project), Series 2013-A, 6.00% 2042 | 400 | 459 |
| Dev. Fin. Corp., Healthcare Facs. Rev. Bonds (Renaissance Charter School Inc.), Series 2020-C, 4.00% 20302 | 470 | 490 |
| Dev. Fin. Corp., Healthcare Facs. Rev. Bonds (Renaissance Charter School Inc.), Series 2020-C, 5.00% 20402 | 1,050 | 1,125 |
| Dev. Fin. Corp., Healthcare Facs. Rev. Bonds (Renaissance Charter School Inc.), Series 2020-C, 5.00% 20502 | 2,055 | 2,186 |
| Dev. Fin. Corp., Healthcare Facs. Rev. Bonds (UF Health - Jacksonville Project), Series 2013-A, 5.50% 2028 | 1,535 | 1,657 |
| Dev. Fin. Corp., Healthcare Facs. Rev. Bonds (UF Health - Jacksonville Project), Series 2013-A, 6.00% 2033 | 14,630 | 15,545 |
American High-Income Municipal Bond Fund — Page 17 of 77
| Bonds, notes & other debt instruments (continued) Florida (continued) | Principal amount (000) | Value (000) |
| Dev. Fin. Corp., Solid Waste Disposal Rev. Bonds (Waste Pro USA, Inc. Project), Series 2017, AMT, 5.00% 2029 (put 2022)2 | $8,330 | $8,554 |
| Dev. Fin. Corp., Solid Waste Disposal Rev. Bonds (Waste Pro USA, Inc. Project), Series 2019, AMT, 5.00% 20292 | 3,000 | 3,212 |
| County of Escambia, Health Facs. Auth., Health Care Facs. Rev. Bonds (Baptist Health Care Corp. Obligated Group), Series 2020-A, 4.00% 2050 | 5,860 | 6,438 |
| County of Escambia, Health Facs. Auth., Health Care Facs. Rev. Bonds (Baptist Hospital, Inc. Project), Series 2010-A, 5.75% 2029 | 5,250 | 5,261 |
| Halifax Hospital Medical Center, Hospital Rev. Ref. Bonds, Series 2016, 5.00% 2028 | 1,000 | 1,196 |
| Halifax Hospital Medical Center, Hospital Rev. Ref. Bonds, Series 2016, 5.00% 2030 | 2,750 | 3,270 |
| Higher Educational Facs. Fncg. Auth., Educational Facs. Rev. Bonds (Florida Institute of Technology), Series 2019, 4.00% 2044 | 1,000 | 1,007 |
| Higher Educational Facs. Fncg. Auth., Educational Facs. Rev. Bonds (Florida Institute of Technology), Series 2019, 4.00% 2049 | 1,000 | 1,002 |
| Higher Educational Facs. Fncg. Auth., Educational Facs. Rev. Bonds (Florida Institute of Technology), Series 2019, 5.00% 2035 | 750 | 835 |
| Higher Educational Facs. Fncg. Auth., Educational Facs. Rev. Bonds (Jacksonville University Project), Series 2018-A-1, 4.50% 20332 | 2,000 | 1,965 |
| Higher Educational Facs. Fncg. Auth., Educational Facs. Rev. Bonds (Jacksonville University Project), Series 2018-A-1, 4.75% 20382 | 2,150 | 2,104 |
| Higher Educational Facs. Fncg. Auth., Educational Facs. Rev. Bonds (Jacksonville University Project), Series 2018-A-1, 5.00% 20482 | 3,000 | 2,960 |
| Higher Educational Facs. Fncg. Auth., Educational Facs. Rev. Bonds (Jacksonville University Project), Series 2018-B, 5.00% 20532 | 3,000 | 2,933 |
| JEA, Water and Sewer System Rev. Bonds, Series 2017-A, 5.00% 2027 | 1,000 | 1,302 |
| County of Lee, Airport Rev. Ref. Bonds, Series 2011-A, AMT, 5.375% 2032 | 9,935 | 10,321 |
| County of Lee, Industrial Dev. Auth., Healthcare Facs. Rev. Ref. Bonds (Shell Point/Alliance Obligated Group, Shell Point Project), Series 2011-B, 6.50% 2031 | 2,600 | 2,719 |
| County of Lee, Industrial Dev. Auth., Healthcare Facs. Rev. Ref. Bonds (Shell Point/Alliance Obligated Group, Shell Point Project), Series 2019, 5.00% 2039 | 1,975 | 2,158 |
| County of Lee, Industrial Dev. Auth., Healthcare Facs. Rev. Ref. Bonds (Shell Point/Alliance Obligated Group, Shell Point Project), Series 2019, 5.00% 2044 | 5,250 | 5,686 |
| County of Lee, Industrial Dev. Auth., Healthcare Facs. Rev. Ref. Bonds (Shell Point/Alliance Obligated Group, Shell Point Project), Series 2019, 5.00% 2049 | 7,805 | 8,411 |
| Counties of Manatee and Sarasota, Lakewood Ranch Stewardship Dist., Special Assessment Rev. Bonds (Lakewood Centre North), Series 2015, 4.875% 2035 | 465 | 489 |
| Counties of Manatee and Sarasota, Lakewood Ranch Stewardship Dist., Special Assessment Rev. Bonds (Lakewood Centre North), Series 2015, 4.875% 2045 | 1,985 | 2,066 |
| Counties of Manatee and Sarasota, Lakewood Ranch Stewardship Dist., Special Assessment Rev. Bonds (Lakewood National and Polo Run Project), Series 2017, 5.25% 2037 | 1,000 | 1,090 |
| Counties of Manatee and Sarasota, Lakewood Ranch Stewardship Dist., Special Assessment Rev. Bonds (Lakewood National and Polo Run Project), Series 2017, 5.375% 2047 | 1,100 | 1,195 |
| County of Martin, Health Facs. Auth., Hospital Rev. Bonds (Martin Memorial Medical Center), Series 2012, 5.50% 2042 (preref. 2021) | 3,000 | 3,204 |
| City of Miami, Midtown Miami Community Dev. Dist., Special Assessment and Rev. Ref. Bonds (Infrastructure Project), Series 2014-B, 5.00% 2037 | 1,735 | 1,793 |
| City of Miami, Midtown Miami Community Dev. Dist., Special Assessment and Rev. Ref. Bonds (Parking Garage Project), Series 2014-A, 4.25% 2024 | 1,665 | 1,725 |
| County of Miami-Dade, Expressway Auth., Toll System Rev. Ref. Bonds, Series 2016-A, 5.00% 2030 | 1,225 | 1,457 |
| City of Miami Beach, Health Facs. Auth., Hospital Rev. Ref. Bonds (Mount Sinai Medical Center of Florida), Series 2012, 5.00% 2021 | 1,000 | 1,053 |
| City of Miami Beach, Health Facs. Auth., Hospital Rev. Ref. Bonds (Mount Sinai Medical Center of Florida), Series 2012, 5.00% 2022 | 1,750 | 1,913 |
| City of Miami Beach, Health Facs. Auth., Hospital Rev. Ref. Bonds (Mount Sinai Medical Center of Florida), Series 2014, 5.00% 2039 | 1,500 | 1,647 |
American High-Income Municipal Bond Fund — Page 18 of 77
| Bonds, notes & other debt instruments (continued) Florida (continued) | Principal amount (000) | Value (000) |
| North Broward Hospital Dist., Rev. Bonds (Broward Health), Series 2017-B, 5.00% 2035 | $3,225 | $3,838 |
| North Broward Hospital Dist., Rev. Bonds (Broward Health), Series 2017-B, 5.00% 2036 | 4,000 | 4,744 |
| North Broward Hospital Dist., Rev. Bonds (Broward Health), Series 2017-B, 5.00% 2042 | 17,500 | 20,324 |
| North Broward Hospital Dist., Rev. Bonds (Broward Health), Series 2017-B, 5.00% 2048 | 11,500 | 13,154 |
| City of North Port, West Villages Improvement Dist., Special Assessment Bonds (Unit of Dev. No. 2), Series 2019-A-1, 5.75% 2036 | 2,625 | 2,123 |
| City of North Port, West Villages Improvement Dist., Special Assessment Bonds (Unit of Dev. No. 2), Series 2019-A-2, 5.75% 2036 | 2,295 | 1,331 |
| County of Okaloosa, Mid-Bay Bridge Auth., Rev. Bonds, Series 2015-A, 5.00% 2035 | 1,000 | 1,122 |
| County of Okaloosa, Mid-Bay Bridge Auth., Rev. Bonds, Series 2015-A, 5.00% 2040 | 1,000 | 1,117 |
| County of Okaloosa, Mid-Bay Bridge Auth., Rev. Bonds, Series 2015-C, 5.00% 2040 | 1,935 | 2,151 |
| County of Orange, Health Facs. Auth., Health Care Facs. Rev. Bonds (Presbyterian Retirement Communities Project), Series 2015, 5.00% 2035 | 1,500 | 1,679 |
| County of Orange, Health Facs. Auth., Health Care Facs. Rev. Bonds (Presbyterian Retirement Communities Project), Series 2015, 5.00% 2040 | 3,000 | 3,326 |
| County of Orange, Health Facs. Auth., Health Care Facs. Rev. Bonds (Presbyterian Retirement Communities Project), Series 2015, 5.00% 2045 | 4,300 | 4,738 |
| County of Orange, Health Facs. Auth., Health Care Facs. Rev. Bonds (Presbyterian Retirement Communities Project), Series 2016, 5.00% 2036 | 4,100 | 4,508 |
| County of Orange, Health Facs. Auth., Health Care Facs. Rev. Bonds (Presbyterian Retirement Communities Project), Series 2016, 5.00% 2041 | 4,880 | 5,336 |
| County of Orange, Health Facs. Auth., Health Care Facs. Rev. Bonds (Presbyterian Retirement Communities Project), Series 2016, 5.00% 2047 | 6,280 | 6,841 |
| County of Orange, Health Facs. Auth., Hospital Rev. Ref. Bonds (Orlando Health Obligated Group), Series 2016-A, 5.00% 2033 | 1,240 | 1,492 |
| County of Palm Beach, Health Facs. Auth., Retirement Communities Rev. Bonds (ACTS Retirement-Life Communities, Inc. Obligated Group), Series 2016, 5.00% 2032 | 4,895 | 5,720 |
| County of Palm Beach, Health Facs. Auth., Retirement Communities Rev. Bonds (ACTS Retirement-Life Communities, Inc. Obligated Group), Series 2018-A, 5.00% 2045 | 1,315 | 1,501 |
| County of Palm Beach, Health Facs. Auth., Rev. Bonds (Lifespace Communities, Inc.), Series 2015-C, 5.00% 2028 | 1,920 | 2,055 |
| County of Palm Beach, Health Facs. Auth., Rev. Bonds (Lifespace Communities, Inc.), Series 2016-B, 5.00% 2036 | 1,250 | 1,320 |
| County of Palm Beach, Health Facs. Auth., Rev. Bonds (Lifespace Communities, Inc.), Series 2018-B, 5.00% 2036 | 2,000 | 2,130 |
| County of Palm Beach, Health Facs. Auth., Rev. Bonds (Lifespace Communities, Inc.), Series 2019-B, 5.00% 2053 | 2,000 | 2,108 |
| County of Palm Beach, Health Facs. Auth., Rev. Bonds (Lifespace Communities, Inc.), Series 2020-B, 5.00% 2042 | 150 | 178 |
| County of Palm Beach, Health Facs. Auth., Rev. Bonds (Lifespace Communities, Inc.), Series 2020-B, 4.00% 2041 | 250 | 275 |
| City of Palm Coast, Palm Coast Park Community Dev. Dist., Special Assessment Bonds, Series 2006, 5.70% 2037 | 2,855 | 2,857 |
| City of Palm Coast, Town Center at Palm Coast Community Dev. Dist., Capital Improvement Rev. Bonds, Series 2005, 6.00% 2036 | 2,605 | 2,606 |
| County of Pasco, Meadow Pointe IV Community Dev. Dist., Capital Improvement Rev. Bonds, Series 2004-A, 6.00% 20365 | 1,035 | 25 |
| County of Pasco, Meadow Pointe IV Community Dev. Dist., Capital Improvement Rev. Bonds, Series 2012-A-2, 6.25% 20381 | 270 | 280 |
| County of Pasco, Meadow Pointe IV Community Dev. Dist., Capital Improvement Rev. Bonds, Capital Appreciation Bonds, Series 2012-A-1, 6.00% 20361 | 140 | 144 |
| County of Pinellas, Industrial Dev. Auth., Rev. Bonds (Drs. Kiran & Pallavi Patel 2017 Foundation for Global Understanding, Inc. Project), Series 2019, 5.00% 2029 | 2,650 | 2,952 |
| County of Pinellas, Industrial Dev. Auth., Rev. Bonds (Drs. Kiran & Pallavi Patel 2017 Foundation for Global Understanding, Inc. Project), Series 2019, 5.00% 2039 | 3,070 | 3,475 |
American High-Income Municipal Bond Fund — Page 19 of 77
| Bonds, notes & other debt instruments (continued) Florida (continued) | Principal amount (000) | Value (000) |
| County of Polk, Lake Ashton II Community Dev. Dist., Capital Improvement Rev. Bonds, Series 2005-A, 5.375% 2036 | $2,190 | $2,081 |
| City of Pompano Beach, Rev. Bonds (John Knox Village Project), Series 2015, 5.00% 2039 | 2,250 | 2,437 |
| City of Pompano Beach, Rev. Bonds (John Knox Village Project), Series 2015, 5.00% 2044 | 3,420 | 3,682 |
| City of Port St. Lucie, Utility System Rev. Ref. Bonds, Series 2016, 4.00% 2036 | 2,000 | 2,264 |
| City of St. Cloud, Gramercy Farms Community Dev. Dist., Special Assessment Bonds, Series 2007-B, 5.10% 20145 | 10,260 | —6 |
| City of St. Cloud, Gramercy Farms Community Dev. Dist., Special Assessment Rev. Ref. Bonds, Capital Appreciation Bonds, Series 2011, 0% 20397,8 | 31,540 | 5,056 |
| City of St. Cloud, Stevens Plantation Community Dev. Dist., Special Assessment Rev. Bonds, Series 2003-B, 6.375% 20135 | 1,852 | 1,204 |
| City of St. Cloud, Stevens Plantation Improvement Project Dependent Special Dist., Rev. Bonds, Series 2003, 6.375% 20135 | 2,035 | 1,526 |
| County of St. Johns, Industrial Dev. Auth., Rev. Ref. Bonds (Presbyterian Retirement Communities Project), Series 2010-A, 5.875% 2040 (preref. 2020) | 3,625 | 3,625 |
| County of St. Johns, Marshall Creek Community Dev. Dist., Special Assessment Bonds, Series 2002, 5.00% 2032 | 2,680 | 2,248 |
| County of St. Johns, Marshall Creek Community Dev. Dist., Special Assessment Bonds, Series 2016, 6.32% 2045 | 215 | 170 |
| County of Sarasota, Health Facs. Auth., Retirement Fac. Rev. Bonds (Village on the Isle Project), Series 2017-A, 5.00% 2037 | 2,150 | 2,254 |
| County of Sarasota, Health Facs. Auth., Retirement Fac. Rev. Bonds (Village on the Isle Project), Series 2017-A, 5.00% 2042 | 3,200 | 3,319 |
| County of Sarasota, Health Facs. Auth., Retirement Fac. Rev. Bonds (Village on the Isle Project), Series 2017-A, 5.00% 2047 | 3,645 | 3,760 |
| County of Sarasota, Health Facs. Auth., Retirement Fac. Rev. Bonds (Village on the Isle Project), Series 2017-A, 5.00% 2052 | 6,695 | 6,887 |
| County of Sarasota, Health Facs. Auth., Retirement Fac. Rev. Ref. Bonds (Village on the Isle Project), Series 2016, 5.00% 2025 | 225 | 240 |
| County of Sarasota, Health Facs. Auth., Retirement Fac. Rev. Ref. Bonds (Village on the Isle Project), Series 2016, 5.00% 2026 | 150 | 161 |
| County of Sarasota, Health Facs. Auth., Retirement Fac. Rev. Ref. Bonds (Village on the Isle Project), Series 2016, 5.00% 2027 | 180 | 194 |
| County of Sarasota, Health Facs. Auth., Retirement Fac. Rev. Ref. Bonds (Village on the Isle Project), Series 2016, 5.00% 2030 | 120 | 128 |
| City of South Miami, Health Facs. Auth., Hospital Rev. Ref. Bonds (Baptist Health South Florida Obligated Group), Series 2017, 5.00% 2047 | 4,350 | 5,112 |
| Southeast Overtown/Park West Community Redev. Agcy., Tax Increment Rev. Bonds, Series 2014-A-1, 5.00% 20242 | 1,000 | 1,139 |
| Southeast Overtown/Park West Community Redev. Agcy., Tax Increment Rev. Bonds, Series 2014-A-1, 5.00% 20302 | 6,000 | 6,750 |
| County of Sumter, Village Community Dev. Dist. No. 6, Rev. Ref. Bonds, Series 2017, BAM insured, 4.00% 2037 | 2,215 | 2,478 |
| City of Tallahassee, Health Facs. Rev. Ref. Bonds (Tallahassee Memorial HealthCare, Inc. Project), Series 2015-A, 5.00% 2040 | 1,350 | 1,517 |
| City of Tallahassee, Health Facs. Rev. Ref. Bonds (Tallahassee Memorial HealthCare, Inc. Project), Series 2016-A, 5.00% 2055 | 1,800 | 2,008 |
| City of Tampa, Capital Improvement Cigarette Tax Allocation Bonds (H. Lee Moffitt Cancer Center Project), Capital Appreciation Bonds, Series 2020-A, 0% 2037 | 800 | 466 |
| City of Tampa, Capital Improvement Cigarette Tax Allocation Bonds (H. Lee Moffitt Cancer Center Project), Capital Appreciation Bonds, Series 2020-A, 0% 2039 | 850 | 451 |
| City of Tampa, Capital Improvement Cigarette Tax Allocation Bonds (H. Lee Moffitt Cancer Center Project), Capital Appreciation Bonds, Series 2020-A, 0% 2040 | 1,000 | 506 |
| City of Tampa, Capital Improvement Cigarette Tax Allocation Bonds (H. Lee Moffitt Cancer Center Project), Capital Appreciation Bonds, Series 2020-A, 0% 2042 | 1,000 | 460 |
American High-Income Municipal Bond Fund — Page 20 of 77
| Bonds, notes & other debt instruments (continued) Florida (continued) | Principal amount (000) | Value (000) |
| City of Tampa, Rev. and Rev. Ref. Bonds (University of Tampa Project), Series 2015, 5.00% 2045 | $3,945 | $4,433 |
| City of Tampa, Rev. and Rev. Ref. Bonds (University of Tampa Project), Series 2020-A, 4.00% 2050 | 1,865 | 2,116 |
| City of Venice, Retirement Community Rev. Improvement Bonds (Village on the Isle Project), Series 2019, 5.00% 2047 | 3,205 | 3,325 |
| City of Venice, Retirement Community Rev. Improvement Bonds (Village on the Isle Project), Series 2019, 5.00% 2052 | 3,010 | 3,112 |
| County of Volusia, Educational Facs. Auth., Educational Facs. Rev. Ref. Bonds (Embry-Riddle Aeronautical University, Inc. Project), Series 2015-B, 5.00% 2030 | 1,500 | 1,745 |
| County of Volusia, Educational Facs. Auth., Educational Facs. Rev. Ref. Bonds (Embry-Riddle Aeronautical University, Inc. Project), Series 2015-B, 5.00% 2031 | 1,520 | 1,762 |
| City of Winter Garden, Winter Garden Village at Fowler Groves Community Dev. Dist., Special Assessment Rev. Ref. Bonds, Series 2016, 3.75% 2031 | 1,980 | 2,026 |
| City of Winter Garden, Winter Garden Village at Fowler Groves Community Dev. Dist., Special Assessment Rev. Ref. Bonds, Series 2016, 4.125% 2037 | 2,000 | 2,047 |
| 421,631 | ||
| Georgia 2.17% | ||
| City of Atlanta, Dev. Auth., Senior Health Care Facs. Rev. Bonds (Georgia Proton Treatment Center Project), Series 2017-A-1, 6.75% 2035 | 2,725 | 2,289 |
| City of Atlanta, Dev. Auth., Senior Health Care Facs. Rev. Bonds (Georgia Proton Treatment Center Project), Series 2017-A-1, 7.00% 2040 | 2,000 | 1,682 |
| City of Atlanta, Dev. Auth., Student Housing Rev. Bonds (ADA/CAU Partners, Inc. Project at Clark Atlanta University), Series 2004-A, ACA insured, 6.25% 2024 | 1,060 | 1,060 |
| City of Atlanta, Dev. Auth., Student Housing Rev. Bonds (ADA/CAU Partners, Inc. Project at Clark Atlanta University), Series 2004-A, ACA insured, 6.25% 2036 | 140 | 140 |
| County of Burke, Dev. Auth., Pollution Control Rev. Bonds (Oglethorpe Power Corp. - Vogtle Project), Series 2017-C, 4.125% 2045 | 5,000 | 5,604 |
| County of Cobb, Dev. Auth., Parking and Dining Hall Lease Rev. Ref. Bonds (Kennesaw State University Real Estate Foundations Projects), Series 2017, 5.00% 2033 | 1,000 | 1,203 |
| County of Dekalb, Housing Auth., Senior Living Rev. Bonds (Baptist Retirement Communities of Georgia, Inc. and Clairmont Crest, Inc. Project), Series 2019-A, 5.125% 20492 | 5,145 | 3,993 |
| County of Dekalb, Housing Auth., Senior Living Rev. Bonds (Baptist Retirement Communities of Georgia, Inc. and Clairmont Crest, Inc. Project), Series 2019-A, 5.25% 20542 | 4,750 | 3,686 |
| County of DeKalb, Hospital Auth., Rev. Ref. Anticipation Certificates (DeKalb Medical Center, Inc. Project), Series 2010, 6.00% 2030 (preref. 2020) | 7,200 | 7,231 |
| County of DeKalb, Hospital Auth., Rev. Ref. Anticipation Certificates (DeKalb Medical Center, Inc. Project), Series 2010, 6.125% 2040 (preref. 2020) | 5,250 | 5,273 |
| County of Fulton, Dev. Auth., Rev. Bonds (TUFF CAUB LLC Project), Series 2007-A, 5.25% 2028 | 2,775 | 2,777 |
| Counties of Macon and Bibb, Urban Dev. Auth., Rev. Bonds (Academy for Classical Education, Inc.), Series 2017, 5.75% 20372 | 1,200 | 1,234 |
| Counties of Macon and Bibb, Urban Dev. Auth., Rev. Bonds (Academy for Classical Education, Inc.), Series 2017, 5.875% 20472 | 2,180 | 2,221 |
| Counties of Macon and Bibb, Urban Dev. Auth., Rev. Bonds (Academy for Classical Education, Inc.), Series 2017, 6.00% 20522 | 1,530 | 1,565 |
| Main Street Natural Gas, Inc., Gas Project Rev. Bonds, Series 2007-A, 5.50% 2023 | 1,000 | 1,138 |
| Main Street Natural Gas, Inc., Gas Project Rev. Bonds, Series 2007-A, 5.50% 2026 | 1,000 | 1,246 |
| Main Street Natural Gas, Inc., Gas Supply Rev. Bonds, Series 2018-C, 4.00% 2048 (put 2023) | 4,000 | 4,407 |
| Main Street Natural Gas, Inc., Gas Supply Rev. Bonds, Series 2019-A, 5.00% 2043 | 860 | 1,031 |
| City of Marietta, Dev. Auth., Rev. Bonds (Life University, Inc. Project), Series 2017-A, 5.00% 20372 | 2,500 | 2,644 |
| Municipal Electric Auth., Plant Vogtle Units 3 and 4 Project J Bonds, Series 2015-A, 5.00% 2060 | 6,740 | 7,556 |
| Municipal Electric Auth., Plant Vogtle Units 3 and 4 Project J Bonds, Series 2015-A, 5.50% 2060 | 19,100 | 21,890 |
| Municipal Electric Auth., Plant Vogtle Units 3 and 4 Project J Bonds, Series 2019-A, 5.00% 2039 | 3,000 | 3,669 |
| Municipal Electric Auth., Plant Vogtle Units 3 and 4 Project J Bonds, Series 2019-A, 5.00% 2049 | 22,835 | 27,454 |
American High-Income Municipal Bond Fund — Page 21 of 77
| Bonds, notes & other debt instruments (continued) Georgia (continued) | Principal amount (000) | Value (000) |
| Municipal Electric Auth., Plant Vogtle Units 3 and 4 Project J Bonds, Series 2019-A, 5.00% 2059 | $15,700 | $18,658 |
| Municipal Electric Auth., Plant Vogtle Units 3 and 4 Project M Bonds, Series 2019-A, 5.00% 2063 | 10,175 | 12,076 |
| Municipal Electric Auth., Plant Vogtle Units 3 and 4 Project P Bonds, Series 2019-B, 5.00% 2048 | 5,000 | 6,018 |
| Municipal Electric Auth., Plant Vogtle Units 3 and 4 Project P Bonds, Series 2019-B, 5.00% 2059 | 8,300 | 9,864 |
| Municipal Electric Auth., Project One Bonds, Series 2019-A, 4.00% 2049 | 4,200 | 4,723 |
| Municipal Electric Auth., Project One Bonds, Series 2019-A, 5.00% 2034 | 2,300 | 2,888 |
| Private Colleges and Universities Auth., Rev. Bonds (The Savannah College of Art and Design Projects), Series 2014, 5.00% 2029 | 1,000 | 1,127 |
| Private Colleges and Universities Auth., Rev. Bonds (The Savannah College of Art and Design Projects), Series 2014, 5.00% 2044 | 2,000 | 2,194 |
| Road and Tollway Auth., Toll Rev. Convertible Bonds (I-75 S Expressway Lanes Project), Capital Appreciation Bonds, Series 2014-A, 0% 20242 | 2,115 | 1,916 |
| Road and Tollway Auth., Toll Rev. Convertible Bonds (I-75 S Expressway Lanes Project), Capital Appreciation Bonds, Series 2014-A, 0% 20342 | 3,495 | 1,469 |
| Road and Tollway Auth., Toll Rev. Convertible Bonds (I-75 S Expressway Lanes Project), Capital Appreciation Bonds, Series 2014-B, 0% 2049 (7.00% on 6/1/2024)1,2 | 6,755 | 5,310 |
| County of Rockdale, Rev. Ref. Bonds (Pratt Paper (GA), LLC Project), Series 2018, AMT, 4.00% 20382 | 2,500 | 2,622 |
| 179,858 | ||
| Guam 0.46% | ||
| A.B. Won Pat International Airport Auth., General Rev. Bonds, Series 2013-C, AMT, 6.25% 2034 | 1,500 | 1,560 |
| A.B. Won Pat International Airport Auth., General Rev. Bonds, Series 2013-C, AMT, 6.375% 2043 | 7,990 | 8,289 |
| A.B. Won Pat International Airport Auth., General Rev. Bonds, Series 2013-C, AMT, 5.00% 2021 (escrowed to maturity) | 5,090 | 5,080 |
| Business Privilege Tax Bonds, Series 2011-A, 5.00% 2021 | 125 | 126 |
| Business Privilege Tax Bonds, Series 2011-A, 5.00% 2031 | 2,050 | 2,122 |
| Business Privilege Tax Bonds, Series 2011-A, 5.25% 2036 | 1,665 | 1,723 |
| Business Privilege Tax Bonds, Series 2012-B-1, 5.00% 2032 | 2,070 | 2,141 |
| Business Privilege Tax Bonds, Series 2012-B-1, 5.00% 2037 | 1,775 | 1,829 |
| Business Privilege Tax Rev. Ref. Bonds, Series 2015-D, 5.00% 2031 | 3,250 | 3,645 |
| Business Privilege Tax Rev. Ref. Bonds, Series 2015-D, 5.00% 2032 | 3,000 | 3,359 |
| Hotel Occupancy Tax Rev. Ref. Bonds, Series 2011-A, 6.50% 2040 | 1,000 | 1,012 |
| Limited Obligation Rev. Ref. Bonds (Section 30), Series 2016-A, 5.00% 2022 | 1,000 | 1,062 |
| Port Auth., Port Rev. Bonds, Series 2018-B, AMT, 5.00% 2024 | 725 | 800 |
| Port Auth., Port Rev. Bonds, Series 2018-B, AMT, 5.00% 2031 | 585 | 694 |
| Port Auth., Port Rev. Bonds, Series 2018-B, AMT, 5.00% 2033 | 465 | 545 |
| Port Auth., Port Rev. Bonds, Series 2018-B, AMT, 5.00% 2035 | 400 | 466 |
| Power Auth., Rev. Bonds, Series 2014-A, Assured Guaranty Municipal insured, 5.00% 2021 | 495 | 513 |
| Waterworks Auth., Water and Wastewater System Rev. Bonds, Series 2013, 5.50% 2043 | 1,750 | 1,925 |
| Waterworks Auth., Water and Wastewater System Rev. Bonds, Series 2020-A, 5.00% 2050 | 1,205 | 1,489 |
| 38,380 | ||
| Hawaii 0.26% | ||
| Airports System Rev. Bonds, Series 2018-A, AMT, 5.00% 2048 | 5,000 | 6,011 |
| Dept. of Budget and Fin., Special Purpose Rev. Ref. Bonds (Hawaiian Electric Co., Inc.), Series 2017-B, AMT, 4.00% 2037 | 13,800 | 15,105 |
| 21,116 | ||
| Idaho 0.23% | ||
| Health Facs. Auth., Rev. Bonds (Kootenai Health Project), Series 2014-A, 4.375% 20342 | 2,420 | 2,639 |
| Health Facs. Auth., Rev. Bonds (Kootenai Health Project), Series 2014-A, 4.75% 20442 | 7,015 | 7,615 |
| Health Facs. Auth., Rev. Bonds (Kootenai Health Project), Series 2017-A, 5.00% 2047 | 1,500 | 1,744 |
| Housing and Fin. Assn., Facs. Rev. Bonds (Compass Public Charter School, Inc. Project), Series 2018-A, 6.00% 20492 | 1,180 | 1,373 |
American High-Income Municipal Bond Fund — Page 22 of 77
| Bonds, notes & other debt instruments (continued) Idaho (continued) | Principal amount (000) | Value (000) |
| Housing and Fin. Assn., Facs. Rev. Bonds (Compass Public Charter School, Inc. Project), Series 2020-A, 4.50% 20302 | $540 | $570 |
| Housing and Fin. Assn., Facs. Rev. Bonds (Compass Public Charter School, Inc. Project), Series 2020-A, 5.00% 20402 | 1,665 | 1,758 |
| Housing and Fin. Assn., Facs. Rev. Bonds (Compass Public Charter School, Inc. Project), Series 2020-A, 5.00% 20542 | 3,000 | 3,127 |
| 18,826 | ||
| Illinois 15.47% | ||
| Village of Bolingbrook, Special Service Area No. 2019-1, Special Tax Bonds, Series 2019, 5.00% 2033 | 1,645 | 1,653 |
| Village of Bolingbrook, Special Service Area No. 2019-1, Special Tax Bonds, Series 2019, 5.25% 2041 | 4,230 | 4,193 |
| Build Illinois Bonds, Sales Tax Rev. Bonds, Series 2016-A, 4.00% 2028 | 4,685 | 5,052 |
| Chicago Transit Auth., Capital Grant Receipts Rev. Ref. Bonds (Federal Transit Administration Section 5307 Urbanized Area Formula Funds), Series 2017, 5.00% 2023 | 805 | 894 |
| City of Chicago, Board of Education, Capital Improvement Tax Bonds (Dedicated Rev.), Series 2018, 5.00% 2034 | 1,535 | 1,712 |
| City of Chicago, Board of Education, Unlimited Tax G.O. Bonds (Dedicated Rev.), Series 2015-C, 5.25% 2039 | 6,355 | 6,654 |
| City of Chicago, Board of Education, Unlimited Tax G.O. Bonds (Dedicated Rev.), Series 2016-B, 6.50% 2046 | 7,910 | 9,282 |
| City of Chicago, Board of Education, Unlimited Tax G.O. Bonds (Dedicated Rev.), Series 2017-A, 7.00% 20462 | 26,470 | 32,737 |
| City of Chicago, Board of Education, Unlimited Tax G.O. Bonds (Dedicated Rev.), Series 2018-A, Assured Guaranty Municipal insured, 5.00% 2026 | 2,500 | 2,912 |
| City of Chicago, Board of Education, Unlimited Tax G.O. Bonds (Dedicated Rev.), Series 2018-D, 5.00% 2046 | 8,165 | 8,898 |
| City of Chicago, Board of Education, Unlimited Tax G.O. Rev. Ref. Bonds (Dedicated Rev.), Series 2005-A, AMBAC insured, 5.50% 2020 | 260 | 262 |
| City of Chicago, Board of Education, Unlimited Tax G.O. Rev. Ref. Bonds (Dedicated Rev.), Series 2005-A, AMBAC insured, 5.50% 2024 | 2,425 | 2,680 |
| City of Chicago, Board of Education, Unlimited Tax G.O. Rev. Ref. Bonds (Dedicated Rev.), Series 2010-F, 5.00% 2020 | 405 | 408 |
| City of Chicago, Board of Education, Unlimited Tax G.O. Rev. Ref. Bonds (Dedicated Rev.), Series 2012-B, 4.00% 2035 | 5,000 | 5,055 |
| City of Chicago, Board of Education, Unlimited Tax G.O. Rev. Ref. Bonds (Dedicated Rev.), Series 2017-B, 6.75% 20302 | 3,500 | 4,351 |
| City of Chicago, Board of Education, Unlimited Tax G.O. Rev. Ref. Bonds (Dedicated Rev.), Series 2017-B, 7.00% 20422 | 28,185 | 34,929 |
| City of Chicago, Board of Education, Unlimited Tax G.O. Rev. Ref. Bonds (Dedicated Rev.), Series 2017-C, 5.00% 2021 | 2,000 | 2,059 |
| City of Chicago, Board of Education, Unlimited Tax G.O. Rev. Ref. Bonds (Dedicated Rev.), Series 2017-C, 5.00% 2024 | 2,000 | 2,179 |
| City of Chicago, Board of Education, Unlimited Tax G.O. Rev. Ref. Bonds (Dedicated Rev.), Series 2017-C, 5.00% 2025 | 4,000 | 4,416 |
| City of Chicago, Board of Education, Unlimited Tax G.O. Rev. Ref. Bonds (Dedicated Rev.), Series 2017-D, 5.00% 2021 | 1,500 | 1,544 |
| City of Chicago, Board of Education, Unlimited Tax G.O. Rev. Ref. Bonds (Dedicated Rev.), Series 2017-F, 5.00% 2024 | 2,000 | 2,179 |
| City of Chicago, Board of Education, Unlimited Tax G.O. Rev. Ref. Bonds (Dedicated Rev.), Series 2017-G, 5.00% 2034 | 4,000 | 4,404 |
| City of Chicago, Board of Education, Unlimited Tax G.O. Rev. Ref. Bonds (Dedicated Rev.), Series 2017-H, 5.00% 2036 | 10,000 | 10,939 |
| City of Chicago, Board of Education, Unlimited Tax G.O. Rev. Ref. Bonds (Dedicated Rev.), Series 2017-H, 5.00% 2046 | 13,780 | 14,887 |
| City of Chicago, Board of Education, Unlimited Tax G.O. Rev. Ref. Bonds (Dedicated Rev.), Series 2018-A, Assured Guaranty Municipal insured, 5.00% 2035 | 3,105 | 3,442 |
| City of Chicago, Board of Education, Unlimited Tax G.O. Rev. Ref. Bonds (Dedicated Rev.), Series 2018-C, Assured Guaranty Municipal insured, 5.00% 2023 | 5,500 | 5,895 |
American High-Income Municipal Bond Fund — Page 23 of 77
| Bonds, notes & other debt instruments (continued) Illinois (continued) | Principal amount (000) | Value (000) |
| City of Chicago, Board of Education, Unlimited Tax G.O. Rev. Ref. Bonds (Dedicated Rev.), Series 2018-C, Assured Guaranty Municipal insured, 5.00% 2028 | $2,250 | $2,685 |
| City of Chicago, Board of Education, Unlimited Tax G.O. Rev. Ref. Bonds (Dedicated Rev.), Capital Appreciation Bonds, Series 1998-B-1, FGIC insured, 0% 2028 | 6,125 | 4,780 |
| City of Chicago, Board of Education, Unlimited Tax G.O. Rev. Ref. Bonds (Dedicated Rev.), Capital Appreciation Bonds, Series 2019-A, 0% 2025 | 2,000 | 1,668 |
| City of Chicago, Chicago Midway Airport, Rev. and Rev. Ref. Bonds, Series 2016-B, 5.00% 2046 | 2,500 | 2,831 |
| City of Chicago, Chicago Midway Airport, Rev. Ref. Bonds, Series 2014-A, AMT, 5.00% 2031 | 3,500 | 3,889 |
| City of Chicago, Chicago Midway Airport, Rev. Ref. Bonds, Series 2014-A, AMT, 5.00% 2032 | 5,000 | 5,540 |
| City of Chicago, Chicago Midway Airport, Rev. Ref. Bonds, Series 2014-A, AMT, 5.00% 2041 | 12,000 | 13,113 |
| City of Chicago, Chicago Midway Airport, Rev. Ref. Bonds, Series 2016-A, AMT, 5.00% 2028 | 1,750 | 2,056 |
| City of Chicago, Chicago Midway Airport, Rev. Ref. Bonds, Series 2016-A, AMT, 5.00% 2029 | 2,500 | 2,924 |
| City of Chicago, Chicago Midway Airport, Rev. Ref. Bonds, Series 2016-A, AMT, 5.00% 2031 | 855 | 990 |
| City of Chicago, G.O. Bonds (City Colleges of Chicago Capital Improvement Project), Capital Appreciation Bonds, Series 1999, National insured, 0% 2031 | 7,000 | 5,148 |
| City of Chicago, G.O. Bonds (City Colleges of Chicago Capital Improvement Project), Capital Appreciation Bonds, Series 1999, National insured, 0% 2034 | 2,090 | 1,331 |
| City of Chicago, G.O. Bonds (Neighborhoods Alive 21 Program), Series 2002-B, 5.50% 2034 | 500 | 545 |
| City of Chicago, G.O. Bonds, Series 2003-B, 5.00% 2024 | 1,000 | 1,077 |
| City of Chicago, G.O. Bonds, Series 2012-A, 5.00% 2033 | 585 | 602 |
| City of Chicago, G.O. Bonds, Series 2012-C, 5.00% 2023 | 435 | 449 |
| City of Chicago, G.O. Bonds, Series 2014-A, 5.25% 2029 | 3,895 | 4,174 |
| City of Chicago, G.O. Bonds, Series 2015-A, 5.25% 2028 | 3,230 | 3,532 |
| City of Chicago, G.O. Bonds, Series 2015-A, 5.50% 2034 | 200 | 218 |
| City of Chicago, G.O. Bonds, Series 2017-A, 5.75% 2033 | 465 | 538 |
| City of Chicago, G.O. Bonds, Series 2019-A, 5.00% 2044 | 3,000 | 3,283 |
| City of Chicago, G.O. Bonds, Series 2019-A, 5.50% 2035 | 7,200 | 8,280 |
| City of Chicago, G.O. Bonds, Series 2019-A, 5.50% 2049 | 2,500 | 2,813 |
| City of Chicago, G.O. Project and Rev. Ref. Bonds, Capital Appreciation Bonds, Series 2008-C, 0% 2030 | 8,000 | 5,794 |
| City of Chicago, G.O. Project and Rev. Ref. Bonds, Capital Appreciation Bonds, Series 2008-C, 0% 2031 | 2,105 | 1,454 |
| City of Chicago, G.O. Project and Rev. Ref. Bonds, Capital Appreciation Bonds, Series 2008-C, 0% 2032 | 725 | 477 |
| City of Chicago, G.O. Project and Rev. Ref. Bonds, Series 2003-B, 5.00% 2022 | 1,000 | 1,033 |
| City of Chicago, G.O. Project and Rev. Ref. Bonds, Series 2005-D, 5.50% 2037 | 260 | 282 |
| City of Chicago, G.O. Project and Rev. Ref. Bonds, Series 2014-A, 5.00% 2022 | 100 | 103 |
| City of Chicago, G.O. Project and Rev. Ref. Bonds, Series 2014-A, 5.00% 2035 | 1,600 | 1,690 |
| City of Chicago, G.O. Project and Rev. Ref. Bonds, Series 2014-A, 5.25% 2030 | 4,885 | 5,223 |
| City of Chicago, G.O. Project and Rev. Ref. Bonds, Series 2017-A, 5.625% 2029 | 6,500 | 7,530 |
| City of Chicago, G.O. Project and Rev. Ref. Bonds, Series 2017-A, 5.625% 2030 | 7,300 | 8,426 |
| City of Chicago, G.O. Project and Rev. Ref. Bonds, Series 2017-A, 6.00% 2038 | 12,170 | 14,130 |
| City of Chicago, G.O. Rev. Ref. Bonds, Series 2015-A, 5.375% 2029 | 1,000 | 1,096 |
| City of Chicago, G.O. Rev. Ref. Bonds, Series 2015-C, 5.00% 2024 | 2,020 | 2,175 |
| City of Chicago, G.O. Rev. Ref. Bonds, Series 2015-C, 5.00% 2027 | 3,105 | 3,421 |
| City of Chicago, G.O. Rev. Ref. Bonds, Series 2015-C, 5.00% 2035 | 1,670 | 1,798 |
| City of Chicago, G.O. Rev. Ref. Bonds, Series 2015-C, 5.00% 2038 | 5,500 | 5,891 |
| City of Chicago, G.O. Rev. Ref. Bonds, Series 2020-A, 5.00% 2027 | 9,200 | 10,295 |
| City of Chicago, O’Hare International Airport, Customer Fac. Charge Rev. Bonds, Series 2013, 5.50% 2025 | 1,000 | 1,075 |
| City of Chicago, O’Hare International Airport, Customer Fac. Charge Rev. Bonds, Series 2013, 5.50% 2026 | 1,680 | 1,802 |
| City of Chicago, O’Hare International Airport, Customer Fac. Charge Rev. Bonds, Series 2013, 5.75% 2038 | 1,000 | 1,062 |
| City of Chicago, O’Hare International Airport, Customer Fac. Charge Rev. Bonds, Series 2013, 5.75% 2043 | 4,250 | 4,495 |
| City of Chicago, O’Hare International Airport, General Airport Rev. Bonds, Series 2011-A, 5.75% 2039 | 515 | 524 |
| City of Chicago, O’Hare International Airport, General Airport Rev. Bonds, Series 2011-A, 5.75% 2039 (preref. 2021) | 2,070 | 2,117 |
| City of Chicago, O’Hare International Airport, General Airport Rev. Ref. Bonds, Series 2012-A, AMT, 5.00% 2026 | 3,500 | 3,697 |
American High-Income Municipal Bond Fund — Page 24 of 77
| Bonds, notes & other debt instruments (continued) Illinois (continued) | Principal amount (000) | Value (000) |
| City of Chicago, O’Hare International Airport, General Airport Rev. Ref. Bonds, Series 2015-A, AMT, 5.00% 2034 | $3,000 | $3,395 |
| City of Chicago, O’Hare International Airport, Special Facs. Rev. Bonds (Trips Obligated Group), Series 2018, AMT, 5.00% 2048 | 6,250 | 7,158 |
| City of Chicago, Sales Tax Rev. Ref. Bonds, Series 2002, 5.00% 2032 (preref. 2025) | 145 | 175 |
| City of Chicago, School Reform Board of Trustees of the Board of Education, Unlimited Tax G.O. Bonds (Dedicated Tax Rev.), Capital Appreciation Bonds, Series 1998-B-1, National insured, 0% 2029 | 3,790 | 2,847 |
| City of Chicago, School Reform Board of Trustees of the Board of Education, Unlimited Tax G.O. Bonds (Dedicated Tax Rev.), Capital Appreciation Bonds, Series 1998-B-1, National insured, 0% 2031 | 6,440 | 4,445 |
| City of Chicago, School Reform Board of Trustees of the Board of Education, Unlimited Tax G.O. Bonds (Dedicated Tax Rev.), Capital Appreciation Bonds, Series 1999-A, National insured, 0% 2024 | 2,070 | 1,855 |
| City of Chicago, School Reform Board of Trustees of the Board of Education, Unlimited Tax G.O. Bonds (Dedicated Tax Rev.), Capital Appreciation Bonds, Series 1999-A, National insured, 0% 2025 | 1,410 | 1,224 |
| City of Chicago, School Reform Board of Trustees of the Board of Education, Unlimited Tax G.O. Bonds (Dedicated Tax Rev.), Capital Appreciation Bonds, Series 1999-A, National insured, 0% 2031 | 3,900 | 2,692 |
| City of Chicago, School Reform Board of Trustees of the Board of Education, Unlimited Tax G.O. Bonds (Dedicated Tax Rev.), Series 2011-A, 5.00% 2041 | 10,165 | 10,278 |
| City of Chicago, School Reform Board of Trustees of the Board of Education, Unlimited Tax G.O. Bonds (Dedicated Tax Rev.), Series 2012-A, 5.00% 2042 | 7,100 | 7,237 |
| City of Chicago, School Reform Board of Trustees of the Board of Education, Unlimited Tax G.O. Bonds (Dedicated Tax Rev.), Series 2016-A, 7.00% 2044 | 23,050 | 27,182 |
| City of Chicago, Transit Auth., Sales Tax Receipts Rev. Bonds, Series 2017, Assured Guaranty Municipal insured, 5.00% 2051 | 19,750 | 22,160 |
| City of Chicago, Wastewater Transmission Rev. Bonds, Series 2012, 5.00% 2042 | 6,000 | 6,258 |
| City of Chicago, Wastewater Transmission Rev. Bonds, Series 2014, 5.00% 2024 | 1,000 | 1,125 |
| City of Chicago, Wastewater Transmission Rev. Bonds, Series 2017-A, 5.00% 2037 | 3,000 | 3,512 |
| City of Chicago, Wastewater Transmission Rev. Ref. Bonds, Capital Appreciation Bonds, Series 1998-A, National insured, 0% 2026 | 560 | 494 |
| City of Chicago, Wastewater Transmission Rev. Ref. Bonds, Capital Appreciation Bonds, Series 1998-A, National insured, 0% 2027 | 5,000 | 4,274 |
| City of Chicago, Wastewater Transmission Rev. Ref. Bonds, Series 2008-C, 5.00% 2023 | 1,000 | 1,090 |
| City of Chicago, Water Rev. Bonds, Series 2000, 5.00% 2028 | 1,000 | 1,207 |
| City of Chicago, Water Rev. Bonds, Series 2000, 5.00% 2029 | 1,000 | 1,203 |
| City of Chicago, Water Rev. Bonds, Series 2000, 5.00% 2030 | 700 | 838 |
| City of Chicago, Water Rev. Bonds, Series 2004, 5.00% 2023 | 2,575 | 2,904 |
| City of Chicago, Water Rev. Bonds, Series 2004, 5.00% 2024 | 2,000 | 2,317 |
| City of Chicago, Water Rev. Bonds, Series 2004, 5.00% 2027 | 1,750 | 2,118 |
| City of Chicago, Water Rev. Bonds, Series 2014, 5.00% 2022 | 250 | 273 |
| City of Chicago, Water Rev. Bonds, Series 2014, 5.00% 2033 | 6,200 | 6,991 |
| City of Chicago, Water Rev. Bonds, Series 2016-A-1, 5.00% 2031 | 1,000 | 1,192 |
| City of Chicago, Water Rev. Ref. Bonds, Series 2001, 5.75% 2030 | 3,000 | 3,785 |
| City of Chicago, Water Rev. Ref. Bonds, Series 2012, 5.00% 2042 | 4,370 | 4,654 |
| City of Chicago, Water Rev. Ref. Bonds, Series 2014, 5.00% 2029 | 1,605 | 1,832 |
| City of Chicago, Water Rev. Ref. Bonds, Series 2014, 5.00% 2044 | 500 | 554 |
| City of Chicago, Water Rev. Ref. Bonds, Series 2017-2, Assured Guaranty Municipal insured, 5.00% 2035 | 2,290 | 2,712 |
| City of Chicago, Water Rev. Ref. Bonds, Series 2017-2, Assured Guaranty Municipal insured, 5.00% 2038 | 5,000 | 5,874 |
| Counties of Cook, DuPage, Kane, Lake, McHenry and Will, Regional Transportation Auth., G.O. Bonds, Series 2003-A, FGIC-National insured, 6.00% 2033 | 6,300 | 9,217 |
| Counties of Cook, DuPage, Kane, Lake, McHenry and Will, Regional Transportation Auth., G.O. Bonds, Series 2004-A, Assured Guaranty Municipal insured, 5.75% 2034 | 2,000 | 2,830 |
| Counties of Cook, DuPage, Kane, Lake, McHenry and Will, Regional Transportation Auth., G.O. Rev. Ref. Bonds, Series 1999, Assured Guaranty Municipal insured, 6.00% 2025 | 1,995 | 2,363 |
| County of Cook, Community College Dist. No. 508 (City Colleges of Chicago), Unlimited Tax G.O. Bonds, Series 2013, 5.25% 2043 | 3,000 | 3,067 |
American High-Income Municipal Bond Fund — Page 25 of 77
| Bonds, notes & other debt instruments (continued) Illinois (continued) | Principal amount (000) | Value (000) |
| County of Cook, Community College Dist. No. 508 (City Colleges of Chicago), Unlimited Tax G.O. Bonds, Series 2017, BAM insured, 5.00% 2047 | $7,100 | $8,384 |
| County of Cook, Community College Dist. No. 508 (South Suburban College), G.O. Bonds, Capital Appreciation Bonds, Series 2008, Assured Guaranty insured, 0% 2022 | 1,000 | 972 |
| County of Cook, G.O. Rev. Ref. Bonds, Series 2016-A, 5.00% 2021 | 290 | 302 |
| County of Cook, G.O. Rev. Ref. Bonds, Series 2016-A, Assured Guaranty Municipal insured, 5.00% 2026 | 350 | 420 |
| County of Cook, G.O. Rev. Ref. Bonds, Series 2016-A, Assured Guaranty Municipal insured, 5.00% 2028 | 3,000 | 3,549 |
| County of Cook, G.O. Rev. Ref. Bonds, Series 2016-A, Assured Guaranty Municipal insured, 5.00% 2031 | 3,500 | 4,091 |
| County of DuPage, Special Service Area No. 31 (Monarch Landing Project), Special Tax Bonds, Series 2006, 5.625% 2036 | 4,240 | 4,241 |
| Fin. Auth., Charter School Rev. Ref. and Improvement Rev. Bonds (Chicago International Charter School Project), Series 2017, 5.00% 2037 | 2,030 | 2,212 |
| Fin. Auth., Charter School Rev. Ref. and Improvement Rev. Bonds (Chicago International Charter School Project), Series 2017, 5.00% 2047 | 3,180 | 3,398 |
| Fin. Auth., Recovery Zone Fac. Rev. Ref. Bonds (Navistar International Corp. Project), Series 2020, 4.75% 2040 (put 2030)2 | 24,340 | 24,963 |
| Fin. Auth., Rev. Bonds (Benedictine University Project), Series 2013-A, 6.25% 2033 | 4,010 | 4,026 |
| Fin. Auth., Rev. Bonds (Centegra Health System), Series 2014-A, 5.00% 2022 | 40 | 44 |
| Fin. Auth., Rev. Bonds (Centegra Health System), Series 2014-A, 5.00% 2042 | 1,000 | 1,128 |
| Fin. Auth., Rev. Bonds (Clean Water Initiative Revolving Fund), Series 2017, 5.00% 2036 | 7,530 | 9,365 |
| Fin. Auth., Rev. Bonds (DePaul University), Series 2016, 5.00% 2041 | 1,000 | 1,158 |
| Fin. Auth., Rev. Bonds (Edward-Elmhurst Healthcare), Series 2017-A, 5.00% 2032 | 1,285 | 1,535 |
| Fin. Auth., Rev. Bonds (Edward-Elmhurst Healthcare), Series 2017-A, 5.00% 2035 | 3,750 | 4,432 |
| Fin. Auth., Rev. Bonds (Franciscan Communities, Inc.), Series 2013-A, 5.125% 2043 | 4,000 | 4,076 |
| Fin. Auth., Rev. Bonds (Franciscan Communities, Inc.), Series 2013-A, 5.125% 2043 (preref. 2023) | 430 | 487 |
| Fin. Auth., Rev. Bonds (Friendship Village Schaumburg), Series 2017, 5.125% 2045 | 6,775 | 5,979 |
| Fin. Auth., Rev. Bonds (Hospital Sisters Services, Inc. Obligated Group), Series 2012-C, 5.00% 2020 | 230 | 230 |
| Fin. Auth., Rev. Bonds (Lifespace Communities, Inc.), Series 2015-A, 5.00% 2045 | 3,500 | 3,620 |
| Fin. Auth., Rev. Bonds (Mercy Health Corp.), Series 2016, 4.00% 2035 | 1,465 | 1,597 |
| Fin. Auth., Rev. Bonds (Mercy Health Corp.), Series 2016, 5.00% 2034 | 3,600 | 4,174 |
| Fin. Auth., Rev. Bonds (Mercy Health Corp.), Series 2016, 5.00% 2040 | 12,000 | 13,734 |
| Fin. Auth., Rev. Bonds (Mercy Health Corp.), Series 2016, 5.00% 2046 | 17,165 | 19,475 |
| Fin. Auth., Rev. Bonds (Northwest Community Hospital), Series 2016-A, 5.00% 2033 | 1,800 | 2,117 |
| Fin. Auth., Rev. Bonds (OSF Healthcare System), Series 2012-A, 5.00% 2028 | 1,500 | 1,602 |
| Fin. Auth., Rev. Bonds (OSF Healthcare System), Series 2015-A, 4.125% 2037 | 1,220 | 1,334 |
| Fin. Auth., Rev. Bonds (Presbyterian Homes Obligated Group), Series 2016-A, 5.00% 2025 | 1,135 | 1,298 |
| Fin. Auth., Rev. Bonds (Presbyterian Homes Obligated Group), Series 2016-A, 5.00% 2026 | 1,000 | 1,164 |
| Fin. Auth., Rev. Bonds (Presbyterian Homes Obligated Group), Series 2016-A, 5.00% 2026 | 1,000 | 1,151 |
| Fin. Auth., Rev. Bonds (Presbyterian Homes Obligated Group), Series 2016-A, 5.00% 2028 | 2,240 | 2,584 |
| Fin. Auth., Rev. Bonds (Presbyterian Homes Obligated Group), Series 2016-A, 5.00% 2029 | 3,090 | 3,555 |
| Fin. Auth., Rev. Bonds (Presbyterian Homes Obligated Group), Series 2016-A, 5.00% 2030 | 1,500 | 1,714 |
| Fin. Auth., Rev. Bonds (Presbyterian Homes Obligated Group), Series 2016-A, 5.00% 2031 | 2,270 | 2,583 |
| Fin. Auth., Rev. Bonds (Presbyterian Homes Obligated Group), Series 2016-B, (1-month USD-LIBOR x 0.70 + 1.35%) 1.469% 2036 (put 2021)3 | 800 | 800 |
| Fin. Auth., Rev. Bonds (Presence Health Network), Series 2016-C, 3.75% 2034 | 250 | 280 |
| Fin. Auth., Rev. Bonds (Presence Health Network), Series 2016-C, 4.00% 2041 | 2,150 | 2,415 |
| Fin. Auth., Rev. Bonds (Presence Health Network), Series 2016-C, 4.00% 2041 (preref. 2027) | 80 | 98 |
| Fin. Auth., Rev. Bonds (Presence Health Network), Series 2016-C, 4.00% 2041 (preref. 2027) | 5 | 6 |
| Fin. Auth., Rev. Bonds (Presence Health Network), Series 2016-C, 5.00% 2027 | 1,875 | 2,356 |
| Fin. Auth., Rev. Bonds (Presence Health Network), Series 2016-C, 5.00% 2029 | 4,500 | 5,622 |
| Fin. Auth., Rev. Bonds (Presence Health Network), Series 2016-C, 5.00% 2032 | 4,500 | 5,549 |
| Fin. Auth., Rev. Bonds (Presence Health Network), Series 2016-C, 5.00% 2034 | 1,265 | 1,546 |
| Fin. Auth., Rev. Bonds (Presence Health Network), Series 2016-C, 5.00% 2036 | 2,250 | 2,737 |
| Fin. Auth., Rev. Bonds (Presence Health Network), Series 2016-C, 5.00% 2041 | 2,000 | 2,401 |
| Fin. Auth., Rev. Bonds (Rehabilitation Institute of Chicago), Series 2013-A, 6.00% 2043 | 2,300 | 2,571 |
American High-Income Municipal Bond Fund — Page 26 of 77
| Bonds, notes & other debt instruments (continued) Illinois (continued) | Principal amount (000) | Value (000) |
| Fin. Auth., Rev. Bonds (Rosalind Franklin University Research Building Project), Series 2017-C, 5.00% 2046 | $900 | $979 |
| Fin. Auth., Rev. Bonds (Rosalind Franklin University Research Building Project), Series 2017-C, 5.00% 2049 | 1,250 | 1,356 |
| Fin. Auth., Rev. Bonds (Rush University Medical Center Obligated Group), Series 2015-A, 5.00% 2032 | 1,100 | 1,269 |
| Fin. Auth., Rev. Bonds (Rush University Medical Center Obligated Group), Series 2015-A, 5.00% 2038 | 1,500 | 1,709 |
| Fin. Auth., Rev. Bonds (Swedish Covenant Hospital), Series 2016-A, 5.00% 2032 | 2,000 | 2,549 |
| Fin. Auth., Rev. Bonds (Swedish Covenant Hospital), Series 2016-A, 5.00% 2033 | 2,000 | 2,549 |
| Fin. Auth., Rev. Bonds (Swedish Covenant Hospital), Series 2016-A, 5.00% 2035 | 2,000 | 2,549 |
| Fin. Auth., Rev. Bonds (Swedish Covenant Hospital), Series 2016-A, 5.00% 2037 | 1,800 | 2,294 |
| Fin. Auth., Rev. Bonds (The Cable Foundation), Series 2016-A, 5.00% 2045 | 6,880 | 8,178 |
| Fin. Auth., Rev. Ref. Bonds (Anne & Robert H. Lurie Children’s Hospital), Series 2017, 5.00% 2034 | 1,000 | 1,206 |
| Fin. Auth., Rev. Ref. Bonds (Benedictine University), Series 2017, 5.00% 2026 | 1,065 | 1,155 |
| Fin. Auth., Rev. Ref. Bonds (Benedictine University), Series 2017, 5.00% 2030 | 1,900 | 2,043 |
| Fin. Auth., Rev. Ref. Bonds (Benedictine University), Series 2017, 5.00% 2033 | 3,000 | 3,176 |
| Fin. Auth., Rev. Ref. Bonds (Benedictine University), Series 2017, 5.00% 2038 | 11,080 | 11,570 |
| Fin. Auth., Rev. Ref. Bonds (Christian Homes, Inc.), Series 2016, 5.00% 2031 | 1,875 | 1,987 |
| Fin. Auth., Rev. Ref. Bonds (Christian Homes, Inc.), Series 2016, 5.00% 2036 | 2,400 | 2,506 |
| Fin. Auth., Rev. Ref. Bonds (Christian Homes, Inc.), Series 2016, 5.00% 2040 | 2,275 | 2,357 |
| Fin. Auth., Rev. Ref. Bonds (Illinois Institute of Technology), Series 2019, 5.00% 2034 | 1,100 | 1,273 |
| Fin. Auth., Rev. Ref. Bonds (Illinois Institute of Technology), Series 2019, 5.00% 2036 | 1,000 | 1,150 |
| Fin. Auth., Rev. Ref. Bonds (Illinois Institute of Technology), Series 2019, 5.00% 2038 | 1,000 | 1,143 |
| Fin. Auth., Rev. Ref. Bonds (Illinois Institute of Technology), Series 2019, 5.00% 2040 | 1,500 | 1,705 |
| Fin. Auth., Rev. Ref. Bonds (OSF Healthcare System), Series 2015-A, 5.00% 2035 | 5,450 | 6,351 |
| Fin. Auth., Rev. Ref. Bonds (OSF Healthcare System), Series 2015-A, 5.00% 2045 | 2,000 | 2,294 |
| Fin. Auth., Rev. Ref. Bonds (OSF Healthcare System), Series 2018-A, 4.125% 2047 | 2,000 | 2,220 |
| Fin. Auth., Rev. Ref. Bonds (Silver Cross Hospital and Medical Centers), Series 2015-C, 4.125% 2037 | 8,710 | 9,425 |
| Fin. Auth., Rev. Ref. Bonds (Silver Cross Hospital and Medical Centers), Series 2015-C, 5.00% 2035 | 3,950 | 4,510 |
| Fin. Auth., Rev. Ref. Bonds (Silver Cross Hospital and Medical Centers), Series 2015-C, 5.00% 2044 | 6,400 | 7,160 |
| Fin. Auth., Rev. Ref. Bonds (Southern Illinois Healthcare Enterprises, Inc.), Series 2017-C, 5.00% 2026 | 250 | 304 |
| Fin. Auth., Rev. Ref. Bonds (University of Chicago Medical Center), Series 2009-B, 5.00% 2025 | 1,995 | 1,999 |
| Fin. Auth., Rev. Ref. Bonds (University of Chicago Medical Center), Series 2009-B, 5.00% 2025 (preref. 2020) | 1,005 | 1,006 |
| Fin. Auth., Student Housing and Academic Fac. Rev. Bonds (CHF-Chicago, LLC - University of Illinois at Chicago Project), Series 2017-A, 5.00% 2047 | 2,365 | 2,399 |
| Fin. Auth., Student Housing Rev. Bonds (CHF-Cook, LLC - Northeastern Illinois University Project), Series 2015-A, 5.00% 2023 | 775 | 785 |
| Fin. Auth., Student Housing Rev. Bonds (CHF-Cook, LLC - Northeastern Illinois University Project), Series 2015-A, 5.00% 2024 | 815 | 826 |
| Fin. Auth., Student Housing Rev. Bonds (CHF-Cook, LLC - Northeastern Illinois University Project), Series 2015-A, 5.00% 2025 | 730 | 738 |
| Fin. Auth., Student Housing Rev. Bonds (CHF-Cook, LLC - Northeastern Illinois University Project), Series 2015-A, 5.00% 2030 | 3,965 | 3,937 |
| Fin. Auth., Student Housing Rev. Bonds (CHF-Cook, LLC - Northeastern Illinois University Project), Series 2015-A, 5.00% 2035 | 2,800 | 2,664 |
| Fin. Auth., Student Housing Rev. Bonds (CHF-Cook, LLC - Northeastern Illinois University Project), Series 2015-A, 5.00% 2047 | 12,500 | 11,099 |
| Fin. Auth., Student Housing Rev. Bonds (CHF-DeKalb II, LLC - Northern Illinois University Project), Series 2011, 5.125% 2020 | 2,275 | 2,281 |
| Fin. Auth., Student Housing Rev. Bonds (CHF-DeKalb II, LLC - Northern Illinois University Project), Series 2011, 5.75% 2021 | 2,000 | 2,051 |
| Fin. Auth., Student Housing Rev. Bonds (CHF-DeKalb II, LLC - Northern Illinois University Project), Series 2011, 6.00% 2024 | 1,000 | 1,031 |
| Fin. Auth., Student Housing Rev. Bonds (CHF-DeKalb II, LLC - Northern Illinois University Project), Series 2011, 6.875% 2043 | 19,125 | 19,643 |
| Fin. Auth., Student Housing Rev. Bonds (CHF-Normal, LLC - Illinois State University Project), Series 2011, 7.00% 2043 (preref. 2021) | 4,265 | 4,449 |
| G.O. Bonds, Series 2010, Assured Guaranty Municipal insured, 5.00% 2022 | 50 | 50 |
American High-Income Municipal Bond Fund — Page 27 of 77
| Bonds, notes & other debt instruments (continued) Illinois (continued) | Principal amount (000) | Value (000) |
| G.O. Bonds, Series 2012-A, 5.00% 2028 | $1,000 | $1,035 |
| G.O. Bonds, Series 2013, 5.00% 2021 | 875 | 898 |
| G.O. Bonds, Series 2013, 5.00% 2023 | 740 | 798 |
| G.O. Bonds, Series 2013, 5.50% 2033 | 3,715 | 3,996 |
| G.O. Bonds, Series 2013, 5.50% 2038 | 1,000 | 1,068 |
| G.O. Bonds, Series 2014, 5.00% 2022 | 885 | 922 |
| G.O. Bonds, Series 2014, 5.00% 2024 | 3,000 | 3,270 |
| G.O. Bonds, Series 2014, 5.00% 2026 | 2,025 | 2,203 |
| G.O. Bonds, Series 2014, 5.00% 2027 | 2,000 | 2,248 |
| G.O. Bonds, Series 2014, 5.00% 2039 | 13,550 | 14,354 |
| G.O. Bonds, Series 2014, 5.00% 2039 | 4,100 | 4,361 |
| G.O. Bonds, Series 2016, 4.00% 2036 | 2,545 | 2,617 |
| G.O. Bonds, Series 2016, 5.00% 2025 | 1,000 | 1,114 |
| G.O. Bonds, Series 2016, 5.00% 2027 | 3,065 | 3,492 |
| G.O. Bonds, Series 2016, 5.00% 2028 | 1,500 | 1,694 |
| G.O. Bonds, Series 2016, 5.00% 2033 | 4,000 | 4,442 |
| G.O. Bonds, Series 2016, 5.00% 2038 | 1,000 | 1,094 |
| G.O. Bonds, Series 2016, Assured Guaranty Municipal insured, 5.00% 2030 | 3,000 | 3,343 |
| G.O. Bonds, Series 2016, Assured Guaranty Municipal insured, 5.00% 2041 | 2,125 | 2,293 |
| G.O. Bonds, Series 2017-A, 5.00% 2023 | 2,500 | 2,721 |
| G.O. Bonds, Series 2017-A, 5.00% 2025 | 2,500 | 2,823 |
| G.O. Bonds, Series 2017-A, 5.00% 2035 | 3,145 | 3,516 |
| G.O. Bonds, Series 2017-A, 5.00% 2036 | 3,000 | 3,340 |
| G.O. Bonds, Series 2017-C, 5.00% 2029 | 9,820 | 11,212 |
| G.O. Bonds, Series 2017-D, 5.00% 2027 | 23,990 | 27,620 |
| G.O. Bonds, Series 2017-D, BAM insured, 5.00% 2021 | 5,095 | 5,278 |
| G.O. Bonds, Series 2017-D, BAM insured, 5.00% 2026 | 11,980 | 13,633 |
| G.O. Bonds, Series 2017-D, BAM insured, 5.00% 2028 | 27,175 | 31,187 |
| G.O. Bonds, Series 2018-A, 5.00% 2034 | 2,145 | 2,427 |
| G.O. Bonds, Series 2020, 5.50% 2039 | 7,000 | 8,352 |
| G.O. Bonds, Series 2020, 5.75% 2045 | 2,500 | 3,000 |
| G.O. Rev. Ref. Bonds, Series 2012, 4.00% 2025 | 405 | 418 |
| G.O. Rev. Ref. Bonds, Series 2012, 5.00% 2021 | 600 | 617 |
| G.O. Rev. Ref. Bonds, Series 2012, Assured Guaranty Municipal insured, 5.00% 2025 | 4,250 | 4,475 |
| G.O. Rev. Ref. Bonds, Series 2016, 5.00% 2026 | 3,000 | 3,394 |
| G.O. Rev. Ref. Bonds, Series 2016, 5.00% 2028 | 5,150 | 5,883 |
| G.O. Rev. Ref. Bonds, Series 2016, Assured Guaranty Municipal insured, 4.00% 2030 | 750 | 825 |
| G.O. Rev. Ref. Bonds, Series 2018-A, 5.00% 2023 | 2,500 | 2,711 |
| G.O. Rev. Ref. Bonds, Series 2018-A, 5.00% 2025 | 3,750 | 4,224 |
| G.O. Rev. Ref. Bonds, Series 2018-A, 5.00% 2026 | 5,500 | 6,281 |
| G.O. Rev. Ref. Bonds, Series 2018-A, 5.00% 2027 | 2,000 | 2,314 |
| G.O. Rev. Ref. Bonds, Series 2018-A, 5.00% 2029 | 2,000 | 2,335 |
| G.O. Rev. Ref. Bonds, Series 2018-B, 5.00% 2029 | 6,200 | 7,239 |
| Housing Dev. Auth., Homeowner Mortgage Rev. Bonds, Series 2016-B, AMT, 3.50% 2046 | 3,110 | 3,336 |
| Housing Dev. Auth., Homeowner Mortgage Rev. Bonds, Series 2016-C, 3.50% 2046 | 1,660 | 1,792 |
| Board of Trustees of Illinois State University, Auxiliary Facs. System Rev. Bonds, Series 2016, Assured Guaranty Municipal insured, 5.00% 2025 | 3,000 | 3,532 |
| Board of Trustees of Illinois State University, Auxiliary Facs. System Rev. Bonds, Series 2016, Assured Guaranty Municipal insured, 5.00% 2026 | 1,150 | 1,390 |
| Board of Trustees of Illinois State University, Auxiliary Facs. System Rev. Bonds, Series 2018-A, Assured Guaranty Municipal insured, 5.00% 2027 | 1,140 | 1,406 |
| Board of Trustees of Illinois State University, Auxiliary Facs. System Rev. Bonds, Series 2018-A, Assured Guaranty Municipal insured, 5.00% 2035 | 750 | 908 |
| Board of Trustees of Illinois State University, Auxiliary Facs. System Rev. Bonds, Series 2018-A, Assured Guaranty Municipal insured, 5.00% 2039 | 1,165 | 1,390 |
American High-Income Municipal Bond Fund — Page 28 of 77
| Bonds, notes & other debt instruments (continued) Illinois (continued) | Principal amount (000) | Value (000) |
| Board of Trustees of Illinois State University, Auxiliary Facs. System Rev. Bonds, Series 2018-B, Assured Guaranty Municipal insured, 5.00% 2026 | $620 | $749 |
| Board of Trustees of Illinois State University, Auxiliary Facs. System Rev. Bonds, Series 2018-B, Assured Guaranty Municipal insured, 5.00% 2029 | 1,610 | 2,022 |
| Board of Trustees of Illinois State University, Auxiliary Facs. System Rev. Bonds, Series 2018-B, Assured Guaranty Municipal insured, 5.00% 2031 | 780 | 970 |
| Village of Lincolnshire, Special Service Area No. 1 (Sedgebrook Project), Special Tax Bonds, Series 2004, 6.25% 2034 | 1,380 | 1,381 |
| Metropolitan Pier and Exposition Auth., Dedicated State Tax Rev. Bonds, Capital Appreciation Bonds, Series 1994, BAM insured, 0% 2028 | 3,185 | 2,646 |
| Metropolitan Pier and Exposition Auth., Dedicated State Tax Rev. Bonds, Capital Appreciation Bonds, Series 2002-A, National insured, 0% 2030 | 2,435 | 1,808 |
| Metropolitan Pier and Exposition Auth., Dedicated State Tax Rev. Bonds, Capital Appreciation Bonds, Series 2002-A, National insured, 0% 2030 (escrowed to maturity) | 130 | 117 |
| Metropolitan Pier and Exposition Auth., McCormick Place Expansion Project Bonds, Capital Appreciation Bonds, Series 2002-A, National insured, 0% 2032 | 8,860 | 5,932 |
| Metropolitan Pier and Exposition Auth., McCormick Place Expansion Project Bonds, Capital Appreciation Bonds, Series 2002-A, National insured, 0% 2033 | 10,230 | 6,561 |
| Metropolitan Pier and Exposition Auth., McCormick Place Expansion Project Bonds, Capital Appreciation Bonds, Series 2002-A, National insured, 0% 2034 | 10,000 | 6,285 |
| Metropolitan Pier and Exposition Auth., McCormick Place Expansion Project Bonds, Capital Appreciation Bonds, Series 2002-A, National insured, 0% 2039 | 3,800 | 1,873 |
| Metropolitan Pier and Exposition Auth., McCormick Place Expansion Project Bonds, Capital Appreciation Bonds, Series 2012-B, 0% 2050 | 4,620 | 1,252 |
| Metropolitan Pier and Exposition Auth., McCormick Place Expansion Project Bonds, Capital Appreciation Bonds, Series 2012-B, 0% 2051 | 28,865 | 7,471 |
| Metropolitan Pier and Exposition Auth., McCormick Place Expansion Project Rev. Bonds, Series 2002-A, Assured Guaranty Municipal insured, 5.50% 2023 | 450 | 484 |
| Metropolitan Pier and Exposition Auth., McCormick Place Expansion Project Rev. Bonds, Series 2012-A, 5.00% 2042 | 1,500 | 1,534 |
| Metropolitan Pier and Exposition Auth., McCormick Place Expansion Project Rev. Bonds, Series 2015-A, 5.00% 2053 | 5,950 | 6,254 |
| Metropolitan Pier and Exposition Auth., McCormick Place Expansion Project Rev. Ref. Bonds, Series 2012-B, 5.00% 2028 | 500 | 520 |
| Metropolitan Pier and Exposition Auth., McCormick Place Expansion Project Rev. Ref. Bonds, Series 2020-A, 4.00% 2050 | 7,500 | 7,487 |
| Metropolitan Pier and Exposition Auth., McCormick Place Expansion Project Rev. Ref. Bonds, Series 2020-A, 5.00% 2050 | 9,500 | 10,638 |
| Metropolitan Pier and Exposition Auth., McCormick Place Expansion Project Rev. Ref. Bonds, Capital Appreciation Bonds, Series 1994, National insured, 0% 2029 | 4,000 | 3,091 |
| Metropolitan Pier and Exposition Auth., McCormick Place Expansion Project Rev. Ref. Bonds, Capital Appreciation Bonds, Series 1996-A, National insured, 0% 2025 | 2,535 | 2,245 |
| Metropolitan Pier and Exposition Auth., McCormick Place Expansion Project Rev. Ref. Bonds, Capital Appreciation Bonds, Series 2010-B-1, Assured Guaranty Municipal insured, 0% 2027 | 3,500 | 2,996 |
| Metropolitan Pier and Exposition Auth., McCormick Place Expansion Project Rev. Ref. Bonds, Capital Appreciation Bonds, Series 2010-B-1, Assured Guaranty Municipal insured, 0% 2043 | 800 | 381 |
| Metropolitan Pier and Exposition Auth., McCormick Place Expansion Project Rev. Ref. Bonds, Capital Appreciation Bonds, Series 2010-B-1, Assured Guaranty Municipal insured, 0% 2044 | 25,395 | 11,602 |
| Metropolitan Pier and Exposition Auth., McCormick Place Expansion Project Rev. Ref. Bonds, Capital Appreciation Bonds, Series 2010-B-1, Assured Guaranty Municipal insured, 0% 2046 | 3,300 | 1,395 |
| Metropolitan Pier and Exposition Auth., McCormick Place Expansion Project Rev. Ref. Bonds, Capital Appreciation Bonds, Series 2017-A, 0% 2056 | 37,160 | 7,600 |
| Metropolitan Pier and Exposition Auth., McCormick Place Expansion Project Rev. Ref. Bonds, Capital Appreciation Bonds, Series 2017-A, Assured Guaranty Municipal insured, 0% 2056 | 13,250 | 3,803 |
American High-Income Municipal Bond Fund — Page 29 of 77
| Bonds, notes & other debt instruments (continued) Illinois (continued) | Principal amount (000) | Value (000) |
| Metropolitan Pier and Exposition Auth., McCormick Place Expansion Project Rev. Ref. Bonds, Capital Appreciation Bonds, Series 2017-B, 0% 2054 | $27,760 | $6,229 |
| Metropolitan Pier and Exposition Auth., McCormick Place Expansion Project Rev. Ref. Bonds, Capital Appreciation Bonds, Series 2017-B, Assured Guaranty Municipal insured, 0% 2056 | 38,865 | 11,154 |
| Metropolitan Pier and Exposition Auth., McCormick Place Expansion Project Rev. Ref. Bonds, Capital Appreciation Bonds, Series 2017-B, BAM insured, 0% 2054 | 16,785 | 5,170 |
| Metropolitan Pier and Exposition Auth., McCormick Place Expansion Project Rev. Ref. Bonds, Series 2012-B, 5.00% 2052 | 1,470 | 1,498 |
| Metropolitan Pier and Exposition Auth., McCormick Place Expansion Project Rev. Ref. Bonds, Series 2015-B, 5.00% 2035 | 3,000 | 3,206 |
| Metropolitan Pier and Exposition Auth., McCormick Place Expansion Project Rev. Ref. Bonds, Series 2015-B, 5.00% 2040 | 4,000 | 4,227 |
| Metropolitan Pier and Exposition Auth., McCormick Place Expansion Project Rev. Ref. Bonds, Series 2017-A, 5.00% 2057 | 7,000 | 7,657 |
| Board of Trustees of Northern Illinois University, Auxiliary Facs. System Rev. Ref. Bonds, Series 2020-B, BAM insured, 4.00% 2035 | 1,075 | 1,240 |
| Board of Trustees of Northern Illinois University, Auxiliary Facs. System Rev. Ref. Bonds, Series 2020-B, BAM insured, 4.00% 2036 | 2,175 | 2,497 |
| Board of Trustees of Northern Illinois University, Auxiliary Facs. System Rev. Ref. Bonds, Series 2020-B, BAM insured, 4.00% 2037 | 1,650 | 1,887 |
| Board of Trustees of Northern Illinois University, Auxiliary Facs. System Rev. Ref. Bonds, Series 2020-B, BAM insured, 4.00% 2038 | 1,850 | 2,109 |
| Board of Trustees of Northern Illinois University, Auxiliary Facs. System Rev. Ref. Bonds, Series 2020-B, BAM insured, 4.00% 2039 | 2,520 | 2,865 |
| Board of Trustees of Northern Illinois University, Auxiliary Facs. System Rev. Ref. Bonds, Series 2020-B, BAM insured, 4.00% 2040 | 1,975 | 2,239 |
| Board of Trustees of Northern Illinois University, Auxiliary Facs. System Rev. Ref. Bonds, Series 2020-B, BAM insured, 4.00% 2041 | 2,350 | 2,656 |
| Sales Tax Securitization Corp., Sales Tax Securitization Bonds, Series 2020-A, BAM insured, 4.00% 2038 | 6,365 | 6,977 |
| Sales Tax Securitization Corp., Sales Tax Securitization Bonds, Series 2020-A, BAM insured, 5.00% 2036 | 1,280 | 1,565 |
| Sales Tax Securitization Corp., Sales Tax Securitization Bonds, Series 2020-A, BAM insured, 5.00% 2037 | 2,285 | 2,800 |
| Board of Trustees of Southern Illinois University, Housing and Auxiliary Facs. System Rev. Bonds, Capital Appreciation Bonds, Series 1999-A, National insured, 0% 2022 | 4,500 | 4,329 |
| Board of Trustees of Southern Illinois University, Housing and Auxiliary Facs. System Rev. Bonds, Capital Appreciation Bonds, Series 1999-A, National insured, 0% 2025 | 205 | 182 |
| Board of Trustees of Southern Illinois University, Housing and Auxiliary Facs. System Rev. Bonds, Capital Appreciation Bonds, Series 1999-A, National insured, 0% 2029 | 1,095 | 835 |
| Board of Trustees of Southern Illinois University, Housing and Auxiliary Facs. System Rev. Bonds, Series 2008-A, 5.50% 2023 | 500 | 543 |
| Board of Trustees of Southern Illinois University, Housing and Auxiliary Facs. System Rev. Bonds, Series 2012-A, 4.00% 2028 | 325 | 325 |
| Board of Trustees of Southern Illinois University, Housing and Auxiliary Facs. System Rev. Bonds, Series 2012-B-1, 5.00% 2022 | 790 | 819 |
| Board of Trustees of Southern Illinois University, Housing and Auxiliary Facs. System Rev. Bonds, Series 2012-B-1, 5.00% 2023 | 300 | 313 |
| Board of Trustees of Southern Illinois University, Housing and Auxiliary Facs. System Rev. Bonds, Series 2012-B-1, 5.00% 2027 | 2,205 | 2,285 |
| Board of Trustees of Southern Illinois University, Housing and Auxiliary Facs. System Rev. Bonds, Series 2012-B-1, 5.00% 2032 | 4,045 | 4,140 |
| Southwestern Illinois Dev. Auth., Health Fac. Rev. Bonds (Hospital Sisters Services, Inc. Obligated Group), Series 2017-A, 5.00% 2028 | 550 | 697 |
| Southwestern Illinois Dev. Auth., Health Fac. Rev. Bonds (Memorial Group, Inc.), Series 2013, 7.625% 2048 (preref. 2023) | 3,000 | 3,700 |
| Sports Facs. Auth., Sports Facs. Rev. Ref. Bonds (State Tax Supported), Capital Appreciation Bonds, Series 2001, AMBAC insured, 0% 2023 | 2,625 | 2,443 |
American High-Income Municipal Bond Fund — Page 30 of 77
| Bonds, notes & other debt instruments (continued) Illinois (continued) | Principal amount (000) | Value (000) |
| Sports Facs. Auth., Sports Facs. Rev. Ref. Bonds (State Tax Supported), Capital Appreciation Bonds, Series 2001, AMBAC insured, 0% 2025 | $545 | $479 |
| Sports Facs. Auth., Sports Facs. Rev. Ref. Bonds (State Tax Supported), Capital Appreciation Bonds, Series 2001, AMBAC insured, 0% 2026 | 640 | 542 |
| Sports Facs. Auth., Sports Facs. Rev. Ref. Bonds (State Tax Supported), Series 2014, Assured Guaranty Municipal insured, 5.25% 2030 | 6,000 | 6,740 |
| Sports Facs. Auth., Sports Facs. Rev. Ref. Bonds (State Tax Supported), Series 2014, Assured Guaranty Municipal insured, 5.25% 2031 | 2,500 | 2,800 |
| Sports Facs. Auth., Sports Facs. Rev. Ref. Bonds (State Tax Supported), Series 2014, Assured Guaranty Municipal insured, 5.25% 2032 | 1,000 | 1,117 |
| Sports Facs. Auth., Sports Facs. Rev. Ref. Bonds (State Tax Supported), Series 2019, 5.00% 2028 | 1,000 | 1,141 |
| Sports Facs. Auth., Sports Facs. Rev. Ref. Bonds (State Tax Supported), Series 2019, 5.00% 2029 | 2,000 | 2,294 |
| Sports Facs. Auth., Sports Facs. Rev. Ref. Bonds (State Tax Supported), Series 2019, BAM insured, 5.00% 2028 | 2,000 | 2,472 |
| Sports Facs. Auth., Sports Facs. Rev. Ref. Bonds (State Tax Supported), Series 2019, BAM insured, 5.00% 2030 | 2,250 | 2,714 |
| Toll Highway Auth., Toll Highway Rev. Bonds, Series 2015-B, 5.00% 2040 | 4,000 | 4,688 |
| Board of Trustees of the University of Illinois, Auxiliary Facs. System Rev. Bonds, Series 2014-A, 5.00% 2024 | 480 | 553 |
| Board of Trustees of the University of Illinois, Auxiliary Facs. System Rev. Ref. Bonds, Series 2013-A, 5.00% 2026 | 750 | 829 |
| Board of Trustees of the University of Illinois, Auxiliary Facs. System Rev. Ref. Bonds, Series 2016-A, 4.00% 2034 | 2,160 | 2,391 |
| Board of Trustees of the University of Illinois, Auxiliary Facs. System Rev. Ref. Bonds, Series 2016-A, 5.00% 2025 | 1,000 | 1,188 |
| Board of Trustees of the University of Illinois, Auxiliary Facs. System Rev. Ref. Bonds, Series 2016-A, Assured Guaranty Municipal insured, 4.00% 2036 | 5,000 | 5,531 |
| Board of Trustees of the University of Illinois, Auxiliary Facs. System Rev. Ref. Bonds, Series 2013-A, 5.00% 2023 | 2,985 | 3,318 |
| Board of Trustees of the University of Illinois, Rev. Ref. Certs. of Part., Series 2014-C, 5.00% 2023 | 775 | 860 |
| Board of Trustees of the University of Illinois, Rev. Ref. Certs. of Part., Series 2016-A, 5.00% 2020 | 145 | 145 |
| Village of Volo, Special Service Areas Nos. 3 and 6 (Symphony Meadows/Lancaster Falls Projects), Special Tax Rev. Ref. Bonds, Series 2016, Assured Guaranty Municipal insured, 3.125% 2027 | 1,129 | 1,235 |
| Village of Volo, Special Service Areas Nos. 3 and 6 (Symphony Meadows/Lancaster Falls Projects), Special Tax Rev. Ref. Bonds, Series 2016, Assured Guaranty Municipal insured, 4.00% 2036 | 1,246 | 1,359 |
| Village of Volo, Special Service Areas Nos. 3 and 6 (Symphony Meadows/Lancaster Falls Projects), Special Tax Rev. Ref. Bonds, Series 2016, Assured Guaranty Municipal insured, 5.00% 2034 | 4,993 | 5,811 |
| United City of Yorkville, Special Service Area Nos. 2005-108 and 2005-109, Special Tax Rev. Ref. Bonds, Series 2016, Assured Guaranty Municipal insured, 4.00% 2036 | 7,531 | 8,169 |
| United City of Yorkville, Special Service Area Nos. 2005-108 and 2005-109, Special Tax Rev. Ref. Bonds, Series 2016, Assured Guaranty Municipal insured, 5.00% 2032 | 4,320 | 5,133 |
| 1,282,018 | ||
| Indiana 1.30% | ||
| Fin. Auth., Health Facs. Rev. Bonds (Good Samaritan Hospital Project), Series 2016-A, 5.50% 2041 | 2,000 | 2,247 |
| Fin. Auth., Health System Rev. Bonds (Franciscan Alliance, Inc.), Series 2016-A, 5.00% 2051 | 1,500 | 1,719 |
| Fin. Auth., Hospital Rev. Bonds (Goshen Health), Series 2019-A, 4.00% 2043 | 2,000 | 2,248 |
| Fin. Auth., Hospital Rev. Ref. Bonds (The Methodist Hospitals, Inc.), Series 2014-A, 5.00% 2028 | 2,500 | 2,805 |
| Fin. Auth., Midwestern Disaster Relief Rev. Bonds (Ohio Valley Electric Corp. Project), Series 2012-A, 5.00% 2032 | 17,560 | 18,355 |
| Fin. Auth., Midwestern Disaster Relief Rev. Bonds (Ohio Valley Electric Corp. Project), Series 2012-A, 5.00% 2039 | 10,100 | 10,500 |
| Fin. Auth., Midwestern Disaster Relief Rev. Bonds (Ohio Valley Electric Corp. Project), Series 2012-B, 3.00% 2030 | 2,500 | 2,626 |
| Fin. Auth., Private Activity Bonds (Ohio River Bridges East End Crossing Project), Series 2013-A, AMT, 5.00% 2035 | 3,000 | 3,249 |
| Fin. Auth., Private Activity Bonds (Ohio River Bridges East End Crossing Project), Series 2013-A, AMT, 5.00% 2044 | 7,225 | 7,747 |
American High-Income Municipal Bond Fund — Page 31 of 77
| Bonds, notes & other debt instruments (continued) Indiana (continued) | Principal amount (000) | Value (000) |
| Fin. Auth., Private Activity Bonds (Ohio River Bridges East End Crossing Project), Series 2013-A, AMT, 5.00% 2048 | $3,250 | $3,478 |
| Fin. Auth., Private Activity Bonds (Ohio River Bridges East End Crossing Project), Series 2013-A, AMT, 5.25% 2051 | 3,410 | 3,669 |
| Fin. Auth., Rev. Bonds (BHI Senior Living Obligated Group), Series 2016-A, 5.25% 2046 | 6,750 | 7,187 |
| Fin. Auth., Rev. Bonds (BHI Senior Living Obligated Group), Series 2018-A, 5.00% 2033 | 2,410 | 2,633 |
| Fin. Auth., Rev. Bonds (BHI Senior Living Obligated Group), Series 2018-A, 5.00% 2038 | 2,395 | 2,588 |
| Fin. Auth., Rev. Bonds (BHI Senior Living Obligated Group), Series 2018-A, 5.00% 2043 | 4,000 | 4,276 |
| Fin. Auth., Rev. Bonds (BHI Senior Living Obligated Group), Series 2018-A, 5.00% 2048 | 4,500 | 4,785 |
| Fin. Auth., Rev. Bonds (Greencroft Obligated Group), Series 2013-A, 5.75% 2028 | 255 | 269 |
| Fin. Auth., Rev. Bonds (Greencroft Obligated Group), Series 2013-A, 6.50% 2033 | 215 | 230 |
| Fin. Auth., Rev. Bonds (Greencroft Obligated Group), Series 2013-A, 7.00% 2043 | 3,710 | 3,980 |
| Fin. Auth., Rev. Ref. Bonds (Community Foundation of Northwest Indiana Obligated Group), Series 2015, 5.00% 2036 | 3,730 | 4,295 |
| City of Franklin, Econ. Dev. Rev. Ref. Bonds (Otterbein Homes Obligated Group), Series 2019-B, 5.00% 2029 | 635 | 786 |
| City of Franklin, Econ. Dev. Rev. Ref. Bonds (Otterbein Homes Obligated Group), Series 2019-B, 5.00% 2031 | 700 | 850 |
| Gary/Chicago International Airport Auth., Airport Dev. Zone Rev. Bonds, Series 2014, AMT, 5.00% 2039 | 2,500 | 2,730 |
| Gary/Chicago International Airport Auth., Airport Dev. Zone Rev. Bonds, Series 2014, AMT, 5.25% 2034 | 1,000 | 1,110 |
| Housing and Community Dev. Auth., Single Family Mortgage Rev. Bonds, Series 2016-A-2, AMT, 3.50% 2038 | 845 | 889 |
| County of Knox, Econ. Dev. Rev. and Ref. Bonds (Good Samaritan Hospital Project), Series 2012-A, 5.00% 2023 | 1,000 | 1,056 |
| County of Knox, Econ. Dev. Rev. and Ref. Bonds (Good Samaritan Hospital Project), Series 2012-A, 5.00% 2025 | 1,570 | 1,654 |
| City of Valparaiso, Exempt Facs. Rev. Bonds (Pratt Paper (IN), LLC Project), Series 2013, AMT, 7.00% 2044 | 3,080 | 3,428 |
| City of Whiting, Environmental Facs. Rev. Bonds (BP Products North America, Inc. Project), Series 2015, AMT, 5.00% 2045 (put 2022) | 3,000 | 3,282 |
| City of Whiting, Environmental Facs. Rev. Bonds (BP Products North America, Inc. Project), Series 2016-A, AMT, 5.00% 2046 (put 2023) | 3,000 | 3,319 |
| 107,990 | ||
| Iowa 0.48% | ||
| Fin. Auth., Midwestern Disaster Area Rev. Bonds (Iowa Fertilizer Co. Project), Series 2013-B, 5.25% 2050 (put 2037) | 1,500 | 1,581 |
| Fin. Auth., Midwestern Disaster Area Rev. Ref. Bonds (Iowa Fertilizer Co. Project), Series 2013, 5.25% 2025 | 7,960 | 8,347 |
| Fin. Auth., Midwestern Disaster Area Rev. Ref. Bonds (Iowa Fertilizer Co. Project), Series 2013, 5.875% 20262 | 2,320 | 2,415 |
| Fin. Auth., Rev. Bonds (Lifespace Communities, Inc.), Series 2018-A, 5.00% 2043 | 1,500 | 1,574 |
| Fin. Auth., Rev. Bonds (Lifespace Communities, Inc.), Series 2018-A, 5.00% 2048 | 6,340 | 6,621 |
| Fin. Auth., Rev. Bonds (Lifespace Communities, Inc.), Series 2019-A-1, 5.00% 2055 | 2,000 | 2,104 |
| Fin. Auth., Rev. Bonds (Lifespace Communities, Inc.), Series 2019-A-2, 2.875% 2049 | 500 | 501 |
| Fin. Auth., Senior Housing Rev. Bonds (Northcrest, Inc. Project), Series 2018-A, 5.00% 2028 | 535 | 578 |
| Fin. Auth., Senior Housing Rev. Bonds (Northcrest, Inc. Project), Series 2018-A, 5.00% 2033 | 1,000 | 1,062 |
| Fin. Auth., Senior Housing Rev. Bonds (Northcrest, Inc. Project), Series 2018-A, 5.00% 2038 | 1,000 | 1,053 |
| Fin. Auth., Senior Housing Rev. Bonds (Northcrest, Inc. Project), Series 2018-A, 5.00% 2048 | 2,500 | 2,591 |
| Student Loan Liquidity Corp., Student Loan Rev. Bonds, Series 2019-B, AMT, 3.00% 2039 | 4,000 | 4,034 |
| Student Loan Liquidity Corp., Student Loan Rev. Bonds, Series 2019-C, AMT, 3.50% 2044 | 6,950 | 6,878 |
| 39,339 | ||
| Kansas 0.33% | ||
| Dev. Fin. Auth., Rev. Ref. Bonds (Lifespace Communities, Inc.), Series 2010-S, 5.00% 2030 | 1,920 | 1,922 |
| City of Lenexa, Health Care Fac. Rev. Bonds (Lakeview Village, Inc. Project), Series 2017-A, 5.00% 2043 | 4,000 | 4,226 |
| City of Lenexa, Health Care Fac. Rev. Bonds (Lakeview Village, Inc. Project), Series 2018-A, 5.00% 2027 | 750 | 821 |
| City of Lenexa, Health Care Fac. Rev. Bonds (Lakeview Village, Inc. Project), Series 2018-A, 5.00% 2029 | 1,205 | 1,316 |
| City of Lenexa, Health Care Fac. Rev. Bonds (Lakeview Village, Inc. Project), Series 2018-A, 5.00% 2031 | 1,330 | 1,445 |
| City of Lenexa, Health Care Fac. Rev. Bonds (Lakeview Village, Inc. Project), Series 2018-A, 5.00% 2039 | 5,660 | 6,067 |
| City of Wichita, Health Care Facs. Rev. Bonds (Presbyterian Manors, Inc.), Series 2018-I, 5.00% 2047 | 750 | 708 |
American High-Income Municipal Bond Fund — Page 32 of 77
| Bonds, notes & other debt instruments (continued) Kansas (continued) | Principal amount (000) | Value (000) |
| City of Wichita, Health Care Facs. Rev. Bonds (Presbyterian Manors, Inc.), Series 2019-III, 5.00% 2034 | $2,000 | $2,017 |
| City of Wichita, Health Care Facs. Rev. Bonds (Presbyterian Manors, Inc.), Series 2019-III, 5.00% 2050 | 500 | 465 |
| City of Wichita, Sales Tax Special Obligation Rev. Bonds (K-96 Greenwich Star Bond Project), Series 2017, 3.00% 2023 | 315 | 321 |
| City of Wichita, Sales Tax Special Obligation Rev. Bonds (K-96 Greenwich Star Bond Project), Series 2017, 4.20% 2027 | 5,000 | 5,098 |
| Unified Government of Wyandotte County, Special Obligation Improvement Rev. Ref. Bonds (Wyandotte Plaza Redev. Project), Series 2016, 4.00% 2028 | 560 | 543 |
| Unified Government of Wyandotte County, Special Obligation Improvement Rev. Ref. Bonds (Wyandotte Plaza Redev. Project), Series 2016, 5.00% 2034 | 2,125 | 2,112 |
| 27,061 | ||
| Kentucky 1.00% | ||
| City of Ashland, Medical Center Rev. Bonds (Ashland Hospital Corp. - King’s Daughters Medical Center Project), Series 2016-A, 4.00% 2032 | 500 | 528 |
| City of Ashland, Medical Center Rev. Bonds (Ashland Hospital Corp. - King’s Daughters Medical Center Project), Series 2016-A, 4.00% 2036 | 2,675 | 2,786 |
| City of Ashland, Medical Center Rev. Bonds (Ashland Hospital Corp. - King’s Daughters Medical Center Project), Series 2016-A, 5.00% 2028 | 1,260 | 1,451 |
| City of Ashland, Medical Center Rev. Bonds (Ashland Hospital Corp. - King’s Daughters Medical Center Project), Series 2016-A, 5.00% 2030 | 1,110 | 1,272 |
| City of Ashland, Medical Center Rev. Bonds (Ashland Hospital Corp. - King’s Daughters Medical Center Project), Series 2016-A, 5.00% 2040 | 4,615 | 5,123 |
| City of Ashland, Medical Center Rev. Ref. Bonds (Ashland Hospital Corp. - King’s Daughters Medical Center Project), Series 2019, 4.00% 2034 | 980 | 1,062 |
| City of Ashland, Medical Center Rev. Ref. Bonds (Ashland Hospital Corp. - King’s Daughters Medical Center Project), Series 2019, 4.00% 2036 | 380 | 409 |
| City of Ashland, Medical Center Rev. Ref. Bonds (Ashland Hospital Corp. - King’s Daughters Medical Center Project), Series 2019, 4.00% 2037 | 750 | 806 |
| City of Ashland, Medical Center Rev. Ref. Bonds (Ashland Hospital Corp. - King’s Daughters Medical Center Project), Series 2019, 5.00% 2032 | 910 | 1,104 |
| City of Ashland, Medical Center Rev. Ref. Bonds (Ashland Hospital Corp. - King’s Daughters Medical Center Project), Series 2019, Assured Guaranty Municipal insured, 3.00% 2040 | 6,185 | 6,396 |
| Econ. Dev. Fin. Auth., Health System Rev. Bonds (Norton Healthcare, Inc.), Series 2000-B, National insured, 0% 2026 | 4,500 | 3,959 |
| Econ. Dev. Fin. Auth., Healthcare Facs. Rev. and Rev. Ref. Bonds (Rosedale Green Project), Series 2015, 5.50% 2035 | 550 | 512 |
| Econ. Dev. Fin. Auth., Healthcare Facs. Rev. and Rev. Ref. Bonds (Rosedale Green Project), Series 2015, 5.75% 2045 | 6,515 | 5,919 |
| Econ. Dev. Fin. Auth., Healthcare Facs. Rev. and Rev. Ref. Bonds (Rosedale Green Project), Series 2015, 5.75% 2050 | 2,650 | 2,372 |
| Econ. Dev. Fin. Auth., Hospital Rev. Bonds (Baptist Healthcare System Obligated Group), Series 2017-B, 5.00% 2041 | 4,250 | 4,913 |
| Econ. Dev. Fin. Auth., Hospital Rev. Bonds (Baptist Healthcare System Obligated Group), Series 2017-B, 5.00% 2046 | 8,350 | 9,573 |
| Econ. Dev. Fin. Auth., Hospital Rev. Bonds (Baptist Healthcare System Obligated Group), Series 2017-B, 5.00% 2034 | 2,720 | 3,201 |
| Econ. Dev. Fin. Auth., Louisville Arena Project Rev. Ref. Bonds (Louisville Arena Auth., Inc.), Series 2017-A, Assured Guaranty Municipal insured, 5.00% 2045 | 7,000 | 8,342 |
| Econ. Dev. Fin. Auth., Louisville Arena Project Rev. Ref. Bonds (Louisville Arena Auth., Inc.), Series 2017-A, Assured Guaranty Municipal insured, 5.00% 2047 | 1,500 | 1,606 |
| Higher Education Student Loan Corp., Student Loan Rev. Bonds, Series 2017-A, AMT, 3.00% 2029 | 1,235 | 1,230 |
| Louisville/Jefferson Metro County Government, Health System Rev. Bonds (Norton Healthcare, Inc.), Series 2016-A, 5.00% 2029 | 2,550 | 3,091 |
American High-Income Municipal Bond Fund — Page 33 of 77
| Bonds, notes & other debt instruments (continued) Kentucky (continued) | Principal amount (000) | Value (000) |
| City of Paducah, Electric Plant Board, Rev. Ref. Bonds, Series 2016-A, Assured Guaranty Municipal insured, 5.00% 2028 | $500 | $616 |
| City of Paducah, Electric Plant Board, Rev. Ref. Bonds, Series 2016-A, Assured Guaranty Municipal insured, 5.00% 2035 | 1,500 | 1,802 |
| Public Energy Auth., Gas Supply Rev. Bonds, Series 2018-A, 4.00% 2048 (put 2024) | 6,600 | 7,327 |
| Public Transportation Infrastructure Auth., Toll Rev. Bonds (Downtown Crossing Project), Series 2013-A, 5.75% 2049 | 1,885 | 1,981 |
| Public Transportation Infrastructure Auth., Toll Rev. Bonds (Downtown Crossing Project), Series 2013-A, 6.00% 2053 | 5,500 | 5,810 |
| 83,191 | ||
| Louisiana 1.44% | ||
| Aviation Board, General Airport Rev. Bonds (North Terminal Project), Series 2015-B, AMT, 5.00% 2035 | 1,785 | 2,026 |
| Aviation Board, General Airport Rev. Bonds (North Terminal Project), Series 2015-B, AMT, 5.00% 2040 | 7,000 | 7,874 |
| Aviation Board, General Airport Rev. Ref. Bonds, Series 2017-D-2, AMT, 5.00% 2030 | 300 | 361 |
| Aviation Board, General Airport Rev. Ref. Bonds, Series 2017-D-2, AMT, 5.00% 2031 | 400 | 479 |
| Aviation Board, General Airport Rev. Ref. Bonds, Series 2017-D-2, AMT, 5.00% 2032 | 500 | 597 |
| Aviation Board, General Airport Rev. Ref. Bonds, Series 2017-D-2, AMT, 5.00% 2033 | 1,100 | 1,306 |
| Parish of Calcasieu, Memorial Hospital Service Dist., Hospital Rev. Ref. Bonds (Lake Charles Memorial Hospital Project), Series 2019, 5.00% 2029 | 1,000 | 1,233 |
| Parish of Calcasieu, Memorial Hospital Service Dist., Hospital Rev. Ref. Bonds (Lake Charles Memorial Hospital Project), Series 2019, 5.00% 2034 | 2,000 | 2,314 |
| Parish of Calcasieu, Memorial Hospital Service Dist., Hospital Rev. Ref. Bonds (Lake Charles Memorial Hospital Project), Series 2019, 5.00% 2039 | 2,000 | 2,260 |
| Parish of Jefferson, Hospital Dist. No. 1 (West Jefferson Medical Center), Hospital Rev. Ref. Bonds, Series 2011-A, 6.00% 2039 (preref. 2021) | 1,500 | 1,535 |
| Juban Crossing Econ. Dev. Dist., Rev. Ref. Bonds (Drainage Projects), Series 2015-B, 7.00% 20442 | 3,035 | 2,646 |
| Juban Crossing Econ. Dev. Dist., Rev. Ref. Bonds (Drainage Projects), Series 2015-C, 7.00% 20442 | 10,425 | 9,090 |
| Juban Crossing Econ. Dev. Dist., Rev. Ref. Bonds (Road Projects), Series 2015-A, 7.00% 20442 | 3,000 | 2,616 |
| Local Government Environmental Facs. and Community Dev. Auth., Rev. Bonds (Westlake Chemical Corp. Projects), Series 2009-A, 6.50% 2029 | 2,000 | 2,006 |
| Local Government Environmental Facs. and Community Dev. Auth., Rev. Bonds (Westlake Chemical Corp. Projects), Series 2010-A-1, 6.50% 2035 | 5,750 | 5,809 |
| Local Government Environmental Facs. and Community Dev. Auth., Rev. Bonds (Westlake Chemical Corp. Projects), Series 2010-A-2, 6.50% 2035 | 2,850 | 2,879 |
| Local Government Environmental Facs. and Community Dev. Auth., Rev. Ref. Bonds (Ragin’ Cajun Facs., Inc. Project), Series 2017, Assured Guaranty Municipal insured, 5.00% 2039 | 1,000 | 1,213 |
| Local Government Environmental Facs. and Community Dev. Auth., Rev. Ref. Bonds (Westlake Chemical Corp. Projects), Series 2017, 3.50% 2032 | 5,000 | 5,312 |
| Public Facs. Auth., Lease Rev. Bonds (Provident Group - Flagship Properties LLC - Louisiana State University Greenhouse Dist. Phase II Project), Series 2017, 5.00% 2042 | 2,000 | 2,228 |
| Public Facs. Auth., Lease Rev. Bonds (Provident Group - Flagship Properties LLC - Louisiana State University Greenhouse Dist. Phase II Project), Series 2017, 5.00% 2052 | 800 | 883 |
| Public Facs. Auth., Lease Rev. Bonds (Provident Group - Flagship Properties LLC - Louisiana State University Greenhouse Dist. Phase III Project), Series 2019-A, 5.00% 2059 | 14,000 | 15,743 |
| Public Facs. Auth., Lease Rev. Bonds (Provident Group - Flagship Properties LLC - Louisiana State University Nicholson Gateway Project), Series 2016-A, 5.00% 2051 | 10,460 | 11,413 |
| Public Facs. Auth., Lease Rev. Bonds (Provident Group - Flagship Properties LLC - Louisiana State University Nicholson Gateway Project), Series 2016-A, 5.00% 2056 | 1,000 | 1,088 |
| Public Facs. Auth., Rev. Bonds (Ochsner Clinic Foundation Project), Series 2016, 5.00% 2032 (preref. 2026) | 10 | 13 |
| Public Facs. Auth., Rev. Ref. Bonds (Nineteenth Judicial Dist. Court Building Project), Series 2015, Assured Guaranty Municipal insured, 5.25% 2051 | 1,000 | 1,154 |
| Public Facs. Auth., Rev. Ref. Bonds (Ochsner Clinic Foundation Project), Series 2016, 5.00% 2032 | 890 | 1,047 |
| Public Facs. Auth., Rev. Ref. Bonds (Ochsner Clinic Foundation Project), Series 2016, 5.00% 2033 | 1,620 | 1,897 |
American High-Income Municipal Bond Fund — Page 34 of 77
| Bonds, notes & other debt instruments (continued) Louisiana (continued) | Principal amount (000) | Value (000) |
| Public Facs. Auth., Rev. Ref. Bonds (Ochsner Clinic Foundation Project), Series 2016, 5.00% 2033 (preref. 2026) | $15 | $19 |
| Parish of St. Charles, Gulf Opportunity Zone Rev. Bonds (Valero Project), Series 2010, 4.00% 2040 (put 2022) | 6,500 | 6,805 |
| Parish of St. James, Rev. Bonds (Nustar Logistics, L.P. Project), Series 2008, 6.10% 2038 (put 2030)2 | 4,160 | 4,949 |
| Parish of St. James, Rev. Bonds (Nustar Logistics, L.P. Project), Series 2010, 6.35% 20402 | 8,140 | 9,740 |
| Parish of St. James, Rev. Bonds (Nustar Logistics, L.P. Project), Series 2010-A, 6.35% 20402 | 2,000 | 2,393 |
| Parish of St. James, Rev. Bonds (Nustar Logistics, L.P. Project), Series 2011, 5.85% 2041 (put 2025)2 | 4,500 | 4,951 |
| Parish of St. John the Baptist, Rev. Ref. Bonds (Marathon Oil Corp. Project), Series 2017, 2.10% 2037 (put 2024) | 1,000 | 988 |
| Parish of St. Tammany, Public Trust Fncg. Auth., Rev. and Rev. Ref. Bonds (Christwood Project), Series 2014, 5.00% 2024 | 625 | 640 |
| Parish of St. Tammany, Public Trust Fncg. Auth., Rev. and Rev. Ref. Bonds (Christwood Project), Series 2014, 5.25% 2037 | 2,000 | 2,048 |
| 119,555 | ||
| Maine 0.24% | ||
| Fin. Auth., Solid Waste Disposal Rev. Bonds (Casella Waste Systems, Inc. Project), Series 2005-R-3, AMT, 5.25% 20252 | 2,000 | 2,190 |
| Fin. Auth., Solid Waste Disposal Rev. Bonds (Casella Waste Systems, Inc. Project), Series 2015-R-2, AMT, 4.375% 2035 (put 2025)2 | 250 | 267 |
| Health and Higher Educational Facs. Auth., Rev. Bonds (Eastern Maine Healthcare Systems Obligated Group Issue), Series 2016-A, 5.00% 2041 | 1,800 | 1,965 |
| Health and Higher Educational Facs. Auth., Rev. Bonds (Eastern Maine Healthcare Systems Obligated Group Issue), Series 2016-A, 5.00% 2046 | 1,000 | 1,080 |
| Health and Higher Educational Facs. Auth., Rev. Bonds (Eastern Maine Medical Center Obligated Group Issue), Series 2013, 5.00% 2026 | 275 | 301 |
| Health and Higher Educational Facs. Auth., Rev. Bonds (Eastern Maine Medical Center Obligated Group Issue), Series 2013, 5.00% 2027 | 985 | 1,074 |
| Health and Higher Educational Facs. Auth., Rev. Bonds (MaineGeneral Medical Center Issue), Series 2011, 5.25% 2021 | 250 | 257 |
| Health and Higher Educational Facs. Auth., Rev. Bonds (MaineGeneral Medical Center Issue), Series 2011, 6.75% 2036 | 4,000 | 4,121 |
| Health and Higher Educational Facs. Auth., Rev. Bonds (MaineGeneral Medical Center Issue), Series 2011, 6.75% 2041 | 3,375 | 3,475 |
| Health and Higher Educational Facs. Auth., Rev. Bonds (MaineGeneral Medical Center Issue), Series 2011, 7.00% 2041 | 1,500 | 1,548 |
| City of Portland, General Airport Rev. Ref. Bonds, Series 2016, 5.00% 2031 | 1,090 | 1,272 |
| City of Portland, General Airport Rev. Ref. Bonds, Series 2016, 5.00% 2034 | 1,000 | 1,154 |
| City of Portland, General Airport Rev. Ref. Bonds, Series 2016, 5.00% 2035 | 1,000 | 1,152 |
| 19,856 | ||
| Maryland 1.19% | ||
| County of Baltimore, Rev. Bonds (Oak Crest Village, Inc. Fac.), Series 2016, 5.00% 2037 | 2,100 | 2,331 |
| County of Baltimore, Rev. Bonds (Oak Crest Village, Inc. Fac.), Series 2020, 4.00% 2045 | 1,040 | 1,115 |
| County of Baltimore, Rev. Bonds (Riverwood Village, Inc. Fac.), Series 2020, 4.00% 2045 | 5,550 | 6,095 |
| County of Baltimore, Rev. Bonds (Riverwood Village, Inc. Fac.), Series 2020, 4.00% 2050 | 4,000 | 4,378 |
| Mayor and City Council of Baltimore, Special Obligation Rev. Ref. Bonds, Series 2017-A, 4.00% 2027 | 475 | 491 |
| Mayor and City Council of Baltimore, Special Obligation Rev. Ref. Bonds, Series 2017-A, 4.50% 2033 | 3,900 | 4,017 |
| Mayor and City Council of Baltimore, Special Obligation Rev. Ref. Bonds, Series 2017-A, 5.00% 2038 | 1,725 | 1,809 |
| Mayor and Council of Brunswick, Special Obligation Rev. Ref. Bonds (Brunswick Crossing Special Taxing Dist.), Series 2019, 3.00% 2024 | 880 | 877 |
| Mayor and Council of Brunswick, Special Obligation Rev. Ref. Bonds (Brunswick Crossing Special Taxing Dist.), Series 2019, 4.00% 2029 | 950 | 968 |
American High-Income Municipal Bond Fund — Page 35 of 77
| Bonds, notes & other debt instruments (continued) Maryland (continued) | Principal amount (000) | Value (000) |
| Mayor and Council of Brunswick, Special Obligation Rev. Ref. Bonds (Brunswick Crossing Special Taxing Dist.), Series 2019, 5.00% 2036 | $1,400 | $1,471 |
| Community Dev. Administration, Dept. of Housing and Community Dev., Residential Rev. Bonds, Series 2014-B, AMT, 3.25% 2044 | 465 | 481 |
| Community Dev. Administration, Dept. of Housing and Community Dev., Residential Rev. Ref. Bonds, Series 2014-D, AMT, 4.00% 2036 | 635 | 672 |
| Econ. Dev. Corp., Econ. Dev. Rev. Bonds (Terminal Project), Series 2019-A, AMT, 5.00% 2044 | 500 | 548 |
| Econ. Dev. Corp., Econ. Dev. Rev. Bonds (Terminal Project), Series 2019-A, AMT, 5.00% 2049 | 1,250 | 1,361 |
| Econ. Dev. Corp., Econ. Dev. Rev. Ref. Bonds (Transportation Facs. Project), Series 2017-A, 5.00% 2029 | 1,850 | 2,130 |
| Econ. Dev. Corp., Econ. Dev. Rev. Ref. Bonds (Transportation Facs. Project), Series 2017-A, 5.00% 2032 | 1,000 | 1,125 |
| Econ. Dev. Corp., Special Obligation Bonds (Metro Centre at Owings Mills Project), Series 2017, 4.375% 2036 | 3,560 | 3,466 |
| Econ. Dev. Corp., Special Obligation Bonds (Metro Centre at Owings Mills Project), Series 2017, 4.50% 2044 | 6,850 | 6,645 |
| Econ. Dev. Corp., Student Housing Rev. Bonds (Bowie State University Project), Series 2020, 4.00% 2040 | 500 | 509 |
| Econ. Dev. Corp., Student Housing Rev. Bonds (Bowie State University Project), Series 2020, 4.00% 2050 | 1,500 | 1,504 |
| Econ. Dev. Corp., Student Housing Rev. Bonds (Bowie State University Project), Series 2020, 5.00% 2055 | 2,000 | 2,151 |
| Econ. Dev. Corp., Student Housing Rev. Ref. Bonds (Bowie State University Project), Series 2015, 5.00% 20252 | 2,100 | 2,239 |
| Econ. Dev. Corp., Student Housing Rev. Ref. Bonds (Bowie State University Project), Series 2015, 5.00% 20292 | 1,680 | 1,823 |
| Econ. Dev. Corp., Student Housing Rev. Ref. Bonds (Frostburg State University Project), Series 2013, 5.00% 2033 | 1,000 | 1,065 |
| Econ. Dev. Corp., Student Housing Rev. Ref. Bonds (Morgan State University Project), Series 2012, 5.00% 2034 | 1,500 | 1,560 |
| Health and Higher Educational Facs. Auth., Rev. Bonds (Adventist HealthCare Issue), Series 2016-A, 5.50% 2036 | 8,000 | 9,153 |
| Health and Higher Educational Facs. Auth., Rev. Bonds (Broadmead Issue), Series 2018-A, 5.00% 2048 | 4,500 | 4,919 |
| Health and Higher Educational Facs. Auth., Rev. Bonds (Frederick Health System), Series 2020, 4.00% 2045 | 900 | 1,010 |
| Health and Higher Educational Facs. Auth., Rev. Bonds (Frederick Health System), Series 2020, 4.00% 2050 | 1,000 | 1,118 |
| County of Howard, Special Obligation Bonds (Downtown Columbia), Series 2017-A, 4.00% 20282 | 550 | 563 |
| County of Howard, Special Obligation Bonds (Downtown Columbia), Series 2017-A, 4.125% 20342 | 750 | 755 |
| County of Howard, Special Obligation Bonds (Downtown Columbia), Series 2017-A, 4.375% 20392 | 2,000 | 2,021 |
| County of Howard, Special Obligation Bonds (Downtown Columbia), Series 2017-A, 4.50% 20472 | 10,000 | 10,078 |
| County of Prince George, Special Obligation Bonds (Hampton Park Project), Series 2019-A, 4.00% 20312 | 750 | 759 |
| County of Prince George, Special Obligation Bonds (Hampton Park Project), Series 2019-A, 4.25% 20392 | 2,150 | 2,135 |
| County of Prince George, Special Obligation Bonds (Hampton Park Project), Series 2019-A, 4.375% 20482 | 5,330 | 5,224 |
| County of Prince George, Special Obligation Bonds (National Harbor Project), Series 2004, 5.20% 2034 | 6,832 | 6,881 |
| County of Prince George, Special Obligation Bonds (Suitland-Naylor Road Project), Series 2016, 5.00% 20462 | 2,500 | 2,623 |
| County of Prince George, Special Tax Dist. Bonds (Victoria Falls Project), Series 2005, 5.25% 2035 | 839 | 846 |
| 98,916 | ||
| Massachusetts 0.80% | ||
| Dev. Fin. Agcy., Rev. Bonds (Boston Medical Center Issue), Series 2015-D, 5.00% 2044 | 1,500 | 1,674 |
| Dev. Fin. Agcy., Rev. Bonds (Linden Ponds, Inc. Issue), Series 2011-B, 0% 2056 | 5,138 | 780 |
| Dev. Fin. Agcy., Rev. Bonds (Linden Ponds, Inc. Issue), Series 2018, 5.00% 20282 | 3,335 | 3,389 |
| Dev. Fin. Agcy., Rev. Bonds (Linden Ponds, Inc. Issue), Series 2018, 5.00% 20332 | 4,000 | 3,977 |
| Dev. Fin. Agcy., Rev. Bonds (Linden Ponds, Inc. Issue), Series 2018, 5.00% 20382 | 4,250 | 4,112 |
| Dev. Fin. Agcy., Rev. Bonds (Linden Ponds, Inc. Issue), Series 2018, 5.125% 20462 | 7,825 | 7,503 |
| Dev. Fin. Agcy., Rev. Bonds (Partners HealthCare System Issue), Series 2017-S, 4.00% 2036 | 2,500 | 2,909 |
| Dev. Fin. Agcy., Rev. Bonds (UMass Memorial Health Care Obligated Group Issue), Series 2016-I, 5.00% 2029 | 1,800 | 2,112 |
| Dev. Fin. Agcy., Rev. Bonds (UMass Memorial Health Care Obligated Group Issue), Series 2016-I, 5.00% 2036 | 3,500 | 4,010 |
| Dev. Fin. Agcy., Rev. Bonds (Wellforce Obligated Issue), Series 2019-A, 5.00% 2038 | 500 | 591 |
| Dev. Fin. Agcy., Rev. Bonds (Wellforce Obligated Issue), Series 2019-A, 5.00% 2044 | 750 | 873 |
| Dev. Fin. Agcy., Rev. Ref. Bonds (Newbridge Charles Issue), Series 2017, 5.00% 20472 | 1,800 | 1,924 |
| Dev. Fin. Agcy., Rev. Ref. Bonds (Tufts Medical Center Issue), Series 2011-I, 6.75% 2036 (preref. 2021) | 3,505 | 3,599 |
| Dev. Fin. Agcy., Rev. Ref. Bonds (Tufts Medical Center Issue), Series 2011-I, 6.875% 2041 (preref. 2021) | 1,205 | 1,238 |
| Dev. Fin. Agcy., Rev. Ref. Bonds (Tufts Medical Center Issue), Series 2011-I, 6.875% 2041 (preref. 2021) | 795 | 817 |
| Educational Fncg. Auth., Education Loan Rev. Bonds, Series 2016-J, AMT, 3.50% 2033 | 8,485 | 8,664 |
American High-Income Municipal Bond Fund — Page 36 of 77
| Bonds, notes & other debt instruments (continued) Massachusetts (continued) | Principal amount (000) | Value (000) |
| Educational Fncg. Auth., Education Loan Rev. Bonds, Series 2017-A, AMT, 3.625% 2032 | $6,920 | $7,173 |
| Educational Fncg. Auth., Education Loan Rev. Bonds, Series 2019-B, AMT, 3.00% 2035 | 5,000 | 5,053 |
| Health and Educational Facs. Auth., Rev. Bonds (UMass Memorial Issue), Series 2010-G, 5.00% 2021 | 405 | 406 |
| Health and Educational Facs. Auth., Rev. Ref. Bonds (Northeastern University Issue), Series 2010-A, 5.00% 2035 | 1,800 | 1,814 |
| Housing Fin. Agcy., Single Family Housing Rev. Ref. Bonds, Series 177, AMT, 4.00% 2039 | 1,820 | 1,930 |
| Housing Fin. Agcy., Single Family Housing Rev. Ref. Bonds, Series 188, AMT, 4.00% 2043 | 1,310 | 1,418 |
| 65,966 | ||
| Michigan 1.79% | ||
| City of Dearborn, Econ. Dev. Corp., Limited Obligation Rev. Ref. Bonds (Henry Ford Village, Inc. Project), Series 2008, 7.00% 2038 | 2,500 | 1,921 |
| City of Dearborn, Econ. Dev. Corp., Limited Obligation Rev. Ref. Bonds (Henry Ford Village, Inc. Project), Series 2008, 7.125% 2043 | 6,525 | 5,017 |
| City of Dearborn, Econ. Dev. Corp., Limited Obligation Rev. Ref. Bonds (Henry Ford Village, Inc. Project), Series 2017, 7.50% 20442 | 6,600 | 5,071 |
| City of Detroit, Unlimited Tax G.O. Bonds, Series 2018, 5.00% 2021 | 1,000 | 1,011 |
| City of Detroit, Unlimited Tax G.O. Bonds, Series 2018, 5.00% 2024 | 500 | 525 |
| City of Detroit, Unlimited Tax G.O. Bonds, Series 2018, 5.00% 2025 | 1,350 | 1,432 |
| City of Detroit, Unlimited Tax G.O. Bonds, Series 2018, 5.00% 2029 | 250 | 268 |
| City of Detroit, Unlimited Tax G.O. Bonds, Series 2018, 5.00% 2030 | 500 | 533 |
| City of Detroit, Unlimited Tax G.O. Bonds, Series 2018, 5.00% 2032 | 1,000 | 1,054 |
| City of Detroit, Unlimited Tax G.O. Bonds, Series 2018, 5.00% 2033 | 500 | 524 |
| City of Detroit, Unlimited Tax G.O. Bonds, Series 2018, 5.00% 2034 | 1,250 | 1,307 |
| City of Detroit, Unlimited Tax G.O. Bonds, Series 2018, 5.00% 2036 | 1,565 | 1,626 |
| City of Detroit, Unlimited Tax G.O. Bonds, Series 2018, 5.00% 2037 | 500 | 518 |
| City of Detroit, Unlimited Tax G.O. Bonds, Series 2018, 5.00% 2038 | 1,300 | 1,344 |
| City of Detroit, Water and Sewerage Dept., Sewage Disposal System Rev. and Rev. Ref. Bonds, Series 2012-A, Assured Guaranty Municipal insured, 5.25% 2039 | 4,850 | 5,322 |
| Detroit School Dist., Unlimited Tax G.O. School Building and Site Improvement Rev. Ref. Bonds, Series 2012-A, 5.00% 2026 | 1,000 | 1,078 |
| Fin. Auth., Hospital Rev. and Rev. Ref. Bonds (Trinity Health Credit Group), Series 2017-A, 4.00% 2040 | 5,000 | 5,688 |
| Fin. Auth., Hospital Rev. and Rev. Ref. Bonds (Trinity Health Credit Group), Series 2017-A, 5.00% 2047 (preref. 2022) | 1,400 | 1,554 |
| Fin. Auth., Hospital Rev. Ref. Bonds (Henry Ford Health System), Series 2016, 5.00% 2037 | 3,500 | 4,164 |
| Fin. Auth., Hospital Rev. Ref. Bonds (Henry Ford Health System), Series 2016, 5.00% 2041 | 2,005 | 2,372 |
| Fin. Auth., Hospital Rev. Ref. Bonds (McLaren Health Care), Series 2019-A, 4.00% 2047 | 1,700 | 1,937 |
| Fin. Auth., Hospital Rev. Ref. Bonds (Oakwood Obligated Group), Series 2012, 5.00% 2027 | 1,090 | 1,186 |
| Fin. Auth., Local Government Loan Program Rev. Bonds (Detroit Fin. Recovery Income Tax Local Project Bonds), Series 2014-F-1, 4.50% 2029 | 2,600 | 2,750 |
| Fin. Auth., Local Government Loan Program Rev. Bonds (Detroit Water and Sewerage Dept., Sewage Disposal System Rev. and Rev. Ref. Local Project Bonds), Series 2014-C-6, 5.00% 2033 | 2,000 | 2,270 |
| Fin. Auth., Local Government Loan Program Rev. Bonds (Detroit Water and Sewerage Dept., Sewage Disposal System Rev. Ref. Local Project Bonds), Series 2015-C, 5.00% 2032 | 500 | 593 |
| Fin. Auth., Local Government Loan Program Rev. Bonds (Detroit Water and Sewerage Dept., Sewage Disposal System Rev. Ref. Local Project Bonds), Series 2015-C, 5.00% 2034 | 2,000 | 2,359 |
| Fin. Auth., Local Government Loan Program Rev. Bonds (Detroit Water and Sewerage Dept., Sewage Disposal System Rev. Ref. Local Project Bonds), Series 2015-C, 5.00% 2035 | 1,500 | 1,761 |
| Fin. Auth., Local Government Loan Program Rev. Bonds (Detroit Water and Sewerage Dept., Water Supply System Rev. Ref. Local Project Bonds), Series 2014-D-4, 5.00% 2034 | 1,000 | 1,134 |
| Fin. Auth., Student Loan Rev. Ref. Bonds, Series 25-A, AMT, 4.00% 2030 | 2,550 | 2,643 |
| Fin. Auth., Student Loan Rev. Ref. Bonds, Series 25-A, AMT, 4.00% 2031 | 1,000 | 1,035 |
| Fin. Auth., Student Loan Rev. Ref. Bonds, Series 25-A, AMT, 5.00% 2021 | 1,500 | 1,559 |
| Fin. Auth., Student Loan Rev. Ref. Bonds, Series 25-A, AMT, 5.00% 2022 | 3,150 | 3,370 |
| City of Flint, Hospital Building Auth., Rev. Ref. Bonds (Hurley Medical Center), Series 2013-B, 4.75% 2023 | 755 | 802 |
American High-Income Municipal Bond Fund — Page 37 of 77
| Bonds, notes & other debt instruments (continued) Michigan (continued) | Principal amount (000) | Value (000) |
| City of Flint, Hospital Building Auth., Rev. Rental Bonds (Hurley Medical Center), Series 2013-A, 5.00% 2023 | $1,555 | $1,660 |
| City of Flint, Hospital Building Auth., Rev. Rental Bonds (Hurley Medical Center), Series 2013-A, 5.25% 2028 | 4,000 | 4,379 |
| City of Flint, Hospital Building Auth., Rev. Rental Bonds (Hurley Medical Center), Series 2013-A, 5.25% 2039 | 2,775 | 2,967 |
| City of Grand Rapids, Econ. Dev. Corp., Rev. Bonds (Clark Retirement Community Inc.), Series 2019-A, 5.50% 2039 | 7,500 | 6,673 |
| City of Grand Rapids, Econ. Dev. Corp., Rev. Bonds (Clark Retirement Community Inc.), Series 2019-A, 5.75% 2049 | 2,000 | 1,743 |
| City of Grand Rapids, Econ. Dev. Corp., Rev. Bonds (Clark Retirement Community Inc.), Series 2019-A, 5.75% 2054 | 2,000 | 1,696 |
| City of Grand Rapids, Econ. Dev. Corp., Rev. Ref. Bonds (Beacon Hill Estate Project), Series 2017-A, 4.00% 2027 | 2,770 | 2,784 |
| City of Grand Rapids, Econ. Dev. Corp., Rev. Ref. Bonds (Beacon Hill Estate Project), Series 2017-A, 5.00% 2032 | 1,055 | 1,100 |
| City of Grand Rapids, Econ. Dev. Corp., Rev. Ref. Bonds (Beacon Hill Estate Project), Series 2017-A, 5.00% 2037 | 1,200 | 1,228 |
| City of Grand Rapids, Econ. Dev. Corp., Rev. Ref. Bonds (Beacon Hill Estate Project), Series 2017-A, 5.00% 2047 | 5,165 | 5,193 |
| City of Grand Rapids, Econ. Dev. Corp., Rev. Ref. Bonds (Beacon Hill Estate Project), Series 2017-A, 5.00% 2052 | 4,740 | 4,751 |
| Great Lakes Water Auth., Water Supply System Rev. Ref. Bonds, Series 2016-B, 5.00% 2046 | 5,000 | 5,928 |
| Housing Dev. Auth., Single Family Mortgage Rev. Bonds, Series 2016-B, 3.35% 2034 | 1,500 | 1,630 |
| Housing Dev. Auth., Single Family Mortgage Rev. Bonds, Series 2016-B, 3.50% 2047 | 850 | 911 |
| City of Kentwood, Econ. Dev. Corp., Limited Obligation Rev. Ref. Bonds (Holland Home Obligated Group), Series 2012, 5.625% 2041 | 4,775 | 4,908 |
| City of Kentwood, Econ. Dev. Corp., Limited Obligation Rev. Ref. Bonds (Holland Home Obligated Group), Series 2016, 5.00% 2037 | 8,625 | 9,021 |
| Strategic Fund, Limited Obligation Rev. Bonds (I-75 Improvement Project), Series 2018, Assured Guaranty Municipal insured, AMT, 5.00% 2043 | 5,000 | 5,642 |
| Strategic Fund, Limited Obligation Rev. Bonds (I-75 Improvement Project), Series 2018, Assured Guaranty Municipal insured, AMT, 5.00% 2048 | 2,750 | 3,076 |
| Strategic Fund, Limited Obligation Rev. Ref. Bonds (Detroit Edison Co. Exempt Facs. Project), Series 2008-ET-2, 1.45% 2029 (put 2021) | 1,950 | 1,961 |
| Strategic Fund, Limited Obligation Rev. Ref. Bonds (Holland Home Obligated Group), Series 2019, 5.00% 2029 | 1,000 | 1,099 |
| Strategic Fund, Limited Obligation Rev. Ref. Bonds (Holland Home Obligated Group), Series 2019, 5.00% 2043 | 1,000 | 1,046 |
| County of Wayne, Airport Auth., Airport Rev. Ref. Bonds (Detroit Metropolitan Wayne County Airport), Series 2012-D, AMT, 5.00% 2028 | 12,000 | 13,003 |
| 148,127 | ||
| Minnesota 0.25% | ||
| City of Duluth, Econ. Dev. Auth., Health Care Facs. Rev. Bonds (Essentia Health Obligated Group), Series 2018-A, 5.00% 2058 | 5,000 | 5,778 |
| Higher Education Supplemental Loan Auth., Rev. Bonds, Series 2018, AMT, 4.00% 2037 | 8,500 | 9,355 |
| Higher Education Supplemental Loan Auth., Rev. Bonds, Series 2020, AMT, 2.65% 2038 | 2,000 | 2,017 |
| Housing Fin. Agcy., Residential Housing Fin. Bonds, Series 2013-A, AMT, 3.00% 2031 | 200 | 206 |
| Housing Fin. Agcy., Residential Housing Fin. Bonds, Series 2014-C, AMT, 4.00% 2045 | 770 | 824 |
| City of St. Paul, Housing and Redev. Auth., Charter School Lease Rev. Bonds (Great River School Project), Series 2017-A, 4.75% 20292 | 365 | 386 |
| City of St. Paul, Housing and Redev. Auth., Charter School Lease Rev. Bonds (Great River School Project), Series 2017-A, 5.25% 20332 | 140 | 152 |
| City of St. Paul, Housing and Redev. Auth., Charter School Lease Rev. Bonds (Great River School Project), Series 2017-A, 5.50% 20522 | 1,600 | 1,710 |
| 20,428 |
American High-Income Municipal Bond Fund — Page 38 of 77
| Bonds, notes & other debt instruments (continued) Mississippi 0.33% | Principal amount (000) | Value (000) |
| Business Fin. Corp., Solid Waste Disposal, Rev. Bonds (Waste Pro USA, Inc. Project), Series 2017, AMT, 5.00% 2036 (put 2022)2 | $10,500 | $10,762 |
| Hospital Equipment and Facs. Auth., Rev. Bonds (Baptist Memorial Health Care), Series 2016-A, 5.00% 2041 | 4,000 | 4,596 |
| Hospital Equipment and Facs. Auth., Rev. Bonds (Baptist Memorial Health Care), Series 2016-A, 5.00% 2046 | 4,000 | 4,563 |
| County of Warren, Gulf Opportunity Zone Bonds (International Paper Co. Project), Series 2011-A, 5.375% 2035 | 5,100 | 5,341 |
| County of Warren, Gulf Opportunity Zone Rev. Ref. Bonds (International Paper Co. Project), Series 2018, 2.90% 2032 (put 2023) | 1,900 | 2,011 |
| 27,273 | ||
| Missouri 1.54% | ||
| County of Cape Girardeau, Industrial Dev. Auth., Health Facs. Rev. Bonds (Southeast Missouri Hospital Association), Series 2016-A, 6.00% 2033 | 4,250 | 4,789 |
| Health and Educational Facs. Auth., Health Facs. Rev. Bonds (Bethesda Health Group, Inc.), Series 2015, 5.00% 2040 | 1,650 | 1,705 |
| Health and Educational Facs. Auth., Health Facs. Rev. Bonds (Bethesda Health Group, Inc.), Series 2015, 5.00% 2045 | 2,050 | 2,107 |
| Health and Educational Facs. Auth., Health Facs. Rev. Ref. Bonds (St. Anthony’s Medical Center), Series 2015-B, 5.00% 2045 | 1,320 | 1,532 |
| Health and Educational Facs. Auth., Senior Living Facs. Rev. Bonds (Christian Horizons Obligated Group), Series 2018, 5.00% 2036 | 1,500 | 1,586 |
| Health and Educational Facs. Auth., Senior Living Facs. Rev. Bonds (Christian Horizons Obligated Group), Series 2018, 5.00% 2040 | 2,000 | 2,093 |
| Health and Educational Facs. Auth., Senior Living Facs. Rev. Bonds (Lutheran Senior Services), Series 2011, 6.00% 2041 | 1,000 | 1,017 |
| Health and Educational Facs. Auth., Senior Living Facs. Rev. Bonds (Lutheran Senior Services), Series 2019-A, 5.00% 2034 | 2,500 | 2,736 |
| Health and Educational Facs. Auth., Senior Living Facs. Rev. Bonds (Lutheran Senior Services), Series 2019-A, 5.00% 2042 | 5,600 | 6,066 |
| Health and Educational Facs. Auth., Senior Living Facs. Rev. Bonds (Lutheran Senior Services), Series 2019-B, 2.875% 2034 (put 2022) | 2,600 | 2,587 |
| Health and Educational Facs. Auth., Senior Living Facs. Rev. Bonds (Lutheran Senior Services), Series 2019-C, 4.00% 2048 | 5,000 | 5,076 |
| Health and Educational Facs. Auth., Senior Living Facs. Rev. Ref. Bonds (Lutheran Senior Services), Series 2016-A, 5.00% 2030 | 415 | 458 |
| Health and Educational Facs. Auth., Senior Living Facs. Rev. Ref. Bonds (Lutheran Senior Services), Series 2016-A, 5.00% 2046 | 825 | 881 |
| Housing Dev. Commission, Single Family Mortgage Rev. Bonds (Special Homeownership Loan Program), Series 2015-B-1, AMT, 4.00% 2045 | 2,470 | 2,648 |
| City of Lee’s Summit, Special Obligation Tax Increment and Special Dist. Rev. Ref. and Improvement Bonds (Summit Fair Project), Series 2017, 3.50% 20232 | 515 | 510 |
| City of Lee’s Summit, Special Obligation Tax Increment and Special Dist. Rev. Ref. and Improvement Bonds (Summit Fair Project), Series 2017, 4.00% 20272 | 1,850 | 1,812 |
| City of Maryland Heights, Industrial Dev. Auth., Rev. Bonds (St. Louis Community Ice Center Project), Series 2018-A, 4.375% 2030 | 945 | 858 |
| City of Maryland Heights, Industrial Dev. Auth., Rev. Bonds (St. Louis Community Ice Center Project), Series 2018-A, 5.00% 2039 | 4,360 | 3,817 |
| City of Maryland Heights, Industrial Dev. Auth., Rev. Bonds (St. Louis Community Ice Center Project), Series 2018-A, 5.00% 2049 | 7,250 | 5,958 |
| City of Rolla, Move Rolla Transportation Dev. Dist., Sales Tax Rev. Bonds, Series 2017, 3.75% 2029 | 1,825 | 1,981 |
| City of Rolla, Move Rolla Transportation Dev. Dist., Sales Tax Rev. Bonds, Series 2017, 4.50% 2036 | 750 | 819 |
| City of St. Louis, Airport Rev. Ref. Bonds (Lambert-St. Louis International Airport), Series 2005, National insured, 5.50% 2026 | 2,500 | 3,014 |
American High-Income Municipal Bond Fund — Page 39 of 77
| Bonds, notes & other debt instruments (continued) Missouri (continued) | Principal amount (000) | Value (000) |
| City of St. Louis, Airport Rev. Ref. Bonds (Lambert-St. Louis International Airport), Series 2005, National insured, 5.50% 2027 | $3,275 | $4,178 |
| City of St. Louis, Airport Rev. Ref. Bonds (Lambert-St. Louis International Airport), Series 2005, National insured, 5.50% 2028 | 2,400 | 3,135 |
| City of St. Louis, Airport Rev. Ref. Bonds (Lambert-St. Louis International Airport), Series 2005, National insured, 5.50% 2029 | 1,000 | 1,334 |
| City of St. Louis, Airport Rev. Ref. Bonds (Lambert-St. Louis International Airport), Series 2005, National insured, 5.50% 2030 | 4,255 | 5,781 |
| City of St. Louis, Airport Rev. Ref. Bonds (Lambert-St. Louis International Airport), Series 2005, National insured, 5.50% 2031 | 2,000 | 2,760 |
| City of St. Louis, Airport Rev. Ref. Bonds (Lambert-St. Louis International Airport), Series 2012, AMT, 5.00% 2032 | 1,685 | 1,793 |
| City of St. Louis, Airport Rev. Ref. Bonds (Lambert-St. Louis International Airport), Series 2017-B, AMT, Assured Guaranty Municipal insured, 5.00% 2027 | 1,500 | 1,851 |
| City of St. Louis, Industrial Dev. Auth., Dev. Fncg. Rev. Bonds (Ballpark Village Dev. Project), Series 2017-A, 4.75% 2047 | 1,000 | 886 |
| County of St. Louis, Industrial Dev. Auth., Healthcare Facs. Rev. Bonds (Nazareth Living Center), Series 2012, 6.125% 2042 | 1,000 | 1,029 |
| County of St. Louis, Industrial Dev. Auth., Healthcare Facs. Rev. Bonds (Nazareth Living Center), Series 2015-A, 5.00% 2030 | 1,000 | 1,019 |
| County of St. Louis, Industrial Dev. Auth., Healthcare Facs. Rev. Bonds (Nazareth Living Center), Series 2015-A, 5.00% 2035 | 1,400 | 1,415 |
| County of St. Louis, Industrial Dev. Auth., Healthcare Facs. Rev. Bonds (Nazareth Living Center), Series 2015-A, 5.125% 2045 | 2,000 | 2,007 |
| County of St. Louis, Industrial Dev. Auth., Senior Living Facs. Rev. Bonds (Friendship Village St. Louis Obligated Group), Series 2017, 5.00% 2048 | 5,110 | 5,298 |
| County of St. Louis, Industrial Dev. Auth., Senior Living Facs. Rev. Bonds (Friendship Village St. Louis Obligated Group), Series 2018, 5.00% 2038 | 1,000 | 1,059 |
| County of St. Louis, Industrial Dev. Auth., Senior Living Facs. Rev. Bonds (Friendship Village St. Louis Obligated Group), Series 2018, 5.125% 2049 | 1,335 | 1,400 |
| County of St. Louis, Industrial Dev. Auth., Senior Living Facs. Rev. Bonds (Friendship Village St. Louis Obligated Group), Series 2018, 5.25% 2053 | 18,710 | 19,664 |
| County of St. Louis, Industrial Dev. Auth., Senior Living Facs. Rev. Bonds (Friendship Village St. Louis Obligated Group), Series 2018-A, 5.125% 2048 | 880 | 923 |
| County of St. Louis, Industrial Dev. Auth., Senior Living Facs. Rev. Bonds (Friendship Village Sunset Hills), Series 2012, 5.00% 2032 | 1,020 | 1,043 |
| County of St. Louis, Industrial Dev. Auth., Senior Living Facs. Rev. Bonds (St. Andrew’s Resources for Seniors Obligated Group), Series 2015-A, 5.00% 2025 | 1,455 | 1,482 |
| County of St. Louis, Industrial Dev. Auth., Senior Living Facs. Rev. Bonds (St. Andrew’s Resources for Seniors Obligated Group), Series 2015-A, 5.00% 2035 | 1,410 | 1,383 |
| County of St. Louis, Industrial Dev. Auth., Senior Living Facs. Rev. Bonds (St. Andrew’s Resources for Seniors Obligated Group), Series 2015-A, 5.125% 2045 | 8,300 | 7,898 |
| County of St. Louis, Transportation Dev. Dist., Transportation Rev. Bonds (Missouri Bottom Road/Taussig Road), Series 2002, 7.20% 20335 | 3,300 | 1,122 |
| County of Stoddard, Industrial Dev. Auth., Health Facs. Rev. Bonds (Southeast Missouri Hospital Association), Series 2016-B, 6.00% 2037 | 3,995 | 4,442 |
| Town and Country Crossing Transportation Dev. Dist., Transportation Sales Tax Rev. Ref. Bonds, Series 2020-A, 3.375% 2037 | 575 | 526 |
| 127,478 |
American High-Income Municipal Bond Fund — Page 40 of 77
| Bonds, notes & other debt instruments (continued) Nebraska 0.17% | Principal amount (000) | Value (000) |
| County of Douglas, Hospital Auth. No. 2 (Methodist Health System), Health Facs. Rev. Ref. Bonds, Series 2015, 5.00% 2048 | $2,350 | $2,675 |
| County of Douglas, Sanitary and Improvement Dist. No. 587 (Townhomes at Village Pointe), Construction Fund Warrants, Series 2018, 7.00% 2023 (100% PIK)7,8,9,10 | 27 | 25 |
| County of Douglas, Sanitary and Improvement Dist. No. 587 (Townhomes at Village Pointe), Construction Fund Warrants, Series 2018, 7.00% 20247,8,9,10 | 398 | 367 |
| County of Douglas, Sanitary and Improvement Dist. No. 587 (Townhomes at Village Pointe), Construction Fund Warrants, Series 2018, 7.00% 2024 (100% PIK)7,8,9,10 | 199 | 183 |
| County of Douglas, Sanitary and Improvement Dist. No. 587 (Townhomes at Village Pointe), Construction Fund Warrants, Series 2018, 7.00% 2024 (100% PIK)7,8,9,10 | 194 | 179 |
| County of Douglas, Sanitary and Improvement Dist. No. 587 (Townhomes at Village Pointe), Construction Fund Warrants, Series 2018, 7.00% 2024 (100% PIK)7,8,9,10 | 153 | 141 |
| County of Douglas, Sanitary and Improvement Dist. No. 587 (Townhomes at Village Pointe), Construction Fund Warrants, Series 2018, 7.00% 2024 (100% PIK)7,8,9,10 | 150 | 138 |
| County of Douglas, Sanitary and Improvement Dist. No. 587 (Townhomes at Village Pointe), Construction Fund Warrants, Series 2018, 7.00% 2024 (100% PIK)7,8,9,10 | 62 | 57 |
| County of Douglas, Sanitary and Improvement Dist. No. 596, Construction Fund Warrants, Series 2019, 7.00% 20247,8,9,10 | 344 | 316 |
| County of Douglas, Sanitary and Improvement Dist. No. 596, Construction Fund Warrants, Series 2019, 7.00% 2024 (100% PIK)7,8,9,10 | 352 | 324 |
| County of Douglas, Sanitary and Improvement Dist. No. 596, Construction Fund Warrants, Series 2019, 7.00% 2024 (100% PIK)7,8,9,10 | 331 | 304 |
| County of Douglas, Sanitary and Improvement Dist. No. 596, Construction Fund Warrants, Series 2019, 7.00% 2024 (100% PIK)7,8,9,10 | 228 | 210 |
| County of Douglas, Sanitary and Improvement Dist. No. 596, Construction Fund Warrants, Series 2019, 7.00% 2024 (100% PIK)7,8,9,10 | 65 | 60 |
| County of Douglas, Sanitary and Improvement Dist. No. 596, Construction Fund Warrants, Series 2019, 7.00% 2024 (100% PIK)7,8,9,10 | 56 | 52 |
| County of Douglas, Sanitary and Improvement Dist. No. 596, Construction Fund Warrants, Series 2019, 7.00% 2024 (100% PIK)7,8,9,10 | 10 | 9 |
| County of Douglas, Sanitary and Improvement Dist. No. 596, Construction Fund Warrants, Series 2019, 7.00% 2024 (100% PIK)7,8,9,10 | 8 | 7 |
| County of Douglas, Sanitary and Improvement Dist. No. 596, Construction Fund Warrants, Series 2019, 7.00% 2024 (100% PIK)7,8,9,10 | 3 | 2 |
| County of Douglas, Sanitary and Improvement Dist. No. 596, Construction Fund Warrants, Series 2019, 7.00% 2024 (100% PIK)7,8,9,10 | 2 | 1 |
| County of Douglas, Sanitary and Improvement Dist. No. 596, Construction Fund Warrants, Series 2019, 7.00% 20257,8,10 | 184 | 169 |
| County of Douglas, Sanitary and Improvement Dist. No. 596, Construction Fund Warrants, Series 2019, 7.00% 20257,8,10 | 172 | 159 |
| County of Douglas, Sanitary and Improvement Dist. No. 596, Construction Fund Warrants, Series 2019, 7.00% 20257,8,10 | 25 | 23 |
| Investment Fin. Auth., Single Family Housing Rev. Bonds, Series 2018-C, 4.00% 2048 | 1,960 | 2,160 |
| Investment Fin. Auth., Single Family Housing Rev. Bonds, Series 2019, AMT, 3.75% 2049 | 2,890 | 3,138 |
| Investment Fin. Auth., Single Family Housing Rev. Bonds, Series 2019-B, AMT, 4.00% 2049 | 2,410 | 2,660 |
| County of Sarpy, Sanitary and Improvement Dist. No. 340, Construction Fund Warrants, Series 2020, 7.00% 20257,8,9 | 439 | 404 |
| 13,763 | ||
| Nevada 0.63% | ||
| Dept. of Business and Industry, Charter School Rev. Bonds (Doral Academy of Nevada), Series 2017-A, 5.00% 20372 | 1,000 | 1,060 |
| Dept. of Business and Industry, Charter School Rev. Bonds (Doral Academy of Nevada), Series 2017-A, 5.00% 20472 | 1,600 | 1,660 |
| Dept. of Business and Industry, Lease Rev. Bonds (Somerset Academy), Series 2015-A, 4.00% 2025 | 1,490 | 1,505 |
American High-Income Municipal Bond Fund — Page 41 of 77
| Bonds, notes & other debt instruments (continued) Nevada (continued) | Principal amount (000) | Value (000) |
| Dept. of Business and Industry, Lease Rev. Bonds (Somerset Academy), Series 2015-A, 5.125% 20452 | $1,000 | $1,019 |
| Dept. of Business and Industry, Lease Rev. Bonds (Somerset Academy), Series 2018-A, 4.50% 20292 | 970 | 998 |
| Dept. of Business and Industry, Lease Rev. Bonds (Somerset Academy), Series 2018-A, 5.00% 20382 | 1,000 | 1,022 |
| Dept. of Business and Industry, Lease Rev. Bonds (Somerset Academy), Series 2018-A, 5.00% 20482 | 1,500 | 1,517 |
| County of Clark, Rev. Ref. Bonds (Jet Aviation Fuel Tax), Series 2013-A, AMT, 5.00% 2028 | 2,000 | 2,174 |
| County of Clark, Special Improvement Dist. No. 121 (Southern Highlands Area), Local Improvement Rev. Ref. Bonds, Series 2016, 2.50% 2020 | 440 | 440 |
| County of Clark, Special Improvement Dist. No. 121 (Southern Highlands Area), Local Improvement Rev. Ref. Bonds, Series 2016, 2.50% 2021 | 260 | 260 |
| County of Clark, Special Improvement Dist. No. 121 (Southern Highlands Area), Local Improvement Rev. Ref. Bonds, Series 2016, 2.75% 2022 | 365 | 366 |
| County of Clark, Special Improvement Dist. No. 121 (Southern Highlands Area), Local Improvement Rev. Ref. Bonds, Series 2016, 2.75% 2023 | 375 | 374 |
| County of Clark, Special Improvement Dist. No. 121 (Southern Highlands Area), Local Improvement Rev. Ref. Bonds, Series 2016, 3.00% 2024 | 390 | 390 |
| County of Clark, Special Improvement Dist. No. 121 (Southern Highlands Area), Local Improvement Rev. Ref. Bonds, Series 2016, 3.00% 2025 | 400 | 397 |
| County of Clark, Special Improvement Dist. No. 142 (Mountain’s Edge), Local Improvement Rev. Ref. Bonds, Series 2012, 5.00% 2020 | 990 | 990 |
| County of Clark, Special Improvement Dist. No. 142 (Mountain’s Edge), Local Improvement Rev. Ref. Bonds, Series 2012, 5.00% 2021 | 1,060 | 1,103 |
| County of Clark, Special Improvement Dist. No. 151 (Summerlin-Mesa), Local Improvement Rev. Ref. Bonds, Series 2015, 4.00% 2020 | 1,095 | 1,095 |
| City of Henderson, Local Improvement Dist. No. T-16 (Falls at Lake Las Vegas), Limited Obligation Improvement Bonds, Series 2005, 5.125% 2025 | 2,350 | 2,116 |
| City of Las Vegas, Redev. Agcy., Tax Increment Rev. Ref. Bonds, Series 2016, 5.00% 2045 | 1,225 | 1,373 |
| City of Las Vegas, Sales Tax Increment Rev. Bonds, Series 2016, 3.50% 20252 | 2,415 | 2,410 |
| City of Las Vegas, Special Improvement Dist. No. 607 (Providence), Local Improvement Rev. Ref. Bonds, Series 2013, 4.25% 2024 | 200 | 211 |
| City of Las Vegas, Special Improvement Dist. No. 607 (Providence), Local Improvement Rev. Ref. Bonds, Series 2013, 5.00% 2022 | 335 | 350 |
| City of Las Vegas, Special Improvement Dist. No. 607 (Providence), Local Improvement Rev. Ref. Bonds, Series 2013, 5.00% 2023 | 290 | 310 |
| City of Las Vegas, Special Improvement Dist. No. 607 (Providence), Local Improvement Rev. Ref. Bonds, Series 2013, 5.00% 2024 | 180 | 196 |
| City of Las Vegas, Special Improvement Dist. No. 812 (Summerlin Village 24), Local Improvement Rev. Ref. Bonds, Series 2015, 4.00% 2022 | 1,085 | 1,114 |
| City of Las Vegas, Special Improvement Dist. No. 812 (Summerlin Village 24), Local Improvement Rev. Ref. Bonds, Series 2015, 4.50% 2025 | 650 | 696 |
| City of Las Vegas, Special Improvement Dist. No. 812 (Summerlin Village 24), Local Improvement Rev. Ref. Bonds, Series 2015, 5.00% 2026 | 680 | 742 |
| City of Las Vegas, Special Improvement Dist. No. 812 (Summerlin Village 24), Local Improvement Rev. Ref. Bonds, Series 2015, 5.00% 2029 | 1,615 | 1,740 |
| City of Las Vegas, Special Improvement Dist. No. 812 (Summerlin Village 24), Local Improvement Rev. Ref. Bonds, Series 2015, 5.00% 2035 | 1,585 | 1,672 |
| City of Las Vegas, Special Improvement Dist. No. 813 (Summerlin Village 26), Local Improvement Bonds, Series 2017, 3.00% 2023 | 210 | 211 |
| City of Las Vegas, Special Improvement Dist. No. 813 (Summerlin Village 26), Local Improvement Bonds, Series 2017, 3.00% 2024 | 165 | 165 |
| City of Las Vegas, Special Improvement Dist. No. 813 (Summerlin Village 26), Local Improvement Bonds, Series 2017, 3.00% 2025 | 245 | 243 |
| City of Las Vegas, Special Improvement Dist. No. 813 (Summerlin Village 26), Local Improvement Bonds, Series 2017, 3.25% 2026 | 240 | 239 |
| City of Las Vegas, Special Improvement Dist. No. 813 (Summerlin Village 26), Local Improvement Bonds, Series 2017, 3.50% 2027 | 265 | 267 |
American High-Income Municipal Bond Fund — Page 42 of 77
| Bonds, notes & other debt instruments (continued) Nevada (continued) | Principal amount (000) | Value (000) |
| City of Las Vegas, Special Improvement Dist. No. 813 (Summerlin Village 26), Local Improvement Bonds, Series 2017, 3.50% 2028 | $240 | $239 |
| City of Las Vegas, Special Improvement Dist. No. 813 (Summerlin Village 26), Local Improvement Bonds, Series 2017, 4.00% 2033 | 1,220 | 1,225 |
| City of Las Vegas, Special Improvement Dist. No. 813 (Summerlin Village 26), Local Improvement Bonds, Series 2017, 4.25% 2037 | 1,040 | 1,047 |
| City of Las Vegas, Special Improvement Dist. No. 813 (Summerlin Village 26), Local Improvement Bonds, Series 2017, 4.375% 2042 | 1,320 | 1,324 |
| City of Las Vegas, Special Improvement Dist. No. 813 (Summerlin Village 26), Local Improvement Bonds, Series 2017, 4.50% 2047 | 1,585 | 1,597 |
| City of Las Vegas, Special Improvement Dist. No. 814 (Summerlin Village 21 and 24A), Local Improvement Bonds, Series 2019, 3.00% 2021 | 100 | 101 |
| City of Las Vegas, Special Improvement Dist. No. 814 (Summerlin Village 21 and 24A), Local Improvement Bonds, Series 2019, 3.25% 2023 | 440 | 448 |
| City of Las Vegas, Special Improvement Dist. No. 814 (Summerlin Village 21 and 24A), Local Improvement Bonds, Series 2019, 3.25% 2031 | 310 | 307 |
| City of Las Vegas, Special Improvement Dist. No. 814 (Summerlin Village 21 and 24A), Local Improvement Bonds, Series 2019, 3.50% 2025 | 200 | 206 |
| City of Las Vegas, Special Improvement Dist. No. 814 (Summerlin Village 21 and 24A), Local Improvement Bonds, Series 2019, 3.50% 2026 | 200 | 206 |
| City of Las Vegas, Special Improvement Dist. No. 814 (Summerlin Village 21 and 24A), Local Improvement Bonds, Series 2019, 3.50% 2027 | 200 | 206 |
| City of Las Vegas, Special Improvement Dist. No. 814 (Summerlin Village 21 and 24A), Local Improvement Bonds, Series 2019, 3.50% 2028 | 160 | 164 |
| City of Las Vegas, Special Improvement Dist. No. 814 (Summerlin Village 21 and 24A), Local Improvement Bonds, Series 2019, 3.50% 2029 | 345 | 353 |
| City of Las Vegas, Special Improvement Dist. No. 814 (Summerlin Village 21 and 24A), Local Improvement Bonds, Series 2019, 3.50% 2032 | 420 | 418 |
| City of Las Vegas, Special Improvement Dist. No. 814 (Summerlin Village 21 and 24A), Local Improvement Bonds, Series 2019, 3.50% 2033 | 470 | 465 |
| City of Las Vegas, Special Improvement Dist. No. 814 (Summerlin Village 21 and 24A), Local Improvement Bonds, Series 2019, 3.50% 2035 | 1,035 | 1,013 |
| City of Las Vegas, Special Improvement Dist. No. 814 (Summerlin Village 21 and 24A), Local Improvement Bonds, Series 2019, 4.00% 2039 | 500 | 510 |
| City of Las Vegas, Special Improvement Dist. No. 814 (Summerlin Village 21 and 24A), Local Improvement Bonds, Series 2019, 4.00% 2049 | 1,650 | 1,653 |
| City of Las Vegas, Special Improvement Dist. No. 815 (Summerlin Village 25), Local Improvement Bonds, Series 2020, 4.75% 2040 | 1,000 | 1,057 |
| City of Las Vegas, Special Improvement Dist. Nos. 808 and 810 (Summerlin Village 23B), Local Improvement Rev. Ref. Bonds, Series 2014, 5.00% 2026 | 865 | 937 |
| City of Las Vegas, Special Improvement Dist. Nos. 808 and 810 (Summerlin Village 23B), Local Improvement Rev. Ref. Bonds, Series 2014, 5.00% 2028 | 345 | 371 |
| City of Las Vegas, Special Improvement Dist. Nos. 808 and 810 (Summerlin Village 23B), Local Improvement Rev. Ref. Bonds, Series 2014, 5.00% 2029 | 610 | 655 |
| City of Las Vegas, Special Improvement Dist. Nos. 808 and 810 (Summerlin Village 23B), Local Improvement Rev. Ref. Bonds, Series 2014, 5.00% 2031 | 125 | 133 |
| City of North Las Vegas, Special Improvement Dist. No. 64 (Valley Vista), Local Improvement Bonds, Series 2019, 3.50% 2021 | 120 | 121 |
| City of North Las Vegas, Special Improvement Dist. No. 64 (Valley Vista), Local Improvement Bonds, Series 2019, 3.50% 2022 | 150 | 151 |
| City of North Las Vegas, Special Improvement Dist. No. 64 (Valley Vista), Local Improvement Bonds, Series 2019, 3.50% 2023 | 125 | 126 |
| City of North Las Vegas, Special Improvement Dist. No. 64 (Valley Vista), Local Improvement Bonds, Series 2019, 3.50% 2024 | 130 | 131 |
American High-Income Municipal Bond Fund — Page 43 of 77
| Bonds, notes & other debt instruments (continued) Nevada (continued) | Principal amount (000) | Value (000) |
| City of North Las Vegas, Special Improvement Dist. No. 64 (Valley Vista), Local Improvement Bonds, Series 2019, 3.75% 2025 | $150 | $152 |
| City of North Las Vegas, Special Improvement Dist. No. 64 (Valley Vista), Local Improvement Bonds, Series 2019, 3.75% 2026 | 200 | 203 |
| City of North Las Vegas, Special Improvement Dist. No. 64 (Valley Vista), Local Improvement Bonds, Series 2019, 3.75% 2027 | 265 | 268 |
| City of North Las Vegas, Special Improvement Dist. No. 64 (Valley Vista), Local Improvement Bonds, Series 2019, 3.875% 2028 | 415 | 417 |
| City of North Las Vegas, Special Improvement Dist. No. 64 (Valley Vista), Local Improvement Bonds, Series 2019, 4.00% 2029 | 215 | 215 |
| City of North Las Vegas, Special Improvement Dist. No. 64 (Valley Vista), Local Improvement Bonds, Series 2019, 4.00% 2030 | 350 | 348 |
| City of North Las Vegas, Special Improvement Dist. No. 64 (Valley Vista), Local Improvement Bonds, Series 2019, 4.25% 2034 | 630 | 636 |
| City of North Las Vegas, Special Improvement Dist. No. 64 (Valley Vista), Local Improvement Bonds, Series 2019, 4.50% 2039 | 800 | 818 |
| City of North Las Vegas, Special Improvement Dist. No. 64 (Valley Vista), Local Improvement Bonds, Series 2019, 4.625% 2043 | 675 | 692 |
| City of North Las Vegas, Special Improvement Dist. No. 64 (Valley Vista), Local Improvement Bonds, Series 2019, 4.625% 2049 | 1,500 | 1,530 |
| City of Reno, Sales Tax Rev. Ref. Bonds (ReTRAC-Reno Transportation Rail Access Corridor Project), Series 2018-B, Assured Guaranty Municipal insured, 4.125% 2058 | 1,250 | 1,382 |
| 52,250 | ||
| New Hampshire 0.45% | ||
| Business Fin. Auth., Solid Waste Disposal Rev. Bonds (Casella Waste Systems, Inc. Project), Series 2013, AMT, 2.95% 20292 | 1,900 | 1,855 |
| Business Fin. Auth., Solid Waste Disposal Rev. Bonds (Waste Management, Inc. Project), Series 2003, AMT, 3.125% 20241 | 2,750 | 2,941 |
| Health and Education Facs. Auth., Healthcare System Rev. Bonds (Covenant Health Systems Obligated Group Issue), Series 2007-A, 5.00% 2027 | 150 | 151 |
| Health and Education Facs. Auth., Rev. Bonds (Elliot Hospital Issue), Series 2016, 5.00% 2031 | 1,250 | 1,477 |
| Health and Education Facs. Auth., Rev. Bonds (Rivermead Issue), Series 2011-A, 6.875% 2041 | 2,625 | 2,669 |
| National Fin. Auth., Municipal Certificates, Series 2020-1, Class A, 4.125% 2034 | 15,995 | 17,533 |
| National Fin. Auth., Resource Recovery Rev. Ref. Bonds (Covanta Project), Series 2018-A, AMT, 4.00% 20272 | 2,000 | 2,052 |
| National Fin. Auth., Resource Recovery Rev. Ref. Bonds (Covanta Project), Series 2018-B, 4.625% 20422 | 1,000 | 1,015 |
| National Fin. Auth., Resource Recovery Rev. Ref. Bonds (Covanta Project), Series 2018-C, AMT, 4.875% 20422 | 5,000 | 5,109 |
| National Fin. Auth., Solid Waste Disposal Rev. Ref. Bonds (Waste Management, Inc. Project), Series 2019-A-4, AMT, 2.15% 2038 (put 2024) | 2,000 | 2,058 |
| 36,860 | ||
| New Jersey 4.03% | ||
| Atlantic City, Tax Appeal Rev. Ref. Bonds, Series 2017-B, Assured Guaranty Municipal insured, 5.00% 2032 | 1,200 | 1,475 |
| County of Camden, Improvement Auth., Health Care Redev. Project, Rev. Bonds (Cooper Health System Obligated Group Issue), Series 2013-A, 5.75% 2042 | 2,665 | 2,870 |
| County of Camden, Improvement Auth., Health Care Redev. Project, Rev. Ref. Bonds (Cooper Health System Obligated Group Issue), Series 2014, 5.00% 2032 | 555 | 608 |
| Casino Reinvestment Dev. Auth., Luxury Tax Rev. Bonds, Series 2014, Assured Guaranty Municipal insured, 5.25% 2039 | 2,500 | 2,572 |
| Casino Reinvestment Dev. Auth., Luxury Tax Rev. Bonds, Series 2014, Assured Guaranty Municipal insured, 5.25% 2044 | 1,000 | 1,023 |
| Casino Reinvestment Dev. Auth., Luxury Tax Rev. Bonds, Series 2014, Assured Guaranty Municipal insured, 5.00% 2024 | 2,250 | 2,554 |
| Casino Reinvestment Dev. Auth., Luxury Tax Rev. Bonds, Series 2014, Assured Guaranty Municipal insured, 5.00% 2026 | 1,500 | 1,676 |
American High-Income Municipal Bond Fund — Page 44 of 77
| Bonds, notes & other debt instruments (continued) New Jersey (continued) | Principal amount (000) | Value (000) |
| Casino Reinvestment Dev. Auth., Luxury Tax Rev. Bonds, Series 2014, Assured Guaranty Municipal insured, 5.00% 2027 | $1,000 | $1,112 |
| Casino Reinvestment Dev. Auth., Luxury Tax Rev. Bonds, Series 2014, Assured Guaranty Municipal insured, 5.00% 2029 | 1,180 | 1,304 |
| Econ. Dev. Auth., Energy Fac. Rev. Bonds (UMM Energy Partners, LLC Project), Series 2012-A, AMT, 5.00% 2037 | 7,085 | 7,510 |
| Econ. Dev. Auth., Energy Fac. Rev. Bonds (UMM Energy Partners, LLC Project), Series 2012-A, AMT, 5.125% 2043 | 750 | 795 |
| Econ. Dev. Auth., Motor Vehicle Surcharges Rev. Ref. Bonds, Series 2017-A, BAM insured, 4.00% 2034 | 2,210 | 2,353 |
| Econ. Dev. Auth., Motor Vehicle Surcharges Rev. Ref. Bonds, Series 2017-A, BAM insured, 5.00% 2027 | 3,250 | 3,908 |
| Econ. Dev. Auth., Private Activity Bonds (Goethals Bridge Replacement Project), Series 2013, AMT, 5.375% 2043 | 7,725 | 8,531 |
| Econ. Dev. Auth., Private Activity Bonds (Goethals Bridge Replacement Project), Series 2013, AMT, 5.625% 2052 | 3,940 | 4,373 |
| Econ. Dev. Auth., Rev. Bonds (Foundation Academy Charter School Project), Series 2018-A, 5.00% 2050 | 1,100 | 1,212 |
| Econ. Dev. Auth., Rev. Bonds (Provident Group - Kean Properties LLC - Kean University Student Housing Project), Series 2017-A, 5.00% 2037 | 1,250 | 1,193 |
| Econ. Dev. Auth., Rev. Bonds (Provident Group - Kean Properties LLC - Kean University Student Housing Project), Series 2017-A, 5.00% 2047 | 3,500 | 3,165 |
| Econ. Dev. Auth., Rev. Bonds (Provident Group - Kean Properties LLC - Kean University Student Housing Project), Series 2017-A, 5.00% 2050 | 1,590 | 1,426 |
| Econ. Dev. Auth., Rev. Ref. Bonds (Cranes Mill Project), Series 2018, 5.00% 2029 | 1,200 | 1,277 |
| Econ. Dev. Auth., Rev. Ref. Bonds (Cranes Mill Project), Series 2018, 5.00% 2034 | 2,025 | 2,089 |
| Econ. Dev. Auth., Rev. Ref. Bonds (Cranes Mill Project), Series 2018, 5.00% 2039 | 1,685 | 1,714 |
| Econ. Dev. Auth., Rev. Ref. Bonds (Cranes Mill Project), Series 2018, 5.00% 2049 | 3,810 | 3,793 |
| Econ. Dev. Auth., Rev. Ref. Bonds (Provident Group - Montclair Properties LLC - Montclair State University Student Housing Project), Series 2017, Assured Guaranty Municipal insured, 5.00% 2037 | 2,750 | 3,292 |
| Econ. Dev. Auth., Rev. Ref. Bonds (Provident Group - Rowan Properties LLC - Rowan University Student Housing Project), Series 2015-A, 5.00% 2035 | 3,750 | 3,540 |
| Econ. Dev. Auth., Rev. Ref. Bonds (Provident Group - Rowan Properties LLC - Rowan University Student Housing Project), Series 2015-A, 5.00% 2048 | 2,150 | 1,990 |
| Econ. Dev. Auth., School Facs. Construction Bonds, Series 2015-WW, 5.25% 2029 | 2,500 | 2,848 |
| Econ. Dev. Auth., School Facs. Construction Bonds, Series 2015-WW, 5.25% 2033 | 2,500 | 2,810 |
| Econ. Dev. Auth., School Facs. Construction Bonds, Series 2016-AAA, 5.50% 2031 | 2,000 | 2,370 |
| Econ. Dev. Auth., School Facs. Construction Bonds, Series 2017-DDD, 5.00% 2034 | 1,500 | 1,728 |
| Econ. Dev. Auth., School Facs. Construction Bonds, Series 2017-DDD, 5.00% 2035 | 1,275 | 1,465 |
| Econ. Dev. Auth., School Facs. Construction Bonds, Series 2018-EEE, 5.00% 2043 | 3,500 | 4,036 |
| Econ. Dev. Auth., School Facs. Construction Bonds, Series 2018-FFF, 5.00% 2026 | 3,235 | 3,799 |
| Econ. Dev. Auth., School Facs. Construction Bonds, Series 2019-LLL, 4.00% 2044 | 3,500 | 3,784 |
| Econ. Dev. Auth., School Facs. Construction Bonds, Series 2019-LLL, 5.00% 2037 | 2,000 | 2,375 |
| Econ. Dev. Auth., School Facs. Construction Rev. Bonds, Series 2013-NN, 5.00% 2024 | 2,000 | 2,178 |
| Econ. Dev. Auth., School Facs. Construction Rev. Ref. Bonds, Series 2013-I, (SIFMA Municipal Swap Index + 1.60%) 1.76% 20283 | 13,970 | 13,621 |
| Econ. Dev. Auth., School Facs. Construction Rev. Ref. Bonds, Series 2015-XX, 5.00% 2021 | 125 | 130 |
| Econ. Dev. Auth., School Facs. Construction Rev. Ref. Bonds, Series 2015-XX, 5.00% 2025 | 10,500 | 12,133 |
| Econ. Dev. Auth., School Facs. Rev. Bonds (Beloved Community Charter School), Series 2019-A, 4.00% 20292 | 670 | 700 |
| Econ. Dev. Auth., School Facs. Rev. Bonds (Beloved Community Charter School), Series 2019-A, 5.00% 20392 | 825 | 866 |
| Econ. Dev. Auth., School Facs. Rev. Bonds (Beloved Community Charter School), Series 2019-A, 5.00% 20492 | 930 | 970 |
| Econ. Dev. Auth., School Facs. Rev. Bonds (Beloved Community Charter School), Series 2019-A, 5.00% 20542 | 725 | 751 |
| Econ. Dev. Auth., Special Fac. Rev. Bonds (Continental Airlines, Inc. Project), Series 1999, AMT, 5.125% 2023 | 1,500 | 1,537 |
| Econ. Dev. Auth., Special Fac. Rev. Bonds (Continental Airlines, Inc. Project), Series 1999, AMT, 5.25% 2029 | 23,275 | 23,847 |
| Econ. Dev. Auth., Special Fac. Rev. Bonds (Continental Airlines, Inc. Project), Series 2003, AMT, 5.50% 2033 | 3,500 | 3,590 |
| Econ. Dev. Auth., Transit Transportation Project Bonds, Series 2020-A, 4.00% 2037 | 1,850 | 2,019 |
| Econ. Dev. Auth., Transit Transportation Project Bonds, Series 2020-A, 4.00% 2038 | 6,600 | 7,190 |
| Econ. Dev. Auth., Transit Transportation Project Bonds, Series 2020-A, 4.00% 2039 | 4,550 | 4,947 |
American High-Income Municipal Bond Fund — Page 45 of 77
| Bonds, notes & other debt instruments (continued) New Jersey (continued) | Principal amount (000) | Value (000) |
| Econ. Dev. Auth., Transit Transportation Project Bonds, Series 2020-A, 5.00% 2044 | $3,000 | $3,490 |
| Educational Facs. Auth., Rev. Bonds (Higher Education Capital Improvement Fund Issue), Series 2014-A, 4.00% 2031 | 10,130 | 10,712 |
| County of Essex, Improvement Auth., Solid Waste Disposal Rev. Bonds (Covanta Project), Series 2015, AMT, 5.25% 20452 | 2,850 | 2,858 |
| Health Care Facs. Fncg. Auth., Rev. and Rev. Ref. Bonds (Trinitas Regional Medical Center Obligated Group Issue), Series 2017-A, 5.00% 2024 | 1,000 | 1,156 |
| Health Care Facs. Fncg. Auth., Rev. and Rev. Ref. Bonds (Trinitas Regional Medical Center Obligated Group Issue), Series 2017-A, 5.00% 2027 | 1,000 | 1,212 |
| Health Care Facs. Fncg. Auth., Rev. and Rev. Ref. Bonds (Trinitas Regional Medical Center Obligated Group Issue), Series 2017-A, 5.00% 2030 | 500 | 594 |
| Health Care Facs. Fncg. Auth., Rev. Bonds (Princeton HealthCare System Issue), Series 2016-A, 5.00% 2034 | 1,000 | 1,198 |
| Health Care Facs. Fncg. Auth., Rev. Bonds (St. Joseph’s Healthcare System Obligated Group Issue), Series 2016, 5.00% 2031 | 1,700 | 1,965 |
| Health Care Facs. Fncg. Auth., Rev. Bonds (St. Joseph’s Healthcare System Obligated Group Issue), Series 2016, 5.00% 2035 | 500 | 569 |
| Health Care Facs. Fncg. Auth., Rev. Bonds (St. Peter’s University Hospital Obligated Group Issue), Series 2007, 5.75% 2037 | 6,500 | 6,520 |
| Health Care Facs. Fncg. Auth., Rev. Ref. Bonds (St. Peter’s University Hospital Obligated Group Issue), Series 2011, 6.00% 2026 | 2,080 | 2,145 |
| Health Care Facs. Fncg. Auth., Rev. Ref. Bonds (St. Peter’s University Hospital Obligated Group Issue), Series 2011, 6.25% 2035 | 3,110 | 3,212 |
| Health Care Facs. Fncg. Auth., State Contract Rev. Ref. Bonds (Hospital Asset Transformation Program), Series 2017, 5.00% 2036 | 2,000 | 2,291 |
| Higher Education Student Assistance Auth., Student Loan Rev. Bonds, Series 2013-1-A, AMT, 3.75% 2026 | 380 | 393 |
| Higher Education Student Assistance Auth., Student Loan Rev. Bonds, Series 2016-1-A, AMT, 3.50% 2032 | 1,265 | 1,305 |
| Higher Education Student Assistance Auth., Student Loan Rev. Bonds, Series 2016-1-A, AMT, 5.00% 2025 | 1,000 | 1,167 |
| Higher Education Student Assistance Auth., Student Loan Rev. Bonds, Series 2019-B, AMT, 3.25% 2039 | 10,000 | 10,035 |
| Housing and Mortgage Fin. Agcy., Single Family Housing Rev. Bonds, Series 2019-C, 4.75% 2050 | 1,395 | 1,595 |
| South Jersey Port Corp., Marine Terminal Rev. Bonds, Series 2017-B, AMT, 5.00% 2036 | 1,000 | 1,110 |
| South Jersey Port Corp., Marine Terminal Rev. Bonds, Series 2017-B, AMT, 5.00% 2042 | 1,250 | 1,367 |
| South Jersey Port Corp., Marine Terminal Rev. Bonds, Series 2017-B, AMT, 5.00% 2048 | 875 | 949 |
| South Jersey Transportation Auth., Transportation System Rev. Bonds, Series 2014-A, 5.00% 2025 | 400 | 452 |
| South Jersey Transportation Auth., Transportation System Rev. Ref. Bonds, Series 2012-A, 5.00% 2026 | 1,920 | 2,052 |
| South Jersey Transportation Auth., Transportation System Rev. Ref. Bonds, Series 2014-A, 5.00% 2027 | 990 | 1,111 |
| South Jersey Transportation Auth., Transportation System Rev. Ref. Bonds, Series 2014-A, 5.00% 2033 | 1,600 | 1,762 |
| Tobacco Settlement Fncg. Corp., Tobacco Settlement Bonds, Series 2018-A, 5.25% 2046 | 1,210 | 1,435 |
| Tobacco Settlement Fncg. Corp., Tobacco Settlement Bonds, Series 2018-B, 5.00% 2046 | 4,500 | 5,087 |
| Transportation Trust Fund Auth., Transportation Program Bonds, Series 2019-AA, 5.00% 2037 | 1,500 | 1,755 |
| Transportation Trust Fund Auth., Transportation Program Bonds, Series 2019-BB, 5.00% 2044 | 4,575 | 5,263 |
| Transportation Trust Fund Auth., Transportation Program Bonds, Series 2019-BB, 5.00% 2050 | 2,500 | 2,857 |
| Transportation Trust Fund Auth., Transportation System Bonds, Capital Appreciation Bonds, Series 2006-C, AMBAC insured, 0% 2026 | 630 | 544 |
| Transportation Trust Fund Auth., Transportation System Bonds, Capital Appreciation Bonds, Series 2006-C, AMBAC insured, 0% 2035 | 3,375 | 2,114 |
| Transportation Trust Fund Auth., Transportation System Bonds, Capital Appreciation Bonds, Series 2006-C, AMBAC insured, 0% 2036 | 9,730 | 5,838 |
| Transportation Trust Fund Auth., Transportation System Bonds, Capital Appreciation Bonds, Series 2006-C, Assured Guaranty Municipal insured, 0% 2034 | 17,245 | 11,611 |
| Transportation Trust Fund Auth., Transportation System Bonds, Capital Appreciation Bonds, Series 2006-C, National insured, 0% 2031 | 12,480 | 9,126 |
| Transportation Trust Fund Auth., Transportation System Bonds, Capital Appreciation Bonds, Series 2008-A, 0% 2035 | 4,000 | 2,468 |
| Transportation Trust Fund Auth., Transportation System Bonds, Capital Appreciation Bonds, Series 2009-A, 0% 2039 | 11,215 | 5,819 |
American High-Income Municipal Bond Fund — Page 46 of 77
| Bonds, notes & other debt instruments (continued) New Jersey (continued) | Principal amount (000) | Value (000) |
| Transportation Trust Fund Auth., Transportation System Bonds, Capital Appreciation Bonds, Series 2009-C, BAM insured, 0% 2032 | $1,825 | $1,318 |
| Transportation Trust Fund Auth., Transportation System Bonds, Capital Appreciation Bonds, Series 2010-A, BAM insured, 0% 2027 | 8,245 | 7,055 |
| Transportation Trust Fund Auth., Transportation System Bonds, Capital Appreciation Bonds, Series 2010-A, BAM insured, 0% 2028 | 9,800 | 7,921 |
| Transportation Trust Fund Auth., Transportation System Bonds, Capital Appreciation Bonds, Series 2010-B, 0% 2027 | 965 | 804 |
| Transportation Trust Fund Auth., Transportation System Bonds, Series 2005-B, National insured, 5.50% 2021 | 5,975 | 6,352 |
| Transportation Trust Fund Auth., Transportation System Bonds, Series 2018-A, 5.00% 2030 | 2,000 | 2,406 |
| Transportation Trust Fund Auth., Transportation System Bonds, Series 2018-A, 5.00% 2032 | 2,240 | 2,663 |
| Transportation Trust Fund Auth., Transportation System Bonds, Series 2018-A, 5.00% 2033 | 2,500 | 2,959 |
| Transportation Trust Fund Auth., Transportation System Bonds, Series 2019-A, 4.00% 2039 | 3,000 | 3,264 |
| Transportation Trust Fund Auth., Transportation System Bonds, Series 2019-AA, 5.00% 2046 | 4,500 | 5,161 |
| Transportation Trust Fund Auth., Transportation System Bonds, Series 2019-BB, 4.00% 2037 | 5,000 | 5,425 |
| County of Union, Improvement Auth., Solid Waste Disposal Rev. Green Bonds (Aries Linden, LLC Project), Series 2019, AMT, 6.75% 20412 | 7,000 | 6,600 |
| 334,114 | ||
| New Mexico 0.15% | ||
| Hospital Equipment Loan Council, First Mortgage Rev. Bonds (Haverland Charter Lifestyle Group - La Vida Llena Expansion Project), Series 2019-A, 5.00% 2049 | 2,875 | 2,970 |
| Hospital Equipment Loan Council, Rev. Ref. Bonds (Haverland Charter Lifestyle Group), Series 2012, 5.00% 2032 | 1,500 | 1,529 |
| Hospital Equipment Loan Council, Rev. Ref. Bonds (Haverland Charter Lifestyle Group), Series 2012, 5.00% 2042 | 1,500 | 1,517 |
| Mortgage Fin. Auth., Single Family Mortgage Program Bonds, Series 2010-A, Class I, 4.625% 2025 | 120 | 122 |
| Mortgage Fin. Auth., Single Family Mortgage Program Bonds, Series 2016-A-2, Class I, AMT, 3.50% 2046 | 900 | 962 |
| Mortgage Fin. Auth., Single Family Mortgage Program Rev. Ref. Bonds, Series 2012-B-1, Class I, AMT, 3.75% 2043 | 510 | 527 |
| City of Santa Fe, Retirement Fac. Rev. Bonds (El Castillo Retirement Residences), Series 2019-A, 5.00% 2034 | 500 | 524 |
| City of Santa Fe, Retirement Fac. Rev. Bonds (El Castillo Retirement Residences), Series 2019-A, 5.00% 2039 | 500 | 518 |
| City of Santa Fe, Retirement Fac. Rev. Bonds (El Castillo Retirement Residences), Series 2019-A, 5.00% 2044 | 1,000 | 1,021 |
| City of Santa Fe, Retirement Fac. Rev. Bonds (El Castillo Retirement Residences), Series 2019-A, 5.00% 2049 | 2,405 | 2,442 |
| 12,132 | ||
| New York 4.28% | ||
| Brooklyn Arena Local Dev. Corp., PILOT Rev. Bonds (Barclays Center), Capital Appreciation Bonds, Series 2009, 0% 2045 | 2,110 | 670 |
| Brooklyn Arena Local Dev. Corp., PILOT Rev. Bonds (Barclays Center), Capital Appreciation Bonds, Series 2009, 0% 2046 | 3,850 | 1,162 |
| Brooklyn Arena Local Dev. Corp., PILOT Rev. Ref. Bonds (Barclays Center), Series 2016-A, Assured Guaranty Municipal insured, 5.00% 2026 | 2,500 | 2,815 |
| Brooklyn Arena Local Dev. Corp., PILOT Rev. Ref. Bonds (Barclays Center), Series 2016-A, Assured Guaranty Municipal insured, 5.00% 2042 | 27,830 | 29,921 |
| Buffalo and Erie County Industrial Land Dev. Corp., Rev. Bonds (Catholic Health System Obligated Group Project), Series 2015, 5.00% 2040 | 600 | 664 |
| Buffalo and Erie County Industrial Land Dev. Corp., Rev. Bonds (Catholic Health System Obligated Group Project), Series 2015, 5.25% 2035 | 500 | 567 |
| Build NYC Resource Corp., Rev. Bonds (Bronx Charter School for Excellence Project), Series 2013-A, 5.50% 2043 | 500 | 530 |
| Build NYC Resource Corp., Rev. Ref. Bonds (Albert Einstein School of Medicine, Inc. Project), Series 2015, 5.50% 20452 | 5,300 | 5,765 |
| Build NYC Resource Corp., Rev. Ref. Bonds (Brooklyn Navy Yard Cogeneration Partners, LP Project), Series 2019, AMT, 5.00% 20282 | 11,950 | 12,849 |
American High-Income Municipal Bond Fund — Page 47 of 77
| Bonds, notes & other debt instruments (continued) New York (continued) | Principal amount (000) | Value (000) |
| Build NYC Resource Corp., Solid Waste Disposal Rev. Bonds (Pratt Paper (NY), Inc. Project), Series 2014, AMT, 4.50% 20252 | $410 | $432 |
| Build NYC Resource Corp., Solid Waste Disposal Rev. Bonds (Pratt Paper (NY), Inc. Project), Series 2014, AMT, 5.00% 20352 | 4,495 | 4,819 |
| Convention Center Dev. Corp., Rev. Bonds (Hotel Unit Fee Secured), Capital Appreciation Bonds, Series 2016-A, 0% 2049 | 4,020 | 1,562 |
| Convention Center Dev. Corp., Rev. Bonds (Hotel Unit Fee Secured), Capital Appreciation Bonds, Series 2016-A, 0% 2055 | 10,000 | 3,073 |
| Convention Center Dev. Corp., Rev. Bonds (Hotel Unit Fee Secured), Capital Appreciation Bonds, Series 2016-B, 0% 2055 | 6,090 | 1,629 |
| Convention Center Dev. Corp., Rev. Bonds (Hotel Unit Fee Secured), Capital Appreciation Bonds, Series 2016-B, Assured Guaranty Municipal insured, 0% 2048 | 2,305 | 948 |
| Convention Center Dev. Corp., Rev. Bonds (Hotel Unit Fee Secured), Capital Appreciation Bonds, Series 2016-B, BAM insured, 0% 2037 | 1,415 | 866 |
| Convention Center Dev. Corp., Rev. Bonds (Hotel Unit Fee Secured), Capital Appreciation Bonds, Series 2016-B, BAM insured, 0% 2038 | 2,110 | 1,246 |
| Convention Center Dev. Corp., Rev. Bonds (Hotel Unit Fee Secured), Capital Appreciation Bonds, Series 2016-B, BAM insured, 0% 2039 | 4,000 | 2,281 |
| Convention Center Dev. Corp., Rev. Bonds (Hotel Unit Fee Secured), Capital Appreciation Bonds, Series 2016-B, BAM insured, 0% 2046 | 3,445 | 1,519 |
| Dormitory Auth., Mental Health Services Facs. Improvement Rev. Ref. Bonds, Series 2010-A, 5.00% 2024 (preref. 2020) | 5 | 5 |
| Dormitory Auth., Rev. Bonds (Culinary Institute of America), Series 2013, 5.50% 2033 | 500 | 543 |
| Dormitory Auth., Rev. Bonds (Icahn School of Medicine at Mount Sinai), Series 2015-A, 5.00% 2040 | 250 | 283 |
| Dormitory Auth., Rev. Bonds (Montefiore Obligated Group), Series 2020-A, 4.00% 2045 | 1,525 | 1,681 |
| Dormitory Auth., Rev. Bonds (Orange Regional Medical Center Obligated Group), Series 2015, 5.00% 20312 | 500 | 573 |
| Dormitory Auth., Rev. Bonds (Orange Regional Medical Center Obligated Group), Series 2015, 5.00% 20322 | 500 | 571 |
| Dormitory Auth., Rev. Bonds (Orange Regional Medical Center Obligated Group), Series 2015, 5.00% 20332 | 1,200 | 1,366 |
| Dormitory Auth., Rev. Bonds (Orange Regional Medical Center Obligated Group), Series 2015, 5.00% 20342 | 1,200 | 1,364 |
| Dormitory Auth., Rev. Bonds (Orange Regional Medical Center Obligated Group), Series 2015, 5.00% 20352 | 1,000 | 1,134 |
| County of Dutchess, Local Dev. Corp., Rev. Bonds (Health Quest Systems, Inc. Project), Series 2016-B, 5.00% 2046 | 1,500 | 1,685 |
| Environmental Facs. Corp., Solid Waste Disposal Rev. Bonds (Casella Waste Systems, Inc. Project), Series 2017, AMT, 2.875% 2044 (put 2029)2 | 4,750 | 4,600 |
| City of Glen Cove, Local Econ. Assistance Corp., Rev. Bonds (Garvies Point Public Improvement Project), Convertible Capital Appreciation Bonds, Series 2016-C, 0% 2055 (5.62% on 1/1/2024)1 | 16,320 | 15,065 |
| Hudson Yards Infrastructure Corp., Rev. Bonds, Fiscal 2012, Series 2012-A, 5.25% 2047 | 1,435 | 1,469 |
| Hudson Yards Infrastructure Corp., Rev. Bonds, Fiscal 2012, Series 2012-A, 5.25% 2047 (preref. 2021) | 110 | 113 |
| Hudson Yards Infrastructure Corp., Rev. Bonds, Fiscal 2012, Series 2012-A, 5.75% 2047 | 1,140 | 1,171 |
| Hudson Yards Infrastructure Corp., Rev. Bonds, Fiscal 2012, Series 2012-A, 5.75% 2047 (preref. 2021) | 350 | 360 |
| County of Jefferson, Civic Fac. Dev. Corp., Rev. Bonds (Samaritan Medical Center Project), Series 2017-A, 4.00% 2042 | 1,750 | 1,764 |
| Liberty Dev. Corp., Liberty Rev. Ref. Bonds (3 World Trade Center Project), Series 2014, Class 2, 5.15% 20342 | 2,250 | 2,389 |
| Liberty Dev. Corp., Liberty Rev. Ref. Bonds (3 World Trade Center Project), Series 2014, Class 2, 5.375% 20402 | 1,000 | 1,060 |
| Liberty Dev. Corp., Liberty Rev. Ref. Bonds (4 World Trade Center Project), Series 2011, 5.75% 2051 | 1,000 | 1,050 |
| Metropolitan Transportation Auth., Transportation Rev. Bonds, Series 2012-A-3, (SIFMA Municipal Swap Index + 0.50%) 0.66% 2042 (put 2022)3 | 750 | 723 |
| Metropolitan Transportation Auth., Transportation Rev. Bonds, Series 2013-E, 5.00% 2038 | 1,970 | 2,079 |
| Metropolitan Transportation Auth., Transportation Rev. Bonds, Series 2015-A-1, 5.00% 2040 | 1,500 | 1,615 |
| Metropolitan Transportation Auth., Transportation Rev. Bonds, Series 2015-A-2, 5.00% 2045 (put 2030) | 8,450 | 9,734 |
| Metropolitan Transportation Auth., Transportation Rev. Green Bonds, Series 2020-C-1, 4.75% 2045 | 10,550 | 11,791 |
| Metropolitan Transportation Auth., Transportation Rev. Green Bonds, Series 2020-C-1, 5.00% 2050 | 12,955 | 14,872 |
| Metropolitan Transportation Auth., Transportation Rev. Green Bonds, Series 2020-C-1, 5.25% 2055 | 5,000 | 5,706 |
| Metropolitan Transportation Auth., Transportation Rev. Ref. Green Bonds, Capital Appreciation Bonds, Series 2017-C-2, BAM insured, 0% 2040 | 9,325 | 5,227 |
American High-Income Municipal Bond Fund — Page 48 of 77
| Bonds, notes & other debt instruments (continued) New York (continued) | Principal amount (000) | Value (000) |
| Metropolitan Transportation Auth., Transportation Rev. Ref. Green Bonds, Series 2017-A-2, 5.00% 2026 | $1,500 | $1,691 |
| Metropolitan Transportation Auth., Transportation Rev. Ref. Green Bonds, Series 2017-B, 5.00% 2026 | 890 | 1,003 |
| Metropolitan Transportation Auth., Transportation Rev. Ref. Green Bonds, Series 2017-C-1, 5.00% 2028 | 1,890 | 2,165 |
| County of Monroe, Industrial Dev. Corp., Rev. Bonds (St. Ann’s of Greater Rochester, Inc.), Series 2019, 5.00% 2040 | 7,470 | 7,044 |
| County of Monroe, Industrial Dev. Corp., Rev. Bonds (St. Ann’s of Greater Rochester, Inc.), Series 2019, 5.00% 2050 | 11,250 | 10,147 |
| New York City G.O. Bonds, Fiscal 2020, Series 2020-D-1, 4.00% 2050 | 4,000 | 4,646 |
| New York City Housing Dev. Corp., Multi Family Housing Rev. Bonds (8 Spruce Street), Series 2014-E, 3.50% 2048 | 1,600 | 1,663 |
| New York City Housing Dev. Corp., Multi Family Housing Rev. Bonds (8 Spruce Street), Series 2014-F, 4.50% 2048 | 1,925 | 2,019 |
| New York City Industrial Dev. Agcy., PILOT Rev. Bonds (Yankee Stadium Project), Series 2006, 5.00% 2046 | 2,085 | 2,089 |
| New York City Industrial Dev. Agcy., PILOT Rev. Bonds (Yankee Stadium Project), Series 2006, FGIC insured, 4.50% 2039 | 915 | 915 |
| New York City Municipal Water Fin. Auth., Water and Sewer System Second General Resolution Rev. Bonds, Fiscal 2020, Series 2020-DD-1, 4.00% 2050 | 8,750 | 10,482 |
| Niagara Area Dev. Corp., Solid Waste Disposal Fac. Rev. Ref. Bonds (Covanta Project), Series 2018-A, AMT, 4.75% 20422 | 3,000 | 3,055 |
| Niagara Frontier Transportation Auth., Airport Rev. Ref. Bonds (Buffalo Niagara International Airport), Series 2014-A, AMT, 5.00% 2029 | 1,200 | 1,356 |
| County of Onondaga, Resource Recovery Agcy., Rev. Ref. Bonds, Series 2015-A, AMT, Assured Guaranty Municipal insured, 5.00% 2030 | 1,490 | 1,753 |
| Onondaga Civic Dev. Corp., Rev. Bonds (St. Joseph’s Hospital Health Center Project), Series 2012, 5.00% 2042 (preref. 2022) | 1,000 | 1,089 |
| Port Auth., Consolidated Bonds, Series 207, AMT, 5.00% 2032 | 5,000 | 6,201 |
| Port Auth., Special Project Bonds (John F. Kennedy International Air Terminal LLC Project), Series 8, 6.00% 2036 | 2,650 | 2,669 |
| Port Auth., Special Project Bonds (John F. Kennedy International Air Terminal LLC Project), Series 8, 6.00% 2042 | 5,500 | 5,540 |
| County of Rockland, G.O. Bonds, Series 2014-A, Assured Guaranty Municipal insured, 5.00% 2024 | 300 | 350 |
| County of Suffolk, Econ. Dev. Corp., Rev. Bonds (Peconic Landing at Southold, Inc. Project), Series 2019-B, 5.00% 2040 | 1,000 | 1,074 |
| Tompkins County Dev. Corp., Rev. Bonds (Tompkins Cortland Community College Foundation, Inc. Project), Series 2013-A, 5.00% 2021 | 1,000 | 550 |
| Tompkins County Dev. Corp., Rev. Bonds (Tompkins Cortland Community College Foundation, Inc. Project), Series 2013-A, 5.00% 2027 | 1,805 | 993 |
| Tompkins County Dev. Corp., Rev. Bonds (Tompkins Cortland Community College Foundation, Inc. Project), Series 2013-A, 5.00% 2032 | 2,345 | 1,290 |
| Tompkins County Dev. Corp., Rev. Bonds (Tompkins Cortland Community College Foundation, Inc. Project), Series 2013-A, AMT, 5.00% 2038 | 1,370 | 753 |
| Transportation Dev. Corp., Special Fac. Rev. Bonds (American Airlines, Inc. John F. Kennedy International Airport Project), Series 2020, AMT, 5.25% 2031 | 11,870 | 12,395 |
| Transportation Dev. Corp., Special Fac. Rev. Bonds (American Airlines, Inc. John F. Kennedy International Airport Project), Series 2020, AMT, 5.375% 2036 | 5,900 | 6,171 |
| Transportation Dev. Corp., Special Fac. Rev. Ref. Bonds (American Airlines, Inc. John F. Kennedy International Airport Project), Series 2016, AMT, 5.00% 2020 (escrowed to maturity) | 3,970 | 3,970 |
| Transportation Dev. Corp., Special Fac. Rev. Ref. Bonds (American Airlines, Inc. John F. Kennedy International Airport Project), Series 2016, AMT, 5.00% 2026 | 14,220 | 14,262 |
| Transportation Dev. Corp., Special Fac. Rev. Ref. Bonds (American Airlines, Inc. John F. Kennedy International Airport Project), Series 2016, AMT, 5.00% 2031 | 4,000 | 4,000 |
| Transportation Dev. Corp., Special Fac. Rev. Ref. Bonds (Terminal One Group Association, LP Project), Series 2015, AMT, 5.00% 2023 | 560 | 598 |
| Transportation Dev. Corp., Special Facs. Bonds (LaGuardia Airport Terminal B Redev. Project), Series 2016-A, AMT, 4.00% 2032 | 2,000 | 2,109 |
American High-Income Municipal Bond Fund — Page 49 of 77
| Bonds, notes & other debt instruments (continued) New York (continued) | Principal amount (000) | Value (000) |
| Transportation Dev. Corp., Special Facs. Bonds (LaGuardia Airport Terminal B Redev. Project), Series 2016-A, AMT, 4.00% 2033 | $4,500 | $4,732 |
| Transportation Dev. Corp., Special Facs. Bonds (LaGuardia Airport Terminal B Redev. Project), Series 2016-A, AMT, 5.00% 2041 | 3,250 | 3,551 |
| Transportation Dev. Corp., Special Facs. Bonds (LaGuardia Airport Terminal B Redev. Project), Series 2016-A, AMT, 5.00% 2046 | 3,300 | 3,588 |
| Transportation Dev. Corp., Special Facs. Bonds (LaGuardia Airport Terminal B Redev. Project), Series 2016-A, AMT, 5.25% 2050 | 16,950 | 18,552 |
| Transportation Dev. Corp., Special Facs. Rev. Bonds (Delta Air Lines, Inc. LaGuardia Airport Terminals C & D Redev. Project), Series 2018, AMT 5.00% 2026 | 1,110 | 1,216 |
| Transportation Dev. Corp., Special Facs. Rev. Bonds (Delta Air Lines, Inc. LaGuardia Airport Terminals C & D Redev. Project), Series 2018, AMT 5.00% 2031 | 10,725 | 11,799 |
| Transportation Dev. Corp., Special Facs. Rev. Bonds (Delta Air Lines, Inc. LaGuardia Airport Terminals C & D Redev. Project), Series 2018, AMT 5.00% 2034 | 5,000 | 5,473 |
| Transportation Dev. Corp., Special Facs. Rev. Bonds (Delta Air Lines, Inc. LaGuardia Airport Terminals C & D Redev. Project), Series 2018, AMT, 4.00% 2036 | 7,000 | 7,146 |
| Transportation Dev. Corp., Special Facs. Rev. Bonds (Delta Air Lines, Inc. LaGuardia Airport Terminals C & D Redev. Project), Series 2018, AMT, 5.00% 2028 | 650 | 724 |
| Transportation Dev. Corp., Special Facs. Rev. Bonds (Delta Air Lines, Inc. LaGuardia Airport Terminals C & D Redev. Project), Series 2018, AMT, 5.00% 2030 | 3,500 | 3,869 |
| Transportation Dev. Corp., Special Facs. Rev. Bonds (Delta Air Lines, Inc. LaGuardia Airport Terminals C & D Redev. Project), Series 2018, AMT, 5.00% 2032 | 9,000 | 9,863 |
| Urban Dev. Corp., State Personal Income Tax Rev. Bonds (General Purpose), Series 2019-A, 5.00% 2039 | 1,500 | 1,892 |
| County of Westchester, Local Dev. Corp., Rev. Bonds (Westchester Medical Center Obligated Group Project), Series 2016, 5.00% 2046 | 3,000 | 3,196 |
| Yonkers Econ. Dev. Corp., Educational Rev. Bonds (Lamartine/Warburton LLC - Charter School of Educational Excellence Project), Series 2019-A, 4.00% 2029 | 200 | 206 |
| Yonkers Econ. Dev. Corp., Educational Rev. Bonds (Lamartine/Warburton LLC - Charter School of Educational Excellence Project), Series 2019-A, 5.00% 2039 | 420 | 447 |
| Yonkers Econ. Dev. Corp., Educational Rev. Bonds (Lamartine/Warburton LLC - Charter School of Educational Excellence Project), Series 2019-A, 5.00% 2054 | 930 | 970 |
| 354,577 | ||
| North Carolina 0.22% | ||
| Educational Assistance Auth., Student Loan Rev. Bonds, Series 2020-A, AMT, 3.125% 2039 | 1,000 | 996 |
| Medical Care Commission, Health Care Facs. First Mortgage Rev. Ref. Bonds (Pennybyrn at Maryfield), Series 2015, 5.00% 2025 | 500 | 520 |
| Medical Care Commission, Health Care Facs. First Mortgage Rev. Ref. Bonds (Pennybyrn at Maryfield), Series 2015, 5.00% 2030 | 1,900 | 1,915 |
| Medical Care Commission, Health Care Facs. First Mortgage Rev. Ref. Bonds (Pennybyrn at Maryfield), Series 2015, 5.00% 2035 | 1,000 | 968 |
| Medical Care Commission, Health Care Facs. First Mortgage Rev. Ref. Bonds (Lutheran Services for the Aging), Series 2012-A, 4.75% 2032 | 1,500 | 1,515 |
| Medical Care Commission, Retirement Facs. First Mortgage Rev. Bonds (Carolina Village Project), Series 2017-B, 5.00% 2047 | 5,230 | 5,043 |
| Medical Care Commission, Retirement Facs. First Mortgage Rev. Bonds (Sharon Towers), Series 2019-A, 5.00% 2039 | 1,650 | 1,776 |
| Medical Care Commission, Retirement Facs. First Mortgage Rev. Bonds (Sharon Towers), Series 2019-A, 5.00% 2049 | 4,100 | 4,345 |
| Medical Care Commission, Retirement Facs. First Mortgage Rev. Bonds (Lutheran Retirement Ministries Project), Series 2019-A, 5.00% 2049 | 1,300 | 1,376 |
| 18,454 |
American High-Income Municipal Bond Fund — Page 50 of 77
| Bonds, notes & other debt instruments (continued) North Dakota 0.41% | Principal amount (000) | Value (000) |
| County of Burleigh, Health Care Rev. Bonds (St. Alexius Medical Center Project), Series 2014-A, 5.00% 2035 (preref. 2021) | $500 | $520 |
| County of Ward, Health Care Facs. Rev. Bonds (Trinity Obligated Group), Series 2017-C, 5.00% 2043 | 11,900 | 13,283 |
| County of Ward, Health Care Facs. Rev. Bonds (Trinity Obligated Group), Series 2017-C, 5.00% 2048 | 9,500 | 10,530 |
| County of Ward, Health Care Facs. Rev. Bonds (Trinity Obligated Group), Series 2017-C, 5.00% 2053 | 8,550 | 9,433 |
| 33,766 | ||
| Ohio 4.68% | ||
| Air Quality Dev. Auth., Air Quality Rev. Bonds (Ohio Valley Electric Corp. Project), Series 2009-A, 2.875% 2026 | 2,750 | 2,850 |
| Air Quality Dev. Auth., Air Quality Rev. Bonds (Ohio Valley Electric Corp. Project), Series 2009-D, 2.875% 2026 | 7,975 | 8,265 |
| Air Quality Dev. Auth., Air Quality Rev. Ref. Bonds (American Electric Co. Project), Series 2005-A, AMT, 2.10% 2029 (put 2024) | 1,250 | 1,307 |
| Air Quality Dev. Auth., Air Quality Rev. Ref. Bonds (American Electric Co. Project), Series 2014-B, AMT, 2.60% 2041 (put 2029) | 1,000 | 1,042 |
| Air Quality Dev. Auth., Air Quality Rev. Ref. Bonds (Ohio Valley Electric Corp. Project), Series 2019-A, 3.25% 2029 | 3,600 | 3,886 |
| Air Quality Dev. Auth., Exempt Facs. Rev. Bonds (AMG Vanadium Project), Series 2019, AMT, 5.00% 20492 | 15,925 | 16,257 |
| Air Quality Dev. Auth., Exempt Facs. Rev. Bonds (Pratt Paper (OH), LLC Project), Series 2017, AMT, 4.25% 20382 | 1,850 | 1,972 |
| Air Quality Dev. Auth., Exempt Facs. Rev. Bonds (Pratt Paper (OH), LLC Project), Series 2017, AMT, 4.50% 20482 | 2,500 | 2,659 |
| County of Allen, Hospital Facs. Rev. Bonds (Bon Secours Mercy Health, Inc.), Series 2020-A, 4.00% 2040 | 1,200 | 1,408 |
| Buckeye Tobacco Settlement Fncg. Auth., Tobacco Settlement Asset-Backed Rev. Ref. Bonds, Capital Appreciation Bonds, Series 2020-B-3, 0% 2057 | 344,335 | 49,870 |
| Buckeye Tobacco Settlement Fncg. Auth., Tobacco Settlement Asset-Backed Rev. Ref. Bonds, Series 2020-A-2, 4.00% 2048 | 1,500 | 1,680 |
| Buckeye Tobacco Settlement Fncg. Auth., Tobacco Settlement Asset-Backed Rev. Ref. Bonds, Series 2020-B-2, 5.00% 2055 | 51,280 | 56,601 |
| County of Butler, Hospital Facs. Rev. Bonds (UC Health), Series 2010, 5.50% 2040 (preref. 2020) | 2,330 | 2,360 |
| County of Butler, Hospital Facs. Rev. Bonds (UC Health), Series 2010, 5.50% 2040 (preref. 2020) | 1,710 | 1,732 |
| County of Butler, Hospital Facs. Rev. Bonds (UC Health), Series 2016, 5.00% 2045 | 6,500 | 7,597 |
| City of Centerville, Health Care Improvement and Rev. Ref. Bonds, Series 2017, 5.25% 2037 | 4,250 | 4,434 |
| City of Centerville, Health Care Improvement and Rev. Ref. Bonds, Series 2017, 5.25% 2047 | 3,795 | 3,889 |
| City of Centerville, Health Care Improvement and Rev. Ref. Bonds, Series 2017, 5.25% 2050 | 2,400 | 2,455 |
| City of Cleveland, Airport System Rev. Ref. Bonds, Series 2012-A, 5.00% 2025 | 1,110 | 1,186 |
| City of Cleveland, Airport System Rev. Ref. Bonds, Series 2012-A, 5.00% 2026 | 1,000 | 1,069 |
| City of Cleveland, Airport System Rev. Ref. Bonds, Series 2012-A, 5.00% 2031 | 1,000 | 1,069 |
| County of Cuyahoga, Hospital Rev. Bonds (MetroHealth System), Series 2017, 5.00% 2037 | 2,450 | 2,771 |
| County of Cuyahoga, Hospital Rev. Bonds (MetroHealth System), Series 2017, 5.00% 2052 | 7,750 | 8,620 |
| County of Cuyahoga, Hospital Rev. Bonds (MetroHealth System), Series 2017, 5.00% 2057 | 6,000 | 6,680 |
| County of Cuyahoga, Hospital Rev. Bonds (MetroHealth System), Series 2017, 5.50% 2052 | 4,000 | 4,595 |
| County of Franklin, Health Care Facs. Improvement Rev. Bonds (OPRS Communities), Series 2013-A, 5.25% 2028 | 235 | 235 |
| County of Franklin, Health Care Facs. Improvement Rev. Bonds (OPRS Communities), Series 2013-A, 6.125% 2040 (preref. 2022) | 2,210 | 2,314 |
| County of Franklin, Health Care Facs. Improvement Rev. Bonds (OPRS Communities), Series 2013-A, 6.125% 2040 (preref. 2022) | 140 | 155 |
| County of Franklin, Health Care Facs. Rev. Bonds (OPRS Communities), Series 2016-C, 5.00% 2038 | 3,000 | 3,156 |
| County of Gallia, Hospital Facs. Rev. Ref. and Improvement Bonds (Holzer Health System Obligated Group Project), Series 2012-A, 8.00% 2042 | 7,840 | 8,622 |
| County of Hamilton, Healthcare Facs. Rev. Bonds (Christ Hospital Project), Series 2012, 5.00% 2042 (preref. 2022) | 1,500 | 1,632 |
| County of Hamilton, Healthcare Improvement and Rev. Ref. Bonds (Life Enriching Communities Project), Series 2016, 5.00% 2031 | 4,360 | 4,651 |
American High-Income Municipal Bond Fund — Page 51 of 77
| Bonds, notes & other debt instruments (continued) Ohio (continued) | Principal amount (000) | Value (000) |
| County of Hamilton, Healthcare Improvement and Rev. Ref. Bonds (Life Enriching Communities Project), Series 2016, 5.00% 2046 | $3,870 | $4,003 |
| County of Hamilton, Healthcare Improvement and Rev. Ref. Bonds (Life Enriching Communities Project), Series 2016, 5.00% 2051 | 6,145 | 6,326 |
| County of Hamilton, Healthcare Rev. Bonds (Life Enriching Communities Project), Series 2017-A, 5.00% 2047 | 1,250 | 1,299 |
| County of Hamilton, Healthcare Rev. Bonds (Life Enriching Communities Project), Series 2017-A, 5.00% 2052 | 1,125 | 1,163 |
| Health Care Facs., Rev. Bonds (United Church Homes, Inc.), Series 2019, 5.125% 2049 | 1,040 | 1,062 |
| Hickory Chase Community Auth., Infrastructure Improvement Rev. Bonds (Hickory Chase Project), Series 2019-A, 5.00% 20402 | 2,425 | 2,458 |
| Hickory Chase Community Auth., Infrastructure Improvement Rev. Bonds (Hickory Chase Project), Series 2019-B-1, 6.00% 20462 | 2,320 | 2,327 |
| Hospital Rev. Bonds (Aultman Health Foundation), Series 2018, 5.00% 20282 | 6,000 | 6,756 |
| Hospital Rev. Bonds (Aultman Health Foundation), Series 2018, 5.00% 20332 | 13,835 | 15,227 |
| Hospital Rev. Bonds (Aultman Health Foundation), Series 2018, 5.00% 20382 | 6,750 | 7,317 |
| Hospital Rev. Bonds (Aultman Health Foundation), Series 2018, 5.00% 20482 | 16,170 | 17,213 |
| County of Licking, Health Care Facs. Rev. Ref. Bonds (Kendal Granville), Series 2015-A, 6.00% 2050 | 3,560 | 2,626 |
| County of Licking, Health Care Facs. Rev. Ref. Bonds (Kendal Granville), Series 2015-A, 6.125% 2042 | 7,000 | 5,443 |
| County of Lucas, Hospital Rev. Bonds (Promedica Healthcare Obligated Group), Series 2018-A, 5.25% 2048 | 17,675 | 20,022 |
| County of Muskingum, Hospital Facs. Rev. Bonds (Genesis HealthCare System Obligated Group Project), Series 2013, 5.00% 2021 | 725 | 738 |
| County of Muskingum, Hospital Facs. Rev. Ref. Bonds (Genesis HealthCare System Obligated Group Project), Series 2013, 5.00% 2033 | 2,765 | 2,894 |
| County of Muskingum, Hospital Facs. Rev. Ref. Bonds (Genesis HealthCare System Obligated Group Project), Series 2013, 5.00% 2044 | 2,000 | 2,059 |
| County of Muskingum, Hospital Facs. Rev. Ref. Bonds (Genesis HealthCare System Obligated Group Project), Series 2013, 5.00% 2048 | 9,360 | 9,596 |
| Private Activity Bonds (Portsmouth Bypass Project), Series 2015, AMT, Assured Guaranty Municipal insured, 5.00% 2039 | 120 | 136 |
| Private Activity Bonds (Portsmouth Bypass Project), Series 2015, AMT, Assured Guaranty Municipal insured, 5.00% 2053 | 20,455 | 22,916 |
| Southeastern Ohio Port Auth., Hospital Facs. Improvement Rev. Bonds (Memorial Health System Obligated Group Project), Series 2015, 5.00% 2020 | 350 | 352 |
| Southeastern Ohio Port Auth., Hospital Facs. Rev. Ref. and Improvement Bonds (Memorial Health System Obligated Group Project), Series 2012, 5.00% 2022 | 205 | 211 |
| Southeastern Ohio Port Auth., Hospital Facs. Rev. Ref. and Improvement Bonds (Memorial Health System Obligated Group Project), Series 2012, 5.75% 2032 | 12,615 | 13,349 |
| Southeastern Ohio Port Auth., Hospital Facs. Rev. Ref. and Improvement Bonds (Memorial Health System Obligated Group Project), Series 2012, 6.00% 2042 | 16,450 | 17,277 |
| Southeastern Ohio Port Auth., Hospital Facs. Rev. Ref. and Improvement Bonds (Memorial Health System Obligated Group Project), Series 2015, 5.00% 2035 | 850 | 897 |
| Southeastern Ohio Port Auth., Hospital Facs. Rev. Ref. and Improvement Bonds (Memorial Health System Obligated Group Project), Series 2015, 5.00% 2043 | 3,965 | 4,082 |
| County of Warren, Healthcare Facs., Rev. Ref. Bonds (Otterbein Homes Obligated Group), Series 2016-A, 5.00% 2040 | 1,575 | 1,765 |
| County of Warren, Healthcare Facs., Rev. Ref. Bonds (Otterbein Homes Obligated Group), Series 2019-A, 5.00% 2032 | 1,070 | 1,293 |
| 387,826 | ||
| Oklahoma 0.39% | ||
| County of Comanche, Hospital Auth., Hospital Rev. Ref. Bonds, Series 2015, 5.00% 2029 | 1,070 | 1,190 |
| Dev. Fin. Auth., Health System Rev. Bonds (OU Medicine Project), Series 2018-B, 5.50% 2057 | 7,765 | 9,225 |
| Dev. Fin. Auth., Rev. Bonds (Provident Education Resources Inc. - Cross Village Student Housing Project), Series 2017-A, 5.00% 2037 | 1,000 | 400 |
| Dev. Fin. Auth., Rev. Bonds (Provident Education Resources Inc. - Cross Village Student Housing Project), Series 2017-A, 5.00% 2047 | 1,890 | 756 |
American High-Income Municipal Bond Fund — Page 52 of 77
| Bonds, notes & other debt instruments (continued) Oklahoma (continued) | Principal amount (000) | Value (000) |
| Dev. Fin. Auth., Rev. Bonds (Provident Education Resources Inc. - Cross Village Student Housing Project), Series 2017-A, 5.25% 2057 | $4,000 | $1,600 |
| Fort Sill Apache Tribe, Econ. Dev. Auth., Gaming Enterprise Rev. Bonds, Series 2011-A, 8.50% 20262 | 5,780 | 6,207 |
| Trustees of the Tulsa Airports Improvement Trust, General Airport Rev. Bonds, Series 2015-A, AMT, BAM insured, 5.00% 2035 | 1,000 | 1,127 |
| Trustees of the Tulsa Airports Improvement Trust, General Airport Rev. Bonds, Series 2015-A, AMT, BAM insured, 5.00% 2045 | 2,480 | 2,790 |
| Trustees of the Tulsa Municipal Airport Trust, American Airlines Inc. Rev. Ref. Bonds, Series 2001-B, AMT, 5.50% 2035 | 5,500 | 5,535 |
| Trustees of the Tulsa Municipal Airport Trust, American Airlines Inc. Rev. Ref. Bonds, Series 2013-B, AMT, 5.50% 2035 | 520 | 523 |
| Trustees of the Tulsa Municipal Airport Trust, Rev. Ref. Bonds, Series 2015, AMT, 5.00% 2035 (put 2025) | 2,750 | 2,769 |
| 32,122 | ||
| Oregon 0.54% | ||
| Business Dev. Commission, Econ. Dev. Rev. Bonds (Red Rock Biofuels LLC Clean Energy Project), Capital Appreciation Bonds, Series 2020-G-248, 0% 20372 | 5,800 | 5,058 |
| Business Dev. Commission, Econ. Dev. Rev. Bonds (Red Rock Biofuels LLC Clean Energy Project), Series 2017-A-248, AMT, 6.50% 20312,5 | 4,500 | 2,925 |
| Business Dev. Commission, Econ. Dev. Rev. Bonds (Red Rock Biofuels LLC Clean Energy Project), Series 2018-D-248, AMT, 6.50% 20312,5 | 9,930 | 6,454 |
| County of Clackamas, Hospital Fac. Auth., Senior Living Rev. Bonds (Williamette View Project), Series 2017-A, 4.00% 2020 | 460 | 462 |
| County of Clackamas, Hospital Facs. Auth., Rev. Senior Living Bonds (Rose Villa Inc. Obligated Group), Series 2020-A, 5.125% 2040 | 625 | 660 |
| County of Clackamas, Hospital Facs. Auth., Rev. Senior Living Bonds (Rose Villa Inc. Obligated Group), Series 2020-A, 5.25% 2050 | 1,000 | 1,054 |
| County of Clackamas, Hospital Facs. Auth., Rev. Senior Living Bonds (Rose Villa Inc. Obligated Group), Series 2020-A, 5.375% 2055 | 1,000 | 1,058 |
| Facs. Auth., Rev. Ref. Bonds (Samaritan Health Services Project), Series 2020-A, 5.00% 2040 | 2,250 | 2,780 |
| Housing and Community Services Dept., Mortgage Rev. Bonds (Single Family Mortgage Program), Series 2017-E, AMT, 3.50% 2040 | 2,140 | 2,291 |
| County of Polk, Hospital Fac. Auth., Rev. Bonds (Dallas Retirement Village Project), Series 2015-A, 5.50% 2050 | 5,080 | 5,193 |
| County of Polk, Hospital Fac. Auth., Rev. Bonds (Dallas Retirement Village Project), Series 2015-A, 5.125% 2035 | 1,240 | 1,266 |
| County of Polk, Hospital Fac. Auth., Rev. Bonds (Dallas Retirement Village Project), Series 2015-A, 5.375% 2045 | 1,500 | 1,529 |
| County of Polk, Hospital Fac. Auth., Rev. Bonds (Dallas Retirement Village Project), Series 2020-A, 5.125% 2055 | 6,200 | 6,234 |
| City of Salem, Hospital Fac. Auth., Rev. Bonds (Capital Manor Project), Series 2018, 5.00% 2033 | 550 | 594 |
| City of Salem, Hospital Fac. Auth., Rev. Bonds (Capital Manor Project), Series 2018, 5.00% 2048 | 1,100 | 1,152 |
| County of Yamhill, Hospital Auth., Rev. and Rev. Ref. Bonds (Friendsview Retirement Community), Series 2016-A, 5.00% 2031 | 125 | 132 |
| County of Yamhill, Hospital Auth., Rev. and Rev. Ref. Bonds (Friendsview Retirement Community), Series 2016-A, 5.00% 2036 | 625 | 652 |
| County of Yamhill, Hospital Auth., Rev. and Rev. Ref. Bonds (Friendsview Retirement Community), Series 2016-A, 5.00% 2046 | 4,835 | 4,982 |
| County of Yamhill, Hospital Auth., Rev. and Rev. Ref. Bonds (Friendsview Retirement Community), Series 2016-A, 5.00% 2051 | 500 | 514 |
| 44,990 |
American High-Income Municipal Bond Fund — Page 53 of 77
| Bonds, notes & other debt instruments (continued) Pennsylvania 5.54% | Principal amount (000) | Value (000) |
| County of Allegheny, Hospital Dev. Auth. Rev. Bonds (Allegheny Health Network Obligated Group Issue), Series 2018-A, 5.00% 2033 | $3,500 | $4,283 |
| County of Allegheny, Hospital Dev. Auth., Rev. Bonds (University of Pittsburgh Medical Center Issue), Series 2007-A-1, (3-month USD-LIBOR x 0.67 + 0.82%) 1.28% 20373 | 6,000 | 5,847 |
| Allentown City School Dist., Unlimited Tax G.O. Bonds, Series 2018, BAM insured, 5.00% 2028 | 2,500 | 3,236 |
| City of Allentown, Neighborhood Improvement Zone Dev. Auth., Tax Rev. Bonds (City Center Project), Series 2018, 5.00% 20422 | 1,500 | 1,575 |
| County of Berks, Industrial Dev. Auth., Health System Rev. Bonds (Tower Health Project), Series 2017, 5.00% 2035 | 3,325 | 3,655 |
| County of Berks, Industrial Dev. Auth., Health System Rev. Bonds (Tower Health Project), Series 2017, 5.00% 2047 | 6,300 | 6,803 |
| County of Berks, Industrial Dev. Auth., Health System Rev. Bonds (Tower Health Project), Series 2017, 5.00% 2050 | 1,710 | 1,848 |
| County of Berks, Industrial Dev. Auth., Healthcare Facs. Rev. Bonds (The Highlands at Wyomissing), Series 2018, 5.00% 2038 | 1,000 | 1,059 |
| County of Bucks, Industrial Dev. Auth., Rev. Bonds (Pennswood Village Project), Series 2018-A, 5.00% 2029 | 1,035 | 1,135 |
| County of Bucks, Industrial Dev. Auth., Rev. Bonds (Pennswood Village Project), Series 2018-A, 5.00% 2032 | 250 | 272 |
| County of Bucks, Industrial Dev. Auth., Rev. Bonds (Pennswood Village Project), Series 2018-A, 5.00% 2033 | 415 | 450 |
| County of Bucks, Industrial Dev. Auth., Rev. Bonds (St. Luke’s University Health Network Project), Series 2019, 4.00% 2050 | 2,500 | 2,744 |
| County of Chester, Health and Education Facs. Auth., Rev. Bonds (Simpson Senior Services Project), Series 2015-A, 5.00% 2035 | 1,020 | 1,028 |
| County of Chester, Health and Education Facs. Auth., Rev. Bonds (Simpson Senior Services Project), Series 2015-A, 5.25% 2045 | 3,860 | 3,876 |
| County of Chester, Health and Education Facs. Auth., Rev. Bonds (Simpson Senior Services Project), Series 2019, 5.00% 2051 | 3,625 | 3,475 |
| County of Chester, Industrial Dev. Auth., Rev. Bonds (Avon Grove Charter School Project), Series 2017-A, 5.00% 2047 | 1,160 | 1,289 |
| County of Chester, Industrial Dev. Auth., Rev. Bonds (Avon Grove Charter School Project), Series 2017-A, 5.00% 2051 | 645 | 715 |
| County of Chester, Industrial Dev. Auth., Rev. Bonds (Woodlands Greystone Project), Series 2018, 4.375% 20282 | 275 | 276 |
| County of Chester, Industrial Dev. Auth., Rev. Bonds (Woodlands Greystone Project), Series 2018, 5.00% 20382 | 1,602 | 1,620 |
| County of Chester, Industrial Dev. Auth., Rev. Bonds (Woodlands Greystone Project), Series 2018, 5.125% 20482 | 5,313 | 5,338 |
| County of Crawford, Hospital Auth., Rev. Bonds (Meadville Medical Center Project), Series 2016-A, 6.00% 2036 | 1,515 | 1,704 |
| County of Crawford, Hospital Auth., Rev. Bonds (Meadville Medical Center Project), Series 2016-A, 6.00% 2046 | 7,500 | 8,250 |
| County of Crawford, Hospital Auth., Rev. Bonds (Meadville Medical Center Project), Series 2016-A, 6.00% 2051 | 7,005 | 7,680 |
| County of Cumberland, Municipal Auth., Rev. Bonds (Diakon Lutheran Social Ministries Project), Series 2016, 5.00% 2030 | 1,000 | 1,086 |
| County of Cumberland, Municipal Auth., Rev. Bonds (Diakon Lutheran Social Ministries Project), Series 2016, 5.00% 2033 | 1,610 | 1,731 |
| County of Cumberland, Municipal Auth., Rev. Ref. Bonds (Asbury Pennsylvania Obligated Group), Series 2019, 5.00% 2029 | 3,165 | 3,186 |
| County of Cumberland, Municipal Auth., Rev. Ref. Bonds (Asbury Pennsylvania Obligated Group), Series 2019, 5.00% 2034 | 4,415 | 4,398 |
| County of Cumberland, Municipal Auth., Rev. Ref. Bonds (Asbury Pennsylvania Obligated Group), Series 2019, 5.00% 2045 | 5,150 | 4,953 |
| County of Dauphin, General Auth., Health System Rev. Bonds (Pinnacle Health System Project), Series 2016-A, 5.00% 2034 | 1,245 | 1,474 |
American High-Income Municipal Bond Fund — Page 54 of 77
| Bonds, notes & other debt instruments (continued) Pennsylvania (continued) | Principal amount (000) | Value (000) |
| County of Dauphin, General Auth., Health System Rev. Bonds (Pinnacle Health System Project), Series 2016-A, 5.00% 2036 | $500 | $589 |
| City of Doylestown, Hospital Auth., Rev. Bonds (Doylestown Hospital), Series 2016-A, 5.00% 2041 | 6,550 | 7,301 |
| City of Doylestown, Hospital Auth., Rev. Bonds (Doylestown Hospital), Series 2016-A, 5.00% 2046 | 7,370 | 8,076 |
| City of Doylestown, Hospital Auth., Rev. Bonds (Doylestown Hospital), Series 2016-B, 5.00% 2021 | 1,215 | 1,248 |
| City of Doylestown, Hospital Auth., Rev. Bonds (Doylestown Hospital), Series 2019-A, 4.00% 2045 | 1,375 | 1,470 |
| City of Doylestown, Hospital Auth., Rev. Bonds (Doylestown Hospital), Series 2019-A, 5.00% 2049 | 2,000 | 2,252 |
| East Hempfield Township, Industrial Dev. Auth., Rev. Bonds (Student Services, Inc. Student Housing Project at Millersville University of Pennsylvania), Series 2013, 5.00% 2035 | 1,000 | 1,010 |
| East Hempfield Township, Industrial Dev. Auth., Rev. Bonds (Student Services, Inc. Student Housing Project at Millersville University of Pennsylvania), Series 2013, 5.00% 2045 | 2,750 | 2,756 |
| East Hempfield Township, Industrial Dev. Auth., Rev. Bonds (Student Services, Inc. Student Housing Project at Millersville University of Pennsylvania), Series 2014, 5.00% 2034 | 875 | 888 |
| East Hempfield Township, Industrial Dev. Auth., Rev. Bonds (Student Services, Inc. Student Housing Project at Millersville University of Pennsylvania), Series 2014, 5.00% 2039 | 440 | 443 |
| East Hempfield Township, Industrial Dev. Auth., Rev. Bonds (Student Services, Inc. Student Housing Project at Millersville University of Pennsylvania), Series 2014, 5.00% 2046 | 3,850 | 3,859 |
| East Hempfield Township, Industrial Dev. Auth., Rev. Bonds (Student Services, Inc. Student Housing Project at Millersville University of Pennsylvania), Series 2015, 5.00% 2030 | 825 | 851 |
| East Hempfield Township, Industrial Dev. Auth., Rev. Bonds (Student Services, Inc. Student Housing Project at Millersville University of Pennsylvania), Series 2015, 5.00% 2047 | 2,500 | 2,506 |
| Econ. Dev. Fncg. Auth., Exempt Facs. Rev. Ref. Bonds (National Gypsum Co.), Series 2014, AMT, 5.50% 2044 | 4,500 | 4,630 |
| Econ. Dev. Fncg. Auth., Exempt Facs. Rev. Ref. Bonds (PPL Energy Supply, LLC Project), Series 2009-C, 5.00% 2037 (put 2020) | 17,275 | 17,276 |
| Econ. Dev. Fncg. Auth., Private Activity Rev. Bonds (The Pennsylvania Rapid Bridge Replacement Project), Series 2015, AMT, 5.00% 2029 | 5,000 | 5,727 |
| Econ. Dev. Fncg. Auth., Private Activity Rev. Bonds (The Pennsylvania Rapid Bridge Replacement Project), Series 2015, AMT, 5.00% 2034 | 16,300 | 18,140 |
| Econ. Dev. Fncg. Auth., Private Activity Rev. Bonds (The Pennsylvania Rapid Bridge Replacement Project), Series 2015, AMT, 5.00% 2038 | 14,490 | 15,994 |
| Econ. Dev. Fncg. Auth., Private Activity Rev. Bonds (The Pennsylvania Rapid Bridge Replacement Project), Series 2015, AMT, 5.00% 2042 | 1,000 | 1,097 |
| Econ. Dev. Fncg. Auth., Solid Waste Disposal Rev. Bonds (CarbonLite P, LLC Project), Series 2019, AMT, 5.25% 20262 | 2,500 | 2,496 |
| Econ. Dev. Fncg. Auth., Solid Waste Disposal Rev. Bonds (CarbonLite P, LLC Project), Series 2019, AMT, 5.75% 20362 | 7,290 | 7,193 |
| Econ. Dev. Fncg. Auth., Solid Waste Disposal Rev. Bonds (Waste Management, Inc. Project), Series 2011, AMT, 2.15% 2041 (put 2024) | 3,000 | 3,127 |
| Econ. Dev. Fncg. Auth., Solid Waste Disposal Rev. Green Bonds (Covanta Project), Series 2019, AMT, 3.25% 20392 | 5,750 | 5,288 |
| Erie County School Dist., Limited Tax G.O. Bonds, Series 2019-A, Assured Guaranty Municipal insured, 5.00% 2029 | 300 | 400 |
| Erie County School Dist., Limited Tax G.O. Bonds, Series 2019-A, Assured Guaranty Municipal insured, 5.00% 2031 | 525 | 688 |
| Erie County School Dist., Limited Tax G.O. Bonds, Series 2019-A, Assured Guaranty Municipal insured, 5.00% 2034 | 825 | 1,062 |
| Fncg. Auth., Rev. Bonds (Tobacco Master Settlement Payment), Series 2018, 5.00% 2035 | 2,500 | 3,102 |
| County of Franklin, Industrial Dev. Auth., Rev. Bonds (Menno-Haven Inc. Project), Series 2018, 5.00% 2032 | 300 | 314 |
| County of Franklin, Industrial Dev. Auth., Rev. Bonds (Menno-Haven Inc. Project), Series 2018, 5.00% 2038 | 500 | 512 |
| County of Franklin, Industrial Dev. Auth., Rev. Bonds (Menno-Haven Inc. Project), Series 2018, 5.00% 2043 | 1,000 | 1,012 |
| County of Franklin, Industrial Dev. Auth., Rev. Bonds (Menno-Haven Inc. Project), Series 2018, 5.00% 2048 | 1,300 | 1,308 |
| County of Franklin, Industrial Dev. Auth., Rev. Bonds (Menno-Haven Inc. Project), Series 2018, 5.00% 2053 | 2,150 | 2,156 |
| County of Franklin, Industrial Dev. Auth., Rev. Bonds (Menno-Haven Inc. Project), Series 2019, 5.00% 2039 | 385 | 393 |
| County of Franklin, Industrial Dev. Auth., Rev. Bonds (Menno-Haven Inc. Project), Series 2019, 5.00% 2049 | 510 | 513 |
| Higher Education Assistance Agcy., Education Loan Rev. Bonds, Series 2020, 2.45% 2041 | 3,480 | 3,261 |
American High-Income Municipal Bond Fund — Page 55 of 77
| Bonds, notes & other debt instruments (continued) Pennsylvania (continued) | Principal amount (000) | Value (000) |
| Higher Educational Facs. Auth., Health System Rev. Bonds (University of Pennsylvania Health System), Series 2017-A, 5.00% 2042 | $1,000 | $1,206 |
| Higher Educational Facs. Auth., Rev. Bonds (Shippensburg University Student Services, Inc. Student Housing Project at Shippensburg University of Pennsylvania), Series 2012, 5.00% 2044 (preref. 2022) | 2,760 | 3,045 |
| Higher Educational Facs. Auth., Rev. Bonds (Thomas Jefferson University), Series 2015-A, 5.25% 2050 | 2,400 | 2,717 |
| Higher Educational Facs. Auth., Student Housing Rev. Bonds (University Properties, Inc. Student Housing Project at East Stroudsburg University of Pennsylvania), Series 2010, 5.00% 2031 | 4,925 | 4,933 |
| Higher Educational Facs. Auth., Student Housing Rev. Bonds (University Properties, Inc. Student Housing Project at East Stroudsburg University of Pennsylvania), Series 2010, 5.00% 2042 | 7,890 | 7,902 |
| Higher Educational Facs. Auth., Student Housing Rev. Bonds (University Properties, Inc. Student Housing Project at East Stroudsburg University of Pennsylvania), Series 2016-A, 5.00% 2026 | 570 | 607 |
| Higher Educational Facs. Auth., Student Housing Rev. Bonds (University Properties, Inc. Student Housing Project at East Stroudsburg University of Pennsylvania), Series 2016-A, 5.00% 2031 | 1,450 | 1,512 |
| Housing Fin. Agcy., Single Family Mortgage Rev. Bonds, Series 2017-123-A, AMT, 4.00% 2039 | 2,340 | 2,480 |
| Housing Fin. Agcy., Single Family Mortgage Rev. Bonds, Series 2017-124-A, AMT, 4.00% 2038 | 5,500 | 5,823 |
| Housing Fin. Agcy., Single Family Mortgage Rev. Bonds, Series 2019-128-A, AMT, 4.75% 2033 | 6,840 | 7,557 |
| County of Lancaster, Hospital Auth., Rev. Bonds (Saint Anne’s Retirement Community, Inc. Project), Series 2020, 5.00% 2040 | 1,000 | 1,029 |
| County of Lancaster, Hospital Auth., Rev. Bonds (Saint Anne’s Retirement Community, Inc. Project), Series 2020, 5.00% 2045 | 1,500 | 1,532 |
| County of Lancaster, Hospital Auth., Rev. Bonds (Saint Anne’s Retirement Community, Inc. Project), Series 2020, 5.00% 2050 | 3,650 | 3,716 |
| County of Montgomery, Higher Education and Health Auth., Rev. Ref. Bonds (Philadelphia Presbytery Homes, Inc. Project), Series 2017, 5.00% 2032 | 260 | 280 |
| County of Montgomery, Higher Education and Health Auth., Rev. Ref. Bonds (Philadelphia Presbytery Homes, Inc. Project), Series 2017, 5.00% 2037 | 780 | 831 |
| County of Montgomery, Higher Education and Health Auth., Rev. Ref. Bonds (Philadelphia Presbytery Homes, Inc. Project), Series 2017, 5.00% 2047 | 6,055 | 6,334 |
| County of Montgomery, Industrial Dev. Auth., Health Systems Rev. Bonds (Albert Einstein Healthcare Network Issue), Series 2015-A, 5.00% 2021 | 2,000 | 2,023 |
| County of Montgomery, Industrial Dev. Auth., Health Systems Rev. Bonds (Albert Einstein Healthcare Network Issue), Series 2015-A, 5.00% 2022 | 250 | 259 |
| County of Montgomery, Industrial Dev. Auth., Health Systems Rev. Bonds (Albert Einstein Healthcare Network Issue), Series 2015-A, 5.25% 2028 | 1,500 | 1,648 |
| County of Montgomery, Industrial Dev. Auth., Health Systems Rev. Bonds (Albert Einstein Healthcare Network Issue), Series 2015-A, 5.25% 2030 | 500 | 546 |
| County of Montgomery, Industrial Dev. Auth., Health Systems Rev. Bonds (Albert Einstein Healthcare Network Issue), Series 2015-A, 5.25% 2036 | 10,895 | 11,733 |
| County of Montgomery, Industrial Dev. Auth., Health Systems Rev. Bonds (Albert Einstein Healthcare Network Issue), Series 2015-A, 5.25% 2045 | 14,600 | 15,503 |
| County of Montgomery, Industrial Dev. Auth., Health Systems Rev. Bonds (Albert Einstein Healthcare Network Issue), Series 2015-A, 5.25% 2046 | 2,060 | 2,185 |
| County of Montgomery, Industrial Dev. Auth., Retirement Communities Rev. Bonds (Waverly Heights Ltd.), Series 2019, 5.00% 2044 | 1,250 | 1,385 |
| County of Montgomery, Industrial Dev. Auth., Retirement Communities Rev. Bonds (ACTS Retirement-Life Communities, Inc. Obligated Group), Series 2016, 5.00% 2033 | 3,360 | 3,922 |
| County of Montgomery, Industrial Dev. Auth., Retirement Communities Rev. Bonds (ACTS Retirement-Life Communities, Inc. Obligated Group), Series 2016, 5.00% 2036 | 5,250 | 6,074 |
| County of Montgomery, Industrial Dev. Auth., Retirement Communities Rev. Ref. Bonds (ACTS Retirement-Life Communities, Inc. Obligated Group), Series 2012, 5.00% 2027 (preref. 2022) | 2,500 | 2,712 |
| County of Montgomery, Industrial Dev. Auth., Retirement Communities Rev. Ref. Bonds (ACTS Retirement-Life Communities, Inc. Obligated Group), Series 2012, 5.00% 2028 (preref. 2022) | 2,800 | 3,037 |
| County of Montgomery, Industrial Dev. Auth., Rev. Bonds (Lifespace Communities, Inc.), Series 2020-C, 4.00% 2043 | 500 | 548 |
American High-Income Municipal Bond Fund — Page 56 of 77
| Bonds, notes & other debt instruments (continued) Pennsylvania (continued) | Principal amount (000) | Value (000) |
| County of Montgomery, Industrial Dev. Auth., Rev. Bonds (Lifespace Communities, Inc.), Series 2020-C, 5.00% 2045 | $1,000 | $1,183 |
| County of Northampton, General Purpose Auth., Hospital Rev. Bonds (St. Luke’s University Health Network Project), Series 2016-A, 5.00% 2046 | 1,000 | 1,144 |
| County of Northampton, General Purpose Auth., Hospital Rev. Bonds (St. Luke’s University Health Network Project), Series 2018-B, (1-month USD-LIBOR x 0.70 + 1.04%) 1.159% 2048 (put 2022)3 | 600 | 598 |
| County of Northampton, Industrial Dev. Auth., Rev. Bonds (Morningstar Senior Living, Inc.), Series 2019, 5.00% 2039 | 1,500 | 1,550 |
| County of Northampton, Industrial Dev. Auth., Rev. Bonds (Morningstar Senior Living, Inc.), Series 2019, 5.00% 2044 | 3,725 | 3,805 |
| County of Northampton, Industrial Dev. Auth., Rev. Bonds (Morningstar Senior Living, Inc.), Series 2019, 5.00% 2049 | 4,200 | 4,268 |
| City of Philadelphia, Hospitals and Higher Education Facs. Auth., Hospital Rev. Bonds (Temple University Health System Obligated Group), Series 2012-A, 5.625% 2036 | 3,885 | 4,105 |
| City of Philadelphia, Hospitals and Higher Education Facs. Auth., Hospital Rev. Bonds (Temple University Health System Obligated Group), Series 2012-A, 5.625% 2042 | 14,190 | 14,895 |
| City of Philadelphia, Hospitals and Higher Education Facs. Auth., Hospital Rev. Bonds (Temple University Health System Obligated Group), Series 2017, 5.00% 2021 | 250 | 258 |
| City of Philadelphia, Hospitals and Higher Education Facs. Auth., Hospital Rev. Bonds (Temple University Health System Obligated Group), Series 2017, 5.00% 2028 | 1,000 | 1,184 |
| City of Philadelphia, Hospitals and Higher Education Facs. Auth., Hospital Rev. Bonds (Temple University Health System Obligated Group), Series 2017, 5.00% 2033 | 3,500 | 4,058 |
| City of Philadelphia, Industrial Dev. Auth., Charter School Rev. Bonds (Mast Community Charter School II Project), Series 2020-A, 5.00% 2030 | 525 | 636 |
| City of Philadelphia, Industrial Dev. Auth., Charter School Rev. Bonds (Mast Community Charter School II Project), Series 2020-A, 5.00% 2040 | 620 | 728 |
| City of Philadelphia, Industrial Dev. Auth., Charter School Rev. Bonds (Mast Community Charter School II Project), Series 2020-A, 5.00% 2050 | 1,050 | 1,221 |
| City of Philadelphia, Industrial Dev. Auth., Rev. Bonds (Independence Charter School West), Series 2019, 4.00% 2029 | 350 | 358 |
| City of Philadelphia, Industrial Dev. Auth., Rev. Bonds (Independence Charter School West), Series 2019, 5.00% 2039 | 500 | 517 |
| City of Philadelphia, Industrial Dev. Auth., Rev. Bonds (Independence Charter School West), Series 2019, 5.00% 2050 | 1,375 | 1,403 |
| City of Philadelphia, Industrial Dev. Auth., Rev. Bonds (Mast III Charter School Project), Series 2019-A, 6.50% 2054 | 17,910 | 18,628 |
| City of Philadelphia, Industrial Dev. Auth., Rev. Bonds (University of the Sciences), Series 2017, 5.00% 2047 | 3,425 | 3,620 |
| Philadelphia School Dist., G.O. Bonds, Series 2011-E, 5.25% 2023 | 300 | 301 |
| Philadelphia School Dist., G.O. Bonds, Series 2016-F, 5.00% 2028 | 6,100 | 7,529 |
| Philadelphia School Dist., G.O. Bonds, Series 2016-F, 5.00% 2029 | 4,500 | 5,530 |
| Philadelphia School Dist., G.O. Bonds, Series 2016-F, 5.00% 2030 (preref. 2026) | 10 | 13 |
| Philadelphia School Dist., G.O. Bonds, Series 2016-F, 5.00% 2036 | 1,000 | 1,199 |
| Philadelphia School Dist., G.O. Bonds, Series 2016-F, 5.00% 2037 | 1,500 | 1,794 |
| Philadelphia School Dist., G.O. Bonds, Series 2016-F, 5.00% 2038 | 1,000 | 1,193 |
| Philadelphia School Dist., G.O. Bonds, Series 2018-A, 5.00% 2028 | 745 | 967 |
| Philadelphia School Dist., G.O. Bonds, Series 2018-A, 5.00% 2034 | 1,270 | 1,596 |
| Philadelphia School Dist., G.O. Bonds, Series 2018-A, Assured Guaranty Municipal insured, 5.00% 2038 | 1,000 | 1,237 |
| Philadelphia School Dist., G.O. Rev. Ref. Bonds, Series 2007-A, FGIC-National insured, 5.00% 2034 | 3,000 | 4,331 |
| Public School Building Auth., School Lease Rev. Ref. Bonds (Philadelphia School Dist. Project), Series 2016-A, Assured Guaranty Municipal insured, 5.00% 2030 | 5,000 | 6,149 |
| Reading School Dist., G.O. Bonds, Series 2017, Assured Guaranty Municipal insured, 5.00% 2027 | 275 | 348 |
| Reading School Dist., G.O. Bonds, Series 2017, Assured Guaranty Municipal insured, 5.00% 2028 | 275 | 347 |
| Reading School Dist., G.O. Bonds, Series 2017, Assured Guaranty Municipal insured, 5.00% 2036 | 1,100 | 1,341 |
| Reading School Dist., G.O. Bonds, Series 2017, Assured Guaranty Municipal insured, 5.00% 2038 | 1,000 | 1,206 |
American High-Income Municipal Bond Fund — Page 57 of 77
| Bonds, notes & other debt instruments (continued) Pennsylvania (continued) | Principal amount (000) | Value (000) |
| Scranton School Dist., G.O. Bonds, Series 2017-E, BAM insured, 5.00% 2034 | $825 | $1,027 |
| Scranton School Dist., G.O. Bonds, Series 2017-E, BAM insured, 5.00% 2035 | 750 | 930 |
| Susquehanna Area Regional Airport Auth., Airport System Rev. Bonds, Series 2012-A, AMT, 5.00% 2023 | 4,120 | 4,316 |
| Susquehanna Area Regional Airport Auth., Airport System Rev. Bonds, Series 2012-A, AMT, 5.00% 2027 | 11,710 | 12,211 |
| Susquehanna Area Regional Airport Auth., Airport System Rev. Bonds, Series 2012-B, 4.00% 2033 | 650 | 658 |
| Susquehanna Area Regional Airport Auth., Airport System Rev. Bonds, Series 2017, AMT, 5.00% 2035 | 4,685 | 5,075 |
| Susquehanna Area Regional Airport Auth., Airport System Rev. Bonds, Series 2017, AMT, 5.00% 2038 | 4,450 | 4,781 |
| Turnpike Commission, Turnpike Rev. Bonds, Series 2017-B-2, Assured Guaranty Municipal insured, 5.00% 2033 | 1,000 | 1,250 |
| Turnpike Commission, Turnpike Rev. Bonds, Series 2019-A, 5.00% 2044 | 5,750 | 7,131 |
| Turnpike Commission, Turnpike Rev. Bonds, Series 2019-A, 5.00% 2049 | 1,425 | 1,754 |
| County of Washington, Redev. Auth., Redev. Rev. Ref. Bonds (Victory Centre Tax Increment Fncg. Project), Series 2018, 4.00% 2023 | 550 | 554 |
| County of Washington, Redev. Auth., Redev. Rev. Ref. Bonds (Victory Centre Tax Increment Fncg. Project), Series 2018, 5.00% 2028 | 850 | 882 |
| Wilkes-Barre Area School Dist., G.O. Bonds, Series 2019, BAM insured, 5.00% 2059 | 2,000 | 2,462 |
| 459,274 | ||
| Puerto Rico 5.20% | ||
| Aqueduct and Sewer Auth., Rev. Bonds, Series 2012-A, 5.00% 2033 | 16,230 | 16,737 |
| Aqueduct and Sewer Auth., Rev. Bonds, Series 2012-A, 5.125% 2037 | 1,045 | 1,078 |
| Aqueduct and Sewer Auth., Rev. Bonds, Series 2012-A, 5.25% 2042 | 48,205 | 49,711 |
| Aqueduct and Sewer Auth., Rev. Bonds, Series 2012-A, 5.75% 2037 | 8,000 | 8,350 |
| Electric Power Auth., Power Rev. Bonds, Series 2003-NN, National insured, 5.25% 2021 | 1,050 | 1,062 |
| Electric Power Auth., Power Rev. Bonds, Series 2005-RR, Assured Guaranty insured, 5.00% 2028 | 3,055 | 3,074 |
| Electric Power Auth., Power Rev. Bonds, Series 2005-SS, Assured Guaranty Municipal insured, 5.00% 2030 | 165 | 166 |
| Electric Power Auth., Power Rev. Bonds, Series 2005-SS, National insured, 5.00% 2024 | 1,420 | 1,431 |
| Electric Power Auth., Power Rev. Bonds, Series 2007-TT, 5.00% 20325 | 2,960 | 2,035 |
| Electric Power Auth., Power Rev. Bonds, Series 2007-TT, 5.00% 20375 | 1,410 | 969 |
| Electric Power Auth., Power Rev. Bonds, Series 2008-WW, 5.00% 20285 | 5,485 | 3,771 |
| Electric Power Auth., Power Rev. Bonds, Series 2008-WW, 5.375% 20245 | 8,635 | 5,969 |
| Electric Power Auth., Power Rev. Bonds, Series 2008-WW, 5.50% 20275 | 3,000 | 2,059 |
| Electric Power Auth., Power Rev. Bonds, Series 2008-WW, 5.50% 20385 | 2,150 | 1,489 |
| Electric Power Auth., Power Rev. Bonds, Series 2010-AAA, 5.25% 20285 | 20 | 13 |
| Electric Power Auth., Power Rev. Bonds, Series 2010-CCC, 5.00% 20285 | 4,120 | 2,832 |
| Electric Power Auth., Power Rev. Bonds, Series 2010-XX, 5.25% 20405 | 20,475 | 14,128 |
| Electric Power Auth., Power Rev. Bonds, Series 2010-XX, 5.75% 20365 | 3,340 | 2,321 |
| Electric Power Auth., Power Rev. Bonds, Series 2010-ZZ, 5.25% 20245 | 2,480 | 1,711 |
| Electric Power Auth., Power Rev. Bonds, Series 2012-A, 5.00% 20425 | 11,090 | 7,624 |
| Electric Power Auth., Power Rev. Bonds, Series 2012-A, 5.05% 20425 | 1,885 | 1,296 |
| Electric Power Auth., Power Rev. Bonds, Series 2013-A, 7.00% 20405 | 4,500 | 3,172 |
| Electric Power Auth., Power Rev. Ref. Bonds, Series 2003-NN, National insured, 4.75% 2033 | 1,870 | 1,882 |
| Electric Power Auth., Power Rev. Ref. Bonds, Series 2007-VV, National insured, 5.25% 2025 | 775 | 796 |
| Electric Power Auth., Power Rev. Ref. Bonds, Series 2007-VV, National insured, 5.25% 2030 | 475 | 487 |
| Electric Power Auth., Power Rev. Ref. Bonds, Series 2010-DDD, Assured Guaranty Municipal insured, 3.65% 2024 | 120 | 120 |
| Electric Power Auth., Power Rev. Ref. Bonds, Series UU, Assured Guaranty Municipal insured, (3-month USD-LIBOR x 0.67 + 0.52%) 0.718% 20293 | 11,430 | 10,116 |
| Highways and Transportation Auth., Highway Rev. Ref. Bonds, Series 1996-Y, Assured Guaranty Municipal insured, 6.25% 2021 | 1,230 | 1,273 |
| Highways and Transportation Auth., Highway Rev. Ref. Bonds, Series 2003-AA-1, Assured Guaranty Municipal insured, 4.95% 2026 | 545 | 548 |
| Highways and Transportation Auth., Highway Rev. Ref. Bonds, Series 2007-CC, Assured Guaranty Municipal insured, 5.25% 2033 | 340 | 373 |
| Highways and Transportation Auth., Transportation Rev. Bonds, Series 2004-J, National insured, 5.00% 2029 | 1,075 | 1,082 |
American High-Income Municipal Bond Fund — Page 58 of 77
| Bonds, notes & other debt instruments (continued) Puerto Rico (continued) | Principal amount (000) | Value (000) |
| Highways and Transportation Auth., Transportation Rev. Ref. Bonds, Series 2005-L, AMBAC insured, 5.25% 2038 | $1,445 | $1,502 |
| Highways and Transportation Auth., Transportation Rev. Ref. Bonds, Series 2007-N, AMBAC insured, 1.449% 20283 | 8,535 | 7,874 |
| Industrial, Tourist, Educational, Medical and Environmental Control Facs. Fncg. Auth., Higher Education Rev. and Rev. Ref. Bonds (Ana G. Méndez University System Project), Series 2002, 5.375% 2021 | 40 | 40 |
| Industrial, Tourist, Educational, Medical and Environmental Control Facs. Fncg. Auth., Higher Education Rev. and Rev. Ref. Bonds (Ana G. Méndez University System Project), Series 2002, 5.50% 2031 | 6,815 | 6,816 |
| Industrial, Tourist, Educational, Medical and Environmental Control Facs. Fncg. Auth., Higher Education Rev. and Rev. Ref. Bonds (Ana G. Méndez University System Project), Series 2006, 5.00% 2021 | 575 | 576 |
| Industrial, Tourist, Educational, Medical and Environmental Control Facs. Fncg. Auth., Higher Education Rev. and Rev. Ref. Bonds (Ana G. Méndez University System Project), Series 2006, 5.00% 2026 | 755 | 755 |
| Industrial, Tourist, Educational, Medical and Environmental Control Facs. Fncg. Auth., Higher Education Rev. and Rev. Ref. Bonds (Ana G. Méndez University System Project), Series 2006, 5.00% 2036 | 520 | 501 |
| Industrial, Tourist, Educational, Medical and Environmental Control Facs. Fncg. Auth., Higher Education Rev. and Rev. Ref. Bonds (Ana G. Méndez University System Project), Series 2012, 5.00% 2027 | 6,200 | 6,200 |
| Industrial, Tourist, Educational, Medical and Environmental Control Facs. Fncg. Auth., Higher Education Rev. and Rev. Ref. Bonds (Ana G. Méndez University System Project), Series 2012, 5.125% 2032 | 3,750 | 3,709 |
| Industrial, Tourist, Educational, Medical and Environmental Control Facs. Fncg. Auth., Higher Education Rev. and Rev. Ref. Bonds (Ana G. Méndez University System Project), Series 2012, 5.375% 2042 | 6,455 | 6,353 |
| Industrial, Tourist, Educational, Medical and Environmental Control Facs. Fncg. Auth., Higher Education Rev. and Rev. Ref. Bonds (Inter American University of Puerto Rico Project), Series 2012, 5.00% 2020 | 3,485 | 3,501 |
| Industrial, Tourist, Educational, Medical and Environmental Control Facs. Fncg. Auth., Higher Education Rev. and Rev. Ref. Bonds (Inter American University of Puerto Rico Project), Series 2012, 5.00% 2021 | 2,425 | 2,508 |
| Industrial, Tourist, Educational, Medical and Environmental Control Facs. Fncg. Auth., Higher Education Rev. and Rev. Ref. Bonds (Inter American University of Puerto Rico Project), Series 2012, 5.00% 2022 | 1,000 | 1,062 |
| Industrial, Tourist, Educational, Medical and Environmental Control Facs. Fncg. Auth., Higher Education Rev. and Rev. Ref. Bonds (Inter American University of Puerto Rico Project), Series 2012, 5.00% 2031 | 1,700 | 1,783 |
| Industrial, Tourist, Educational, Medical and Environmental Control Facs. Fncg. Auth., Higher Education Rev. and Rev. Ref. Bonds (University of the Sacred Heart Project), Series 2012, 4.00% 2023 | 960 | 927 |
| Industrial, Tourist, Educational, Medical and Environmental Control Facs. Fncg. Auth., Higher Education Rev. and Rev. Ref. Bonds (University of the Sacred Heart Project), Series 2012, 4.00% 2024 | 325 | 311 |
| Industrial, Tourist, Educational, Medical and Environmental Control Facs. Fncg. Auth., Higher Education Rev. and Rev. Ref. Bonds (University of the Sacred Heart Project), Series 2012, 4.00% 2026 | 825 | 774 |
| Industrial, Tourist, Educational, Medical and Environmental Control Facs. Fncg. Auth., Higher Education Rev. and Rev. Ref. Bonds (University of the Sacred Heart Project), Series 2012, 4.125% 2027 | 995 | 932 |
| Industrial, Tourist, Educational, Medical and Environmental Control Facs. Fncg. Auth., Higher Education Rev. and Rev. Ref. Bonds (University of the Sacred Heart Project), Series 2012, 4.375% 2031 | 1,525 | 1,417 |
| Industrial, Tourist, Educational, Medical and Environmental Control Facs. Fncg. Auth., Higher Education Rev. and Rev. Ref. Bonds (University of the Sacred Heart Project), Series 2012, 5.00% 2042 | 1,650 | 1,489 |
| Industrial, Tourist, Educational, Medical and Environmental Control Facs. Fncg. Auth., Higher Education Rev. Bonds (Inter American University of Puerto Rico Project), Series 2004, National insured, 4.25% 2024 | 550 | 551 |
| Industrial, Tourist, Educational, Medical and Environmental Control Facs. Fncg. Auth., Higher Education Rev. Bonds (Inter American University of Puerto Rico Project), Series 2004, National insured, 4.50% 2029 | 2,230 | 2,235 |
| Industrial, Tourist, Educational, Medical and Environmental Control Facs. Fncg. Auth., Higher Education Rev. Bonds (Inter American University of Puerto Rico Project), Series 2019, 5.00% 2022 | 1,500 | 1,593 |
| Industrial, Tourist, Educational, Medical and Environmental Control Facs. Fncg. Auth., Higher Education Rev. Bonds (Inter American University of Puerto Rico Project), Series 2019, 5.00% 2023 | 1,600 | 1,743 |
| Industrial, Tourist, Educational, Medical and Environmental Control Facs. Fncg. Auth., Higher Education Rev. Bonds (Inter American University of Puerto Rico Project), Series 2019, 5.00% 2024 | 1,700 | 1,892 |
| Industrial, Tourist, Educational, Medical and Environmental Control Facs. Fncg. Auth., Higher Education Rev. Bonds (Inter American University of Puerto Rico Project), Series 2019, 5.00% 2025 | 1,800 | 2,039 |
| Industrial, Tourist, Educational, Medical and Environmental Control Facs. Fncg. Auth., Higher Education Rev. Bonds (Inter American University of Puerto Rico Project), Series 2019, 5.00% 2026 | 1,900 | 2,183 |
American High-Income Municipal Bond Fund — Page 59 of 77
| Bonds, notes & other debt instruments (continued) Puerto Rico (continued) | Principal amount (000) | Value (000) |
| Industrial, Tourist, Educational, Medical and Environmental Control Facs. Fncg. Auth., Higher Education Rev. Bonds (Inter American University of Puerto Rico Project), Series 2019, 5.00% 2027 | $1,900 | $2,214 |
| Industrial, Tourist, Educational, Medical and Environmental Control Facs. Fncg. Auth., Higher Education Rev. Bonds (Inter American University of Puerto Rico Project), Series 2019, 5.00% 2028 | 2,000 | 2,359 |
| Industrial, Tourist, Educational, Medical and Environmental Control Facs. Fncg. Auth., Higher Education Rev. Bonds (Inter American University of Puerto Rico Project), Series 2019, 5.00% 2034 | 2,200 | 2,552 |
| Industrial, Tourist, Educational, Medical and Environmental Control Facs. Fncg. Auth., Higher Education Rev. Bonds (Inter American University of Puerto Rico Project), Series 2019, 5.00% 2044 | 2,500 | 2,815 |
| Industrial, Tourist, Educational, Medical and Environmental Control Facs. Fncg. Auth., Higher Education Rev. and Rev. Ref. Bonds (University of the Sacred Heart Project), Series 2012, 5.00% 2020 | 50 | 50 |
| Industrial, Tourist, Educational, Medical and Environmental Control Facs. Fncg. Auth., Hospital Rev. and Rev. Ref. Bonds (Hospital Auxilio Mutuo Obligated Group Project), Series 2011-A, 5.00% 2021 | 2,270 | 2,334 |
| Industrial, Tourist, Educational, Medical and Environmental Control Facs. Fncg. Auth., Hospital Rev. and Rev. Ref. Bonds (Hospital Auxilio Mutuo Obligated Group Project), Series 2011-A, 6.00% 2033 | 15,180 | 15,637 |
| Infrastructure Fncg. Auth., Special Tax Rev. Bonds, Capital Appreciation Bonds, Series 2005-A, Assured Guaranty Municipal insured, 0% 2036 | 1,560 | 753 |
| Infrastructure Fncg. Auth., Special Tax Rev. Ref. Bonds, Series 2005-C, AMBAC insured, 5.50% 2024 | 240 | 260 |
| Infrastructure Fncg. Auth., Special Tax Rev. Ref. Bonds, Series 2005-C, AMBAC insured, 5.50% 2025 | 1,130 | 1,231 |
| Public Building Auth., Rev. Ref. Bonds, Series 1993-L, National insured, 5.50% 2021 | 1,079 | 1,094 |
| Public Improvement G.O. Bonds, Series 2001-A, 5.125% 20315 | 5,015 | 3,473 |
| Public Improvement G.O. Bonds, Series 2001-A, Assured Guaranty insured, 5.50% 2029 | 4,875 | 5,398 |
| Public Improvement G.O. Rev. Ref. Bonds, Series 2012-A, Assured Guaranty Municipal insured, 5.00% 2035 | 2,590 | 2,663 |
| Public Improvement G.O. Rev. Ref. Bonds, Series 2012-A, Assured Guaranty Municipal insured, 5.00% 20415 | 11,993 | 7,166 |
| Sales Tax Fncg. Corp., Sales Tax Rev. Bonds, Capital Appreciation Bonds, Series 2007-A, Class 2, AMBAC insured, 0% 20473 | 3,513 | 964 |
| Sales Tax Fncg. Corp., Sales Tax Rev. Bonds, Capital Appreciation Bonds, Series 2007-A, Class 2, AMBAC insured, 0% 20543 | 22,487 | 4,266 |
| Sales Tax Fncg. Corp., Sales Tax Rev. Bonds, Capital Appreciation Bonds, Series 2019, Class 2, 0% 20543 | 84 | 17 |
| Sales Tax Fncg. Corp., Sales Tax Rev. Restructured Bonds, Capital Appreciation Bonds, Series 2018-A-1, 0% 2024 | 301 | 275 |
| Sales Tax Fncg. Corp., Sales Tax Rev. Restructured Bonds, Capital Appreciation Bonds, Series 2018-A-1, 0% 2027 | 511 | 429 |
| Sales Tax Fncg. Corp., Sales Tax Rev. Restructured Bonds, Capital Appreciation Bonds, Series 2018-A-1, 0% 2029 | 498 | 392 |
| Sales Tax Fncg. Corp., Sales Tax Rev. Restructured Bonds, Capital Appreciation Bonds, Series 2018-A-1, 0% 2031 | 641 | 465 |
| Sales Tax Fncg. Corp., Sales Tax Rev. Restructured Bonds, Capital Appreciation Bonds, Series 2018-A-1, 0% 2033 | 723 | 485 |
| Sales Tax Fncg. Corp., Sales Tax Rev. Restructured Bonds, Capital Appreciation Bonds, Series 2018-A-1, 0% 2046 | 11,000 | 3,217 |
| Sales Tax Fncg. Corp., Sales Tax Rev. Restructured Bonds, Capital Appreciation Bonds, Series 2018-A-1, 0% 2051 | 100,270 | 21,149 |
| Sales Tax Fncg. Corp., Sales Tax Rev. Restructured Bonds, Series 2018-A-1, 4.75% 2053 | 14,201 | 15,130 |
| Sales Tax Fncg. Corp., Sales Tax Rev. Restructured Bonds, Series 2018-A-1, 5.00% 2058 | 48,813 | 52,867 |
| Sales Tax Fncg. Corp., Sales Tax Rev. Restructured Bonds, Series 2019-A-2, 4.329% 2040 | 11,158 | 11,647 |
| Sales Tax Fncg. Corp., Sales Tax Rev. Restructured Bonds, Series 2019-A-2, 4.536% 2053 | 1,022 | 1,074 |
| Sales Tax Fncg. Corp., Sales Tax Rev. Restructured Bonds, Series 2019-A-2, 4.784% 2058 | 25,200 | 26,924 |
| University of Puerto Rico, University System Rev. Bonds, Series 2006-Q, 5.00% 2023 | 1,000 | 985 |
| University of Puerto Rico, University System Rev. Bonds, Series 2006-Q, 5.00% 2024 | 875 | 861 |
| University of Puerto Rico, University System Rev. Bonds, Series 2006-Q, 5.00% 2025 | 675 | 663 |
| University of Puerto Rico, University System Rev. Bonds, Series 2006-Q, 5.00% 2026 | 520 | 510 |
| University of Puerto Rico, University System Rev. Bonds, Series 2006-Q, 5.00% 2030 | 1,269 | 1,244 |
| University of Puerto Rico, University System Rev. Bonds, Series 2006-Q, 5.00% 2036 | 4,055 | 3,974 |
| University of Puerto Rico, University System Rev. Ref. Bonds, Series 2006-P, 5.00% 2021 | 970 | 958 |
American High-Income Municipal Bond Fund — Page 60 of 77
| Bonds, notes & other debt instruments (continued) Puerto Rico (continued) | Principal amount (000) | Value (000) |
| University of Puerto Rico, University System Rev. Ref. Bonds, Series 2006-P, 5.00% 2022 | $2,505 | $2,471 |
| University of Puerto Rico, University System Rev. Ref. Bonds, Series 2006-P, 5.00% 2023 | 5,710 | 5,624 |
| University of Puerto Rico, University System Rev. Ref. Bonds, Series 2006-P, 5.00% 2024 | 4,660 | 4,584 |
| University of Puerto Rico, University System Rev. Ref. Bonds, Series 2006-P, 5.00% 2025 | 470 | 462 |
| University of Puerto Rico, University System Rev. Ref. Bonds, Series 2006-P, 5.00% 2026 | 1,450 | 1,423 |
| University of Puerto Rico, University System Rev. Ref. Bonds, Series 2006-P, 5.00% 2030 | 8,370 | 8,203 |
| University of Puerto Rico, University System Rev. Ref. Bonds, Series 2006-P, National insured, 5.00% 2024 | 50 | 50 |
| University of Puerto Rico, University System Rev. Ref. Bonds, Series 2006-P, National insured, 5.00% 2025 | 105 | 106 |
| University of Puerto Rico, University System Rev. Ref. Bonds, Series 2006-Q, 5.00% 2021 | 760 | 750 |
| University of Puerto Rico, University System Rev. Ref. Bonds, Series 2006-Q, 5.00% 2022 | 60 | 59 |
| 431,168 | ||
| Rhode Island 0.92% | ||
| Commerce Corp., Airport Rev. Bonds, Series 2016-D, 5.00% 2030 | 500 | 572 |
| Commerce Corp., Airport Rev. Bonds, Series 2016-D, 5.00% 2041 | 500 | 553 |
| Health and Educational Building Corp., Hospital Fncg. Rev. Ref. Bonds (Care New England Issue), Series 2016-B, 5.00% 2031 | 11,410 | 11,990 |
| Health and Educational Building Corp., Hospital Fncg. Rev. Ref. Bonds (Care New England Issue), Series 2016-B, 5.00% 2036 | 12,825 | 13,193 |
| Health and Educational Building Corp., Hospital Fncg. Rev. Ref. Bonds (Lifespan Obligated Group Issue), Series 2016, 5.00% 2029 | 1,380 | 1,562 |
| Health and Educational Building Corp., Hospital Fncg. Rev. Ref. Bonds (Lifespan Obligated Group Issue), Series 2016, 5.00% 2034 | 3,150 | 3,490 |
| Housing and Mortgage Fin. Corp., Homeownership Opportunity Bonds, Series 68-C, AMT, 3.50% 2039 | 6,385 | 6,732 |
| Student Loan Auth., Student Loan Program Rev. Bonds, Series 2015-A, AMT, 3.625% 2026 | 1,000 | 1,032 |
| Student Loan Auth., Student Loan Program Rev. Bonds, Series 2017-A, AMT, 3.80% 2031 | 2,065 | 2,068 |
| Student Loan Auth., Student Loan Program Rev. Bonds, Series 2017-A, AMT, 4.00% 2027 | 2,950 | 3,163 |
| Student Loan Auth., Student Loan Program Rev. Bonds, Series 2018-A, AMT, 3.50% 2034 | 8,280 | 8,544 |
| Student Loan Auth., Student Loan Program Rev. Bonds, Series 2019-A, AMT, 2.875% 2035 | 5,000 | 4,953 |
| Tobacco Settlement Fin. Corp., Tobacco Settlement Asset-Backed Bonds, Capital Appreciation Bonds, Series 2007-A, 0% 2052 | 119,630 | 18,230 |
| 76,082 | ||
| South Carolina 2.20% | ||
| Connector 2000 Association Inc., Toll Road Rev. Bonds, Capital Appreciation Bonds, Series 2011-A, 0% 2021 | 74 | 72 |
| Connector 2000 Association Inc., Toll Road Rev. Bonds, Capital Appreciation Bonds, Series 2011-A, 0% 2022 | 556 | 504 |
| Connector 2000 Association Inc., Toll Road Rev. Bonds, Capital Appreciation Bonds, Series 2011-A-1, 0% 2032 | 10,101 | 4,438 |
| Connector 2000 Association Inc., Toll Road Rev. Bonds, Capital Appreciation Bonds, Series 2011-A-1, 0% 2042 | 73,439 | 14,582 |
| Connector 2000 Association Inc., Toll Road Rev. Bonds, Capital Appreciation Bonds, Series 2011-A-1, 0% 2051 | 25 | 2 |
| Housing Fin. and Dev. Auth., Mortgage Rev. Bonds, Series 2016-B-2, AMT, 4.00% 2043 | 1,920 | 2,060 |
| Jobs-Econ. Dev. Auth., Econ. Dev. Rev. Bonds (Custodial Receipts), Series 2018, 5.00% 2036 (preref. 2026)1,2 | 3,000 | 3,803 |
| Jobs-Econ. Dev. Auth., Econ. Dev. Rev. Bonds (Custodial Receipts), Series 2018, 5.00% 2041 (preref. 2026)1,2 | 12,495 | 15,840 |
| Jobs-Econ. Dev. Auth., Econ. Dev. Rev. Bonds (Woodlands at Furman), Series 2020-A, 5.00% 2042 | 585 | 592 |
| Jobs-Econ. Dev. Auth., Econ. Dev. Rev. Bonds (Woodlands at Furman), Series 2020-A, 5.00% 2054 | 1,000 | 998 |
| Jobs-Econ. Dev. Auth., First Mortgage Health Care Facs. Rev. Ref. Bonds (The Lutheran Homes of South Carolina, Inc.), Series 2017, 5.00% 2042 | 1,855 | 1,686 |
| Jobs-Econ. Dev. Auth., Health Facs. Rev. Ref. Bonds (Wesley Commons), Series 2016, 5.00% 20362 | 2,000 | 2,059 |
| Jobs-Econ. Dev. Auth., Health Facs. Rev. Ref. Bonds (Wesley Commons), Series 2016, 5.00% 20412 | 6,000 | 6,114 |
| Jobs-Econ. Dev. Auth., Hospital Facs. Rev. Bonds (Bon Secours Mercy Health, Inc.), Series 2020-A, 4.00% 2044 | 5,000 | 5,804 |
| Jobs-Econ. Dev. Auth., Hospital Rev. Bonds (Prisma Health Obligated Group), Series 2018-A, 5.00% 2048 | 4,500 | 5,223 |
| Jobs-Econ. Dev. Auth., Residential Facs. Rev. Bonds (Episcopal Home Still Hopes), Series 2017, 5.00% 2047 | 4,700 | 4,961 |
| Jobs-Econ. Dev. Auth., Residential Facs. Rev. Bonds (Episcopal Home Still Hopes), Series 2017, 5.00% 2052 | 5,055 | 5,320 |
American High-Income Municipal Bond Fund — Page 61 of 77
| Bonds, notes & other debt instruments (continued) South Carolina (continued) | Principal amount (000) | Value (000) |
| Jobs-Econ. Dev. Auth., Residential Facs. Rev. Ref. Bonds (Episcopal Home Still Hopes), Series 2018-A, 5.00% 2032 | $2,135 | $2,303 |
| Jobs-Econ. Dev. Auth., Residential Facs. Rev. Ref. Bonds (Episcopal Home Still Hopes), Series 2018-A, 5.00% 2038 | 9,035 | 9,647 |
| Jobs-Econ. Dev. Auth., Residential Facs. Rev. Ref. Bonds (Episcopal Home Still Hopes), Series 2018-A, 5.00% 2048 | 3,500 | 3,692 |
| Patriots Energy Group Fncg. Agcy., Gas Supply Rev. Bonds, Series 2018-A, 4.00% 2048 (put 2024) | 5,100 | 5,644 |
| Public Service Auth., Rev. Obligations (Santee Cooper), Series 2011-C, 5.00% 2036 | 6,700 | 7,017 |
| Public Service Auth., Rev. Obligations (Santee Cooper), Series 2012-D, 5.00% 2043 | 6,420 | 6,792 |
| Public Service Auth., Rev. Obligations (Santee Cooper), Series 2013-E, 5.00% 2048 | 2,055 | 2,262 |
| Public Service Auth., Rev. Obligations (Santee Cooper), Series 2014-A, 5.00% 2049 | 1,000 | 1,114 |
| Public Service Auth., Rev. Obligations (Santee Cooper), Series 2014-A, 5.50% 2054 | 2,950 | 3,333 |
| Public Service Auth., Rev. Obligations (Santee Cooper), Series 2014-C, 5.00% 2046 | 100 | 113 |
| Public Service Auth., Rev. Obligations (Santee Cooper), Series 2015-A, 5.00% 2055 | 3,555 | 4,050 |
| Public Service Auth., Rev. Obligations (Santee Cooper), Series 2015-E, 5.25% 2055 | 10,280 | 11,981 |
| Public Service Auth., Rev. Obligations (Santee Cooper), Series 2016-A, 5.00% 2032 | 965 | 1,152 |
| Public Service Auth., Rev. Obligations (Santee Cooper), Series 2016-B, 5.00% 2035 | 250 | 300 |
| Public Service Auth., Rev. Obligations (Santee Cooper), Series 2016-B, 5.00% 2041 | 14,850 | 17,582 |
| Public Service Auth., Rev. Obligations (Santee Cooper), Series 2016-B, 5.00% 2056 | 45 | 53 |
| Public Service Auth., Rev. Ref. Obligations (Santee Cooper), Series 2013-B, 5.125% 2043 | 2,215 | 2,455 |
| Public Service Auth., Rev. Ref. Obligations (Santee Cooper), Series 2014-B, 5.00% 2038 | 3,000 | 3,372 |
| Public Service Auth., Rev. Ref. Obligations (Santee Cooper), Series 2014-C, 5.00% 2039 | 505 | 575 |
| Public Service Auth., Rev. Ref. Obligations (Santee Cooper), Series 2015-A, 5.00% 2034 | 6,275 | 7,453 |
| Public Service Auth., Rev. Ref. Obligations (Santee Cooper), Series 2016-A, 5.00% 2029 | 15 | 18 |
| Public Service Auth., Rev. Ref. Obligations (Santee Cooper), Series 2016-B, 2.75% 2051 (3.00% on 12/1/2022)1 | 15,255 | 15,215 |
| Public Service Auth., Rev. Ref. Obligations (Santee Cooper), Series 2016-C, 5.00% 2031 | 2,010 | 2,444 |
| 182,625 | ||
| South Dakota 0.02% | ||
| Housing Dev. Auth., Homeownership Mortgage Bonds, Series 2014-A, AMT, 4.00% 2044 | 980 | 1,030 |
| Housing Dev. Auth., Homeownership Mortgage Rev. Ref. Bonds, Series 2012-D, AMT, 4.00% 2029 | 335 | 344 |
| 1,374 | ||
| Tennessee 0.14% | ||
| City of Chattanooga, Hospital Auth., Hospital Rev. Ref. Bonds (Erlanger Health System), Series 2014, 5.00% 2039 | 2,815 | 2,915 |
| Housing Dev. Agcy., Residential Fin. Program Bonds, Series 2014-2-A, AMT, 4.00% 2045 | 770 | 817 |
| City of Memphis, Airport Auth., Airport Rev. Ref. Bonds, Series 2011-A-1, AMT, 6.00% 2021 | 1,495 | 1,564 |
| City of Memphis, Airport Auth., Airport Rev. Ref. Bonds, Series 2011-A-1, AMT, 6.00% 2022 | 1,000 | 1,047 |
| Metropolitan Dev. and Housing Agcy., Tennessee Tax Increment Rev. Bonds (Fifth & Broadway Dev. Project), Series 2018, 5.125% 20362 | 750 | 787 |
| County of Shelby, Health, Educational and Housing Fac. Board, Residential Care Fac. Mortgage Rev. Ref. Bonds (Village at Germantown), Series 2012, 5.375% 2047 | 1,735 | 1,753 |
| County of Shelby, Health, Educational and Housing Fac. Board, Rev. Bonds (Farms at Bailey Station), Series 2019-A, 5.75% 2059 | 3,000 | 2,935 |
| 11,818 | ||
| Texas 5.40% | ||
| Arlington Higher Education Fin. Corp., Education Rev. Bonds (KIPP Texas, Inc.), Series 2019, 4.00% 2035 | 1,500 | 1,821 |
| Arlington Higher Education Fin. Corp., Education Rev. Bonds (KIPP Texas, Inc.), Series 2019, 4.00% 2036 | 1,690 | 2,042 |
| Arlington Higher Education Fin. Corp., Education Rev. Bonds (UME Preparatory Academy), Series 2017-A, 5.00% 2038 | 1,000 | 1,048 |
| Arlington Higher Education Fin. Corp., Education Rev. Bonds (UME Preparatory Academy), Series 2017-A, 5.00% 2048 | 2,685 | 2,772 |
American High-Income Municipal Bond Fund — Page 62 of 77
| Bonds, notes & other debt instruments (continued) Texas (continued) | Principal amount (000) | Value (000) |
| Arlington Higher Education Fin. Corp., Education Rev. Bonds (UME Preparatory Academy), Series 2017-A, 5.00% 2053 | $1,375 | $1,415 |
| Arlington Higher Education Fin. Corp., Education Rev. Bonds (Uplift Education), Series 2016-A, 2.75% 2026 | 2,320 | 2,350 |
| Arlington Higher Education Fin. Corp., Education Rev. Bonds (Uplift Education), Series 2016-A, 5.00% 2036 | 3,370 | 3,781 |
| Arlington Higher Education Fin. Corp., Education Rev. Bonds (Uplift Education), Series 2016-A, 5.00% 2046 | 3,745 | 4,128 |
| Arlington Higher Education Fin. Corp., Education Rev. Bonds (Uplift Education), Series 2016-A, 5.00% 2051 | 4,100 | 4,506 |
| County of Brazoria, Industrial Dev. Corp., Solid Waste Disposal Facs. Rev. Bonds (Gladieux Metals Recycling, LLC Project), Series 2020, 8.50% 20392 | 16,500 | 16,911 |
| Brazos Higher Education Auth., Inc., Student Loan Program Rev. Bonds, Series 2020-1-A, AMT, 2.35% 2040 | 2,300 | 2,270 |
| Brazos Higher Education Auth., Inc., Student Loan Program Rev. Bonds, Series 2020-1-B, AMT, 3.00% 2040 | 1,800 | 1,731 |
| Central Texas Regional Mobility Auth., Rev. Bonds, Series 2011, 6.00% 2041 (preref. 2021) | 2,000 | 2,048 |
| Clifton Higher Education Fin. Corp., Education Rev. Bonds (Idea Public Schools), Series 2012, 5.00% 2032 | 2,400 | 2,555 |
| Clifton Higher Education Fin. Corp., Education Rev. Bonds (Idea Public Schools), Series 2013, 6.00% 2033 | 1,000 | 1,130 |
| Clifton Higher Education Fin. Corp., Education Rev. Bonds (Idea Public Schools), Series 2016-B, 5.00% 2028 | 500 | 597 |
| City of Decatur, Hospital Auth., Hospital Rev. Bonds (Wise Regional Health System), Series 2014-A, 5.00% 2034 | 1,850 | 2,033 |
| City of Decatur, Hospital Auth., Hospital Rev. Bonds (Wise Regional Health System), Series 2014-A, 5.25% 2044 | 4,200 | 4,555 |
| County of Fort Bend, Industrial Dev. Corp., Industrial Dev. Rev. Bonds (NRG Energy, Inc. Project), Series 2012-A, 4.75% 2038 | 4,500 | 4,680 |
| County of Fort Bend, Industrial Dev. Corp., Industrial Dev. Rev. Bonds (NRG Energy, Inc. Project), Series 2012-B, 4.75% 2042 | 5,000 | 5,173 |
| Grand Parkway Transportation Corp., Grand Parkway System Toll Rev. Ref. Bonds, Series 2020-C, 4.00% 2049 | 15,220 | 17,993 |
| County of Gregg, Health Facs. Dev. Corp., Hospital Rev. Bonds (Good Shepherd Health System Obligated Group), Series 2012-C, 3.82% 2025 (preref. 2022) | 530 | 560 |
| County of Gregg, Health Facs. Dev. Corp., Hospital Rev. Bonds (Good Shepherd Health System Obligated Group), Series 2012-C, 5.00% 2032 (preref. 2022) | 925 | 1,007 |
| Gulf Coast Industrial Dev. Auth., Solid Waste Disposal Rev. Bonds (CITGO Petroleum Corp. Project), Series 1995, AMT, 4.875% 2025 | 6,465 | 6,537 |
| County of Harris, Cultural Education Facs. Fin. Corp., First Mortgage Rev. Bonds (Brazos Presbyterian Homes, Inc. Project), Series 2013-A, 5.00% 2033 | 275 | 281 |
| County of Harris, Cultural Education Facs. Fin. Corp., First Mortgage Rev. Bonds (Brazos Presbyterian Homes, Inc. Project), Series 2013-A, 5.00% 2038 | 510 | 519 |
| County of Harris, Cultural Education Facs. Fin. Corp., First Mortgage Rev. Bonds (Brazos Presbyterian Homes, Inc. Project), Series 2013-A, 5.00% 2043 | 1,240 | 1,257 |
| County of Harris, Cultural Education Facs. Fin. Corp., First Mortgage Rev. Bonds (Brazos Presbyterian Homes, Inc. Project), Series 2016, 5.00% 2037 | 2,960 | 3,098 |
| County of Harris, Cultural Education Facs. Fin. Corp., First Mortgage Rev. Bonds (Brazos Presbyterian Homes, Inc. Project), Series 2016, 5.00% 2048 | 22,705 | 23,368 |
| County of Harris, Cultural Education Facs. Fin. Corp., Rev. Ref. Bonds (Young Men’s Christian Assn. of the Greater Houston Area), Series 2013-A, 5.00% 2033 | 1,400 | 1,447 |
| County of Harris, Cultural Education Facs. Fin. Corp., Rev. Ref. Bonds (Young Men’s Christian Assn. of the Greater Houston Area), Series 2013-A, 5.00% 2038 | 3,500 | 3,591 |
| County of Harris, Sports Auth., Rev. Ref. Bonds, Capital Appreciation Bonds, Series 2014-A, 0% 2042 | 1,000 | 425 |
| County of Harris, Sports Auth., Rev. Ref. Bonds, Capital Appreciation Bonds, Series 2014-A, 0% 2050 | 1,500 | 414 |
| County of Harris, Sports Auth., Rev. Ref. Bonds, Series 2014-A, Assured Guaranty Municipal insured, 5.00% 2053 | 1,000 | 1,019 |
| Dept. of Housing and Community Affairs, Single Family Mortgage Rev. Bonds, Series 2018-A, 4.75% 2049 | 3,740 | 4,209 |
| City of Houston, Airport System Special Facs. Rev. Bonds (Continental Airlines, Inc. Terminal Improvement Projects), Series 2011, AMT, 6.50% 2030 | 12,500 | 12,759 |
| City of Houston, Airport System Special Facs. Rev. Bonds (Continental Airlines, Inc. Terminal Improvement Projects), Series 2011, AMT, 6.625% 2038 | 3,000 | 3,052 |
| City of Houston, Airport System Special Facs. Rev. Bonds (United Airlines, Inc. Terminal Improvement Projects), Series 2018-C, AMT, 5.00% 2028 | 15,000 | 15,656 |
American High-Income Municipal Bond Fund — Page 63 of 77
| Bonds, notes & other debt instruments (continued) Texas (continued) | Principal amount (000) | Value (000) |
| City of Houston, Airport System Special Facs. Rev. Ref. Bonds (United Airlines, Inc. Terminal E Project), Series 2014, AMT, 4.75% 2024 | $13,000 | $13,247 |
| City of Houston, Airport System Special Facs. Rev. Ref. Bonds (United Airlines, Inc. Terminal E Project), Series 2014, AMT, 5.00% 2029 | 6,775 | 6,971 |
| City of Houston, Airport System Special Facs. Rev. Ref. Bonds (United Airlines, Inc. Terminal Improvement Projects), Series 2015-B-1, AMT, 5.00% 2030 | 3,000 | 3,097 |
| City of Houston, Airport System Special Facs. Rev. Ref. Bonds (United Airlines, Inc. Terminal Improvement Projects), Series 2020-A, AMT, 5.00% 2027 | 2,000 | 2,095 |
| City of Houston, Airport System Special Facs. Rev. Ref. Bonds (United Airlines, Inc. Terminal Improvement Projects), Series 2020-B-2, AMT, 5.00% 2027 | 2,750 | 2,881 |
| City of Houston, Airport System Special Facs. Rev. Ref. Bonds (United Airlines, Inc. Terminal Improvement Projects), Series 2020-C, AMT, 5.00% 2027 | 8,800 | 9,070 |
| City of Houston, Combined Utility System Rev. Ref. Bonds, Series 2014-C, 5.00% 2025 | 1,670 | 1,964 |
| City of Houston, Combined Utility System Rev. Ref. Bonds, Series 2018-C, (1-month USD-LIBOR x 0.70 + 0.36%) 0.476% 2034 (put 2021)3 | 3,500 | 3,490 |
| City of Irving, Hospital Auth., Hospital Rev. Bonds (Baylor Scott & White Medical Center - Irving), Series 2017-A, 5.00% 2033 | 1,000 | 1,187 |
| City of Irving, Hospital Auth., Hospital Rev. Bonds (Baylor Scott & White Medical Center - Irving), Series 2017-A, 5.00% 2044 | 1,000 | 1,144 |
| City of Irving, Hospital Auth., Hospital Rev. Bonds (Baylor Scott & White Medical Center - Irving), Series 2017-B, (SIFMA Municipal Swap Index + 1.11%) 1.26% 2044 (put 2023)3 | 1,500 | 1,465 |
| County of Jefferson, Port of Beaumont Navigation Dist., Dock and Warf Fac. Rev. Bonds (Jefferson Gulf Coast Energy Project), Series 2020-A, 3.625% 20352 | 2,095 | 2,094 |
| County of Jefferson, Port of Beaumont Navigation Dist., Dock and Warf Fac. Rev. Bonds (Jefferson Gulf Coast Energy Project), Series 2020-A, 4.00% 20502 | 3,955 | 3,974 |
| City of Kerrville, Health Facs. Dev. Corp., Hospital Rev. Bonds (Peterson Regional Medical Center Project), Series 2015, 5.00% 2024 | 1,000 | 1,159 |
| City of Kerrville, Health Facs. Dev. Corp., Hospital Rev. Bonds (Peterson Regional Medical Center Project), Series 2015, 5.00% 2025 | 1,000 | 1,187 |
| City of Kerrville, Health Facs. Dev. Corp., Hospital Rev. Bonds (Peterson Regional Medical Center Project), Series 2015, 5.00% 2030 | 3,450 | 4,014 |
| County of Matagorda, Navigation Dist. No. 1, Pollution Control Rev. Ref. Bonds (AEP Texas Central Co. Project), Series 2005-A, AMBAC insured, 4.40% 2030 | 4,500 | 5,379 |
| County of Matagorda, Navigation Dist. No. 1, Rev. Ref. Bonds (Houston Lighting & Power Co. Project), Series 1997, AMT, AMBAC insured, 5.125% 2028 | 1,800 | 2,291 |
| Mission Econ. Dev. Corp., Rev. Bonds (Natgasoline Project), Series 2018, AMT, 4.625% 20312 | 2,000 | 2,123 |
| Mission Econ. Dev. Corp., Solid Waste Disposal Rev. Bonds (Waste Management, Inc. Project), Series 2020-A, AMT, 0.40% 2046 (put 2020) | 2,000 | 2,000 |
| Municipal Gas Acquisition and Supply Corp. II, Gas Supply Rev. Bonds, Series 2007-B, (SIFMA Municipal Swap Index + 0.55%) 0.71% 20273 | 2,620 | 2,563 |
| New Hope Cultural Education Facs. Fin. Corp., Capital Improvement Rev. Bonds (CHF-Collegiate Housing Denton, LLC - Texas Woman’s University Housing Project), Series 2018-A-1, Assured Guaranty Municipal insured, 5.00% 2058 | 1,650 | 1,883 |
| New Hope Cultural Education Facs. Fin. Corp., Education Rev. Bonds (Beta Foundation), Series 2019-A, 3.375% 20292 | 510 | 508 |
| New Hope Cultural Education Facs. Fin. Corp., Education Rev. Bonds (Beta Foundation), Series 2019-A, 5.00% 20392 | 550 | 572 |
| New Hope Cultural Education Facs. Fin. Corp., Education Rev. Bonds (Beta Foundation), Series 2019-A, 5.00% 20492 | 1,270 | 1,310 |
| New Hope Cultural Education Facs. Fin. Corp., Retirement Fac. Rev. Bonds (Morningside Ministries Project), Series 2020-A, 5.00% 2030 | 1,000 | 1,060 |
| New Hope Cultural Education Facs. Fin. Corp., Retirement Fac. Rev. Bonds (Morningside Ministries Project), Series 2020-A, 5.00% 2035 | 500 | 521 |
| New Hope Cultural Education Facs. Fin. Corp., Retirement Fac. Rev. Bonds (Morningside Ministries Project), Series 2020-A, 5.00% 2040 | 790 | 815 |
American High-Income Municipal Bond Fund — Page 64 of 77
| Bonds, notes & other debt instruments (continued) Texas (continued) | Principal amount (000) | Value (000) |
| New Hope Cultural Education Facs. Fin. Corp., Retirement Fac. Rev. Bonds (Morningside Ministries Project), Series 2020-A, 5.00% 2055 | $6,100 | $6,166 |
| New Hope Cultural Education Facs. Fin. Corp., Retirement Fac. Rev. Bonds (MRC Crestview Project), Series 2016, 5.00% 2031 | 1,170 | 1,240 |
| New Hope Cultural Education Facs. Fin. Corp., Retirement Fac. Rev. Bonds (MRC Crestview Project), Series 2016, 5.00% 2046 | 4,350 | 4,465 |
| New Hope Cultural Education Facs. Fin. Corp., Retirement Fac. Rev. Bonds (Wesleyan Homes, Inc. Project), Series 2014, 5.50% 2035 | 100 | 103 |
| New Hope Cultural Education Facs. Fin. Corp., Retirement Fac. Rev. Bonds (Wesleyan Homes, Inc. Project), Series 2014, 5.50% 2043 | 3,700 | 3,758 |
| New Hope Cultural Education Facs. Fin. Corp., Retirement Fac. Rev. Bonds (Wesleyan Homes, Inc. Project), Series 2014, 5.50% 2049 | 8,430 | 8,531 |
| New Hope Cultural Education Facs. Fin. Corp., Retirement Fac. Rev. Bonds (Wesleyan Homes, Inc.), Series 2019, 5.00% 2039 | 1,000 | 1,003 |
| New Hope Cultural Education Facs. Fin. Corp., Retirement Fac. Rev. Bonds (Wesleyan Homes, Inc.), Series 2019, 5.00% 2050 | 1,180 | 1,145 |
| New Hope Cultural Education Facs. Fin. Corp., Retirement Fac. Rev. Bonds (Wesleyan Homes, Inc.), Series 2019, 5.00% 2055 | 4,000 | 3,811 |
| New Hope Cultural Education Facs. Fin. Corp., Retirement Fac. Rev. Bonds (Westminster Project), Series 2016, 5.00% 2025 | 350 | 383 |
| New Hope Cultural Education Facs. Fin. Corp., Retirement Fac. Rev. Bonds (Westminster Project), Series 2016, 5.00% 2026 | 330 | 361 |
| New Hope Cultural Education Facs. Fin. Corp., Retirement Fac. Rev. Bonds (Westminster Project), Series 2016, 5.00% 2031 | 1,410 | 1,523 |
| New Hope Cultural Education Facs. Fin. Corp., Retirement Fac. Rev. Bonds (Westminster Project), Series 2016, 5.00% 2040 | 4,900 | 5,190 |
| New Hope Cultural Education Facs. Fin. Corp., Student Housing Rev. Bonds (CHF-Collegiate Housing Corpus Christi II, LLC - Texas A&M University-Corpus Christi Project), Series 2016-A, 5.00% 2036 | 3,030 | 2,921 |
| New Hope Cultural Education Facs. Fin. Corp., Student Housing Rev. Bonds (CHF-Collegiate Housing Island Campus, LLC - Texas A&M University-Corpus Christi Island Campus Project), Series 2017-A, 5.00% 2031 | 845 | 860 |
| New Hope Cultural Education Facs. Fin. Corp., Student Housing Rev. Bonds (CHF-Collegiate Housing Island Campus, LLC - Texas A&M University-Corpus Christi Island Campus Project), Series 2017-A, 5.00% 2032 | 855 | 865 |
| New Hope Cultural Education Facs. Fin. Corp., Student Housing Rev. Bonds (CHF-Collegiate Housing Island Campus, LLC - Texas A&M University-Corpus Christi Island Campus Project), Series 2017-A, 5.00% 2037 | 6,310 | 6,320 |
| New Hope Cultural Education Facs. Fin. Corp., Student Housing Rev. Bonds (CHF-Collegiate Housing Island Campus, LLC - Texas A&M University-Corpus Christi Island Campus Project), Series 2017-A, 5.00% 2042 | 8,405 | 8,252 |
| New Hope Cultural Education Facs. Fin. Corp., Student Housing Rev. Bonds (CHF-Collegiate Housing Stephenville II, LLC - Tarleton State University Project), Series 2014-A, 5.00% 2039 | 2,250 | 2,579 |
| New Hope Cultural Education Facs. Fin. Corp., Student Housing Rev. Bonds (CHF-Collegiate Housing Stephenville II, LLC - Tarleton State University Project), Series 2014-A, 5.00% 2046 | 5,600 | 6,420 |
| New Hope Cultural Education Facs. Fin. Corp., Student Housing Rev. Bonds (CHF-Collegiate Housing Stephenville III, LLC - Tarleton State University Project), Series 2015-A, 5.00% 2035 (preref. 2025) | 1,800 | 2,131 |
| New Hope Cultural Education Facs. Fin. Corp., Student Housing Rev. Bonds (CHF-Collegiate Housing Corpus Christi II, LLC - Texas A&M University-Corpus Christi Project), Series 2016-A, 5.00% 2031 | 330 | 327 |
| Newark Higher Education Fin. Corp., Education Rev. Bonds (Austin Achieve Public School, Inc.), Series 2017-A, 5.00% 2032 | 750 | 772 |
| Newark Higher Education Fin. Corp., Education Rev. Bonds (Austin Achieve Public School, Inc.), Series 2017-A, 5.00% 2037 | 600 | 615 |
| Newark Higher Education Fin. Corp., Education Rev. Bonds (Austin Achieve Public School, Inc.), Series 2017-A, 5.00% 2042 | 1,000 | 1,021 |
| Newark Higher Education Fin. Corp., Education Rev. Bonds (Austin Achieve Public School, Inc.), Series 2017-A, 5.25% 2048 | 3,460 | 3,541 |
| Newark Higher Education Fin. Corp., Education Rev. Bonds (Austin Achieve Public School, Inc.), Series 2018, 5.00% 2048 | 450 | 458 |
| North Texas Tollway Auth., System Rev. and Rev. Ref. Bonds, Series 2017-A, 5.00% 2039 | 10,000 | 12,237 |
American High-Income Municipal Bond Fund — Page 65 of 77
| Bonds, notes & other debt instruments (continued) Texas (continued) | Principal amount (000) | Value (000) |
| North Texas Tollway Auth., System Rev. Ref. Bonds, Series 2010, 6.00% 2034 (preref. 2021) | $1,525 | $1,561 |
| North Texas Tollway Auth., System Rev. Ref. Bonds, Series 2015-A, 5.00% 2034 | 2,000 | 2,310 |
| North Texas Tollway Auth., System Rev. Ref. Bonds, Series 2015-A, 5.00% 2035 | 1,000 | 1,153 |
| North Texas Tollway Auth., System Rev. Ref. Bonds, Series 2015-A, 5.00% 2038 | 1,000 | 1,146 |
| Red River Education Fin. Corp., Higher Education Rev. Bonds (St. Edward’s University Project), Series 2016, 4.00% 2036 | 500 | 521 |
| Red River Health Facs. Dev. Corp., Retirement Fac. Rev. Bonds (MRC The Crossings Project), Series 2014-A, 7.75% 2044 | 1,815 | 1,947 |
| Red River Health Facs. Dev. Corp., Retirement Fac. Rev. Bonds (MRC The Crossings Project), Series 2014-A, 8.00% 2049 | 3,355 | 3,620 |
| SA Energy Acquisition Public Fac. Corp., Gas Supply Rev. Bonds, Series 2007, 5.50% 2020 | 1,000 | 1,000 |
| SA Energy Acquisition Public Fac. Corp., Gas Supply Rev. Bonds, Series 2007, 5.50% 2027 | 1,360 | 1,730 |
| Sam Rayburn Municipal Power Agcy., Power Supply System Rev. Ref. Bonds, Series 2012, 5.00% 2021 | 2,875 | 3,024 |
| City of Sanger, Industrial Dev. Corp., Industrial Dev. Rev. Ref. Bonds (Texas Pellets Project), Series 2012-B, AMT, 8.00% 20385 | 3,110 | 778 |
| County of Tarrant, Cultural Education Facs. Fin. Corp. Retirement Facs., Rev. Ref. Bonds (Northwest Senior Housing Corp. Edgemere Project), Series 2015-A, 5.00% 2045 | 1,100 | 893 |
| County of Tarrant, Cultural Education Facs. Fin. Corp., Retirement Fac. Rev. Bonds (Air Force Villages Obligated Group), Series 2016, 4.00% 2027 | 12,615 | 12,350 |
| County of Tarrant, Cultural Education Facs. Fin. Corp., Retirement Fac. Rev. Bonds (Air Force Villages Obligated Group), Series 2016, 4.00% 2031 | 5,500 | 5,204 |
| County of Tarrant, Cultural Education Facs. Fin. Corp., Retirement Fac. Rev. Bonds (Air Force Villages Obligated Group), Series 2016, 5.00% 2037 | 5,750 | 5,906 |
| County of Tarrant, Cultural Education Facs. Fin. Corp., Retirement Fac. Rev. Bonds (Air Force Villages Obligated Group), Series 2016, 5.00% 2045 | 13,490 | 13,671 |
| County of Tarrant, Cultural Education Facs. Fin. Corp., Retirement Fac. Rev. Bonds (Barton Creek Senior Living Center, Inc. - Querencia Project), Series 2015, 5.00% 2030 | 1,650 | 1,747 |
| County of Tarrant, Cultural Education Facs. Fin. Corp., Retirement Fac. Rev. Bonds (Barton Creek Senior Living Center, Inc. - Querencia Project), Series 2015, 5.00% 2035 | 200 | 209 |
| County of Tarrant, Cultural Education Facs. Fin. Corp., Retirement Fac. Rev. Bonds (Barton Creek Senior Living Center, Inc. - Querencia Project), Series 2015, 5.00% 2040 | 1,635 | 1,689 |
| County of Tarrant, Cultural Education Facs. Fin. Corp., Retirement Fac. Rev. Bonds (Buckingham Senior Living Community, Inc. Project), Series 2007, 5.75% 20375 | 7,170 | 4,661 |
| County of Tarrant, Cultural Education Facs. Fin. Corp., Retirement Fac. Rev. Bonds (Northwest Senior Housing Corp.), Series 2017, 5.25% 2047 | 3,180 | 2,654 |
| County of Tarrant, Cultural Education Facs. Fin. Corp., Retirement Fac. Rev. Ref. Bonds (Buckingham Senior Living Project), Series 2015-A, 5.25% 20355 | 900 | 585 |
| County of Tarrant, Cultural Education Facs. Fin. Corp., Retirement Fac. Rev. Ref. Bonds (Buckingham Senior Living Project), Series 2015-A, 5.50% 20455 | 625 | 406 |
| County of Tarrant, Cultural Education Facs. Fin. Corp., Rev. Ref. Bonds (Trinity Terrace Project), Series 2015-B, 5.00% 2036 | 1,000 | 871 |
| Transportation Commission, Central Texas Turnpike System Rev. Ref. Bonds, Series 2015-C, 5.00% 2030 | 2,000 | 2,244 |
| Transportation Commission, Central Texas Turnpike System Rev. Ref. Bonds, Series 2015-C, 5.00% 2032 | 5,000 | 5,573 |
| Transportation Commission, Central Texas Turnpike System Rev. Ref. Bonds, Series 2015-C, 5.00% 2037 | 5,000 | 5,516 |
| Transportation Commission, State Highway 249 System First Tier Toll Rev. Bonds, Capital Appreciation Bonds, Series 2019-A, 0% 2041 | 430 | 176 |
| Transportation Commission, State Highway 249 System First Tier Toll Rev. Bonds, Capital Appreciation Bonds, Series 2019-A, 0% 2042 | 2,370 | 920 |
| County of Travis, Health Facs. Dev. Corp., Rev. Bonds (Westminster Manor Project), Series 2010, 7.00% 2030 | 160 | 162 |
| County of Travis, Health Facs. Dev. Corp., Rev. Bonds (Westminster Manor Project), Series 2010, 7.125% 2040 (preref. 2020) | 3,750 | 3,812 |
| Turnpike Auth., Central Texas Turnpike System, Rev. Bonds, Capital Appreciation Bonds, Series 2002-A, AMBAC insured, 0% 2028 | 17,800 | 15,784 |
American High-Income Municipal Bond Fund — Page 66 of 77
| Bonds, notes & other debt instruments (continued) Texas (continued) | Principal amount (000) | Value (000) |
| Turnpike Auth., Central Texas Turnpike System, Rev. Bonds, Capital Appreciation Bonds, Series 2002-A, AMBAC insured, 0% 2029 | $10,500 | $9,083 |
| County of Wood, Central Hospital Dist., Hospital Rev. Bonds (East Texas Medical Center Quitman Project), Series 2011, 6.00% 2041 (preref. 2021) | 2,870 | 3,071 |
| 447,777 | ||
| United States 0.12% | ||
| Freddie Mac, Multi Family Certificates, Series 2010-M-024, AMT, 2.304% 2027 | 2,960 | 3,188 |
| Freddie Mac, Multi Family Mortgage Bonds, Series 2019-ML-05, Class AUS, 3.40% 2036 | 2,109 | 2,451 |
| Freddie Mac, Multi Family Mortgage Bonds, Series 2019-ML-06, Class XUS, 1.132% 20372 | 61,974 | 3,894 |
| 9,533 | ||
| Utah 0.41% | ||
| Charter School Fin. Auth., Charter School Rev. Ref. Bonds (Early Light Academy), Series 2017, 5.00% 20462 | 7,405 | 7,571 |
| Hideout Local Dist. No. 1, Special Assessment Bonds, Series 2017, 6.75% 20372 | 26,595 | 25,976 |
| 33,547 | ||
| Vermont 0.29% | ||
| Econ. Dev. Auth., Solid Waste Disposal Rev. Bonds (Casella Waste Systems, Inc. Project), Series 2013, AMT, 4.625% 2036 (put 2028)2 | 250 | 274 |
| Student Assistance Corp., Education Loan Rev. Bonds, Series 2017-A, AMT, 3.75% 2028 | 1,995 | 2,164 |
| Student Assistance Corp., Education Loan Rev. Bonds, Series 2017-A, AMT, 4.00% 2029 | 2,330 | 2,547 |
| Student Assistance Corp., Education Loan Rev. Bonds, Series 2017-A, AMT, 4.00% 2030 | 1,335 | 1,451 |
| Student Assistance Corp., Education Loan Rev. Bonds, Series 2017-A, AMT, 4.00% 2031 | 730 | 788 |
| Student Assistance Corp., Education Loan Rev. Bonds, Series 2017-A, AMT, 4.00% 2032 | 400 | 429 |
| Student Assistance Corp., Education Loan Rev. Bonds, Series 2018-A, AMT, 3.625% 2029 | 835 | 895 |
| Student Assistance Corp., Education Loan Rev. Bonds, Series 2018-A, AMT, 3.75% 2030 | 660 | 703 |
| Student Assistance Corp., Education Loan Rev. Bonds, Series 2018-A, AMT, 4.00% 2031 | 420 | 451 |
| Student Assistance Corp., Education Loan Rev. Bonds, Series 2018-A, AMT, 4.00% 2032 | 335 | 358 |
| Student Assistance Corp., Education Loan Rev. Bonds, Series 2018-A, AMT, 4.375% 2046 | 1,850 | 1,921 |
| Student Assistance Corp., Education Loan Rev. Bonds, Series 2018-A, AMT, 5.00% 2025 | 300 | 346 |
| Student Assistance Corp., Education Loan Rev. Bonds, Series 2018-A, AMT, 5.00% 2026 | 500 | 586 |
| Student Assistance Corp., Education Loan Rev. Bonds, Series 2018-A, AMT, 5.00% 2027 | 300 | 349 |
| Student Assistance Corp., Education Loan Rev. Bonds, Series 2018-A, AMT, 5.00% 2028 | 500 | 579 |
| Student Assistance Corp., Education Loan Rev. Bonds, Series 2019-A, AMT, 3.00% 2035 | 8,275 | 8,306 |
| Student Assistance Corp., Education Loan Rev. Bonds, Series 2019-B, AMT, 4.00% 2047 | 2,150 | 2,197 |
| 24,344 | ||
| Virgin Islands 0.01% | ||
| Public Fin. Auth., Rev. Bonds (Matching Fund Loan Note - Diageo Project), Series 2009-A, 6.625% 2029 | 1,250 | 1,207 |
| Virginia 2.74% | ||
| City of Alexandria, Industrial Dev. Auth., Demand Rev. Ref. Bonds (Goodwin House), Series 2015, 5.00% 2045 | 3,000 | 3,194 |
| County of Arlington, Industrial Dev. Auth., Hospital Rev. Bonds (Virginia Hospital Center), Series 2020, 4.00% 2045 | 1,665 | 1,945 |
| County of Botetourt, Industrial Dev. Auth., Residential Care Fac. Rev. Ref. Bonds (Glebe, Inc.), Series 2014-A, 6.00% 2044 | 4,000 | 4,093 |
| City of Chesapeake, Chesapeake Transportation System Toll Road Rev. Ref. Bonds, Convertible Capital Appreciation Bonds, Series 2012-B, 0% 2040 (4.875% on 7/15/2023)1 | 1,500 | 1,439 |
| County of Fairfax, Econ. Dev. Auth., Residential Care Facs. Mortgage Rev. Ref. Bonds (Goodwin House Inc.), Series 2016-A, 5.00% 2036 | 1,000 | 1,083 |
| County of Fairfax, Mosaic Dist. Community Dev. Auth., Rev. Bonds, Series 2011-A, 6.875% 2036 | 1,210 | 1,231 |
| Town of Farmville, Industrial Dev. Auth., Educational Facs. Rev. Ref. Bonds (Longwood University Student Housing Project), Series 2018-A, 5.00% 2038 | 3,250 | 3,565 |
American High-Income Municipal Bond Fund — Page 67 of 77
| Bonds, notes & other debt instruments (continued) Virginia (continued) | Principal amount (000) | Value (000) |
| Town of Farmville, Industrial Dev. Auth., Educational Facs. Rev. Ref. Bonds (Longwood University Student Housing Project), Series 2018-A, 5.00% 2043 | $3,500 | $3,792 |
| Town of Farmville, Industrial Dev. Auth., Educational Facs. Rev. Ref. Bonds (Longwood University Student Housing Project), Series 2018-A, 5.00% 2048 | 4,000 | 4,310 |
| Town of Farmville, Industrial Dev. Auth., Educational Facs. Rev. Ref. Bonds (Longwood University Student Housing Project), Series 2018-A, 5.00% 2055 | 18,305 | 19,628 |
| Town of Farmville, Industrial Dev. Auth., Educational Facs. Rev. Ref. Bonds (Longwood University Student Housing Project), Series 2020-A, 5.00% 2040 | 3,660 | 4,042 |
| Town of Farmville, Industrial Dev. Auth., Educational Facs. Rev. Ref. Bonds (Longwood University Student Housing Project), Series 2020-A, 5.00% 2050 | 10,000 | 10,871 |
| Town of Farmville, Industrial Dev. Auth., Educational Facs. Rev. Ref. Bonds (Longwood University Student Housing Project), Series 2020-A, 5.00% 2059 | 14,840 | 15,943 |
| County of Hanover, Econ. Dev. Auth., Residential Care Fac. Rev. Ref. Bonds (Covenant Woods), Series 2012-A, 5.00% 2042 | 6,050 | 6,088 |
| County of Hanover, Econ. Dev. Auth., Residential Care Fac. Rev. Ref. Bonds (Covenant Woods), Series 2018, 5.00% 2048 | 1,400 | 1,420 |
| County of Hanover, Econ. Dev. Auth., Residential Care Fac. Rev. Ref. Bonds (Covenant Woods), Series 2018, 5.00% 2051 | 4,700 | 4,757 |
| County of Henrico, Econ. Dev. Auth., Residential Care Fac. Rev. Bonds (Pinnacle Living), Series 2019-A, 5.00% 2034 | 1,000 | 1,039 |
| County of Henrico, Econ. Dev. Auth., Residential Care Fac. Rev. Bonds (Pinnacle Living), Series 2019-A, 5.00% 2039 | 5,970 | 6,117 |
| County of Henrico, Econ. Dev. Auth., Residential Care Fac. Rev. Bonds (Pinnacle Living), Series 2019-A, 5.00% 2044 | 2,045 | 2,074 |
| County of Henrico, Econ. Dev. Auth., Residential Care Fac. Rev. Bonds (Pinnacle Living), Series 2019-A, 5.00% 2049 | 4,070 | 4,109 |
| County of Henrico, Econ. Dev. Auth., Residential Care Fac. Rev. Bonds (Pinnacle Living), Series 2019-A, 5.00% 2052 | 1,970 | 1,985 |
| County of Henrico, Econ. Dev. Auth., Residential Care Fac. Rev. Ref. Bonds (LifeSpire of Virginia), Series 2017-C, 5.00% 2037 | 1,445 | 1,493 |
| County of Henrico, Econ. Dev. Auth., Residential Care Fac. Rev. Ref. Bonds (LifeSpire of Virginia), Series 2017-C, 5.00% 2047 | 16,035 | 16,270 |
| City of Newport News, Econ. Dev. Auth., Residential Care Facs. Rev. Ref. Bonds (LifeSpire of Virginia), Series 2016, 3.50% 2029 | 750 | 689 |
| City of Newport News, Econ. Dev. Auth., Residential Care Facs. Rev. Ref. Bonds (LifeSpire of Virginia), Series 2016, 5.00% 2038 | 10,365 | 10,456 |
| City of Newport News, Industrial Dev. Auth., Health Systems Rev. Bonds, Series 2017-A, 5.00% 20462 | 9,250 | 10,510 |
| City of Newport News, Industrial Dev. Auth., Health Systems Rev. Ref. Bonds (Custodial Receipts), Series 2015, 5.33% 20452 | 27,900 | 31,116 |
| City of Norfolk, Redev. and Housing Auth., Rev. Bonds (Fort Norfolk Retirement Community Inc. - Harbor’s Edge Project), Series 2019-A, 5.00% 2049 | 3,875 | 3,974 |
| City of Norfolk, Redev. and Housing Auth., Rev. Bonds (Fort Norfolk Retirement Community Inc. - Harbor’s Edge Project), Series 2019-A, 5.25% 2054 | 8,000 | 8,303 |
| County of Prince William, Heritage Hunt Commercial Community Dev. Auth., Special Assessment Bonds, Series 1999-B, 7.00% 2029 | 327 | 327 |
| Small Business Fncg. Auth., Health Facs. Rev. Bonds (Bon Secours Mercy Health, Inc.), Series 2020-A, 4.00% 2049 | 2,800 | 3,228 |
| Small Business Fncg. Auth., Private Activity Rev. Bonds (Transform 66 P3 Project), Series 2017, AMT, 5.00% 2049 | 2,000 | 2,250 |
| Small Business Fncg. Auth., Private Activity Rev. Bonds (Transform 66 P3 Project), Series 2017, AMT, 5.00% 2052 | 7,000 | 7,853 |
| Small Business Fncg. Auth., Residential Care Fac. Rev. Bonds (Pinnacle Living), Series 2017-C, 5.00% 2032 | 1,425 | 1,470 |
| Small Business Fncg. Auth., Residential Care Fac. Rev. Bonds (Pinnacle Living), Series 2017-C, 5.00% 2037 | 4,075 | 4,155 |
| Small Business Fncg. Auth., Residential Care Fac. Rev. Bonds (Pinnacle Living), Series 2017-C, 5.00% 2042 | 3,500 | 3,544 |
| Small Business Fncg. Auth., Residential Care Fac. Rev. Bonds (Pinnacle Living), Series 2017-C, 5.00% 2047 | 4,510 | 4,544 |
American High-Income Municipal Bond Fund — Page 68 of 77
| Bonds, notes & other debt instruments (continued) Virginia (continued) | Principal amount (000) | Value (000) |
| Small Business Fncg. Auth., Residential Care Fac. Rev. Bonds (Pinnacle Living), Series 2017-C, 5.00% 2052 | $8,425 | $8,467 |
| Small Business Fncg. Auth., Rev. Ref. Bonds (Hampton University), Series 2014, 5.25% 2029 | 2,250 | 2,670 |
| Small Business Fncg. Auth., Solid Waste Disposal Rev. Bonds (Covanta Project), Series 2018-C, AMT, 5.00% 20481,2 | 1,500 | 1,545 |
| County of Stafford, Econ. Dev. Auth., Hospital Facs. Rev. Ref. Bonds (Mary Washington Healthcare Obligated Group), Series 2016, 5.00% 2036 | 1,000 | 1,163 |
| 226,752 | ||
| Washington 1.55% | ||
| Convention Center Public Facs. Dist., Lodging Tax Bonds, Series 2010-B, 5.00% 2043 | 5,000 | 5,637 |
| Convention Center Public Facs. Dist., Lodging Tax Bonds, Series 2010-B, 5.00% 2048 | 10,000 | 11,160 |
| Convention Center Public Facs. Dist., Lodging Tax Bonds, Series 2018, 5.00% 2058 | 14,250 | 15,713 |
| Health Care Facs. Auth., Rev. Bonds (Catholic Health Initiatives), Series 2013-B-1, (SIFMA Municipal Swap Index + 1.00%) 1.16% 2035 (put 2021)3 | 7,375 | 7,353 |
| Health Care Facs. Auth., Rev. Bonds (Kadlec Regional Medical Center), Series 2012, 5.00% 2042 (preref. 2021) | 1,250 | 1,329 |
| Health Care Facs. Auth., Rev. Bonds (Virginia Mason Medical Center), Series 2017, 5.00% 2032 | 1,615 | 1,830 |
| Health Care Facs. Auth., Rev. Bonds (Virginia Mason Medical Center), Series 2017, 5.00% 2034 | 1,875 | 2,112 |
| Health Care Facs. Auth., Rev. Bonds (Virginia Mason Medical Center), Series 2017, 5.00% 2035 | 1,825 | 2,050 |
| Health Care Facs. Auth., Rev. Bonds (Yakima Valley Memorial Hospital Association), Series 2016, 5.00% 2036 | 2,720 | 3,098 |
| Health Care Facs. Auth., Rev. Bonds (Yakima Valley Memorial Hospital Association), Series 2016, 5.00% 2041 | 1,920 | 2,153 |
| Housing Fin. Commission, Nonprofit Housing Rev. and Rev. Ref. Bonds (Horizon House Project), Series 2017, 5.00% 20312 | 1,000 | 1,098 |
| Housing Fin. Commission, Nonprofit Housing Rev. and Rev. Ref. Bonds (Horizon House Project), Series 2017, 5.00% 20332 | 1,050 | 1,147 |
| Housing Fin. Commission, Nonprofit Housing Rev. Bonds (Hearthstone Project), Series 2018-B, 3.125% 20232 | 400 | 394 |
| Housing Fin. Commission, Nonprofit Housing Rev. Ref. Bonds (Herons Key Senior Living), Series 2015-A, 6.50% 20302 | 1,700 | 1,853 |
| Housing Fin. Commission, Nonprofit Housing Rev. Ref. Bonds (Herons Key Senior Living), Series 2015-A, 6.75% 20352 | 1,630 | 1,762 |
| Housing Fin. Commission, Nonprofit Housing Rev. Ref. Bonds (Horizon House Project), Series 2017, 5.00% 20382 | 2,350 | 2,537 |
| Housing Fin. Commission, Nonprofit Housing Rev. Ref. Bonds (Horizon House Project), Series 2017, 5.00% 20432 | 3,100 | 3,317 |
| Housing Fin. Commission, Nonprofit Housing Rev. Ref. Bonds (Horizon House Project), Series 2017, 5.00% 20482 | 2,700 | 2,877 |
| Housing Fin. Commission, Nonprofit Housing Rev. Ref. Bonds (Judson Park Project), Series 2018, 5.00% 20332 | 250 | 269 |
| Housing Fin. Commission, Nonprofit Housing Rev. Ref. Bonds (Judson Park Project), Series 2018, 5.00% 20482 | 1,350 | 1,426 |
| Housing Fin. Commission, Nonprofit Housing Rev. Ref. Bonds (Rockwood Retirement Project), Series 2014-A, 7.375% 20442 | 7,000 | 7,497 |
| Housing Fin. Commission, Nonprofit Housing Rev. Ref. Bonds (Rockwood Retirement Project), Series 2014-A, 7.50% 20492 | 9,090 | 9,755 |
| Housing Fin. Commission, Nonprofit Housing Rev. Ref. Bonds (Rockwood Retirement Project), Series 2019, 5.00% 20552 | 8,520 | 7,707 |
| Housing Fin. Commission, Single Family Program Bonds, Series 2014-2A-R, AMT, 3.50% 2044 | 795 | 823 |
| Kalispel Tribe of Indians, Priority Distribution Payment Bonds, Series 2018-A, 5.00% 20322 | 1,955 | 2,214 |
| Kalispel Tribe of Indians, Priority Distribution Payment Bonds, Series 2018-A, 5.25% 20382 | 7,245 | 8,151 |
| Kalispel Tribe of Indians, Priority Distribution Payment Bonds, Series 2018-B, 5.00% 20322 | 805 | 912 |
| Kalispel Tribe of Indians, Priority Distribution Payment Bonds, Series 2018-B, 5.25% 20382 | 1,000 | 1,125 |
| Port of Seattle, Rev. Ref. Bonds, Series 2015-C, AMT, 5.00% 2035 | 1,500 | 1,682 |
| Port of Seattle, Special Fac. Rev. Ref. Bonds (SEATAC Fuel Facs. LLC), Series 2013, AMT, 5.00% 2030 | 2,000 | 2,195 |
| Port of Seattle, Special Fac. Rev. Ref. Bonds (SEATAC Fuel Facs. LLC), Series 2013, AMT, 5.00% 2031 | 2,000 | 2,190 |
| County of Skagit, Public Hospital Dist. No. 1 (Skagit Regional Health), Hospital Rev. Improvement and Rev. Ref. Bonds, Series 2013-A, 5.00% 2037 | 4,000 | 4,312 |
| County of Skagit, Public Hospital Dist. No. 1 (Skagit Regional Health), Hospital Rev. Improvement and Rev. Ref. Bonds, Series 2016, 4.00% 2025 | 500 | 559 |
American High-Income Municipal Bond Fund — Page 69 of 77
| Bonds, notes & other debt instruments (continued) Washington (continued) | Principal amount (000) | Value (000) |
| County of Skagit, Public Hospital Dist. No. 1 (Skagit Regional Health), Hospital Rev. Improvement and Rev. Ref. Bonds, Series 2016, 5.00% 2027 | $1,000 | $1,179 |
| County of Skagit, Public Hospital Dist. No. 1 (Skagit Regional Health), Hospital Rev. Improvement and Rev. Ref. Bonds, Series 2016, 5.00% 2028 | 2,440 | 2,865 |
| County of Skagit, Public Hospital Dist. No. 1 (Skagit Regional Health), Hospital Rev. Improvement and Rev. Ref. Bonds, Series 2016, 5.00% 2029 | 1,000 | 1,169 |
| County of Skagit, Public Hospital Dist. No. 1 (Skagit Regional Health), Hospital Rev. Improvement and Rev. Ref. Bonds, Series 2016, 5.00% 2030 | 1,500 | 1,744 |
| County of Skagit, Public Hospital Dist. No. 1 (Skagit Regional Health), Hospital Rev. Improvement and Rev. Ref. Bonds, Series 2016, 5.00% 2031 | 1,500 | 1,734 |
| County of Skagit, Public Hospital Dist. No. 1 (Skagit Regional Health), Hospital Rev. Improvement and Rev. Ref. Bonds, Series 2016, 5.00% 2032 | 1,500 | 1,724 |
| 128,652 | ||
| West Virginia 0.26% | ||
| Econ. Dev. Auth., Solid Waste Disposal Facs. Rev. Bonds (Arch Resources Project), Series 2020, AMT, 5.00% 2045 (put 2025) | 10,250 | 10,614 |
| Econ. Dev. Auth., Solid Waste Disposal Facs. Rev. Ref. Bonds (Wheeling Power Co. - Mitchell Project), Series 2013-A, AMT, 3.00% 2037 (put 2022) | 1,300 | 1,335 |
| County of Harrison, Solid Waste Disposal Rev. Ref. Bonds (Monongahela Power Co. Project), Series 2018-A, AMT, 3.00% 2037 (put 2021) | 1,500 | 1,538 |
| Hospital Fin. Auth., Hospital Rev. Ref. and Improvement Rev. Bonds (Cabell Huntington Hospital Obligated Group), Series 2018-A, 4.125% 2047 | 2,000 | 2,186 |
| Hospital Fin. Auth., Hospital Rev. Ref. and Improvement Rev. Bonds (Cabell Huntington Hospital Obligated Group), Series 2018-A, 5.00% 2043 | 4,700 | 5,625 |
| 21,298 | ||
| Wisconsin 1.98% | ||
| Health and Educational Facs. Auth., Rev. Bonds (Advocate Aurora Health Care Credit Group), Series 2018-C-3, (SIFMA Municipal Swap Index + 0.55%) 0.71% 2054 (put 2023)3 | 6,750 | 6,737 |
| Health and Educational Facs. Auth., Rev. Bonds (Agnesian HealthCare, Inc.), Series 2013-B, 5.00% 2036 (preref. 2023) | 2,000 | 2,271 |
| Health and Educational Facs. Auth., Rev. Bonds (Ascension Health Senior Credit Group), Series 2016-A, 4.00% 2039 | 500 | 565 |
| Health and Educational Facs. Auth., Rev. Bonds (Ascension Health Senior Credit Group), Series 2016-A, 5.00% 2039 | 1,000 | 1,190 |
| Health and Educational Facs. Auth., Rev. Bonds (Benevolent Corp. Cedar Community), Series 2017, 5.00% 2023 | 1,085 | 1,125 |
| Health and Educational Facs. Auth., Rev. Bonds (Benevolent Corp. Cedar Community), Series 2017, 5.00% 2024 | 1,165 | 1,218 |
| Health and Educational Facs. Auth., Rev. Bonds (Benevolent Corp. Cedar Community), Series 2017, 5.00% 2025 | 1,225 | 1,290 |
| Health and Educational Facs. Auth., Rev. Bonds (Benevolent Corp. Cedar Community), Series 2017, 5.00% 2026 | 1,285 | 1,359 |
| Health and Educational Facs. Auth., Rev. Bonds (Benevolent Corp. Cedar Community), Series 2017, 5.00% 2027 | 1,350 | 1,432 |
| Health and Educational Facs. Auth., Rev. Bonds (Benevolent Corp. Cedar Community), Series 2017, 5.00% 2029 | 1,485 | 1,572 |
| Health and Educational Facs. Auth., Rev. Bonds (Benevolent Corp. Cedar Community), Series 2017, 5.00% 2031 | 1,640 | 1,718 |
| Health and Educational Facs. Auth., Rev. Bonds (Benevolent Corp. Cedar Community), Series 2017, 5.00% 2037 | 1,220 | 1,252 |
| Health and Educational Facs. Auth., Rev. Bonds (Clement Manor, Inc.), Series 2019, 5.00% 2049 | 3,750 | 3,161 |
| Health and Educational Facs. Auth., Rev. Bonds (Marshfield Clinic Health System, Inc.), Series 2016-B, 5.00% 2034 | 1,800 | 2,090 |
American High-Income Municipal Bond Fund — Page 70 of 77
| Bonds, notes & other debt instruments (continued) Wisconsin (continued) | Principal amount (000) | Value (000) |
| Health and Educational Facs. Auth., Rev. Bonds (Marshfield Clinic Health System, Inc.), Series 2016-B, 5.00% 2042 | $2,215 | $2,531 |
| Health and Educational Facs. Auth., Rev. Bonds (Marshfield Clinic Health System, Inc.), Series 2016-B, 5.00% 2046 | 3,205 | 3,641 |
| Health and Educational Facs. Auth., Rev. Bonds (Milwaukee Regional Medical Center Thermal Service, Inc.), Series 2018, 5.00% 2044 | 1,600 | 1,959 |
| Health and Educational Facs. Auth., Rev. Bonds (St. Camillus Health System, Inc.), Series 2019-A, 5.00% 2023 | 235 | 246 |
| Health and Educational Facs. Auth., Rev. Bonds (St. Camillus Health System, Inc.), Series 2019-A, 5.00% 2054 | 2,000 | 2,009 |
| Public Fin. Auth., Airport Facs. Rev. Ref. Bonds (Transportation Infrastructure Properties, LLC Obligated Group), Series 2012-B, AMT, 5.00% 2022 | 25 | 26 |
| Public Fin. Auth., Airport Facs. Rev. Ref. Bonds (Transportation Infrastructure Properties, LLC Obligated Group), Series 2012-B, AMT, 5.00% 2042 | 450 | 467 |
| Public Fin. Auth., Charter School Rev. Bonds (American Preparatory Academy - Las Vegas 2 Project), Series 2019-A, 4.00% 20292 | 645 | 650 |
| Public Fin. Auth., Charter School Rev. Bonds (American Preparatory Academy - Las Vegas 2 Project), Series 2019-A, 5.00% 20392 | 1,380 | 1,432 |
| Public Fin. Auth., Charter School Rev. Bonds (American Preparatory Academy - Las Vegas 2 Project), Series 2019-A, 5.00% 20492 | 3,360 | 3,437 |
| Public Fin. Auth., Charter School Rev. Bonds (American Preparatory Academy - Las Vegas 2 Project), Series 2019-A, 5.00% 20542 | 1,605 | 1,637 |
| Public Fin. Auth., Charter School Rev. Bonds (American Preparatory Academy - Las Vegas Project), Series 2017-A, 5.125% 20372 | 1,000 | 1,050 |
| Public Fin. Auth., Charter School Rev. Bonds (American Preparatory Academy - Las Vegas Project), Series 2017-A, 5.375% 20472 | 6,375 | 6,670 |
| Public Fin. Auth., Charter School Rev. Bonds (American Preparatory Academy - Las Vegas Project), Series 2017-B, 5.375% 20522 | 2,000 | 2,086 |
| Public Fin. Auth., Charter School Rev. Bonds (Coral Academy of Science Reno), Series 2019-A, 5.00% 20392 | 710 | 737 |
| Public Fin. Auth., Charter School Rev. Bonds (Coral Academy of Science Reno), Series 2019-A, 5.00% 20502 | 1,950 | 2,002 |
| Public Fin. Auth., Education Rev. Bonds (North Carolina Leadership Academy), Series 2019-A, 5.00% 20392 | 820 | 847 |
| Public Fin. Auth., Education Rev. Bonds (North Carolina Leadership Academy), Series 2019-A, 5.00% 20492 | 520 | 531 |
| Public Fin. Auth., Education Rev. Bonds (North Carolina Leadership Academy), Series 2019-A, 5.00% 20542 | 1,365 | 1,390 |
| Public Fin. Auth., Exempt Facs. Rev. Ref. Bonds (Celanese Project), Series 2016-A, AMT, 5.00% 20242 | 1,605 | 1,765 |
| Public Fin. Auth., Exempt Facs. Rev. Ref. Bonds (Celanese Project), Series 2016-A, AMT, 5.00% 20252 | 1,000 | 1,143 |
| Public Fin. Auth., Exempt Facs. Rev. Ref. Bonds (National Gypsum Co.), Series 2016, AMT, 4.00% 2035 | 9,200 | 8,799 |
| Public Fin. Auth., Retirement Community Rev. Bonds (Evergreens Obligated Group), Series 2019-A, 5.00% 2044 | 1,750 | 1,855 |
| Public Fin. Auth., Retirement Community Rev. Bonds (Evergreens Obligated Group), Series 2019-A, 5.00% 2049 | 1,500 | 1,582 |
| Public Fin. Auth., Retirement Community Rev. Bonds (Lifespace Communities, Inc.), Series 2020-A, 4.00% 2037 | 600 | 667 |
| Public Fin. Auth., Retirement Community Rev. Bonds (Lifespace Communities, Inc.), Series 2020-A, 5.00% 2041 | 2,000 | 2,368 |
| Public Fin. Auth., Retirement Fac. Rev. Bonds (Penick Village), Series 2019, 4.00% 20292 | 600 | 589 |
| Public Fin. Auth., Retirement Fac. Rev. Bonds (Penick Village), Series 2019, 5.00% 20392 | 775 | 788 |
| Public Fin. Auth., Retirement Fac. Rev. Bonds (Penick Village), Series 2019, 5.00% 20492 | 1,300 | 1,300 |
| Public Fin. Auth., Retirement Fac. Rev. Bonds (Penick Village), Series 2019, 5.00% 20542 | 1,360 | 1,349 |
| Public Fin. Auth., Retirement Facs. Rev. Bonds (Friends Homes), Series 2019, 4.00% 20292 | 1,250 | 1,246 |
| Public Fin. Auth., Retirement Facs. Rev. Bonds (Friends Homes), Series 2019, 5.00% 20392 | 2,230 | 2,302 |
| Public Fin. Auth., Retirement Facs. Rev. Bonds (Friends Homes), Series 2019, 5.00% 20492 | 6,000 | 6,092 |
| Public Fin. Auth., Retirement Facs. Rev. Bonds (Friends Homes), Series 2019, 5.00% 20542 | 2,320 | 2,338 |
| Public Fin. Auth., Rev. Bonds (Roseman University of Health Sciences Project), Series 2012, 5.50% 2032 | 500 | 517 |
| Public Fin. Auth., Rev. Bonds (Roseman University of Health Sciences Project), Series 2012, 5.75% 2042 | 3,500 | 3,609 |
| Public Fin. Auth., Rev. Bonds (Roseman University of Health Sciences Project), Series 2015, 5.875% 2045 | 6,250 | 6,774 |
| Public Fin. Auth., Rev. Bonds (Roseman University of Health Sciences Project), Series 2020, 3.00% 20252 | 425 | 423 |
| Public Fin. Auth., Rev. Bonds (Roseman University of Health Sciences Project), Series 2020, 5.00% 20302 | 500 | 553 |
American High-Income Municipal Bond Fund — Page 71 of 77
| Bonds, notes & other debt instruments (continued) Wisconsin (continued) | Principal amount (000) | Value (000) |
| Public Fin. Auth., Rev. Bonds (Roseman University of Health Sciences Project), Series 2020, 5.00% 20402 | $1,175 | $1,271 |
| Public Fin. Auth., Rev. Bonds (Wilson Preparatory Academy), Series 2019-A, 4.125% 20292 | 515 | 523 |
| Public Fin. Auth., Rev. Bonds (Wilson Preparatory Academy), Series 2019-A, 5.00% 20392 | 500 | 512 |
| Public Fin. Auth., Rev. Bonds (Wilson Preparatory Academy), Series 2019-A, 5.00% 20492 | 1,100 | 1,113 |
| Public Fin. Auth., Rev. Bonds (Wonderful Foundations Charter School Portfolio Project), Series 2020-A-1, 5.00% 20552 | 5,500 | 5,615 |
| Public Fin. Auth., Senior Living Rev. Bonds (Mary’s Woods at Marylhurst Project), Series 2017-A, 5.00% 20322 | 1,280 | 1,362 |
| Public Fin. Auth., Senior Living Rev. Bonds (Mary’s Woods at Marylhurst Project), Series 2017-A, 5.25% 20372 | 650 | 692 |
| Public Fin. Auth., Senior Living Rev. Bonds (Mary’s Woods at Marylhurst Project), Series 2017-A, 5.25% 20422 | 250 | 264 |
| Public Fin. Auth., Senior Living Rev. Bonds (Mary’s Woods at Marylhurst Project), Series 2017-A, 5.25% 20472 | 900 | 945 |
| Public Fin. Auth., Senior Living Rev. Bonds (Mary’s Woods at Marylhurst Project), Series 2017-A, 5.25% 20522 | 2,300 | 2,409 |
| Public Fin. Auth., Senior Living Rev. Bonds (Rose Villa Project), Series 2014-A, 5.50% 20342 | 1,000 | 1,066 |
| Public Fin. Auth., Senior Living Rev. Bonds (Rose Villa Project), Series 2014-A, 5.75% 20442 | 1,800 | 1,916 |
| Public Fin. Auth., Senior Living Rev. Ref. Bonds (Fellowship Senior Living Project), Series 2019-A, 4.00% 2046 | 1,000 | 939 |
| Public Fin. Auth., Senior Living Rev. Ref. Bonds (Fellowship Senior Living Project), Series 2019-A, 4.00% 2052 | 2,000 | 1,830 |
| Public Fin. Auth., Student Housing Rev. Bonds (Beyond Boone, LLC - Appalachian State University Project), Series 2019-A, Assured Guaranty Municipal insured, 5.00% 2054 | 1,700 | 1,992 |
| Public Fin. Auth., Student Housing Rev. Bonds (Beyond Boone, LLC - Appalachian State University Project), Series 2020-A, Assured Guaranty Municipal insured, 4.00% 2059 | 2,400 | 2,622 |
| Public Fin. Auth., Student Housing Rev. Bonds (CHF-Cullowhee, LLC - Western Carolina University Project), Series 2015, 5.00% 2035 | 1,000 | 1,046 |
| Public Fin. Auth., Student Housing Rev. Bonds (CHF-Cullowhee, LLC - Western Carolina University Project), Series 2015, 5.25% 2047 | 2,000 | 2,078 |
| Public Fin. Auth., Student Housing Rev. Bonds (CHF-Cullowhee, LLC - Western Carolina University Project), Series 2015-A, 5.00% 2030 | 2,140 | 2,275 |
| Public Fin. Auth., Student Housing Rev. Bonds (CHF-Wilmington, LLC - University of North Carolina Project), Series 2018, Assured Guaranty Municipal insured, 5.00% 2053 | 9,130 | 10,700 |
| Public Fin. Auth., Student Housing Rev. Bonds (NC A&T Real Estate Foundation, LLC Project), Series 2019-A, 5.00% 2034 | 4,045 | 4,342 |
| Public Fin. Auth., Student Housing Rev. Bonds (NC A&T Real Estate Foundation, LLC Project), Series 2019-A, 5.00% 2039 | 2,045 | 2,157 |
| Public Fin. Auth., Student Housing Rev. Bonds (NC A&T Real Estate Foundation, LLC Project), Series 2019-A, 5.00% 2044 | 1,350 | 1,409 |
| Public Fin. Auth., Student Housing Rev. Bonds (NC A&T Real Estate Foundation, LLC Project), Series 2019-A, 5.00% 2049 | 3,625 | 3,763 |
| Public Fin. Auth., Student Housing Rev. Bonds (NC A&T Real Estate Foundation, LLC Project), Series 2019-B, 5.00% 2034 | 1,295 | 1,391 |
| Public Fin. Auth., Student Housing Rev. Bonds (NC A&T Real Estate Foundation, LLC Project), Series 2019-B, 5.00% 2039 | 1,595 | 1,682 |
| Public Fin. Auth., Student Housing Rev. Bonds (NC A&T Real Estate Foundation, LLC Project), Series 2019-B, 5.00% 2049 | 1,340 | 1,391 |
| 163,692 | ||
| Total bonds, notes & other debt instruments (cost: $7,401,287,000) | 7,664,762 | |
| Short-term securities 6.89% | ||
| Freddie Mac, Multi Family Certificates, Series 2019-M-055, 0.37% 20282,3 | 7,900 | 7,900 |
| State of Alaska, City of Valdez, Marine Terminal Rev. Ref. Bonds (ExxonMobil Project), Series 2001, 0.14% 20293 | 4,110 | 4,110 |
| State of Arizona, Health Facs. Auth., Rev. Bonds (Banner Health), Series 2015-B, 0.12% 20463 | 6,600 | 6,600 |
| State of Arizona, City of Phoenix, Industrial Dev. Auth., Health Care Facs. Rev. Bonds (Mayo Clinic), Series 2014-A, 0.12% 20523 | 9,500 | 9,500 |
| State of California, Pollution Control Fncg. Auth., Environmental Impact Rev. Bonds (Air Products and Chemicals, Inc. Project), Series 1997-B, 0.12% 20423 | 2,450 | 2,450 |
American High-Income Municipal Bond Fund — Page 72 of 77
| Short-term securities (continued) | Principal amount (000) | Value (000) |
| State of California, Regents of the University of California, G.O. Rev. Bonds, Series 2013-AL-2, 0.14% 20483 | $12,300 | $12,300 |
| State of Colorado, Regents of the University of Colorado, University Enterprise Rev. and Rev. Ref. Bonds, Series 2020-A-2, 0.02% 20503 | 6,100 | 6,100 |
| State of Colorado, Regents of the University of Colorado, University Enterprise Rev. and Rev. Ref. Bonds, Series 2020-B-1, 0.17% 20503 | 16,000 | 16,000 |
| State of Florida, City of Gainesville, Utilities System Rev. Bonds, Series 2019-C, 0.16% 20473 | 7,500 | 7,500 |
| State of Illinois, Fin. Auth., Demand Rev. Bonds (University of Chicago Medical Center), Series 2009-E-1, JPMorgan Chase LOC, 0.15% 20433 | 6,270 | 6,270 |
| State of Illinois, Fin. Auth., Demand Rev. Bonds (University of Chicago Medical Center), Series 2010-A, 0.17% 20443 | 5,900 | 5,900 |
| State of Illinois, Fin. Auth., Demand Rev. Bonds (University of Chicago Medical Center), Series 2011-A, 0.17% 20443 | 5,600 | 5,600 |
| State of Iowa, Fin. Auth., Rev. Bonds (UnityPoint Health), Series 2018-F, 0.14% 20413 | 6,605 | 6,605 |
| State of Louisiana, Parish of East Baton Rouge, Industrial Dev. Board, Gulf Opportunity Zone Rev. Bonds (ExxonMobil Project), Series 2011, 0.14% 20513 | 6,135 | 6,135 |
| State of Louisiana, Parish of East Baton Rouge, Pollution Control Rev. Ref. Bonds (ExxonMobil Project), Series 2010-A, 0.14% 20353 | 5,370 | 5,370 |
| State of Maryland, County of Montgomery, G.O. Bonds, Series 2017-E, 0.16% 20373 | 3,000 | 3,000 |
| State of Maryland, County of Montgomery, IAM Commercial Paper, Series 2009-B, 0.21% 8/26/2020 | 5,500 | 5,500 |
| State of Massachusetts, G.O. Bonds (Central Artery/Ted Williams Tunnel Infrastructure Loan Act of 2000), Series 2000-B, 0.14% 20303 | 6,000 | 6,000 |
| State of Massachusetts, Massachusetts Bay Transportation Auth., Sales Tax Bonds, Series 2018-A-1, 0.16% 20263 | 27,290 | 27,290 |
| State of Massachusetts, Water and Sewer Community, Rev. IAM Commercial Paper, Series 2020-A, 0.21% 9/3/2020 | 1,000 | 1,000 |
| State of Michigan, Fin. Auth., State Aid Rev. Bonds, Series 2019-A, 2.00% 8/20/2020 | 4,000 | 4,003 |
| State of Michigan, Fin. Auth., State Aid Rev. Bonds, Series 2020-A-2, 4.00% 2021 | 4,000 | 4,150 |
| State of Michigan, Strategic Fund, Demand Limited Obligation Rev. Bonds (Air Products and Chemicals, Inc. Project), Series 2007, 0.12% 20423 | 30,040 | 30,040 |
| State of Michigan, Regents of the University of Michigan, General Rev. Bonds, Series 2012-B, 0.11% 20423 | 7,770 | 7,770 |
| State of Mississippi, Business Fin. Corp., Gulf Opportunity Zone Industrial Dev. Rev. Bonds (Chevron U.S.A. Inc. Project), Series 2007-E, 0.14% 20303 | 7,500 | 7,500 |
| State of Mississippi, Business Fin. Corp., Gulf Opportunity Zone Industrial Dev. Rev. Bonds (Chevron U.S.A. Inc. Project), Series 2010-J, 0.14% 20353 | 7,010 | 7,010 |
| State of Mississippi, Business Fin. Corp., Gulf Opportunity Zone Industrial Dev. Rev. Bonds (Chevron U.S.A. Inc. Project), Series 2011-F, 0.14% 20353 | 2,400 | 2,400 |
| State of Mississippi, Business Fin. Corp., Gulf Opportunity Zone Industrial Dev. Rev. Bonds (Chevron U.S.A. Inc. Project), Series 2011-G, 0.14% 20353 | 8,900 | 8,900 |
| State of Mississippi, County of Jackson, Port Fac. Rev. Ref. Bonds (Chevron U.S.A. Inc. Project), Series 1993, 0.14% 20233 | 6,465 | 6,465 |
| State of Missouri, Health and Educational Facs. Auth., Demand Educational Facs. Rev. Bonds (Washington University), Series 2000-B, 0.17% 20403 | 1,100 | 1,100 |
| State of Missouri, Health and Educational Facs. Auth., Demand Educational Facs. Rev. Bonds (Washington University), Series 2003-B, 0.16% 20333 | 500 | 500 |
| State of Nebraska, County of Sarpy, Sanitary and Improvement Dist. No. 340, Construction Fund Warrants, Series 2020, 7.00% 20247,8,9 | 598 | 551 |
| State of Nebraska, County of Sarpy, Sanitary and Improvement Dist. No. 340, Construction Fund Warrants, Series 2020, 7.00% 20247,8,9 | 637 | 586 |
| State of Nebraska, County of Sarpy, Sanitary and Improvement Dist. No. 340, Construction Fund Warrants, Series 2020, 7.00% 20257,8 | 139 | 128 |
| State of Nebraska, County of Sarpy, Sanitary and Improvement Dist. No. 340, Construction Fund Warrants, Series 2020, 7.00% 20257,8 | 179 | 165 |
| State of New Hampshire, Health and Education Facs. Auth., Rev. Ref. Bonds (Dartmouth College Issue), Series 2007-B, 0.15% 20413 | 13,685 | 13,685 |
American High-Income Municipal Bond Fund — Page 73 of 77
| Short-term securities (continued) | Principal amount (000) | Value (000) |
| State of New Hampshire, National Fin. Auth., Exempt Facs. Rev. Ref. Bonds (Emerald Renewable Diesel LLC Project), Series 2019, AMT, 2.00% 2049 (put 2020)2,11 | $10,700 | $10,707 |
| State of New York, Dormitory Auth., IAM Commercial Paper, Series 2020, 0.20% 10/5/2020 | 7,600 | 7,600 |
| State of New York, New York City G.O. Bonds, Fiscal 2006, Series 2006-E-4, 0.16% 20343 | 4,425 | 4,425 |
| State of New York, New York City G.O. Bonds, Fiscal 2006, Series 2006-I-7, 0.13% 20363 | 8,055 | 8,055 |
| State of New York, New York City G.O. Bonds, Fiscal 2008, Series 2008-L-3, 0.16% 20363 | 2,100 | 2,100 |
| State of New York, New York City G.O. Bonds, Fiscal 2008, Series 2008-L-5, 0.16% 20353 | 5,000 | 5,000 |
| State of New York, New York City G.O. Bonds, Fiscal 2013, Series 2013-F-3, 0.16% 20423 | 15,500 | 15,500 |
| State of New York, New York City Municipal Water Fin. Auth., Water and Sewer System Second General Resolution Rev. Bonds, Fiscal 2011, Series 2011-DD-2, 0.18% 20433 | 17,050 | 17,050 |
| State of New York, New York City Municipal Water Fin. Auth., Water and Sewer System Second General Resolution Rev. Bonds, Fiscal 2011, Series 2011-FF-1, 0.16% 20443 | 7,850 | 7,850 |
| State of New York, New York City Municipal Water Fin. Auth., Water and Sewer System Second General Resolution Rev. Bonds, Fiscal 2014, Series 2014-AA-2, 0.18% 20503 | 27,975 | 27,975 |
| State of New York, New York City Municipal Water Fin. Auth., Water and Sewer System Second General Resolution Rev. Bonds, Fiscal 2015, Series 2015-BB-1, 0.16% 20493 | 15,080 | 15,080 |
| State of New York, New York City Municipal Water Fin. Auth., Water and Sewer System Second General Resolution Rev. Bonds, Fiscal 2016, Series 2016-AA-1, 0.16% 20483 | 26,125 | 26,125 |
| State of New York, New York City Transitional Fin. Auth., Future Tax Secured Bonds, Fiscal 2016, Series 2016-A-4, 0.16% 20413 | 5,075 | 5,075 |
| State of New York, New York City Transitional Fin. Auth., Future Tax Secured Rev. Ref. Bonds, Fiscal 2015, Series 2015-E-3, 0.18% 20453 | 1,875 | 1,875 |
| State of New York, New York City Transitional Fin. Auth., Future Tax Secured Rev. Ref. Bonds, Fiscal 2015, Series 2015-E-4, 0.16% 20453 | 15,650 | 15,650 |
| State of Ohio, County of Franklin, Rev. Bonds (CHE Trinity Health Credit Group), Series 2013, 0.70% 2046 (put 2020)11 | 3,750 | 3,750 |
| State of Ohio, Hospital Rev. Bonds (Cleveland Clinic Health System Obligated Group), Series 2013-B-3, 0.13% 20393 | 18,385 | 18,385 |
| State of Ohio, Hospital Rev. Bonds (Cleveland Clinic Health System Obligated Group), Series 2019-F, 0.13% 20523 | 3,300 | 3,300 |
| State of Pennsylvania, Econ. Dev. Fncg. Auth., Solid Waste Disposal Rev. Bonds (Republic Services, Inc. Project), Series 2014, AMT, 0.65% 2044 (put 2020)11 | 11,625 | 11,627 |
| State of South Carolina, Jobs-Econ. Dev. Auth., Hospital Rev. Bonds (Prisma Health Obligated Group), Series 2018-B, 0.14% 20483 | 11,640 | 11,640 |
| State of Tennessee, County of Montgomery, Public Building Auth., Pooled Fncg. Rev. Bonds (Tennessee County Loan Pool), Series 2002, Bank of America LOC, 0.19% 20323 | 7,240 | 7,240 |
| State of Tennessee, County of Montgomery, Public Building Auth., Pooled Fncg. Rev. Bonds (Tennessee County Loan Pool), Series 2004, Bank of America LOC, 0.19% 20343 | 935 | 935 |
| State of Texas, County of Alachua, Health Facs. Auth., Health Facs. IAM Commercial Paper, Series 2008-A, 0.24% 9/3/2020 | 8,750 | 8,750 |
| State of Texas, Gulf Coast Waste Disposal Auth., Pollution Control Rev. Ref. Bonds (Exxon Project), Series 1989, 0.14% 20243 | 2,100 | 2,100 |
| State of Texas, County of Harris, Health Facs. Dev. Corp., Rev. Ref. Bonds (CHRISTUS Health), Series 2005-A-4, Assured Guaranty Municipal insured, 0.60% 20313 | 1,275 | 1,275 |
| State of Texas, Port Arthur Navigation Dist. Industrial Dev. Corp., Rev. Bonds (Air Products Project), Series 2005, 0.12% 20403 | 2,700 | 2,700 |
| State of Texas, Public Service Auth., IAM Commercial Paper (Santee Cooper), Series 2020-D, 0.30% 9/2/2020 | 10,103 | 10,103 |
| State of Texas, Tax and Rev. Anticipation Notes, Series 2019, 4.00% 8/27/2020 | 17,625 | 17,668 |
| State of Texas, Board of Regents of the University of Texas System, IAM Commercial Paper, Series 2020-A, 0.15% 8/18/2020 | 3,000 | 3,000 |
| State of Texas, Board of Regents of the University of Texas System, IAM Commercial Paper, Series 2020-A, 0.19% 8/11/2020 | 5,000 | 5,000 |
| State of Texas, Board of Regents of the University of Texas System, IAM Commercial Paper, Series 2020-A, 0.40% 8/10/2020 | 5,000 | 5,000 |
American High-Income Municipal Bond Fund — Page 74 of 77
| Short-term securities (continued) | Principal amount (000) | Value (000) |
| State of Texas, Board of Regents of the University of Texas System, Rev. Fncg. System Bonds, Series 2008-B, 0.15% 20253 | $18,195 | $18,195 |
| State of Texas, Veterans Bonds, Series 2019, 0.28% 20503 | 10,000 | 10,000 |
| State of Wisconsin, Health and Educational Facs. Auth., Rev. Bonds (Marshfield Clinic Health System, Inc.), Series 2020-C, 0.75% 20533 | 5,110 | 5,110 |
| State of Wyoming, County of Sublette, Pollution Control Rev. Ref. Bonds (ExxonMobil Project), Series 2014, 0.14% 20443 | 5,425 | 5,425 |
| State of Wyoming, County of Uinta, Pollution Control Rev. Ref. Bonds (Chevron U.S.A. Inc. Project), Series 1992, 0.14% 20223 | 3,500 | 3,500 |
| Total short-term securities (cost: $570,960,000) | 570,853 | |
| Total investment securities 99.40% (cost: $7,972,247,000) | 8,235,615 | |
| Other assets less liabilities 0.60% | 49,314 | |
| Net assets 100.00% | $8,284,929 |
Futures contracts
| Contracts | Type | Number of contracts | Expiration | Notional amount12 (000) | Value at 7/31/202013 (000) | Unrealized depreciation at 7/31/2020 (000) |
| 10 Year U.S. Treasury Note Futures | Short | 1,850 | September 2020 | $(185,000) | $(259,144) | $(2,378) |
| 30 Year Ultra U.S. Treasury Bond Futures | Short | 13 | September 2020 | (1,300) | (2,960) | (214) |
| $(2,592) |
| 1 | Step bond; coupon rate may change at a later date. |
| 2 | Acquired in a transaction exempt from registration under Rule 144A of the Securities Act of 1933. May be resold in the U.S. in transactions exempt from registration, normally to qualified institutional buyers. The total value of all such securities was $1,182,094,000, which represented 14.27% of the net assets of the fund. |
| 3 | Coupon rate may change periodically. Reference rate and spread are as of the most recent information available. Some coupon rates are determined by the issuer or agent based on current market conditions; therefore, the reference rate and spread are not available. For short-term securities, the date of the next scheduled coupon rate change is considered to be the maturity date. |
| 4 | Scheduled interest payment was not received. Coupon payments are paid at the election of the issuer and any unpaid amounts are accumulated. |
| 5 | Scheduled interest and/or principal payment was not received. |
| 6 | Amount less than one thousand. |
| 7 | Valued under fair value procedures adopted by authority of the board of trustees. The total value of all such securities was $9,616,000, which represented .12% of the net assets of the fund. |
| 8 | Value determined using significant unobservable inputs. |
| 9 | Payment in kind; the issuer has the option of paying additional securities in lieu of cash. Most recent payment was 100% cash unless otherwise noted. |
| 10 | Acquired through a private placement transaction exempt from registration under the Securities Act of 1933. May be subject to legal or contractual restrictions on resale. Further details on these holdings appear below. |
| 11 | For short-term securities, the mandatory put date is considered to be the maturity date. |
| 12 | Notional amount is calculated based on the number of contracts and notional contract size. |
| 13 | Value is calculated based on the notional amount and current market price. |
| Private placement securities | Acquisition date(s) | Cost (000) | Value (000) | Percent of net assets |
| County of Douglas, Sanitary and Improvement Dist. No. 587 (Townhomes at Village Pointe), Construction Fund Warrants, Series 2018, 7.00% 2024 | 8/1/2019-8/13/2019 | $398 | $367 | .01% |
| County of Douglas, Sanitary and Improvement Dist. No. 596, Construction Fund Warrants, Series 2019, 7.00% 2024 | 11/13/2019 | 352 | 324 | .01 |
| County of Douglas, Sanitary and Improvement Dist. No. 596, Construction Fund Warrants, Series 2019, 7.00% 2024 | 12/1/2019-1/8/2020 | 344 | 316 | .01 |
| County of Douglas, Sanitary and Improvement Dist. No. 596, Construction Fund Warrants, Series 2019, 7.00% 2024 | 11/13/2019 | 331 | 304 | .00 |
American High-Income Municipal Bond Fund — Page 75 of 77
| Private placement securities | Acquisition date(s) | Cost (000) | Value (000) | Percent of net assets |
| County of Douglas, Sanitary and Improvement Dist. No. 596, Construction Fund Warrants, Series 2019, 7.00% 2024 | 1/8/2020 | $228 | $210 | .00% |
| County of Douglas, Sanitary and Improvement Dist. No. 587 (Townhomes at Village Pointe), Construction Fund Warrants, Series 2018, 7.00% 2024 (100% PIK) | 2/6/2020 | 199 | 183 | .00 |
| County of Douglas, Sanitary and Improvement Dist. No. 587 (Townhomes at Village Pointe), Construction Fund Warrants, Series 2018, 7.00% 2024 (100% PIK) | 9/26/2019 | 194 | 179 | .00 |
| County of Douglas, Sanitary and Improvement Dist. No. 596, Construction Fund Warrants, Series 2019, 7.00% 2025 | 6/19/2020 | 184 | 169 | .00 |
| County of Douglas, Sanitary and Improvement Dist. No. 596, Construction Fund Warrants, Series 2019, 7.00% 2025 | 6/19/2020 | 172 | 159 | .00 |
| County of Douglas, Sanitary and Improvement Dist. No. 587 (Townhomes at Village Pointe), Construction Fund Warrants, Series 2018, 7.00% 2024 (100% PIK) | 2/6/2020 | 153 | 141 | .00 |
| County of Douglas, Sanitary and Improvement Dist. No. 587 (Townhomes at Village Pointe), Construction Fund Warrants, Series 2018, 7.00% 2024 (100% PIK) | 9/26/2019 | 150 | 138 | .00 |
| County of Douglas, Sanitary and Improvement Dist. No. 596, Construction Fund Warrants, Series 2019, 7.00% 2024 | 11/13/2019 | 65 | 60 | .00 |
| County of Douglas, Sanitary and Improvement Dist. No. 587 (Townhomes at Village Pointe), Construction Fund Warrants, Series 2018, 7.00% 2024 (100% PIK) | 9/26/2019 | 62 | 57 | .00 |
| County of Douglas, Sanitary and Improvement Dist. No. 596, Construction Fund Warrants, Series 2019, 7.00% 2024 | 11/13/2019 | 56 | 52 | .00 |
| County of Douglas, Sanitary and Improvement Dist. No. 587 (Townhomes at Village Pointe), Construction Fund Warrants, Series 2018, 7.00% 2023 (100% PIK) | 9/26/2019 | 27 | 25 | .00 |
| County of Douglas, Sanitary and Improvement Dist. No. 596, Construction Fund Warrants, Series 2019, 7.00% 2025 | 6/19/2020 | 25 | 23 | .00 |
| County of Douglas, Sanitary and Improvement Dist. No. 596, Construction Fund Warrants, Series 2019, 7.00% 2024 | 11/13/2019 | 10 | 9 | .00 |
| County of Douglas, Sanitary and Improvement Dist. No. 596, Construction Fund Warrants, Series 2019, 7.00% 2024 | 11/13/2019 | 8 | 7 | .00 |
| County of Douglas, Sanitary and Improvement Dist. No. 596, Construction Fund Warrants, Series 2019, 7.00% 2024 | 11/13/2019 | 3 | 2 | .00 |
| County of Douglas, Sanitary and Improvement Dist. No. 596, Construction Fund Warrants, Series 2019, 7.00% 2024 | 11/13/2019 | 2 | 1 | .00 |
| Total private placement securities | $2,963 | $2,726 | .03% |
American High-Income Municipal Bond Fund — Page 76 of 77
| Key to abbreviations and symbol | |
| Agcy. = Agency | Fncg. = Financing |
| AMT = Alternative Minimum Tax | G.O. = General Obligation |
| Auth. = Authority | IAM = Interest at Maturity |
| Certs. of Part. = Certificates of Participation | LIBOR = London Interbank Offered Rate |
| Dept. = Department | LOC = Letter of Credit |
| Dev. = Development | Preref. = Prerefunded |
| Dist. = District | Redev. = Redevelopment |
| Econ. = Economic | Ref. = Refunding |
| Fac. = Facility | Rev. = Revenue |
| Facs. = Facilities | SIFMA = Securities Industry and Financial Markets Association |
| Fin. = Finance | USD/$ = U.S. dollars |
Additional financial disclosures are included in the fund’s current shareholder report and should be read in conjunction with this report.
Investments are not FDIC-insured, nor are they deposits of or guaranteed by a bank or any other entity, so they may lose value.
Investors should carefully consider investment objectives, risks, charges and expenses. This and other important information is contained in the fund prospectus and summary prospectus, which can be obtained from your financial professional and should be read carefully before investing. You may also call American Funds Service Company (AFS) at (800) 421-4225 or visit the Capital Group website at capitalgroup.com.
All Capital Group trademarks mentioned are owned by The Capital Group Companies, Inc., an affiliated company or fund. All other company and product names mentioned are the property of their respective companies.
American Funds Distributors, Inc., member FINRA.
© 2020 Capital Group. All rights reserved.
| MFGEFP4-040-0920O-S78109 | American High-Income Municipal Bond Fund — Page 77 of 77 |
Report of Independent Registered Public Accounting Firm
To the Board of Trustees and Shareholders of American High-Income Municipal Bond Fund
Opinion on the Financial Statements
We have audited the accompanying statement of assets and liabilities, including the summary investment portfolio, of American High-Income Municipal Bond Fund (the “Fund”) as of July 31, 2020, the related statement of operations for the year ended July 31, 2020, the statement of changes in net assets for each of the two years in the period ended July 31, 2020, including the related notes, and the financial highlights for each of the periods indicated therein (included in Item 1 of this Form N-CSR) and the investment portfolio (included in Item 6 of this Form N-CSR) as of July 31, 2020 (collectively referred to as the “financial statements”). In our opinion, the financial statements present fairly, in all material respects, the financial position of the Fund as of July 31, 2020, the results of its operations for the year then ended, the changes in its net assets for each of the two years in the period ended July 31, 2020 and the financial highlights for each of the periods indicated therein in conformity with accounting principles generally accepted in the United States of America.
Basis for Opinion
These financial statements are the responsibility of the Fund’s management. Our responsibility is to express an opinion on the Fund’s financial statements based on our audits. We are a public accounting firm registered with the Public Company Accounting Oversight Board (United States) (PCAOB) and are required to be independent with respect to the Fund in accordance with the U.S. federal securities laws and the applicable rules and regulations of the Securities and Exchange Commission and the PCAOB.
We conducted our audits of these financial statements in accordance with the standards of the PCAOB. Those standards require that we plan and perform the audit to obtain reasonable assurance about whether the financial statements are free of material misstatement, whether due to error or fraud.
Our audits included performing procedures to assess the risks of material misstatement of the financial statements, whether due to error or fraud, and performing procedures that respond to those risks. Such procedures included examining, on a test basis, evidence regarding the amounts and disclosures in the financial statements. Our audits also included evaluating the accounting principles used and significant estimates made by management, as well as evaluating the overall presentation of the financial statements. Our procedures included confirmation of securities owned as of July 31, 2020 by correspondence with the custodian and brokers; when replies were not received from brokers, we performed other auditing procedures. We believe that our audits provide a reasonable basis for our opinion.
/s/ PricewaterhouseCoopers LLP
Los Angeles, California
September 14, 2020
We have served as the auditor of one or more investment companies in The Capital Group Companies Investment Company Complex since 1934.
ITEM 7 – Disclosure of Proxy Voting Policies and Procedures for Closed-End Management Investment Companies
Not applicable to this Registrant, insofar as the Registrant is not a closed-end management investment company.
ITEM 8 – Portfolio Managers of Closed-End Management Investment Companies
Not applicable to this Registrant, insofar as the Registrant is not a closed-end management investment company.
ITEM 9 – Purchases of Equity Securities by Closed-End Management Investment Company and Affiliated Purchasers
Not applicable to this Registrant, insofar as the Registrant is not a closed-end management investment company.
ITEM 10 – Submission of Matters to a Vote of Security Holders
There have been no material changes to the procedures by which shareholders may recommend nominees to the Registrant’s board of trustees since the Registrant last submitted a proxy statement to its shareholders. The procedures are as follows. The Registrant has a nominating and governance committee comprised solely of persons who are not considered ‘‘interested persons’’ of the Registrant within the meaning of the Investment Company Act of 1940, as amended. The committee periodically reviews such issues as the board’s composition, responsibilities, committees, compensation and other relevant issues, and recommends any appropriate changes to the full board of trustees. While the committee normally is able to identify from its own resources an ample number of qualified candidates, it will consider shareholder suggestions of persons to be considered as nominees to fill future vacancies on the board. Such suggestions must be sent in writing to the nominating and governance committee of the Registrant, c/o the Registrant’s Secretary, and must be accompanied by complete biographical and occupational data on the prospective nominee, along with a written consent of the prospective nominee for consideration of his or her name by the nominating and governance committee.
ITEM 11 – Controls and Procedures
| (a) | The Registrant’s Principal Executive Officer and Principal Financial Officer have concluded, based on their evaluation of the Registrant’s disclosure controls and procedures (as such term is defined in Rule 30a-3 under the Investment Company Act of 1940), that such controls and procedures are adequate and reasonably designed to achieve the purposes described in paragraph (c) of such rule. |
| (b) | There were no changes in the Registrant’s internal controls over financial reporting (as defined in Rule 30a-3(d) under the Investment Company Act of 1940) that occurred during the Registrant’s semi-annual period covered by this report that has materially affected, or is reasonably likely to materially affect, the Registrant’s internal control over financial reporting.
|
ITEM 12 – Exhibits
| (a)(1) | The Code of Ethics that is the subject of the disclosure required by Item 2 is attached as an exhibit hereto. |
| (a)(2) | The certifications required by Rule 30a-2 of the Investment Company Act of 1940 and Sections 302 and 906 of the Sarbanes-Oxley Act of 2002 are attached as exhibits hereto. |
SIGNATURES
Pursuant to the requirements of the Securities Exchange Act of 1934 and the Investment Company Act of 1940, the Registrant has duly caused this report to be signed on its behalf by the undersigned, thereunto duly authorized.
| AMERICAN HIGH-INCOME MUNICIPAL BOND FUND | |
| By __/s/ Kristine M. Nishiyama________________ | |
Kristine M. Nishiyama, Executive Vice President and Principal Executive Officer | |
| Date: September 30, 2020 |
Pursuant to the requirements of the Securities Exchange Act of 1934 and the Investment Company Act of 1940, this report has been signed below by the following persons on behalf of the Registrant and in the capacities and on the dates indicated.
| By _ /s/ Kristine M. Nishiyama_____________ |
Kristine M. Nishiyama, Executive Vice President and Principal Executive Officer |
| Date: September 30, 2020 |
| By ___/s/ Brian C. Janssen__________________ |
Brian C. Janssen, Treasurer and Principal Financial Officer |
| Date: September 30, 2020 |