Table of Contents
UNITED STATES
SECURITIES AND EXCHANGE COMMISSION
Washington, D.C. 20549
Form 6-K
Report of Foreign Issuer
Pursuant to Rule 13a-16 or 15d-16 under
the Securities Exchange Act of 1934
For the Month of May 2022
Commission File Number: 001-32294
TATA MOTORS LIMITED
(Translation of registrant’s name into English)
BOMBAY HOUSE
24, HOMI MODY STREET,
MUMBAI 400 001, MAHARASHTRA, INDIA
Telephone # 91 22 6665 8282
(Address of principal executive office)
Indicate by check mark whether the registrant files or will file annual reports under cover Form 20-F or Form 40-F.
Form 20-F ☒ Form 40-F ☐
Indicate by check mark if the registrant is submitting the Form 6-K in paper as permitted by Regulation S-T Rule 101(b)(1):
Yes ☐ No ☒
Indicate by check mark if the registrant is submitting the Form 6-K in paper as permitted by Regulation S-T Rule 101(b)(7):
Yes ☐ No ☒
Table of Contents
Table of Contents
SIGNATURE
Pursuant to the requirements of the Securities Exchange Act of 1934, the registrant has duly caused this report to be signed on its behalf by the undersigned, thereunto duly authorised.
Tata Motors Limited By: /s/ Maloy Kumar Gupta Name: Maloy Kumar Gupta Title: Company Secretary
Dated: May 12, 2022 |
Table of Contents
TATA MOTORS LIMITED
Bombay House
24, Homi Mody Street,
Mumbai 400 001, Maharashtra, India
| News Release - 1 | May 12, 2022 |
Re: Intimation of outcome of Board Meeting under Regulations 30, 33, 52 and 54 of the SEBI (Listing Obligations and Disclosure Requirements) Regulations 2015 (“SEBI Listing Regulations”)
Further to our letters Sc nos. 16746 and 16772 dated April 18, 2022 and May 9, 2022 respectively, and in accordance with Regulations 30, 33, 52 and 54 of the SEBI Listing Regulations read with Schedule III, we hereby inform you that the Board of Directors of Tata Motors Limited (‘the Company’) at its Meeting held today, i.e., May 12, 2022 has inter alia, approved the following:
i. Financial Results: The Audited Standalone and Consolidated Financial Results of the Company along with Auditor’s Report thereon, for the fourth quarter and financial year ended March 31, 2022. The said Financial Results and the Auditor’s Reports are attached herewith. We also enclose herewith a copy of the Press Release and Investor Presentation with regard to the said Financial Results together with the Auditors’ Report of the Company for the fourth quarter and financial year ended March 31, 2022.
ii. Annual General Meeting: The 77th Annual General Meeting (‘AGM’) of the Company will be held on Monday, July 4, 2022, through permissible mode.
iii. Re-appointment of Statutory Auditors: The Board, based on the recommendation of the Audit Committee, has re-appointed of B S R & Co. LLP, Chartered Accountants (Firm Registration No.101248W/W – 100022) as the Statutory Auditors of the Company for the second term of 5 years, i.e., from the conclusion of the 77th AGM to be held on July 4, 2022 upto the conclusion of the 82nd AGM of the Company to be held in the year 2027, subject to approval of shareholders of the Company.
The above information is also made available on the Company’s website at www.tatamotors.com.
The Board Meeting commenced at 12:30 p.m. and concluded at 4.05 p.m.
Table of Contents
| News Release – 2 | May 12, 2022 |
CONTENTS OF THE PRESS RELEASE
Tata Motors Group Results-Q4 FY22 | May 12, 2022 |

Tata Motors Consolidated Q4 FY22 Results:
Revenue ₹ 78.4KCr, EBITDA at ₹ 8.8KCr, PBT (bei) ₹ 0.4KCr, Auto FCF ₹ 7.9 KCr
| • | Q4 FY22 Details: |
| • | JLR Revenue £4.8b down 27.1%, EBITDA at 12.6%, EBIT at 2.0% |
| • | Tata CV Revenue ₹ 18.5KCr, up 29.3%, EBITDA at 5.9% (-290 bps) |
| • | Tata PV Revenue ₹ 10.5KCr, up 62.0%, EBITDA at 6.9% (+190 bps) |
| • | FY22: Consolidated Revenues ₹ 278.5KCr (+11.5%), EBITDA 9.6% (-260 bps), EBIT 0.7% (-190 bps), PBT(bei) ₹ (6.4) KCr |
Mumbai, May 12, 2022: Tata Motors Ltd announced its results for quarter ending March 31, 2022. The results represent the details on consolidated segment level. Please refer “Reporting format” section in the end for details.
Consolidated (₹ Cr Ind AS) | Jaguar Land Rover (£m, IFRS) | Tata Commercial Vehicles (₹Cr, Ind AS) | Tata Passenger Vehicles (₹Cr, Ind AS) | |||||||||||||||||||||||||||||||
| FY’22 | VS. PY | FY’22 | VS. PY | FY’22 | VS. PY | FY’22 | VS. PY | |||||||||||||||||||||||||||
Q4 FY22 | Revenue | 78,439 | (11.5) | % | 4,767 | (27.1) | % | 18,529 | 29.3 | % | 10,491 | 62.0 | % | |||||||||||||||||||||
| EBITDA (%) | 11.2 | (320) | bps | 12.6 | (270) | bps | 5.9 | (290) | bps | 6.9 | 190 | bps | ||||||||||||||||||||||
| EBIT (%) | 3.2 | (410) | bps | 2.0 | (550) | bps | 3.4 | (220) | bps | 1.2 | 400 | bps | ||||||||||||||||||||||
| PBT (bei) | 373 | — | 9 | — | 607 | — | 42 | — | ||||||||||||||||||||||||||
| FY22 | Revenue | 278,454 | 11.5 | % | 18,320 | (7.2) | % | 52,288 | 57.9 | % | 31,515 | 89.8 | % | |||||||||||||||||||||
| EBITDA (%) | 9.6 | (260) | bps | 10.3 | (250) | bps | 3.7 | (50) | bps | 5.3 | 330 | bps | ||||||||||||||||||||||
| EBIT (%) | 0.7 | (190) | bps | (0.4) | (300) | bps | 0.4 | 130 | bps | (2.0) | 750 | bps | ||||||||||||||||||||||
| PBT (bei) | (6,374) | — | (412) | — | (133) | — | (857) | — | ||||||||||||||||||||||||||
Jaguar Land Rover (JLR): Revenue was £4.8 billion in Q4 FY22, up 1% from Q3 FY22, reflecting the higher wholesales offset partially by the impact of the runout of the previous generation Range Rover, with the New Range Rover still ramping up. The EBIT margin in the quarter was 2.0% with profit before tax about breakeven (£ 9 million) before £ (43) million exceptional charge for our business in Russia. Free Cashflow improved to £340 million, up from £164 million in Q3.
Tata Commercial Vehicles (Tata CV): Tata CV business continued to show strong sequential recovery led by MHCV segment. The business clocked its highest quarterly revenues since Q4’FY19 and grew market shares in all segments. Despite lower margins due to commodity inflation, impact was lower on PBT (bei) of ₹ 607 Crores in Q4 due to operating leverage from higher revenues.
Tata Passenger Vehicles (Tata PV): Tata PV business delivered a comprehensive turnaround in Q4 FY 22 with highest quarterly revenues of ₹10.5 K Cr (+62%), positive EBIT 1.2% and positive free cash flows. EV volumes rose to 9.1K units in Q4 and PV market share improved to 13.4% (+440bps). Robust demand for “New Forever” range and agile supply actions led to this strong performance.
Outlook: The demand remains strong despite geopolitical and inflation concerns. The supply situation is gradually improving, whereas commodity inflation is likely to remain at elevated levels. We expect performance to improve through the year as the China COVID and semiconductor supplies improve and aim to deliver strong EBIT improvement and free cash flows in FY 23 to get to near net auto debt free by FY 2024.
Page 1 of 5
Table of Contents
Tata Motors Group Results-Q4 FY22 | May 12, 2022 |
JAGUAR LAND ROVER (JLR)
HIGHLIGHTS
| • | Company sees increase in free cash flow and EBIT margin in Q4, but sales remain constrained by global semiconductor shortage |
| • | Wholesales improved 11% in Q4 to 76.5K units while full year volumes of 294,182 were down 15% |
| • | Quarterly free cash flow again positive and increased to £340 million in Q4; full year cash outflow of £1.16 billion, reflecting working capital impact of lower volumes in the first half. |
| • | Q4 EBIT margin of 2.0% with pre-tax profit before exceptional items about breakeven (£9 million); full year EBIT margin at (0.4%) with pre-tax loss before exceptional items of £0.4 billion. |
| • | Exceptional charge of £43m in the fourth quarter relating to our business in Russia |
| • | Strong demand for New Range Rover helps order book to new record at more than 168,000 units (New Range Rover 46, 000 units and Defender 41,000 units), up 13,000 units in Q4. |
| • | Our Refocus transformation programme delivers £1.5 billion of value in the year, beating £1 billion target. |
| • | Liquidity of £6.4 billion as at 31 March 2022, including £4.4 billion cash and a £2 billion undrawn revolving credit facility. |
FINANCIALS
Wholesales (excluding the China Joint Venture) in Q4 were 76,526 units, up 11% on Q3 FY22 with higher production volumes. Retail sales in Q4 were 79,008 vehicles, down 1% from Q3 FY22 as a consequence of constrained wholesales and low dealer inventories, while the mix of electrified retail sales (BEV, PHEV and MHEV) increased to 66% for the full year compared to 51% in the prior year. Wholesales for the full year FY22 were 294,182, down 15% compared to FY21. Retail sales for FY22 were 376,381, down 14% compared to FY21.
Full year performance in FY22 was significantly impacted by the constraint on production and sales resulting from the global chip shortage. Revenue was £18.3 billion, down 7% from the prior year, with a pre-tax loss of £412 million before the £ (43)m Q4 exceptional charge, compared to a PBT of £662 million before exceptional items in FY21. The impact on working capital of the reduced volumes in the first half of the financial year resulted in a free cash outflow of £1.16 billion for FY22. The working capital outflow is expected to be recovered over time as volumes gradually increase. While sales to Russia remain paused, Russia and Ukraine historically account for about 2.5% combined of global sales. The impact on production has been limited to date as a result of active management of our parts supply chain. While we have a relatively small number of parts that are sourced from the affected countries, it is too early to say how future commodity supply and pricing could be impacted.
LOOKINGAHEAD
Inflation represents an increasing headwind for the business and we expect our Refocus actions to help mitigate this in the coming year. We expect the global semiconductor shortage to continue through the next fiscal year with gradual improvement. However, the Covid lockdowns in China as well as the new Range Rover Sport model changeover are expected to limit volume improvements in Q1 possibly resulting in negative EBIT and negative free cash flows in the quarter. Volumes are expected to improve progressively thereafter, and we target achieving a 5% EBIT margin and £1bn+ positive free cash flow in FY23 for the full year. Our medium- and longer-term financial targets under the Reimagine strategy, underpinned by the Refocus transformation programme, remain unchanged, including improving EBIT margins to 10% or more by FY26 and improving cash flow to achieve near zero net debt in FY24.
Thierry Bolloré, Jaguar Land Rover’s Chief Executive Officer, said:
“The environment remains difficult in light of the global chip shortage and other challenges. However, I’m encouraged by the continuing strong customer demand for our products, highlighted by a record order book. And we are continuing to execute our Reimagine Strategy with exciting new products like the Defender, New Range Rover and just announced New Range Rover Sport while we are rapidly progressing our plans for a new generation of electric vehicles with our all electric Jaguar strategy and BEV first EMA platform for new Land Rover products.”
Page 2 of 5
Table of Contents
Tata Motors Group Results-Q4 FY22 | May 12, 2022 |
TATA COMMERCIAL VEHICLES (TATA CV)
HIGHLIGHTS
| • | Q4 revenue at ₹ 18.5KCr, (+29%), EBITDA 5.9% (-290 bps), EBIT 3.4% (-220 bps), PBT (bei) 0.6 K Cr. |
| • | FY22 revenue at ₹ 52.3KCr, (+58%), EBITDA 3.7% (-50 bps), EBIT 0.4% (130 bps), PBT (bei) (0.1) K Cr. |
| • | Q4 Tata CV global wholesales stood at 122.3K units (+7.6%). FY 22 at 367.5K units (+37%). |
| • | Q4 CV domestic wholesales at 110.0 K units (+7%), domestic retails at 107.4K units in (+ 16%). |
| • | FY 22 domestic wholesales at 322.7 K units (+34%), domestic retails at 319.1K units in (+ 53%). |
| • | Domestic CV market share improved to 44.9% in FY22 (+250 bps vs FY 21) with all segments gaining shares. |
FINANCIALS
The CV industry witnessed a strong rebound in FY 22, after two consecutive years of decline. The domestic business gained market share across all segments in FY22. The strong volumes and market share growth, with repeat customer orders, is testimony to the strong BS-VI product portfolio.Q4 revenues stood at ₹ 18.5K Cr (+29% Y-o-Y and +34% Q-o-Q). While in Q4 EBITDA margins were at 5.9% (lower 290 bps Y-o-Y), Q-o-Q there was a 330 bps recovery due to impact of price hikes, improved mix and stable commodity prices in Q4. For FY 22, business recorded revenues of ₹ 52.3K Crs (+ 58%), EBITDA margin of 3.7% (-50 bps), EBIT margin of 0.4% (+130 bps) and PBT (bei) of (0.1)K Crs. Operating leverage from higher revenues delivered better PBT (bei) despite lower EBITDA margins.
LOOKINGAHEAD
The CV industry is poised for further growth on the back of increased activity in road construction, mining and improved infrastructure spending. The supply situation continues to show gradual improvement. Despite uncertainties, business sentiments continue to be positive with increasing fleet utilization levels and freight rates. Sharp commodity inflation, however, continues to remain a challenge. The Company will continue to step-up its investments in products and new business models to deliver customer value while ensuring profitable growth. Despite near-term supply challenges and inflation concerns, the business aims to deliver strong margins recovery and profitability in FY23.
Girish Wagh, Executive Director Tata Motors Ltd said:
“The Indian Commercial Vehicles sector, deeply impacted for two successive years, showed promising signs of growth in FY22 supported by a steady recovery in the economy, rising industrial activity and reopening of markets. At Tata Motors, the early adoption of a holistic ‘Business Agility Plan’ enabled us to protect and serve the interests of our customers, dealers and suppliers as well as smartly manage supply related challenges including the global shortage of critical electronic parts. The improvement in consumer sentiment, buoyancy in e-business, firming freight rates, reopening of schools and offices and higher infrastructure spends in road construction and mining helped regenerate demand. We optimized production, introduced new passenger and cargo mobility solutions and accelerated sales to grow every quarter and gain higher market share in every segment of commercial vehicles. Looking ahead, we see significant opportunities to leverage the mega trends shaping the Indian automotive industry. We are keeping a close watch on geopolitical developments, fuel inflation and semiconductor shortage and remain optimistic whilst continuing to work closely with our customers and ecosystem partners to mitigate risks and manage uncertainties.”
Page 3 of 5
Table of Contents
Tata Motors Group Results-Q4 FY22 | May 12, 2022 |
TATA PASSENGER VEHICLES (TATA PV)
HIGHLIGHTS
| • | Q4 revenue at ₹ 10.5KCr, (+62%), EBITDA 6.9% (+190 bps), EBIT 1.2% (+400 bps), PBT (bei) positive. |
| • | FY22 revenue at ₹ 31.5KCr, (+90%), EBITDA 5.3% (+330 bps), EBIT (2.0)% (+750 bps), PBT (bei) (0.9) K Cr. |
| • | Q4 Tata PV global wholesales stood at 123.6K units (+47%). FY 22 at 372.2K units (+67%). |
| • | Q4 PV domestic wholesales at 123.1 K units (+47%), domestic retails at 115.0K units (+ 44%). |
| • | FY 22 domestic wholesales at 370.4 K units (+67%), domestic retails at 363.0K units (+ 59%). |
| • | Q4 EV volumes were highest at 9.1 K units (+432%). FY22 at 19.1Kunits (+353%). EV penetration at 7.4% |
| • | Domestic PV market share improved by 440 bps to 13.4% in Q4 FY22. |
| • | First tranche of ₹ 3,750 crores from TPG Rise Climate received. |
FINANCIALS
Tata PV business delivered a consistent and strong performance leading to the highest quarterly and annual sales in TML history. The business witnessed strong revenues of ₹ 31.5 K Cr in FY 22 (+ 90% Y-o-Y as compared to ₹ 16.6 K Cr in FY 21). Robust demand for New Forever range and agile actions taken on the supply side drove volumes growth. EV sales continued to witness a rapid growth in demand on the back of strong acceptance of Nexon EV and Tigor EV. Profitability improved significantly with positive EBIT achieved in Q4 FY 22 and strong 750 bps EBIT improvement for FY 22. Market shares continue to improve to 12.1% in FY22.
LOOKINGAHEAD
In Passenger Vehicles, the company will continue to drive strong sales performance whilst improving profitability and managing supply bottlenecks. In Electric Vehicles, the business will drive up penetration and accelerate sales further. The business is expected to deliver strong improvement in margins and profitability in FY23. The business will continue to step-up new product launches and enhance capacities to cater to increasing demand. Despite significant step-up in investments, the PV business is expected to remain self-sustaining whilst the EV business investments are well funded with the capital infusion.
Shailesh Chandra, Managing Director Tata Motors Passenger Vehicles Ltd & Tata Passenger Electric Mobility Limited said:
“In a challenging year disrupted by Covid, semi-conductor crisis and steep increase in commodity prices, Tata Motors set several new records in passenger and electric vehicles to make FY22 a landmark year. We posted our highest ever annual, quarterly and monthly sales in March 22 and introduced new nameplates and aspirational variants to substantially improve our market share overall as well as in every segment of cars and SUVs where we have a presence. We also operationalized two subsidiaries- Tata Motors Passenger Vehicles Ltd. focusing on passenger vehicles powered by IC engines and Tata Passenger Electric Mobility Limited to accelerate the development of the passenger EV business and its enabling ecosystem with TPG Rise Climate as an investor. Going forward, the demand for our ‘New Forever’ range continues to remain strong even as the semi-conductor situation and supply side challenges remains uncertain. We remain agile and will continue to take prudent actions while enhancing our focus on future-fit initiatives of transforming customer experience digitally and strengthening our established lead in sustainable mobility.”
Page 4 of 5
Table of Contents
Tata Motors Group Results-Q4 FY22 | May 12, 2022 |
ADDITIONAL COMMENTARY ON FINANCIAL STATEMENTS
(CONSOLIDATED NUMBERS, IND AS)
FINANCE COSTS
Finance costs increased by ₹ 1, 215Cr to ₹ 9,312Cr during FY’22 due to higher gross borrowings.
JOINTVENTURES, ASSOCIATESAND OTHERINCOME
For the year, net loss from joint ventures and associates amounted to ₹74Cr compared with a loss of ₹ 379Cr in FY21. Other income (excluding grants) was ₹ 929Cr in the current year versus ₹ 725Cr in the prior year
FREE CASH FLOWS
Free cash flow (automotive) in the year, was negative at ₹9.5 KCr (as compared to positive ₹5.3K Cr in FY 21), primarily due to working capital impact of ₹9.6 KCr. The business showed strong sequential recovery with positive free cash flow (automotive) of ₹ 11.9K Cr in H2.
REPORTING FORMAT
The press release represents results provided the details on consolidated segment level. The operating segment comprise of automotive segment and others.
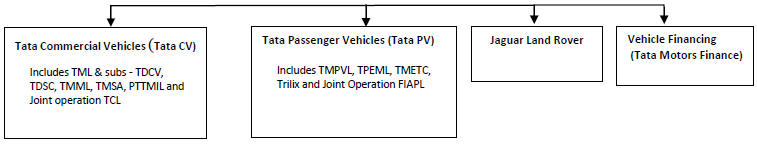
In automotive segment, results have been presented for entities basis four reportable sub-segments as below
TML Group Automotive business
For further information contact
Corporate Communications, Tata Motors Limited
Phone: 00 91 22 6665 7289; www.tatamotors.com
Page 5 of 5
Table of Contents
News Release – 3 | May 12, 2022 |
Independent Auditors Report (Consolidated)
| B S R & Co. LLP | ||
Chartered Accountants | ||
8th floor, Business Plaza, | Telephone: +91 20 6747 7300 | |
Westin Hotel Campus, | Fax: +91 20 6747 7310 | |
36/3-B, Koregaon Park Annex, | ||
Mundhwa Road, Ghorpadi, | ||
Pune - 411001, India | ||
Independent Auditor’s Report
To the Board of Directors of Tata Motors Limited
Report on the audit of the Consolidated Annual Financial Results
Opinion
We have audited the accompanying consolidated annual financial results of Tata Motors Limited (hereinafter referred to as the “Holding Company”) and its subsidiaries (the Holding Company and its subsidiaries together referred to as “the Group”), its associates and its joint ventures for the year ended 31 March 2022, attached herewith, (in which are included financial statements/financial results/financial information of two joint operations) being submitted by the Holding Company pursuant to the requirement of Regulation 33 and Regulation 52(4) read with Regulation 63 of the Securities and Exchange Board of India (Listing Obligations and Disclosure Requirements) Regulations, 2015, as amended (“Listing Regulations”).
In our opinion and to the best of our information and according to the explanations given to us and based on the consideration of reports of the other auditors on separate audited financial statements /financial results/financial information of the subsidiaries, associates, joint ventures and joint operations, the aforesaid consolidated annual financial results:
| a. | include the annual financial results of the entities mentioned in Annexure I |
| b. | are presented in accordance with the requirements of Regulation 33 and Regulation 52(4) read with Regulation 63 of the Listing Regulations in this regard; and |
| c. | give a true and fair view in conformity with the recognition and measurement principles laid down in the applicable Indian Accounting Standards, and other accounting principles generally accepted in India, of consolidated net loss and other comprehensive loss and other financial information of the Group for the year ended 31 March 2022. |
Basis for Opinion
We conducted our audit in accordance with the Standards on Auditing (“SAs”) specified under section 143(10) of the Companies Act, 2013 (“the Act”). Our responsibilities under those SAs are further described in the Auditor’s Responsibilities for the Audit of the Consolidated Annual Financial Results section of our report. We are independent of the Group, its associates and its joint ventures in accordance with the Code of Ethics issued by the Institute of Chartered Accountants of India together with the ethical requirements that are relevant to our audit of the financial statements under the provisions of the Act, and the Rules thereunder, and we have fulfilled our other ethical responsibilities in accordance with these requirements and the Code of Ethics. We believe that the audit evidence obtained by us,along with the consideration of audit reports of the other auditors referred to in sub paragraph (a) of “Other Matters” paragraph below, is sufficient and appropriate to provide a basis for our opinion on the consolidated annual financial results.
Emphasis of Matter(s)
We draw attention to Note 2 to the unaudited consolidated financial results, which describes the economic and social consequences/disruption the Group is facing as a result of COVID-19 which is impacting supply chains / consumer demand/ financial markets/commodity prices/ personnel available for work.
Our opinion is not modified in respect of this matter.
| B S R & Co. (a partnership firm with Registration No. BA61223) converted into B S R & Co. LLP (a Limited Liability Partnership with LLP Registration No. AAB-8181) with effect from October 14, 2013 | Registered Office:
14th Floor, Central B Wing and North C Wing, Nesco IT Park 4, Nesco Center, Western Express Highway, Goregaon (East), Mumbai - 400063 |
Table of Contents
B S R & Co. LLP
Independent Auditor’s Report (Continued)
Tata Motors Limited
Management’s and Board of Directors’ Responsibilities for the Consolidated Annual Financial Results
These consolidated annual financial results have been prepared on the basis of the consolidated annual financial statements.
The Holding Company’s Management and the Board of Directors are responsible for the preparation and presentation of these consolidated annual financial results that give a true and fair view of the consolidated net profit/ loss and other comprehensive income and other financial information of the Group including its associates and joint ventures in accordance with the recognition and measurement principles laid down in Indian Accounting Standards prescribed under Section 133 of the Act and other accounting principles generally accepted in India and in compliance with Regulation 33 and Regulation 52(4) read with Regulation 63 of the Listing Regulations. The respective Management and Board of Directors of the companies included in the Group and of its associates and joint ventures are responsible for maintenance of adequate accounting records in accordance with the provisions of the Act for safeguarding of the assets of each company and for preventing and detecting frauds and other irregularities; selection and application of appropriate accounting policies; making judgments and estimates that are reasonable and prudent; and the design, implementation and maintenance of adequate internal financial controls, that were operating effectively for ensuring accuracy and completeness of the accounting records, relevant to the preparation and presentation of the consolidated annual financial results that give a true and fair view and are free from material misstatement, whether due to fraud or error, which have been used for the purpose of preparation of the consolidated annual financial results by the Management and the Board of Directors of the Holding Company, as aforesaid.
In preparing the consolidated annual financial results, the respective Management and the Board of Directors of the companies included in the Group and of its associates and joint ventures are responsible for assessing the ability of each company to continue as a going concern, disclosing, as applicable, matters related to going concern and using the going concern basis of accounting unless the respective Board of Directors either intends to liquidate the company or to cease operations, or has no realistic alternative but to do so.
The respective Board of Directors of the companies included in the Group and of its associates and joint ventures is responsible for overseeing the financial reporting process of each company.
Auditor’s Responsibilities for the Audit of the Consolidated Annual Financial Results
Our objectives are to obtain reasonable assurance about whether the consolidated annual financial results as a whole are free from material misstatement, whether due to fraud or error, and to issue an auditor’s report that includes our opinion. Reasonable assurance is a high level of assurance, but is not a guarantee that an audit conducted in accordance with SAs will always detect a material misstatement when it exists. Misstatements can arise from fraud or error and are considered material if, individually or in the aggregate, they could reasonably be expected to influence the economic decisions of users taken on the basis of these consolidated annual financial results.
As part of an audit in accordance with SAs, we exercise professional judgment and maintain professional skepticism throughout the audit. We also:
| • | Identify and assess the risks of material misstatement of the consolidated annual financial results, whether due to fraud or error, design and perform audit procedures responsive to those risks, and obtain audit evidence that is sufficient and appropriate to provide a basis for our opinion. The risk of not detecting a material misstatement resulting from fraud is higher than for one resulting from error, as fraud may involve collusion, forgery, intentional omissions, misrepresentations, or the override of internal control. |
| • | Obtain an understanding of internal control relevant to the audit in order to design audit procedures that are appropriate in the circumstances. Under Section 143(3) (i) of the Act, we are also responsible for expressing our opinion through a separate report on the complete set of financial statements on whether the company has adequate internal financial controls with reference to financial statements in place and the operating effectiveness of such controls. |
| • | Evaluate the appropriateness of accounting policies used and the reasonableness of accounting estimates and related disclosures in the consolidated annual financial results made by the Management and Board of Directors. |
Table of Contents
B S R & Co. LLP
Independent Auditor’s Report (Continued)
Tata Motors Limited
| • | Conclude on the appropriateness of the Management and Board of Directors use of the going concern basis of accounting and, based on the audit evidence obtained, whether a material uncertainty exists related to events or conditions that may cast significant doubt on the appropriateness of this assumption. If we conclude that a material uncertainty exists, we are required to draw attention in our auditor’s report to the related disclosures in the consolidated annual financial results or, if such disclosures are inadequate, to modify our opinion. Our conclusions are based on the audit evidence obtained up to the date of our auditor’s report. However, future events or conditions may cause the Group and its associates and joint ventures to cease to continue as a going concern. |
| • | Evaluate the overall presentation, structure and content of the consolidated annual financial results, including the disclosures, and whether the consolidated annual financial results represent the underlying transactions and events in a manner that achieves fair presentation. |
| • | Obtain sufficient appropriate audit evidence regarding the financial results/ financial statements/financial information of the entities within the Group and its associates and joint ventures to express an opinion on the consolidated annual financial results. We are responsible for the direction, supervision and performance of the audit of financial results/ financial statements/financial information of such entities included in the consolidated annual financial results of which we are the independent auditors. For the other entities included in the consolidated annual financial results, which have been audited by other auditors, such other auditors remain responsible for the direction, supervision and performance of the audits carried out by them. We remain solely responsible for our audit opinion. Our responsibilities in this regard are further described in sub-paragraph (a) of “Other Matters” paragraph in this audit report. |
We communicate with those charged with governance of the Holding Company and such other entities included in the consolidated annual financial results of which we are the independent auditors regarding, among other matters, the planned scope and timing of the audit and significant audit findings, including any significant deficiencies in internal control that we identify during our audit.
We also provide those charged with governance with a statement that we have complied with relevant ethical requirements regarding independence, and to communicate with them all relationships and other matters that may reasonably be thought to bear on our independence, and where applicable, related safeguards.
We also performed procedures in accordance with the circular No CIR/CFD/CMD1/44/2019 issued by the Securities and Exchange Board of India under Regulation 33(8) of the Listing Regulations, to the extent applicable.
Other Matter(s)
| a. | The consolidated annual financial results include the audited financial results of one Joint Operation, whose financial statements/financial results/ financial information reflect total assets (before consolidation adjustments) of Rs. 9,273.94 crores as at 31 March 2022, total revenue (before consolidation adjustments) of Rs. 15,023.54 crores, total net profit after tax (before consolidation adjustments) of Rs. 630.20 crores and net cash outflows (before consolidation adjustments) of Rs.722.88 crores for the year ended on that date, as considered in the consolidated annual financial results, which have been audited by their independent auditor. The independent auditor’s report on financial statements/ financial results/financial information of this joint operation have been furnished to us by the management. |
Our opinion on the consolidated annual financial results, in so far as it relates to the amounts and disclosures included in respect of this joint operation, is based solely on the report of such auditor and the procedures performed by us are as stated in paragraph above.
The consolidated annual financial results include the audited financial results of one subsidiary and 76 step down subsidiaries, whose financial statements/financial results/ financial information reflect total assets (before consolidation adjustments) of Rs. 281,177.99 crores as at 31 March 2022, total revenue (before consolidation adjustments) of Rs. 196,734.98 crores and total net loss after tax (before consolidation adjustments) (net) of Rs. 7,696.53 crores and net cash inflows (before consolidation adjustments) (net) of Rs. 3,455.03 crores for the year ended on that date, as considered in the consolidated annual financial results, which have been audited by their respective independent auditors. The consolidated annual financial results also include the Group’s share of total net loss after tax of Rs. 206.37 crores for the year ended 31 March 2022, as considered in the consolidated annual financial results, in respect of five associates and two joint ventures, whose financial statements/ financial information / financial results have been audited by their respective independent auditors. The independent auditor’s report on financial statements/ financial results/financial information of these entities have been furnished to us by the management.
Table of Contents
B S R & Co. LLP
Independent Auditor’s Report (Continued)
Tata Motors Limited
Our opinion on the consolidated annual financial results, in so far as it relates to the amounts and disclosures included in respect of these entities, is based solely on the report of such auditor and the procedures performed by us are as stated in paragraph above.
Certain of these subsidiaries are located outside India whose financial results/financial statements/financial information have been prepared in accordance with accounting principles generally accepted in their respective countries and which have been audited by other auditors under generally accepted auditing standards applicable in their respective countries. The Holding Company’s management has converted the financial results/ financial statements/financial information of such subsidiaries located outside India from accounting principles generally accepted in their respective countries to accounting principles generally accepted in India. We have audited these conversion adjustments made by the Holding Company’s management. Our opinion in so far as it relates to the balances and affairs of such subsidiaries located outside India is based on the reports of other auditors and the conversion adjustments prepared by the management of the Holding Company and audited by us.
Our opinion on the consolidated annual financial results is not modified in respect of the above matters with respect to our reliance on the work done and the reports of the other auditors.
| b. | The consolidated annual financial results include the unaudited financial results of six subsidiaries and eight step down subsidiaries, whose financial statements/financial results/ financial information reflect total assets (before consolidation adjustments) of Rs. 554.31 crores as at 31 March 2022, total revenue (before consolidation adjustments) of Rs. 363.72 crores, total net profit after tax (before consolidation adjustments)(net) of Rs. 105.82 crores and net cash inflows (before consolidation adjustments) (net) of Rs 38.11 crores for the year ended on that date, as considered in the consolidated annual financial results. These unaudited financial statements/financial results/ financial information have been furnished to us by the Board of Directors. The consolidated annual financial results also include the Group’s share of total net profit after tax of Rs. 10.77 crores for the year ended 31 March 2022, as considered in the consolidated annual financial results, in respect of three associates and two joint ventures. These unaudited financial statements/ financial information / financial results have been furnished to us by the Board of Directors. |
Our opinion on the consolidated annual financial results, in so far as it relates to the amounts and disclosures included in respect of these subsidiaries, step down subsidiaries, associates and joint ventures is based solely on such financial statements/ financial results/financial information. In our opinion and according to the information and explanations given to us by the Board of Directors, these financial statements/financial results / financial information are not material to the Group.
Our opinion on the consolidated annual financial results is not modified in respect of the above matter with respect to the financial statements/financial results/financial information certified by the Board of Directors.
Table of Contents
B S R & Co. LLP
Independent Auditor’s Report (Continued)
Tata Motors Limited
| c. | The consolidated annual financial results include the results for the quarter ended 31 March 2022 being the balancing figure between the audited figures in respect of the full financial year and the published unaudited year to date figures up to the third quarter of the current financial year which were subject to limited review by us. |
| For B S R & Co. LLP | ||
| Chartered Accountants | ||
| Firm’s Registration No.:101248W/W-100022 | ||
| Shiraz Vastani | ||
| Partner | ||
| Mumbai | Membership No.: 103334 | |
| 12 May 2022 | UDIN:22103334AIVUWW1719 | |
Table of Contents
B S R & Co. LLP
Independent Auditor’s Report (Continued)
Tata Motors Limited
Annexure I
List of entities included in consolidated annual financial results.
| Sr. No | Name of component | Relationship | ||
| 1 | TML Business Services Limited (Name changed from Concorde Motors (India) Limited w.e.f March 31, 2020). | Subsidiary | ||
| 2 | Tata Technologies Limited | Subsidiary | ||
| 3 | Tata Marcopolo Motors Limited | Subsidiary | ||
| 4 | TMF Holdings Limited | Subsidiary | ||
| 5 | Tata Motors Insurance Broking & Advisory Services Limited | Subsidiary | ||
| 6 | JT Special Vehicles Pvt. Limited | Subsidiary | ||
| 7 | Trilix S.R.L | Subsidiary | ||
| 8 | Tata Hispano Motors Carrocera S.A | Subsidiary | ||
| 9 | TML Holdings Pte, Ltd; Singapore | Subsidiary | ||
| 10 | Tata Precision Industries Pte Ltd | Subsidiary | ||
| 11 | Tata Hispano Motors Carrocerries Maghreb SA | Subsidiary | ||
| 12 | Brabo Robotics and Automation Limited (Incorporated with effect from July 17, 2019) | Subsidiary | ||
| 13 | Tata Motors Passenger Vehicles Limited (Name changed from TML Business Analytics Services Limited with effect from September 17, 2021) | Subsidiary | ||
| 14 | TML CV Mobility Solutions Limited | Subsidiary | ||
| 15 | Tata Passenger Electric Mobility Ltd. (Incorporated on December 21, 2021) | Subsidiary | ||
| 16 | Jaguar Land Rover India Limited | Step down subsidiary | ||
| 17 | Tata Motors Finance Solutions Limited | Step down subsidiary | ||
| 18 | Tata Daewoo Commercial Vehicle Co Ltd | Step down subsidiary | ||
| 19 | Tata Daewoo Commercial Vehicle Sales and Distribution Company Limited | Step down subsidiary | ||
Table of Contents
B S R & Co. LLP
Independent Auditor’s Report (Continued)
Tata Motors Limited
| 20 | Tata Motors (Thailand) Ltd | Step down subsidiary | ||
| 21 | Tata Motors (SA) (Propreitary) Ltd | Step down subsidiary | ||
| 22 | P.T. Tata Motors Indonesia | Step down subsidiary | ||
| 23 | Jaguar Land Rover Automotive PLC | Step down subsidiary | ||
| 24 | PT Tata Motors Distribusi Indonesia | Step down subsidiary | ||
| 25 | TMNL Motor Services Nigeria Limited | Step down subsidiary | ||
| 26 | Jaguar Land Rover France SAS | Step down subsidiary | ||
| 27 | Jaguar Land Rover Italia SPA | Step down subsidiary | ||
| 28 | Jaguar Land Rover Portugal Veiculos e Pecas Lda | Step down subsidiary | ||
| 29 | Jaguar Land Rover Espana SL | Step down subsidiary | ||
| 30 | Jaguar Land Rover Deustcheland GmbH | Step down subsidiary | ||
| 31 | Jaguar Land Rover Austria GmbH | Step down subsidiary | ||
| 32 | Jaguar Land Rover Australia Pty Limited | Step down subsidiary | ||
| 33 | Jaguar Land Rover Japan Limited | Step down subsidiary | ||
| 34 | Jaguar Land Rover Canada ULC | Step down subsidiary | ||
| 35 | Jaguar Land Rover Belux NV (Following the merger of Jaguar Belux and Land Rover) | Step down subsidiary | ||
| 36 | Jaguar Land Rover Nederland BV | Step down subsidiary | ||
| 37 | Jaguar Land Rover (South Africa) (Pty) Ltd | Step down subsidiary | ||
| 38 | JLR Nominee Company Limited | Step down subsidiary | ||
| 39 | Jaguar Land Rover (South Africa) Holdings Limited | Step down subsidiary | ||
| 40 | Jaguar Cars Limited | Step down subsidiary | ||
| 41 | Jaguar Cars (South Africa) (Pty) Ltd | Step down subsidiary | ||
| 42 | S S Cars Limited | Step down subsidiary | ||
Table of Contents
B S R & Co. LLP
Independent Auditor’s Report (Continued)
Tata Motors Limited
| 43 | Daimler Transport Vehicles Limited | Step down subsidiary | ||
| 44 | Jaguar Land Rover North America LLC | Step down subsidiary | ||
| 45 | Jaguar Land Rover Holdings Limited | Step down subsidiary | ||
| 46 | Jaguar Land Rover Limited | Step down subsidiary | ||
| 47 | Land Rover Exports Limited ( Business Transferred to Jaguar Land Rover Exports Limited) | Step down subsidiary | ||
| 48 | The Lanchester Motor Company Limited | Step down subsidiary | ||
| 49 | The Daimler Motor Company Limited | Step down subsidiary | ||
| 50 | Jaguar Land Rover Korea Company Limited | Step down subsidiary | ||
| 51 | Jaguar land rover (China) Investment Co., Limited | Step down subsidiary | ||
| 52 | Jaguar e Land rover Brasil Industria e Comercio de veiculos LTDA | Step down subsidiary | ||
| 53 | Limited Liability Company “Jaguar land rover” (Russia) | Step down subsidiary | ||
| 54 | Land Rover Ireland Limited | Step down subsidiary | ||
| 55 | Shanghai Jaguar Land Rover Automotive Services Company Limited | Step down subsidiary | ||
| 56 | Jaguar Land Rover Pension Trustees Limited | Step down subsidiary | ||
| 57 | Jaguar Land Rover Slovakia S.R.O | Step down subsidiary | ||
| 58 | Jaguar Land Rover Singapore Pte. Ltd. | Step down subsidiary | ||
| 59 | Jaguar Racing Limited | Step down subsidiary | ||
| 60 | Inmotion Ventures Limited | Step down subsidiary | ||
| 61 | Inmotion Ventures 2 Limited | Step down subsidiary | ||
| 62 | Inmotion Ventures 3 Limited | Step down subsidiary | ||
| 63 | Jaguar Land Rover Columbia S.A.S | Step down subsidiary | ||
Table of Contents
B S R & Co. LLP
Independent Auditor’s Report (Continued)
Tata Motors Limited
| 64 | Tata Technologies Inc. | Step down subsidiary | ||
| 65 | Tata Technologies De Mexico, S.A. de C.V. | Step down subsidiary | ||
| 66 | Tata Technologies Pte Limited | Step down subsidiary | ||
| 67 | Tata Technologies (Thailand) Limited | Step down subsidiary | ||
| 68 | Tata Technologies Europe limited | Step down subsidiary | ||
| 69 | Incat International PLC | Step down subsidiary | ||
| 70 | Tata Technologies GmBH | Step down subsidiary | ||
| 71 | Cambric Limited | Step down subsidiary | ||
| 72 | Tata Technlogies SRL Romania | Step down subsidiary | ||
| 73 | Tata Manufacturing Technologies (Shanghai) Limited | Step down subsidiary | ||
| 74 | Tata Technologies Nordics AB | Step down subsidiary | ||
| 75 | Tata Motors Finance Limited | Step down subsidiary | ||
| 76 | Spark 44 (JV) Limited | Step down subsidiary | ||
| 77 | Tata Motors European Technical Centre PLC | Step down subsidiary | ||
| 78 | Spark44 Pty. Ltd. | Step down subsidiary | ||
| 79 | Spark44 GMBH | Step down subsidiary | ||
| 80 | Spark44 LLC | Step down subsidiary | ||
| 81 | Spark44 Limited | Step down subsidiary | ||
| 82 | Spark44 Middle East DMCC | Step down subsidiary | ||
| 83 | Spark44 Demand Creation Partners Limited | Step down subsidiary | ||
| 84 | Spark44 Limited | Step down subsidiary | ||
| 85 | Spark44 Pte Ltd | Step down subsidiary | ||
| 86 | Jaguar Land Rover Ireland (Services) Limited | Step down subsidiary | ||
| 87 | Spark 44 Communication SL (Madrid) | Step down subsidiary | ||
| 88 | Spark44 SRL | Step down subsidiary | ||
Table of Contents
B S R & Co. LLP
Independent Auditor’s Report (Continued)
Tata Motors Limited
| 89 | Spark Limited | Step down subsidiary | ||
| 90 | Spark44 KK | Step down subsidiary | ||
| 91 | Spark44 Canada Inc | Step down subsidiary | ||
| 92 | Spark44 South Africa (Pty) Limited | Step down subsidiary | ||
| 93 | Jaguar Land Rover Mexico, SAPi de CV - Mexico | Step down subsidiary | ||
| 94 | Jaguar Land Rover Servicios Mexico, S.A. de C.V. - Mexico | Step down subsidiary | ||
| 95 | Jaguar Land Rover Taiwan Company LTD | Step down subsidiary | ||
| 96 | Spark44 Colombia SAS | Step down subsidiary | ||
| 97 | Spark44 Taiwan Limited | Step down subsidiary | ||
| 98 | Jaguar Land Rover Hungary KFT | Step down subsidiary | ||
| 99 | Jaguar Land Rover Classic USA LLC | Step down subsidiary | ||
| 100 | Jaguar Land Rover Classic Deutschland GmbH | Step down subsidiary | ||
| 101 | Jaguar Land Rover Ventures Ltd | Step down subsidiary | ||
| 102 | Jaguar Land Rover (Ningbo) Trading Co. Limited | Step down subsidiary | ||
| 103 | Bowler Motors Limited | Step down subsidiary | ||
| 104 | In-Car Ventures Limited | Step down subsidiary | ||
| 105 | Tata Cumins Private Limited | Joint Operation | ||
| 106 | Fiat India Automobiles Private Limited | Joint Operation | ||
| 107 | Nita Company Ltd | Associate | ||
| 108 | Jaguar Cars Finance Limited | Associate | ||
| 109 | Synaptiv Limited | Associate | ||
| 110 | Cloud Car Inc | Associate | ||
| 111 | Automobile Corporation of Goa Limited | Associate | ||
| 112 | Tata Hitachi Construction Machinery Company Private Limited | Associate | ||
Table of Contents
B S R & Co. LLP
Independent Auditor’s Report (Continued)
Tata Motors Limited
| 113 | Tata Precision Industries (India) Limited | Associate | ||
| 114 | Tata Autocomp Systems Limited | Associate | ||
| 115 | Drive Club Service Pte Ltd | Associate | ||
| 116 | Inchcape JLR Europe Limited | Associate | ||
| 117 | Chery Jaguar Land Rover Automotive Company Ltd | Joint Venture | ||
| 118 | Tata HAL Technologies Limited | Joint Venture | ||
| 119 | Loginomic Tech Solutions Limited | Joint Venture | ||
| 120 | Jaguar Land Rover Schweiz AG | Joint Venture | ||
Table of Contents
| News Release – 4 | May 12, 2022 |
Consolidated Financial Results

TATA MOTORS LIMITED
Regd.Office : Bombay House, 24, Homi Mody Street, Mumbai 400 001.
CIN L28920MH1945PLC004520
(₹ in crores)
STATEMENT OF CONSOLIDATED AUDITED FINANCIAL RESULTS FOR THE QUARTER AND YEAR ENDED MARCH 31, 2022
| Quarter ended | Year ended | |||||||||||||||||||||
| March 31, | December 31, | March 31, | March 31, | March 31, | ||||||||||||||||||
| 2022 | 2021 | 2022 | 2021 | |||||||||||||||||||
Particulars | Audited [refer note 14] | Unaudited | Audited [refer note 14] | Audited | ||||||||||||||||||
| Revenue from operations | ||||||||||||||||||||||
| I | (a) Revenue | 77,857.16 | 71,406.77 | 87,772.31 | 275,235.23 | 246,972.17 | ||||||||||||||||
(b) Other operating revenues | 581.90 | 822.52 | 855.59 | 3,218.39 | 2,822.58 | |||||||||||||||||
| Total revenue from operations (a)+(b) | 78,439.06 | 72,229.29 | 88,627.90 | 278,453.62 | 249,794.75 | |||||||||||||||||
II | Other income (includes government incentives) | 902.55 | 702.57 | 691.44 | 3,053.63 | 2,643.19 | ||||||||||||||||
III | Total Income (I + II) | 79,341.61 | 72,931.86 | 89,319.34 | 281,507.25 | 252,437.94 | ||||||||||||||||
IV | Expenses | |||||||||||||||||||||
(a) Cost of materials consumed | ||||||||||||||||||||||
(i) Cost of materials consumed | 47,590.01 | 41,616.79 | 52,201.81 | 159,598.06 | 141,392.43 | |||||||||||||||||
(ii) Basis adjustment on hedge accounted derivatives | 379.14 | 352.58 | (0.57 | ) | 1,322.50 | (35.16 | ) | |||||||||||||||
(b) Purchase of products for sale | 5,350.94 | 4,874.09 | 3,812.97 | 18,374.77 | 12,250.09 | |||||||||||||||||
(c) Changes in inventories of finished goods, work-in-progress and products for sale | (2,123.66 | ) | (794.71 | ) | 979.02 | 1,590.49 | 4,684.16 | |||||||||||||||
(d) Employee benefits expense (refer note 7) | 8,029.42 | 7,651.04 | 7,982.99 | 30,808.52 | 27,648.48 | |||||||||||||||||
(e) Finance costs | 2,380.52 | 2,400.74 | 2,144.83 | 9,311.86 | 8,097.17 | |||||||||||||||||
(f) Compulsorily convertible preference share measured at fair value | 14.45 | — | — | 14.45 | — | |||||||||||||||||
(g) Foreign exchange (gain)/loss (net) | 444.33 | (313.78 | ) | (628.93 | ) | 78.68 | (1,732.15 | ) | ||||||||||||||
(h) Depreciation and amortisation expense | 6,432.11 | 6,078.13 | 6,217.12 | 24,835.69 | 23,546.71 | |||||||||||||||||
(i) Product development/engineering expenses | 2,752.47 | 2,292.60 | 1,872.21 | 9,209.50 | 5,226.63 | |||||||||||||||||
(j) Other expenses | 11,640.56 | 12,935.01 | 12,601.40 | 47,133.85 | 40,921.97 | |||||||||||||||||
(k) Amount transferred to capital and other account | (3,921.39 | ) | (3,462.35 | ) | (3,566.73 | ) | (14,397.29 | ) | (12,849.13 | ) | ||||||||||||
| Total expenses (IV) | 78,968.90 | 73,630.14 | 83,616.12 | 287,881.08 | 249,151.20 | |||||||||||||||||
V | Profit/(loss) before exceptional items and tax (III - IV) | 372.71 | (698.28 | ) | 5,703.22 | (6,373.83 | ) | 3,286.74 | ||||||||||||||
VI | Exceptional Items | |||||||||||||||||||||
(a) Defined benefit pension plan amendment past service cost | — | — | — | — | 84.81 | |||||||||||||||||
(b) Employee separation cost | 1.96 | 0.10 | 116.66 | 9.83 | 459.90 | |||||||||||||||||
(c) Restructuring cost at JLR - Assets written downs, employee and third party obligations | — | — | 14,994.30 | — | 14,994.30 | |||||||||||||||||
(d) Write off/provision (reversal) for tangible/intangible assets (including under development) | — | — | 114.00 | — | 114.00 | |||||||||||||||||
(e) Reversal of Impairment in passenger vehicle business | — | — | (1,182.41 | ) | — | (1,182.41 | ) | |||||||||||||||
(f) Reversal for onerous contracts and related supplier claims | — | — | (663.00 | ) | — | (663.00 | ) | |||||||||||||||
(g) Reversal for cost of closure of operation of a subsidiary | (18.15 | ) | — | (33.06 | ) | (21.47 | ) | (46.58 | ) | |||||||||||||
(h) Reversal of Impairment in subsidiaries (refer note 9) | — | (86.26 | ) | — | (86.26 | ) | — | |||||||||||||||
(i) Cost of slump sale of passenger vehicle undertaking | 301.34 | — | — | 301.34 | — | |||||||||||||||||
(j) Provision for Russia market (refer note 11) | 428.66 | — | — | 428.66 | — | |||||||||||||||||
(k) Others (refer note 4) | — | — | — | (2.52 | ) | — | ||||||||||||||||
VII | Profit/(loss) before tax (V - VI) | (341.10 | ) | (612.12 | ) | (7,643.27 | ) | (7,003.41 | ) | (10,474.28 | ) | |||||||||||
VIII | Tax expense/(credit) (net) | |||||||||||||||||||||
(a) Current tax | 925.82 | 616.33 | 158.47 | 2,669.98 | 1,710.18 | |||||||||||||||||
(b) Deferred tax | (167.60 | ) | 109.72 | (290.89 | ) | 1,561.31 | 831.68 | |||||||||||||||
| Total tax expense/(credit) (net) (refer note 5) | 758.22 | 726.05 | (132.42 | ) | 4,231.29 | 2,541.86 | ||||||||||||||||
IX | Profit/(Loss) for the period/year from continuing operations (VII - VIII) | (1,099.32 | ) | (1,338.17 | ) | (7,510.85 | ) | (11,234.70 | ) | (13,016.14 | ) | |||||||||||
X | Share of profit/(loss) of joint ventures and associates (net) | 107.27 | (112.88 | ) | (74.49 | ) | (74.06 | ) | (378.96 | ) | ||||||||||||
XI | Profit/(Loss) for the period/year (IX + X) | (992.05 | ) | (1,451.05 | ) | (7,585.34 | ) | (11,308.76 | ) | (13,395.10 | ) | |||||||||||
| Attributable to: | ||||||||||||||||||||||
(a) Shareholders of the Company | (1,032.84 | ) | (1,516.14 | ) | (7,605.40 | ) | (11,441.47 | ) | (13,451.39 | ) | ||||||||||||
(b) Non-controlling interests | 40.79 | 65.09 | 20.06 | 132.71 | 56.29 | |||||||||||||||||
XII | Other comprehensive income/(loss) | |||||||||||||||||||||
(A) (i) Items that will not be reclassified to profit or loss | 6,320.58 | 1,467.85 | 4,170.98 | 7,480.70 | (6,866.99 | ) | ||||||||||||||||
(ii) Income tax(expense)/credit relating to items that will not be reclassified to profit or loss | (1,572.79 | ) | (383.25 | ) | (774.82 | ) | (963.79 | ) | 1,369.11 | |||||||||||||
(B) (i) Items that will be reclassified to profit or loss | (4,456.90 | ) | (876.75 | ) | (437.87 | ) | (9,002.90 | ) | 9,517.24 | |||||||||||||
(ii) Income tax (expense)/credit relating to items that will be reclassified to profit or loss | 1,033.79 | 215.74 | 147.63 | 2,030.80 | (1,100.02 | ) | ||||||||||||||||
| Total other comprehensive income/(loss) | 1,324.68 | 423.59 | 3,105.92 | (455.19 | ) | 2,919.34 | ||||||||||||||||
XIII | Total comprehensive income/(loss) for the period/year (net of tax) (XI + XII) | 332.63 | (1,027.46 | ) | (4,479.42 | ) | (11,763.95 | ) | (10,475.76 | ) | ||||||||||||
| Attributable to: | ||||||||||||||||||||||
(a) Shareholders of the Company | 291.33 | (1,092.09 | ) | (4,502.62 | ) | (11,897.28 | ) | (10,551.20 | ) | |||||||||||||
(b) Non-controlling interests | 41.30 | 64.63 | 23.20 | 133.33 | 75.44 | |||||||||||||||||
XIV | Paid-up equity share capital (face value of ₹2 each) | 765.88 | 765.86 | 765.81 | 765.88 | 765.81 | ||||||||||||||||
XV | Reserves excluding revaluation reserves | 43,795.38 | 54,480.91 | |||||||||||||||||||
XVI | Earnings per share (EPS) | |||||||||||||||||||||
| A. Ordinary shares (face value of ₹2 each) | ||||||||||||||||||||||
(a) Basic EPS | ₹ | (2.70 | ) | (3.96 | ) | (20.24 | ) | (29.88 | ) | (36.99 | ) | |||||||||||
(b) Diluted EPS | ₹ | (2.70 | ) | (3.96 | ) | (20.24 | ) | (29.88 | ) | (36.99 | ) | |||||||||||
B. ‘A’ Ordinary shares (face value of ₹2 each) | ||||||||||||||||||||||
(a) Basic EPS | ₹ | (2.70 | ) | (3.96 | ) | (20.24 | ) | (29.88 | ) | (36.99 | ) | |||||||||||
(b) Diluted EPS | ₹ | (2.70 | ) | (3.96 | ) | (20.24 | ) | (29.88 | ) | (36.99 | ) | |||||||||||
| Not annualised | ||||||||||||||||||||||
Table of Contents
Statement of Consolidated Assets and Liabilities
(₹ in crores)
| As at March 31, | As at March 31, | |||||||
| 2022 | 2021 | |||||||
| Audited | ||||||||
I. ASSETS | ||||||||
(1) Non-current assets | ||||||||
(a) Property, plant and equipment | 80,900.13 | 79,640.05 | ||||||
(b) Capital work-in-progress | 3,529.04 | 8,377.14 | ||||||
(c) Right of use assets | 6,686.02 | 6,490.66 | ||||||
(d) Goodwill | 807.17 | 803.72 | ||||||
(e) Other intangible assets | 50,462.13 | 51,773.18 | ||||||
(f) Intangible assets under development | 6,722.05 | 12,586.79 | ||||||
(g) Investment in equity accounted investees | 4,349.39 | 4,200.79 | ||||||
(h) Financial assets: | ||||||||
(i) Other investments | 2,320.92 | 1,368.30 | ||||||
(ii) Finance receivables | 11,135.85 | 16,846.82 | ||||||
(iii) Loans and advances | 843.35 | 1,034.89 | ||||||
(iv) Other financial assets | 5,179.49 | 6,197.39 | ||||||
(i) Deferred tax assets (net) | 3,870.85 | 4,520.35 | ||||||
(j) Non-current tax assets (net) | 1,196.79 | 1,003.30 | ||||||
(k) Other non-current assets | 5,639.21 | 1,394.78 | ||||||
|
|
|
| |||||
| 183,642.39 | 196,238.16 | |||||||
|
|
|
| |||||
(2) Current assets | ||||||||
(a) Inventories | 35,240.34 | 36,088.59 | ||||||
(b) Financial assets: | ||||||||
(i) Other investments | 22,709.22 | 19,051.19 | ||||||
(ii) Trade receivables | 12,442.12 | 12,679.08 | ||||||
(iii) Cash and cash equivalents | 38,159.01 | 31,700.01 | ||||||
(iv) Bank balances other than (iii) above | 2,510.18 | 15,092.45 | ||||||
(v) Finance receivables | 22,095.35 | 17,868.09 | ||||||
(vi) Loans and advances | 1,671.93 | 1,610.61 | ||||||
(vii) Other financial assets | 3,799.82 | 5,413.11 | ||||||
(c) Current tax assets (net) | 259.84 | 865.31 | ||||||
(d) Assets classified as held-for-sale | 523.85 | 220.80 | ||||||
(e) Other current assets | 7,565.88 | 6,298.40 | ||||||
|
|
|
| |||||
| 146,977.54 | 146,887.64 | |||||||
|
|
|
| |||||
TOTAL ASSETS | 330,619.93 | 343,125.80 | ||||||
|
|
|
| |||||
II. EQUITY AND LIABILITIES | ||||||||
(1) Equity | ||||||||
(a) Equity share capital | 765.88 | 765.81 | ||||||
(b) Other equity | 43,795.36 | 54,480.91 | ||||||
|
|
|
| |||||
Equity attributable to owners of Tata Motors Limited | 44,561.24 | 55,246.72 | ||||||
Non-controlling interests | 4,271.06 | 1,573.49 | ||||||
|
|
|
| |||||
| 48,832.30 | 56,820.21 | |||||||
|
|
|
| |||||
Liabilities | ||||||||
(2) Non-current liabilities | ||||||||
(a) Financial liabilities: | ||||||||
(i) Borrowings | 97,759.17 | 93,112.77 | ||||||
(ii) Lease liabilities | 5,962.44 | 5,412.06 | ||||||
(iii) Other financial liabilities | 5,333.66 | 2,556.35 | ||||||
(b) Provisions | 12,955.89 | 13,606.76 | ||||||
(c) Deferred tax liabilities (net) | 1,558.44 | 1,555.89 | ||||||
(d) Other non-current liabilities | 7,535.22 | 12,312.58 | ||||||
|
|
|
| |||||
| 131,104.82 | 128,556.41 | |||||||
|
|
|
| |||||
(3) Current liabilities | ||||||||
(a) Financial liabilities: | ||||||||
(i) Borrowings | 41,917.87 | 42,791.74 | ||||||
(ii) Lease liabilities | 809.55 | 814.00 | ||||||
(iii) Trade payables | ||||||||
(a) Total outstanding dues of micro and small enterprises | 183.92 | 186.21 | ||||||
(b) Total outstanding dues of creditors other than micro and small enterprises | 59,786.46 | 67,993.63 | ||||||
(iv) Acceptances | 9,779.95 | 7,860.31 | ||||||
(v) Other financial liabilities | 14,420.24 | 13,725.64 | ||||||
(b) Provisions | 10,766.31 | 12,848.03 | ||||||
(c) Current tax liabilities (net) | 1,253.85 | 1,086.44 | ||||||
(d) Liabilities directly associated with Assets held-for-sale | 3.12 | — | ||||||
(e) Other current liabilities | 11,761.54 | 10,443.18 | ||||||
|
|
|
| |||||
| 150,682.81 | 157,749.18 | |||||||
|
|
|
| |||||
TOTAL EQUITY & LIABILITIES | 330,619.93 | 343,125.80 | ||||||
|
|
|
| |||||
Table of Contents
Statement of Consolidated Cash Flows
| (₹ in crores) | ||||||||
| For the year ended March 31, | ||||||||
| 2022 | 2021 | |||||||
| Audited | ||||||||
Cash flows from operating activities: | ||||||||
Profit/(Loss) for the period | (11,308.76 | ) | (13,395.10 | ) | ||||
Adjustments for: | ||||||||
Depreciation and amortisation expense | 24,835.69 | 23,546.71 | ||||||
Allowances for finance receivables | 1,307.59 | 957.93 | ||||||
(Reversal)/provision for trade and other receivables | — | 50.01 | ||||||
Inventory write-down | — | 129.19 | ||||||
Reversal for costs of closure of operations of a subsidiary company | (3.32 | ) | (51.99 | ) | ||||
Write off/provision (reversal) for tangible/intangible assets (including under development) | — | 114.00 | ||||||
Restructuring cost at JLR - Assets written downs, employee and third party obligations |
| 14,994.30 | ||||||
Reversal of Impairment in subsidiaries | (104.42 | ) | — | |||||
Reversal of Impairment in passenger vehicle business | — | (1,182.41 | ) | |||||
Reversal for onerous contracts and related supplier claims | — | (663.00 | ) | |||||
Defined benefit pension plan amendment past service cost | — | 84.81 | ||||||
Employee separation cost | — | 430.76 | ||||||
Accrual for share-based payments | 18.05 | 9.04 | ||||||
Marked-to-market gain on investments measured at fair value through profit or loss | — | (19.91 | ) | |||||
Loss on sale of assets (including assets scrapped/written off) (net) | 94.19 | 265.59 | ||||||
Profit on sale of investments (net) | (266.56 | ) | (177.26 | ) | ||||
Share of loss of joint ventures and associates (net) | 74.06 | 378.96 | ||||||
Tax expense (net) | 4,231.29 | 2,541.86 | ||||||
Finance costs | 9,326.31 | 8,097.17 | ||||||
Interest income | (625.22 | ) | (492.53 | ) | ||||
Dividend income | (34.22 | ) | (18.37 | ) | ||||
Foreign exchange gain (net) | (878.51 | ) | (4,402.12 | ) | ||||
|
|
|
| |||||
Cash flows from operating activities before changes in following assets and liabilities | 26,666.17 | 31,197.64 | ||||||
Finance receivables | (75.63 | ) | (4,386.94 | ) | ||||
Trade receivables | 412.34 | (1,118.35 | ) | |||||
Loans and advances and other financial assets | 129.26 | (1,308.92 | ) | |||||
Other current and non-current assets | (5,312.17 | ) | 3,853.53 | |||||
Inventories | 597.40 | 3,814.50 | ||||||
Trade payables and acceptances | (7,011.86 | ) | 5,748.15 | |||||
Other current and non-current liabilities | (3,065.37 | ) | 2,217.87 | |||||
Other financial liabilities | (178.55 | ) | (1,168.39 | ) | ||||
Provisions | 4,030.88 | (7,744.02 | ) | |||||
|
|
|
| |||||
Cash from operations | 16,192.47 | 31,105.07 | ||||||
Income tax paid (net) | (1,909.64 | ) | (2,104.56 | ) | ||||
|
|
|
| |||||
Net cash from operating activities | 14,282.83 | 29,000.51 | ||||||
|
|
|
| |||||
Cash flows from investing activities: | ||||||||
Payments for property, plant and equipments | (9,039.40 | ) | (11,775.65 | ) | ||||
Payments for other intangible assets | (6,129.02 | ) | (8,429.75 | ) | ||||
Proceeds from sale of property, plant and equipments | 230.10 | 350.58 | ||||||
Investments in mutual fund (purchased)/sold (net) | (2,968.54 | ) | (7,432.85 | ) | ||||
Disposal of subsidiary companies | (98.45 | ) | — | |||||
Investment in equity accounted investees | — | (9.90 | ) | |||||
Investment in Government securities | (1,228.21 | ) | — | |||||
Investments - others | (39.71 | ) | (97.30 | ) | ||||
Proceeds from sale of investments in other companies | 103.55 | 225.82 | ||||||
Proceeds from disposal of defence business | 234.09 | — | ||||||
Interest received | 652.94 | 427.51 | ||||||
Dividend received | 32.01 | 18.37 | ||||||
Dividend received from equity accounted investees | — | 1.51 | ||||||
Deposit/restricted deposits with financial institution | (600.00 | ) | (1,000.00 | ) | ||||
Deposits/restricted deposits with banks | (13,203.08 | ) | (38,243.27 | ) | ||||
Realisation of deposits/restricted deposits with banks | 25,978.60 | 39,088.68 | ||||||
Realisation of deposit with financial institution | 1,300.00 | 750.00 | ||||||
|
|
|
| |||||
Net cash used in investing activities | (4,775.12 | ) | (26,126.25 | ) | ||||
|
|
|
| |||||
Cash flows from financing activities: | ||||||||
Proceeds from issue of shares, warrants and share application pending allotment (net of issue expenses) | 18.59 | 2,602.51 | ||||||
Proceeds from issuance of compulsorily convertible preference shares | 3,750.00 | — | ||||||
Proceeds from long-term borrowings | 31,308.62 | 29,642.36 | ||||||
Repayment of long-term borrowings | (23,355.80 | ) | (18,629.61 | ) | ||||
Proceeds/(payment) from option settlement of long term borrowings | (97.77 | ) | 35.01 | |||||
Repayment of matured fixed deposits | — | (0.48 | ) | |||||
Proceeds from short-term borrowings | 16,866.24 | 20,807.15 | ||||||
Repayment of short-term borrowings | (19,460.45 | ) | (11,078.93 | ) | ||||
Net change in other short-term borrowings (with maturity up to three months) | (1,975.59 | ) | (4,544.27 | ) | ||||
Repayment of lease liability ( including interest) | (1,558.95 | ) | (1,477.28 | ) | ||||
Dividend paid to non-controlling interest shareholders of subsidiaries | (98.39 | ) | (28.75 | ) | ||||
Proceeds from issuance /(payment) for acquisition of shares from non-controlling | — | 0.24 | ||||||
Dividend paid (including transferred to IEPF) | (1.53 | ) | (1.56 | ) | ||||
Proceeds from issuance of perpetual debt instrument classified as equity by a subsidiary (net) | 476.28 | 700.75 | ||||||
Interest paid [including discounting charges paid ₹1,082.52 crores (March 31, 2021 ₹1,201.20 crores)] | (9,251.42 | ) | (8,122.94 | ) | ||||
|
|
|
| |||||
Net cash (used in)/from financing activities | (3,380.17 | ) | 9,904.20 | |||||
|
|
|
| |||||
Net increase in cash and cash equivalents | 6,127.54 | 12,778.46 | ||||||
Cash and cash equivalents as at April 1, (opening balance) | 31,700.01 | 18,467.80 | ||||||
Effect of foreign exchange on cash and cash equivalents | 331.46 | 453.75 | ||||||
|
|
|
| |||||
Cash and cash equivalents as at March 31, (closing balance) | 38,159.01 | 31,700.01 | ||||||
|
|
|
| |||||
Non-cash transactions: | ||||||||
Liability towards property, plant and equipment and intangible assets purchased on credit/deferred credit | 4,547.68 | 5,367.84 | ||||||
|
|
|
| |||||
Table of Contents
Segment wise Revenue, Results, Assets and Liabilities
The Company primarily operates in the automotive segment. The automotive segment includes all activities relating to development, design, manufacture, assembly and sale of vehicles including financing thereof, as well as sale of related parts and accessories. The Company provides financing for vehicles sold by dealers in India. The vehicle financing is intended to drive sale of vehicles by providing financing to the dealers’ customers and as such is an integral part of automotive business. The operating results for Vehicle Financing has been adjusted only for finance cost for the borrowings sourced by this segment.
Operating segments consist of :
| a) | Automotive: The Automotive segment consists of four reportable sub-segments: Tata Commercial Vehicles, Tata Passenger Vehicles, Jaguar Land Rover and Vehicle Financing. |
| b) | Others: Others consist of IT services and Insurance Broking services. |
Other operating segments do not meet the quantitative thresholds for disclosure and have been aggregated.
This segment information is provided to and reviewed by Chief Operating Decision Maker (CODM).
| (₹ in crores) | ||||||||||||||||||||||
Particulars | Quarter ended | Year ended | ||||||||||||||||||||
| March 31, | December 31, | March 31, | March 31, | March 31, | ||||||||||||||||||
| 2022 | 2021 | 2022 | 2021 | |||||||||||||||||||
| Audited [refer note 14] | Unaudited | Audited [refer note 14] | Audited | |||||||||||||||||||
A. | Segment Revenue : | |||||||||||||||||||||
| Revenue from operations | ||||||||||||||||||||||
I. | Automotive and related activity | |||||||||||||||||||||
| - Tata and other brands vehicles | ||||||||||||||||||||||
(a) Commercial Vehicle | 18,528.87 | 13,785.60 | 14,333.81 | 52,287.30 | 33,104.14 | |||||||||||||||||
(b) Passenger Vehicle | 10,491.32 | 8,492.60 | 6,475.18 | 31,514.90 | 16,606.24 | |||||||||||||||||
(c) Corporate/Unallocable | 184.15 | 42.73 | 147.29 | 314.35 | 282.76 | |||||||||||||||||
| - Vehicle Financing | 1,085.04 | 1,181.62 | 1,229.47 | 4,584.58 | 4,490.45 | |||||||||||||||||
| - Jaguar and Land Rover | 48,022.57 | 47,915.13 | 66,074.61 | 187,696.74 | 193,822.71 | |||||||||||||||||
| Less: Intra segment eliminations | (546.24 | ) | (23.42 | ) | (59.43 | ) | (618.20 | ) | (125.28 | ) | ||||||||||||
|
|
|
|
|
|
|
|
|
| |||||||||||||
| -Total | 77,765.71 | 71,394.26 | 88,200.93 | 275,779.67 | 248,181.02 | |||||||||||||||||
II. | Others | 987.13 | 1,114.15 | 718.99 | 3,809.13 | 2,612.46 | ||||||||||||||||
|
|
|
|
|
|
|
|
|
| |||||||||||||
| Total Segment Revenue | 78,752.84 | 72,508.41 | 88,919.92 | 279,588.80 | 250,793.48 | |||||||||||||||||
| Less: Inter segment revenue | (313.78 | ) | (279.12 | ) | (292.02 | ) | (1,135.18 | ) | (998.73 | ) | ||||||||||||
|
|
|
|
|
|
|
|
|
| |||||||||||||
| Revenue from Operations | 78,439.06 | 72,229.29 | 88,627.90 | 278,453.62 | 249,794.75 | |||||||||||||||||
|
|
|
|
|
|
|
|
|
| |||||||||||||
B. | Segment results before other income (excluding government incentives), finance costs, foreign exchange gain/(loss) (net), exceptional items and tax: | |||||||||||||||||||||
I. | Automotive and related activity | |||||||||||||||||||||
| - Tata and other brands vehicles | ||||||||||||||||||||||
(a) Commercial Vehicle | 673.37 | (62.14 | ) | 801.88 | 210.21 | (305.44 | ) | |||||||||||||||
(b) Passenger Vehicle | 140.72 | (297.13 | ) | (177.83 | ) | (660.13 | ) | (1,564.16 | ) | |||||||||||||
(c) Corporate/Unallocable | 46.23 | 16.05 | (4.46 | ) | (62.47 | ) | (74.89 | ) | ||||||||||||||
| - Vehicle Financing (net off finance costs pertaining to borrowings sourced by the segment) | (41.16 | ) | (49.52 | ) | 29.32 | (253.19 | ) | (57.45 | ) | |||||||||||||
| - Jaguar and Land Rover | 1,414.28 | 699.86 | 5,595.38 | (439.39 | ) | 7,691.03 | ||||||||||||||||
| Less: Intra segment eliminations | (90.20 | ) | — | — | (90.20 | ) | — | |||||||||||||||
|
|
|
|
|
|
|
|
|
| |||||||||||||
| -Total | 2,143.24 | 307.12 | 6,244.29 | (1,295.17 | ) | 5,689.09 | ||||||||||||||||
II. | Others | 170.98 | 198.69 | 117.99 | 624.73 | 319.47 | ||||||||||||||||
|
|
|
|
|
|
|
|
|
| |||||||||||||
| Total Segment results | 2,314.22 | 505.81 | 6,362.28 | (670.44 | ) | 6,008.56 | ||||||||||||||||
| Less: Inter segment eliminations | (12.13 | ) | 26.07 | 6.30 | 53.75 | 66.70 | ||||||||||||||||
|
|
|
|
|
|
|
|
|
| |||||||||||||
| Net Segment results | 2,302.09 | 531.88 | 6,368.58 | (616.69 | ) | 6,075.26 | ||||||||||||||||
| Add/(Less) : Other income (excluding Government Incentives) | 242.42 | 196.96 | 141.73 | 928.92 | 725.05 | |||||||||||||||||
| Add/(Less) : Finance costs (excluding pertaining to borrowings sourced by the vehicle finance segment) | (1,727.47 | ) | (1,740.90 | ) | (1,436.02 | ) | (6,607.38 | ) | (5,245.72 | ) | ||||||||||||
| Add/(Less) : Foreign exchange gain/(loss) (net) | (444.33 | ) | 313.78 | 628.93 | (78.68 | ) | 1,732.15 | |||||||||||||||
| Add/(Less) : Exceptional items | ||||||||||||||||||||||
| - Tata and other brands vehicles | ||||||||||||||||||||||
(a) Commercial Vehicle | (55.56 | ) | (0.61 | ) | (9.31 | ) | (52.50 | ) | (53.66 | ) | ||||||||||||
(b) Passenger Vehicle | (233.19 | ) | 86.26 | 1,682.22 | (147.21 | ) | 1,673.71 | |||||||||||||||
(c) Corporate/Unallocable | 3.60 | 0.51 | (19.69 | ) | (0.10 | ) | (24.96 | ) | ||||||||||||||
| - Jaguar and Land Rover | (428.66 | ) | — | (14,994.30 | ) | (428.66 | ) | (15,350.70 | ) | |||||||||||||
| - Others | — | — | (5.41 | ) | (1.11 | ) | (5.41 | ) | ||||||||||||||
|
|
|
|
|
|
|
|
|
| |||||||||||||
| Total Profit/(loss) before tax | (341.10 | ) | (612.12 | ) | (7,643.27 | ) | (7,003.41 | ) | (10,474.28 | ) | ||||||||||||
|
|
|
|
|
|
|
|
|
| |||||||||||||
| As at December 31, | As at March 31, | As at March 31, | ||||||||||||||||||||
| 2021 | 2022 | 2021 | ||||||||||||||||||||
| C. | Segment Assets | Unaudited | Audited | Audited | ||||||||||||||||||
I. | Automotive and related activity | |||||||||||||||||||||
| - Tata and other brands vehicles | ||||||||||||||||||||||
(a) Commercial Vehicle | 28,628.67 | 30,407.96 | 27,086.92 | |||||||||||||||||||
(b) Passenger Vehicle | 19,506.96 | 15,877.08 | 16,296.91 | |||||||||||||||||||
(c) Corporate/Unallocable - (including assets classified as held for sale) | 795.43 | 856.80 | 2,306.98 | |||||||||||||||||||
| - Vehicle Financing (including assets classified as held for sale) | 36,924.86 | 38,994.57 | 39,565.55 | |||||||||||||||||||
| - Jaguar and Land Rover (including assets classified as held for sale) | 170,271.77 | 172,273.81 | 179,341.50 | |||||||||||||||||||
|
|
|
|
|
| |||||||||||||||||
| -Total | 256,127.69 | 258,410.22 | 264,597.86 | |||||||||||||||||||
II. | (a) Others | 3,327.93 | 3,465.00 | 2,477.58 | ||||||||||||||||||
|
|
|
|
|
| |||||||||||||||||
| Total Segment Assets | 259,455.62 | 261,875.22 | 267,075.44 | |||||||||||||||||||
| Less: Inter segment eliminations | (1,222.00 | ) | (1,129.43 | ) | (1,269.89 | ) | ||||||||||||||||
|
|
|
|
|
| |||||||||||||||||
| Net Segment Assets | 258,233.62 | 260,745.79 | 265,805.55 | |||||||||||||||||||
| Investment in equity accounted investees | ||||||||||||||||||||||
| - Tata and other brands vehicles - Corporate/Unallocable | 485.63 | 554.25 | 427.14 | |||||||||||||||||||
| - Jaguar and Land Rover | 3,092.42 | 3,192.99 | 3,182.53 | |||||||||||||||||||
| - Others | 590.81 | 602.15 | 591.12 | |||||||||||||||||||
| Add : Unallocable assets | 63,310.44 | 65,524.75 | 73,119.46 | |||||||||||||||||||
|
|
|
|
|
| |||||||||||||||||
| Total Assets | 325,712.92 | 330,619.93 | 343,125.80 | |||||||||||||||||||
|
|
|
|
|
| |||||||||||||||||
D. | Segment Liabilities | |||||||||||||||||||||
I. | Automotive and related activity | |||||||||||||||||||||
| - Tata and other brands vehicles | ||||||||||||||||||||||
(a) Commercial Vehicle | 18,434.01 | 21,230.50 | 18,038.77 | |||||||||||||||||||
(b) Passenger Vehicle | 8,288.98 | 10,932.34 | 6,035.88 | |||||||||||||||||||
(c) Corporate/Unallocable | 1,171.46 | 209.55 | 1,106.16 | |||||||||||||||||||
| - Vehicle Financing | 1,105.33 | 966.20 | 837.32 | |||||||||||||||||||
| - Jaguar and Land Rover (including liabilities for assets classified as held for sale) | 93,062.35 | 94,698.42 | 114,420.20 | |||||||||||||||||||
| Less: Intra segment eliminations | — | (88.60 | ) | — | ||||||||||||||||||
|
|
|
|
|
| |||||||||||||||||
| -Total | 122,062.13 | 127,948.41 | 140,438.33 | |||||||||||||||||||
II. | (a) Others | 1,708.29 | 2,020.15 | 1,508.46 | ||||||||||||||||||
|
|
|
|
|
| |||||||||||||||||
| Total Segment Liabilities | 123,770.42 | 129,968.56 | 141,946.79 | |||||||||||||||||||
| Less: Inter segment eliminations | (283.64 | ) | (269.78 | ) | (271.47 | ) | ||||||||||||||||
|
|
|
|
|
| |||||||||||||||||
| Net Segment Liabilities | 123,486.78 | 129,698.78 | 141,675.32 | |||||||||||||||||||
| Add : Unallocable liabilities | 156,342.66 | 152,088.81 | 144,630.27 | |||||||||||||||||||
|
|
|
|
|
| |||||||||||||||||
| Total Liabilities | 279,829.44 | 281,787.59 | 286,305.59 | |||||||||||||||||||
|
|
|
|
|
| |||||||||||||||||
Table of Contents
Notes:-
| 1) | The above results were reviewed and recommended by the Audit Committee and approved by the Board of Directors at its meeting held on May 12, 2022. |
| 2) | COVID-19 pandemic has rapidly spread throughout the world, including India. Governments in India and across the world have taken significant measures to curb the spread of the virus including imposing mandatory lockdowns and restrictions in activities. Consequently, Company’s manufacturing plants and offices had to be closed down / operate under restrictions for a certain period of time. Lockdowns / restrictions have impacted the Company operationally including on commodity prices, supply chain matters (including semiconductor supplies), consumer demand and recoveries of loans under its vehicle financing business. The Company is monitoring the situation closely taking into account the directives from the various Governments. Management believes that it has taken into account all the possible impacts of known events arising from COVID-19 pandemic in the preparation of the financial results including but not limited to its assessment of Company’s liquidity and going concern, recoverable values of its property, plant and equipment, intangible assets, intangible assets under development, allowances for losses for finance receivables and the net realisable values of other assets. However, given the effect of these lockdowns and restrictions on the overall economic activity and in particular on the automotive industry, the impact assessment of COVID-19 on the above mentioned financial statement captions is subject to significant estimation uncertainties due to its nature and duration and, accordingly, the actual impacts in future may be different from those estimated as at the date of approval of these financial results. The Company will continue to monitor any material changes to future economic conditions and consequential impact on its financial results. |
| 3) | During the year ended March 31, 2020, the Company had allotted 20,16,23,407 Ordinary Shares at a price of ₹150 per Ordinary Share aggregating to ₹3,024.35 crores and 23,13,33,871 Convertible Warrants (‘Warrants’), each carrying a right to subscribe to one Ordinary Share per Warrant, at a price of ₹150 per Warrant (‘Warrant Price’), aggregating to ₹3,470.00 crores on a preferential basis to Tata Sons Private Limited. An amount equivalent to 25% of the Warrant Price was paid at the time of subscription and the balance 75% of the Warrant Price was payable by the Warrant holder against each Warrant at the time of allotment of Ordinary Shares pursuant to exercise of the options attached to Warrant(s) to subscribe to Ordinary Share(s), by June 2021. The Company has fully utilized the amount of ₹3,891.85 crores towards repayment of debt, and other general corporate purposes of the Company and its subsidiaries. During the year ended March 31, 2021, on exercise of options by Tata Sons Private Ltd and on receipt of balance subscription money of ₹2,602.51 crores, the Company has fully converted 23,13,33,871 convertible warrants into Ordinary Shares. As at March 31, 2022 the Company has fully utilised amount towards repayment of debt, and other general corporate purposes of the Company. |
| 4) | During the year ended March 31, 2022, the Company has completed the sale of certain assets related to defence business to Tata Advanced Systems Limited (TASL) for sale consideration of ₹234.09 crores againts the Net Assets of ₹231.57 crores resulting in a gain of ₹2.52 crores recorded as an exceptional item in Statement of Profit and Loss. |
| 5) | Despite a loss during the year ended March 31, 2022, a tax charge of ₹3,756.01 crores (£367 million) was incurred at Jaguar Land Rover as a result of inability to recognise UK deferred tax assets arising in the period due to current UK loss profile amounting to ₹3,380.26 crores (£331 million). |
| 6) | The Indian Parliament has approved the Code on Social Security, 2020 which would impact the contributions by the company towards Provident Fund and Gratuity. The Ministry of Labour and Employment has released draft rules for the Code on Social Security, 2020 on November 13, 2020, and has invited suggestions from stakeholders which are under active consideration by the Ministry. The Company will assess the impact and its evaluation once the subject rules are notified and will give appropriate impact in its financial statements in the period in which, the Code becomes effective and the related rules to determine the financial impact are published. |
| 7) | Employee benefits expense for the year ended March 31, 2022 and March 31, 2021 is net of Government grants received by certain subsidiary companies amounting to ₹148.31 crores (£14.45 million) and ₹1,883.01 crores (£188.89 million), respectively. |
| 8) | The Company at its Board meeting held on October 12, 2021, approved the incorporation of a wholly owned subsidiary (“TML EV Co”) to undertake its passenger electric mobility business and executed a Securities Subscription Agreement with India Markets Rio Pte Ltd, an entity affiliated with TPG Rise Climate (the climate investing strategy of TPG’s global impact investing platform TPG Rise) for an aggregate investment of ₹7,500 crores in TML EV Co over the period of 18 months, subject to fulfilment of certain condition precedent, from the date of completion of the first tranche. Accordingly, Tata Passenger Electric Mobility Limited (TPEML) was formed on December 21, 2021. The transaction involves the primary investment of ₹7,500 crores by TPG Rise Climate in TPEML in tranches; and issuance and allotment of compulsorily convertible preference shares, having face value of ₹1,000 each, by TPEML to TPG Rise Climate in lieu of such investment. The total amount of investment of ₹7,500 crores is bifurcated into two instruments CCPS A1 and CCPS A2 of investment of ₹5,000 crores and investment of ₹2,500 crores, respectively. The remittance of the first tranche of ₹3,750 crores (50% of each instrument) has been received on March 29, 2022. |
CCPS A1 is convertible into fixed number of equity shares of TPEML and hence has been classified as equity in the financial statements of TPEML. In these consolidated financial statements, CCPS A1 has been reflected as part of non-controlling interests. CCPS A2 is convertible into variable number of equity shares of TPEML and hence has been classified as financial liability at fair value through profit and loss in the financial statements of TPEML and in these consolidated financial statements. As at March 31, 2022 the fair value of CCPS A2 is ₹1,250 crores.
CCPS A1 is convertible into equity shares at any time after 2 years, at the option of the investor, and is convertible compulsorily and automatically at the agreed conversion date, which is linked to meeting one of the agreed conditions. CCPS A2 is convertible compulsorily and automatically into such number of equity shares determined as per a pre-determined formula at the conversion date, which is linked to meeting one of the agreed conditions.
The Shareholders Agreement dated, November 16, 2021, contemplates that TML shall provide certain exit options to TPG between April 1, 2027 and September 30, 2028 at discretion of TML. In case such exit has not materialized by such time, investor can opt to get an exit through an IPO of TPEML or through listed shares of TML via share swap or merger of TPEML with TML, with both valued at FMV. As one of the exit options could require the Company to issue a variable number of its equity shares under a share-swap or merger arrangement, in exchange for the shares of TPEML held by TPG Rise Climate, the Company has accounted for the optionality of swapping CCPS A1 and A2 as a derivative liability on net basis at fair value. As at March 31, 2022 the fair value of the option derivative value is zero.
| 9) | As part of slump sale (passenger vehicle undertaking), the investments in wholly owned subsidiaries of the Company engaged in designing services namely Tata Motors European Technical Centre PLC (TMETC) and Trilix S.r.l (Trilix) have been transferred to Tata Motors Passenger Vehicle Limited, a wholly owned subsidiary of the Company, w.e.f. January 1, 2022. These subsidiaries are being transferred to Tata Passenger Electric Mobility Ltd., a wholly owned subsidiary of the Company. Considering the business plans for these subsidiaries, the Company reassessed the recoverable value of assets belonging to its subsidiaries TMETC and Trilix and accordingly provision for impairment towards the assets is reversed amounting to ₹38.18 crores (£3.8 million) and ₹48.08 crores (€5.6 million) in TMETC and Trilix, respectively. |
| 10) | Annual disclosure for reporting of fund raising of issuance of Debt Securities by Holding Company : |
| (₹ in crores) | ||||||||
| Year ended March 31, 2022 | Year ended | |||||||
Sr No Particulars | ||||||||
(i) | Incremental borrowing done (a) | 2,000.00 | 4,500.00 | |||||
(ii) | Mandatory borrowing to be done through issuance of debt securities (b) = (25% of a) | 500.00 | 1,125.00 | |||||
(iii) | Actual borrowings done through debt securities (c) | 1,000.00 | 1,000.00 | |||||
(iv) | Shortfall in the mandatory borrowing through debt securities, if any (d) = (b) - (c) | — | 125.00 | |||||
(v) | Reasons for short fall, if any, in mandatory borrowings through debt securities | — | COVID 19- shallow market | |||||
Table of Contents
| 11) | During the year ended March 31, 2022, Jaguar Land Rover has created a provision of ₹428.66 crores (£43.00 million) in relation to customer liabilities arising from sanctions imposed against Russia by many countries, preventing the shipment of vehicles and certain parts to the market. |
| 12) | Additional Information pursuant to requirement of Regulation 52(4) and Regulation 54(2) of the Securities and Exchange Board of India (Listing Obligations and Disclosure Requirements) Regulation 2015 as amended and as at year ended March 31, 2022: |
Sr | Particulars | Quarter ended | Year ended | |||||||||||||||||||
| March 31 | December 31 | March 31 | March 31 |
| ||||||||||||||||||
| 2022 | 2021 |
| 2022 | 2021 | ||||||||||||||||||
| Audited [refer note 14] | Unaudited | Audited [refer note 14] | Audited | |||||||||||||||||||
a) | Debt Equity Ratio (number of times) [Total Debt(i)/Equity(ii)] | 3.13 | 3.33 | 2.46 | 3.13 | 2.46 | ||||||||||||||||
b) | Debt Service Coverage Ratio (number of times) (not annualised) [(Profit/ (loss) before exceptional items and tax + Interest on borrowings)/(Interest on borrowings + Repayment of borrowings)(iii)] | 0.18 | 0.21 | 0.67 | 0.04 | 0.50 | ||||||||||||||||
c) | Interest Service Coverage Ratio (number of times) (not annualised) [(Profit/ (loss) before exceptional items and tax +Interest on borrowings)/Interest on borrowings] | 1.18 | 0.66 | 4.25 | 0.19 | 1.49 | ||||||||||||||||
d) | Capital redemption reserve (₹ In crores) | 2.28 | 2.28 | 2.28 | 2.28 | 2.28 | ||||||||||||||||
e) | Debenture redemption reserve (₹ In crores) | 411.14 | 904.44 | 904.44 | 411.14 | 904.44 | ||||||||||||||||
f) | Net worth(iv) (₹ In crores) | 44,561.24 | 43,901.74 | 55,246.72 | 44,561.24 | 55,246.72 | ||||||||||||||||
g) | Current ratio (number of times) [Current assets / Current liabilities] | 0.98 | 0.98 | 0.93 | 0.98 | 0.93 | ||||||||||||||||
h) | Long term debt to working capital (number of times) [Long Term Borrowings(v) / Working capital(vi)] | 5.42 | 6.35 | 9.62 | 5.42 | 9.62 | ||||||||||||||||
i) | Bad debts to Account receivable ratio (%) [Bad Debts(vii) / Average of trade and other receivables(viii)] | 0.27 | % | 0.03 | % | 0.02 | % | 1.01 | % | 0.63 | % | |||||||||||
j) | Current liability ratio (number of times) [Current Liabilities (excluding current maturities of Iong term debt and interest accrued on borrowings) / (Total liabilities)] | 0.44 | 0.43 | 0.47 | 0.44 | 0.47 | ||||||||||||||||
k) | Total debts to total assets (number of times) [(Non current borrowings + Current borrowings) / Total assets] | 0.42 | 0.45 | 0.40 | 0.42 | 0.40 | ||||||||||||||||
l) | Debtors turnover (in times) (not annualised) [Revenue from operations (excluding finance revenue) / Average trade receivables] | 6.47 | 6.72 | 8.03 | 21.84 | 20.61 | ||||||||||||||||
m) | Inventory turnover (in times) (not annualised) [Raw material consumed (ix)/ Average inventory(x) ] | 1.50 | 1.41 | 1.57 | 5.07 | 4.30 | ||||||||||||||||
n) | Operating margin (%) [(Profit/ (loss) before exceptional items and tax + Finance costs (excluding finance costs pertaining to borrowings sourced by vehicle financing segment) + Foreign exchange (gain)/loss (net)+ Depreciation and amortisation expense - Other Income (excluding incentives)) / Revenue from operations] | 11.14 | % | 9.15 | % | 14.20 | % | 8.70 | % | 11.86 | % | |||||||||||
o) | Net profit margin (%) [Profit/(loss) for the period / Revenue from operations] | (1.26 | %) | (2.01 | %) | (8.56 | %) | (4.06 | %) | (5.36 | %) | |||||||||||
Notes:
| (i) | Total debt includes non-current and current borrowings. |
| (ii) | Equity = equity attributable to owners of Tata Motors Ltd |
| (iii) | Repayment of borrowing includes repayment of long-term borrowings, proceeds from short-term borrowings, repayment of short-term borrowings and net change in other short-term borrowings (with maturity up to three months). |
| (iv) | Net worth has been computed on the basis as stated in Clause 2 of the Securities and Exchange Board of India (Listing Obligations and Disclosure Requirements) Regulations, 2015 i.e. Net worth as defined in sub-section (57) of section 2 of the Companies Act, 2013. |
| (v) | Long term borrowings (including current portion of long term borrowings) |
| (vi) | Working capital = current assets - current liabilities (excluding current maturities of Iong term debt and interest accrued on borrowings) |
| (vii) | Bad debts includes written off on trade and other receivables. |
| (viii) | Average of trade and other receivables includes trade receivables, non-current and current loans and advances, non-current and current other assets. |
| (ix) | Raw material consumed includes cost of materials consumed, purchase of products for sale and changes in inventories of finished goods, work-in-progress and products for sale. |
| (x) | Inventory includes raw materials and components, work-in-progress, finished goods, stores and spare parts, consumable tools and goods-in-transit - raw materials and components. |
| 13) | Previous period figures have been re-grouped/ re-classified wherever necessary, to conform to current period’s classification in order to comply with the requirements of the amended Schedule III to the Companies Act, 2013 effective from April 1, 2021. |
| 14) | Figures for the quarters ended March 31, 2022 and 2021, represent the difference between the audited figures in respect of full financial years and the published figures for the nine months ended December 31, 2021 and 2020, respectively which were subject to limited review. |
| 15) | The Statutory Auditors have carried out a audit of the consolidated financial results for the year ended March 31, 2022 and have issued an unmodified opinion on the same. |
| Tata Motors Limited | ||
| GIRISH WAGH | ||
| Mumbai, May 12, 2022 | Executive Director | |
Table of Contents
| News Release – 5 | May 12, 2022 |
Independent Auditors Report (Standalone)
B S R & Co. LLP Chartered Accountants
8th floor, Business Plaza, Westin Hotel Campus, 36/3-B, Koregaon Park Annex, Mundhwa Road, Ghorpadi, Pune - 411001, India |
Telephone: +91 20 6747 7300 Fax: +91 20 6747 7310 |
Independent Auditor’s Report
To the Board of Directors of Tata Motors Limited
Report on the audit of the Standalone Annual Financial Results
Opinion
We have audited the accompanying standalone annual financial results of Tata Motors Limited (hereinafter referred to as the “Company”) for the year ended 31 March 2022, attached herewith, (in which are included financial statements/financial results/financial information from two joint operations) being submitted by the Company pursuant to the requirement of Regulation 33 and Regulation 52(4) read with Regulation 63 of the Securities and Exchange Board of India (Listing Obligations and Disclosure Requirements) Regulations, 2015, as amended (“Listing Regulations”).
In our opinion and to the best of our information and according to the explanations given to us and based on the consideration of the report of the other auditor on separate audited financial statements/financial results/financial information of one joint operation, the aforesaid standalone annual financial results:
| a. | are presented in accordance with the requirements of Regulation 33 and Regulation 52(4) read with Regulation 63 of the Listing Regulations in this regard; and |
| b. | give a true and fair view in conformity with the recognition and measurement principles laid down in the applicable Indian Accounting Standards, and other accounting principles generally accepted in India, of the net loss and other comprehensive income and other financial information for the year ended 31 March 2022. |
Basis for Opinion
We conducted our audit in accordance with the Standards on Auditing (“SAs”) specified under section 143(10) of the Companies Act, 2013 (“the Act”). Our responsibilities under those SAs are further described in the Auditor’s Responsibilities for the Audit of the Standalone Annual Financial Results section of our report. We are independent of the Company, in accordance with the Code of Ethics issued by the Institute of Chartered Accountants of India together with the ethical requirements that are relevant to our audit of the financial statements under the provisions of the Act, and the Rules thereunder, and we have fulfilled our other ethical responsibilities in accordance with these requirements and the Code of Ethics. We believe that the audit evidence obtained by us,along with the consideration of report of the other auditor referred to in sub paragraph no. ‘a’ of the “Other Matters” paragraph below, is sufficient and appropriate to provide a basis for our opinion on the standalone annual financial results.
Emphasis of Matters
| a. | We draw attention to note 4 to the standalone annual financial results which describes the transfer of the Passenger Vehicle Undertaking by the Company to its step-down subsidiary during the year in accordance with the Scheme of Arrangement (‘Scheme’) approved by the National Company Law Tribunal (‘NCLT’) vide its Order dated August 24, 2021. The Company has accounted for this transfer in accordance with the accounting principles generally accepted in India and has recognized the excess of consideration received over the carrying value of net assets transferred, amounting to Rs. 1,960.04 crores in Capital Reserve. |
Our opinion is not modified in respect of this matter.
| b. | We draw attention to Note 8 to the standalone annual financial results, which describes the economic and social consequences/disruption the Company is facing as a result of COVID-19 which is impacting supply chains / consumer demand / financial markets / commodity prices / personnel available for work. |
| B S R & Co. (a partnership firm with Registration No. BA61223) converted into B S R & Co. LLP (a Limited Liability Partnership with LLP Registration No. AAB-8181) with effect from October 14, 2013 | Registered Office:
14th Floor, Central B Wing and North C Wing, Nesco IT Park 4, Nesco Center, Western Express Highway, Goregaon (East), Mumbai - 400063 |
Table of Contents
B S R & Co. LLP
Independent Auditor’s Report (Continued)
Tata Motors Limited
Our opinion is not modified in respect of this matter.
Management’s and Board of Directors’ Responsibilities for the Standalone Annual Financial Results
These standalone annual financial results have been prepared on the basis of the standalone annual financial statements.
The Company’s Management and the Board of Directors are responsible for the preparation and presentation of these standalone annual financial results that give a true and fair view of the net profit/ loss and other comprehensive income and other financial information in accordance with the recognition and measurement principles laid down in Indian Accounting Standards prescribed under Section 133 of the Act and other accounting principles generally accepted in India and in compliance with Regulation 33 and Regulation 52(4) read with Regulation 63 of the Listing Regulations. The respective Management and Board of Directors of the Company and its joint operations are responsible for maintenance of adequate accounting records in accordance with the provisions of the Act for safeguarding of the assets of each company and for preventing and detecting frauds and other irregularities; selection and application of appropriate accounting policies; making judgments and estimates that are reasonable and prudent; and the design, implementation and maintenance of adequate internal financial controls, that were operating effectively for ensuring accuracy and completeness of the accounting records, relevant to the preparation and presentation of the standalone annual financial results that give a true and fair view and are free from material misstatement, whether due to fraud or error.
In preparing the standalone annual financial results, the respective Management and the Board of Directors are responsible for assessing each company’s ability to continue as a going concern, disclosing, as applicable, matters related to going concern and using the going concern basis of accounting unless the respective Board of Directors either intends to liquidate the company or to cease operations, or has no realistic alternative but to do so.
The respective Board of Directors is responsible for overseeing the financial reporting process of each company.
Auditor’s Responsibilities for the Audit of the Standalone Annual Financial Results
Our objectives are to obtain reasonable assurance about whether the standalone annual financial results as a whole are free from material misstatement, whether due to fraud or error, and to issue an auditor’s report that includes our opinion. Reasonable assurance is a high level of assurance, but is not a guarantee that an audit conducted in accordance with SAs will always detect a material misstatement when it exists. Misstatements can arise from fraud or error and are considered material if, individually or in the aggregate, they could reasonably be expected to influence the economic decisions of users taken on the basis of these standalone annual financial results.
As part of an audit in accordance with SAs, we exercise professional judgment and maintain professional skepticism throughout the audit. We also:
| ◾ | Identify and assess the risks of material misstatement of the standalone annual financial results, whether due to fraud or error, design and perform audit procedures responsive to those risks, and obtain audit evidence that is sufficient and appropriate to provide a basis for our opinion. The risk of not detecting a material misstatement resulting from fraud is higher than for one resulting from error, as fraud may involve collusion, forgery, intentional omissions, misrepresentations, or the override of internal control. |
| ◾ | Obtain an understanding of internal control relevant to the audit in order to design audit procedures that are appropriate in the circumstances. Under Section 143(3) (i) of the Act, we are also responsible for expressing our opinion through a separate report on the complete set of financial statements on whether the company has adequate internal financial controls with reference to financial statements in place and the operating effectiveness of such controls. |
| ◾ | Evaluate the appropriateness of accounting policies used and the reasonableness of accounting estimates and related disclosures in the standalone annual financial results made by the Management and Board of Directors. |
Table of Contents
B S R & Co. LLP
Independent Auditor’s Report (Continued)
Tata Motors Limited
| ◾ | Conclude on the appropriateness of the Management and Board of Directors use of the going concern basis of accounting and, based on the audit evidence obtained, whether a material uncertainty exists related to events or conditions that may cast significant doubt on the appropriateness of this assumption. If we conclude that a material uncertainty exists, we are required to draw attention in our auditor’s report to the related disclosures in the standalone annual financial results or, if such disclosures are inadequate, to modify our opinion. Our conclusions are based on the audit evidence obtained up to the date of our auditor’s report. However, future events or conditions may cause the Company to cease to continue as a going concern. |
| ◾ | Evaluate the overall presentation, structure and content of the standalone annual financial results, including the disclosures, and whether the standalone annual financial results represent the underlying transactions and events in a manner that achieves fair presentation. |
| ◾ | Obtain sufficient appropriate audit evidence regarding the financial results/ financial statements/financial information of the joint operation of the Company to express an opinion on the standalone annual financial results. We are responsible for the direction, supervision and performance of the audit of financial results/financial statements/financial information of such joint operation included in the standalone annual financial results of which we are the independent auditors. For the other joint operation included in the standalone annual financial results, which has been audited by the other auditor, such the other auditor remain responsible for the direction, supervision and performance of the audits carried out by them. We remain solely responsible for our audit opinion. Our responsibilities in this regard are further described in sub paragraph no. ‘a’ of the “Other Matters” paragraph in this audit report. |
We communicate with those charged with governance of the Company and such other entities included in standalone annual financial results of which we are the independent auditors regarding, among other matters, the planned scope and timing of the audit and significant audit findings, including any significant deficiencies in internal control that we identify during our audit.
We also provide those charged with governance with a statement that we have complied with relevant ethical requirements regarding independence, and to communicate with them all relationships and other matters that may reasonably be thought to bear on our independence, and where applicable, related safeguards.
Other Matters
| a. | The standalone annual financial results include the audited financial results of one joint operation (which ceased to be a joint operation on January 01, 2022) whose financial statements/financial results/ financial information reflect total revenue (before accounting adjustments) of Rs. 10,213.55 crores, total net profit after tax (before accounting adjustments) of Rs. 399.34 crores and net cash outflows (before accounting adjustments) of Rs. 657.82 crores for the period from April 01, 2021 to December 31, 2021 as considered in the standalone annual financial results, which has been audited by the other auditor. The other auditor’s report on financial statements/ financial results/financial information of this joint operation has been furnished to us by the management. |
Our opinion on the standalone annual financial results, in so far as it relates to the amounts and disclosures included in respect of this joint operation, is based solely on the report of such other auditor.
Our opinion is not modified in respect of this matter.
| b. | The standalone annual financial results include the results for the quarter ended 31 March 2022 being the balancing figure between the audited figures in respect of the full financial year and the published audited year to date figures up to the third quarter of the current financial year. |
Table of Contents
B S R & Co. LLP
Independent Auditor’s Report (Continued)
Tata Motors Limited
For B S R & Co. LLP
Chartered Accountants
Firm’s Registration No.:101248W/W-100022
| Shiraz Vastani | ||
| Partner | ||
| Mumbai | Membership No.: 103334 | |
| 12 May 2022 | UDIN:22103334AIVTLZ2478 |
Table of Contents
| News Release – 6 | May 12, 2022 |
Standalone Financial Results
TATA MOTORS LIMITED
Regd.Office : Bombay House, 24, Homi Mody Street, Mumbai 400 001.
CIN L28920MH1945PLC004520
(₹ in crores)
STATEMENT OF STANDALONE AUDITED FINANCIAL RESULTS FOR THE QUARTER AND YEAR ENDED MARCH 31, 2022
| Quarter ended | Year ended | |||||||||||||||||||||
| March 31, | December 31, | March 31, | March 31, | March 31, | ||||||||||||||||||
| 2022 | 2021 | 2021 | 2022 | 2021 | ||||||||||||||||||
Particulars | (Refer note 11) | (Refer note 11) |
| |||||||||||||||||||
I. | Revenue from operations | Audited | ||||||||||||||||||||
(a) Revenue | 17,224.61 | 12,259.02 | 13,286.92 | 46,880.97 | 29,769.07 | |||||||||||||||||
(b) Other operating revenue | 113.66 | 93.76 | 193.50 | 382.71 | 405.96 | |||||||||||||||||
| Total Revenue from operations (a)+(b) | 17,338.27 | 12,352.78 | 13,480.42 | 47,263.68 | 30,175.03 | |||||||||||||||||
II. | Other Income (includes Government incentives) | 195.32 | 138.74 | 110.68 | 659.91 | 419.99 | ||||||||||||||||
III. | Total Income (I+II) | 17,533.59 | 12,491.52 | 13,591.10 | 47,923.59 | 30,595.02 | ||||||||||||||||
IV. | Expenses | |||||||||||||||||||||
(a) Cost of materials consumed | 11,036.46 | 8,499.61 | 8,373.87 | 31,693.11 | 19,050.74 | |||||||||||||||||
(b) Purchases of products for sale | 1,605.80 | 1,342.76 | 1,214.02 | 5,030.00 | 3,156.80 | |||||||||||||||||
(c) Changes in inventories of finished goods, work-in-progress and products for sale | 870.43 | (188.35 | ) | 362.97 | (403.87 | ) | (609.55 | ) | ||||||||||||||
(d) Employee benefits expense | 875.60 | 918.10 | 837.20 | 3,601.51 | 3,341.53 | |||||||||||||||||
(e) Finance costs | 491.75 | 535.55 | 476.33 | 2,121.73 | 2,110.83 | |||||||||||||||||
(f) Foreign exchange (gain)/loss (net) | 49.80 | 33.80 | 25.76 | 136.81 | 32.62 | |||||||||||||||||
(g) Depreciation and amortisation expense | 457.86 | 452.15 | 455.59 | 1,760.57 | 1,730.71 | |||||||||||||||||
(h) Product development/engineering expenses | 262.63 | 122.83 | 143.88 | 593.90 | 348.71 | |||||||||||||||||
(i) Other expenses | 1,832.57 | 1,589.72 | 1,594.96 | 6,018.71 | 4,194.74 | |||||||||||||||||
(j) Amount transferred to capital and other accounts | (261.85 | ) | (233.09 | ) | (247.76 | ) | (905.42 | ) | (794.93 | ) | ||||||||||||
| Total expenses (IV) | 17,221.05 | 13,073.08 | 13,236.82 | 49,647.05 | 32,562.20 | |||||||||||||||||
V. | Profit/(loss) before exceptional items and tax (III-IV) | 312.54 | (581.56 | ) | 354.28 | (1,723.46 | ) | (1,967.17 | ) | |||||||||||||
VI. | Exceptional Items | |||||||||||||||||||||
(a) Employee separation cost | 1.87 | 0.09 | 121.05 | 8.35 | 184.19 | |||||||||||||||||
(b) Cost of slump sale of PV undertaking | 50.00 | — | — | 50.00 | — | |||||||||||||||||
(c) Provision/(Reversal) for loan given to/investment in subsidiary companies | (193.42 | ) | — | 41.00 | (139.24 | ) | 123.36 | |||||||||||||||
(d) Others (refer note 6) | — | — | — | (2.52 | ) | — | ||||||||||||||||
VII. | Profit/(loss) before tax (V-VI) | 454.09 | (581.65 | ) | 192.23 | (1,640.05 | ) | (2,274.72 | ) | |||||||||||||
VIII. | Tax expense (net) | |||||||||||||||||||||
(a) Current tax | 22.44 | 11.10 | 18.10 | 51.18 | 20.16 | |||||||||||||||||
(b) Deferred tax | 18.30 | 42.74 | 10.34 | 48.00 | 0.56 | |||||||||||||||||
| Total tax expense (net) | 40.74 | 53.84 | 28.44 | 99.18 | 20.72 | |||||||||||||||||
IX. | Profit/(loss) for the period from continuing operations (VII-VIII) | 413.35 | (635.49 | ) | 163.79 | (1,739.23 | ) | (2,295.44 | ) | |||||||||||||
X. | Profit/(loss) before tax for the period/year from discontinued operations | — | 834.77 | 1,498.04 | 392.51 | (37.85 | ) | |||||||||||||||
XI. | Tax expense/(credit) (net) of discontinued operations | |||||||||||||||||||||
(a) Current tax | — | 23.43 | 16.15 | 44.14 | 62.15 | |||||||||||||||||
(b) Deferred tax | — | — | — | — | — | |||||||||||||||||
| Total tax expense | — | 23.43 | 16.15 | 44.14 | 62.15 | |||||||||||||||||
XII. | Profit/(loss) for the period/year after tax from discontinued operations (X-XI) | — | 811.34 | 1,481.89 | 348.37 | (100.00 | ) | |||||||||||||||
XIII. | Profit/(loss) for the period/year (IX+XII) | 413.35 | 175.85 | 1,645.68 | (1,390.86 | ) | (2,395.44 | ) | ||||||||||||||
XIV. | Other comprehensive income/(loss): | |||||||||||||||||||||
(A) (i) Items that will not be reclassified to profit and loss | 132.26 | (128.19 | ) | 125.49 | 313.63 | 342.22 | ||||||||||||||||
(ii) Income tax (expense)/credit relating to items that will not be reclassified to profit and loss | (19.41 | ) | 22.91 | (8.38 | ) | (32.33 | ) | (8.60 | ) | |||||||||||||
(B) (i) Items that will be reclassified to profit and loss | 9.71 | 14.24 | 27.58 | 1.62 | 168.12 | |||||||||||||||||
(ii) Income tax (expense)/credit relating to items that will be reclassified to profit and loss | (3.40 | ) | (4.97 | ) | (9.64 | ) | (0.57 | ) | (58.75 | ) | ||||||||||||
| Total other comprehensive income/(loss) | 119.16 | (96.01 | ) | 135.05 | 282.35 | 442.99 | ||||||||||||||||
XV. | Total comprehensive income/(loss) for the period/year (XIII+XIV) | 532.51 | 79.84 | 1,780.73 | (1,108.51 | ) | (1,952.45 | ) | ||||||||||||||
XVI. | Paid-up equity share capital (face value of ₹2 each) | 765.88 | 765.86 | 765.81 | 765.88 | 765.81 | ||||||||||||||||
XVII. | Reserves excluding revaluation reserve | 19,178.27 | 18,290.16 | |||||||||||||||||||
XVIII. | Earnings/(loss) per share (EPS) | |||||||||||||||||||||
| Earnings/(loss) per share from continuing operations (EPS) | ||||||||||||||||||||||
(a) Ordinary shares (face value of ₹2 each) | ||||||||||||||||||||||
(i) Basic EPS | ₹ | 1.07 | (1.66 | ) | 0.42 | (4.54 | ) | (6.31 | ) | |||||||||||||
(ii) Diluted EPS | ₹ | 1.07 | (1.66 | ) | 0.42 | (4.54 | ) | (6.31 | ) | |||||||||||||
(b) ‘A’ Ordinary shares (face value of ₹2 each) | ||||||||||||||||||||||
(i) Basic EPS | ₹ | 1.17 | (1.66 | ) | 0.52 | (4.54 | ) | (6.31 | ) | |||||||||||||
(ii) Diluted EPS | ₹ | 1.17 | (1.66 | ) | 0.52 | (4.54 | ) | (6.31 | ) | |||||||||||||
| Earnings/(loss) per share from discontinued operations (EPS) | ||||||||||||||||||||||
(a) Ordinary shares (face value of ₹ 2 each) : | ||||||||||||||||||||||
(i) Basic | ₹ | — | 2.11 | 3.95 | 0.90 | (0.28 | ) | |||||||||||||||
(ii) Diluted | ₹ | — | 2.10 | 3.95 | 0.90 | (0.28 | ) | |||||||||||||||
(b) ‘A’ Ordinary shares (face value of ₹ 2 each) : | ||||||||||||||||||||||
(i) Basic | ₹ | — | 2.21 | 3.95 | 1.00 | (0.28 | ) | |||||||||||||||
(ii) Diluted | ₹ | — | 2.20 | 3.95 | 1.00 | (0.28 | ) | |||||||||||||||
| Earnings/(loss) per share from continuing and discontinued operations (EPS) | ||||||||||||||||||||||
(a) Ordinary shares (face value of ₹ 2 each) : | ||||||||||||||||||||||
(i) Basic | ₹ | 1.07 | 0.45 | 4.37 | (3.63 | ) | (6.59 | ) | ||||||||||||||
(ii) Diluted | ₹ | 1.07 | 0.44 | 4.37 | (3.63 | ) | (6.59 | ) | ||||||||||||||
(b) ‘A’ Ordinary shares (face value of ₹ 2 each) : | ||||||||||||||||||||||
(i) Basic | ₹ | 1.17 | 0.55 | 4.47 | (3.63 | ) | (6.59 | ) | ||||||||||||||
(ii) Diluted | ₹ | 1.17 | 0.54 | 4.47 | (3.63 | ) | (6.59 | ) | ||||||||||||||
| Not annualised | ||||||||||||||||||||||
Table of Contents
Statement of Standalone Assets and Liabilities
| (₹ in crores) | ||||||||
| As at March 31, | ||||||||
| 2022 | 2021 | |||||||
| Audited | ||||||||
I. ASSETS | ||||||||
(1) Non-current assets | ||||||||
(a) Property, plant and equipment | 11,733.44 | 19,153.47 | ||||||
(b) Capital work-in-progress | 585.21 | 1,400.82 | ||||||
(c) Right of use assets | 332.45 | 768.59 | ||||||
(d) Goodwill | — | 99.09 | ||||||
(e) Other intangible assets | 2,009.87 | 6,401.95 | ||||||
(f) Intangible assets under development | 882.03 | 1,605.64 | ||||||
(g) Investments in subsidiaries, joint ventures and associates | 27,917.45 | 15,147.26 | ||||||
(h) Financial assets | ||||||||
(i) Investments | 1,338.94 | 967.65 | ||||||
(ii) Loans and advances | 48.43 | 72.39 | ||||||
(iii) Other financial assets | 1,992.52 | 1,899.20 | ||||||
(i) Non-current tax assets (net) | 777.68 | 715.31 | ||||||
(j) Other non-current assets | 662.24 | 973.70 | ||||||
|
|
|
| |||||
| 48,280.26 | 49,205.07 | |||||||
|
|
|
| |||||
(2) Current assets | ||||||||
(a) Inventories | 3,718.49 | 4,551.71 | ||||||
(b) Financial assets | ||||||||
(i) Investments | 5,143.08 | 1,578.26 | ||||||
(ii) Trade receivables | 2,111.78 | 2,087.51 | ||||||
(iii) Cash and cash equivalents | 2,450.23 | 2,365.54 | ||||||
(iv) Bank balances other than (iii) above | 155.20 | 1,953.40 | ||||||
(v) Loans and advances | 139.37 | 184.49 | ||||||
(vi) Other financial assets | 809.51 | 1,745.99 | ||||||
(c) Assets classified as held for sale | — | 220.80 | ||||||
(d) Other current assets | 1,091.95 | 1,166.89 | ||||||
|
|
|
| |||||
| 15,619.61 | 15,854.59 | |||||||
|
|
|
| |||||
TOTAL ASSETS | 63,899.87 | 65,059.66 | ||||||
|
|
|
| |||||
II. EQUITY AND LIABILITIES | ||||||||
Equity | ||||||||
(a) Equity share capital | 765.88 | 765.81 | ||||||
(b) Other equity | 19,178.27 | 18,290.16 | ||||||
| 19,944.15 | 19,055.97 | |||||||
Liabilities | ||||||||
(1) Non-current liabilities | ||||||||
(a) Financial liabilities | ||||||||
(i) Borrowings | 14,102.74 | 16,326.77 | ||||||
(ii) Lease liabilities | 237.84 | 593.74 | ||||||
(iii) Other financial liabilities | 460.37 | 659.64 | ||||||
(b) Provisions | 1,474.11 | 1,371.94 | ||||||
(c) Deferred tax liabilities (net) | 173.72 | 266.50 | ||||||
(d) Other non-current liabilities | 514.13 | 533.55 | ||||||
|
|
|
| |||||
| 16,962.91 | 19,752.14 | |||||||
|
|
|
| |||||
(2) Current liabilities | ||||||||
(a) Financial liabilities | ||||||||
(i) Borrowings | 9,129.91 | 5,421.95 | ||||||
(ii) Lease liabilities | 58.58 | 96.47 | ||||||
(iii) Trade payables | ||||||||
(a) Total outstanding dues of micro and small enterprises | 146.10 | 167.23 | ||||||
(b) Total outstanding dues of creditors other than micro and small enterprises | 5,956.00 | 7,947.78 | ||||||
(iv) Acceptances | 7,883.96 | 7,873.12 | ||||||
(v) Other financial liabilities | 1,113.26 | 1,376.12 | ||||||
(b) Provisions | 608.06 | 1,043.54 | ||||||
(c) Current tax liabilities (net) | 49.67 | 37.84 | ||||||
(d) Other current liabilities | 2,047.27 | 2,287.50 | ||||||
|
|
|
| |||||
| 26,992.81 | 26,251.55 | |||||||
|
|
|
| |||||
TOTAL EQUITY AND LIABILITIES | 63,899.87 | 65,059.66 | ||||||
|
|
|
| |||||
Table of Contents
Statement of Standalone Cash Flows
| (₹ in crores) | ||||||||||
| Year ended | ||||||||||
| March 31, | March 31, | |||||||||
| 2022 | 2021 | |||||||||
| Audited | ||||||||||
I | Cash flows from operating activities: | |||||||||
(Loss) for the year from continuing operations | (1,739.23 | ) | (2,295.44 | ) | ||||||
Profit/(Loss) for the year from discontinued operations | 348.37 | (100.00 | ) | |||||||
Adjustments for: | ||||||||||
Depreciation and amortisation expense | 2,724.93 | 3,681.61 | ||||||||
Allowances for trade and other receivables | 42.71 | 102.69 | ||||||||
Inventory write down (net) | 25.25 | 45.58 | ||||||||
Provision/(reversal) for loan given to/investment and cost of closure in subsidiary companies/joint venture (net) | (699.15 | ) | 123.36 | |||||||
Employee separation cost | — | 188.20 | ||||||||
Impairment losses/(reversal) in passenger vehicle business | — | (1,182.41 | ) | |||||||
Provision/(reversal) for Onerous Contracts and related supplier claims | — | (663.00 | ) | |||||||
Share-based payments | 18.04 | 9.04 | ||||||||
Marked-to-market loss/(gain) on investments measured at Fair value through profit and loss | (10.16 | ) | (5.20 | ) | ||||||
Write off/provision (reversal) for tangible/intangible assets (including under development) | — | 114.00 | ||||||||
(Profit)/Loss on sale of assets (net) (including assets scrapped/written off) | (70.95 | ) | (126.09 | ) | ||||||
Profit on sale of investment in a subsidiary company | — | — | ||||||||
Profit on sale of investments at FVTPL (net) | (109.82 | ) | (72.80 | ) | ||||||
Tax expense (net) | 143.32 | 82.87 | ||||||||
Finance costs | 2,300.73 | 2,358.54 | ||||||||
Interest income | (323.59 | ) | (196.24 | ) | ||||||
Dividend income | (80.08 | ) | (20.45 | ) | ||||||
Foreign exchange (gain)/loss (net) | 112.69 | (83.44 | ) | |||||||
|
|
|
| |||||||
| 4,073.92 | 4,356.26 | |||||||||
|
|
|
| |||||||
Cash flows from operating activities before changes in following assets and liabilities | 2,683.06 | 1,960.82 | ||||||||
Trade receivables | (1,015.62 | ) | (141.51 | ) | ||||||
Loans and advances and other financial assets | (245.40 | ) | (175.97 | ) | ||||||
Other current and non-current assets | (240.50 | ) | 34.11 | |||||||
Inventories | (1,201.08 | ) | (765.37 | ) | ||||||
Trade payables and acceptances | 5,285.19 | 4,964.54 | ||||||||
Other current and non-current liabilities | (56.72 | ) | 1,075.59 | |||||||
Other financial liabilities | 289.73 | 31.69 | ||||||||
Provisions | (60.79 | ) | (240.33 | ) | ||||||
|
|
|
| |||||||
Cash generated from/(used in) operations | 5,437.87 | 6,743.57 | ||||||||
Income taxes paid (net) | (155.94 | ) | (63.25 | ) | ||||||
|
|
|
| |||||||
Net cash from/(used in) operating activities | 5,281.93 | 6,680.32 | ||||||||
|
|
|
| |||||||
II | Cash flows from investing activities: | |||||||||
Payments for property, plant and equipments | (1,191.03 | ) | (1,162.95 | ) | ||||||
Payments for other intangible assets | (639.64 | ) | (693.35 | ) | ||||||
Proceeds from sale of property, plant and equipments | 99.57 | 178.36 | ||||||||
Investments in Mutual Fund (purchased)/sold (net) | (3,560.47 | ) | (614.95 | ) | ||||||
Advance towards investments in subsidiary companies | (870.91 | ) | — | |||||||
Disposal of business | 234.09 | — | ||||||||
Sale of business to subsidiary company | — | 10.30 | ||||||||
Purchase of unquoted investment- others | — | (57.60 | ) | |||||||
Purchase of stake in joint venture | — | (0.02 | ) | |||||||
Loan given to subsidiary companies/payment for costs of closure in subsidiary companies | (51.10 | ) | (56.59 | ) | ||||||
Sale of quoted investment- others | — | 4.36 | ||||||||
(Increase)/decrease in short term inter corporate deposit (net) | 30.00 | (30.00 | ) | |||||||
Deposits/restricted deposits with financial institution | (600.00 | ) | (1,000.00 | ) | ||||||
Realisation of deposits with financial institution | 1,300.00 | 750.00 | ||||||||
Deposits/restricted deposits with banks | (540.87 | ) | (3,342.52 | ) | ||||||
Realisation of deposits/restricted deposits with banks | 2,259.30 | 2,849.64 | ||||||||
Interest received | 301.49 | 153.55 | ||||||||
Dividend received | 80.08 | 20.45 | ||||||||
|
|
|
| |||||||
Net cash used in investing activities | (3,149.49 | ) | (2,991.32 | ) | ||||||
|
|
|
| |||||||
III | Cash flows from financing activities | |||||||||
Proceeds from issue of shares/conversion of warrants (net of issue expenses) | 12.23 | 2,602.51 | ||||||||
Proceeds from Share Application pending allotment | 6.38 | — | ||||||||
Proceeds from long-term borrowings (net of issue expenses) | 1,999.79 | 4,667.65 | ||||||||
Repayment of long-term borrowings | (3,482.07 | ) | (4,562.91 | ) | ||||||
Proceeds/(payment) from Option settlement of long term borrowings | (97.77 | ) | 35.01 | |||||||
Repayment of matured fixed deposits | — | (0.48 | ) | |||||||
Proceeds from short-term borrowings | 5,137.27 | 4,068.21 | ||||||||
Repayment of short-term borrowings | (4,936.80 | ) | (5,874.81 | ) | ||||||
Net change in other short-term borrowings (with maturity up to three months) | 3,270.78 | (1,785.86 | ) | |||||||
Repayment of lease liabilities (including interest) | (151.63 | ) | (192.32 | ) | ||||||
Dividend paid | (1.53 | ) | (1.56 | ) | ||||||
Interest paid [including discounting charges paid, ₹492.62 crores (March 31, 2021 ₹438.43 crores)] | (2,272.49 | ) | (2,427.35 | ) | ||||||
|
|
|
| |||||||
Net cash from/(used in) financing activities | (515.84 | ) | (3,471.91 | ) | ||||||
|
|
|
| |||||||
Net increase in cash and cash equivalents | 1,616.60 | 217.09 | ||||||||
Cash and cash equivalents as at April 1, (opening balance) | 2,365.54 | 2,145.30 | ||||||||
Cash outflow as a part of slump sale of PV undertaking | (1,200.00 | ) | — | |||||||
Adjustment due to conversion of joint operation into joint venture | (341.21 | ) | — | |||||||
Effect of foreign exchange on cash and cash equivalents | 9.30 | 3.15 | ||||||||
|
|
|
| |||||||
Cash and cash equivalents as at March 31, (closing balance) | 2,450.23 | 2,365.54 | ||||||||
|
|
|
| |||||||
Non-cash transactions: | ||||||||||
Liability towards property, plant and equipment and other intangible assets purchased on credit/deferred credit | 185.40 | 410.15 | ||||||||
Table of Contents
Notes:
| 1) | The above results were reviewed and recommended by the Audit Committee and approved by the Board of Directors at its meeting held on May 12, 2022. |
| 2) | The above results include the Company’s proportionate share of income and expenditure in its two Joint Operations, namely Tata Cummins Private Limited and Fiat India Automobiles Private Limited (which ceased to be a joint operation w.e.f. January 1, 2022). Certain of the Company’s activities were condutcted through one of the joint operations namely Fiat India Automobiles Private Limited (“FIAPL”). FIAPL manufactures certain models of passengers cars and powertrains used in the passenger cars. |
Pursuant to the Scheme of Arrangement between the Company and Tata Motors Passenger Vehicles Limited (TMPVL), the PV undertaking of the Company has been transferred as a going concern, on a slump sale basis effective January 1, 2022. The economic benefits arising out of the assets of FIAPL has been transferred to TMPVL, whilst the ownership of equity shares of FIAPL continues to be retained by Tata Motors Limited and thus the above arrangement has been classifified as joint venture effective January 1, 2022 in the financial results. Accordingly, the proportionate net assets and liabilities as at January 1, 2022 has been considered as deemed cost of investment in joint venture in the financial results.
Below are supplementary details of Tata Motors Limited on standalone basis excluding interest in the aforesaid two Joint Operations:
| (₹ in crores) | ||||||||||||||||||||||
Particulars | Quarter ended | Year ended | ||||||||||||||||||||
| March 31, | December 31, | March 31, | March 31, | |||||||||||||||||||
| 2022 | 2021 | 2021 | 2022 | 2021 | ||||||||||||||||||
1 | Revenue from operations | 17,192.07 | 12,197.46 | 13,367.21 | 46,668.92 | 29,821.77 | ||||||||||||||||
2 | Profit/(loss) before tax from continuing operations | 367.11 | (627.21 | ) | 113.23 | (1,795.39 | ) | (2,366.56 | ) | |||||||||||||
3 | Profit/(loss) after tax from continuing operations | 389.10 | (645.18 | ) | 128.70 | (1,763.34 | ) | (2,301.28 | ) | |||||||||||||
4 | Profit/(loss) before tax from discontinued operations | — | 705.36 | 1,406.21 | 143.81 | (385.79 | ) | |||||||||||||||
5 | Profit/(loss) after tax from discontinued operations | — | 705.36 | 1,406.21 | 143.81 | (385.79 | ) | |||||||||||||||
| 3) | During the year ended March 31, 2020, the Company has allotted 20,16,23,407 Ordinary Shares at a price of ₹150 per Ordinary Share aggregating to ₹3,024.35 crores and 23,13,33,871 Convertible Warrants (‘Warrants’), each carrying a right to subscribe to one Ordinary Share per Warrant, at a price of ₹150 per Warrant (‘Warrant Price’), aggregating to ₹3,470.00 crores on a preferential basis to Tata Sons Private Limited. An amount equivalent to 25% of the Warrant Price was paid at the time of subscription and the balance 75% of the Warrant Price was payable by the Warrant holder against each Warrant at the time of allotment of Ordinary Shares pursuant to exercise of the options attached to Warrant(s) to subscribe to Ordinary Share(s) by June 2021. The Company has fully utilised the amount of ₹3,891.85 crores towards repayment of debt, and other general corporate purposes of the Company and its subsidiaries. During the year ended March 31, 2021, on exercise of options by Tata Sons Pvt Ltd and on receipt of the balance subscription money of ₹2,602.51 crores, the Company has fully converted 23,13,33,871 convertible warrants into Ordinary Shares. As at March 31, 2022 the Company has fully utilised amount towards repayment of debt, and other general corporate purposes of the Company. |
| 4) | The Board of Directors had, at its meeting held on July 31, 2020 , approved (subject to the requisite regulatory and other approvals) a Scheme of Arrangement between Tata Motors Limited and Tata Motors Passenger Vehicles Limited (formerly known as TML Business Analytics Services Limited) (Transferee Company) for: |
| (a) | Transfer of the PV Undertaking of the Company as a going concern, on a slump sale basis as defined under Section 2(42C) of the Income-tax Act, 1961, to the Transferee Company for a lump sum consideration of ₹9,417.00 crores through issuance of equity shares; and |
| (b) | Reduction of its share capital without extinguishing or reducing its liability on any of its shares by writing down a portion of its securities premium account to the extent of ₹11,173.59 crores, with a corresponding adjustment to the accumulated losses of the Company. |
The Scheme of Arrangement has been approved by the National Company Law Tribunal, Mumbai Bench on August 24, 2021. The Company has received all other necessary regulatory approvals and the scheme is effective from January 1, 2022. The Company has accounted for transfer of net assets in accordance with the accounting principles generally accepted in India and has recognised the excess of consideration received over the carrying value of net assets transferred, amounting to ₹1,960.04 crores in Capital Reserve. The Company had stopped depreciation from the date of receipt of NCLT order. Accordingly Depreciation and Amortisation of ₹737.07 crores is not provided from August 25, 2021 to December 31, 2021.
| 5) | As part of above slump sale, the investments in wholly owned subsidiaries of the Company engaged in designing services namely Tata Motors European Technical Centre PLC (TMETC) and Trilix S.r.l (Trilix) have been transferred to Tata Motors Passenger Vehicle Limited (a wholly owned subsidiary of the Company) w.e.f. January 1, 2022. These subsidiaries are being transferred to Tata Passenger Electric Mobility Ltd., a wholly owned subsidiary of the Company. Considering the business plans for these subsidiaries, the Company reassessed their investment carrying value and accordingly provision for impairment towards these investments is reversed amounting to ₹526.64 crores and ₹33.27 crores in TMETC and Trilix, respectively during quarter ended December 31, 2021. This reversal is included in profit/(loss) before and after tax from discontinued operations and it is an exceptional item. |
| 6) | During the year ended March 31, 2022 the Company has completed the sale of certain assets related to defence business to Tata Advanced Systems Limited (TASL) for sale consideration of ₹234.09 crores againts the Net Assets of ₹231.57 crores resulting in a gain of ₹2.52 crores recorded as an exceptional item in Statement of Profit and Loss. |
| 7) | The Company primarily operates in the automotive business. The automotive business comprises two reportable segments i.e. commercial vehicles and passenger vehicles (Upto December 31, 2021—refer note 4 above). Post transfer of net assets of PV undertaking, the Company operates in a single segment of commercial vehicles. The Company has opted for an exemption as per para 4 of Ind AS 108. Segment information is thus given in the consolidated financial results of the Company. |
| 8) | Covid-19 pandemic has rapidly spread throughout the world, including India. Governments in India and across the world have taken significant measures to curb the spread of the virus including imposing mandatory lockdowns and restrictions in activities. Consequently, Company's manufacturing plants and offices had to operate under restrictions for a certain period of time during the year. The pandemic has impacted the Company operationally including on commodity prices, supply chain matters (including semiconductor supplies) and consumer demand. Management believes that it has taken into account all the possible impacts of known events arising from COVID-19 pandemic in the preparation of the financial results including but not limited to its assessment of Company's liquidity and going concern, recoverable values of its property, plant and equipment, intangible assets, intangible assets under development and the net realisable values of other assets. However, given the effect of the pandemic and restrictions on the overall economic activity and in particular on the automotive industry, the impact assessment of COVID-19 on the abovementioned financial result captions is subject to significant estimation uncertainties due to its nature and duration and, accordingly, the actual impacts in future may be different from those estimated as at the date of approval of these financial results. The Company will continue to monitor any material changes to future economic conditions and consequential impact on its financial results. |
| 9) | The Indian Parliament has approved the Code on Social Security, 2020 which would impact the contributions by the company towards Provident Fund and Gratuity. The Ministry of Labour and Employment has released draft rules for the Code on Social Security, 2020 on November 13, 2020, and has invited suggestions from stakeholders which are under active consideration by the Ministry. The Company will assess the impact and its evaluation once the subject rules are notified and will give appropriate impact in its financial results in the period in which, the Code becomes effective and the related rules to determine the financial impact are published. |
Table of Contents
| 10) (a) | Additional Information pursuant to requirement of Regulation 52(4) and Regulation 54(2) of the Securities and Exchange Board of India (Listing Obligations and Disclosure Requirements) Regulation 2015 as amended and as at year ended March 31, 2022: |
Sr No | Particulars | Quarter ended | Year ended | |||||||||||||||||||
| March 31, | December 31, | March 31, | March 31, | March 31, | ||||||||||||||||||
| 2022 | 2021 | 2021 | 2022 | 2021 | ||||||||||||||||||
| Audited | ||||||||||||||||||||||
a) | Debt Equity Ratio (number of times) | 1.16 | 1.41 | 1.06 | 1.16 | 1.06 | ||||||||||||||||
| [Total Debt(i)/ Equity(ii)] | ||||||||||||||||||||||
b) | Debt Service Coverage Ratio (number of times) (not annualised) [(Profit/(loss) before exceptional items and tax+Interest on Borrowings)/(Interest on Borrowings + Repayment of Borrowings(iii))] | 0.58 | (0.08 | ) | (0.06 | ) | 0.01 | 0.02 | ||||||||||||||
c) | Interest Service Coverage Ratio (number of times) (not annualised) [(Profit/(loss) before exceptional items and tax+Interest on Borrowings)/Interest on Borrowings] | 1.73 | (0.58 | ) | 1.90 | 0.01 | (0.07 | ) | ||||||||||||||
d) | Capital redemption reserve (₹ In crores) | 2.28 | 2.28 | 2.28 | 2.28 | 2.28 | ||||||||||||||||
e) | Debenture redemption reserve (₹ In crores) | 411.14 | 904.44 | 904.44 | 411.14 | 904.44 | ||||||||||||||||
f) | Net worth (₹ In crores)(iv) | 19,944.15 | 17,436.77 | 19,778.46 | 19,944.15 | 19,778.46 | ||||||||||||||||
g) | Current ratio (number of times) [Current assets (excluding Assets classified as held for sale) / Current liabilities (excluding Liabilities directly associated with Assets Classified as Held For Sale] | 0.58 | 0.61 | 0.61 | 0.58 | 0.61 | ||||||||||||||||
h) | Long term debt to working capital (number of times) [Long Term Borrowings(v)/Working capital(vi)] | (2.18 | ) | (2.90 | ) | (3.77 | ) | (2.18 | ) | (3.77 | ) | |||||||||||
i) | Bad debts to Account receivable ratio (%) [Bad Debts(vii) / Average of Trade and other Receivables(viii)] | 0.29 | % | 0.00 | % | 0.66 | % | 1.72 | % | 2.88 | % | |||||||||||
j) | Current liability ratio (number of times) [Current liabilities (excluding current maturities of Iong term debt, interest accrued on borrowings and Liabilities directly associated with Assets Classified as Held For Sales) / (Total liabilities)] | 0.54 | 0.42 | 0.45 | 0.54 | 0.45 | ||||||||||||||||
k) | Total debts to total assets (number of times) [(Non current borrowings + Current borrowings) / Total assets] | 0.36 | 0.35 | 0.44 | 0.36 | 0.44 | ||||||||||||||||
l) | Debtors turnover (number of times) (not annualised) [Revenue from operations / Average Trade receivables] | 6.73 | 4.46 | 8.48 | 25.88 | 19.32 | ||||||||||||||||
m) | Inventory turnover (number of times) (not annualised) [Raw material consumed(ix) / average inventory(x)] | 3.12 | 2.02 | 2.85 | 10.60 | 8.20 | ||||||||||||||||
n) | Operating margin (%) [(Profit/(loss) before tax from continuing operations +/(-) Exceptional Items + Net Finance Charges + Depreciation and amortisation - Other Income (excluding incentives)) / Revenue from operations] | 6.84 | % | 2.80 | % | 9.91 | % | 3.85 | % | 5.50 | % | |||||||||||
o) | Net profit margin (%) [Net profit after tax / Revenue from continuing operations] | 2.38 | % | (5.14 | %) | 12.21 | % | (2.94 | %) | (7.94 | %) | |||||||||||
p) | Asset cover ratio (number of times)1 [Secured Assets(xi) / Secured Borrowings(xii)] | 1.38 | 1.34 | 1.26 | 1.38 | 1.26 | ||||||||||||||||
| 1 | As at March 31, 2022 |
8.80% non-convertible debentures of face value of ₹1,000 crores are secured by creating a pari passu charge on certain tangible fixed assets, right of use assets and capital work-in-progress.
| 2 | Previous period amounts of assets and liabilties were recomputed excluding PV undertaking (refer note 4) and Fiat India Automobiles Private Limited (refer note 2) to make the ratios comparable with current periods. |
Notes:
| i | Total debts includes non current and current borrowings |
| ii | Equity = Equity share capital + Other equity |
| iii | Repayment of borrowings includes repayment of long-term borrowings, proceeds from short-term borrowings, repayment of short-term borrowings and net change in other short-term borrowings (with maturity up to three months). |
| iv | Net Worth has been computed on the basis as stated in Clause 2 of the Securities and Exchange Board of India (Listing Obligations and Disclosure Requirements) Regulations, 2015 i.e. Net worth as defined in sub-section (57) of section 2 of the Companies Act, 2013. |
| v | Long term borrowings (including current portion of long term borrowings). |
| vi | Working capital = Current assets (excluding Assets classified as held for sale) - Current liabilities (excluding current maturities of Iong term debt, interest accrued on borrowings and liabilities directly associated with assets classified as held for sale). |
| vii | Bad debts includes written off on trade and other receivables. |
| viii | Trade and other receivables includes Trade receivables, current and non-current Loans and advances and other current and non-current assets. |
| ix | Raw material consumed includes Cost of materials consumed, Purchases of products for sale and Changes in inventories of finished goods, work-in-progress and products for sale. |
| x | Inventory includes Raw materials and components, Work-in-progress, Finished goods, Stores and spare parts, Consumable tools and Goods-in-transit—Raw materials and components. |
| xi | Secured assets include written down value of secured assets and fixed deposits under lien. |
| xii | Secured borrowings include 8.80% non-convertible debentures and term loans from financial institutions. |
Table of Contents
| 10) (b) | Annual disclosure for reporting of fund raising of issuance of Debt Securities by Large Corporate : |
(₹ in crores) | ||||||||
| Year ended March 31, 2022 | Year ended | |||||||
| Sr No | Particulars | |||||||
(i) | Incremental borrowing done (a) | 2,000.00 | 4,500.00 | |||||
(ii) | Mandatory borrowing to be done through issuance of debt securities (b) = (25% of a) | 500.00 | 1,125.00 | |||||
(iii) | Actual borrowings done through debt securities (c) | 1,000.00 | 1,000.00 | |||||
(iv) | Shortfall in the mandatory borrowing through debt securities, if any (d) = (b) - (c) | — | 125.00 | |||||
(v) | Reasons for short fall, if any, in mandatory borrowings through debt securities | — | COVID 19- shallow market | |||||
| 11) | The figures for the quarter ended March 31, 2022 and 2021 represent the difference between the audited figures in respect of full financial years and the published figures for the nine months ended December 31, 2021 and December 31, 2020, respectively. |
| 12) | The Statutory Auditors have carried out an audit of the above results for the year ended March 31, 2022 and have issued an unmodified opinion on the same. |
Tata Motors Limited
| Girish Wagh | ||
| Mumbai, May 12, 2022 | Executive Director |
Table of Contents
Media Contact Information
Tata Motors Corporate Communications E-mail: indiacorpcomm@tatamotors.com
Tel: +91 22-66657613 www.tatamotors.com
All statements contained herein that are not statements of historical fact constitute “forward-looking statements”. All statements regarding our expected financial condition and results of operations, business, plans and prospects are forward-looking statements. These forward-looking statements include but are no limited to statements as to our business strategy, our revenue and profitability, planned projects and other matters discussed herein regarding matters that are not historical fact. These forward-looking statements and any other projections (whether made by us or any third party) involve known and unknown risks, uncertainties and other factors that may cause our actual results, performance or achievements to be materially different from any future results, performance or achievements expressed or implied by these forward-looking statements or other projections. Additional risks that could affect our future operating results are more fully described in our filings with the United States Securities and Exchange Commission. These filings are available at www.sec.gov. We may, from time to time, make additional written and oral forward-looking statements, including statements contained in our filings with the Securities and Exchange Commission and our reports to shareholders. We do not undertake to update any forward-looking statement that may be made from time to time by or on our behalf.