Exhibit 99.1
TATA MOTORS LIMITED
Bombay House
24, Homi Mody Street,
Mumbai 400 001, Maharashtra, India
Submission of Investor presentation to be made to the Analysts/Investors
May 16, 2023, Mumbai: Pursuant to Regulations 30 and 46(2)(ao) of the SEBI (Listing Obligations and Disclosure Requirements) Regulations, 2015, and with further reference to our filing dated May 1, 2023, please find reproduced hereunder the presentation made to the Analysts / Investors on the Audited Standalone and Consolidated Financial Results for the fourth quarter and year ended March 31, 2023.
The same is also being made available on the Company’s website www.tatamotors.com.
This is for your information and records.

TATA MOTORS Tata Motors Group Results for quarter ended March 31, 2023

Safe harbour statement Statements in this presentation describing the objectives, projections, estimates and expectations of Tata Motors Limited (the “Group”), Jaguar Land Rover Automotive plc (“JLR ”) and its business segments may be “forward-looking statements” within the meaning of applicable securities laws and regulations. Actual results could differ materially from those expressed or implied. Important factors that could make a difference to the Group’s operations include, amongst others, economic conditions affecting demand / supply and price conditions in the domestic and overseas markets in which the Group operates, changes in Government regulations, tax laws and other statutes and incidental factors. Certain analysis undertaken and represented in this document may constitute an estimate from the Group and may differ from the actual underlying results. Narrations Q4FY23 represents the 3 months period from 1 Jan 2023 to 31 Mar 2023 Q4FY22 represents the 3 months period from 1 Jan 2022 to 31 Mar 2022 FY23 represents the 12 months period from 1 Apr 2022 to 31 Mar 2023 FY22 represents the 12 months period from 1 Apr 2021 to 31 Mar 2022 Q1FY23 represents the 3 months period from 1 Apr 2022 to 30 Jun 2022 Q2FY23 represents the 3 months period from 1 Jul 2022 to 30 Sep 2022 Q3FY23 represents the 3 months period from 1 Oct 2022 to 31 Dec 2022 Accounting Standards Financials (other than JLR) contained in the presentation are as per IndAS Results of Jaguar Land Rover Automotive plc are presented under IFRS as adopted for use in the UK. Other Details Presentation format The results provided represent the details on consolidated segment level. The operating segment comprise of Automotive segment and others. In automotive segment, results have been presented for entities basis four reportable sub-segments as below TML Group Automotive business Tata Commercial Vehicles (Tata CV) Includes TML & subs - TDCV, TDSC, TMML,TMSA, PTTMIL and Joint operation TCL Tata Passenger Vehicles (Tata PV) Includes TMPVL, TPEML,TMETC, TRILIX and Joint operation FIAPL Jaguar Land Rover Vehicle Financing (Tata Motors Finance) JLR volumes: Unless otherwise specified, retail volume and wholesales volume data includes sales from the Chinese joint venture (“CJLR”) Reported EBITDA is defined to include the product development expenses charged to P&L and realised FX and commodity hedges but excludes the revaluation of foreign currency debt, revaluation of foreign currency other assets and liabilities, MTM on FX and commodity hedges, other income (except government grant) as well as exceptional items. Reported EBIT is defined as reported EBITDA plus profits from equity accounted investees less depreciation & amortisation. Free cash flow is defined as net cash generated from operating activities less net cash used in automotive investing activities, excluding investments in consolidated entities, M&A linked asset purchases and movements in financial investments, and after net finance expenses and fees paid. Retail sales for India business represents the estimated retails for the period TATA MOTORS 2

Product and other highlights for the year – Tata Motors (India) Launch of 5 CNG trucks, including India’s first in MHCV, introduction of new age ADAS Launch of Tiago.EV, strong response. Acquisition of Ford Sanand Facility complete Yodha 2.0, Intra V20 bi-fuel and Intra V50. MOU with UBER for 25,000 XPRES–T EVs, apart from other MOUs for 20K Funds received on January 31, for Tranche 2 of ₹3,750 Cr. Exciting product range unveiled at Auto Expo 2023 TATA MOTORS 3
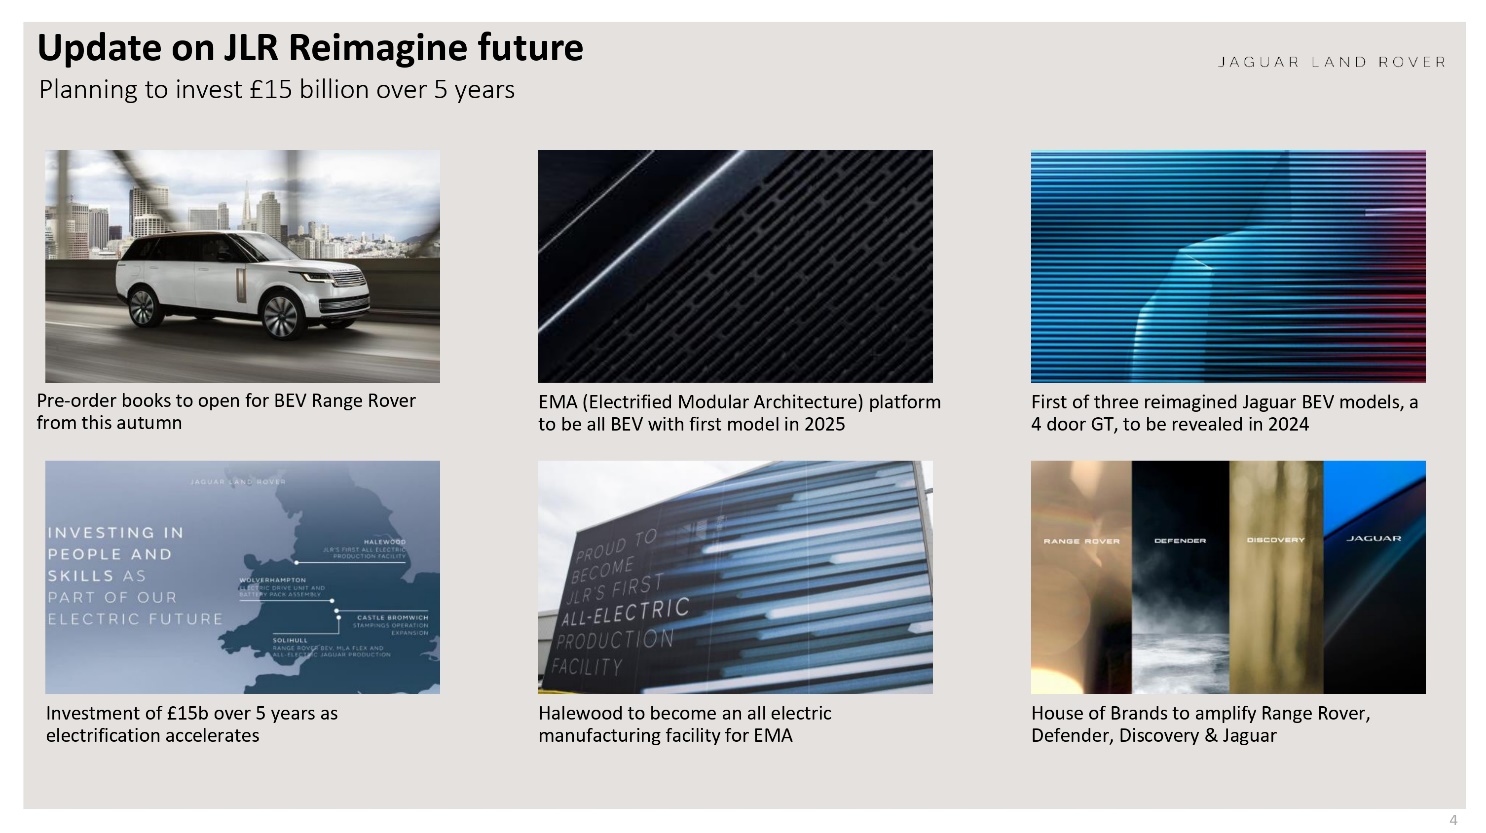
Update on JLR Reimagine future Planning to invest £15 billion over 5 years Pre-order books to open for BEV Range Rover from this autumn EMA (Electrified Modular Architecture) platform to be all BEV with first model in 2025 First of three reimagined Jaguar BEV models, a 4 door GT, to be revealed in 2024 Investment of £15b over 5 years as electrification accelerates Halewood to become an all electric manufacturing facility for EMA House of Brands to amplify Range Rover, Defender, Discovery & Jaguar TATA MOTORS 4

Q4: Revenue ₹ 105.9 KCr, EBITDA 13.3%, PBT(bei) ₹ 5.0 KCr Robust performance of all the auto verticals FY 23 | Consolidated | Ind AS, ₹ KCr Q1 FY23 Q2 FY23 Q3 FY23 Q4 FY23 Q4 FY22 Y-o-Y FY23 FY22 Y-o-Y Global wholesales (K units) 317 336 322 362 335 8.0% 1,336 1,087 22.9% Revenue 71.9 79.6 88.5 105.9 78.4 35.1% 346.0 278.5 24.2% EBITDA (%) 7.4% 9.7% 11.1% 13.3% 11.2% 210 bps 10.7% 9.6% 110 bps EBIT (%) -0.7% 2.4% 4.4% 6.8% 3.2% 360 bps 3.6% 0.7% 290 bps PBT (bei) (5.0) (1.8) 3.2 5.0 0.4 4.6 1.5 (6.4) 7.9 FCF (Auto) (9.8) 1.0 5.3 11.3 7.9 3.4 7.8 (9.5) 17.3 Volume & Revenue Volumes improve sequentially due to strong India demand and better supplies at JLR. Pricing actions and richer mix leading to improved ASP’s and higher revenue growth Profitability All 3 core-auto businesses report strong profits for second quarter in a row. Margins improve due to better mix, pricing actions and easing inflation Cash Flow Strong FCF of ₹ 16.6 K Crs in H2, leading to full year auto FCF at ₹ 7.8 K Crs Operational cash flows and working capital rewind aiding cash flows TATA MOTORS 5

EBIT 6.8%; Net Auto Debt reduces to ₹ 43.7 KCr Revenue growth ~35% YoY, EBIT improves 360bps YoY. Q4 FY 23 | Consolidated | IndAS Revenue ₹ KCr 78.4 19.2 8.2 (0.5) 0.6 24.4% 10.5% (0.5)% 0.7% 105.9 Q4FY22 Volume & Mix Price 35.1% increase Translation Others Q4FY23 Profitability (EBIT) ₹Cr 2,478 3,312 1,197 50 117 7,154 EBIT Q4 FY22 JLR Tata(CV) Tata (PV) Others EBIT Q4 FY 23 3.2% 2.8% 0.9% 0.0% (0.1)% 6.8% Net Auto Debt ₹ KCr 40.9 6.2 34.7 FY21 48.7 6.7 9.6 32.4 FY22 60.7 18.5 34.8 Q1FY23 59.5 7.8 19.9 32.2 H1FY23 57.5 8.3 18.5 30.7 9MFY23 43.7 8.4 12.2 23.1 FY23 Ext. Debt Impact of WC change Lease Entities ₹ KCr TML India* 6.2 JLR 30.3 TML Holdings 9.3 Others and adj (2.1) Total 43.7 *CV+PV+EV+Joint operations TATA MOTORS 6

Financials: Headline observations* Amongst the strongest quarters for TML Group QUARTER HIGHEST EVER REVENUE ₹ 105.9 K crs HIGHEST EVER EBITDA ₹ 14.1 K crs STRONG PBT (bei) All auto verticals profitable ₹ 5.0 K crs NET AUTO DEBT REDUCTION ₹ 13.8 K crs in Q4 FULL YEAR HIGHEST EVER REVENUE ₹ 346.0 K crs HIGHEST EBITDA since FY2015 ₹ 37.0 K crs STRONG PBT (bei) ₹ 1.5 K crs INDIA NET DEBT Lowest in 15 years ₹ 6.2 K crs * Represents data on consolidated basis, unless otherwise specified TATA MOTORS 7

Dividend ₹ 2 per share recommended The Board has recommended a dividend of ₹ 2 per share for Ordinary shareholders (100% of face value) and ₹ 2.1 per share for DVR shareholders To be approved in the ensuing shareholders meeting Resultant cash outflow would be ₹ 771 cr. TATA MOTORS 8
JAGUAR LAND ROVER JAGUAR LAND ROVER AUTOMOTIVE PLC Results for the quarter ended March 31, 2023 RICHARD MOLYNEU X Acting Chief Financial Officer 9

Q4 Revenue £7.1b, EBITDA 14.6%, PBT (bei) £368m Financial performance continued to improve in Q4 FY23 FY23 | Jaguar Land Rover | IFRS, £m Q1 FY23 Q2 FY23 Q3 FY23 Q4 FY23 Q4 FY22 Y-o-Y FY23 FY22 Y-o-Y Retails (K units) 78.8 88.1 84.8 102.9 79.0 30.2% 354.7 376.4 (5.8)% Revenue (£m) 4,406 5,260 6,041 7,102 4,767 49% 22,809 18,320 24.5% EBITDA (%) 6.3% 10.3% 11.9% 14.6% 12.6% 200 bps 11.3% 10.3% 100 bps EBIT (%) (4.4)% 1.0% 3.7% 6.5% 2.0% 450 bps 2.4% (0.4)% 280 bps PBT (bei) (£m)* (524) (173) 265 368 9 359 (64) (412) 348 Free Cash flows(£m) (769) (15) 490 815 340 475 521 (1,156) 1,677*PBT before exceptional items. Exceptional items are: £6m in Q4 FY23; £161m in FY23; £(43)m in Q4 FY22; £(43)m FY22. *PBT including exceptional items: £374m Q4 FY23; £97m FY23; £(34)m Q4 FY22; £(455)m FY22 JAGUAR LAND ROVER 10
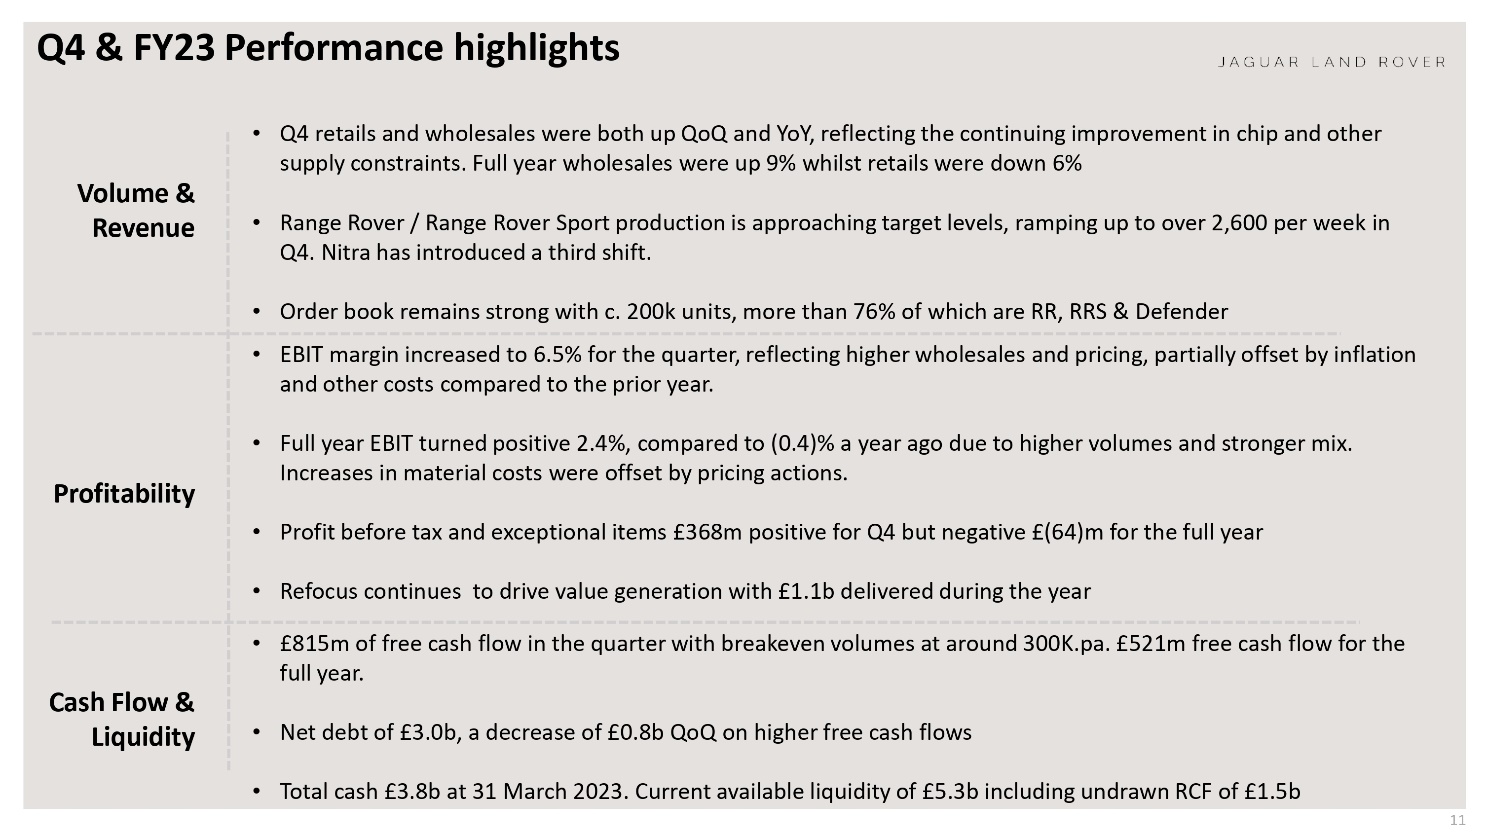
Q4 & FY23 Performance highlights Volume & Revenue Q4 retails and wholesales were both up QoQ and YoY, reflecting the continuing improvement in chip and other supply constraints. Full year wholesales were up 9% whilst retails were down 6% Range Rover / Range Rover Sport production is approaching target levels, ramping up to over 2,600 per week in Q4. Nitra has introduced a third shift. Order book remains strong with c. 200k units, more than 76% of which are RR, RRS & Defender Profitability EBIT margin increased to 6.5% for the quarter, reflecting higher wholesales and pricing, partially offset by inflation and other costs compared to the prior year. Full year EBIT turned positive 2.4%, compared to (0.4)% a year ago due to higher volumes and stronger mix. Increases in material costs were offset by pricing actions. Profit before tax and exceptional items £368m positive for Q4 but negative £(64)m for the full year Refocus continues to drive value generation with £1.1b delivered during the year £815m of free cash flow in the quarter with breakeven volumes at around 300K.pa. £521m free cash flow for the full year. Cash Flow & Liquidity Net debt of £3.0b, a decrease of £0.8b QoQ on higher free cash flows Total cash £3.8b at 31 March 2023. Current available liquidity of £5.3b including undrawn RCF of £1.5b JAGUAR LAND ROVER 11

Q4 wholesales of ~95k, up 19% QoQ, 24% YoY Full year wholesales up 9% compared to the prior year FY 23 | Brans | Wholesales* | Units in 000’s RANGE ROVER DEFENDER DISCOVER JAGUAR QUARTER FULL YEAR 37.8 Q4 FY22 40.2 Q3 FY23 47.8 Q4 FY23 15.9 Q4 FY22 23.8 Q3 FY23 27.5 Q4 FY23 9.5 5.6 9.6 13.3 10.0 9.7 Q4 FY22 Q3 FY23 Q4 FY23 Q4 FY22 Q3 FY23 Q4 FY23 Q4 FY22 Q3 FY23 Q4 FY23 147.5 FY22 158.3 FY23 58.4 FY22 86.5 FY23 38.7 FY22 38.8 FY23 49.5 FY22 42.7 FY23 TOTAL 76.5 79.6 94.6 Q4 FY22 Q3 FY23 Q4 FY23 294.2 FY22 321.4 FY23 *. Wholesales are excluding sales from Chinese Joint Venture JAGUAR LAND ROVER 12

Q4 wholesales were higher in all regions compared to the prior year Full year wholesales also higher in all regions compared to the prior year FY 23 | Region s | Wholesales* | Units in 000’s U K N AMERICA EUROPE CHINA OVERSEAS QUARTER 16.4 13.6 20.3 Q4FY22 Q3FY23 Q4FY23 19.0 26.2 19.3 Q4FY22 Q3FY23 Q4FY23 18.0 15.2 22.0 Q4FY22 Q3FY23 Q4FY23 10.3 11.6 12.0 Q4FY22 Q3FY23 Q4FY23 13.0 13.0 21.0 Q4FY22 Q3FY23 Q4FY23 57.3 62.1 FY22 FY23 79.4 81.6 FY22 FY23 65.2 74.4 FY22 FY23 41.4 44.9 FY22 FY2351.1 58.3 FY22 FY23 JLR POWERTRAIN MIX (RETAILS) 36% 50% 14% Q4FY22 34% 56% 11% Q3FY23 27% 57% 17%Q4FY23 BEV & PHEV MHEV ICE * Wholesales are excluding sales from Chinese Joint Venture JAGUAR LAND ROVER 13

Q4 FY23 PBT up £359m YoY Favourable volume, mix and pricing, offset partially by inflation and other items FY 23 | IFRS, £m Volumes 272 Mix 335 Emissions (35) Other 22 Pricing 242 Material cost (230) VME (0.9)% to (0.5)% 23 Manufacturing (22) Warranty (69) (321) SG&A (117) Depn & Amort. (73) L&OH (25) (217) Operational FX 113 Realised FX derivatives (81) Revaluation 105 Unrealised commodity derivatives (99) 38 9 594 368 Q4 FY22 PBT (bei) Volume & Mix Net Pricing Contribution Costs Structural costs FX & commodities Q4 FY23 PBT (bei) EBIT Margin 2.0% 11.4% (4.4)% (3.0)% 0.5% 6.5% JAGUAR LAND ROVER 14
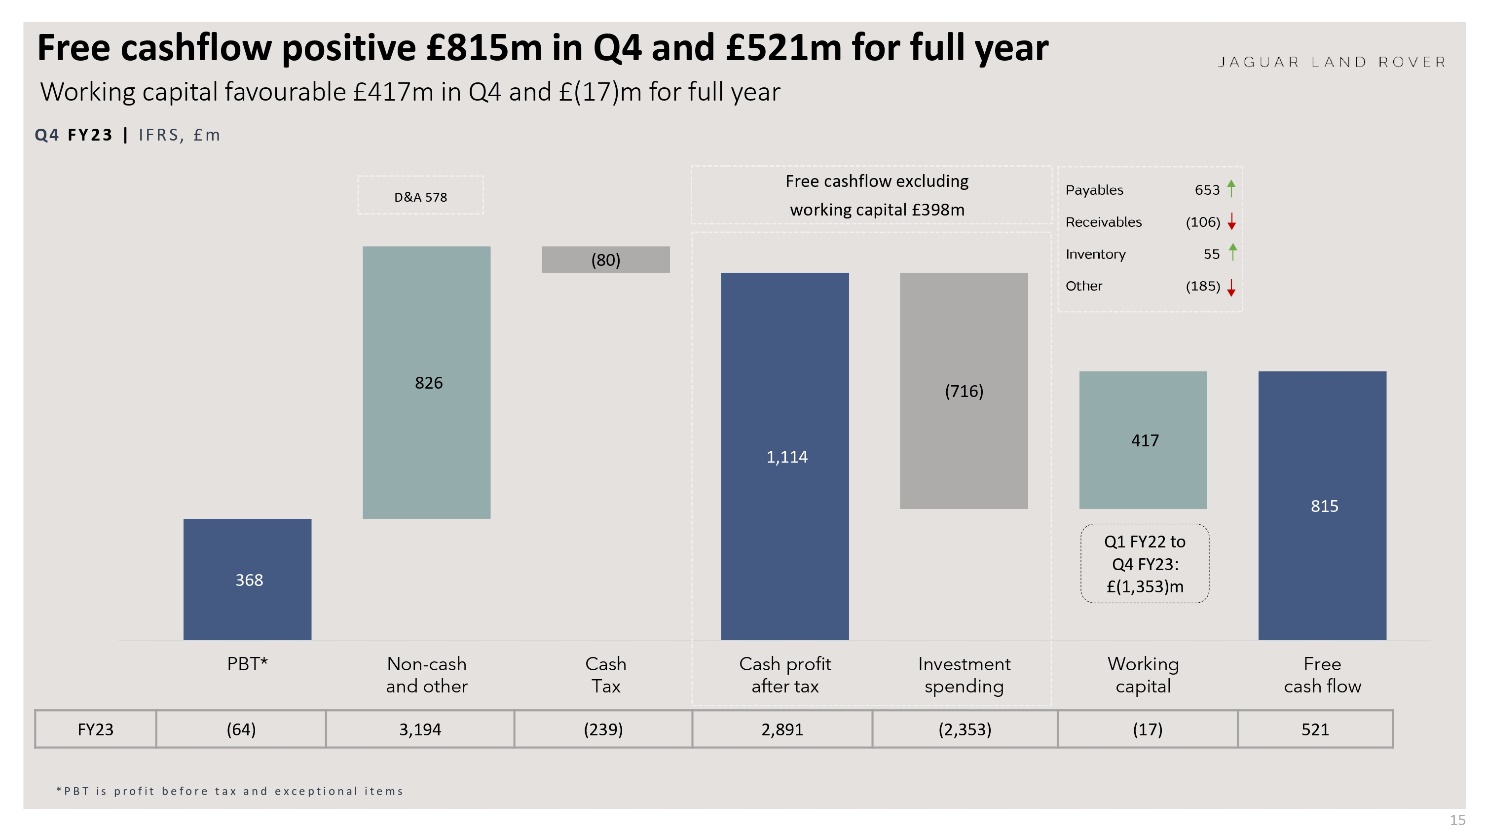
Free cashflow positive £815m in Q4 and £521m for full year Working capital favourable £417m in Q4 and £(17)m for full year Q4FY23 | IFRS, £m D&A 578 826 (80) Free cashflow excluding working capital £398m 1,114 (716) Payables 653 Receivables (106) Inventory 55 Other (185) 417 815 368 PBT*Non-cash and other Cash Tax Cash profit after tax Investment spending Q1 FY22 to Q4 FY23: £(1,353)m Working capital Free cash flow FY23 (64) 3,194 (239) 2,891 (2,353) (17) 521 *PBT is profit before tax and exceptional items JAGUAR LAND ROVER 15

Total FY23 investment £2.4bn, engineering capitalisation rate 43% Q4 FY23 investment £0.7bn, engineering capitalisation rate 53% FY23 | IFRS, £Mfy23 Capitalised Engineering 727 Expensed Engineering 966 Total Engineering 1,693 Capital Investment 660 Total Investment2,353 FY22 455 839 1,294 742 2,036 Q4 FY23 270 236 506 210 716 JAGUAR LAND ROVER 16

BUSINESS UPDATE JAGUAR LAND ROVER 17
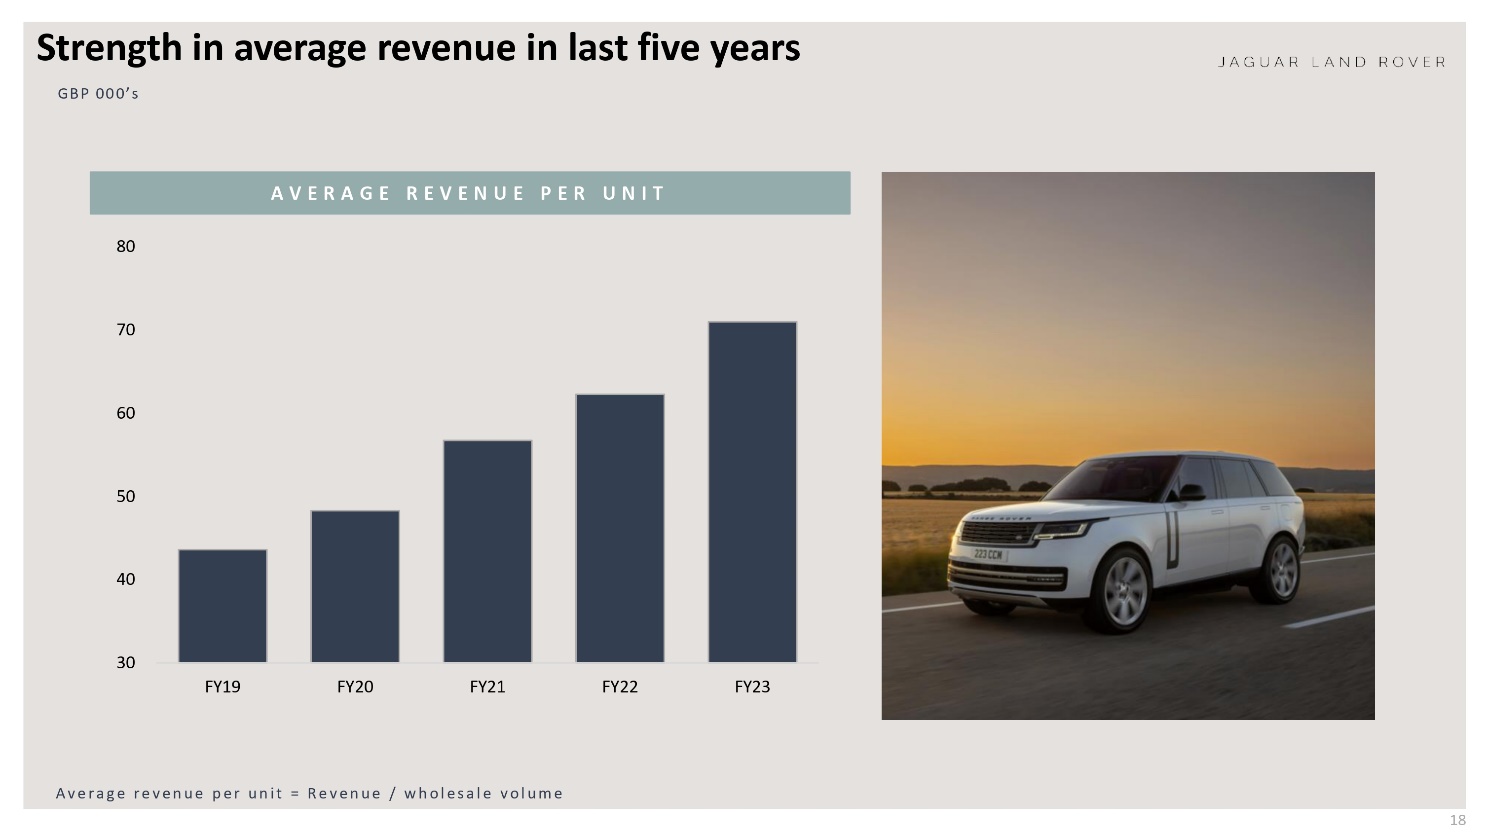
Strength in average revenue in last five years GBP 000’s AVERAGE REVENUE PER UNIT 80 70 60 50 40 30 FY19 FY20 FY21 FY22 FY23 Average revenue per unit = Revenue / wholesale volume JAGUAR LAND ROVER 18

Semiconductor supply improved in Q4 FY23 Expect improvement to continue over FY24 Units 000’s WHOLESALE VOLUME* 100 90 80 70 60 50 40 Q1 FY22 Q2 FY22 Q3 FY22 Q4 FY22 Q1 FY23 Q2 FY23 Q3 FY23 Q4 FY23 COMMENTARY Agreements in place with key suppliers now improving visibility of chip supply Expect gradual improvement to continue over FY24 Wholesales in Q1 expected to be similar to Q4 reflecting 60 planned production days compared to 64 production days in Q4 Continue to manage other constraints in the supply chain *. Wholesales are excluding sales from Chinese Joint Venture JAGUAR LAND ROVER 19

New Range Rover & Range Rover Sport continues to increase Production approaching target levels FY23 AVERAGE WEEKLY RR/RRS PRODUCTION 1,100 Q1 1,600 Q2 2,300 Q3 2,600 Q4 Note: Approximately 46 weeks of production in each fiscal year due to planned shut down periods JAGUAR LAND ROVER 20

Significant inflation headwinds offset by Refocus in FY23 Revenue and cost optimisation actions being taken to mitigate inflation FY23 SOURCES OF INFLATION JAGUAR LAND ROVER REFOCUS SAVINGS IN FY23 ■Commodity prices Semiconductors Energy ☐ Other MARKET PERFORMANCE £600m value contribution Primarily re-pricing and optimisation of available semi- conductor using data analytics COSTS ⚫ £100m labour and quality cost saving through Agile transformation activities INVESTMENT £400m investment savings through applying strict payback criteria on non-production spend Inflation accounted for c. £(850)m increased cost in FY23 Inflation includes direct costs and indirect costs from supplier price increases Further £250m delivered in Q4 £1.1bn saved from Refocus initiatives in FY23 21

China market update JLR China FY23 profitability highest in 5 years with premium market volumes steady last 2 years JAGUAR LAND ROVER TOTAL CHINA PREMIUM MARKET AND JLR SHARE STABILIZED WHILE NEV GROWING AVERAGE NET VEHICLE REVENUE KEEPS AN INCREASING TREND 3,903k 3,717k 3,916k GBP -Import 100k 101k 91k -Total China 56k 61k 66k 383k (10%) FY20/21 748k (20%) FY21/22 1,152k (29%) FY22/23 ■NEV in adjusted China premium market* JLR Share 3% excl. NEV 3% JLR KEEPS STABLE SHARE IN KEY LARGE SUV MARKET 368k 358k 3% 353k Local JV 30k 32k 36k CY2020 CY2021 CY2022 KEY TAKEAWAYS ⚫ JLR China profitability in FY23 - highest in 5 years despite two months' Covid lockdown • 9% 9% 9% Following global Refocus strategy, JLR China built up the success based on: ✓ Improvement on supply and success in launching new products ✓ Continuing of transformation journey of cost optimization, and ✓ Dealer network consolidation FY20/21 SUV4&5 FY21/22 FY22/23 JLR share in SUV4&5 *Adjusted China premium market: global premium market + local near premium brands (HiPhi, Nio, IM, Avatr, Zeekr, Aito, Denza, Arcfox, Li, Voyah). "NEV" includes BEV and PHEV vehicles. 22
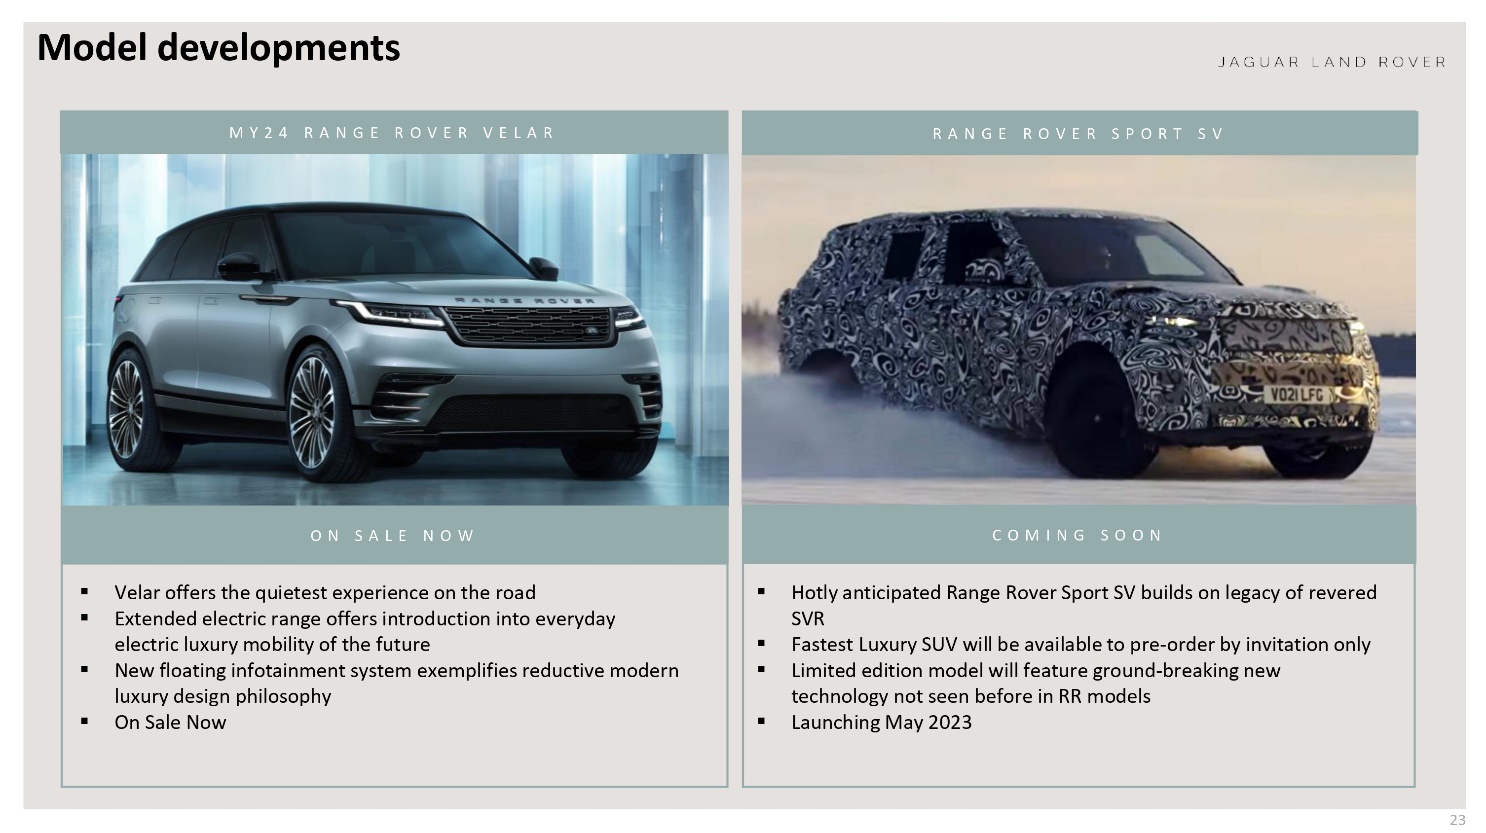
Model developments MY 24 RANGE ROVER VELAR RANGE ROVER SPORT SV RANG ROVE ON SALE NOW COMING SOON JAGUAR LAND ROVER V021 LFG • Velar offers the quietest experience on the road Extended electric range offers introduction into everyday electric luxury mobility of the future New floating infotainment system exemplifies reductive modern luxury design philosophy • On Sale Now Hotly anticipated Range Rover Sport SV builds on legacy of revered SVR Fastest Luxury SUV will be available to pre-order by invitation only Limited edition model will feature ground-breaking new technology not seen before in RR models Launching May 2023 23
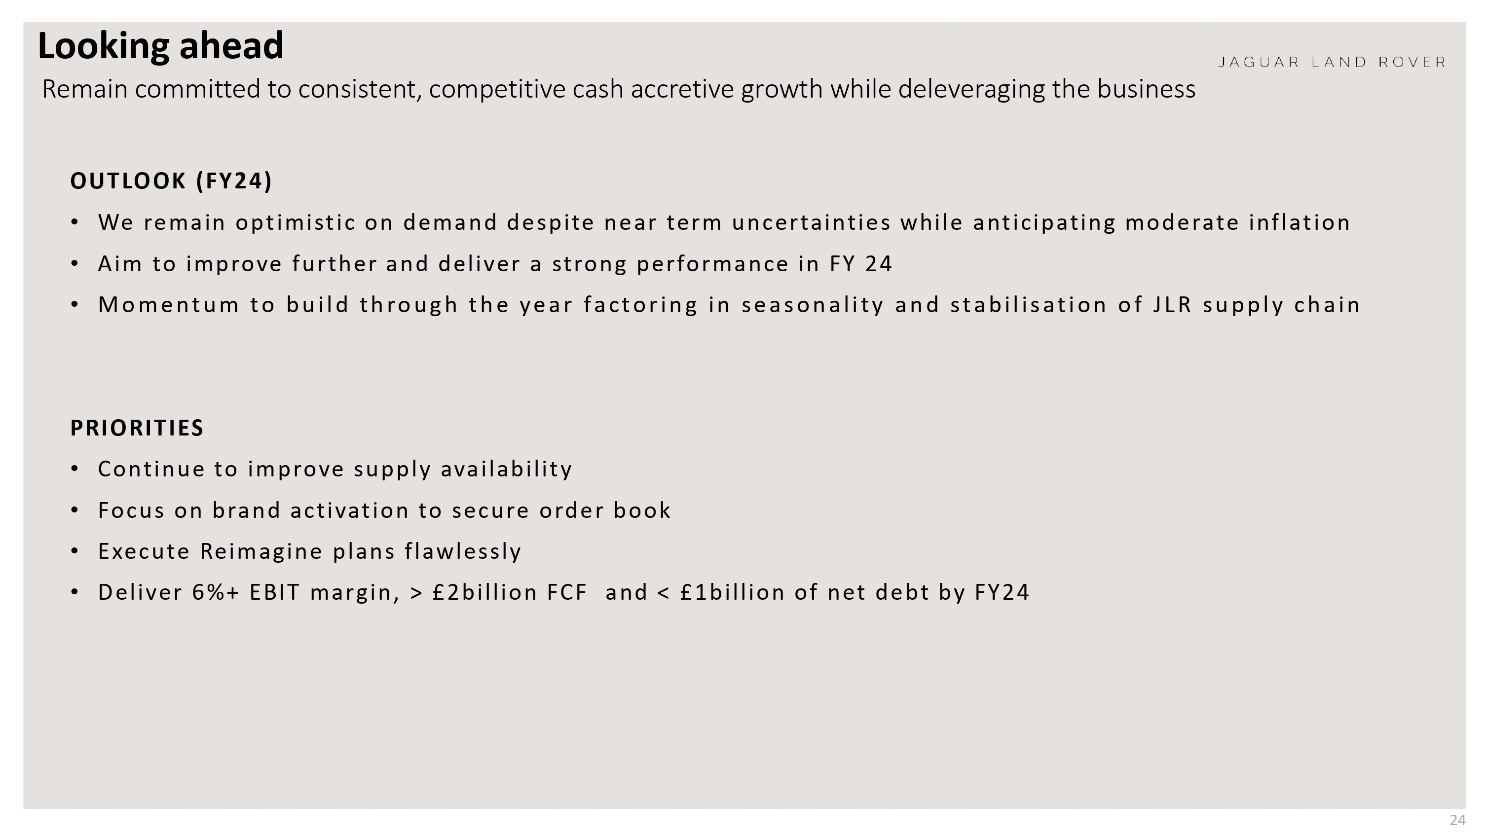
Looking ahead Remain committed to consistent, competitive cash accretive growth while deleveraging the business OUTLOOK (FY24) • JAGUAR LAND ROVER We remain optimistic on demand despite near term uncertainties while anticipating moderate inflation Aim to improve further and deliver a strong performance in FY 24 Momentum to build through the year factoring in seasonality and stabilisation of JLR supply chain PRIORITIES • Continue to improve supply availability • Focus on brand activation to secure order book • Execute Reimagine plans flawlessly Deliver 6% + EBIT margin, > £2billion FCF and < £1billion of net debt by FY24 24
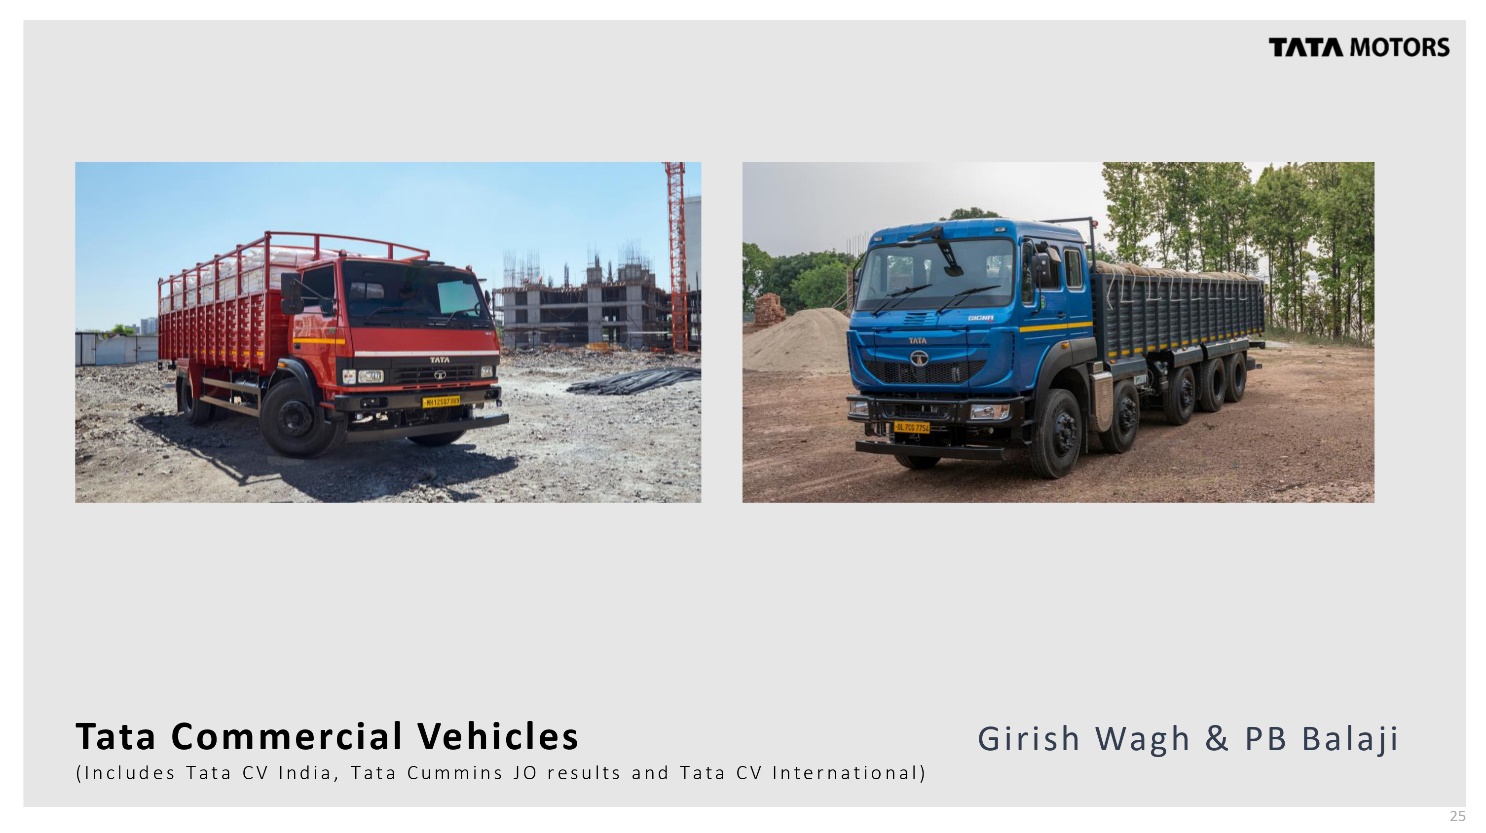
6530 TATA OL 700 7754 Tata Commercial Vehicles (Includes Tata CV India, Tata Cummins JO results and Tata CV International) TATA MOTORS Girish Wagh & PB Balaji 25

Registration (Vahan) market share starts to recover HCV, LGV and Passenger recover; MGV to be addressed on priority Tata Commercial Vehicles | Domestic market share* Commercial Vehicles 44.7% 41.7% 43.1% 39.9% 41.1% FY22 FY23 H1 FY23 Q3 FY23 Q4 FY23 TATA MOTORS Vahan Ref HGV+HMV MGV LGV Tonnage > = 13Ts 7.5 to 12 Ts HPV+MPV+LPV Upto 7.5ts Passenger transport HGV+HMV MGV LGV Passenger 52.6% 49.6% 50.7% 48.7% 48.6% 48.6% 44.2% 47.2% 41.4% 42.2% 37.8% 39.3% 35.7% 37.0% 38.4% 39.7% 40.2% 35.9% 37.9% 35.6% FY22 FY23 H1 FY23 Q3 FY23 Q4 FY23 FY22 FY23 H1 FY23 Q3 FY23 Q4 FY23 FY22 FY23 H1 FY23 Q3 FY23 Q4 FY23 FY22 FY23 H1 FY23 Q3 FY23 Q4 FY23 *VAHAN registration market share is based on 07 Vehicle Categories of Govt. of India's VAHAN portal (powered by National Informatics Centre) *The data excludes registration of MP, Andhra Pradesh and Telangana states *The data is based on details updated as on 8th April,2023. VAHAN portal data is subject to updates with retrospective effect, marginally impacting TML overall MS on an annualized basis. HGV: Heavy Goods Vehicles HMV: Heavy Motor Vehicles MGV: Medium Goods Vehicles LGV: Light Goods Vehicles LPV: Light Passenger Vehicles MPV: Medium Passenger vehicles HPV: Heavy Passenger Vehicles 26

RETAILS Tata Commercial Vehicles - Volumes Strong recovery lead by MHCV and CV passenger segment, offset by weaker exports Tata Commercial Vehicles | India Business Volumes TATA MOTORS WHOLESALES Wholesales (incl. exports) (K units) Wholesales (incl. exports) (K units) YoY (2.7)% Exports YoY 15.6% Exports 413.1 20.2 119.8 9.8 116.5 357.5 95.0 4.0 34.8 4.2 110.0 112.5 90.8 Q4 FY22 Q3 FY23 Q4 FY23 Retails (domestic) (K units) ΥΟΥ 6.3% 114.2 107.4 97.7 Powertrain mix (FY 23) 392.9 322.7 9% 18% 15% 2% 10% 9% 20% FY22 100% FY23 82% 89% 81% 65% Retails (domestic) (K units) YoY 24.5% 397.2 319.1 Q4 FY22 Q3 FY23 Q4 FY23 FY22 FY23 MHCV ILCV SCV PU Buses Total Diesel Petrol CNG+EV 27

Q4: Revenue 21.2KCr, EBITDA 10.1%, PBT(bei) € 1.7 KCr Double digit EBITDA margins in Q4 TATA MOTORS FY23 | Tata Commercial Vehicles | IndAS, * KCr Q1 FY23 Q2 FY23 Q3 FY23 Global wholesales (K units) 103.7 103.1 97.1 Q4 FY23 118.7 Q4 FY22 122.3 Y-o-Y (3.0)% FY23 FY22 Y-o-Y 422.6 367.5 15.0% Revenue 16.3 16.4 16.9 21.2 18.5 14.6% 70.8 52.3 35.4% EBITDA (%) 5.5% 5.0% 8.4% 10.1% 5.9% 420 bps 7.4% 3.7% 370 bps EBIT (%) 2.8% 2.3% 5.9% 8.6% 3.4% 520 bps 5.2% 0.4% 480 bps PBT (bei) 0.3 0.3 0.9 1.7 0.6 1.1 3.2 (0.1) 3.3 Volume & Revenue Rebound in volumes lead by HCV and passenger segment. Some element of pre-buy in the Q4 volume numbers Improved mix and pricing actions drive higher ASP's and revenue growth. • Profitability Demand pull strategy starting to yield results as profits and market shares improve sequentially FY23 EBITDA and EBIT margins improve by 370 bps and 480 bps respectively. Strong PBT (bei) of 3.2 K Cr in FY23 28
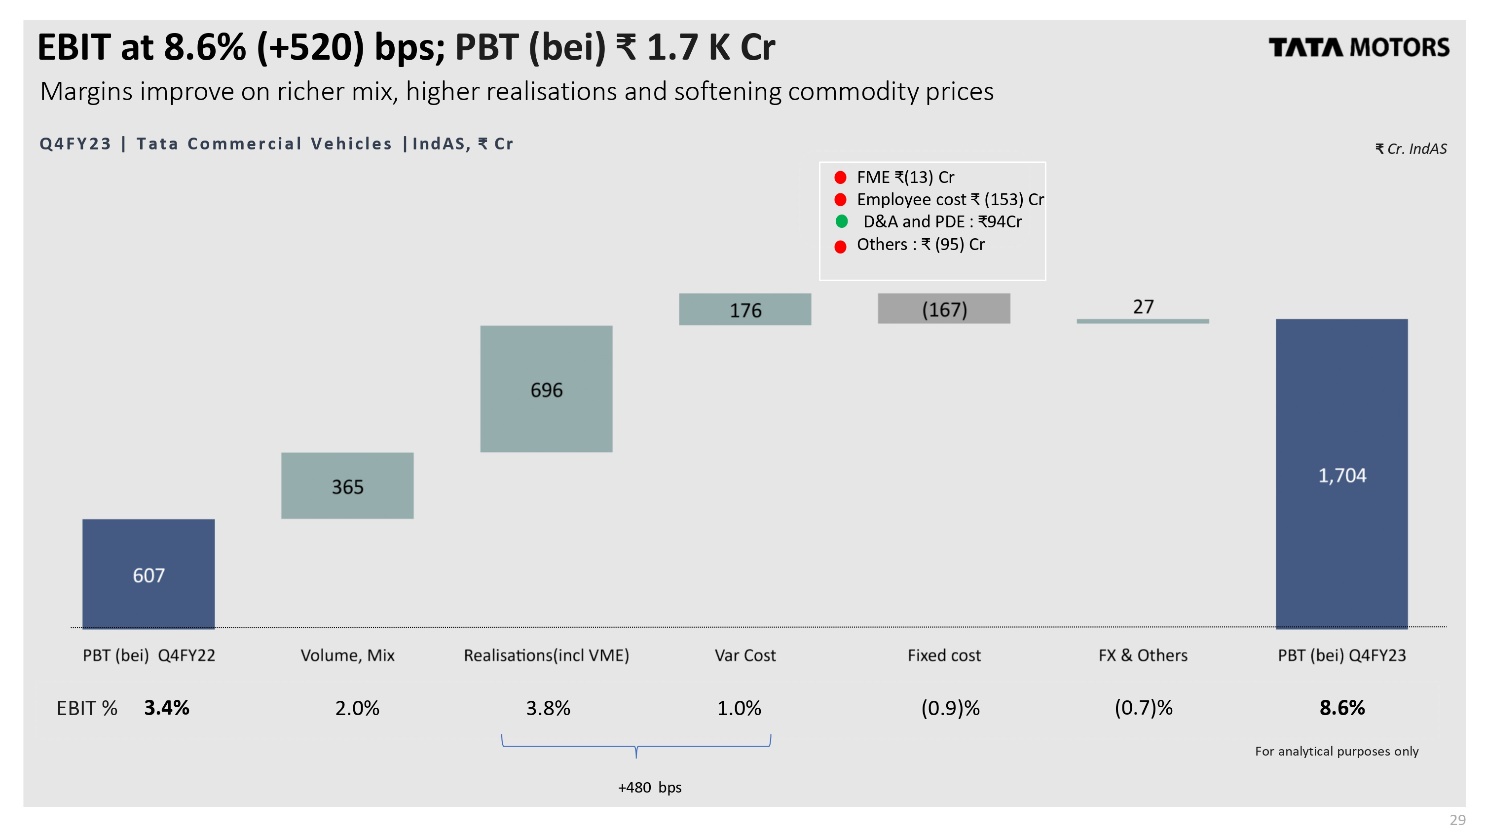
EBIT at 8.6% (+520) bps; PBT (bei) € 1.7 K Cr Margins improve on richer mix, higher realisations and softening commodity prices Q4FY23 | Tata Commercial Vehicles | IndAS, * Cr 607 365 696 176 FME (13) Cr Employee cost (153) Cr D&A and PDE: *94Cr Others: * (95) Cr (167) 27 27 TATA MOTORS * Cr. IndAS 1,704 PBT (bei) Q4FY22 Volume, Mix Realisations(incl VME) Var Cost Fixed cost FX & Others PBT (bei) Q4FY23 EBIT % 3.4% 2.0% 3.8% 1.0% (0.9)% (0.7)% 8.6% +480 bps For analytical purposes only 29
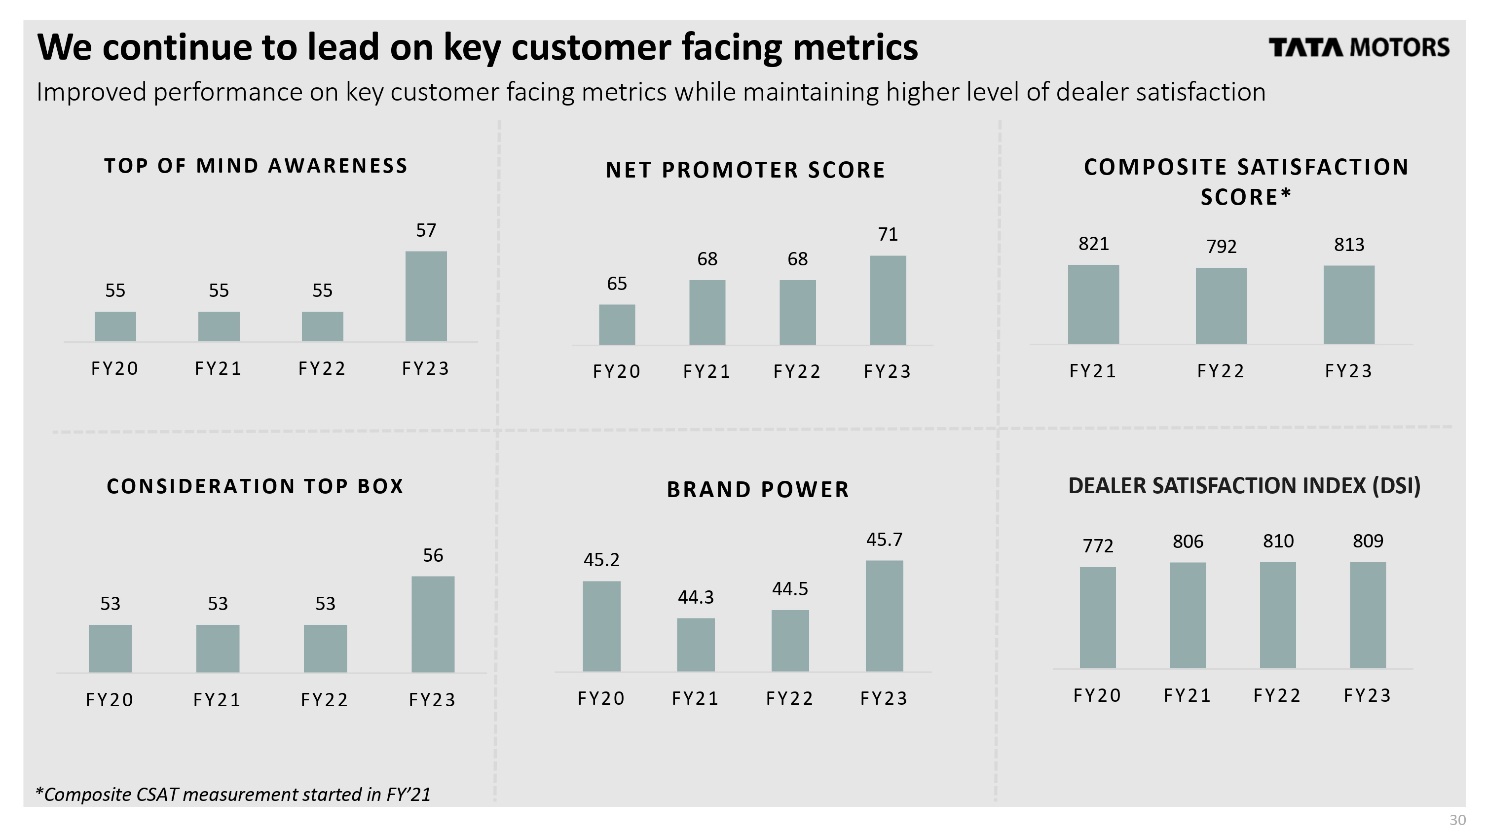
We continue to lead on key customer facing metrics Improved performance on key customer facing metrics while maintaining higher level of dealer satisfaction TATA MOTORS TOP OF MIND AWARENESS 55 55 55 NET PROMOTER SCORE COMPOSITE SATISFACTION SCORE* 57 71 821 792 813 68 68 65 FY20 FY21 FY22 FY23 FY20 FY21 FY22 FY23 FY21 FY22 FY23 CONSIDERATION TOP BOX BRAND POWER DEALER SATISFACTION INDEX (DSI) 45.7 772 806 810 809 56 45.2 44.5 53 53 44.3 53 FY20 FY21 FY22 FY23 FY20 FY21 FY22 FY23 FY20 FY21 FY22 FY23 *Composite CSAT measurement started in FY'21 30

Tata Commercial Vehicles - overall update Industry volumes continued to grow led by MHCVs and passenger carriers Key highlights Industry continued its upward trajectory, +22% vs Q4 FY22, +34% in FY23 vs FY22. 40+ new products and 150+ variants launched in FY23. Highest annual and quarterly revenue*. Improved VAHAN share in Q4 vs Q3 after the shift to demand pull strategy Non-vehicle-business grew by 33%. Spares and Service penetration improves further. • EBIT improves sequentially, highest in 21 quarters*, led by discount pull back, cost reduction and commodity softening * For TML standalone CV + Joint Operation Tata Cummins Bright Spots Strong demand led by M&HCVs (+52.4% vs FY22) and robust recovery in passenger carriers (+155% vs FY22) Improved net promoter score and Brand power by 300bps and 170bps respectively to highest ever levels. Entire portfolio transitioned to BSVI Phase II with improved competitiveness on TCO, comfort and convenience and connectivity With new CNG pricing guideline, there is 7-9% reduction in CNG prices which is expected to improve demand of CNG powered vehicles MHCV: Medium and heavy Commercial vehides ILCV: Intermediate and Light Commercial vehicles SCV: Small commercial vehicles • • • TATA MOTORS Focus areas Continued focus on retail, VAHAN (registration) share and realization improvement with enhanced engagement with all stakeholders Establish BS6 phase II product in market with focused value communication Scale up EV supplies (ACE EV & E-Buses) Continue growth in downstream International markets: Focus on maintaining market shares, margins and channel health as most markets operating at lower volumes 31

Tata Commercial Vehicles - New business update TATA MOTORS Electric Mobility Completed all due E-Bus deliveries to DTC and Nagpur city in FY23 Started manufacturing and dispatches of CESL orders against 2800 ordered ~300 Ace EVs delivered in Q4, focus on ramping up supplies and orders Shared green portfolio plans through 14 exhibits across all future powertrain technologies at Auto Expo 23 TML Smart City Mobility Solutions Ltd. Concession agreements signed • . Delhi Transport Corporation (1500) Bengaluru Metropolitan Transport Corporation (921) J&K (200) TML e-bus fleet cumulatively crossed 70 million Kms with >95% uptime in FY23. Operational revenue in FY23 ~ 500crs Digital Sustained growth in Fleet Edge adoption (>390K connected trucks) and monthly active usage. Increased penetration in Q4 and introduced. subscription model in April Engagement time improved E-dukaan, online marketplace for spares grew by 2.8X in FY23 vs FY22. Extended E-Dukaan for DEF1 and lubricants. Digitally sourced leads consistently clocking double digit share of retails. 1. DEF: Diesel Exhaust Fluid 32
NEXONEY PUNCH TATA MOTORS Shailesh Chandra & PB Balaji Tata Passenger Vehicles (Includes Tata PV, EV India, FIAPL JO results and international business (PV+EV))

RETAILS Tata Passenger Vehicles - Volumes Tata Passenger Vehicles |India business | Volumes WHOLESALES Wholesales (incl. exports) Wholesales (incl. exports) (K units) (K units) YoY 9.6% Exports ΥΟΥ 45.4% Exports 541.0 2.5 132.3 135.6 123.6 0.8 0.5 1.0 123.1 131.3 134.8 Q4 FY22 Q3 FY23 Q4 FY23 Retails (domestic) (K units) 115.0 YoY 9.7% 138.9 126.1 Q4 FY22 Q3 FY23 Q4 FY23 372.2 1.8 TATA MOTORS VAHAN registration market share(1) 538.5 13.5% 11.4% 370.4 8.0% FY22 FY23 FY21 FY22 FY23 Retails (domestic) (K units) Powertrain Mix ΥΟΥ 44.2% Petrol Diesel EV ☐ CNG 523.5 1% 5% 8% 363.0 3% 18% 9% 20% 16% FY22 FY23 80% 72% 67% FY21 (1)VAHAN registration market share is based on VAHAN portal (powered by National Informatics Centre). The data excludes registrations done in MP, Andhra Pradesh and Telangana states FY22 FY23 34

EV's continue to witness strong growth; 16K vehicles sold in Q4 Tata Passenger Electric Vehicles | Domestic Domestic Volumes VAHAN registration market share(1) TATA MOTORS 47,792 86.5% 83.9% 72.0% 19,105 4,218 FY21 FY22 FY23 FY21 FY22 FY23 51 Network Cities ■Dealerships 250 165 143 97 75 450 Charging infra 5,314 2,000 FY21 FY22 FY23 FY21 FY22 FY23 (1)VAHAN registration market share is based on VAHAN portal (powered by National Informatics Centre). The data excludes registrations done in MP, Andhra Pradesh and Telangana states 35

Q4: Revenue * 12.1 KCr, EBITDA 7.3%, PBT(bei) positive Consistently delivering volumes growth, positive EBIT margins and PBT TATA MOTORS FY23 | Tata Passenger Vehicles | IndAS, KCr Global wholesales (K units) Q1 FY23 130.4 Q2 FY23 142.8 Q3 FY23 132.3 Q4 FY23 135.5 Q4 FY22 123.6 Y-o-Y FY23 FY22 Y-o-Y 9.6% 541.0 372.2 45.4% Revenue 11.6 12.5 11.7 12.1 10.5 15.3% 47.9 31.5 51.9% EBITDA) (%) 6.1% 5.4% 6.9% 7.3% 6.9% 40 bps 6.4% 5.3% 110 bps EBIT(1) (%) 0.9% 0.4% 1.5% 1.4% 1.2% 20 bps 1.0% -2.0% 300 bps PBT(1) (bei) 0.0 20 0.2 0.3 0.2 0.04 0.19 0.7 (0.9) 1.6 Volume & Revenue Strong volume led growth due to "New Forever" interventions, multiple powertrains and debottlenecking actions Profitability FY23 EBITDA and EBIT margins improve by 110 bps and 300 bps respectively. PV (ICE) and EV financials split(2) FY23 (RKCr) PV EV Revenue 42.8 7.4 Margins improve on improved volumes, better realizations and operating leverage. EBITDA margin% 8.1% (4.6)% PBT (bei) 1.0 (0.2) Note - (1) Q3FY23 and FY23 numbers include one-off gain of 99 crs; FY22 numbers include PV subsidiarization related one off costs of 170 crs (2) PV represents PV(ICE) + FIAL JO; EV - represents EV + Trilix and TMETC 36
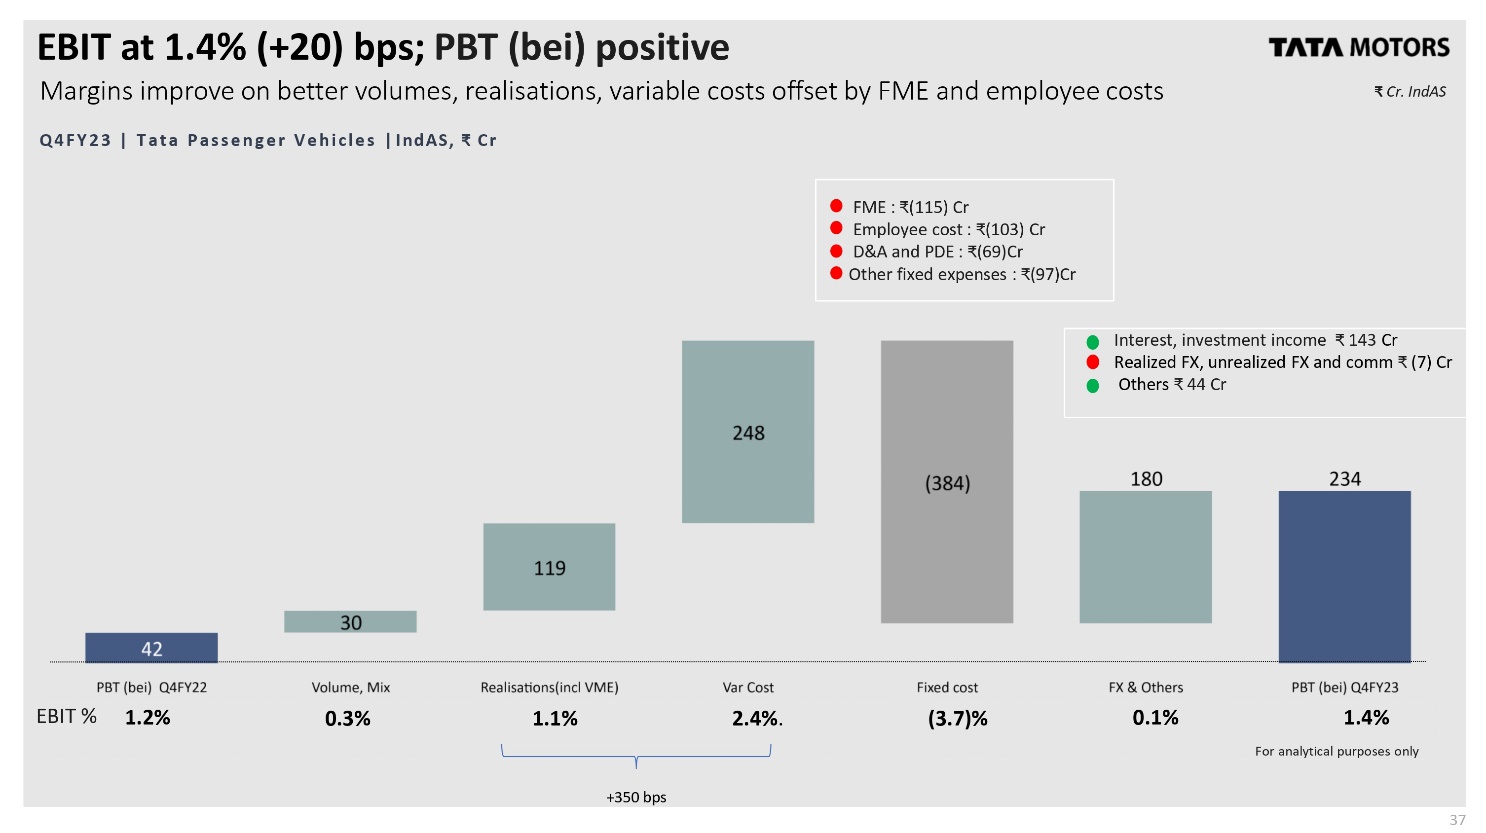
EBIT at 1.4% (+20) bps; PBT (bei) positive Margins improve on better volumes, realisations, variable costs offset by FME and employee costs Q4FY23 | Tata Passenger Vehicles | IndAS, * Cr TATA MOTORS * Cr. IndAS 42 119 30 248 FME: *(115) Cr Employee cost: *(103) Cr D&A and PDE: *(69)Cr Other fixed expenses: (97)Cr Interest, investment income 143 Cr Realized FX, unrealized FX and comm * (7) Cr Others * 44 Cr (384) 180 234 PBT (bei) Q4FY22 Volume, Mix EBIT % 1.2% 0.3% Realisations (incl VME) 1.1% Var Cost Fixed cost 2.4%. (3.7)% FX & Others 0.1% PBT (bei) Q4FY23 1.4% +350 bps For analytical purposes only 37

Business update Highest ever sales in FY23; EV adoption increasing at a rapid pace Tata Passenger and Electric Vehicles Industry PV +EV Key Highlights • Highest ever wholesale: ~3.9 mn (FY23) Industry wholesale grew by 27% in FY23 vis- à-vis FY22 • SUV share increased by 300bps to 43% EV industry grew by ~170% in FY23 Highest ever wholesale @5.39lakh; VAHAN MS 13.5% EV Sales crossed 50K (including IB) in FY23; VAHAN MS@ ~84% despite increase in competition PV and EV business YoY growth in FY23 45% and 150% respectively • #1 SUV manufacturer in FY23 Bright spots Demand for SUVS expected to be higher amidst new launches ⚫ CNG demand expected to pick up owing to reduction in fuel cost • New launches and Increasing EV acceptance leading to market expansion BSVI Ph2 transition completed ahead of deadline New launch to drive demand • Nexon EV Max #Dark with new features Altroz iCNG with twin cylinder tech. Mid-cycle enhancement. • Leverage Diesel portfolio to improve sales • TATA MOTORS Challenges Hatch, sedan segment demand under pressure • Channel inventory high in industry Pent up demand down, barring new launches and few popular SUVs Price increase by OEMS post BSVI PH2 transition Focused demand generation initiatives - Micro-market and better conversion rates Leverage on CNG and EV growth; new models (Nexon EV #Dark, Altroz CNG) Drive margin improvement through institutionalized cost reduction 38

Tata Motors (CV+PV) *TML, TMPVL, TPEML and Joint operations TCL and FIAPL. NEXON TATA MOTORS

Investment Spending in FY23 € 6.4 KCr FY24 capex to increase further to ~8 KCr as electrification investments step up FY23 | Tata Motors Domestic Business(1) |IndAS, * Cr TATA MOTORS Connecting Aspirations PV+EV CV 2,725(2) 6,419 639 2,086 2,474 1,642 3,694 899 2,052 1,835 743 3,945 936 1,859 1,116 Capitalised Expensed Total Capital & Other FY23 R&D R&D R&D Investment Total Investment Spending FY22 903 1,299 2,202 1,462 Q4 FY23 747 362 1,108 1,485(2) 3,664 2,593 (1)Includes details for TML, TMPVL, TPEML and Joint operations FIAPL, TCL. (2) Includes amounts related to Ford Sanand acquisition *836 crs For analytical purposes only 40

Q4 FY23 Free Cash Flows ~ 3.8 KCr Strong cash profits driving positive cash flows Q4 FY23 | Tata Motors Domestic Business (CV+PV) |IndAS, Cr(1) Payables, acceptances * 749 Cr Trade receivables * 15 Cr Inventories * 983 Cr Others * 870 Cr 2,894 (71) 1,379 1,586 2,586 (1,395) (311) TATA MOTORS Connecting Aspirations 3,774 (1) (2) (3) Q4 FY23 PBT (bei) Non-cash Tax and other Cash profit after tax Capex Working capital Finance expenses changes (net), dividend Free cash flow FY23 2,269 5,848 (405) 7,712 (3,941) 224 (1,626) 2,369 (1) Includes free cash flows of TML, TMPVL, TPEML and Joint operations FIAPL, TCL. (2)PBT (bei) includes corporate and interest costs not allocated to Tata CV and Tata PV segments, and excludes the PBT(bei) of international subsidiaries of Tata CV and Tata PV segments (3) Excludes amounts related to Ford Sanand acquisition For analytical purposes only 41

TMF: Getting back on track for a normalized performance in FY24 Concerted collection efforts delivering results; GNPA down by 2.6% Q-o-Q FY23 |Tata Motors Finance | IndAS, ( Cr INR) TATA Motorsfinance driven by trust IndAS CV Market Share PBT ROE (Pre-tax) FY22 FY23 27% 17% 101 (993) 2.1% NA AUM 45,220 43,338 GNPA %* (total incl Covid 8.8% 8.3% restructured book) NNPA %* 5.3% 4.5% *GNPA & NNPA % includes performance of On and off book assets. Collection Efficiency for Q4 >100% with March 23 delivering 108% GNPA reduced in Q4 by over Rs.1,300 crs to 8.3% as on 31st March 2023 from 10.9% as on 31st December 2022 Adequate provisions taken on the normal and pandemic affected restructured book. Normal book (Rs.40K Cr AUM) remains healthy with a GNPA of 4.3%, and NNPA of 2.6%. GNPA reduction from 5.9% in December 2022 Capital adequacy remains comfortable at 24% and Tier-1 capital at 13.1%. DE ratio at 6.6x as on 31st March 2023. Liquidity comfortable at Rs.6.0K Cr as of 31st March 2023 Business on track to deliver double digit ROE in the medium term with focus on improving NIMs, lowering credit losses and tight controls on fixed costs. 42

Credit rating indicators continue to improve S&P upgrades rating by 1 notch, ICRA revises outlook to positive Rating Agencies Moody's S&P CRISIL ICRA CARE Long Term Rating B1/Stable BB / Stable AA- / Stable AA- / Positive AA- / Stable CCopyright, Confidential, Tata Motors Limited TATA MOTORS Connecting Aspirations 43
Investor day TATA MOTORS Connecting Aspirations JLR 416 XCP TATA MOTORS Tata Motors India Investor Day Wednesday, June 7, 2023 Mumbai, India Jaguar Land Rover Investor Day Monday, June 12, 2023 Gaydon, Warwick, UK. 44
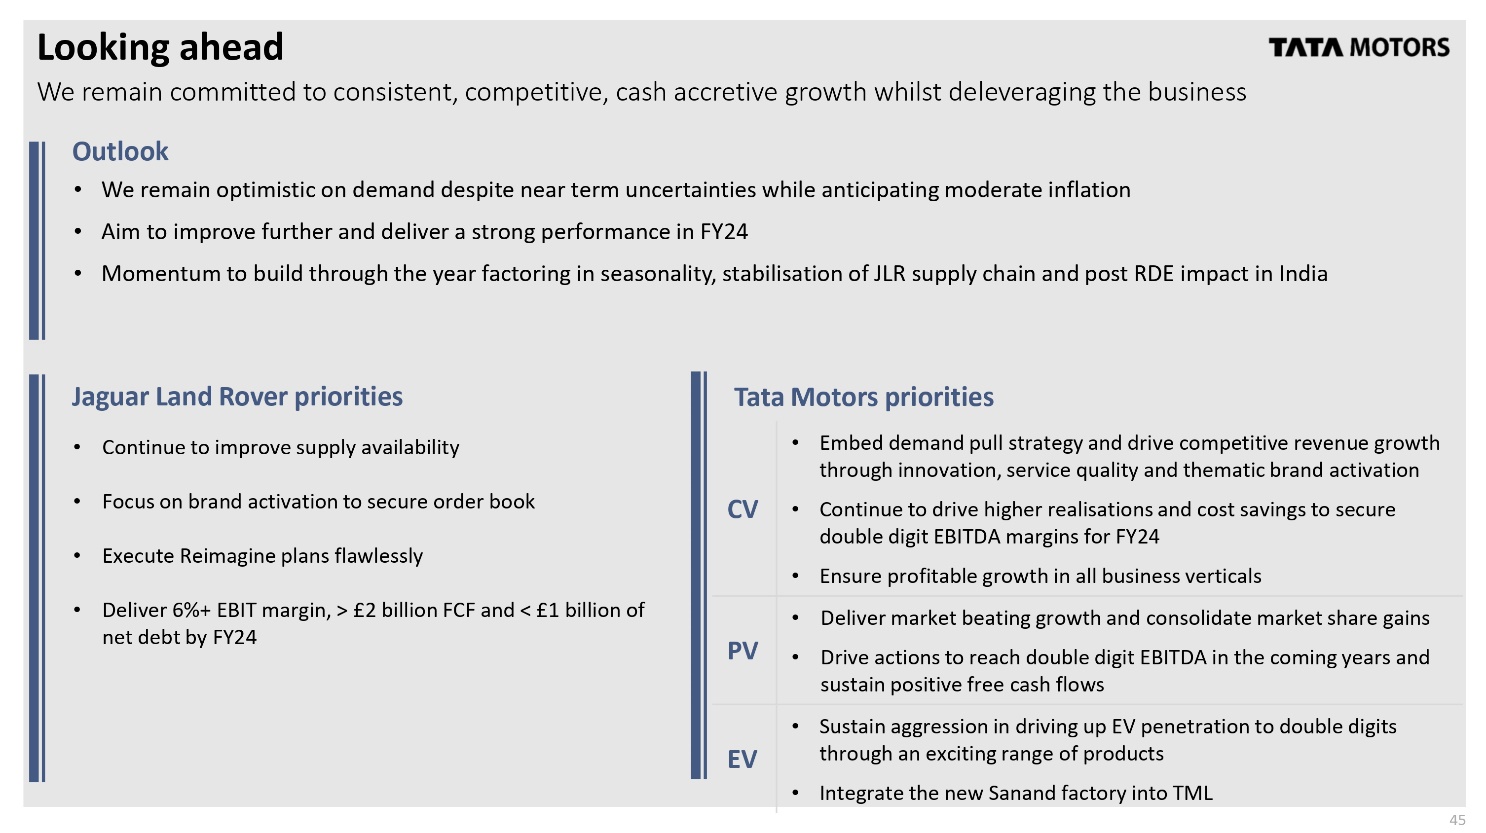
Looking ahead We remain committed to consistent, competitive, cash accretive growth whilst deleveraging the business Outlook • We remain optimistic on demand despite near term uncertainties while anticipating moderate inflation • Aim to improve further and deliver a strong performance in FY24 • TATA MOTORS Momentum to build through the year factoring in seasonality, stabilisation of JLR supply chain and post RDE impact in India Jaguar Land Rover priorities • Continue to improve supply availability • Focus on brand activation to secure order book • Execute Reimagine plans flawlessly • Deliver 6%+ EBIT margin, > £2 billion FCF and < £1 billion of net debt by FY24 PV Tata Motors priorities CV EV • Embed demand pull strategy and drive competitive revenue growth through innovation, service quality and thematic brand activation • • Continue to drive higher realisations and cost savings to secure double digit EBITDA margins for FY24 Ensure profitable growth in all business verticals Deliver market beating growth and consolidate market share gains Drive actions to reach double digit EBITDA in the coming years and sustain positive free cash flows Sustain aggression in driving up EV penetration to double digits through an exciting range of products • Integrate the new Sanand factory into TML 45

TATA D NEXONEY Q&A session Please submit your questions in the Q&A textbox Thank you Please mention your name and name of the organization you represent along with the questions TATA MOTORS 416 XCP 46

Tata Motors Group: Additional details Results for the quarter ended March 31, 2023 TATA MOTORS 47

Tata Motors Group Financials Consolidated Revenue from operations Grant income / incentives Expenses: Quarter ended March 31, 2023 TATA MOTORS JLR Tata Commercial Vehicles 71,463 21,240 833 107 Rs Cr. IndAS Tata Passenger Vehicles Others* Consolidated 12,093 77 1,136 1,05,932 28 1,045 Cost of materials consumed (43,234) (15,700) (9,976) 716 (68,194) Employee benefit expenses (6,965) (1,079) (459) (875) (9,378) Other expenses (9,023) (2,091) (614) (635) (12,363) Product development and engineering expenses (2,352) (307) (236) 83 (2,812) Exchange gain/loss (realized) (630) (18) 3 528 (117) EBITDA 10,092 2,152 888 981 14,113 Depreciation and amortization (5,970) (322) (717) (41) Profit / loss from equity accounted investees 35 56 (7,050) 91 EBIT 4,157 1,830 171 996 7,154 Other income (excl. grant income) 211 38 141 143 533 Finance cost Unrealized FX, Unrealized commodities PBT (bei) (Incl share of JV and Associates) (1,303) (148) (72) (1,133) (2,656) 581 (16) (6) (500) 59 3,646 1,704 234 (494) 5,090 EBITDA Margin EBIT Margin Others include vehicle financing, other segment and income/expenses not specifically allocable to any other segments 14.1% 10.1% 7.3% ΝΑ 13.3% 5.8% 8.6% 1.4% ΝΑ 6.8% 48

Tata Motors Group Financials Consolidated Quarter ended March 31, 2022 TATA MOTORS Rs Cr. IndAS JLR Tata Commercial Vehicles Tata Passenger Vehicles Others* Consolidated Revenue from operations Grant income / incentives Expenses: 48,023 18,529 10,491 1,396 78,439 491 69 101 (2) 660 Cost of materials consumed (28,238) (14,399) (8,930) 370 (51,196) Employee benefit expenses (6,049) (935) (347) (698) (8,029) Other expenses (5,814) (1,916) (481) (210) (8,421) Product development and engineering expenses (2,434) (263) (91) 35 (2,752) Exchange gain/loss (realized) 127 3 (19) (8) 103 EBITDA Depreciation and amortization 6,107 1,087 724 884 8,803 (5,295) (455) (602) (79) (6,432) Profit / loss from equity accounted investees 33 74 107 EBIT Other income (excl. grant income) Finance cost Unrealized FX, Unrealized commodities PBT (bei) (Incl share of JV and Associates) EBITDA Margin 845 632 122 879 2,478 43 49 (16) 167 242 (1,022) (136) (70) (1,167) (2,395) 135 62 6 (49) 154 1 607 42 (170) 480 12.7% 5.9% 6.9% NA 11.2% EBIT Margin 1.8% 3.4% 1.2% ΝΑ 3.2% * Others include vehicle financing, other segment and income/expenses not specifically allocable to any other segments 49
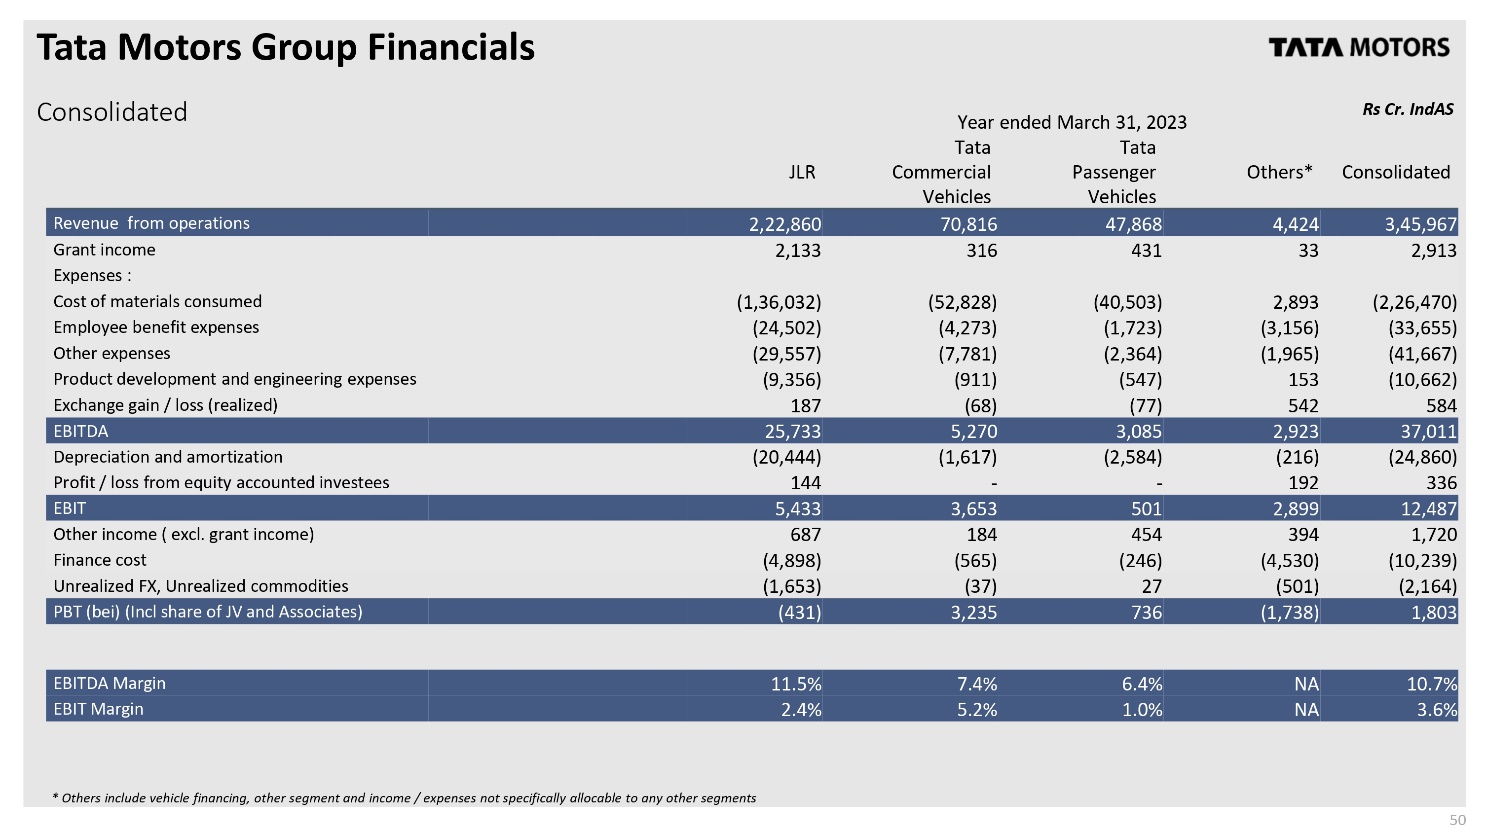
Tata Motors Group Financials Consolidated TATA MOTORS Rs Cr. IndAS Year ended March 31, 2023 JLR Revenue from operations Grant income Expenses: 2,22,860 Tata Commercial Vehicles 70,816 Tata Passenger Others* Consolidated Vehicles 2,133 316 47,868 431 4,424 33 3,45,967 2,913 Cost of materials consumed (1,36,032) (52,828) (40,503) 2,893 (2,26,470) Employee benefit expenses (24,502) (4,273) (1,723) (3,156) (33,655) Other expenses (29,557) (7,781) (2,364) (1,965) (41,667) Product development and engineering expenses (9,356) (911) (547) 153 (10,662) Exchange gain/loss (realized) 187 (68) (77) 542 584 EBITDA 25,733 Depreciation and amortization (20,444) 5,270 (1,617) 3,085 2,923 37,011 (2,584) (216) (24,860) Profit / loss from equity accounted investees 144 192 EBIT 5,433 3,653 501 2,899 336 12,487 Other income (excl. grant income) Finance cost Unrealized FX, Unrealized commodities PBT (bei) (Incl share of JV and Associates) 687 184 454 394 1,720 (4,898) (565) (246) (4,530) (10,239) (1,653) (37) 27 (501) (2,164) (431) 3,235 736 (1,738) 1,803 EBITDA Margin EBIT Margin * Others include vehicle financing, other segment and income/expenses not specifically allocable to any other segments 11.5% 7.4% 6.4% ΝΑ 颈 10.7% 2.4% 5.2% 1.0% ΝΑ 3.6% 50

Tata Motors Group Financials Consolidated TATA MOTORS Rs Cr. IndAS Year ended March 31, 2022 JLR Tata Commercial Vehicles Tata Passenger Vehicles Others* Consolidated Revenue from operations Grant income Expenses: 187,697 52,287 31,515 6,955 1,468 184 465 7 278,454 2,125 Cost of materials consumed (114,340) (39,999) (26,348) (199) (180,886) Employee benefit expenses (23,081) (3,745) (1,272) (2,711) (30,809) Other expenses (23,538) (6,207) (2,412) (1,047) Product development and engineering expenses (8,533) (594) (280) 198 (33,203) (9,209) Exchange gain/loss (realized) 387 5 (10) (13) 369 EBITDA Depreciation and amortization 20,060 1,932 1,659 3,189 (20,577) (1,743) (2,305) (211) 26,840 (24,836) Profit / loss from equity accounted investees (206) 132 EBIT Other income (excl. grant income) Finance cost Unrealized FX, Unrealized commodities PBT (bei) (Incl share of JV and Associates) EBITDA Margin (722) 189 (646) 3,110 134 120 41 634 (3,742) (494) (222) (4,868) (74) 1,931 929 (9,326) 142 53 (30) (145) 19 (4,189) (133) (857) (1,270) (6,448) 10.7% 3.7% 5.3% ΝΑ 9.6% EBIT Margin (0.4)% 0.4% (2.0)% ΝΑ 0.7% * Others include vehicle financing, other segment and income/expenses not specifically allocable to any other segments 51
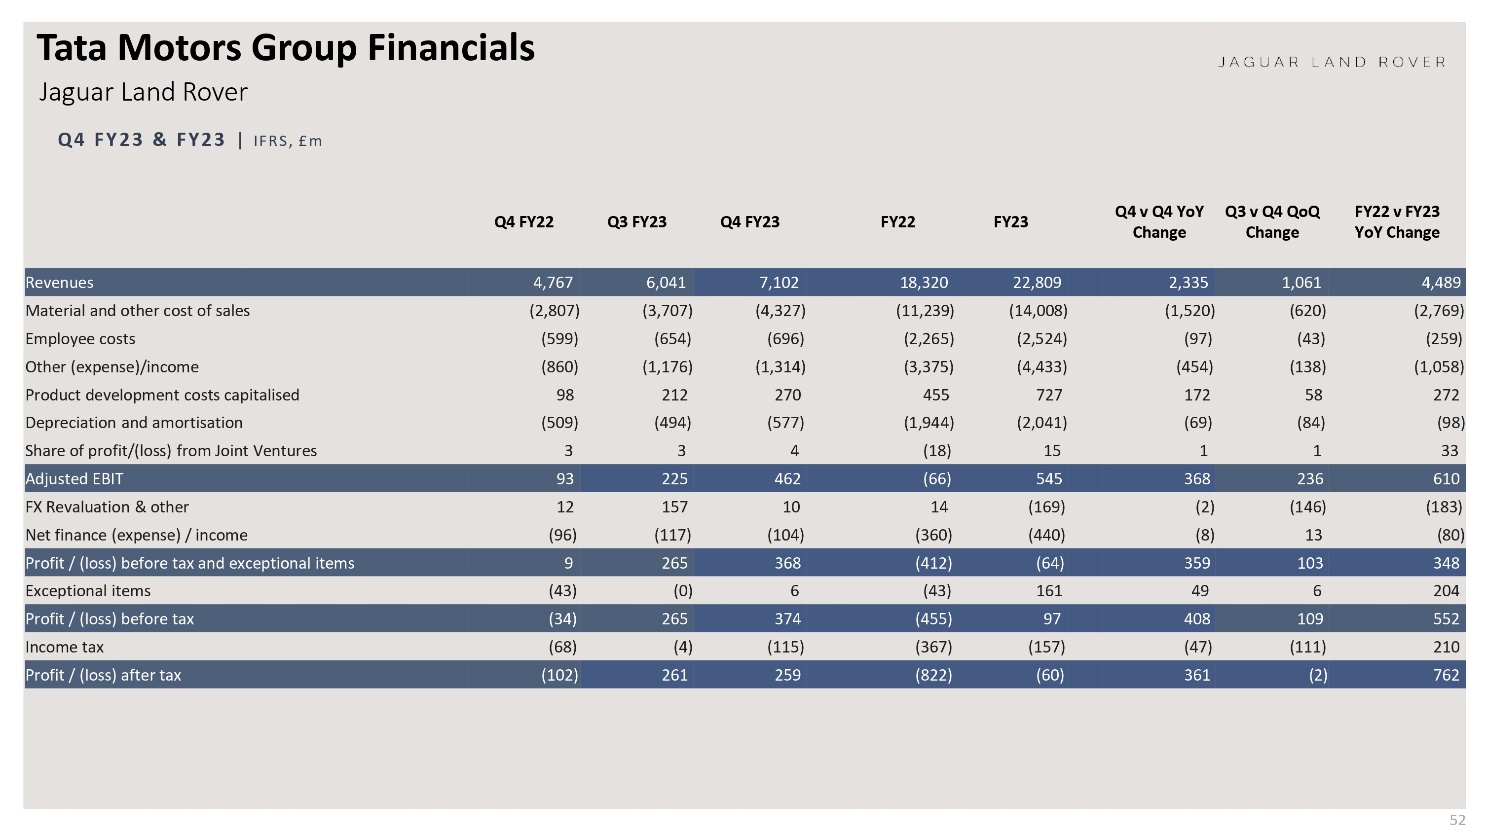
Tata Motors Group Financials Jaguar Land Rover Q4 FY23 & FY23 | IFRS, £m JAGUAR LAND ROVER Q4 FY22 Q3 FY23 Q4 FY23 FY22 FY23 Q4 v Q4 YoY Change Q3 v Q4 QoQ Change FY22 v FY23 YoY Change Revenues Material and other cost of sales Employee costs Other (expense)/income 4,767 6,041 7,102 18,320 22,809 2,335 1,061 4,489 (2,807) (3,707) (4,327) (11,239) (14,008) (1,520) (620) (2,769) (599) (654) (696) (2,265) (2,524) (97) (43) (259) (860) (1,176) (1,314) (3,375) (4,433) (454) (138) (1,058) Product development costs capitalised 98 212 270 455 727 172 58 272 Depreciation and amortisation (509) (494) (577) (1,944) (2,041) (69) (84) (98) Share of profit/(loss) from Joint Ventures Adjusted EBIT 3 3 4 (18) 15 1 1 33 93 225 462 (66) 545 368 236 610 FX Revaluation & other 12 157 10 14 (169) (2) (146) (183) Net finance (expense) / income (96) (117) (104) (360) (440) (8) 13 (80) Profit/(loss) before tax and exceptional items 9 265 368 (412) (64) 359 103 348 Exceptional items (43) (0) 6 (43) 161 49 6 204 Profit/(loss) before tax (34) 265 374 (455) 97 408 109 552 Income tax (68) (4) (115) (367) (157) (47) (111) 210 Profit/(loss) after tax (102) 261 259 (822) (60) 361 (2) 762 52

FULL YEAR Q4 retails of 103k, up 21% QoQ, 30% YoY Full year retails were down 6% compared to the prior year FY23 | Brands | Retails* | Units in 000's RANGE ROVER DEFENDER Q4 50.9 40.7 36.7 DISCOVERY JAGUAR 23.6 19.8 15.5 14.6 14.5 15.4 12.1 12.9 9.7 JAGUAR LAND ROVER TOTAL 102.9 84.8 79.0 Q4 Q3 Q4 Q4 Q3 Q4 Q4 Q3 Q4 Q4 Q3 Q4 Q4 Q3 Q4 FY22 FY23 FY23 FY22 FY23 FY23 FY22 FY23 FY23 FY22 FY23 FY23 FY22 FY23 FY23 174.9 376.4 168.9 354.7 FY22 FY23 74.9 77.4 61.7 62.3 62.5 48.3 FY22 Includes sales from unconsolidated Chinese joint venture FY23 FY22 FY23 FY22 FY23 FY22 FY23 53

FULL YEAR Q4 Q4 retails were higher in all regions compared to the prior year Full year retails lower in all regions except UK compared to the prior year FY23 | Brands | Retails* | Units in 000's JAGUAR LAND ROVER 14.6 12.4 UK Q4 Q3 Q4 FY22 FY23 63.5 64.0 N. AMERICA 23.6 22.3 20.6 19.8 EUROPE CHINA OVERSEAS 25.3 21.7 19.3 19.5 15.0 13.2 JLR POWERTRAIN MIX(RETAILS) 15.4 11.9 12.1 27% 36% 34% FY23 Q4 Q3 FY22 FY23 FY23 Q4 Q4 Q3 Q4 FY22 FY23 FY23 Q4 Q3 Q4 FY22 FY23 FY23 Q4 Q3 Q4 FY22 FY23 FY23 57% 95.8 91.3 91.0 50% 56% 77.6 72.1 71.7 53.8 50.4 14% 17% 11% Q4 Q3 Q4 FY22 FY23 FY23 FY22 FY23 FY22 FY23 FY22 FY23 FY22 FY23 FY22 FY23 BEV & PHEV MHEV ICE Includes sales from unconsolidated Chinese joint venture 54 -74% electrified ‒‒‒‒‒‒‒‒‒‒‒‒‒‒‒‒‒‒
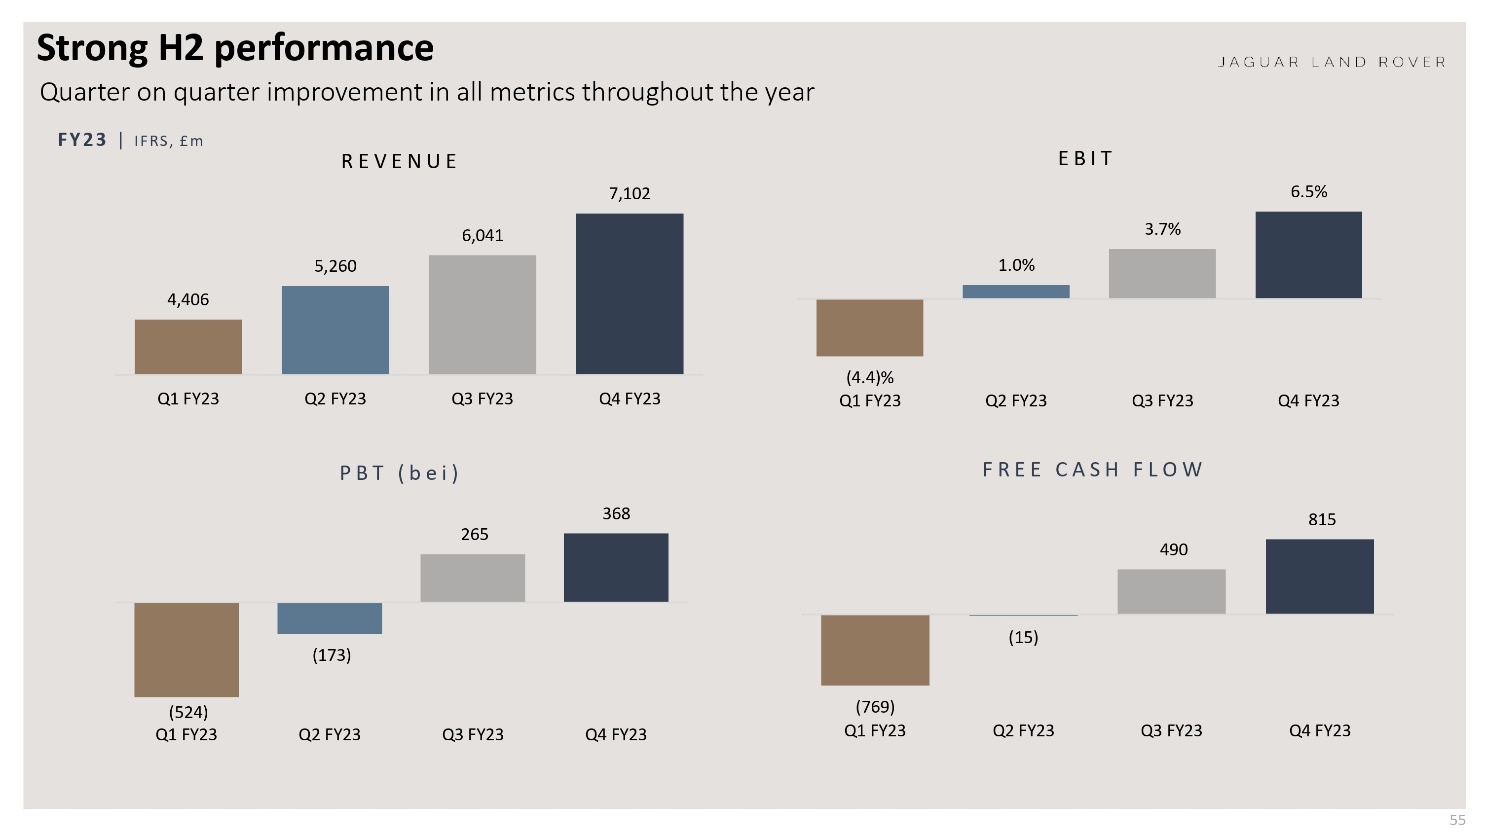
Strong H2 performance Quarter on quarter improvement in all metrics throughout the year FY23 IFRS, £m REVENUE EBIT 4,406 7,102 6,041 5,260 JAGUAR LAND ROVER 6.5% 3.7% 1.0% Q1 FY23 Q2 FY23 Q3 FY23 Q4 FY23 (4.4)% Q1 FY23 Q2 FY23 Q3 FY23 Q4 FY23 PBT (bei) (173) 368 265 FREE CASH FLOW (15) 815 490 (524) Q1 FY23 (769) Q2 FY23 Q3 FY23 Q4 FY23 Q1 FY23 Q2 FY23 Q3 FY23 Q4 FY23 55

Favourable Q4 YoY operational FX offset partially by hedging JAGUAR LAND ROVER Total FX £137m favourable after other FX revaluation, offset partially by unrealised commodity revaluation Q4 FY23 YoY | IFRS, £m (81) 113 32 54 51 (99) 137 38 Operational Exchange (1) Realised FX hedges FX Impact on EBIT FX revaluation of net Other FX revaluation debt & debt hedges FX impact on PBT Unrealised commodity hedges FX, Commodity Impact on PBT £m Q4 FY22 Q3 FY23 Q4 FY23 Rates Q4 FY23 QoQ YoY Hedge reserve(2) (580) (973) (668) GBP:USD 1.238 2.7% (5.8)% Change (YoY/QoQ) (88) 305 GBP: EUR 1.136 0.5% (3.5)% Total Hedges 19,529 19,012 18,399 GBP:CNY 8.505 1.3% 1.9% 1 The year-on-year operational exchange is an analytical estimate, which may differ from the actual impact 2 Hedge reserve is the hedge reserve pre-tax 56

Debt profile Strong liquidity; debt maturities well spread out JLR IFRS, £m Debt maturity profile IndAS * Crores Total 6,789 816 TATA MOTORS Tata Domestic Business* Debt maturity profile Total 15,392 836 1,158 1,891 13,398 Undrawn RCF 1520 1,158 5,078 260 4,083 2,364 3,074 2,375 817 120 766 CY23 CY24 CY25 CY26 247 CY27 Thereafter 188 1,010 1,360 562 775 Total Borrowings 376 CY23 CY24 CY 25 CY 26 CY 27 Thereafter Total Borrowings Long Term Debt Short Term Finance Lease Bonds Bank facilities Finance Lease & others RCF, 1,520 £5.3b Cash, Liquidity 3,792 9.2 KCr Cash, *Includes data for Domestic CV, PV, EV business, and 9,233 Liquidity Joint operation - Tata Cummins and FIAPL 57
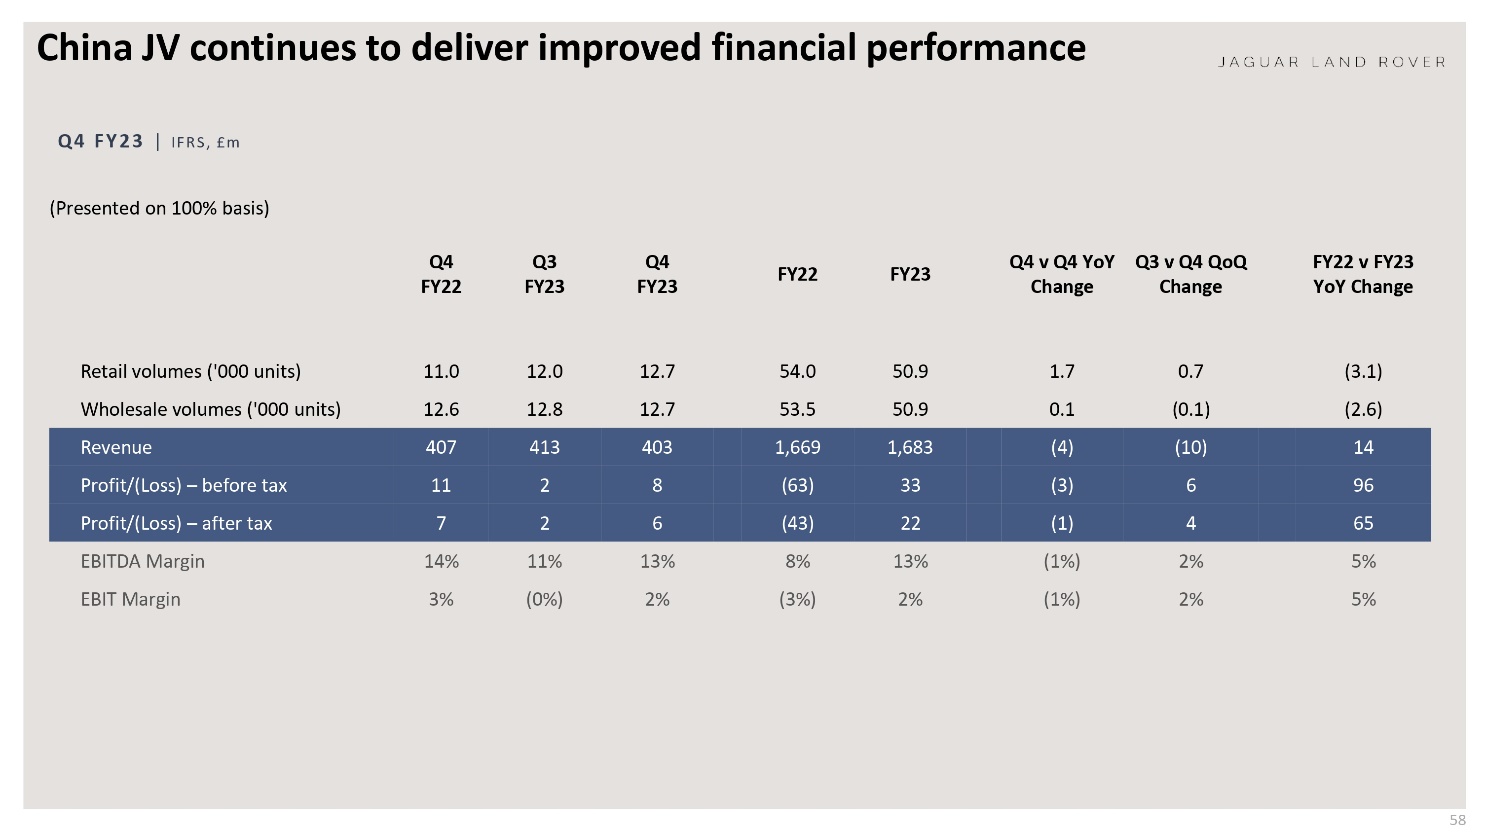
China JV continues to deliver improved financial performance Q4 FY23 | IFRS, £m JAGUAR LAND ROVER (Presented on 100% basis) Q4 Q3 Q4 FY22 FY23 FY22 FY23 FY23 Q4 v Q4 YoY Change Q3 v Q4 QoQ Change FY22 v FY23 YoY Change Retail volumes ('000 units) 11.0 12.0 12.7 54.0 50.9 1.7 0.7 (3.1) Wholesale volumes ('000 units) 12.6 12.8 12.7 53.5 50.9 0.1 (0.1) (2.6) Revenue 407 413 403 1,669 1,683 (4) (10) 14 Profit/(Loss) - before tax 11 2 8 (63) 33 (3) 6 96 Profit/(Loss)- after tax 7 2 6 (43) 22 (1) 4 65 EBITDA Margin 14% 11% 13% 8% 13% (1%) 2% 5% EBIT Margin 3% (0%) 2% (3%) 2% (1%) 2% 5% 58
About Tata Motors
Part of the USD 128 billion Tata group, Tata Motors Limited (NYSE: TTM; BSE: 500570 and 570001; NSE: TATAMOTORS and TATAMTRDVR), a USD 37 billion organization, is a leading global automobile manufacturer of cars, utility vehicles, pick-ups, trucks and buses, offering extensive range of integrated, smart and e-mobility solutions. With ‘Connecting Aspirations’ at the core of its brand promise, Tata Motors is India’s market leader in commercial vehicles and amongst the top three in the passenger vehicles market.
Tata Motors strives to bring new products that fire the imagination of GenNext customers, fueled by state of the art design and R&D centers located in India, UK, US, Italy and South Korea. With a focus on engineering and tech enabled automotive solutions catering to the future of mobility, the company’s innovation efforts are focused to develop pioneering technologies that are sustainable as well as suited to evolving aspirations of the market and the customers. The company is pioneering India's Electric Vehicle (EV) transition and driving the shift towards sustainable mobility solutions by preparing a tailor-made product strategy, leveraging the synergy between the Group companies and playing an active role liasoning with the Government in developing the policy framework.
With operations in India, the UK, South Korea, Thailand, South Africa and Indonesia, Tata Motors’ vehicles are marketed in Africa, Middle East, South & South East Asia, Australia, South America, Russia and other CIS countries. As of March 31, 2022, Tata Motors’ operations include 86 consolidated subsidiaries, two joint operations, four joint ventures and 10 equity-accounted associates, including their subsidiaries, in respect of which the company exercises significant influence.
To know more, please visit (www.tatamotors.com; also follow us on Twitter: https://twitter.com/TataMotors)
Media Contact Information:
Tata Motors Corporate Communications: +91 22-66657613 / indiacorpcomm@tatamotors.com
Safe Harbor: Statements included herein may constitute "forward-looking statements". Forward-looking statements are based on expectations, forecasts and assumptions by management and involve risks, uncertainties, and other factors that may cause our actual results, performance or achievements to materially differ from those stated. We cannot be certain that any expectation, forecast or assumption made by management in preparing these forward-looking statements will prove accurate, or that any projection will be realized. More detailed information about these and other factors that could affect future results is contained in our annual reports and filings with the Securities and Exchange Commission. Our forward-looking statements pertain to the date of their initial issuance, and we do not undertake to publicly update or revise any forward-looking statement, whether as a result of new information, future events or otherwise.