UNITED STATES
SECURITIES AND EXCHANGE COMMISSION
Washington, D.C. 20549
FORM N-CSR
CERTIFIED SHAREHOLDER REPORT OF REGISTERED MANAGEMENT
INVESTMENT COMPANIES
Investment Company Act file number 811-8598
The Commerce Funds
(Exact name of Registrant as specified in charter)
|
| 922 Walnut St., Fourth Floor, Mail Code = TB4-1, Kansas City, Missouri 64106 |
| (Address of principal executive offices) (Zip code) |
Diana E. McCarthy, Esq.,
Drinker Biddle & Reath LLP
One Logan Square
Suite 2000
Philadelphia, PA 19103-6996
(Name and address of agent for service)
Registrant’s telephone number, including area code:1-800-995-6365
Date of fiscal year end: 10/31
Date of reporting period: 04/30/15
| ITEM 1. | | REPORTS TO SHAREHOLDERS. |
The Semi-Annual Report to Shareholders pursuant to Rule 30e-1 under the Investment Company Act of 1940 (17 CFR 270.30e-1) is filed herewith.

The Commerce Funds
The Commerce Funds Semi-Annual Report
April 30, 2015
For Your Life’s Direction
At The Commerce Funds, we’re committed to providing sound investment choices to help you realize your most important financial goals, no matter where life takes you.
We offer a full range of mutual funds managed by Commerce Investment Advisors, Inc., a subsidiary of Commerce Bank. With a choice of 8 portfolios — each targeting a specific investment goal — we make it easy for you to invest with confidence not just today, but throughout all the stages of your life.
Behind each of our Funds is a carefully defined investment philosophy and a commitment to the highest investment standards. This means, whether you are building a nest egg for retirement, planning for your child’s education, or saving for a special need, you can find investment options at The Commerce Funds.
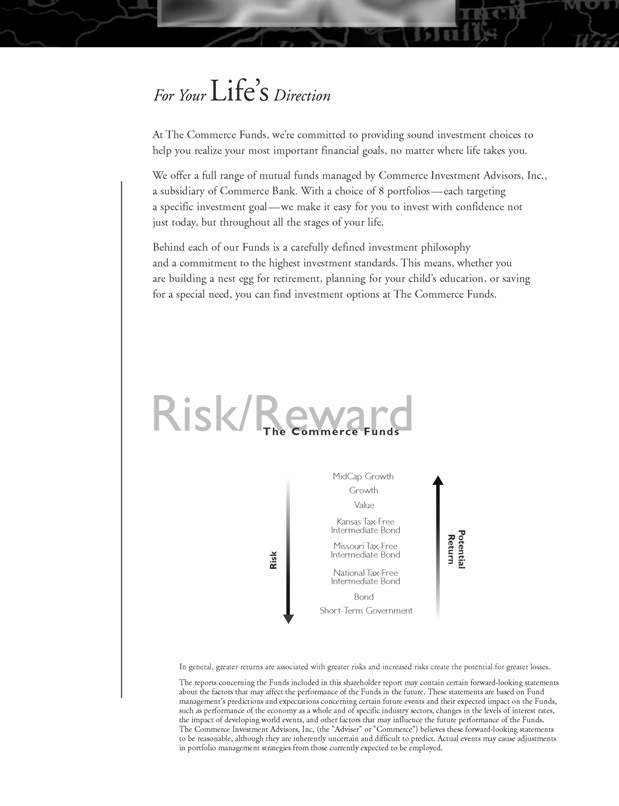
Risk/Reward
The Commerce Funds
MidCap Growth
Growth
Value
Kansas Tax-Free Intermediate Bond
Missouri Tax-Free
Risk Intermediate Bond Return Potential
National Tax-Free Intermediate Bond
Bond
Short-Term Government
In general, greater returns are associated with greater risks and increased risks create the potential for greater losses.
The reports concerning the Funds included in this shareholder report may contain certain forward-looking statements about the factors that may affect the performance of the Funds in the future. These statements are based on Fund management’s predictions and expectations concerning certain future events and their expected impact on the Funds, such as performance of the economy as a whole and of specific industry sectors, changes in the levels of interest rates, the impact of developing world events, and other factors that may influence the future performance of the Funds. The Commerce Investment Advisors, Inc. (the “Adviser” or “Commerce”) believes these forward-looking statements to be reasonable, although they are inherently uncertain and difficult to predict. Actual events may cause adjustments in portfolio management strategies from those currently expected to be employed.
COMMERCE FUNDS
Table of Contents
Please note:
The information in this semi-annual report is as of April 30, 2015 and is unaudited. The securities mentioned in this report may no longer be held by the Funds. To view more recent information about each Commerce Fund’s performance and portfolio or to obtain a prospectus, please visit our website at www.commercefunds.com. This report is not authorized for distribution to prospective shareholders unless accompanied or preceded by a prospectus, which contains more complete information about the Commerce Funds’ investment policies, management and expenses. Investors should read the prospectus carefully before investing.
You may also receive Commerce Funds information by calling toll free 1-800-995-6365 or by writing to P.O. Box 219525, Kansas City, Missouri, 64121-9525, or you may contact your investment professional. The Commerce Funds publish performance and portfolio information for each Commerce Fund at the end of every calendar quarter. Investors should read the prospectus carefully before investing or sending money.
COMMERCE FUNDS
Performance Summaries
April 30, 2015 (Unaudited)
The following is performance information for the Commerce Funds for various time periods. The returns represent past performance. Past performance is no guarantee of future results. The Funds’ investment returns and principal values will fluctuate so that an investor’s shares, when redeemed, may be worth more or less than their original cost. Returns do not reflect the deduction of taxes that a shareholder would pay on Fund distributions or the redemption of Fund shares. The Funds are not subject to a sales charge, so a sales charge is not applied to their total returns. In addition to the Adviser’s decisions regarding issuer/industry investment selection and allocation, other factors may affect Fund performance. These factors include, but are not limited to, Fund operating fees and expenses, portfolio turnover, and subscription and redemption cash flows affecting the Funds. Please visit our website at www.commercefunds.com to obtain the most recent month-end returns.
| | | | | | | | | | |
PERFORMANCE REVIEW | | | | | | | | | | |
| November 1, 2014 - April 30, 2015 | | Fund Total Return(a) | | | Index Total Return | | | Index |
Equity Funds: | | | | | | | | | | |
Growth | | | 5.12 | % | | | 6.54 | % | | Russell 1000® Growth(b) |
Value | | | 3.04 | | | | 2.89 | | | Russell 1000® Value(c) |
MidCap Growth | | | 5.50 | | | | 7.77 | | | Russell Midcap® Growth(d) |
Fixed Income Funds: | | | | | | | | | | |
Bond | | | 1.89 | | | | 2.06 | | | Barclays U.S. Aggregate Bond(e) |
Short-Term Government | | | 0.65 | | | | 0.85 | | | Citigroup 1-5 Year Treasury/Government Sponsored(f) |
National Tax-Free Intermediate Bond | | | 1.29 | | | | 0.91 | | | Barclays 3-15 Year Blend Municipal Bond(g) |
Missouri Tax-Free Intermediate Bond | | | 1.30 | | | | 0.91 | | | Barclays 3-15 Year Blend Municipal Bond(g) |
Kansas Tax-Free Intermediate Bond | | | 1.30 | | | | 0.91 | | | Barclays 3-15 Year Blend Municipal Bond(g) |
| (a) | | Returns reflect any fee waivers or expense reductions. Returns do not reflect the deduction of taxes that a shareholder would pay on Fund distributions or the redemption of Fund shares. |
| (b) | | The Russell 1000® Growth Index, an unmanaged index, measures the performance of the large-cap growth segment of the U.S. equity universe. It includes those Russell 1000 companies with higher price-to-book ratios and higher forecasted growth values. The Index figures do not reflect any deduction for fees, taxes or expenses. |
| (c) | | The Russell 1000® Value Index, an unmanaged index, measures the performance of the large-cap value segment of the U.S. equity universe. It includes Russell 1000 companies with lower price-to-book ratios and lower expected growth values. The Index figures do not reflect any deduction for fees, taxes or expenses. |
| (d) | | The Russell Midcap® Growth Index, an unmanaged index, measures the performance of the mid-cap growth segment of the U.S. equity universe. It includes those Russell Midcap Index companies with higher price-to-book ratios and higher forecasted growth values. The Index figures do not reflect any deduction for fees, taxes or expenses. |
| (e) | | The Barclays U.S. Aggregate Bond Index is an unmanaged index that measures the investment grade, U.S. dollar denominated, fixed-rate taxable bond market, including treasuries, government-related and corporate securities, mortgage-backed securities, asset-backed securities, and commercial mortgage-backed securities. The Index figures do not reflect any deduction for fees, taxes or expenses. |
| (f) | | The Citigroup 1-5 Year Treasury/Government Sponsored Index is an unmanaged index comprised of Treasury securities with a minimum principal amount of $1 billion and U.S. Government securities with a minimum principal amount of $100 million. The securities range in maturity from one to five years. The Index figures do not reflect any deduction for fees, taxes or expenses. |
| (g) | | The Barclays 3-15 Year Blend Municipal Bond Index is an unmanaged index comprised of investment-grade municipal securities ranging from 2 to 17 years in maturity. The Index figures do not reflect any deduction for fees, taxes or expenses. |
| | | | | | | | | | | | | | | | | | | | |
STANDARDIZED TOTAL RETURNS(h) | | | | | | | | | | | | | | | | | | | | |
| For the period ended 03/31/2015 | | One Year | | | Five Years | | | Ten Years | | | Since Inception | | | Inception Date | |
Equity Funds: | | | | | | | | | | | | | | | | | | | | |
Growth | | | 15.96 | % | | | 13.16 | % | | | 7.82 | % | | | 8.28 | % | | | 12/12/94 | |
Value | | | 8.08 | | | | 14.32 | | | | 7.16 | | | | 6.40 | | | | 3/3/97 | |
MidCap Growth | | | 13.05 | | | | 14.18 | | | | 9.03 | | | | 8.52 | | | | 12/12/94 | |
Fixed Income Funds: | | | | | | | | | | | | | | | | | | | | |
Bond | | | 5.07 | | | | 5.47 | | | | 5.79 | | | | 6.20 | | | | 12/12/94 | |
Short-Term Government | | | 1.24 | | | | 1.76 | | | | 3.18 | | | | 4.35 | | | | 12/12/94 | |
National Tax-Free Intermediate Bond | | | 4.33 | | | | 4.72 | | | | 4.37 | | | | 4.76 | | | | 2/21/95 | |
Missouri Tax-Free Intermediate Bond | | | 4.47 | | | | 3.86 | | | | 3.89 | | | | 4.44 | | | | 2/21/95 | |
Kansas Tax-Free Intermediate Bond | | | 5.11 | | | | 4.04 | | | | 3.99 | | | | 4.29 | | | | 12/26/00 | |
| (h) | | The Standardized Total Returns are average annual total returns as of the most recent calendar quarter-end. They assume reinvestment of all distributions at net asset value (“NAV”). Current performance may be lower or higher than the total return figures in the above table. |
Returns reflect any fee waivers or expense reductions. Absent these waivers and reductions, returns would have been lower. Returns do not reflect the deduction of taxes that a shareholder would pay on Fund distributions or the redemption of Fund shares.
| | | | | | | | |
EXPENSE RATIOS(i) | | | | | | | | |
| | | Net Expense Ratio (Current) | | | Gross Expense Ratio (Before Reimbursement) | |
Equity Funds: | | | | | | | | |
Growth | | | 1.08 | % | | | 1.08 | % |
Value | | | 0.70 | | | | 0.71 | |
MidCap Growth | | | 1.05 | | | | 1.05 | |
Fixed Income Funds: | | | | | | | | |
Bond | | | 0.70 | | | | 0.70 | |
Short-Term Government | | | 0.68 | | | | 0.88 | |
National Tax-Free Intermediate Bond | | | 0.69 | | | | 0.69 | |
Missouri Tax-Free Intermediate Bond | | | 0.69 | | | | 0.69 | |
Kansas Tax-Free Intermediate Bond | | | 0.72 | | | | 0.89 | |
| (i) | | The Funds’ expense ratios, both current (net of applicable fee waivers and/or expense reimbursements) and gross (before fee waivers and/or expense reimbursements), set forth above are as of the most recent publicly available prospectus for the Funds (March 1, 2015) and may differ from the expense ratios disclosed in the Financial Highlights in this report. The Adviser has contractually agreed to reduce or limit the Total Annual Fund Operating Expenses, excluding interest, taxes, acquired fund fees and expenses and extraordinary expenses. This agreement will remain in place through March 1, 2016. After this date, the Adviser or a Fund may terminate the contractual arrangement. If this occurs, the expense ratios may change without shareholder approval. |
2
COMMERCE GROWTH FUND
Schedule of Investments
April 30, 2015 (Unaudited)
| | | | | | | | |
| | |
| Shares | | | Description | | Value | |
| | Common Stocks – 96.8% | | | | |
| Commercial Services – 2.0% | | | | |
| | 7,900 | | | Moody’s Corp. | | | $ 849,408 | |
| | 16,400 | | | Tyco International PLC | | | 645,832 | |
| | | | | | | | |
| | | | | | | 1,495,240 | |
| | |
| Communications – 2.0% | |
| | 29,200 | | | Verizon Communications, Inc. | | | 1,472,848 | |
| | |
| Consumer Durables* – 1.1% | |
| | 15,925 | | | Jarden Corp. | | | 815,042 | |
| | |
| Consumer Non-Durables – 14.6% | | | | |
| | 15,900 | | | Altria Group, Inc. | | | 795,795 | |
| | 11,600 | | | Colgate-Palmolive Co. | | | 780,448 | |
| | 10,800 | | | Dr Pepper Snapple Group, Inc. | | | 805,464 | |
| | 13,800 | | | Kellogg Co. | | | 873,954 | |
| | 8,100 | | | Kimberly-Clark Corp. | | | 888,489 | |
| | 8,200 | | | Mead Johnson Nutrition Co. | | | 786,544 | |
| | 8,400 | | | Nike, Inc. Class B | | | 830,256 | |
| | 8,400 | | | PepsiCo, Inc. | | | 799,008 | |
| | 10,200 | | | Philip Morris International, Inc. | | | 851,394 | |
| | 12,600 | | | Reynolds American, Inc. | | | 923,580 | |
| | 23,200 | | | The Coca-Cola Co. | | | 940,992 | |
| | 8,300 | | | The Estee Lauder Cos., Inc. Class A | | | 674,707 | |
| | 11,400 | | | V. F. Corp. | | | 825,702 | |
| | | | | | | | |
| | | | | | | 10,776,333 | |
| | |
| Consumer Services – 6.7% | | | | |
| | 13,100 | | | CBS Corp. Class B | | | 813,903 | |
| | 13,600 | | | Comcast Corp. Class A | | | 785,536 | |
| | 9,500 | | | DIRECTV* | | | 861,697 | |
| | 15,300 | | | eBay, Inc.* | | | 891,378 | |
| | 27,600 | | | Service Corp. | | | 763,968 | |
| | 11,800 | | | Viacom, Inc. Class B | | | 819,510 | |
| | | | | | | | |
| | | | | | | 4,935,992 | |
| | |
| Distribution Services – 2.2% | | | | |
| | 3,900 | | | McKesson Corp. | | | 871,260 | |
| | 2,900 | | | W.W. Grainger, Inc. | | | 720,447 | |
| | | | | | | | |
| | | | | | | 1,591,707 | |
| | |
| Electronic Technology – 11.3% | | | | |
| | 35,200 | | | Apple, Inc. | | | 4,405,280 | |
| | 28,200 | | | Intel Corp. | | | 917,910 | |
| | 9,200 | | | Lam Research Corp. | | | 695,336 | |
| | 4,300 | | | Lockheed Martin Corp. | | | 802,380 | |
| | 13,800 | | | Microchip Technology, Inc. | | | 657,639 | |
| | 12,200 | | | QUALCOMM, Inc. | | | 829,600 | |
| | | | | | | | |
| | | | | | | 8,308,145 | |
| | |
| Finance – 9.8% | | | | |
| | 9,800 | | | American Express Co. | | | 759,010 | |
| | 10,000 | | | Crown Castle International Corp. | | | 835,300 | |
| | 8,300 | | | Erie Indemnity Co. Class A | | | 686,825 | |
| | 11,500 | | | Extra Space Storage, Inc. | | | 758,195 | |
| | 3,700 | | | Intercontinental Exchange, Inc. | | | 830,761 | |
| | |
| | | | | | | | |
| | |
| Shares | | | Description | | Value | |
| | Common Stocks – (continued) | | | | |
| Finance – (continued) | | | | |
| | 9,500 | | | Mastercard, Inc. Class A | | | $ 856,995 | |
| | 4,300 | | | Public Storage | | | 808,013 | |
| | 10,700 | | | T. Rowe Price Group, Inc. | | | 868,626 | |
| | 12,400 | | | Visa, Inc. Class A | | | 819,020 | |
| | | | | | | | |
| | | | | | | 7,222,745 | |
| | |
| Health Services* – 1.2% | | | | |
| | 12,200 | | | Cerner Corp. | | | 876,082 | |
| | |
| Health Technology – 9.1% | | | | |
| | 4,900 | | | Amgen, Inc. | | | 773,759 | |
| | 5,800 | | | Becton Dickinson & Co. | | | 817,046 | |
| | 6,600 | | | Bio-Techne Corp. | | | 633,336 | |
| | 4,300 | | | C. R. Bard, Inc. | | | 716,294 | |
| | 8,700 | | | Gilead Sciences, Inc.* | | | 874,437 | |
| | 4,600 | | | IDEXX Laboratories, Inc.* | | | 576,702 | |
| | 8,500 | | | Johnson & Johnson | | | 843,200 | |
| | 6,900 | | | Pall Corp. | | | 671,508 | |
| | 8,700 | | | Stryker Corp. | | | 802,488 | |
| | | | | | | | |
| | | | | | | 6,708,770 | |
| | |
| Industrial Services – 2.3% | | | | |
| | 9,700 | | | Schlumberger Ltd. | | | 917,717 | |
| | 16,100 | | | Waste Management, Inc. | | | 797,433 | |
| | | | | | | | |
| | | | | | | 1,715,150 | |
| | |
| Process Industries – 8.3% | | | | |
| | 18,300 | | | Archer-Daniels-Midland Co. | | | 894,504 | |
| | 19,600 | | | Donaldson Co, Inc. | | | 732,452 | |
| | 7,700 | | | Ecolab, Inc. | | | 862,246 | |
| | 7,500 | | | Monsanto Co. | | | 854,700 | |
| | 9,300 | | | Packaging Corp. of America | | | 643,467 | |
| | 14,300 | | | RPM International, Inc. | | | 679,822 | |
| | 2,900 | | | The Sherwin-Williams Co. | | | 806,200 | |
| | 6,700 | | | W.R. Grace & Co.* | | | 648,024 | |
| | | | | | | | |
| | | | | | | 6,121,415 | |
| | |
| Producer Manufacturing – 6.2% | | | | |
| | 22,600 | | | Allison Transmission Holdings, Inc. | | | 693,368 | |
| | 13,700 | | | AMETEK, Inc. | | | 718,154 | |
| | 8,300 | | | Honeywell International, Inc. | | | 837,636 | |
| | 8,800 | | | Illinois Tool Works, Inc. | | | 823,504 | |
| | 6,600 | | | Lennox International, Inc. | | | 699,336 | |
| | 7,200 | | | United Technologies Corp. | | | 819,000 | |
| | | | | | | | |
| | | | | | | 4,590,998 | |
| | |
| Retail Trade – 7.4% | | | | |
| | 1,300 | | | AutoZone, Inc.* | | | 874,458 | |
| | 8,700 | | | Dollar Tree, Inc.* | | | 664,767 | |
| | 12,000 | | | Lowe’s Cos., Inc. | | | 826,320 | |
| | 12,200 | | | Macy’s, Inc. | | | 788,486 | |
| | 7,200 | | | The Home Depot, Inc. | | | 770,256 | |
| | 10,700 | | | The Kroger Co. | | | 737,337 | |
| | 9,800 | | | Wal-Mart Stores, Inc. | | | 764,890 | |
| | | | | | | | |
| | | | | | | 5,426,514 | |
| | |
| | |
| The accompanying notes are an integral part of these financial statements. | | 3 |
COMMERCE GROWTH FUND
Schedule of Investments (continued)
April 30, 2015 (Unaudited)
| | | | | | | | |
| | |
| Shares | | | Description | | Value | |
| | Common Stocks – (continued) | | | | |
| Technology Services – 10.4% | | | | |
| | 10,700 | | | Adobe Systems, Inc.* | | | $ 813,842 | |
| | 9,600 | | | Automatic Data Processing, Inc. | | | 811,584 | |
| | 9,100 | | | Fiserv, Inc.* | | | 706,160 | |
| | 2,700 | | | Google, Inc. Class A* | | | 1,481,679 | |
| | 1,103 | | | Google, Inc. Class C* | | | 592,697 | |
| | 5,800 | | | International Business Machines Corp. | | | 993,482 | |
| | 31,600 | | | Microsoft Corp. | | | 1,537,024 | |
| | 14,900 | | | Paychex, Inc. | | | 721,011 | |
| | | | | | | | |
| | | | | | | 7,657,479 | |
| | |
| Transportation – 2.2% | | | | |
| | 7,200 | | | Union Pacific Corp. | | | 764,856 | |
| | 8,400 | | | United Parcel Service, Inc. Class B | | | 844,452 | |
| | | | | | | | |
| | | | | | | 1,609,308 | |
| | |
| | TOTAL COMMON STOCKS | | | | |
| (Cost $54,644,144) | | | $71,323,768 | |
| | |
| | | | | | | | |
| | Exchange Traded Fund – 3.0% | | | | |
| | 22,400 | | | iShares Russell 1000 Growth Index Fund | |
| (Cost $2,178,656) | | | $ 2,227,904 | |
| | |
| | TOTAL INVESTMENTS – 99.8% | | | | |
| (Cost $56,822,800) | | | $73,551,672 | |
| | |
| OTHER ASSETS IN EXCESS OF
LIABILITIES – 0.2% | | | 148,186 | |
| | |
| | NET ASSETS – 100.0% | | | $73,699,858 | |
| | |
| | |
| The percentage shown for each investment category reflects the value of investments in that category as a percentage of net assets. |
| |
| * | | Non-income producing security. |
PORTFOLIO COMPOSITION
| | | | | | | | |
| | | AS OF 4/30/15 | | | AS OF 10/31/14 | |
| |
Consumer Non-Durables | | | 14.6 | % | | | 12.9 | % |
Electronic Technology | | | 11.3 | | | | 10.5 | |
Technology Services | | | 10.4 | | | | 10.2 | |
Finance | | | 9.8 | | | | 8.8 | |
Health Technology | | | 9.1 | | | | 9.0 | |
Process Industries | | | 8.3 | | | | 8.1 | |
Retail Trade | | | 7.4 | | | | 7.5 | |
Consumer Services | | | 6.7 | | | | 7.3 | |
Producer Manufacturing | | | 6.2 | | | | 6.3 | |
Exchange Traded Fund | | | 3.0 | | | | 2.0 | |
Industrial Services | | | 2.3 | | | | 3.1 | |
Transportation | | | 2.2 | | | | 2.4 | |
Distribution Services | | | 2.2 | | | | 2.1 | |
Commercial Services | | | 2.0 | | | | 2.3 | |
Communications | | | 2.0 | | | | 2.0 | |
Health Services | | | 1.2 | | | | 1.1 | |
Consumer Durables | | | 1.1 | | | | 1.0 | |
Energy Minerals | | | — | | | | 1.0 | |
Short-term Investment | | | — | | | | 1.7 | |
| |
| TOTAL INVESTMENTS | | | 99.8 | % | | | 99.3 | % |
| |
The percentage shown for each investment category reflects the value of investments in that category as a percentage of net assets. Underlying investment categories of investment companies or exchange traded funds held by the Fund are not reflected in the table above. Consequently, the Fund’s overall investment category allocations may differ from the percentages contained in the table above.
The Fund is actively managed and, as such, its composition may differ over time.
| | |
| 4 | | The accompanying notes are an integral part of these financial statements. |
COMMERCE VALUE FUND
Schedule of Investments
April 30, 2015 (Unaudited)
| | | | | | | | |
| | |
| Shares | | | Description | | Value | |
| | Common Stocks – 97.7% | |
| Communications – 4.6% | | | | |
| | 146,000 | | | AT&T, Inc. | | | $ 5,057,440 | |
| | 104,000 | | | Verizon Communications, Inc. | | | 5,245,760 | |
| | | | | | | | |
| | | | | | | 10,303,200 | |
| | |
| Consumer Durables – 3.6% | | | | |
| | 53,000 | | | Hasbro, Inc. | | | 3,751,870 | |
| | 64,000 | | | Tupperware Brands Corp. | | | 4,279,040 | |
| | | | | | | | |
| | | | | | | 8,030,910 | |
| | |
| Consumer Non-Durables – 7.6% | | | | |
| | 81,000 | | | Altria Group, Inc. | | | 4,054,050 | |
| | 40,000 | | | Kimberly-Clark Corp. | | | 4,387,600 | |
| | 52,000 | | | Procter & Gamble Co. | | | 4,134,520 | |
| | 62,000 | | | Reynolds American, Inc. | | | 4,544,600 | |
| | | | | | | | |
| | | | | | | 17,120,770 | |
| | |
| Consumer Services – 3.4% | | | | |
| | 52,000 | | | Darden Restaurants, Inc. | | | 3,316,040 | |
| | 45,000 | | | McDonald’s Corp. | | | 4,344,750 | |
| | | | | | | | |
| | | | | | | 7,660,790 | |
| | |
| Distribution Services – 1.8% | | | | |
| | 112,500 | | | SYSCO Corp. | | | 4,165,875 | |
| | |
| Electronic Technology – 5.5% | |
| | 131,000 | | | Intel Corp. | | | 4,264,050 | |
| | 22,000 | | | Lockheed Martin Corp. | | | 4,105,200 | |
| | 86,000 | | | Microchip Technology, Inc. | | | 4,098,330 | |
| | | | | | | | |
| | | | | | | 12,467,580 | |
| | |
| Energy Minerals – 12.2% | | | | |
| | 83,000 | | | Chevron Corp. | | | 9,217,980 | |
| | 138,000 | | | ConocoPhillips | | | 9,372,960 | |
| | 50,000 | | | Exxon Mobil Corp. | | | 4,368,500 | |
| | 57,000 | | | Occidental Petroleum Corp. | | | 4,565,700 | |
| | | | | | | | |
| | | | | | | 27,525,140 | |
| | |
| Finance – 23.3% | | | | |
| | 71,000 | | | Bank of Hawaii Corp. | | | 4,287,690 | |
| | 113,000 | | | BB&T Corp. | | | 4,326,770 | |
| | 63,000 | | | Cullen/Frost Bankers, Inc. | | | 4,595,220 | |
| | 95,000 | | | Federated Investors, Inc. Class B | | | 3,268,000 | |
| | 108,000 | | | HCP, Inc. | | | 4,351,320 | |
| | 148,000 | | | JPMorgan Chase & Co. | | | 9,362,480 | |
| | 172,000 | | | Kimco Realty Corp. | | | 4,145,200 | |
| | 86,000 | | | Principal Financial Group, Inc. | | | 4,396,320 | |
| | 88,000 | | | Waddell & Reed Financial, Inc. Class A | | | 4,340,160 | |
| | 172,000 | | | Wells Fargo & Co. | | | 9,477,200 | |
| | | | | | | | |
| | | | | | | 52,550,360 | |
| | |
| | | | | | | | |
| | |
| Shares | | | Description | | Value | |
| | Common Stocks – (continued) | |
| Health Technology – 9.3% | | | | |
| | 64,000 | | | Baxter International, Inc. | | | $ 4,399,360 | |
| | 43,000 | | | Johnson & Johnson | | | 4,265,600 | |
| | 96,000 | | | Merck & Co., Inc. | | | 5,717,760 | |
| | 192,000 | | | Pfizer, Inc. | | | 6,514,560 | |
| | | | | | | | |
| | | | | | | 20,897,280 | |
| | |
| Industrial Services – 3.8% | | | | |
| | 108,000 | | | Kinder Morgan, Inc. | | | 4,638,600 | |
| | 81,000 | | | Waste Management, Inc. | | | 4,011,930 | |
| | | | | | | | |
| | | | | | | 8,650,530 | |
| | |
| Process Industries – 3.7% | | | | |
| | 55,000 | | | E. I. du Pont de Nemours and Co. | | | 4,026,000 | |
| | 96,000 | | | Sonoco Products Co. | | | 4,290,240 | |
| | | | | | | | |
| | | | | | | 8,316,240 | |
| | |
| Producer Manufacturing – 6.7% | |
| | 54,000 | | | Caterpillar, Inc. | | | 4,691,520 | |
| | 77,000 | | | Emerson Electric Co. | | | 4,529,910 | |
| | 215,000 | | | General Electric Co. | | | 5,822,200 | |
| | | | | | | | |
| | | | | | | 15,043,630 | |
| | |
| Retail Trade – 3.7% | | | | |
| | 105,000 | | | Coach, Inc. | | | 4,012,050 | |
| | 56,000 | | | Target Corp. | | | 4,414,480 | |
| | | | | | | | |
| | | | | | | 8,426,530 | |
| | |
| Technology Services – 1.9% | | | | |
| | 89,000 | | | Paychex, Inc. | | | 4,306,710 | |
| | |
| Utilities – 6.6% | | | | |
| | 47,000 | | | Dominion Resources, Inc. | | | 3,368,960 | |
| | 33,000 | | | NextEra Energy, Inc. | | | 3,330,690 | |
| | 124,000 | | | PPL Corp. | | | 4,219,720 | |
| | 90,000 | | | The Southern Co. | | | 3,987,000 | |
| | | | | | | | |
| | | | | | | 14,906,370 | |
| | |
| | TOTAL COMMON STOCKS | | | | |
| (Cost $186,715,080) | | | $220,371,915 | |
| | |
| | | | | | | | |
| | Exchange Traded Fund – 2.1% | | | | |
| | 45,000 | | | iShares Russell 1000 Value Index Fund | |
| (Cost $4,661,168) | | | $ 4,679,550 | |
| | |
| | TOTAL INVESTMENTS – 99.8% | | | | |
| (Cost $191,376,248) | | | $225,051,465 | |
| | |
| OTHER ASSETS IN EXCESS OF
LIABILITIES – 0.2% | | | 515,001 | |
| | |
| NET ASSETS – 100.0% | | | $225,566,466 | |
| | |
| | |
| The percentage shown for each investment category reflects the value of investments in that category as a percentage of net assets. |
| | |
| The accompanying notes are an integral part of these financial statements. | | 5 |
COMMERCE VALUE FUND
Schedule of Investments (continued)
April 30, 2015 (Unaudited)
PORTFOLIO COMPOSITION
| | | | | | | | |
| | | AS OF
4/30/15 | | | AS OF
10/31/14 | |
| |
Finance | | | 23.3 | % | | | 23.7 | % |
Energy Minerals | | | 12.2 | | | | 10.5 | |
Health Technology | | | 9.3 | | | | 9.1 | |
Consumer Non-Durables | | | 7.6 | | | | 8.0 | |
Producer Manufacturing | | | 6.7 | | | | 6.2 | |
Utilities | | | 6.6 | | | | 8.1 | |
Electronic Technology | | | 5.5 | | | | 5.6 | |
Communications | | | 4.6 | | | | 4.6 | |
Industrial Services | | | 3.8 | | | | 3.9 | |
Retail Trade | | | 3.7 | | | | 1.9 | |
Process Industries | | | 3.7 | | | | 3.8 | |
Consumer Durables | | | 3.6 | | | | 3.2 | |
Consumer Services | | | 3.4 | | | | 3.3 | |
Exchange Traded Fund | | | 2.1 | | | | 1.9 | |
Technology Services | | | 1.9 | | | | 2.0 | |
Distribution Services | | | 1.8 | | | | 1.9 | |
Short-term Investment | | | — | | | | 2.1 | |
| |
| TOTAL INVESTMENTS | | | 99.8 | % | | | 99.8 | % |
| |
The percentage shown for each investment category reflects the value of investments in that category as a percentage of net assets. Underlying investment categories of investment companies or exchange traded funds held by the Fund are not reflected in the table above. Consequently, the Fund’s overall investment category allocations may differ from the percentages contained in the table above.
The Fund is actively managed and, as such, its composition may differ over time.
| | |
| 6 | | The accompanying notes are an integral part of these financial statements. |
COMMERCE MIDCAP GROWTH FUND
Schedule of Investments
April 30, 2015 (Unaudited)
| | | | | | | | |
| | |
| Shares | | | Description | | Value | |
| | Common Stocks – 94.8% | |
| Commercial Services – 8.6% | |
| | 9,100 | | | Equifax, Inc. | | | $ 882,063 | |
| | 9,000 | | | Gartner, Inc.* | | | 746,820 | |
| | 21,800 | | | KAR Auction Services, Inc. | | | 811,178 | |
| | 11,300 | | | Morningstar, Inc. | | | 857,557 | |
| | 14,000 | | | MSCI, Inc. | | | 856,660 | |
| | 16,900 | | | Nielsen NV | | | 759,486 | |
| | 6,300 | | | The Dun & Bradstreet Corp. | | | 804,321 | |
| | | | | | | | |
| | | | | | | 5,718,085 | |
| | |
| Communications* – 1.2% | |
| | 6,600 | | | SBA Communications Corp. Class A | | | 764,412 | |
| | |
| Consumer Durables – 3.6% | |
| | 13,500 | | | Harley-Davidson, Inc. | | | 758,835 | |
| | 15,500 | | | Jarden Corp.* | | | 793,290 | |
| | 12,200 | | | Tupperware Brands Corp. | | | 815,692 | |
| | | | | | | | |
| | | | | | | 2,367,817 | |
| | |
| Consumer Non-Durables – 7.2% | |
| | 9,800 | | | Church & Dwight Co., Inc. | | | 795,466 | |
| | 7,100 | | | Constellation Brands, Inc. Class A* | | | 823,174 | |
| | 10,700 | | | Dr Pepper Snapple Group, Inc. | | | 798,006 | |
| | 10,800 | | | McCormick & Co., Inc. | | | 813,240 | |
| | 6,300 | | | Ralph Lauren Corp. | | | 840,483 | |
| | 7,700 | | | The Hershey Co. | | | 707,784 | |
| | | | | | | | |
| | | | | | | 4,778,153 | |
| | |
| Consumer Services – 9.7% | |
| | 1,200 | | | Chipotle Mexican Grill, Inc.* | | | 745,608 | |
| | 17,300 | | | Dunkin’ Brands Group, Inc. | | | 901,503 | |
| | 9,600 | | | Marriott International, Inc. Class A | | | 768,480 | |
| | 36,700 | | | Regal Entertainment Group Class A | | | 807,400 | |
| | 34,950 | | | Rollins, Inc. | | | 866,760 | |
| | 9,700 | | | Scripps Networks Interactive, Inc. Class A | | | 677,642 | |
| | 31,100 | | | Service Corp. | | | 860,848 | |
| | 9,200 | | | Wyndham Worldwide Corp. | | | 785,680 | |
| | | | | | | | |
| | | | | | | 6,413,921 | |
| | |
| Distribution Services – 1.3% | |
| | 3,400 | | | W.W. Grainger, Inc. | | | 844,662 | |
| | |
| Electronic Technology – 8.2% | |
| | 14,100 | | | Amphenol Corp. Class A | | | 780,717 | |
| | 11,200 | | | Harris Corp. | | | 898,688 | |
| | 9,700 | | | Lam Research Corp. | | | 733,126 | |
| | 16,100 | | | Linear Technology Corp. | | | 742,693 | |
| | 16,400 | | | Microchip Technology, Inc. | | | 781,542 | |
| | 11,800 | | | Motorola Solutions, Inc. | | | 705,050 | |
| | 3,900 | | | TransDigm Group, Inc. | | | 827,307 | |
| | | | | | | | |
| | | | | | | 5,469,123 | |
| | |
| Energy Minerals – 1.3% | |
| | 9,700 | | | EQT Corp. | | | 872,418 | |
| | |
| | | | | | | | |
| | |
| Shares | | | Description | | Value | |
| | Common Stocks – (continued) | |
| Finance – 9.4% | |
| | 5,800 | | | Boston Properties, Inc. | | | $ 767,398 | |
| | 25,200 | | | Brown & Brown, Inc. | | | 805,140 | |
| | 14,000 | | | CBOE Holdings, Inc. | | | 787,780 | |
| | 9,700 | | | Crown Castle International Corp. | | | 810,241 | |
| | 9,300 | | | Erie Indemnity Co. Class A | | | 769,575 | |
| | 5,700 | | | Federal Realty Investment Trust | | | 761,919 | |
| | 3,400 | | | Intercontinental Exchange, Inc. | | | 763,402 | |
| | 9,800 | | | T. Rowe Price Group, Inc. | | | 795,564 | |
| | | | | | | | |
| | | | | | | 6,261,019 | |
| | |
| Health Services* – 1.2% | |
| | 6,600 | | | Laboratory Corporation of America Holdings | | | 789,096 | |
| | |
| Health Technology – 6.8% | |
| | 8,300 | | | Bio-Techne Corp. | | | 796,468 | |
| | 15,700 | | | DENTSPLY International, Inc. | | | 800,700 | |
| | 5,200 | | | IDEXX Laboratories, Inc.* | | | 651,924 | |
| | 7,700 | | | Pall Corp. | | | 749,364 | |
| | 8,500 | | | Sirona Dental Systems, Inc.* | | | 788,375 | |
| | 6,800 | | | Zimmer Holdings, Inc. | | | 746,912 | |
| | | | | | | | |
| | | | | | | 4,533,743 | |
| | |
| Process Industries – 5.8% | | | | |
| | 18,200 | | | Cabot Corp. | | | 777,868 | |
| | 16,000 | | | Crown Holdings, Inc.* | | | 868,160 | |
| | 9,700 | | | Packaging Corp. of America | | | 671,143 | |
| | 15,200 | | | RPM International, Inc. | | | 722,608 | |
| | 2,800 | | | The Sherwin-Williams Co. | | | 778,400 | |
| | | | | | | | |
| | | | | | | 3,818,179 | |
| | |
| Producer Manufacturing – 11.0% | | | | |
| | 12,900 | | | A.O. Smith Corp. | | | 824,310 | |
| | 25,900 | | | Allison Transmission Holdings, Inc. | | | 794,612 | |
| | 15,200 | | | AMETEK, Inc. | | | 796,784 | |
| | 11,200 | | | Dover Corp. | | | 848,064 | |
| | 11,600 | | | Graco, Inc. | | | 830,792 | |
| | 10,000 | | | IDEX Corp. | | | 750,100 | |
| | 2,400 | | | Mettler-Toledo International, Inc.* | | | 760,824 | |
| | 12,100 | | | The Toro Co. | | | 811,184 | |
| | 6,800 | | | Valmont Industries, Inc. | | | 856,936 | |
| | | | | | | | |
| | | | | | | 7,273,606 | |
| | |
| Retail Trade – 10.9% | | | | |
| | 1,300 | | | AutoZone, Inc.* | | | 874,458 | |
| | 9,300 | | | Carter’s, Inc. | | | 928,698 | |
| | 10,000 | | | Dollar Tree, Inc.* | | | 764,100 | |
| | 13,300 | | | Foot Locker, Inc. | | | 790,685 | |
| | 27,200 | | | Liberty Interactive Corp. Class A* | | | 782,272 | |
| | 10,000 | | | Nordstrom, Inc. | | | 755,600 | |
| | 3,700 | | | O’Reilly Automotive, Inc.* | | | 805,971 | |
| | 7,800 | | | Ross Stores, Inc. | | | 771,264 | |
| | 10,400 | | | Williams-Sonoma, Inc. | | | 764,712 | |
| | | | | | | | |
| | | | | | | 7,237,760 | |
| | |
| | |
| The accompanying notes are an integral part of these financial statements. | | 7 |
COMMERCE MIDCAP GROWTH FUND
Schedule of Investments (continued)
April 30, 2015 (Unaudited)
| | | | | | | | |
| | |
| Shares | | | Description | | Value | |
| | Common Stocks – (continued) | |
| Technology Services – 8.6% | | | | |
| | 2,700 | | | Alliance Data Systems Corp.* | | | $ 802,737 | |
| | 10,400 | | | Fiserv, Inc.* | | | 807,040 | |
| | 18,700 | | | Informatica Corp.* | | | 898,909 | |
| | 16,000 | | | Paychex, Inc. | | | 774,240 | |
| | 21,000 | | | PTC, Inc.* | | | 805,140 | |
| | 15,900 | | | Solera Holdings, Inc. | | | 771,468 | |
| | 21,300 | | | Total System Services, Inc. | | | 842,628 | |
| | | | | | | | |
| | | | | | | 5,702,162 | |
| | |
| | TOTAL COMMON STOCKS | | | | |
| (Cost $49,286,858) | | | $62,844,156 | |
| | |
| | | | | | | | |
| | Exchange Traded Fund – 4.5% | | | | |
| | 30,700 | | | iShares Russell Midcap Growth Index Fund | |
| (Cost $2,865,942) | | | $ 2,985,575 | |
| | |
| | | | | | | | | | |
| | | | | | | | | | |
Principal Amount | | Interest Rate | | | Maturity Date | | Value | |
| Short-term Investment(a) – 0.7% | |
Repurchase Agreement – 0.7% | |
| State Street Bank & Trust Co. | |
| $496,000 | | | 0.000 | % | | 05/01/15 | | $ | 496,000 | |
Maturity Value: $496,000 | |
(Cost $496,000) | | | | |
| |
| TOTAL INVESTMENTS – 100.0% | |
(Cost $52,648,800) | | $ | 66,325,731 | |
| |
LIABILITIES IN EXCESS OF OTHER ASSETS – 0.0% | | | (31,477) | |
| |
| NET ASSETS – 100.0% | | $ | 66,294,254 | |
| |
| | |
| The percentage shown for each investment category reflects the value of investments in that category as a percentage of net assets. |
| |
| * | | Non-income producing security. |
| (a) | | Repurchase agreement was entered into on April 30, 2015. This agreement was fully collateralized by $355,000 U.S. Treasury Bond, 8.000%, due 11/15/21 with a market value of $507,759. |
PORTFOLIO COMPOSITION
| | | | | | | | |
| | | AS OF
4/30/15 | | | AS OF
10/31/14 | |
| |
Producer Manufacturing | | | 11.0 | % | | | 12.9 | % |
Retail Trade | | | 10.9 | | | | 11.3 | |
Consumer Services | | | 9.7 | | | | 8.5 | |
Finance | | | 9.4 | | | | 7.5 | |
Commercial Services | | | 8.6 | | | | 7.3 | |
Technology Services | | | 8.6 | | | | 8.5 | |
Electronic Technology | | | 8.2 | | | | 6.7 | |
Consumer Non-Durables | | | 7.2 | | | | 7.4 | |
Health Technology | | | 6.8 | | | | 7.5 | |
Process Industries | | | 5.8 | | | | 8.0 | |
Exchange Traded Fund | | | 4.5 | | | | 0.8 | |
Consumer Durables | | | 3.6 | | | | 3.6 | |
Energy Minerals | | | 1.3 | | | | 2.2 | |
Distribution Services | | | 1.3 | | | | 1.1 | |
Health Services | | | 1.2 | | | | 2.3 | |
Communications | | | 1.2 | | | | 1.2 | |
Industrial Services | | | — | | | | 2.3 | |
Short-term Investment | | | 0.7 | | | | 1.0 | |
| |
| TOTAL INVESTMENTS | | | 100.0 | % | | | 100.1 | % |
| |
The percentage shown for each investment category reflects the value of investments in that category as a percentage of net assets. Underlying investment categories of investment companies or exchange traded funds held by the Fund are not reflected in the table above. Consequently, the Fund’s overall investment category allocations may differ from the percentages contained in the table above.
The Fund is actively managed and, as such, its composition may differ over time.
| | |
| 8 | | The accompanying notes are an integral part of these financial statements. |
COMMERCE BOND FUND
Schedule of Investments
April 30, 2015 (Unaudited)
| | | | | | | | | | |
Principal
Amount | | Interest Rate | | | Maturity Date | | Value | |
| Asset-Backed Securities – 12.0% | |
Auto – 1.7% | |
| California Republic Auto Receivables Trust Series 2012-1, Class A(a) | |
| $ 99,451 | | | 1.180 | % | | 08/15/17 | | $ | 99,596 | |
| California Republic Auto Receivables Trust Series 2013-1, Class A2(a) | |
| 1,537,322 | | | 1.410 | | | 09/17/18 | | | 1,543,268 | |
| CPS Auto Trust Series 2012-B, Class A(a) | |
| 820,595 | | | 2.520 | | | 09/16/19 | | | 825,084 | |
| Exeter Automobile Receivables Trust Series 2014-3A, Class A(a) | |
| 2,551,679 | | | 1.320 | | | 01/15/19 | | | 2,550,102 | |
| Flagship Credit Auto Trust Series 2013-1, Class A(a) | |
| 869,556 | | | 1.320 | | | 04/16/18 | | | 870,280 | |
| Ford Credit Floorplan Master Owner Trust Series 2012-2, Class A | |
| 3,000,000 | | | 1.920 | | | 01/15/19 | | | 3,045,543 | |
| Oscar US Funding Trust Series 2014-1A, Class A3(a) | |
| 7,450,000 | | | 1.720 | | | 04/15/19 | | | 7,468,625 | |
| | | | | | | | | | |
| | | | | | | | | 16,402,498 | |
| |
Commercial – 0.0% | |
| Small Business Administration Series 2006-P10B, Class 1 | |
| 195,928 | | | 5.681 | | | 08/10/16 | | | 202,973 | |
| |
Equipment(a) – 1.3% | |
| Cronos Containers Program Ltd. Series 2013-1A, Class A | |
| 800,000 | | | 3.080 | | | 04/18/28 | | | 795,777 | |
| Cronos Containers Program Ltd. Series 2014-2A, Class A | |
| 4,768,519 | | | 3.270 | | | 11/18/29 | | | 4,813,014 | |
| Dong Fang Container Finance II SPV Ltd. Series 2014-1A, Class A1 | |
| 4,120,833 | | | 1.950 | | | 11/25/39 | | | 4,088,567 | |
| Global SC Finance SRL Series 2013-1A, Class A | |
| 3,504,000 | | | 2.980 | | | 04/17/28 | | | 3,507,069 | |
| | | | | | | | | | |
| | | | | | | | | 13,204,427 | |
| |
Home Equity – 4.7% | |
| Accredited Mortgage Loan Trust Series 2004-4, Class A1B(b) | |
| 1,231,270 | | | 0.954 | | | 01/25/35 | | | 1,187,279 | |
| Ameriquest Mortgage Securities, Inc. Series 2004-FR1W, Class A6(b) | |
| 1,700,747 | | | 4.749 | | | 05/25/34 | | | 1,705,467 | |
| Chase Funding Mortgage Loan Asset-Backed Certificates Series 2002-3, Class 1A5(c) | |
| 2,788,343 | | | 5.907 | | | 06/25/32 | | | 2,710,729 | |
| Countrywide Asset-Backed Certificates Series 2004-BC5, Class M2(b) | |
| 2,099,057 | | | 1.014 | | | 10/25/34 | | | 2,091,072 | |
| Countrywide Asset-Backed Certificates Series 2005-SD2, Class M2(a)(b) | |
| 4,195,739 | | | 1.269 | | | 08/25/35 | | | 4,049,988 | |
| |
| | | | | | | | | | |
Principal
Amount | | Interest Rate | | | Maturity Date | | Value | |
| Asset-Backed Securities – (continued) | |
Home Equity – (continued) | |
| Countrywide Asset-Backed Certificates Series 2007-QH1, Class A1(a)(b) | |
| $ 842,269 | | | 0.381 | % | | 02/25/37 | | $ | 548,781 | |
| Equifirst Mortgage Loan Trust Series 2003-2, Class 2A2(c) | |
| 551,986 | | | 4.250 | | | 09/25/33 | | | 556,473 | |
| Equity One ABS, Inc. Series 2004-2, Class AF5(c) | |
| 450,000 | | | 5.699 | | | 07/25/34 | | | 450,954 | |
| Invitation Homes Trust Series 2013-SFR1, Class A(a)(b) | |
| 3,419,771 | | | 1.400 | | | 12/17/30 | | | 3,420,284 | |
| Invitation Homes Trust Series 2015-SFR2, Class A(a)(b) | |
| 4,500,000 | | | 1.528 | | | 06/17/32 | | | 4,515,440 | |
| Irwin Home Equity Series 2005-A, Class A3(b) | |
| 1,578,583 | | | 0.934 | | | 02/25/34 | | | 1,528,807 | |
| JPMorgan Mortgage Acquisition Corp. Series 2006-CH1, Class A5(b) | |
| 3,300,000 | | | 0.404 | | | 07/25/36 | | | 3,150,008 | |
| Morgan Stanley ABS Capital I, Inc. Trust Series 2005-HE1, Class M1(b) | |
| 6,650,000 | | | 0.849 | | | 12/25/34 | | | 6,144,966 | |
| Renaissance Home Equity Loan Trust Series 2005-3, Class AF3(c) | |
| 430,385 | | | 4.814 | | | 11/25/35 | | | 435,509 | |
| Renaissance Home Equity Loan Trust Series 2005-3, Class AF4(c) | |
| 1,125,000 | | | 5.140 | | | 11/25/35 | | | 1,065,207 | |
| Residential Asset Mortgage Products, Inc. Series 2003-RZ3, Class A6(c) | |
| 498,698 | | | 3.900 | | | 03/25/33 | | | 508,423 | |
| Residential Asset Mortgage Products, Inc. Series 2003-RZ4, Class A6(c) | |
| 2,769,732 | | | 5.490 | | | 10/25/33 | | | 2,906,247 | |
| Residential Funding Mortgage Securities II, Inc. Series 2000-HI2, Class AI5(c) | |
| 53,149 | | | 8.350 | | | 03/25/25 | | | 52,874 | |
| Residential Funding Mortgage Securities II, Inc. Series 2000-HI4, Class AI7(c) | |
| 114,695 | | | 8.480 | | | 09/25/30 | | | 114,562 | |
| Southern Pacific Secured Asset Corp. Series 1998-2, Class A7(c) | |
| 2,719,528 | | | 6.740 | | | 07/25/29 | | | 2,639,318 | |
| Structured Asset Investment Loan Trust Series 2003-BC5, Class M1(b) | |
| 1,411,524 | | | 1.299 | | | 06/25/33 | | | 1,354,085 | |
| Structured Asset Securities Corp. Series 2005-9XS, Class 1A3A(c) | |
| 1,389,798 | | | 5.250 | | | 06/25/35 | | | 1,412,781 | |
| Terwin Mortgage Trust Series 2005-16HE, Class AF2(c) | |
| 281,309 | | | 4.393 | | | 09/25/36 | | | 290,400 | |
| Wells Fargo Home Equity Trust Series 2006-2, Class A4(b) | |
| 2,825,000 | | | 0.424 | | | 07/25/36 | | | 2,628,939 | |
| | | | | | | | | | |
| | | | | | | | | 45,468,593 | |
| |
| | |
| The accompanying notes are an integral part of these financial statements. | | 9 |
COMMERCE BOND FUND
Schedule of Investments (continued)
April 30, 2015 (Unaudited)
| | | | | | | | | | |
Principal
Amount | | Interest Rate | | | Maturity Date | | Value | |
| Asset-Backed Securities – (continued) | |
Manufactured Housing – 0.3% | |
| Green Tree Financial Corp. Series 1993-4, Class A5 | |
| $ 103,583 | | | 7.050 | % | | 01/15/19 | | $ | 106,036 | |
| Green Tree Financial Corp. Series 1997-3, Class A6 | |
| 28,742 | | | 7.320 | | | 03/15/28 | | | 30,227 | |
| Green Tree Financial Corp. Series 1998-3, Class A5 | |
| 2,061,237 | | | 6.220 | | | 03/01/30 | | | 2,176,765 | |
| Green Tree Financial Corp. Series 1998-3, Class A6(b) | |
| 257,454 | | | 6.760 | | | 03/01/30 | | | 275,319 | |
| Lehman Manufactured Housing Contract Series 2001-B, Class A3 | |
| 167,561 | | | 4.350 | | | 04/15/40 | | | 175,500 | |
| Mid-State Trust Series 11, Class A1 | |
| 289,495 | | | 4.864 | | | 07/15/38 | | | 307,338 | |
| Origen Manufactured Housing Series 2005-B, Class A3 | |
| 9,066 | | | 5.605 | | | 05/15/22 | | | 9,057 | |
| | | | | | | | | | |
| | | | | | | | | 3,080,242 | |
| |
Other – 2.6% | |
| FirstKey Lending Trust Series 2015-SFR1, Class A(a) | |
| 700,000 | | | 2.553 | | | 09/09/31 | | | 702,475 | |
| Longtrain Leasing III LLC Series 2015-1A, Class A1(a) | |
| 5,844,981 | | | 2.980 | | | 01/15/45 | | | 5,864,580 | |
| PFS Financing Corp. Series 2014-AA, Class A(a)(b) | |
| 1,155,000 | | | 0.782 | | | 02/15/19 | | | 1,152,100 | |
| State of Hawaii Department of Business Economic Development & Tourism Series 2014-A, Class A2 | |
| 8,000,000 | | | 3.242 | | | 01/01/31 | | | 8,136,880 | |
| TAL Advantage V LLC Series 2014-3A, Class A(a) | |
| 4,791,667 | | | 3.270 | | | 11/21/39 | | | 4,858,007 | |
| Textainer Marine Containers Ltd. Series 2014-1A, Class A(a) | |
| 4,712,000 | | | 3.270 | | | 10/20/39 | | | 4,746,492 | |
| | | | | | | | | | |
| | | | | | | | | 25,460,534 | |
| |
Student Loans – 1.4% | |
| Navient Private Education Loan Trust Series 2015-AA, Class A2A(a) | |
| 8,000,000 | | | 2.650 | | | 12/15/28 | | | 8,046,176 | |
| Northstar Education Finance, Inc. Series 2005-1, Class A5(b) | |
| 808,104 | | | 1.029 | | | 10/30/45 | | | 804,718 | |
| SLM Student Loan Trust Series 2011-A, Class A2(a) | |
| 4,300,000 | | | 4.370 | | | 04/17/28 | | | 4,581,719 | |
| | | | | | | | | | |
| | | | | | | | | 13,432,613 | |
| |
| TOTAL ASSET-BACKED SECURITIES | |
(Cost $112,393,054) | | $ | 117,251,880 | |
| |
| | | | | | | | | | |
| Municipal Bond Obligations – 9.8% | |
California – 2.2% | |
| Anaheim California Public Financing Authority Revenue Bonds Build America Bonds | |
| $ 4,000,000 | | | 5.685 | % | | 10/01/40 | | $ | 4,876,520 | |
| |
| | | | | | | | | | |
Principal
Amount | | Interest Rate | | | Maturity Date | | Value | |
| Municipal Bond Obligations – (continued) | |
California – (continued) | |
| Hillsborough School District GO Bonds Capital Appreciation Election 2002 C(d) | |
| $10,590,000 | | | 0.000 | % | | 09/01/42 | | $ | 2,129,014 | |
| 11,420,000 | | | 0.000 | | | 09/01/43 | | | 2,116,240 | |
| Napa Valley Unified School District GO Bonds (Build America Bonds-Taxable) Series B | |
| 3,000,000 | | | 6.507 | | | 08/01/43 | | | 3,986,460 | |
| San Mateo Union High School District GO Bonds Refunding Taxable Series B | |
| 2,055,000 | | | 2.520 | | | 09/01/20 | | | 2,100,292 | |
| Santa Clara County CA Fremont Union High School District GO Bonds Capital Appreciation Election of 2008 Series B(d) | |
| 11,005,000 | | | 0.000 | | | 08/01/37 | | | 2,979,714 | |
| 12,290,000 | | | 0.000 | | | 08/01/39 | | | 2,800,522 | |
| | | | | | | | | | |
| | | | | | | | | 20,988,762 | |
| |
District of Columbia – 0.6% | |
| Metropolitan Washington D.C. Airport Authority System Revenue Bonds Series B | |
| 5,000,000 | | | 5.250 | | | 10/01/25 | | | 5,759,450 | |
| |
Florida – 0.2% | |
| Inland Protection Financing Corp. Florida Revenue Bonds Build America Bonds Series 2010 | |
| 2,000,000 | | | 4.700 | | | 07/01/19 | | | 2,162,100 | |
| |
Idaho – 0.5% | |
| Idaho Housing & Finance Association Economic Development Revenue Bonds Taxable (Facilities Project) Series 2011 | |
| 4,100,000 | | | 7.000 | | | 01/01/31 | | | 4,673,795 | |
| |
Illinois – 0.2% | |
| Will County Community Consolidated School District No. 30-C Troy Township Taxable GO Series 2007 (AGM) | |
| 1,100,000 | | | 5.650 | | | 10/01/18 | | | 1,192,532 | |
| Will County Forest Preservation District GO Bonds Build America Bonds Direct Payment Series 2009 | |
| 1,000,000 | | | 5.700 | | | 12/15/27 | | | 1,223,870 | |
| | | | | | | | | | |
| | | | | | | | | 2,416,402 | |
| |
Indiana – 0.5% | |
| Indianapolis Multi-School Building Corp. Revenue Bonds (Refunding First Mortgage) | |
| 5,000,000 | | | 3.000 | | | 01/15/26 | | | 5,064,400 | |
| |
Iowa – 0.2% | |
| Iowa Student Loan Liquidity Corp. Revenue Bonds Series A-1 (AMT) | |
| 1,490,000 | | | 3.500 | | | 12/01/15 | | | 1,509,132 | |
| |
Maryland – 0.1% | |
| Baltimore County Maryland GO Bonds Build America Bonds Consolidated Public Improvement Series B | |
| 1,000,000 | | | 5.000 | | | 11/01/23 | | | 1,122,380 | |
| |
| | |
| 10 | | The accompanying notes are an integral part of these financial statements. |
COMMERCE BOND FUND
| | | | | | | | | | |
Principal
Amount | | Interest Rate | | | Maturity Date | | Value | |
| Municipal Bond Obligations – (continued) | |
Michigan – 0.2% | |
| Utica Community Schools GO Bonds (Taxable-Qualified School Construction-Direct Payment) | |
| $ 1,500,000 | | | 5.875 | % | | 05/01/22 | | $ | 1,620,510 | |
| |
Missouri – 1.4% | |
| Curators University of Missouri System Facilities Revenue Bonds Build America Bonds | |
| 2,500,000 | | | 5.792 | | | 11/01/41 | | | 3,324,225 | |
| Missouri Joint Municipal Electric Utility Commission Power Project Revenue Bonds Build America Bonds Series 2009 | |
| 2,000,000 | | | 5.078 | | | 01/01/17 | | | 2,124,340 | |
| Missouri Joint Municipal Electric Utility Commission Power Project Revenue Bonds Taxable Series B | |
| 1,570,000 | | | 4.693 | | | 01/01/16 | | | 1,609,140 | |
| Missouri State Highways & Transit Commission State Road Revenue Bonds Build America Bonds Series 2010 | |
| 2,800,000 | | | 4.820 | | | 05/01/23 | | | 3,117,156 | |
| New Liberty Hospital District Revenue Bonds Build America Bonds Series B | |
| 1,345,000 | | | 5.704 | | | 12/01/19 | | | 1,483,105 | |
| Saint Louis Special Administrative Board of The Transitional School District GO Bonds (Taxable-Refunding) (MO Direct Deposit) Series B | |
| 1,800,000 | | | 4.000 | | | 04/01/17 | | | 1,891,854 | |
| | | | | | | | | | |
| | | | | | | | | 13,549,820 | |
| |
Nevada – 0.3% | |
| Clark County Nevada Sales & Excise Tax Revenue Bonds Build America Bonds Series C | |
| 2,525,000 | | | 5.100 | | | 07/01/21 | | | 2,851,053 | |
| |
New Jersey – 0.5% | |
| New Jersey State Economic Development Authority Revenue Bonds (Taxable-Refunding) (School Facilities Construction) Series QQ | |
| 3,000,000 | | | 1.802 | | | 06/15/17 | | | 3,030,120 | |
| New Jersey State Higher Education Student Assistance Authority Revenue Bonds Student Loan Series 1A (AMT) | |
| 1,250,000 | | | 4.000 | | | 12/01/19 | | | 1,346,612 | |
| | | | | | | | | | |
| | | | | | | | | 4,376,732 | |
| |
New York – 1.0% | |
| New York GO Build America Bonds Series 2010 | |
| 2,000,000 | | | 4.908 | | | 06/01/21 | | | 2,269,720 | |
| 1,055,000 | | | 5.008 | | | 06/01/22 | | | 1,209,326 | |
| New York Housing Development Corporation Multi Family Housing Revenue Bonds Taxable Series I | |
| 2,600,000 | | | 1.921 | | | 11/01/18 | | | 2,630,862 | |
| New York State Housing Finance Agency Personal Income Tax Revenue Bonds Taxable Economic Development & Housing Series B | |
| 3,925,000 | | | 5.220 | | | 09/15/15 | | | 3,993,020 | |
| | | | | | | | | | |
| | | | | | | | | 10,102,928 | |
| |
| | | | | | | | | | |
Principal
Amount | | Interest Rate | | | Maturity Date | | Value | |
| Municipal Bond Obligations – (continued) | |
Ohio – 0.5% | |
| Ohio State GO Build America Bonds Series 2010 | |
| $ 2,500,000 | | | 3.000 | % | | 11/01/18 | | $ | 2,631,575 | |
| Ohio State GO Build America Bonds Taxable Conservation Project Direct Payment Series C | |
| 1,960,000 | | | 4.471 | | | 03/01/19 | | | 2,155,314 | |
| | | | | | | | | | |
| | | | | | | | | 4,786,889 | |
| |
Pennsylvania – 0.4% | |
| State Public School Building Authority Revenue Bonds (Qualified School Construction Bonds) | |
| 3,000,000 | | | 6.495 | | | 09/15/28 | | | 3,735,090 | |
| |
Puerto Rico – 0.3% | |
| Puerto Rico Electric Power Authority Revenue Bonds (Refunding) Series VV | |
| 1,100,000 | | | 5.500 | | | 07/01/20 | | | 663,652 | |
| Puerto Rico Electric Power Authority Revenue Bonds (Refunding) Series ZZ | |
| 3,400,000 | | | 5.250 | | | 07/01/18 | | | 2,053,430 | |
| | | | | | | | | | |
| | | | | | | | | 2,717,082 | |
| |
Rhode Island – 0.2% | |
| Rhode Island Convention Center Authority Revenue Bonds Taxable Civic Center Series A (AGM) | |
| 2,155,000 | | | 5.810 | | | 05/15/16 | | | 2,250,380 | |
| |
South Carolina – 0.3% | |
| South Carolina State Housing Finance & Development Authority Revenue Bonds Refunding Taxable PAC Series A-2 (FHA) | |
| 3,245,000 | | | 4.000 | | | 07/01/34 | | | 3,348,223 | |
| |
Washington – 0.2% | |
| Seattle Municipal Light & Power Revenue Bonds Taxable Clean Renewable Energy Bonds Series C | |
| 2,000,000 | | | 3.750 | | | 06/01/33 | | | 2,017,580 | |
| |
| TOTAL MUNICIPAL BOND OBLIGATIONS | |
(Cost $85,641,377) | | $ | 95,052,708 | |
| |
| | | | | | | | | | |
| Mortgage-Backed Obligations – 18.1% | |
Collateralized Mortgage Obligations – 11.1% | |
| Adjustable Rate Mortgage Trust Series 2004-5, Class 3A1(b) | |
| $ 1,735,857 | | | 2.505 | % | | 04/25/35 | | $ | 1,732,633 | |
| Agate Bay Mortgage Loan Trust Series 2015-3, Class A8(a)(b) | |
| 3,000,000 | | | 3.000 | | | 04/25/45 | | | 3,059,063 | |
| Banc of America Alternative Loan Trust Series 2004-1, Class 1A1 | |
| 2,128,987 | | | 6.000 | | | 02/25/34 | | | 2,263,696 | |
| Banc of America Alternative Loan Trust Series 2005-10, Class 6A1 | |
| 1,115,262 | | | 5.500 | | | 11/25/20 | | | 1,129,021 | |
| Banc of America Alternative Loan Trust Series 2006-3, Class 6A1 | |
| 234,815 | | | 6.000 | | | 04/25/36 | | | 241,092 | |
| |
| | |
| The accompanying notes are an integral part of these financial statements. | | 11 |
COMMERCE BOND FUND
Schedule of Investments (continued)
April 30, 2015 (Unaudited)
| | | | | | | | | | |
Principal
Amount | | Interest Rate | | | Maturity Date | | Value | |
| Mortgage-Backed Obligations – (continued) | |
Collateralized Mortgage Obligations – (continued) | |
| BCAP LLC Trust Series 2006-RR1, Class PE | |
| $ 3,740,311 | | | 5.000 | % | | 11/25/36 | | $ | 3,818,562 | |
| Bear Stearns Alt-A Trust Series 2005-9, Class 25A1(b) | |
| 2,295,728 | | | 2.512 | | | 11/25/35 | | | 1,809,068 | |
| Bear Stearns Asset Backed Securities Trust Series 2003-AC7, Class A2(c) | |
| 532,641 | | | 5.750 | | | 01/25/34 | | | 555,782 | |
| Citicorp Mortgage Securities, Inc. Series 2006-4, Class 3A1 | |
| 54,339 | | | 5.500 | | | 08/25/21 | | | 54,605 | |
| Citigroup Mortgage Loan Trust, Inc. Series 2004-NCM2, Class 1CB2 | |
| 1,236,031 | | | 6.750 | | | 08/25/34 | | | 1,358,716 | |
| Citigroup Mortgage Loan Trust, Inc. Series 2005-10, Class 1A5A(b) | |
| 1,014,970 | | | 2.821 | | | 12/25/35 | | | 893,259 | |
| Citigroup Mortgage Loan Trust, Inc. Series 2007-AR5, Class 1A3A(b) | |
| 408,021 | | | 2.760 | | | 04/25/37 | | | 334,942 | |
| Citigroup Mortgage Loan Trust, Inc. Series 2009-3, Class 2A1(a) | |
| 102,153 | | | 5.750 | | | 09/25/21 | | | 102,192 | |
| Citigroup Mortgage Loan Trust, Inc. Series 2009-5, Class 7A1(a)(b) | |
| 1,471,348 | | | 0.524 | | | 07/25/36 | | | 1,429,234 | |
| Citigroup Mortgage Loan Trust, Inc. Series 2015-A, Class A1(b) | |
| 5,939,192 | | | 3.500 | | | 06/25/58 | | | 6,007,998 | |
| Citimortgage Alternative Loan Trust Series 2006-A3, Class 2A1 | |
| 188,395 | | | 5.500 | | | 07/25/36 | | | 188,777 | |
| Countrywide Alternative Loan Trust Series 2004-18CB, Class 3A1 | |
| 369,920 | | | 5.250 | | | 09/25/19 | | | 377,769 | |
| Countrywide Alternative Loan Trust Series 2005-J1, Class 3A1 | |
| 128,732 | | | 6.500 | | | 08/25/32 | | | 133,720 | |
| Countrywide Alternative Loan Trust Series 2007-J2, Class 2A1 | |
| 362,925 | | | 6.000 | | | 07/25/37 | | | 370,257 | |
| Countrywide Home Loans Trust Series 2003-J6, Class 1A1 | |
| 718,121 | | | 5.500 | | | 08/25/33 | | | 751,074 | |
| Countrywide Home Loans Trust Series 2004-J1, Class 2A4 | |
| 292,813 | | | 4.750 | | | 01/25/19 | | | 297,540 | |
| Countrywide Home Loans Trust Series 2005-27, Class 2A1 | |
| 1,487,374 | | | 5.500 | | | 12/25/35 | | | 1,354,977 | |
| Countrywide Home Loans Trust Series 2005-6, Class 2A1 | |
| 365,894 | | | 5.500 | | | 04/25/35 | | | 362,872 | |
| Countrywide Home Loans Trust Series 2005-7, Class 1A1(b) | |
| 2,123,568 | | | 0.714 | | | 03/25/35 | | | 1,981,563 | |
| CS First Boston Mortgage Securities Corp. Series 2003-19, Class 1A4 | |
| 441,023 | | | 5.250 | | | 07/25/33 | | | 454,289 | |
| CS First Boston Mortgage Securities Corp. Series 2005-5, Class 2A9 | |
| 5,911,030 | | | 5.500 | | | 07/25/35 | | | 6,062,483 | |
| EverBank Mortgage Loan Trust Series 2013-2, Class A(a)(b) | |
| 3,916,304 | | | 3.000 | | | 06/25/43 | | | 3,904,218 | |
| |
| | | | | | | | | | |
Principal
Amount | | Interest Rate | | | Maturity Date | | Value | |
| Mortgage-Backed Obligations – (continued) | |
Collateralized Mortgage Obligations – (continued) | |
| FHLMC REMIC PAC Series 1579, Class PM | |
| $ 169,040 | | | 6.700 | % | | 09/15/23 | | $ | 192,106 | |
| FHLMC REMIC PAC Series 2103, Class TE | |
| 130,980 | | | 6.000 | | | 12/15/28 | | | 150,587 | |
| FHLMC REMIC PAC Series 2110, Class PG | |
| 582,999 | | | 6.000 | | | 01/15/29 | | | 667,912 | |
| FHLMC REMIC Series 2391, Class Z | |
| 1,588,950 | | | 6.000 | | | 12/15/31 | | | 1,821,776 | |
| FHLMC REMIC Series 2603, Class C | |
| 708,702 | | | 5.500 | | | 04/15/23 | | | 782,241 | |
| FHLMC REMIC Series 2677, Class BC | |
| 204,878 | | | 4.000 | | | 09/15/18 | | | 211,915 | |
| FHLMC REMIC Series 2866, Class DH | |
| 610,628 | | | 4.000 | | | 09/15/34 | | | 640,258 | |
| First Horizon Alternative Mortgage Securities Series 2004-FA2, Class 1A1 | |
| 815,253 | | | 6.000 | | | 01/25/35 | | | 809,861 | |
| First Horizon Alternative Mortgage Securities Series 2006-RE1, Class A1 | |
| 2,562,301 | | | 5.500 | | | 05/25/35 | | | 2,431,262 | |
| FNMA REMIC FNIC PAC Series 2001-45, Class WG | |
| 198,521 | | | 6.500 | | | 09/25/31 | | | 228,547 | |
| FNMA REMIC PAC Series 2003-117, Class KB | |
| 3,000,000 | | | 6.000 | | | 12/25/33 | | | 3,441,594 | |
| FNMA REMIC PAC Series 2003-14, Class AP | |
| 125,535 | | | 4.000 | | | 03/25/33 | | | 132,677 | |
| FNMA REMIC PAC Series 2004-53, Class NC | |
| 915,099 | | | 5.500 | | | 07/25/24 | | | 1,010,244 | |
| FNMA REMIC Series 2002-73, Class OE | |
| 551,421 | | | 5.000 | | | 11/25/17 | | | 573,053 | |
| FNMA REMIC Series 2002-82, Class XE | |
| 488,490 | | | 5.000 | | | 12/25/17 | | | 502,725 | |
| FNMA REMIC Series 2003-83, Class PG | |
| 137,883 | | | 5.000 | | | 06/25/23 | | | 145,567 | |
| FNMA Series 2003-W6, Class 2A32 | |
| 188,594 | | | 6.500 | | | 09/25/42 | | | 217,564 | |
| GSR Mortgage Loan Trust Series 2004-12, Class 1A1(b) | |
| 1,335,530 | | | 0.514 | | | 12/25/34 | | | 1,210,377 | |
| GSR Mortgage Loan Trust Series 2004-7, Class 1A1(b) | |
| 244,069 | | | 2.239 | | | 06/25/34 | | | 237,058 | |
| Impac CMB Trust Series 2003-2F, Class A(b) | |
| 692,817 | | | 5.730 | | | 01/25/33 | | | 722,574 | |
| Impac CMB Trust Series 2004-4, Class 1A1(b) | |
| 2,113,462 | | | 0.814 | | | 09/25/34 | | | 2,017,560 | |
| Impac CMB Trust Series 2004-4, Class 2A2(c) | |
| 3,234,071 | | | 4.913 | | | 09/25/34 | | | 3,277,372 | |
| Impac Secured Assets Corp. Series 2004-2, Class A6(c) | |
| 235,414 | | | 4.947 | | | 08/25/34 | | | 247,338 | |
| JPMorgan Alternative Loan Trust Series 2006-S1, Class 1A16 | |
| 1,975,997 | | | 6.000 | | | 03/25/36 | | | 1,745,495 | |
| |
| | |
| 12 | | The accompanying notes are an integral part of these financial statements. |
COMMERCE BOND FUND
| | | | | | | | | | |
Principal
Amount | | Interest Rate | | | Maturity Date | | Value | |
| Mortgage-Backed Obligations – (continued) | |
Collateralized Mortgage Obligations – (continued) | |
| JPMorgan Mortgage Trust Series 2007-A2, Class 4A2(b) | |
| $ 640,896 | | | 4.937 | % | | 04/25/37 | | $ | 583,002 | |
| JPMorgan Mortgage Trust Series 2013-3, Class A10(a)(b) | |
| 3,166,339 | | | 3.470 | | | 07/25/43 | | | 3,210,370 | |
| JPMorgan Mortgage Trust Series 2014-2, Class 1A1(a)(b) | |
| 3,999,767 | | | 3.000 | | | 06/25/29 | | | 4,097,541 | |
| Lehman XS Trust Series 2005-1, Class 1A4(b) | |
| 403,732 | | | 0.684 | | | 07/25/35 | | | 388,762 | |
| Long Beach Mortgage Loan Trust Series 2003-4, Class AV1(b) | |
| 227,322 | | | 0.794 | | | 08/25/33 | | | 211,089 | |
| Master Adjustable Rate Mortgages Trust Series 2003-2, Class 6A1(b) | |
| 1,037,977 | | | 2.327 | | | 07/25/33 | | | 1,019,722 | |
| Master Alternative Loans Trust Series 2004-4, Class 1A1 | |
| 280,454 | | | 5.500 | | | 05/25/34 | | | 298,702 | |
| Master Alternative Loans Trust Series 2004-4, Class 8A1 | |
| 1,499,483 | | | 6.500 | | | 05/25/34 | | | 1,557,338 | |
| Master Alternative Loans Trust Series 2004-9, Class A6(c) | |
| 861,737 | | | 5.143 | | | 08/25/34 | | | 899,685 | |
| Master Asset Securitization Trust Series 2003-10, Class 3A1 | |
| 132,962 | | | 5.500 | | | 11/25/33 | | | 139,066 | |
| Master Asset Securitization Trust Series 2003-7, Class 1A1 | |
| 268,084 | | | 5.500 | | | 09/25/33 | | | 278,252 | |
| Master Asset Securitization Trust Series 2004-3, Class 5A1 | |
| 11,046 | | | 6.250 | | | 01/25/32 | | | 11,190 | |
| Morgan Stanley Dean Witter Capital I Series 2003-HYB1, Class A3(b) | |
| 439,173 | | | 1.699 | | | 03/25/33 | | | 411,301 | |
| Morgan Stanley Mortgage Loan Trust Series 2005-7, Class 2A1(b) | |
| 2,147,697 | | | 5.812 | | | 11/25/35 | | | 2,150,603 | |
| Morgan Stanley Mortgage Loan Trust Series 2007-12, Class 3A22 | |
| 1,631,752 | | | 6.000 | | | 08/25/37 | | | 1,507,938 | |
| NRP Mortgage Trust Series 2013-1, Class A23(a)(b) | |
| 3,617,323 | | | 3.250 | | | 07/25/43 | | | 3,687,727 | |
| Opteum Mortgage Acceptance Corp. Asset Backed Pass-Through Certificates Series 2005-1, Class M3(b) | |
| 1,370,000 | | | 1.029 | | | 02/25/35 | | | 1,310,780 | |
| PHHMC Mortgage Pass-Through Certificates Series 2008-CIM1, Class 11A1(b) | |
| 1,530,754 | | | 2.424 | | | 05/25/38 | | | 1,443,254 | |
| RBSGC Mortgage Pass-Through Certificates Series 2007-B, Class 2A1(b) | |
| 1,452,260 | | | 5.785 | | | 11/25/21 | | | 1,334,964 | |
| RBSGC Mortgage Pass-Through Certificates Series 2007-B, Class 3A1(b) | |
| 53,056 | | | 5.331 | | | 07/25/35 | | | 54,634 | |
| Residential Accredit Loans, Inc. Series 2003-QS7, Class A2 | |
| 1,099,570 | | | 4.750 | | | 04/25/33 | | | 1,117,326 | |
| Residential Accredit Loans, Inc. Series 2004-QS2, Class CB | |
| 2,575,358 | | | 5.750 | | | 02/25/34 | | | 2,666,093 | |
| |
| | | | | | | | | | |
Principal
Amount | | Interest Rate | | | Maturity Date | | Value | |
| Mortgage-Backed Obligations – (continued) | |
Collateralized Mortgage Obligations – (continued) | |
| Residential Accredit Loans, Inc. Series 2005-QS11, Class A2(b) | |
| $ 402,049 | | | 0.674 | % | | 07/25/35 | | $ | 340,042 | |
| Residential Asset Mortgage Products, Inc. Series 2004-SL4, Class A2 | |
| 49,238 | | | 6.000 | | | 07/25/32 | | | 49,085 | |
| Residential Asset Securitization Trust Series 2004-A6, Class A1 | |
| 655,119 | | | 5.000 | | | 08/25/19 | | | 671,435 | |
| Residential Funding Mortgage Securities Corp. Series 2003-RM2, Class AIII | |
| 203,897 | | | 6.000 | | | 05/25/33 | | | 214,552 | |
| Residential Funding Mortgage Securities I, Inc. Series 2005-S7, Class A5 | |
| 323,667 | | | 5.500 | | | 11/25/35 | | | 303,594 | |
| Residential Funding Mortgage Securities I, Inc. Series 2005-S9, Class A5 | |
| 952,547 | | | 5.750 | | | 12/25/35 | | | 910,159 | |
| Residential Funding Mortgage Securities I, Inc. Series 2006-S12, Class 1A1 | |
| 563,811 | | | 5.500 | | | 12/25/21 | | | 573,419 | |
| Sequoia Mortgage Trust Series 2004-10, Class A1A(b) | |
| 857,671 | | | 0.796 | | | 11/20/34 | | | 819,575 | |
| Sequoia Mortgage Trust Series 2015-2, Class A10(a)(b) | |
| 3,000,000 | | | 3.500 | | | 05/25/45 | | | 3,100,737 | |
| Structured Adjustable Rate Mortgage Loan Trust Series 2004-14, Class 1A(b) | |
| 1,450,125 | | | 2.458 | | | 10/25/34 | | | 1,477,000 | |
| Structured Adjustable Rate Mortgage Loan Trust Series 2004-4, Class 3A4(b) | |
| 371,610 | | | 2.479 | | | 04/25/34 | | | 368,052 | |
| Structured Asset Securities Corp. Series 2003-29, Class 5A4 | |
| 1,238,509 | | | 5.250 | | | 09/25/33 | | | 1,288,334 | |
| Structured Asset Securities Corp. Series 2003-31A, Class 2A7(b) | |
| 662,037 | | | 2.436 | | | 10/25/33 | | | 650,897 | |
| Structured Asset Securities Corp. Series 2003-34A, Class 3A3(b) | |
| 1,046,874 | | | 2.862 | | | 11/25/33 | | | 1,034,476 | |
| Structured Asset Securities Corp. Series 2003-34A, Class 6A(b) | |
| 479,399 | | | 2.596 | | | 11/25/33 | | | 468,807 | |
| Structured Asset Securities Corp. Series 2004-11XS, Class 1A4B(c) | |
| 973,362 | | | 5.710 | | | 06/25/34 | | | 988,987 | |
| Structured Asset Securities Corp. Series 2005-6, Class 5A2 | |
| 94,222 | | | 5.000 | | | 05/25/35 | | | 96,268 | |
| Structured Asset Securities Corp. Series 2005-6, Class 5A4 | |
| 130,542 | | | 5.000 | | | 05/25/35 | | | 132,970 | |
| Washington Mutual Alternative Mortgage Pass-Through Certificates Series 2005-4, Class 4A1 | |
| 656,924 | | | 5.500 | | | 06/25/20 | | | 667,005 | |
| Wells Fargo Mortgage Backed Securities Trust Series 2005-AR15, Class 1A2(b) | |
| 628,579 | | | 2.613 | | | 09/25/35 | | | 612,686 | |
| |
| | |
| The accompanying notes are an integral part of these financial statements. | | 13 |
COMMERCE BOND FUND
Schedule of Investments (continued)
April 30, 2015 (Unaudited)
| | | | | | | | | | |
Principal
Amount | | Interest Rate | | | Maturity Date | | Value | |
| Mortgage-Backed Obligations – (continued) | |
Collateralized Mortgage Obligations – (continued) | |
| Wells Fargo Mortgage Backed Securities Trust Series 2007-2, Class 3A5 | |
| $ 622,491 | | | 5.250 | % | | 03/25/37 | | $ | 639,205 | |
| |
| TOTAL COLLATERALIZED MORTGAGE OBLIGATIONS | |
(Cost $96,632,530) | | $ | 108,233,689 | |
| |
Commercial Mortgage Obligations – 6.1% | |
| Citigroup Commercial Mortgage Trust Series 2013-GC17, Class A2 | |
| $ 5,000,000 | | | 2.962 | % | | 11/10/46 | | $ | 5,204,705 | |
| Citigroup Commercial Mortgage Trust Series 2015-GC29, Class A2 | |
| 5,000,000 | | | 2.674 | | | 04/10/48 | | | 5,132,595 | |
| Commercial Mortgage Pass Through Certificates Series 2013-CR12, Class A2 | |
| 2,520,000 | | | 2.904 | | | 10/10/46 | | | 2,617,181 | |
| Commercial Mortgage Pass-Through Certificates Series 2014-CR14, Class A2 | |
| 3,020,000 | | | 3.147 | | | 02/10/47 | | | 3,149,307 | |
| Commercial Mortgage Trust Series 2012-CR2, Class A2 | |
| 1,775,000 | | | 2.025 | | | 08/15/45 | | | 1,803,141 | |
| Commercial Mortgage Trust Series 2012-CR4, Class A2 | |
| 1,000,000 | | | 1.801 | | | 10/15/45 | | | 1,006,800 | |
| Commercial Mortgage Trust Series 2013-CR6, Class A2 | |
| 2,035,000 | | | 2.122 | | | 03/10/46 | | | 2,070,446 | |
| Commercial Mortgage Trust Series 2014-CR15, Class A2 | |
| 5,000,000 | | | 2.928 | | | 02/10/47 | | | 5,193,925 | |
| Commercial Mortgage Trust Series 2014-LC15, Class A2 | |
| 700,000 | | | 2.840 | | | 04/10/47 | | | 725,266 | |
| JPMBB Commercial Mortgage Securities Trust Series 2014-C19, Class A2 | |
| 1,500,000 | | | 3.046 | | | 04/15/47 | | | 1,569,261 | |
| JPMBB Commercial Mortgage Securities Trust Series 2015-C28, Class A2 | |
| 1,915,000 | | | 2.773 | | | 10/15/48 | | | 1,965,267 | |
| Morgan Stanley Bank of America Merrill Lynch Trust Series 2012-C6, Class A2 | |
| 3,000,000 | | | 1.868 | | | 11/15/45 | | | 3,036,207 | |
| Morgan Stanley Bank of America Merrill Lynch Trust Series 2014-C14, Class A2 | |
| 4,000,000 | | | 2.916 | | | 02/15/47 | | | 4,155,356 | |
| Morgan Stanley Bank of America Merrill Lynch Trust Series 2015-C21, Class A2 | |
| 7,830,000 | | | 2.933 | | | 03/15/48 | | | 8,124,204 | |
| Morgan Stanley Bank of America Merrill Lynch Trust Series 2015-C22, Class A2 | |
| 5,000,000 | | | 2.739 | | | 05/15/46 | | | 5,145,350 | |
| UBS-Citigroup Commercial Mortgage Trust Series 2011-C1, Class A1 | |
| 2,165,094 | | | 1.524 | | | 01/10/45 | | | 2,174,854 | |
| |
| | | | | | | | | | |
Principal
Amount | | Interest Rate | | | Maturity Date | | Value | |
| Mortgage-Backed Obligations – (continued) | |
Commercial Mortgage Obligations – (continued) | |
| WF-RBS Commercial Mortgage Trust Series 2011-C2, Class A1(a) | |
| $ 352,719 | | | 2.501 | % | | 02/15/44 | | $ | 353,506 | |
| WF-RBS Commercial Mortgage Trust Series 2014-C19, Class A2 | |
| 2,455,000 | | | 2.895 | | | 03/15/47 | | | 2,552,267 | |
| WF-RBS Commercial Mortgage Trust Series 2014-C20, Class A2 | |
| 3,500,000 | | | 3.036 | | | 05/15/47 | | | 3,656,216 | |
| |
| TOTAL COMMERCIAL MORTGAGE OBLIGATIONS | |
(Cost $52,721,326) | | $ | 59,635,854 | |
| |
Mortgage-Backed Pass-Through Obligations – 0.9% | |
| FHLMC | | | | | | | | | | |
| $ 4,798 | | | 8.500 | % | | 02/01/19 | | $ | 4,848 | |
| 22,823 | | | 8.500 | | | 03/01/21 | | | 23,743 | |
| 302,168 | | | 7.000 | | | 05/01/26 | | | 358,151 | |
| 5,254 | | | 7.000 | | | 10/01/30 | | | 5,271 | |
| 41,715 | | | 7.500 | | | 12/01/30 | | | 52,021 | |
| 75,782 | | | 7.500 | | | 01/01/31 | | | 94,019 | |
| 131,631 | | | 7.000 | | | 08/01/31 | | | 159,131 | |
| 1,582,812 | | | 5.000 | | | 05/01/33 | | | 1,780,263 | |
| 347,277 | | | 2.354 | (b) | | 05/01/34 | | | 370,388 | |
| 456,828 | | | 2.342 | (b) | | 01/01/36 | | | 491,073 | |
| FNMA | | | | | | | | | | |
| 10,232 | | | 9.000 | | | 11/01/21 | | | 10,374 | |
| 57,179 | | | 9.000 | | | 02/01/25 | | | 64,703 | |
| 13,487 | | | 6.500 | | | 03/01/26 | | | 15,540 | |
| 2,238,163 | | | 2.500 | | | 05/01/28 | | | 2,290,812 | |
| 16,016 | | | 8.000 | | | 07/01/28 | | | 16,826 | |
| 50,120 | | | 6.500 | | | 10/01/28 | | | 58,696 | |
| 57,493 | | | 2.415 | (b) | | 12/01/28 | | | 59,023 | |
| 61,221 | | | 6.000 | | | 07/01/29 | | | 69,865 | |
| 30,409 | | | 7.500 | | | 09/01/29 | | | 32,799 | |
| 48,109 | | | 7.000 | | | 03/01/31 | | | 54,324 | |
| 14,817 | | | 7.500 | | | 03/01/31 | | | 17,355 | |
| 56,079 | | | 7.000 | | | 11/01/31 | | | 63,839 | |
| 40,912 | | | 7.000 | | | 01/01/32 | | | 42,188 | |
| 190,257 | | | 6.000 | | | 12/01/32 | | | 217,957 | |
| 57,117 | | | 1.787 | (b) | | 02/01/33 | | | 59,850 | |
| 277,425 | | | 5.000 | | | 07/01/33 | | | 310,468 | |
| 310,644 | | | 2.365 | (b) | | 10/01/34 | | | 331,010 | |
| 317,967 | | | 2.385 | (b) | | 02/01/35 | | | 340,588 | |
| GNMA | | | | | | | | | | |
| 124,556 | | | 8.000 | | | 02/15/22 | | | 137,985 | |
| 41,215 | | | 7.500 | | | 08/20/25 | | | 47,214 | |
| 202,040 | | | 7.500 | | | 07/20/26 | | | 244,480 | |
| 142,172 | | | 6.500 | | | 04/15/31 | | | 163,985 | |
| |
| | |
| 14 | | The accompanying notes are an integral part of these financial statements. |
COMMERCE BOND FUND
| | | | | | | | | | |
Principal
Amount | | Interest Rate | | | Maturity Date | | Value | |
| Mortgage-Backed Obligations – (continued) | |
Mortgage-Backed Pass-Through Obligations – (continued) | |
| GNMA – (continued) | |
| $ 223,374 | | | 6.500 | % | | 05/15/31 | | $ | 257,645 | |
| |
| TOTAL MORTGAGE-BACKED PASS-THROUGH OBLIGATIONS | |
(Cost $7,602,637) | | $ | 8,246,434 | |
| |
| TOTAL MORTGAGE-BACKED OBLIGATIONS | |
(Cost $156,956,493) | | $ | 176,115,977 | |
| |
| | | | | | | | | | |
| Corporate Obligations – 50.9% | |
Aerospace/Defense – 0.4% | |
| Goodrich Corp. | |
| $ 1,000,000 | | | 4.875 | % | | 03/01/20 | | $ | 1,120,864 | |
| United Technologies Corp. | |
| 2,000,000 | | | 5.700 | | | 04/15/40 | | | 2,500,214 | |
| | | | | | | | | | |
| | | | | | | | | 3,621,078 | |
| |
Auto Manufacturers – 0.5% | |
| General Motors Co. | |
| 2,000,000 | | | 5.000 | | | 04/01/35 | | | 2,084,672 | |
| Hyundai Capital America(a) | |
| 2,900,000 | | | 2.550 | | | 02/06/19 | | | 2,942,328 | |
| | | | | | | | | | |
| | | | | | | | | 5,027,000 | |
| |
Beverages – 1.0% | |
| Anheuser-Busch Cos., LLC | |
| 4,609,000 | | | 6.800 | | | 08/20/32 | | | 6,097,919 | |
| Anheuser-Busch InBev Worldwide, Inc. | |
| 500,000 | | | 7.750 | | | 01/15/19 | | | 602,416 | |
| PepsiCo, Inc. | |
| 2,500,000 | | | 4.500 | | | 01/15/20 | | | 2,793,805 | |
| | | | | | | | | | |
| | | | | | | | | 9,494,140 | |
| |
Cable TV – 0.2% | |
| Comcast Corp. | |
| 1,250,000 | | | 6.400 | | | 05/15/38 | | | 1,633,295 | |
| |
Chemicals – 0.6% | |
| FMC Corp. | |
| 3,000,000 | | | 5.200 | | | 12/15/19 | | | 3,317,187 | |
| Sigma-Aldrich Corp. | |
| 2,000,000 | | | 3.375 | | | 11/01/20 | | | 2,094,714 | |
| | | | | | | | | | |
| | | | | | | | | 5,411,901 | |
| |
Commercial Banks – 5.8% | |
| Bank of Nova Scotia(a) | |
| 5,000,000 | | | 1.950 | | | 01/30/17 | | | 5,093,090 | |
| Barclays Bank PLC | |
| 2,000,000 | | | 5.125 | | | 01/08/20 | | | 2,261,554 | |
| Citizens Bank NA | |
| 3,000,000 | | | 2.450 | | | 12/04/19 | | | 3,027,750 | |
| |
| | | | | | | | | | |
Principal
Amount | | Interest Rate | | | Maturity Date | | Value | |
| Corporate Obligations – (continued) | |
Commercial Banks – (continued) | |
| Commonwealth Bank of Australia(a) | |
| $ 3,400,000 | | | 2.250 | % | | 03/16/17 | | $ | 3,478,394 | |
| Credit Suisse New York | |
| 3,000,000 | | | 3.000 | | | 10/29/21 | | | 3,039,315 | |
| HSBC USA, Inc. | |
| 1,052,000 | | | 9.300 | | | 06/01/21 | | | 1,405,216 | |
| KeyBank NA | |
| 5,500,000 | | | 2.250 | | | 03/16/20 | | | 5,519,377 | |
| Lloyds Bank PLC | |
| 1,640,000 | | | 6.375 | | | 01/21/21 | | | 1,971,579 | |
| Manufacturers & Traders Trust Co. | |
| 5,840,000 | | | 2.250 | | | 07/25/19 | | | 5,894,738 | |
| National Bank of Canada | |
| 3,100,000 | | | 1.450 | | | 11/07/17 | | | 3,097,111 | |
| PNC Bank NA | |
| 1,900,000 | | | 6.875 | | | 04/01/18 | | | 2,170,763 | |
| 2,500,000 | | | 2.950 | | | 01/30/23 | | | 2,492,070 | |
| Rabobank Nederland Cooperatieve Centrale Raiffeisen-Boerenleenbank BA/NY | |
| 4,510,000 | | | 2.250 | | | 01/14/19 | | | 4,575,715 | |
| U.S. Bancorp | |
| 2,050,000 | | | 3.600 | | | 09/11/24 | | | 2,125,975 | |
| U.S. Bank NA | |
| 5,380,000 | | | 2.125 | | | 10/28/19 | | | 5,434,795 | |
| Wachovia Bank NA | |
| 2,000,000 | | | 5.000 | | | 08/15/15 | | | 2,025,532 | |
| Wells Fargo Bank NA | |
| 2,000,000 | | | 6.180 | | | 02/15/36 | | | 2,474,912 | |
| | | | | | | | | | |
| | | | | | | | | 56,087,886 | |
| |
Commercial Services – 0.3% | |
| Northwestern University | |
| 1,000,000 | | | 4.643 | | | 12/01/44 | | | 1,139,124 | |
| The ADT Corp. | |
| 2,000,000 | | | 2.250 | | | 07/15/17 | | | 1,990,000 | |
| | | | | | | | | | |
| | | | | | | | | 3,129,124 | |
| |
Communications Equipment – 0.4% | |
| Cisco Systems, Inc. | |
| 2,700,000 | | | 4.450 | | | 01/15/20 | | | 3,011,270 | |
| Juniper Networks, Inc. | |
| 1,220,000 | | | 3.300 | | | 06/15/20 | | | 1,249,731 | |
| | | | | | | | | | |
| | | | | | | | | 4,261,001 | |
| |
Computer Services – 0.0% | |
| International Business Machines Corp. | |
| 300,000 | | | 5.700 | | | 09/14/17 | | | 332,235 | |
| |
Consumer Services – 0.3% | |
| eBay, Inc. | |
| 3,425,000 | | | 2.200 | | | 08/01/19 | | | 3,415,629 | |
| |
| | |
| The accompanying notes are an integral part of these financial statements. | | 15 |
COMMERCE BOND FUND
Schedule of Investments (continued)
April 30, 2015 (Unaudited)
| | | | | | | | | | |
Principal
Amount | | Interest Rate | | | Maturity Date | | Value | |
| Corporate Obligations – (continued) | |
Diversified Manufacturing – 0.6% | |
| GE Capital Trust I(b) | |
| $ 3,525,000 | | | 6.375 | % | | 11/15/67 | | $ | 3,851,063 | |
| Parker-Hannifin Corp. | |
| 2,000,000 | | | 3.500 | | | 09/15/22 | | | 2,113,536 | |
| | | | | | | | | | |
| | | | | | | | | 5,964,599 | |
| |
Electric – 1.5% | |
| Carolina Power & Light Co. | |
| 2,000,000 | | | 2.800 | | | 05/15/22 | | | 2,038,370 | |
| Columbus Southern Power Co. | |
| 2,870,000 | | | 5.850 | | | 10/01/35 | | | 3,561,690 | |
| Duke Energy Corp. | |
| 1,525,000 | | | 5.300 | | | 10/01/15 | | | 1,555,015 | |
| Emerson Electric Co. | |
| 1,000,000 | | | 6.125 | | | 04/15/39 | | | 1,323,430 | |
| PacifiCorp | |
| 2,000,000 | | | 3.850 | | | 06/15/21 | | | 2,167,636 | |
| 1,900,000 | | | 6.100 | | | 08/01/36 | | | 2,507,761 | |
| Southern California Edison Co. | |
| 1,000,000 | | | 5.550 | | | 01/15/37 | | | 1,250,863 | |
| The Connecticut Light & Power Co. | |
| 415,000 | | | 5.650 | | | 05/01/18 | | | 466,864 | |
| | | | | | | | | | |
| | | | | | | | | 14,871,629 | |
| |
Financial – 10.9% | |
| Abbey National Treasury Services PLC | |
| 1,000,000 | | | 3.050 | | | 08/23/18 | | | 1,041,534 | |
| Air Lease Corp. | |
| 3,000,000 | | | 3.375 | | | 01/15/19 | | | 3,082,500 | |
| 1,175,000 | | | 3.875 | | | 04/01/21 | | | 1,213,188 | |
| American Express Credit Corp. | |
| 4,700,000 | | | 2.250 | | | 08/15/19 | | | 4,758,957 | |
| American Honda Finance Corp.(a) | |
| 1,500,000 | | | 1.500 | | | 09/11/17 | | | 1,509,449 | |
| Bank of America Corp. | |
| 2,000,000 | | | 5.700 | | | 01/24/22 | | | 2,317,982 | |
| Bank One Corp.(c) | |
| 1,000,000 | | | 8.530 | | | 03/01/19 | | | 1,208,180 | |
| BlackRock, Inc. | |
| 5,000,000 | | | 4.250 | | | 05/24/21 | | | 5,569,555 | |
| Blackstone Holdings Finance Co. LLC(a) | |
| 1,000,000 | | | 6.625 | | | 08/15/19 | | | 1,171,963 | |
| 3,000,000 | | | 5.875 | | | 03/15/21 | | | 3,493,113 | |
| Caterpillar Financial Services Corp. | |
| 2,300,000 | | | 2.100 | | | 06/09/19 | | | 2,332,326 | |
| 1,855,000 | | | 2.000 | | | 03/05/20 | | | 1,861,572 | |
| CDP Financial, Inc.(a) | |
| 1,000,000 | | | 3.150 | | | 07/24/24 | | | 1,032,695 | |
| Citigroup, Inc. | |
| 2,500,000 | | | 2.500 | | | 07/29/19 | | | 2,523,275 | |
| 3,000,000 | | | 5.500 | | | 09/13/25 | | | 3,357,831 | |
| |
| | | | | | | | | | |
Principal
Amount | | Interest Rate | | | Maturity Date | | Value | |
| Corporate Obligations – (continued) | |
Financial – (continued) | |
| CME Group, Inc. | |
| $ 1,685,000 | | | 3.000 | % | | 09/15/22 | | $ | 1,736,612 | |
| Ford Motor Credit Co. LLC | |
| 3,550,000 | | | 6.625 | | | 08/15/17 | | | 3,937,365 | |
| Franklin Resources, Inc. | |
| 5,000,000 | | | 2.850 | | | 03/30/25 | | | 4,967,520 | |
| General Electric Capital Corp. | |
| 150,000 | | | 0.590 | | | 12/20/16 | | | 150,302 | |
| 2,000,000 | | | 5.625 | | | 05/01/18 | | | 2,248,146 | |
| 1,600,000 | | | 6.250 | | | 12/29/49 | | | 1,800,000 | |
| Invesco Finance PLC | |
| 6,509,000 | | | 3.125 | | | 11/30/22 | | | 6,565,466 | |
| Jefferies Group, Inc. | |
| 1,600,000 | | | 3.875 | | | 11/09/15 | | | 1,619,789 | |
| John Deere Capital Corp. | |
| 2,000,000 | | | 1.125 | | | 06/12/17 | | | 2,008,598 | |
| JPMorgan Chase & Co. | |
| 300,000 | | | 6.000 | | | 01/15/18 | | | 334,256 | |
| 1,600,000 | | | 2.250 | | | 01/23/20 | | | 1,595,518 | |
| 2,000,000 | | | 4.350 | | | 08/15/21 | | | 2,186,578 | |
| 150,000 | | | 1.277 | | | 04/26/23 | | | 147,173 | |
| Legg Mason, Inc. | |
| 3,895,000 | | | 5.625 | | | 01/15/44 | | | 4,465,415 | |
| Merrill Lynch & Co., Inc. | |
| 2,250,000 | | | 6.400 | | | 08/28/17 | | | 2,485,195 | |
| 1,270,000 | | | 6.875 | | | 04/25/18 | | | 1,448,425 | |
| 1,270,000 | | | 6.500 | | | 07/15/18 | | | 1,443,096 | |
| Metropolitan Life Insurance Co.(a) | |
| 3,000,000 | | | 7.700 | | | 11/01/15 | | | 3,093,720 | |
| Morgan Stanley & Co. | |
| 2,500,000 | | | 4.875 | | | 11/01/22 | | | 2,708,310 | |
| 1,875,000 | | | 4.100 | | | 05/22/23 | | | 1,923,360 | |
| National Rural Utilities Cooperative Finance Corp. | |
| 5,000,000 | | | 2.000 | | | 01/27/20 | | | 4,997,095 | |
| Northern Trust Corp. | |
| 3,000,000 | | | 3.950 | | | 10/30/25 | | | 3,187,845 | |
| NYSE Holdings LLC | |
| 1,250,000 | | | 2.000 | | | 10/05/17 | | | 1,267,515 | |
| PNC Financial Services Group, Inc.(b) | |
| 2,500,000 | | | 6.750 | | | 12/31/49 | | | 2,810,000 | |
| TD Ameritrade Holding Corp. | |
| 400,000 | | | 5.600 | | | 12/01/19 | | | 461,145 | |
| The Charles Schwab Corp. | |
| 2,500,000 | | | 1.500 | | | 03/10/18 | | | 2,510,540 | |
| Toyota Motor Credit Corp. | |
| 2,000,000 | | | 1.750 | | | 05/22/17 | | | 2,029,378 | |
| 1,000,000 | | | 2.000 | | | 10/24/18 | | | 1,019,438 | |
| Wells Fargo & Co. | |
| 2,500,000 | | | 4.100 | | | 06/03/26 | | | 2,591,105 | |
| 1,500,000 | | | 4.650 | | | 11/04/44 | | | 1,531,425 | |
| | | | | | | | | | |
| | | | | | | | | 105,744,450 | |
| |
| | |
| 16 | | The accompanying notes are an integral part of these financial statements. |
COMMERCE BOND FUND
| | | | | | | | | | |
Principal
Amount | | Interest Rate | | | Maturity Date | | Value | |
| Corporate Obligations – (continued) | |
Food – 0.7% | |
| Campbell Soup Co. | |
| $ 235,000 | | | 3.050 | % | | 07/15/17 | | $ | 243,876 | |
| Danone SA(a) | |
| 2,700,000 | | | 3.000 | | | 06/15/22 | | | 2,712,709 | |
| Pernod-Ricard SA(a) | |
| 3,500,000 | | | 5.750 | | | 04/07/21 | | | 4,036,522 | |
| | | | | | | | | | |
| | | | | | | | | 6,993,107 | |
| |
Hardware – 0.5% | |
| Intel Corp. | |
| 400,000 | | | 1.350 | | | 12/15/17 | | | 402,071 | |
| Xilinx, Inc. | |
| 4,425,000 | | | 3.000 | | | 03/15/21 | | | 4,556,392 | |
| | | | | | | | | | |
| | | | | | | | | 4,958,463 | |
| |
Healthcare-Products – 0.6% | |
| Baxter International, Inc. | |
| 2,650,000 | | | 5.375 | | | 06/01/18 | | | 2,940,448 | |
| Danaher Corp. | |
| 1,000,000 | | | 3.900 | | | 06/23/21 | | | 1,093,183 | |
| Medtronic, Inc.(a) | |
| 1,875,000 | | | 3.150 | | | 03/15/22 | | | 1,936,789 | |
| | | | | | | | | | |
| | | | | | | | | 5,970,420 | |
| |
Health Technology – 0.5% | |
| Amgen, Inc. | |
| 400,000 | | | 2.500 | | | 11/15/16 | | | 409,025 | |
| 1,295,000 | | | 6.400 | | | 02/01/39 | | | 1,631,506 | |
| Becton, Dickinson & Co. | |
| 2,000,000 | | | 3.250 | | | 11/12/20 | | | 2,075,552 | |
| Gilead Sciences, Inc. | |
| 300,000 | | | 3.050 | | | 12/01/16 | | | 309,959 | |
| | | | | | | | | | |
| | | | | | | | | 4,426,042 | |
| |
Healthcare-Services – 0.9% | |
| Laboratory Corp. of America Holdings | |
| 300,000 | | | 5.625 | | | 12/15/15 | | | 308,468 | |
| 100,000 | | | 3.125 | | | 05/15/16 | | | 102,071 | |
| Mayo Clinic Rochester | |
| 2,600,000 | | | 3.774 | | | 11/15/43 | | | 2,545,346 | |
| Mission Health System, Inc. | |
| 5,710,000 | | | 3.033 | | | 10/01/22 | | | 5,593,533 | |
| UnitedHealth Group, Inc. | |
| 250,000 | | | 1.400 | | | 10/15/17 | | | 252,299 | |
| | | | | | | | | | |
| | | | | | | | | 8,801,717 | |
| |
Household Products – 0.4% | |
| Church & Dwight Co., Inc. | |
| 2,000,000 | | | 2.875 | | | 10/01/22 | | | 1,985,336 | |
| Leggett & Platt, Inc. | |
| 2,200,000 | | | 3.800 | | | 11/15/24 | | | 2,272,070 | |
| | | | | | | | | | |
| | | | | | | | | 4,257,406 | |
| |
| | | | | | | | | | |
Principal
Amount | | Interest Rate | | | Maturity Date | | Value | |
| Corporate Obligations – (continued) | |
Industrial – 0.7% | |
| Joy Global, Inc. | |
| $ 2,860,000 | | | 5.125 | % | | 10/15/21 | | $ | 3,197,208 | |
| Receipts on Corporate Securities Trust NSC-1998-1 | |
| 874,243 | | | 6.375 | | | 05/15/17 | | | 905,990 | |
| Rockwell Automation, Inc. | |
| 2,850,000 | | | 2.050 | | | 03/01/20 | | | 2,866,333 | |
| | | | | | | | | | |
| | | | | | | | | 6,969,531 | |
| |
Insurance – 4.4% | |
| Aegon NV | | | | | | | | | | |
| 2,650,000 | | | 4.625 | | | 12/01/15 | | | 2,708,946 | |
| Assured Guaranty US Holdings, Inc. | |
| 1,500,000 | | | 5.000 | | | 07/01/24 | | | 1,583,826 | |
| AXA Equitable Life Insurance Co.(a) | |
| 6,220,000 | | | 7.700 | | | 12/01/15 | | | 6,451,838 | |
| Berkshire Hathaway Finance Corp. | |
| 5,000,000 | | | 3.000 | | | 05/15/22 | | | 5,177,885 | |
| CNA Financial Corp. | |
| 2,215,000 | | | 7.350 | | | 11/15/19 | | | 2,649,663 | |
| Genworth Financial, Inc. | |
| 738,000 | | | 8.625 | | | 12/15/16 | | | 795,195 | |
| 2,000,000 | | | 7.625 | | | 09/24/21 | | | 2,120,000 | |
| Liberty Mutual Group, Inc.(a) | |
| 1,110,000 | | | 4.250 | | | 06/15/23 | | | 1,175,079 | |
| MassMutual Global Funding II(a) | |
| 2,000,000 | | | 2.100 | | | 08/02/18 | | | 2,037,254 | |
| MetLife, Inc. | |
| 2,055,000 | | | 10.750 | | | 08/01/69 | | | 3,442,125 | |
| PartnerRe Finance B LLC | |
| 525,000 | | | 5.500 | | | 06/01/20 | | | 594,429 | |
| Principal Life Global Funding II(a) | |
| 2,000,000 | | | 2.200 | | | 04/08/20 | | | 2,007,648 | |
| Prudential Financial, Inc.(b) | |
| 2,000,000 | | | 5.875 | | | 09/15/42 | | | 2,170,000 | |
| Reinsurance Group of America, Inc. | |
| 2,000,000 | | | 6.450 | | | 11/15/19 | | | 2,330,350 | |
| 2,100,000 | | | 5.000 | | | 06/01/21 | �� | | 2,336,939 | |
| Sirius International Group Ltd.(a) | |
| 1,269,000 | | | 6.375 | | | 03/20/17 | | | 1,359,617 | |
| Symetra Financial Corp.(a) | |
| 4,235,000 | | | 6.125 | | | 04/01/16 | | | 4,388,142 | |
| | | | | | | | | | |
| | | | | | | | | 43,328,936 | |
| |
Media – 0.7% | |
| 21st Century Fox America, Inc. | |
| 1,000,000 | | | 7.125 | | | 04/08/28 | | | 1,273,727 | |
| CBS Corp. | |
| 2,500,000 | | | 7.875 | | | 09/01/23 | | | 3,208,283 | |
| Scripps Networks Interactive, Inc. | |
| 2,000,000 | | | 2.750 | | | 11/15/19 | | | 2,010,632 | |
| | | | | | | | | | |
| | | | | | | | | 6,492,642 | |
| |
| | |
| The accompanying notes are an integral part of these financial statements. | | 17 |
COMMERCE BOND FUND
Schedule of Investments (continued)
April 30, 2015 (Unaudited)
| | | | | | | | | | |
Principal
Amount | | Interest Rate | | | Maturity Date | | Value | |
| Corporate Obligations – (continued) | |
Metals & Mining – 1.6% | |
| Freeport-McMoRan Copper & Gold, Inc. | |
| $ 1,000,000 | | | 2.375 | % | | 03/15/18 | | $ | 997,274 | |
| Glencore Funding LLC(a) | |
| 3,000,000 | | | 2.500 | | | 01/15/19 | | | 3,000,717 | |
| Rio Tinto Finance USA Ltd. | |
| 3,000,000 | | | 5.200 | | | 11/02/40 | | | 3,251,631 | |
| Rio Tinto Finance USA PLC | |
| 3,000,000 | | | 1.625 | | | 08/21/17 | | | 3,013,950 | |
| The Timken Co. | |
| 2,000,000 | | | 3.875 | (a) | | 09/01/24 | | | 2,022,768 | |
| 2,750,000 | | | 6.875 | | | 05/08/28 | | | 3,410,594 | |
| | | | | | | | | | |
| | | | | | | | | 15,696,934 | |
| |
Oil & Gas – 2.9% | |
| Apache Corp. | |
| 675,000 | | | 5.625 | | | 01/15/17 | | | 723,306 | |
| 2,835,000 | | | 5.100 | | | 09/01/40 | | | 2,971,191 | |
| 1,360,000 | | | 7.375 | | | 08/15/47 | | | 1,822,680 | |
| BG Energy Capital PLC(a) | |
| 3,000,000 | | | 2.875 | | | 10/15/16 | | | 3,076,614 | |
| BP Capital Markets PLC | |
| 6,000,000 | | | 1.375 | | | 11/06/17 | | | 6,017,238 | |
| Energen Corp. | |
| 2,000,000 | | | 4.625 | | | 09/01/21 | | | 1,886,638 | |
| Hess Corp. | |
| 2,115,000 | | | 7.875 | | | 10/01/29 | | | 2,765,851 | |
| Phillips 66 | |
| 3,000,000 | | | 4.650 | | | 11/15/34 | | | 3,139,179 | |
| Rowan Cos., Inc. | |
| 1,000,000 | | | 4.750 | | | 01/15/24 | | | 946,928 | |
| Statoil ASA | |
| 2,360,000 | | | 2.250 | | | 11/08/19 | | | 2,402,874 | |
| Tosco Corp. | |
| 2,095,000 | | | 8.125 | | | 02/15/30 | | | 3,020,751 | |
| | | | | | | | | | |
| | | | | | | | | 28,773,250 | |
| |
Pharmaceuticals – 1.8% | |
| Actavis Funding SCS | |
| 3,000,000 | | | 2.450 | | | 06/15/19 | | | 3,007,830 | |
| AstraZeneca PLC | |
| 500,000 | | | 5.900 | | | 09/15/17 | | | 554,686 | |
| 3,000,000 | | | 1.950 | | | 09/18/19 | | | 3,021,330 | |
| Bayer US Finance LLC(a) | |
| 2,000,000 | | | 2.375 | | | 10/08/19 | | | 2,029,668 | |
| Johnson & Johnson | |
| 400,000 | | | 5.150 | | | 07/15/18 | | | 450,114 | |
| McKesson Corp. | |
| 225,000 | | | 3.250 | | | 03/01/16 | | | 229,502 | |
| Mylan, Inc.(a) | |
| 3,135,000 | | | 7.875 | | | 07/15/20 | | | 3,282,674 | |
| Pfizer, Inc. | |
| 2,900,000 | | | 7.200 | | | 03/15/39 | | | 4,140,983 | |
| Pharmacia Corp. | |
| 475,000 | | | 6.500 | % | | 12/01/18 | | | 553,250 | |
| | | | | | | | | | |
| | | | | | | | | 17,270,037 | |
| |
| | | | | | | | | | |
Principal
Amount | | Interest Rate | | | Maturity Date | | Value | |
| Corporate Obligations – (continued) | |
Pipelines – 1.9% | |
| Buckeye Partners LP | |
| $ 2,000,000 | | | 4.150 | | | 07/01/23 | | $ | 1,988,852 | |
| DCP Midstream LLC | |
| 3,397,000 | | | 8.125 | | | 08/16/30 | | | 3,627,340 | |
| DCP Midstream Operating LP | |
| 3,000,000 | | | 3.875 | | | 03/15/23 | | | 2,759,190 | |
| Energy Transfer Partners LP | |
| 3,000,000 | | | 4.900 | | | 03/15/35 | | | 2,928,822 | |
| ONEOK Partners LP | |
| 875,000 | | | 8.625 | | | 03/01/19 | | | 1,048,534 | |
| Tennessee Gas Pipeline Co. LLC | |
| 628,000 | | | 8.375 | | | 06/15/32 | | | 791,548 | |
| 1,450,000 | | | 7.625 | | | 04/01/37 | | | 1,783,895 | |
| Williams Partners LP | |
| 3,390,000 | | | 4.500 | | | 11/15/23 | | | 3,526,522 | |
| | | | | | | | | | |
| | | | | | | | | 18,454,703 | |
| |
Process Industries – 0.4% | |
| International Paper Co. | |
| 2,925,000 | | | 8.700 | | | 06/15/38 | | | 4,195,152 | |
| |
Real Estate – 3.6% | |
| Brookfield Asset Management, Inc. | |
| 2,000,000 | | | 4.000 | | | 01/15/25 | | | 2,000,568 | |
| Columbia Property Trust Operating Partnership LP | |
| 2,000,000 | | | 4.150 | | | 04/01/25 | | | 2,048,618 | |
| Hospitality Properties Trust | |
| 1,240,000 | | | 6.300 | | | 06/15/16 | | | 1,275,599 | |
| 825,000 | | | 5.000 | | | 08/15/22 | | | 879,009 | |
| 1,685,000 | | | 4.650 | | | 03/15/24 | | | 1,731,658 | |
| Kimco Realty Corp. | |
| 1,345,000 | | | 3.125 | | | 06/01/23 | | | 1,328,808 | |
| Mid-America Apartments LP | |
| 1,860,000 | | | 4.300 | | | 10/15/23 | | | 1,968,527 | |
| National Retail Properties, Inc. | |
| 1,000,000 | | | 3.900 | | | 06/15/24 | | | 1,029,033 | |
| Piedmont Operating Partnership LP | |
| 1,290,000 | | | 3.400 | | | 06/01/23 | | | 1,250,385 | |
| 2,800,000 | | | 4.450 | | | 03/15/24 | | | 2,912,577 | |
| Post Apartment Homes LP | |
| 1,500,000 | | | 3.375 | | | 12/01/22 | | | 1,499,889 | |
| Select Income REIT | |
| 3,000,000 | | | 4.150 | | | 02/01/22 | | | 3,026,106 | |
| Simon Property Group LP | |
| 2,815,000 | | | 3.750 | | | 02/01/24 | | | 2,962,269 | |
| UDR, Inc. | |
| 2,640,000 | | | 3.750 | | | 07/01/24 | | | 2,707,233 | |
| Ventas Realty LP | |
| 2,910,000 | | | 3.500 | % | | 02/01/25 | | | 2,898,942 | |
| Washington Real Estate Investment Trust | |
| 1,580,000 | | | 3.950 | | | 10/15/22 | | | 1,595,236 | |
| WP Carey, Inc. | |
| 2,000,000 | | | 4.600 | | | 04/01/24 | | | 2,069,922 | |
| 1,575,000 | | | 4.000 | | | 02/01/25 | | | 1,556,657 | |
| | | | | | | | | | |
| | | | | | | | | 34,741,036 | |
| |
| | |
| 18 | | The accompanying notes are an integral part of these financial statements. |
COMMERCE BOND FUND
| | | | | | | | | | |
Principal
Amount | | Interest Rate | | | Maturity Date | | Value | |
| Corporate Obligations – (continued) | |
Retail – 0.7% | |
| CVS Pass-Through Trust(a) | |
| $ 3,222,724 | | | 7.507 | | | 01/10/32 | | $ | 4,145,837 | |
| O’Reilly Automotive, Inc. | |
| 1,000,000 | | | 3.800 | | | 09/01/22 | | | 1,037,326 | |
| Wal-Mart Stores, Inc. | |
| 1,250,000 | | | 6.200 | | | 04/15/38 | | | 1,664,759 | |
| | | | | | | | | | |
| | | | | | | | | 6,847,922 | |
| |
Software – 0.3% | |
| Adobe Systems, Inc. | |
| 563,000 | | | 4.750 | | | 02/01/20 | | | 627,989 | |
| Oracle Corp. | |
| 2,685,000 | | | 2.250 | | | 10/08/19 | | | 2,727,815 | |
| | | | | | | | | | |
| | | | | | | | | 3,355,804 | |
| |
Sovereign Agency – 0.2% | |
| Resolution Funding Corp. | |
| 1,500,000 | | | 8.125 | | | 10/15/19 | | | 1,924,782 | |
| |
Telecommunications – 1.7% | |
| AT&T, Inc. | | | | | | | | | | |
| 200,000 | | | 5.500 | | | 02/01/18 | | | 220,284 | |
| 4,000,000 | | | 4.800 | | | 06/15/44 | | | 3,943,792 | |
| Bellsouth Capital Funding Corp. | |
| 2,465,000 | | | 7.875 | | | 02/15/30 | | | 3,285,446 | |
| Orange SA | |
| 300,000 | | | 2.125 | | | 09/16/15 | | | 301,527 | |
| SBA Tower Trust(a) | |
| 3,240,000 | | | 5.101 | | | 04/15/42 | | | 3,369,645 | |
| Verizon Communications, Inc. | |
| 450,000 | | | 3.500 | | | 11/01/21 | | | 468,499 | |
| 4,630,000 | | | 4.150 | | | 03/15/24 | | | 4,899,448 | |
| | | | | | | | | | |
| | | | | | | | | 16,488,641 | |
| |
Transportation – 0.6% | |
| FedEx Corp. | |
| 2,475,000 | | | 3.200 | | | 02/01/25 | | | 2,471,627 | |
| PACCAR Financial Corp. | |
| 1,000,000 | | | 1.100 | | | 06/06/17 | | | 1,002,924 | |
| Union Pacific Corp. | |
| 500,000 | | | 4.750 | | | 09/15/41 | | | 560,870 | |
| 1,220,000 | | | 4.750 | | | 12/15/43 | | | 1,393,640 | |
| | | | | | | | | | |
| | | | | | | | | 5,429,061 | |
| |
Trucking & Leasing(a) – 0.2% | |
| Penske Truck Leasing Co. LP/PTL Finance Corp. | |
| 2,000,000 | | | 3.125 | % | | 05/11/15 | | | 2,000,784 | |
| |
Utilities – 2.1% | |
| Arizona Public Service Co. | |
| 2,150,000 | | | 6.875 | | | 08/01/36 | | | 2,889,925 | |
| Commonwealth Edison Co. | |
| 1,645,000 | | | 6.450 | | | 01/15/38 | | | 2,261,844 | |
| Entergy Louisiana LLC | |
| 3,000,000 | | | 3.780 | | | 04/01/25 | | | 3,128,625 | |
| | | | | | | | | | |
Principal
Amount | | Interest Rate | | | Maturity Date | | Value | |
| Corporate Obligations – (continued) | |
Utilities – (continued) | | | | |
| Gulf Power Co. | |
| $ 1,250,000 | | | 4.550 | | | 10/01/44 | | $ | 1,346,769 | |
| KeySpan Corp. | |
| 3,375,000 | | | 8.000 | | | 11/15/30 | | | 4,747,612 | |
| Louisville Gas & Electric Co. | |
| 1,850,000 | | | 4.650 | | | 11/15/43 | | | 2,102,140 | |
| Pacific Gas & Electric Co. | |
| 2,000,000 | | | 6.350 | | | 02/15/38 | | | 2,633,220 | |
| PPL Electric Utilities Corp. | |
| 1,025,000 | | | 4.750 | | | 07/15/43 | | | 1,186,849 | |
| | | | | | | | | | |
| | | | | | | | | 20,296,984 | |
| |
Yankee – 1.0% | |
| Canadian National Railway Co. | |
| 1,190,000 | | | 6.200 | | | 06/01/36 | | | 1,584,749 | |
| UBS AG | |
| 7,335,000 | | | 7.375 | | | 06/15/17 | | | 8,176,794 | |
| | | | | | | | | | |
| | | | | | | | | 9,761,543 | |
| |
| TOTAL CORPORATE OBLIGATIONS | |
(Cost $483,290,628) | | $ | 496,428,864 | |
| |
| | | | | | | | | | |
| Foreign Debt Obligation – 0.0% | |
Sovereign – 0.0% | |
| Ontario Province of Canada | |
| $ 245,000 | | | 1.650 | % | | 09/27/19 | | $ | 246,033 | |
(Cost $236,971) | | | | | | | |
| |
| | | | | | | | | | |
| U.S. Government Agency Obligations – 3.9% | |
| FFCB | |
| $ 150,000 | | | 1.290 | % | | 09/25/18 | | $ | 149,763 | |
| 350,000 | | | 1.690 | | | 08/28/19 | | | 348,431 | |
| 350,000 | | | 1.420 | | | 10/22/19 | | | 347,494 | |
| 2,860,000 | | | 5.190 | | | 04/22/21 | | | 3,390,653 | |
| FHLB | |
| 2,650,000 | | | 7.125 | | | 02/15/30 | | | 3,949,483 | |
| FHLMC | |
| 2,500,000 | | | 5.000 | | | 02/16/17 | | | 2,693,437 | |
| 5,500,000 | | | 5.500 | | | 08/23/17 | | | 6,091,701 | |
| 3,000,000 | | | 4.875 | | | 06/13/18 | | | 3,354,045 | |
| FNMA | |
| 4,500,000 | | | 5.000 | % | | 02/13/17 | | | 4,847,449 | |
| 3,000,000 | | | 5.000 | | | 05/11/17 | | | 3,257,664 | |
| 6,000,000 | | | 5.375 | | | 06/12/17 | | | 6,580,074 | |
| Tennessee Valley Authority | |
| 1,786,505 | | | 4.929 | | | 01/15/21 | | | 1,962,922 | |
| 980,563 | | | 5.131 | | | 01/15/21 | | | 1,078,619 | |
| |
| TOTAL U.S. GOVERNMENT AGENCY OBLIGATIONS | |
(Cost $37,874,202) | | $ | 38,051,735 | |
| |
| | |
| The accompanying notes are an integral part of these financial statements. | | 19 |
COMMERCE BOND FUND
Schedule of Investments (continued)
April 30, 2015 (Unaudited)
| | | | | | | | | | |
Principal
Amount | | Interest Rate | | | Maturity Date | | Value | |
| U.S. Treasury Obligations – 3.8% | |
| United States Treasury Bond | |
| $ 3,000,000 | | | 3.500 | % | | 02/15/39 | | $ | 3,431,718 | |
| United States Treasury Inflation Protected Securities | |
| 299,648 | | | 0.125 | | | 04/15/17 | | | 306,039 | |
| 365,494 | | | 0.125 | | | 04/15/18 | | | 374,203 | |
| United States Treasury Notes | |
| 5,000,000 | | | 2.750 | | | 11/30/16 | | | 5,178,515 | |
| 10,000,000 | | | 0.750 | | | 12/31/17 | | | 9,977,340 | |
| 6,000,000 | | | 1.375 | | | 09/30/18 | | | 6,060,000 | |
| 8,000,000 | | | 2.125 | | | 08/31/20 | | | 8,242,496 | |
| 3,000,000 | | | 1.750 | | | 10/31/20 | | | 3,028,359 | |
| |
| TOTAL U.S. TREASURY OBLIGATIONS | |
(Cost $35,187,321) | | $ | 36,598,670 | |
| |
| | | | | | | | | | |
| Shares | | Description | | | | | Value | |
| Investment Company – 0.5% | |
Vanguard Long-Term Investment Grade Fund Admiral Shares | |
| 506,527 | | | | | | | | $ | 5,374,254 | |
(Cost $3,961,043) | | | | | | | |
| |
| | | | | | | | | | |
Principal Amount | | Interest Rate | | | Maturity Date | | Value | |
| Short-term Investments(e) – 0.8% | |
Repurchase Agreement – 0.8% | |
| State Street Bank & Trust Co. | |
| $ 7,637,000 | | | 0.000 | % | | 05/01/15 | | $ | 7,637,000 | |
Maturity Value: $7,637,000 | | | | |
(Cost $7,637,000) | | | | | | | |
| |
| TOTAL INVESTMENTS – 99.8% | |
(Cost $923,178,089) | | | | | $ | 972,757,121 | |
| |
OTHER ASSETS IN EXCESS OF LIABILITIES – 0.2% | | | 1,467,563 | |
| |
| NET ASSETS – 100.0% | | $ | 974,224,684 | |
| |
| | |
| The percentage shown for each investment category reflects the value of investments in that category as a percentage of net assets. |
| |
| (a) | | Exempt from registration under Rule 144A of the Securities Act of 1933. Under procedures approved by the Board of Trustees, such securities have been determined to be liquid by the Investment Adviser and may be resold, normally to qualified institutional buyers in transactions exempt from registration. Total market value of Rule 144A securities amounted to $162,841,069, which represents approximately 16.7% of net assets as of April 30, 2015. |
| |
| (b) | | Variable rate security. The interest rate shown reflects the rate as of April 30, 2015. |
| | |
| |
| (c) | | Step-up Bond. Coupon rate increases in increments to maturity. Rate disclosed is as of April 30, 2015. Maturity date disclosed is the ultimate maturity. |
| |
| (d) | | Issued with a zero coupon. Income is recognized through the accretion of discount. |
| |
| (e) | | Repurchase agreement was entered into on April 30, 2015. This agreement was fully collateralized by $5,450,000 U.S. Treasury Bond, 8.000%, due 11/15/21 with a market value of $7,795,168. |
| | |
|
| Investment Abbreviations: |
| AGM | | —Insured by Assured Guaranty Municipal Corp. |
| AMT | | —Alternative Minimum Tax |
| FFCB | | —Federal Farm Credit Bank |
| FHA | | —Insured by Federal Housing Administration |
| FHLB | | —Federal Home Loan Bank |
| FHLMC | | —Federal Home Loan Mortgage Corp. |
| FNIC | | —Financial Network Investment Corporation |
| FNMA | | —Federal National Mortgage Association |
| GNMA | | —Government National Mortgage Association |
| GO | | —General Obligation |
| PAC | | —Planned Amortization Class |
| REIT | | —Real Estate Investment Trust |
| REMIC | | —Real Estate Mortgage Investment Conduit |
|
PORTFOLIO COMPOSITION
| | | | | | | | |
| | | AS OF 4/30/15 | | | AS OF 10/31/14 | |
| |
Corporate Obligations | | | 50.9 | % | | | 51.9 | % |
Asset-Backed Securities | | | 12.0 | | | | 9.2 | |
Collateralized Mortgage Obligations | | | 11.1 | | | | 12.3 | |
Municipal Bond Obligations | | | 9.8 | | | | 11.1 | |
Commercial Mortgage Obligations | | | 6.1 | | | | 4.8 | |
U.S. Government Agency Obligations | | | 3.9 | | | | 4.5 | |
U.S. Treasury Obligations | | | 3.8 | | | | 1.4 | |
Mortgage-Backed Pass-Through Obligations | | | 0.9 | | | | 0.8 | |
Investment Company | | | 0.5 | | | | 0.6 | |
Foreign Debt Obligation | | | 0.0 | | | | 0.1 | |
Short-term Investment | | | 0.8 | | | | 2.8 | |
| |
| TOTAL INVESTMENTS | | | 99.8 | % | | | 99.5 | % |
| |
The percentage shown for each investment category reflects the value of investments in that category as a percentage of net assets. Underlying investment categories of investment companies held by the Fund are not reflected in the table above. Consequently, the Fund’s overall investment category allocations may differ from the percentages contained in the table above.
The Fund is actively managed and, as such, its composition may differ over time.
| | |
| 20 | | The accompanying notes are an integral part of these financial statements. |
COMMERCE SHORT-TERM GOVERNMENT FUND
Schedule of Investments
April 30, 2015 (Unaudited)
| | | | | | | | | | |
Principal Amount | | Interest Rate | | | Maturity Date | | Value | |
| Asset-Backed Securities – 2.8% | |
Commercial – 0.0% | |
| Small Business Administration Series 2006-P10B, Class 1 | |
| $ 78,371 | | | 5.681 | % | | 08/10/16 | | $ | 81,189 | |
| |
Home Equity(a) – 2.8% | |
| Argent Securities, Inc. Series 2004-W5, Class AV3B | |
| 1,756,259 | | | 1.074 | | | 04/25/34 | | | 1,704,385 | |
| Bear Stearns Asset Backed Securities Trust Series 2004-SD4, Class A1 | |
| 1,038,434 | | | 1.074 | | | 08/25/44 | | | 1,048,620 | |
| Countrywide Asset-Backed Certificates Series 2004-6, Class 2A4 | |
| 516,654 | | | 1.074 | | | 11/25/34 | | | 497,985 | |
| Lehman XS Trust Series 2005-7N, Class 1A1A | |
| 225,073 | | | 0.444 | | | 12/25/35 | | | 196,655 | |
| Morgan Stanley Capital, Inc. Series 2002-HE3, Class A2 | |
| 453,333 | | | 1.254 | | | 03/25/33 | | | 438,871 | |
| Terwin Mortgage Trust Series 2004-7HE, Class A3(b) | |
| 241,005 | | | 1.574 | | | 07/25/34 | | | 225,923 | |
| Terwin Mortgage Trust Series 2004-9HE, Class A1(b) | |
| 186,125 | | | 0.974 | | | 09/25/34 | | | 174,568 | |
| Wells Fargo Home Equity Trust Mortgage Pass-Through Certificates Series 2004-1, Class 1A | |
| 374,208 | | | 0.481 | | | 04/25/34 | | | 356,570 | |
| | | | | | | | | | |
| | | | | | | | | 4,643,577 | |
| |
| TOTAL ASSET-BACKED SECURITIES | |
(Cost $4,215,768) | | $ | 4,724,766 | |
| |
| | | | | | | | | | |
| Mortgage-Backed Obligations – 15.5% | |
Collateralized Mortgage Obligations – 11.5% | |
| Adjustable Rate Mortgage Trust Series 2004-5, Class 3A1(a) | |
| $ 248,806 | | | 2.505 | % | | 04/25/35 | | $ | 248,344 | |
| American Home Mortgage Investment Trust Series 2004-3, Class 6A4(c) | |
| 16,614 | | | 5.010 | | | 10/25/34 | | | 16,611 | |
| Banc of America Alternative Loan Trust Series 2004-1, Class 1A1 | |
| 232,170 | | | 6.000 | | | 02/25/34 | | | 246,860 | |
| Banc of America Mortgage Securities, Inc. Series 2003-J, Class 2A1(a) | |
| 404,434 | | | 2.792 | | | 11/25/33 | | | 404,583 | |
| Bank of America Funding Corp. Series 2004-A, Class 1A3(a) | |
| 18,121 | | | 2.621 | | | 09/20/34 | | | 17,962 | |
| Bear Stearns Adjustable Rate Mortgage Trust Series 2004-9, Class 24A1(a) | |
| 147,762 | | | 3.377 | | | 11/25/34 | | | 143,762 | |
| Citigroup Mortgage Loan Trust, Inc. Series 2004-HYB3, Class 1A(a) | |
| 119,756 | | | 2.578 | | | 09/25/34 | | | 119,897 | |
| Countrywide Alternative Loan Trust Series 2004-29CB, Class A7 | |
| 135,256 | | | 5.375 | | | 01/25/35 | | | 137,714 | |
| |
| | | | | | | | | | |
Principal Amount | | Interest Rate | | | Maturity Date | | Value | |
| Mortgage-Backed Obligations – (continued) | |
Collateralized Mortgage Obligations – (continued) | |
| Countrywide Home Loans Trust Series 2003-J6, Class 1A1 | |
| $ 35,131 | | | 5.500 | % | | 08/25/33 | | $ | 36,743 | |
| Countrywide Home Loans, Inc. Series 2002-35, Class 3A1 | |
| 55,053 | | | 5.000 | | | 02/25/18 | | | 55,252 | |
| Countrywide Home Loans, Inc. Series 2003-HYB3, Class 7A1(a) | |
| 197,969 | | | 2.399 | | | 11/19/33 | | | 194,066 | |
| FHLMC REMIC PAC Series 023, Class PK | |
| 184,423 | | | 6.000 | | | 11/25/23 | | | 203,621 | |
| FHLMC REMIC PAC Series 159, Class H | |
| 12,246 | | | 4.500 | | | 09/15/21 | | | 12,854 | |
| FHLMC REMIC PAC Series 2022, Class PE | |
| 36,396 | | | 6.500 | | | 01/15/28 | | | 42,254 | |
| FHLMC REMIC PAC Series 2109, Class PE | |
| 76,529 | | | 6.000 | | | 12/15/28 | | | 87,461 | |
| FHLMC REMIC PAC Series 2345, Class PQ | |
| 3,930 | | | 6.500 | | | 08/15/16 | | | 4,047 | |
| FHLMC REMIC PAC Series 3841, Class ED | |
| 11,823 | | | 3.000 | | | 07/15/38 | | | 11,835 | |
| FHLMC REMIC Series 2830, Class DA | |
| 28,687 | | | 5.000 | | | 07/15/19 | | | 29,751 | |
| FHLMC REMIC Series 2972, Class CA | |
| 52,988 | | | 4.500 | | | 05/15/20 | | | 54,776 | |
| FHLMC REMIC Series 3634, Class BJ | |
| 22,199 | | | 3.000 | | | 08/15/27 | | | 22,258 | |
| FHLMC REMIC Series 3795, Class KA | |
| 801,584 | | | 4.000 | | | 11/15/24 | | | 822,464 | |
| FHLMC REMIC Series 3816, Class HA | |
| 1,074,590 | | | 3.500 | | | 11/15/25 | | | 1,142,927 | |
| FHLMC REMIC Series 3968, Class AT | |
| 228,882 | | | 3.500 | | | 03/15/38 | | | 233,733 | |
| First Horizon Mortgage Pass-Through Trust Series 2003-AR3, Class 2A1(a) | |
| 722,139 | | | 2.590 | | | 09/25/33 | | | 720,879 | |
| FNMA REMIC PAC Series 1992, Class 89 Principal-Only Stripped Security(d) | |
| 14,680 | | | 0.000 | | | 06/25/22 | | | 14,559 | |
| FNMA REMIC PAC Series 1992-129, Class L | |
| 72,370 | | | 6.000 | | | 07/25/22 | | | 78,455 | |
| FNMA REMIC PAC Series 1998-36, Class J | |
| 8,589 | | | 6.000 | | | 07/18/28 | | | 8,721 | |
| FNMA REMIC PAC Series 2001-71, Class MB | |
| 24,723 | | | 6.000 | | | 12/25/16 | | | 25,439 | |
| FNMA REMIC PAC Series 2003-117, Class KB | |
| 556,000 | | | 6.000 | | | 12/25/33 | | | 637,842 | |
| FNMA REMIC PAC Series 2003-14, Class AP | |
| 168,787 | | | 4.000 | | | 03/25/33 | | | 178,389 | |
| FNMA REMIC Series 1991-137, Class H | |
| 31,162 | | | 7.000 | | | 10/25/21 | | | 34,532 | |
| FNMA REMIC Series 1993-182, Class FA(a) | |
| 13,655 | | | 1.250 | | | 09/25/23 | | | 13,751 | |
| |
| | |
| The accompanying notes are an integral part of these financial statements. | | 21 |
COMMERCE SHORT-TERM GOVERNMENT FUND
Schedule of Investments (continued)
April 30, 2015 (Unaudited)
| | | | | | | | | | |
Principal Amount | | Interest Rate | | | Maturity Date | | Value | |
| Mortgage-Backed Obligations – (continued) | |
Collateralized Mortgage Obligations – (continued) | |
| FNMA REMIC Series 2010-135, Class EA | |
| $ 612,933 | | | 3.000 | % | | 01/25/40 | | $ | 636,885 | |
| FNMA Series 2003-W17, Class 1A6 | |
| 631 | | | 5.310 | | | 08/25/33 | | | 631 | |
| GNMA REMIC Series 2013-23, Class MC | |
| 1,457,495 | | | 1.500 | | | 01/20/42 | | | 1,436,532 | |
| GNMA Series 2001-53, Class F(a) | |
| 1,566 | | | 0.531 | | | 10/20/31 | | | 1,566 | |
| GNMA Series 2009-65, Class AF | |
| 261,516 | | | 4.000 | | | 07/20/39 | | | 279,806 | |
| GNMA Series 2010-115, Class QJ | |
| 385,339 | | | 3.500 | | | 11/20/38 | | | 402,510 | |
| GNMA Series 2010-14, Class PA | |
| 188,542 | | | 3.000 | | | 02/20/40 | | | 193,212 | |
| GNMA Series 2010-89, Class GL | |
| 972,791 | | | 4.000 | | | 05/20/39 | | | 1,012,524 | |
| GSR Mortgage Loan Trust Series 2003-6F, Class A1 | |
| 115,346 | | | 3.000 | | | 09/25/32 | | | 113,493 | |
| GSR Mortgage Loan Trust Series 2004-6F, Class 5A1 | |
| 111,407 | | | 5.500 | | | 03/25/19 | | | 114,068 | |
| GSR Mortgage Loan Trust Series 2005-AR3, Class 2A1(a) | |
| 455,710 | | | 0.614 | | | 05/25/35 | | | 415,924 | |
| GSR Mortgage Loan Trust Series 2006-AR1, Class 2A4(a) | |
| 1,032,621 | | | 2.710 | | | 01/25/36 | | | 956,404 | |
| Impac CMB Trust Series 2003-2F, Class A(a) | |
| 428,886 | | | 5.730 | | | 01/25/33 | | | 447,308 | |
| Impac CMB Trust Series 2003-8, Class 2A1(a) | |
| 172,321 | | | 1.074 | | | 10/25/33 | | | 166,196 | |
| Impac CMB Trust Series 2004-7, Class 1A1(a) | |
| 141,789 | | | 0.914 | | | 11/25/34 | | | 134,515 | |
| Impac CMB Trust Series 2005-2, Class 2A2(a) | |
| 177,459 | | | 0.974 | | | 04/25/35 | | | 161,886 | |
| Impac Secured Assets Corp. Series 2006-1, Class 2A1(a) | |
| 1,004,566 | | | 0.524 | | | 05/25/36 | | | 972,212 | |
| Indymac Index Mortgage Loan Trust Series 2004-AR6, Class 6A1(a) | |
| 209,736 | | | 2.700 | | | 10/25/34 | | | 211,348 | |
| Master Adjustable Rate Mortgages Trust Series 2004-13, Class 2A1(a) | |
| 271,550 | | | 2.667 | | | 04/21/34 | | | 273,202 | |
| Master Alternative Loans Trust Series 2004-9, Class A6(c) | |
| 182,793 | | | 5.143 | | | 08/25/34 | | | 190,842 | |
| Master Asset Securitization Trust Series 2004-3, Class 5A1 | |
| 5,253 | | | 6.250 | | | 01/25/32 | | | 5,321 | |
| MortgageIT Trust Series 2005-1, Class 1A1(a) | |
| 1,659,197 | | | 0.814 | | | 02/25/35 | | | 1,617,825 | |
| MortgageIT Trust Series 2005-1, Class 1A2(a) | |
| 1,427,153 | | | 0.961 | | | 02/25/35 | | | 1,339,917 | |
| Residential Accredit Loans, Inc. Series 2003-QS4, Class A4(a) | |
| 495,741 | | | 0.604 | | | 03/25/33 | | | 482,351 | |
| |
| | | | | | | | | | |
Principal Amount | | Interest Rate | | | Maturity Date | | Value | |
| Mortgage-Backed Obligations – (continued) | |
Collateralized Mortgage Obligations – (continued) | |
| Residential Accredit Loans, Inc. Series 2004-QA4, Class NB21(a) | |
| $ 59,421 | | | 3.128 | % | | 09/25/34 | | $ | 58,849 | |
| Residential Accredit Loans, Inc. Series 2004-QS5, Class A5 | |
| 100,449 | | | 4.750 | | | 04/25/34 | | | 102,604 | |
| Residential Funding Mortgage Securities Corp. Series 2003-RM2, Class AII | |
| 25,645 | | | 5.000 | | | 05/25/18 | | | 26,068 | |
| Residential Funding Mortgage Securities Corp. Series 2004-S4, Class 2A6 | |
| 273,767 | | | 4.500 | | | 04/25/19 | | | 276,390 | |
| Securitized Asset Sales, Inc. Series 1993-7, Class TA6 | |
| 11,258 | | | 6.250 | | | 12/25/23 | | | 11,521 | |
| Sequoia Mortgage Trust Series 10, Class 1A(a) | |
| 80,458 | | | 0.981 | | | 10/20/27 | | | 78,620 | |
| Sequoia Mortgage Trust Series 2003-2, Class A1(a) | |
| 174,052 | | | 0.836 | | | 06/20/33 | | | 165,694 | |
| Structured Asset Securities Corp. Series 2003-31A, Class 2A7(a) | |
| 600,583 | | | 2.436 | | | 10/25/33 | | | 590,477 | |
| Vendee Mortgage Trust Series 1996-2, Class 1Z | |
| 134,266 | | | 6.750 | | | 06/15/26 | | | 155,069 | |
| Washington Mutual MSC Mortgage Pass-Through Series 2003-MS8, Class 2A1 | |
| 61,294 | | | 5.000 | | | 05/25/18 | | | 62,735 | |
| Wells Fargo Alternative Loan Trust Series 2003-1, Class 2A1 | |
| 126,514 | | | 5.750 | | | 09/25/18 | | | 128,789 | |
| |
| TOTAL COLLATERALIZED MORTGAGE OBLIGATIONS | |
(Cost $17,648,045) | | | | | $ | 19,225,636 | |
| |
Mortgage-Backed Pass-Through Obligations – 4.0% | |
| FHLMC | | | | | | | | | | |
| $ 20,721 | | | 5.500 | % | | 08/01/17 | | $ | 21,735 | |
| 31,700 | | | 6.000 | | | 10/01/23 | | | 36,049 | |
| 64,549 | | | 5.000 | | | 05/01/27 | | | 71,668 | |
| 795,796 | | | 2.500 | | | 04/01/28 | | | 814,314 | |
| FNMA | | | | | | | | | | |
| 8,122 | | | 10.500 | | | 11/01/15 | | | 8,189 | |
| 8,196 | | | 6.000 | | | 07/01/16 | | | 8,331 | |
| 88,277 | | | 5.500 | | | 05/01/19 | | | 92,598 | |
| 86,693 | | | 5.500 | | | 06/01/20 | | | 90,899 | |
| 1,112 | | | 9.000 | | | 07/01/24 | | | 1,128 | |
| 1,488,333 | | | 2.500 | | | 03/01/28 | | | 1,523,265 | |
| 2,387,896 | | | 2.500 | | | 05/01/28 | | | 2,443,807 | |
| 6,804 | | | 2.415 | (a) | | 12/01/28 | | | 6,985 | |
| 959,699 | | | 2.500 | | | 01/01/30 | | | 976,762 | |
| 16,994 | | | 7.000 | | | 11/01/31 | | | 19,345 | |
| 277,383 | | | 6.000 | | | 07/01/33 | | | 319,470 | |
| 182,778 | | | 2.200 | (a) | | 02/01/34 | | | 195,159 | |
| 144,852 | | | 2.365 | (a) | | 10/01/34 | | | 154,348 | |
| GNMA(a) | | | | | | | | | | |
| 234 | | | 2.000 | | | 11/20/24 | | | 242 | |
| |
| | |
| 22 | | The accompanying notes are an integral part of these financial statements. |
COMMERCE SHORT-TERM GOVERNMENT FUND
| | | | | | | | | | |
Principal Amount | | Interest Rate | | | Maturity Date | | Value | |
| Mortgage-Backed Obligations – (continued) | |
Mortgage-Backed Pass-Through Obligations – (continued) | |
| GNMA(a) – (continued) | |
| $ 544 | | | 3.000 | % | | 12/20/24 | | $ | 569 | |
| 8,754 | | | 1.625 | | | 04/20/26 | | | 9,100 | |
| 7,140 | | | 1.625 | | | 08/20/26 | | | 7,363 | |
| 9,765 | | | 1.625 | | | 01/20/28 | | | 10,162 | |
| |
| TOTAL MORTGAGE-BACKED PASS-THROUGH OBLIGATIONS | |
(Cost $6,744,592) | | | | | $ | 6,811,488 | |
| |
| TOTAL MORTGAGE-BACKED OBLIGATIONS | |
(Cost $24,392,637) | | | | | $ | 26,037,124 | |
| |
| | | | | | | | | | |
| U.S. Government Agency Obligations – 53.9% | |
| FFCB | |
| $ 250,000 | | | 7.000 | % | | 09/01/15 | | $ | 255,694 | |
| 500,000 | | | 6.125 | | | 12/29/15 | | | 519,103 | |
| 1,000,000 | | | 0.650 | | | 01/17/17 | | | 999,882 | |
| 1,000,000 | | | 0.690 | | | 05/16/17 | | | 999,176 | |
| 1,500,000 | | | 1.580 | | | 02/26/19 | | | 1,507,810 | |
| FHLB | | | | | | | | | | |
| 2,500,000 | | | 5.000 | | | 12/21/15 | | | 2,574,392 | |
| 1,000,000 | | | 0.580 | | | 01/09/17 | | | 999,104 | |
| 3,500,000 | | | 4.875 | | | 05/17/17 | | | 3,795,960 | |
| 1,600,000 | | | 1.375 | | | 10/13/17 | | | 1,612,357 | |
| 1,500,000 | | | 1.125 | | | 04/25/18 | | | 1,506,799 | |
| 1,000,000 | | | 0.625 | (c) | | 07/30/18 | | | 1,001,081 | |
| 950,000 | | | 1.750 | | | 08/07/18 | | | 953,232 | |
| 1,000,000 | | | 2.000 | | | 09/13/19 | | | 1,021,351 | |
| 1,000,000 | | | 4.125 | | | 12/13/19 | | | 1,115,952 | |
| 1,000,000 | | | 1.000 | | | 02/27/20 | | | 999,755 | |
| 1,750,000 | | | 1.750 | (c) | | 12/20/24 | | | 1,751,550 | |
| FHLMC | | | | | | | | | | |
| 2,600,000 | | | 1.750 | | | 09/10/15 | | | 2,615,345 | |
| 1,300,000 | | | 5.300 | | | 12/01/15 | | | 1,337,629 | |
| 1,900,000 | | | 2.500 | | | 05/27/16 | | | 1,942,828 | |
| 4,000,000 | | | 1.250 | | | 05/12/17 | | | 4,042,984 | |
| 1,000,000 | | | 1.000 | | | 06/29/17 | | | 1,005,653 | |
| 1,150,000 | | | 1.000 | | | 07/28/17 | | | 1,156,438 | |
| 1,000,000 | | | 1.250 | | | 12/29/17 | | | 1,001,635 | |
| 3,000,000 | | | 0.750 | | | 01/12/18 | | | 2,998,707 | |
| 1,500,000 | | | 1.500 | | | 09/18/18 | | | 1,503,623 | |
| 1,500,000 | | | 1.750 | | | 03/19/19 | | | 1,502,055 | |
| 2,000,000 | | | 1.750 | | | 05/30/19 | | | 2,033,752 | |
| 1,500,000 | | | 1.250 | | | 08/01/19 | | | 1,490,538 | |
| 1,000,000 | | | 1.250 | | | 10/02/19 | | | 989,497 | |
| 1,500,000 | | | 1.650 | | | 11/15/19 | | | 1,495,013 | |
| 1,100,000 | | | 1.850 | | | 03/30/20 | | | 1,102,660 | |
| 1,000,000 | | | 1.650 | | | 04/29/20 | | | 1,002,732 | |
| 1,000,000 | | | 5.400 | | | 03/17/21 | | | 1,042,972 | |
| FNMA | | | | | | | | | | |
| 2,450,000 | | | 2.375 | | | 07/28/15 | | | 2,463,458 | |
| 1,000,000 | | | 4.375 | | | 10/15/15 | | | 1,019,113 | |
| 1,350,000 | | | 2.125 | (c) | | 10/21/15 | | | 1,362,550 | |
| 2,000,000 | | | 1.625 | | | 10/26/15 | | | 2,014,726 | |
| 1,800,000 | | | 5.000 | | | 03/15/16 | | | 1,873,570 | |
| 1,500,000 | | | 1.250 | | | 09/28/16 | | | 1,515,660 | |
| 1,000,000 | | | 0.750 | | | 04/20/17 | | | 1,002,543 | |
| |
| | | | | | | | | | |
Principal Amount | | Interest Rate | | | Maturity Date | | Value | |
| U.S. Government Agency Obligations – (continued) | |
| FNMA – (continued) | |
| $2,000,000 | | | 1.125 | % | | 04/27/17 | | $ | 2,019,152 | |
| 1,200,000 | | | 1.000 | | | 09/20/17 | | | 1,202,202 | |
| 1,200,000 | | | 1.000 | (c) | | 09/27/17 | | | 1,202,338 | |
| 1,200,000 | | | 0.875 | | | 10/26/17 | | | 1,202,354 | |
| 1,000,000 | | | 0.875 | | | 12/20/17 | | | 999,180 | |
| 1,175,000 | | | 0.800 | (c) | | 01/29/18 | | | 1,175,029 | |
| 1,000,000 | | | 0.875 | | | 02/08/18 | | | 996,734 | |
| 1,750,000 | | | 1.625 | | | 11/27/18 | | | 1,777,263 | |
| 1,000,000 | | | 1.500 | | | 01/30/19 | | | 1,004,049 | |
| 2,000,000 | | | 1.875 | | | 02/19/19 | | | 2,042,474 | |
| 4,500,000 | | | 1.750 | | | 06/20/19 | | | 4,567,972 | |
| 4,000,000 | | | 1.750 | | | 09/12/19 | | | 4,047,016 | |
| 1,500,000 | | | 1.750 | | | 11/26/19 | | | 1,515,613 | |
| 1,000,000 | | | 2.000 | | | 12/30/19 | | | 1,011,964 | |
| 3,000,000 | | | 1.625 | | | 01/21/20 | | | 3,013,830 | |
| 1,000,000 | | | 1.750 | | | 11/20/20 | | | 989,945 | |
| 389,000 | | | 2.500 | | | 12/27/24 | | | 382,151 | |
| |
| TOTAL U.S. GOVERNMENT AGENCY OBLIGATIONS | |
(Cost $90,968,982) | | | | | $ | 90,278,145 | |
| |
| | | | | | | | | | |
| U.S. Treasury Obligations – 22.2% | |
| United States Treasury Inflation Indexed Notes | |
| $ 849,270 | | | 2.625 | % | | 07/15/17 | | $ | 922,984 | |
| 870,664 | | | 1.375 | | | 07/15/18 | | | 933,923 | |
| 874,480 | | | 2.125 | | | 01/15/19 | | | 963,978 | |
| 868,224 | | | 1.375 | | | 01/15/20 | | | 941,073 | |
| United States Treasury Notes | |
| 1,500,000 | | | 2.125 | | | 05/31/15 | | | 1,502,578 | |
| 2,000,000 | | | 0.875 | | | 02/28/17 | | | 2,011,876 | |
| 4,000,000 | | | 0.625 | | | 05/31/17 | | | 3,999,064 | |
| 4,700,000 | | | 0.625 | | | 11/30/17 | | | 4,677,600 | |
| 3,000,000 | | | 0.750 | | | 03/31/18 | | | 2,986,407 | |
| 4,000,000 | | | 1.375 | | | 06/30/18 | | | 4,047,188 | |
| 1,550,000 | | | 1.375 | | | 02/28/19 | | | 1,559,808 | |
| 3,000,000 | | | 1.625 | | | 03/31/19 | | | 3,046,173 | |
| 5,750,000 | | | 1.250 | | | 04/30/19 | | | 5,753,594 | |
| 2,000,000 | | | 0.875 | | | 07/31/19 | | | 1,964,844 | |
| 1,000,000 | | | 1.000 | | | 09/30/19 | | | 984,766 | |
| 1,000,000 | | | 1.125 | | | 12/31/19 | | | 987,344 | |
| |
| TOTAL U.S. TREASURY OBLIGATIONS | |
(Cost $35,950,045) | | | | | $ | 37,283,200 | |
| |
| | | | | | | | | | |
| Short-term Investment(e) – 5.3% | |
Repurchase Agreement – 5.3% | |
| State Street Bank & Trust Co. | |
| $8,812,000 | | | 0.000 | % | | 05/01/15 | | $ | 8,812,000 | |
Maturity Value: $8,812,000 | |
(Cost $8,812,000) | | | | | | | |
| |
| TOTAL INVESTMENTS – 99.7% | |
(Cost $164,339,432) | | | | | $ | 167,135,235 | |
| |
OTHER ASSETS IN EXCESS OF LIABILITIES – 0.3% | | | 490,562 | |
| |
| NET ASSETS – 100.0% | | $ | 167,625,797 | |
| |
| | |
| The accompanying notes are an integral part of these financial statements. | | 23 |
COMMERCE SHORT-TERM GOVERNMENT FUND
Schedule of Investments (continued)
April 30, 2015 (Unaudited)
| | |
| The percentage shown for each investment category reflects the value of investments in that category as a percentage of net assets. |
| |
| (a) | | Variable rate security. Interest rate or distribution rate disclosed is that which is in effect at April 30, 2015. |
| (b) | | Exempt from registration under Rule 144A of the Securities Act of 1933. Under procedures approved by the Board of Trustees, such securities have been determined to be liquid by the Investment Adviser and may be resold, normally to qualified institutional buyers in transactions exempt from registration. Total market value of Rule 144A securities amounted to $400,491, which represents approximately 0.2% of net assets as of April 30, 2015. |
| (c) | | Step-up Bond. Coupon rate increases in increments to maturity. Rate disclosed is as of April 30, 2015. Maturity date disclosed is the ultimate maturity. |
| (d) | | Issued with a zero coupon. Income is recognized through the accretion of discount. |
| (e) | | Repurchase agreement was entered into on April 30, 2015. This agreement was fully collateralized by $6,285,000 U.S. Treasury Bond, 8.000%, due 11/15/21 with a market value of $8,989,473. |
| | |
|
| Investment Abbreviations: |
| FFCB | | —Federal Farm Credit Bank |
| FHLB | | —Federal Home Loan Bank |
| FHLMC | | —Federal Home Loan Mortgage Corp. |
| FNMA | | —Federal National Mortgage Association |
| GNMA | | —Government National Mortgage Association |
| MSC | | —Mortgage Securities Corp. |
| PAC | | —Planned Amortization Class |
| REMIC | | —Real Estate Mortgage Investment Conduit |
|
PORTFOLIO COMPOSITION
| | | | | | | | |
| | | AS OF 4/30/15 | | | AS OF 10/31/14 | |
| |
U.S. Government Agency Obligations | | | 53.9 | % | | | 62.0 | % |
U.S. Treasury Obligations | | | 22.2 | | | | 13.1 | |
Collateralized Mortgage Obligations | | | 11.5 | | | | 17.9 | |
Mortgage-Backed Pass-Through Obligations | | | 4.0 | | | | 1.3 | |
Asset-Backed Securities | | | 2.8 | | | | 3.6 | |
Short-term Investments | | | 5.3 | | | | 1.3 | |
| |
| TOTAL INVESTMENTS | | | 99.7 | % | | | 99.2 | % |
| |
The percentage shown for each investment category reflects the value of investments in that category as a percentage of net assets. Underlying investment categories of investment companies held by the Fund, if any, are not reflected in the table above. Consequently, the Fund’s overall investment category allocations may differ from the percentages contained in the table above.
The Fund is actively managed and, as such, its composition may differ over time.
| | |
| 24 | | The accompanying notes are an integral part of these financial statements. |
COMMERCE NATIONAL TAX-FREE INTERMEDIATE BOND FUND
Schedule of Investments
April 30, 2015 (Unaudited)
| | | | | | | | | | |
Principal
Amount | | Interest
Rate | | | Maturity
Date | | Value | |
| Municipal Bond Obligations – 94.2% | |
Alaska – 0.6% | |
| Alaska Industrial Development & Export Authority Revenue Bonds (Providence Health & Services) Series H (AA-/Aa3) | |
| $1,515,000 | | | 5.000 | % | | 10/01/22 | | $ | 1,611,475 | |
| |
Arizona – 6.9% | |
| Arizona Health Facilities Authority Healthcare & Education Facilities Revenue Bonds (Kirksville College) (A-/NR) | |
| 700,000 | | | 4.700 | | | 01/01/21 | | | 781,620 | |
| 750,000 | | | 4.750 | | | 01/01/22 | | | 835,927 | |
| 1,000,000 | | | 5.000 | | | 01/01/25 | | | 1,128,430 | |
| Glendale AZ Industrial Development Authority Revenue Bonds (Midwestern University) (A-/NR) | |
| 1,500,000 | | | 5.000 | | | 05/15/30 | | | 1,703,460 | |
| Pima County AZ Regional Transportation Excise Tax Revenue Bonds (Pima County Regional Transportation Fund) (AA+/NR) | |
| 1,500,000 | | | 5.000 | | | 06/01/21 | | | 1,787,280 | |
| 1,000,000 | | | 5.000 | | | 06/01/22 | | | 1,208,640 | |
| 1,000,000 | | | 5.000 | | | 06/01/23 | | | 1,220,090 | |
| Pinal County AZ Electric District No. 3 (Refunding) (A/NR) | |
| 1,835,000 | | | 5.000 | | | 07/01/21 | | | 2,160,437 | |
| Pinal County AZ Unified School District No. 1 Florence GO Bonds (School Improvement Project of 2006) Series C (A/NR) | |
| 335,000 | | | 5.000 | | | 07/01/18 | | | 371,217 | |
| 350,000 | | | 5.000 | | | 07/01/19 | | | 389,214 | |
| 1,100,000 | | | 5.125 | | | 07/01/22 | | | 1,242,054 | |
| Rio Nuevo Multipurpose Facilities District Excise Tax Revenue Bonds (Sub Lien) Series 2008 (Assured Guaranty) (AA/A2) | |
| 3,475,000 | | | 5.750 | | | 07/15/18 | | | 3,926,924 | |
| Yuma County AZ Library District GO Bonds Series 2007 (XLCA) (A+/Aa3) | |
| 1,000,000 | | | 5.000 | | | 07/01/19 | | | 1,085,970 | |
| 1,000,000 | | | 5.000 | | | 07/01/21 | | | 1,085,300 | |
| | | | | | | | | | |
| | | | | | | | | 18,926,563 | |
| |
Arkansas – 0.2% | |
| Arkansas State Development Finance Authority Economic Development Revenue Bonds (Taxable) (ADFA-GTD) (A/NR) | |
| 435,000 | | | 5.480 | | | 09/01/17 | | | 435,944 | |
| |
California – 2.3% | |
| Bonita Unified School District Taxable GO Bonds Election of 2008 Series B-1 (AA-/NR) | |
| 1,000,000 | | | 5.560 | | | 08/01/25 | | | 1,185,400 | |
| California Health Facilities Financing Authority Revenue Bonds (Children’s Hospital of Orange) Series 2009 (A-/NR) | |
| 1,000,000 | | | 6.250 | | | 11/01/29 | | | 1,199,200 | |
| Fresno CA Unified School District GO Bonds Election of 2001 Series G (NR/Aa3)(a) | |
| 1,000,000 | | | 0.000 | | | 08/01/24 | | | 737,190 | |
| Los Angeles CA Unified School District GO Bonds (Refunding) Series A-1 (AGM) (AA/Aa2) | |
| 2,100,000 | | | 4.500 | | | 07/01/24 | | | 2,260,545 | |
| Port Oakland CA Revenue Bonds Series C (NATL-RE) (AA-/A3) | |
| 600,000 | | | 5.000 | | | 11/01/16 | | | 639,168 | |
| |
| | | | | | | | | | |
Principal
Amount | | Interest
Rate | | | Maturity
Date | | Value | |
| Municipal Bond Obligations – (continued) | |
California – (continued) | |
| University of California CA Revenue Bonds (Unrefunded-General) Series Q (AA/NR) | |
| $ 235,000 | | | 5.250 | % | | 05/15/22 | | $ | 258,305 | |
| | | | | | | | | | |
| | | | | | | | | 6,279,808 | |
| |
Colorado – 1.7% | |
| Colorado Educational & Cultural Facilities Authority Revenue Bonds (Charter School-High Point Academy) (A/NR) | |
| 1,000,000 | | | 4.500 | | | 03/01/20 | | | 1,114,360 | |
| Colorado Educational & Cultural Facilities Authority Revenue Bonds (Johnson & Wales University Project) Series B (A-/A2) | |
| 1,255,000 | | | 5.000 | | | 04/01/22 | | | 1,486,912 | |
| Colorado Health Facilities Authority Revenue Bonds (Unrefunded Balance-Adventist) Series 2006 (AA-/Aa2)(b) | |
| 1,030,000 | | | 5.125 | | | 11/15/20 | | | 1,097,836 | |
| Colorado Housing & Finance Authority Revenue Bonds (Single Family Mortgage) Class I Series A (FHA) (AAA/Aaa) | |
| 285,000 | | | 4.350 | | | 11/01/19 | | | 291,643 | |
| 300,000 | | | 4.600 | | | 11/01/20 | | | 307,908 | |
| Westminster CO Certificates of Participation (Refunding) (NATL-RE) (AA-/A3) | |
| 250,000 | | | 4.500 | | | 12/01/23 | | | 263,855 | |
| | | | | | | | | | |
| | | | | | | | | 4,562,514 | |
| |
Connecticut – 1.8% | |
| Connecticut GO Bonds (Refunding) Series E (AA/Aa3) | |
| 1,000,000 | | | 5.000 | | | 12/15/20 | | | 1,072,950 | |
| Connecticut State Higher Education Supplement Loan Authority Revenue Bonds (Chesla Loan Program) Series A (AMT) (NR/Aa3) | |
| 1,100,000 | | | 3.250 | | | 11/15/24 | | | 1,086,217 | |
| 1,350,000 | | | 3.500 | | | 11/15/25 | | | 1,347,044 | |
| 1,550,000 | | | 3.750 | | | 11/15/27 | | | 1,544,606 | |
| | | | | | | | | | |
| | | | | | | | | 5,050,817 | |
| |
District of Columbia – 0.5% | |
| District of Columbia Revenue Bonds (Deed Tax) Series B (NR/A1) | |
| 1,165,000 | | | 5.000 | | | 06/01/25 | | | 1,326,131 | |
| |
Florida – 6.7% | |
| Brevard County FL Health Facilities Authority Revenue Bonds (Health First, Inc. Project) Series 2005 (A-/A3) | |
| 875,000 | | | 5.000 | | | 04/01/18 | | | 908,407 | |
| Florida State Board of Education Lottery Revenue Bonds Series A (BHAC) (AAA/Aa1) | |
| 850,000 | | | 5.000 | | | 07/01/23 | | | 934,099 | |
| Jupiter County FL (Community Center Project) GO Bonds Series 2001 (AAA/Aaa) | |
| 50,000 | | | 5.500 | | | 07/01/21 | | | 58,239 | |
| Lake County FL School Board Certificates of Participation (Refunding-Master Lease Program) Series A (A/NR) | |
| 725,000 | | | 5.000 | | | 06/01/24 | | | 849,221 | |
| Martin County FL School Board Certificates of Participation (Refunding) Series A (AGM) (AA/NR) | |
| 1,690,000 | | | 5.000 | | | 07/01/23 | | | 1,986,291 | |
| |
| | |
| The accompanying notes are an integral part of these financial statements. | | 25 |
COMMERCE NATIONAL TAX-FREE INTERMEDIATE BOND FUND
Schedule of Investments (continued)
April 30, 2015 (Unaudited)
| | | | | | | | | | |
Principal
Amount | | Interest
Rate | | | Maturity
Date | | Value | |
| Municipal Bond Obligations – (continued) | |
Florida – (continued) | |
| Miami-Dade County FL Aviation Revenue Bonds (Miami International Airport) Series A (A/A2) | |
| $1,000,000 | | | 5.000 | % | | 10/01/22 | | $ | 1,155,740 | |
| 1,000,000 | | | 5.500 | | | 10/01/25 | | | 1,177,900 | |
| Miami-Dade County FL Educational Facilities Authority Revenue Bonds (Refunding-University of Miami) Series B (AMBAC) (A-/A3) | |
| 685,000 | | | 5.250 | | | 04/01/21 | | | 807,156 | |
| Miami-Dade County FL Facilities Authority Revenue Bonds (University of Miami) Series A (A-/A3) | |
| 1,000,000 | | | 5.250 | | | 04/01/21 | | | 1,041,370 | |
| Sumter County FL Industrial Development Authority Hospital Revenue Bonds (Refunding) Series B (BBB+/A3) | |
| 2,425,000 | | | 5.000 | | | 07/01/25 | | | 2,844,598 | |
| Tallahassee FL Energy Systems Revenue Bonds Series 2005 (NATL-RE) (AA/Aa3) | |
| 3,065,000 | | | 5.000 | | | 10/01/35 | | | 3,118,515 | |
| Volusia County FL School Board Certificates of Participation (Refunding-Master Lease Program) Series A (NR/Aa3e) | |
| 1,000,000 | | | 5.000 | | | 08/01/23 | | | 1,188,340 | |
| Walton County FL School Board Certificates of Participation Series 2015 (AGM) (AA/A2) | |
| 1,000,000 | | | 5.000 | | | 07/01/25 | | | 1,167,460 | |
| 1,000,000 | | | 5.000 | | | 07/01/29 | | | 1,128,950 | |
| | | | | | | | | | |
| | | | | | | | | 18,366,286 | |
| |
Georgia – 0.1% | |
| Brunswick GA Water & Sewer Revenue Bonds (Refunding & Improvement) Series 1992 (ETM) (NATL-RE) (AA-/A3) | |
| 90,000 | | | 6.100 | | | 10/01/19 | | | 100,517 | |
| Cherokee County GA Water & Sewer Authority Revenue Bonds (Refunding & Improvement) Series 1993 (NATL-RE) (AA-/Aa2) | |
| 55,000 | | | 5.500 | | | 08/01/23 | | | 65,001 | |
| Fulton County GA Development Authority Revenue Bonds (Spelman College) Series 2007 (NR/A1)(c) | |
| 150,000 | | | 5.000 | | | 06/01/17 | | | 162,823 | |
| | | | | | | | | | |
| | | | | | | | | 328,341 | |
| |
Illinois – 10.6% | |
| Chicago IL Public Building Commission Revenue Bonds (Refunding-Chicago Transit Authority) Series 2006 (AMBAC) (A+/A2) | |
| 350,000 | | | 5.250 | | | 03/01/33 | | | 386,921 | |
| Chicago O’Hare International Airport Revenue Bonds (General Airport Third Lien) Series A (NATL-RE) (AA-/A2) | |
| 4,000,000 | | | 5.000 | | | 01/01/33 | | | 4,096,480 | |
| Cook & DuPage Counties IL High School District No. 210 GO Bonds Series 2006 (NATL-RE) (NR/Aa2) | |
| 360,000 | | | 5.000 | | | 01/01/26 | | | 370,562 | |
| Cook County IL Community High School District No. 234 Taxable GO Bonds (Ridgewood Build America Bonds – Direct Payment to Issuer) Series B (Assured Guaranty) (AA/A3) | |
| 300,000 | | | 6.400 | | | 12/01/28 | | | 346,737 | |
| |
| | | | | | | | | | |
Principal
Amount | | Interest
Rate | | | Maturity
Date | | Value | |
| Municipal Bond Obligations – (continued) | |
Illinois – (continued) | |
| Countryside IL GO Bonds (Taxable-Refunding) Series 2014 (NR/Aa2) | |
| $ 500,000 | | | 3.300 | % | | 01/01/24 | | $ | 505,630 | |
| 860,000 | | | 4.150 | | | 01/01/29 | | | 862,752 | |
| DeKalb, Kane & Lasalle Counties Community College District No. 523 GO Bonds Series A (AA/NR) | |
| 400,000 | | | 5.000 | | | 02/01/23 | | | 468,532 | |
| Illinois Finance Authority Revenue Bonds (Bradley University Projects) Series A (XLCA) (A/WR) | |
| 3,000,000 | | | 5.000 | | | 08/01/27 | | | 3,248,940 | |
| Illinois Finance Authority Revenue Bonds (Columbia College) (NATL-RE) (AA-/A3) | |
| 2,000,000 | | | 5.250 | | | 12/01/22 | | | 2,168,960 | |
| Illinois Finance Authority Revenue Bonds (Poetry Foundation Project) (AA-/Aa3) | |
| 470,000 | | | 4.850 | | | 01/01/26 | | | 527,692 | |
| 1,625,000 | | | 5.000 | | | 01/01/30 | | | 1,841,417 | |
| Illinois Finance Authority Revenue Bonds (Refunding-Columbia College) Series 2011 (BBB+/NR) | |
| 300,000 | | | 5.000 | | | 12/01/17 | | | 323,157 | |
| 405,000 | | | 4.000 | | | 12/01/18 | | | 430,483 | |
| 420,000 | | | 4.250 | | | 12/01/19 | | | 452,882 | |
| 440,000 | | | 4.500 | | | 12/01/20 | | | 483,578 | |
| Illinois Finance Authority Revenue Bonds (Refunding-Swedish Covenant) Series A (BBB+/NR) | |
| 1,210,000 | | | 5.500 | | | 08/15/24 | | | 1,371,305 | |
| Illinois Finance Authority Revenue Bonds (The Carle Foundation) Series A (A+/NR) | |
| 1,000,000 | | | 5.375 | | | 08/15/26 | | | 1,179,400 | |
| Illinois State GO Bonds (A-/A3) | |
| 3,000,000 | | | 4.000 | | | 09/01/21 | | | 3,208,980 | |
| Illinois State GO Bonds Series A (A-/A3) | |
| 1,000,000 | | | 5.000 | | | 03/01/28 | | | 1,003,020 | |
| Northern Illinois Municipal Power Agency Revenue Bonds (Prairie State Project) Series A (NATL-RE) (NR/A2) | |
| 1,000,000 | | | 5.000 | | | 01/01/20 | | | 1,097,080 | |
| Peoria County IL Community Unit School District No. 309 GO Bonds (Capital Appreciation-Brimfield School District) Series A (Assured Guaranty) (AA/NR)(a) | |
| 540,000 | | | 0.000 | | | 04/01/18 | | | 505,721 | |
| Peoria IL GO Bonds (Refunding) Series B (AA-/Aa3) | |
| 1,205,000 | | | 5.000 | | | 01/01/24 | | | 1,423,720 | |
| Peoria IL Metropolitan Airport Authority Revenue Bonds (Alternative Revenue Source) Series 2008 (NR/Aa2) | |
| 1,000,000 | | | 5.000 | | | 12/01/26 | | | 1,104,370 | |
| Quad Cities IN Regional Economic Development Authority Revenue Bonds (Augustana College) Series 2012 (Refunding) (NR/Baa1) | |
| 750,000 | | | 4.750 | | | 10/01/32 | | | 778,410 | |
| University of Illinois Board of Trustees Certificates of Participation (Prerefunded-Refunding) Series A (NR/NR)(c) | |
| 575,000 | | | 5.000 | | | 10/01/17 | | | 634,162 | |
| |
| | |
| 26 | | The accompanying notes are an integral part of these financial statements. |
COMMERCE NATIONAL TAX-FREE INTERMEDIATE BOND FUND
| | | | | | | | | | |
Principal
Amount | | Interest
Rate | | | Maturity
Date | | Value | |
| Municipal Bond Obligations – (continued) | |
Illinois – (continued) | |
| University of Illinois Board of Trustees Certificates of Participation (Unrefunded-Refunding) Series A (AA-/Aa3) | |
| $ 425,000 | | | 5.000 | % | | 10/01/20 | | $ | 467,011 | |
| | | | | | | | | | |
| | | | | | | | | 29,287,902 | |
| |
Indiana – 6.3% | |
| Allen County IN War Memorial Revenue Bonds (Refunding-Coliseum Additions Building Corp.) Series A (NR/Aa3) | |
| 615,000 | | | 5.000 | | | 11/01/16 | | | 655,904 | |
| Anderson IN School Building Corp. Revenue Bonds (Refunding) Series 2015 (AA+/NR) | |
| 1,565,000 | | | 4.000 | | | 07/15/26 | | | 1,692,078 | |
| Decatur Township IN Multi-School Building Corp. Revenue Bonds (Refunding-First Mortgage) (Multi Purpose) Series 2015 (AA+/NR) | |
| 2,315,000 | | | 5.000 | | | 07/15/23 | | | 2,751,609 | |
| Evansville IN Redevelopment Authority Revenue Bonds (Build America Bonds-Taxable) Series B (A/Aa3) | |
| 250,000 | | | 4.930 | | | 02/01/17 | | | 263,640 | |
| 675,000 | | | 6.050 | | | 02/01/23 | | | 772,679 | |
| Indiana Finance Authority Revenue Bonds (Educational Facilities-Butler University Project) Series A (BBB+/NR) | |
| 540,000 | | | 5.000 | | | 02/01/25 | | | 624,256 | |
| 425,000 | | | 5.000 | | | 02/01/27 | | | 488,839 | |
| 700,000 | | | 5.000 | | | 02/01/28 | | | 793,079 | |
| 600,000 | | | 5.000 | | | 02/01/29 | | | 676,374 | |
| Indiana State Finance Authority Revenue Bond (Refunding-Educational Facilities-Indianapolis Museum of Art) Series B (NR/A1) | |
| 815,000 | | | 5.000 | | | 02/01/28 | | | 931,023 | |
| Indiana State University Revenue Bonds (Build America Bonds) (NR/A1) | |
| 530,000 | | | 5.310 | | | 04/01/25 | | | 568,558 | |
| Lake Central Multi-District School Building Corp. Revenue Bonds (Refunding-First Mortgage) Series B (AA+/NR) | |
| 1,000,000 | | | 5.000 | | | 07/15/24 | | | 1,199,310 | |
| Plainfield IN High School Building Corp. Revenue Bonds (Refunding-First Mortgage) Series 2014 (AA+/NR) | |
| 2,245,000 | | | 4.000 | | | 01/15/26 | | | 2,490,805 | |
| 2,235,000 | | | 4.000 | | | 01/15/27 | | | 2,449,113 | |
| Upland IN Economic Development Revenue Bonds (Taylor University Project) (Refunding) Series 2012 (NR/Baa1) | |
| 900,000 | | | 4.500 | | | 09/01/32 | | | 912,312 | |
| | | | | | | | | | |
| | | | | | | | | 17,269,579 | |
| |
Iowa – 0.6% | |
| Iowa Finance Authority Health Facilities Revenue Bonds (Mercy Medical Center Project) Series 2012 (A/A2) | |
| 1,410,000 | | | 5.000 | | | 08/15/27 | | | 1,605,934 | |
| Iowa Finance Authority Revenue Bonds (Single Family Mortgage) Series A (GNMA/FNMA) (AA+/Aaa) | |
| 85,000 | | | 4.300 | | | 07/01/16 | | | 85,049 | |
| | | | | | | | | | |
| | | | | | | | | 1,690,983 | |
| |
| | | | | | | | | | |
Principal
Amount | | Interest
Rate | | | Maturity
Date | | Value | |
| Municipal Bond Obligations – (continued) | |
Kentucky – 1.5% | |
| Ashland KY Medical Center Revenue Bonds (Ashland Hospital Corp.) Series B (BBB/A3) | |
| $1,000,000 | | | 5.000 | % | | 02/01/23 | | $ | 1,105,380 | |
| Barren County KY School District Finance Corp. Revenue Bonds (Refunding) Series 2015 (NR/Aa3) | |
| 1,000,000 | | | 5.000 | | | 08/01/26 | | | 1,175,160 | |
| Kentucky State Higher Education Student Loan Corp. (Senior Lien) Series A (AMT) (A/NR) | |
| 1,870,000 | | | 3.750 | | | 06/01/26 | | | 1,872,057 | |
| | | | | | | | | | |
| | | | | | | | | 4,152,597 | |
| |
Louisiana – 3.7% | |
| Louisiana Local Government Environmental Facilities Community Development Authority Revenue Bonds (Woman’s Hospital Foundation) Series A (A/A3) | |
| 5,000,000 | | | 5.500 | | | 10/01/25 | | | 5,855,950 | |
| Louisiana Public Facilities Authority Revenue Bonds (Loyola University) Series 2011 (A-/A3) | |
| 3,715,000 | | | 5.250 | | | 10/01/27 | | | 4,328,087 | |
| | | | | | | | | | |
| | | | | | | | | 10,184,037 | |
| |
Maine – 0.4% | |
| Maine State Health & Higher Educational Facilities Authority Revenue Bonds Series A (NR/A1) | |
| 1,000,000 | | | 5.000 | | | 07/01/24 | | | 1,158,470 | |
| |
Massachusetts – 2.6% | |
| Massachusetts Educational Financing Authority Education Loan Revenue Bonds (Issue I) Series 2014 (AMT) (AA/NR) | |
| 2,550,000 | | | 4.000 | | | 01/01/27 | | | 2,611,531 | |
| Massachusetts Educational Financing Authority Education Loan Revenue Bonds (Issue I) Series A (AA/NR) | |
| 1,205,000 | | | 5.100 | | | 01/01/25 | | | 1,296,941 | |
| Massachusetts Educational Financing Authority Revenue Bonds Series J (AMT) (AA/NR) | |
| 1,215,000 | | | 4.250 | | | 07/01/22 | | | 1,297,632 | |
| Massachusetts State Housing Finance Agency Revenue Bonds Series B (AMT) (AA-/Aa3) | |
| 480,000 | | | 2.500 | | | 12/01/20 | | | 488,266 | |
| 475,000 | | | 2.700 | | | 06/01/21 | | | 480,852 | |
| 475,000 | | | 3.050 | | | 06/01/22 | | | 481,954 | |
| 480,000 | | | 3.250 | | | 06/01/23 | | | 488,885 | |
| Massachusetts State Water Resources Authority Revenue Bonds Series A (ETM) (GO of Authority) (AA+/Aa1) | |
| 40,000 | | | 6.500 | | | 07/15/19 | | | 44,292 | |
| | | | | | | | | | |
| | | | | | | | | 7,190,353 | |
| |
Michigan – 5.6% | |
| Comstock Park MI Public Schools GO Bonds (Refunding) Series 2015 (Q-SBLF) (AA-/NR) | |
| 730,000 | | | 5.000 | | | 05/01/24 | | | 859,385 | |
| East Lansing MI School District GO Bonds (Refunding) Series 2015 (Q-SBLF) (AA-/NR) | |
| 1,175,000 | | | 5.000 | | | 05/01/24 | | | 1,404,947 | |
| |
| | |
| The accompanying notes are an integral part of these financial statements. | | 27 |
COMMERCE NATIONAL TAX-FREE INTERMEDIATE BOND FUND
Schedule of Investments (continued)
April 30, 2015 (Unaudited)
| | | | | | | | | | |
Principal
Amount | | Interest
Rate | | | Maturity
Date | | Value | |
| Municipal Bond Obligations – (continued) | |
Michigan – (continued) | |
| Grand Valley MI State University Revenue Bonds Series 1998 (NATL-RE) (FGIC) (AA-/A3) | |
| $ 580,000 | | | 5.500 | % | | 02/01/18 | | $ | 596,942 | |
| Marshall MI Public Schools District GO Bonds (Refunding) Series 2015 (Q-SBLF) (AA-/NR) | |
| 1,380,000 | | | 4.000 | | | 11/01/28 | | | 1,466,457 | |
| Mattawan MI Consolidated School District GO Bonds Series I (Q-SBLF) (AA-/NR) | |
| 750,000 | | | 5.000 | | | 05/01/26 | | | 890,752 | |
| Michigan State Finance Authority Revenue Bonds (Refunding-Beaumont Health Credit Group) Series 2015 (A/A1) | |
| 1,500,000 | | | 5.000 | | | 08/01/24 | | | 1,789,845 | |
| 1,000,000 | | | 5.000 | | | 08/01/25 | | | 1,167,320 | |
| Michigan State Housing Development Authority Rental Housing Revenue Bonds Series B (GO of Authority) (AA/NR) | |
| 690,000 | | | 4.500 | | | 10/01/19 | | | 726,860 | |
| Michigan State Housing Development Authority Single Family Home Ownership Revenue Bonds (Non AMT) Series A (GO of Authority) (AA+/NR) | |
| 965,000 | | | 4.750 | | | 12/01/25 | | | 1,026,123 | |
| Northwest Community Schools GO Bonds (School Building & Site) Series 2013 (AA-/NR) | |
| 1,000,000 | | | 4.000 | | | 05/01/24 | | | 1,097,380 | |
| South Redford MI School District GO Bonds (Refunding) Series 2014 (Q-SBLF) (AA-/NR) | |
| 1,590,000 | | | 5.000 | | | 05/01/26 | | | 1,859,394 | |
| Warren Woods MI Public Schools GO Bonds (Refunding) Series 2015 (Q-SBLF) (AA-/NR) | |
| 1,480,000 | | | 5.000 | | | 05/01/24 | | | 1,760,475 | |
| Washtenaw MI Community College GO Bonds (Refunding) Series 2015 (NR/Aa1) | |
| 645,000 | | | 4.000 | | | 04/01/25 | | | 717,440 | |
| | | | | | | | | | |
| | | | | | | | | 15,363,320 | |
| |
Minnesota – 0.8% | | | | |
| Minnesota State Housing Finance Agency Revenue Bonds (Refunding-Residential Housing) Series D (GNMA/FNMA/FHLMC) (AA+/Aa1) | |
| 1,565,000 | | | 3.000 | | | 07/01/25 | | | 1,596,441 | |
| Minnesota State Housing Finance Agency Revenue Bonds (Residential) Series A (AA+/Aa1) | |
| 115,000 | | | 3.800 | | | 07/01/17 | | | 117,701 | |
| Minnesota State Municipal Power Agency Electric Revenue Bonds (Refunding) Series 2014 (NR/A2) | |
| 500,000 | | | 4.000 | | | 10/01/21 | | | 560,155 | |
| | | | | | | | | | |
| | | | | | | | | 2,274,297 | |
| |
Mississippi – 0.0% | |
| Mississippi Home Corporation Homeownership Revenue Bonds Series A (GNMA/FNMA/FHLMC) (NR/Aaa) | |
| 40,000 | | | 2.700 | | | 06/01/18 | | | 41,180 | |
| |
Missouri – 1.5% | |
| Greene County MO GO Bonds Limited-Wilson Creek Marketplace NID Project (Refunding) Series A (NR/A1) | |
| 500,000 | | | 5.000 | | | 04/01/32 | | | 555,680 | |
| |
| | | | | | | | | | |
Principal
Amount | | Interest
Rate | | | Maturity
Date | | Value | |
| Municipal Bond Obligations – (continued) | |
Missouri – (continued) | |
| Joplin Industrial Development Authority Health Facilities Revenue Bonds (Freeman Health Systems ) Series 2011 (BBB+/NR) | |
| $1,490,000 | | | 4.250 | % | | 02/15/21 | | $ | 1,624,979 | |
| Joplin Industrial Development Authority Health Facilities Revenue Bonds (Refunding-Freeman Health System) Series 2015 (BBB+/NR) | |
| 1,000,000 | | | 5.000 | | | 02/15/29 | | | 1,107,690 | |
| Kansas City MO Special Obligation Revenue Bonds (Capital Appreciation) Series E (AA-/A1)(a) | |
| 305,000 | | | 0.000 | | | 02/01/17 | | | 297,329 | |
| St. Louis County MO Industrial Development Authority Health Facilities Revenue Bonds (Refunding-Ranken Jordan Project) (NR/NR) | |
| 500,000 | | | 5.000 | | | 11/15/17 | | | 510,985 | |
| | | | | | | | | | |
| | | | | | | | | 4,096,663 | |
| |
Montana – 0.1% | |
| Montana State Board Housing Revenue Bonds (Single Family Mortgage) Series A-2 (AMT) (AA+/Aa1) | |
| 95,000 | | | 4.350 | | | 06/01/16 | | | 95,089 | |
| 100,000 | | | 4.350 | | | 12/01/16 | | | 101,053 | |
| | | | | | | | | | |
| | | | | | | | | 196,142 | |
| |
Nebraska – 0.2% | |
| Douglas County NE Hospital Authority No. 2 Revenue Bonds (Prerefunded-Refunding) (Health Facilities-Children’s Hospital) Series 2008 (NR/NR)(c) | |
| 220,000 | | | 6.000 | | | 08/15/17 | | | 246,407 | |
| Douglas County NE Hospital Authority No. 2 Revenue Bonds (Unrefunded-Refunding) (Health Facilities-Children’s Hospital) Series 2008 (NR/A2) | |
| 280,000 | | | 6.000 | | | 08/15/22 | | | 310,976 | |
| | | | | | | | | | |
| | | | | | | | | 557,383 | |
| |
Nevada – 1.6% | |
| Clark County NV School District GO Bonds (Building) Series B (AMBAC) (AA-/A1) | |
| 2,150,000 | | | 5.000 | | | 06/15/20 | | | 2,334,384 | |
| Clark County NV School District GO Bonds (Limited Tax Building) Series C (AA-/A1) | |
| 1,100,000 | | | 5.000 | | | 06/15/25 | | | 1,212,508 | |
| Las Vegas Valley NV Water District GO Bonds (Refunding) Series B (AA+/Aa1) | |
| 800,000 | | | 5.000 | | | 06/01/22 | | | 892,704 | |
| Nye County NV School District GO Bonds (Refunding) Series A (PSF-GTD) (NR/Aaa)(c) | |
| 100,000 | | | 4.375 | | | 05/01/15 | | | 100,000 | |
| | | | | | | | | | |
| | | | | | | | | 4,539,596 | |
| |
New Hampshire – 1.2% | |
| Manchester NH General Airport Revenue Bonds Series A (BBB+/Baa1) | |
| 2,990,000 | | | 5.000 | | | 01/01/21 | | | 3,385,218 | |
| |
| | |
| 28 | | The accompanying notes are an integral part of these financial statements. |
COMMERCE NATIONAL TAX-FREE INTERMEDIATE BOND FUND
| | | | | | | | | | |
Principal
Amount | | Interest
Rate | | | Maturity
Date | | Value | |
| Municipal Bond Obligations – (continued) | |
New Jersey – 4.6% | |
| New Jersey State Certificates of Participation (Equipment Lease Purchase) Series A (A-/A3) | |
| $1,000,000 | | | 5.000 | % | | 06/15/21 | | $ | 1,091,930 | |
| New Jersey State Economic Development Authority Revenue Bonds (School Facilities Construction) Series UU (A-/A3) | |
| 1,750,000 | | | 5.000 | | | 06/15/28 | | | 1,879,693 | |
| New Jersey State Economic Development Authority Revenue Bonds School Facilities Construction (Refunding) Series F (A-/A3)(b) | |
| 4,700,000 | | | 2.026 | | | 02/01/18 | | | 4,819,756 | |
| New Jersey State Higher Education Assistance Authority Revenue Bonds (Senior Lien) Series 1A (AMT) (AA/Aa2) | |
| 2,965,000 | | | 3.625 | | | 12/01/30 | | | 2,977,038 | |
| New Jersey State Higher Education Assistance Authority Student Loan Revenue Bonds (Refunding) Series 1A (AA/Aa2) | |
| 1,610,000 | | | 4.750 | | | 12/01/23 | | | 1,743,823 | |
| Passaic County NJ GO Bonds (Refunding-Taxable Pension) Series 2003 (AGM) (NR/Aa3) | |
| 100,000 | | | 5.750 | | | 02/15/21 | | | 107,983 | |
| | | | | | | | | | |
| | | | | | | | | 12,620,223 | |
| |
New York – 3.3% | |
| Albany NY Industrial Development Agency (St. Peters Hospital Project) Series A (NR/A3)(c) | |
| 1,000,000 | | | 5.250 | | | 11/15/17 | | | 1,113,800 | |
| Metropolitan Transportation Authority NY Revenue Bonds (Transportation) Series A (AA-/A2) | |
| 3,000,000 | | | 5.000 | | | 11/15/20 | | | 3,205,680 | |
| Metropolitan Transportation Authority NY Revenue Bonds Series 2008 C (AA-/A2) | |
| 125,000 | | | 5.500 | | | 11/15/18 | | | 135,758 | |
| Metropolitan Transportation Authority NY Revenue Bonds Series H (AA-/A2) | |
| 1,000,000 | | | 4.000 | | | 11/15/23 | | | 1,116,890 | |
| Monroe Country NY Development Corp. Revenue Bonds (Refunding John Fisher College) Series A (BBB+/NR) | |
| 500,000 | | | 5.000 | | | 06/01/29 | | | 560,330 | |
| New York City Housing Development Corp. Revenue Bonds (Multi Family Development) Series G (AA+/Aa2) | |
| 250,000 | | | 3.800 | | | 11/01/37 | | | 251,357 | |
| New York State Dormitory Authority Personal Income Tax Revenue Bonds (Education) Series C (AAA/Aa1) | |
| 1,460,000 | | | 5.000 | | | 12/15/20 | | | 1,567,003 | |
| New York State Dormitory Authority Revenues Non Supported Debt Revenue Bonds (School District Financing Program) Series C (AGM) (AA/A2) | |
| 1,000,000 | | | 5.000 | | | 10/01/20 | | | 1,095,580 | |
| | | | | | | | | | |
| | | | | | | | | 9,046,398 | |
| |
North Carolina – 1.2% | |
| North Carolina State Medical Care Commission Revenue Bonds (Refunding-NC Baptist Hospital) (A/A2) | |
| 1,190,000 | | | 5.000 | | | 06/01/22 | | | 1,360,753 | |
| |
| | | | | | | | | | |
Principal
Amount | | Interest
Rate | | | Maturity
Date | | Value | |
| Municipal Bond Obligations – (continued) | |
North Carolina – (continued) | |
| Western Carolina University Revenue Bonds (Refunding-Limited Obligation-Student Housing) (A/NR) | |
| $ 200,000 | | | 2.000 | % | | 06/01/20 | | $ | 199,710 | |
| 420,000 | | | 3.000 | | | 06/01/21 | | | 438,266 | |
| 330,000 | | | 4.000 | | | 06/01/22 | | | 362,574 | |
| 350,000 | | | 4.000 | | | 06/01/23 | | | 383,863 | |
| 480,000 | | | 4.000 | | | 06/01/25 | | | 514,531 | |
| | | | | | | | | | |
| | | | | | | | | 3,259,697 | |
| |
Ohio – 2.9% | |
| Akron OH Certificates of Participation (Refunding-Municipal Baseball Stadium Project) Series 2013 (A+/NR) | |
| 660,000 | | | 3.000 | | | 12/01/19 | | | 678,269 | |
| Ohio State Higher Educational Facility Commission Revenue Bonds (Xavier University-Refunding) Series C (A-/A3) | |
| 1,000,000 | | | 5.000 | | | 05/01/27 | | | 1,156,560 | |
| 1,000,000 | | | 5.000 | | | 05/01/28 | | | 1,144,570 | |
| 750,000 | | | 5.000 | | | 05/01/29 | | | 852,270 | |
| Sylvania OH City School District GO Bonds Series 2015 (Refunding) (AA/A1) | |
| 3,000,000 | | | 4.000 | | | 12/01/26 | | | 3,210,540 | |
| Toledo GO Bonds Limited Tax Capital Improvement (Refunding) Series 2012 (A-/A2) | |
| 1,000,000 | | | 3.000 | | | 12/01/23 | | | 995,490 | |
| | | | | | | | | | |
| | | | | | | | | 8,037,699 | |
| |
Oregon – 0.2% | |
| Oregon State Housing & Community Services Department Housing Revenue Bonds Single Family Mortgage Program Series A (FHLMC) (NR/Aa3) | |
| 590,000 | | | 5.000 | | | 07/01/17 | | | 624,958 | |
| Oregon State Housing & Community Services Department Revenue Bonds (Single Family Mortgage) Series E (AMT) (NR/Aa2) | |
| 40,000 | | | 5.050 | | | 07/01/17 | | | 41,040 | |
| | | | | | | | | | |
| | | | | | | | | 665,998 | |
| |
Pennsylvania – 4.4% | |
| Butler County PA Hospital Authority Revenue Bonds (Refunding) Series 2015 (NR/Baa1) | |
| 500,000 | | | 5.000 | | | 07/01/25 | | | 581,730 | |
| 450,000 | | | 5.000 | | | 07/01/26 | | | 518,476 | |
| 490,000 | | | 5.000 | | | 07/01/27 | | | 557,733 | |
| Delaware County PA Authority University Revenue Bonds (Neumann University) (BBB/NR) | |
| 1,025,000 | | | 5.000 | | | 10/01/19 | | | 1,125,860 | |
| 1,250,000 | | | 5.250 | | | 10/01/31 | | | 1,348,537 | |
| Lancaster PA GO Bonds Series 2007 (AMBAC) (NR/A1) | |
| 2,000,000 | | | 5.000 | | | 11/01/19 | | | 2,155,080 | |
| Pennsylvania State GO Bonds Second Series (AGC) (AA/Aa3) | |
| 1,000,000 | | | 4.500 | | | 03/01/26 | | | 1,055,380 | |
| Pennsylvania State Higher Educational Facilities Authority Revenue Bonds (Drexel University College Medicine) Series 2007 (NATL-RE) (AA-/A3) | |
| 1,250,000 | | | 5.000 | | | 05/01/27 | | | 1,355,525 | |
| |
| | |
| The accompanying notes are an integral part of these financial statements. | | 29 |
COMMERCE NATIONAL TAX-FREE INTERMEDIATE BOND FUND
Schedule of Investments (continued)
April 30, 2015 (Unaudited)
| | | | | | | | | | |
Principal
Amount | | Interest
Rate | | | Maturity
Date | | Value | |
| Municipal Bond Obligations – (continued) | |
Pennsylvania – (continued) | |
| Pennsylvania State Housing Finance Agency Single Family Mortgage Revenue Bonds Series 113 (AA+/Aa2) | |
| $ 795,000 | | | 4.000 | % | | 10/01/18 | | $ | 846,270 | |
| Pennsylvania State Turnpike Commission Turnpike Revenue Bonds Series A (AMBAC) (A+/A1) | |
| 1,800,000 | | | 5.000 | | | 12/01/25 | | | 1,879,344 | |
| Pennsylvania State Turnpike Commission Turnpike Revenue Bonds Series C (A+/A1) | |
| 500,000 | | | 5.000 | | | 12/01/26 | | | 590,875 | |
| | | | | | | | | | |
| | | | | | | | | 12,014,810 | |
| |
Rhode Island – 2.0% | |
| Rhode Island Housing & Mortgage Finance Corp. Revenue Bonds (Multi Family Development) Series 1 (NR/Aa2) | |
| 260,000 | | | 5.125 | | | 10/01/30 | | | 280,649 | |
| Rhode Island Housing & Mortgage Finance Corp. Revenue Bonds Homeownership Opportunities Series 61 B (Non-AMT) (Non-ACE) (AA+/Aa2) | |
| 2,150,000 | | | 3.450 | | | 04/01/26 | | | 2,194,935 | |
| Rhode Island State Health & Educational Building Corp. Higher Education Facility Revenue Bonds (Bryant University Project) (A/A2) | |
| 950,000 | | | 5.000 | | | 06/01/21 | | | 1,100,414 | |
| Rhode Island State Health & Educational Building Corp. Public Schools Revenue Bonds (Financing Project) Series A (AMBAC) (NR/A3) | |
| 1,460,000 | | | 5.000 | | | 05/15/23 | | | 1,518,955 | |
| Rhode Island State Housing & Mortgage Finance Corp. Revenue Bonds (Home Funding) Series 4 (NR/Aa2) | |
| 430,000 | | | 3.500 | | | 04/01/22 | | | 460,302 | |
| | | | | | | | | | |
| | | | | | | | | 5,555,255 | |
| |
South Carolina – 4.3% | |
| Fort Mill SC School Facilities Corp. Revenue Bonds (Installment Purchase Revenue) Series 2006 (NR/Aa3) | |
| 550,000 | | | 5.250 | | | 12/01/22 | | | 589,688 | |
| Kershaw County SC Public School Foundation Installment Power Revenue Bonds (School District Project) (AGC) (AA/A3) | |
| 1,000,000 | | | 5.000 | | | 12/01/22 | | | 1,067,440 | |
| Newberry Investing in Children’s Education SC Installment Purpose Revenue Bonds (Refunding-Newberry Co. School District) Series 2014 (A/A1) | |
| 2,925,000 | | | 5.000 | | | 12/01/25 | | | 3,467,383 | |
| Scago Educational Facilities Corp. for Beaufort School District SC Installment Revenue Bonds (AGM) (AA/Aa2) | |
| 175,000 | | | 5.500 | | | 12/01/15 | | | 180,353 | |
| Scago Educational Facilities Corp. for Pickens School District Revenue Bonds (Refunding) Series 2015 (A/A1) | |
| 2,550,000 | | | 5.000 | | | 12/01/27 | | | 2,975,978 | |
| Scago Educational Facilities Corp. for Sumter County School District 17 SC Revenue Bonds (AGM) (AA/A2) | |
| 255,000 | | | 5.500 | | | 12/01/15 | | | 262,530 | |
| |
| | | | | | | | | | |
Principal
Amount | | Interest
Rate | | | Maturity
Date | | Value | |
| Municipal Bond Obligations – (continued) | |
South Carolina – (continued) | |
| South Carolina Transportation Infrastructure Bank Revenue Bonds Series A (XLCA) (NR/A1) | |
| $3,000,000 | | | 5.000 | % | | 10/01/22 | | $ | 3,185,340 | |
| | | | | | | | | | |
| | | | | | | | | 11,728,712 | |
| |
South Dakota – 0.4% | |
| South Dakota State Health & Educational Facilities Authority Revenue Bonds (Avera Health Issue) Series A (AA-/A1) | |
| 1,000,000 | | | 5.000 | | | 07/01/25 | | | 1,157,850 | |
| |
Tennessee – 0.3% | |
| Tennessee Housing Development Agency Revenue Bonds Homeownership Program Series 1C (Non-AMT) (GO of Agency) (AA+/Aa1) | |
| 915,000 | | | 3.500 | | | 07/01/27 | | | 944,902 | |
| |
Texas – 4.5% | |
| Canyon TX Regional Water Authority Contract Revenue Bonds (Refunding-Mid Cities Project) (AMBAC) (A+/NR) | |
| 220,000 | | | 5.000 | | | 08/01/22 | | | 231,983 | |
| Harris County TX Improvement District No. 18 Series 2014 (AGM) (AA/A2) | |
| 1,340,000 | | | 5.000 | | | 09/01/22 | | | 1,595,417 | |
| Houston County TX GO Bonds (Certificates of Obligation) (A/NR) | |
| 235,000 | | | 5.000 | | | 02/15/20 | | | 258,371 | |
| Kyle TX GO Bonds (Refunding) Series 2015 (AA-/NR) | |
| 1,000,000 | | | 4.000 | | | 08/15/26 | | | 1,097,500 | |
| Lower Colorado River Authority Revenue Bonds (Prerefunded-Refunding) (NR/NR)(c) | |
| 5,000 | | | 5.625 | | | 05/15/19 | | | 5,865 | |
| Nolan County TX Hospital District GO Bonds Series 2014 (NR/A3) | |
| 1,025,000 | | | 5.000 | | | 08/15/27 | | | 1,177,366 | |
| North Texas Tollway Authority Revenue Bonds (Refunding-System-First) Series A (AA/A2) | |
| 600,000 | | | 5.750 | | | 01/01/40 | | | 664,638 | |
| Texas State GO Bonds (AMT) Series 2014 (AAA/Aaa) | |
| 2,635,000 | | | 6.000 | | | 08/01/21 | | | 3,278,204 | |
| Wichita Falls TX Water & Sewer System Revenue Bonds (Refunding-Priority Lien) Series 2008 (NATL) (AA-/A3) | |
| 4,055,000 | | | 4.500 | | | 08/01/26 | | | 4,231,312 | |
| | | | | | | | | | |
| | | | | | | | | 12,540,656 | |
| |
Vermont – 0.6% | |
| Vermont Economic Development Authority Revenue Bonds (Central Vermont Public Service Corp.-Recovery Zone Facility) (NR/WR) | |
| 1,000,000 | | | 5.000 | | | 12/15/20 | | | 1,147,590 | |
| Vermont State Student Assistance Corp. Education Loan Revenue Bonds Series A (AMT) (AA/NR) | |
| 410,000 | | | 4.000 | | | 06/15/20 | | | 439,327 | |
| | | | | | | | | | |
| | | | | | | | | 1,586,917 | |
| |
| | |
| 30 | | The accompanying notes are an integral part of these financial statements. |
COMMERCE NATIONAL TAX-FREE INTERMEDIATE BOND FUND
| | | | | | | | | | |
Principal
Amount | | Interest
Rate | | | Maturity
Date | | Value | |
| Municipal Bond Obligations – (continued) | |
Virginia – 2.5% | |
| Fairfax County VA Economic Development Authority Revenue Bonds (Refunding Facilities Project) Series A (AA+/Aa1) | |
| $5,000,000 | | | 5.000 | % | | 10/01/23 | | $ | 6,111,850 | |
| Richmond VA Metropolitan Authority Expressway Revenue Bonds (Prerefunded-Refunding) (ETM) Series 1998 (AA-/A3) | |
| 420,000 | | | 5.250 | | | 07/15/17 | | | 437,737 | |
| Richmond VA Metropolitan Authority Expressway Revenue Bonds (Unrefunded-Refunding) Series 1998 (AA-/A3) | |
| 225,000 | | | 5.250 | | | 07/15/17 | | | 228,397 | |
| | | | | | | | | | |
| | | | | | | | | 6,777,984 | |
| |
Washington – 4.3% | |
| COB Properties WA Lease Revenue Bonds (Bothell City Hall Project) Series 2014 (AA/NR) | |
| 1,620,000 | | | 5.000 | | | 12/01/26 | | | 1,930,911 | |
| King County WA School District No. 414 Lake Washington GO Bonds Series 2007 (AGM) (AA/Aaa) | |
| 1,000,000 | | | 5.000 | | | 12/01/20 | | | 1,107,250 | |
| Port of Seattle WA Revenue Bonds (Refunding-Intermediate Lien) Series 2006 (XLCA) (A+/A1) | |
| 1,400,000 | | | 5.000 | | | 02/01/26 | | | 1,444,492 | |
| Puyallup WA Combined Utility Revenue Bonds Series A (AA/NR) | |
| 160,000 | | | 4.000 | | | 11/01/15 | | | 162,675 | |
| Skagit County Public Hospital District No. 1 GO Bonds (Refunding-Skagit Regional Health) (NR/A1) | |
| 2,000,000 | | | 5.000 | | | 12/01/23 | | | 2,405,840 | |
| Washington Higher Education Facilities Authority Revenue Bonds Seattle University Project Series 2011 (Refunding) (A/NR) | |
| 560,000 | | | 5.000 | | | 05/01/18 | | | 618,464 | |
| Washington State Health Care Facilities Authority Revenue Bonds (Catholic Health Initiatives) Series D (A/A2) | |
| 500,000 | | | 6.000 | | | 10/01/23 | | | 577,670 | |
| Washington State Health Care Facilities Authority Revenue Bonds (Multicare Health System) Series A (AA-/Aa3) | |
| 1,495,000 | | | 5.000 | | | 08/15/27 | | | 1,741,869 | |
| Washington State Housing Finance Commission Revenue Bonds (Single Family Program) Series 1N (Non-AMT) (NR/Aaa) | |
| 925,000 | | | 3.500 | | | 12/01/23 | | | 970,112 | |
| 860,000 | | | 3.700 | | | 06/01/24 | | | 904,755 | |
| | | | | | | | | | |
| | | | | | | | | 11,864,038 | |
| |
Wisconsin – 0.5% | |
| Milwaukee County WI Airport Revenue Bonds (Refunding) Series B (AMT) (NATL-RE) (NR/A2) | |
| 350,000 | | | 5.000 | | | 12/01/15 | | | 359,296 | |
| Wisconsin State Health & Educational Facilities Authority Revenue Bonds (Children’s Hospital of Wisconsin) (AA-/Aa3) | |
| 1,000,000 | | | 5.000 | | | 08/15/21 | | | 1,115,600 | |
| | | | | | | | | | |
| | | | | | | | | 1,474,896 | |
| |
| | | | | | | | | | |
Principal
Amount | | Interest
Rate | | | Maturity
Date | | Value | |
| Municipal Bond Obligations – (continued) | |
Wyoming – 0.7% | |
| Lincoln County Building Corp. Lease Revenue Bonds Series 2012 (A+/NR) | |
| $ 140,000 | | | 1.000 | % | | 05/01/15 | | $ | 140,000 | |
| 290,000 | | | 2.000 | | | 05/01/16 | | | 292,474 | |
| 295,000 | | | 2.000 | | | 05/01/17 | | | 296,608 | |
| 305,000 | | | 3.000 | | | 05/01/18 | | | 311,841 | |
| Wyoming Community Development Authority Homeownership Mortgage Revenue Bonds Series A (NR/Aa2) | |
| 450,000 | | | 2.250 | | | 12/01/16 | | | 455,431 | |
| Wyoming Community Development Authority Housing Revenue Bonds Series 8 (AMT) (AA+/Aa1) | |
| 385,000 | | | 4.300 | | | 12/01/15 | | | 389,832 | |
| | | | | | | | | | |
| | | | | | | | | 1,886,186 | |
| |
| TOTAL MUNICIPAL BOND OBLIGATIONS | |
(Cost $251,948,684) | | $ | 259,437,820 | |
| |
| | | | | | | | | | |
| Shares | | Description | | | | | Value | |
| Investment Company – 2.1% | |
T. Rowe Price Tax-Free High Yield Fund (NR/NR) | |
| 493,274 | | | | | | | | $ | 5,899,552 | |
(Cost $5,500,000) | | | | | | | |
| |
| | | | | | | | | | |
Principal Amount | | Interest
Rate | | | Maturity
Date | | Value | |
| Short-term Investment(d) – 0.2% | |
Repurchase Agreement – 0.2% | |
| State Street Bank & Trust Co. | |
| $ 470,000 | | | 0.000 | % | | 05/01/15 | | $ | 470,000 | |
Maturity Value: $470,000 | | | | |
(Cost $470,000) | | | | | | | |
| |
| TOTAL INVESTMENTS – 96.5% | |
(Cost $257,918,684) | | | | | $ | 265,807,372 | |
| |
OTHER ASSETS IN EXCESS OF LIABILITIES – 3.5% | | | 9,548,655 | |
| |
| NET ASSETS – 100.0% | | $ | 275,356,027 | |
| |
| | |
| The percentage shown for each investment category reflects the value of investments in that category as a percentage of net assets. |
| |
| (a) | | Issued with a zero coupon. Income is recognized through the accretion of discount. |
| |
| (b) | | Variable rate security. The interest rate shown reflects the rate as of April 30, 2015. |
| |
| (c) | | Prerefunded security. Maturity date disclosed is prerefunding date. |
| |
| (d) | | Repurchase agreement was entered into on April 30, 2015. This agreement was fully collateralized by $340,000 U.S. Treasury Bond, 8.000%, due 11/15/21 with a market value of $486,304. |
| | |
| The accompanying notes are an integral part of these financial statements. | | 31 |
COMMERCE NATIONAL TAX-FREE INTERMEDIATE BOND FUND
Schedule of Investments (continued)
April 30, 2015 (Unaudited)
| | |
| Security ratings disclosed, if any, are issued by Standard & Poor’s Ratings Services/Moody’s Investors Service and are unaudited. A description of the ratings is available in the Fund’s Statement of Additional Information. |
| | |
|
| Investment Abbreviations: |
| AGC | | —Insured by Assured Guaranty Corp. |
| AGM | | —Insured by Assured Guaranty Municipal Corp. |
| AMBAC | | —Insuredby American Municipal Bond Assurance Corp. |
| AMT | | —AlternativeMinimum Tax |
| BHAC | | —BerkshireHathaway Assurance Corp. |
| ETM | | —Escrowto Maturity |
| FGIC | | —Insuredby Financial Guaranty Insurance Co. |
| FHA | | —Insuredby Federal Housing Administration |
| FHLMC | | —FederalHome Loan Mortgage Corp. |
| FNMA | | —FederalNational Mortgage Association |
| GNMA | | —GovernmentNational Mortgage Association |
| GO | | —GeneralObligation |
| NATL-RE | | —Insuredby National Reinsurance Corp. |
| NR | | —Not Rated |
| PSF-GTD | | —Guaranteedby Permanent School Fund |
| Q-SBLF | | —QualifiedSchool Bond Loan Fund |
| VA | | —VeteransAdministration |
| WR | | —WithdrawnRating |
| XLCA | | —Insuredby XL Capital Assurance, Inc. |
|
PORTFOLIO COMPOSITION
| | | | | | | | |
| | | AS OF
4/30/15 | | | AS OF
10/31/14 | |
| |
General Obligation | | | 18.8 | % | | | 17.6 | % |
Education | | | 14.5 | | | | 18.2 | |
Lease | | | 12.8 | | | | 8.7 | |
Hospital | | | 12.2 | | | | 11.1 | |
General | | | 9.6 | | | | 8.8 | |
Transportation | | | 9.4 | | | | 11.4 | |
Student | | | 5.9 | | | | 6.8 | |
Single Family Housing | | | 4.2 | | | | 6.1 | |
Power | | | 3.0 | | | | 3.1 | |
Investment Company | | | 2.1 | | | | 2.2 | |
Water/Sewer | | | 1.6 | | | | 2.5 | |
Multi Family Housing | | | 1.2 | | | | 1.3 | |
Prerefunded/Escrow to Maturity | | | 1.0 | | | | 0.9 | |
Short-term Investment | | | 0.2 | | | | 0.1 | |
| |
| TOTAL INVESTMENTS | | | 96.5 | % | | | 98.8 | % |
| |
The percentage shown for each investment category reflects the value of investments in that category as a percentage of net assets. Underlying investment categories of investment companies held by the Fund are not reflected in the table above. Consequently, the Fund’s overall investment category allocations may differ from the percentages contained in the table above.
The Fund is actively managed and, as such, its composition may differ over time.
| | |
| 32 | | The accompanying notes are an integral part of these financial statements. |
COMMERCE MISSOURI TAX-FREE INTERMEDIATE BOND FUND
Schedule of Investments
April 30, 2015 (Unaudited)
| | | | | | | | | | |
Principal
Amount | | Interest
Rate | | | Maturity
Date | | Value | |
| Municipal Bond Obligations – 95.9% | |
Arizona – 0.8% | |
| Arizona Healthcare & Education Facilities Authority Revenue Bonds (Kirksville College) (A-/NR) | |
| $1,000,000 | | | 5.000 | % | | 01/01/25 | | $ | 1,128,430 | |
| Pinal City Arizona Unified School District No. 1 Florence School Improvement Project of 2006 GO Bonds Series C (A/NR) | |
| 1,215,000 | | | 5.150 | | | 07/01/24 | | | 1,372,853 | |
| | | | | | | | | | |
| | | | | | | | | 2,501,283 | |
| |
California(a) – 0.9% | |
| Burbank CA Unified School District GO Bonds Capital Appreciation Election of 1997 Series C (NATL-RE) (FGIC) (AA-/A3) | |
| 2,000,000 | | | 0.000 | | | 07/01/27 | | | 1,305,520 | |
| Washington CA Unified School District GO Bonds Capital Appreciation Election of 2004 (Yolo County) Series A (NATL-RE) (FGIC) (AA-/A3) | |
| 2,400,000 | | | 0.000 | | | 08/01/29 | | | 1,320,552 | |
| | | | | | | | | | |
| | | | | | | | | 2,626,072 | |
| |
Colorado – 0.1% | |
| Colorado Housing & Finance Authority Revenue Bonds (Single Family Mortgage) Class I Series A (FHA) (AAA/Aaa) | |
| 420,000 | | | 4.350 | | | 11/01/19 | | | 429,790 | |
| |
Florida – 0.7% | |
| Gulf Breeze FL Revenue Bonds (Local Government Loan) Series J (A+/Aa3) | |
| 1,000,000 | | | 4.500 | | | 12/01/20 | | | 1,137,980 | |
| Miami-Dade County FL GO Bonds (Building Better Communities Program) Series 2005 (NATL-RE) (AA/Aa2)(b) | |
| 1,000,000 | | | 5.000 | | | 07/01/15 | | | 1,007,600 | |
| | | | | | | | | | |
| | | | | | | | | 2,145,580 | |
| |
Hawaii(b) – 1.1% | |
| Honolulu City & County GO Bonds Series A (NR/Aa1) | |
| 3,000,000 | | | 5.250 | | | 04/01/19 | | | 3,460,950 | |
| |
Idaho – 0.0% | |
| Idaho Housing & Finance Association Revenue Bonds (Single Family Mortgage) Series B Class I (NR/Aa2) | |
| 70,000 | | | 5.250 | | | 07/01/29 | | | 74,071 | |
| |
Illinois – 1.5% | |
| Illinois Finance Authority Revenue Bonds (Refunding-Swedish Covenant) Series A (BBB+/NR) | |
| 1,000,000 | | | 5.500 | | | 08/15/24 | | | 1,133,310 | |
| Kendall Kane & Will Counties IL Community Unit School District No. 308 Series 2014 (NR/Aa2) | |
| 2,000,000 | | | 4.125 | | | 02/01/30 | | | 2,116,500 | |
| Will County IL Community Unit School District No. 201 Crete-Monee GO Bonds (Capital Appreciation) Series 2004 (NATL-RE) (FGIC) (AA-/A3)(a) | |
| 1,500,000 | | | 0.000 | | | 11/01/19 | | | 1,367,550 | |
| | | | | | | | | | |
| | | | | | | | | 4,617,360 | |
| |
Indiana – 0.2% | |
| Indiana Bond Bank Revenue Bonds (Special Program-Hendricks Regional Health) Series A (AA/NR) | |
| 500,000 | | | 5.500 | | | 02/01/29 | | | 563,690 | |
| |
Iowa – 0.5% | |
| Waterloo Community School District Infrastructure Sales & Services Tax Revenue Bonds (Refunding) Series A (A/NR) | |
| 1,245,000 | | | 5.250 | | | 01/01/30 | | | 1,410,336 | |
| |
| | | | | | | | | | |
Principal
Amount | | Interest
Rate | | | Maturity
Date | | Value | |
| Municipal Bond Obligations – (continued) | |
Louisiana – 3.2% | |
| Louisiana Local Government Environmental Facilities & Community Development Authority Revenue Bonds (Refunding-Independence Stadium Project) (A/NR) | |
| $1,525,000 | | | 5.000 | % | | 03/01/21 | | $ | 1,674,587 | |
| Louisiana Local Government Environmental Facilities & Community Development Authority Revenue Bonds (Woman’s Hospital Foundation) Series A (A/A3) | |
| 7,000,000 | | | 5.500 | | | 10/01/25 | | | 8,198,330 | |
| | | | | | | | | | |
| | | | | | | | | 9,872,917 | |
| |
Michigan(b) – 0.3% | |
| Michigan State Hospital Finance Authority Revenue Bonds (McLaren Health Care) Series C (NR/Aa3) | |
| 1,000,000 | | | 5.000 | | | 08/01/15 | | | 1,010,870 | |
| |
Missouri – 81.6% | |
| Arnold MO Certificates of Participation (A+/NR) | |
| 200,000 | | | 3.000 | | | 11/01/17 | | | 205,816 | |
| 230,000 | | | 3.000 | | | 11/01/18 | | | 237,006 | |
| 210,000 | | | 3.000 | | | 11/01/19 | | | 215,897 | |
| 225,000 | | | 3.625 | | | 11/01/22 | | | 231,962 | |
| 470,000 | | | 3.700 | | | 11/01/23 | | | 483,179 | |
| 225,000 | | | 3.800 | | | 11/01/24 | | | 236,021 | |
| 480,000 | | | 3.875 | | | 11/01/25 | | | 502,574 | |
| 250,000 | | | 4.000 | | | 11/01/26 | | | 263,138 | |
| Belton MO Certificates of Participation (A+/NR) | |
| 500,000 | | | 5.125 | | | 03/01/25 | | | 548,725 | |
| 500,000 | | | 5.250 | | | 03/01/29 | | | 548,260 | |
| Belton MO School District No. 124 Direct Deposit Program GO Bonds (Refunding) Series B (AA+/Aa1) | |
| 150,000 | | | 4.000 | | | 03/01/21 | | | 161,142 | |
| Bi-State Development Agency MO Metro District Revenue Bonds (Refunding-Combined Lien) Series A (AA+/Aa3) | |
| 1,000,000 | | | 5.000 | | | 10/01/33 | | | 1,125,540 | |
| Bi-State Development Agency MO Metro District Revenue Bonds (Refunding-St. Clair County Metrolink Project) (AGM) (AA/A2) | |
| 2,000,000 | | | 5.250 | | | 07/01/20 | | | 2,327,520 | |
| Boone County MO Hospital Revenue Bonds (NR/A3) | |
| 2,350,000 | | | 5.750 | | | 08/01/28 | | | 2,660,552 | |
| Boone County MO Hospital Revenue Bonds Series 2012 (NR/A3) | |
| 400,000 | | | 4.000 | | | 08/01/18 | | | 422,252 | |
| 500,000 | | | 4.000 | | | 08/01/19 | | | 531,425 | |
| Branson MO Reorganized School District No. R-4 GO Bonds (AGM) (AA/A2) | |
| 1,000,000 | | | 5.000 | | | 03/01/18 | | | 1,003,140 | |
| Branson MO Reorganized School District No. R-4 GO Bonds Series 2012 (A+/NR) | |
| 2,000,000 | | | 4.000 | | | 03/01/27 | | | 2,101,060 | |
| Camdenton MO Reorganized School District No. RIII GO Bonds (Refunding & Improvement) (AGM) (AA/A2) | |
| 1,000,000 | | | 5.250 | | | 03/01/21 | | | 1,003,300 | |
| Cape Girardeau County MO Industrial Development Authority Revenue Bonds (St. Francis Medical Center) Series A (A+/NR) | |
| 750,000 | | | 5.000 | | | 06/01/26 | | | 862,447 | |
| Cass County MO Reorganized School District No. R-2 Raymore-Peculiar Direct Deposit Program GO Bonds (AA+/NR) | |
| 1,000,000 | | | 5.000 | | | 03/01/18 | | | 1,038,560 | |
| Chesterfield MO Certificates of Participation (AMBAC) (NR/Aa1) | |
| 600,000 | | | 5.000 | | | 02/15/22 | | | 705,228 | |
| |
| | |
| The accompanying notes are an integral part of these financial statements. | | 33 |
COMMERCE MISSOURI TAX-FREE INTERMEDIATE BOND FUND
Schedule of Investments (continued)
April 30, 2015 (Unaudited)
| | | | | | | | | | |
Principal
Amount | | Interest
Rate | | | Maturity
Date | | Value | |
| Municipal Bond Obligations – (continued) | |
Missouri – (continued) | |
| Clay County MO Public School District No. 53 Liberty School Building Direct Deposit Program GO Bonds (AA+/NR) | |
| $1,280,000 | | | 5.000 | % | | 03/01/25 | | $ | 1,419,085 | |
| Clayton MO Special Obligation Revenue Bonds (Build America Bonds) Series B (AA+/NR) | |
| 810,000 | | | 5.200 | | | 12/01/23 | | | 888,602 | |
| Cole County MO Certificates of Participation (Jail Project) (NR/Aa3)(b) | |
| 660,000 | | | 4.300 | | | 12/01/15 | | | 675,543 | |
| 1,400,000 | | | 4.500 | | | 12/01/15 | | | 1,434,566 | |
| Cottleville MO Certificates of Participation (Refunding) (NR/A2) | |
| 1,000,000 | | | 3.750 | | | 08/01/32 | | | 977,570 | |
| Duckett Creek MO Sewer District Revenue Bonds (Refunding-System) Series 2015 (NR/Aa3) | |
| 1,300,000 | | | 5.000 | | | 12/01/24 | | | 1,566,526 | |
| 1,215,000 | | | 5.000 | | | 12/01/25 | | | 1,472,993 | |
| Gladstone MO Certificates of Participation Series A (XLCA) (NR/A1) | |
| 475,000 | | | 5.000 | | | 06/01/23 | | | 496,309 | |
| Grain Valley MO Certificates of Participation (Refunding) (NR/NR) | |
| 200,000 | | | 5.000 | | | 09/01/20 | | | 205,664 | |
| Great Rivers Greenway Metropolitan Park & Recreation District (Gateway Arch Project) Series 2014 (A+/A1) | |
| 1,000,000 | | | 5.000 | | | 12/30/26 | | | 1,174,700 | |
| Greene County MO Certificates of Participation (Refunding-Law Enforcement) (NR/A1) | |
| 425,000 | | | 2.500 | | | 07/01/15 | | | 425,888 | |
| Greene County MO GO Bonds Limited-Jamestown NID Project Series B (NR/A1) | |
| 4,280,000 | | | 5.000 | | | 04/01/32 | | | 4,756,621 | |
| Greenwood MO GO Build America Bonds Taxable Series B (AA-/NR) | |
| 500,000 | | | 5.625 | | | 03/01/25 | | | 573,980 | |
| Higginsville MO Sewage Systems Revenue Bonds (Build America Bonds-Taxable Direct Payment to Issuer) (BBB-/NR) | |
| 500,000 | | | 5.924 | | | 10/01/30 | | | 530,850 | |
| I-470 & 350 Transportation Development District MO Sales Tax Revenue Bonds (Refunding & Improvement) (Radian) (AA/WR) | |
| 280,000 | | | 4.600 | | | 06/01/29 | | | 280,129 | |
| Jackson County MO Consolidated School District Direct Deposit Program GO Bonds (AA+/NR) | |
| 2,365,000 | | | 5.000 | | | 03/01/25 | | | 2,618,481 | |
| Jackson County MO Consolidated School District No. 2 Direct Deposit Program GO Bonds (NATL-RE) (AA+/A3) | |
| 1,250,000 | | | 5.000 | | | 03/01/22 | | | 1,294,400 | |
| Jackson County MO Public Building Corp. Leasehold Revenue Bonds (Capital Improvements Project) Series B (NR/Aa3)(b) | |
| 1,085,000 | | | 4.500 | | | 12/01/16 | | | 1,153,410 | |
| Jackson County MO Public Building Corp. Leasehold Revenue Bonds Series A (NATL-RE) (NR/Aa3) | |
| 500,000 | | | 5.000 | | | 12/01/20 | | | 534,290 | |
| Jackson County MO School District No. C-1 Hickman School Building Direct Deposit Program GO Bonds (AA+/NR) | |
| 500,000 | | | 5.000 | | | 03/01/24 | | | 553,150 | |
| Jackson County MO Special Obligation Revenue Bonds (Harry S. Truman Sports Complex) (AMBAC) (A/Aa3)(b) | |
| 1,360,000 | | | 5.000 | | | 12/01/16 | | | 1,456,383 | |
| |
| | | | | | | | | | |
Principal
Amount | | Interest
Rate | | | Maturity
Date | | Value | |
| Municipal Bond Obligations – (continued) | |
Missouri – (continued) | |
| Jackson County MO Special Obligation Revenue Bonds (Refunding-Truman Sports Complex Project) Series 2014 (NR/Aa3) | |
| $4,000,000 | | | 3.000 | % | | 12/01/16 | | $ | 4,153,840 | |
| 1,000,000 | | | 5.000 | | | 12/01/25 | | | 1,198,450 | |
| Jackson County MO Special Obligation Revenue Bonds (Truman Medical Center Projects) (NR/Aa3) | |
| 890,000 | | | 4.000 | | | 12/01/17 | | | 960,942 | |
| 595,000 | | | 4.250 | | | 12/01/23 | | | 656,910 | |
| Jackson County MO Special Obligation Revenue Bonds (Truman Medical Control Project) Series B (NR/Aa3) | |
| 900,000 | | | 3.500 | | | 12/01/18 | | | 966,276 | |
| 920,000 | | | 3.850 | | | 12/01/20 | | | 1,016,986 | |
| 500,000 | | | 4.350 | | | 12/01/23 | | | 561,535 | |
| 820,000 | | | 4.500 | | | 12/01/24 | | | 926,772 | |
| Jefferson County MO Consolidated Public Water Supply District No. C-1 Waterworks Revenue Bonds (Refunding) (A+/NR) | |
| 290,000 | | | 4.000 | | | 12/01/20 | | | 309,665 | |
| 435,000 | | | 4.000 | | | 12/01/21 | | | 464,271 | |
| 425,000 | | | 4.000 | | | 12/01/22 | | | 453,373 | |
| Joplin MO Industrial Development Authority Health Facilities Revenue Bonds (Freeman Health System Project) (BBB+/NR) | |
| 1,000,000 | | | 5.500 | | | 02/15/31 | | | 1,103,190 | |
| Joplin MO Industrial Development Authority Health Facilities Revenue Bonds (Refunding-Freeman Health System Project) Series 2014 (BBB+/NR) | |
| 1,895,000 | | | 5.000 | | | 02/15/27 | | | 2,121,813 | |
| Kansas City MO GO Bonds (Refunding & Improvement) Series A (AA/Aa2) | |
| 5,425,000 | | | 4.500 | | | 02/01/24 | | | 6,206,037 | |
| Kansas City MO Industrial Development Authority Revenue Bonds (AMBAC) (AA-/A1) | |
| 1,905,000 | | | 4.500 | | | 12/01/26 | | | 2,054,676 | |
| Kansas City MO Industrial Development Authority Revenue Bonds (Refunding & Downtown Redevelopment District) Series A (AA-/A1) | |
| 2,130,000 | | | 5.500 | | | 09/01/29 | | | 2,527,479 | |
| Kansas City MO Land Clearance Redevelopment Authority Revenue Bonds (Refunding & Improvement) (Municipal Auditorium-Garage) Series E (XLCA) (AA-/A1) | |
| 800,000 | | | 5.000 | | | 12/01/15 | | | 821,104 | |
| Kansas City MO Metropolitan Community Leasehold Jr. College Revenue Bonds (Refunding & Improvement) (NATL-RE) (FGIC) (NR/Aa2)(b) | |
| 1,075,000 | | | 5.000 | | | 07/01/16 | | | 1,133,233 | |
| Kansas City MO Special Obligation Revenue Bonds (Arena Project) (Refunding & Improvement) Series C (AA-/A1) | |
| 1,000,000 | | | 5.500 | | | 04/01/19 | | | 1,118,450 | |
| 1,575,000 | | | 5.500 | | | 04/01/23 | | | 1,759,637 | |
| Kansas City MO Special Obligation Revenue Bonds (Arena Project) (Refunding & Improvement) Series D (AA-/A1) | |
| 135,000 | | | 6.431 | | | 04/01/18 | | | 143,274 | |
| Kansas City MO Special Obligation Revenue Bonds (Capital Appreciation) Series E (AA-/A1)(a) | |
| 4,465,000 | | | 0.000 | | | 02/01/18 | | | 4,238,491 | |
| Kansas City MO Special Obligation Tax Allocation (East Village Project) Series A (AA-/A1) | |
| 500,000 | | | 5.000 | | | 04/15/31 | | | 571,035 | |
| |
| | |
| 34 | | The accompanying notes are an integral part of these financial statements. |
COMMERCE MISSOURI TAX-FREE INTERMEDIATE BOND FUND
| | | | | | | | | | |
Principal
Amount | | Interest
Rate | | | Maturity
Date | | Value | |
| Municipal Bond Obligations – (continued) | |
Missouri – (continued) | |
| Kirkwood MO Certificates of Participation (Build America Bonds-Taxable Direct Payment) (NR/Aa2) | |
| $ 500,000 | | | 6.050 | % | | 09/01/30 | | $ | 529,795 | |
| Kirkwood School District Educational Facilities Authority Leasehold Revenue Bonds (Refunding) (NR/Aa2) | |
| 1,860,000 | | | 5.000 | | | 02/15/20 | | | 2,132,192 | |
| Kirkwood School District Educational Facilities Authority Leasehold Revenue Bonds (Refunding) (NR/Aa2) | |
| 1,700,000 | | | 5.000 | | | 02/15/21 | | | 1,986,025 | |
| Ladue MO School District GO Bonds (Prerefunded-Refunding & Improvement) (NR/NR) | |
| 275,000 | | | 5.000 | | | 03/01/20 | | | 294,654 | |
| 305,000 | | | 5.000 | | | 03/01/22 | | | 326,798 | |
| 280,000 | | | 5.000 | | | 03/01/23 | | | 300,012 | |
| Ladue MO School District GO Bonds (Unrefunded-Refunding & Improvement) (AAA/NR) | |
| 225,000 | | | 5.000 | | | 03/01/20 | | | 242,955 | |
| 240,000 | | | 5.000 | | | 03/01/22 | | | 259,198 | |
| 220,000 | | | 5.000 | | | 03/01/23 | | | 237,347 | |
| Missouri Development Finance Board Cultural Facilities Revenue Bonds (Nelson Gallery Foundation) Series A (AA-/NR) | |
| 1,000,000 | | | 5.000 | | | 12/01/20 | | | 1,156,860 | |
| Missouri Joint Municipal Electric Utility Commission Power Project Revenue Bonds (Refunding-Iatan 2 Project) Series A (NR/A2) | |
| 3,115,000 | | | 5.000 | | | 01/01/31 | | | 3,513,253 | |
| Missouri Joint Municipal Electric Utility Commission Power Project Revenue Bonds (Refunding-Prairie State Project) Series A (NR/A2) | |
| 1,000,000 | | | 5.000 | | | 06/01/17 | | | 1,087,220 | |
| 1,500,000 | | | 5.000 | | | 12/01/17 | | | 1,655,205 | |
| Missouri School Board Association Lease Certificates of Participation for Liberty Public School District No. 53 (AA-/NR) | |
| 400,000 | | | 4.000 | | | 04/01/28 | | | 421,960 | |
| 425,000 | | | 5.000 | | | 04/01/31 | | | 472,328 | |
| 475,000 | | | 5.000 | | | 04/01/32 | | | 526,034 | |
| 500,000 | | | 5.000 | | | 04/01/33 | | | 552,090 | |
| 500,000 | | | 5.000 | | | 04/01/34 | | | 550,470 | |
| Missouri School Board Association Lease Certificates of Participation for Liberty Public School District No. 53 (AGM) (AA/A2) | |
| 830,000 | | | 5.250 | | | 03/01/21 | | | 891,644 | |
| 700,000 | | | 5.250 | | | 03/01/22 | | | 751,856 | |
| Missouri State Board of Public Buildings Special Obligation (Refunding) Series A (AA+/Aa1) | |
| 2,450,000 | | | 5.000 | | | 10/01/21 | | | 2,885,242 | |
| Missouri State Board of Public Buildings Special Obligation Revenue Bonds Series A (AA+/Aa1) | |
| 1,825,000 | | | 3.000 | | | 10/01/26 | | | 1,859,711 | |
| Missouri State Development Finance Board Cultural Facilities Revenue Bonds (Nilson Gallery Foundation) Series A (AA-/NR) | |
| 1,000,000 | | | 4.000 | | | 12/01/17 | | | 1,071,500 | |
| Missouri State Development Finance Board Revenue Bonds (Louis Convention Center) Series C (AA-/NR)(c) | |
| 1,205,000 | | | 0.140 | | | 12/01/20 | | | 1,205,000 | |
| Missouri State Environmental Improvement & Energy Resources Authority Water Pollution Control Revenue Bonds (State Revolving Funds Program) Series A (NR/Aaa) | |
| 400,000 | | | 5.500 | | | 01/01/23 | | | 460,552 | |
| |
| | | | | | | | | | |
Principal
Amount | | Interest
Rate | | | Maturity
Date | | Value | |
| Municipal Bond Obligations – (continued) | |
Missouri – (continued) | |
| Missouri State Environmental Improvement & Energy Resources Authority Water Pollution Control Revenue Bonds (State Revolving Funds Program) Series B (NR/Aaa) | |
| $1,115,000 | | | 5.000 | % | | 07/01/17 | | $ | 1,174,998 | |
| Missouri State Environmental Improvement & Energy Resources Authority Water Pollution Control Revenue Bonds (Unrefunded Balance-State Revolving Funds Program) Series B (GO of Authority) (NR/Aaa) | |
| 380,000 | | | 5.125 | | | 01/01/18 | | | 381,098 | |
| 5,000 | | | 5.000 | | | 01/01/22 | | | 5,013 | |
| Missouri State Health & Educational Facilities Authority Educational Facilities Revenue Bonds (A.T. Still University of Health Sciences) Series 2011 (A-/NR) | |
| 510,000 | | | 3.000 | | | 10/01/17 | | | 531,945 | |
| 525,000 | | | 4.000 | | | 10/01/18 | | | 566,234 | |
| 545,000 | | | 4.000 | | | 10/01/19 | | | 588,584 | |
| 400,000 | | | 3.500 | | | 10/01/21 | | | 417,264 | |
| 1,850,000 | | | 5.250 | | | 10/01/41 | | | 2,011,042 | |
| Missouri State Health & Educational Facilities Authority Educational Facilities Revenue Bonds (Kansas City University of Medicine And Biosciences) Series A (NR/A1) | |
| 1,440,000 | | | 4.500 | | | 06/01/28 | | | 1,529,021 | |
| Missouri State Health & Educational Facilities Authority Educational Facilities Revenue Bonds (Ranken Technical College) Series A (A-/A3) | |
| 1,000,000 | | | 5.125 | | | 11/01/31 | | | 1,119,830 | |
| Missouri State Health & Educational Facilities Authority Educational Facilities Revenue Bonds (University of Central Missouri) Series C (A/NR) | |
| 2,400,000 | | | 5.000 | | | 10/01/26 | | | 2,789,064 | |
| Missouri State Health & Educational Facilities Authority Health Facilities Revenue Bonds (Heartland Refunding Medical Center) (NR/A1) | |
| 2,000,000 | | | 5.000 | | | 02/15/37 | | | 2,159,480 | |
| Missouri State Health & Educational Facilities Authority Health Facilities Revenue Bonds (Prerefunded-Cox Health) Series A (NR/NR) | |
| 1,880,000 | | | 5.125 | | | 11/15/23 | | | 2,136,921 | |
| Missouri State Health & Educational Facilities Authority Health Facilities Revenue Bonds (St. Lukes Episcopal) Series 2011 (A/NR) | |
| 2,270,000 | | | 5.000 | | | 12/01/25 | | | 2,635,810 | |
| Missouri State Health & Educational Facilities Authority Health Facilities Revenue Bonds (Unrefunded-Cox Health) Series A (NR/A2) | |
| 470,000 | | | 5.125 | | | 11/15/23 | | | 528,327 | |
| Missouri State Health & Educational Facilities Authority Revenue Bonds (BJC Health System) Series 2014 (AA/Aa2) | |
| 1,000,000 | | | 5.000 | | | 01/01/17 | | | 1,072,540 | |
| 1,000,000 | | | 5.000 | | | 01/01/18 | | | 1,105,390 | |
| Missouri State Health & Educational Facilities Authority Revenue Bonds (BJC Health System) Series A (AA/Aa2) | |
| 1,225,000 | | | 5.000 | | | 05/15/18 | | | 1,229,226 | |
| 8,700,000 | | | 0.100 | (c) | | 05/15/38 | | | 8,700,000 | |
| Missouri State Health & Educational Facilities Authority Revenue Bonds (Children’s Mercy Hospital) (A+/NR) | |
| 1,000,000 | | | 5.000 | | | 05/15/23 | | | 1,126,690 | |
| |
| | |
| The accompanying notes are an integral part of these financial statements. | | 35 |
COMMERCE MISSOURI TAX-FREE INTERMEDIATE BOND FUND
Schedule of Investments (continued)
April 30, 2015 (Unaudited)
| | | | | | | | | | |
Principal
Amount | | Interest
Rate | | | Maturity
Date | | Value | |
| Municipal Bond Obligations – (continued) | |
Missouri – (continued) | |
| Missouri State Health & Educational Facilities Authority Revenue Bonds (Refunding & Improvement-Webster University Project) Series 2011 (NR/A2) | |
| $2,000,000 | | | 5.000 | % | | 04/01/22 | | $ | 2,318,100 | |
| 2,000,000 | | | 5.000 | | | 04/01/25 | | | 2,302,520 | |
| Missouri State Health & Educational Facilities Authority Revenue Bonds (Refunding-Lake Regional Health System) (BBB+/NR) | |
| 2,000,000 | | | 5.000 | | | 02/15/19 | | | 2,231,900 | |
| Missouri State Health & Educational Facilities Authority Revenue Bonds (SSM Health Care) Series B (A+/NR) | |
| 1,000,000 | | | 4.500 | | | 06/01/25 | | | 1,111,330 | |
| Missouri State Health & Educational Facilities Authority Revenue Bonds (St. Louis University) Series A (NR/A1)(c) | |
| 1,060,000 | | | 0.130 | | | 10/01/16 | | | 1,060,000 | |
| Missouri State Health & Educational Facilities Authority Revenue Bonds (St. Lukes Health System) Series A (AGM) (AA/A1) | |
| 1,000,000 | | | 5.000 | | | 11/15/19 | | | 1,140,410 | |
| Missouri State Health & Educational Facilities Authority Revenue Bonds (Variable-Washington University) Series B (JP Morgan Chase Bank NA) (AAA/Aaa)(c) | |
| 500,000 | | | 0.120 | | | 03/01/40 | | | 500,000 | |
| Missouri State Health & Educational Facilities Authority Revenue Bonds (Variable-Washington University) Series B (Wells Fargo Bank NA SPA) (AAA/Aaa)(c) | |
| 1,015,000 | | | 0.130 | | | 02/15/34 | | | 1,015,000 | |
| Missouri State Health & Educational Facility Revenue Bonds (St. Louis University) (U.S. Bank NA SPA) (NR/A1)(c) | |
| 7,395,000 | | | 0.120 | | | 07/01/32 | | | 7,395,000 | |
| Missouri State Highways & Transit Commission Road Revenue Bonds (Second Lien) (AAA/Aa1)(b) | |
| 1,165,000 | | | 5.250 | | | 05/01/17 | | | 1,271,213 | |
| Missouri State Housing Development Commission Multi Family Housing Revenue Bonds (Courthouse Apartments LLC) Series 2009-1 (FHA) (AA+/NR) | |
| 610,000 | | | 5.250 | | | 07/01/42 | | | 641,824 | |
| Missouri State Housing Development Commission Multi Family Housing Revenue Bonds (Samantha Heights Apartments Project) Series 2 (FHA) (AA+/NR) | |
| 500,000 | | | 4.375 | | | 07/01/30 | | | 523,430 | |
| Missouri State Housing Development Commission Single Family Mortgage Revenue Bonds (Special Homeownership Loan Program Market Bonds) Series E-1 (FHLMC) (AA+/NR) | |
| 517,000 | | | 3.950 | | | 05/01/21 | | | 530,695 | |
| 605,000 | | | 3.950 | | | 11/01/21 | | | 621,026 | |
| Missouri State Housing Development Commission Single Family Mortgage Revenue Bonds (Special Homeownership Loan Program) (Non-AMT) Series E-4 (GNMA/FNMA/FHLMC) (AA+/NR) | |
| 235,000 | | | 1.500 | | | 05/01/15 | | | 235,000 | |
| 295,000 | | | 3.600 | | | 11/01/23 | | | 311,597 | |
| 440,000 | | | 3.750 | | | 05/01/24 | | | 466,638 | |
| 370,000 | | | 3.800 | | | 05/01/25 | | | 389,851 | |
| |
| | | | | | | | | | |
Principal
Amount | | Interest
Rate | | | Maturity
Date | | Value | |
| Municipal Bond Obligations – (continued) | |
Missouri – (continued) | |
| Missouri State University Auxiliary Enterprise System Revenue Bonds (Refunding) Series A (A+/A1) | |
| $1,170,000 | | | 4.000 | % | | 04/01/19 | | $ | 1,282,870 | |
| 2,835,000 | | | 4.000 | | | 04/01/26 | | | 3,039,829 | |
| Monarch-Chesterfield MO Levee District Special Tax (A-/NR) | |
| 3,425,000 | | | 4.000 | | | 03/01/19 | | | 3,594,743 | |
| North Kansas City MO Levee District (Improvement) Series 2011 (A-/NR) | |
| 275,000 | | | 3.000 | | | 04/01/18 | | | 283,115 | |
| 280,000 | | | 3.000 | | | 04/01/19 | | | 288,761 | |
| 265,000 | | | 3.250 | | | 04/01/20 | | | 273,146 | |
| 275,000 | | | 4.000 | | | 04/01/21 | | | 295,884 | |
| 315,000 | | | 4.000 | | | 04/01/22 | | | 338,921 | |
| 385,000 | | | 4.500 | | | 04/01/27 | | | 415,561 | |
| 405,000 | | | 4.500 | | | 04/01/28 | | | 435,578 | |
| 425,000 | | | 4.625 | | | 04/01/29 | | | 457,742 | |
| 445,000 | | | 4.750 | | | 04/01/30 | | | 483,408 | |
| North Kansas City MO School District No. 74 Certificates of Participation Series 2015 (NR/Aa3) | |
| 520,000 | | | 3.000 | | | 09/01/17 | | | 542,464 | |
| 540,000 | | | 3.000 | | | 09/01/18 | | | 567,767 | |
| Northwest Missouri State University Revenue Bonds (Housing System) (NR/A3) | |
| 1,535,000 | | | 2.000 | | | 06/01/19 | | | 1,508,874 | |
| 2,750,000 | | | 4.000 | | | 06/01/26 | | | 2,918,602 | |
| 2,925,000 | | | 4.000 | | | 06/01/27 | | | 3,072,010 | |
| 1,000,000 | | | 4.000 | | | 06/01/28 | | | 1,043,810 | |
| O’Fallon MO Certificates of Participation (NATL-RE) (NR/Aa3) | |
| 1,000,000 | | | 5.250 | | | 11/01/18 | | | 1,133,570 | |
| O’Fallon MO Special Obligation Revenue Bonds Series 2012 (AA-/NR) | |
| 1,135,000 | | | 4.000 | | | 11/01/22 | | | 1,225,789 | |
| OTC Public Building Corp. MO Build America Bonds Revenue Bonds Series 2010 (AGM) (AA/NR) | |
| 1,000,000 | | | 6.400 | | | 03/01/30 | | | 1,148,250 | |
| OTC Public Building Corp. MO Leasehold Revenue Bonds (Refunding-Ozarks Technical Community College) (AGM) (AA/NR) | |
| 1,500,000 | | | 5.000 | | | 03/01/19 | | | 1,684,170 | |
| Ozark MO Certificates of Participation Series 2014 (A+/NR) | |
| 500,000 | | | 5.000 | | | 09/01/44 | | | 538,740 | |
| Ozark MO Reorganized School District No. R-6 GO Bonds (Direct Deposit Program) (AGM) (AA+/A2) | |
| 440,000 | | | 5.000 | | | 03/01/22 | | | 472,692 | |
| Platte County MO Industrial Development Authority Transportation Revenue Bonds (Refunding & Improvement-Zona Rosa Retail Project) (AA-/NR) | |
| 435,000 | | | 5.000 | | | 12/01/18 | | | 481,301 | |
| 850,000 | | | 5.000 | | | 12/01/20 | | | 940,015 | |
| Republic MO Special Obligation Revenue Bonds (A/NR) | |
| 175,000 | | | 2.500 | | | 05/01/15 | | | 175,000 | |
| 150,000 | | | 2.650 | | | 05/01/16 | | | 151,716 | |
| 330,000 | | | 2.500 | | | 08/01/16 | | | 333,300 | |
| |
| | |
| 36 | | The accompanying notes are an integral part of these financial statements. |
COMMERCE MISSOURI TAX-FREE INTERMEDIATE BOND FUND
| | | | | | | | | | |
Principal
Amount | | Interest
Rate | | | Maturity
Date | | Value | |
| Municipal Bond Obligations – (continued) | |
Missouri – (continued) | |
| Republic MO Special Obligation Revenue Bonds (A/NR) – (continued) | |
| $ 125,000 | | | 3.000 | % | | 05/01/17 | | $ | 127,573 | |
| 345,000 | | | 3.000 | | | 08/01/17 | | | 352,207 | |
| 150,000 | | | 3.150 | | | 05/01/18 | | | 153,618 | |
| 360,000 | | | 3.000 | | | 08/01/18 | | | 366,797 | |
| 150,000 | | | 3.300 | | | 05/01/19 | | | 154,616 | |
| 250,000 | | | 3.500 | | | 05/01/20 | | | 257,668 | |
| 300,000 | | | 3.750 | | | 05/01/21 | | | 317,487 | |
| 325,000 | | | 3.875 | | | 05/01/22 | | | 344,442 | |
| Ritenour MO School District Direct Deposit Program GO Bonds (AA+/NR) | |
| 1,740,000 | | | 4.500 | | | 03/01/17 | | | 1,798,203 | |
| Riverside MO Tax Increment Revenue Tax Allocation (L-385 Levee Project) (A/NR)(b) | |
| 1,000,000 | | | 5.250 | | | 05/01/15 | | | 1,000,000 | |
| Rolla MO Certificates of Participation Series B (A+/NR) | |
| 225,000 | | | 3.150 | | | 07/01/27 | | | 218,774 | |
| 410,000 | | | 3.450 | | | 07/01/32 | | | 394,527 | |
| Saint Charles MO GO Bonds (Neighborhood Improvement District-Phase Two) Series B (NR/Aa2) | |
| 1,035,000 | | | 3.000 | | | 03/01/27 | | | 1,028,852 | |
| Saint Charles MO GO Bonds (Neighborhood Improvement District-Phase Two) Series B (NR/Aa2) | |
| 645,000 | | | 3.000 | | | 03/01/23 | | | 650,921 | |
| Saint Louis MO Special Administrative Board of the Transitional School District GO Bonds (Direct Deposit Program) Series 2012 (AA+/NR) | |
| 3,000,000 | | | 4.000 | | | 04/01/23 | | | 3,299,730 | |
| Saint Louis MO Special Administrative Board of the Transitional School District GO Bonds (Direct Deposit Program) Series A (AA+/NR) | |
| 1,300,000 | | | 4.000 | | | 04/01/23 | | | 1,429,883 | |
| Saint Louis MO Special Administrative Board of the Transitional School District GO Bonds (Direct Deposit Program) Series B (AA+/NR) | |
| 2,675,000 | | | 4.000 | | | 04/01/24 | | | 2,900,101 | |
| Springfield MO Public Building Corp. Leasehold Revenue Bonds (Taxable Improvement-Branson National Airport) (NR/Aa2) | |
| 540,000 | | | 6.750 | | | 03/01/28 | | | 607,900 | |
| 575,000 | | | 6.850 | | | 03/01/29 | | | 646,599 | |
| Springfield MO Public Building Corp. Revenue Bonds (AMT-Springfield Branson Airport) Series B (AMBAC) (NR/Aa2) | |
| 400,000 | | | 5.000 | | | 07/01/16 | | | 419,948 | |
| Springfield MO Public Utility Revenue Certificates of Participation (Lease Purchase for Various Projects) Series A (NATL-RE) (AA/Aa3) | |
| 1,000,000 | | | 5.000 | | | 12/01/18 | | | 1,026,150 | |
| Springfield MO Special Obligation Revenue Bonds (College Station Garage Project) Series A (NR/Aa3) | |
| 190,000 | | | 4.500 | | | 11/01/18 | | | 206,895 | |
| 530,000 | | | 4.500 | | | 11/01/19 | | | 576,720 | |
| 610,000 | | | 4.500 | | | 11/01/20 | | | 663,613 | |
| |
| | | | | | | | | | |
Principal
Amount | | Interest
Rate | | | Maturity
Date | | Value | |
| Municipal Bond Obligations – (continued) | |
Missouri – (continued) | |
| Springfield MO Special Obligation Revenue Bonds (College Station Garage Project) Series A (NR/Aa3) – (continued) | |
| $ 645,000 | | | 4.750 | % | | 11/01/21 | | $ | 705,482 | |
| 685,000 | | | 4.750 | | | 11/01/22 | | | 749,054 | |
| Springfield MO Special Obligation Revenue Bonds (Heers Garage Project) Series B (NR/Aa3) | |
| 385,000 | | | 4.750 | | | 11/01/21 | | | 421,101 | |
| 405,000 | | | 4.750 | | | 11/01/22 | | | 442,872 | |
| Springfield MO Special Obligation Revenue Bonds (Sewer Systems Improvement Project) Series 2012 (NR/Aa2) | |
| 1,275,000 | | | 5.000 | | | 04/01/22 | | | 1,497,181 | |
| 1,340,000 | | | 5.000 | | | 04/01/23 | | | 1,599,960 | |
| St. Charles County MO Public Water Supply District No. 2 Certificates of Participation (AA/NR) | |
| 2,115,000 | | | 4.000 | | | 12/01/20 | | | 2,155,396 | |
| 100,000 | | | 5.200 | | | 12/01/31 | | | 102,571 | |
| St. Charles County MO Water Supply District No. 2 Certificates of Participation (AA/NR) | |
| 650,000 | | | 5.375 | | | 12/01/36 | | | 666,978 | |
| St. Charles MO Certificates of Participation Build America Bonds Series B (NR/Aa3) | |
| 1,250,000 | | | 5.650 | | | 02/01/30 | | | 1,276,000 | |
| St. Charles MO Certificates of Participation Series 2012 (NR/A1) | |
| 1,000,000 | | | 3.000 | | | 05/01/22 | | | 1,021,160 | |
| St. Louis County MO Industrial Development Authority Health Facilities Revenue Bonds (Refunding-Ranken Jordan Project) (NR/NR) | |
| 490,000 | | | 5.000 | | | 11/15/15 | | | 493,959 | |
| 515,000 | | | 5.000 | | | 11/15/16 | | | 526,469 | |
| St. Louis County MO Library District Certificates of Participation (AA/Aa2) | |
| 1,855,000 | | | 4.000 | | | 04/01/25 | | | 2,042,262 | |
| 1,930,000 | | | 4.000 | | | 04/01/26 | | | 2,091,753 | |
| 2,010,000 | | | 4.000 | | | 04/01/27 | | | 2,147,564 | |
| St. Louis County MO Parkway School District No. C-2 GO Bonds (Refunding & Improvement) (AAA/NR) | |
| 400,000 | | | 3.250 | | | 03/01/19 | | | 428,060 | |
| St. Louis County MO Parkway School District No. C-2 GO Bonds Series B (AAA/NR) | |
| 1,000,000 | | | 4.000 | | | 03/01/32 | | | 1,080,960 | |
| St. Louis County MO Regional Convention & Sports Complex Authority Revenue Bonds (Refunding-Convention & Sports Facilities) Series B (AA/NR) | |
| 875,000 | | | 5.000 | | | 08/15/20 | | | 1,015,831 | |
| St. Louis County MO Special Obligation Revenue Bonds Series 2009 (AA/Aa2) | |
| 1,500,000 | | | 3.000 | | | 05/15/17 | | | 1,567,170 | |
| St. Louis County MO Special School District Certificates of Participation (Lease) Series B (AA/NR) | |
| 1,735,000 | | | 4.000 | | | 04/01/26 | | | 1,863,737 | |
| St. Louis MO Airport Revenue Bonds (Refunding-Lambert International Airport) Series 2012 (AMT) (A-/A3) | |
| 1,280,000 | | | 5.000 | | | 07/01/23 | | | 1,448,102 | |
| |
| | |
| The accompanying notes are an integral part of these financial statements. | | 37 |
COMMERCE MISSOURI TAX-FREE INTERMEDIATE BOND FUND
Schedule of Investments (continued)
April 30, 2015 (Unaudited)
| | | | | | | | | | |
Principal
Amount | | Interest
Rate | | | Maturity
Date | | Value | |
| Municipal Bond Obligations – (continued) | |
Missouri – (continued) | |
| St. Louis MO Airport Revenue Bonds (Refunding-Lambert International Airport) Series B (AMT) (AGM) (AA/A2) | |
| $2,000,000 | | | 5.000 | % | | 07/01/24 | | $ | 2,140,820 | |
| St. Louis MO Junior College District Building Corp. Leasehold Revenue Bonds (AA/NR) | |
| 100,000 | | | 4.000 | | | 04/01/16 | | | 103,418 | |
| St. Louis MO Junior College District Building Corp. Leasehold Revenue Bonds (Refunding) (AA/NR) | |
| 750,000 | | | 3.000 | | | 04/01/21 | | | 786,023 | |
| 800,000 | | | 3.000 | | | 04/01/22 | | | 835,040 | |
| 800,000 | | | 3.000 | | | 04/01/23 | | | 827,784 | |
| St. Louis MO Parking Revenue Bonds Series A (NATL-RE) (AA-/A3) | |
| 1,275,000 | | | 5.000 | | | 12/15/22 | | | 1,363,102 | |
| St. Louis MO Special Administrative Board Transitional School District GO Bonds (Direct Deposit Program) (AA+/NR) | |
| 4,250,000 | | | 5.000 | | | 04/01/21 | | | 4,736,880 | |
| St. Peters MO Certificates of Participation (Refunding) Series 2013 (NR/A1) | |
| 695,000 | | | 3.250 | | | 05/01/21 | | | 729,639 | |
| Taney County MO Certificates of Participation (NATL-RE) (NR/A1) | |
| 1,095,000 | | | 4.500 | | | 04/01/17 | | | 1,130,971 | |
| Truman State University MO Housing System Revenue Bonds (Refunding) (NR/A1) | |
| 765,000 | | | 4.000 | | | 06/01/21 | | | 843,107 | |
| Valley Park MO School District Educational Facilities Authority Leasehold Revenue Bonds (Refunding) (A+/NR) | |
| 300,000 | | | 2.750 | | | 03/01/17 | | | 311,226 | |
| 345,000 | | | 3.000 | | | 03/01/18 | | | 364,844 | |
| 360,000 | | | 3.000 | (b) | | 03/01/18 | | | 380,707 | |
| 385,000 | | | 3.150 | (b) | | 03/01/18 | | | 408,751 | |
| 700,000 | | | 3.300 | (b) | | 03/01/18 | | | 746,102 | |
| Wentzville R-IV School District MO Lease Certificates of Participation Series 2012 (NR/Aa3) | |
| 340,000 | | | 3.000 | | | 04/01/17 | | | 354,576 | |
| 560,000 | | | 3.000 | | | 04/01/18 | | | 582,814 | |
| 1,270,000 | | | 3.250 | | | 04/01/21 | | | 1,310,957 | |
| Willard MO Certificates of Participation (Parks & Recreation Project) Series B (A-/NR) | |
| 625,000 | | | 6.625 | | | 06/01/28 | | | 693,231 | |
| | | | | | | | | | |
| | | | | | | | | 250,679,701 | |
| |
New Hampshire – 1.1% | |
| New Hampshire Health & Education Facilities Authority Revenue Bonds (Concord Hospital) Series A (NR/A2) | |
| 1,340,000 | | | 4.000 | | | 10/01/22 | | | 1,489,450 | |
| 1,750,000 | | | 4.000 | | | 10/01/33 | | | 1,758,873 | |
| | | | | | | | | | |
| | | | | | | | | 3,248,323 | |
| |
New Jersey(c) – 2.0% | |
| New Jersey State Economic Development Authority Revenue Bonds School Facilities Construction (Refunding) Series F (A-/A3) | |
| 6,000,000 | | | 2.026 | | | 02/01/18 | | | 6,152,880 | |
| |
| | | | | | | | | | |
Principal
Amount | | Interest
Rate | | | Maturity
Date | | Value | |
| Municipal Bond Obligations – (continued) | |
Pennsylvania – 0.4% | |
| Delaware County Authority University Revenue Bonds for Neumann University (BBB/NR) | |
| $1,000,000 | | | 5.000 | % | | 10/01/25 | | $ | 1,086,600 | |
| |
Virginia – 1.5% | |
| Fairfax County VA Economic Development Authority Revenue Bonds (Refunding Facilities Project) Series A (AA+/Aa1) | |
| 3,900,000 | | | 5.000 | | | 10/01/23 | | | 4,767,243 | |
| |
| TOTAL MUNICIPAL BOND OBLIGATIONS | |
(Cost $282,502,465) | | | | | $ | 294,647,666 | |
| |
| | | | | | | | | | |
| Shares | | Description | | | | | Value | |
| Investment Company – 2.5% | |
| T. Rowe Price Tax-Free High Yield Fund (NR/NR) | |
| 627,803 | | | | | | | | $ | 7,508,520 | |
(Cost $7,000,000) | | | | | | | |
| |
| | | | | | | | | | |
Principal
Amount | | Interest
Rate | | | Maturity
Date | | Value | |
| Short-term Investment(d) – 0.3% | |
Repurchase Agreement – 0.3% | |
| State Street Bank & Trust Co. | |
| $1,040,000 | | | 0.000 | % | | 05/01/15 | | $ | 1,040,000 | |
Maturity Value: $1,040,000 | | | | |
(Cost $1,040,000) | | | | | | | |
| |
| TOTAL INVESTMENTS – 98.7% | |
(Cost $290,542,465) | | | | | $ | 303,196,186 | |
| |
OTHER ASSETS IN EXCESS OF LIABILITIES – 1.3% | | | 4,112,112 | |
| |
| NET ASSETS – 100.0% | | $ | 307,308,298 | |
| |
| | |
| The percentage shown for each investment category reflects the value of investments in that category as a percentage of net assets. |
| |
| (a) | | Issued with a zero coupon. Income is recognized through the accretion of discount. |
| |
| (b) | | Prerefunded security. Maturity date disclosed is prerefunding date. |
| |
| (c) | | Variable rate security. Interest rate or distribution rate disclosed is that which is in effect at April 30, 2015. |
| |
| (d) | | Repurchase agreement was entered into on April 30, 2015. This agreement was fully collateralized by $745,000 U.S. Treasury Bond, 8.000%, due 11/15/21 with a market value of $1,065,578. |
| Security ratings disclosed, if any, are issued by Standard & Poor’s Ratings Services/Moody’s Investors Service. A description of the ratings is available in the Fund’s Statement of Additional Information. |
|
| | |
| 38 | | The accompanying notes are an integral part of these financial statements. |
COMMERCE MISSOURI TAX-FREE INTERMEDIATE BOND FUND
| | |
|
| Investment Abbreviations: |
| AGM | | —Insured by Assured Guaranty Municipal Corp. |
| AMBAC | | —Insured by American Municipal Bond Assurance Corp. |
| AMT | | —Alternative Minimum Tax |
| FGIC | | —Insured by Financial Guaranty Insurance Co. |
| FHA | | —Insured by Federal Housing Administration |
| FHLMC | | —Federal Home Loan Mortgage Corp. |
| FNMA | | —Federal National Mortgage Association |
| GNMA | | —Government National Mortgage Association |
| GO | | —General Obligation |
| NATL-RE | | —Insured by National Reinsurance Corp. |
| NR | | —Not Rated |
| Radian | | —Insured by Radian Asset Assurance |
| SPA | | —Stand-by Purchase Agreement |
| VA | | —Veterans Administration |
| WR | | —Withdrawn Rating |
| XLCA | | —Insured by XL Capital Assurance, Inc. |
|
PORTFOLIO COMPOSITION
| | | | | | | | |
| | | AS OF
4/30/15 | | | AS OF
10/31/14 | |
| |
Lease | | | 19.9 | % | | | 19.0 | % |
General Obligation | | | 16.8 | | | | 19.6 | |
Hospital | | | 15.2 | | | | 16.9 | |
Education | | | 14.9 | | | | 16.8 | |
General | | | 13.2 | | | | 13.1 | |
Prerefunded/Escrow to Maturity | | | 6.1 | | | | 2.8 | |
Water/Sewer | | | 3.3 | | | | 2.3 | |
Investment Company | | | 2.5 | | | | 2.4 | |
Transportation | | | 2.3 | | | | 3.3 | |
Power | | | 2.0 | | | | 1.2 | |
Single Family Housing | | | 1.0 | | | | 1.1 | |
Crossover | | | 0.8 | | | | 1.2 | |
Multi Family Housing | | | 0.4 | | | | 0.4 | |
Short-term Investment | | | 0.3 | | | | 0.0 | |
| |
| TOTAL INVESTMENTS | | | 98.7 | % | | | 100.1 | % |
| |
The percentage shown for each investment category reflects the value of investments in that category as a percentage of net assets. Underlying investment categories of investment companies held by the Fund are not reflected in the table above. Consequently, the Fund’s overall investment category allocations may differ from the percentages contained in the table above.
The Fund is actively managed and, as such, its composition may differ over time.
| | |
| The accompanying notes are an integral part of these financial statements. | | 39 |
COMMERCE KANSAS TAX-FREE INTERMEDIATE BOND FUND
Schedule of Investments
April 30, 2015 (Unaudited)
| | | | | | | | | | |
Principal
Amount | | Interest
Rate | | | Maturity
Date | | Value | |
| Municipal Bond Obligations – 92.3% | |
Arizona – 0.5% | |
| Arizona Healthcare & Education Facilities Authority Revenue Bonds (Kirksville College) (A-/NR) | |
| $ 450,000 | | | 5.000 | % | | 01/01/25 | | $ | 507,794 | |
| |
California(a) – 2.0% | |
| Burbank CA Unified School District GO Bonds Capital Appreciation Election of 1997 Series C (NATL-RE) (FGIC) (AA-/A3) | |
| 670,000 | | | 0.000 | | | 07/01/27 | | | 437,349 | |
| San Marcos Unified School District GO Bonds (Capital Appreciation) (AA-/Aa3) | |
| 2,275,000 | | | 0.000 | | | 08/01/24 | | | 1,740,466 | |
| | | | | | | | | | |
| | | | | | | | | 2,177,815 | |
| |
Florida(b) – 0.7% | |
| Miami-Dade County FL GO Bonds (Building Better Communities Program) Series 2005 (NATL-RE) (AA/Aa2) | |
| 750,000 | | | 5.000 | | | 07/01/15 | | | 755,700 | |
| |
Illinois(a) – 0.4% | |
| Will County IL Community Unit School District No. 201 Crete-Monee GO Bonds (Capital Appreciation) Series 2004 (NATL-RE) (FGIC) (AA-/A3) | |
| 500,000 | | | 0.000 | | | 11/01/19 | | | 455,850 | |
| |
Kansas – 82.0% | |
| Allen County KS Public Building Community Revenue Bonds (Allen County Hospital Project) Series 2012 (A/NR) | |
| 1,090,000 | | | 5.000 | | | 12/01/27 | | | 1,235,090 | |
| 1,140,000 | | | 5.000 | | | 12/01/28 | | | 1,285,988 | |
| 1,195,000 | | | 5.000 | | | 12/01/29 | | | 1,335,197 | |
Burlington KS Environment Improvement Revenue Bonds (Refunding-Kansas City Power & Light) Series A (AAA/Aa1)(c) | |
| 1,700,000 | | | 0.100 | | | 09/01/35 | | | 1,700,000 | |
| Burlington KS Pollution Control Revenue Bonds (Refunding Gas & Electric) (NATL-RE) (AA-/A2) | |
| 190,000 | | | 4.850 | | | 06/01/31 | | | 196,620 | |
| Butler County KS Unified School District No. 490 GO Bonds (Refunding-School Building) Series A (AA-/NR) | |
| 500,000 | | | 5.000 | | | 09/01/18 | | | 560,645 | |
| Chisholm Creek Utility Authority KS Water and Wastewater Facilities Revenue Bonds (Refunding) (AMBAC) (NR/WR) | |
| 1,000,000 | | | 5.250 | | | 09/01/24 | | | 1,159,690 | |
| City of Abilene KS Public Building Commission Revenue Bonds Series 2011 (AA-/NR) | |
| 595,000 | | | 4.150 | | | 12/01/27 | | | 637,162 | |
| City of Manhattan KS Hospital Revenue Bonds (Refunding-Mercy Regional Hospital Center, Inc.) Series 2013 (A+/NR) | |
| 1,000,000 | | | 4.000 | | | 11/15/16 | | | 1,050,370 | |
| 2,000,000 | | | 5.000 | | | 11/15/29 | | | 2,269,160 | |
| City of McPherson KS Water System Revenue Bonds Series 2012 (Refunding) (A+/NR) | |
| 235,000 | | | 3.000 | | | 10/01/17 | | | 242,506 | |
| 500,000 | | | 3.000 | | | 10/01/18 | | | 517,210 | |
| 655,000 | | | 4.000 | | | 10/01/19 | | | 706,522 | |
| |
| | | | | | | | | | |
Principal
Amount | | Interest
Rate | | | Maturity
Date | | Value | |
| Municipal Bond Obligations – (continued) | |
Kansas – (continued) | |
| Coffeyville Public Building Commission Health Care Facilities Revenue Bonds Regional Medical Center (Refunding) Series 2012 (A+/NR) | |
| $1,115,000 | | | 3.000 | % | | 08/01/18 | | $ | 1,137,557 | |
| County of Shawnee KS Certificates of Participation First Responders Communications Projects Series 2012 (NR/Aa3) | |
| 1,145,000 | | | 4.000 | | | 09/01/26 | | | 1,218,887 | |
| Cowley County KS Unified School District No. 470 Arkansas City GO Bonds (Refunding) (A-/NR) | |
| 235,000 | | | 4.000 | | | 09/01/18 | | | 250,693 | |
| Dodge City KS Industrial Revenue Bonds (Dodge City Community College Activity Center) Series 2014 (A+/NR) | |
| 735,000 | | | 2.000 | | | 07/15/17 | | | 751,075 | |
| Dodge City KS Revenue Bonds (Refunding & Improvement) Series B (A+/NR) | |
| 1,815,000 | | | 4.000 | | | 09/01/20 | | | 1,989,676 | |
| Harvey County KS Unified School District No. 373 Newton GO Bonds (Refunding) Series 2014 (A+/NR) | |
| 550,000 | | | 2.000 | | | 09/01/17 | | | 564,641 | |
| Jackson County KS Unified School District No. 336 Denison-Holton GO Bonds (Refunding & Improvement) Series B (NR/A2) | |
| 510,000 | | | 2.000 | | | 09/01/15 | | | 512,672 | |
| Johnson & Miami County KS Unified School District No. 230 GO Bonds (Refunding) (NR/Aa3) | |
| 1,000,000 | | | 3.000 | | | 09/01/18 | | | 1,057,100 | |
| Johnson County KS Park & Recreation District Certificates of Participation Series A (NR/Aa2) | |
| 1,000,000 | | | 4.000 | | | 09/01/23 | | | 1,096,260 | |
| Johnson County KS Public Building Commission Lease Purchase Revenue Bonds (Refunding) Series C (AAA/Aaa) | |
| 750,000 | | | 4.000 | | | 09/01/18 | | | 814,860 | |
| 500,000 | | | 4.000 | | | 09/01/20 | | | 555,310 | |
| Johnson County KS Unified School District No. 229 GO Bonds Series A (AA+/Aaa) | |
| 945,000 | | | 4.000 | | | 10/01/23 | | | 1,036,022 | |
| Johnson County KS Unified School District No. 231 GO Bonds (Improvement) Series 2013-A (AA-/NR) | |
| 2,395,000 | | | 5.000 | | | 10/01/22 | | | 2,869,018 | |
| Johnson County KS Unified School District No. 231 GO Bonds (Refunding & Improvement) Series A (FGIC) (AA-/A3) | |
| 500,000 | | | 6.000 | | | 10/01/16 | | | 538,615 | |
| Johnson County KS Unified School District No. 231 GO Bonds (Refunding & Improvement) Series B (AMBAC) (AA-/NR) | |
| 925,000 | | | 5.000 | | | 10/01/22 | | | 982,017 | |
| Junction City KS GO Bonds (Refunding Water & Sewer System) Series B (A+/NR) | |
| 825,000 | | | 5.500 | | | 09/01/36 | | | 975,224 | |
| Junction City KS GO Bonds (Refunding) Series A (A+/NR) | |
| 560,000 | | | 5.000 | | | 09/01/18 | | | 616,571 | |
| 600,000 | | | 5.000 | | | 09/01/33 | | | 683,808 | |
| 600,000 | | | 5.000 | | | 09/01/34 | | | 679,692 | |
| Kansas Development Finance Authority Revenue Bonds (Wichita University Project) Series A (NR/Aa3) | |
| 525,000 | | | 3.000 | | | 06/01/23 | | | 534,912 | |
| |
| | |
| 40 | | The accompanying notes are an integral part of these financial statements. |
COMMERCE KANSAS TAX-FREE INTERMEDIATE BOND FUND
| | | | | | | | | | |
Principal
Amount | | Interest
Rate | | | Maturity
Date | | Value | |
| Municipal Bond Obligations – (continued) | |
Kansas – (continued) | |
| Kansas Development Finance Authority Revenue Bonds (Wichita University Union Corporation Student Housing Project) Series F-1 (NR/Aa3) | |
| $1,000,000 | | | 5.000 | % | | 06/01/24 | | $ | 1,169,480 | |
| Kansas State Department of Transportation Revenue Bonds Series C-2 (NR/Aa2)(c) | |
| 3,000,000 | | | 0.140 | | | 09/01/22 | | | 3,000,000 | |
| Kansas State Development Finance Authority Health Facilities Revenue Bonds (Hays Medical Center, Inc.) Series L (NR/A2) | |
| 1,750,000 | | | 5.000 | | | 11/15/20 | | | 1,791,073 | |
| Kansas State Development Finance Authority Health Facilities Revenue Bonds (Hays Medical Center, Inc.) Series Q (NR/A2) | |
| 750,000 | | | 5.000 | | | 05/15/35 | | | 824,130 | |
| Kansas State Development Finance Authority Hospital Revenue Bonds (Adventist Health) (AA-/Aa2) | |
| 1,000,000 | | | 5.500 | | | 11/15/23 | | | 1,183,610 | |
| Kansas State Development Finance Authority Hospital Revenue Bonds (Adventist Health) Series D (AA-/Aa2) | |
| 800,000 | | | 5.000 | | | 11/15/24 | | | 878,200 | |
| Kansas State Development Finance Authority Revenue Bonds (Athletic Facilities) Series A-1 (A-/A1) | |
| 500,000 | | | 4.875 | | | 07/01/27 | | | 521,845 | |
| 1,425,000 | | | 5.250 | | | 07/01/31 | | | 1,491,177 | |
| Kansas State Development Finance Authority Revenue Bonds (Board of Regents University Housing) Series A (NATL-RE) (AA-/NR) | |
| 30,000 | | | 5.000 | | | 04/01/24 | | | 30,000 | |
| Kansas State Development Finance Authority Revenue Bonds (Department of Commerce) Series K (AA-/A3) | |
| 2,000,000 | | | 3.500 | | | 06/01/23 | | | 2,070,980 | |
| Kansas State Development Finance Authority Revenue Bonds (Health Facilities) Series F (NR/A2) | |
| 1,000,000 | | | 5.000 | | | 11/15/26 | | | 1,135,270 | |
| Kansas State Development Finance Authority Revenue Bonds (Kansas Project) Series M-1 (AA-/Aa3) | |
| 500,000 | | | 5.000 | | | 11/01/16 | | | 533,255 | |
| 1,500,000 | | | 5.000 | | | 11/01/20 | | | 1,727,085 | |
| 2,000,000 | | | 5.000 | | | 11/01/27 | | | 2,284,080 | |
| Kansas State Development Finance Authority Revenue Bonds (Kansas State Projects) Series K (NATL-RE) (AA-/Aa3)(b) | |
| 1,000,000 | | | 5.250 | | | 11/01/17 | | | 1,108,660 | |
| Kansas State Development Finance Authority Revenue Bonds (Sisters of Charity of Leavenworth) Series A (AA-/Aa3) | |
| 1,750,000 | | | 5.250 | | | 01/01/25 | | | 2,010,820 | |
| Kansas State Development Finance Authority Revenue Bonds (Transportation Revolving Fund Trust) (AA+/Aa1) | |
| 1,105,000 | | | 5.000 | | | 10/01/21 | | | 1,126,448 | |
| Kansas State Development Finance Authority Revenue Bonds (Water Pollution Control Revolving Fund II) (AAA/Aaa) | |
| 280,000 | | | 5.500 | | | 05/01/17 | | | 306,790 | |
| Leavenworth County KS Unified School District No. 453 GO Bonds (Refunding & Improvement) Series A (AGM) (NR/Aa3)(b) | |
| 1,455,000 | | | 5.250 | | | 09/01/19 | | | 1,703,121 | |
| |
| | | | | | | | | | |
Principal
Amount | | Interest
Rate | | | Maturity
Date | | Value | |
| Municipal Bond Obligations – (continued) | |
Kansas – (continued) | |
| Leavenworth County KS Unified School District No. 458 GO Bonds (Refunding & Improvement) Series A (NR/Aa3)(b) | |
| $1,415,000 | | | 5.250 | % | | 09/01/19 | | $ | 1,646,565 | |
| Leavenworth County KS Unified School District No. 464 GO Bonds (Refunding & Improvement) Series B (NR/A1) | |
| 500,000 | | | 4.000 | | | 09/01/26 | | | 538,430 | |
| Leavenworth County KS Unified School District No. 464 Tonganoxie GO Bonds (Improvement) Series A (NATL-RE) (AA-/A3)(b) | |
| 150,000 | | | 5.000 | | | 09/01/15 | | | 152,363 | |
| Lyons KS Public Building Commission Revenue Bonds (A+/NR) | |
| 315,000 | | | 5.000 | | | 10/01/23 | | | 353,250 | |
| Miami County Unified School District No. 367 Osawatomie, KS GO Bonds (Refunding) Series A (AGM) (AA/A2)(b) | |
| 1,310,000 | | | 5.000 | | | 09/01/15 | | | 1,330,633 | |
| Miami County Unified School District No. 416 Louisburg, KS GO Bonds (Refunding & Improvement) (NATL-RE) (AA-/A3) | |
| 365,000 | | | 5.000 | (b) | | 09/01/16 | | | 387,619 | |
| 1,285,000 | | | 5.000 | | | 09/01/17 | | | 1,359,170 | |
| Olathe KS Health Facilities Revenue Bonds (Medical Center Project) Series 2008 (A+/NR) | |
| 1,195,000 | | | 5.125 | | | 09/01/21 | | | 1,306,697 | |
| Pratt County KS Public Building Commission Revenue Bonds (A+/NR) | |
| 300,000 | | | 5.000 | | | 12/01/19 | | | 335,373 | |
| 400,000 | | | 5.000 | | | 12/01/20 | | | 451,040 | |
| Reno County KS Unified School District No. 308 Hutchinson GO Bonds Series A (NATL-RE) (NR/Aa3) | |
| 500,000 | | | 4.500 | | | 09/01/22 | | | 540,545 | |
| Reno County KS Unified School District No. 313 GO Bonds Series A (NR/A2) | |
| 1,930,000 | | | 4.000 | | | 09/01/26 | | | 2,021,019 | |
| Sedgwick County KS Public Building Commission Revenue Bonds (Technical Education Complex Project) Series 2008-1 (NR/Aaa) | |
| 1,000,000 | | | 5.250 | | | 08/01/18 | | | 1,127,580 | |
| Sedgwick County KS Unified School District No. 261 GO Bonds (Prerefunded-Refunding & School Improvement) Series 2007 (AGM) (AA/NR)(b) | |
| 1,475,000 | | | 5.000 | | | 11/01/17 | | | 1,631,999 | |
| Sedgwick County KS Unified School District No. 261 GO Bonds (Unrefunded-Refunding & School Improvement) Series 2007 (AGM) (AA/NR) | |
| 25,000 | | | 5.000 | | | 11/01/32 | | | 27,194 | |
| Sedwick & Shawnee County KS Single Family Mortgage Revenue Bonds (Mortgage Backed Securities Program) AMT Series B-3 (FHLMC/FNMA/GNMA) (NR/Aa1) | |
| 415,000 | | | 5.250 | | | 12/01/38 | | | 423,445 | |
| Seward County KS Unified School District No. 480 GO Bonds (Refunding & Improvement) (A+/A1) | |
| 1,000,000 | | | 5.000 | | | 09/01/23 | | | 1,180,960 | |
| Shawnee County KS Certificates of Participation (Refunding) Series B (NR/Aa3) | |
| 795,000 | | | 3.000 | | | 09/01/18 | | | 834,551 | |
| |
| | |
| The accompanying notes are an integral part of these financial statements. | | 41 |
COMMERCE KANSAS TAX-FREE INTERMEDIATE BOND FUND
Schedule of Investments (continued)
April 30, 2015 (Unaudited)
| | | | | | | | | | | | |
Principal
Amount | | Interest
Rate | | | Maturity
Date | | | Value | |
| Municipal Bond Obligations – (continued) | |
Kansas – (continued) | |
| Shawnee County KS Certificates of Participation (Refunding) Series B (NR/Aa3) – (continued) | |
| $ 820,000 | | | 3.000 | % | | | 09/01/19 | | | $ | 867,043 | |
| 845,000 | | | 3.000 | | | | 09/01/20 | | | | 891,391 | |
| Shawnee County KS Certificates of Participation Health Agency Parks & Recreation Projects (NR/A1) | |
| 200,000 | | | 3.750 | | | | 09/01/18 | | | | 207,012 | |
| Shawnee County KS Certificates of Participation Series 2015 (NR/Aa3) | |
| 485,000 | | | 4.000 | | | | 09/01/30 | | | | 514,478 | |
| 1,000,000 | | | 4.000 | | | | 09/01/31 | | | | 1,056,290 | |
| 1,065,000 | | | 5.000 | | | | 09/01/32 | | | | 1,235,389 | |
| Shawnee County KS GO Bonds (Refunding) Series 2015 (NR/Aa2) | |
| 435,000 | | | 3.000 | | | | 09/01/22 | | | | 465,407 | |
| 450,000 | | | 3.000 | | | | 09/01/23 | | | | 477,936 | |
| 490,000 | | | 3.000 | | | | 09/01/25 | | | | 509,438 | |
| Sumner County KS Unified School District No. 353 Wellington GO Bonds (Refunding) Series 2006 (NATL-RE) (AA-/A3) | |
| 650,000 | | | 4.200 | | | | 09/01/24 | | | | 656,578 | |
| Topeka KS GO Bonds (Refunding) Series B (AA/Aa3) | |
| 1,360,000 | | | 2.500 | | | | 08/15/19 | | | | 1,363,196 | |
| Topeka KS Public Building Commission Revenue Bonds (Refunding 10th & Jackson Project) Series A (NATL-RE) (AA-/A3) | |
| 35,000 | | | 5.000 | | | | 06/01/16 | | | | 36,659 | |
| 1,000,000 | | | 5.000 | | | | 06/01/23 | | | | 1,126,060 | |
| Topeka KS Public Building Commission Revenue Bonds (Refunding Department of Social and Rehabilitation Project) Series B (NATL-RE) (AA-/A3) | |
| 300,000 | | | 5.000 | | | | 06/01/23 | | | | 337,818 | |
| 475,000 | | | 5.000 | | | | 06/01/24 | | | | 534,570 | |
| University of Kansas Hospital Authority Health Facilities Revenue Bonds (Refunding & Improvement) (Kansas University Health System) (A+/NR) | |
| 530,000 | | | 5.000 | | | | 09/01/29 | | | | 609,256 | |
| Washburn University KS Revenue Bonds Series 2014 (Refunding) (NR/A1) | |
| 435,000 | | | 3.000 | | | | 07/01/20 | | | | 461,465 | |
| 460,000 | | | 3.000 | | | | 07/01/22 | | | | 491,469 | |
| Wyandotte County Kansas City KS Unified Government Utility System Revenue Bonds Series A (BHAC) (AA+/Aa1) | |
| 1,000,000 | | | 5.000 | | | | 09/01/24 | | | | 1,128,730 | |
| Wyandotte County KS School District No. 500 GO Bonds (Refunding) (AA-/Aa2) | |
| 1,405,000 | | | 4.000 | | | | 09/01/20 | | | | 1,573,305 | |
| Wyandotte County KS Unified Government Utility System (Refunding & Improvement) Revenue Bonds Series 2011-A (A+/NR) | |
| 1,400,000 | | | 5.000 | | | | 09/01/20 | | | | 1,631,784 | |
Wyandotte County Unified School District No. 204 GO Bonds (Unrefunded) (Refunding & Improvement) Series A (NATL-RE) (NR/A1) | |
| 750,000 | | | 5.000 | | | | 09/01/21 | | | | 760,800 | |
| |
| | | | | | | | | | |
Principal
Amount | | Interest
Rate | | | Maturity
Date | | Value | |
| Municipal Bond Obligations – (continued) | |
Kansas – (continued) | |
| Wyandotte County-Kansas City Unified Government Special Obligation Revenue Bonds (Refunding-Sales Tax-KS International Speedway Corp. Project) Series 2014 (A+/NR) | |
| $ 300,000 | | | 5.000 | % | | 12/01/16 | | $ | 320,184 | |
| 400,000 | | | 5.000 | | | 12/01/17 | | | 439,560 | |
| Wyandotte County-Kansas City Unified Government Special Obligation Revenue Bonds (Sub Lien-Redevelopment Project Area) (Refunding) Series B (AA-/NR) | |
| 455,000 | | | 5.000 | | | 12/01/16 | | | 483,906 | |
| | | | | | | | | | |
| | | | | | | | | 90,484,951 | |
| |
Louisiana – 2.1% | |
| Louisiana Local Government Environmental Facilities & Community Development Authority Revenue Bonds (Woman’s Hospital Foundation) Series A (A/A3) | |
| 2,000,000 | | | 5.500 | | | 10/01/25 | | | 2,342,380 | |
| |
Maryland – 0.8% | |
| Maryland State Transportation Authority Passenger Facility Charge Revenue Bonds (AMT) Series B (A+/A2) | |
| 945,000 | | | 2.500 | | | 06/01/25 | | | 877,565 | |
| |
Massachusetts – 0.3% | |
| Massachusetts Educational Financing Authority Education Loan Revenue Bonds (Issue I) Series A (AA/NR) | |
| 295,000 | | | 5.300 | | | 01/01/30 | | | 315,662 | |
| |
Michigan(b) – 0.7% | |
| Michigan State Hospital Finance Authority Revenue Bonds (McLaren Health Care) Series C (NR/Aa3) | |
| 750,000 | | | 5.000 | | | 08/01/15 | | | 758,152 | |
| |
Pennsylvania – 0.6% | |
| Delaware County Authority University Revenue Bonds for Neumann University (BBB/NR) | |
| 605,000 | | | 5.000 | | | 10/01/25 | | | 657,393 | |
| |
South Carolina – 1.4% | |
Kershaw County SC Public School Foundation Installment Power Revenue Bonds (School District Project) (AGC) (AA/A3) | |
| 500,000 | | | 5.000 | | | 12/01/28 | | | 531,280 | |
| South Carolina Transportation Infrastructure Bank Revenue Bonds Series A (XLCA) (NR/A1) | |
| 1,000,000 | | | 5.000 | | | 10/01/22 | | | 1,061,780 | |
| | | | | | | | | | |
| | | | | | | | | 1,593,060 | |
| |
Washington – 0.8% | |
| Washington State Health Care Facilities Authority Revenue Bonds (Overlake Hospital Medical Center) (A/A2) | |
| 750,000 | | | 5.250 | | | 07/01/25 | | | 867,225 | |
| |
| TOTAL MUNICIPAL BOND OBLIGATIONS | |
(Cost $96,827,731) | | | | | $ | 101,793,547 | |
| |
| | |
| 42 | | The accompanying notes are an integral part of these financial statements. |
COMMERCE KANSAS TAX-FREE INTERMEDIATE BOND FUND
| | | | | | | | |
Shares | | Description | | | | Value | |
| Investment Company – 2.5% | |
| T. Rowe Price Tax-Free High Yield Fund (NR/NR) | |
| 233,184 | | | | | | $ | 2,788,879 | |
(Cost $2,600,000) | | | | | | |
| |
| | | | | | | | | | |
Principal
Amount | | Interest
Rate | | | Maturity
Date | | Value | |
| Short-term Investment(d) – 4.1% | |
Repurchase Agreement – 4.1% | |
| State Street Bank & Trust Co. | |
| $4,553,000 | | | 0.000 | % | | 05/01/15 | | $ | 4,553,000 | |
Maturity Value: $4,553,000 | | | | |
(Cost $4,553,000) | | | | |
| |
| TOTAL INVESTMENTS – 98.9% | |
(Cost $103,980,731) | | $ | 109,135,426 | |
| |
OTHER ASSETS IN EXCESS OF LIABILITIES – 1.1% | | | 1,174,193 | |
| |
NET ASSETS – 100.0% | | $ | 110,309,619 | |
| |
| | |
| The percentage shown for each investment category reflects the value of investments in that category as a percentage of net assets. |
| |
| (a) | | Issued with a zero coupon. Income is recognized through the accretion of discount. |
| (b) | | Prerefunded security. Maturity date disclosed is prerefunding date. |
| (c) | | Variable rate security. Interest rate or distribution rate disclosed is that which is in effect at April 30, 2015. |
| (d) | | Repurchase agreement was entered into on April 30, 2015. This agreement was fully collateralized by $3,250,000 U.S. Treasury Bond, 8.000%, due 11/15/21 with a market value of $4,648,495. |
| Security ratings disclosed, if any, are issued by Standard & Poor’s Ratings Services/Moody’s Investors Service. A description of the ratings is available in the Fund’s Statement of Additional Information. |
| | |
|
| Investment Abbreviations: |
| AGC | | —Insured by Assured Guaranty Corp. |
| AGM | | —Insuredby Assured Guaranty Municipal Corp. |
| AMBAC | | —Insuredby American Municipal Bond Assurance Corp. |
| AMT | | —AlternativeMinimum Tax |
| BHAC | | —BerkshireHathaway Assurance Corp. |
| FGIC | | —Insuredby Financial Guaranty Insurance Co. |
| FHLMC | | —FederalHome Loan Mortgage Corp. |
| FNMA | | —FederalNational Mortgage Association |
| GNMA | | —GovernmentNational Mortgage Association |
| GO | | —GeneralObligation |
| NATL-RE | | —Insuredby National Reinsurance Corp. |
| NR | | —Not Rated |
| WR | | —WithdrawnRating |
| XLCA | | —Insuredby XL Capital Assurance, Inc. |
|
PORTFOLIO COMPOSITION
| | | | | | | | |
| | | AS OF
4/30/15 | | | AS OF
10/31/14 | |
| |
General Obligation | | | 26.2 | % | | | 32.2 | % |
Hospital | | | 18.2 | | | | 19.1 | |
Lease | | | 15.8 | | | | 15.1 | |
Prerefunded/Escrow to Maturity | | | 8.9 | | | | 6.5 | |
General | | | 5.8 | | | | 5.1 | |
Education | | | 5.3 | | | | 5.5 | |
Transportation | | | 4.5 | | | | 5.8 | |
Power | | | 3.0 | | | | 4.4 | |
Water/Sewer | | | 2.7 | | | | 2.8 | |
Investment Company | | | 2.5 | | | | 2.6 | |
Crossover | | | 1.2 | | | | 0.0 | |
Single Family Housing | | | 0.4 | | | | 0.4 | |
Student | | | 0.3 | | | | 0.3 | |
Short-term Investment | | | 4.1 | | | | 0.6 | |
| |
| TOTAL INVESTMENTS | | | 98.9 | % | | | 100.4 | % |
| |
The percentage shown for each investment category reflects the value of investments in that category as a percentage of net assets. Underlying investment categories of investment companies held by the Fund are not reflected in the table above. Consequently, the Fund’s overall investment category allocations may differ from the percentages contained in the table above.
The Fund is actively managed and, as such, its composition may differ over time.
| | |
| The accompanying notes are an integral part of these financial statements. | | 43 |
COMMERCE FUNDS
Statements of Assets and Liabilities
April 30, 2015 (Unaudited)
| | | | | | | | | | | | |
| | | Growth Fund | | | Value Fund | | |
MidCap
Growth Fund | |
Assets: | | | | | | | | | | | | |
Investments at value (identified cost $56,822,800, $191,376,248, $52,648,800, $923,178,089, $164,339,432, $257,918,684, $290,542,465 and $103,980,731, respectively) | | $ | 73,551,672 | | | $ | 225,051,465 | | | $ | 66,325,731 | |
Cash | | | — | | | | 576,912 | | | | 51 | |
Receivables: | | | | | | | | | | | | |
Interest and dividends | | | 33,709 | | | | 340,751 | | | | 18,017 | |
Investments sold | | | 1,200,450 | | | | — | | | | — | |
Fund shares sold | | | 14,900 | | | | 246,842 | | | | 21,294 | |
Reimbursement from adviser | | | — | | | | — | | | | — | |
Other | | | 3,988 | | | | 13,701 | | | | 3,755 | |
Total Assets | | | 74,804,719 | | | | 226,229,671 | | | | 66,368,848 | |
|
| |
Liabilities: | | | | | | | | | | | | |
Due to custodian | | | 1,002,727 | | | | — | | | | — | |
Payables: | | | | | | | | | | | | |
Investments purchased | | | — | | | | — | | | | — | |
Dividends | | | — | | | | — | | | | — | |
Fund shares redeemed | | | 412 | | | | 511,189 | | | | 197 | |
Advisory fees | | | 40,666 | | | | 66,271 | | | | 36,171 | |
Deferred trustee fees | | | 36,036 | | | | 31,948 | | | | 18,260 | |
Administrative fees | | | 9,384 | | | | 28,129 | | | | 8,347 | |
Accrued expenses | | | 15,636 | | | | 25,668 | | | | 11,619 | |
Total Liabilities | | | 1,104,861 | | | | 663,205 | | | | 74,594 | |
| | | |
| | | | | | | | | | | | |
Net Assets: | | | | | | | | | | | | |
Paid-in capital | | | 52,398,795 | | | | 183,044,270 | | | | 49,002,829 | |
Undistributed (distributions in excess of) net investment income | | | 252,680 | | | | 299,242 | | | | 144,879 | |
Accumulated net realized gain (loss) | | | 4,319,511 | | | | 8,547,737 | | | | 3,469,615 | |
Net unrealized gain on investments | | | 16,728,872 | | | | 33,675,217 | | | | 13,676,931 | |
Net Assets | | $ | 73,699,858 | | | $ | 225,566,466 | | | $ | 66,294,254 | |
| | | |
| | | | | | | | | | | | |
Shares Outstanding/Net Asset Value | | | | | | | | | | | | |
Total shares outstanding, no par value (unlimited number of shares authorized): | | | 2,584,593 | | | | 7,013,417 | | | | 1,862,869 | |
Net asset value (net assets/shares outstanding) | | $ | 28.52 | | | $ | 32.16 | | | $ | 35.59 | |
| | |
| 44 | | The accompanying notes are an integral part of these financial statements. |
COMMERCE FUNDS
| | | | | | | | | | | | | | | | | | |
| Bond Fund | | | Short-Term
Government
Fund | | | National
Tax-Free
Intermediate
Bond Fund | | | Missouri
Tax-Free
Intermediate
Bond Fund | | | Kansas Tax-Free
Intermediate
Bond Fund | |
| | | | | | | | | | | | | | | | | | |
| | | | |
| $ | 972,757,121 | | | $ | 167,135,235 | | | $ | 265,807,372 | | | $ | 303,196,186 | | | $ | 109,135,426 | |
| | 79,040 | | | | 282 | | | | 794 | | | | 1,561,819 | | | | 388 | |
| | | | | | | | | | | | | | | | | | |
| | 7,863,296 | | | | 625,369 | | | | 3,019,411 | | | | 2,621,122 | | | | 1,066,960 | |
| | — | | | | — | | | | 12,404,358 | | | | — | | | | — | |
| | 771,920 | | | | 79,001 | | | | 177,784 | | | | 769,347 | | | | 362,261 | |
| | — | | | | 15,864 | | | | — | | | | — | | | | 17,521 | |
| | 52,465 | | | | 7,756 | | | | 14,718 | | | | 16,477 | | | | 5,795 | |
| | 981,523,842 | | | | 167,863,507 | | | | 281,424,437 | | | | 308,164,951 | | | | 110,588,351 | |
| | | | |
| | | | | | | | | | | | | | | | | | |
| | | | | | |
| | — | | | | — | | | | — | | | | — | | | | — | |
| | | | | | | | | | | | | | | | | | |
| | 4,349,134 | | | | — | | | | 5,082,222 | | | | — | | | | — | |
| | 1,877,048 | | | | 79,786 | | | | 451,145 | | | | 520,406 | | | | 170,349 | |
| | 317,196 | | | | 18,861 | | | | 322,005 | | | | 118,797 | | | | 9,772 | |
| | 307,994 | | | | 60,128 | | | | 85,514 | | | | 92,040 | | | | 44,162 | |
| | 183,732 | | | | 37,006 | | | | 54,794 | | | | 66,166 | | | | 23,871 | |
| | 120,687 | | | | 20,485 | | | | 34,048 | | | | 37,964 | | | | 13,643 | |
| | 143,367 | | | | 21,444 | | | | 38,682 | | | | 21,280 | | | | 16,935 | |
| | 7,299,158 | | | | 237,710 | | | | 6,068,410 | | | | 856,653 | | | | 278,732 | |
| | | | |
| | | | | | | | | | | | | | | | | | |
| | | | | | |
| | 929,986,360 | | | | 170,960,072 | | | | 267,836,667 | | | | 300,566,449 | | | | 106,160,475 | |
| | (6,842,909 | ) | | | (1,836,174 | ) | | | 348,030 | | | | 71,847 | | | | 12,524 | |
| | 1,502,201 | | | | (4,293,904 | ) | | | (717,358 | ) | | | (5,983,719 | ) | | | (1,018,075 | ) |
| | 49,579,032 | | | | 2,795,803 | | | | 7,888,688 | | | | 12,653,721 | | | | 5,154,695 | |
| $ | 974,224,684 | | | $ | 167,625,797 | | | $ | 275,356,027 | | | $ | 307,308,298 | | | $ | 110,309,619 | |
| | | | |
| | | | | | | | | | | | | | | | | | |
| | | | | | |
| | 47,788,692 | | | | 9,568,667 | | | | 14,122,808 | | | | 15,727,561 | | | | 5,677,522 | |
| $ | 20.39 | | | $ | 17.52 | | | $ | 19.50 | | | $ | 19.54 | | | $ | 19.43 | |
| | |
| The accompanying notes are an integral part of these financial statements. | | 45 |
COMMERCE FUNDS
Statements of Operations
For the Six Months Ended April 30, 2015 (Unaudited)
| | | | | | | | | | | | |
| | | Growth Fund | | | Value Fund | | |
MidCap
Growth Fund | |
Investment Income: | |
Interest | | $ | — | | | $ | — | | | $ | — | |
Dividends | | | 659,075 | | | | 3,766,821 | | | | 492,580 | |
Total Investment Income | | | 659,075 | | | | 3,766,821 | | | | 492,580 | |
| | | |
| | | | | | | | | | | | |
Expenses: | |
Advisory fees | | | 239,618 | | | | 352,285 | | | | 211,695 | |
Administration fees | | | 55,296 | | | | 176,142 | | | | 48,853 | |
Custody and accounting fees | | | 19,990 | | | | 21,257 | | | | 19,186 | |
Professional fees | | | 15,505 | | | | 20,529 | | | | 13,534 | |
Transfer Agent fees | | | 13,386 | | | | 58,870 | | | | 10,960 | |
Registration fees | | | 10,984 | | | | 20,047 | | | | 10,476 | |
Shareowner servicing fees | | | 9,198 | | | | 134,076 | | | | 5,329 | |
Trustee fees | | | 2,820 | | | | 7,924 | | | | 2,292 | |
Printing and mailing fees | | | 2,538 | | | | 9,372 | | | | 2,006 | |
Other | | | 10,523 | | | | 12,549 | | | | 9,243 | |
Total Expenses | | | 379,858 | | | | 813,051 | | | | 333,574 | |
Less — expense reimbursements | | | — | | | | — | | | | — | |
Net Expenses | | | 379,858 | | | | 813,051 | | | | 333,574 | |
| Net Investment Income | | | 279,217 | | | | 2,953,770 | | | | 159,006 | |
| | | |
| | | | | | | | | | | | |
Realized and unrealized gain (loss) | |
Net realized gain (loss) | | | 4,433,433 | | | | 9,299,248 | | | | 3,493,287 | |
Net change in unrealized gain (loss) | | | (909,670 | ) | | | (5,117,992 | ) | | | (112,060 | ) |
Net realized and unrealized gain | | | 3,523,763 | | | | 4,181,256 | | | | 3,381,227 | |
| NET INCREASE IN NET ASSETS RESULTING FROM OPERATIONS | | $ | 3,802,980 | | | $ | 7,135,026 | | | $ | 3,540,233 | |
| | |
| 46 | | The accompanying notes are an integral part of these financial statements. |
COMMERCE FUNDS
| | | | | | | | | | | | | | | | | | |
| Bond Fund | | | Short-Term
Government
Fund | | | National
Tax-Free
Intermediate
Bond Fund | | | Missouri
Tax-Free
Intermediate
Bond Fund | | | Kansas
Tax-Free
Intermediate
Bond Fund | |
| | | | | | |
| $ | 17,728,556 | | | $ | 981,418 | | | $ | 3,597,897 | | | $ | 4,565,698 | | | $ | 1,506,371 | |
| | 117,317 | | | | — | | | | 116,847 | | | | 148,714 | | | | 55,236 | |
| | 17,845,873 | | | | 981,418 | | | | 3,714,744 | | | | 4,714,412 | | | | 1,561,607 | |
| | | | |
| | | | | | | | | | | | | | | | | | |
| | | | | | |
| | 1,800,545 | | | | 281,808 | | | | 510,247 | | | | 553,783 | | | | 262,518 | |
| | 693,532 | | | | 89,351 | | | | 202,011 | | | | 228,133 | | | | 80,629 | |
| | 77,838 | | | | 23,871 | | | | 34,367 | | | | 37,183 | | | | 22,026 | |
| | 140,020 | | | | 16,775 | | | | 46,997 | | | | 32,780 | | | | 22,817 | |
| | 39,631 | | | | 9,187 | | | | 10,908 | | | | 13,440 | | | | 9,019 | |
| | 16,159 | | | | 11,024 | | | | 5,769 | | | | 3,388 | | | | 11,351 | |
| | 321,871 | | | | 38,012 | | | | 22,472 | | | | 57,691 | | | | 18,276 | |
| | 30,358 | | | | 3,652 | | | | 9,106 | | | | 10,467 | | | | 3,735 | |
| | 27,740 | | | | 4,000 | | | | 9,082 | | | | 10,076 | | | | 3,355 | |
| | 33,696 | | | | 6,757 | | | | 15,156 | | | | 16,822 | | | | 9,814 | |
| | 3,181,390 | | | | 484,437 | | | | 866,115 | | | | 963,763 | | | | 443,540 | |
| | — | | | | (79,379 | ) | | | — | | | | — | | | | (67,272 | ) |
| | 3,181,390 | | | | 405,058 | | | | 866,115 | | | | 963,763 | | | | 376,268 | |
| | 14,664,483 | | | | 576,360 | | | | 2,848,629 | | | | 3,750,649 | | | | 1,185,339 | |
| | | | |
| | | | | | | | | | | | | | | | | | |
| | | | | | |
| | 1,502,995 | | | | (2,424 | ) | | | 1,469,606 | | | | 431,531 | | | | 31,774 | |
| | 317,806 | | | | 213,937 | | | | (862,638 | ) | | | (314,256 | ) | | | 179,762 | |
| | 1,820,801 | | | | 211,513 | | | | 606,968 | | | | 117,275 | | | | 211,536 | |
| $ | 16,485,284 | | | $ | 787,873 | | | $ | 3,455,597 | | | $ | 3,867,924 | | | $ | 1,396,875 | |
| | |
| The accompanying notes are an integral part of these financial statements. | | 47 |
COMMERCE FUNDS
Statements of Changes in Net Assets
| | | | | | | | | | | | | | | | |
| | | Growth Fund | | | Value Fund | |
| | | For the Six Months Ended April 30, 2015
(Unaudited) | | | For the Fiscal Year Ended October 31, 2014 | | | For the Six Months Ended April 30, 2015
(Unaudited) | | | For the Fiscal Year Ended October 31, 2014 | |
From Operations: | |
Net investment income | | $ | 279,217 | | | $ | 623,664 | | | $ | 2,953,770 | | | $ | 4,858,026 | |
Net realized gain | | | 4,433,433 | | | | 16,958,856 | | | | 9,299,248 | | | | 6,770,659 | |
Net change in unrealized gain (loss) | | | (909,670 | ) | | | (2,406,226 | ) | | | (5,117,992 | ) | | | 10,073,806 | |
Net increase in net assets resulting from operations | | | 3,802,980 | | | | 15,176,294 | | | | 7,135,026 | | | | 21,702,491 | |
| | | | |
| | | | | | | | | | | | | | | | |
Distributions to Shareholders: | |
From net investment income | | | (635,572 | ) | | | (614,637 | ) | | | (2,960,759 | ) | | | (4,888,623 | ) |
From net realized gains | | | (16,926,544 | ) | | | (13,379,736 | ) | | | (6,705,421 | ) | | | (123,948 | ) |
Total distributions to shareholders | | | (17,562,116 | ) | | | (13,994,373 | ) | | | (9,666,180 | ) | | | (5,012,571 | ) |
| | | | |
| | | | | | | | | | | | | | | | |
From Share Transactions: | | | | | |
Proceeds from sales of shares | | | 12,020,001 | | | | 10,565,007 | | | | 25,381,127 | | | | 100,718,728 | |
Proceeds received in connection with in-kind sale | | | — | | | | — | | | | — | | | | — | |
Reinvestment of distributions | | | 6,345,334 | | | | 7,605,254 | | | | 5,361,027 | | | | 2,273,146 | |
Cost of shares redeemed | | | (6,403,698 | ) | | | (47,291,295 | ) | | | (39,969,741 | ) | | | (41,098,115 | ) |
Net increase (decrease) in net assets resulting from share transactions | | | 11,961,637 | | | | (29,121,034 | ) | | | (9,227,587 | ) | | | 61,893,759 | |
| TOTAL INCREASE (DECREASE) | | | (1,797,499 | ) | | | (27,939,113 | ) | | | (11,758,741 | ) | | | 78,583,679 | |
| | | | |
| | | | | | | | | | | | | | | | |
Net Assets: | | | | | |
Beginning of period | | | 75,497,357 | | | | 103,436,470 | | | | 237,325,207 | | | | 158,741,528 | |
End of period | | $ | 73,699,858 | | | $ | 75,497,357 | | | $ | 225,566,466 | | | $ | 237,325,207 | |
Undistributed (distributions in excess of) net investment income | | $ | 252,680 | | | $ | 609,035 | | | $ | 299,242 | | | $ | 306,231 | |
| | |
| 48 | | The accompanying notes are an integral part of these financial statements. |
COMMERCE FUNDS
| | | | | | | | | | | | | | |
| MidCap Growth Fund | | | Bond Fund | |
For the Six Months Ended
April 30, 2015
(Unaudited) | | | For the Fiscal Year Ended October 31, 2014 | | | For the Six Months Ended April 30, 2015
(Unaudited) | | | For the Fiscal Year Ended October 31, 2014 | |
| | | | | | | | | | | | | | |
| $ | 159,006 | | | $ | 96,426 | | | $ | 14,664,483 | | | $ | 28,221,756 | |
| | 3,493,287 | | | | 8,676,717 | | | | 1,502,995 | | | | 5,108,851 | |
| | (112,060 | ) | | | (1,103,679 | ) | | | 317,806 | | | | 5,699,368 | |
| | 3,540,233 | | | | 7,669,464 | | | | 16,485,284 | | | | 39,029,975 | |
| | | |
| | | | | | | | | | | | | | |
| | | | | | | | | | | | | | |
| | (97,697 | ) | | | (202,256 | ) | | | (15,957,962 | ) | | | (31,259,532 | ) |
| | (8,677,440 | ) | | | (6,999,042 | ) | | | (3,108,789 | ) | | | — | |
| | (8,775,137 | ) | | | (7,201,298 | ) | | | (19,066,751 | ) | | | (31,259,532 | ) |
| | | |
| | | | | | | | | | | | | | |
| | | | | | | | | | | | | | |
| | 8,125,312 | | | | 7,762,539 | | | | 159,514,777 | | | | 171,199,040 | |
| | — | | | | — | | | | — | | | | 15,190,894 | |
| | 2,222,918 | | | | 2,083,398 | | | | 5,810,691 | | | | 7,952,090 | |
| | (3,654,153 | ) | | | (11,100,183 | ) | | | (56,153,332 | ) | | | (114,182,055 | ) |
| | 6,694,077 | | | | (1,254,246 | ) | | | 109,172,136 | | | | 80,159,969 | |
| | 1,459,173 | | | | (786,080 | ) | | | 106,590,669 | | | | 87,930,412 | |
| | | |
| | | | | | | | | | | | | | |
| | | | | | | | | | | | | | |
| | 64,835,081 | | | | 65,621,161 | | | | 867,634,015 | | | | 779,703,603 | |
| $ | 66,294,254 | | | $ | 64,835,081 | | | $ | 974,224,684 | | | $ | 867,634,015 | |
| $ | 144,879 | | | $ | 83,570 | | | $ | (6,842,909 | ) | | $ | (5,549,430 | ) |
| | |
| The accompanying notes are an integral part of these financial statements. | | 49 |
COMMERCE FUNDS
Statements of Changes in Net Assets (continued)
| | | | | | | | | | | | | | | | |
| | | Short-Term
Government Fund | | | National Tax-Free
Intermediate Bond Fund | |
| | | For the Six Months Ended April 30, 2015
(Unaudited) | | | For the Fiscal Year Ended October 31, 2014 | | | For the Six Months Ended April 30, 2015
(Unaudited) | | | For the Fiscal Year Ended October 31, 2014 | |
From Operations: | |
Net investment income | | $ | 576,360 | | | $ | 1,336,694 | | | $ | 2,848,629 | | | $ | 7,141,890 | |
Net realized gain (loss) | | | (2,424 | ) | | | 57,795 | | | | 1,469,606 | | | | (2,219,154 | ) |
Net change in unrealized gain | | | 213,937 | | | | (666,676 | ) | | | (862,638 | ) | | | 6,432,307 | |
Net increase in net assets resulting from operations | | | 787,873 | | | | 727,813 | | | | 3,455,597 | | | | 11,355,043 | |
| | | | |
| | | | | | | | | | | | | | | | |
Distributions to Shareholders: | | | | | |
From net investment income | | | (888,021 | ) | | | (2,041,802 | ) | | | (2,796,115 | ) | | | (7,120,497 | ) |
From net realized gains | | | — | | | | — | | | | — | | | | (1,819,381 | ) |
Total distributions to shareholders | | | (888,021 | ) | | | (2,041,802 | ) | | | (2,796,115 | ) | | | (8,939,878 | ) |
| | | | |
| | | | | | | | | | | | | | | | |
From Share Transactions: | | | | | |
Proceeds from sales of shares | | | 93,656,994 | | | | 44,208,165 | | | | 25,567,824 | | | | 52,655,081 | |
Reinvestment of distributions | | | 475,113 | | | | 865,517 | | | | 167,134 | | | | 670,298 | |
Cost of shares redeemed | | | (24,350,123 | ) | | | (49,060,080 | ) | | | (17,038,920 | ) | | | (37,715,185 | ) |
Net increase (decrease) in net assets resulting from share transactions | | | 69,781,984 | | | | (3,986,398 | ) | | | 8,696,038 | | | | 15,610,194 | |
| TOTAL INCREASE (DECREASE) | | | 69,681,836 | | | | (5,300,387 | ) | | | 9,355,520 | | | | 18,025,359 | |
| | | | |
| | | | | | | | | | | | | | | | |
Net Assets: | | | | | |
Beginning of period | | | 97,943,961 | | | | 103,244,348 | | | | 266,000,507 | | | | 247,975,148 | |
End of period | | $ | 167,625,797 | | | $ | 97,943,961 | | | $ | 275,356,027 | | | $ | 266,000,507 | |
Undistributed (distributions in excess of) net investment income | | $ | (1,836,174 | ) | | $ | (1,524,513 | ) | | $ | 348,030 | | | $ | 295,516 | |
| | |
| 50 | | The accompanying notes are an integral part of these financial statements. |
COMMERCE FUNDS
| | | | | | | | | | | | | | |
Missouri Tax-Free
Intermediate Bond Fund | | | Kansas Tax-Free
Intermediate Bond Fund | |
For the
Six Months Ended April 30, 2015
(Unaudited) | | | For the
Fiscal Year Ended October 31, 2014 | | | For the
Six Months Ended April 30, 2015
(Unaudited) | | | For the
Fiscal Year Ended October 31, 2014 | |
| | | | | | | | | | | | | | |
| $ | 3,750,649 | | | $ | 8,688,009 | | | $ | 1,185,339 | | | $ | 2,730,320 | |
| | 431,531 | | | | (6,409,692 | ) | | | 31,774 | | | | (1,052,521 | ) |
| | (314,256 | ) | | | 11,922,320 | | | | 179,762 | | | | 3,835,568 | |
| | 3,867,924 | | | | 14,200,637 | | | | 1,396,875 | | | | 5,513,367 | |
| | | |
| | | | | | | | | | | | | | |
| | | | | | | | | | | | | | |
| | (3,664,460 | ) | | | (8,694,907 | ) | | | (1,172,975 | ) | | | (2,701,227 | ) |
| | — | | | | (1,518,654 | ) | | | — | | | | (207,704 | ) |
| | (3,664,460 | ) | | | (10,213,561 | ) | | | (1,172,975 | ) | | | (2,908,931 | ) |
| | | |
| | | | | | | | | | | | | | |
| | | | | | | | | | | | | | |
| | 24,284,170 | | | | 49,047,866 | | | | 12,300,448 | | | | 17,329,289 | |
| | 550,443 | | | | 1,512,647 | | | | 162,604 | | | | 420,342 | |
| | (24,403,990 | ) | | | (55,869,181 | ) | | | (7,772,030 | ) | | | (18,692,829 | ) |
| | 430,623 | | | | (5,308,668 | ) | | | 4,691,022 | | | | (943,198 | ) |
| | 634,087 | | | | (1,321,592 | ) | | | 4,914,922 | | | | 1,661,238 | |
| | | |
| | | | | | | | | | | | | | |
| | | | | | | | | | | | | | |
| | 306,674,211 | | | | 307,995,803 | | | | 105,394,697 | | | | 103,733,459 | |
| $ | 307,308,298 | | | $ | 306,674,211 | | | $ | 110,309,619 | | | $ | 105,394,697 | |
| $ | 71,847 | | | $ | (14,342 | ) | | $ | 12,524 | | | $ | 160 | |
| | |
| The accompanying notes are an integral part of these financial statements. | | 51 |
COMMERCE FUNDS
Financial Highlights
Selected Data for a Share Outstanding Throughout Each Period
| | | | | | | | | | | | | | | | | | | | | | | | | | | | |
| | | | | | Income (loss) from
investment operations | | | Distributions
to shareholders | |
| Year | | Net asset
value,
beginning
of period | | | Net
investment
income(a) | | | Net realized
and unrealized
gain | | | Total from
investment
operations | | | From net
investment
income | | | From net
realized
gains | | | Total
distributions | |
GROWTH FUND | |
For the Six Months Ended April 30, (Unaudited) | |
2015 | | $ | 34.95 | | | $ | 0.11 | | | $ | 1.57 | | | $ | 1.68 | | | $ | (0.25 | ) | | $ | (7.86 | ) | | $ | (8.11 | ) |
For the Fiscal Years Ended October 31, | |
2014 | | | 34.32 | | | | 0.22 | | | | 5.09 | | | | 5.31 | | | | (0.19 | ) | | | (4.49 | ) | | | (4.68 | ) |
2013 | | | 28.81 | | | | 0.25 | | | | 6.49 | | | | 6.74 | | | | (0.19 | ) | | | (1.04 | ) | | | (1.23 | ) |
2012 | | | 25.56 | | | | 0.16 | | | | 3.20 | | | | 3.36 | | | | (0.11 | ) | | | — | | | | (0.11 | ) |
2011 | | | 24.73 | | | | 0.13 | (d) | | | 0.82 | | | | 0.95 | | | | (0.12 | ) | | | — | | | | (0.12 | ) |
2010 | | | 21.24 | | | | 0.19 | (e) | | | 3.41 | | | | 3.60 | | | | (0.11 | ) | | | — | | | | (0.11 | ) |
| | | | | | | | | | | | | | | | | | | | | | | | | | | | |
VALUE FUND | |
For the Six Months Ended April 30, (Unaudited) | |
2015 | | $ | 32.50 | | | $ | 0.40 | | | $ | 0.59 | | | $ | 0.99 | | | $ | (0.41 | ) | | $ | (0.92 | ) | | $ | (1.33 | ) |
For the Fiscal Years Ended October 31, | |
2014 | | | 29.83 | | | | 0.78 | | | | 2.69 | | | | 3.47 | | | | (0.78 | ) | | | (0.02 | ) | | | (0.80 | ) |
2013 | | | 24.10 | | | | 0.77 | | | | 5.70 | | | | 6.47 | | | | (0.74 | ) | | | — | | | | (0.74 | ) |
2012 | | | 21.18 | | | | 0.67 | | | | 2.90 | | | | 3.57 | | | | (0.65 | ) | | | — | | | | (0.65 | ) |
2011 | | | 18.91 | | | | 0.48 | | | | 2.24 | | | | 2.72 | | | | (0.45 | ) | | | — | | | | (0.45 | ) |
2010 | | | 16.81 | | | | 0.22 | | | | 2.10 | | | | 2.32 | | | | (0.22 | ) | | | — | | | | (0.22 | ) |
| (a) | | Calculated based on the average shares outstanding methodology. |
| (b) | | Assumes investment at the net asset value at the beginning of the period, reinvestment of all dividends and distributions, a complete redemption of the investment at the net asset value at the end of the period and no sales or redemption charges. Total returns would be reduced if a sales or redemption charge was taken into account. Returns do not reflect the deduction of taxes that a shareholder would pay on Fund distributions or the redemption of Fund shares. Total returns for periods less than one full year are not annualized. |
| (d) | | Reflects income recognized from non-recurring special dividends which amounted to $0.02 per share and 0.09% of average net assets. |
| (e) | | Reflects income recognized from non-recurring special dividends which amounted to $0.13 per share and 0.56% of average net assets. |
| | |
| 52 | | The accompanying notes are an integral part of these financial statements. |
COMMERCE FUNDS
| | | | | | | | | | | | | | | | | | | | | | | | | | |
| | | | | | |
| | | | | | | | | | | | | | | | | | | | |
Net asset
value, end
of period | | | Total
return(b) | | | Net assets
at end of
period
(in 000s) | | | Ratio of
net expenses to
average net assets | | | Ratio of total
expenses to
average net assets | | | Ratio of
net investment
income to
average net assets | | | Portfolio
turnover
rate | |
| | | | | | | | | | | | | | | | | | | | | | | | | | |
| | | | | | | | | | | | | | | | | | | | | | | | | | |
| $ | 28.52 | | | | 5.12 | % | | $ | 73,700 | | | | 1.03 | %(c) | | | 1.03 | %(c) | | | 0.76 | %(c) | | | 22 | % |
| | | | | | | | | | | | | | | | | | | | | | | | | | |
| | 34.95 | | | | 17.42 | | | | 75,497 | | | | 1.08 | | | | 1.08 | | | | 0.68 | | | | 40 | |
| | 34.32 | | | | 24.39 | | | | 103,436 | | | | 1.07 | | | | 1.07 | | | | 0.80 | | | | 78 | |
| | 28.81 | | | | 13.18 | | | | 90,413 | | | | 1.13 | | | | 1.15 | | | | 0.57 | | | | 52 | |
| | 25.56 | | | | 3.84 | | | | 96,856 | | | | 1.13 | | | | 1.19 | | | | 0.50 | (d) | | | 43 | |
| | 24.73 | | | | 16.98 | | | | 119,567 | | | | 1.13 | | | | 1.24 | | | | 0.82 | (e) | | | 46 | |
| | | | | | | | | | | | | | | | | | | | | | | | | | |
| | | | | | | | | | | | | | | | | | | | | | | | | | |
| | | | | | | | | | | | | | | | | | | | | | | | | | |
| $ | 32.16 | | | | 3.04 | % | | $ | 225,566 | | | | 0.69 | %(c) | | | 0.69 | %(c) | | | 2.52 | %(c) | | | 14 | % |
| | | | | | | | | | | | | | | | | | | | | | | | | | |
| | 32.50 | | | | 11.76 | | | | 237,325 | | | | 0.70 | | | | 0.71 | | | | 2.50 | | | | 18 | |
| | 29.83 | | | | 27.27 | | | | 158,742 | | | | 0.66 | | | | 0.66 | | | | 2.84 | | | | 34 | |
| | 24.10 | | | | 16.99 | | | | 97,737 | | | | 0.70 | | | | 0.70 | | | | 2.94 | | | | 46 | |
| | 21.18 | | | | 14.51 | | | | 71,025 | | | | 0.86 | | | | 0.90 | | | | 2.32 | | | | 116 | |
| | 18.91 | | | | 13.88 | | | | 49,932 | | | | 1.20 | | | | 1.26 | | | | 1.24 | | | | 47 | |
| | |
| The accompanying notes are an integral part of these financial statements. | | 53 |
COMMERCE FUNDS
Financial Highlights
Selected Data for a Share Outstanding Throughout Each Period
| | | | | | | | | | | | | | | | | | | | | | | | | | | | |
| | | | | | Income (loss) from
investment operations | | | Distributions
to shareholders | |
| Year | | Net asset
value,
beginning
of period | | | Net
investment
income
(loss)(a) | | | Net realized
and unrealized
gain (loss) | | | Total from
investment
operations | | | From net
investment
income | | | From net
realized
gains | | | Total
distributions | |
MIDCAP GROWTH FUND | |
For the Six Months Ended April 30, (Unaudited) | |
2015 | | $ | 38.82 | | | $ | 0.09 | (c) | | $ | 1.95 | | | $ | 2.04 | | | $ | (0.05 | ) | | $ | (5.22 | ) | | $ | (5.27 | ) |
For the Fiscal Years Ended October 31, | | | | | | | | | | | | | | | | | | | | | | | | | |
2014 | | | 38.64 | | | | 0.06 | | | | 4.36 | | | | 4.42 | | | | (0.11 | ) | | | (4.13 | ) | | | (4.24 | ) |
2013 | | | 33.38 | | | | 0.16 | | | | 8.32 | | | | 8.48 | | | | (0.10 | ) | | | (3.12 | ) | | | (3.22 | ) |
2012 | | | 32.78 | | | | 0.06 | (e) | | | 2.43 | | | | 2.49 | | | | — | | | | (1.89 | ) | | | (1.89 | ) |
2011 | | | 31.24 | | | | (0.06 | )(f) | | | 1.60 | | | | 1.54 | | | | — | | | | — | | | | — | |
2010 | | | 24.06 | | | | (0.07 | ) | | | 7.29 | | | | 7.22 | | | | (0.04 | ) | | | — | | | | (0.04 | ) |
| | | | | | | | | | | | | | | | | | | | | | | | | | | | |
BOND FUND | |
For the Six Months Ended April 30, (Unaudited) | |
2015 | | $ | 20.43 | | | $ | 0.32 | | | $ | 0.06 | | | $ | 0.38 | | | $ | (0.35 | ) | | $ | (0.07 | ) | | $ | (0.42 | ) |
For the Fiscal Years Ended October 31, | | | | | | | | | | | | | | | | | | | | | | | | | |
2014 | | | 20.24 | | | | 0.70 | | | | 0.27 | | | | 0.97 | | | | (0.78 | ) | | | — | | | | (0.78 | ) |
2013 | | | 20.99 | | | | 0.77 | | | | (0.70 | ) | | | 0.07 | | | | (0.82 | ) | | | — | | | | (0.82 | ) |
2012 | | | 20.39 | | | | 0.82 | | | | 0.64 | | | | 1.46 | | | | (0.86 | ) | | | — | | | | (0.86 | ) |
2011 | | | 20.35 | | | | 0.89 | | | | 0.06 | | | | 0.95 | | | | (0.91 | ) | | | — | | | | (0.91 | ) |
2010 | | | 19.17 | | | | 0.93 | | | | 1.21 | | | | 2.14 | | | | (0.96 | ) | | | — | | | | (0.96 | ) |
| (a) | | Calculated based on the average shares outstanding methodology. |
| (b) | | Assumes investment at the net asset value at the beginning of the period, reinvestment of all dividends and distributions, a complete redemption of the investment at the net asset value at the end of the period and no sales or redemption charges. Total returns would be reduced if a sales or redemption charge was taken into account. Returns do not reflect the deduction of taxes that a shareholder would pay on Fund distributions or the redemption of Fund shares. Total returns for periods less than one full year are not annualized. |
| (c) | | Reflects income recognized from non-recurring special dividends which amounted to $0.03 per share and 0.18% of average net assets. |
| (e) | | Reflects income recognized from non-recurring special dividends which amounted to $0.09 per share and 0.20% of average net assets. |
| (f) | | Reflects income recognized from non-recurring special dividends which amounted to $0.07 per share and 0.19% of average net assets. |
| | |
| 54 | | The accompanying notes are an integral part of these financial statements. |
COMMERCE FUNDS
| | | | | | | | | | | | | | | | | | | | | | | | | | |
| | | | | | |
| | | | | | | | | | | | | | | | | | | | |
Net asset
value, end
of period | | | Total
return(b) | | | Net assets
at end of
period (in 000s) | | | Ratio of
net expenses to
average net assets | | | Ratio of total
expenses to
average net assets | | | Ratio of
net investment
income (loss) to
average net assets | | | Portfolio
turnover
rate | |
| | | | | | | | | | | | | | | | | | | | | | | | | | |
| | |
| $ | 35.59 | | | | 5.50 | % | | $ | 66,294 | | | | 1.03 | %(d) | | | 1.03 | %(d) | | | 0.49 | %(c)(d) | | | 24 | % |
| | | | | | | | | | | | | | | | | | | | | | | | | | |
| | 38.82 | | | | 12.58 | | | | 64,835 | | | | 1.05 | | | | 1.05 | | | | 0.15 | | | | 43 | |
| | 38.64 | | | | 27.92 | | | | 65,621 | | | | 1.09 | | | | 1.09 | | | | 0.45 | | | | 75 | |
| | 33.38 | | | | 8.12 | | | | 56,936 | | | | 1.18 | | | | 1.18 | | | | 0.20 | (e) | | | 64 | |
| | 32.78 | | | | 4.93 | | | | 56,264 | | | | 1.24 | | | | 1.24 | | | | (0.18 | )(f) | | | 46 | |
| | 31.24 | | | | 30.08 | | | | 53,380 | | | | 1.33 | | | | 1.33 | | | | (0.24 | ) | | | 45 | |
| | | | | | | | | | | | | | | | | | | | | | | | | | |
| | | | | | | | | | | | | | | | | | | | | | | | | | |
| | | | | | | | | | | | | | | | | | | | | | | | | | |
| $ | 20.39 | | | | 1.89 | % | | $ | 974,225 | | | | 0.69 | %(d) | | | 0.69 | %(d) | | | 3.17 | %(d) | | | 9 | % |
| | | | | | | | | | | | | | | | | | | | | | | | | | |
| | 20.43 | | | | 4.86 | | | | 867,634 | | | | 0.70 | | | | 0.70 | | | | 3.44 | | | | 22 | |
| | 20.24 | | | | 0.31 | | | | 779,704 | | | | 0.72 | | | | 0.72 | | | | 3.71 | | | | 23 | |
| | 20.99 | | | | 7.30 | | | | 785,627 | | | | 0.77 | | | | 0.77 | | | | 3.96 | | | | 18 | |
| | 20.39 | | | | 4.80 | | | | 725,261 | | | | 0.81 | | | | 0.81 | | | | 4.39 | | | | 26 | |
| | 20.35 | | | | 11.46 | | | | 648,695 | | | | 0.83 | | | | 0.83 | | | | 4.75 | | | | 26 | |
| | |
| The accompanying notes are an integral part of these financial statements. | | 55 |
COMMERCE FUNDS
Financial Highlights
Selected Data for a Share Outstanding Throughout Each Period
| | | | | | | | | | | | | | | | | | | | | | | | | | | | |
| | | | | | Income (loss) from
investment operations | | | Distributions
to shareholders | |
| Year | | Net asset
value,
beginning
of period | | | Net
investment
income(a) | | | Net realized
and unrealized
gain (loss) | | | Total from
investment
operations | | | From net
investment
income | | | From net
realized
gains | | | Total
distributions | |
SHORT TERM GOVERNMENT FUND | |
For the Six Months Ended April 30, (Unaudited) | |
2015 | | $ | 17.54 | | | $ | 0.08 | | | $ | 0.02 | | | $ | 0.10 | | | $ | (0.12 | ) | | $ | — | | | $ | (0.12 | ) |
For the Fiscal Years Ended October 31, | |
2014 | | | 17.78 | | | | 0.24 | | | | (0.12 | ) | | | 0.12 | | | | (0.36 | ) | | | — | | | | (0.36 | ) |
2013 | | | 18.14 | | | | 0.27 | | | | (0.23 | ) | | | 0.04 | | | | (0.40 | ) | | | — | | | | (0.40 | ) |
2012 | | | 18.15 | | | | 0.30 | | | | 0.14 | | | | 0.44 | | | | (0.45 | ) | | | — | | | | (0.45 | ) |
2011 | | | 18.48 | | | | 0.38 | | | | (0.19 | ) | | | 0.19 | | | | (0.52 | ) | | | — | | | | (0.52 | ) |
2010 | | | 18.16 | | | | 0.48 | | | | 0.42 | | | | 0.90 | | | | (0.58 | ) | | | — | | | | (0.58 | ) |
| | | | | | | | | | | | | | | | | | | | | | | | | | | | |
NATIONAL TAX-FREE INTERMEDIATE BOND FUND | |
For the Six Months Ended April 30, (Unaudited) | |
2015 | | $ | 19.45 | | | $ | 0.21 | | | $ | 0.04 | | | $ | 0.25 | | | $ | (0.20 | ) | | $ | — | | | $ | (0.20 | ) |
For the Fiscal Years Ended October 31, | |
2014 | | | 19.27 | | | | 0.54 | | | | 0.32 | | | | 0.86 | | | | (0.54 | ) | | | (0.14 | ) | | | (0.68 | ) |
2013 | | | 20.59 | | | | 0.63 | | | | (1.07 | ) | | | (0.44 | ) | | | (0.63 | ) | | | (0.25 | ) | | | (0.88 | ) |
2012 | | | 19.42 | | | | 0.64 | | | | 1.27 | | | | 1.91 | | | | (0.64 | ) | | | (0.10 | ) | | | (0.74 | ) |
2011 | | | 19.50 | | | | 0.71 | | | | 0.16 | | | | 0.87 | | | | (0.71 | ) | | | (0.24 | ) | | | (0.95 | ) |
2010 | | | 18.84 | | | | 0.67 | | | | 0.71 | | | | 1.38 | | | | (0.67 | ) | | | (0.05 | ) | | | (0.72 | ) |
| (a) | | Calculated based on the average shares outstanding methodology. |
| (b) | | Assumes investment at the net asset value at the beginning of the period, reinvestment of all dividends and distributions, a complete redemption of the investment at the net asset value at the end of the period and no sales or redemption charges. Total returns would be reduced if a sales or redemption charge was taken into account. Returns do not reflect the deduction of taxes that a shareholder would pay on Fund distributions or the redemption of Fund shares. Total returns for periods less than one full year are not annualized. |
| | |
| 56 | | The accompanying notes are an integral part of these financial statements. |
COMMERCE FUNDS
| | | | | | | | | | | | | | | | | | | | | | | | | | |
| | | | | | |
| | | | | | | | | | | | | | | | | | | | |
Net asset
value, end
of period | | | Total
return(b) | | | Net assets
at end of
period
(in 000s) | | | Ratio of
net expenses to
average net assets | | | Ratio of total
expenses to
average net assets | | | Ratio of
net investment
income to
average net assets | | | Portfolio
turnover
rate | |
| | | | | | | | | | | | | | | | | | | | | | | | | | |
| | | | | | | | | | | | | | | | | | | | | | | | | | |
| $ | 17.52 | | | | 0.65 | % | | $ | 167,626 | | | | 0.68 | %(c) | | | 0.81 | %(c) | | | 0.97 | %(c) | | | 10 | % |
| | | | | | | | | | | | | | | | | | | | | | | | | | |
| | 17.54 | | | | 0.70 | | | | 97,944 | | | | 0.68 | | | | 0.88 | | | | 1.35 | | | | 27 | |
| | 17.78 | | | | 0.24 | | | | 103,244 | | | | 0.68 | | | | 0.83 | | | | 1.48 | | | | 25 | |
| | 18.14 | | | | 2.46 | | | | 122,957 | | | | 0.68 | | | | 0.83 | | | | 1.66 | | | | 26 | |
| | 18.15 | | | | 1.07 | | | | 129,510 | | | | 0.68 | | | | 0.88 | | | | 2.09 | | | | 27 | |
| | 18.48 | | | | 5.04 | | | | 133,022 | | | | 0.68 | | | | 0.89 | | | | 2.60 | | | | 28 | |
| | | | | | | | | | | | | | | | | | | | | | | | | | |
| | | | | | | | | | | | | | | | | | | | | | | | | | |
| | | | | | | | | | | | | | | | | | | | | | | | | | |
| $ | 19.50 | | | | 1.29 | % | | $ | 275,356 | | | | 0.64 | %(c) | | | 0.64 | %(c) | | | 2.12 | %(c) | | | 24 | % |
| | | | | | | | | | | | | | | | | | | | | | | | | | |
| | 19.45 | | | | 4.59 | | | | 266,001 | | | | 0.67 | | | | 0.67 | | | | 2.81 | | | | 74 | |
| | 19.27 | | | | (2.23 | ) | | | 247,975 | | | | 0.66 | | | | 0.66 | | | | 3.18 | | | | 37 | |
| | 20.59 | | | | 9.95 | | | | 250,220 | | | | 0.70 | | | | 0.74 | | | | 3.16 | | | | 17 | |
| | 19.42 | | | | 4.73 | | | | 194,878 | | | | 0.70 | | | | 0.84 | | | | 3.76 | | | | 44 | |
| | 19.50 | | | | 7.43 | | | | 191,897 | | | | 0.70 | | | | 0.86 | | | | 3.49 | | | | 46 | |
| | |
| The accompanying notes are an integral part of these financial statements. | | 57 |
COMMERCE FUNDS
Financial Highlights
Selected Data for a Share Outstanding Throughout Each Period
| | | | | | | | | | | | | | | | | | | | | | | | | | | | |
| | | | | | Income (loss) from
investment operations | | | Distributions
to shareholders | |
| Year | | Net asset
value,
beginning
of period | | | Net
investment
income(a) | | | Net realized
and unrealized
gain (loss) | | | Total from
investment
operations | | | From net
investment
income | | | From net
realized
gains | | | Total
distributions | |
MISSOURI TAX-FREE INTERMEDIATE BOND FUND | |
For the Six Months Ended April 30, (Unaudited) | |
2015 | | $ | 19.52 | | | $ | 0.24 | | | $ | 0.01 | | | $ | 0.25 | | | $ | (0.23 | ) | | $ | — | | | $ | (0.23 | ) |
For the Fiscal Years Ended October 31, | | | | | | | | | | | | | | | | | | | | | | | | | |
2014 | | | 19.25 | | | | 0.56 | | | | 0.37 | | | | 0.93 | | | | (0.56 | ) | | | (0.10 | ) | | | (0.66 | ) |
2013 | | | 20.39 | | | | 0.61 | | | | (1.06 | ) | | | (0.45 | ) | | | (0.61 | ) | | | (0.08 | ) | | | (0.69 | ) |
2012 | | | 19.69 | | | | 0.64 | | | | 0.79 | | | | 1.43 | | | | (0.65 | ) | | | (0.08 | ) | | | (0.73 | ) |
2011 | | | 19.70 | | | | 0.69 | | | | 0.03 | | | | 0.72 | | | | (0.69 | ) | | | (0.04 | ) | | | (0.73 | ) |
2010 | | | 19.30 | | | | 0.66 | | | | 0.43 | | | | 1.09 | | | | (0.66 | ) | | | (0.03 | ) | | | (0.69 | ) |
| | | | | | | | | | | | | | | | | | | | | | | | | | | | |
KANSAS TAX-FREE INTERMEDIATE BOND FUND | |
For the Six Months Ended April 30, (Unaudited) | |
2015 | | $ | 19.39 | | | $ | 0.21 | | | $ | 0.04 | | | $ | 0.25 | | | $ | (0.21 | ) | | $ | — | | | $ | (0.21 | ) |
For the Fiscal Years Ended October 31, | | | | | | | | | | | | | | | | | | | | | | | | | |
2014 | | | 18.90 | | | | 0.50 | | | | 0.53 | | | | 1.03 | | | | (0.50 | ) | | | (0.04 | ) | | | (0.54 | ) |
2013 | | | 20.01 | | | | 0.57 | | | | (0.98 | ) | | | (0.41 | ) | | | (0.56 | ) | | | (0.14 | ) | | | (0.70 | ) |
2012 | | | 19.27 | | | | 0.62 | | | | 0.77 | | | | 1.39 | | | | (0.61 | ) | | | (0.04 | ) | | | (0.65 | ) |
2011 | | | 19.32 | | | | 0.66 | | | | 0.10 | | | | 0.76 | | | | (0.66 | ) | | | (0.15 | ) | | | (0.81 | ) |
2010 | | | 19.05 | | | | 0.63 | | | | 0.33 | | | | 0.96 | | | | (0.63 | ) | | | (0.06 | ) | | | (0.69 | ) |
| (a) | | Calculated based on the average shares outstanding methodology. |
| (b) | | Assumes investment at the net asset value at the beginning of the period, reinvestment of all dividends and distributions, a complete redemption of the investment at the net asset value at the end of the period and no sales or redemption charges. Total returns would be reduced if a sales or redemption charge was taken into account. Returns do not reflect the deduction of taxes that a shareholder would pay on Fund distributions or the redemption of Fund shares. Total returns for periods less than one full year are not annualized. |
| | |
| 58 | | The accompanying notes are an integral part of these financial statements. |
COMMERCE FUNDS
| | | | | | | | | | | | | | | | | | | | | | | | | | |
| | | | | | |
| | | | | | | | | | | | | | | | | | | | |
Net asset
value, end
of period | | | Total
return(b) | | | Net assets
at end of
period (in 000s) | | | Ratio of
net expenses to
average net assets | | | Ratio of total
expenses to
average net assets | | | Ratio of
net investment
income to
average net assets | | | Portfolio
turnover
rate | |
| | | | | | | | | | | | | | | | | | | | | | | | | | |
| | | | | | | | | | | | | | | | | | | | | | | | | | |
| $ | 19.54 | | | | 1.30 | % | | $ | 307,308 | | | | 0.63 | %(c) | | | 0.63 | %(c) | | | 2.47 | %(c) | | | 8 | % |
| | | | | | | | | | | | | | | | | | | | | | | | | | |
| | 19.52 | | | | 4.92 | | | | 306,674 | | | | 0.67 | | | | 0.67 | | | | 2.90 | | | | 29 | |
| | 19.25 | | | | (2.29 | ) | | | 307,996 | | | | 0.64 | | | | 0.64 | | | | 3.07 | | | | 23 | |
| | 20.39 | | | | 7.33 | | | | 319,687 | | | | 0.70 | | | | 0.74 | | | | 3.20 | | | | 14 | |
| | 19.69 | | | | 3.77 | | | | 266,668 | | | | 0.70 | | | | 0.84 | | | | 3.57 | | | | 15 | |
| | 19.70 | | | | 5.72 | | | | 265,798 | | | | 0.70 | | | | 0.84 | | | | 3.37 | | | | 19 | |
| | | | | | | | | | | | | | | | | | | | | | | | | | |
| | | | | | | | | | | | | | | | | | | | | | | | | | |
| | | | | | | | | | | | | | | | | | | | | | | | | | |
| $ | 19.43 | | | | 1.30 | % | | $ | 110,310 | | | | 0.70 | %(c) | | | 0.83 | %(c) | | | 2.21 | %(c) | | | 5 | % |
| | | | | | | | | | | | | | | | | | | | | | | | | | |
| | 19.39 | | | | 5.51 | | | | 105,395 | | | | 0.70 | | | | 0.87 | | | | 2.63 | | | | 26 | |
| | 18.90 | | | | (2.09 | ) | | | 103,733 | | | | 0.70 | | | | 0.83 | | | | 2.91 | | | | 22 | |
| | 20.01 | | | | 7.32 | | | | 114,837 | | | | 0.70 | | | | 0.85 | | | | 3.11 | | | | 24 | |
| | 19.27 | | | | 4.09 | | | | 98,340 | | | | 0.70 | | | | 0.90 | | | | 3.50 | | | | 14 | |
| | 19.32 | | | | 5.15 | | | | 84,067 | | | | 0.70 | | | | 0.94 | | | | 3.31 | | | | 23 | |
| | |
| The accompanying notes are an integral part of these financial statements. | | 59 |
COMMERCE FUNDS
Notes to Financial Statements
April 30, 2015 (Unaudited)
The Commerce Funds (the “Trust”) is a Delaware statutory trust registered under the Investment Company Act of 1940, as amended (the “Act”), as an open-end, management investment company. The Trust consists of eight portfolios (individually, a “Fund” and collectively, the “Funds”): Growth Fund, Value Fund, MidCap Growth Fund, Bond Fund, Short-Term Government Fund, National Tax-Free Intermediate Bond Fund, Missouri Tax-Free Intermediate Bond Fund and Kansas Tax-Free Intermediate Bond Fund. Each of the Funds offers one class of shares (the “Shares”). Each Fund is registered as a diversified open-end management investment company, except the Missouri Tax-Free Intermediate Bond Fund and the Kansas Tax-Free Intermediate Bond Fund, which are registered as non-diversified under the Act.
The Funds have entered into an Advisory Agreement with Commerce Investment Advisors, Inc. (the “Adviser” or “Commerce”), a subsidiary of Commerce Bank.
| | |
| 2. SIGNIFICANT ACCOUNTING POLICIES | | |
The financial statements have been prepared in accordance with accounting principles generally accepted in the U.S. (“GAAP”) and require management to make estimates and assumptions that may affect the reported amounts and disclosures. Actual results may differ from those estimates and assumptions.
A. Investment Valuation — The Funds’ valuation policy is to value investments at fair value.
B. Investment Income and Investments — Investment income is comprised of interest income and dividend income. Interest income is accrued daily and adjusted for amortization of premiums and accretion of discounts. Dividend income is recognized on ex-dividend date. Investment transactions are reflected on trade date with realized gains and losses on sales calculated using identified cost. Investment transactions are recorded on the following business day for daily net asset value (“NAV”) calculations. Distributions received from the Funds’ investments in United States (“U.S.”) real estate investment trusts (“REITs”) may be characterized as ordinary income, net capital gain or a return of capital. A return of capital is recorded by the Funds as a reduction to the cost basis of the REIT.
For securities with paydown provisions, principal payments received are treated as a proportionate reduction to the cost basis of the securities and excess or shortfall amounts are recorded as gains or losses.
C. Expenses — Expenses incurred directly by the Trust that do not specifically relate to an individual Fund of the Trust are allocated to the Funds based on each Fund’s average net assets and are accrued daily.
D. Federal Taxes and Distributions to Shareholders — It is each Fund’s policy to comply with the requirements of the Internal Revenue Code of 1986, as amended (the “Code”), applicable to regulated investment companies (mutual funds) and to distribute each year substantially all of its investment company taxable income and capital gains to its shareholders. Accordingly, the Funds are not required to make any provisions for the payment of federal income tax. Distributions to shareholders are recorded on the ex-dividend date. Income and capital gains distributions, if any, are declared and paid according to the following schedule:
| | | | | | | | |
| | | Income Distribution | | Capital Gains Distribution |
| Fund | | Declared | | Paid | | Declared | | Paid |
Value | | Quarterly | | Quarterly | | Annually | | Annually |
Growth and MidCap Growth | | Annually | | Annually | | Annually | | Annually |
Bond, Short-Term Government, National Tax-Free Intermediate Bond, Missouri Tax-Free Intermediate Bond and Kansas Tax-Free Intermediate Bond | | Daily | | Monthly | | Annually | | Annually |
60
COMMERCE FUNDS
| | |
| 2. SIGNIFICANT ACCOUNTING POLICIES (continued) | | |
Net capital losses are carried forward to future fiscal years and may be used to the extent allowed by the Code to offset any future capital gains. Utilization of capital loss carryforwards will reduce the requirement of future capital gains distributions.
Under the Regulated Investment Company Modernization Act of 2010, the Funds are permitted to carry forward capital losses incurred in taxable years beginning after December 22, 2010 for an unlimited period. However, any losses incurred during those future taxable years will be required to be utilized prior to the losses incurred in pre-enactment taxable years. As a result of this ordering rule, pre-enactment capital loss carryforwards may be more likely to expire unused. Additionally, post-enactment capital losses that are carried forward will retain their character as either short-term or long term capital losses rather than being considered all short-term as under previous law.
The characterization of distributions to shareholders for financial reporting purposes is determined in accordance with federal income tax rules, which may differ from GAAP. The source of each Fund’s distributions may be shown in the accompanying financial statements as either from net investment income, net realized gain or capital. Certain components of the Funds’ net assets on the Statements of Assets and Liabilities reflect permanent GAAP/tax differences based on the appropriate tax character.
| | |
| 3. INVESTMENTS AND FAIR VALUE MEASUREMENTS | | |
The fair value of a financial instrument is the amount that would be received to sell an asset or paid to transfer a liability in an orderly transaction between market participants at the measurement date (i.e., the exit price). GAAP establishes a fair value hierarchy that prioritizes the inputs to valuation techniques used to measure fair value. The hierarchy gives the highest priority to unadjusted quoted prices in active markets for identical assets or liabilities (Level 1 measurements) and the lowest priority to unobservable inputs (Level 3 measurements). The levels used for classifying investments are not necessarily an indication of the risk associated with investing in these investments. The three levels of the fair value hierarchy are described below:
Level 1 — Unadjusted quoted prices in active markets that are accessible at the measurement date for identical, unrestricted assets or liabilities;
Level 2 — Quoted prices in markets that are not active or financial instruments for which significant inputs are observable (including, but not limited to, quoted prices for similar investments, interest rates, prepayment speeds and credit risk), either directly or indirectly;
Level 3 — Prices or valuations that require significant unobservable inputs (including the Adviser’s assumptions in determining fair value measurement).
A. Level 1 and Level 2 Fair Value Investments — The valuation techniques and significant inputs used in determining the fair values for investments classified as Level 1 and Level 2 are as follows:
Equity Securities — Equity securities and investment companies traded on a United States (“U.S.”) securities exchange or the NASDAQ system, are valued daily at their last sale price or official closing price on the principal exchange or system on which they are traded. If there is no sale or official closing price or it is believed by the investment adviser to not represent fair value, equity securities and exchange traded investment companies are valued at the last bid price. Investments in investment companies (other than those that are exchange traded) are valued at the NAV on the valuation date. To the extent these investments are actively traded, they are classified as Level 1 of the fair value hierarchy, otherwise they are classified as Level 2.
Unlisted equity securities for which market quotations are available are valued at the last sale price on the valuation date, or if no sale occurs, at the last bid price. Investments applying these valuation adjustments are classified as Level 2 of the fair value hierarchy.
61
COMMERCE FUNDS
Notes to Financial Statements (continued)
April 30, 2015 (Unaudited)
| | |
| 3. INVESTMENTS AND FAIR VALUE MEASUREMENTS (continued) | | |
Debt Securities — Debt securities for which market quotations are readily available are valued daily on the basis of quotations furnished by an independent pricing service or provided by securities dealers. The pricing services may use valuation models or matrix pricing, which consider yield or price with respect to comparable bonds, quotations from bond dealers or by reference to other securities that are considered comparable in characteristics such as rating, interest rate and maturity date, to determine current value. Short-term debt obligations that mature in sixty days or less and that do not exhibit signs of credit deterioration are valued at amortized cost, which approximates fair value. With the exception of treasury securities, which are generally classified as Level 1, these investments are generally classified as Level 2 of the fair value hierarchy.
Mortgage-Backed and Asset-Backed Securities — Mortgage-backed securities represent direct or indirect participations in, or are collateralized by and payable from, mortgage loans secured by residential and/or commercial real estate property. Asset-backed securities include securities whose principal and interest payments are collateralized by pools of other assets. The value of certain mortgage-backed and asset-backed securities (including adjustable rate mortgage loans) may be particularly sensitive to changes in prevailing interest rates. The value of these securities may also fluctuate in response to the market’s perception of the creditworthiness of the issuers.
Asset-backed securities may present credit risks that are not presented by mortgage-backed securities because they generally do not have the benefit of a security interest in collateral that is comparable to mortgage assets. Some asset-backed securities may only have a subordinated claim on collateral.
Collateralized mortgage-backed securities (“CMOs”) may exhibit even more price volatility and interest rate risk than other mortgage-backed securities. They may lose liquidity as CMO market makers may choose not to repurchase, or may offer prices, based on current market conditions, that are unacceptable to a Fund based on the Adviser’s analysis of the market value of the security.
Short Term Investments — Short-term investments having a maturity of 60 days or less are generally valued at amortized cost, which approximates fair market value. With the exception of treasury securities, which are generally classified as Level 1, these investments are classified as Level 2 of the fair value hierarchy.
Repurchase Agreements — Repurchase agreements involve the purchase of securities subject to the seller’s agreement to repurchase the securities at a mutually agreed upon date and price, under the terms of a Master Repurchase Agreement (“MRA”). During the term of a repurchase agreement, the value of the underlying securities held as collateral on behalf of a Fund, including accrued interest is required to exceed the value of the repurchase agreement, including accrued interest. The underlying securities for all repurchase agreements are held at the Funds’ custodian or designated sub-custodians under tri-party repurchase agreements.
An MRA governs transactions between a Fund and select counterparties. An MRA contains provisions for, among other things, initiation, income payments, and events of default and maintenance of securities for repurchase agreements. An MRA also permits offsetting with collateral to create one single net payment in the event of default or similar events, including the bankruptcy or insolvency of a counterparty.
If the seller defaults, a Fund could suffer a loss to the extent that the proceeds from the sale of the underlying securities and other collateral held by the Fund are less than the repurchase price and the Fund’s costs associated with delay and enforcement of the repurchase agreement. In addition, in the event of default or insolvency of the seller, a court could determine that a Fund’s interest in the collateral is not enforceable, resulting in additional losses to the Fund.
62
COMMERCE FUNDS
| | |
| 3. INVESTMENTS AND FAIR VALUE MEASUREMENTS (continued) | | |
B. Level 3 Fair Value Investments — The valuation techniques and significant inputs used in determining the fair values for investments classified as Level 3 are as follows:
To the extent that the aforementioned significant inputs are unobservable, or if quotations are not readily available, or if Commerce believes that such quotations do not accurately reflect fair value, the fair value of a Fund’s investments may be determined under valuation procedures approved by the Trust’s Board of Trustees. Commerce, consistent with the Funds’ procedures and applicable regulatory guidance, may make an adjustment to the most recent valuation prices of either domestic or foreign securities in light of significant events to reflect what it believes to be the fair value of the securities at the time of determining a Fund’s NAV. Significant events that could affect a large number of securities in a particular market may include, but are not limited to: significant fluctuations in U.S. or foreign markets; market dislocations; market disruptions; or unscheduled market closings. Significant events that could also affect a single issuer may include, but are not limited to: corporate actions such as reorganizations, mergers and buy-outs; ratings downgrades; and bankruptcies.
C. Fair Value Hierarchy — The following is a summary of the Funds’ investments and derivatives classified in the fair value hierarchy as of April 30, 2015:
| | | | | | | | | | | | |
| GROWTH | | | | | | | | | | | | |
| Investment Type | | Level 1 | | | Level 2 | | | Level 3 | |
Assets | | | | | | | | | | | | |
Common Stock and/or Exchange Traded Fund | | $ | 73,551,672 | | | $ | — | | | $ | — | |
Total | | $ | 73,551,672 | | | $ | — | | | $ | — | |
| | | |
| VALUE | | | | | | | | | | | | |
| Investment Type | | Level 1 | | | Level 2 | | | Level 3 | |
Assets | | | | | | | | | | | | |
Common Stock and/or Exchange Traded Fund | | $ | 225,051,465 | | | $ | — | | | $ | — | |
Total | | $ | 225,051,465 | | | $ | — | | | $ | — | |
| | | |
| MIDCAP GROWTH | | | | | | | | | | | | |
| Investment Type | | Level 1 | | | Level 2 | | | Level 3 | |
Assets | | | | | | | | | | | | |
Common Stock and/or Exchange Traded Fund | | $ | 65,829,731 | | | $ | — | | | $ | — | |
Short-term Investment | | | — | | | | 496,000 | | | | — | |
Total | | $ | 65,829,731 | | | $ | 496,000 | | | $ | — | |
| | | |
| BOND | | | | | | | | | | | | |
| Investment Type | | Level 1 | | | Level 2 | | | Level 3 | |
Assets | | | | | | | | | | | | |
Fixed Income | | | | | | | | | | | | |
Asset-Backed Securities | | $ | — | | | $ | 117,251,880 | | | $ | — | |
Municipal Bond Obligations | | | — | | | | 95,052,708 | | | | — | |
Mortgage-Backed Obligations | | | — | | | | 176,115,977 | | | | — | |
Corporate Obligations | | | — | | | | 496,428,864 | | | | — | |
Foreign Debt Obligations | | | 246,033 | | | | — | | | | — | |
U.S. Treasury and/or Other U.S. Government Agencies | | | 36,598,670 | | | | 38,051,735 | | | | — | |
Investment Company | | | 5,374,254 | | | | — | | | | — | |
Short-term Investment | | | — | | | | 7,637,000 | | | | — | |
Total | | $ | 42,218,957 | | | $ | 930,538,164 | | | $ | — | |
63
COMMERCE FUNDS
Notes to Financial Statements (continued)
April 30, 2015 (Unaudited)
| | |
| 3. INVESTMENTS AND FAIR VALUE MEASUREMENTS (continued) | | |
| | | | | | | | | | | | |
| | | |
| SHORT-TERM GOVERNMENT | | | | | | | | | | | | |
| Investment Type | | Level 1 | | | Level 2 | | | Level 3 | |
Assets | | | | | | | | | | | | |
Fixed Income | | | | | | | | | | | | |
Asset-Backed Securities | | $ | — | | | $ | 4,724,766 | | | $ | — | |
Mortgage-Backed Obligations | | | — | | | | 26,037,124 | | | | — | |
U.S. Treasury and/or Other U.S. Government Agencies | | | 37,283,200 | | | | 90,278,145 | | | | — | |
Short-term Investment | | | — | | | | 8,812,000 | | | | — | |
Total | | | 37,283,200 | | | | 129,852,035 | | | | — | |
| | | |
| NATIONAL TAX-FREE INTERMEDIATE BOND | | | | | | | | | | | | |
| Investment Type | | Level 1 | | | Level 2 | | | Level 3 | |
Assets | | | | | | | | | | | | |
Fixed Income | | | | | | | | | | | | |
Municipal Bond Obligations | | $ | | | | $ | 259,437,820 | | | $ | | |
Investment Company | | | 5,899,552 | | | | — | | | | — | |
Short-term Investment | | | — | | | | 470,000 | | | | — | |
Total | | $ | 5,899,552 | | | $ | 259,907,820 | | | $ | — | |
| | | |
| MISSOURI TAX-FREE INTERMEDIATE BOND | | | | | | | | | | | | |
| Investment Type | | Level 1 | | | Level 2 | | | Level 3 | |
Assets | | | | | | | | | | | | |
Fixed Income | | | | | | | | | | | | |
Municipal Bond Obligations | | $ | — | | | $ | 294,647,666 | | | $ | — | |
Investment Company | | | 7,508,520 | | | | — | | | | — | |
Short-term Investment | | | — | | | | 1,040,000 | | | | — | |
Total | | $ | 7,508,520 | | | $ | 295,687,666 | | | $ | — | |
| | | |
| KANSAS TAX-FREE INTERMEDIATE BOND | | | | | | | | | | | | |
| Investment Type | | Level 1 | | | Level 2 | | | Level 3 | |
Assets | | | | | | | | | | | | |
Fixed Income | | | | | | | | | | | | |
Municipal Bond Obligations | | $ | — | | | $ | 101,793,547 | | | $ | — | |
Investment Company | | | 2,788,879 | | | | — | | | | — | |
Short-term Investment | | | — | | | | 4,553,000 | | | | — | |
Total | | $ | 2,788,879 | | | $ | 106,346,547 | | | $ | — | |
For further information regarding security characteristics, see the Schedules of Investments.
The Trustees have adopted Valuation Procedures that govern the valuation of the portfolio investments held by the Funds, including investments for which market quotations are not readily available. The Trustees have delegated to Commerce day-to-day responsibility for implementing and maintaining internal controls and procedures related to the valuation of the Funds’ portfolio investments. To assess the continuing appropriateness of pricing sources and methodologies, Commerce regularly performs price verification procedures and issues challenges as necessary to third party pricing vendors or brokers, and any differences are reviewed in accordance with the Valuation Procedures.
64
COMMERCE FUNDS
| | |
| 4. AGREEMENTS AND OTHER AFFILIATED TRANSACTIONS | | |
A. Advisory Agreement — Pursuant to the terms of the Advisory Agreement, the Adviser is responsible for managing the investments and making investment decisions for each of the Funds. For these services and for assuming related expenses, the Adviser is entitled to a fee, accrued daily and payable monthly, at the contractual annual rate of the corresponding Fund’s average daily net assets. The contractual advisory fees for the Funds are as follows:
| | | | | | |
| | | Contractual Advisory Fees |
| Fund | | First
$100 million | | Next
$100 million | | Over
$200 million |
Growth and MidCap Growth | | 0.65% | | 0.50% | | 0.40% |
Short-Term Government, National Tax-Free Intermediate Bond, Missouri Tax-Free Intermediate Bond and Kansas Tax-Free Intermediate Bond | | 0.50% | | 0.35% | | 0.25% |
| | | First
$400 million | | Next
$300 million | | Over
$700 million |
Bond | | 0.50% | | 0.35% | | 0.25% |
The contractual advisory fee for the Value Fund is 0.30% of the Fund’s average daily net assets.
For the six months ended April 30, 2015, the effective advisory fees were 0.65%, 0.30%, 0.65%, 0.41%, 0.50%, 0.39%, 0.37% and 0.49% for the Growth, Value, MidCap Growth, Bond, Short-Term Government, National Tax-Free Intermediate Bond, Missouri Tax-Free Intermediate Bond and Kansas Tax-Free Intermediate Bond Funds, respectively.
B. Administration Agreements — Goldman Sachs Asset Management, L.P. (“GSAM”), an affiliate of Goldman Sachs & Co. (“Goldman Sachs”), and Commerce, serve as Co-Administrators of the Trust pursuant to a Co-Administration Agreement. Under the Co-Administration Agreement, GSAM and Commerce administer the Trust’s business affairs. As compensation for the services rendered under the Co-Administration Agreement, GSAM and Commerce are entitled to a fee, accrued daily and payable monthly, at the contractual annual rate of the corresponding Fund’s average daily net assets. Pursuant to the Co-Administration Agreement, the Funds will pay an aggregate administrative fee at the annual rate of 0.15%, allocated as follows: (1) for each Fund, Commerce is entitled to receive 0.12% of each Fund’s average daily net assets; and (2) for each Fund, GSAM is entitled to receive 0.03% of each Fund’s average daily net assets.
C. Distribution Agreement — The Commerce Funds’ shares are offered on a continuous basis through Goldman Sachs & Co. (“Goldman”), which acts as Distributor under the Distribution Agreement with The Commerce Funds. Goldman does not receive compensation from the Funds for these services.
D. Other Agreements — The Adviser has contractually agreed to waive fees and/or reimburse expenses (excluding interest, taxes and extraordinary expenses) for all Funds (except the MidCap Growth Fund) to the extent that such expenses exceeded, on an annualized basis, 1.13%, 0.70%, 0.80%, 0.68%, 0.70%, 0.70% and 0.70% of the average net assets of the Growth, Value, Bond, Short-Term Government, National Tax-Free Intermediate Bond, Missouri Tax-Free Intermediate Bond and Kansas Tax-Free Intermediate Bond Funds, respectively. The Adviser has contractually agreed to reduce or limit the Total Annual Fund Operating Expenses excluding interest, taxes, acquired fund fees and expenses and extraordinary expenses. This agreement will remain in place through March 1, 2016. After this date, the Adviser or a Fund may terminate the contractual arrangement. In addition, the Funds are not obligated to reimburse the Adviser for prior fiscal year expense reimbursements, if any. Expense reimbursements, if any, are accrued daily and paid monthly and are disclosed in the Statements of Operations for the six months ended ended April 30, 2015.
65
COMMERCE FUNDS
Notes to Financial Statements (continued)
April 30, 2015 (Unaudited)
| | |
| 4. AGREEMENTS AND OTHER AFFILIATED TRANSACTIONS (continued) | | |
Pursuant to a Shareholder Administrative Services Plan adopted by the Trust’s Board of Trustees, the Funds may enter into agreements with service organizations, such as banks and financial institutions, which include affiliates of the Adviser (“Service Organizations”), under which they will render shareholder administration support services. For these services, the Service Organizations are entitled to receive fees from each Fund at an annual rate of up to 0.25% of the average daily net asset value of Fund shares beneficially owned by clients of such Service Organizations. For the six months ended April 30, 2015, Commerce Bank, an affiliate of the Adviser, received $187,458 in shareowner servicing fees.
E. Deferred Compensation Plan — Certain Trustees participate in a Deferred Compensation Plan, as amended and restated (the “Plan”), which allows eligible non-affiliated Trustees as described in the Plan to defer the receipt of all or a portion of the Trustees’ fees payable. Under the Plan, such Trustees have deferred fees treated as if they had been invested by The Commerce Funds in the shares of one or more Funds of the Trust. All amounts payable to the Trustees under the Plan are determined based on the performance of such Funds and are accrued monthly.
| | |
| 5. PORTFOLIO SECURITIES TRANSACTIONS | | |
The cost of purchases and proceeds from sales and maturities of long-term securities for the six months ended April 30, 2015, were as follows:
| | | | | | | | | | | | | | | | |
| Fund | | Purchases of U.S. Government
and Agency
Obligations | | | Purchases
(Excluding U.S. Government
and Agency
Obligations) | | | Sales and
Maturities of
U.S. Government
and Agency
Obligations | | | Sales
and Maturities
(Excluding
U.S. Government
and Agency
Obligations) | |
Growth | | $ | — | | | $ | 16,418,397 | | | $ | — | | | $ | 20,012,081 | |
Value | | | — | | | | 33,779,450 | | | | — | | | | 44,839,030 | |
MidCap Growth | | | — | | | | 15,664,657 | | | | — | | | | 16,986,042 | |
Bond | | | 32,532,441 | | | | 179,379,035 | | | | 9,024,917 | | | | 74,384,447 | |
Short-Term Government | | | 71,183,788 | | | | 2,866,378 | | | | 10,251,862 | | | | 1,456,868 | |
National Tax-Free Intermediate Bond | | | — | | | | 68,585,152 | | | | — | | | | 64,531,702 | |
Missouri Tax-Free Intermediate Bond | | | — | | | | 24,284,584 | | | | — | | | | 29,323,442 | |
Kansas Tax-Free Intermediate Bond | | | — | | | | 4,895,837 | | | | — | | | | 5,259,730 | |
As of the Funds’ most recent fiscal year ended, October 31, 2014, the Funds’ capital loss carryforwards and certain timing differences on a tax basis, if any, were as follows:
| | | | | | | | | | | | | | | | |
| | | Growth | | | Value | | | MidCap
Growth | | | Bond | |
Capital loss carryforward | | $ | — | | | $ | — | | | $ | — | | | $ | — | |
Timing differences (distributions payable, deferred compensation) | | $ | (21,148 | ) | | $ | (20,631 | ) | | $ | (13,774 | ) | | $ | (1,926,843 | ) |
66
COMMERCE FUNDS
| | |
| 6. TAX INFORMATION (continued) | | |
| | | | | | | | | | | | | | | | |
| | | Short-Term
Government | | | National Tax-Free
Intermediate Bond | | | Missouri Tax-Free
Intermediate Bond | | | Kansas Tax-Free
Intermediate Bond | |
Capital loss carryforward | | $ | (4,291,480 | ) | | $ | (2,186,964 | ) | | $ | (6,415,248 | ) | | $ | (1,049,849 | ) |
Timing differences (distributions payable, deferred compensation) | | $ | (81,538 | ) | | $ | (428,316 | ) | | $ | (549,298 | ) | | $ | (171,876 | ) |
Capital loss carryforwards:(1) | | | | | | | | | | | | | | | | |
Expiring 2015 | | | (1,094,544 | ) | | | — | | | | — | | | | — | |
Expiring 2016 | | | (347,228 | ) | | | — | | | | — | | | | — | |
Expiring 2017 | | | (400,692 | ) | | | — | | | | — | | | | — | |
Expiring 2018 | | | (460,436 | ) | | | — | | | | — | | | | — | |
Expiring 2019 | | | (375,119 | ) | | | — | | | | — | | | | — | |
Perpetual Short-term | | | (266,198 | ) | | | — | | | | (432,522 | ) | | | (61,805 | ) |
Perpetual Long-term | | | (1,347,263 | ) | | | (2,186,964 | ) | | | (5,982,726 | ) | | | (988,044 | ) |
Total capital loss carryforwards: | | $ | (4,291,480 | ) | | $ | (2,186,964 | ) | | $ | (6,415,248 | ) | | $ | (1,049,849 | ) |
| (1) | | Expiration occurs on October 31 of the year indicated. |
As of April 30, 2015, the Funds’ aggregate security unrealized gains and losses based on cost for U.S. federal income tax purposes were as follows:
| | | | | | | | | | | | | | | | |
| | | Growth | | | Value | | | MidCap Growth | | | Bond | |
Tax Cost | | $ | 56,936,715 | | | $ | 192,127,303 | | | $ | 52,672,381 | | | $ | 929,870,580 | |
Gross unrealized gain | | | 17,078,637 | | | | 35,296,363 | | | | 14,687,281 | | | | 58,928,425 | |
Gross unrealized loss | | | (463,680 | ) | | | (2,372,201 | ) | | | (1,033,931 | ) | | | (16,041,884 | ) |
Net unrealized security gain | | $ | 16,614,957 | | | $ | 32,924,162 | | | $ | 13,653,350 | | | $ | 42,886,541 | |
| | | | |
| | | Short-Term Government | | | National Tax-Free Intermediate Bond | | | Missouri Tax-Free Intermediate Bond | | | Kansas Tax-Free
Intermediate Bond | |
Tax Cost | | $ | 165,831,943 | | | $ | 257,897,629 | | | $ | 290,488,053 | | | $ | 103,908,128 | |
Gross unrealized gain | | | 4,448,584 | | | | 8,633,754 | | | | 13,325,251 | | | | 5,300,037 | |
Gross unrealized loss | | | (3,145,292 | ) | | | (724,011 | ) | | | (617,118 | ) | | | (72,739 | ) |
Net unrealized security gain | | $ | 1,303,292 | | | $ | 7,909,743 | | | $ | 12,708,133 | | | $ | 5,227,298 | |
The difference between GAAP-basis and tax-basis unrealized gains (losses) is attributable primarily attributable to wash sales and differences in the tax treatment of market discount accretion and premium amortization.
Commerce and GSAM have reviewed the Funds’ tax positions for all open tax years (the current and prior three fiscal years) and have concluded the no provision for income tax is required in the Funds’ financial statements. These open tax years remain subject to examination and adjustment by tax authorities.
The Funds’ risks include, but are not limited to, the following:
Credit Risks — The fixed income funds are subject to credit risks because an issuer or guarantor of a fixed income security may be unable or unwilling to make interest and principal payments when due. A bond’s value could decline because of concerns about an issuer’s willingness to make such payments.
67
COMMERCE FUNDS
Notes to Financial Statements (continued)
April 30, 2015 (Unaudited)
| | |
| 7. OTHER RISKS (continued) | | |
Interest Rate Risks — Interest rate risk is the risk that the value of the Fund’s portfolio will decline because of rising interest rates. The magnitude of this decline will often be greater for longer-term, fixed-income securities than shorter-term securities.
Market Risks — In the normal course of business, the Funds trade financial instruments and enter into financial transactions where risk of potential loss exists due to changes in the market (market risk).
Portfolio Concentrations — The Missouri Tax-Free Intermediate Bond and Kansas Tax-Free Intermediate Bond Funds invest a large percentage of their assets in obligations of issuers within Missouri and Kansas, respectively. Therefore, they are subject to possible concentration risks associated with economic, political or legal developments or industrial or regional matters specifically affecting those states.
Under normal market conditions, the Missouri Tax-Free Intermediate Bond Fund and the Kansas Tax-Free Intermediate Bond Fund invest at least 80% of their assets plus any borrowings for investment purposes (measured at the time of purchase) in Missouri and Kansas municipal securities, respectively, the income from which, in the opinion of bond counsel, is exempt from regular federal income tax, federal alternative minimum taxes and Missouri and Kansas state taxes, respectively. Alternatively, at least 80% of a Fund’s distributed income must be exempt from such taxes. For each of the Missouri and Kansas Tax-Free Funds, the actual payment of principal and interest on Missouri and Kansas municipal securities is dependent on the Missouri General Assembly and the Kansas legislature, respectively, allotting money each fiscal year for these payments.
The investments of the Growth and MidCap Growth Funds may be concentrated in securities of technology companies. At times, securities of technology companies may experience significant price fluctuations. The MidCap Growth Fund concentrates in mid-cap stocks. Investing in mid-sized companies may be riskier than investing in larger, more established companies.
The Bond and Short-Term Government Funds may invest 80% and 100%, respectively, of their total assets in mortgage-related securities and the Bond Fund may invest 80% of its total assets in asset-backed securities. Mortgage-backed securities, especially collateralized mortgage-backed securities, may be subject to risks that include price volatility, liquidity, and enhanced sensitivity to interest rates. As a result, mortgage-backed securities may be more difficult to value and liquidate, if necessary. Mortgage-backed securities are also subject to prepayment risk, which may result in a decreased rate of return and a decline in the value of the securities. Asset-backed securities are dependent upon payment of the underlying consumer loans or receivables by individuals, and the certificate holder frequently has no recourse against the entity that originated the loans or receivables. Asset-backed securities have a greater risk of default during periods of economic downturn than other securities. Also, asset-backed securities may be less liquid than other securities and therefore more difficult to value and liquidate, if necessary.
Under the Trust’s organizational documents, its trustees, officers, employees and agents are indemnified, to the extent permitted by the Act and state law, against certain liabilities that may arise out of performance of their duties to the Funds. Additionally, in the course of business, the Funds enter into contracts that contain a variety of indemnification clauses. The Fund’s maximum exposure under these arrangements is unknown, as this would involve future claims that may be made against the Funds that have not yet occured. However, in their experience, Commerce and GSAM believe the risk of loss under these arrangements to be remote.
68
COMMERCE FUNDS
Approval of Advisory Agreement — The Trustees oversee the management of the Trust, and review the investment performance and expenses of the Funds at regularly scheduled meetings held during the Funds’ fiscal year. In addition, the Trustees determine annually whether to reapprove and continue the Trust’s investment advisory agreement (“Advisory Agreement”) with the Adviser for the Funds.
The Advisory Agreement for the Funds was most recently approved by the Trustees, including all of the Trustees who are not parties to the Advisory Agreement or “interested persons” (as such term is defined in the Act) of any party thereto (the “non-interested Trustees”), on November 18, 2014 (the “Annual Contract Meeting”).
Prior to the Annual Contract Meeting, the Board of Trustees received written materials provided by the Adviser relating to the Trustees’ consideration of the Advisory Agreement. At the Annual Contract Meeting, the Trustees also received and considered the Adviser’s oral presentations and discussed the information that had been provided. In connection with their deliberations, the disinterested Trustees were advised by their independent legal counsel regarding their responsibilities under applicable law and met separately in executive session with independent counsel without members of management present.
In evaluating the Advisory Agreement, the Trustees relied upon their knowledge, resulting from their meetings and other interactions throughout the year, of the Adviser and its services and personnel. Both in meetings specifically dedicated to the review of the Advisory Agreement and meetings held during the year, the Trustees reviewed materials relating to the Adviser’s investment management services. Specifically, the Trustees reviewed, among other things, information relating to: (i) the terms of the Advisory Agreement; (ii) the Funds’ investment performance over different time periods in comparison to the investment performance of mutual fund peer categories selected by Lipper Inc. (“Lipper”), a third-party provider of mutual fund data; (iii) the contractual investment advisory fees, the actual investment advisory fees (after expense reimbursements) and the total expenses borne by the Funds in comparison to those borne by mutual fund peer groups selected by Lipper; (iv) the Adviser’s staffing for the Funds and the experience of the portfolio managers and other investment personnel; (v) the fees paid by the Funds to the Adviser and its affiliates for services, and the expenses incurred by them in connection with the provision of those services, the profitability of the Advisory Agreement to the Adviser, and a comparison of the Adviser’s profitability with that of other publicly reported profitability information of other advisers; (vi) information about fees charged to institutional accounts for which an affiliate of the Adviser, Commerce Trust Company (“CTC”), was performing services similar to those performed for the Funds; and (vii) potential economies of scale.
In connection with their approval of the Advisory Agreement for each of the Funds, the Trustees gave weight to various factors, but did not identify any single factor as controlling their decision. As part of their review, the Trustees considered the following factors:
Nature, Quality and Extent of Services – The Trustees reviewed the nature, quality and extent of services provided by the Adviser to the Funds, taking into account the investment objectives and strategies of each Fund and knowledge gained from meetings with management through the year. The Trustees also considered the available resources and key investment personnel of the Adviser, including members of the staff who operated the quantitative model, and their experience and length of service to the Funds. The Trustees discussed the Adviser’s reports to the Board, compliance record, risk management program and effectiveness of oversight over the Funds’ other service providers, communications to and support services for shareholders, service as the Funds’ co-administrator, adherence to investment policies, execution of portfolio transactions and selection of broker dealers and other similar factors.
The Trustees determined that the Adviser had invested significant resources in the Funds and provided a seasoned and experienced portfolio management and compliance staff. Moreover, they considered that the Adviser had a highly disciplined money management and credit research and analytic process and was able to attract and retain high quality personnel. The Trustees also considered that the Adviser had provided clear, concise reports to the Board and updated the Trustees frequently on performance issues. In particular, they noted the Adviser’s efforts to correct the underperformance of the Equity Funds in recent years. They concluded that the Adviser had (i) an excellent compliance record, and (ii) provided strong oversight over
69
COMMERCE FUNDS
Notes to Financial Statements (continued)
April 30, 2015 (Unaudited)
| | |
| 9. OTHER MATTERS (continued) | | |
compliance programs of the other service providers to the Funds. The Trustees also discussed that the Funds had had clean audits and regulatory exams and that the Adviser had made significant commitments to address regulatory requirements applicable to the Funds and the Adviser. The Trustees concluded that the Funds would therefore benefit from the Adviser’s continued service to them.
Performance of the Funds – The Trustees considered both the short-term and long-term performance of each of the Funds. They also considered performance in light of market conditions and each Fund’s investment objectives and strategies including risk and credit parameters, if applicable. They reviewed and discussed the Lipper and other information presented, which compared each Fund’s performance with that of its benchmark and with performance of comparable funds identified by Lipper. The Trustees believed that performance of the Fixed Income Funds was very satisfactory over all time periods.
The Trustees considered that the Value Fund’s returns lagged during the past year and three years but were excellent over the five and ten-year periods and that the Adviser had successfully improved the Fund’s performance through changes made several years ago to its quantitative investment methodology. The Trustees concluded that the Growth and MidCap Growth Funds’ returns were competitive and had improved significantly over the one-year period as a result of changes made by the Adviser to their quantitative models. The Trustees believed that the Adviser was making significant efforts to address past underperformance of these Funds through enhancements to their quantitative models and that the Trustees would continue to monitor these changes.
Fund Fees and Expenses – The Trustees next turned to Fund advisory fees and total net expenses. They reviewed each Fund’s advisory fees and net expense ratios versus similar funds as presented in the Lipper information. They observed that the advisory fees were generally higher than peers (except for the Value, MidCap Growth and Missouri Tax-Free Intermediate Bond Funds) and that net expenses were higher than peers, except for the Growth, Bond, MidCap Growth and Value Funds. The Trustees noted that where Fund expenses were higher, it was within a range of 1-13 basis points. The Trustees considered the amount of assets in the Funds, the Funds’ share structure and the Adviser’s fee caps on each of the Short-Term Government and Tax-Free Funds, and substantial reimbursements made by the Adviser to maintain those caps. The Trustees also considered that the Lipper expense versus three-year performance charts showed that shareholders were generally receiving value for the services provided by the Adviser.
The Trustees also reviewed information provided on the Funds’ advisory fees compared to advisory fees charged by the Adviser’s affiliates to similar institutional accounts managed by Commerce personnel. These accounts were not managed by the Adviser but by its affiliate, CTC; but, some of the same investment personnel provided these advisory services. In some cases, the fees charged were lower than the fees charged to the Funds and in other cases the fees were about the same. The Trustees considered Commerce’s explanations for the differences in services provided by Commerce or its affiliates to these clients.
Costs of Services and Profits Realized by the Adviser – The Board considered the Adviser’s cost of providing advisory services to the Funds, both on a pre- and post-marketing cost basis, as well as its profitability. The Trustees considered that the Adviser had reduced its advisory fees for most of the Funds in 2012 pursuant to a Fee Reduction Commitment, under which those Funds’ advisory fees were permanently reduced and made subject to breakpoints. It was also noted that the Adviser’s cost allocation methodology had not changed and appeared generally reasonable. The Trustees discussed that the Adviser appeared to have a rigorous and consistent program in place to control Fund expenses. The Trustees considered the Adviser’s profitability in light of the profitability of other investment advisers’ publicly-reported profitability margins, as provided by Lipper, and concluded that it was within the range of reasonability.
Economies of Scale – The Trustees considered that the Funds’ (other than the Value Fund) had breakpoints in their respective advisory fee schedules. In addition, the Trustees considered that the Adviser was reimbursing expenses to certain of the Funds to keep them within their fee caps. The Trustees concluded that the Adviser was sharing economies of scale with shareholders.
70
COMMERCE FUNDS
| | |
| 9. OTHER MATTERS (continued) | | |
Fall-Out Benefits – The principal benefits to the Adviser from its relationship with the Funds were its receipt of soft dollars, its contract as a Co-Administrator of the Funds and CTC’s receipt of shareholder servicing fees. The Trustees considered that they receive regular, extensive quarterly reports on the Adviser’s soft dollar program and that its program was in compliance with Section 28(e) of the Securities Exchange Act of 1934. They also considered that the Adviser had a system in place to test for best execution, which is reviewed on at least an annual basis.
The Trustees concluded at the Annual Contract Meeting with respect to all of the Funds that the investment advisory fees paid by the Funds were reasonable in light of the services provided by the Adviser, Fund performance, the Adviser’s costs and the Funds’ current and reasonably foreseeable asset levels. For these reasons, the Board determined that the Advisory Agreement should be reapproved and continued.
Subsequent events after the Statement of Assets and Liabilities date have been evaluated through the date the financial statements were issued. Commerce and GSAM have concluded that there is no impact requiring adjustment or disclosure in the financial statements.
71
COMMERCE FUNDS
Notes to Financial Statements (continued)
April 30, 2015 (Unaudited)
| | |
| 11. SUMMARY OF SHARE TRANSACTIONS | | |
Share activity is as follows:
| | | | | | | | | | | | | | | | |
| | | Growth Fund | |
| | | For the Six Months Ended
April 30, 2015
(Unaudited) | | | For the Fiscal Year Ended
October 31, 2014 | |
| | | Shares | | | Dollars | | | Shares | | | Dollars | |
Shares sold | | | 419,215 | | | $ | 12,020,001 | | | | 325,421 | | | $ | 10,565,007 | |
Reinvestment of distributions | | | 223,737 | | | | 6,345,334 | | | | 247,431 | | | | 7,605,254 | |
Shares redeemed | | | (218,488 | ) | | | (6,403,698 | ) | | | (1,426,730 | ) | | | (47,291,295 | ) |
| Net Increase (Decrease) | | | 424,464 | | | $ | 11,961,637 | | | | (853,878 | ) | | $ | (29,121,034 | ) |
| | | | |
| | | | | | | | | | | | | | | | |
| | | Value Fund | |
| | | For the Six Months Ended
April 30, 2015
(Unaudited) | | | For the Fiscal Year Ended
October 31, 2014 | |
| | | Shares | | | Dollars | | | Shares | | | Dollars | |
Shares sold | | | 786,660 | | | $ | 25,381,127 | | | | 3,226,063 | | | $ | 100,718,728 | |
Reinvestment of distributions | | | 165,777 | | | | 5,361,027 | | | | 72,159 | | | | 2,273,146 | |
Shares redeemed | | | (1,241,426 | ) | | | (39,969,741 | ) | | | (1,316,690 | ) | | | (41,098,115 | ) |
| Net Increase (Decrease) | | | (288,989 | ) | | $ | (9,227,587 | ) | | | 1,981,532 | | | $ | 61,893,759 | |
| | | | |
| | | | | | | | | | | | | | | | |
| | | MidCap Growth Fund | |
| | | For the Six Months Ended
April 30, 2015
(Unaudited) | | | For the Fiscal Year Ended
October 31, 2014 | |
| | | Shares | | | Dollars | | | Shares | | | Dollars | |
Shares sold | | | 229,663 | | | $ | 8,125,312 | | | | 211,051 | | | $ | 7,762,539 | |
Reinvestment of distributions | | | 63,418 | | | | 2,222,918 | | | | 58,997 | | | | 2,083,398 | |
Shares redeemed | | | (100,352 | ) | | | (3,654,153 | ) | | | (298,273 | ) | | | (11,100,183 | ) |
| Net Increase (Decrease) | | | 192,729 | | | $ | 6,694,077 | | | | (28,225 | ) | | $ | (1,254,246 | ) |
| | | | |
| | | | | | | | | | | | | | | | |
| | | Bond Fund | |
| | | For the Six Months Ended
April 30, 2015
(Unaudited) | | | For the Fiscal Year Ended
October 31, 2014 | |
| | | Shares | | | Dollars | | | Shares | | | Dollars | |
Shares sold | | | 7,786,103 | | | $ | 159,514,777 | | | | 8,411,197 | | | $ | 171,199,040 | |
Shares issued in connection with in-kind sale | | | — | | | | — | | | | 751,652 | | | | 15,190,894 | |
Reinvestment of distributions | | | 284,165 | | | | 5,810,691 | | | | 390,827 | | | | 7,952,090 | |
Shares redeemed | | | (2,744,036 | ) | | | (56,153,332 | ) | | | (5,615,775 | ) | | | (114,182,055 | ) |
| Net Increase | | | 5,326,232 | | | $ | 109,172,136 | | | | 3,937,901 | | | $ | 80,159,969 | |
72
COMMERCE FUNDS
| | |
| 11. SUMMARY OF SHARE TRANSACTIONS (continued) | | |
| | | | | | | | | | | | | | | | |
| | | | |
| | | | | | | | | | | | | | | | |
| | | | | | | | | | | | | | | | |
| | | Short-Term Government Fund | |
| | | For the Six Months Ended
April 30, 2015
(Unaudited) | | | For the Fiscal Year Ended
October 31, 2014 | |
| | | Shares | | | Dollars | | | Shares | | | Dollars | |
Shares sold | | | 5,347,573 | | | $ | 93,656,994 | | | | 2,506,485 | | | $ | 44,208,165 | |
Reinvestment of distributions | | | 27,110 | | | | 475,113 | | | | 49,077 | | | | 865,517 | |
Shares redeemed | | | (1,389,343 | ) | | | (24,350,123 | ) | | | (2,779,539 | ) | | | (49,060,080 | ) |
| Net Increase (Decrease) | | | 3,985,340 | | | $ | 69,781,984 | | | | (223,977 | ) | | $ | (3,986,398 | ) |
| | | | |
| | | | | | | | | | | | | | | | |
| | | National Tax-Free Intermediate Bond Fund | |
| | | For the Six Months Ended
April 30, 2015
(Unaudited) | | | For the Fiscal Year Ended
October 31, 2014 | |
| | | Shares | | | Dollars | | | Shares | | | Dollars | |
Shares sold | | | 1,306,608 | | | $ | 25,567,824 | | | | 2,737,505 | | | $ | 52,655,081 | |
Reinvestment of distributions | | | 8,538 | | | | 167,134 | | | | 35,031 | | | | 670,298 | |
Shares redeemed | | | (870,965 | ) | | | (17,038,920 | ) | | | (1,964,411 | ) | | | (37,715,185 | ) |
| Net Increase | | | 444,181 | | | $ | 8,696,038 | | | | 808,125 | | | $ | 15,610,194 | |
| | | | |
| | | | | | | | | | | | | | | | |
| | | Missouri Tax-Free Intermediate Bond Fund | |
| | | For the Six Months Ended
April 30, 2015
(Unaudited) | | | For the Fiscal Year Ended
October 31, 2014 | |
| | | Shares | | | Dollars | | | Shares | | | Dollars | |
Shares sold | | | 1,236,241 | | | $ | 24,284,170 | | | | 2,537,991 | | | $ | 49,047,866 | |
Reinvestment of distributions | | | 28,048 | | | | 550,443 | | | | 78,494 | | | | 1,512,647 | |
Shares redeemed | | | (1,244,695 | ) | | | (24,403,990 | ) | | | (2,904,426 | ) | | | (55,869,181 | ) |
| Net Increase (Decrease) | | | 19,594 | | | $ | 430,623 | | | | (287,941 | ) | | $ | (5,308,668 | ) |
| | | | |
| | | | | | | | | | | | | | | | |
| | | Kansas Tax-Free Intermediate Bond Fund | |
| | | For the Six Months Ended
April 30, 2015
(Unaudited) | | | For the Fiscal Year Ended
October 31, 2014 | |
| | | Shares | | | Dollars | | | Shares | | | Dollars | |
Shares sold | | | 631,502 | | | $ | 12,300,448 | | | | 910,259 | | | $ | 17,329,289 | |
Reinvestment of distributions | | | 8,341 | | | | 162,604 | | | | 22,065 | | | | 420,342 | |
Shares redeemed | | | (398,986 | ) | | | (7,772,030 | ) | | | (983,213 | ) | | | (18,692,829 | ) |
| Net Increase (Decrease) | | | 240,857 | | | $ | 4,691,022 | | | | (50,889 | ) | | $ | (943,198 | ) |
73
COMMERCE FUNDS
Fund Expenses – Six Month Period Ended April 30, 2015 (Unaudited)
As a shareholder of the Funds you incur two types of costs: (1) transaction costs and (2) ongoing costs, including management fees; shareholder servicing fees and other Fund expenses. This Example is intended to help you understand your ongoing costs (in dollars) of investing in the Fund and to compare these costs with the ongoing costs of investing in other mutual funds.
The Example is based on an investment of $1,000 invested at the beginning of the period and held for the entire period from November 1, 2014 through April 30, 2015.
Actual Expenses — The first line in the table below provides information about actual account values and actual expenses. You may use the information in this line, together with the amount you invested, to estimate the expenses that you paid over the period. Simply divide your account value by $1,000 (for example, an $8,600 account value divided by $1,000=8.6), then multiply the result by the number in the first line under the heading entitled “Expenses Paid” to estimate the expenses you paid on your account during this period.
Hypothetical Example for Comparison Purposes — The second line in the table below provides information about hypothetical account values and hypothetical expenses based on the Funds’ actual net expense ratios and an assumed rate of return of 5% per year before expenses, which is not the Funds’ actual return. The hypothetical account values and expenses may not be used to estimate the actual ending account balance or expenses you paid for the period. You may use this information to compare the ongoing costs of investing in the Funds and other funds. To do so, compare this 5% hypothetical example with the 5% hypothetical examples that appear in the shareholder reports of the other funds.
Please note that the expenses shown in the table are meant to highlight your ongoing costs only and do not reflect any transactional costs, such as exchange fees, but shareholders of other funds may incur such costs. Therefore, the second line of the table is useful in comparing ongoing costs only, and will not help you determine the relative total costs of owning different funds. In addition, if these transactional costs were included, your costs would have been higher.
| | | | | | | | | | | | | | | | | | | | | | | | | | | | | | | | | | | | | | | | | | | | | | | | |
| | | Beginning
Account
Value
11/1/14 | | | Ending
Account
Value
4/30/15 | | | Expenses
Paid for
the
6 months
ended
4/30/15* | | | Beginning
Account
Value
11/1/14 | | | Ending
Account
Value
4/30/15 | | | Expenses
Paid for
the
6 months
ended
4/30/15* | | | Beginning
Account
Value
11/1/14 | | | Ending
Account
Value
4/30/15 | | | Expenses
Paid for
the
6 months
ended
4/30/15* | | | Beginning
Account
Value
11/1/14 | | | Ending
Account
Value
4/30/15 | | | Expenses
Paid for
the
6 months
ended
4/30/15* | |
| Fund | | Growth Fund | | | Value Fund | | | MidCap Growth Fund | | | Bond Fund | |
Shares | | | | | | | | | | | | | | | | | | | | | | | | | | | | | | | | | | | | | | | | | | | | | | | | |
| Actual | | $ | 1,000.00 | | | $ | 1,051.20 | | | $ | 5.24 | | | $ | 1,000.00 | | | $ | 1,030.40 | | | $ | 3.47 | | | $ | 1,000.00 | | | $ | 1,055.00 | | | $ | 5.25 | | | $ | 1,000.00 | | | $ | 1,018.90 | | | $ | 3.45 | |
| Hypothetical 5% return | | | 1,000.00 | | | | 1,019.69 | + | | | 5.16 | | | | 1,000.00 | | | | 1,021.37 | + | | | 3.46 | | | | 1,000.00 | | | | 1,019.69 | + | | | 5.16 | | | | 1,000.00 | | | | 1,021.37 | + | | | 3.46 | |
| | | Short-Term Government Fund | | | National Tax-Free Intermediate
Bond Fund | | | Missouri Tax-Free Intermediate
Bond Fund | | | Kansas Tax-Free Intermediate Bond Fund | |
Shares | | | | | | | | | | | | | | | | | | | | | | | | | | | | | | | | | | | | | | | | | | | | | | | | |
| Actual | | $ | 1,000.00 | | | $ | 1,006.50 | | | $ | 3.38 | | | $ | 1,000.00 | | | $ | 1,012.90 | | | $ | 3.19 | | | $ | 1,000.00 | | | $ | 1,013.00 | | | $ | 3.14 | | | $ | 1,000.00 | | | $ | 1,013.00 | | | $ | 3.49 | |
| Hypothetical 5% return | | | 1,000.00 | | | | 1,021.42 | + | | | 3.41 | | | | 1,000.00 | | | | 1,021.62 | + | | | 3.21 | | | | 1,000.00 | | | | 1,021.67 | + | | | 3.16 | | | | 1,000.00 | | | | 1,021.32 | + | | | 3.51 | |
| * | | Expenses are calculated using each Fund’s annualized net expense ratio, which represents the ongoing expenses as a percentage of net assets for the six months ended April 30, 2015. Expenses are calculated by multiplying the annualized net expense ratio by the average account value for the period; then multiplying the result by the number of days in the most recent fiscal half year; and then dividing that result by the number of days in the year. The annualized net expense ratios for the period were as follows: |
| | | | | | | | | | | | |
Fund | | | | | | | Fund | | | |
| Growth | | | 1.03 | % | | | | Short-Term Government | | | 0.68 | % |
| Value | | | 0.69 | | | | | National Tax-Free Intermediate Bond | | | 0.64 | |
| MidCap Growth | | | 1.03 | | | | | Missouri Tax-Free Intermediate Bond | | | 0.63 | |
| Bond | | | 0.69 | | | | | Kansas Tax-Free Intermediate Bond | | | 0.70 | |
| + | | Hypothetical expenses are based on the Funds’ actual net expense ratios and an assumed rate of return of 5% per year before expenses. |
74
COMMERCE FUNDS
The Commerce Funds
Growth Fund:
The Fund is subject to market risk so that the value of the securities in which it invests may go up or down in response to the prospects of individual companies, particular industry sectors and/or general economic conditions. Investments in technology companies, which may produce or use products or services that prove commercially unsuccessful or become obsolete, may be subject to greater price volatility than securities of companies in other sectors.
Value Fund:
The Fund is subject to market risk so that the value of the securities in which it invests may go up or down in response to the prospects of individual companies, particular industry sectors and/or general economic conditions.
MidCap Growth Fund:
The Fund invests in small- and mid-capitalization securities. Generally, smaller and mid-sized companies are more vulnerable to adverse developments because of more limited product lines, markets or financial resources. As a result, the securities of smaller and mid-sized companies involve greater risks than those associated with larger, more established companies and may be subject to more abrupt or erratic trading and price movements. Investments in technology companies, which may produce or use products or services that prove commercially unsuccessful or become obsolete, may be subject to greater price volatility than securities of companies in other sectors.
Bond Fund:
Investments in fixed income securities are subject to the risks associated with debt securities including credit and interest rate risk. The guarantee on U.S. government securities applies only to the underlying securities of the Fund if held to maturity and not to the value of the Fund’s shares. Mortgage-backed securities, especially collateralized mortgage-backed securities, may be subject to risks that include price volatility, liquidity and enhanced sensitivity to interest rates. Asset-backed securities may be less liquid than other securities and therefore more difficult to value and liquidate, if necessary.
Short-Term Government Fund:
Investments in fixed income securities are subject to the risks associated with debt securities including credit and interest rate risk. The guarantee on U.S. government securities applies only to the underlying securities of the Fund if held to maturity and not to the value of the Fund’s shares. Mortgage-backed securities, especially collateralized mortgage-backed securities, may be subject to risks that include price volatility, liquidity and enhanced sensitivity to interest rates.
National Tax-Free Intermediate Bond Fund:
Investments in fixed income securities are subject to the risks associated with debt securities including credit and interest rate risk. Investments in municipal securities can be significantly affected by political changes as well as uncertainties in the municipal market related to taxation or legislative changes. The Fund’s investments may subject shareholders to the federal alternative minimum tax and state income taxes.
Missouri Tax-Free Intermediate Bond Fund:
Investments in fixed income securities are subject to the risks associated with debt securities including credit and interest rate risk. The Fund invests its assets predominately in Missouri bonds. The actual payment of principal and interest on these bonds is dependent on the Missouri General Assembly allotting money each fiscal year for these payments. The Fund is non-diversified. Due to the small number of bonds generally held in the portfolio, the Fund may be subject to greater risks than a more diversified fund. A change in the value of any single holding may affect the overall value more than it would affect a
75
COMMERCE FUNDS
The Commerce Funds (continued)
diversified fund that holds more investments. Investments in municipal securities can be significantly affected by political changes as well as uncertainties in the municipal market related to taxation or legislative changes. In addition, the Fund’s investments may subject shareholders to federal alternative minimum tax. The investment income from this Fund may be subject to state income taxes.
Kansas Tax-Free Intermediate Bond Fund:
Investments in fixed income securities are subject to the risks associated with debt securities including credit and interest rate risk. The Fund invests its assets predominately in Kansas bonds. The actual payment of principal and interest on these bonds is dependent on the Kansas legislature allotting money each fiscal year for these payments. The Fund is non-diversified. Due to the small number of bonds generally held in the portfolio, the Fund may be subject to greater risks than a more diversified fund. A change in the value of any single holding may affect the overall value more than it would affect a diversified fund that holds more investments. Investments in municipal securities can be significantly affected by political changes as well as uncertainties in the municipal market related to taxation or legislative changes. In addition, the Fund’s investments may subject shareholders to federal alternative minimum tax. The investment income from this Fund may be subject to state income taxes.
76
INVESTMENT ADVISER
DISTRIBUTOR
AND CO-ADMINISTRATOR
Goldman, Sachs & Co.
Commerce Investment Advisors, Inc.
200 West Street
922 Walnut Street
New York, New York 10282
4th Floor
Kansas City, Missouri 64106
CO-ADMINISTRATOR
Goldman Sachs Asset Management, L.P.
CUSTODIAN/ACCOUNTING AGENT
200 West Street
State Street Bank & Trust Company
New York, New York 10282
1 Lincoln Street
Boston, Massachusetts 02111
INDEPENDENT REGISTERED
PUBLIC ACCOUNTING FIRM
TRANSFER AGENT
KPMG LLP
Boston Financial Data Services, Inc.
Two Financial Center
330 W. 9th
60 South St.
4th Floor
Boston, MA 02111
Kansas City, Missouri 64105
LEGAL COUNSEL
Drinker Biddle & Reath LLP
One Logan Square
Ste. 2000
Philadelphia, Pennsylvania 19103-6996
This Semi-Annual Report contains facts concerning The Commerce Funds’ objectives and policies,_management, expenses, and other information. For more complete information about The Commerce Funds, a prospectus may be obtained by calling 1-800-995-6365. An investor should read the prospectus carefully before investing or sending money.
The Commerce Funds are advised by Commerce Investment Advisors, Inc., a subsidiary of Commerce Bank, which receives a fee for its services.The Commerce Funds are distributed by Goldman, Sachs & Co.
The Commerce Funds file their complete schedule of portfolio holdings with the Securities and Exchange Commission (the “SEC”) for the first and third quarters of each fiscal year on Form N-Q.The Funds’ Form N-Q is available on the SEC’s website at http://www.sec.gov. You may also review and obtain copies at the SEC’s Public Reference Room in Washington, D.C. Information about the Public Reference Room may be obtained by calling 1-800-SEC-0330.
A description of the policies and procedures that The Commerce Funds use to determine how to vote proxies relating to portfolio securities and information regarding how the Funds voted proxies relating to portfolio securities during the most recent 12-month period ended June 30 is available (i) without change, upon request by calling 1-800-995-6365 and (ii) on the SEC’s website at http://www.sec.gov.
This material is not authorized for distribution to prospective investors unless preceded or accompanied by a current Prospectus. Investors should consider a Fund’s objective, risks, and charges and expenses, and read the Prospectus carefully before investing or sending money. The Prospectus contains this and other information about a Fund and may be obtained from your authorized dealer or from Commerce Funds by calling 1-800-995-6365.
NOT FDIC INSURED
MAY LOSE VALUE
NO BANK GUARANTEE

TRUSTEES
Martin E. Galt III, Chairman
David L. Bodde, Lead Independent Trustee
Charles W. Peffer
James M. Snowden, Jr.
OFFICERS
William Schuetter, President
Angela Dew, Vice President, Chief Compliance Of?cer, and Secretary Jeffrey Bolin, Vice President Peter W. Fortner, Chief Accounting Of?cer
Scott McHugh, Treasurer
Philip V. Giuca Jr., Assistant Treasurer
Andrew Murphy, Assistant Secretary
922 Walnut
Fourth Floor
Kansas City, Missouri 64106 www.commercefunds.com 1-800-995-6365
164336.MF.MED.TMPL/6/2015
Not applicable for the reporting period.
| ITEM 3. | | AUDIT COMMITTEE FINANCIAL EXPERT. |
Not applicable for the reporting period.
| ITEM 4. | | PRINCIPAL ACCOUNTANT FEES AND SERVICES. |
Not applicable for the reporting period.
| ITEM 5. | | AUDIT COMMITTEE OF LISTED REGISTRANTS. |
Not applicable.
| ITEM 6. | | SCHEDULE OF INVESTMENTS. |
(a) The Schedule of Investments is included as part of the Report to Shareholders filed under Item 1.
(b) Not applicable.
| ITEM 7. | | DISCLOSURE OF PROXY VOTING POLICIES AND PROCEDURES FOR CLOSED-END MANAGEMENT |
Not applicable.
| ITEM 8. | | PORTFOLIO MANAGERS OF CLOSED-END MANAGEMENT INVESTMENT COMPANIES. |
Not applicable.
| ITEM 9. | | PURCHASES OF EQUITY SECURITIES BY CLOSED-END MANAGEMENT INVESTMENT COMPANY AND |
Not applicable.
| ITEM 10. | | SUBMISSION OF MATTERS TO A VOTE OF SECURITY HOLDERS. |
There has been no material change to the procedures by which shareholders may recommend nominees to the Registrant’s Board of Trustees.
| ITEM 11. | | CONTROLS AND PROCEDURES. |
| | (a) | | The Registrant’s principal executive and principal financial officers or persons performing similar functions have concluded that the Registrant’s disclosure controls and procedures (as defined in Rule 30a-3(c) under the Investment Company Act of 1940, as amended (the “1940 Act”)) are effective as of a date within 90 days of the filing of this report, based on the evaluation of these controls and procedures required by Rule 30a-3(b) under the 1940 Act and Rule 15d-15(b) under the Securities Exchange Act of 1934, as amended. |
| | (b) | | There were no changes in the Registrant’s internal control over financial reporting (as defined in Rule 30a-3(d) under the 1940 Act) that occurred during the second fiscal quarter of the period covered by this report that has materially affected, or is reasonably likely to materially affect, the Registrant’s internal control over financial reporting. |
| | | | |
| |
| (a)(1) | | Not applicable for the reporting period. |
| | |
| (a)(2) | | Exhibit 99.CERT | | Certifications pursuant to Section 302 of the Sarbanes-Oxley Act of 2002 are filed herewith. |
| |
| (a)(3) | | Not applicable. |
| | |
| (b) | | Exhibit 99.906CERT | | Certifications pursuant to Section 906 of the Sarbanes-Oxley Act of 2002 are filed herewith. |
SIGNATURES
Pursuant to the requirements of the Securities Exchange Act of 1934 and the Investment Company Act of 1940, the Registrant has duly caused this report to be signed on its behalf by the undersigned, thereunto duly authorized.
|
| THE COMMERCE FUNDS |
|
| /s/ Bill Schuetter |
| Bill Schuetter |
| President |
| July 8, 2015 |
Pursuant to the requirements of the Securities Exchange Act of 1934 and the Investment Company Act of 1940, this report has been signed below by the following persons on behalf of the Registrant and in the capacities and on the dates indicated.
|
|
| /s/ Bill Schuetter |
| Bill Schuetter |
| President |
| The Commerce Funds |
| July 8, 2015 |
|
|
| /s/ Peter Fortner |
| Peter Fortner |
| Chief Accounting Officer |
| The Commerce Funds |
| July 8, 2015 |