Exhibit 99.2 Adtran Holdings November 06, 2023 Investor presentation

Cautionary note regarding forward-looking statements Statements contained in this presentation which are not historical facts, such as those relating to expectations regarding earnings, expenses and margin; the ability of ADTRAN Holdings, Inc. (“ADTRAN Holdings”) to reduce expenses in the coming year and the amount thereof through its implementation of the business efficiency program; and ADTRAN Holdings’ strategy, outlook and financial guidance, are forward-looking statements within the meaning of the Private Securities Litigation Reform Act of 1995. Forward-looking statements can also generally be identified by the use of words such as “believe,” “expect,” “intend,” “estimate,” “anticipate,” “will,” “may,” “could” and similar expressions. In addition, ADTRAN Holdings, through its senior management, may from time to time make forward-looking public statements concerning the matters described herein. All such projections and other forward-looking information speak only as of the date hereof, and ADTRAN Holdings undertakes no duty to publicly update or revise such forward-looking information, whether as a result of new information, future events, or otherwise, except to the extent as may be required by law. All such forward-looking statements are necessarily estimates and reflect management’s best judgment based upon current information. Actual events or results may differ materially from those anticipated in these forward-looking statements as a result of a variety of factors. While it is impossible to identify all such factors, factors which have caused and may in the future cause actual events or results to differ materially from those estimated by ADTRAN Holdings include, but are not limited to: (i) risks and uncertainties related to manufacturing and supply chain constraints; (ii) risks and uncertainties related to the completed business combination between the Company, ADTRAN, Inc. (“ADTRAN”) and Adtran Networks SE (“Adtran Networks”), including risks related to the ability to successfully integrate ADTRAN’s and Adtran Networks’ businesses, the disruption of management time from ongoing business operations due to integration efforts following the business combination, and the risk that ADTRAN Holdings may be unable to achieve expected synergies or that it may take longer or be more costly than expected to achieve those synergies; (iii) risks and uncertainties relating to the recent restatement of our previously issued consolidated financial statements and ongoing material weakness in our internal control over financial reporting; (iv) risks and uncertainties relating to ADTRAN Holdings’ ability to reduce expenditures and the impact of such reductions on its financial results and financial condition; (v) the risk of fluctuations in revenue due to lengthy sales and approval processes required by major and other service providers for new products, as well as ongoing tighter inventory management of ADTRAN Holdings’ customers; (vi) the risk posed by potential breaches of information systems and cyber-attacks; (vii) the risk that ADTRAN Holdings may not be able to effectively compete, including through product improvements and development; and (viii) other risks set forth in ADTRAN Holdings’ public filings made with the Securities and Exchange Commission, including its Annual Report on Form 10-K for the year ended December 31, 2022, as amended, as well as its Form 10-Q for the quarter ended June 30, 2023 2 2023 © ADTRAN, INC.

Introduction and business model 3
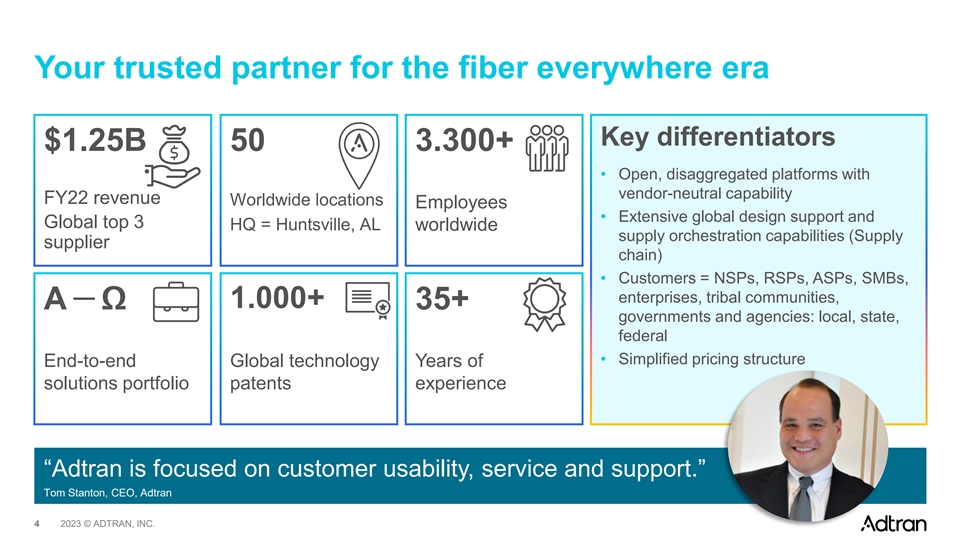
Your trusted partner for the fiber everywhere era Key differentiators $1.25B 50 3.300+ • Open, disaggregated platforms with vendor-neutral capability FY22 revenue Worldwide locations Employees • Extensive global design support and Global top 3 HQ = Huntsville, AL worldwide supply orchestration capabilities (Supply supplier chain) • Customers = NSPs, RSPs, ASPs, SMBs, enterprises, tribal communities, — 1.000+ Α Ω 35+ governments and agencies: local, state, federal • Simplified pricing structure End-to-end Global technology Years of solutions portfolio patents experience “Adtran is focused on customer usability, service and support.” Tom Stanton, CEO, Adtran 4 2023 © ADTRAN, INC.

OUR VISION is to enable a fully-connected world, where the power and freedom to communicate is available to everyone, everywhere, in a secure, efficient and sustainable environment. 5 2023 © ADTRAN, INC.
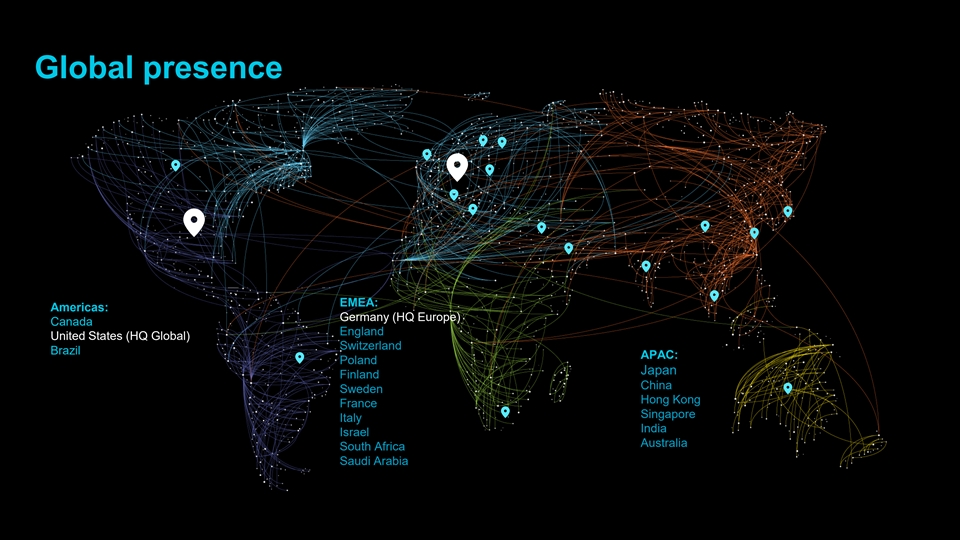
Global presence EMEA: Americas: Germany (HQ Europe) Canada England United States (HQ Global) Switzerland Brazil APAC: Poland Japan Finland China Sweden Hong Kong France Singapore Italy India Israel Australia South Africa Saudi Arabia 6 2023 © ADTRAN, INC.
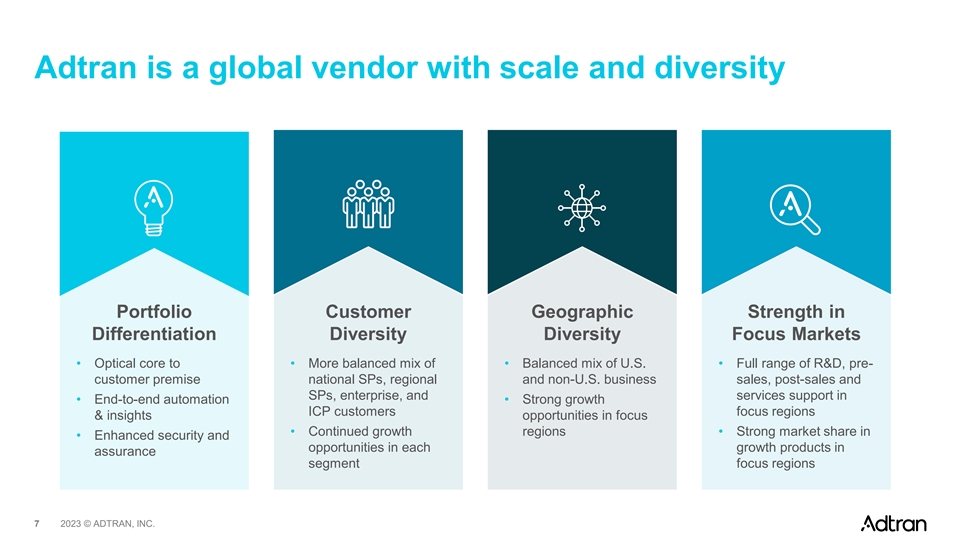
Adtran is a global vendor with scale and diversity Portfolio Customer Geographic Strength in Differentiation Diversity Diversity Focus Markets • Optical core to • More balanced mix of • Balanced mix of U.S. • Full range of R&D, pre- customer premise national SPs, regional and non-U.S. business sales, post-sales and SPs, enterprise, and services support in • End-to-end automation • Strong growth ICP customers focus regions & insights opportunities in focus • Continued growth regions • Strong market share in • Enhanced security and opportunities in each growth products in assurance segment focus regions 7 2023 © ADTRAN, INC.

Management board Tom Stanton Christoph Glingener Uli Dopfer Jay Wilson Chairman & CEO CTO CFO CRO • Joined Adtran in 1995 as VP of • Joined ADVA Optical • Joined ADVA Optical • Joined Adtran in 1998 and has Marketing for the Carrier Networking in April 2006, Networking in March 2004, held many roles from Senior Networks Division and named appointed CTO in 2007 and appointed CFO in January 2015 Vice President of Technology Adtran’s CEO in September named CTO of Adtran in and named CFO of Adtran in and Strategy to GM of Adtran’s 2005 and Chairman of the September 2022 May 2023 Carrier Networks Division, VP Board in 2007 of Product Marketing, • Holds Ph.D in Electric • Holds a Diploma in business • Holds a Bachelor of Science in Engineering from the University economics from Wirtschafts- • Holds a Bachelor of Computer Engineering from of Dortmund akademie Munich, Germany Engineering in Electrical Auburn University Engineering from Vanderbilt University 8 2023 © ADTRAN, INC.
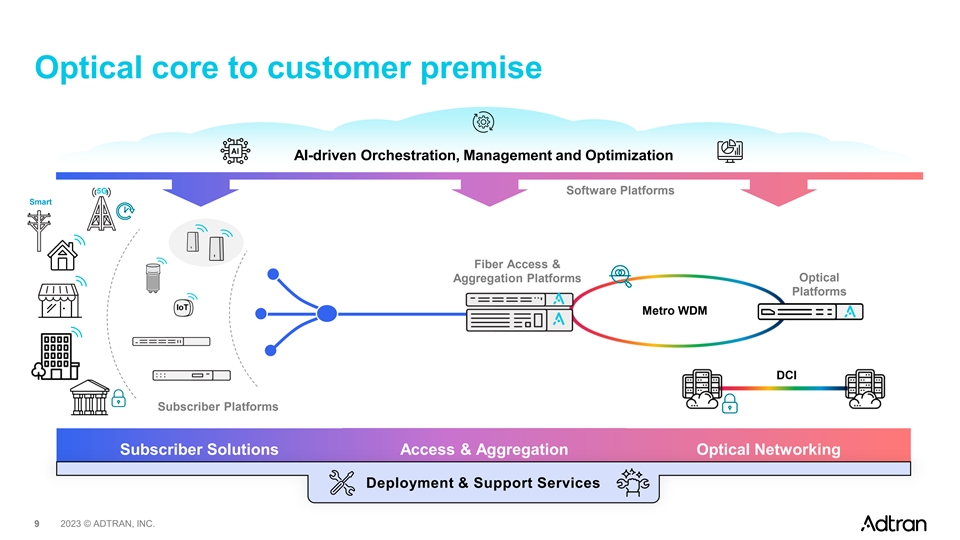
Optical core to customer premise AI-driven Orchestration, Management and Optimization 5G Software Platforms Smart Fiber Access & Optical Aggregation Platforms Platforms I o T Metro WDM DCI Subscriber Platforms Subscriber Solutions Access & Aggregation Optical Networking ONT 10G PON Deployment & Support Services 9 9 2023 © ADTRAN, INC.

Our portfolio Software Professional Subscriber and enterprise solutions platforms services Open multi-gig PON systems, Carrier Ethernet access, Wi-Fi, IoT, routers, switches and more Open, cloud- Scalable in- Access and aggregation solutions centric region services, Fiber access platforms, 1/10/25/100G Ethernet management and including aggregation, network timing and synchronization orchestration planning, deployment, and Optical Networking Solutions maintenance Optical access and transport, data center interconnect, advanced pluggable optics, assurance and monitoring, encryption and security 10 2023 © ADTRAN, INC.
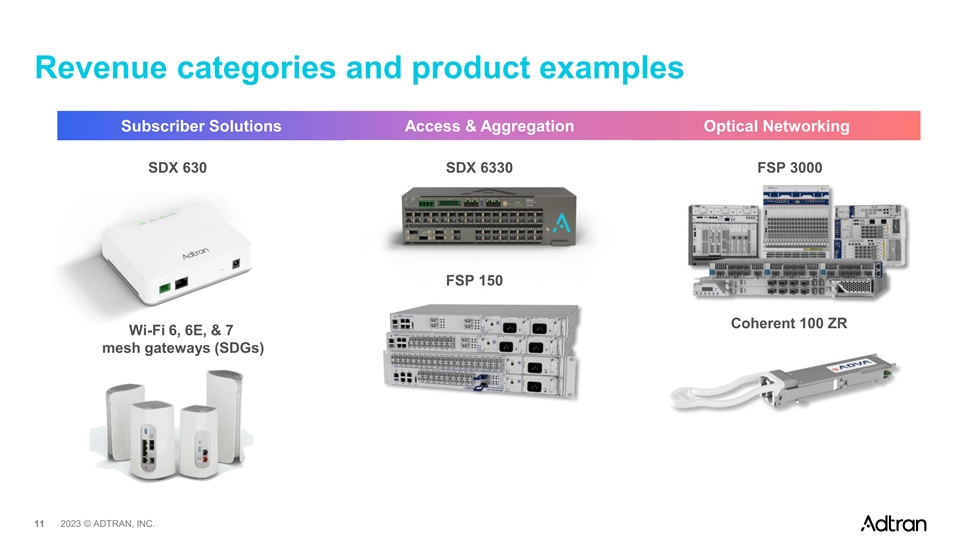
Revenue categories and product examples Subscriber Solutions Access & Aggregation Optical Networking SDX 630 SDX 6330 FSP 3000 FSP 150 Coherent 100 ZR Wi-Fi 6, 6E, & 7 mesh gateways (SDGs) 11 2023 © ADTRAN, INC.

A unique scaled pure play addressing the converged edge Network focus Converged edge RAN, core / metro Core / Metro Core / Metro Fixed line Metro / Access Tier 1, 2, 3 CSPs Tier 1 CSPs Tier 1 CSPs Customer focus Tier 1, 2 CSPs Tier 2, 3 CSPs Tier 2, 3 CSPs enterprises ICPs ICPs Customer X X X ✓✓✓ premises (Residential/SMB) Customer X X X premises ✓✓✓ (Ent./ Wholesale) Fiber access X X ✓✓✓✓ (Residential/SMB) Fiber backhaul X ✓✓✓✓✓ (Metro) 12 2023 © ADTRAN, INC. Converged Edge
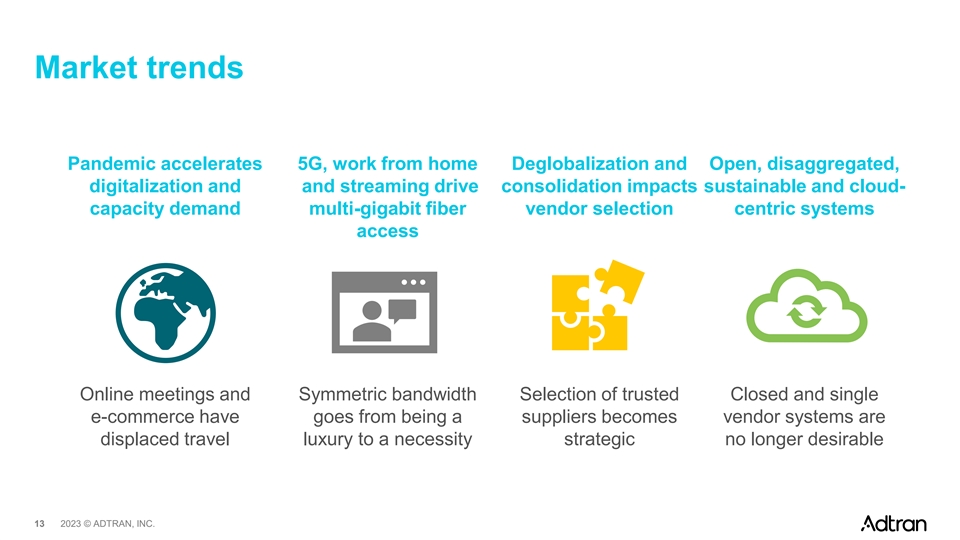
Market trends Pandemic accelerates 5G, work from home Deglobalization and Open, disaggregated, digitalization and and streaming drive consolidation impacts sustainable and cloud- capacity demand multi-gigabit fiber vendor selection centric systems access Online meetings and Symmetric bandwidth Selection of trusted Closed and single e-commerce have goes from being a suppliers becomes vendor systems are displaced travel luxury to a necessity strategic no longer desirable 13 2023 © ADTRAN, INC.

Fiber networking market forecasts PON OLT-ONT Metro WDM Carrier Ethernet $7,000 $6,000 $700 $6,000 $600 $5,000 $5,000 $500 $4,000 CAGR 2022-2027:4% $4,000 $400 CAGR 2022-2027:4% $3,000 CAGR 2022-2027: 6% $3,000 $300 $2,000 $2,000 $200 $1,000 $1,000 $100 $0 $0 $0 2020 2021 2022 2023 2024 2025 2026 2027 2020 2021 2022 2023 2024 2025 2026 2027 2020 2021 2022 2023 2024 2025 2026 2027 EMEA + NAM EMEA + NAM EMEA + NAM Sources: PON OLT+ONT: Dell’Oro 5yr Broadband Access and Home Networking Report (3Q 2023) Metro WDM: Omdia Optical Network Forecast (3Q 2023) Carrier Ethernet: Service Provider Switching and Routing Forecast (2Q 2023) 14 2023 © ADTRAN, INC. Millions Millions Millions
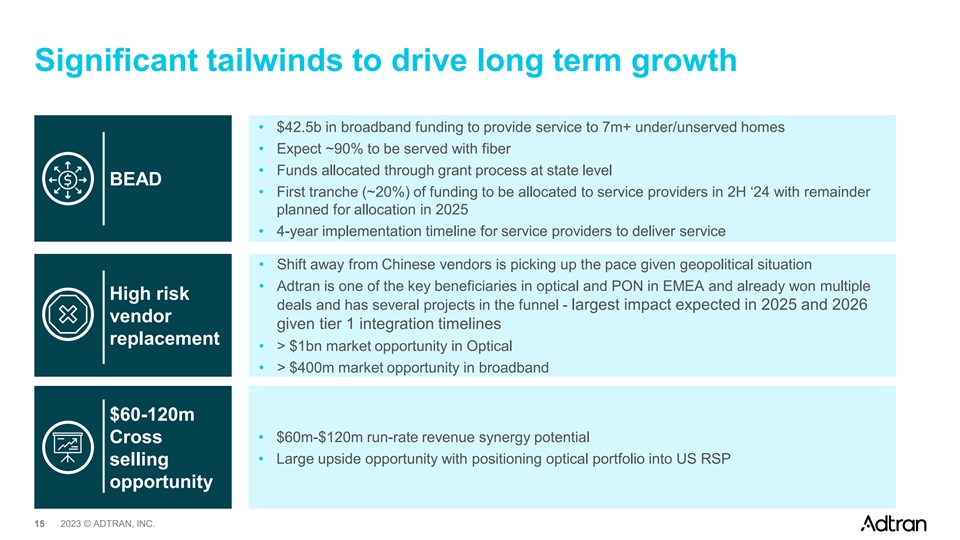
Significant tailwinds to drive long term growth • $42.5b in broadband funding to provide service to 7m+ under/unserved homes • Expect ~90% to be served with fiber • Funds allocated through grant process at state level BEAD • First tranche (~20%) of funding to be allocated to service providers in 2H ‘24 with remainder planned for allocation in 2025 • 4-year implementation timeline for service providers to deliver service • Shift away from Chinese vendors is picking up the pace given geopolitical situation • Adtran is one of the key beneficiaries in optical and PON in EMEA and already won multiple High risk deals and has several projects in the funnel - largest impact expected in 2025 and 2026 vendor given tier 1 integration timelines replacement • > $1bn market opportunity in Optical • > $400m market opportunity in broadband $60-120m • $60m-$120m run-rate revenue synergy potential Cross • Large upside opportunity with positioning optical portfolio into US RSP selling opportunity 15 2023 © ADTRAN, INC.

Corporate Social Responsibility Environmental Social Governance • Sustainability is integral part of product strategy • Event sponsoring, volunteer hours at non- • Comprehensive ethics and compliance through process-based product ecodesign and profit organizations and donations policy, code of conduct and processes lifecycle assessment (LCA) • Dedicated human capital management • Dedicated human rights policy and supplier • Involvement of supply chain based on Integrity of conduct • Employee-driven diversity, equity & inclusion Next supplier onboarding (DE&I) task force to support a diverse and • Dedicated engagement in security - ISO • ISO certificated (ISO 14001 EMS, ISO 50001 inclusive workforce 27001-certified EnMS) • Strictly following ILO requirements Ratings ISS Rating Ecovadis CDP Adtran, Inc. Adtran Networks Governance Environment Social Adtran ADVA Climate Change 6 4 3 2022 C A- Supplier Engagement C- 2022 C A- 16 2023 © ADTRAN, INC.
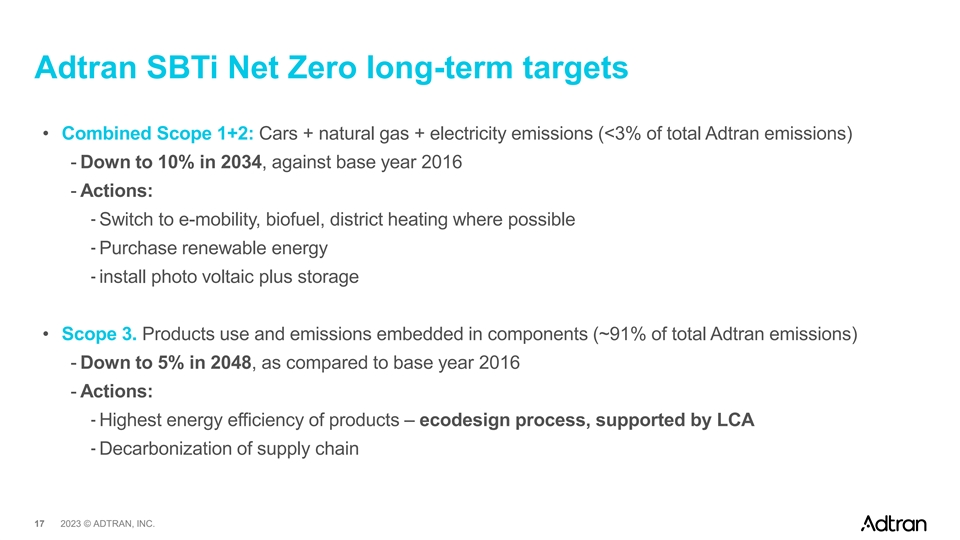
Adtran SBTi Net Zero long-term targets • Combined Scope 1+2: Cars + natural gas + electricity emissions (<3% of total Adtran emissions) - Down to 10% in 2034, against base year 2016 - Actions: -Switch to e-mobility, biofuel, district heating where possible -Purchase renewable energy -install photo voltaic plus storage • Scope 3. Products use and emissions embedded in components (~91% of total Adtran emissions) - Down to 5% in 2048, as compared to base year 2016 - Actions: -Highest energy efficiency of products – ecodesign process, supported by LCA -Decarbonization of supply chain 17 2023 © ADTRAN, INC.

Why Adtran? Differentiation and Unprecedented Substantial Strong commitment diversification market opportunity transformation of to ESG operating model Differentiated portfolio Unique positioned in Implementation of a Strong commitment to from optical core to historic demand for fiber comprehensive business corporate social customer premise with a supported by public efficiency program responsibility, as well as balanced mix of stimulus to deploy fiber- targeting a leaner, environmental, social and large and regional based broadband efficient and profitable governance Service provider, networks paired with company with expected enterprise, and High risk vendor margins in the low teens ICP customers replacement opportunities in 2025 18 2023 © ADTRAN, INC.

Business Update 19
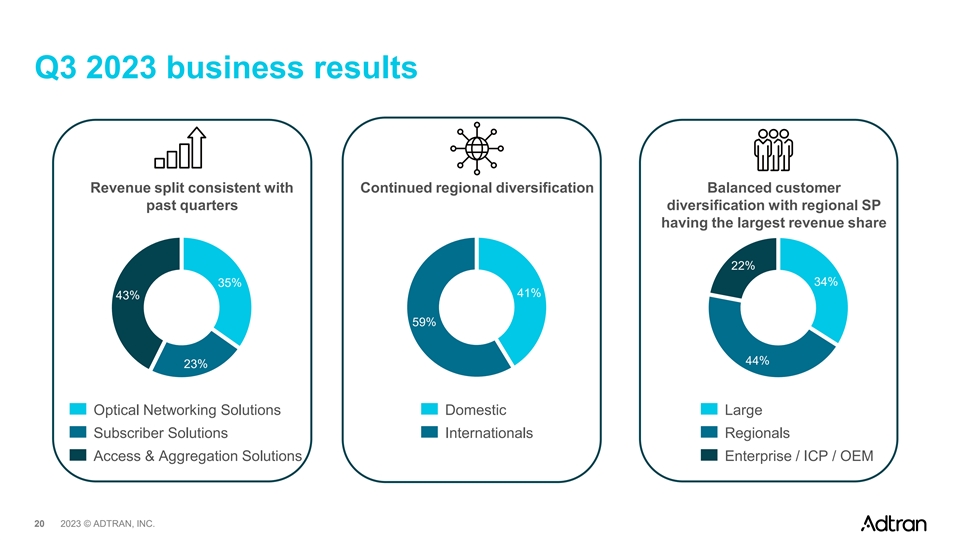
Q3 2023 business results Revenue split consistent with Continued regional diversification Balanced customer past quarters diversification with regional SP having the largest revenue share 22% 35% 34% 41% 43% 59% 44% 23% Optical Networking Solutions Domestic Large Subscriber Solutions Internationals Regionals Access & Aggregation Solutions Enterprise / ICP / OEM 20 2023 © ADTRAN, INC.

Q3 2023 technology update AI-driven Orchestration, Management and Optimization (Software Platforms) Smart 5G Fiber Access & Aggregation Optical Platforms Platforms IoT Metro WDM DCI Subscriber Platforms Subscriber Solutions Optical Networking Access & Aggregation Deployment & Support Services • Multiple large EMEA service provider • Launched SDG 8600 and 8700 Wi-Fi • Highest market share growth in opportunities 6, 6E and 7 mesh routers for European WDM market at the optimized in-home connectivity expense of market share loss from • #2 in market share for fiber access high-risk vendors* platforms (OLT)* in NAM and EMEA • Launched Intellifi®, a cloud-managed Wi-Fi solution designed for CSPs to • Secured two key tier 1 high-risk • Strong US FTTH market presence effectively monitor, manage and vendor replacement metro WDM with 13 new FTTH operators added in monetize residential Wi-Fi networks projects Q3 *) Source: Dell´Oro 21 2023 © ADTRAN, INC.

Priority Adtran´s strategic priorities 2024 / 2025 Strategic Priorities Details • Cost efficiency program 1 Business efficiency program • Capital efficiency program • De-leverage balance sheet 2 • Reduce interest expense Strengthen capital structure • Improve free cash flow • Convert customer wins to revenue • Governmental Funding opportunities Leverage enhanced operating model 3 • High-risk vendor displacement • Increase software related revenue contribution • Use free cash flow as primary source 4 De-list Adtran Networks • Ensure at least cross-over investment grade metrics 22 2023 © ADTRAN, INC.
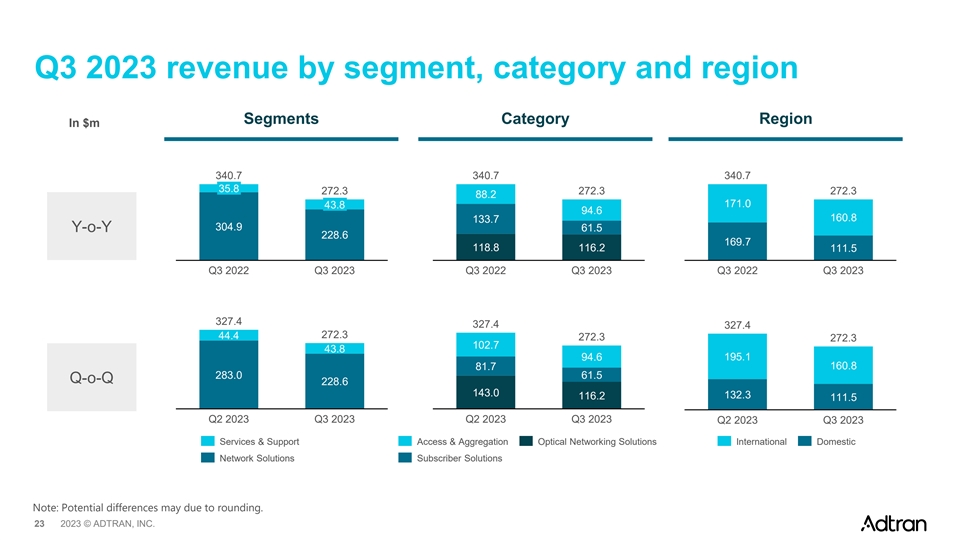
Q3 2023 revenue by segment, category and region Segments Category Region In $m 340.7 340.7 340.7 35.8 272.3 272.3 272.3 88.2 43.8 171.0 94.6 160.8 133.7 304.9 Y-o-Y 61.5 228.6 169.7 118.8 116.2 111.5 Q3 2022 Q3 2023 Q3 2022 Q3 2023 Q3 2022 Q3 2023 327.4 327.4 327.4 272.3 44.4 272.3 272.3 102.7 43.8 94.6 195.1 160.8 81.7 283.0 61.5 Q-o-Q 228.6 143.0 132.3 116.2 111.5 Q2 2023 Q3 2023 Q2 2023 Q3 2023 Q2 2023 Q3 2023 Services & Support Access & Aggregation Optical Networking Solutions International Domestic Network Solutions Subscriber Solutions Note: Potential differences may due to rounding. 23 2023 © ADTRAN, INC.
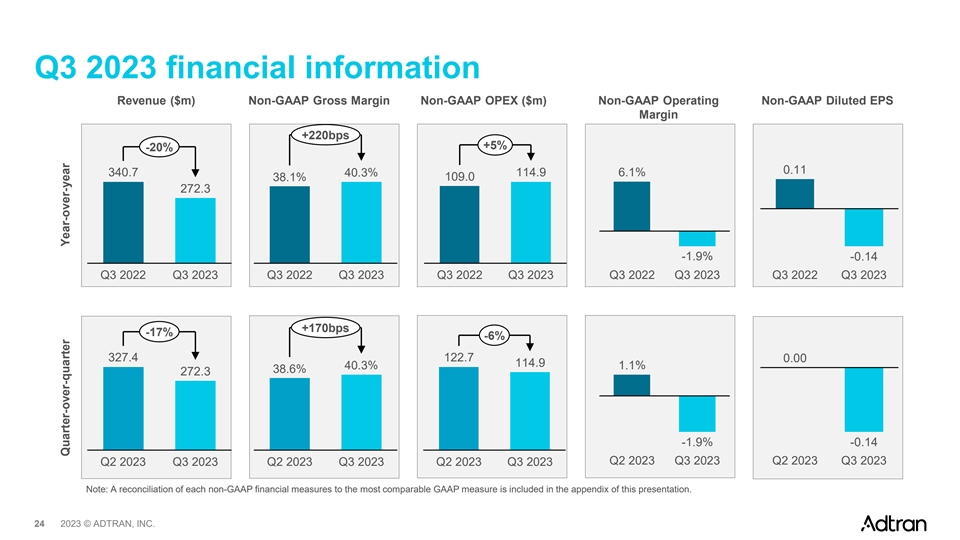
Q3 2023 financial information Revenue ($m) Non-GAAP Gross Margin Non-GAAP OPEX ($m) Non-GAAP Operating Non-GAAP Diluted EPS Margin +220bps +5% -20% 0.11 6.1% 340.7 40.3% 114.9 38.1% 109.0 272.3 -1.9% -0.14 Q3 2022 Q3 2023 Q3 2022 Q3 2023 Q3 2022 Q3 2023 Q3 2022 Q3 2023 Q3 2022 Q3 2023 +170bps -17% -6% 327.4 122.7 0.00 114.9 40.3% 1.1% 38.6% 272.3 -1.9% -0.14 Q2 2023 Q3 2023 Q2 2023 Q3 2023 Q2 2023 Q3 2023 Q2 2023 Q3 2023 Q2 2023 Q3 2023 Note: A reconciliation of each non-GAAP financial measures to the most comparable GAAP measure is included in the appendix of this presentation. 24 2023 © ADTRAN, INC. Quarter-over-quarter Year-over-year
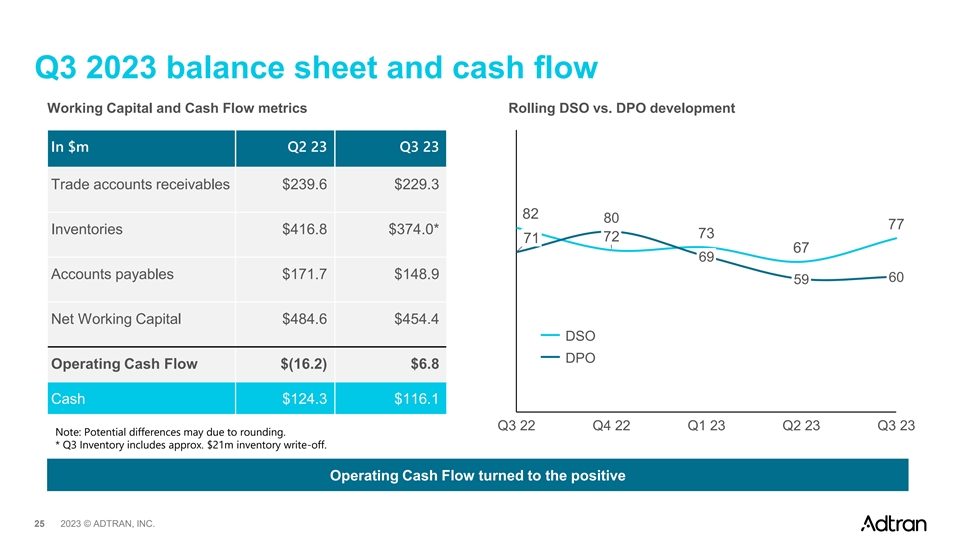
Q3 2023 balance sheet and cash flow Working Capital and Cash Flow metrics Rolling DSO vs. DPO development In $m Q2 23 Q3 23 Trade accounts receivables $239.6 $229.3 82 80 77 Inventories $416.8 $374.0* 73 72 71 67 69 Accounts payables $171.7 $148.9 60 59 Net Working Capital $484.6 $454.4 DSO DPO Operating Cash Flow $(16.2) $6.8 Cash $124.3 $116.1 Q3 22 Q4 22 Q1 23 Q2 23 Q3 23 Note: Potential differences may due to rounding. * Q3 Inventory includes approx. $21m inventory write-off. Operating Cash Flow turned to the positive 25 2023 © ADTRAN, INC.

Business Efficiency Program 2024 • 15% sequential reduction in non-GAAP operating expenses projected for Q4 2023 • Targeting positive non-GAAP operating Cost Efficiency Program margin for Q2 2024 • Expect $90m reduction of non-GAAP operating expenditures in 2024 as compared to 2023 • Suspend dividend Capital Efficiency Program • Up to $150m proceeds from site consolidation Decisive steps to lower cost, improve cash flow and de-lever balance sheet 26 2023 © ADTRAN, INC.

Guidance for Q4 2023 Revenue Non-GAAP Operating Margin $210m – $240m -7% – 0% 27 27 27 2023 © ADTRAN, INC.
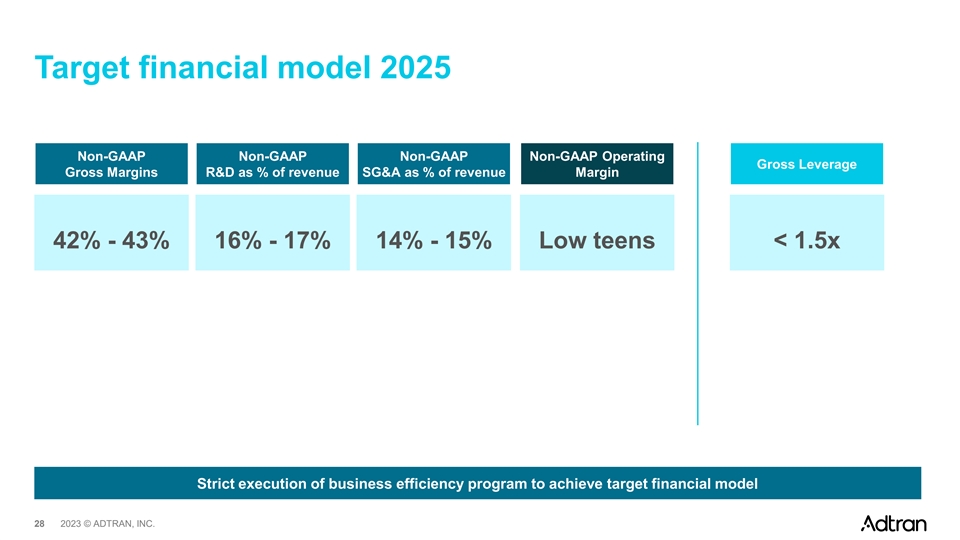
Target financial model 2025 Non-GAAP Non-GAAP Non-GAAP Non-GAAP Operating Gross Leverage Gross Margins R&D as % of revenue SG&A as % of revenue Margin 42% - 43% 16% - 17% 14% - 15% Low teens < 1.5x Strict execution of business efficiency program to achieve target financial model 28 28 28 2023 © ADTRAN, INC.

Appendix 29
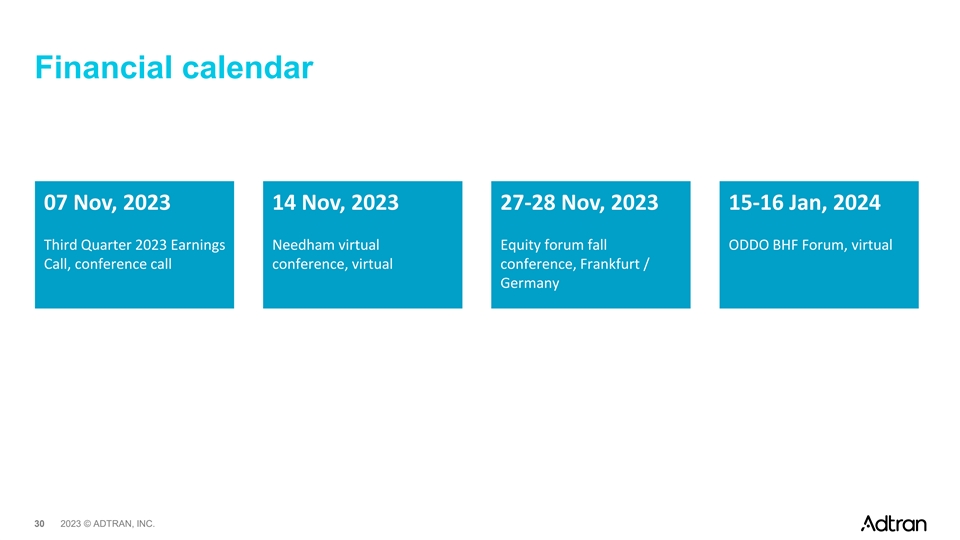
Financial calendar 07 Nov, 2023 14 Nov, 2023 27-28 Nov, 2023 15-16 Jan, 2024 Third Quarter 2023 Earnings Needham virtual Equity forum fall ODDO BHF Forum, virtual Call, conference call conference, virtual conference, Frankfurt / Germany 30 2023 © ADTRAN, INC.
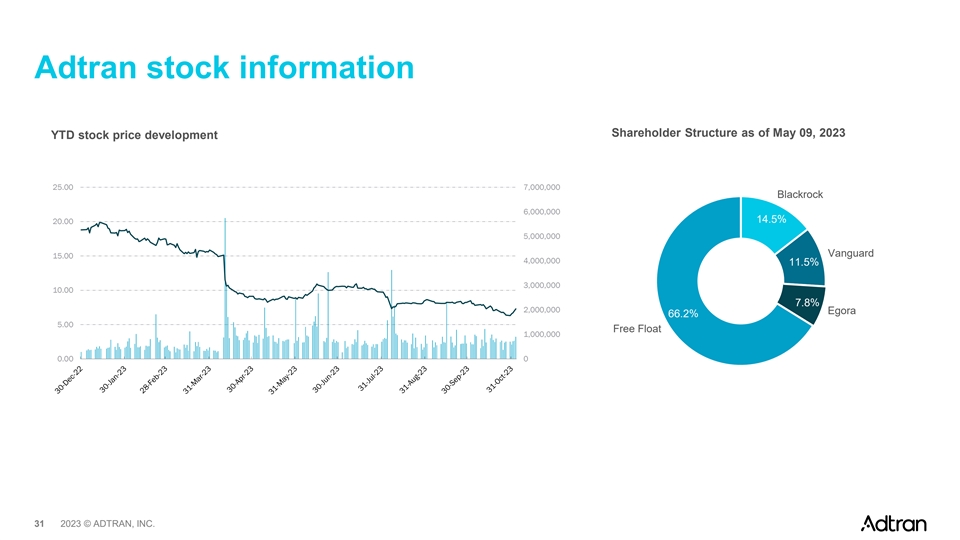
Adtran stock information Shareholder Structure as of May 09, 2023 YTD stock price development 25.00 7,000,000 Blackrock 6,000,000 14.5% 20.00 5,000,000 Vanguard 15.00 4,000,000 11.5% 3,000,000 10.00 7.8% 2,000,000 Egora 66.2% 5.00 Free Float 1,000,000 0.00 0 31 2023 © ADTRAN, INC.
Explanation of Use of Non-GAAP Financial Measures Set forth in the following tables are reconciliations of gross profit, gross margin, operating expenses, operating loss, other (expense) income, net (loss) income inclusive of the non-controlling interest, net (loss) income attributable to the Company, net loss attributable to the non-controlling interest, and loss per share - basic and diluted, attributable to the Company, in each case as reported based on generally accepted accounting principles in the United States (“GAAP”), to non-GAAP gross profit, non-GAAP gross margin, non-GAAP operating expenses, non-GAAP operating (loss) income, non-GAAP other (expense) income, non-GAAP net (loss) income inclusive of the non-controlling interest, non-GAAP net (loss) income attributable to the Company, non-GAAP net (loss) income attributable to the non-controlling interest, and non-GAAP (loss) earnings per share - basic and diluted, attributable to the Company, respectively. Such non-GAAP measures exclude acquisition related expenses, amortization and adjustments (consisting of intangible amortization of backlog, developed technology, customer relationships, and trade names acquired in connection with business combinations and amortization of inventory fair value adjustments), stock-based compensation expense, amortization of pension actuarial losses, deferred compensation adjustments, integration expenses, restructuring expenses, asset and goodwill impairments, changes in valuation allowance related to our deferred tax assets, and the tax effect of these adjustments to net income. These measures are used by management in our ongoing planning and annual budgeting processes. Additionally, we believe the presentation of these non-GAAP measures when combined with the presentation of the most directly comparable GAAP financial measure, is beneficial to the overall understanding of ongoing operating performance of the Company. The information contained in this presentation is solely based on unaudited condensed consolidated results. These non-GAAP financial measures are not prepared in accordance with, or an alternative for, GAAP and therefore should not be considered in isolation or as a substitution for analysis of our results as reported under GAAP. Additionally, our calculation of non-GAAP measures may not be comparable to similar measures calculated by other companies. Furthermore, non-GAAP operating margin (which is calculated as non-GAAP operating (loss) income divided by revenue), non-GAAP operating expense, non-GAAP gross margin, non-GAAP R&D (which is calculated as GAAP R&D operating expenses less acquisition related expenses, amortization and adjustments (consisting of intangible amortization of developed technology and trade names acquired in connection with business combinations), stock-based compensation expense, integration expenses, and restructuring expenses), and non-GAAP SG&A (which is calculated as GAAP SG&A operating expenses less acquisition related amortization of customer relationships acquired in connection with business combinations, stock-based compensation expense, non-cash deferred compensation adjustments, integration expenses, and restructuring expenses) are non-GAAP financial measures. The Company has provided forward-looking guidance with respect to such non-GAAP measures. These measures exclude from the corresponding GAAP financial measures the effect of adjustments as described above. The Company has not provided a reconciliation of such non-GAAP guidance to guidance presented on a GAAP basis because it cannot predict and quantify without unreasonable effort all of the adjustments that may occur during the period due to the difficulty of predicting the timing and amounts of various items within a reasonable range. In particular, these non-GAAP financial measures exclude certain items, including continued restructuring and integration expenses that will continue to evolve as our business efficiency program is implemented and, therefore, the Company is unable to quantitatively predict. Depending on the materiality of these items, they could have a significant impact on the Company's GAAP financial results. 32 2023 © ADTRAN, INC.
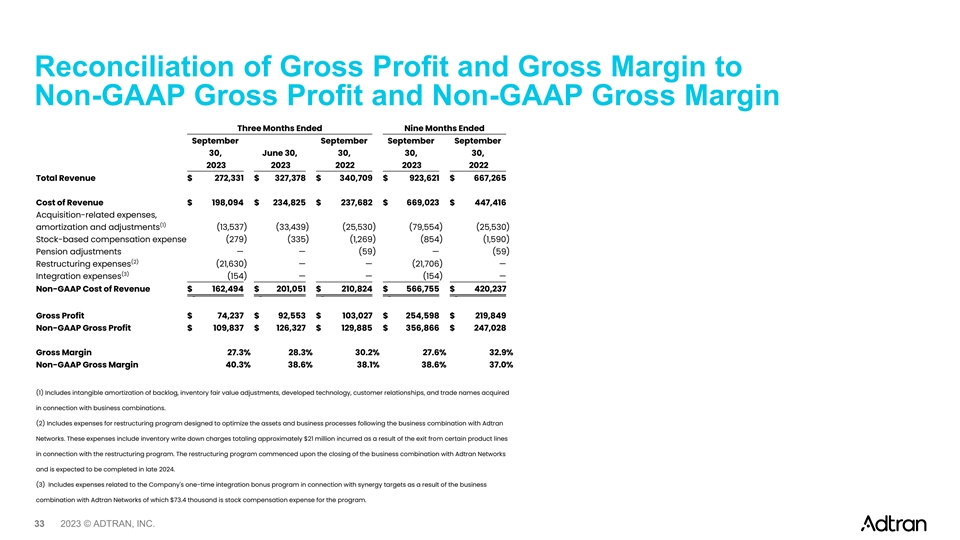
Reconciliation of Gross Profit and Gross Margin to Non-GAAP Gross Profit and Non-GAAP Gross Margin Three Months Ended Nine Months Ended September September September September 30, June 30, 30, 30, 30, 2023 2023 2022 2023 2022 Total Revenue $ 272,331 $ 327,378 $ 340,709 $ 923,621 $ 667,265 Cost of Revenue $ 198,094 $ 234,825 $ 237,682 $ 669,023 $ 447,416 Acquisition-related expenses, (1) amortization and adjustments (13,537 ) (33,439) (25,530) (79,554 ) (25,530) Stock-based compensation expense (279 ) (335) (1,269 ) (854 ) (1,590) Pension adjustments — — (59 ) — (59) (2) Restructuring expenses (21,630 ) — — (21,706 ) — (3) Integration expenses (154) — — (154 ) — Non-GAAP Cost of Revenue $ 162,494 $ 201,051 $ 210,824 $ 566,755 $ 420,237 Gross Profit $ 74,237 $ 92,553 $ 103,027 $ 254,598 $ 219,849 Non-GAAP Gross Profit $ 109,837 $ 126,327 $ 129,885 $ 356,866 $ 247,028 Gross Margin 27.3% 28.3% 30.2 % 27.6% 32.9% Non-GAAP Gross Margin 40.3% 38.6% 38.1 % 38.6% 37.0% (1) Includes intangible amortization of backlog, inventory fair value adjustments, developed technology, customer relationships, and trade names acquired in connection with business combinations. (2) Includes expenses for restructuring program designed to optimize the assets and business processes following the business combination with Adtran Networks. These expenses include inventory write down charges totaling approximately $21 million incurred as a result of the exit from certain product lines in connection with the restructuring program. The restructuring program commenced upon the closing of the business combination with Adtran Networks and is expected to be completed in late 2024. (3) Includes expenses related to the Company's one-time integration bonus program in connection with synergy targets as a result of the business combination with Adtran Networks of which $73.4 thousand is stock compensation expense for the program. 33 2023 © ADTRAN, INC.

Reconciliation of Operating Expenses to Non-GAAP Operating Expenses Three Months Ended Nine Months Ended September September September September 30, June 30, 30, 30, 30, 2023 2023 2022 2023 2022 Operating Expenses $ 125,659 $ 137,181 $ 134,076 $ 400,380 $ 242,833 Acquisition-related expenses, (1) (6) (10) (13) amortization and adjustments (4,534) (4,398 ) (14,780) (13,516 ) (19,233 Stock-based compensation (2) (7) (11) (14) expense (3,251 ) (3,974 ) (10,862 ) (10,683 ) (14,322 (3) (8) (15) Restructuring expenses (3,243) (5,868 ) — (11,472 ) (2 (4) (9) (16) Integration expenses (1,485 ) (563 ) — (2,897 ) — (12) Pension adjustments — — (185 ) — (185 Deferred compensation (5) adjustments 1,801 307 740 1,714 7,173 Non-GAAP Operating Expenses $ 114,947 $ 122,685 $ 108,989 $ 363,526 $ 216,264 (1) Includes intangible amortization of developed technology, customer relationships, and trade names acquired in connection with business combinations, of which $4.0 million is included in selling, general and administrative expenses and $0.5 million is included in research and development expenses on the condensed consolidated statements of loss. (2) $2.4 million is included in selling, general and administrative expenses and $0.8 million is included in research and development expenses on the condensed consolidated statements of loss. (3) $3.4 million is included in selling, general and administrative expenses and $(0.2) million is included in research and development expenses on the condensed consolidated statements of loss. (4) $1.4 million is included in selling, general and administrative expenses and $0.1 million is included in research and development expenses on the condensed consolidated statements of loss. Includes fees relating to the expansion of internal controls at Adtran Networks and the implementation of the DPLTA. Additionally, includes expenses related to the Company's one-time integration bonus program in connection with synergy targets as a result of the business combination with Adtran Networks of which $0.5 million is stock compensation expense for the program. (5) Includes non-cash change in fair value of equity investments held in the ADTRAN Holdings, Inc. Deferred Compensation Program for Employees, all of which is included in selling, general and administrative expenses on the condensed consolidated statement of loss. (6) Includes intangible amortization of developed technology, customer relationships, and trade names acquired in connection with business combinations, of which $3.9 million is included in selling, general and administrative expenses and $0.5 million is included in research and development expenses on the condensed consolidated statements of loss. (7) $2.7 million is included in selling, general and administrative expenses and $1.3 million is included in research and development expenses on the condensed consolidated statements of loss. (8) $1.4 million is included in selling, general and administrative expenses and $4.5 million is included in research and development expenses on the condensed consolidated statements of loss. (9) $0.6 million is included in selling, general and administrative expenses on the condensed consolidated statements of loss. Includes fees relating to the expansion of internal controls at Adtran Networks and the implementation of the DPLTA. (10) Includes intangible amortization of developed technology, customer relationships, and trade names acquired in connection with business combinations, of which $14.3 million is included in selling, general and administrative expenses and $0.5 million is included in research and development expenses on the condensed consolidated statements of loss. (11) $9.2 million is included in selling, general and administrative expenses and $1.7 million is included in research and development expenses on the condensed consolidated statements of loss. (12) $0.1 million is included in selling, general and administrative expenses and $0.1 million is included in research and development expenses on the condensed consolidated statements of loss. Includes amortization of actuarial losses related to the Company's pension plan for employees in certain foreign countries. (13) Includes intangible amortization of developed technology, customer relationships, and trade names acquired in connection with business combinations, of which $12.0 million is included in selling, general and administrative expenses and $1.5 million is included in research and development expenses on the condensed consolidated statements of loss. (14) $7.6 million is included in selling, general and administrative expenses and $3.1 million is included in research and development expenses on the condensed consolidated statements of loss. (15) $7.0 million is included in selling, general and administrative expenses and $4.5 million is included in research and development expenses on the condensed consolidated statements of loss. (16) $2.8 million is included in selling, general and administrative expenses and $0.1 million is included in research and development expenses on the condensed consolidated statements of loss. Includes fees relating to the expansion of internal controls at Adtran Networks and the implementation of the DPLTA. Additionally, includes expenses related to the Company's one-time integration bonus program in connection with synergy targets as a result of the business combination with Adtran Networks of which $0.5 million is stock compensation expense for the program. (17) Includes intangible amortization of developed technology, customer relationships, and trade names acquired in connection with business combinations, of which $17.7 million is included in selling, general and administrative expenses and $1.5 million is included in research and development expenses on the condensed consolidated statements of loss. (18) $11.4 million is included in selling, general and administrative expenses and $2.9 million is included in research and development expenses on the condensed consolidated statements of loss. 34 2023 © ADTRAN, INC.

Reconciliation of Operating Loss to Non-GAAP Operating (Loss) Income Three Months Ended Nine Months Ended September September September September 30, June 30, 30, 30, 30, 2023 2023 2022 2023 2022 Operating Loss $ (89,296 ) $ (44,628 ) $ (48,018) $ (183,656) $ (39,953) Acquisition related expenses, (1) amortization and adjustments 18,070 37,837 40,310 93,069 44,763 (2) Asset impairments — — 16,969 — 16,969 Stock-based compensation expense 3,530 4,309 12,131 11,537 15,912 Pension adjustments — — 244 — 244 (3) Restructuring expenses 24,873 5,868 — 33,178 2 (4) Integration expenses 1,639 563 — 3,051 — (5) Deferred compensation adjustments (1,801 ) (307) (740 ) (1,714 ) (7,173) (6) Goodwill impairment 37,874 — — 37,874 — Non-GAAP Operating (Loss) Income $ (5,111 ) $ 3,642 $ 20,896 $ (6,661) $ 30,764 (1) Includes intangible amortization of backlog, inventory fair value adjustments, developed technology, customer relationships, and trade names acquired in connection with business combinations. (2) Includes impairment charges related to the abandonment of certain information technology projects due to the business combination. (3) Includes expenses for restructuring program designed to optimize the assets and business processes following the business combination with Adtran Networks. These expenses include inventory write down charges totaling approximately $21M incurred as a result of the exit from certain product lines in connection with the restructuring program. The restructuring program commenced upon the closing of the business combination with Adtran Networks and is expected to be completed in late 2024. (4) Includes fees relating to the expansion of internal controls at Adtran Networks and the implementation of the DPTLA. Additionally, includes expenses related to the Company's one-time integration bonus program in connection with synergy targets as a results of the business combination with Adtran Networks. (5) Includes non-cash change in fair value of equity investments held in the ADTRAN Holdings, Inc. Deferred Compensation Program for Employees, all of which is included in selling, general and administrative expenses on the condensed consolidated statement of loss. (6) Includes non-cash goodwill impairment charge related to our Services and Support reporting unit. The impairment primarily resulted from a decrease in projected revenue growth rates and EBITDA margins. 35 2023 © ADTRAN, INC.
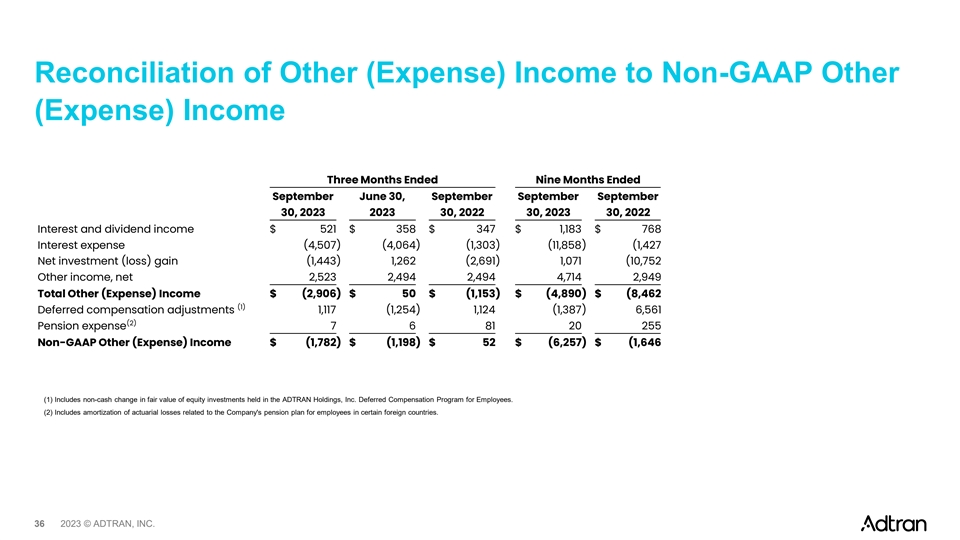
Reconciliation of Other (Expense) Income to Non-GAAP Other (Expense) Income Three Months Ended Nine Months Ended September June 30, September September September 30, 2023 2023 30, 2022 30, 2023 30, 2022 Interest and dividend income $ 521 $ 358 $ 347 $ 1,183 $ 768 Interest expense (4,507 ) (4,064 ) (1,303 ) (11,858 ) (1,427 Net investment (loss) gain (1,443 ) 1,262 (2,691 ) 1,071 (10,752 Other income, net 2,523 2,494 2,494 4,714 2,949 Total Other (Expense) Income $ (2,906) $ 50 $ (1,153 ) $ (4,890 ) $ (8,462 (1) Deferred compensation adjustments 1,117 (1,254 ) 1,124 (1,387 ) 6,561 (2) Pension expense 7 6 81 20 255 Non-GAAP Other (Expense) Income $ (1,782) $ (1,198 ) $ 52 $ (6,257 ) $ (1,646 (1) Includes non-cash change in fair value of equity investments held in the ADTRAN Holdings, Inc. Deferred Compensation Program for Employees. (2) Includes amortization of actuarial losses related to the Company's pension plan for employees in certain foreign countries. 36 2023 © ADTRAN, INC.

Further reconciliations related to net income, net loss, earnings per share, loss per share Three Months Ended Nine Months Ended (1) Represents the non-controlling interest portion of the Company's ownership of Adtran Networks pre-DPLTA and the annual recurring compensation earned by September 30, June 30, September 30, September 30, September 30, redeemable non-controlling interests and accrued by the Company post-DPLTA. 2023 2023 2022 2023 2022 Net Loss attributable to ADTRAN Holdings, Inc. $ (72,735) $ (33,334 ) $ (41,934) $ (140,533 ) $ (40,918 ) (2) Includes non-cash change in fair value of equity investments held in deferred compensation plans offered to certain employees. (1) Plus: Net Loss attributable to non-controlling interest (2,914) (2,881 ) (2,925) (11,784) (2,925 ) (3) Includes amortization of actuarial losses related to the Company's pension plan for employees in certain foreign countries. Net Loss inclusive of non-controlling interest $ (75,649 ) $ (36,215 ) $ (44,859) $ (152,317) $ (43,843 ) Acquisition related expenses, amortization and adjustments 18,070 37,837 40,310 93,069 44,763 Asset impairments — — 16,969 — 16,969 Stock-based compensation expense 3,530 4,309 12,131 11,537 15,912 Valuation allowance — (185) 3,182 (185 ) 15,550 (2) Deferred compensation adjustments (684 ) (1,561) 383 (3,101) (612) (3) Pension adjustments 7 6 325 20 499 Restructuring expenses 24,873 5,868 — 33,178 2 Integration expenses 1,639 563 — 3,051 — Goodwill impairment 37,874 - — 37,874 — Tax effect of adjustments to net loss (23,366) (13,426) (16,245) (49,099) (17,430) Non-GAAP Net (Loss) Income inclusive of non-controlling interest $ (13,706) $ (2,804) $ 12,196 $ (25,973) $ 31,810 Less: Non-GAAP Net Loss (Income) attributable to non- (1) controlling interest (2,914 ) (2,881) 4,486 (10,255 ) 4,486 Non-GAAP Net (Loss) Income attributable to ADTRAN Holdings, Inc. $ (10,792) $ 77 $ 7,710 $ (15,718 ) $ 27,324 (1) GAAP Net Loss attributable to non-controlling interest $ (2,914) $ (2,881) $ (2,925) $ (11,784 ) $ (2,925 ) Acquisition related expenses, amortization and adjustments — — 7,120 1,457 7,120 Restructuring expenses — — — 29 — Integration expenses — — — 6 — Stock-based compensation expense — — 231 37 231 Pension adjustments — — 60 — 60 Non-GAAP Net Loss (Income) attributable to non-controlling (1) interest $ (2,914) $ (2,881 ) $ 4,486 $ (10,255 ) $ 4,486 Weighted average shares outstanding – basic 78,389 78,366 73,036 78,378 57,175 Weighted average shares outstanding – diluted 78,389 78,366 73,036 78,378 57,175 Loss per common share attributable to ADTRAN Holdings, Inc. – basic $ (0.93 ) $ (0.43 ) $ (0.57) $ (1.79 ) $ (0.72) Loss per common share attributable to ADTRAN Holdings, Inc. – diluted $ (0.93) $ (0.43) $ (0.57) $ (1.79 ) $ (0.72) Non-GAAP (Loss) Earnings per common share attributable to ADTRAN – basic $ (0.14) $ 0.00 $ 0.11 $ (0.20) $ 0.48 Non-GAAP (Loss) Earnings per common share attributable to ADTRAN – diluted $ (0.14 ) $ 0.00 $ 0.11 $ (0.20) $ 0.48 37 2023 © ADTRAN, INC.

Thank you