Exhibit 99.1

Investor Day September 2022 Positioning Omnicell for the Future © 2022 Omnicell, Inc. 1

© 2022 Omnicell, Inc. Agenda Welcome Kathleen Nemeth, Senior Vice President, Investor Relations Strategic Overview & Opportunity Randall Lipps, Chairman, President, Chief Executive Officer & Founder Pharmacy Transformation & the Shift to Services Scott Seidelmann, Executive Vice President & Chief Commercial Officer An Introduction to EnlivenHealth® Danny Sanchez, Senior Vice President & General Manager, EnlivenHealth® Capitalizing on the Opportunity Peter Kuipers, Executive Vice President & Chief Financial Officer Conclusion Randall Lipps Q&A 2
© 2022 Omnicell, Inc. Forward - Looking Statements This presentation contains “forward - looking statements” within the meaning of federal securities laws. These forward - looking sta tements include statements with respect to expected benefits and objectives of Omnicell’s products and services, strategic and growth opportunities, 2022 guidance, 2025 targets, growth targets, other expectations and other non - hist orical information. Without limiting the foregoing, statements including the words “expect,” “intend,” “may,” “will,” “should,” “would,” “could,” “plan,” “potential,” “anticipate,” “believe,” “forecast,” “guidance,” “outlook,” “ goa ls,” “target,” “estimate,” “seek,” “predict,” “project,” and similar expressions are intended to identify forward - looking statements. Forward - looking statements are subject to the occurrence of many events outside Omnicell’s control a nd are subject to various risks and uncertainties, including those described below. Among other things, there can be no assurance that Omnicell’s actual results or growth rates will not differ, perhaps substantially, from th e targets and expectations contained in this presentation. Such statements also include, but are not limited to, Omnicell’s projected bookings, GAAP and non - GAAP revenues, non - GAAP EBITDA , non - GAAP EBITDA margin, non - GAAP gross margin, non - GAAP earnings per share, growth rates, total addressable market, market share and margin expansion; existing products and services and planned new products and serv ice s and the related expected benefits; and statements about Omnicell’s strategy, objectives, and vision, including its corporate responsibility (innovation, environment, social and governance) goals and strategies. Actual results and other events may differ significantly from those contemplated by forward - looking statements due to numerous factors that involve substantial known and unknown risks and uncertainties. These risks and uncertainties include, a mon g other things, (i) risks related to the ongoing COVID - 19 pandemic (including new variants of the virus), (ii) Omnicell’s ability to take advantage of growth opportunities and develop and commercialize new solutions and enhance exi sti ng solutions, (iii) continued and increased competition from current and future competitors in the medication management automation solutions market and the medication adherence solutions market, (iv) unfavorable general eco nom ic and market conditions or reduction in demand for our solutions, (v) changes to the 340B Program, (vi) Omnicell’s substantial debt, which could impair its financial flexibility and access to capital, (vii) risks re lat ed to Omnicell’s investments in new business strategies or initiatives, including its transition to selling more products and services on a subscription basis, and its ability to acquire companies, businesses, or technologies and successf ull y integrate such acquisitions, (viii) risks presented by government regulations, legislative changes, fraud and anti - kickback statues, products liability claims, the outcome of legal proceedings, and other legal obligations related to healt hcare, privacy, data protection, and information security, including any potential governmental investigations and enforcement actions, litigation, fines and penalties, exposure to indemnification obligations or other liabilities, and a dve rse publicity that may result from the previously disclosed ransomware incident, (ix) any disruption in Omnicell’s information technology systems and breaches of data security or cyber - attacks on its systems or solutions, including the previously disclosed ransomware incident and any potential adverse legal, reputational, and financial effects that may result from it and/or additional cybersecurity incidents, as well as the effectiveness of business continuit y p lans during any future cybersecurity incidents, (x) risks related to climate change and legal, regulatory, or market measures to address climate change as well as a related emphasis on ESG matters by various stakeholders, (xi) risks as soc iated with operating in foreign countries, (xii) Omnicell’s ability to recruit and retain skilled and motivated personnel, (xiii) Omnicell’s ability to protect its intellectual property, (xiv) Omnicell’s ability to meet the dem and s of, or maintain relationships with, its institutional, retail, and specialty pharmacy customers, (xv) risks related to the availability and sources of raw materials and components or price fluctuations, shortages, or interruptions of supply, (x vi) Omnicell’s dependence on a limited number of suppliers for certain components, equipment, and raw materials, as well as technologies provided by third - party vendors, and (xvii) other risks and uncertainties further described i n the “Risk Factors” section of Omnicell’s most recent Annual Report on Form 10 - K, as well as in Omnicell’s other reports filed with or furnished to the United States Securities and Exchange Commission (“SEC”), available at www.sec.g ov. Forward - looking statements should be considered in light of these risks and uncertainties. Investors and others are cautioned not to place undue reliance on forward - looking statements. All forward - looking statements contained in this press release speak only as of the date of this press release. Omnicell assumes no obligation to update any such statements publicly, or to update the reasons actual results could differ materially from those expressed or implied in any forward - looking statements, whether as a result of changed circumstances, new information, future events, or otherwise, except as required by law. Non - GAAP Financial Information This presentation contains financial measures that are not calculated in accordance with U.S. generally accepted accounting p rin ciples (“GAAP”), including 2017 and 2021 total non - GAAP revenue, 2017 non - GAAP EBITDA, 2017 non - GAAP earnings per share, 2017 non - GAAP gross margin, 2017 non - GAAP EBITDA margin, 2017 and 2021 Net Debt/EBITDA, 2017 and 2021 L iquidity, guidance with respect to 2022 total non - GAAP revenues, non - GAAP EBITDA, non - GAAP EBITDA margin, non - GAAP gross margin and non - GAAP earnings per share, and expected annual revenue and recurring revenue, targete d non - GAAP gross margin and targeted non - GAAP EBITDA margin. Reconciliations of the 2017 and 2021 non - GAAP financial measures, as well as non - GAAP gross profit, to the most directly comparable GAAP measures are included i n the Appendix to this presentation. Our 2022 guidance for total non - GAAP revenues, non - GAAP EBITDA, non - GAAP EBITDA margin, non - GAAP gross margin, and non - GAAP earnings per share, and our expected annual revenue and recu rring revenue, non - GAAP gross margin targets, and non - GAAP EBITDA margin target, exclude certain items, which include, but are not limited to, unusual gains and losses, costs associated with future restructurings, acq uisition - related expenses, and certain tax and litigation outcomes. These excluded items may be significant. We do not provide a reconciliation of forward - looking non - GAAP measures or targets to the comparable GAAP measures as these item s are inherently uncertain and difficult to estimate and cannot be predicted without unreasonable effort. We believe such a reconciliation would imply a degree of precision that could be confusing or misleading to investors . T hese items may also have a material impact on GAAP earnings per share, total revenues, gross profit or net income in future periods. As such, these forward - looking non - GAAP financial measures are limited in their utility for evaluating our future operating results in accordance with GAAP. OMNICELL, the Omnicell logo, AMPLICARE, and ENLIVENHEALTH are registered trademarks and Omnicell One is a trademark, of Omnic ell , Inc. or one its subsidiaries. 3
Strategic Overview & Opportunity Randall Lipps, Chairman, President, Chief Executive Officer & Founder 4 © 2022 Omnicell, Inc.
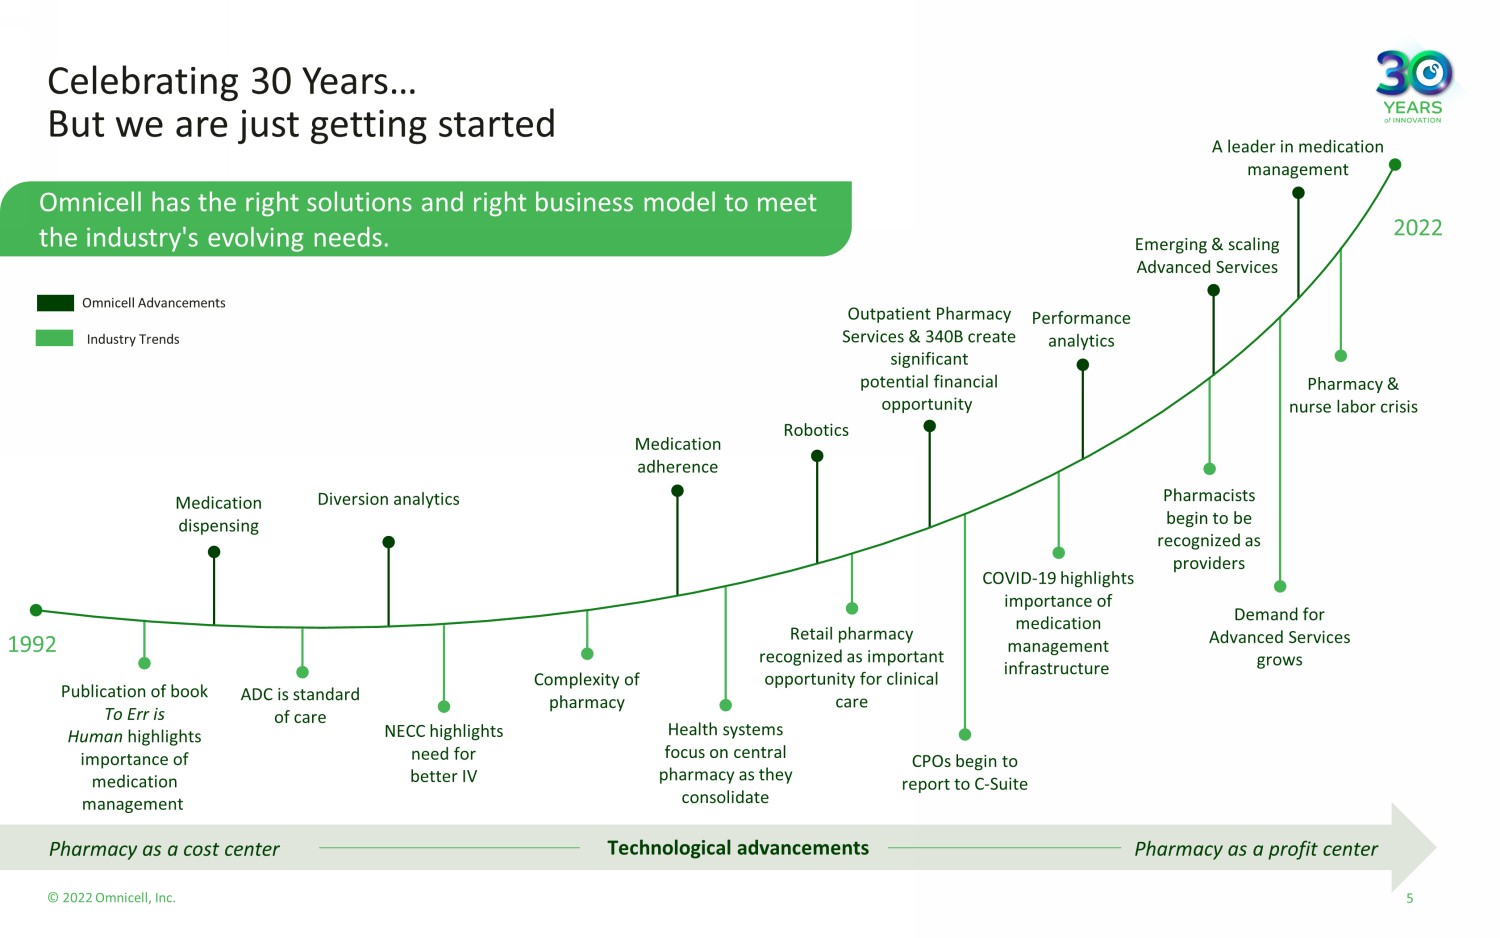
© 2022 Omnicell, Inc. Pharmacy as a cost center Pharmacy as a profit center Celebrating 30 Years… But we are just getting started 5 Omnicell has the right solutions and righ t business model to meet the industry's evolving needs. Technological advancements Robotics Omnicell Advancements Industry Trends 1992 2022 Complexity of pharmacy Pharmacy & nurse labor crisis Demand for Advanced Services grows CPOs begin to report to C - Suite Outpatient Pharmacy Services & 340B create significant potential financial opportunity COVID - 19 highlights importance of medication management infrastructure ADC is standard of care Retail pharmacy recognized as important opportunity for clinical care Medication dispensing Diversion analytics Medication adherence Performance analytics A leader in medication management Publication of book To Err is Human highlights importance of medication management Health systems focus on central pharmacy as they consolidate Pharmacists begin to be recognized as providers NECC highlights need for better IV Emerging & scaling Advanced Services

© 2022 Omnicell, Inc. Our Mission Our Vision D eliver the most compelling automation and services that accelerate pharmacy perfection. Be the clinician’s most trusted partner for medication management. We are dedicated to continuously deliver innovative technology that helps our customers improve patient care, for everyone . 6

© 2022 Omnicell, Inc. The Challenge: Our Healthcare System is Broken The healthcare industry is trying to drive clinical standardization often creating siloed settings of care. 7 7
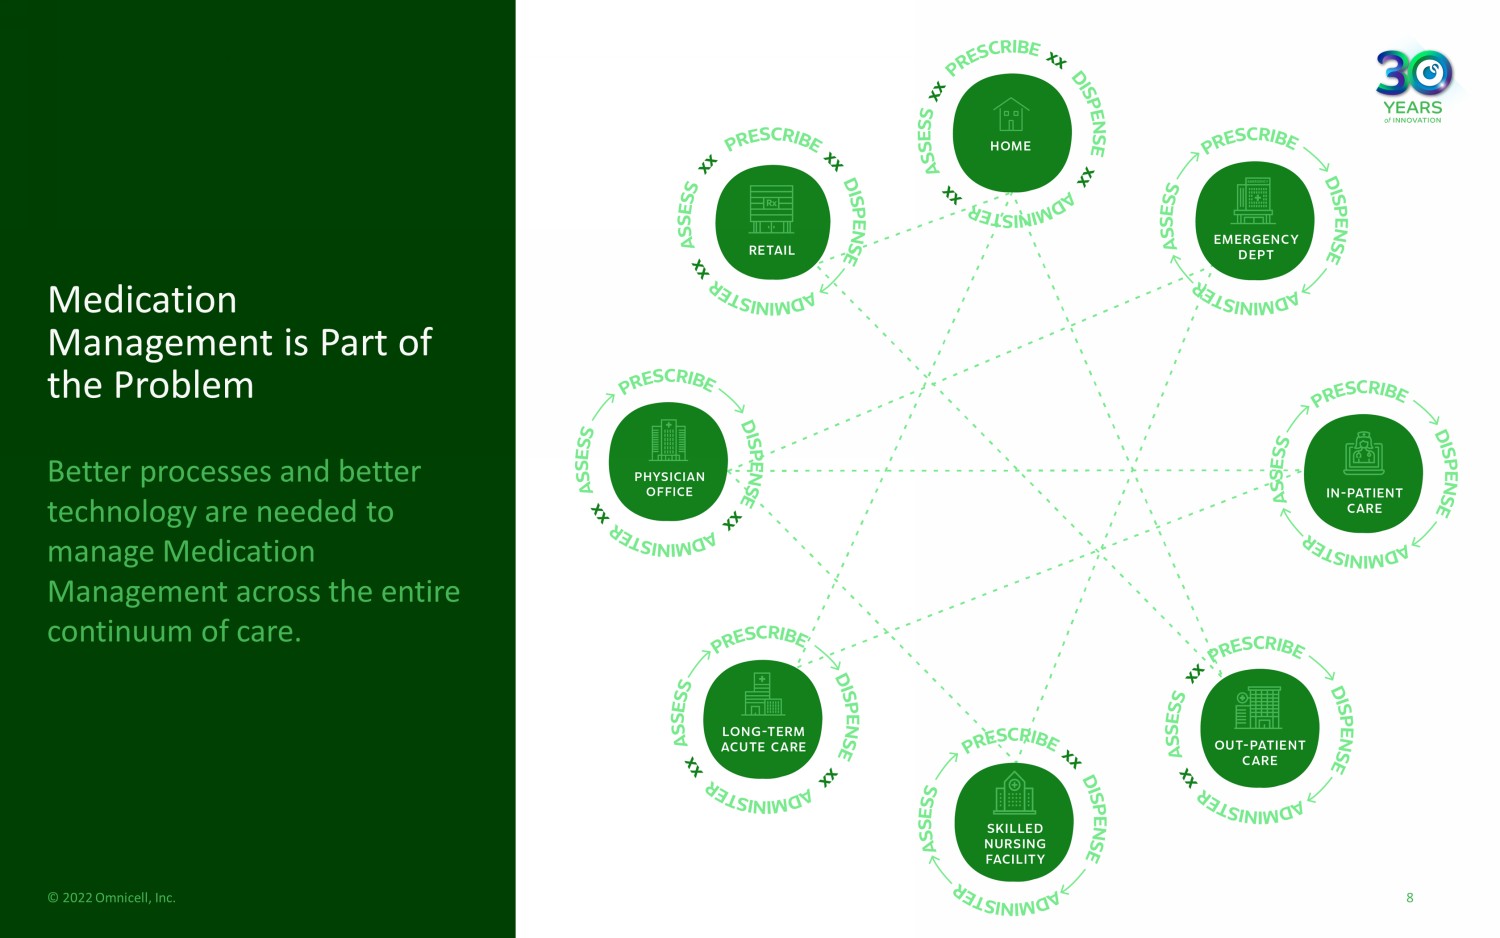
© 2022 Omnicell, Inc. Medication Management is Part of the Problem Better processes and better technology are needed to manage Medication Management across the entire continuum of care. 8

© 2022 Omnicell, Inc. Omnicell is uniquely positioned… to solve the problems of medication management. 9
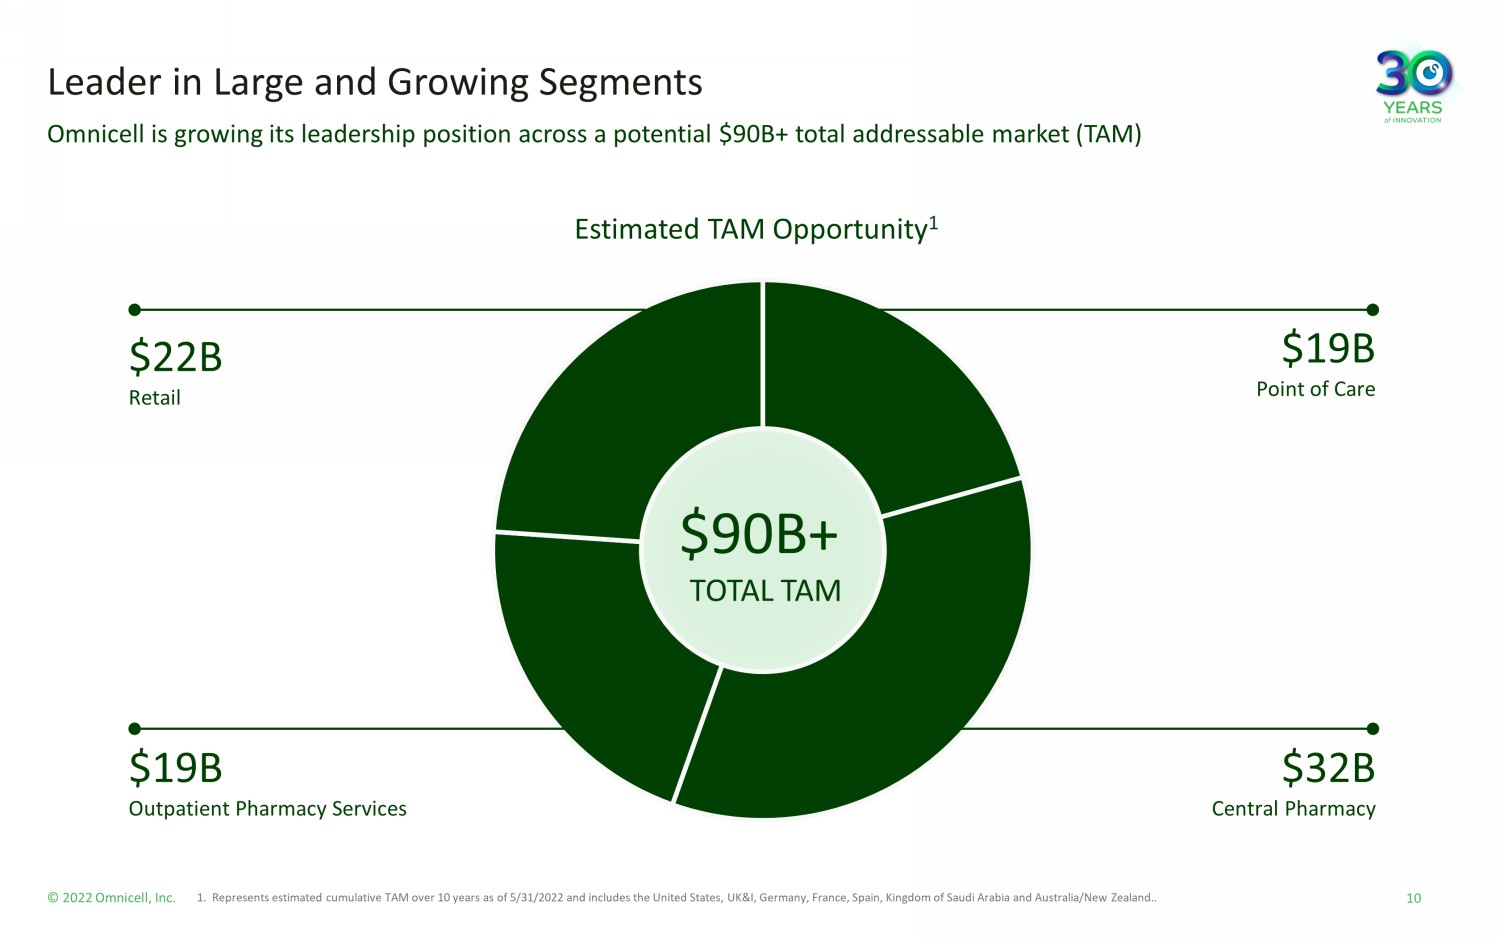
© 2022 Omnicell, Inc. 10 Leader in Large and Growing Segments 1. Represents estimated cumulative TAM over 10 years as of 5/31/2022 and includes the United States, UK&I, Germany, France, Spai n, Kingdom of Saudi Arabia and Australia/New Zealand.. Omnicell is growing its leadership position across a potential $90B+ total addressable market (TAM) Estimated TAM Opportunity 1 $ 19 B Point of Care $32B Central Pharmacy $90B+ TOTAL TAM $22B Retail $19B Outpatient Pharmacy Services
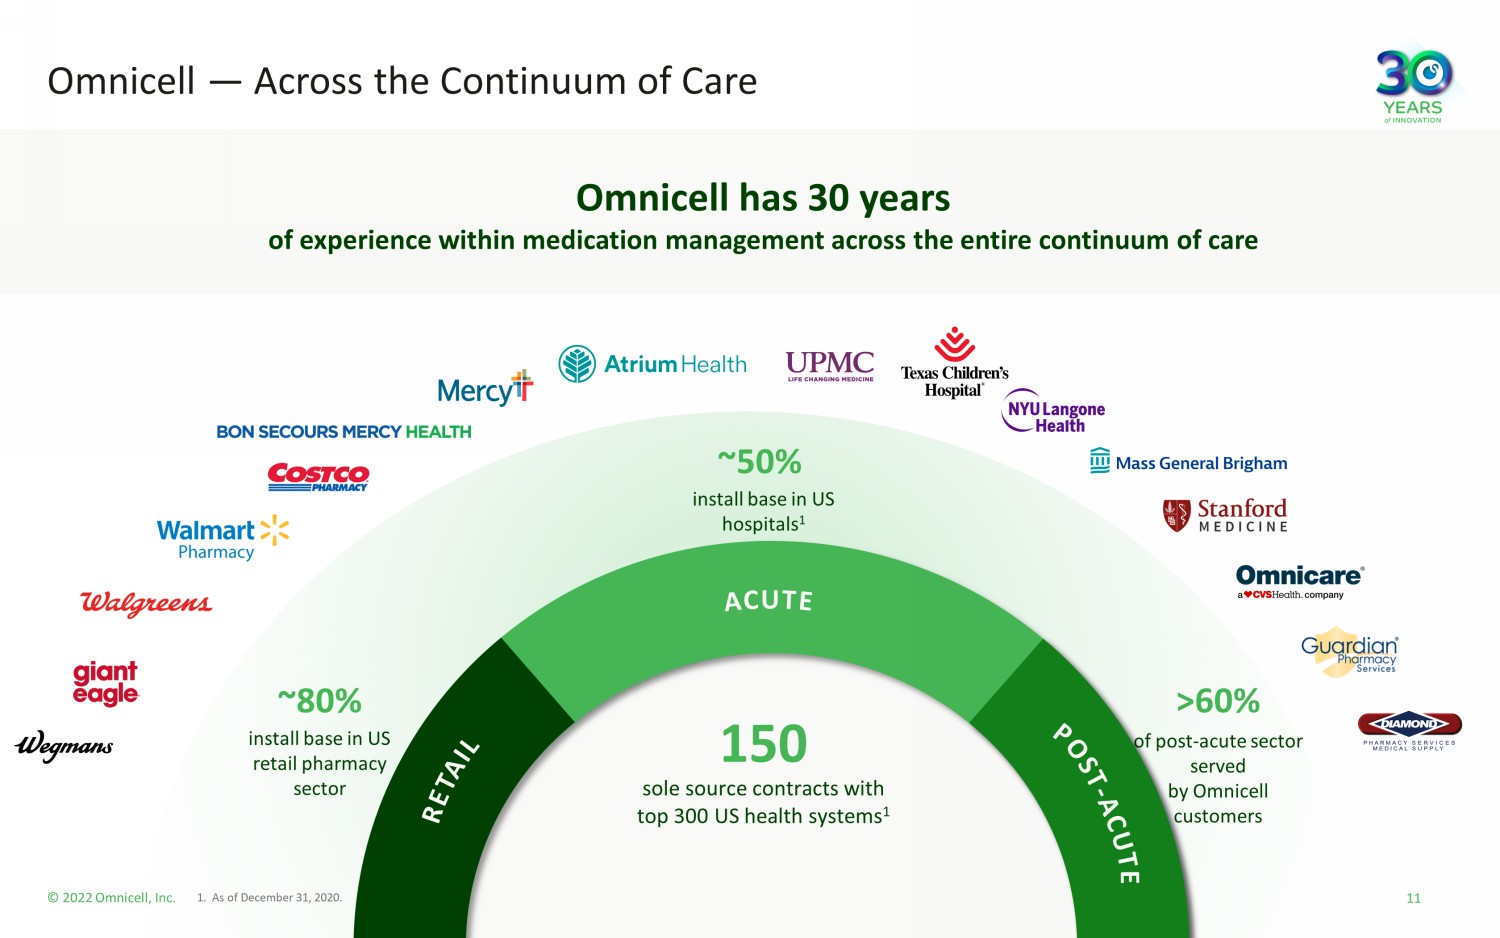
© 2022 Omnicell, Inc. Omnicell — Across the Continuum of Care install base in US retail pharmacy sector ~80% of post - acute sector served by Omnicell customers >60% install base in US hospitals 1 ~50% Omnicell has 30 years of experience within medication management across the entire continuum of care 150 sole source contracts with top 300 US health systems 1 11 1. As of December 31, 2020.
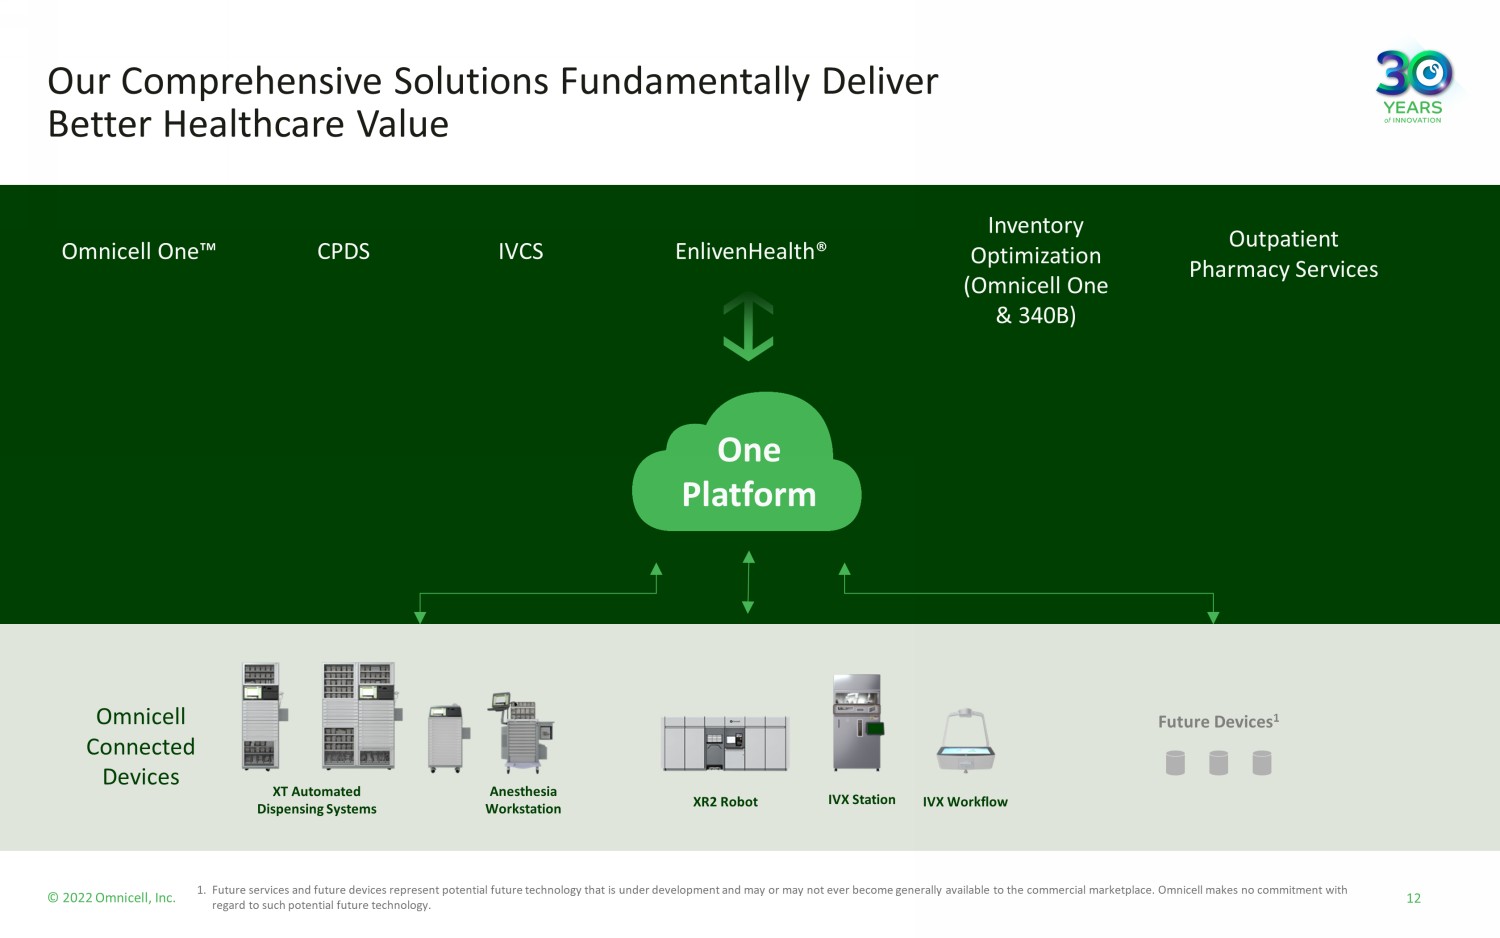
© 2022 Omnicell, Inc. Our Comprehensive Solutions Fundamentally Deliver Better Healthcare Value 12 1. Future services and future devices represent potential future technology that is under development and may or may not ever be com e generally available to the commercial marketplace. Omnicell makes no commitment with regard to such potential future technology. Future Devices 1 Omnicell Connected Devices One Platform XR2 Robot IVX Workflow IV X Station XT Automated Dispensing Systems Anesthesia Workstation Inventory Optimization (Omnicell One & 340B) Omnicell One Ρ CPDS IVCS EnlivenHealth® Outpatient Pharmacy Services
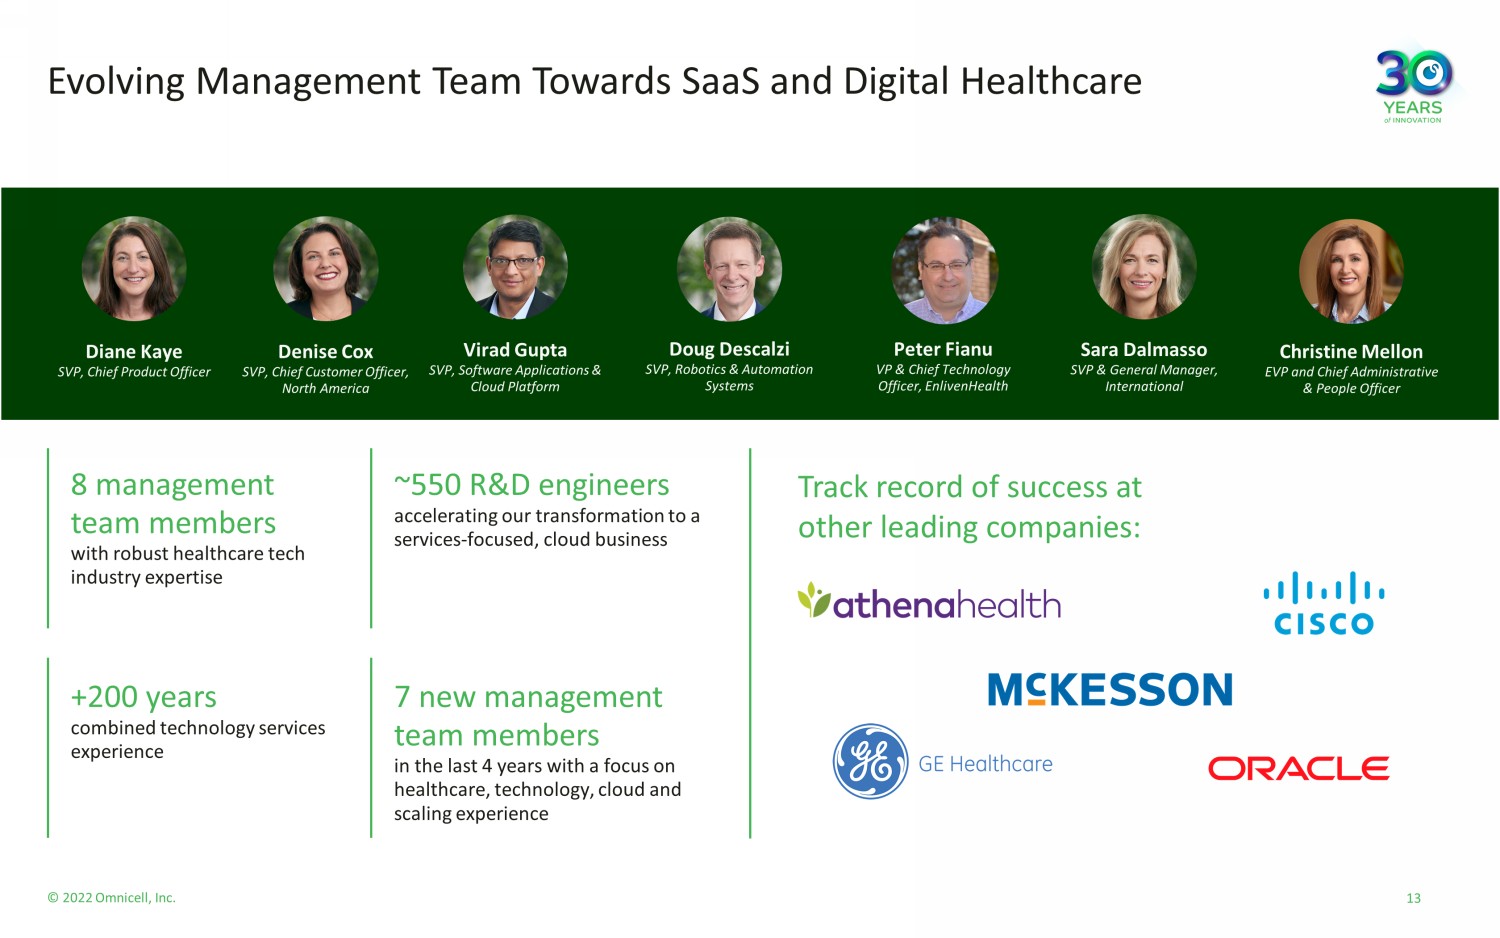
© 2022 Omnicell, Inc. Evolving Management Team Towards SaaS and Digital Healthcare 8 management team members with robust healthcare tech industry expertise +200 years combined technology services experience 7 new management team members in the last 4 years with a focus on healthcare, technology, cloud and scaling experience ~550 R&D engineers accelerating our transformation to a services - focused, cloud business Track record of success at other leading companies: Diane Kaye SVP, Chief Product Officer Christine Mellon EVP and Chief Administrative & People Officer Denise Cox SVP, Chief Customer Officer, North America Peter Fianu VP & Chief Technology Officer, EnlivenHealth Sara Dalmasso SVP & General Manager, International Doug Descalzi SVP, Robotics & Automation Systems Virad Gupta SVP, Software Applications & Cloud Platform 13

© 2022 Omnicell, Inc. Our Strategy Fundamentally transform the pharmacy care delivery model by delivering a set of services that touch the entire continuum of care, built on a single cloud platform. 14
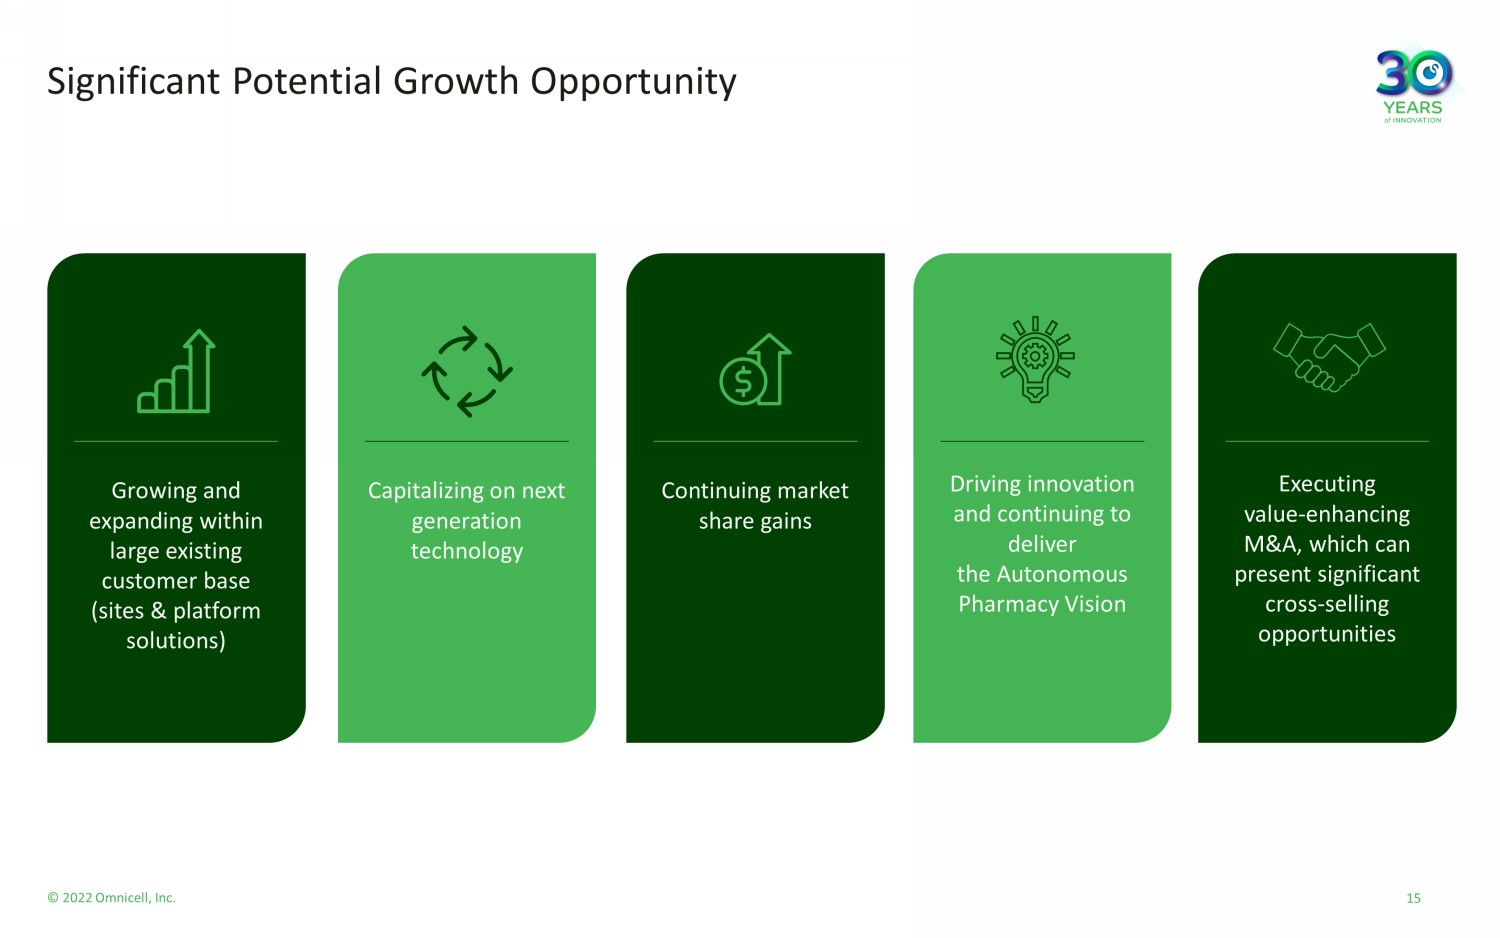
© 2022 Omnicell, Inc. Driving innovation and continuing to deliver the Autonomous Pharmacy Vision Growing and expanding within large existing customer base (sites & platform solutions) Capitalizing on next generation technology Continuing market share gains Executing value - enhancing M&A, which can present significant cross - selling opportunities Significant Potential Growth Opportunity 15
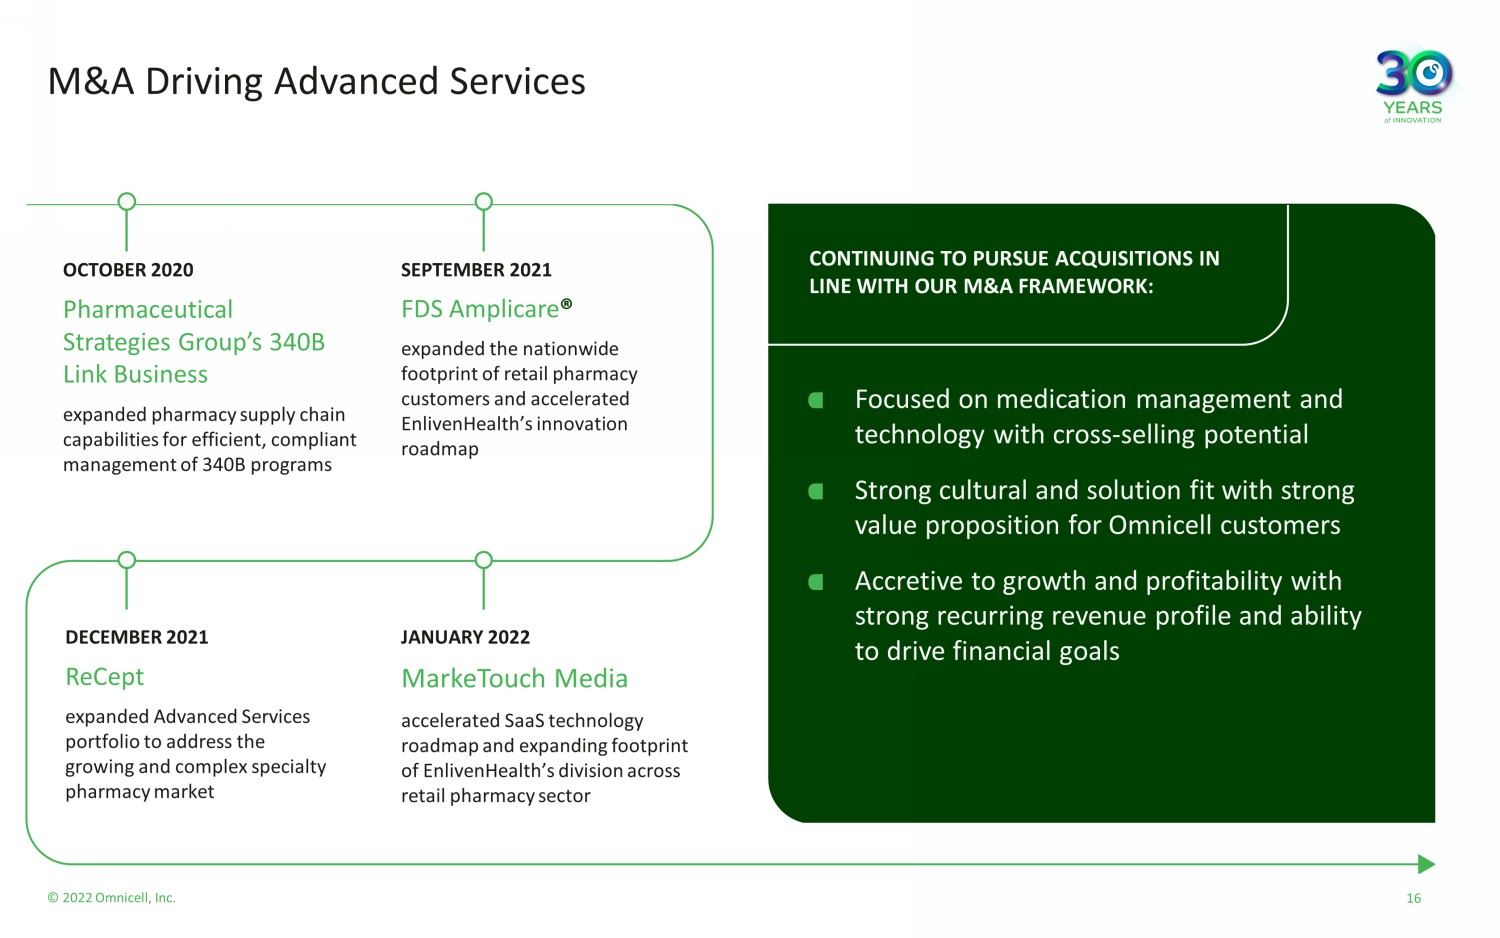
© 2022 Omnicell, Inc. M&A Driving Advanced Services Focused on medication management and technology with cross - selling potential Strong cultural and solution fit with strong value proposition for Omnicell customers Accretive to growth and profitability with strong recurring revenue profile and ability to drive financial goals MarkeTouch Media accelerated SaaS technology roadmap and expanding footprint of EnlivenHealth’s division across retail pharmacy sector Pharmaceutical Strategies Group’s 340B Link Business expanded pharmacy supply chain capabilities for efficient, compliant management of 340B programs OCTOBER 2020 SEPTEMBER 2021 JANUARY 2022 DECEMBER 2021 CONTINUING TO PURSUE ACQUISITIONS IN LINE WITH OUR M&A FRAMEWORK: FDS Amplicare ® expanded the nationwide footprint of retail pharmacy customers and accelerated EnlivenHealth’s innovation roadmap ReCept expanded Advanced Services portfolio to address the growing and complex specialty pharmacy market 16
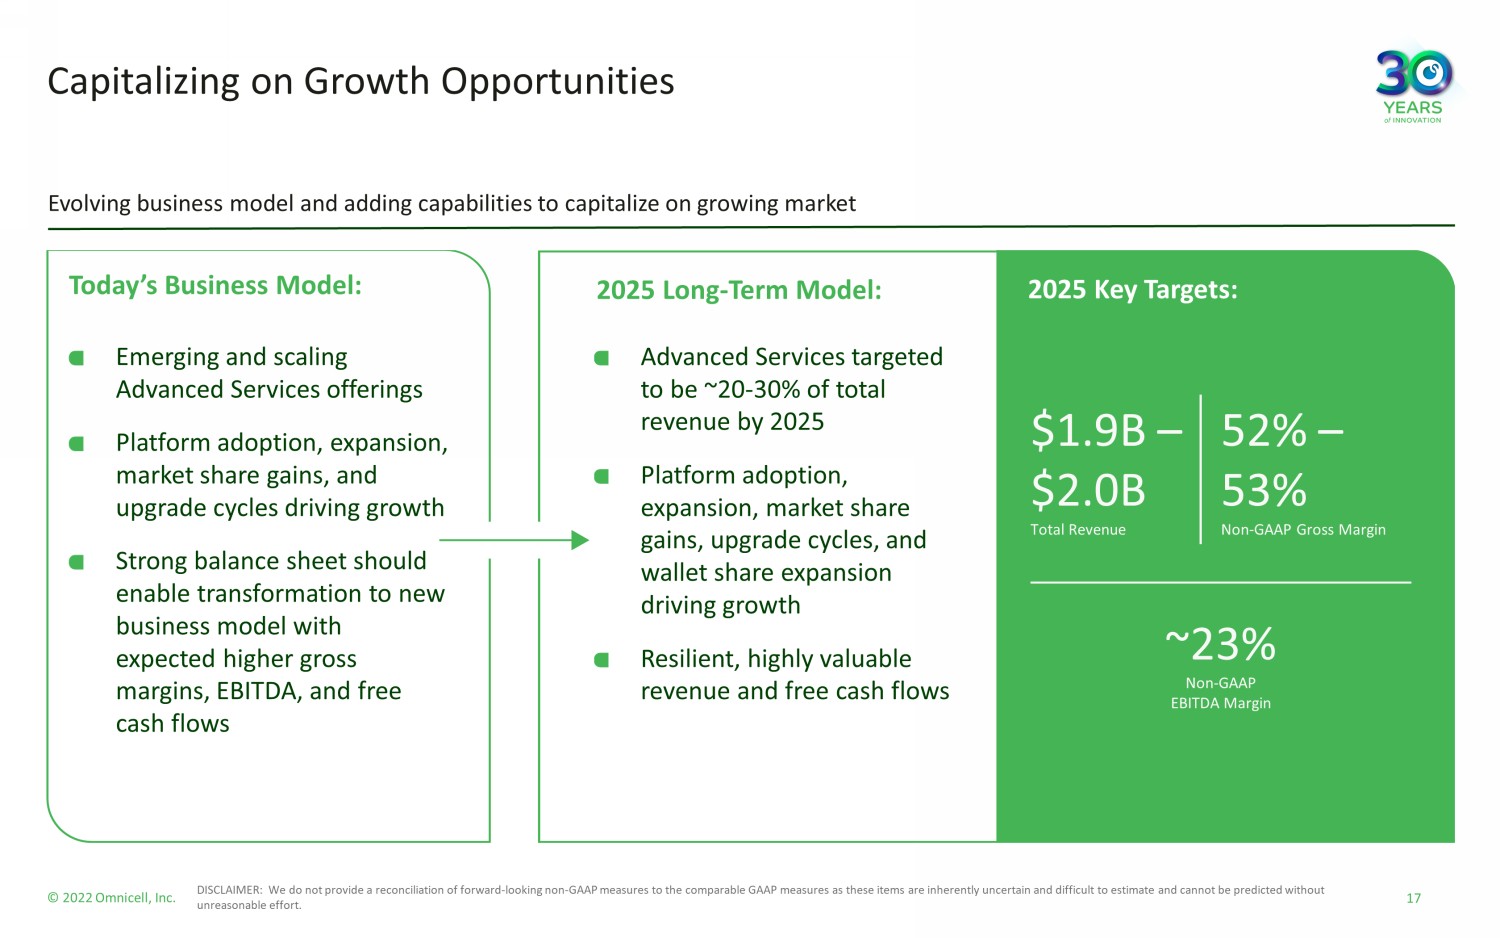
© 2022 Omnicell, Inc. Capitalizing on Growth Opportunities 17 DISCLAIMER: We do not provide a reconciliation of forward - looking non - GAAP measures to the comparable GAAP measures as these it ems are inherently uncertain and difficult to estimate and cannot be predicted without unreasonable effort. Today’s Business Model: 2025 Long - Term Model: 2025 Key Targets: Evolving business model and adding capabilities to capitalize on growing market $1.9B – $2.0B Total Revenue 52% – 53% Non - GAAP Gross Margin ~23 % Non - GAAP EBITDA Margin Emerging and scaling Advanced Services offerings Platform adoption, expansion, market share gains, and upgrade cycles driving growth Strong balance sheet should enable transformation to new business model with expected higher gross margins, EBITDA, and free cash flows Advanced Services targeted to be ~20 - 30% of total revenue by 2025 Platform adoption, expansion, market share gains, upgrade cycles, and wallet share expansion driving growth Resilient, highly valuable revenue and free cash flows
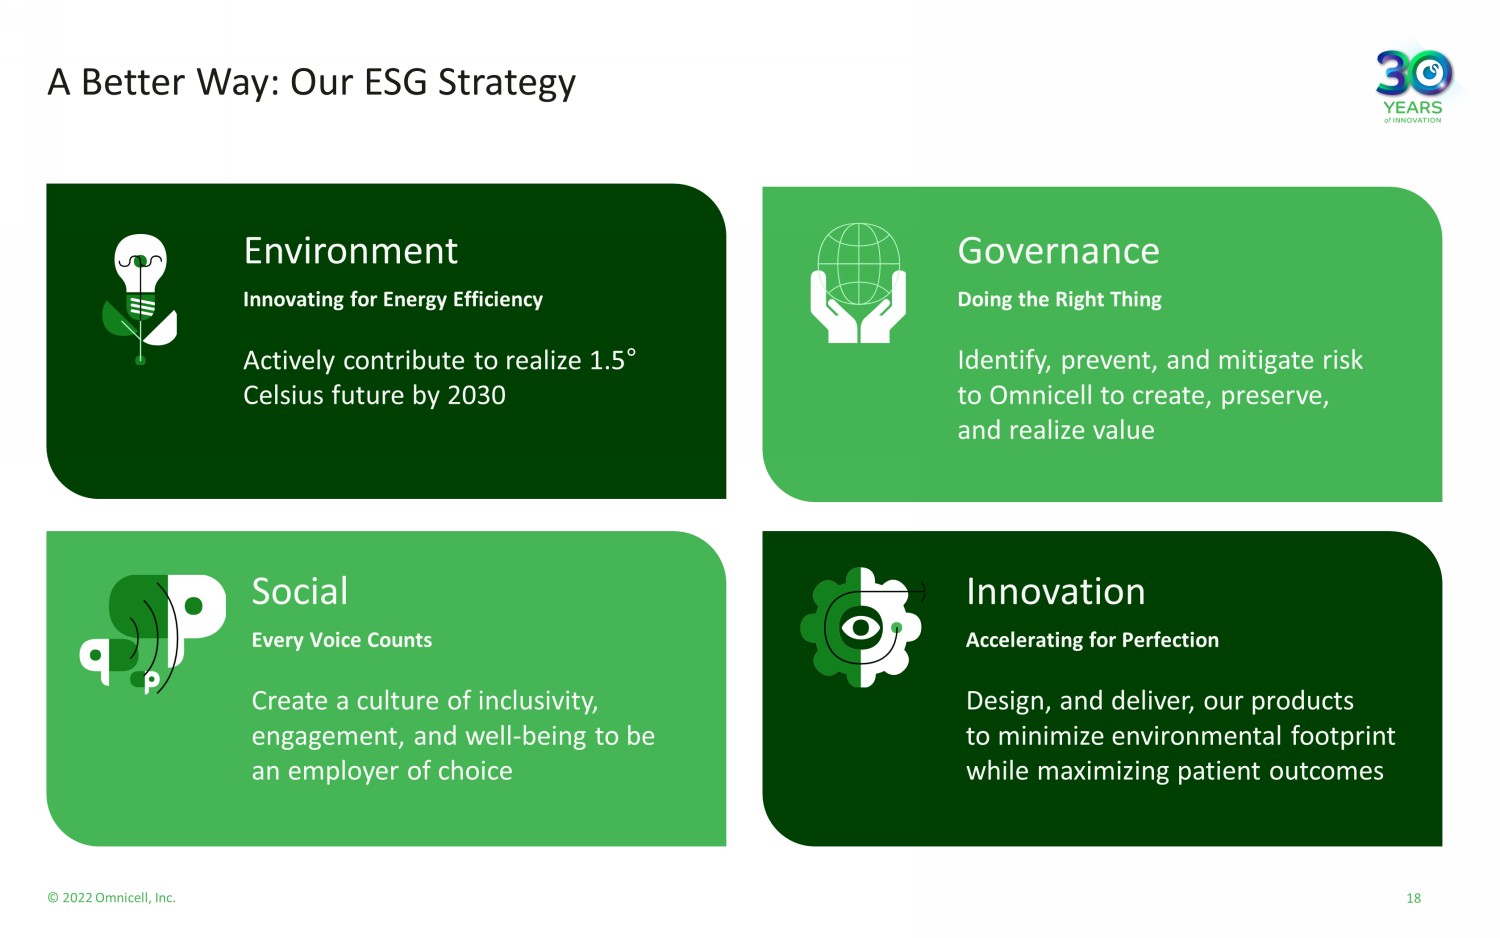
© 2022 Omnicell, Inc. A Better Way: Our ESG Strategy Innovation Accelerating for Perfection Design, and deliver, our products to minimize environmental footprint while maximizing patient outcomes Environment Innovating for Energy Efficiency Actively contribute to realize 1.5 ƒ Celsius future by 2030 Social Every Voice Counts Create a culture of inclusivity, engagement, and well - being to be an employer of choice Governance Doing the Right Thing Identify, prevent, and mitigate risk to Omnicell to create, preserve, and realize value 18
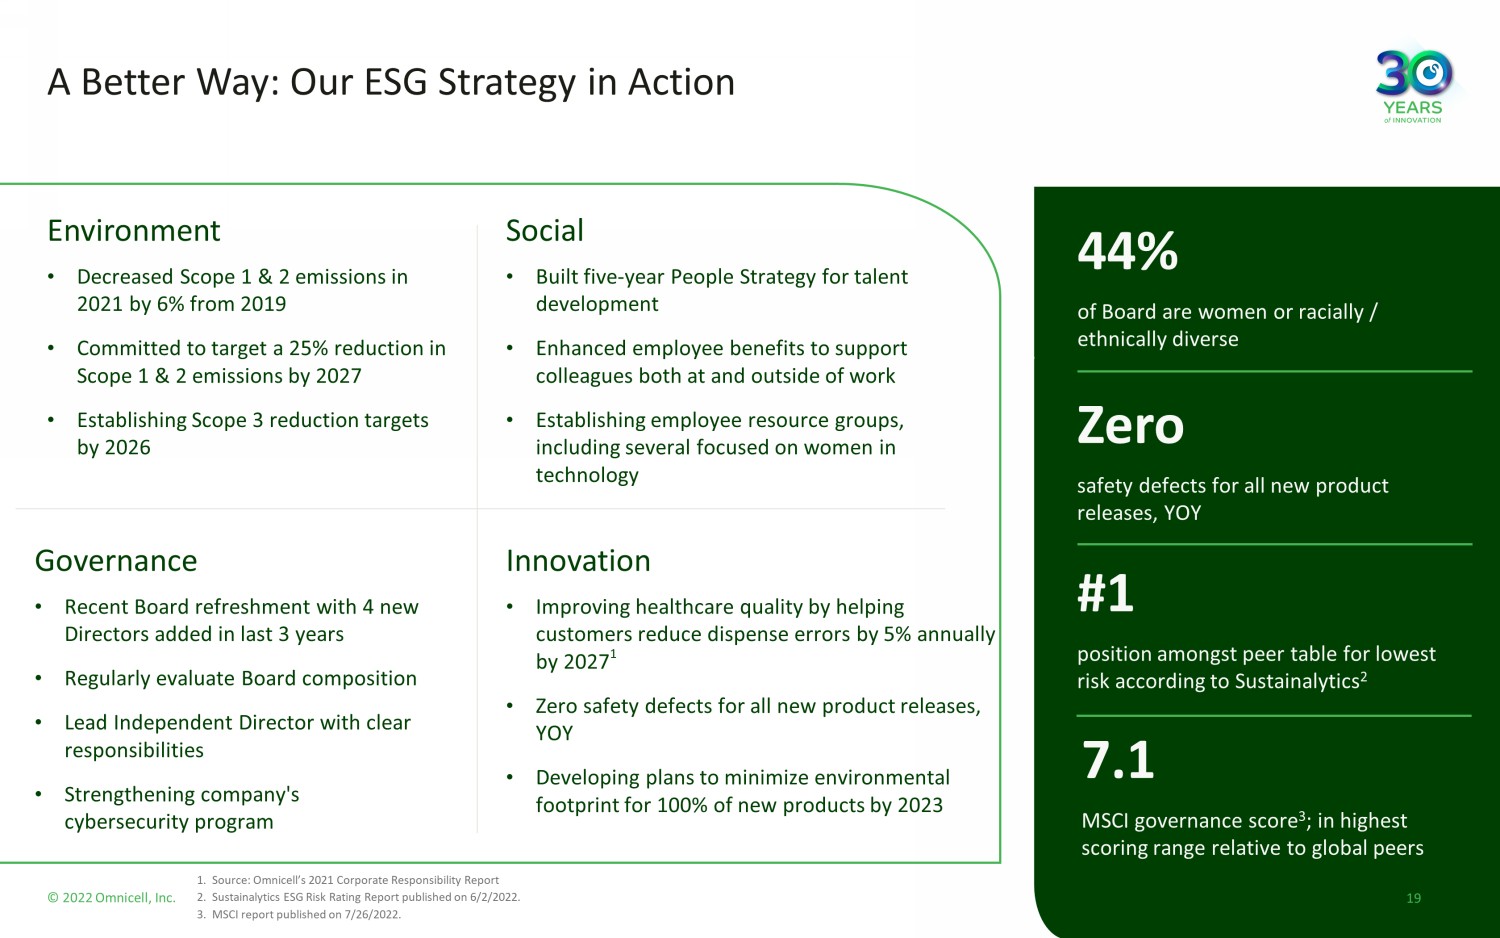
© 2022 Omnicell, Inc. 19 A Better Way: Our ESG Strategy in Action 1. Source: Omnicell’s 2021 Corporate Responsibility Report 2. Sustainalytics ESG Risk Rating Report published on 6/2/2022. 3. MSCI report published on 7/26/2022. 44% of Board are women or racially / ethnically diverse Zero safety defects for all new product releases, YOY 7.1 MSCI governance score 3 ; in highest scoring range relative to global peers #1 position amongst peer table for lowest risk according to Sustainalytics 2 Innovation • Improving healthcare quality by helping customers reduce dispense errors by 5% annually by 2027 1 • Zero safety defects for all new product releases, YOY • Developing plans to minimize environmental footprint for 100% of new products by 2023 Environment • Decreased Scope 1 & 2 emissions in 2021 by 6% from 2019 • Committed to target a 25% reduction in Scope 1 & 2 emissions by 2027 • Establishing Scope 3 reduction targets by 2026 Social • Built five - year People Strategy for talent development • Enhanced employee benefits to support colleagues both at and outside of work • Establishing employee resource groups, including several focused on women in technology Governance • Recent Board refreshment with 4 new Directors added in last 3 years • Regularly evaluate Board composition • Lead Independent Director with clear responsibilities • Strengthening company's cybersecurity program
© 2022 Omnicell, Inc. Why we win? Pharmacy focused True strategic customer partnerships Comprehensive solution portfolio Cloud enabled Services deliver real outcomes 20
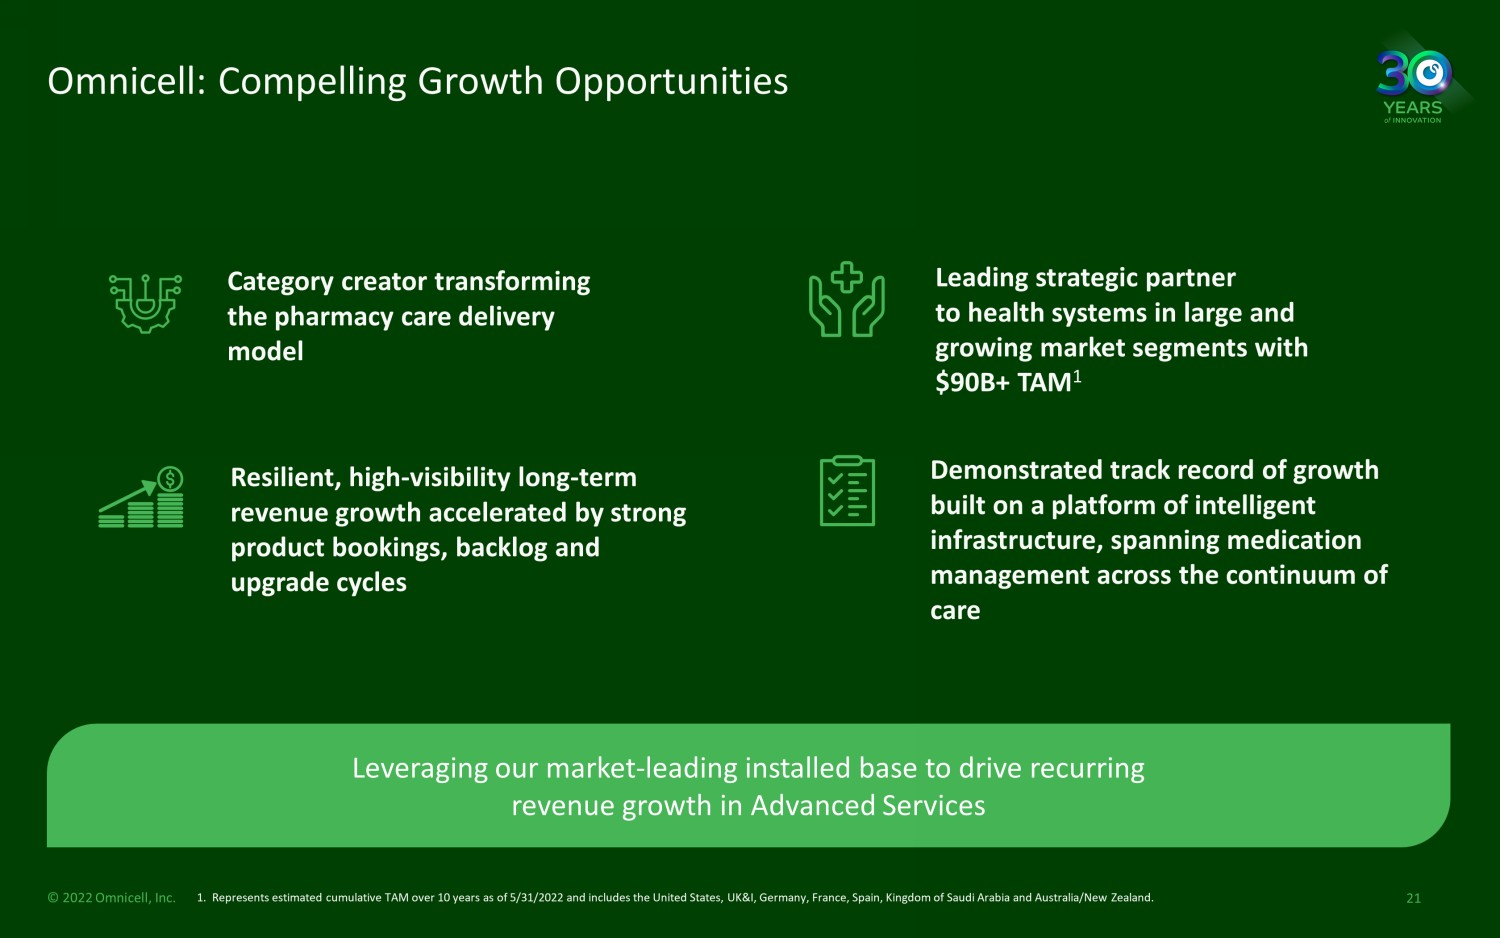
© 2022 Omnicell, Inc. Omnicell: Compelling Growth Opportunities 21 1. Represents estimated cumulative TAM over 10 years as of 5/31/2022 and includes the United States, UK&I, Germany, France, Spain, Kingdom of Saudi Arabia and Australia/New Zealand. Category creator transforming the pharmacy care delivery model Leading strategic partner to health systems in large and growing market segments with $90B+ TAM 1 Resilient, high - visibility long - term revenue growth accelerated by strong product bookings, backlog and upgrade cycles Demonstrated track record of growth built on a platform of intelligent infrastructure, spanning medication management across the continuum of care Leveraging our market - leading installed base to drive recurring revenue growth in Advanced Services

Pharmacy Transformation & the Shift to Services Scott Seidelmann, Executive Vice President & Chief Commercial Officer 22 © 2022 Omnicell, Inc.

© 2022 Omnicell, Inc. Omnicell is uniquely positioned… to solve the problems of medication management. 23
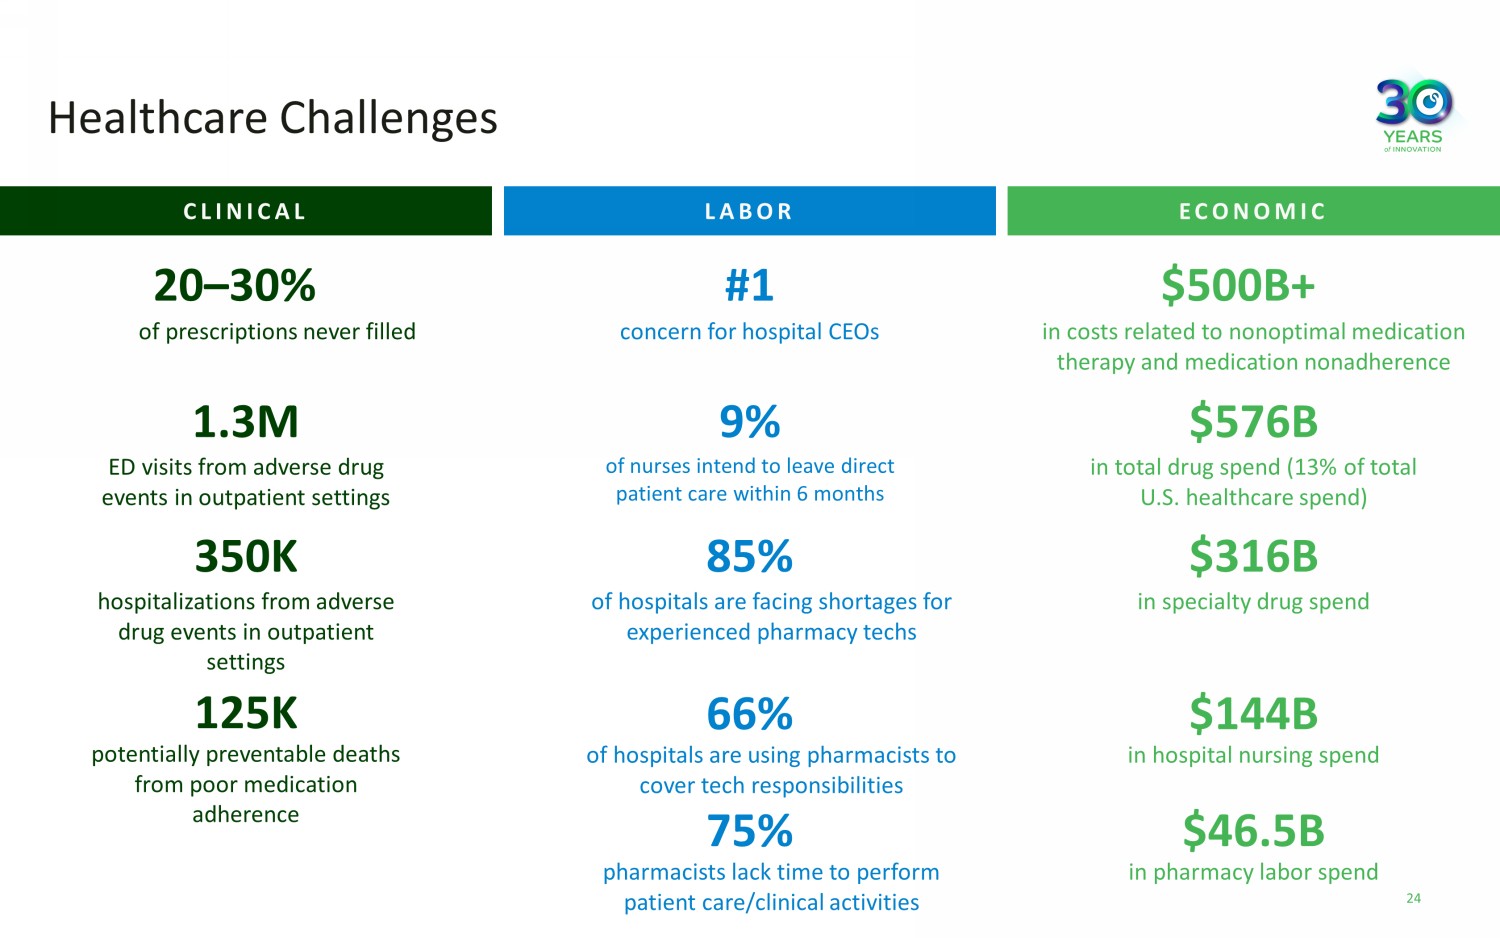
Healthcare Challenges CLINICAL 20 – 30% of prescriptions never filled 1.3M ED visits from adverse drug events in outpatient settings 350K hospitalizations from adverse drug events in outpatient settings 125K potentially preventable deaths from poor medication adherence ECONOMIC in hospital nursing spend $500B+ in costs related to nonoptimal medication therapy and medication nonadherence $576B in total drug spend (13% of total U.S. healthcare spend) $316B in specialty drug spend $144B $46.5B in pharmacy labor spend LABOR #1 concern for hospital CEOs 9% of nurses intend to leave direct patient care within 6 months 85% of hospitals are facing shortages for experienced pharmacy techs 66% of hospitals are using pharmacists to cover tech responsibilities 75% pharmacists lack time to perform patient care/clinical activities 24
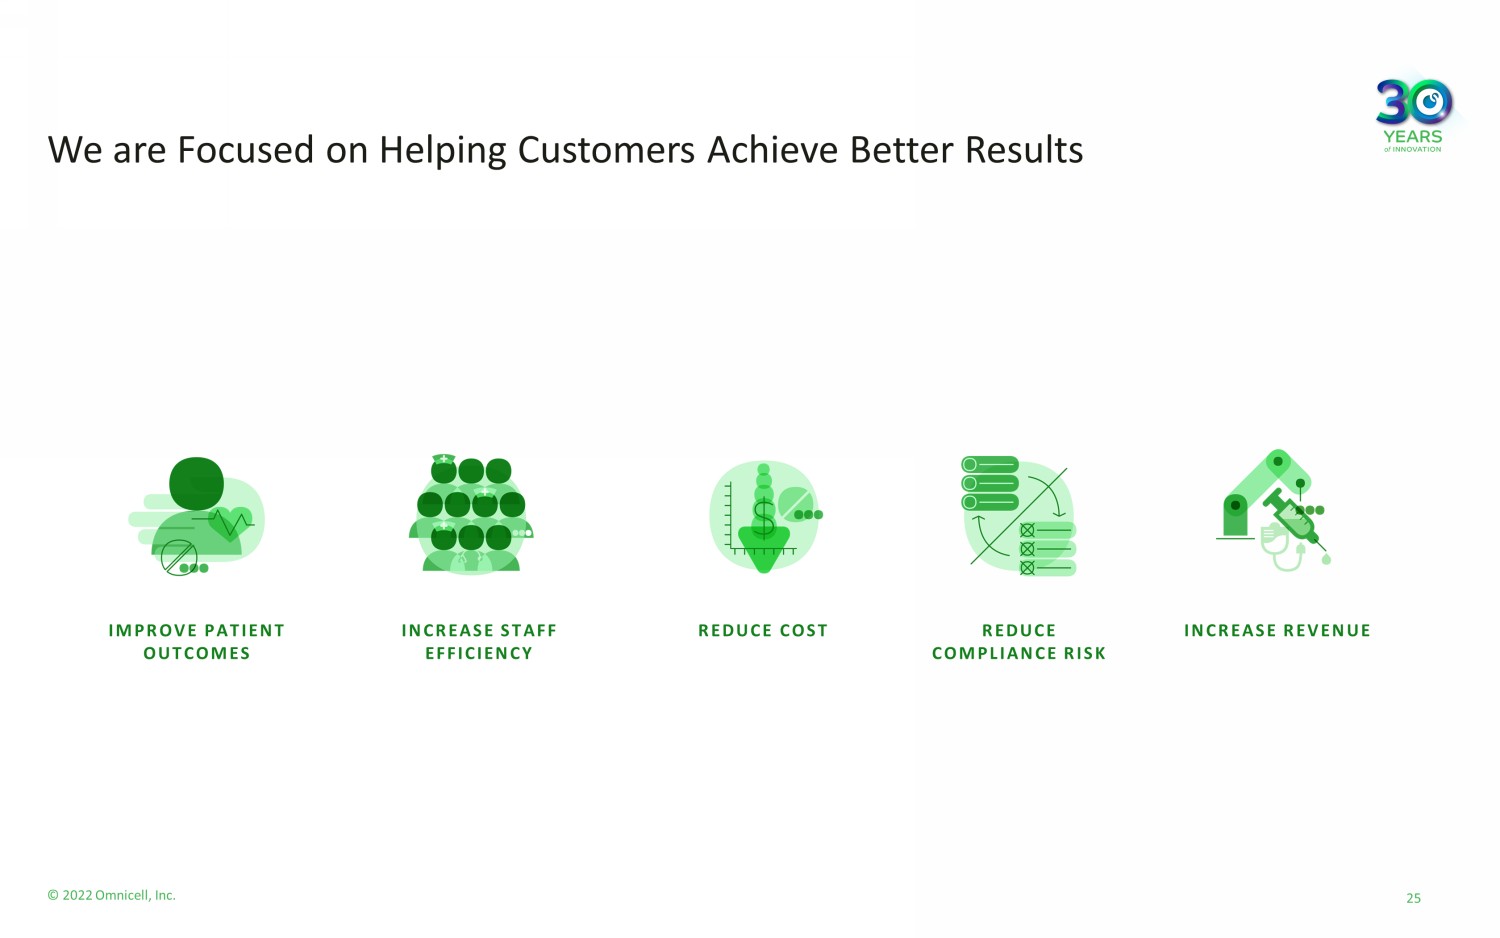
We are Focused on Helping Customers Achieve Better Results IMPROVE PATIENT OUTCOMES INCREASE STAFF EFFICIENCY REDUCE COST REDUCE COMPLIANCE RISK INCREASE REVENUE 25 © 2022 Omnicell, Inc.
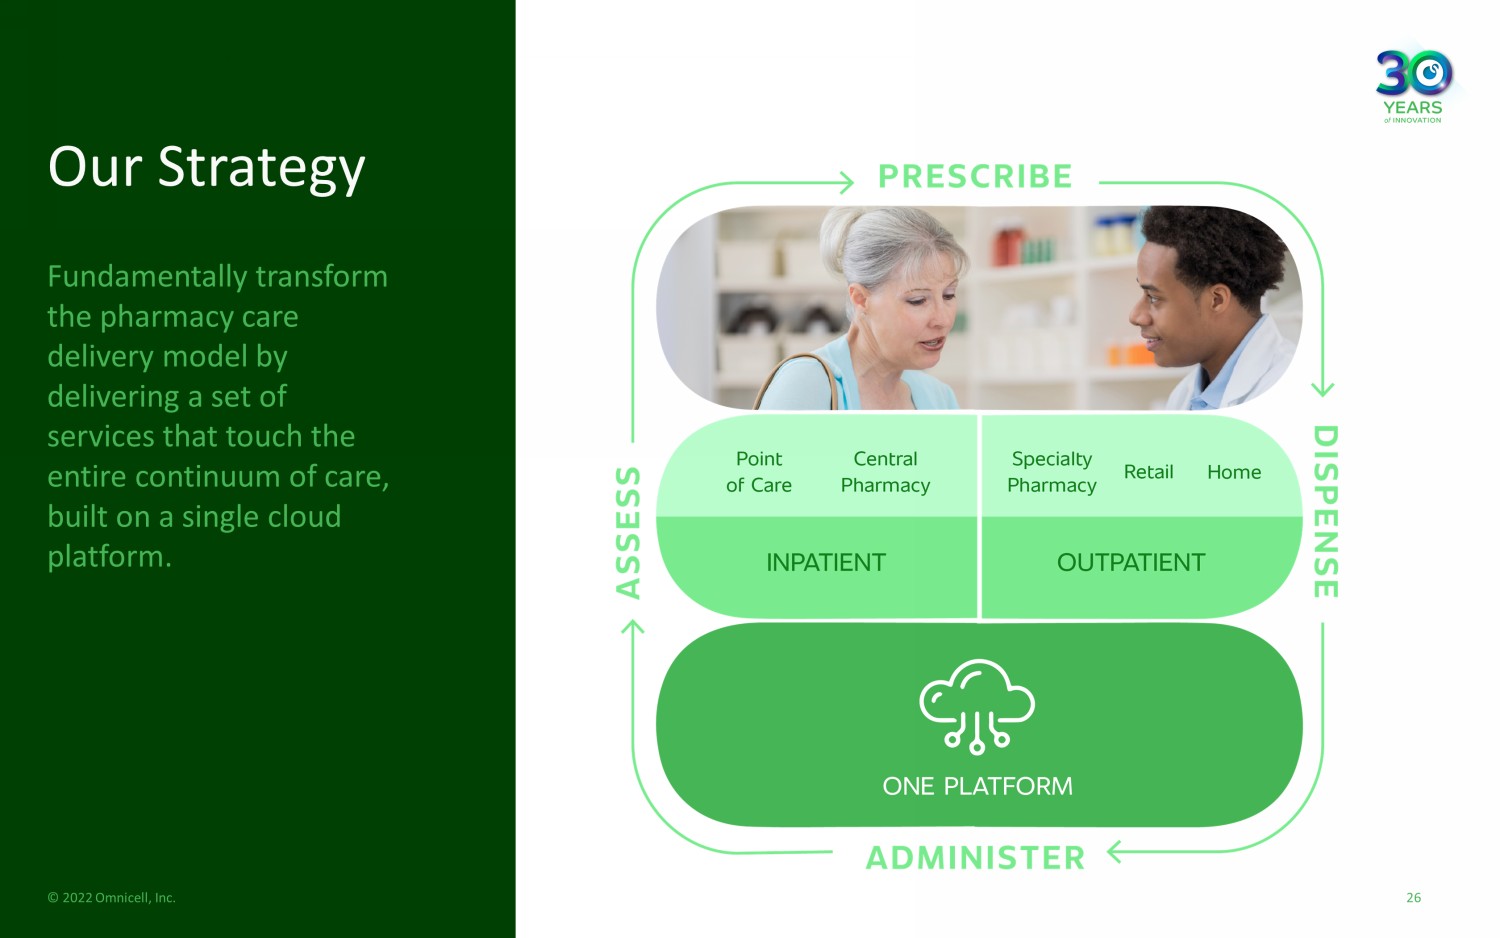
© 2022 Omnicell, Inc. Our Strategy Fundamentally transform the pharmacy care delivery model by delivering a set of services that touch the entire continuum of care, built on a single cloud platform. 26
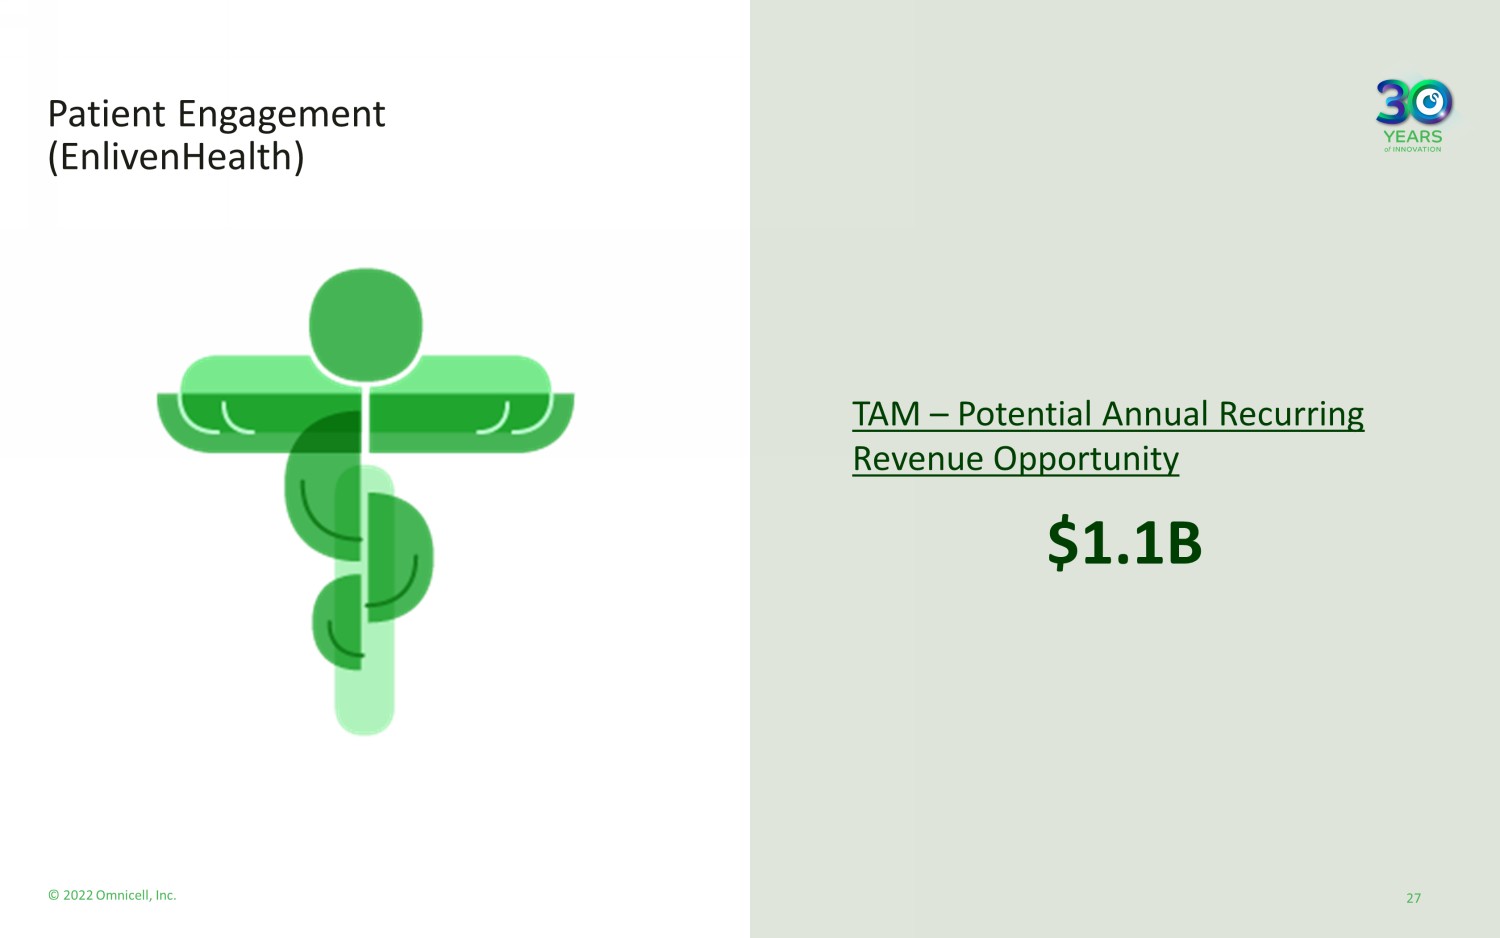
© 2022 Omnicell, Inc. 27 Patient Engagement (EnlivenHealth) $1.1B TAM – Potential Annual Recurring Revenue Opportunity 27

© 2022 Omnicell, Inc. 28 Inventory Optimization (Omnicell One Ρ & 340B) $1.3B TAM – Potential Annual Recurring Revenue Opportunity 28

© 2022 Omnicell, Inc. 29 Outpatient Pharmacy Services (fka ReCept Specialty) $1.9B TAM – Potential Annual Recurring Revenue Opportunity 29
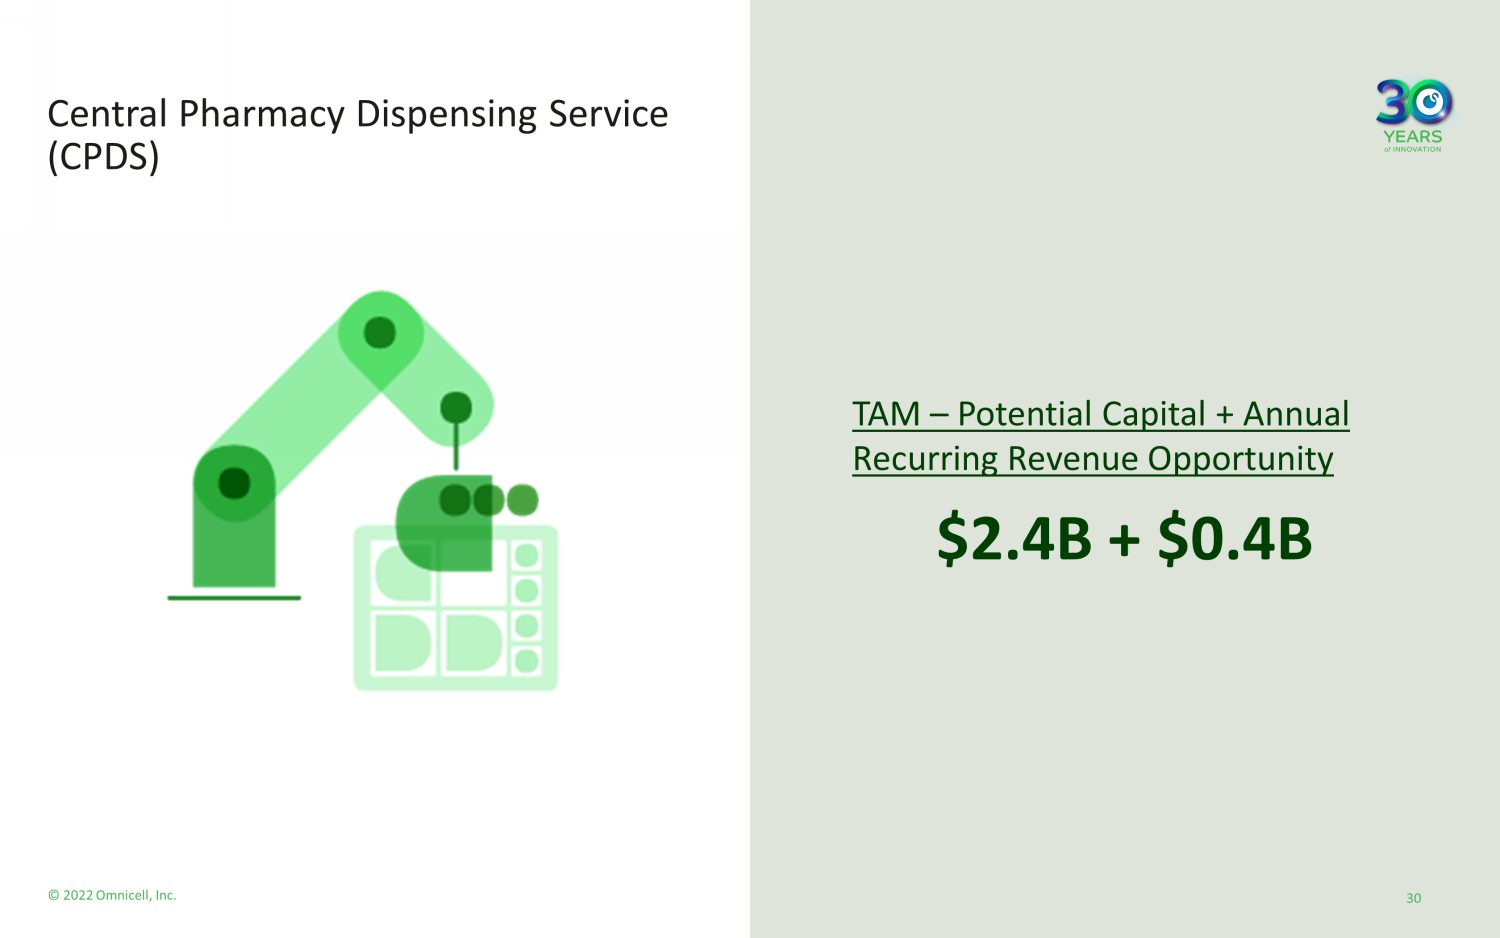
© 2022 Omnicell, Inc. 30 Central Pharmacy Dispensing Service (CPDS) $2.4B + $0.4B TAM – Potential Capital + Annual Recurring Revenue Opportunity 30

© 2022 Omnicell, Inc. 31 IV Compounding Service (IVCS) $1.1B + $0.4B TAM – Potential Capital + Annual Recurring Revenue Opportunity 31
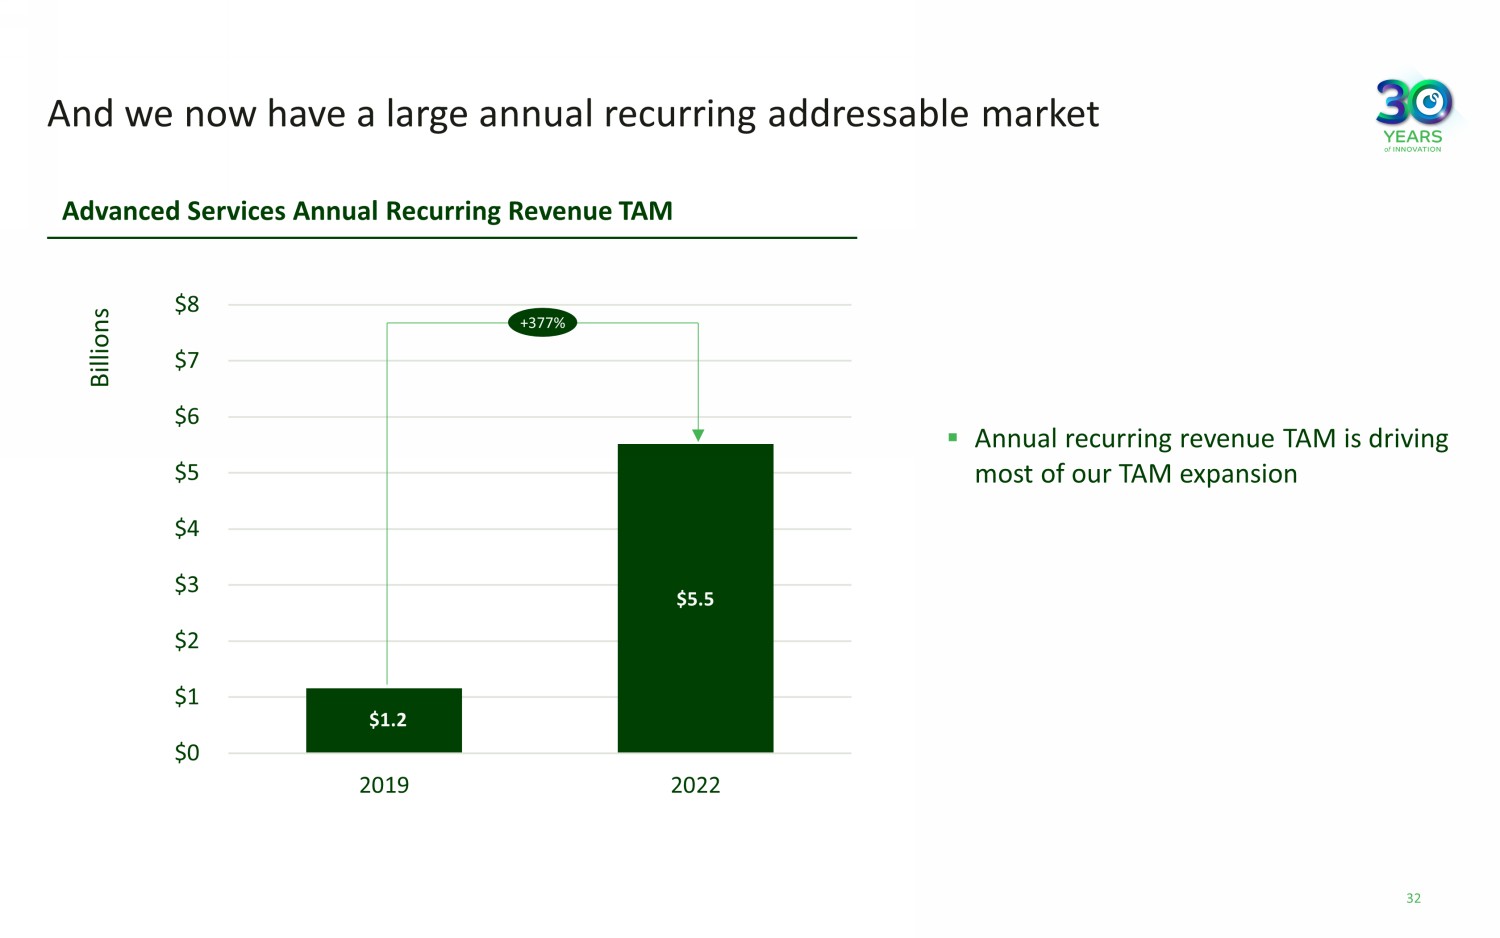
And we now have a large annual recurring addressable market Advanced Services Annual Recurring Revenue TAM $1.2 $5.5 $0 $1 $2 $3 $4 $5 $6 $7 $8 2019 2022 Billions +377% ▪ Annual recurring revenue TAM is driving most of our TAM expansion 32
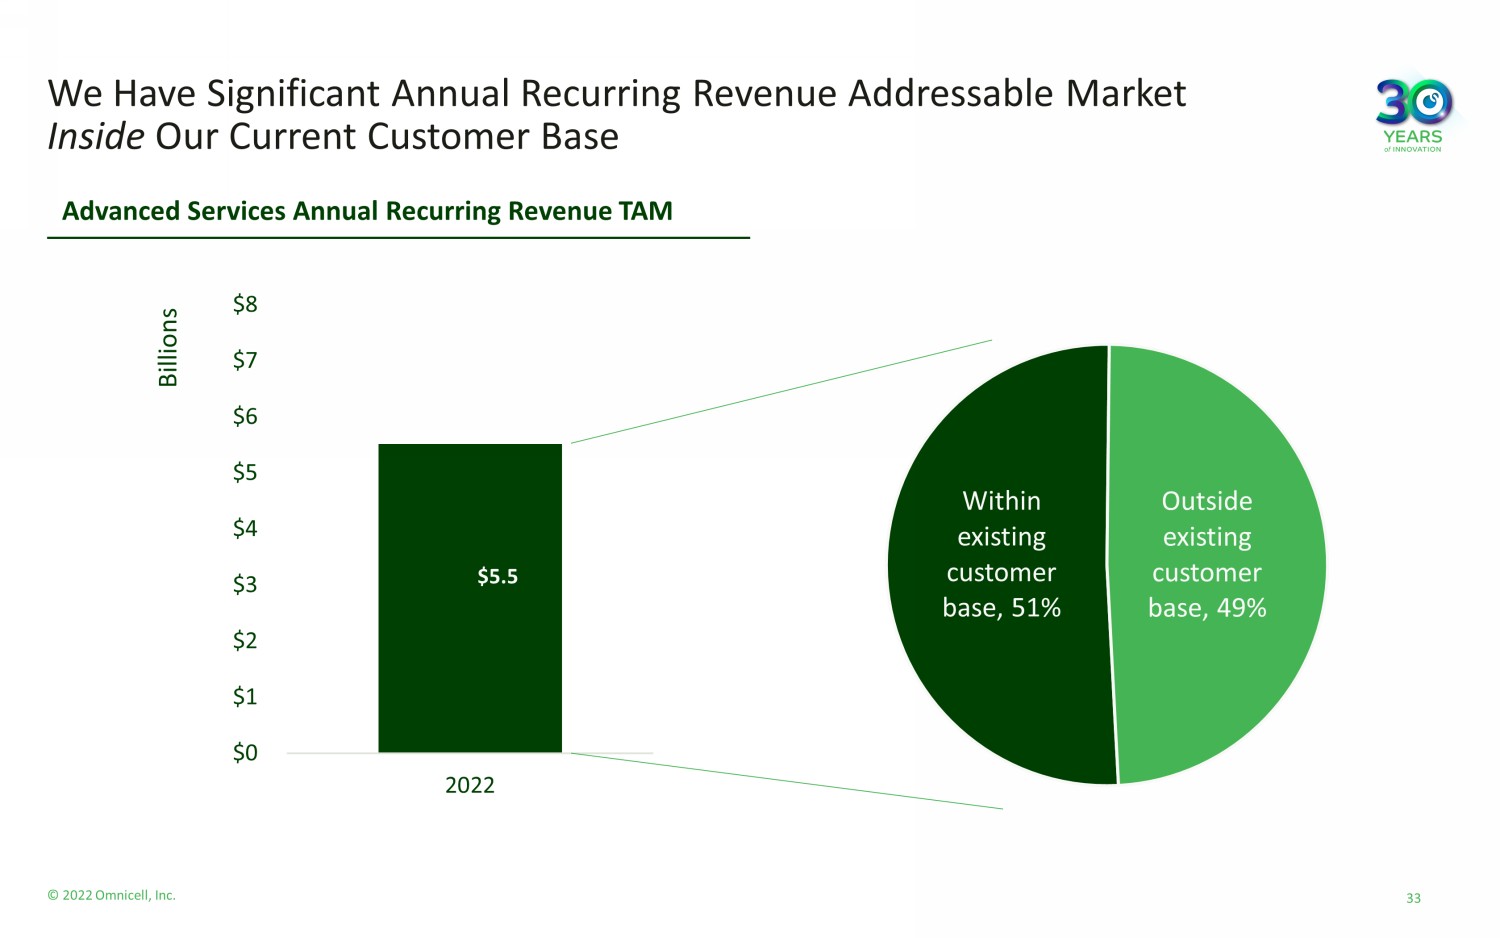
We Have Significant Annual Recurring Revenue Addressable Market Inside Our Current Customer Base Within existing customer base , 51% Outside existing customer base , 49% $5.5 $0 $1 $2 $3 $4 $5 $6 $7 $8 2022 Billions Advanced Services Annual Recurring Revenue TAM 33 © 2022 Omnicell, Inc.

© 2022 Omnicell, Inc. 34 We Can Achieve Our Long - Term Targets With Less Than 10% Market Share Capture ~ 6% 20 20 20 - 30% 202 5E ~ 50% 2020 - 2025 Targeted Revenue CAGR 20 21A 10% SaaS, Sub SW & Tech - Enabled Services (% of Total Revenue) We forecast 7 - 10% market share for our Advanced Services portfolio in 2025 34 Market share for subscription services without a hardware component (Omnicell One, Outpatient Pharmacy Services,340b, Enliven He alth) is calculated using revenue share of annual recurring TAM. Market share for subscription services with a hardware component (CPDS, IVCS) is calculated using share of upfront TAM (i.e., nu mber of units implemented). DISCLAIMER: We do not provide a reconciliation of forward - looking non - GAAP measures to the comparable GAAP measures as these ite ms are inherently uncertain and difficult to estimate and cannot be predicted without unreasonable effort.
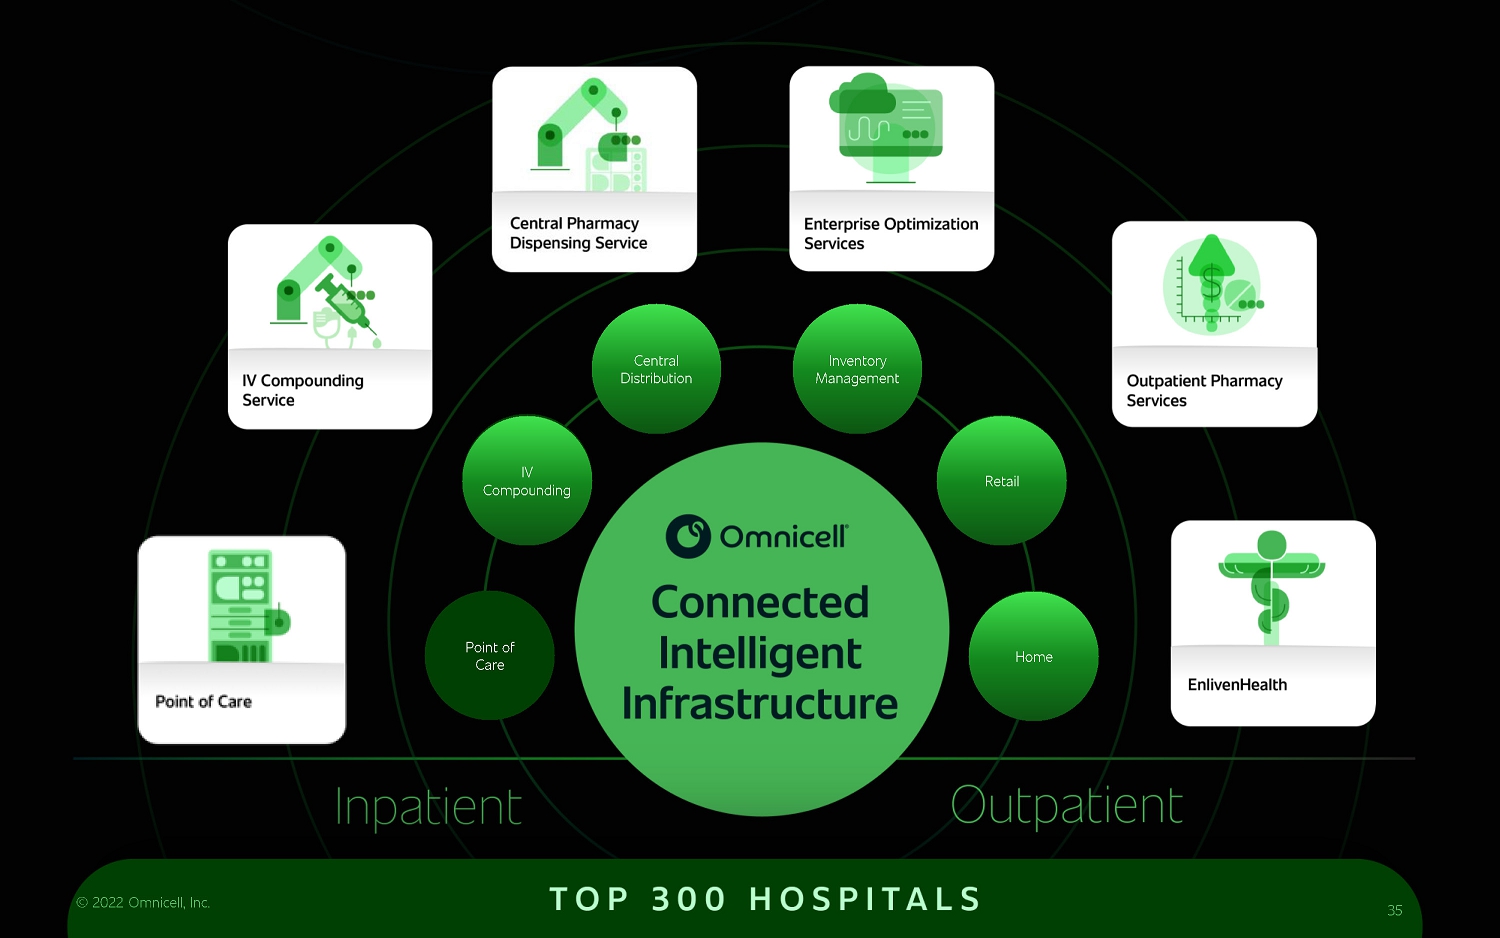
35 Point of Care IV Compounding Central Distribution Inventory Management Retail Home Point of Care IV Compounding Central Distribution Inventory Management Retail Home © 2022 Omnicell, Inc. 35
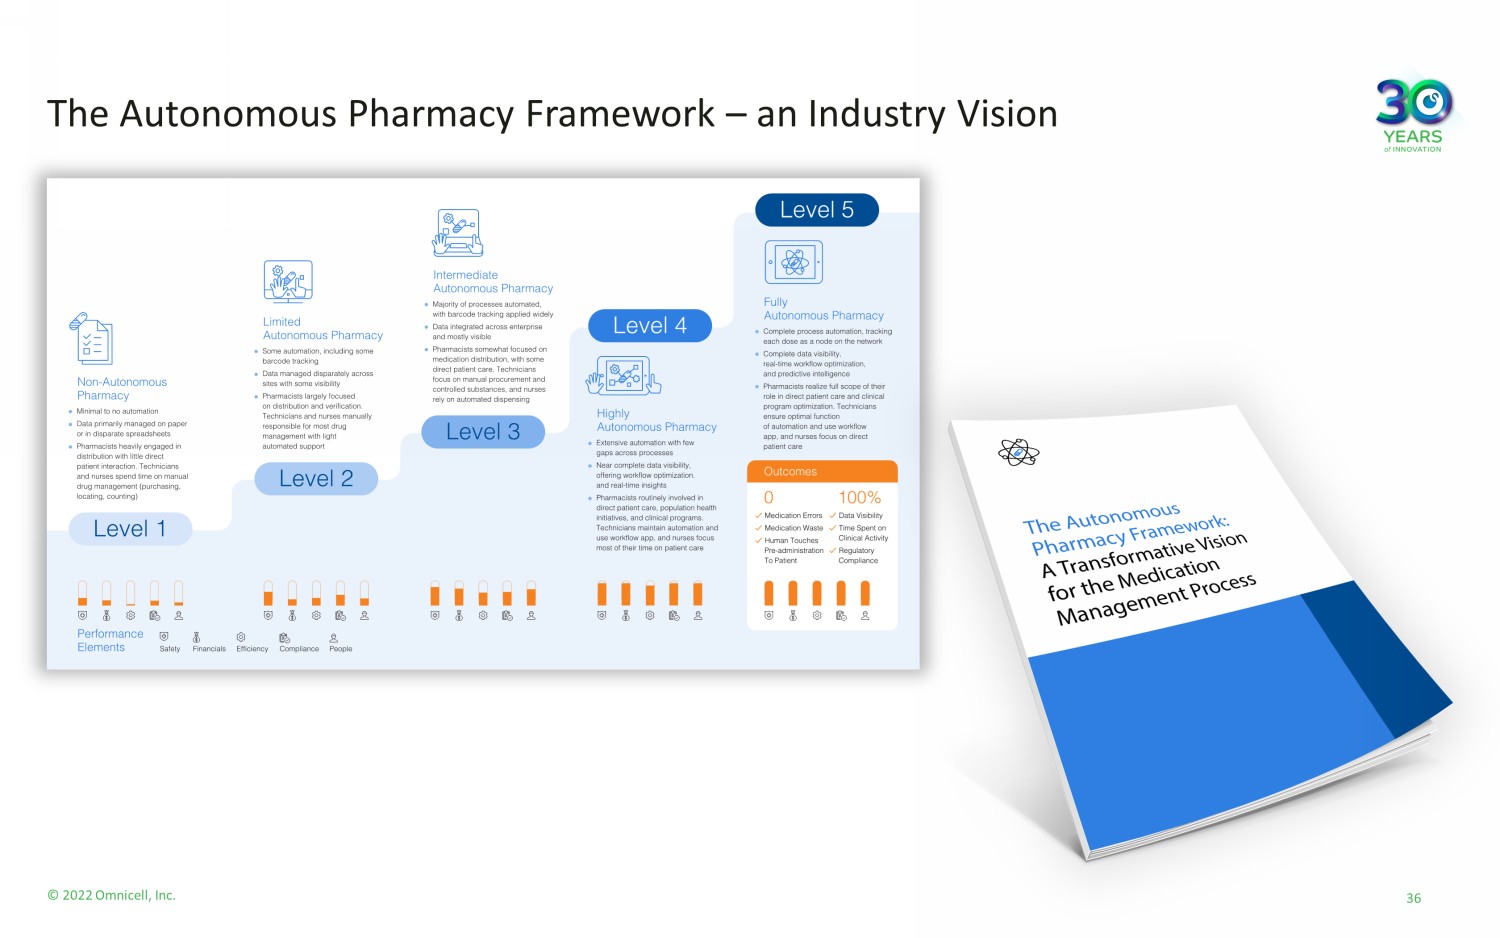
The Autonomous Pharmacy Framework – an Industry Vision 36 © 2022 Omnicell, Inc.
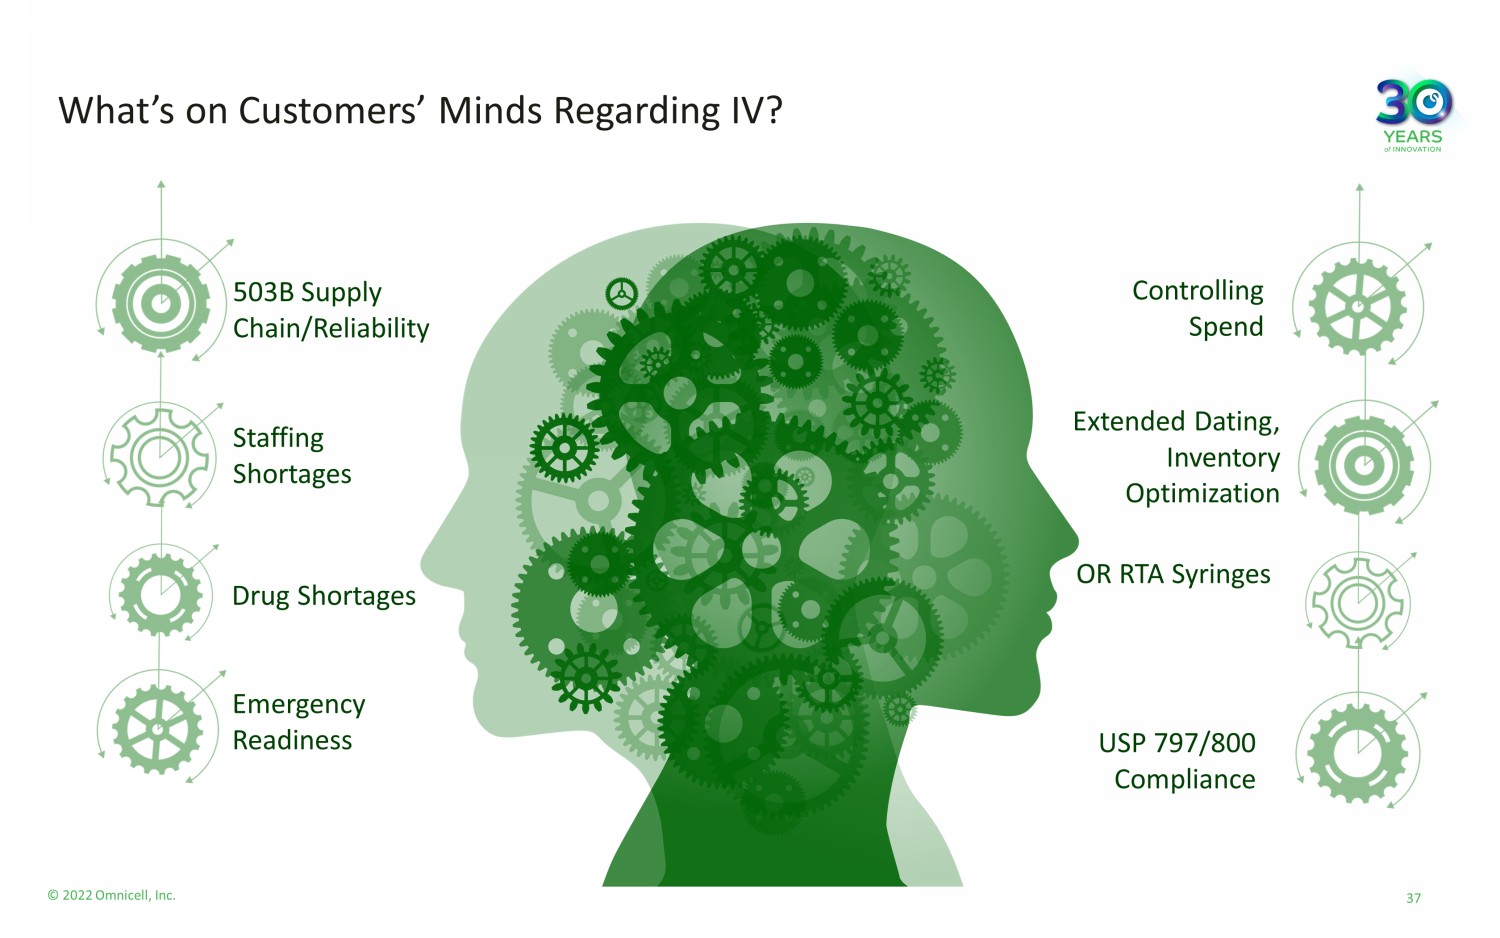
Extended Dating, Inventory O ptimization 503B Supply Chain/Reliability OR RTA Syringes Emergency Readiness Drug Shortages Staffing Shortages Controlling Spend USP 797/800 Compliance What’s on Customers’ Minds Regarding IV? 37 © 2022 Omnicell, Inc.

IV Compounding Service (IVCS) IVCS is a comprehensive solution designed to transform IV sterile compounding operations and drive value. Advanced Robotics Intelligent Analytics Expert Services Reduce Medication Cost Improve Labor Efficiency Reduce Stockouts Designed to: 38 © 2022 Omnicell, Inc.

39 We Perpetually Curate Knowledge to Improve our Services © 2022 Omnicell, Inc.
© 2022 Omnicell, Inc. Omnicell is uniquely positioned to transform the pharmacy care delivery model Pharmacy has big, important problems to solve Comprehensive solutions portfolio driving value Potential >$90B 10 - year TAM with a $5B annual recurring revenue market Advanced Services driving our long - term targets 40

An Introduction to EnlivenHealth® Danny Sanchez, Senior Vice President & General Manager, EnlivenHealth® 41 © 2022 Omnicell, Inc.
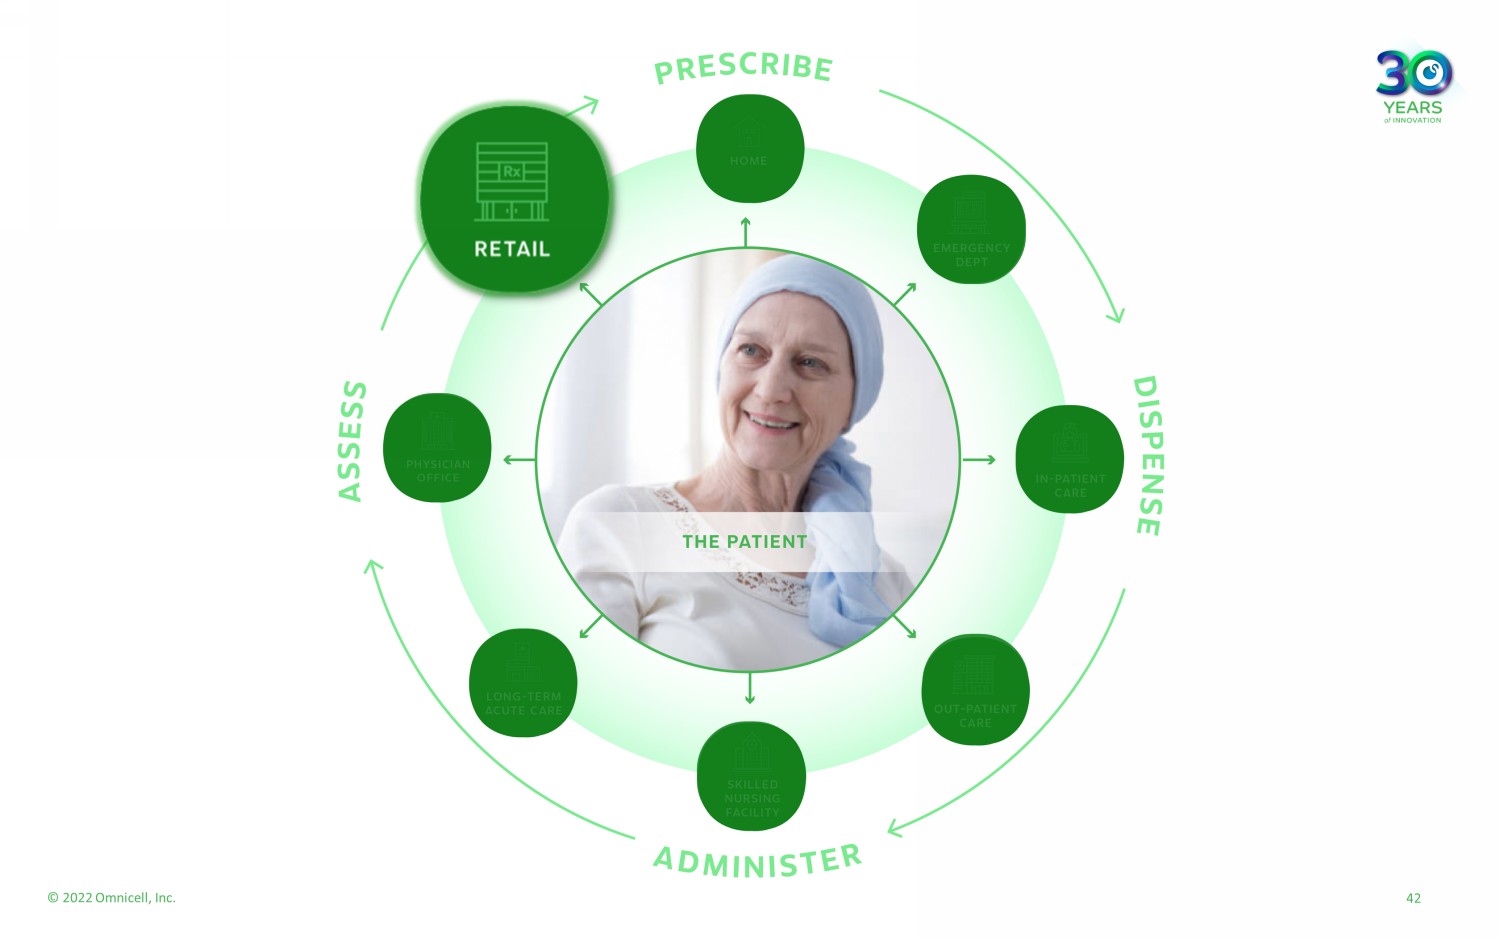
© 2022 Omnicell, Inc. 42
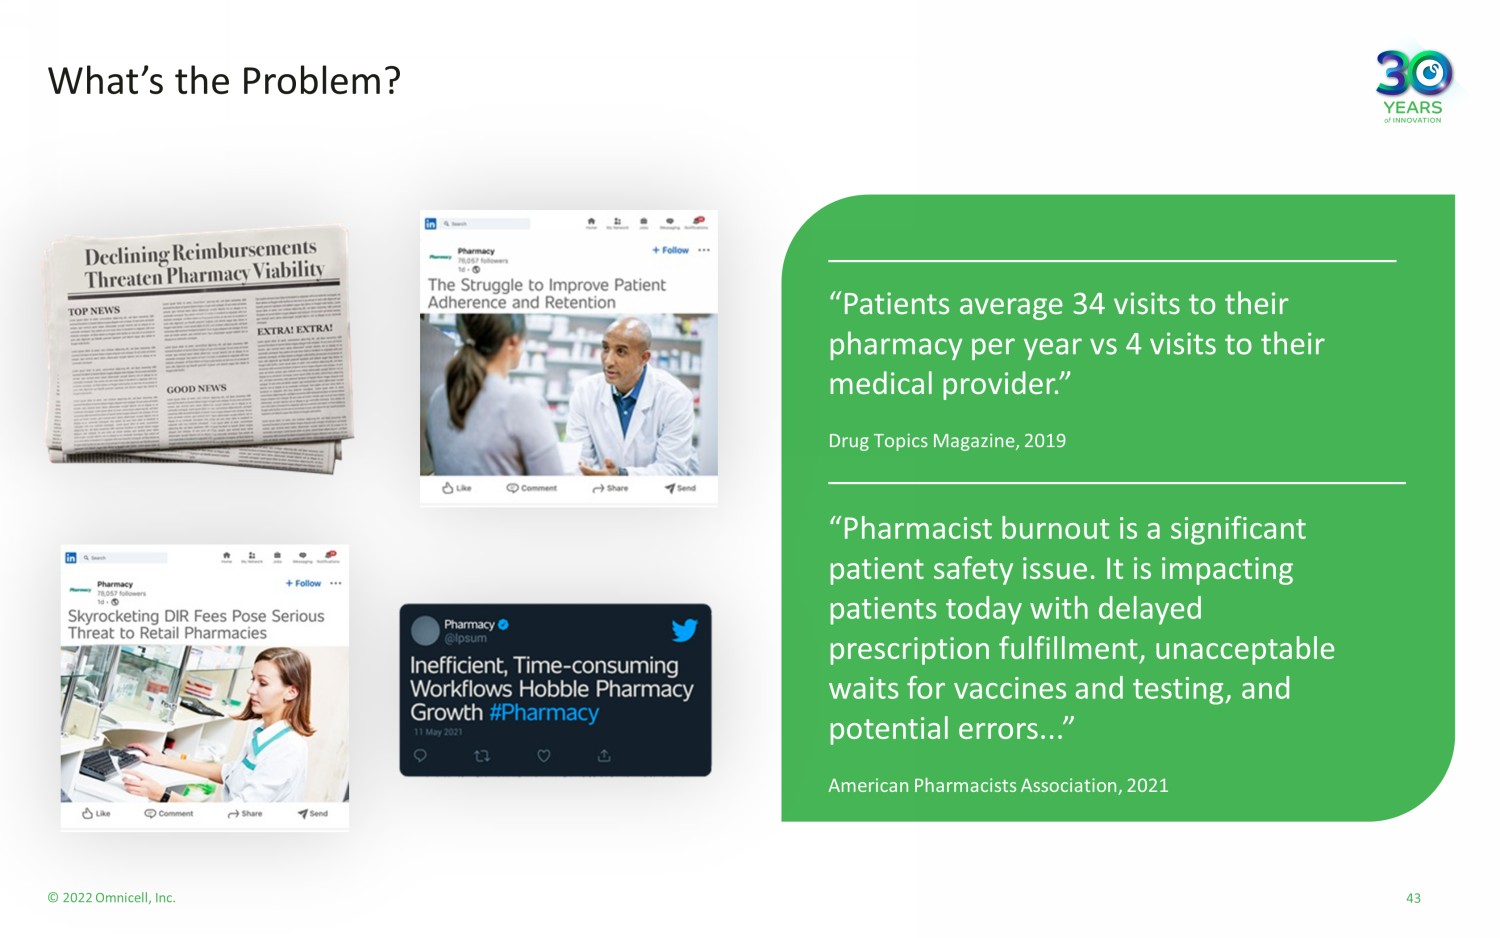
© 2022 Omnicell, Inc. What’s the Problem? “Patients average 34 visits to their pharmacy per year vs 4 visits to their medical provider .” Drug Topics Magazine, 2019 “Pharmacist burnout is a significant patient safety issue. It is impacting patients today with delayed prescription fulfillment, unacceptable waits for vaccines and testing, and potential errors...” American Pharmacists Association, 2021 43

© 2022 Omnicell, Inc. Why These Problems Persist in Retail Pharmacy Inefficient Pharmacy Workflows Constant Battle to Retain Patients Growing Demand for Clinical Services Poor Management of Pharmacy Financials 44 The Great Resignation: How Is It Impacting the Pharmacy Industry? Retail Pharmacy Has Reached the Breaking Point 44 © 2022 Omnicell, Inc.

© 2022 Omnicell, Inc. The Complete Pharmacy Solutions Platform 45 1. This solution achieved a nearly 20% reduction in inbound call transfers for an EnlivenHealth pharmacy customer based in the M idw est. This reduction translates into a significant decrease in phone interruptions for the pharmacy staff. Source: EnlivenHealth customer analytics. Spring/Summer 2022. • MedBill • Econcile • CentralPay • MyDataMart • Impact DIR (Direct & Indirect Remuneration) • Amplicare Clinical Solution • Medication Synchronization • CareScheduler • Medicare Match • Personalized Communications • Personalized Interactive Voice Response 1 • Conversational - Power ed Interactive Voice Response • Outbound Communications Financial Solutions Insights Analytics Solutions Patient Engagement Solutions Clinical Solutions

© 2022 Omnicell, Inc. EnlivenHealth Works With More than 50,000 Retail Pharmacies in the USA And thousands of independent pharmacies 46

© 2022 Omnicell, Inc. 47 By the Numbers: Accelerating Pharmacy Growth 0 10,000 20,000 30,000 40,000 50,000 60,000 2020 2021 2022 1. According to NCPDP DataQ 2022. 64,000 retail pharmacies in the U.S. 1 ~31% ~78% ~78% Number of Pharmacies EnlivenHealth Engages With

© 2022 Omnicell, Inc. Customer Case Study ANNUAL RECURRING REVENUE PLATFORM PURCHASED SOLUTIONS SOLUTIONS IN DISCUSSION Patient Engagement Solutions Patient Communications Next - Gen Communications Platform Clinical Solutions Medication Synchronization & CareScheduler Expanded Clinical Applications Financial Solutions Major Financial Solutions Insights Analytics Solutions New Analytics Solutions Multi - State Grocery Chain Current Share Remaining TAM 63% 37% 48

© 2022 Omnicell, Inc. National Chain: Prospect Example 49 1. Tier 1 is defined as a top 5 retail pharmacy chain Initial Products Other Interested Products Tier 1 1 Pharmacies utilizing our solutions 5 Solutions initially under contract $29M Annual TAM for current product portfolio $50M Booking value for initial contract — ratable over 5 years $14M Annual contract value at maturity Our partners are looking for one vendor to orchestrate and execute a medication management system, and the EnlivenHealth platform is delivering. Medication Synchronization Personalized Interactive Voice Response Outbound Communications E - Medical Guides & Medicare Match Medical Billing Conversational Interactive Voice Response Denotes solution from a recent acquisition
© 2022 Omnicell, Inc. EnlivenHealth Growth Strategies Leverage significant position with integration of FDS Amplicare and MarkeTouch Media “Land & expand”: Cross - sell full range of digital SaaS solutions Continue to cross - sell with Health System solutions 50

Capitalizing on the Opportunity Peter Kuipers, Executive Vice President & Chief Financial Officer 51 © 2022 Omnicell, Inc.

© 2022 Omnicell, Inc. Omnicell Business Model Evolution 2025 Business Model • Advanced Services targeted to be ~20 - 30% of total revenue by 2025 • Platform adoption, expansion, market share gains, next generation technologies, and wallet share expansion driving growth • Resilient, highly valuable revenue and free cash flows Pre - 2017 Business Model • Hardware focused • Growth driven by market share gains • Cash reinvested in development of hardware R&D Current Business Model • Emerging and scaling of Advanced Services offerings • Platform adoption, expansion, market share gains, and upgrade cycles driving growth • Strong balance sheet should enable transformation to new business model with expected higher gross margins, EBITDA, and free cash flows Total Revenue $1.9B – $2.0B Non - GAAP EBITDA Margin ~23% Non - GAAP Gross Margin 52% – 53% Total Revenue $0.7B Non - GAAP EBITDA Margin 13% Non - GAAP Gross Margin 47% Total Revenue $1.4B Non - GAAP EBITDA Margin ~ 18% Non - GAAP Gross Margin ~49% 2025 KEY TARGETS 2017 KEY STATISTICS 1 2022E MIDPOINT OF GUIDANCE 52 1. As adjusted for full retrospective adoption of ASC 606. DISCLAIMER: See Appendix for a reconciliation of 2017 non - GAAP revenues, 2017 non - GAAP gross margin and 2017 non - GAAP EBITDA mar gin to their most directly comparable GAAP financial measures. We do not provide a reconciliation of forward - looking non - GAAP measures to the comparable GAAP measures as these items are inherently uncertain and difficult to estimate and cannot be predicted without unreasonable effort.

© 2022 Omnicell, Inc. Driving Profitable Growth Through Disciplined Execution $ 1,900 – $ 2 ,000 2025E $1,133 2021A Expected Annual Non - GAAP Revenue ($ in Millions) $ 1,650 – $ 1,750 Continue to grow and expand within large existing customer base (sites & platform solutions ) Growth from next generation technologies Continue market share gains Drive innovation and continue to deliver the Autonomous Pharmacy Vision Value - enhancing M&A , which can present significant cross - sell opportunities 11 – 12% Organic CAGR Target (2021A – 25E) 1 14 – 15% Total CAGR Target (2021A – 25E) 1 53 1. CAGR is calculated based on midpoint of guidance previously provided in January 2021. DISCLAIMER: See Appendix for a reconciliation of 2021 non - GAAP revenues to its most directly comparable GAAP financial measures. We do not provide a reconciliation of forward - looking non - GAAP measures to the comparable GAAP measures as these items are inherently uncertain and difficult to estimate and cannot be predicted without unreasonable eff ort.
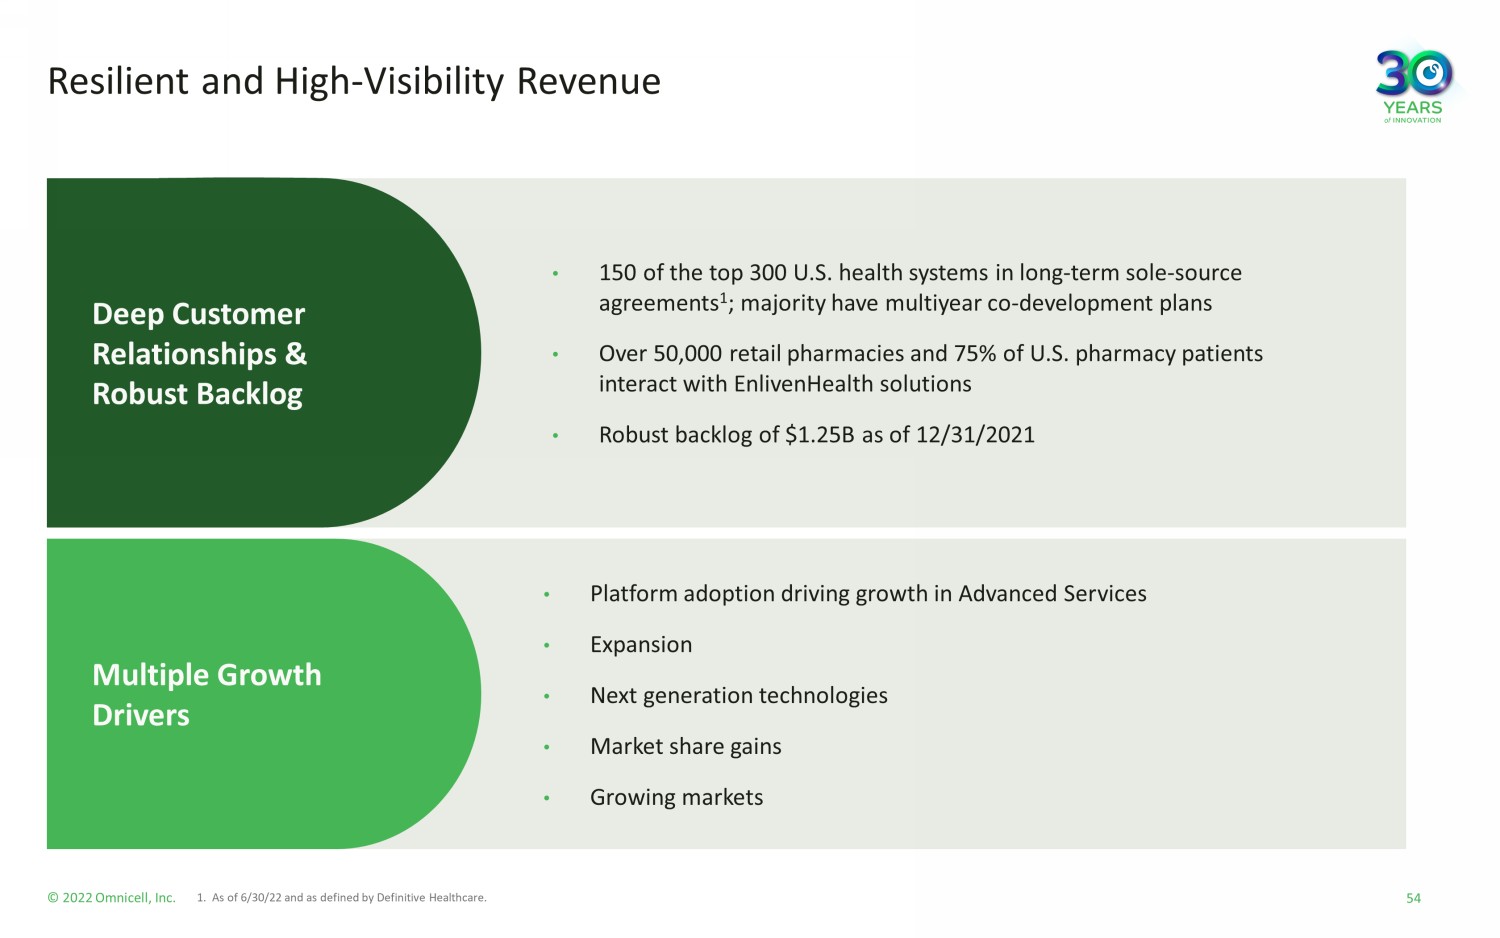
© 2022 Omnicell, Inc. Multiple Growth Drivers Resilient and High - Visibility Revenue Deep Customer Relationships & Robust Backlog • 150 of the top 300 U.S. health systems in long - term sole - source agreements 1 ; majority have multiyear co - development plans • Over 50,000 retail pharmacies and 75% of U.S. pharmacy patients interact with EnlivenHealth solutions • Robust backlog of $1.25B as of 12/31/2021 • Platform adoption driving growth in Advanced Services • Expansion • Next generation technologies • Market share gains • Growing markets 54 1. As of 6/30/22 and as defined by Definitive Healthcare.

Advanced Services Accelerating Recurring Revenue Growth 55 SaaS, Subscription Software & Tech - Enabled Services (% of Total Revenue) 6% 20 20 20 - 30% 202 5E Leveraging established channel and strong customer relationships Strong demand driven by increasing provider digitization and need to evolve medication supply chain Omnicell’s cloud - based services designed to enable better outcomes Subscription - based, recurring revenue streams Significantly increases core addressable market High margin unit economics ~ 50% 2020 - 2025 Targeted Revenue CAGR NOTE: Includes Central Pharmacy Dispense Services (XR2aaS), EnlivenHealth, IVCS Service, IV RIIS, Outpatient Pharmacy Service s, Omnicell 340B, Omnicell One Service and RobotRX Service (Pak Plus). 2021A 10% © 2022 Omnicell, Inc. Targeting 13% - 14% of revenue for 2022

© 2022 Omnicell, Inc. ~55% ~20% ~20 - 30% Business Model Transformation — Revenue Composition 65% 25% 10% Intelligent Connected Devices, Software Licenses & Other Revenue 2021A 2025E ~45% SaaS, Subscription Software & Tech - Enabled Services CAGR 1 14 – 15% total revenue CAGR Recurring Technical Services and Consumables Recurring SaaS, Subscription Software & Tech - Enabled Services 1 56 1. Includes Central Pharmacy Dispense Services (XR2aaS), EnlivenHealth, IVCS Service, IV RIIS, Outpatient Pharmacy Services, Omn ice ll 340B, Omnicell One Service and RobotRX Service (Pak Plus). 2. Bookings defined as minimum purchase commitments and does not contain estimates above the minimum purchase commitment over th e c ontract term. Bookings excludes Technical Services. DISCLAIMER: We do not provide a reconciliation of forward - looking non - GAAP measures to the comparable GAAP measures as these ite ms are inherently uncertain and difficult to estimate and cannot be predicted without unreasonable effort. Advanced Services bookings expected to account for >60% of total bookings by 2025 driving recurring revenue to ~45% of total revenue
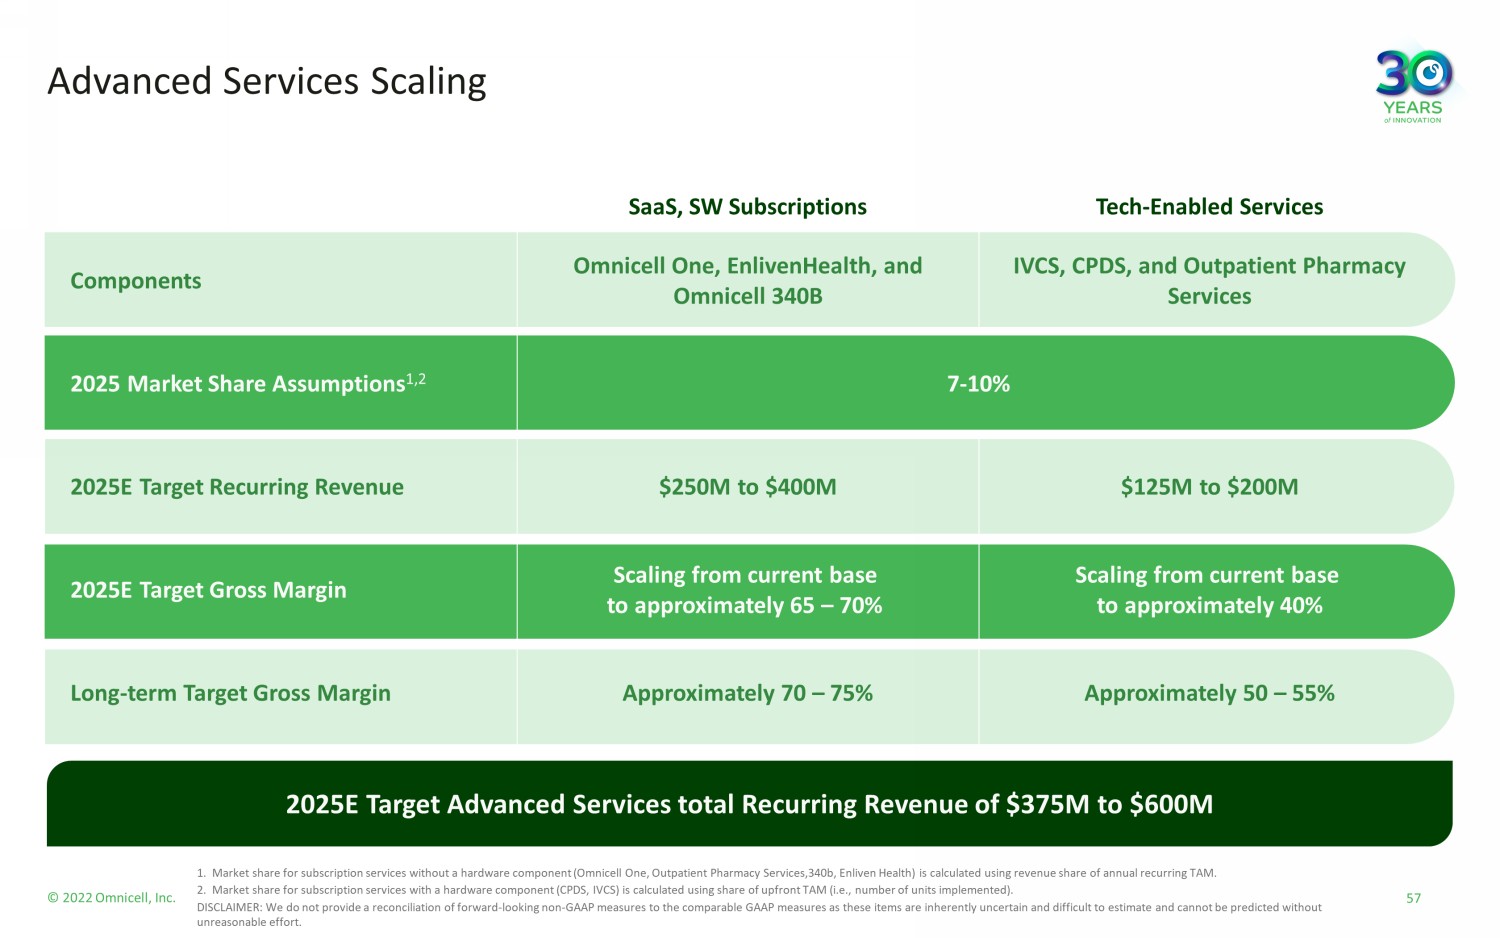
© 2022 Omnicell, Inc. SaaS, SW Subscriptions Tech - Enabled Services Components Omnicell One, EnlivenHealth, and Omnicell 340B IVCS, CPDS, and Outpatient Pharmacy Services 2025 Market Share Assumptions 1,2 7 - 10% 2025E Target Recurring Revenue $250M to $400M $125M to $200M 2025E Target Gross Margin Scaling from current base to approximately 65 – 70% Scaling from current base to approximately 40% Long - term Target Gross Margin Approximately 70 – 75% Approximately 50 – 55% Advanced Services Scaling 2025E Target Advanced Services total Recurring Revenue of $375M to $600M 57 1. Market share for subscription services without a hardware component (Omnicell One, Outpatient Pharmacy Services,340b, Enliven He alth) is calculated using revenue share of annual recurring TAM. 2. Market share for subscription services with a hardware component (CPDS, IVCS) is calculated using share of upfront TAM (i.e., nu mber of units implemented). DISCLAIMER: We do not provide a reconciliation of forward - looking non - GAAP measures to the comparable GAAP measures as these ite ms are inherently uncertain and difficult to estimate and cannot be predicted without unreasonable effort.

© 2022 Omnicell, Inc. SaaS and Software Subscriptions Model YEAR 1 YEAR 2 YEAR 3 YEAR 4 – 5 YEAR 1 YEAR 2 YEAR 3 YEAR 4 – 7 Advanced Services Business Model — Customer Example End of year 7 Net sales type lease balance: $0 Transition to Advanced Services business model provides: 1) Increased value to customers 2) Higher revenue versus previous model 3) Highly visible, recurring revenue & cash flow Cash Received Cash Received Cash Received Cash Received Cash Received Cash Received Cash Received Cash Received Net Sales Type Lease Run Down Net Sales Type Lease Run Down Net Sales Type Lease Run Down Net Sales Type Lease Run Down Recurring Advanced Services Revenue Recurring Advanced Services Revenue Recurring Advanced Services Revenue Recurring Advanced Services Revenue Recurring Advanced Services Revenue Product Revenue Recurring Advanced Services Revenue Recurring Advanced Services Revenue Recurring Advanced Services Revenue Tech - Enabled Services Model (IVCS and CPDS) 58
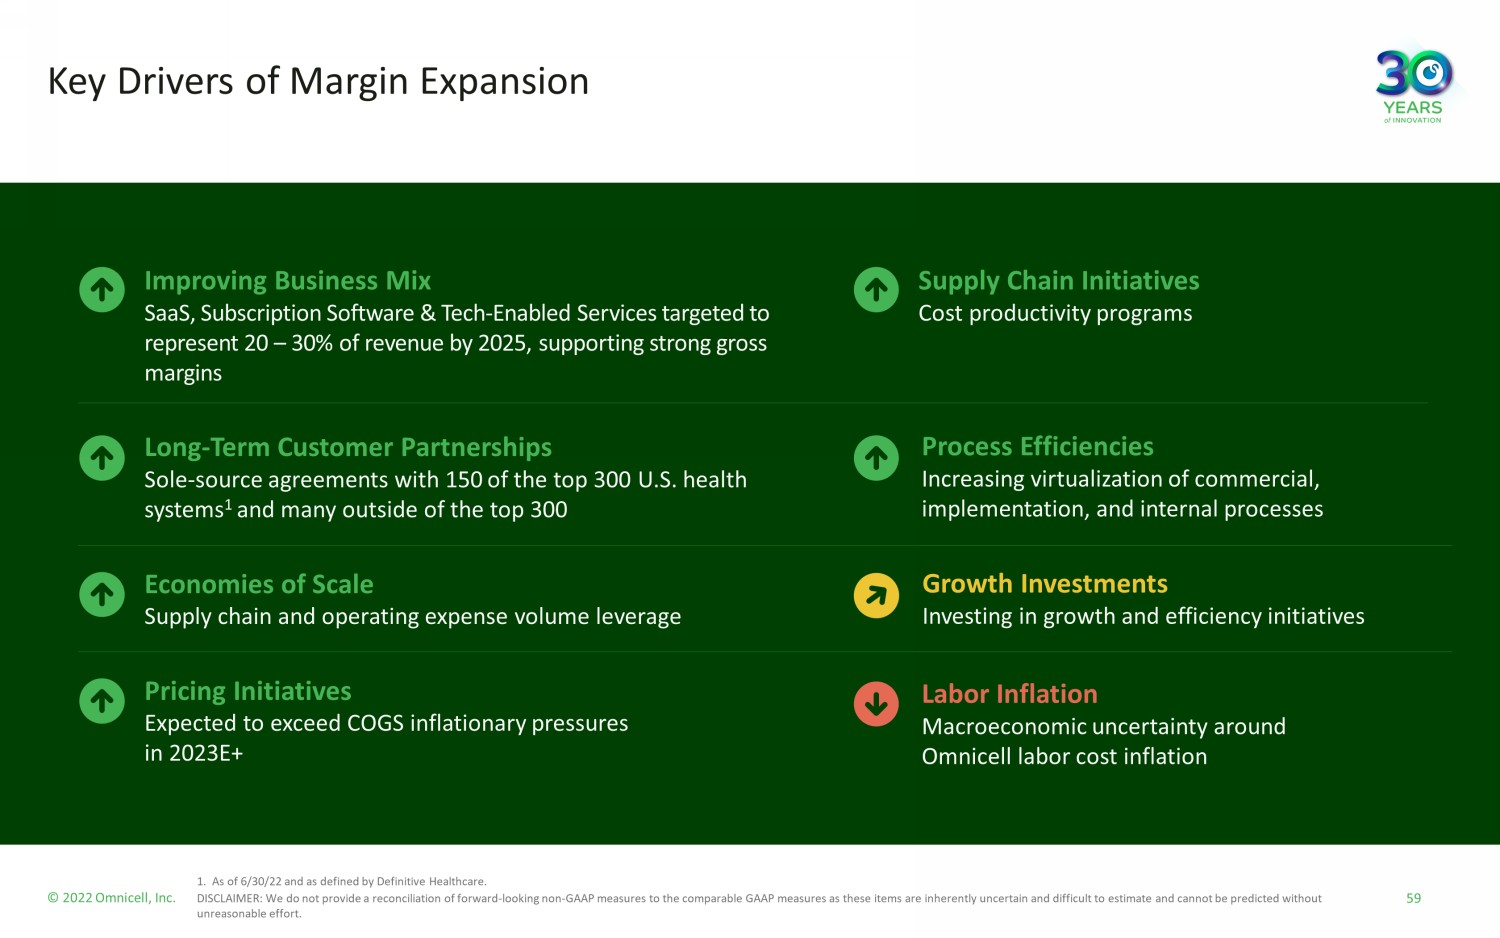
© 2022 Omnicell, Inc. Improving Business Mix SaaS, Subscription Software & Tech - Enabled Services targeted to represent 20 – 30% of revenue by 2025, supporting strong gross margins Long - Term Customer Partnerships Sole - source agreements with 150 of the top 300 U.S. health systems 1 and many outside of the top 300 Economies of Scale Supply chain and operating expense volume leverage Pricing Initiatives Expected to exceed COGS inflationary pressures in 2023E+ Key Drivers of Margin Expansion Supply Chain Initiatives Cost productivity programs Labor Inflation Macroeconomic uncertainty around Omnicell labor cost inflation Process Efficiencies Increasing virtualization of commercial, implementation, and internal processes Growth Investments Investing in growth and efficiency initiatives 59 1. As of 6/30/22 and as defined by Definitive Healthcare. DISCLAIMER: We do not provide a reconciliation of forward - looking non - GAAP measures to the comparable GAAP measures as these ite ms are inherently uncertain and difficult to estimate and cannot be predicted without unreasonable effort.
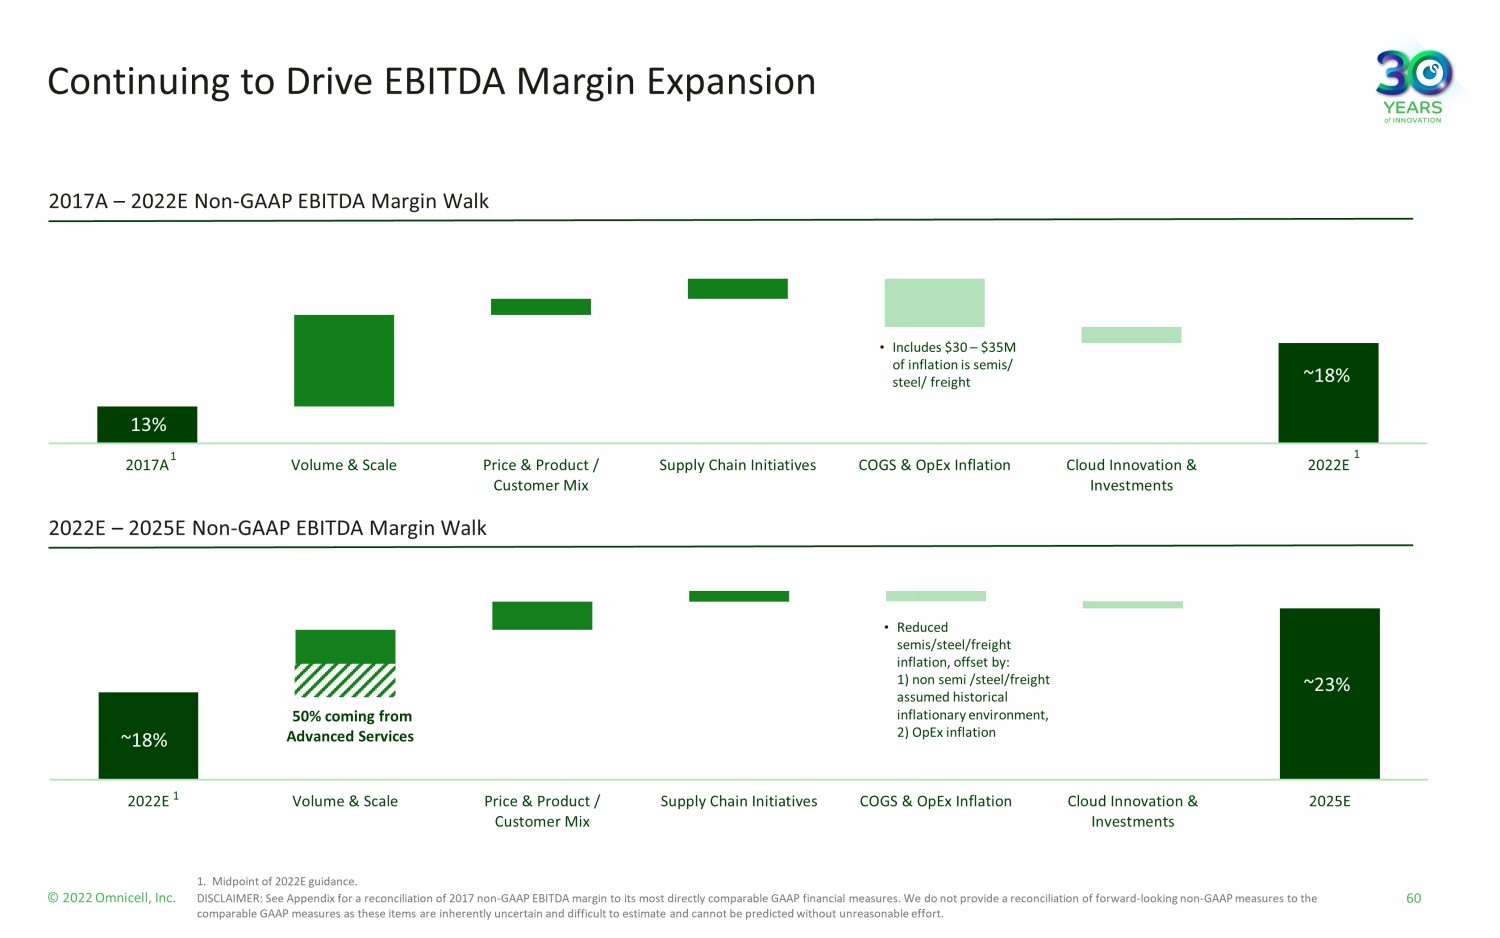
© 2022 Omnicell, Inc. 2022E Volume & Scale Price & Product / Customer Mix Supply Chain Initiatives COGS & OpEx Inflation Cloud Innovation & Investments 2025E 2017A Volume & Scale Price & Product / Customer Mix Supply Chain Initiatives COGS & OpEx Inflation Cloud Innovation & Investments 2022E Continuing to Drive EBITDA Margin Expansion 2022E – 2025E Non - GAAP EBITDA Margin Walk 1 1 2017A – 2022E Non - GAAP EBITDA Margin Walk 50% coming from Advanced Services 13% ~18% ~18% ~23% 1 • Reduced semis/steel/freight inflation, offset by: 1) non semi /steel/freight assumed historical inflationary environment, 2) OpEx inflation • Includes $30 – $35M of inflation is semis/ steel/ freight 60 1. Midpoint of 2022E guidance. DISCLAIMER: See Appendix for a reconciliation of 2017 non - GAAP EBITDA margin to its most directly comparable GAAP financial meas ures. We do not provide a reconciliation of forward - looking non - GAAP measures to the comparable GAAP measures as these items are inherently uncertain and difficult to estimate and cannot be predicted without un rea sonable effort.
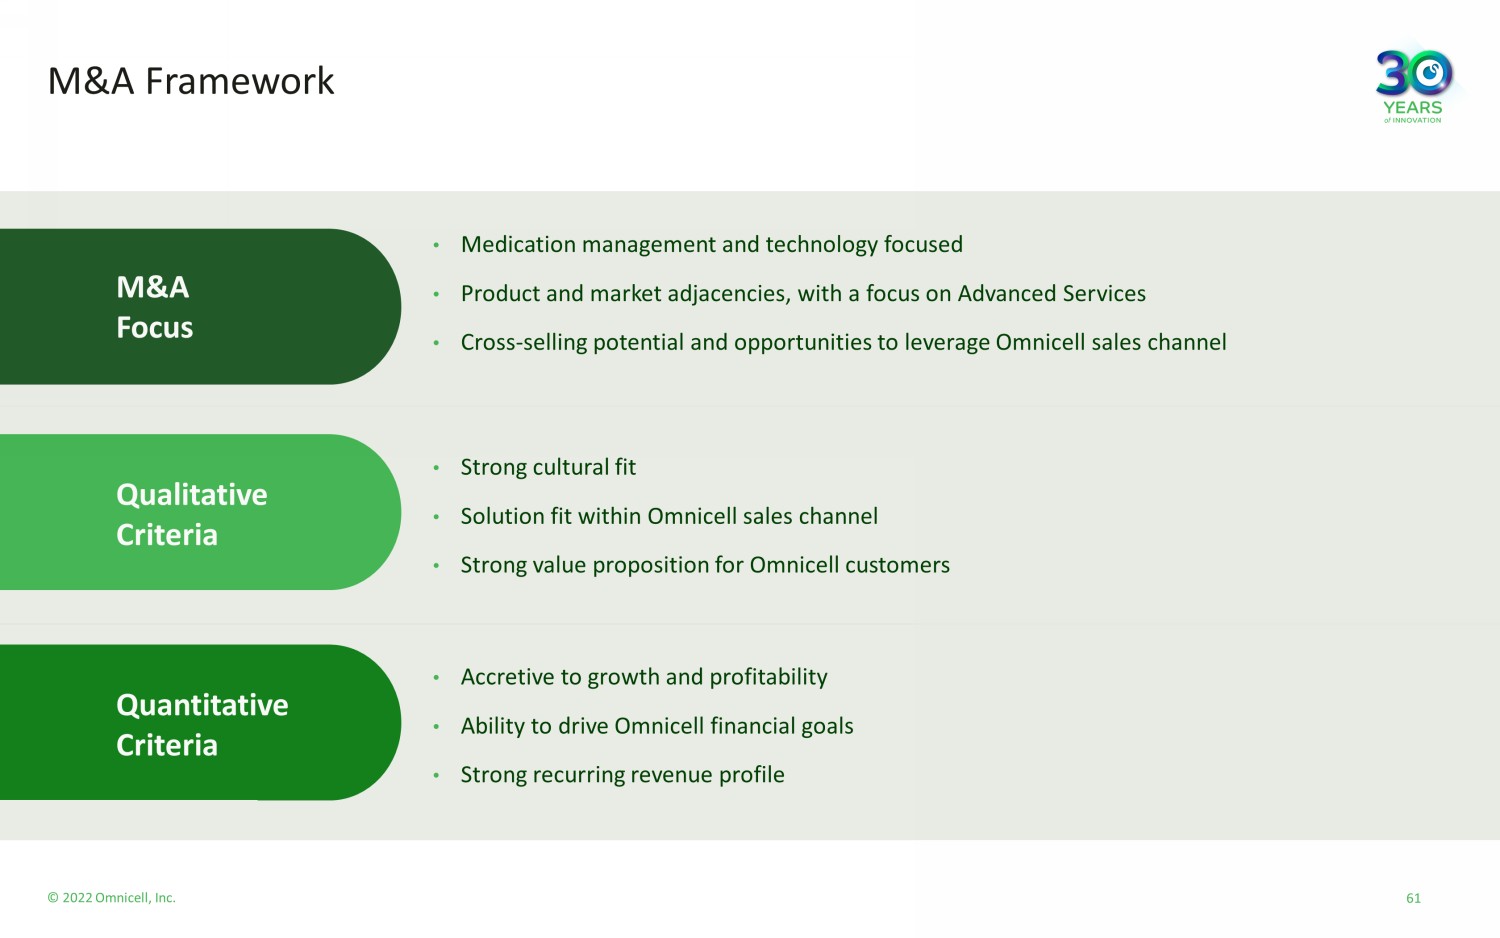
© 2022 Omnicell, Inc. M&A Framework • Medication management and technology focused • Product and market adjacencies, with a focus on Advanced Services • Cross - selling potential and opportunities to leverage Omnicell sales channel • Strong cultural fit • Solution fit within Omnicell sales channel • Strong value proposition for Omnicell customers • Accretive to growth and profitability • Ability to drive Omnicell financial goals • Strong recurring revenue profile M&A Focus Qualitative Criteria Quantitative Criteria 61
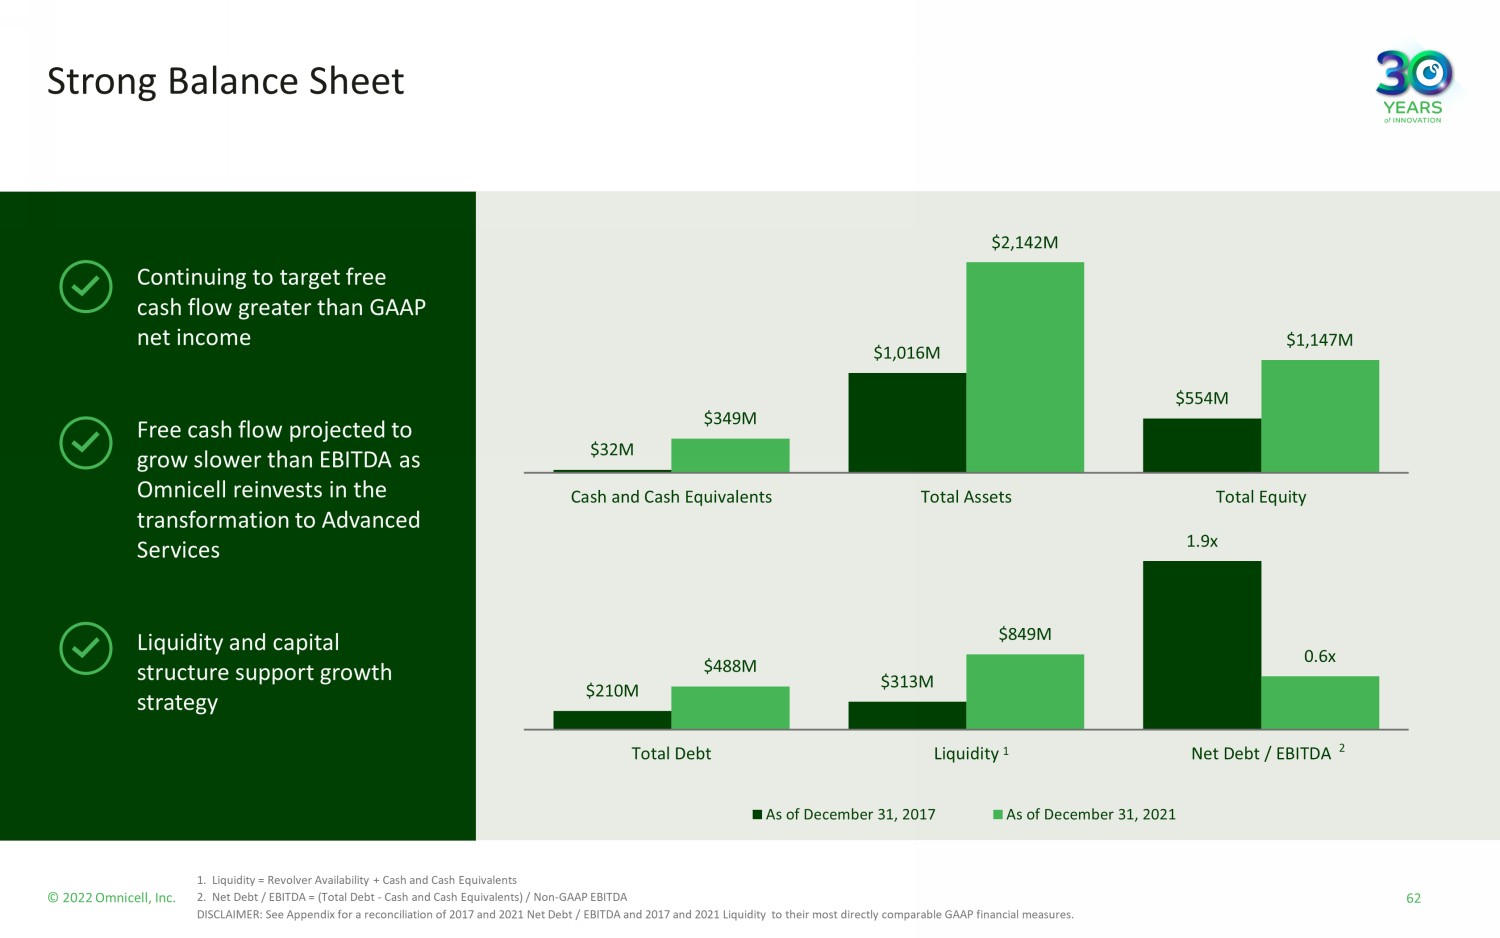
© 2022 Omnicell, Inc. Strong Balance Sheet Continuing to target free cash flow greater than GAAP net income Free cash flow projected to grow slower than EBITDA as Omnicell reinvests in the transformation to Advanced Services Liquidity and capital structure support growth strategy $32M $1,016M $554M $349M $2,142M $1,147M Cash and Cash Equivalents Total Assets Total Equity $210M $313M 1.9x $488M $849M 0.6x Total Debt Liquidity Net Debt / EBITDA As of December 31, 2017 As of December 31, 2021 1 2 62 1. Liquidity = Revolver Availability + Cash and Cash Equivalents 2. Net Debt / EBITDA = (Total Debt - Cash and Cash Equivalents) / Non - GAAP EBITDA DISCLAIMER: See Appendix for a reconciliation of 2017 and 2021 Net Debt / EBITDA and 2017 and 2021 Liquidity to their most d ire ctly comparable GAAP financial measures.

© 2022 Omnicell, Inc. Key Financial Takeaways Targeting to grow total revenue to $1.9 – $2.0B in 2025 Targeting 14 – 15% 2021 – 2025 total revenue CAGR (organic 11 – 12%, inorganic 3%) Targeting 2025 non - GAAP EBITDA margin of ~23% Advanced Services growth driving recurring revenue to ~45% of total revenue by 2025 and generating profitability at scale Targeting ~45% 2021 – 2025 revenue CAGR for SaaS, Subscription Software & Tech - Enabled Services Strong balance sheet to support transformation to Advanced Services With a track record of strong financial performance and disciplined execution, Omnicell is poised to drive profitable growth 63 DISCLAIMER: We do not provide a reconciliation of forward - looking non - GAAP measures to the comparable GAAP measures as these ite ms are inherently uncertain and difficult to estimate and cannot be predicted without unreasonable effort.

Conclusion Randall Lipps, Chairman, President, Chief Executive Officer & Founder 64 © 2022 Omnicell, Inc.
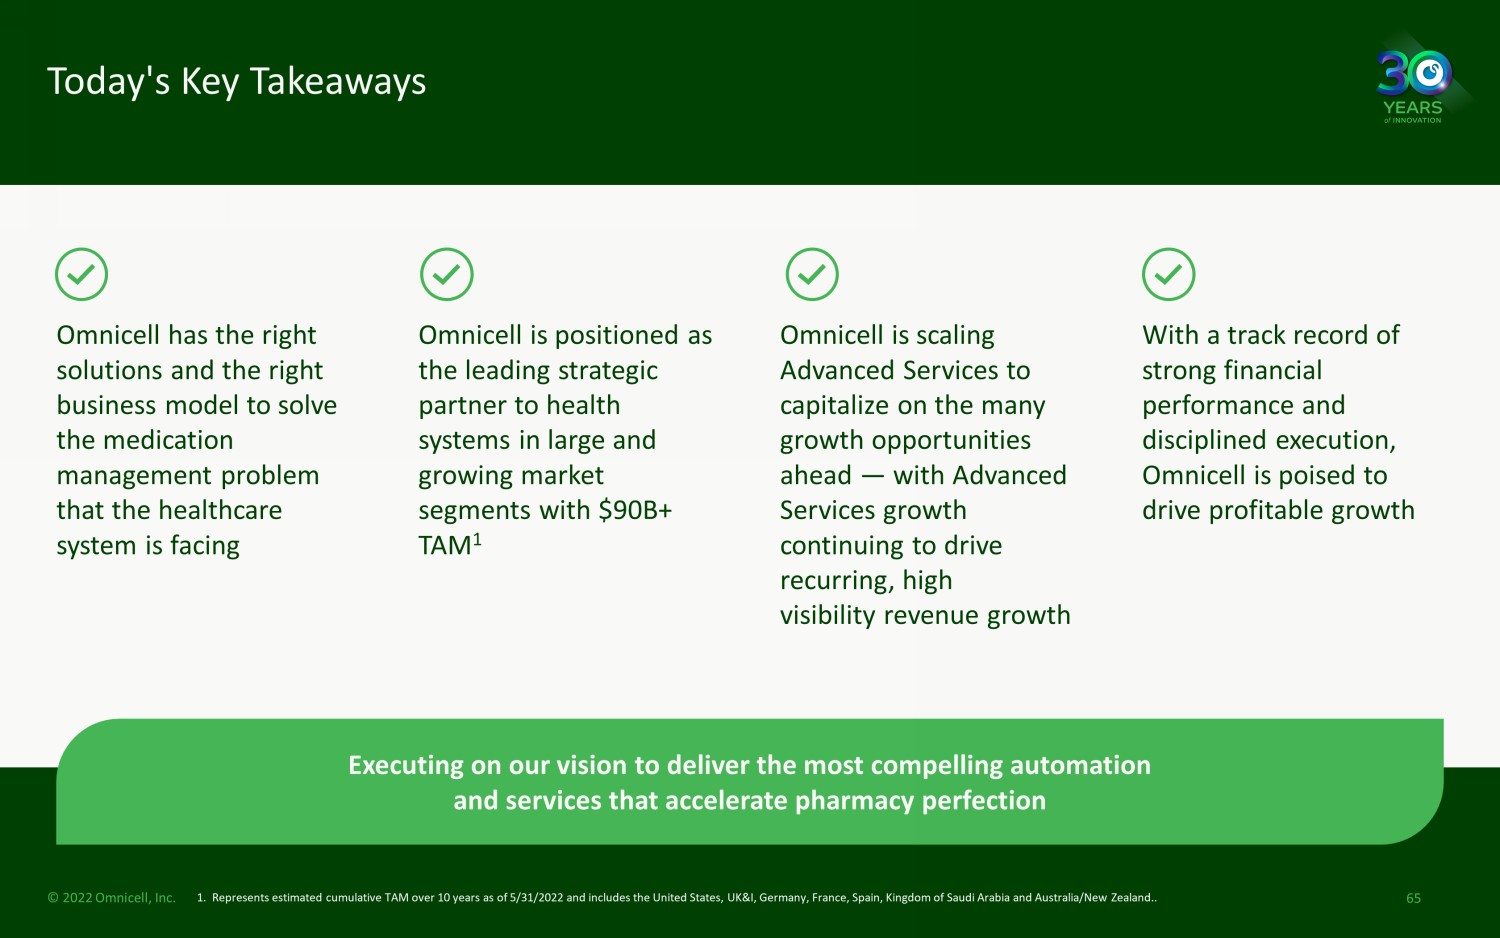
© 2022 Omnicell, Inc. Today's Key Takeaways 65 1. Represents estimated cumulative TAM over 10 years as of 5/31/2022 and includes the United States, UK&I, Germany, France, Spai n, Kingdom of Saudi Arabia and Australia/New Zealand.. Omnicell has the right solutions and the right business model to solve the medication management problem that the healthcare system is facing Omnicell is positioned as the leading strategic partner to health systems in large and growing market segments with $90B+ TAM 1 Omnicell is scaling Advanced Services to capitalize on the many growth opportunities ahead — with Advanced Services growth continuing to drive recurring, high visibility revenue growth With a track record of strong financial performance and disciplined execution, Omnicell is poised to drive profitable growth Executing on our vision to deliver the most compelling automation and services that accelerate pharmacy perfection

Q&A 66 © 2022 Omnicell, Inc.

67

Appendix 68 © 2022 Omnicell, Inc.
Sources Clinical • 20 - 30% of prescriptions never filled • Brody, J., “The Cost of Not Taking Your Medicine,” New York Times, April 17, 2017. • 1.3M ED visits from adverse drug events in outpatient settings • Centers for Disease Control and Prevention , “Adverse Drug Events in Adults,” cdc.gov, accessed June 18, 2020. • 350K hospitalizations from adverse drug events in outpatient settings • Watanabe JH, McInnis T, Hirsch JD. Cost of prescription drug - related morbidity and mortality. Annals of Pharmacotherapy. March 2 6, 2018. • 125K potentially preventable deaths from poor medication adherence • Rose, JZ, “Contributor: Medication Adherence Is Not a Zero - Sum Game,” American Journal of Managed Care, April 5, 2022. https://w ww.ajmc.com/view/contributor - medication - adherence - is - not - a - zero - sum - game Labor • #1 concern for hospital CEOs • American College of Healthcare Executives 2021 Top Issues Confronting Hospitals Survey, https://www.ache.org/learning - center/res earch/about - the - field/top - issues - confronting - hospitals. • 85% of hospitals are facing shortages for experienced pharmacy techs • ASHP National Survey of Pharmacy Practice in Hospital Settings: Clinical services and workforce — 2021 • 66% of hospitals are using pharmacists to cover tech responsibilities • ASHP National Survey of Pharmacy Practice in Hospital Settings: Clinical services and workforce — 2021 • 75% of pharmacists lack time to perform patient care/clinical activities • 2021 American Pharmacists Association (APhA) - National Alliance of State Pharmacy Associations (NASPA) National State - Based Pharm acy Workplace Survey, https://s3.amazonaws.com/filehost.pharmacist.com/CDN/PDFS/National%20State - Based%20Pharmacy%20Workplace%20Survey%20Final%20Report%20APRIL%202022 - FINAL.pdf?AWSAccessKeyId=AKIAYICBVAN2V7IWVG4T&Expires=1663548630&Signature=RzfjnkIB6yzMmHlAe9bmrZGhDlU%3D, April 2022, p. 12. Economic • Over $500B in costs related to nonoptimal medication therapy, including medication nonadherence • Watanabe JH, McInnis T, Hirsch JD. Cost of prescription drug - related morbidity and mortality. Annals of Pharmacotherapy. March 2 6, 2018. • $576B in total U.S. drug spend (13% of total healthcare spend) • Tichy EM, et al. “ National trends in prescription drug expenditures and projections for 2022,” A m J Health - Syst Pharm. 2022; 79: 1158 - 1172 • $316B in specialty drug spend • IQVIA “Global Medicine Spending and Usage Trends to 2025” (2021), HDA “2020 Specialty Pharmacy Facts, Figures, and Trends,” H BG Analysis • $144B in hospital nursing spend • U.S. Bureau of Labor Statistics, April, 27, 2020 (https://www.bls.gov/opub/ted/2020/registered - nurses - made - up - 30 - percent - of - hosp ital - employment - in - may - 2019.htm#:~:text=Registered%20nurses%20was%20by%20far,percent%20of%20total%20hospital%20employment.) • $46.5B in pharmacy labor spend • Drug Channels Institute, The 2021 Economic Report on U.S. Pharmacies and Pharmacy Benefit Managers, March 2021 • U.S. Bureau of Labor Statistics, May 2021 (https://www.bls.gov/oes/current/oes292052.htm) 69

© 2022 Omnicell, Inc. 70 2021 2017 (a) 1,132,018$ 712,714$ Acquisition accounting impact related to deferred revenues 780 1,252 1,132,798$ 713,966$ 554,653$ 318,637$ 49.0% 44.7% Share-based compensation expense 7,994 3,562 Amortization of acquired intangibles 11,438 11,488 Acquisition accounting impact related to deferred revenues 780 1,252 Inventory fair value adjustments - - Acquisition-related expenses - - Severance-related expenses 389 2,001 575,254$ 336,940$ 50.8% 47.2% 47,943 38,712 45,899 38,712 1.62$ 0.79$ Tax impact of IP restructuring (0.14) - Tax reform benefit impact - (0.52) Share-based compensation expense 1.16 0.56 Amortization of acquired intangibles 0.58 0.67 Acquisition accounting impact related to deferred revenues 0.02 0.03 Inventory fair value adjustments - - Acquisition-related expenses 0.24 0.04 Severance-related and other expenses 0.07 0.15 Amortization of debt issuance costs 0.07 - Amortization of discount on convertible senior notes 0.41 - Non-GAAP dilutive shares impact from convertible note hedge transaction (c) 0.07 - Tax effect of the adjustments above (b) (0.29) (0.31) 3.81$ 1.41$ 77,849$ 30,518$ Share-based compensation expense 53,160 21,857 Interest (income) and expense, net 161 6,072 Depreciation and amortization expense 72,990 51,511 Acquisition accounting impact related to deferred revenues 780 1,252 Inventory fair value adjustments - - Acquisition-related expenses 11,150 1,715 Severance-related and other expenses 3,321 4,752 Amortization of debt issuance costs 3,440 - Amortization of discount on convertible senior notes 18,608 - Income tax benefit (11,842) (26,006) 229,617$ 91,671$ 20.3% 12.8% Reconciliation of GAAP net income to non-GAAP EBITDA (d) : GAAP net income Non-GAAP EBITDA Non-GAAP EBITDA margin (non-GAAP EBITDA as a % of total non-GAAP revenues) Non-GAAP gross margin Reconciliation of GAAP net income per share - diluted to non-GAAP net income per share - diluted: Shares - diluted GAAP Shares - diluted Non-GAAP (c) GAAP net income per share - diluted Non-GAAP net income per share - diluted Reconciliation of GAAP revenues to non-GAAP revenues: Non-GAAP gross profit Year Ended December 31, GAAP revenues Non-GAAP revenues Reconciliation of GAAP gross profit to non-GAAP gross profit: GAAP gross profit GAAP gross margin Omnicell, Inc. Reconciliation of GAAP to Non-GAAP (Unaudited, in thousands, except per share data and percentage) _________________________________________________ (a) As adjusted for full retrospective adoption of ASC 606. (b) Tax effects calculated for all adjustments except share-based compensation expense, using an estimated annual effective tax rate of 21% for fiscal year 2021, and 35% for year 2017. (c) For the year ended December 31, 2021, non-GAAP diluted shares exclude approximately 2.0 million shares related to the impact of dilutive convertible senior notes for which the Company is economically hedged through its anti-dilutive convertible note hedge transaction. (d) Defined as earnings before interest income and expense, taxes, depreciation, amortization, and share- based compensation, as well as excluding certain other non-GAAP adjustments. Year Ended December 31, 2021 Convertible senior notes, net/GAAP Net income 6.3 Convertible senior notes, net 488,152 Cash and cash equivalents (349,051) Net debt 139,101 Net debt/Non-GAAP EBITDA 0.6 Year Ended December 31, 2017 Total debt, net/GAAP Net income 6.9 Long-term debt, current portion, net 15,208 Long-term debt, net 194,917 Total debt, net 210,125 Cash and cash equivalents (32,424) Net debt 177,701 Net debt/Non-GAAP EBITDA 1.9
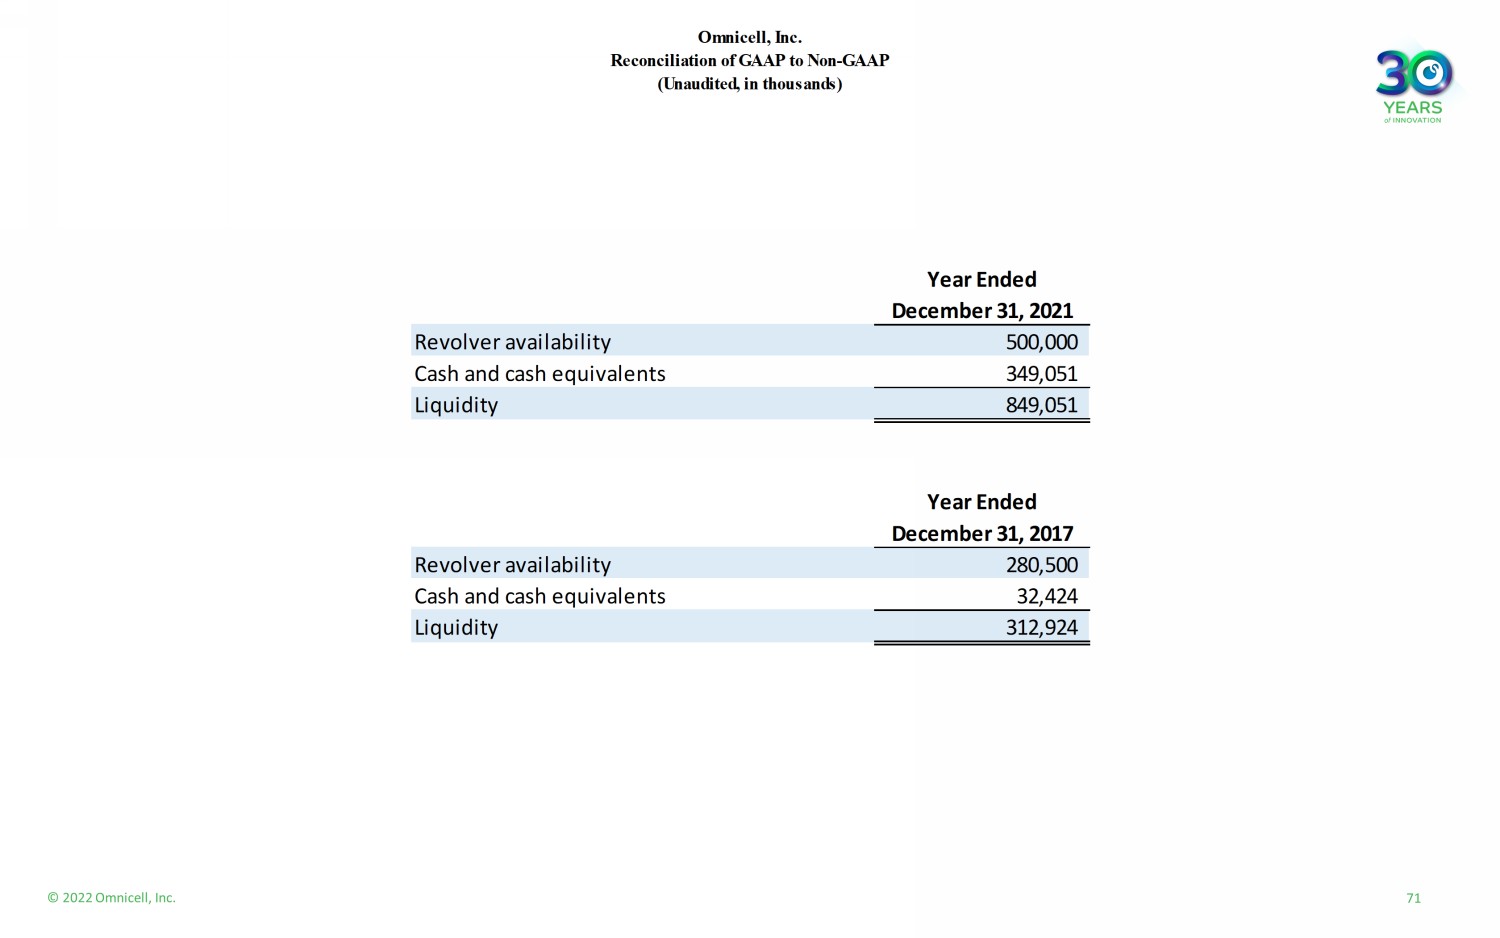
© 2022 Omnicell, Inc. 71 Omnicell, Inc. Reconciliation of GAAP to Non-GAAP (Unaudited, in thousands) Year Ended December 31, 2021 Revolver availability 500,000 Cash and cash equivalents 349,051 Liquidity 849,051 Year Ended December 31, 2017 Revolver availability 280,500 Cash and cash equivalents 32,424 Liquidity 312,924