WASHINGTON, D. C. 20549
FEBRUARY 28, 2013 Semiannual Report to Shareholders |
| |
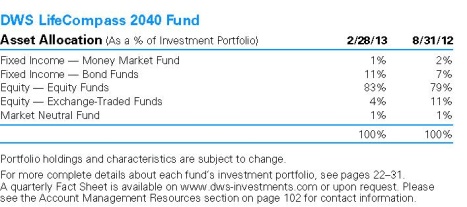
DWS Target Date Series DWS LifeCompass Retirement Fund DWS LifeCompass 2015 Fund DWS LifeCompass 2020 Fund DWS LifeCompass 2030 Fund DWS LifeCompass 2040 Fund |
|
Contents
19 Portfolio Management Team 31 Statements of Assets and Liabilities 35 Statements of Operations 37 Statements of Changes in Net Assets 61 Notes to Financial Statements 84 Information About Each Fund's Expenses 90 Investment Management Agreement Approval 97 Summary of Management Fee Evaluation by Independent Fee Consultant 101 Account Management Resources |
This report must be preceded or accompanied by a prospectus. To obtain a summary prospectus, if available, or prospectus for any of our funds, refer to the Account Management Resources information provided in the back of this booklet. We advise you to consider each fund's objectives, risks, charges and expenses carefully before investing. The summary prospectus and prospectus contain this and other important information about the fund. Please read the prospectus carefully before you invest.
Although allocation among different asset categories generally limits risk, portfolio management may favor an asset category that underperforms other assets or markets as a whole. Bond investments are subject to interest-rate and credit risks. When interest rates rise, bond prices generally fall. Credit risk refers to the ability of an issuer to make timely payments of principal and interest. Investing in derivatives entails special risks relating to liquidity, leverage and credit that may reduce returns and/or increase volatility. Because exchange-traded funds ("ETFs") trade on a securities exchange, their shares may trade at a premium or discount to their net asset value. ETFs also incur fees and expenses so they may not fully match the performance of the indexes they are designed to track. Investing in foreign securities, particularly those of emerging markets, presents certain risks, such as currency fluctuations, political and economic changes, and market risks. The fund may lend securities to approved institutions. Stocks may decline in value. See the prospectus for details.
Target date funds are designed for investors seeking to meet their respective investment goals, such as retirement, around the target date year. The target date is the approximate date when investors plan to start withdrawing their money in the fund. As the fund approaches its target year, the fund will decrease its emphasis on growth of capital and increase its emphasis on current income. The principal value of the funds is not guaranteed at any time, including at the target date. There is no guarantee that the fund will provide adequate income at and through retirement.
DWS Investments is part of the Deutsche Asset & Wealth Management division of Deutsche Bank AG.
NOT FDIC/NCUA INSURED NO BANK GUARANTEE MAY LOSE VALUE NOT A DEPOSIT NOT INSURED BY ANY FEDERAL GOVERNMENT AGENCY
Dear Investor:
As the U.S. and global economies regain their footing, economists are cautiously looking to a less erratic year for the financial markets in 2013. In the U.S. specifically, positive trends in areas such as housing starts and job creation suggest ongoing recovery, albeit at a relatively mild pace. Supporting this view, Larry Adam, Deutsche Asset & Wealth Management's Chief Investment Strategist for Wealth Management, cites the potential for increased bank lending, a rise in business spending, and improved consumer confidence as underlying forces that may act as catalysts for continued positive growth.
Still, critical issues are yet to be resolved. As Washington wrangles with debt concerns, spending, and monetary and fiscal policy, a fair amount of uncertainty lingers. Despite gains in the broad stock market, sluggish growth and historically low interest rates continue to pose a challenge to investors seeking a strategy for growth or retirement income.
Against this backdrop, what can you do? Stay focused. Second-guessing investment decisions based on headlines, short-term market fluctuations or emotion is never a reliable strategy. Also, remember that the investment professionals who manage your DWS fund bring a wealth of experience over a variety of market cycles, along with access to a broad network of research and analytical resources.
At Deutsche Asset & Wealth Management we embrace the concept of discipline and the value of maintaining a long-term view. We urge you to do the same.
Best regards,
Douglas Beck, CFA President, DWS Funds |
Performance Summaries February 28, 2013 (Unaudited)
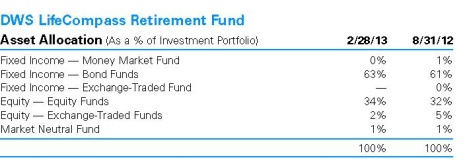
DWS LifeCompass Retirement Fund
| Class A | | 6-Month‡ | | | 1-Year | | | 5-Year | | | 10-Year | |
Average Annual Total Returns as of 2/28/13 | |
| Unadjusted for Sales Charge | | | 4.08 | % | | | 5.76 | % | | | 2.66 | % | | | 4.88 | % |
| Adjusted for the Maximum Sales Charge (max 5.75% load) | | | -1.91 | % | | | -0.32 | % | | | 1.45 | % | | | 4.27 | % |
S&P® Target Date Retirement Income Index† | | | 3.61 | % | | | 5.58 | % | | | 4.20 | % | | | 5.69 | % |
Average Annual Total Returns as of 12/31/12 (most recent calendar quarter end) | |
| Unadjusted for Sales Charge | | | | | | | 9.22 | % | | | 1.60 | % | | | 4.59 | % |
| Adjusted for the Maximum Sales Charge (max 5.75% load) | | | | | | | 2.94 | % | | | 0.40 | % | | | 3.98 | % |
S&P® Target Date Retirement Income Index† | | | | | | | 7.51 | % | | | 3.37 | % | | | 5.48 | % |
| Class B | | 6-Month‡ | | | 1-Year | | | 5-Year | | | 10-Year | |
Average Annual Total Returns as of 2/28/13 | |
| Unadjusted for Sales Charge | | | 3.77 | % | | | 5.15 | % | | | 1.90 | % | | | 4.10 | % |
| Adjusted for the Maximum Sales Charge (max 4.00% CDSC) | | | -0.23 | % | | | 2.15 | % | | | 1.72 | % | | | 4.10 | % |
S&P® Target Date Retirement Income Index† | | | 3.61 | % | | | 5.58 | % | | | 4.20 | % | | | 5.69 | % |
Average Annual Total Returns as of 12/31/12 (most recent calendar quarter end) | |
| Unadjusted for Sales Charge | | | | | | | 8.48 | % | | | 0.85 | % | | | 3.82 | % |
| Adjusted for the Maximum Sales Charge (max 4.00% CDSC) | | | | | | | 5.48 | % | | | 0.67 | % | | | 3.82 | % |
S&P® Target Date Retirement Income Index† | | | | | | | 7.51 | % | | | 3.37 | % | | | 5.48 | % |
| Class C | | 6-Month‡ | | | 1-Year | | | 5-Year | | | 10-Year | |
Average Annual Total Returns as of 2/28/13 | |
| Unadjusted for Sales Charge | | | 3.77 | % | | | 5.06 | % | | | 1.90 | % | | | 4.11 | % |
| Adjusted for the Maximum Sales Charge (max 1.00% CDSC) | | | 2.77 | % | | | 5.06 | % | | | 1.90 | % | | | 4.11 | % |
S&P® Target Date Retirement Income Index† | | | 3.61 | % | | | 5.58 | % | | | 4.20 | % | | | 5.69 | % |
Average Annual Total Returns as of 12/31/12 (most recent calendar quarter end) | |
| Unadjusted for Sales Charge | | | | | | | 8.49 | % | | | 0.85 | % | | | 3.82 | % |
| Adjusted for the Maximum Sales Charge (max 1.00% CDSC) | | | | | | | 8.49 | % | | | 0.85 | % | | | 3.82 | % |
S&P® Target Date Retirement Income Index† | | | | | | | 7.51 | % | | | 3.37 | % | | | 5.48 | % |
DWS LifeCompass Retirement Fund
| Class S | | 6-Month‡ | | | 1-Year | | | 5-Year | | | 10-Year | |
Average Annual Total Returns as of 2/28/13 | |
| No Sales Charges | | | 4.30 | % | | | 6.12 | % | | | 2.92 | % | | | 5.15 | % |
S&P® Target Date Retirement Income Index† | | | 3.61 | % | | | 5.58 | % | | | 4.20 | % | | | 5.69 | % |
Average Annual Total Returns as of 12/31/12 (most recent calendar quarter end) | |
| No Sales Charges | | | | | | | 9.50 | % | | | 1.86 | % | | | 4.86 | % |
S&P® Target Date Retirement Income Index† | | | | | | | 7.51 | % | | | 3.37 | % | | | 5.48 | % |
Performance in the Average Annual Total Returns table above and the Growth of an Assumed $10,000 Investment line graph that follows is historical and does not guarantee future results. Investment return and principal fluctuate so your shares may be worth more or less when redeemed. Current performance may differ from performance data shown. Please visit www.dws-investments.com for the Fund's most recent month-end performance. Fund performance includes reinvestment of all distributions. Unadjusted returns do not reflect sales charges and would have been lower if they had.
The gross expense ratios of the Fund, as stated in the fee table of the prospectus dated December 1, 2012 are 1.34%, 2.08%, 2.03% and 1.05% for Class A, Class B, Class C and Class S shares, respectively, and may differ from the expense ratios disclosed in the Financial Highlights tables in this report. These expense ratios include net expenses of the underlying funds in which the Fund invests.
Index returns do not reflect any fees or expenses and it is not possible to invest directly into an index.
Performance figures do not reflect the deduction of taxes that a shareholder would pay on fund distributions or the redemption of fund shares.
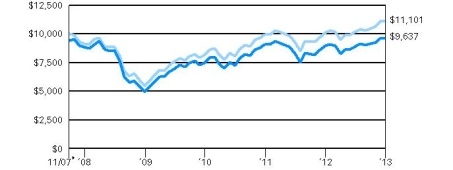
DWS LifeCompass Retirement Fund
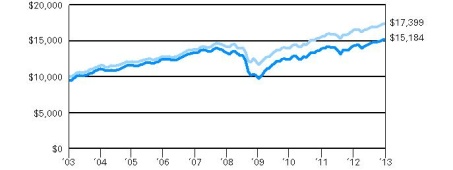
Growth of an Assumed $10,000 Investment (Adjusted for Maximum Sales Charge) |
|
|
| Yearly periods ended February 28 |
The Fund's growth of an assumed $10,000 investment is adjusted for the maximum sales charge of 5.75%. This results in a net initial investment of $9,425.
The growth of $10,000 is cumulative.
Performance of other share classes will vary based on the sales charges and the fee structure of those classes.
† The S&P Target Date Retirement Income Index seeks to represent investment opportunity generally available in target date funds through an asset allocation which targets an immediate retirement allocation.
‡ Total returns shown for periods less than one year are not annualized.
| | | Class A | | | Class B | | | Class C | | | Class S | |
| Net Asset Value | |
| 2/28/13 | | $ | 11.93 | | | $ | 11.94 | | | $ | 11.93 | | | $ | 11.93 | |
| 8/31/12 | | $ | 11.58 | | | $ | 11.58 | | | $ | 11.57 | | | $ | 11.57 | |
Distribution Information as of 2/28/13 | |
| Income Dividends, Six Months | | $ | .12 | | | $ | .08 | | | $ | .07 | | | $ | .13 | |
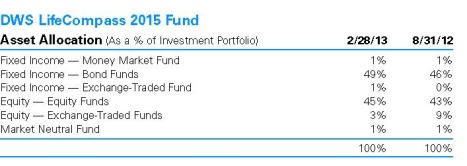
DWS LifeCompass 2015 Fund | Class A | | 6-Month‡ | | | 1-Year | | | 5-Year | | | 10-Year | |
Average Annual Total Returns as of 2/28/13 | |
| Unadjusted for Sales Charge | | | 5.32 | % | | | 6.41 | % | | | 2.28 | % | | | 5.53 | % |
| Adjusted for the Maximum Sales Charge (max 5.75% load) | | | -0.74 | % | | | 0.30 | % | | | 1.08 | % | | | 4.91 | % |
S&P Target Date 2015 Index† | | | 5.85 | % | | | 7.18 | % | | | 4.48 | % | | | 7.24 | % |
Average Annual Total Returns as of 12/31/12 (most recent calendar quarter end) | |
| Unadjusted for Sales Charge | | | | | | | 11.12 | % | | | 0.79 | % | | | 5.05 | % |
| Adjusted for the Maximum Sales Charge (max 5.75% load) | | | | | | | 4.73 | % | | | -0.39 | % | | | 4.43 | % |
S&P Target Date 2015 Index† | | | | | | | 10.32 | % | | | 2.98 | % | | | 6.72 | % |
| Class B | | 6-Month‡ | | | 1-Year | | | 5-Year | | | 10-Year | |
Average Annual Total Returns as of 2/28/13 | |
| Unadjusted for Sales Charge | | | 4.92 | % | | | 5.71 | % | | | 1.53 | % | | | 4.74 | % |
| Adjusted for the Maximum Sales Charge (max 4.00% CDSC) | | | 0.92 | % | | | 2.71 | % | | | 1.34 | % | | | 4.74 | % |
S&P Target Date 2015 Index† | | | 5.85 | % | | | 7.18 | % | | | 4.48 | % | | | 7.24 | % |
Average Annual Total Returns as of 12/31/12 (most recent calendar quarter end) | |
| Unadjusted for Sales Charge | | | | | | | 10.29 | % | | | 0.03 | % | | | 4.26 | % |
| Adjusted for the Maximum Sales Charge (max 4.00% CDSC) | | | | | | | 7.29 | % | | | -0.15 | % | | | 4.26 | % |
S&P Target Date 2015 Index† | | | | | | | 10.32 | % | | | 2.98 | % | | | 6.72 | % |
| Class C | | 6-Month‡ | | | 1-Year | | | 5-Year | | | 10-Year | |
Average Annual Total Returns as of 2/28/13 | |
| Unadjusted for Sales Charge | | | 4.83 | % | | | 5.62 | % | | | 1.52 | % | | | 4.75 | % |
| Adjusted for the Maximum Sales Charge (max 1.00% CDSC) | | | 3.83 | % | | | 5.62 | % | | | 1.52 | % | | | 4.75 | % |
S&P Target Date 2015 Index† | | | 5.85 | % | | | 7.18 | % | | | 4.48 | % | | | 7.24 | % |
Average Annual Total Returns as of 12/31/12 (most recent calendar quarter end) | |
| Unadjusted for Sales Charge | | | | | | | 10.29 | % | | | 0.04 | % | | | 4.28 | % |
| Adjusted for the Maximum Sales Charge (max 1.00% CDSC) | | | | | | | 10.29 | % | | | 0.04 | % | | | 4.28 | % |
S&P Target Date 2015 Index† | | | | | | | 10.32 | % | | | 2.98 | % | | | 6.72 | % |
DWS LifeCompass 2015 Fund
| Class S | | 6-Month‡ | | | 1-Year | | | 5-Year | | | 10-Year | |
Average Annual Total Returns as of 2/28/13 | |
| No Sales Charges | | | 5.37 | % | | | 6.69 | % | | | 2.54 | % | | | 5.78 | % |
S&P Target Date 2015 Index† | | | 5.85 | % | | | 7.18 | % | | | 4.48 | % | | | 7.24 | % |
Average Annual Total Returns as of 12/31/12 (most recent calendar quarter end) | |
| No Sales Charges | | | | | | | 11.42 | % | | | 1.04 | % | | | 5.30 | % |
S&P Target Date 2015 Index† | | | | | | | 10.32 | % | | | 2.98 | % | | | 6.72 | % |
Performance in the Average Annual Total Returns table above and the Growth of an Assumed $10,000 Investment line graph that follows is historical and does not guarantee future results. Investment return and principal fluctuate so your shares may be worth more or less when redeemed. Current performance may differ from performance data shown. Please visit www.dws-investments.com for the Fund's most recent month-end performance. Fund performance includes reinvestment of all distributions. Unadjusted returns do not reflect sales charges and would have been lower if they had.
The gross expense ratios of the Fund, as stated in the fee table of the prospectus dated December 1, 2012 are 1.28%, 2.16%, 2.00% and 1.06% for Class A, Class B, Class C and Class S shares, respectively, and may differ from the expense ratios disclosed in the Financial Highlights tables in this report. These expense ratios include net expenses of the underlying funds in which the Fund invests.
Index returns do not reflect any fees or expenses and it is not possible to invest directly into an index.
Performance figures do not reflect the deduction of taxes that a shareholder would pay on fund distributions or the redemption of fund shares.
DWS LifeCompass 2015 Fund
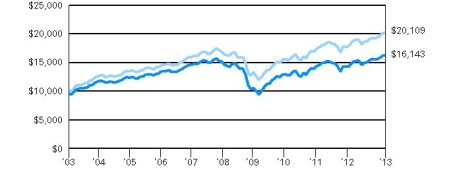
Growth of an Assumed $10,000 Investment (Adjusted for Maximum Sales Charge) |
|
|
| Yearly periods ended February 28 |
The Fund's growth of an assumed $10,000 investment is adjusted for the maximum sales charge of 5.75%. This results in a net initial investment of $9,425.
The growth of $10,000 is cumulative.
Performance of other share classes will vary based on the sales charges and the fee structure of those classes.
† The S&P Target Date 2015 Index seeks to represent investment opportunity generally available in target date funds through an asset allocation which targets retirement horizon on or around 2015.
‡ Total returns shown for periods less than one year are not annualized.
| | | Class A | | | Class B | | | Class C | | | Class S | |
| Net Asset Value | |
| 2/28/13 | | $ | 11.62 | | | $ | 11.61 | | | $ | 11.60 | | | $ | 11.61 | |
| 8/31/12 | | $ | 11.14 | | | $ | 11.13 | | | $ | 11.13 | | | $ | 11.13 | |
Distribution Information as of 2/28/13 | |
| Income Dividends, Six Months | | $ | .11 | | | $ | .07 | | | $ | .07 | | | $ | .12 | |
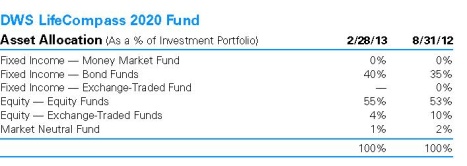
DWS LifeCompass 2020 Fund | Class A | | 6-Month‡ | | | 1-Year | | | 5-Year | | | 10-Year | |
Average Annual Total Returns as of 2/28/13 | |
| Unadjusted for Sales Charge | | | 5.94 | % | | | 6.81 | % | | | 2.21 | % | | | 6.55 | % |
| Adjusted for the Maximum Sales Charge (max 5.75% load) | | | -0.15 | % | | | 0.67 | % | | | 1.01 | % | | | 5.92 | % |
S&P Target Date 2020 Index† | | | 6.76 | % | | | 7.89 | % | | | 4.48 | % | | | 7.65 | % |
Average Annual Total Returns as of 12/31/12 (most recent calendar quarter end) | |
| Unadjusted for Sales Charge | | | | | | | 11.76 | % | | | 0.44 | % | | | 5.85 | % |
| Adjusted for the Maximum Sales Charge (max 5.75% load) | | | | | | | 5.33 | % | | | -0.75 | % | | | 5.22 | % |
S&P Target Date 2020 Index† | | | | | | | 11.48 | % | | | 2.70 | % | | | 7.03 | % |
| Class B | | 6-Month‡ | | | 1-Year | | | 5-Year | | | 10-Year | |
Average Annual Total Returns as of 2/28/13 | |
| Unadjusted for Sales Charge | | | 5.58 | % | | | 6.22 | % | | | 1.49 | % | | | 5.77 | % |
| Adjusted for the Maximum Sales Charge (max 4.00% CDSC) | | | 1.58 | % | | | 3.22 | % | | | 1.30 | % | | | 5.77 | % |
S&P Target Date 2020 Index† | | | 6.76 | % | | | 7.89 | % | | | 4.48 | % | | | 7.65 | % |
Average Annual Total Returns as of 12/31/12 (most recent calendar quarter end) | |
| Unadjusted for Sales Charge | | | | | | | 11.08 | % | | | -0.30 | % | | | 5.07 | % |
| Adjusted for the Maximum Sales Charge (max 4.00% CDSC) | | | | | | | 8.08 | % | | | -0.49 | % | | | 5.07 | % |
S&P Target Date 2020 Index† | | | | | | | 11.48 | % | | | 2.70 | % | | | 7.03 | % |
| Class C | | 6-Month‡ | | | 1-Year | | | 5-Year | | | 10-Year | |
Average Annual Total Returns as of 2/28/13 | |
| Unadjusted for Sales Charge | | | 5.55 | % | | | 6.03 | % | | | 1.45 | % | | | 5.76 | % |
| Adjusted for the Maximum Sales Charge (max 1.00% CDSC) | | | 4.55 | % | | | 6.03 | % | | | 1.45 | % | | | 5.76 | % |
S&P Target Date 2020 Index† | | | 6.76 | % | | | 7.89 | % | | | 4.48 | % | | | 7.65 | % |
Average Annual Total Returns as of 12/31/12 (most recent calendar quarter end) | |
| Unadjusted for Sales Charge | | | | | | | 11.05 | % | | | -0.30 | % | | | 5.07 | % |
| Adjusted for the Maximum Sales Charge (max 1.00% CDSC) | | | | | | | 11.05 | % | | | -0.30 | % | | | 5.07 | % |
S&P Target Date 2020 Index† | | | | | | | 11.48 | % | | | 2.70 | % | | | 7.03 | % |
DWS LifeCompass 2020 Fund
| Class S | | 6-Month‡ | | | 1-Year | | | 5-Year | | | 10-Year | |
Average Annual Total Returns as of 2/28/13 | |
| No Sales Charges | | | 6.13 | % | | | 7.08 | % | | | 2.47 | % | | | 6.82 | % |
S&P Target Date 2020 Index† | | | 6.76 | % | | | 7.89 | % | | | 4.48 | % | | | 7.65 | % |
Average Annual Total Returns as of 12/31/12 (most recent calendar quarter end) | |
| No Sales Charges | | | | | | | 12.05 | % | | | 0.69 | % | | | 6.11 | % |
S&P Target Date 2020 Index† | | | | | | | 11.48 | % | | | 2.70 | % | | | 7.03 | % |
Performance in the Average Annual Total Returns table above and the Growth of an Assumed $10,000 Investment line graph that follows is historical and does not guarantee future results. Investment return and principal fluctuate so your shares may be worth more or less when redeemed. Current performance may differ from performance data shown. Please visit www.dws-investments.com for the Fund's most recent month-end performance. Fund performance includes reinvestment of all distributions. Unadjusted returns do not reflect sales charges and would have been lower if they had.
The gross expense ratios of the Fund, as stated in the fee table of the prospectus dated December 1, 2012 are 1.27%, 1.87%, 1.97% and 1.06% for Class A, Class B, Class C and Class S shares, respectively, and may differ from the expense ratios disclosed in the Financial Highlights tables in this report. These expense ratios include net expenses of the underlying funds in which the Fund invests.
Index returns do not reflect any fees or expenses and it is not possible to invest directly into an index.
Performance figures do not reflect the deduction of taxes that a shareholder would pay on fund distributions or the redemption of fund shares.
DWS LifeCompass 2020 Fund
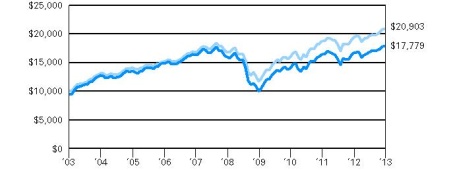
Growth of an Assumed $10,000 Investment (Adjusted for Maximum Sales Charge) |
|
|
| Yearly periods ended February 28 |
The Fund's growth of an assumed $10,000 investment is adjusted for the maximum sales charge of 5.75%. This results in a net initial investment of $9,425.
The growth of $10,000 is cumulative.
Performance of other share classes will vary based on the sales charges and the fee structure of those classes.
† The S&P Target Date 2020 Index seeks to represent investment opportunity generally available in target date funds through an asset allocation which targets retirement horizon on or around 2020.
‡ Total returns shown for periods less than one year are not annualized.
| | | Class A | | | Class B | | | Class C | | | Class S | |
| Net Asset Value | |
| 2/28/13 | | $ | 14.03 | | | $ | 13.96 | | | $ | 13.96 | | | $ | 14.04 | |
| 8/31/12 | | $ | 13.50 | | | $ | 13.39 | | | $ | 13.38 | | | $ | 13.52 | |
Distribution Information as of 2/28/13 | |
| Income Dividends, Six Months | | $ | .26 | | | $ | .17 | | | $ | .16 | | | $ | .30 | |
DWS LifeCompass 2030 Fund | Class A | | 6-Month‡ | | | 1-Year | | | 5-Year | | | Life of Fund* | |
Average Annual Total Returns as of 2/28/13 | |
| Unadjusted for Sales Charge | | | 7.32 | % | | | 7.43 | % | | | 2.00 | % | | | 4.07 | % |
| Adjusted for the Maximum Sales Charge (max 5.75% load) | | | 1.15 | % | | | 1.25 | % | | | 0.80 | % | | | 3.34 | % |
S&P Target Date 2030 Index† | | | 8.37 | % | | | 9.11 | % | | | 4.25 | % | | | 5.78 | % |
Average Annual Total Returns as of 12/31/12 (most recent calendar quarter end) | |
| Unadjusted for Sales Charge | | | | | | | 13.24 | % | | | -0.25 | % | | | 3.69 | % |
| Adjusted for the Maximum Sales Charge (max 5.75% load) | | | | | | | 6.73 | % | | | -1.42 | % | | | 2.94 | % |
S&P Target Date 2030 Index† | | | | | | | 13.43 | % | | | 2.00 | % | | | 5.40 | % |
| Class B | | 6-Month‡ | | | 1-Year | | | 5-Year | | | Life of Fund* | |
Average Annual Total Returns as of 2/28/13 | |
| Unadjusted for Sales Charge | | | 6.94 | % | | | 6.61 | % | | | 1.25 | % | | | 3.30 | % |
| Adjusted for the Maximum Sales Charge (max 4.00% CDSC) | | | 2.94 | % | | | 3.61 | % | | | 1.07 | % | | | 3.30 | % |
S&P Target Date 2030 Index† | | | 8.37 | % | | | 9.11 | % | | | 4.25 | % | | | 5.78 | % |
Average Annual Total Returns as of 12/31/12 (most recent calendar quarter end) | |
| Unadjusted for Sales Charge | | | | | | | 12.47 | % | | | -0.96 | % | | | 2.93 | % |
| Adjusted for the Maximum Sales Charge (max 4.00% CDSC) | | | | | | | 9.47 | % | | | -1.14 | % | | | 2.93 | % |
S&P Target Date 2030 Index† | | | | | | | 13.43 | % | | | 2.00 | % | | | 5.40 | % |
| Class C | | 6-Month‡ | | | 1-Year | | | 5-Year | | | Life of Fund* | |
Average Annual Total Returns as of 2/28/13 | |
| Unadjusted for Sales Charge | | | 6.83 | % | | | 6.61 | % | | | 1.23 | % | | | 3.29 | % |
| Adjusted for the Maximum Sales Charge (max 1.00% CDSC) | | | 5.83 | % | | | 6.61 | % | | | 1.23 | % | | | 3.29 | % |
S&P Target Date 2030 Index† | | | 8.37 | % | | | 9.11 | % | | | 4.25 | % | | | 5.78 | % |
Average Annual Total Returns as of 12/31/12 (most recent calendar quarter end) | |
| Unadjusted for Sales Charge | | | | | | | 12.36 | % | | | -0.98 | % | | | 2.92 | % |
| Adjusted for the Maximum Sales Charge (max 1.00% CDSC) | | | | | | | 12.36 | % | | | -0.98 | % | | | 2.92 | % |
S&P Target Date 2030 Index† | | | | | | | 13.43 | % | | | 2.00 | % | | | 5.40 | % |
DWS LifeCompass 2030 Fund
| Class S | | 6-Month‡ | | | 1-Year | | | 5-Year | | | Life of Fund* | |
Average Annual Total Returns as of 2/28/13 | |
| No Sales Charges | | | 7.38 | % | | | 7.60 | % | | | 2.24 | % | | | 4.32 | % |
S&P Target Date 2030 Index† | | | 8.37 | % | | | 9.11 | % | | | 4.25 | % | | | 5.78 | % |
Average Annual Total Returns as of 12/31/12 (most recent calendar quarter end) | |
| No Sales Charges | | | | | | | 13.41 | % | | | -0.01 | % | | | 3.94 | % |
S&P Target Date 2030 Index† | | | | | | | 13.43 | % | | | 2.00 | % | | | 5.40 | % |
Performance in the Average Annual Total Returns table above and the Growth of an Assumed $10,000 Investment line graph that follows is historical and does not guarantee future results. Investment return and principal fluctuate so your shares may be worth more or less when redeemed. Current performance may differ from performance data shown. Please visit www.dws-investments.com for the Fund's most recent month-end performance. Fund performance includes reinvestment of all distributions. Unadjusted returns do not reflect sales charges and would have been lower if they had.
The gross expense ratios of the Fund, as stated in the fee table of the prospectus dated December 1, 2012 are 1.48%, 2.23%, 2.16% and 1.23% for Class A, Class B, Class C and Class S shares, respectively, and may differ from the expense ratios disclosed in the Financial Highlights tables in this report. These expense ratios include net expenses of the underlying funds in which the Fund invests.
Index returns do not reflect any fees or expenses and it is not possible to invest directly into an index.
Performance figures do not reflect the deduction of taxes that a shareholder would pay on fund distributions or the redemption of fund shares.
DWS LifeCompass 2030 Fund
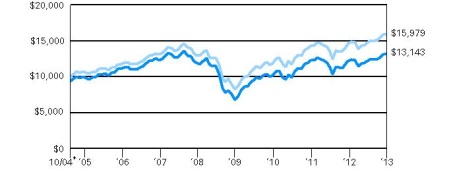
Growth of an Assumed $10,000 Investment (Adjusted for Maximum Sales Charge) |
|
|
| Yearly periods ended February 28 |
The Fund's growth of an assumed $10,000 investment is adjusted for the maximum sales charge of 5.75%. This results in a net initial investment of $9,425.
The growth of $10,000 is cumulative.
Performance of other share classes will vary based on the sales charges and the fee structure of those classes.
* The Fund commenced operations on November 1, 2004. The performance shown for each index is for the time period of October 31, 2004 through February 28, 2013 (through December 31, 2012 for the most recent calendar quarter end returns), which is based on the performance period of the life of the Fund.
† The S&P Target Date 2030 Index seeks to represent investment opportunity generally available in target date funds through an asset allocation which targets retirement horizon on or around 2030.
‡ Total returns shown for periods less than one year are not annualized.
| | | Class A | | | Class B | | | Class C | | | Class S | |
| Net Asset Value | |
| 2/28/13 | | $ | 10.25 | | | $ | 10.25 | | | $ | 10.24 | | | $ | 10.25 | |
| 8/31/12 | | $ | 9.71 | | | $ | 9.67 | | | $ | 9.67 | | | $ | 9.72 | |
Distribution Information as of 2/28/13 | |
| Income Dividends, Six Months | | $ | .16 | | | $ | .09 | | | $ | .09 | | | $ | .19 | |
DWS LifeCompass 2040 Fund | Class A | | 6-Month‡ | | | 1-Year | | | 5-Year | | | Life of Fund* | |
Average Annual Total Returns as of 2/28/13 | |
| Unadjusted for Sales Charge | | | 8.27 | % | | | 7.62 | % | | | 1.82 | % | | | 0.42 | % |
| Adjusted for the Maximum Sales Charge (max 5.75% load) | | | 2.04 | % | | | 1.43 | % | | | 0.62 | % | | | -0.70 | % |
S&P Target Date 2040 Index† | | | 9.39 | % | | | 9.98 | % | | | 4.01 | % | | | 2.01 | % |
Average Annual Total Returns as of 12/31/12 (most recent calendar quarter end) | |
| Unadjusted for Sales Charge | | | | | | | 13.58 | % | | | -0.55 | % | | | -0.38 | % |
| Adjusted for the Maximum Sales Charge (max 5.75% load) | | | | | | | 7.04 | % | | | -1.72 | % | | | -1.53 | % |
S&P Target Date 2040 Index† | | | | | | | 14.69 | % | | | 1.48 | % | | | 1.22 | % |
| Class C | | 6-Month‡ | | | 1-Year | | | 5-Year | | | Life of Fund* | |
Average Annual Total Returns as of 2/28/13 | |
| Unadjusted for Sales Charge | | | 7.71 | % | | | 6.80 | % | | | 1.03 | % | | | -0.33 | % |
| Adjusted for the Maximum Sales Charge (max 1.00% CDSC) | | | 6.71 | % | | | 6.80 | % | | | 1.03 | % | | | -0.33 | % |
S&P Target Date 2040 Index† | | | 9.39 | % | | | 9.98 | % | | | 4.01 | % | | | 2.01 | % |
Average Annual Total Returns as of 12/31/12 (most recent calendar quarter end) | |
| Unadjusted for Sales Charge | | | | | | | 12.84 | % | | | -1.27 | % | | | -1.11 | % |
| Adjusted for the Maximum Sales Charge (max 1.00% CDSC) | | | | | | | 12.84 | % | | | -1.27 | % | | | -1.11 | % |
S&P Target Date 2040 Index† | | | | | | | 14.69 | % | | | 1.48 | % | | | 1.22 | % |
| Class S | | 6-Month‡ | | | 1-Year | | | 5-Year | | | Life of Fund* | |
Average Annual Total Returns as of 2/28/13 | |
| No Sales Charges | | | 8.27 | % | | | 7.88 | % | | | 2.08 | % | | | 0.69 | % |
S&P Target Date 2040 Index† | | | 9.39 | % | | | 9.98 | % | | | 4.01 | % | | | 2.01 | % |
Average Annual Total Returns as of 12/31/12 (most recent calendar quarter end) | |
| No Sales Charges | | | | | | | 14.00 | % | | | -0.25 | % | | | -0.11 | % |
S&P Target Date 2040 Index† | | | | | | | 14.69 | % | | | 1.48 | % | | | 1.22 | % |
Performance in the Average Annual Total Returns table above and the Growth of an Assumed $10,000 Investment line graph that follows is historical and does not guarantee future results. Investment return and principal fluctuate so your shares may be worth more or less when redeemed. Current performance may differ from performance data shown. Please visit www.dws-investments.com for the Fund's most recent month-end performance. Fund performance includes reinvestment of all distributions. Unadjusted returns do not reflect sales charges and would have been lower if they had.
The gross expense ratios of the Fund, as stated in the fee table of the prospectus dated December 1, 2012 are 1.62%, 2.44% and 1.37% for Class A, Class C and Class S shares, respectively, and may differ from the expense ratios disclosed in the Financial Highlights tables in this report. These expense ratios include net expenses of the underlying funds in which the Fund invests.
DWS LifeCompass 2040 Fund
Index returns do not reflect any fees or expenses and it is not possible to invest directly into an index.
Performance figures do not reflect the deduction of taxes that a shareholder would pay on fund distributions or the redemption of fund shares.
Growth of an Assumed $10,000 Investment (Adjusted for Maximum Sales Charge) |
|
|
| Yearly periods ended February 28 |
The Fund's growth of an assumed $10,000 investment is adjusted for the maximum sales charge of 5.75%. This results in a net initial investment of $9,425.
The growth of $10,000 is cumulative.
Performance of other share classes will vary based on the sales charges and the fee structure of those classes.
* The Fund commenced operations on November 15, 2007. The performance shown for each index is for the time period of November 30, 2007 through February 28, 2013 (through December 31, 2012 for the most recent calendar quarter end returns), which is based on the performance period of the life of the Fund.
† The S&P Target Date 2040 Index seeks to represent investment opportunity generally available in target date funds through an asset allocation which targets retirement horizon on or around 2040.
‡ Total returns shown for periods less than one year are not annualized.
| | | Class A | | | Class C | | | Class S | |
| Net Asset Value | |
| 2/28/13 | | $ | 8.75 | | | $ | 8.74 | | | $ | 8.75 | |
| 8/31/12 | | $ | 8.26 | | | $ | 8.23 | | | $ | 8.29 | |
Distribution Information as of 2/28/13 | |
| Income Dividends, Six Months | | $ | .12 | | | $ | .06 | | | $ | .14 | |
| Capital Gain Distributions | | $ | .06 | | | $ | .06 | | | $ | .06 | |
Portfolio Management Team
Subadvisor
QS Investors, LLC ("QS Investors"), New York, New York, is the subadvisor for the fund. QS Investors manages and advises assets on behalf of institutional clients and retail funds, providing global expertise in research, portfolio management and quantitative analysis.
Portfolio Management Team
Robert Wang, Head of Portfolio Management and Trading, QS Investors
Began managing the Target Date Series in 2002.
• Joined QS Investors in 2010 after 28 years of experience of trading fixed income, foreign exchange and derivative products at Deutsche Asset Management and J.P. Morgan.
• BS, The Wharton School, University of Pennsylvania.
Ellen Tesler, Portfolio Manager, QS Investors
Began managing the Target Date Series in 2012.
• Member of the QS Investors portfolio management and trading group.
• Formerly at DB Advisors (2000-2010). Prior to joining DB Advisors, one year as an analyst at Lord Abbett and Company.
• BBA and MBA, Pace University.
Portfolio Summaries (Unaudited)
Investment Portfolios as of February 28, 2013 (Unaudited)
DWS LifeCompass Retirement Fund | | | Shares | | | Value ($) | |
| | | | |
| Equity — Equity Funds 34.0% | |
| DWS Capital Growth Fund "Institutional" (a) | | | 39,675 | | | | 2,474,136 | |
| DWS Core Equity Fund "Institutional" (a) | | | 214,627 | | | | 4,234,581 | |
| DWS Diversified International Equity Fund "Institutional" (a) | | | 116,413 | | | | 826,532 | |
| DWS EAFE Equity Index Fund "Institutional" (a) | | | 287,765 | | | | 3,669,003 | |
| DWS Emerging Markets Equity Fund "Institutional" (a) | | | 73,179 | | | | 1,195,019 | |
| DWS Equity 500 Index Fund "Institutional" (a) | | | 56,835 | | | | 9,777,867 | |
| DWS Equity Dividend Fund "Institutional" (a) | | | 26,067 | | | | 958,487 | |
| DWS International Fund "Institutional" (a) | | | 20,918 | | | | 899,266 | |
| DWS Mid Cap Value Fund "Institutional" (a) | | | 54,958 | | | | 724,342 | |
| DWS Small Cap Core Fund "S" (a) | | | 63,382 | | | | 1,335,449 | |
| DWS Small Cap Growth Fund "Institutional"* (a) | | | 23,458 | | | | 624,684 | |
| DWS Small Cap Value Fund "Institutional" (a) | | | 6,756 | | | | 267,418 | |
Total Equity — Equity Funds (Cost $23,674,332) | | | | 26,986,784 | |
| | |
| Equity — Exchange-Traded Funds 1.6% | |
| iShares MSCI Canada Index Fund | | | 15,828 | | | | 446,666 | |
| SPDR Barclays Capital Convertible Securities Fund | | | 19,138 | | | | 795,950 | |
Total Exchange-Traded Funds (Cost $1,082,436) | | | | 1,242,616 | |
| | |
| Fixed Income — Bond Funds 62.7% | |
| DWS Core Fixed Income Fund "Institutional" (a) | | | 1,663,443 | | | | 16,734,236 | |
| DWS Enhanced Commodity Strategy Fund "Institutional" (a) | | | 245,690 | | | | 796,035 | |
| DWS Enhanced Global Bond Fund "S" (a) | | | 776,778 | | | | 7,961,974 | |
| DWS Floating Rate Fund "Institutional" (a) | | | 84,135 | | | | 796,755 | |
| DWS Global High Income Fund "Institutional" (a) | | | 110,965 | | | | 794,508 | |
| DWS Global Inflation Fund "Institutional" (a) | | | 364,299 | | | | 3,985,432 | |
| DWS High Income Fund "Institutional" (a) | | | 400,623 | | | | 1,991,096 | |
| DWS U.S. Bond Index Fund "Institutional" (a) | | | 1,549,261 | | | | 16,778,495 | |
Total Fixed Income — Bond Funds (Cost $50,359,455) | | | | 49,838,531 | |
| | |
| Market Neutral Fund 1.0% | |
| DWS Disciplined Market Neutral Fund "Institutional"* (a) (Cost $779,158) | | | 81,544 | | | | 795,057 | |
| | |
| Fixed Income — Money Market Fund 0.3% | |
| Central Cash Management Fund, 0.12% (a) (b) (Cost $281,235) | | | 281,235 | | | | 281,235 | |
| | | % of Net Assets | | | Value ($) | |
| | | | |
Total Investment Portfolio (Cost $76,176,616)† | | | 99.6 | | | | 79,144,223 | |
| Other Assets and Liabilities, Net | | | 0.4 | | | | 334,552 | |
| Net Assets | | | 100.0 | | | | 79,478,775 | |
* Non-income producing security.
† The cost for federal income tax purposes was $76,643,212. At February 28, 2013, net unrealized appreciation for all securities based on tax cost was $2,501,011. This consisted of aggregate gross unrealized appreciation for all securities in which there was an excess of value over tax cost of $3,814,299 and aggregate gross unrealized depreciation for all securities in which there was an excess of tax cost over value of $1,313,288.
(a) Affiliated fund managed by Deutsche Investment Management Americas Inc.
(b) The rate shown is the annualized seven-day yield at period end.
EAFE: Europe, Australasia and Far East
MSCI: Morgan Stanley Capital International
SPDR: Standard & Poor's Depositary Receipt
During the six months ended February 28, 2013, purchases and sales of affiliated Underlying Funds (excluding money market funds) aggregated $12,946,209 and $19,510,809, respectively. Purchases and sales of non-affiliated Underlying Funds (excluding money market funds) aggregated $0 and $3,606,306, respectively.
Fair Value Measurements
Various inputs are used in determining the value of the Fund's investments. These inputs are summarized in three broad levels. Level 1 includes quoted prices in active markets for identical securities. Level 2 includes other significant observable inputs (including quoted prices for similar securities, interest rates, prepayment speeds and credit risk). Level 3 includes significant unobservable inputs (including the Fund's own assumptions in determining the fair value of investments). The inputs or methodology used for valuing securities are not necessarily an indication of the risk associated with investing in those securities.
The following is a summary of the inputs used as of February 28, 2013 in valuing the Fund's investments. For information on the Fund's policy regarding the valuation of investments, please refer to the Security Valuation section of Note A in the accompanying Notes to Financial Statements.
| Assets | | Level 1 | | | Level 2 | | | Level 3 | | | Total | |
| | |
| Equity Funds | | $ | 26,986,784 | | | $ | — | | | $ | — | | | $ | 26,986,784 | |
| Exchange-Traded Funds | | | 1,242,616 | | | | — | | | | — | | | | 1,242,616 | |
| Bond Funds | | | 49,838,531 | | | | — | | | | — | | | | 49,838,531 | |
| Market Neutral Fund | | | 795,057 | | | | — | | | | — | | | | 795,057 | |
| Money Market Funds | | | 281,235 | | | | — | | | | — | | | | 281,235 | |
| Total | | $ | 79,144,223 | | | $ | — | | | $ | — | | | $ | 79,144,223 | |
There have been no transfers between fair value measurement levels during the period ended February 28, 2013.
DWS LifeCompass 2015 Fund | | | Shares | | | Value ($) | |
| | | | |
| Equity — Equity Funds 45.2% | |
| DWS Capital Growth Fund "Institutional" (a) | | | 108,031 | | | | 6,736,838 | |
| DWS Core Equity Fund "Institutional" (a) | | | 364,287 | | | | 7,187,384 | |
| DWS Diversified International Equity Fund "Institutional" (a) | | | 136,478 | | | | 968,994 | |
| DWS EAFE Equity Index Fund "Institutional" (a) | | | 622,473 | | | | 7,936,532 | |
| DWS Emerging Markets Equity Fund "Institutional" (a) | | | 128,044 | | | | 2,090,962 | |
| DWS Equity 500 Index Fund "Institutional" (a) | | | 85,037 | | | | 14,629,797 | |
| DWS Equity Dividend Fund "Institutional" (a) | | | 54,769 | | | | 2,013,843 | |
| DWS International Fund "Institutional" (a) | | | 27,616 | | | | 1,187,202 | |
| DWS Small Cap Core Fund "S" (a) | | | 140,517 | | | | 2,960,685 | |
| DWS Technology Fund "Institutional"* (a) | | | 15,225 | | | | 238,583 | |
| DWS World Dividend Fund "Institutional" (a) | | | 50,434 | | | | 1,265,895 | |
Total Equity — Equity Funds (Cost $40,266,312) | | | | 47,216,715 | |
| | |
| Equity — Exchange-Traded Funds 3.0% | |
| iShares MSCI Canada Index Fund | | | 17,145 | | | | 483,832 | |
| SPDR Barclays Capital Convertible Securities Fund | | | 33,506 | | | | 1,393,514 | |
| Vanguard FTSE All World ex-U.S. Small-Cap Fund | | | 12,999 | | | | 1,214,367 | |
Total Equity — Exchange-Traded Funds (Cost $2,743,426) | | | | 3,091,713 | |
| | |
| Fixed Income — Bond Funds 48.7% | |
| DWS Core Fixed Income Fund "Institutional" (a) | | | 1,586,371 | | | | 15,958,895 | |
| DWS Enhanced Commodity Strategy Fund "Institutional" (a) | | | 323,076 | | | | 1,046,766 | |
| DWS Enhanced Emerging Markets Fixed Income Fund "Institutional" (a) | | | 92,550 | | | | 1,046,741 | |
| DWS Enhanced Global Bond Fund "S" (a) | | | 970,414 | | | | 9,946,747 | |
| DWS Floating Rate Fund "Institutional" (a) | | | 110,591 | | | | 1,047,293 | |
| DWS Global High Income Fund "Institutional" (a) | | | 146,064 | | | | 1,045,820 | |
| DWS Global Inflation Fund "Institutional" (a) | | | 254,864 | | | | 2,788,215 | |
| DWS High Income Fund "Institutional" (a) | | | 420,561 | | | | 2,090,187 | |
| DWS U.S. Bond Index Fund "Institutional" (a) | | | 1,476,988 | | | | 15,995,775 | |
Total Fixed Income — Bond Funds (Cost $50,589,200) | | | | 50,966,439 | |
| | |
| Fixed Income — Exchange-Traded Fund 1.0% | |
| WisdomTree Emerging Markets Local Debt Fund (Cost $980,251) | | | 19,674 | | | | 1,042,132 | |
| | |
| Market Neutral Fund 1.2% | |
| DWS Disciplined Market Neutral Fund "Institutional"* (a) (Cost $1,281,312) | | | 134,090 | | | | 1,307,375 | |
| | |
| Fixed Income — Money Market Fund 0.6% | |
| Central Cash Management Fund, 0.12% (a) (b) (Cost $606,378) | | | 606,378 | | | | 606,378 | |
| | | % of Net Assets | | | Value ($) | |
| | | | |
Total Investment Portfolio (Cost $96,466,879)† | | | 99.7 | | | | 104,230,752 | |
| Other Assets and Liabilities, Net | | | 0.3 | | | | 300,997 | |
| Net Assets | | | 100.0 | | | | 104,531,749 | |
* Non-income producing security.
† The cost for federal income tax purposes was $97,457,240. At February 28, 2013, net unrealized appreciation for all securities based on tax cost was $6,773,512. This consisted of aggregate gross unrealized appreciation for all securities in which there was an excess of value over tax cost of $8,114,622 and aggregate gross unrealized depreciation for all securities in which there was an excess of tax cost over value of $1,341,110.
(a) Affiliated fund managed by Deutsche Investment Management Americas Inc.
(b) The rate shown is the annualized seven-day yield at period end.
EAFE: Europe, Australasia and Far East
FTSE: Financial Times and the London Stock Exchange
MSCI: Morgan Stanley Capital International
SPDR: Standard & Poor's Depositary Receipt
During the six months ended February 28, 2013, purchases and sales of affiliated Underlying Funds (excluding money market funds) aggregated $23,994,513 and $56,074,903, respectively. Purchases and sales of non-affiliated Underlying Funds (excluding money market funds) aggregated $831,031 and $11,478,001, respectively.
Fair Value Measurements
Various inputs are used in determining the value of the Fund's investments. These inputs are summarized in three broad levels. Level 1 includes quoted prices in active markets for identical securities. Level 2 includes other significant observable inputs (including quoted prices for similar securities, interest rates, prepayment speeds and credit risk). Level 3 includes significant unobservable inputs (including the Fund's own assumptions in determining the fair value of investments). The inputs or methodology used for valuing securities are not necessarily an indication of the risk associated with investing in those securities.
The following is a summary of the inputs used as of February 28, 2013 in valuing the Fund's investments. For information on the Fund's policy regarding the valuation of investments, please refer to the Security Valuation section of Note A in the accompanying Notes to Financial Statements.
| Assets | | Level 1 | | | Level 2 | | | Level 3 | | | Total | |
| | |
| Equity Funds | | $ | 47,216,715 | | | $ | — | | | $ | — | | | $ | 47,216,715 | |
| Exchange-Traded Funds (c) | | | 4,133,845 | | | | — | | | | — | | | | 4,133,845 | |
| Bond Funds | | | 50,966,439 | | | | — | | | | — | | | | 50,966,439 | |
| Market Neutral Fund | | | 1,307,375 | | | | — | | | | — | | | | 1,307,375 | |
| Money Market Funds | | | 606,378 | | | | — | | | | — | | | | 606,378 | |
| Total | | $ | 104,230,752 | | | $ | — | | | $ | — | | | $ | 104,230,752 | |
There have been no transfers between fair value measurement levels during the period ended February 28, 2013.
(c) See Investment Portfolio for additional detailed categorizations.
DWS LifeCompass 2020 Fund | | | Shares | | | Value ($) | |
| | | | |
| Equity — Equity Funds 55.1% | |
| DWS Capital Growth Fund "Institutional" (a) | | | 120,680 | | | | 7,525,623 | |
| DWS Core Equity Fund "Institutional" (a) | | | 804,127 | | | | 15,865,426 | |
| DWS Diversified International Equity Fund "Institutional" (a) | | | 663,647 | | | | 4,711,896 | |
| DWS EAFE Equity Index Fund "Institutional" (a) | | | 1,139,363 | | | | 14,526,884 | |
| DWS Emerging Markets Equity Fund "Institutional" (a) | | | 335,239 | | | | 5,474,457 | |
| DWS Equity 500 Index Fund "Institutional" (a) | | | 183,962 | | | | 31,648,793 | |
| DWS Equity Dividend Fund "Institutional" (a) | | | 111,753 | | | | 4,109,141 | |
| DWS Global Growth Fund "Institutional" (a) | | | 82,453 | | | | 2,000,311 | |
| DWS Global Small Cap Growth Fund "Institutional" (a) | | | 7,580 | | | | 308,259 | |
| DWS International Fund "Institutional" (a) | | | 48,479 | | | | 2,084,113 | |
| DWS Large Cap Focus Growth Fund "Institutional" (a) | | | 44,338 | | | | 1,520,792 | |
| DWS Large Cap Value Fund "Institutional" (a) | | | 103,710 | | | | 2,036,865 | |
| DWS Small Cap Core Fund "S" (a) | | | 236,472 | | | | 4,982,463 | |
| DWS Small Cap Growth Fund "Institutional"* (a) | | | 29,376 | | | | 782,286 | |
| DWS Small Cap Value Fund "Institutional" (a) | | | 17,759 | | | | 702,920 | |
| DWS Technology Fund "Institutional"* (a) | | | 125,057 | | | | 1,959,645 | |
Total Equity — Equity Funds (Cost $87,840,968) | | | | 100,239,874 | |
| | |
| Equity — Exchange-Traded Funds 3.8% | |
| iShares MSCI Canada Index Fund | | | 50,743 | | | | 1,431,967 | |
| SPDR Barclays Capital Convertible Securities Fund | | | 80,433 | | | | 3,345,209 | |
| Vanguard FTSE All World ex-U.S. Small-Cap Fund | | | 22,583 | | | | 2,109,704 | |
Total Equity — Exchange-Traded Funds (Cost $6,376,014) | | | | 6,886,880 | |
| | |
| Fixed Income — Bond Funds 39.4% | |
| DWS Core Fixed Income Fund "Institutional" (a) | | | 2,177,662 | | | | 21,907,280 | |
| DWS Enhanced Commodity Strategy Fund "Institutional" (a) | | | 562,192 | | | | 1,821,502 | |
| DWS Enhanced Emerging Markets Fixed Income Fund "Institutional" (a) | | | 161,815 | | | | 1,830,125 | |
| DWS Enhanced Global Bond Fund "S" (a) | | | 1,333,265 | | | | 13,665,967 | |
| DWS Floating Rate Fund "Institutional" (a) | | | 192,715 | | | | 1,825,008 | |
| DWS Global High Income Fund "Institutional" (a) | | | 254,515 | | | | 1,822,324 | |
| DWS Global Inflation Fund "Institutional" (a) | | | 407,740 | | | | 4,460,670 | |
| DWS High Income Fund "Institutional" (a) | | | 488,114 | | | | 2,425,927 | |
| DWS U.S. Bond Index Fund "Institutional" (a) | | | 2,026,180 | | | | 21,943,530 | |
Total Fixed Income — Bond Funds (Cost $71,602,386) | | | | 71,702,333 | |
| | |
| Market Neutral Fund 1.2% | |
| DWS Disciplined Market Neutral Fund "Institutional"* (a) (Cost $2,085,626) | | | 218,167 | | | | 2,127,126 | |
| | |
| Fixed Income — Money Market Fund 0.4% | |
| Central Cash Management Fund, 0.12% (a) (b) (Cost $780,147) | | | 780,147 | | | | 780,147 | |
| | | % of Net Assets | | | Value ($) | |
| | | | |
Total Investment Portfolio (Cost $168,685,141)† | | | 99.9 | | | | 181,736,360 | |
| Other Assets and Liabilities, Net | | | 0.1 | | | | 187,723 | |
| Net Assets | | | 100.0 | | | | 181,924,083 | |
* Non-income producing security.
† The cost for federal income tax purposes was $169,971,919. At February 28, 2013, net unrealized appreciation for all securities based on tax cost was $11,764,441. This consisted of aggregate gross unrealized appreciation for all securities in which there was an excess of value over tax cost of $13,748,506 and aggregate gross unrealized depreciation for all securities in which there was an excess of tax cost over value of $1,984,065.
(a) Affiliated fund managed by Deutsche Investment Management Americas Inc.
(b) The rate shown is the annualized seven-day yield at period end.
EAFE: Europe, Australasia and Far East
FTSE: Financial Times and the London Stock Exchange
MSCI: Morgan Stanley Capital International
SPDR: Standard & Poor's Depositary Receipt
During the six months ended February 28, 2013, purchases and sales of affiliated Underlying Funds (excluding money market funds) aggregated $37,066,853 and $51,338,159, respectively. Purchase and sales on non-affiliated Underlying Funds (excluding money market funds) aggregated $335,854 and $14,956,131, respectively.
Fair Value Measurements
Various inputs are used in determining the value of the Fund's investments. These inputs are summarized in three broad levels. Level 1 includes quoted prices in active markets for identical securities. Level 2 includes other significant observable inputs (including quoted prices for similar securities, interest rates, prepayment speeds and credit risk). Level 3 includes significant unobservable inputs (including the Fund's own assumptions in determining the fair value of investments). The inputs or methodology used for valuing securities are not necessarily an indication of the risk associated with investing in those securities.
The following is a summary of the inputs used as of February 28, 2013 in valuing the Fund's investments. For information on the Fund's policy regarding the valuation of investments, please refer to the Security Valuation section of Note A in the accompanying Notes to Financial Statements.
| Assets | | Level 1 | | | Level 2 | | | Level 3 | | | Total | |
| | |
| Equity Funds | | $ | 100,239,874 | | | $ | — | | | $ | — | | | $ | 100,239,874 | |
| Exchange-Traded Funds | | | 6,886,880 | | | | — | | | | — | | | | 6,886,880 | |
| Bond Funds | | | 71,702,333 | | | | — | | | | — | | | | 71,702,333 | |
| Market Neutral Fund | | | 2,127,126 | | | | — | | | | — | | | | 2,127,126 | |
| Money Market Funds | | | 780,147 | | | | — | | | | — | | | | 780,147 | |
| Total | | $ | 181,736,360 | | | $ | — | | | $ | — | | | $ | 181,736,360 | |
There have been no transfers between fair value measurement levels during the period ended February 28, 2013.
DWS LifeCompass 2030 Fund | | | Shares | | | Value ($) | |
| | | | |
| Equity — Equity Funds 72.9% | |
| DWS Capital Growth Fund "Institutional" (a) | | | 83,659 | | | | 5,216,947 | |
| DWS Core Equity Fund "Institutional" (a) | | | 299,108 | | | | 5,901,404 | |
| DWS Diversified International Equity Fund "Institutional" (a) | | | 204,660 | | | | 1,453,083 | |
| DWS EAFE Equity Index Fund "Institutional" (a) | | | 558,656 | | | | 7,122,867 | |
| DWS Emerging Markets Equity Fund "Institutional" (a) | | | 138,199 | | | | 2,256,794 | |
| DWS Equity 500 Index Fund "Institutional" (a) | | | 88,900 | | | | 15,294,330 | |
| DWS Equity Dividend Fund "Institutional" (a) | | | 44,497 | | | | 1,636,145 | |
| DWS Global Growth Fund "Institutional" (a) | | | 16,139 | | | | 391,544 | |
| DWS Global Small Cap Growth Fund "Institutional" (a) | | | 2,710 | | | | 110,207 | |
| DWS International Fund "Institutional" (a) | | | 17,160 | | | | 737,703 | |
| DWS Large Cap Value Fund "Institutional" (a) | | | 58,847 | | | | 1,155,763 | |
| DWS RREEF Global Real Estate Securities Fund "Institutional" (a) | | | 87,196 | | | | 725,470 | |
| DWS Small Cap Core Fund "S" (a) | | | 136,024 | | | | 2,866,035 | |
| DWS Small Cap Growth Fund "Institutional"* (a) | | | 3,097 | | | | 82,461 | |
| DWS Small Cap Value Fund "Institutional" (a) | | | 2,184 | | | | 86,450 | |
| DWS Technology Fund "Institutional"* (a) | | | 46,044 | | | | 721,503 | |
| DWS World Dividend Fund "Institutional" (a) | | | 44,388 | | | | 1,114,133 | |
Total Equity — Equity Funds (Cost $40,890,685) | | | | 46,872,839 | |
| | |
| Equity — Exchange-Traded Funds 3.5% | |
| iShares MSCI Canada Index Fund | | | 15,207 | | | | 429,142 | |
| SPDR Barclays Capital Convertible Securities Fund | | | 25,437 | | | | 1,057,925 | |
| Vanguard FTSE All World ex-U.S. Small-Cap Fund | | | 7,941 | | | | 741,848 | |
Total Equity — Exchange-Traded Funds (Cost $2,020,450) | | | | 2,228,915 | |
| | |
| Fixed Income — Bond Funds 22.0% | |
| DWS Core Fixed Income Fund "Institutional" (a) | | | 488,014 | | | | 4,909,419 | |
| DWS Enhanced Commodity Strategy Fund "Institutional" (a) | | | 198,551 | | | | 643,305 | |
| DWS Enhanced Global Bond Fund "S" (a) | | | 204,895 | | | | 2,100,175 | |
| DWS Global Inflation Fund "Institutional" (a) | | | 58,842 | | | | 643,735 | |
| DWS High Income Fund "Institutional" (a) | | | 194,898 | | | | 968,642 | |
| DWS U.S. Bond Index Fund "Institutional" (a) | | | 453,913 | | | | 4,915,878 | |
Total Fixed Income — Bond Funds (Cost $14,192,834) | | | | 14,181,154 | |
| | |
| Market Neutral Fund 1.0% | |
| DWS Disciplined Market Neutral Fund "Institutional"* (a) (Cost $630,862) | | | 66,086 | | | | 644,342 | |
| | |
| Fixed Income — Money Market Fund 1.8% | |
| Central Cash Management Fund, 0.12% (a) (b) (Cost $1,196,811) | | | 1,196,811 | | | | 1,196,811 | |
| | | % of Net Assets | | | Value ($) | |
| | | | |
Total Investment Portfolio (Cost $58,931,642)† | | | 101.2 | | | | 65,124,061 | |
| Other Assets and Liabilities, Net | | | (1.2 | ) | | | (798,701 | ) |
| Net Assets | | | 100.0 | | | | 64,325,360 | |
* Non-income producing security.
† The cost for federal income tax purposes was $59,448,721. At February 28, 2013, net unrealized appreciation for all securities based on tax cost was $5,675,340. This consisted of aggregate gross unrealized appreciation for all securities in which there was an excess of value over tax cost of $6,615,856 and aggregate gross unrealized depreciation for all securities in which there was an excess of tax cost over value of $940,516.
(a) Affiliated fund managed by Deutsche Investment Management Americas Inc.
(b) The rate shown is the annualized seven-day yield at period end.
EAFE: Europe, Australasia and Far East
FTSE: Financial Times and the London Stock Exchange
MSCI: Morgan Stanley Capital International
SPDR: Standard & Poor's Depositary Receipt
During the six months ended February 28, 2013, purchases and sales of affiliated Underlying Funds (excluding money market funds) aggregated $19,099,616 and $19,847,266, respectively. Purchase and sales on non-affiliated Underlying Funds (excluding money market funds) aggregated $330,721 and $6,360,714, respectively.
Fair Value Measurements
Various inputs are used in determining the value of the Fund's investments. These inputs are summarized in three broad levels. Level 1 includes quoted prices in active markets for identical securities. Level 2 includes other significant observable inputs (including quoted prices for similar securities, interest rates, prepayment speeds and credit risk). Level 3 includes significant unobservable inputs (including the Fund's own assumptions in determining the fair value of investments). The inputs or methodology used for valuing securities are not necessarily an indication of the risk associated with investing in those securities.
The following is a summary of the inputs used as of February 28, 2013 in valuing the Fund's investments. For information on the Fund's policy regarding the valuation of investments, please refer to the Security Valuation section of Note A in the accompanying Notes to Financial Statements.
| Assets | | Level 1 | | | Level 2 | | | Level 3 | | | Total | |
| | |
| Equity Funds | | $ | 46,872,839 | | | $ | — | | | $ | — | | | $ | 46,872,839 | |
| Exchange-Traded Funds | | | 2,228,915 | | | | — | | | | — | | | | 2,228,915 | |
| Bond Funds | | | 14,181,154 | | | | — | | | | — | | | | 14,181,154 | |
| Market Neutral Fund | | | 644,342 | | | | — | | | | — | | | | 644,342 | |
| Money Market Funds | | | 1,196,811 | | | | — | | | | — | | | | 1,196,811 | |
| Total | | $ | 65,124,061 | | | $ | — | | | $ | — | | | $ | 65,124,061 | |
There have been no transfers between fair value measurement levels during the period ended February 28, 2013.
DWS LifeCompass 2040 Fund
| | | Shares | | | Value ($) | |
| | | | |
| Equity — Equity Funds 83.7% | |
| DWS Capital Growth Fund "Institutional" (a) | | | 57,603 | | | | 3,592,093 | |
| DWS Core Equity Fund "Institutional" (a) | | | 193,539 | | | | 3,818,526 | |
| DWS Diversified International Equity Fund "Institutional" (a) | | | 123,518 | | | | 876,980 | |
| DWS EAFE Equity Index Fund "Institutional" (a) | | | 301,620 | | | | 3,845,658 | |
| DWS Emerging Markets Equity Fund "Institutional" (a) | | | 90,346 | | | | 1,475,348 | |
| DWS Equity 500 Index Fund "Institutional" (a) | | | 42,542 | | | | 7,318,984 | |
| DWS Equity Dividend Fund "Institutional" (a) | | | 28,002 | | | | 1,029,622 | |
| DWS Global Growth Fund "Institutional" (a) | | | 13,037 | | | | 316,276 | |
| DWS International Fund "Institutional" (a) | | | 13,705 | | | | 589,187 | |
| DWS Large Cap Value Fund "Institutional" (a) | | | 41,005 | | | | 805,343 | |
| DWS RREEF Global Real Estate Securities Fund "Institutional" (a) | | | 1,827 | | | | 15,201 | |
| DWS Small Cap Core Fund "S" (a) | | | 86,131 | | | | 1,814,788 | |
| DWS Technology Fund "Institutional"* (a) | | | 30,219 | | | | 473,527 | |
| DWS World Dividend Fund "Institutional" (a) | | | 53,794 | | | | 1,350,225 | |
Total Equity — Equity Funds (Cost $22,546,419) | | | | 27,321,758 | |
| | |
| Equity — Exchange-Traded Funds 3.6% | |
| iShares MSCI Canada Index Fund | | | 7,340 | | | | 207,135 | |
| SPDR Barclays Capital Convertible Securities Fund | | | 13,145 | | | | 546,701 | |
| Vanguard FTSE All World ex-U.S. Small-Cap Fund | | | 4,351 | | | | 406,470 | |
Total Equity — Exchange-Traded Funds (Cost $1,026,984) | | | | 1,160,306 | |
| | |
| Fixed Income — Bond Funds 11.2% | |
| DWS Core Fixed Income Fund "Institutional" (a) | | | 100,036 | | | | 1,006,365 | |
| DWS Enhanced Commodity Strategy Fund "Institutional" (a) | | | 100,429 | | | | 325,390 | |
| DWS Enhanced Global Bond Fund "S" (a) | | | 62,978 | | | | 645,520 | |
| DWS Global Inflation Fund "Institutional" (a) | | | 30,021 | | | | 328,428 | |
| DWS High Income Fund "Institutional" (a) | | | 65,753 | | | | 326,794 | |
| DWS U.S. Bond Index Fund "Institutional" (a) | | | 93,433 | | | | 1,011,881 | |
Total Fixed Income — Bond Funds (Cost $3,655,316) | | | | 3,644,378 | |
| | |
| Market Neutral Fund 1.0% | |
| DWS Disciplined Market Neutral Fund "Institutional"* (a) (Cost $318,653) | | | 33,393 | | | | 325,578 | |
| | |
| Fixed Income — Money Market Fund 1.5% | |
| Central Cash Management Fund, 0.12% (a) (b) (Cost $498,335) | | | 498,335 | | | | 498,335 | |
| | | % of Net Assets | | | Value ($) | |
| | | | |
Total Investment Portfolio (Cost $28,045,707)† | | | 101.0 | | | | 32,950,355 | |
| Other Assets and Liabilities, Net | | | (1.0 | ) | | | (313,855 | ) |
| Net Assets | | | 100.0 | | | | 32,636,500 | |
* Non-income producing.
† The cost for federal income tax purposes was $28,360,075. At February 28, 2013, net unrealized appreciation for all securities based on tax cost was $4,590,280. This consisted of aggregate gross unrealized appreciation for all securities in which there was an excess of value over tax cost of $4,942,606 and aggregate gross unrealized depreciation for all securities in which there was an excess of tax cost over value of $352,326.
(a) Affiliated fund managed by Deutsche Investment Management Americas Inc.
(b) The rate shown is the annualized seven-day yield at period end.
EAFE: Europe, Australasia and Far East
FTSE: Financial Times and the London Stock Exchange
MSCI: Morgan Stanley Capital International
SPDR: Standard & Poor's Depositary Receipt
During the six months ended February 28, 2013, purchases and sales of affiliated Underlying Funds (excluding money market funds) aggregated $12,576,591 and $18,722,362, respectively. Purchase and sales on non-affiliated Underlying Funds (excluding money market funds) aggregated $225,518 and $3,526,653, respectively.
Fair Value Measurements
Various inputs are used in determining the value of the Fund's investments. These inputs are summarized in three broad levels. Level 1 includes quoted prices in active markets for identical securities. Level 2 includes other significant observable inputs (including quoted prices for similar securities, interest rates, prepayment speeds and credit risk). Level 3 includes significant unobservable inputs (including the Fund's own assumptions in determining the fair value of investments). The inputs or methodology used for valuing securities are not necessarily an indication of the risk associated with investing in those securities.
The following is a summary of the inputs used as of February 28, 2013 in valuing the Fund's investments. For information on the Fund's policy regarding the valuation of investments, please refer to the Security Valuation section of Note A in the accompanying Notes to Financial Statements.
| Assets | | Level 1 | | | Level 2 | | | Level 3 | | | Total | |
| | |
| Equity Funds | | $ | 27,321,758 | | | $ | — | | | $ | — | | | $ | 27,321,758 | |
| Exchange-Traded Funds | | | 1,160,306 | | | | — | | | | — | | | | 1,160,306 | |
| Bond Funds | | | 3,644,378 | | | | — | | | | — | | | | 3,644,378 | |
| Market Neutral Fund | | | 325,578 | | | | — | | | | — | | | | 325,578 | |
| Money Market Funds | | | 498,335 | | | | — | | | | — | | | | 498,335 | |
| Total | | $ | 32,950,355 | | | $ | — | | | $ | — | | | $ | 32,950,355 | |
There have been no transfers between fair value measurement levels during the period ended February 28, 2013.
The accompanying notes are an integral part of the financial statements.
Statements of Assets and Liabilities | as of February 28, 2013 (Unaudited) | |
| Assets | | DWS LifeCompass Retirement Fund | | | DWS LifeCompass 2015 Fund | | | DWS LifeCompass 2020 Fund | |
| Investments in affiliated Underlying Funds, at value (cost $75,094,180, $92,743,202 and $162,309,127) | | $ | 77,901,607 | | | $ | 100,096,907 | | | $ | 174,849,480 | |
| Investments in non-affiliated Underlying Funds, at value (cost $1,082,436, $3,723,677 and $6,376,014) | | | 1,242,616 | | | | 4,133,845 | | | | 6,886,880 | |
| Total investments in securities, at value (cost $76,176,616, $96,466,879 and $168,685,141) | | | 79,144,223 | | | | 104,230,752 | | | | 181,736,360 | |
| Receivable for investments sold | | | 4,053,657 | | | | 27,546,265 | | | | 16,092,410 | |
| Receivable for Fund shares sold | | | 2,727 | | | | 8,621 | | | | 104,520 | |
| Dividends receivable | | | 24,631 | | | | 28,545 | | | | 29,799 | |
| Interest receivable | | | 50 | | | | 60 | | | | 94 | |
| Due from Advisor | | | 367 | | | | 6,423 | | | | 9,761 | |
| Other assets | | | 34,841 | | | | 32,729 | | | | 28,552 | |
| Total assets | | | 83,260,496 | | | | 131,853,395 | | | | 198,001,496 | |
| Liabilities | |
| Payable for Fund shares redeemed | | | 3,725,318 | | | | 27,232,024 | | | | 15,952,377 | |
| Accrued Trustees' fees | | | 1,602 | | | | 2,942 | | | | 2,633 | |
| Other accrued expenses and payables | | | 54,801 | | | | 86,680 | | | | 122,403 | |
| Total liabilities | | | 3,781,721 | | | | 27,321,646 | | | | 16,077,413 | |
| Net assets, at value | | $ | 79,478,775 | | | $ | 104,531,749 | | | $ | 181,924,083 | |
| Net Assets Consist of | |
| Undistributed net investment income | | | 666,174 | | | | 821,401 | | | | 1,667,138 | |
| Net unrealized appreciation (depreciation) on investments | | | 2,967,607 | | | | 7,763,873 | | | | 13,051,219 | |
| Accumulated net realized gain (loss) | | | (12,790,807 | ) | | | (41,233,527 | ) | | | (29,465,895 | ) |
| Paid-in capital | | | 88,635,801 | | | | 137,180,002 | | | | 196,671,621 | |
| Net assets, at value | | $ | 79,478,775 | | | $ | 104,531,749 | | | $ | 181,924,083 | |
The accompanying notes are an integral part of the financial statements.
Statements of Assets and Liabilities as of February 28, 2013 (Unaudited) (continued) | |
| Net Asset Value | | DWS LifeCompass Retirement Fund | | | DWS LifeCompass 2015 Fund | | | DWS LifeCompass 2020 Fund | |
Class A Net assets applicable to shares outstanding | | $ | 25,636,677 | | | $ | 50,822,534 | | | $ | 74,551,010 | |
| Shares outstanding of beneficial interest, $.01 par value, unlimited number of shares authorized | | | 2,148,275 | | | | 4,374,072 | | | | 5,313,935 | |
Net Asset Value and redemption price per share | | $ | 11.93 | | | $ | 11.62 | | | $ | 14.03 | |
| Maximum offering price per share (100 ÷ 94.25 of net asset value) | | $ | 12.66 | | | $ | 12.33 | | | $ | 14.89 | |
Class B Net assets applicable to shares outstanding | | $ | 480,018 | | | $ | 1,071,355 | | | $ | 2,136,068 | |
| Shares outstanding of beneficial interest, $.01 par value, unlimited number of shares authorized | | | 40,219 | | | | 92,300 | | | | 153,057 | |
Net Asset Value, offering and redemption price (subject to contingent deferred sales charge) per share | | $ | 11.94 | | | $ | 11.61 | | | $ | 13.96 | |
Class C Net assets applicable to shares outstanding | | $ | 4,725,717 | | | $ | 10,431,379 | | | $ | 13,380,552 | |
| Shares outstanding of beneficial interest, $.01 par value, unlimited number of shares authorized | | | 396,256 | | | | 899,023 | | | | 958,595 | |
Net Asset Value, offering and redemption price (subject to contingent deferred sales charge) per share | | $ | 11.93 | | | $ | 11.60 | | | $ | 13.96 | |
Class S Net assets applicable to shares outstanding | | $ | 48,636,363 | | | $ | 42,206,481 | | | $ | 91,856,453 | |
| Shares outstanding of beneficial interest, $.01 par value, unlimited number of shares authorized | | | 4,076,714 | | | | 3,636,894 | | | | 6,544,463 | |
Net Asset Value, offering and redemption price per share | | $ | 11.93 | | | $ | 11.61 | | | $ | 14.04 | |
The accompanying notes are an integral part of the financial statements.
Statements of Assets and Liabilities as of February 28, 2013 (Unaudited) (continued) | |
| Assets | | DWS LifeCompass 2030 Fund | | | DWS LifeCompass 2040 Fund | |
| Investments in affiliated Underlying Funds, at value (cost $56,911,192 and $27,018,723) | | $ | 62,895,146 | | | $ | 31,790,049 | |
| Investments in non-affiliated Underlying Funds, at value (cost $2,020,450 and $1,026,984) | | | 2,228,915 | | | | 1,160,306 | |
| Total investments in securities, at value (cost $58,931,642 and $28,045,707) | | | 65,124,061 | | | | 32,950,355 | |
| Receivable for investments sold | | | 6,198,029 | | | | 10,831,544 | |
| Receivable for Fund shares sold | | | 22,367 | | | | 3,904 | |
| Dividends receivable | | | 2,433 | | | | 1,357 | |
| Interest receivable | | | 84 | | | | 39 | |
| Due from Advisor | | | 2,570 | | | | 5,532 | |
| Other assets | | | 26,039 | | | | 19,943 | |
| Total assets | | | 71,375,583 | | | | 43,812,674 | |
| Liabilities | |
| Payable for Fund shares redeemed | | | 6,996,233 | | | | 11,141,573 | |
| Accrued Trustees' fees | | | 1,483 | | | | 1,370 | |
| Other accrued expenses and payables | | | 52,507 | | | | 33,231 | |
| Total liabilities | | | 7,050,223 | | | | 11,176,174 | |
| Net assets, at value | | $ | 64,325,360 | | | $ | 32,636,500 | |
| Net Assets Consist of | |
| Undistributed net investment income | | | 194,891 | | | | 23,110 | |
| Net unrealized appreciation (depreciation) on investments | | | 6,192,419 | | | | 4,904,648 | |
| Accumulated net realized gain (loss) | | | (1,515,410 | ) | | | 1,585,750 | |
| Paid-in capital | | | 59,453,460 | | | | 26,122,992 | |
| Net assets, at value | | $ | 64,325,360 | | | $ | 32,636,500 | |
The accompanying notes are an integral part of the financial statements.
Statements of Assets and Liabilities as of February 28, 2013 (Unaudited) (continued) | |
| Net Asset Value | | DWS LifeCompass 2030 Fund | | | DWS LifeCompass 2040 Fund | |
Class A Net assets applicable to shares outstanding | | $ | 41,393,153 | | | $ | 21,516,896 | |
| Shares outstanding of beneficial interest, $.01 par value, unlimited number of shares authorized | | | 4,039,199 | | | | 2,460,479 | |
Net Asset Value and redemption price per share | | $ | 10.25 | | | $ | 8.75 | |
| Maximum offering price per share (100 ÷ 94.25 of net asset value) | | $ | 10.88 | | | $ | 9.28 | |
Class B Net assets applicable to shares outstanding | | $ | 706,803 | | | | — | |
| Shares outstanding of beneficial interest, $.01 par value, unlimited number of shares authorized | | | 68,948 | | | | — | |
Net Asset Value, offering and redemption price (subject to contingent deferred sales charge) per share | | $ | 10.25 | | | | — | |
Class C Net assets applicable to shares outstanding | | $ | 4,701,288 | | | $ | 261,326 | |
| Shares outstanding of beneficial interest, $.01 par value, unlimited number of shares authorized | | | 458,895 | | | | 29,910 | |
Net Asset Value, offering and redemption price (subject to contingent deferred sales charge) per share | | $ | 10.24 | | | $ | 8.74 | |
Class S Net assets applicable to shares outstanding | | $ | 17,524,116 | | | $ | 10,858,278 | |
| Shares outstanding of beneficial interest, $.01 par value, unlimited number of shares authorized | | | 1,710,406 | | | | 1,240,393 | |
Net Asset Value, offering and redemption price per share | | $ | 10.25 | | | $ | 8.75 | |
The accompanying notes are an integral part of the financial statements.
| for the six months ended February 28, 2013 (Unaudited) | |
| Investment Income | | DWS LifeCompass Retirement Fund | | | DWS LifeCompass 2015 Fund | | | DWS LifeCompass 2020 Fund | |
| Income distributions from affiliated Underlying Funds | | $ | 1,147,583 | | | $ | 1,799,166 | | | $ | 2,575,560 | |
| Dividends | | | 51,689 | | | | 231,081 | | | | 317,059 | |
| Total income | | | 1,199,272 | | | | 2,030,247 | | | | 2,892,619 | |
Expenses: Administration fee | | | 42,156 | | | | 68,519 | | | | 99,198 | |
| Services to shareholders | | | 70,605 | | | | 143,629 | | | | 221,148 | |
| Distribution and service fees | | | 60,004 | | | | 125,440 | | | | 173,310 | |
| Custodian fee | | | 7,232 | | | | 7,055 | | | | 7,187 | |
| Audit and tax fees | | | 22,082 | | | | 22,141 | | | | 22,106 | |
| Legal fees | | | 7,356 | | | | 7,510 | | | | 5,620 | |
| Reports to shareholders | | | 10,565 | | | | 10,693 | | | | 17,579 | |
| Registration fees | | | 18,966 | | | | 21,326 | | | | 26,416 | |
| Trustees' fees and expenses | | | 1,475 | | | | 2,849 | | | | 4,847 | |
| Other | | | 3,387 | | | | 3,934 | | | | 4,236 | |
| Total expenses before expense reductions | | | 243,828 | | | | 413,096 | | | | 581,647 | |
| Expense reductions | | | (82,659 | ) | | | (127,797 | ) | | | (176,909 | ) |
| Total expenses after expense reductions | | | 161,169 | | | | 285,299 | | | | 404,738 | |
| Net investment income | | | 1,038,103 | | | | 1,744,948 | | | | 2,487,881 | |
| Realized and Unrealized Gain (Loss) | |
Net realized gain (loss) from: Sale of affiliated Underlying Funds | | | 518,688 | | | | 939,764 | | | | 1,570,732 | |
| Sale of non-affiliated Underlying Funds | | | 156,943 | | | | 183,985 | | | | 871,243 | |
| Capital gain distributions from affiliated Underlying Funds | | | 515,192 | | | | 631,250 | | | | 807,945 | |
| Capital gain distributions from non-affiliated Underlying Funds | | | — | | | | 3,961 | | | | — | |
| | | | 1,190,823 | | | | 1,758,960 | | | | 3,249,920 | |
| Change in net unrealized appreciation (depreciation) on investments | | | 1,266,022 | | | | 3,620,249 | | | | 5,919,586 | |
| Net gain (loss) | | | 2,456,845 | | | | 5,379,209 | | | | 9,169,506 | |
| Net increase (decrease) in net assets resulting from operations | | $ | 3,494,948 | | | $ | 7,124,157 | | | $ | 11,657,387 | |
The accompanying notes are an integral part of the financial statements.
Statements of Operations for the six months ended February 28, 2013 (Unaudited) (continued) | |
| Investment Income | | DWS LifeCompass 2030 Fund | | | DWS LifeCompass 2040 Fund | |
| Income distributions from affiliated Underlying Funds | | $ | 940,749 | | | $ | 575,764 | |
| Dividends | | | 101,425 | | | | 57,263 | |
| Total income | | | 1,042,174 | | | | 633,027 | |
Expenses: Administration fee | | | 34,831 | | | | 20,871 | |
| Services to shareholders | | | 77,163 | | | | 46,961 | |
| Distribution and service fees | | | 77,742 | | | | 27,908 | |
| Custodian fee | | | 5,661 | | | | 5,568 | |
| Audit and tax fees | | | 22,186 | | | | 21,413 | |
| Legal fees | | | 6,165 | | | | 5,785 | |
| Reports to shareholders | | | 8,740 | | | | 6,832 | |
| Registration fees | | | 23,141 | | | | 18,603 | |
| Trustees' fees and expenses | | | 2,094 | | | | 1,539 | |
| Other | | | 2,900 | | | | 2,586 | |
| Total expenses before expense reductions | | | 260,623 | | | | 158,066 | |
| Expense reductions | | | (101,434 | ) | | | (82,449 | ) |
| Total expenses after expense reductions | | | 159,189 | | | | 75,617 | |
| Net investment income | | | 882,985 | | | | 557,410 | |
| Realized and Unrealized Gain (Loss) | |
Net realized gain (loss) from: Sale of affiliated Underlying Funds | | | 1,750,609 | | | | 1,526,716 | |
| Sale of non-affiliated Underlying Funds | | | 519,906 | | | | 315,146 | |
| Capital gain distributions from affiliated Underlying Funds | | | 189,427 | | | | 61,559 | |
| | | | 2,459,942 | | | | 1,903,421 | |
| Change in net unrealized appreciation (depreciation) on investments | | | 1,678,064 | | | | 908,603 | |
| Net gain (loss) | | | 4,138,006 | | | | 2,812,024 | |
| Net increase (decrease) in net assets resulting from operations | | $ | 5,020,991 | | | $ | 3,369,434 | |
The accompanying notes are an integral part of the financial statements.
Statements of Changes in Net Assets | DWS LifeCompass Retirement Fund | |
| Increase (Decrease) in Net Assets | | Six Months Ended February 28, 2013 (Unaudited) | | | Year Ended August 31, 2012 | |
Operations: Net investment income | | $ | 1,038,103 | | | $ | 1,796,658 | |
| Net realized gain (loss) | | | 1,190,823 | | | | 3,126,882 | |
| Change in net unrealized appreciation (depreciation) | | | 1,266,022 | | | | 680,690 | |
| Net increase (decrease) in net assets resulting from operations | | | 3,494,948 | | | | 5,604,230 | |
Distributions to shareholders from: Net investment income: Class A | | | (276,125 | ) | | | (489,850 | ) |
| Class B | | | (3,590 | ) | | | (12,122 | ) |
| Class C | | | (31,333 | ) | | | (67,176 | ) |
| Class S | | | (597,475 | ) | | | (1,209,417 | ) |
| Total distributions | | | (908,523 | ) | | | (1,778,565 | ) |
Fund share transactions: Proceeds from shares sold | | | 3,394,649 | | | | 21,387,872 | |
| Reinvestment of distributions | | | 856,199 | | | | 1,669,497 | |
| Payments for shares redeemed | | | (15,161,472 | ) | | | (27,513,642 | ) |
| Net increase (decrease) in net assets from Fund share transactions | | | (10,910,624 | ) | | | (4,456,273 | ) |
| Increase (decrease) in net assets | | | (8,324,199 | ) | | | (630,608 | ) |
| Net assets at beginning of period | | | 87,802,974 | | | | 88,433,582 | |
| Net assets at end of period (including undistributed net investment income of $666,174 and $536,594, respectively) | | $ | 79,478,775 | | | $ | 87,802,974 | |
The accompanying notes are an integral part of the financial statements.
Statements of Changes in Net Assets (continued) | |
| DWS LifeCompass 2015 Fund | |
| Increase (Decrease) in Net Assets | | Six Months Ended February 28, 2013 (Unaudited) | | | Year Ended August 31, 2012 | |
Operations: Net investment income | | $ | 1,744,948 | | | $ | 2,709,901 | |
| Net realized gain (loss) | | | 1,758,960 | | | | 7,130,138 | |
| Change in net unrealized appreciation (depreciation) | | | 3,620,249 | | | | 667,092 | |
| Net increase (decrease) in net assets resulting from operations | | | 7,124,157 | | | | 10,507,131 | |
Distributions to shareholders from: Net investment income: Class A | | | (533,710 | ) | | | (1,197,809 | ) |
| Class B | | | (7,501 | ) | | | (27,607 | ) |
| Class C | | | (61,148 | ) | | | (146,265 | ) |
| Class S | | | (777,212 | ) | | | (1,581,986 | ) |
| Total distributions | | | (1,379,571 | ) | | | (2,953,667 | ) |
Fund share transactions: Proceeds from shares sold | | | 7,083,163 | | | | 21,387,569 | |
| Reinvestment of distributions | | | 1,355,118 | | | | 2,895,880 | |
| Payments for shares redeemed | | | (51,615,578 | ) | | | (38,894,054 | ) |
| Net increase (decrease) in net assets from Fund share transactions | | | (43,177,297 | ) | | | (14,610,605 | ) |
| Increase (decrease) in net assets | | | (37,432,711 | ) | | | (7,057,141 | ) |
| Net assets at beginning of period | | | 141,964,460 | | | | 149,021,601 | |
| Net assets at end of period (including undistributed net investment income of $821,401 and $456,024, respectively) | | $ | 104,531,749 | | | $ | 141,964,460 | |
The accompanying notes are an integral part of the financial statements.
Statements of Changes in Net Assets (continued) | |
| DWS LifeCompass 2020 Fund | |
| Increase (Decrease) in Net Assets | | Six Months Ended February 28, 2013 (Unaudited) | | | Year Ended August 31, 2012 | |
Operations: Net investment income | | $ | 2,487,881 | | | $ | 3,635,541 | |
| Net realized gain (loss) | | | 3,249,920 | | | | 9,350,944 | |
| Change in net unrealized appreciation (depreciation) | | | 5,919,586 | | | | 2,743,520 | |
| Net increase (decrease) in net assets resulting from operations | | | 11,657,387 | | | | 15,730,005 | |
Distributions to shareholders from: Net investment income: Class A | | | (1,459,194 | ) | | | (1,502,293 | ) |
| Class B | | | (28,814 | ) | | | (45,397 | ) |
| Class C | | | (154,707 | ) | | | (169,327 | ) |
| Class S | | | (2,258,510 | ) | | | (2,284,134 | ) |
| Total distributions | | | (3,901,225 | ) | | | (4,001,151 | ) |
Fund share transactions: Proceeds from shares sold | | | 10,933,406 | | | | 47,424,798 | |
| Reinvestment of distributions | | | 3,814,271 | | | | 3,911,051 | |
| Payments for shares redeemed | | | (42,304,924 | ) | | | (68,411,756 | ) |
| Net increase (decrease) in net assets from Fund share transactions | | | (27,557,247 | ) | | | (17,075,907 | ) |
| Increase (decrease) in net assets | | | (19,801,085 | ) | | | (5,347,053 | ) |
| Net assets at beginning of period | | | 201,725,168 | | | | 207,072,221 | |
| Net assets at end of period (including undistributed net investment income of $1,667,138 and $3,080,482, respectively) | | $ | 181,924,083 | | | $ | 201,725,168 | |
The accompanying notes are an integral part of the financial statements.
Statements of Changes in Net Assets (continued) | |
| DWS LifeCompass 2030 Fund | |
| Increase (Decrease) in Net Assets | | Six Months Ended February 28, 2013 (Unaudited) | | | Years Ended August 31, 2012 | |
Operations: Net investment income | | $ | 882,985 | | | $ | 898,048 | |
| Net realized gain (loss) | | | 2,459,942 | | | | 2,717,731 | |
| Change in net unrealized appreciation (depreciation) | | | 1,678,064 | | | | 1,383,611 | |
| Net increase (decrease) in net assets resulting from operations | | | 5,020,991 | | | | 4,999,390 | |
Distributions to shareholders from: Net investment income: Class A | | | (690,169 | ) | | | (559,338 | ) |
| Class B | | | (6,214 | ) | | | (8,276 | ) |
| Class C | | | (40,054 | ) | | | (30,766 | ) |
| Class S | | | (424,344 | ) | | | (330,616 | ) |
| Total distributions | | | (1,160,781 | ) | | | (928,996 | ) |
Fund share transactions: Proceeds from shares sold | | | 9,916,338 | | | | 20,589,069 | |
| Reinvestment of distributions | | | 1,154,676 | | | | 924,310 | |
| Payments for shares redeemed | | | (18,099,224 | ) | | | (20,322,985 | ) |
| Net increase (decrease) in net assets from Fund share transactions | | | (7,028,210 | ) | | | 1,190,394 | |
| Increase (decrease) in net assets | | | (3,168,000 | ) | | | 5,260,788 | |
| Net assets at beginning of period | | | 67,493,360 | | | | 62,232,572 | |
| Net assets at end of period (including undistributed net investment income of $194,891 and $472,687, respectively) | | $ | 64,325,360 | | | $ | 67,493,360 | |
The accompanying notes are an integral part of the financial statements.
Statements of Changes in Net Assets (continued) | |
| DWS LifeCompass 2040 Fund | |
| Increase (Decrease) in Net Assets | | Six Months Ended February 28, 2013 (Unaudited) | | | Year Ended August 31, 2012 | |
Operations: Net investment income | | $ | 557,410 | | | $ | 490,192 | |
| Net realized gain (loss) | | | 1,903,421 | | | | 207,536 | |
| Change in net unrealized appreciation (depreciation) | | | 908,603 | | | | 2,088,450 | |
| Net increase (decrease) in net assets resulting from operations | | | 3,369,434 | | | | 2,786,178 | |
Distributions to shareholders from: Net investment income: Class A | | | (314,923 | ) | | | (258,932 | ) |
| Class C | | | (1,747 | ) | | | (1,209 | ) |
| Class S | | | (332,082 | ) | | | (239,720 | ) |
Net realized gains: Class A | | | (157,332 | ) | | | (417,665 | ) |
| Class C | | | (1,860 | ) | | | (4,452 | ) |
| Class S | | | (140,701 | ) | | | (325,057 | ) |
| Total distributions | | | (948,645 | ) | | | (1,247,035 | ) |
Fund share transactions: Proceeds from shares sold | | | 7,851,407 | | | | 17,486,885 | |
| Reinvestment of distributions | | | 948,565 | | | | 1,247,035 | |
| Payments for shares redeemed | | | (18,500,578 | ) | | | (11,637,070 | ) |
| Net increase (decrease) in net assets from Fund share transactions | | | (9,700,606 | ) | | | 7,096,850 | |
| Increase (decrease) in net assets | | | (7,279,817 | ) | | | 8,635,993 | |
| Net assets at beginning of period | | | 39,916,317 | | | | 31,280,324 | |
| Net assets at end of period (including undistributed net investment income of $23,110 and $114,452, respectively) | | $ | 32,636,500 | | | $ | 39,916,317 | |
The accompanying notes are an integral part of the financial statements.
| DWS LifeCompass Retirement Fund — Class A | |
| | | | | | Years Ended August 31, | |
| | Six Months Ended 2/28/13 (Unaudited) | | | 2012 | | | 2011 | | | 2010 | | | 2009 | | | 2008 | |
| Selected Per Share Data | |
| Net asset value, beginning of period | | $ | 11.58 | | | $ | 11.06 | | | $ | 10.47 | | | $ | 10.08 | | | $ | 11.49 | | | $ | 12.51 | |
Income (loss) from investment operations: Net investment incomea | | | .14 | | | | .22 | | | | .24 | | | | .25 | | | | .36 | | | | .40 | |
| Net realized and unrealized gain (loss) | | | .33 | | | | .52 | | | | .58 | | | | .42 | | | | (1.36 | ) | | | (.98 | ) |
| Total from investment operations | | | .47 | | | | .74 | | | | .82 | | | | .67 | | | | (1.00 | ) | | | (.58 | ) |
Less distributions from: Net investment income | | | (.12 | ) | | | (.22 | ) | | | (.23 | ) | | | (.28 | ) | | | (.41 | ) | | | (.44 | ) |
| Net asset value, end of period | | $ | 11.93 | | | $ | 11.58 | | | $ | 11.06 | | | $ | 10.47 | | | $ | 10.08 | | | $ | 11.49 | |
Total Return (%)b,c,d | | | 4.08 | ** | | | 6.79 | | | | 7.81 | | | | 6.67 | | | | (8.29 | ) | | | (4.76 | ) |
| Ratios to Average Net Assets and Supplemental Data | |
| Net assets, end of period ($ millions) | | | 26 | | | | 29 | | | | 27 | | | | 31 | | | | 31 | | | | 34 | |
Ratio of expenses before expense reductions (%)e | | | .71 | * | | | .74 | | | | .71 | | | | .74 | | | | .77 | | | | .69 | |
Ratio of expenses after expense reductions (%)e | | | .49 | * | | | .62 | | | | .62 | | | | .61 | | | | .52 | | | | .56 | |
| Ratio of net investment income (%) | | | 2.35 | * | | | 1.99 | | | | 2.12 | | | | 2.39 | | | | 3.84 | | | | 3.24 | |
| Portfolio turnover rate (%) | | | 15 | ** | | | 53 | | | | 37 | | | | 53 | | | | 41 | | | | 48 | |
a Based on average shares outstanding during the period. b Total return does not reflect the effect of any sales charge. c Total return would have been lower had certain expenses not been reduced. d Total return would have been lower if the Advisor had not reduced some Underlying Funds' expenses. e The Fund invests in other Funds and indirectly bears its proportionate share of fees and expenses incurred by the Underlying Funds in which the Fund is invested. This ratio does not include these indirect fees and expenses. * Annualized ** Not annualized | |
| DWS LifeCompass Retirement Fund — Class B | |
| | | | | | Years Ended August 31, | |
| | Six Months Ended 2/28/13 (Unaudited) | | | 2012 | | | 2011 | | | 2010 | | | 2009 | | | 2008 | |
| Selected Per Share Data | |
| Net asset value, beginning of period | | $ | 11.58 | | | $ | 11.06 | | | $ | 10.47 | | | $ | 10.08 | | | $ | 11.49 | | | $ | 12.52 | |
Income (loss) from investment operations: Net investment incomea | | | .09 | | | | .14 | | | | .15 | | | | .17 | | | | .29 | | | | .30 | |
| Net realized and unrealized gain (loss) | | | .35 | | | | .52 | | | | .58 | | | | .42 | | | | (1.36 | ) | | | (.97 | ) |
| Total from investment operations | | | .44 | | | | .66 | | | | .73 | | | | .59 | | | | (1.07 | ) | | | (.67 | ) |
Less distributions from: Net investment income | | | (.08 | ) | | | (.14 | ) | | | (.14 | ) | | | (.20 | ) | | | (.34 | ) | | | (.36 | ) |
| Net asset value, end of period | | $ | 11.94 | | | $ | 11.58 | | | $ | 11.06 | | | $ | 10.47 | | | $ | 10.08 | | | $ | 11.49 | |
Total Return (%)b,c,d | | | 3.77 | ** | | | 5.99 | | | | 7.00 | | | | 5.87 | | | | (8.99 | ) | | | (5.46 | ) |
| Ratios to Average Net Assets and Supplemental Data | |
| Net assets, end of period ($ millions) | | | .5 | | | | 1 | | | | 1 | | | | 2 | | | | 3 | | | | 6 | |
Ratio of expenses before expense reductions (%)e | | | 1.50 | * | | | 1.48 | | | | 1.43 | | | | 1.43 | | | | 1.56 | | | | 1.42 | |
Ratio of expenses after expense reductions (%)e | | | 1.24 | * | | | 1.37 | | | | 1.37 | | | | 1.36 | | | | 1.27 | | | | 1.31 | |
| Ratio of net investment income (%) | | | 1.58 | * | | | 1.24 | | | | 1.37 | | | | 1.64 | | | | 3.09 | | | | 2.49 | |
| Portfolio turnover rate (%) | | | 15 | ** | | | 53 | | | | 37 | | | | 53 | | | | 41 | | | | 48 | |
a Based on average shares outstanding during the period. b Total return does not reflect the effect of any sales charge. c Total return would have been lower had certain expenses not been reduced. d Total return would have been lower if the Advisor had not reduced some Underlying Funds' expenses. e The Fund invests in other Funds and indirectly bears its proportionate share of fees and expenses incurred by the Underlying Funds in which the Fund is invested. This ratio does not include these indirect fees and expenses. * Annualized ** Not annualized | |
| DWS LifeCompass Retirement Fund — Class C | |
| | | | | | Years Ended August 31, | |
| | Six Months Ended 2/28/13 (Unaudited) | | | 2012 | | | 2011 | | | 2010 | | | 2009 | | | 2008 | |
| Selected Per Share Data | |
| Net asset value, beginning of period | | $ | 11.57 | | | $ | 11.05 | | | $ | 10.46 | | | $ | 10.07 | | | $ | 11.49 | | | $ | 12.52 | |
Income (loss) from investment operations: Net investment incomea | | | .09 | | | | .14 | | | | .15 | | | | .17 | | | | .29 | | | | .31 | |
| Net realized and unrealized gain (loss) | | | .34 | | | | .52 | | | | .58 | | | | .42 | | | | (1.37 | ) | | | (.98 | ) |
| Total from investment operations | | | .43 | | | | .66 | | | | .73 | | | | .59 | | | | (1.08 | ) | | | (.67 | ) |
Less distributions from: Net investment income | | | (.07 | ) | | | (.14 | ) | | | (.14 | ) | | | (.20 | ) | | | (.34 | ) | | | (.36 | ) |
| Net asset value, end of period | | $ | 11.93 | | | $ | 11.57 | | | $ | 11.05 | | | $ | 10.46 | | | $ | 10.07 | | | $ | 11.49 | |
Total Return (%)b,c,d | | | 3.77 | ** | | | 6.00 | | | | 7.01 | | | | 5.88 | | | | (9.06 | ) | | | (5.43 | ) |
| Ratios to Average Net Assets and Supplemental Data | |
| Net assets, end of period ($ millions) | | | 5 | | | | 5 | | | | 6 | | | | 7 | | | | 8 | | | | 13 | |
Ratio of expenses before expense reductions (%)e | | | 1.42 | * | | | 1.43 | | | | 1.40 | | | | 1.40 | | | | 1.45 | | | | 1.38 | |
Ratio of expenses after expense reductions (%)e | | | 1.24 | * | | | 1.37 | | | | 1.37 | | | | 1.36 | | | | 1.27 | | | | 1.29 | |
| Ratio of net investment income (%) | | | 1.59 | * | | | 1.23 | | | | 1.37 | | | | 1.64 | | | | 3.09 | | | | 2.51 | |
| Portfolio turnover rate (%) | | | 15 | ** | | | 53 | | | | 37 | | | | 53 | | | | 41 | | | | 48 | |
a Based on average shares outstanding during the period. b Total return does not reflect the effect of any sales charge. c Total return would have been lower had certain expenses not been reduced. d Total return would have been lower if the Advisor had not reduced some Underlying Funds' expenses. e The Fund invests in other Funds and indirectly bears its proportionate share of fees and expenses incurred by the Underlying Funds in which the Fund is invested. This ratio does not include these indirect fees and expenses. * Annualized ** Not annualized | |
| DWS LifeCompass Retirement Fund — Class S | |
| | | | | | Years Ended August 31, | |
| | Six Months Ended 2/28/13 (Unaudited) | | | 2012 | | | 2011 | | | 2010 | | | 2009 | | | 2008 | |
| Selected Per Share Data | |
| Net asset value, beginning of period | | $ | 11.57 | | | $ | 11.06 | | | $ | 10.46 | | | $ | 10.08 | | | $ | 11.49 | | | $ | 12.51 | |
Income (loss) from investment operations: Net investment incomea | | | .15 | | | | .25 | | | | .26 | | | | .28 | | | | .38 | | | | .43 | |
| Net realized and unrealized gain (loss) | | | .34 | | | | .51 | | | | .59 | | | | .41 | | | | (1.35 | ) | | | (.98 | ) |
| Total from investment operations | | | .49 | | | | .76 | | | | .85 | | | | .69 | | | | (.97 | ) | | | (.55 | ) |
Less distributions from: Net investment income | | | (.13 | ) | | | (.25 | ) | | | (.25 | ) | | | (.31 | ) | | | (.44 | ) | | | (.47 | ) |
| Net asset value, end of period | | $ | 11.93 | | | $ | 11.57 | | | $ | 11.06 | | | $ | 10.46 | | | $ | 10.08 | | | $ | 11.49 | |
Total Return (%)b,c | | | 4.30 | ** | | | 6.97 | | | | 8.18 | | | | 6.84 | | | | (8.04 | ) | | | (4.52 | ) |
| Ratios to Average Net Assets and Supplemental Data | |
| Net assets, end of period ($ millions) | | | 49 | | | | 53 | | | | 54 | | | | 53 | | | | 53 | | | | 71 | |
Ratio of expenses before expense reductions (%)d | | | .42 | * | | | .45 | | | | .39 | | | | .42 | | | | .50 | | | | .44 | |
Ratio of expenses after expense reductions (%)d | | | .24 | * | | | .37 | | | | .37 | | | | .36 | | | | .27 | | | | .30 | |
| Ratio of net investment income (%) | | | 2.61 | * | | | 2.20 | | | | 2.37 | | | | 2.64 | | | | 4.09 | | | | 3.50 | |
| Portfolio turnover rate (%) | | | 15 | ** | | | 53 | | | | 37 | | | | 53 | | | | 41 | | | | 48 | |
a Based on average shares outstanding during the period. b Total return would have been lower had certain expenses not been reduced. c Total return would have been lower if the Advisor had not reduced some Underlying Funds' expenses. d The Fund invests in other Funds and indirectly bears its proportionate share of fees and expenses incurred by the Underlying Funds in which the Fund is invested. This ratio does not include these indirect fees and expenses. * Annualized ** Not annualized | |
| DWS LifeCompass 2015 Fund — Class A | |
| | | | | | Years Ended August 31, | |
| | Six Months Ended 2/28/13 (Unaudited) | | | 2012 | | | 2011 | | | 2010 | | | 2009 | | | 2008 | |
| Selected Per Share Data | |
| Net asset value, beginning of period | | $ | 11.14 | | | $ | 10.57 | | | $ | 9.70 | | | $ | 9.39 | | | $ | 11.12 | | | $ | 12.47 | |
Income (loss) from investment operations: Net investment incomea | | | .14 | | | | .20 | | | | .20 | | | | .20 | | | | .26 | | | | .29 | |
| Net realized and unrealized gain (loss) | | | .45 | | | | .58 | | | | .85 | | | | .33 | | | | (1.68 | ) | | | (1.20 | ) |
| Total from investment operations | | | .59 | | | | .78 | | | | 1.05 | | | | .53 | | | | (1.42 | ) | | | (.91 | ) |
Less distributions from: Net investment income | | | (.11 | ) | | | (.21 | ) | | | (.18 | ) | | | (.22 | ) | | | (.31 | ) | | | (.44 | ) |
| Net asset value, end of period | | $ | 11.62 | | | $ | 11.14 | | | $ | 10.57 | | | $ | 9.70 | | | $ | 9.39 | | | $ | 11.12 | |
Total Return (%)b,c,d | | | 5.32 | ** | | | 7.54 | | | | 10.80 | | | | 5.61 | | | | (12.46 | ) | | | (7.39 | ) |
| Ratios to Average Net Assets and Supplemental Data | |
| Net assets, end of period ($ millions) | | | 51 | | | | 58 | | | | 63 | | | | 70 | | | | 77 | | | | 97 | |
Ratio of expenses before expense reductions (%)e | | | .66 | * | | | .66 | | | | .65 | | | | .65 | | | | .69 | | | | .64 | |
Ratio of expenses after expense reductions (%)e | | | .48 | * | | | .58 | | | | .58 | | | | .57 | | | | .48 | | | | .51 | |
| Ratio of net investment income (%) | | | 2.48 | * | | | 1.83 | | | | 1.88 | | | | 2.02 | | | | 3.05 | | | | 2.37 | |
| Portfolio turnover rate (%) | | | 19 | ** | | | 39 | | | | 31 | | | | 51 | | | | 32 | | | | 29 | |
a Based on average shares outstanding during the period. b Total return does not reflect the effect of any sales charge. c Total return would have been lower had certain expenses not been reduced. d Total return would have been lower if the Advisor had not reduced some Underlying Funds' expenses. e The Fund invests in other Funds and indirectly bears its proportionate share of fees and expenses incurred by the Underlying Funds in which the Fund is invested. This ratio does not include these indirect fees and expenses. * Annualized ** Not annualized | |
| DWS LifeCompass 2015 Fund — Class B | |
| | | | | | Years Ended August 31, | |
| | Six Months Ended 2/28/13 (Unaudited) | | | 2012 | | | 2011 | | | 2010 | | | 2009 | | | 2008 | |
| Selected Per Share Data | |
| Net asset value, beginning of period | | $ | 11.13 | | | $ | 10.55 | | | $ | 9.69 | | | $ | 9.38 | | | $ | 11.11 | | | $ | 12.47 | |
Income (loss) from investment operations: Net investment incomea | | | .10 | | | | .12 | | | | .12 | | | | .13 | | | | .20 | | | | .19 | |
| Net realized and unrealized gain (loss) | | | .45 | | | | .59 | | | | .84 | | | | .32 | | | | (1.69 | ) | | | (1.19 | ) |
| Total from investment operations | | | .55 | | | | .71 | | | | .96 | | | | .45 | | | | (1.49 | ) | | | (1.00 | ) |
Less distributions from: Net investment income | | | (.07 | ) | | | (.13 | ) | | | (.10 | ) | | | (.14 | ) | | | (.24 | ) | | | (.36 | ) |
| Net asset value, end of period | | $ | 11.61 | | | $ | 11.13 | | | $ | 10.55 | | | $ | 9.69 | | | $ | 9.38 | | | $ | 11.11 | |
Total Return (%)b,c,d | | | 4.92 | ** | | | 6.84 | | | | 9.88 | | | | 4.82 | | | | (13.14 | ) | | | (8.06 | ) |
| Ratios to Average Net Assets and Supplemental Data | |
| Net assets, end of period ($ millions) | | | 1 | | | | 1 | | | | 3 | | | | 7 | | | | 10 | | | | 17 | |
Ratio of expenses before expense reductions (%)e | | | 1.57 | * | | | 1.54 | | | | 1.45 | | | | 1.37 | | | | 1.48 | | | | 1.39 | |
Ratio of expenses after expense reductions (%)e | | | 1.23 | * | | | 1.33 | | | | 1.33 | | | | 1.32 | | | | 1.23 | | | | 1.26 | |
| Ratio of net investment income (%) | | | 1.72 | * | | | 1.13 | | | | 1.13 | | | | 1.27 | | | | 2.30 | | | | 1.62 | |
| Portfolio turnover rate (%) | | | 19 | ** | | | 39 | | | | 31 | | | | 51 | | | | 32 | | | | 29 | |
a Based on average shares outstanding during the period. b Total return does not reflect the effect of any sales charge. c Total return would have been lower had certain expenses not been reduced. d Total return would have been lower if the Advisor had not reduced some Underlying Funds' expenses. e The Fund invests in other Funds and indirectly bears its proportionate share of fees and expenses incurred by the Underlying Funds in which the Fund is invested. This ratio does not include these indirect fees and expenses. * Annualized ** Not annualized | |
| DWS LifeCompass 2015 Fund — Class C | |
| | | | | | Years Ended August 31, | |
| | Six Months Ended 2/28/13 (Unaudited) | | | 2012 | | | 2011 | | | 2010 | | | 2009 | | | 2008 | |
| Selected Per Share Data | |
| Net asset value, beginning of period | | $ | 11.13 | | | $ | 10.55 | | | $ | 9.69 | | | $ | 9.38 | | | $ | 11.10 | | | $ | 12.47 | |
Income (loss) from investment operations: Net investment incomea | | | .10 | | | | .12 | | | | .12 | | | | .13 | | | | .20 | | | | .20 | |
| Net realized and unrealized gain (loss) | | | .44 | | | | .59 | | | | .84 | | | | .32 | | | | (1.68 | ) | | | (1.20 | ) |
| Total from investment operations | | | .54 | | | | .71 | | | | .96 | | | | .45 | | | | (1.48 | ) | | | (1.00 | ) |
Less distributions from: Net investment income | | | (.07 | ) | | | (.13 | ) | | | (.10 | ) | | | (.14 | ) | | | (.24 | ) | | | (.37 | ) |
| Net asset value, end of period | | $ | 11.60 | | | $ | 11.13 | | | $ | 10.55 | | | $ | 9.69 | | | $ | 9.38 | | | $ | 11.10 | |
Total Return (%)b,c,d | | | 4.83 | ** | | | 6.84 | | | | 9.89 | | | | 4.83 | | | | (13.05 | ) | | | (8.12 | ) |
| Ratios to Average Net Assets and Supplemental Data | |
| Net assets, end of period ($ millions) | | | 10 | | | | 11 | | | | 13 | | | | 15 | | | | 18 | | | | 28 | |
Ratio of expenses before expense reductions (%)e | | | 1.36 | * | | | 1.38 | | | | 1.36 | | | | 1.34 | | | | 1.41 | | | | 1.33 | |
Ratio of expenses after expense reductions (%)e | | | 1.23 | * | | | 1.33 | | | | 1.33 | | | | 1.32 | | | | 1.23 | | | | 1.25 | |
| Ratio of net investment income (%) | | | 1.71 | * | | | 1.10 | | | | 1.13 | | | | 1.28 | | | | 2.30 | | | | 1.63 | |
| Portfolio turnover rate (%) | | | 19 | ** | | | 39 | | | | 31 | | | | 51 | | | | 32 | | | | 29 | |
a Based on average shares outstanding during the period. b Total return does not reflect the effect of any sales charge. c Total return would have been lower had certain expenses not been reduced. d Total return would have been lower if the Advisor had not reduced some Underlying Funds' expenses. e The Fund invests in other Funds and indirectly bears its proportionate share of fees and expenses incurred by the Underlying Funds in which the Fund is invested. This ratio does not include these indirect fees and expenses. * Annualized ** Not annualized | |
| DWS LifeCompass 2015 Fund — Class S | |
| | | | | | Years Ended August 31, | |
| | Six Months Ended 2/28/13 (Unaudited) | | | 2012 | | | 2011 | | | 2010 | | | 2009 | | | 2008 | |
| Selected Per Share Data | |
| Net asset value, beginning of period | | $ | 11.13 | | | $ | 10.55 | | | $ | 9.69 | | | $ | 9.38 | | | $ | 11.11 | | | $ | 12.45 | |
Income (loss) from investment operations: Net investment incomea | | | .15 | | | | .22 | | | | .23 | | | | .22 | | | | .28 | | | | .32 | |
| Net realized and unrealized gain (loss) | | | .45 | | | | .60 | | | | .84 | | | | .33 | | | | (1.68 | ) | | | (1.19 | ) |
| Total from investment operations | | | .60 | | | | .82 | | | | 1.07 | | | | .55 | | | | (1.40 | ) | | | (.87 | ) |
Less distributions from: Net investment income | | | (.12 | ) | | | (.24 | ) | | | (.21 | ) | | | (.24 | ) | | | (.33 | ) | | | (.47 | ) |
| Net asset value, end of period | | $ | 11.61 | | | $ | 11.13 | | | $ | 10.55 | | | $ | 9.69 | | | $ | 9.38 | | | $ | 11.11 | |
Total Return (%)b,c | | | 5.37 | ** | | | 7.92 | | | | 10.98 | | | | 5.89 | | | | (12.25 | ) | | | (7.10 | ) |
| Ratios to Average Net Assets and Supplemental Data | |
| Net assets, end of period ($ millions) | | | 42 | | | | 71 | | | | 70 | | | | 73 | | | | 71 | | | | 100 | |
Ratio of expenses before expense reductions (%)d | | | .43 | * | | | .44 | | | | .42 | | | | .41 | | | | .46 | | | | .41 | |
Ratio of expenses after expense reductions (%)d | | | .23 | * | | | .33 | | | | .33 | | | | .32 | | | | .23 | | | | .26 | |
| Ratio of net investment income (%) | | | 2.74 | * | | | 2.07 | | | | 2.13 | | | | 2.27 | | | | 3.30 | | | | 2.62 | |
| Portfolio turnover rate (%) | | | 19 | ** | | | 39 | | | | 31 | | | | 51 | | | | 32 | | | | 29 | |
a Based on average shares outstanding during the period. b Total return would have been lower had certain expenses not been reduced. c Total return would have been lower if the Advisor had not reduced some Underlying Funds' expenses. d The Fund invests in other Funds and indirectly bears its proportionate share of fees and expenses incurred by the Underlying Funds in which the Fund is invested. This ratio does not include these indirect fees and expenses. * Annualized ** Not annualized | |
| DWS LifeCompass 2020 Fund — Class A | |
| | | | | | Years Ended August 31, | |
| | Six Months Ended 2/28/13 (Unaudited) | | | 2012 | | | 2011 | | | 2010 | | | 2009 | | | 2008 | |
| Selected Per Share Data | |
| Net asset value, beginning of period | | $ | 13.50 | | | $ | 12.74 | | | $ | 11.56 | | | $ | 11.21 | | | $ | 13.66 | | | $ | 15.47 | |
Income (loss) from investment operations: Net investment incomea | | | .17 | | | | .22 | | | | .22 | | | | .21 | | | | .27 | | | | .29 | |
| Net realized and unrealized gain (loss) | | | .62 | | | | .78 | | | | 1.18 | | | | .36 | | | | (2.27 | ) | | | (1.55 | ) |
| Total from investment operations | | | .79 | | | | 1.00 | | | | 1.40 | | | | .57 | | | | (2.00 | ) | | | (1.26 | ) |
Less distributions from: Net investment income | | | (.26 | ) | | | (.24 | ) | | | (.22 | ) | | | (.23 | ) | | | (.37 | ) | | | (.55 | ) |
| Net realized gains | | | — | | | | — | | | | — | | | | — | | | | (.08 | ) | | | — | |
| Total distributions | | | (.26 | ) | | | (.24 | ) | | | (.22 | ) | | | (.23 | ) | | | (.45 | ) | | | (.55 | ) |
| Increase from regulatory settlements | | | — | | | | — | | | | — | | | | .01 | f | | | — | | | | — | |
| Net asset value, end of period | | $ | 14.03 | | | $ | 13.50 | | | $ | 12.74 | | | $ | 11.56 | | | $ | 11.21 | | | $ | 13.66 | |
Total Return (%)b,c,d | | | 5.94 | ** | | | 8.01 | | | | 12.08 | | | | 5.10 | f | | | (14.08 | ) | | | (8.48 | ) |
| Ratios to Average Net Assets and Supplemental Data | |
| Net assets, end of period ($ millions) | | | 75 | | | | 80 | | | | 79 | | | | 80 | | | | 77 | | | | 85 | |
Ratio of expenses before expense reductions (%)e | | | .66 | * | | | .63 | | | | .68 | | | | .67 | | | | .71 | | | | .66 | |
Ratio of expenses after expense reductions (%)e | | | .48 | * | | | .59 | | | | .59 | | | | .58 | | | | .49 | | | | .52 | |
| Ratio of net investment income (%) | | | 1.21 | ** | | | 1.69 | | | | 1.70 | | | | 1.82 | | | | 2.63 | | | | 1.96 | |
| Portfolio turnover rate (%) | | | 19 | ** | | | 45 | | | | 26 | | | | 50 | | | | 32 | | | | 31 | |
a Based on average shares outstanding during the period. b Total return does not reflect the effect of any sales charge. c Total return would have been lower had certain expenses not been reduced. d Total return would have been lower if the Advisor had not reduced some Underlying Funds' expenses. e The Fund invests in other Funds and indirectly bears its proportionate share of fees and expenses incurred by the Underlying Funds in which the Fund is invested. This ratio does not include these indirect fees and expenses. f Includes a non-recurring payment from the Advisor which amounted to $0.0004 per share recorded as a result of the Advisor's settlement with the SEC and NY Attorney General in connection with certain trading arrangements. The Fund also received $0.0063 per share of non-affiliated regulatory settlements. Excluding these non-recurring payments, total return would have been 0.06% lower. * Annualized ** Not annualized | |
��
| DWS LifeCompass 2020 Fund — Class B | |
| | | | | | Years Ended August 31, | |
| | Six Months Ended 2/28/13 (Unaudited) | | | 2012 | | | 2011 | | | 2010 | | | 2009 | | | 2008 | |
| Selected Per Share Data | |
| Net asset value, beginning of period | | $ | 13.39 | | | $ | 12.62 | | | $ | 11.45 | | | $ | 11.11 | | | $ | 13.53 | | | $ | 15.32 | |
Income (loss) from investment operations: Net investment incomea | | | .11 | | | | .14 | | | | .13 | | | | .13 | | | | .19 | | | | .18 | |
| Net realized and unrealized gain (loss) | | | .63 | | | | .77 | | | | 1.16 | | | | .34 | | | | (2.24 | ) | | | (1.54 | ) |
| Total from investment operations | | | .74 | | | | .91 | | | | 1.29 | | | | .47 | | | | (2.05 | ) | | | (1.36 | ) |
Less distributions from: Net investment income | | | (.17 | ) | | | (.14 | ) | | | (.12 | ) | | | (.14 | ) | | | (.29 | ) | | | (.43 | ) |
| Net realized gains | | | — | | | | — | | | | — | | | | — | | | | (.08 | ) | | | — | |
| Total distributions | | | (.17 | ) | | | (.14 | ) | | | (.12 | ) | | | (.14 | ) | | | (.37 | ) | | | (.43 | ) |
| Increase from regulatory settlements | | | — | | | | — | | | | — | | | | .01 | f | | | — | | | | — | |
| Net asset value, end of period | | $ | 13.96 | | | $ | 13.39 | | | $ | 12.62 | | | $ | 11.45 | | | $ | 11.11 | | | $ | 13.53 | |
Total Return (%)b,d | | | 5.58 | c** | | | 7.34 | | | | 11.24 | c | | | 4.24 | c,f | | | (14.69 | )c | | | (9.15 | )c |
| Ratios to Average Net Assets and Supplemental Data | |
| Net assets, end of period ($ millions) | | | 2 | | | | 3 | | | | 5 | | | | 10 | | | | 14 | | | | 22 | |
Ratio of expenses before expense reductions (%)e | | | 1.42 | * | | | 1.23 | | | | 1.54 | | | | 1.39 | | | | 1.47 | | | | 1.42 | |
Ratio of expenses after expense reductions (%)e | | | 1.23 | * | | | 1.23 | | | | 1.34 | | | | 1.33 | | | | 1.24 | | | | 1.28 | |
| Ratio of net investment income (%) | | | .83 | ** | | | 1.07 | | | | .95 | | | | 1.07 | | | | 1.88 | | | | 1.20 | |
| Portfolio turnover rate (%) | | | 19 | ** | | | 45 | | | | 26 | | | | 50 | | | | 32 | | | | 31 | |
a Based on average shares outstanding during the period. b Total return does not reflect the effect of any sales charge. c Total return would have been lower had certain expenses not been reduced. d Total return would have been lower if the Advisor had not reduced some Underlying Funds' expenses. e The Fund invests in other Funds and indirectly bears its proportionate share of fees and expenses incurred by the Underlying Funds in which the Fund is invested. This ratio does not include these indirect fees and expenses. f Includes a non-recurring payment from the Advisor which amounted to $0.0004 per share recorded as a result of the Advisor's settlement with the SEC and NY Attorney General in connection with certain trading arrangements. The Fund also received $0.0063 per share of non-affiliated regulatory settlements. Excluding these non-recurring payments, total return would have been 0.06% lower. * Annualized ** Not annualized | |
| DWS LifeCompass 2020 Fund — Class C | |
| | | | | | Years Ended August 31, | |
| | Six Months Ended 2/28/13 (Unaudited) | | | 2012 | | | 2011 | | | 2010 | | | 2009 | | | 2008 | |
| Selected Per Share Data | |
| Net asset value, beginning of period | | $ | 13.38 | | | $ | 12.63 | | | $ | 11.45 | | | $ | 11.11 | | | $ | 13.54 | | | $ | 15.32 | |
Income (loss) from investment operations: Net investment incomea | | | .11 | | | | .12 | | | | .13 | | | | .13 | | | | .19 | | | | .18 | |
| Net realized and unrealized gain (loss) | | | .63 | | | | .77 | | | | 1.17 | | | | .34 | | | | (2.25 | ) | | | (1.52 | ) |
| Total from investment operations | | | .74 | | | | .89 | | | | 1.30 | | | | .47 | | | | (2.06 | ) | | | (1.34 | ) |
Less distributions from: Net investment income | | | (.16 | ) | | | (.14 | ) | | | (.12 | ) | | | (.14 | ) | | | (.29 | ) | | | (.44 | ) |
| Net realized gains | | | — | | | | — | | | | — | | | | — | | | | (.08 | ) | | | — | |
| Total distributions | | | (.16 | ) | | | (.14 | ) | | | (.12 | ) | | | (.14 | ) | | | (.37 | ) | | | (.44 | ) |
| Increase from regulatory settlements | | | — | | | | — | | | | — | | | | .01 | f | | | — | | | | — | |
| Net asset value, end of period | | $ | 13.96 | | | $ | 13.38 | | | $ | 12.63 | | | $ | 11.45 | | | $ | 11.11 | | | $ | 13.54 | |
Total Return (%)b,d | | | 5.55 | c** | | | 7.17 | | | | 11.33 | c | | | 4.24 | c,f | | | (14.74 | )c | | | (9.05 | )c |
| Ratios to Average Net Assets and Supplemental Data | |
| Net assets, end of period ($ millions) | | | 13 | | | | 14 | | | | 16 | | | | 18 | | | | 21 | | | | 30 | |
Ratio of expenses before expense reductions (%)e | | | 1.36 | * | | | 1.33 | | | | 1.40 | | | | 1.37 | | | | 1.44 | | | | 1.38 | |
Ratio of expenses after expense reductions (%)e | | | 1.23 | * | | | 1.33 | | | | 1.34 | | | | 1.33 | | | | 1.24 | | | | 1.27 | |
| Ratio of net investment income (%) | | | .84 | ** | | | .95 | | | | .95 | | | | 1.07 | | | | 1.88 | | | | 1.21 | |
| Portfolio turnover rate (%) | | | 19 | ** | | | 45 | | | | 26 | | | | 50 | | | | 32 | | | | 31 | |
a Based on average shares outstanding during the period. b Total return does not reflect the effect of any sales charge. c Total return would have been lower had certain expenses not been reduced. d Total return would have been lower if the Advisor had not reduced some Underlying Funds' expenses. e The Fund invests in other Funds and indirectly bears its proportionate share of fees and expenses incurred by the Underlying Funds in which the Fund is invested. This ratio does not include these indirect fees and expenses. f Includes a non-recurring payment from the Advisor which amounted to $0.0004 per share recorded as a result of the Advisor's settlement with the SEC and NY Attorney General in connection with certain trading arrangements. The Fund also received $0.0063 per share of non-affiliated regulatory settlements. Excluding these non-recurring payments, total return would have been 0.06% lower. * Annualized ** Not annualized | |
| DWS LifeCompass 2020 Fund — Class S | |
| | | | | | Years Ended August 31, | |
| | Six Months Ended 2/28/13 (Unaudited) | | | 2012 | | | 2011 | | | 2010 | | | 2009 | | | 2008 | |
| Selected Per Share Data | |
| Net asset value, beginning of period | | $ | 13.52 | | | $ | 12.77 | | | $ | 11.58 | | | $ | 11.23 | | | $ | 13.69 | | | $ | 15.50 | |
Income (loss) from investment operations: Net investment incomea | | | .18 | | | | .24 | | | | .25 | | | | .24 | | | | .29 | | | | .32 | |
| Net realized and unrealized gain (loss) | | | .64 | | | | .78 | | | | 1.19 | | | | .36 | | | | (2.28 | ) | | | (1.54 | ) |
| Total from investment operations | | | .82 | | | | 1.02 | | | | 1.44 | | | | .60 | | | | (1.99 | ) | | | (1.22 | ) |
Less distributions from: Net investment income | | | (.30 | ) | | | (.27 | ) | | | (.25 | ) | | | (.26 | ) | | | (.39 | ) | | | (.59 | ) |
| Net realized gains | | | — | | | | — | | | | — | | | | — | | | | (.08 | ) | | | — | |
| Total distributions | | | (.30 | ) | | | (.27 | ) | | | (.25 | ) | | | (.26 | ) | | | (.47 | ) | | | (.59 | ) |
| Increase from regulatory settlements | | | — | | | | — | | | | — | | | | .01 | e | | | — | | | | — | |
| Net asset value, end of period | | $ | 14.04 | | | $ | 13.52 | | | $ | 12.77 | | | $ | 11.58 | | | $ | 11.23 | | | $ | 13.69 | |
Total Return (%)b,c | | | 6.13 | ** | | | 8.19 | | | | 12.43 | | | | 5.36 | e | | | (13.90 | ) | | | (8.22 | ) |
| Ratios to Average Net Assets and Supplemental Data | |
| Net assets, end of period ($ millions) | | | 92 | | | | 105 | | | | 107 | | | | 96 | | | | 96 | | | | 129 | |
Ratio of expenses before expense reductions (%)d | | | .42 | * | | | .42 | | | | .42 | | | | .45 | | | | .51 | | | | .45 | |
Ratio of expenses after expense reductions (%)d | | | .23 | * | | | .34 | | | | .34 | | | | .33 | | | | .24 | | | | .28 | |
| Ratio of net investment income (%) | | | 1.33 | ** | | | 1.87 | | | | 1.95 | | | | 2.07 | | | | 2.88 | | | | 2.20 | |
| Portfolio turnover rate (%) | | | 19 | ** | | | 45 | | | | 26 | | | | 50 | | | | 32 | | | | 31 | |
a Based on average shares outstanding during the period. b Total return would have been lower had certain expenses not been reduced. c Total return would have been lower if the Advisor had not reduced some Underlying Funds' expenses. d The Fund invests in other Funds and indirectly bears its proportionate share of fees and expenses incurred by the Underlying Funds in which the Fund is invested. This ratio does not include these indirect fees and expenses. e Includes a non-recurring payment from the Advisor which amounted to $.0004 per share recorded as a result of the Advisor's settlement with the SEC and NY Attorney General in connection with certain trading arrangements. The Fund also received $.0063 per share of non-affiliated regulatory settlements. Excluding these non-recurring payments, total return would have been 0.06% lower. * Annualized ** Not annualized | |
| DWS LifeCompass 2030 Fund — Class A | |
| | | | | | Years Ended August 31, | |
| | Six Months Ended 2/28/13 (Unaudited) | | | 2012 | | | 2011 | | | 2010 | | | 2009 | | | 2008 | |
| Selected Per Share Data | |
| Net asset value, beginning of period | | $ | 9.71 | | | $ | 9.10 | | | $ | 8.04 | | | $ | 7.87 | | | $ | 10.26 | | | $ | 12.27 | |
Income (loss) from investment operations: Net investment incomea | | | .12 | | | | .13 | | | | .12 | | | | .11 | | | | .13 | | | | .14 | |
| Net realized and unrealized gain (loss) | | | .58 | | | | .61 | | | | 1.04 | | | | .18 | | | | (1.94 | ) | | | (1.32 | ) |
| Total from investment operations | | | .70 | | | | .74 | | | | 1.16 | | | | .29 | | | | (1.81 | ) | | | (1.18 | ) |
Less distributions from: Net investment income | | | (.16 | ) | | | (.13 | ) | | | (.10 | ) | | | (.12 | ) | | | (.11 | ) | | | (.38 | ) |
| Net realized gains | | | — | | | | — | | | | — | | | | — | | | | (.47 | ) | | | (.45 | ) |
| Total distributions | | | (.16 | ) | | | (.13 | ) | | | (.10 | ) | | | (.12 | ) | | | (.58 | ) | | | (.83 | ) |
| Net asset value, end of period | | $ | 10.25 | | | $ | 9.71 | | | $ | 9.10 | | | $ | 8.04 | | | $ | 7.87 | | | $ | 10.26 | |
Total Return (%)b,c,d | | | 7.32 | ** | | | 8.26 | | | | 14.44 | | | | 3.63 | | | | (16.57 | ) | | | (10.40 | ) |
| Ratios to Average Net Assets and Supplemental Data | |
| Net assets, end of period ($ millions) | | | 41 | | | | 41 | | | | 38 | | | | 40 | | | | 31 | | | | 23 | |
Ratio of expenses before expense reductions (%)e | | | .78 | * | | | .80 | | | | .80 | | | | .85 | | | | 1.17 | | | | .99 | |
Ratio of expenses after expense reductions (%)e | | | .48 | * | | | .58 | | | | .58 | | | | .55 | | | | .45 | | | | .47 | |
| Ratio of net investment income (%) | | | 1.25 | ** | | | 1.39 | | | | 1.30 | | | | 1.33 | | | | 1.83 | | | | 1.27 | |
| Portfolio turnover rate (%) | | | 29 | ** | | | 46 | | | | 32 | | | | 44 | | | | 40 | | | | 30 | |
a Based on average shares outstanding during the period. b Total return does not reflect the effect of any sales charge. c Total return would have been lower had certain expenses not been reduced. d Total return would have been lower if the Advisor had not reduced some Underlying Funds' expenses. e The Fund invests in other Funds and indirectly bears its proportionate share of fees and expenses incurred by the Underlying Funds in which the Fund is invested. This ratio does not include these indirect fees and expenses. * Annualized ** Not annualized | |
| DWS LifeCompass 2030 Fund — Class B | |
| | | | | | Years Ended August 31, | |
| | Six Months Ended 2/28/13 (Unaudited) | | | 2012 | | | 2011 | | | 2010 | | | 2009 | | | 2008 | |
| Selected Per Share Data | |
| Net asset value, beginning of period | | $ | 9.67 | | | $ | 9.06 | | | $ | 8.02 | | | $ | 7.84 | | | $ | 10.21 | | | $ | 12.21 | |
Income (loss) from investment operations: Net investment incomea | | | .08 | | | | .06 | | | | .05 | | | | .05 | | | | .08 | | | | .06 | |
| Net realized and unrealized gain (loss) | | | .59 | | | | .61 | | | | 1.02 | | | | .19 | | | | (1.92 | ) | | | (1.33 | ) |
| Total from investment operations | | | .67 | | | | .67 | | | | 1.07 | | | | .24 | | | | (1.84 | ) | | | (1.27 | ) |
Less distributions from: Net investment income | | | (.09 | ) | | | (.06 | ) | | | (.03 | ) | | | (.06 | ) | | | (.06 | ) | | | (.28 | ) |
| Net realized gains | | | — | | | | — | | | | — | | | | — | | | | (.47 | ) | | | (.45 | ) |
| Total distributions | | | (.09 | ) | | | (.06 | ) | | | (.03 | ) | | | (.06 | ) | | | (.53 | ) | | | (.73 | ) |
| Net asset value, end of period | | $ | 10.25 | | | $ | 9.67 | | | $ | 9.06 | | | $ | 8.02 | | | $ | 7.84 | | | $ | 10.21 | |
Total Return (%)b,c,d | | | 6.94 | ** | | | 7.48 | | | | 13.36 | | | | 2.98 | | | | (17.11 | ) | | | (11.09 | ) |
| Ratios to Average Net Assets and Supplemental Data | |
| Net assets, end of period ($ millions) | | | 1 | | | | 1 | | | | 1 | | | | 2 | | | | 2 | | | | 3 | |
Ratio of expenses before expense reductions (%)e | | | 1.62 | * | | | 1.55 | | | | 1.56 | | | | 1.63 | | | | 2.07 | | | | 1.80 | |
Ratio of expenses after expense reductions (%)e | | | 1.23 | * | | | 1.33 | | | | 1.33 | | | | 1.30 | | | | 1.20 | | | | 1.22 | |
| Ratio of net investment income (%) | | | .81 | ** | | | .63 | | | | .55 | | | | .59 | | | | 1.08 | | | | .51 | |
| Portfolio turnover rate (%) | | | 29 | ** | | | 46 | | | | 32 | | | | 44 | | | | 40 | | | | 30 | |
a Based on average shares outstanding during the period. b Total return does not reflect the effect of any sales charge. c Total return would have been lower had certain expenses not been reduced. d Total return would have been lower if the Advisor had not reduced some Underlying Funds' expenses. e The Fund invests in other Funds and indirectly bears its proportionate share of fees and expenses incurred by the Underlying Funds in which the Fund is invested. This ratio does not include these indirect fees and expenses. * Annualized ** Not annualized | |
| DWS LifeCompass 2030 Fund — Class C | |
| | | | | | Years Ended August 31, | |
| | Six Months Ended 2/28/13 (Unaudited) | | | 2012 | | | 2011 | | | 2010 | | | 2009 | | | 2008 | |
| Selected Per Share Data | |
| Net asset value, beginning of period | | $ | 9.67 | | | $ | 9.06 | | | $ | 8.01 | | | $ | 7.83 | | | $ | 10.21 | | | $ | 12.21 | |
Income (loss) from investment operations: Net investment incomea | | | .09 | | | | .06 | | | | .05 | | | | .05 | | | | .08 | | | | .06 | |
| Net realized and unrealized gain (loss) | | | .57 | | | | .61 | | | | 1.03 | | | | .19 | | | | (1.93 | ) | | | (1.33 | ) |
| Total from investment operations | | | .66 | | | | .67 | | | | 1.08 | | | | .24 | | | | (1.85 | ) | | | (1.27 | ) |
Less distributions from: Net investment income | | | (.09 | ) | | | (.06 | ) | | | (.03 | ) | | | (.06 | ) | | | (.06 | ) | | | (.28 | ) |
| Net realized gains | | | — | | | | — | | | | — | | | | — | | | | (.47 | ) | | | (.45 | ) |
| Total distributions | | | (.09 | ) | | | (.06 | ) | | | (.03 | ) | | | (.06 | ) | | | (.53 | ) | | | (.73 | ) |
| Net asset value, end of period | | $ | 10.24 | | | $ | 9.67 | | | $ | 9.06 | | | $ | 8.01 | | | $ | 7.83 | | | $ | 10.21 | |
Total Return (%)b,c,d | | | 6.83 | ** | | | 7.48 | | | | 13.50 | | | | 2.99 | | | | (17.22 | ) | | | (11.09 | ) |
| Ratios to Average Net Assets and Supplemental Data | |
| Net assets, end of period ($ millions) | | | 5 | | | | 5 | | | | 5 | | | | 5 | | | | 6 | | | | 8 | |
Ratio of expenses before expense reductions (%)e | | | 1.47 | * | | | 1.48 | | | | 1.50 | | | | 1.54 | | | | 1.96 | | | | 1.74 | |
Ratio of expenses after expense reductions (%)e | | | 1.23 | * | | | 1.33 | | | | 1.33 | | | | 1.30 | | | | 1.20 | | | | 1.23 | |
| Ratio of net investment income (%) | | | .87 | ** | | | .61 | | | | .55 | | | | .59 | | | | 1.08 | | | | .51 | |
| Portfolio turnover rate (%) | | | 29 | ** | | | 46 | | | | 32 | | | | 44 | | | | 40 | | | | 30 | |
a Based on average shares outstanding during the period. b Total return does not reflect the effect of any sales charge. c Total return would have been lower had certain expenses not been reduced. d Total return would have been lower if the Advisor had not reduced some Underlying Funds' expenses. e The Fund invests in other Funds and indirectly bears its proportionate share of fees and expenses incurred by the Underlying Funds in which the Fund is invested. This ratio does not include these indirect fees and expenses. * Annualized ** Not annualized | |
| DWS LifeCompass 2030 Fund — Class S | |
| | | | | | Years Ended August 31, | |
| | Six Months Ended 2/28/13 (Unaudited) | | | 2012 | | | 2011 | | | 2010 | | | 2009 | | | 2008 | |
| Selected Per Share Data | |
| Net asset value, beginning of period | | $ | 9.72 | | | $ | 9.11 | | | $ | 8.05 | | | $ | 7.87 | | | $ | 10.27 | | | $ | 12.29 | |
Income (loss) from investment operations: Net investment incomea | | | .14 | | | | .15 | | | | .15 | | | | .13 | | | | .15 | | | | .17 | |
| Net realized and unrealized gain (loss) | | | .58 | | | | .61 | | | | 1.04 | | | | .19 | | | | (1.95 | ) | | | (1.33 | ) |
| Total from investment operations | | | .72 | | | | .76 | | | | 1.19 | | | | .32 | | | | (1.80 | ) | | | (1.16 | ) |
Less distributions from: Net investment income | | | (.19 | ) | | | (.15 | ) | | | (.13 | ) | | | (.14 | ) | | | (.13 | ) | | | (.41 | ) |
| Net realized gains | | | — | | | | — | | | | — | | | | — | | | | (.47 | ) | | | (.45 | ) |
| Total distributions | | | (.19 | ) | | | (.15 | ) | | | (.13 | ) | | | (.14 | ) | | | (.60 | ) | | | (.86 | ) |
| Net asset value, end of period | | $ | 10.25 | | | $ | 9.72 | | | $ | 9.11 | | | $ | 8.05 | | | $ | 7.87 | | | $ | 10.27 | |
Total Return (%)b,c | | | 7.38 | ** | | | 8.52 | | | | 14.72 | | | | 4.02 | | | | (16.43 | ) | | | (10.23 | ) |
| Ratios to Average Net Assets and Supplemental Data | |
| Net assets, end of period ($ millions) | | | 18 | | | | 21 | | | | 18 | | | | 11 | | | | 7 | | | | 6 | |
Ratio of expenses before expense reductions (%)d | | | .52 | * | | | .55 | | | | .55 | | | | .59 | | | | .97 | | | | .77 | |
Ratio of expenses after expense reductions (%)d | | | .23 | * | | | .33 | | | | .33 | | | | .30 | | | | .20 | | | | .21 | |
| Ratio of net investment income (%) | | | 1.37 | ** | | | 1.58 | | | | 1.55 | | | | 1.58 | | | | 2.08 | | | | 1.52 | |
| Portfolio turnover rate (%) | | | 29 | ** | | | 46 | | | | 32 | | | | 44 | | | | 40 | | | | 30 | |
a Based on average shares outstanding during the period. b Total return would have been lower had certain expenses not been reduced. c Total return would have been lower if the Advisor had not reduced some Underlying Funds' expenses. d The Fund invests in other Funds and indirectly bears its proportionate share of fees and expenses incurred by the Underlying Funds in which the Fund is invested. This ratio does not include these indirect fees and expenses. * Annualized ** Not annualized | |
| DWS LifeCompass 2040 Fund — Class A | |
| | | | | | Years Ended August 31, | | | | |
| | Six Months Ended 2/28/13 (Unaudited) | | | 2012 | | | 2011 | | | 2010 | | | 2009 | | | Period Ended 8/31/08a | |
| Selected Per Share Data | |
| Net asset value, beginning of period | | $ | 8.26 | | | $ | 7.92 | | | $ | 7.14 | | | $ | 6.97 | | | $ | 8.77 | | | $ | 10.00 | |
Income (loss) from investment operations: Net investment incomeb | | | .11 | | | | .10 | | | | .09 | | | | .08 | | | | .08 | | | | .06 | |
| Net realized and unrealized gain (loss) | | | .56 | | | | .51 | | | | .94 | | | | .17 | | | | (1.74 | ) | | | (.96 | ) |
| Total from investment operations | | | .67 | | | | .61 | | | | 1.03 | | | | .25 | | | | (1.66 | ) | | | (.90 | ) |
Less distributions from: Net investment income | | | (.12 | ) | | | (.10 | ) | | | (.09 | ) | | | (.08 | ) | | | (.05 | ) | | | (.33 | ) |
| Net realized gains | | | (.06 | ) | | | (.17 | ) | | | (.16 | ) | | | — | | | | (.09 | ) | | | — | |
| Total distributions | | | (.18 | ) | | | (.27 | ) | | | (.25 | ) | | | (.08 | ) | | | (.14 | ) | | | (.33 | ) |
| Net asset value, end of period | | $ | 8.75 | | | $ | 8.26 | | | $ | 7.92 | | | $ | 7.14 | | | $ | 6.97 | | | $ | 8.77 | |
Total Return (%)c,d,e | | | 8.27 | ** | | | 8.04 | | | | 14.34 | | | | 3.58 | | | | (18.67 | ) | | | (9.24 | )** |
| Ratios to Average Net Assets and Supplemental Data | |
| Net assets, end of period ($ millions) | | | 22 | | | | 22 | | | | 17 | | | | 17 | | | | 9 | | | | 2 | |
Ratio of expenses before expense reductions (%)f | | | .87 | * | | | .93 | | | | 1.02 | | | | 1.22 | | | | 2.90 | | | | 7.14 | * |
Ratio of expenses after expense reductions (%)f | | | .48 | * | | | .55 | | | | .55 | | | | .54 | | | | .49 | | | | .49 | * |
| Ratio of net investment income (%) | | | 1.27 | ** | | | 1.28 | | | | 1.11 | | | | 1.12 | | | | 1.32 | | | | .86 | * |
| Portfolio turnover rate (%) | | | 32 | ** | | | 38 | | | | 33 | | | | 39 | | | | 30 | | | | 17 | ** |
a For the period from November 15, 2007 (commencement of operations) to August 31, 2008. b Based on average shares outstanding during the period. c Total return does not reflect the effect of any sales charge. d Total return would have been lower had certain expenses not been reduced. e Total return would have been lower if the Advisor had not reduced some Underlying Funds' expenses. f The Fund invests in other Funds and indirectly bears its proportionate share of fees and expenses incurred by the Underlying Funds in which the Fund is invested. This ratio does not include these indirect fees and expenses. * Annualized ** Not annualized | |
| DWS LifeCompass 2040 Fund — Class C | |
| | | | | | Years Ended August 31, | | | | |
| | Six Months Ended 2/28/13 (Unaudited) | | | 2012 | | | 2011 | | | 2010 | | | 2009 | | | Period Ended 8/31/08a | |
| Selected Per Share Data | |
| Net asset value, beginning of period | | $ | 8.23 | | | $ | 7.89 | | | $ | 7.11 | | | $ | 6.94 | | | $ | 8.73 | | | $ | 10.00 | |
Income (loss) from investment operations: Net investment incomeb | | | .08 | | | | .04 | | | | .03 | | | | .03 | | | | .04 | | | | .01 | |
| Net realized and unrealized gain (loss) | | | .55 | | | | .52 | | | | .94 | | | | .17 | | | | (1.73 | ) | | | (.96 | ) |
| Total from investment operations | | | .63 | | | | .56 | | | | .97 | | | | .20 | | | | (1.69 | ) | | | (.95 | ) |
Less distributions from: Net investment income | | | (.06 | ) | | | (.05 | ) | | | (.03 | ) | | | (.03 | ) | | | (.01 | ) | | | (.32 | ) |
| Net realized gains | | | (.06 | ) | | | (.17 | ) | | | (.16 | ) | | | — | | | | (.09 | ) | | | — | |
| Total distributions | | | (.12 | ) | | | (.22 | ) | | | (.19 | ) | | | (.03 | ) | | | (.10 | ) | | | (.32 | ) |
| Net asset value, end of period | | $ | 8.74 | | | $ | 8.23 | | | $ | 7.89 | | | $ | 7.11 | | | $ | 6.94 | | | $ | 8.73 | |
Total Return (%)c,d,e | | | 7.71 | ** | | | 7.25 | | | | 13.53 | | | | 2.81 | | | | (19.43 | ) | | | (9.54 | )** |
| Ratios to Average Net Assets and Supplemental Data | |
| Net assets, end of period ($ millions) | | | .3 | | | | .2 | | | | .2 | | | | .2 | | | | .2 | | | | .3 | |
Ratio of expenses before expense reductions (%)f | | | 1.63 | * | | | 1.75 | | | | 1.84 | | | | 2.20 | | | | 3.86 | | | | 7.87 | * |
Ratio of expenses after expense reductions (%)f | | | 1.22 | * | | | 1.30 | | | | 1.30 | | | | 1.28 | | | | 1.24 | | | | 1.24 | * |
| Ratio of net investment income (%) | | | .96 | ** | | | .51 | | | | .36 | | | | .37 | | | | .57 | | | | .11 | * |
| Portfolio turnover rate (%) | | | 32 | ** | | | 38 | | | | 33 | | | | 39 | | | | 30 | | | | 17 | ** |
a For the period from November 15, 2007 (commencement of operations) to August 31, 2008. b Based on average shares outstanding during the period. c Total return does not reflect the effect of any sales charge. d Total return would have been lower had certain expenses not been reduced. e Total return would have been lower if the Advisor had not reduced some Underlying Funds' expenses. f The Fund invests in other Funds and indirectly bears its proportionate share of fees and expenses incurred by the Underlying Funds in which the Fund is invested. This ratio does not include these indirect fees and expenses. * Annualized ** Not annualized | |
| DWS LifeCompass 2040 Fund — Class S | |
| | | | | | Years Ended August 31, | | | | |
| | Six Months Ended 2/28/13 (Unaudited) | | | 2012 | | | 2011 | | | 2010 | | | 2009 | | | Period Ended 8/31/08a | |
| Selected Per Share Data | |
| Net asset value, beginning of period | | $ | 8.29 | | | $ | 7.94 | | | $ | 7.16 | | | $ | 6.99 | | | $ | 8.79 | | | $ | 10.00 | |
Income (loss) from investment operations: Net investment incomeb | | | .12 | | | | .12 | | | | .11 | | | | .10 | | | | .10 | | | | .08 | |
| Net realized and unrealized gain (loss) | | | .54 | | | | .52 | | | | .94 | | | | .17 | | | | (1.74 | ) | | | (.96 | ) |
| Total from investment operations | | | .66 | | | | .64 | | | | 1.05 | | | | .27 | | | | (1.64 | ) | | | (.88 | ) |
Less distributions from: Net investment income | | | (.14 | ) | | | (.12 | ) | | | (.11 | ) | | | (.10 | ) | | | (.07 | ) | | | (.33 | ) |
| Net realized gains | | | (.06 | ) | | | (.17 | ) | | | (.16 | ) | | | — | | | | (.09 | ) | | | — | |
| Total distributions | | | (.20 | ) | | | (.29 | ) | | | (.27 | ) | | | (.10 | ) | | | (.16 | ) | | | (.33 | ) |
| Net asset value, end of period | | $ | 8.75 | | | $ | 8.29 | | | $ | 7.94 | | | $ | 7.16 | | | $ | 6.99 | | | $ | 8.79 | |
Total Return (%)c,d | | | 8.27 | ** | | | 8.43 | | | | 14.60 | | | | 3.83 | | | | (18.32 | ) | | | (9.11 | )** |
| Ratios to Average Net Assets and Supplemental Data | |
| Net assets, end of period ($ millions) | | | 11 | | | | 18 | | | | 14 | | | | 8 | | | | 4 | | | | 2 | |
Ratio of expenses before expense reductions (%)e | | | .62 | * | | | .68 | | | | .77 | | | | .99 | | | | 2.70 | | | | 6.98 | * |
Ratio of expenses after expense reductions (%)e | | | .22 | * | | | .30 | | | | .30 | | | | .29 | | | | .24 | | | | .24 | * |
| Ratio of net investment income (%) | | | 1.39 | ** | | | 1.45 | | | | 1.36 | | | | 1.37 | | | | 1.57 | | | | 1.11 | * |
| Portfolio turnover rate (%) | | | 32 | ** | | | 38 | | | | 33 | | | | 39 | | | | 30 | | | | 17 | ** |
a For the period from November 15, 2007 (commencement of operations) to August 31, 2008. b Based on average shares outstanding during the period. c Total return would have been lower had certain expenses not been reduced. d Total return would have been lower if the Advisor had not reduced some Underlying Funds' expenses. e The Fund invests in other Funds and indirectly bears its proportionate share of fees and expenses incurred by the Underlying Funds in which the Fund is invested. This ratio does not include these indirect fees and expenses. * Annualized ** Not annualized | |
Notes to Financial Statements (Unaudited)
A. Organization and Significant Accounting Policies
DWS LifeCompass Retirement Fund, DWS LifeCompass 2015 Fund, DWS LifeCompass 2020 Fund, DWS LifeCompass 2030 Fund and DWS LifeCompass 2040 Fund (hereinafter referred to individually as "Fund" or collectively as "Funds") are each a diversified series of DWS Target Date Series (the "Trust"), which is registered under the Investment Company Act of 1940, as amended (the "1940 Act"), as an open-end management investment company organized as a Massachusetts business trust. The Funds mainly invest in other affiliated DWS funds (i.e., mutual funds, exchange-traded funds and other pooled investment vehicles managed by Deutsche Investment Management Americas Inc. or one of its affiliates, together the "Underlying DWS Funds") and non-affiliated exchange-traded funds ("Non-affiliated ETFs"). Non-affiliated ETFs and Underlying DWS Funds are collectively referred to as "Underlying Funds." Each Underlying DWS Fund's accounting policies and investment holdings are outlined in the Underlying DWS Funds' financial statements and are available upon request.
Each Fund offers multiple classes of shares which provide investors with different purchase options. Class A shares are offered to investors subject to an initial sales charge. Class B shares are closed to new purchases, except exchanges or the reinvestment of dividends or other distributions. Class B shares were offered to investors without an initial sales charge and are subject to higher ongoing expenses than Class A shares and a contingent deferred sales charge payable upon certain redemptions. Class B shares automatically convert to Class A shares six years after issuance. Class C shares are offered to investors without an initial sales charge but are subject to higher ongoing expenses than Class A shares and a contingent deferred sales charge payable upon certain redemptions within one year of purchase. Class C shares do not automatically convert into another class. Class S shares are not subject to initial or contingent deferred sales charges and are generally not available to new investors except under certain circumstances.
Investment income, realized and unrealized gains and losses, and certain fund-level expenses and expense reductions, if any, are borne pro rata on the basis of relative net assets by the holders of all classes of shares, except that each class bears certain expenses unique to that class such as services to shareholders, distribution and service fees and certain other class-specific expenses. Differences in class-level expenses may result in payment of different per share dividends by class. All shares of each Fund
have equal rights with respect to voting subject to class-specific arrangements.
The Funds' financial statements are prepared in accordance with accounting principles generally accepted in the United States of America which require the use of management estimates. Actual results could differ from those estimates. The policies described below are followed consistently by each Fund in the preparation of its financial statements.
Security Valuation. Investments are stated at value determined as of the close of regular trading on the New York Stock Exchange on each day the exchange is open for trading.
Various inputs are used in determining the value of each Fund's investments. These inputs are summarized in three broad levels. Level 1 includes quoted prices in active markets for identical securities. Level 2 includes other significant observable inputs (including quoted prices for similar securities, interest rates, prepayment speeds, and credit risk). Level 3 includes significant unobservable inputs (including each Fund's own assumptions in determining the fair value of investments). The inputs or methodology used for valuing securities are not necessarily an indication of the risk associated with investing in those securities.
Investments in Mutual Funds are valued at the net asset value per share of each class of the Mutual Fund and are categorized as Level 1.
ETFs are valued at the most recent sale price or official closing price reported on the exchange (U.S. or foreign) or over-the-counter market on which they trade and are categorized as Level 1 securities. ETFs for which no sales are reported are valued at the calculated mean between the most recent bid and asked quotations on the relevant market or, if a mean cannot be determined, at the most recent bid quotation.
Disclosure about the classification of fair value measurements is included in a table following each Fund's Investment Portfolio.
New Accounting Pronouncement. In January 2013, Accounting Standard Update 2013-01 (ASU 2013-01), Clarifying the Scope of Disclosures about Offsetting Assets and Liabilities, replaced Accounting Standards Update 2011-11 (ASU 2011-11), Disclosures about Offsetting Assets and Liabilities. ASU 2013-01 is effective for fiscal years beginning on or after January 1, 2013, and interim periods within those annual periods. ASU 2011-11 was intended to enhance disclosure requirements on the offsetting of financial assets and liabilities. The ASU 2013-01 limits the scope of the new balance sheet offsetting disclosures to derivatives, repurchase agreements, and securities lending transactions to the extent that they are (1) offset in the financial statements or (2) subject to an enforceable master netting arrangement or similar agreement. Management is currently evaluating the application of ASU 2013-01 and its impact, if any, on the Fund's financial statements.
Federal Income Taxes. Each Fund's policy is to comply with the requirements of the Internal Revenue Code, as amended, which are applicable to regulated investment companies, and to distribute all of its taxable income to its shareholders. Each Fund is treated as a single corporate taxpayer.
Under the Regulated Investment Company Modernization Act of 2010, net capital losses incurred post-enactment may be carried forward indefinitely, and their character is retained as short-term and/or long-term. Previously, net capital losses were carried forward for eight years and treated as short-term. As a transition rule, the Act requires that post-enactment net capital losses be used before pre-enactment net capital losses.
At August 31, 2012, DWS LifeCompass Retirement Fund had a net tax basis capital loss carryforward of approximately $13,206,000 of pre-enactment losses, which may be applied against any realized net taxable capital gains of each succeeding year until fully utilized or until August 31, 2018, ($12,626,000) and August 31, 2019 ($580,000), the respective expiration dates, whichever occurs first.
In addition, from November 1, 2011 through August 31, 2012, the Fund elects to defer qualified late year losses of approximately $309,000 of net short-term realized capital losses and treat them as arising in the fiscal year ending August 31, 2013.
At August 31, 2012, DWS LifeCompass 2015 Fund had a net tax basis capital loss carryforward of approximately $41,942,000 of pre-enactment losses, which may be applied against any realized net taxable capital gains of each succeeding year until fully utilized or until August 31, 2017 ($2,422,000), August 31, 2018 ($29,353,000) and August 31, 2019 ($10,167,000), the respective expiration dates, whichever occurs first.
In addition, from November 1, 2011 through August 31, 2012, the Fund elects to defer qualified late year losses of approximately $60,000 of net short-term realized capital losses and treat them as arising in the fiscal year ending August 31, 2013.
At August 31, 2012, DWS LifeCompass 2020 Fund had a net tax basis capital loss carryforward of approximately $31,163,000 of pre-enactment losses, which may be applied against any realized net taxable capital gains of each succeeding year until fully utilized or until August 31, 2018 ($21,737,000) and August 31, 2019 ($9,426,000), the respective expiration dates, whichever occurs first.
In addition, from November 1, 2011 through August 31, 2012, the Fund elects to defer qualified late year losses of approximately $266,000 of net short-term realized capital losses and treat them as arising in the fiscal year ending August 31, 2013.
At August 31, 2012, DWS LifeCompass 2030 Fund had a net tax basis capital loss carryforward of approximately $3,299,000 of pre-enactment losses, which may be applied against any realized net taxable capital gains of each succeeding year until fully utilized or until August 31, 2018 ($2,386,000) and August 31, 2019 ($913,000), the respective expiration dates, whichever occurs first.
In addition, from November 1, 2011 through August 31, 2012, the Fund elects to defer qualified late year losses of approximately $160,000 of net short-term realized capital losses and treat them as arising in the fiscal year ending August 31, 2013.
The Funds have reviewed the tax positions for the open tax years as of August 31, 2012 and have determined that no provision for income tax is required in the Funds' financial statements. The Funds' federal tax returns for the prior three fiscal years remain open subject to examination by the Internal Revenue Service.
Distribution of Income and Gains. Net investment income from DWS LifeCompass Retirement Fund and DWS LifeCompass 2015 Fund, if any, is declared and distributed to shareholders quarterly. Net investment income from DWS LifeCompass 2020 Fund, DWS LifeCompass 2030 Fund and DWS LifeCompass 2040 Fund, if any, is declared and distributed to shareholders annually. Net realized gains from investment transactions, in excess of available capital loss carryforwards, would be taxable to each Fund if not distributed and, therefore, will be distributed to shareholders at least annually. The Funds may also make additional distributions for tax purposes if necessary.
The timing and characterization of certain income and capital gain distributions are determined annually in accordance with federal tax regulations which may differ from accounting principles generally accepted in the United States of America. These differences primarily relate to certain securities sold at a loss. As a result, net investment income (loss) and net realized gain (loss) on investment transactions for a reporting period may differ significantly from distributions during such period. Accordingly, each Fund may periodically make reclassifications among certain of its capital accounts without impacting the net asset value of a Fund.
The tax character of current year distributions will be determined at the end of the current fiscal year.
Contingencies. In the normal course of business, the Funds may enter into contracts with service providers that contain general indemnification clauses. The Funds' maximum exposure under these arrangements is unknown as this would involve future claims that may be made against the Funds that have not yet been made. However, based on experience, the Funds expect the risk of loss to be remote.
Other. Investment transactions are accounted for on a trade date plus one basis for daily net asset value calculations. However, for financial reporting purposes, investment transactions are reported on trade date. Interest income is recorded on the accrual basis. Distributions of income and capital gains from the Underlying Funds are recorded on the ex-dividend date. Realized gains and losses from investment transactions are recorded on an identified cost basis.
B. Related Parties
Management Agreement. Under the Investment Management Agreement with Deutsche Investment Management Americas Inc. ("DIMA" or the "Advisor"), an indirect, wholly owned subsidiary of Deutsche Bank AG, the Advisor directs the investments of each Fund in accordance with its investment objectives, policies and restrictions. The Advisor determines the securities, instruments and other contracts relating to investments to be purchased, sold or entered into by each Fund or delegates such responsibility to the Fund's subadvisor. The Advisor has agreed not to be paid a management fee directly from the Funds for performing its services under the Investment Management Agreement. However, the Advisor will receive management fees from managing the Underlying DWS Funds in which each Fund invests.
QS Investors, LLC ("QS Investors") acts as investment subadvisor to the Funds. As an investment subadvisor to the Funds, QS Investors renders strategic asset allocation services to the Funds. QS Investors is paid by the Advisor for the services QS Investors provides to the Funds.
The Funds do not invest in the Underlying DWS Funds for the purpose of exercising management or control; however, investments within the set limits may represent 5% or more of an Underlying DWS Funds' outstanding shares. At February 28, 2013, DWS LifeCompass Retirement Fund held 5% or greater of the following Underlying DWS Fund's outstanding shares: approximately 7% of DWS US Bond Index Fund, 6% of DWS Small Cap Core Fund and 5% of DWS Enhanced Global Bond Fund. At February 28, 2013, DWS LifeCompass 2015 Fund held 5% or greater of the following Underlying DWS Funds' outstanding shares: approximately 7% of DWS U.S. Bond Index Fund and 7% of DWS Enhanced Global Bond Fund. At February 28, 2013, DWS LifeCompass 2020 Fund held 5% or greater of the following Underlying DWS Funds' outstanding shares: approximately 9% of DWS U.S. Bond Index Fund, 9% of DWS Enhanced Global Bond Fund, 7% of DWS Diversified International Equity Fund, 6% of DWS Small Cap Core Fund, 6% of DWS EAFE Equity Index Fund and 6% of DWS Core Fixed Income Fund. At February 28, 2013, DWS LifeCompass 2030 Fund and DWS LifeCompass 2040 Fund did not invest in more than 5% of any Underlying DWS Fund.
For the period from September 1, 2012 through September 30, 2012, the Advisor had contractually agreed to reimburse or pay certain operating expenses to the extent necessary to maintain the Funds' operating expenses (excluding certain expenses such as extraordinary expenses, taxes, brokerage, interest and indirect expenses of Underlying Funds) as a percentage of average daily net assets as follows:
| | | LifeCompass Retirement Fund | | | LifeCompass 2015 Fund | | | LifeCompass 2020 Fund | | | LifeCompass 2030 Fund | | | LifeCompass 2040 Fund | |
| Class A | | | .62 | % | | | .58 | % | | | .59 | % | | | .58 | % | | | .55 | % |
| Class B | | | 1.37 | % | | | 1.33 | % | | | 1.34 | % | | | 1.33 | % | | | — | |
| Class C | | | 1.37 | % | | | 1.33 | % | | | 1.34 | % | | | 1.33 | % | | | 1.30 | % |
| Class S | | | .37 | % | | | .33 | % | | | .34 | % | | | .33 | % | | | .30 | % |
For the period from October 1, 2012 through November 30, 2013, the Advisor has contractually agreed to reimburse or pay certain operating expenses to the extent necessary to maintain the Funds' operating expenses (excluding certain expenses such as extraordinary expenses, taxes, brokerage, interest and indirect expenses of Underlying Funds) as a percentage of average daily net assets as follows:
| | | LifeCompass Retirement Fund | | | LifeCompass 2015 Fund | | | LifeCompass 2020 Fund | | | LifeCompass 2030 Fund | | | LifeCompass 2040 Fund | |
| Class A | | | .46 | % | | | .46 | % | | | .46 | % | | | .46 | % | | | .46 | % |
| Class B | | | 1.21 | % | | | 1.21 | % | | | 1.21 | % | | | 1.21 | % | | | — | |
| Class C | | | 1.21 | % | | | 1.21 | % | | | 1.21 | % | | | 1.21 | % | | | 1.21 | % |
| Class S | | | .21 | % | | | .21 | % | | | .21 | % | | | .21 | % | | | .21 | % |
Each Fund indirectly bears its proportionate share of fees and expenses incurred by the Underlying DWS Funds and Non-affiliated ETFs in which it is invested.
Administration Fee. Pursuant to an Administrative Services Agreement, DIMA provides most administrative services to the Funds. For all services provided under the Administrative Services Agreement, the Funds pay DIMA an annual fee ("Administration Fee") of 0.10% of each Fund's average daily net assets, computed and accrued daily and payable monthly. For the six months ended February 28, 2013, the Administration Fee for each Fund was as follows:
| Administration Fee | | Total Aggregated | | | Waived | | | Unpaid at February 28, 2013 | |
| DWS LifeCompass Retirement Fund | | $ | 42,156 | | | $ | 18,532 | | | $ | 383 | |
| DWS LifeCompass 2015 Fund | | $ | 68,519 | | | $ | — | | | $ | 10,149 | |
| DWS LifeCompass 2020 Fund | | $ | 99,198 | | | $ | — | | | $ | 15,230 | |
| DWS LifeCompass 2030 Fund | | $ | 34,831 | | | $ | 29,553 | | | $ | — | |
| DWS LifeCompass 2040 Fund | | $ | 20,871 | | | $ | 20,871 | | | $ | — | |
Service Provider Fees. DWS Investments Service Company ("DISC"), an affiliate of the Advisor, is the transfer agent, dividend-paying agent and shareholder service agent for the Funds. Pursuant to a sub-transfer agency agreement between DISC and DST Systems, Inc. ("DST"), DISC has delegated certain transfer agent, dividend-paying agent and shareholder service agent functions to DST. DISC compensates DST out of the shareholder servicing fee it receives from the Funds. For the six months ended February 28, 2013, the amounts charged to the Funds by DISC were as follows:
| Services to Shareholders | | Total Aggregated | | | Waived | | | Unpaid at February 28, 2013 | |
| DWS LifeCompass Retirement Fund | |
| Class A | | $ | 22,421 | | | $ | 22,421 | | | $ | — | |
| Class B | | | 420 | | | | 420 | | | | — | |
| Class C | | | 2,260 | | | | 2,260 | | | | — | |
| Class S | | | 35,144 | | | | 35,144 | | | | — | |
| | | $ | 60,245 | | | $ | 60,245 | | | $ | — | |
| DWS LifeCompass 2015 Fund | |
| Class A | | $ | 46,801 | | | $ | 46,801 | | | $ | — | |
| Class B | | | 1,814 | | | | 1,814 | | | | — | |
| Class C | | | 4,612 | | | | 4,612 | | | | — | |
| Class S | | | 72,321 | | | | 70,912 | | | | — | |
| | | $ | 125,548 | | | $ | 124,139 | | | $ | — | |
| DWS LifeCompass 2020 Fund | |
| Class A | | $ | 72,987 | | | $ | 67,360 | | | $ | — | |
| Class B | | | 2,849 | | | | 2,849 | | | | — | |
| Class C | | | 7,356 | | | | 7,356 | | | | — | |
| Class S | | | 106,345 | | | | 97,748 | | | | 2,581 | |
| | | $ | 189,537 | | | $ | 175,313 | | | $ | 2,581 | |
| DWS LifeCompass 2030 Fund | |
| Class A | | $ | 44,106 | | | $ | 44,106 | | | $ | — | |
| Class B | | | 860 | | | | 860 | | | | — | |
| Class C | | | 2,586 | | | | 2,586 | | | | — | |
| Class S | | | 21,934 | | | | 21,934 | | | | — | |
| | | $ | 69,486 | | | $ | 69,486 | | | $ | — | |
| DWS LifeCompass 2040 Fund | |
| Class A | | $ | 24,519 | | | $ | 24,031 | | | $ | — | |
| Class C | | | 269 | | | | 269 | | | | — | |
| Class S | | | 20,446 | | | | 20,446 | | | | — | |
| | | $ | 45,234 | | | $ | 44,746 | | | $ | — | |
For the six months ended February 28, 2013, the Advisor reimbursed DWS LifeCompass Retirement Fund, DWS LifeCompass 2030 Fund and DWS LifeCompass 2040 Fund $1,555, $698 and $229, respectively, of sub-recordkeeping expenses for Class S shares.
In addition, for the six months ended February 28, 2013, the Advisor reimbursed DWS LifeCompass 2040 Fund $16,600 of other expenses.
Distribution and Service Fees. Under the Funds' Class B and Class C 12b-1 Plans, DWS Investments Distributors, Inc. ("DIDI"), an affiliate of the Advisor, receives a fee ("Distribution Fee") of 0.75% of average daily net assets of each of Class B and C shares. In accordance with the Funds' Underwriting and Distribution Services Agreements, DIDI enters into related selling group agreements with various firms at various rates for sales of Class B and C shares. For the six months ended February 28, 2013, the Distribution Fees were as follows:
| Distribution Fees | | Total Aggregated | | | Unpaid at February 28, 2013 | |
| DWS LifeCompass Retirement Fund | |
| Class B | | $ | 2,069 | | | $ | 285 | |
| Class C | | | 18,630 | | | | 2,753 | |
| | | $ | 20,699 | | | $ | 3,038 | |
| DWS LifeCompass 2015 Fund | |
| Class B | | $ | 4,724 | | | $ | 641 | |
| Class C | | | 39,583 | | | | 6,039 | |
| | | $ | 44,307 | | | $ | 6,680 | |
| DWS LifeCompass 2020 Fund | |
| Class B | | $ | 8,783 | | | $ | 1,250 | |
| Class C | | | 50,634 | | | | 7,792 | |
| | | $ | 59,417 | | | $ | 9,042 | |
| DWS LifeCompass 2030 Fund | |
| Class B | | $ | 2,921 | | | $ | 361 | |
| Class C | | | 17,191 | | | | 2,506 | |
| | | $ | 20,112 | | | $ | 2,867 | |
| DWS LifeCompass 2040 Fund | |
| Class C | | $ | 898 | | | $ | 158 | |
In addition, DIDI provides information and administrative services for a fee ("Service Fee") to Class A, B and C shareholders at an annual rate of up to 0.25% of average daily net assets for each such class. DIDI in turn has various agreements with financial services firms that provide these services and pays these fees based upon the assets of shareholder accounts the firms service. For the six months ended February 28, 2013, the Service Fees were as follows:
| Service Fees | | Total Aggregated | | | Waived | | | Unpaid at February 28, 2013 | | | Annualized Effective Rate | |
| DWS LifeCompass Retirement Fund | |
| Class A | | $ | 32,494 | | | $ | 1,035 | | | $ | 10,999 | | | | .23 | % |
| Class B | | | 642 | | | | 167 | | | | 184 | | | | .17 | % |
| Class C | | | 6,169 | | | | 1,125 | | | | 1,654 | | | | .20 | % |
| | | $ | 39,305 | | | $ | 2,327 | | | $ | 12,837 | | | | | |
| DWS LifeCompass 2015 Fund | |
| Class A | | $ | 66,399 | | | $ | 1,260 | | | $ | 21,631 | | | | .24 | % |
| Class B | | | 1,563 | | | | 300 | | | | 452 | | | | .20 | % |
| Class C | | | 13,171 | | | | 2,098 | | | | 3,192 | | | | .21 | % |
| | | $ | 81,133 | | | $ | 3,658 | | | $ | 25,275 | | | | | |
| DWS LifeCompass 2020 Fund | |
| Class A | | $ | 94,117 | | | $ | — | | | $ | 30,319 | | | | .24 | % |
| Class B | | | 2,898 | | | | 262 | | | | 943 | | | | .23 | % |
| Class C | | | 16,878 | | | | 1,334 | | | | 4,730 | | | | .23 | % |
| | | $ | 113,893 | | | $ | 1,596 | | | $ | 35,992 | | | | | |
| DWS LifeCompass 2030 Fund | |
| Class A | | $ | 50,939 | | | $ | 443 | | | $ | 17,719 | | | | .24 | % |
| Class B | | | 963 | | | | 312 | | | | 1 | | | | .17 | % |
| Class C | | | 5,728 | | | | 942 | | | | 1,032 | | | | .21 | % |
| | | $ | 57,630 | | | $ | 1,697 | | | $ | 18,752 | | | | | |
| DWS LifeCompass 2040 Fund | |
| Class A | | $ | 26,710 | | | $ | — | | | $ | 9,345 | | | | .24 | % |
| Class C | | | 300 | | | | 3 | | | | 87 | | | | .25 | % |
| | | $ | 27,010 | | | $ | 3 | | | $ | 9,432 | | | | | |
Underwriting Agreement and Contingent Deferred Sales Charge. DIDI is the principal underwriter for the Funds. Underwriting commissions paid in connection with the distribution of Class A shares for the six months ended February 28, 2013 for DWS LifeCompass Retirement Fund, DWS LifeCompass 2015 Fund, DWS LifeCompass 2020 Fund, DWS LifeCompass 2030 Fund and DWS LifeCompass 2040 Fund aggregated $310, $596, $4,673, $1,724 and $954, respectively.
In addition, DIDI receives any contingent deferred sales charge ("CDSC") from Class B share redemptions occurring within six years of purchase and Class C share redemptions occurring within one year of purchase. There is no such charge upon redemption of any share appreciation or reinvested dividends. The CDSC is based on declining rates, ranging from 4% to 1% for Class B and 1% for Class C, of the value of the shares redeemed. For the six months ended February 28, 2013, the CDSC for Class B shares aggregated $839, $526, $644 and $1,637, respectively, for DWS LifeCompass Retirement Fund, DWS LifeCompass 2015 Fund, DWS LifeCompass 2020 Fund and DWS LifeCompass 2030 Fund and Class C shares aggregated $329, $4, $236 and $616, respectively, for DWS LifeCompass Retirement Fund, DWS LifeCompass 2015 Fund, DWS LifeCompass 2020 Fund and DWS LifeCompass 2030 Fund. For the six months ended February 28, 2013, the CDSC for Class C shares aggregated $40 for DWS LifeCompass 2040 Fund. A deferred sales charge of up to 1% is assessed on certain redemptions of Class A shares. For the six months ended February 28, 2013, DIDI received $88, $347 and $188, respectively, for Class A shares of DWS LifeCompass Retirement Fund, DWS LifeCompass 2015 Fund and DWS LifeCompass 2020 Fund.
Typesetting and Filing Service Fees. Under an agreement with DIMA, DIMA is compensated for providing typesetting and certain regulatory filing services to the Funds. For the six months ended February 28, 2013, the amounts charged to the Funds by DIMA included in the Statements of Operations under "reports to shareholders" were as follows:
| Typesetting and Filing Service Fees | | Total Aggregated | | | Unpaid at February 28, 2013 | |
| DWS LifeCompass Retirement Fund | | $ | 5,135 | | | $ | 2,233 | |
| DWS LifeCompass 2015 Fund | | $ | 5,253 | | | $ | 2,012 | |
| DWS LifeCompass 2020 Fund | | $ | 4,344 | | | $ | 2,069 | |
| DWS LifeCompass 2030 Fund | | $ | 4,939 | | | $ | 978 | |
| DWS LifeCompass 2040 Fund | | $ | 4,660 | | | $ | 308 | |
Trustees' Fees and Expenses. The Fund paid retainer fees to each Trustee not affiliated with the Advisor, plus specified amounts to the Board Chairperson and Vice Chairperson and to each committee Chairperson and Vice Chairperson.
Affiliated Cash Management Vehicle. The Fund may invest uninvested cash balances in Central Cash Management Fund, which is managed by the Advisor. The Fund indirectly bears its proportionate share of the expenses of Central Cash Management Fund. Central Cash Management Fund does not pay the Advisor an investment management fee. Central Cash Management Fund seeks a high level of current income consistent with liquidity and the preservation of capital.
C. Concentration of Ownership
From time to time, the Funds may have a concentration of several shareholder accounts holding a significant percentage of shares outstanding. Investment activities of these shareholders could have a material impact on the Funds. At February 28, 2013, there was one shareholder account that held approximately 26% and 12% of the outstanding shares of DWS LifeCompass 2015 Fund and DWS LifeCompass 2030 Fund, respectively, and three shareholder accounts that held approximately 30%, 19% and 11% of the outstanding shares of DWS LifeCompass 2040 Fund.
D. Share Transactions
DWS LifeCompass Retirement Fund
The following table summarizes share and dollar activity in the Fund:
| | | Six Months Ended February 28, 2013 | | | Year Ended
August 31, 2012 | |
| | | Shares | | | Dollars | | | Shares | | | Dollars | |
| Shares sold | |
| Class A | | | 124,130 | | | $ | 1,464,320 | | | | 866,019 | | | $ | 9,828,778 | |
| Class B | | | 2 | | | | 24 | | | | 4,214 | | | | 48,373 | |
| Class C | | | 5,572 | | | | 65,773 | | | | 40,803 | | | | 455,994 | |
| Class S | | | 158,487 | | | | 1,864,532 | | | | 989,095 | | | | 11,054,727 | |
| | | | | | | $ | 3,394,649 | | | | | | | $ | 21,387,872 | |
| Shares issued to shareholders in reinvestment of distributions | |
| Class A | | | 23,250 | | | $ | 271,712 | | | | 43,683 | | | $ | 480,631 | |
| Class B | | | 304 | | | | 3,566 | | | | 1,092 | | | | 11,973 | |
| Class C | | | 2,398 | | | | 28,039 | | | | 5,424 | | | | 59,602 | |
| Class S | | | 47,350 | | | | 552,882 | | | | 101,377 | | | | 1,117,291 | |
| | | | | | | $ | 856,199 | | | | | | | $ | 1,669,497 | |
| Shares redeemed | |
| Class A | | | (534,476 | ) | | $ | (6,269,576 | ) | | | (850,859 | ) | | $ | (9,475,448 | ) |
| Class B | | | (15,713 | ) | | | (184,552 | ) | | | (65,023 | ) | | | (723,653 | ) |
| Class C | | | (64,531 | ) | | | (759,552 | ) | | | (112,759 | ) | | | (1,266,084 | ) |
| Class S | | | (671,758 | ) | | | (7,947,792 | ) | | | (1,432,428 | ) | | | (16,048,457 | ) |
| | | | | | | $ | (15,161,472 | ) | | | | | | $ | (27,513,642 | ) |
| Net increase (decrease) | |
| Class A | | | (387,096 | ) | | $ | (4,533,544 | ) | | | 58,843 | | | $ | 833,961 | |
| Class B | | | (15,407 | ) | | | (180,962 | ) | | | (59,717 | ) | | | (663,307 | ) |
| Class C | | | (56,561 | ) | | | (665,740 | ) | | | (66,532 | ) | | | (750,488 | ) |
| Class S | | | (465,921 | ) | | | (5,530,378 | ) | | | (341,956 | ) | | | (3,876,439 | ) |
| | | | | | | $ | (10,910,624 | ) | | | | | | $ | (4,456,273 | ) |
DWS LifeCompass 2015 Fund
The following table summarizes share and dollar activity in the Fund:
| | | Six Months Ended February 28, 2013 | | | Year Ended
August 31, 2012 | |
| | | Shares | | | Dollars | | | Shares | | | Dollars | |
| Shares sold | |
| Class A | | | 255,663 | | | $ | 2,911,172 | | | | 1,021,922 | | | $ | 10,949,401 | |
| Class B | | | 4 | | | | 52 | | | | 1,333 | | | | 14,309 | |
| Class C | | | 11,754 | | | | 133,792 | | | | 45,171 | | | | 485,137 | |
| Class S | | | 353,617 | | | | 4,038,147 | | | | 916,308 | | | | 9,938,722 | |
| | | | | | | $ | 7,083,163 | | | | | | | $ | 21,387,569 | |
| Shares issued to shareholders in reinvestment of distributions | |
| Class A | | | 46,064 | | | $ | 520,318 | | | | 111,162 | | | $ | 1,170,957 | |
| Class B | | | 643 | | | | 7,264 | | | | 2,543 | | | | 26,616 | |
| Class C | | | 4,861 | | | | 54,862 | | | | 12,401 | | | | 130,275 | |
| Class S | | | 68,563 | | | | 772,674 | | | | 148,856 | | | | 1,568,032 | |
| | | | | | | $ | 1,355,118 | | | | | | | $ | 2,895,880 | |
| Shares redeemed | |
| Class A | | | (1,150,643 | ) | | $ | (13,094,571 | ) | | | (1,877,103 | ) | | $ | (20,135,834 | ) |
| Class B | | | (39,885 | ) | | | (454,261 | ) | | | (178,995 | ) | | | (1,907,940 | ) |
| Class C | | | (93,580 | ) | | | (1,063,561 | ) | | | (326,683 | ) | | | (3,495,746 | ) |
| Class S | | | (3,203,906 | ) | | | (37,003,185 | ) | | | (1,241,730 | ) | | | (13,354,534 | ) |
| | | | | | | $ | (51,615,578 | ) | | | | | | $ | (38,894,054 | ) |
| Net increase (decrease) | |
| Class A | | | (848,916 | ) | | $ | (9,663,081 | ) | | | (744,019 | ) | | $ | (8,015,476 | ) |
| Class B | | | (39,238 | ) | | | (446,945 | ) | | | (175,119 | ) | | | (1,867,015 | ) |
| Class C | | | (76,965 | ) | | | (874,907 | ) | | | (269,111 | ) | | | (2,880,334 | ) |
| Class S | | | (2,781,726 | ) | | | (32,192,364 | ) | | | (176,566 | ) | | | (1,847,780 | ) |
| | | | | | | $ | (43,177,297 | ) | | | | | | $ | (14,610,605 | ) |
DWS LifeCompass 2020 Fund
The following table summarizes share and dollar activity in the Fund:
| | | Six Months Ended February 28, 2013 | | | Year Ended
August 31, 2012 | |
| | | Shares | | | Dollars | | | Shares | | | Dollars | |
| Shares sold | |
| Class A | | | 359,463 | | | $ | 4,970,728 | | | | 1,210,096 | | | $ | 15,657,143 | |
| Class B | | | 141 | | | | 1,967 | | | | 779 | | | | 10,331 | |
| Class C | | | 14,588 | | | | 200,450 | | | | 61,269 | | | | 779,995 | |
| Class S | | | 417,751 | | | | 5,760,261 | | | | 2,398,717 | | | | 30,977,329 | |
| | | | | | | $ | 10,933,406 | | | | | | | $ | 47,424,798 | |
| Shares issued to shareholders in reinvestment of distributions | |
| Class A | | | 105,996 | | | $ | 1,434,136 | | | | 118,697 | | | $ | 1,477,775 | |
| Class B | | | 2,092 | | | | 28,184 | | | | 3,553 | | | | 44,061 | |
| Class C | | | 10,294 | | | | 138,762 | | | | 12,013 | | | | 148,966 | |
| Class S | | | 163,577 | | | | 2,213,189 | | | | 179,795 | | | | 2,240,249 | |
| | | | | | | $ | 3,814,271 | | | | | | | $ | 3,911,051 | |
| Shares redeemed | |
| Class A | | | (1,106,145 | ) | | $ | (15,224,716 | ) | | | (1,558,970 | ) | | $ | (20,201,212 | ) |
| Class B | | | (41,768 | ) | | | (571,800 | ) | | | (220,129 | ) | | | (2,806,589 | ) |
| Class C | | | (94,789 | ) | | | (1,298,432 | ) | | | (283,723 | ) | | | (3,658,948 | ) |
| Class S | | | (1,805,374 | ) | | | (25,209,976 | ) | | | (3,227,711 | ) | | | (41,745,007 | ) |
| | | | | | | $ | (42,304,924 | ) | | | | | | $ | (68,411,756 | ) |
| Net increase (decrease) | |
| Class A | | | (640,686 | ) | | $ | (8,819,852 | ) | | | (230,177 | ) | | $ | (3,066,294 | ) |
| Class B | | | (39,535 | ) | | | (541,649 | ) | | | (215,797 | ) | | | (2,752,197 | ) |
| Class C | | | (69,907 | ) | | | (959,220 | ) | | | (210,441 | ) | | | (2,729,987 | ) |
| Class S | | | (1,224,046 | ) | | | (17,236,526 | ) | | | (649,199 | ) | | | (8,527,429 | ) |
| | | | | | | $ | (27,557,247 | ) | | | | | | $ | (17,075,907 | ) |
DWS LifeCompass 2030 Fund
The following table summarizes share and dollar activity in the Fund:
| | | Six Months Ended February 28, 2013 | | | Year Ended
August 31, 2012 | |
| | | Shares | | | Dollars | | | Shares | | | Dollars | |
| Shares sold | |
| Class A | | | 360,627 | | | $ | 3,609,690 | | | | 1,293,121 | | | $ | 11,961,734 | |
| Class B | | | 872 | | | | 8,812 | | | | 12,529 | | | | 119,294 | |
| Class C | | | 29,561 | | | | 297,436 | | | | 32,178 | | | | 297,256 | |
| Class S | | | 602,611 | | | | 6,000,400 | | | | 879,028 | | | | 8,210,785 | |
| | | | | | | $ | 9,916,338 | | | | | | | $ | 20,589,069 | |
| Shares issued to shareholders in reinvestment of distributions | |
| Class A | | | 70,183 | | | $ | 685,755 | | | | 62,629 | | | $ | 556,144 | |
| Class B | | | 544 | | | | 5,324 | | | | 899 | | | | 8,003 | |
| Class C | | | 4,032 | | | | 39,437 | | | | 3,340 | | | | 29,695 | |
| Class S | | | 43,455 | | | | 424,160 | | | | 37,215 | | | | 330,468 | |
| | | | | | | $ | 1,154,676 | | | | | | | $ | 924,310 | |
| Shares redeemed | |
| Class A | | | (652,423 | ) | | $ | (6,547,954 | ) | | | (1,268,844 | ) | | $ | (11,623,141 | ) |
| Class B | | | (27,976 | ) | | | (275,154 | ) | | | (63,741 | ) | | | (594,813 | ) |
| Class C | | | (50,941 | ) | | | (508,435 | ) | | | (65,577 | ) | | | (609,158 | ) |
| Class S | | | (1,056,187 | ) | | | (10,767,681 | ) | | | (812,241 | ) | | | (7,495,873 | ) |
| | | | | | | $ | (18,099,224 | ) | | | | | | $ | (20,322,985 | ) |
| Net increase (decrease) | |
| Class A | | | (221,613 | ) | | $ | (2,252,509 | ) | | | 86,906 | | | $ | 894,737 | |
| Class B | | | (26,560 | ) | | | (261,018 | ) | | | (50,313 | ) | | | (467,516 | ) |
| Class C | | | (17,348 | ) | | | (171,562 | ) | | | (30,059 | ) | | | (282,207 | ) |
| Class S | | | (410,121 | ) | | | (4,343,121 | ) | | | 104,002 | | | | 1,045,380 | |
| | | | | | | $ | (7,028,210 | ) | | | | | | $ | 1,190,394 | |
DWS LifeCompass 2040 Fund
The following table summarizes share and dollar activity in the Fund:
| | | Six Months Ended February 28, 2013 | | | Year Ended
August 31, 2012 | |
| | | Shares | | | Dollars | | | Shares | | | Dollars | |
| Shares sold | |
| Class A | | | 321,361 | | | $ | 2,736,895 | | | | 1,110,402 | | | $ | 8,824,620 | |
| Class C | | | 5,949 | | | | 50,186 | | | | 3,978 | | | | 31,296 | |
| Class S | | | 595,298 | | | | 5,064,326 | | | | 1,075,064 | | | | 8,630,969 | |
| | | | | | | $ | 7,851,407 | | | | | | | $ | 17,486,885 | |
| Shares issued to shareholders in reinvestment of distributions | |
| Class A | | | 57,035 | | | $ | 472,255 | | | | 89,497 | | | $ | 676,598 | |
| Class C | | | 426 | | | | 3,528 | | | | 749 | | | | 5,660 | |
| Class S | | | 57,031 | | | | 472,782 | | | | 74,706 | | | | 564,777 | |
| | | | | | | $ | 948,565 | | | | | | | $ | 1,247,035 | |
| Shares redeemed | |
| Class A | | | (552,869 | ) | | $ | (4,736,601 | ) | | | (769,258 | ) | | $ | (6,090,804 | ) |
| Class C | | | (1,901 | ) | | | (16,572 | ) | | | (8,775 | ) | | | (70,122 | ) |
| Class S | | | (1,575,676 | ) | | | (13,747,405 | ) | | | (696,126 | ) | | | (5,476,144 | ) |
| | | | | | | $ | (18,500,578 | ) | | | | | | $ | (11,637,070 | ) |
| Net increase (decrease) | |
| Class A | | | (174,473 | ) | | $ | (1,527,451 | ) | | | 430,641 | | | $ | 3,410,414 | |
| Class C | | | 4,474 | | | | 37,142 | | | | (4,048 | ) | | | (33,166 | ) |
| Class S | | | (923,347 | ) | | | (8,210,297 | ) | | | 453,644 | | | | 3,719,602 | |
| | | | | | | $ | (9,700,606 | ) | | | | | | $ | 7,096,850 | |
E. Transactions with Affiliates
The Funds mainly invest in Underlying DWS Funds and Non-affiliated ETFs. The Underlying DWS Funds in which the Funds invest are considered to be affiliated investments. A summary of each Fund's transactions with affiliated Underlying DWS Funds during the six months ended February 28, 2013 is as follows:
DWS LifeCompass Retirement Fund
| Affiliate | | Value ($) at 8/31/2012 | | | Purchases Cost ($) | | | Sales Cost ($) | | | Realized Gain/ (Loss) ($) | | | Income Distributions ($) | | | Capital Gain Distributions ($) | | | Value ($) at 2/28/2013 | |
| DWS Capital Growth Fund | | | 2,004,694 | | | | 837,604 | | | | 460,000 | | | | 24,374 | | | | 27,605 | | | | — | | | | 2,474,136 | |
| DWS Core Equity Fund | | | 5,113,265 | | | | 57,221 | | | | 1,425,000 | | | | 65,220 | | | | 57,221 | | | | — | | | | 4,234,581 | |
| DWS Diversified International Equity Fund | | | 2,160,972 | | | | 42,075 | | | | 1,550,000 | | | | 21,601 | | | | 42,075 | | | | — | | | | 826,532 | |
| DWS EAFE Equity Index Fund | | | 2,202,007 | | | | 1,176,874 | | | | — | | | | — | | | | 91,874 | | | | — | | | | 3,669,003 | |
| DWS Emerging Markets Equity Fund | | | 1,305,988 | | | | 59,486 | | | | 265,000 | | | | (34,018 | ) | | | 19,486 | | | | — | | | | 1,195,019 | |
| DWS Equity 500 Index Fund | | | 7,437,823 | | | | 1,705,479 | | | | — | | | | — | | | | 100,479 | | | | — | | | | 9,777,867 | |
| DWS Equity Dividend Fund | | | 2,347,534 | | | | 23,719 | | | | 1,482,500 | | | | 198,668 | | | | 23,719 | | | | — | | | | 958,487 | |
| DWS Global Growth Fund | | | 820,942 | | | | 10,743 | | | | 904,642 | | | | (13,906 | ) | | | 10,743 | | | | — | | | | — | |
| DWS International Fund | | | 143,679 | | | | 745,447 | | | | 5,000 | | | | 11 | | | | 30,447 | | | | — | | | | 899,266 | |
| DWS Mid Cap Value Fund | | | 835,309 | | | | 9,861 | | | | 222,500 | | | | 17,996 | | | | 9,861 | | | | — | | | | 724,342 | |
| DWS Small Cap Core Fund | | | — | | | | 1,209,437 | | | | — | | | | — | | | | 9,437 | | | | — | | | | 1,335,449 | |
| DWS Small Cap Growth Fund | | | 1,282,759 | | | | 10,000 | | | | 725,000 | | | | 43,230 | | | | — | | | | — | | | | 624,684 | |
| DWS Small Cap Value Fund | | | 1,603,607 | | | | 27,579 | | | | 1,455,000 | | | | 120,056 | | | | 12,408 | | | | 15,171 | | | | 267,418 | |
| DWS Technology Fund | | | 861,200 | | | | — | | | | 827,464 | | | | 329,803 | | | | — | | | | — | | | | — | |
| DWS Core Fixed Income Fund | | | 18,588,809 | | | | 1,127,550 | | | | 2,955,000 | | | | (191,909 | ) | | | 233,202 | | | | — | | | | 16,734,236 | |
| DWS Enhanced Commodity Strategy Fund | | | 877,065 | | | | 53,234 | | | | 75,000 | | | | (22,488 | ) | | | 13,234 | | | | — | | | | 796,035 | |
| DWS Enhanced Emerging Markets Fixed Income Fund | | | 880,881 | | | | 17,968 | | | | 928,703 | | | | 77,629 | | | | 7,968 | | | | — | | | | — | |
| DWS Enhanced Global Bond Fund | | | 8,882,785 | | | | 1,240,586 | | | | 2,200,000 | | | | (115,663 | ) | | | 107,858 | | | | 152,728 | | | | 7,961,974 | |
| DWS Floating Rate Fund | | | — | | | | 860,526 | | | | 70,000 | | | | 332 | | | | 10,526 | | | | — | | | | 796,755 | |
| DWS Global High Income Fund | | | 565,555 | | | | 343,711 | | | | 135,000 | | | | (7,150 | ) | | | 28,220 | | | | 653 | | | | 794,508 | |
| DWS Global Inflation Fund | | | 2,603,157 | | | | 1,799,867 | | | | 315,000 | | | | 1,679 | | | | 6,570 | | | | 68,297 | | | | 3,985,432 | |
| DWS High Income Fund | | | 2,518,389 | | | | 93,586 | | | | 670,000 | | | | 10,968 | | | | 74,523 | | | | 4,063 | | | | 1,991,096 | |
| DWS U.S. Bond Index Fund | | | 18,521,299 | | | | 1,483,656 | | | | 2,735,000 | | | | (8,867 | ) | | | 229,707 | | | | 274,280 | | | | 16,778,495 | |
| DWS Disciplined Market Neutral Fund | | | 876,997 | | | | 10,000 | | | | 105,000 | | | | 1,122 | | | | — | | | | — | | | | 795,057 | |
| Central Cash Management Fund | | | 897,700 | | | | 5,371,781 | | | | 5,988,246 | | | | — | | | | 420 | | | | — | | | | 281,235 | |
| Total | | | 83,332,416 | | | | 18,317,990 | | | | 25,499,055 | | | | 518,688 | | | | 1,147,583 | | | | 515,192 | | | | 77,901,607 | |
DWS LifeCompass 2015 Fund
| Affiliate | | Value ($) at 8/31/2012 | | | Purchases Cost ($) | | | Sales Cost ($) | | | Realized Gain/ (Loss) ($) | | | Income Distributions ($) | | | Capital Gain Distributions ($) | | | Value ($) at 2/28/2013 | |
| DWS Capital Growth Fund | | | 6,460,859 | | | | 2,259,001 | | | | 2,255,000 | | | | 108,781 | | | | 84,001 | | | | — | | | | 6,736,838 | |
| DWS Core Equity Fund | | | 9,595,855 | | | | 111,113 | | | | 3,480,000 | | | | 179,253 | | | | 111,113 | | | | — | | | | 7,187,384 | |
| DWS Diversified International Equity Fund | | | 3,936,762 | | | | 75,280 | | | | 3,375,000 | | | | 155,226 | | | | 75,280 | | | | — | | | | 968,994 | |
| DWS EAFE Equity Index Fund | | | 3,795,526 | | | | 4,420,559 | | | | 815,000 | | | | (8,774 | ) | | | 170,560 | | | | — | | | | 7,936,532 | |
| DWS Emerging Markets Equity Fund | | | 2,810,616 | | | | 57,409 | | | | 985,000 | | | | (36,288 | ) | | | 42,409 | | | | — | | | | 2,090,962 | |
| DWS Equity 500 Index Fund | | | 16,091,799 | | | | 2,182,074 | | | | 4,935,000 | | | | 241,797 | | | | 212,073 | | | | — | | | | 14,629,797 | |
| DWS Equity Dividend Fund | | | 6,227,683 | | | | 73,952 | | | | 4,490,000 | | | | 168,892 | | | | 73,952 | | | | — | | | | 2,013,843 | |
| DWS Global Small Cap Growth Fund | | | 151,391 | | | | — | | | | 151,593 | | | | (8,049 | ) | | | — | | | | — | | | | — | |
| DWS Global Growth Fund | | | 1,019,322 | | | | 9,975 | | | | 1,144,277 | | | | (151,450 | ) | | | 9,975 | | | | — | | | | — | |
| DWS International Fund | | | 1,307,522 | | | | 50,105 | | | | 260,000 | | | | (19,757 | ) | | | 50,105 | | | | — | | | | 1,187,202 | |
| DWS Mid Cap Value Fund | | | 1,305,723 | | | | — | | | | 1,339,674 | | | | 86,134 | | | | — | | | | — | | | | — | |
| DWS RREEF Real Estate Securities Fund | | | 1,128,678 | | | | 4,661 | | | | 1,107,799 | | | | 102,717 | | | | 4,661 | | | | — | | | | — | |
| DWS Small Cap Core Fund | | | 1,217,381 | | | | 1,465,015 | | | | — | | | | — | | | | 20,015 | | | | — | | | | 2,960,685 | |
| DWS Small Cap Growth Fund | | | 1,728,990 | | | | — | | | | 1,817,798 | | | | 419,701 | | | | — | | | | — | | | | — | |
| DWS Small Cap Value Fund | | | 2,447,060 | | | | 93,069 | | | | 2,678,762 | | | | 317,202 | | | | 19,376 | | | | 23,693 | | | | — | |
| DWS Technology Fund | | | 1,470,693 | | | | — | | | | 1,170,000 | | | | 144,752 | | | | — | | | | — | | | | 238,583 | |
| DWS World Dividend Fund | | | — | | | | 1,220,000 | | | | — | | | | — | | | | — | | | | — | | | | 1,265,895 | |
| DWS Core Fixed Income Fund | | | 23,116,315 | | | | 694,864 | | | | 7,825,000 | | | | (478,774 | ) | | | 290,066 | | | | — | | | | 15,958,895 | |
| DWS Enhanced Commodity Strategy Fund | | | 1,421,020 | | | | 61,532 | | | | 340,000 | | | | (108,343 | ) | | | 21,532 | | | | — | | | | 1,046,766 | |
| DWS Enhanced Emerging Markets Fixed Income Fund | | | 1,389,969 | | | | 69,916 | | | | 460,000 | | | | 13,977 | | | | 24,916 | | | | — | | | | 1,046,741 | |
| DWS Enhanced Global Bond Fund | | | 6,973,769 | | | | 7,140,696 | | | | 4,130,000 | | | | (202,321 | ) | | | 129,237 | | | | 211,460 | | | | 9,946,747 | |
| DWS Floating Rate Fund | | | — | | | | 1,402,019 | | | | 365,000 | | | | 2,520 | | | | 17,019 | | | | — | | | | 1,047,293 | |
| DWS Global High Income Fund | | | 710,541 | | | | 734,710 | | | | 430,000 | | | | 6,183 | | | | 44,009 | | | | 1,077 | | | | 1,045,820 | |
| DWS Global Inflation Fund | | | 3,513,017 | | | | 619,325 | | | | 1,290,000 | | | | 4,278 | | | | 5,655 | | | | 48,670 | | | | 2,788,215 | |
| DWS High Income Fund | | | 3,918,446 | | | | 106,315 | | | | 2,005,000 | | | | 47,731 | | | | 100,950 | | | | 5,365 | | | | 2,090,187 | |
| DWS U.S. Bond Index Fund | | | 24,017,624 | | | | 1,137,923 | | | | 8,550,000 | | | | (52,294 | ) | | | 291,728 | | | | 340,985 | | | | 15,995,775 | |
| DWS Disciplined Market Neutral Fund | | | 1,951,143 | | | | 5,000 | | | | 675,000 | | | | 6,670 | | | | — | | | | — | | | | 1,307,375 | |
| Central Cash Management Fund | | | 944,404 | | | | 10,413,081 | | | | 10,751,107 | | | | — | | | | 534 | | | | — | | | | 606,378 | |
| Total | | | 128,652,108 | | | | 34,407,594 | | | | 66,826,010 | | | | 939,764 | | | | 1,799,166 | | | | 631,250 | | | | 100,096,907 | |
DWS LifeCompass 2020 Fund
| Affiliate | | Value ($) at 8/31/2012 | | | Purchases Cost ($) | | | Sales Cost ($) | | | Realized Gain/ (Loss) ($) | | | Income Distributions ($) | | | Capital Gain Distributions ($) | | | Value ($) at 2/28/2013 | |
| DWS Capital Growth Fund | | | 8,249,409 | | | | 587,061 | | | | 1,580,000 | | | | 68,366 | | | | 87,061 | | | | — | | | | 7,525,623 | |
| DWS Core Equity Fund | | | 14,602,788 | | | | 187,040 | | | | 595,000 | | | | (113,778 | ) | | | 187,040 | | | | — | | | | 15,865,426 | |
| DWS Diversified International Equity Fund | | | 7,074,985 | | | | 170,766 | | | | 3,160,000 | | | | 129,223 | | | | 170,766 | | | | — | | | | 4,711,896 | |
| DWS EAFE Equity Index Fund | | | 6,243,742 | | | | 7,900,773 | | | | 500,000 | | | | (20,000 | ) | | | 270,773 | | | | — | | | | 14,526,884 | |
| DWS Emerging Markets Equity Fund | | | 5,201,869 | | | | 681,580 | | | | 825,000 | | | | (63,528 | ) | | | 91,580 | | | | — | | | | 5,474,457 | |
| DWS Equity 500 Index Fund | | | 26,849,646 | | | | 6,026,369 | | | | 3,545,000 | | | | 111,878 | | | | 371,370 | | | | — | | | | 31,648,793 | |
| DWS Equity Dividend Fund | | | 8,818,686 | | | | 115,977 | | | | 5,125,000 | | | | 96,174 | | | | 115,977 | | | | — | | | | 4,109,141 | |
| DWS Global Growth Fund | | | 3,139,313 | | | | 35,977 | | | | 1,505,000 | | | | (401,800 | ) | | | 35,977 | | | | — | | | | 2,000,311 | |
| DWS Global Small Cap Growth Fund | | | 2,057,537 | | | | 84,792 | | | | 1,975,000 | | | | 165,830 | | | | 2,403 | | | | 82,389 | | | | 308,259 | |
| DWS International Fund | | | 2,015,021 | | | | 72,156 | | | | 140,000 | | | | (13,255 | ) | | | 72,156 | | | | — | | | | 2,084,113 | |
| DWS Large Cap Focus Growth Fund | | | 2,083,947 | | | | 5,231 | | | | 580,000 | | | | 67,523 | | | | 5,231 | | | | — | | | | 1,520,792 | |
| DWS Large Cap Value Fund | | | 3,355,410 | | | | 29,462 | | | | 1,530,000 | | | | 96,782 | | | | 29,462 | | | | — | | | | 2,036,865 | |
| DWS Mid Cap Value Fund | | | 1,870,322 | | | | — | | | | 1,916,124 | | | | 128,829 | | | | — | | | | — | | | | — | |
| DWS RREEF Real Estate Securities Fund | | | 1,911,110 | | | | 7,680 | | | | 1,872,035 | | | | 275,266 | | | | 7,680 | | | | — | | | | — | |
| DWS Small Cap Core Fund | | | 610,504 | | | | 3,939,158 | | | | 15,000 | | | | 828 | | | | 34,158 | | | | — | | | | 4,982,463 | |
| DWS Small Cap Growth Fund | | | 3,539,647 | | | | — | | | | 2,890,000 | | | | 547,758 | | | | — | | | | — | | | | 782,286 | |
| DWS Small Cap Value Fund | | | 4,451,274 | | | | 64,937 | | | | 4,040,000 | | | | 403,968 | | | | 29,215 | | | | 35,724 | | | | 702,920 | |
| DWS Technology Fund | | | 4,549,188 | | | | — | | | | 2,435,000 | | | | 503,190 | | | | — | | | | — | | | | 1,959,645 | |
| DWS Core Fixed Income Fund | | | 24,700,476 | | | | 1,207,242 | | | | 3,965,000 | | | | (256,252 | ) | | | 317,622 | | | | — | | | | 21,907,280 | |
| DWS Enhanced Commodity Strategy Fund | | | 2,015,240 | | | | 145,673 | | | | 200,000 | | | | (65,130 | ) | | | 30,673 | | | | — | | | | 1,821,502 | |
| DWS Enhanced Emerging Markets Fixed Income Fund | | | 1,988,405 | | | | 75,589 | | | | 300,000 | | | | 5,278 | | | | 35,589 | | | | — | | | | 1,830,125 | |
| DWS Enhanced Global Bond Fund | | | 7,684,836 | | | | 9,223,724 | | | | 3,175,000 | | | | (155,503 | ) | | | 155,678 | | | | 253,044 | | | | 13,665,967 | |
| DWS Floating Rate Fund | | | — | | | | 2,020,026 | | | | 210,000 | | | | 1,474 | | | | 25,026 | | | | — | | | | 1,825,008 | |
| DWS Global High Income Fund | | | 1,010,802 | | | | 1,054,132 | | | | 285,000 | | | | 2,523 | | | | 63,179 | | | | 1,542 | | | | 1,822,324 | |
| DWS Global Inflation Fund | | | 3,290,486 | | | | 1,598,395 | | | | 360,000 | | | | (1,265 | ) | | | 6,743 | | | | 56,652 | | | | 4,460,670 | |
| DWS High Income Fund | | | 4,860,633 | | | | 115,968 | | | | 2,630,000 | | | | 71,994 | | | | 110,415 | | | | 5,553 | | | | 2,425,927 | |
| DWS U.S. Bond Index Fund | | | 25,641,478 | | | | 1,692,145 | | | | 4,720,000 | | | | (19,743 | ) | | | 319,005 | | | | 373,041 | | | | 21,943,530 | |
| DWS Disciplined Market Neutral Fund | | | 3,325,857 | | | | 25,000 | | | | 1,265,000 | | | | 4,102 | | | | — | | | | — | | | | 2,127,126 | |
| Central Cash Management Fund | | | 235,298 | | | | 16,078,116 | | | | 15,533,267 | | | | — | | | | 781 | | | | — | | | | 780,147 | |
| Total | | | 181,377,909 | | | | 53,144,969 | | | | 66,871,426 | | | | 1,570,732 | | | | 2,575,560 | | | | 807,945 | | | | 174,849,480 | |
DWS LifeCompass 2030 Fund
| Affiliate | | Value ($) at 8/31/2012 | | | Purchases Cost ($) | | | Sales Cost ($) | | | Realized Gain/ (Loss) ($) | | | Income Distributions ($) | | | Capital Gain Distributions ($) | | | Value ($) at 2/28/2013 | |
| DWS Capital Growth Fund | | | 5,538,684 | | | | 88,059 | | | | 600,000 | | | | 36,598 | | | | 63,059 | | | | — | | | | 5,216,947 | |
| DWS Core Equity Fund | | | 5,415,912 | | | | 108,453 | | | | 235,000 | | | | (659 | ) | | | 68,453 | | | | — | | | | 5,901,404 | |
| DWS Diversified International Equity Fund | | | 2,948,172 | | | | 73,662 | | | | 1,845,000 | | | | 97,363 | | | | 73,662 | | | | — | | | | 1,453,083 | |
| DWS EAFE Equity Index Fund | | | 2,667,394 | | | | 4,068,313 | | | | — | | | | — | | | | 118,313 | | | | — | | | | 7,122,867 | |
| DWS Emerging Markets Equity Fund | | | 2,130,250 | | | | 237,739 | | | | 280,000 | | | | (30,263 | ) | | | 37,739 | | | | — | | | | 2,256,794 | |
| DWS Equity 500 Index Fund | | | 11,904,011 | | | | 3,791,664 | | | | 1,500,000 | | | | 59,136 | | | | 171,664 | | | | — | | | | 15,294,330 | |
| DWS Equity Dividend Fund | | | 4,149,885 | | | | 56,761 | | | | 2,725,000 | | | | 536,948 | | | | 56,761 | | | | — | | | | 1,636,145 | |
| DWS Global Growth Fund | | | 818,690 | | | | 9,136 | | | | 520,000 | | | | 11,460 | | | | 9,136 | | | | — | | | | 391,544 | |
| DWS Global Small Cap Growth Fund | | | 660,499 | | | | 48,519 | | | | 640,000 | | | | 87,901 | | | | 950 | | | | 32,569 | | | | 110,207 | |
| DWS International Fund | | | 1,024,951 | | | | 25,541 | | | | 380,000 | | | | (24,840 | ) | | | 25,541 | | | | — | | | | 737,703 | |
| DWS Large Cap Value Fund | | | 1,477,289 | | | | 16,222 | | | | 445,000 | | | | 9,393 | | | | 16,223 | | | | — | | | | 1,155,763 | |
| DWS Mid Cap Value Fund | | | 677,923 | | | | — | | | | 694,415 | | | | 58,595 | | | | — | | | | — | | | | — | |
| DWS RREEF Global Real Estate Securities Fund | | | — | | | | 743,695 | | | | 25,000 | | | | (275 | ) | | | 43,695 | | | | — | | | | 725,470 | |
| DWS RREEF Real Estate Securities Fund | | | 665,900 | | | | 2,823 | | | | 650,477 | | | | 177,804 | | | | 2,823 | | | | — | | | | — | |
| DWS Small Cap Core Fund | | | 513,309 | | | | 2,089,881 | | | | — | | | | — | | | | 19,881 | | | | — | | | | 2,866,035 | |
| DWS Small Cap Growth Fund | | | 1,469,236 | | | | — | | | | 1,430,000 | | | | 337,014 | | | | — | | | | — | | | | 82,461 | |
| DWS Small Cap Value Fund | | | 1,901,757 | | | | 22,948 | | | | 1,925,000 | | | | 228,104 | | | | 10,324 | | | | 12,624 | | | | 86,450 | |
| DWS Technology Fund | | | 1,465,584 | | | | — | | | | 685,000 | | | | 184,818 | | | | — | | | | — | | | | 721,503 | |
| DWS World Dividend Fund | | | 734,184 | | | | 320,883 | | | | — | | | | — | | | | 20,883 | | | | — | | | | 1,114,133 | |
| DWS Core Fixed Income Fund | | | 2,956,334 | | | | 2,457,596 | | | | 492,500 | | | | (1,655 | ) | | | 58,080 | | | | — | | | | 4,909,419 | |
| DWS Enhanced Commodity Strategy Fund | | | 661,343 | | | | 95,244 | | | | 65,000 | | | | (20,013 | ) | | | 10,244 | | | | — | | | | 643,305 | |
| DWS Enhanced Emerging Markets Fixed Income Fund | | | 336,902 | | | | 23,155 | | | | 372,374 | | | | 35,444 | | | | 3,155 | | | | — | | | | — | |
| DWS Enhanced Global Bond Fund | | | 3,764,523 | | | | 1,348,580 | | | | 3,040,000 | | | | (24,189 | ) | | | 40,258 | | | | 58,322 | | | | 2,100,175 | |
| DWS Global Inflation Fund | | | — | | | | 752,244 | | | | 85,000 | | | | (2,976 | ) | | | 898 | | | | 11,346 | | | | 643,735 | |
| DWS High Income Fund | | | 829,903 | | | | 403,901 | | | | 285,000 | | | | 3,573 | | | | 31,879 | | | | 2,022 | | | | 968,642 | |
| DWS U.S. Bond Index Fund | | | 3,296,503 | | | | 2,274,597 | | | | 527,500 | | | | (11,304 | ) | | | 56,589 | | | | 72,544 | | | | 4,915,878 | |
| DWS Disciplined Market Neutral Fund | | | 992,527 | | | | 40,000 | | | | 400,000 | | | | 2,632 | | | | — | | | | — | | | | 644,342 | |
| Central Cash Management Fund | | | 833,112 | | | | 8,369,923 | | | | 8,006,224 | | | | — | | | | 539 | | | | — | | | | 1,196,811 | |
| Total | | | 59,834,777 | | | | 27,469,539 | | | | 27,853,490 | | | | 1,750,609 | | | | 940,749 | | | | 189,427 | | | | 62,895,146 | |
DWS LifeCompass 2040 Fund
| Affiliate | | Value ($) at 8/31/2012 | | | Purchases Cost ($) | | | Sales Cost ($) | | | Realized Gain/ (Loss) ($) | | | Income Distributions ($) | | | Capital Gain Distributions ($) | | | Value ($) at 2/28/2013 | |
| DWS Capital Growth Fund | | | 3,571,780 | | | | 177,282 | | | | 285,000 | | | | 14,836 | | | | 42,282 | | | | — | | | | 3,592,093 | |
| DWS Core Equity Fund | | | 3,649,106 | | | | 74,798 | | | | 305,000 | | | | 10,288 | | | | 44,798 | | | | — | | | | 3,818,526 | |
| DWS Diversified International Equity Fund | | | 2,318,451 | | | | 54,445 | | | | 1,705,000 | | | | 123,235 | | | | 54,446 | | | | — | | | | 876,980 | |
| DWS EAFE Equity Index Fund | | | 2,170,081 | | | | 2,649,345 | | | | 1,305,000 | | | | 3,776 | | | | 109,345 | | | | — | | | | 3,845,658 | |
| DWS Emerging Markets Equity Fund | | | 1,628,991 | | | | 213,667 | | | | 495,000 | | | | (37,994 | ) | | | 28,667 | | | | — | | | | 1,475,348 | |
| DWS Equity 500 Index Fund | | | 7,614,920 | | | | 3,369,850 | | | | 4,425,000 | | | | 263,655 | | | | 114,850 | | | | — | | | | 7,318,984 | |
| DWS Equity Dividend Fund | | | 3,009,328 | | | | 40,143 | | | | 2,115,000 | | | | 366,363 | | | | 40,143 | | | | — | | | | 1,029,622 | |
| DWS Global Growth Fund | | | 694,120 | | | | 5,411 | | | | 440,000 | | | | 20,222 | | | | 5,411 | | | | — | | | | 316,276 | |
| DWS Global Small Cap Growth Fund | | | 378,252 | | | | 34,859 | | | | 437,691 | | | | 69,374 | | | | 421 | | | | 14,438 | | | | — | |
| DWS International Fund | | | 894,048 | | | | 30,093 | | | | 395,000 | | | | 1,409 | | | | 30,093 | | | | — | | | | 589,187 | |
| DWS Large Cap Value Fund | | | 943,049 | | | | 130,029 | | | | 330,000 | | | | 39,340 | | | | 10,029 | | | | — | | | | 805,343 | |
| DWS Mid Cap Value Fund | | | 374,185 | | | | — | | | | 383,174 | | | | 41,083 | | | | — | | | | — | | | | — | |
| DWS RREEF Global Real Estate Securities Fund | | | — | | | | 15,000 | | | | — | | | | — | | | | — | | | | — | | | | 15,201 | |
| DWS RREEF Real Estate Securities Fund | | | 401,416 | | | | 1,702 | | | | 392,045 | | | | 137,693 | | | | 1,702 | | | | — | | | | — | |
| DWS Small Cap Core Fund | | | 408,418 | | | | 1,408,728 | | | | 185,000 | | | | 8,616 | | | | 13,728 | | | | — | | | | 1,814,788 | |
| DWS Small Cap Growth Fund | | | 933,108 | | | | — | | | | 959,952 | | | | 210,884 | | | | — | | | | — | | | | — | |
| DWS Small Cap Value Fund | | | 1,200,907 | | | | 13,501 | | | | 1,269,927 | | | | 161,063 | | | | 6,074 | | | | 7,427 | | | | — | |
| DWS Technology Fund | | | 954,909 | | | | — | | | | 440,000 | | | | 111,690 | | | | — | | | | — | | | | 473,527 | |
| DWS World Dividend Fund | | | 375,996 | | | | 915,197 | | | | — | | | | — | | | | 15,197 | | | | — | | | | 1,350,225 | |
| DWS Core Fixed Income Fund | | | 485,552 | | | | 1,059,298 | | | | 535,000 | | | | (1,547 | ) | | | 14,544 | | | | — | | | | 1,006,365 | |
| DWS Enhanced Commodity Strategy Fund | | | 388,026 | | | | 81,150 | | | | 115,000 | | | | (29,601 | ) | | | 6,150 | | | | — | | | | 325,390 | |
| DWS Enhanced Emerging Markets Fixed Income Fund | | | 195,798 | | | | 6,826 | | | | 209,573 | | | | 19,780 | | | | 1,826 | | | | — | | | | — | |
| DWS Enhanced Global Bond Fund | | | 572,022 | | | | 773,850 | | | | 700,000 | | | | (2,935 | ) | | | 8,370 | | | | 15,480 | | | | 645,520 | |
| DWS Global Inflation Fund | | | — | | | | 462,240 | | | | 120,000 | | | | (4,182 | ) | | | 547 | | | | 6,693 | | | | 328,428 | |
| DWS High Income Fund | | | 390,864 | | | | 248,150 | | | | 320,000 | | | | 5,632 | | | | 12,350 | | | | 800 | | | | 326,794 | |
| DWS U.S. Bond Index Fund | | | 825,998 | | | | 766,027 | | | | 550,000 | | | | (8,575 | ) | | | 14,385 | | | | 16,721 | | | | 1,011,881 | |
| DWS Disciplined Market Neutral Fund | | | 578,434 | | | | 45,000 | | | | 305,000 | | | | 2,611 | | | | — | | | | — | | | | 325,578 | |
| Central Cash Management Fund | | | 798,059 | | | | 7,095,321 | | | | 7,395,045 | | | | — | | | | 406 | | | | — | | | | 498,335 | |
| Total | | | 35,755,818 | | | | 19,671,912 | | | | 26,117,407 | | | | 1,526,716 | | | | 575,764 | | | | 61,559 | | | | 31,790,049 | |
Information About Each Fund's Expenses
As an investor of the Funds, you incur two types of costs: ongoing expenses and transaction costs. Ongoing expenses include distribution and service (12b-1) fees and other Fund expenses. Examples of transaction costs include sales charges (loads) and account maintenance fees, which are not shown in this section. The following tables are intended to help you understand your ongoing expenses (in dollars) of investing in the Funds and to help you compare these expenses with the ongoing expenses of investing in mutual funds. In addition to the ongoing expenses which the Funds bear directly, the Funds' shareholders indirectly bear the expenses of the Underlying Funds in which the Funds invest. These expenses are not included in the Funds' annualized expense ratios used to calculate the expense estimate in the tables. In the most recent six-month period, DWS LifeCompass Retirement Fund, DWS LifeCompass 2015 Fund, DWS LifeCompass 2020 Fund, DWS LifeCompass 2030 Fund and DWS LifeCompass 2040 Fund limited the ongoing expenses the Funds bear directly; had they not done so, expenses would have been higher. The examples in the tables are based on an investment of $1,000 invested at the beginning of the six-month period and held for the entire period (September 1, 2012 to February 28, 2013).
The tables illustrate your Fund's expenses in two ways:
•Actual Fund Return. This helps you estimate the actual dollar amount of ongoing expenses (but not transaction costs) paid on a $1,000 investment in the Fund using the Fund's actual return during the period. To estimate the expenses you paid over the period, simply divide your account value by $1,000 (for example, an $8,600 account value divided by $1,000 = 8.6), then multiply the result by the number in the "Expenses Paid per $1,000" line under the share class you hold.
•Hypothetical 5% Fund Return. This helps you to compare your Fund's ongoing expenses (but not transaction costs) with those of other mutual funds using the Fund's actual expense ratio and a hypothetical rate of return of 5% per year before expenses. Examples using a 5% hypothetical fund return may be found in the shareholder reports of other mutual funds. The hypothetical account values and expenses may not be used to estimate the actual ending account balance or expenses you paid for the period.
Please note that the expenses shown in these tables are meant to highlight your ongoing expenses only and do not reflect any transaction costs. The "Expenses Paid per $1,000" line of the tables is useful in comparing ongoing expenses only and will not help you determine the relative total expense of owning different funds. Subject to certain exceptions, an account maintenance fee of $20.00 assessed once per calendar year for Classes A, B, C and S shares may apply for accounts with balances less than $10,000. This fee is not included in these tables. If it was, the estimate of expenses paid for Classes A, B, C and S shares during the period would be higher, and account value during the period would be lower, by this amount.
DWS LifeCompass Retirement Fund
Expenses and Value of a $1,000 Investment for the six months ended February 28, 2013 (Unaudited) | |
| Actual Fund Return | | Class A | | | Class B | | | Class C | | | Class S | |
| Beginning Account Value 9/1/12 | | $ | 1,000.00 | | | $ | 1,000.00 | | | $ | 1,000.00 | | | $ | 1,000.00 | |
| Ending Account Value 2/28/13 | | $ | 1,040.80 | | | $ | 1,037.70 | | | $ | 1,037.70 | | | $ | 1,043.00 | |
| Expenses Paid per $1,000* | | $ | 2.48 | | | $ | 6.26 | | | $ | 6.26 | | | $ | 1.22 | |
| Hypothetical 5% Fund Return | | Class A | | | Class B | | | Class C | | | Class S | |
| Beginning Account Value 9/1/12 | | $ | 1,000.00 | | | $ | 1,000.00 | | | $ | 1,000.00 | | | $ | 1,000.00 | |
| Ending Account Value 2/28/13 | | $ | 1,022.36 | | | $ | 1,018.65 | | | $ | 1,018.65 | | | $ | 1,023.60 | |
| Expenses Paid per $1,000* | | $ | 2.46 | | | $ | 6.21 | | | $ | 6.21 | | | $ | 1.20 | |
* Expenses are equal to the Fund's annualized expense ratio for each share class, multiplied by the average account value over the period, multiplied by 181 (the number of days in the most recent six-month period), then divided by 365.
| Annualized Expense Ratios** | Class A | Class B | Class C | Class S |
| DWS LifeCompass Retirement Fund | .49% | 1.24% | 1.24% | .24% |
** The Fund invests in other funds and indirectly bears its proportionate share of fees and expenses incurred by the Underlying Funds in which the Fund is invested. These ratios do not include these indirect fees and expenses.
For more information, please refer to the Fund's prospectus.
For an analysis of the fees associated with an investment in the Fund or similar funds, please refer to http://apps.finra.org/fundanalyzer/1/fa.aspx.
DWS LifeCompass 2015 Fund
Expenses and Value of a $1,000 Investment for the six months ended February 28, 2013 (Unaudited) | |
| Actual Fund Return | | Class A | | | Class B | | | Class C | | | Class S | |
| Beginning Account Value 9/1/12 | | $ | 1,000.00 | | | $ | 1,000.00 | | | $ | 1,000.00 | | | $ | 1,000.00 | |
| Ending Account Value 2/28/13 | | $ | 1,053.20 | | | $ | 1,049.20 | | | $ | 1,048.30 | | | $ | 1,053.70 | |
| Expenses Paid per $1,000* | | $ | 2.44 | | | $ | 6.25 | | | $ | 6.25 | | | $ | 1.17 | |
| Hypothetical 5% Fund Return | | Class A | | | Class B | | | Class C | | | Class S | |
| Beginning Account Value 9/1/12 | | $ | 1,000.00 | | | $ | 1,000.00 | | | $ | 1,000.00 | | | $ | 1,000.00 | |
| Ending Account Value 2/28/13 | | $ | 1,022.41 | | | $ | 1,018.70 | | | $ | 1,018.70 | | | $ | 1,023.65 | |
| Expenses Paid per $1,000* | | $ | 2.41 | | | $ | 6.16 | | | $ | 6.16 | | | $ | 1.15 | |
* Expenses are equal to the Fund's annualized expense ratio for each share class, multiplied by the average account value over the period, multiplied by 181 (the number of days in the most recent six-month period), then divided by 365.
| Annualized Expense Ratios** | Class A | Class B | Class C | Class S |
| DWS LifeCompass 2015 Fund | .48% | 1.23% | 1.23% | .23% |
** The Fund invests in other funds and indirectly bears its proportionate share of fees and expenses incurred by the Underlying Funds in which the Fund is invested. These ratios do not include these indirect fees and expenses.
For more information, please refer to the Fund's prospectus.
For an analysis of the fees associated with an investment in the Fund or similar funds, please refer to http://apps.finra.org/fundanalyzer/1/fa.aspx.
DWS LifeCompass 2020 Fund
Expenses and Value of a $1,000 Investment for the six months ended February 28, 2013 (Unaudited) | |
| Actual Fund Return | | Class A | | | Class B | | | Class C | | | Class S | |
| Beginning Account Value 9/1/12 | | $ | 1,000.00 | | | $ | 1,000.00 | | | $ | 1,000.00 | | | $ | 1,000.00 | |
| Ending Account Value 2/28/13 | | $ | 1,059.40 | | | $ | 1,055.80 | | | $ | 1,055.50 | | | $ | 1,061.30 | |
| Expenses Paid per $1,000* | | $ | 2.45 | | | $ | 6.27 | | | $ | 6.27 | | | $ | 1.18 | |
| Hypothetical 5% Fund Return | | Class A | | | Class B | | | Class C | | | Class S | |
| Beginning Account Value 9/1/12 | | $ | 1,000.00 | | | $ | 1,000.00 | | | $ | 1,000.00 | | | $ | 1,000.00 | |
| Ending Account Value 2/28/13 | | $ | 1,022.41 | | | $ | 1,018.70 | | | $ | 1,018.70 | | | $ | 1,023.65 | |
| Expenses Paid per $1,000* | | $ | 2.41 | | | $ | 6.16 | | | $ | 6.16 | | | $ | 1.15 | |
* Expenses are equal to the Fund's annualized expense ratio for each share class, multiplied by the average account value over the period, multiplied by 181 (the number of days in the most recent six-month period), then divided by 365.
| Annualized Expense Ratios** | Class A | Class B | Class C | Class S |
| DWS LifeCompass 2020 Fund | .48% | 1.23% | 1.23% | .23% |
** The Fund invests in other funds and indirectly bears its proportionate share of fees and expenses incurred by the Underlying Funds in which the Fund is invested. These ratios do not include these indirect fees and expenses.
For more information, please refer to the Fund's prospectus.
For an analysis of the fees associated with an investment in the Fund or similar funds, please refer to http://apps.finra.org/fundanalyzer/1/fa.aspx.
DWS LifeCompass 2030 Fund
Expenses and Value of a $1,000 Investment for the six months ended February 28, 2013 (Unaudited) | |
| Actual Fund Return | | Class A | | | Class B | | | Class C | | | Class S | |
| Beginning Account Value 9/1/12 | | $ | 1,000.00 | | | $ | 1,000.00 | | | $ | 1,000.00 | | | $ | 1,000.00 | |
| Ending Account Value 2/28/13 | | $ | 1,073.20 | | | $ | 1,069.40 | | | $ | 1,068.30 | | | $ | 1,073.80 | |
| Expenses Paid per $1,000* | | $ | 2.47 | | | $ | 6.31 | | | $ | 6.31 | | | $ | 1.18 | |
| Hypothetical 5% Fund Return | | Class A | | | Class B | | | Class C | | | Class S | |
| Beginning Account Value 9/1/12 | | $ | 1,000.00 | | | $ | 1,000.00 | | | $ | 1,000.00 | | | $ | 1,000.00 | |
| Ending Account Value 2/28/13 | | $ | 1,022.41 | | | $ | 1,018.70 | | | $ | 1,018.70 | | | $ | 1,023.65 | |
| Expenses Paid per $1,000* | | $ | 2.41 | | | $ | 6.16 | | | $ | 6.16 | | | $ | 1.15 | |
* Expenses are equal to the Fund's annualized expense ratio for each share class, multiplied by the average account value over the period, multiplied by 181 (the number of days in the most recent six-month period), then divided by 365.
| Annualized Expense Ratios** | Class A | Class B | Class C | Class S |
| DWS LifeCompass 2030 Fund | .48% | 1.23% | 1.23% | .23% |
** The Fund invests in other funds and indirectly bears its proportionate share of fees and expenses incurred by the Underlying Funds in which the Fund is invested. These ratios do not include these indirect fees and expenses.
For more information, please refer to the Fund's prospectus.
For an analysis of the fees associated with an investment in the Fund or similar funds, please refer to http://apps.finra.org/fundanalyzer/1/fa.aspx.
DWS LifeCompass 2040 Fund
Expenses and Value of a $1,000 Investment for the six months ended February 28, 2013 (Unaudited) | |
| Actual Fund Return | | Class A | | | Class C | | | Class S | |
| Beginning Account Value 9/1/12 | | $ | 1,000.00 | | | $ | 1,000.00 | | | $ | 1,000.00 | |
| Ending Account Value 2/28/13 | | $ | 1,082.70 | | | $ | 1,077.10 | | | $ | 1,082.70 | |
| Expenses Paid per $1,000* | | $ | 2.48 | | | $ | 6.33 | | | $ | 1.14 | |
| Hypothetical 5% Fund Return | | Class A | | | Class C | | | Class S | |
| Beginning Account Value 9/1/12 | | $ | 1,000.00 | | | $ | 1,000.00 | | | $ | 1,000.00 | |
| Ending Account Value 2/28/13 | | $ | 1,022.41 | | | $ | 1,018.74 | | | $ | 1,023.70 | |
| Expenses Paid per $1,000* | | $ | 2.41 | | | $ | 6.11 | | | $ | 1.10 | |
* Expenses are equal to the Fund's annualized expense ratio for each share class, multiplied by the average account value over the period, multiplied by 181 (the number of days in the most recent six-month period), then divided by 365.
| Annualized Expense Ratios** | Class A | Class C | Class S |
| DWS LifeCompass 2040 Fund | .48% | 1.22% | .22% |
** The Fund invests in other funds and indirectly bears its proportionate share of fees and expenses incurred by the Underlying Funds in which the Fund is invested. These ratios do not include these indirect fees and expenses.
For more information, please refer to the Fund's prospectus.
For an analysis of the fees associated with an investment in the Fund or similar funds, please refer to http://apps.finra.org/fundanalyzer/1/fa.aspx.
Investment Management Agreement Approval
The Board of Trustees approved the renewal of the Funds' investment management agreement (the "Agreement") with Deutsche Investment Management Americas Inc. ("DWS") and sub-advisory agreement (the "Sub-Advisory Agreement" and together with the Agreement, the "Agreements") between DWS and QS Investors, LLC ("QS Investors") in September 2012.
In terms of the process that the Board followed prior to approving the Agreements, shareholders should know that:
• In September 2012, all of the Funds' Trustees were independent of DWS and its affiliates.
• The Trustees met frequently during the past year to discuss fund matters and dedicated a substantial amount of time to contract review matters. Over the course of several months, the Board's Contract Committee, in coordination with the Board's Fixed Income and Quant Oversight Committee, reviewed comprehensive materials received from DWS, independent third parties and independent counsel. These materials included an analysis of the Funds' performance, fees and expenses, and profitability compiled by the Funds' independent fee consultant. The Board also received extensive information throughout the year regarding performance of the Funds.
• The Independent Trustees regularly meet privately with their independent counsel to discuss contract review and other matters. In addition, the Independent Trustees were also advised by the Funds' independent fee consultant in the course of their review of the Funds' contractual arrangements and considered a comprehensive report prepared by the independent fee consultant in connection with their deliberations (the "IFC Report").
• In connection with reviewing the Agreements, the Board also reviewed the terms of each Fund's Rule 12b-1 plan, distribution agreement, administrative services agreement, transfer agency agreement and other material service agreements.
• Based on its evaluation of the information provided, the Contract Committee presented its findings and recommendations to the Board. The Board then reviewed the Contract Committee's findings and recommendations.
In connection with the contract review process, the Contract Committee and the Board considered the factors discussed below, among others. The Board also considered that DWS and its predecessors have managed the Funds since their inception, and the Board believes that a long-term relationship with a capable, conscientious advisor is in the best interests of the Funds. The Board considered, generally, that shareholders chose to invest or remain invested in each respective Fund knowing that DWS managed the Fund. DWS is part of Deutsche Bank, a major global banking institution that is engaged in a wide range of financial services. The Board believes that there are advantages to being part of a global asset management business that offers a wide range of investing expertise and resources, including hundreds of portfolio managers and analysts with research capabilities in many countries throughout the world.
As part of the contract review process, the Board carefully considered the fees and expenses of each DWS fund overseen by the Board in light of the fund's performance. In many cases, this led to a negotiation with DWS of lower expense caps for the coming year than had previously been in place. As part of these negotiations, the Board indicated that it would consider relaxing these new lower caps in future years following sustained improvements in performance, among other considerations.
In June 2012, Deutsche Bank ("DB"), DWS's parent company, announced that DB's new management team had concluded the strategic review of its global asset management business announced in late 2011 by DB's prior management team, and would combine its Asset Management (of which DWS is a part) and Wealth Management divisions. Prior to approving the investment management agreements, the Independent Trustees were apprised of the expected management and structure of the new combined Asset & Wealth Management division ("AWM") and DWS. DB also advised the Independent Trustees that the U.S. asset management business is a critical and integral part of DB and AWM, and that DB would be reinvesting a significant portion of the substantial savings it expects to realize by combining its Asset Management and Wealth Management divisions into a combined AWM division, including enhancements to its investment capabilities. DB also confirmed its commitment to maintaining strong legal and compliance groups within the combined division.
While shareholders may focus primarily on fund performance and fees, the Funds' Board considers these and many other factors, including the quality and integrity of DWS's and QS Investors' personnel and such other issues as back-office operations, fund valuations, and compliance policies and procedures. The Board also noted that the Sub-Advisory Agreement for DWS LifeCompass 2040 Fund was approved by that Fund's shareholders in July 2010.
Nature, Quality and Extent of Services. The Board considered the terms of the Agreements, including the scope of advisory services provided under the Agreements. The Board noted that, under the Agreements, DWS and QS Investors provide portfolio management services to each Fund and that, pursuant to a separate administrative services agreement, DWS provides administrative services to each Fund. The Board considered the experience and skills of senior management and investment personnel, the resources made available to such personnel, the ability of DWS to attract and retain high-quality personnel, and the organizational depth and stability of DWS. The Board also requested and received information regarding DWS's oversight of Fund sub-advisors, including QS Investors. The Board reviewed each Fund's performance over short-term and long-term periods and compared those returns to various agreed-upon performance measures, including market indices and a peer universe compiled by the independent fee consultant using information supplied by Lipper Inc. ("Lipper"), an independent fund data service. The Board also noted that it has put into place a process of identifying "Focus Funds" (e.g., funds performing poorly relative to their benchmark or a peer universe compiled by an independent fund data service), and receives more frequent reporting and information from DWS regarding such funds, along with DWS's remedial plans to address underperformance. The Board believes this process is an effective manner of identifying and addressing underperforming funds.
LifeCompass 2015 Fund. Based on the information provided, the Board noted that for the one-, three- and five-year periods ended December 31, 2011, the LifeCompass 2015 Fund's performance (Class A shares) was in the 3rd quartile, 3rd quartile and 4th quartile, respectively, of the applicable Lipper universe (the 1st quartile being the best performers and the 4th quartile being the worst performers). The Board also observed that the Fund has underperformed its benchmark in the one- and five-year periods and has outperformed its benchmark in the three-year period ended December 31, 2011.
LifeCompass 2020 Fund. Based on the information provided, the Board noted that for the one-, three- and five-year periods ended December 31, 2011, the LifeCompass 2020 Fund's performance (Class A shares) was in the 4th quartile of the applicable Lipper universe (the 1st quartile being the best performers and the 4th quartile being the worst performers). The Board also observed that the Fund has underperformed its benchmark in the one-, three- and five-year periods ended December 31, 2011.
LifeCompass 2030 Fund. Based on the information provided, the Board noted that for the one-, three- and five-year periods ended December 31, 2011, the LifeCompass 2030 Fund's performance (Class A shares) was in the 4th quartile of the applicable Lipper universe (the 1st quartile being the best performers and the 4th quartile being the worst performers). The Board also observed that the Fund has underperformed its benchmark in the one-, three- and five-year periods ended December 31, 2011.
LifeCompass 2040 Fund. Based on the information provided, the Board noted that for the one- and three-year periods ended December 31, 2011, the LifeCompass 2040 Fund's performance (Class A shares) was in the 4th quartile of the applicable Lipper universe (the 1st quartile being the best performers and the 4th quartile being the worst performers). The Board also observed that the Fund has underperformed its benchmark in the one- and three-year periods ended December 31, 2011.
LifeCompass Retirement Fund. Based on the information provided, the Board noted that for the one-, three- and five-year periods ended December 31, 2011, the LifeCompass Retirement Fund's performance (Class A shares) was in the 4th quartile, 3rd quartile and 4th quartile, respectively, of the applicable Lipper universe (the 1st quartile being the best performers and the 4th quartile being the worst performers). The Board also observed that the Fund has underperformed its benchmark in the one- and five-year periods and has outperformed its benchmark in the three-year period ended December 31, 2011.
The Board noted the disappointing investment performance of each Fund in recent periods and continued to discuss with senior management of DWS and QS Investors the factors contributing to such underperformance and actions being taken to improve performance.
Fees and Expenses. The Board considered the Funds' investment management fee schedules, sub-advisory fee schedules, operating expenses and total expense ratios, and comparative information provided by Lipper and the independent fee consultant regarding investment management fee rates paid to other investment advisors by similar funds (1st quartile being the most favorable and 4th quartile being the least favorable). With respect to management fees paid to other investment advisors by similar funds, the Trustees noted that the Funds do not pay any fund-level investment advisory fees, but do bear administrative fees. With respect to the sub-advisory fees paid to QS Investors, the Board noted that the fees are paid by DWS and not directly by the Funds.
LifeCompass 2015 Fund. As a result of the administrative fee, the total management fee rates paid by the LifeCompass 2015 Fund were lower than the median (2nd quartile) of the applicable Lipper peer group (based on Lipper data provided as of December 31, 2011). The Board noted that the Fund's Class A shares total (net) operating expenses (excluding 12b-1 fees) were expected to be higher than the median (3rd quartile) of the applicable Lipper expense universe (based on Lipper data provided as of December 31, 2011, and analyzing Lipper expense universe Class A (net) expenses less any applicable 12b-1 fees) ("Lipper Universe Expenses").
LifeCompass 2020 Fund. As a result of the administrative fee, the total management fee rates paid by the LifeCompass 2020 Fund were lower than the median (2nd quartile) of the applicable Lipper peer group (based on Lipper data provided as of December 31, 2011). The Board noted that the Fund's Class A shares total (net) operating expenses (excluding 12b-1 fees) were expected to be higher than the median (4th quartile) of the applicable Lipper Universe Expenses.
LifeCompass 2030 Fund. As a result of the administrative fee, the total management fee rates paid by the LifeCompass 2030 Fund were lower than the median (1st quartile) of the applicable Lipper peer group (based on Lipper data provided as of December 31, 2011). The Board noted that the Fund's Class A shares total (net) operating expenses (excluding 12b-1 fees) were expected to be higher than the median (4th quartile) of the applicable Lipper Universe Expenses.
LifeCompass 2040 Fund. As a result of the administrative fee, the total management fee rates paid by the LifeCompass 2040 Fund were at the median (2nd quartile) of the applicable Lipper peer group (based on Lipper data provided as of December 31, 2011). The Board noted that the Fund's Class A shares total (net) operating expenses (excluding 12b-1 fees) were expected to be higher than the median (4th quartile) of the applicable Lipper Universe Expenses.
LifeCompass Retirement Fund. As a result of the administrative fee, the total management fee rates paid by the LifeCompass Retirement Fund were at the median (2nd quartile) of the applicable Lipper peer group (based on Lipper data provided as of December 31, 2011). The Board noted that the Fund's Class A shares total (net) operating expenses (excluding 12b-1 fees) were expected to be lower than the median (2nd quartile) of the applicable Lipper Universe Expenses.
The Board also reviewed data comparing total (net) operating expenses of each share class of each Fund to the applicable Lipper Universe Expenses. The Board also considered a report prepared by the Funds' independent fee consultant regarding the competitiveness of each Fund's total expenses relative to a more customized peer group. The Board considered the Funds' total management fee rates as compared to fees charged by DWS and certain of its affiliates for comparable mutual funds and considered differences in fund and fee structures between the DWS Funds. The Board also considered how each Fund's total (net) operating expenses compared to the total (net) operating expenses of a more customized peer group selected by Lipper (based on such factors as asset size). The Board also noted that the expense limitations agreed to by DWS helped to ensure that each Fund's total (net) operating expenses would remain competitive.
The information considered by the Board as part of its review of management fees included information regarding fees charged by DWS and its affiliates to similar institutional accounts and to similar funds offered primarily to European investors ("DWS Europe funds"), in each case as applicable. The Board observed that advisory fee rates for institutional accounts generally were lower than the management fees charged by similarly managed DWS U.S. mutual funds ("DWS Funds"), but also took note of the differences in services provided to DWS Funds as compared to institutional accounts. In the case of DWS Europe funds, the Board observed that fee rates for DWS Europe funds generally were higher than for similarly managed DWS Funds, but noted that differences in the types of services provided to DWS Funds relative to DWS Europe funds made it difficult to compare such fees.
On the basis of the information provided, the Board concluded that each Fund's management fees were reasonable and appropriate in light of the nature, quality and extent of services provided by DWS and QS Investors.
Profitability. The Board reviewed detailed information regarding revenues received by DWS from advising the DWS Funds along with the estimated costs and pre-tax profits realized by DWS from advising the DWS Funds. The Board also received information regarding the estimated enterprise-wide profitability of DWS and its affiliates with respect to all fund services in totality. The Board did not receive profitability information with respect to the Funds (which, as noted above, do not pay any investment advisory fees), but did receive such information with respect to the funds in which the Funds invest. The Board also reviewed information regarding the profitability of certain similar investment management firms. The Board noted that while information regarding the profitability of such firms is limited (and in some cases is not necessarily prepared on a comparable basis), DWS and its affiliates' overall profitability with respect to the DWS fund complex (after taking into account distribution and other services provided to the funds by DWS and its affiliates) was lower than the overall profitability levels of many comparable firms for which such data was available. The Board did not consider the profitability of QS Investors with respect to the Funds. The Board noted that DWS pays QS Investors' fee, and its understanding that each Fund's sub-advisory fee schedule was the product of an arm's length negotiation with DWS.
Economies of Scale. The Board considered whether there are economies of scale with respect to the management of the Funds and whether the Funds benefit from any economies of scale. The Board concluded that each Fund's fee schedule represents an appropriate sharing between each Fund and DWS of such economies of scale as may exist in the management of the Fund at current asset levels.
Other Benefits to DWS and QS Investors and Their Affiliates. The Board also considered the character and amount of other incidental benefits received by DWS and QS Investors and their affiliates, including any fees received by DWS for administrative services provided to the Funds and any fees received by an affiliate of DWS for distribution services. The Board also considered benefits to DWS and QS Investors related to brokerage and soft-dollar allocations, including allocating brokerage to pay for research generated by parties other than the executing broker dealers, which pertain primarily to funds investing in equity securities, along with the incidental public relations benefits to DWS and QS Investors related to DWS Funds advertising and cross-selling opportunities among DWS products and services. The Board concluded that management fees were reasonable in light of these fallout benefits.
Compliance. The Board considered the significant attention and resources dedicated by DWS to documenting and enhancing its compliance processes in recent years. The Board noted in particular (i) the experience and seniority of both DWS's chief compliance officer and the Funds' chief compliance officer; (ii) the large number of DWS compliance personnel; and (iii) the substantial commitment of resources by DWS and its affiliates to compliance matters. The Board also considered the attention and resources dedicated by DWS to the oversight of the investment sub-advisor's compliance program and compliance with the applicable fund policies and procedures.
Based on all of the information considered and the conclusions reached, the Board unanimously determined that the continuation of the Agreements is in the best interests of each Fund. In making this determination, the Board did not give particular weight to any single factor identified above. The Board considered these factors over the course of numerous meetings, certain of which were in executive session with only the Independent Trustees and their counsel present. It is possible that individual Trustees may have weighed these factors differently in reaching their individual decisions to approve the continuation of the Agreements.
Summary of Management Fee Evaluation by Independent Fee Consultant
September 17, 2012
Pursuant to an Order entered into by Deutsche Investment Management Americas and affiliates (collectively, "DeAM") with the Attorney General of New York, I, Thomas H. Mack, have been appointed the Independent Fee Consultant for the DWS Funds (formerly the DWS Scudder Funds). My duties include preparing an annual written evaluation of the management fees DeAM charges the Funds, considering among other factors the management fees charged by other mutual fund companies for like services, management fees DeAM charges other clients for like services, DeAM's costs of supplying services under the management agreements and related profit margins, possible economies of scale if a Fund grows larger, and the nature and quality of DeAM's services, including fund performance. This report summarizes my evaluation for 2012, including my qualifications, the evaluation process for each of the DWS Funds, consideration of certain complex-level factors, and my conclusions. I served in substantially the same capacity in 2007, 2008, 2009, 2010 and 2011.
Qualifications
For more than 35 years I have served in various professional capacities within the investment management business. I have held investment analysis and advisory positions, including securities analyst, portfolio strategist and director of investment policy with a large investment firm. I have also performed business management functions, including business development, financial management and marketing research and analysis.
Since 1991, I have been an independent consultant within the asset management industry. I have provided services to over 125 client organizations, including investment managers, mutual fund boards, product distributors and related organizations. Over the past ten years I have completed a number of assignments for mutual fund boards, specifically including assisting boards with management contract renewal.
I hold a Master of Business Administration degree, with highest honors, from Harvard University and Master of Science and Bachelor of Science (highest honors) degrees from the University of California at Berkeley. I am an independent director and audit committee financial expert for two closed-end mutual funds and have served in various leadership and financial oversight capacities with non-profit organizations.
Evaluation of Fees for each DWS Fund
My work focused primarily on evaluating, fund-by-fund, the fees charged to each of the 103 mutual fund portfolios in the DWS Fund family. For each Fund, I considered each of the key factors mentioned above, as well as any other relevant information. In doing so I worked closely with the Funds' Independent Directors in their annual contract renewal process, as well as in their approval of contracts for several new funds (documented separately).
In evaluating each Fund's fees, I reviewed comprehensive materials provided by or on behalf of DeAM, including expense information prepared by Lipper Analytical, comparative performance information, profitability data, manager histories, and other materials. I also accessed certain additional information from the Lipper and Morningstar databases and drew on my industry knowledge and experience.
To facilitate evaluating this considerable body of information, I prepared for each Fund a document summarizing the key data elements in each area as well as additional analytics discussed below. This made it possible to consider each key data element in the context of the others.
In the course of contract renewal, DeAM agreed to implement a number of fee and expense adjustments requested by the Independent Directors which will favorably impact future fees and expenses, and my evaluation includes the effects of these changes.
Fees and Expenses Compared with Other Funds
The competitive fee and expense evaluation for each fund focused on two primary comparisons:
The Fund's contractual management fee (the advisory fee plus the administration fee where applicable) compared with those of a group of typically 12-15 funds in the same Lipper investment category (e.g. Large Capitalization Growth) having similar distribution arrangements and being of similar size.
The Fund's total expenses compared with a broader universe of funds from the same Lipper investment category and having similar distribution arrangements.
These two comparisons provide a view of not only the level of the fee compared with funds of similar scale but also the total expense the Fund bears for all the services it receives, in comparison with the investment choices available in the Fund's investment category and distribution channel. The principal figure-of-merit used in these comparisons was the subject Fund's percentile ranking against peers.
DeAM's Fees for Similar Services to Others
DeAM provided management fee schedules for all of its US domiciled fund and non-fund investment management accounts in any of the investment categories where there is a DWS Fund. These similar products included the other DWS Funds, non-fund pooled accounts, institutional accounts and sub-advisory accounts. Using this information, I calculated for each Fund the fee that would be charged to each similar product, at the subject Fund's asset level.
Evaluating information regarding non-fund products is difficult because there are varying levels of services required for different types of accounts, with mutual funds generally requiring considerably more regulatory and administrative types of service as well as having more frequent cash flows than other types of accounts. Also, while mutual fund fees for similar fund products can be expected to be similar, there will be some differences due to different pricing conditions in different distribution channels (e.g. retail funds versus those used in variable insurance products), differences in underlying investment processes and other factors.
Costs and Profit Margins
DeAM provided a detailed profitability analysis for each Fund. After making some adjustments so that the presentation would be more comparable to the available industry figures, I reviewed profit margins from investment management alone, from investment management plus other fund services (excluding distribution) provided to the Funds by DeAM (principally shareholder services), and DeAM profits from all sources, including distribution. A later section comments on overall profitability.
Economies of Scale
Economies of scale — an expected decline in management cost per dollar of fund assets as fund assets grow — are very rarely quantified and documented because of inherent difficulties in collecting and analyzing relevant data. However, in virtually every investment category that I reviewed, larger funds tend to have lower fees and lower total expenses than smaller funds. To see how each DWS Fund compares with this industry observation, I reviewed:
The trend in Fund assets over the last five years and the accompanying trend in total expenses. This shows if the Fund has grown and, if so, whether total expense (management fees as well as other expenses) have declined as a percent of assets.
Whether the Fund has break-points in its management fee schedule, the extent of the fee reduction built into the schedule and the asset levels where the breaks take effect, and in the case of a sub-advised Fund how the Fund's break-points compare with those of the sub-advisory fee schedule.
How the Fund's contractual fee schedule compares with trends in the industry data. To accomplish this, I constructed a chart showing how actual latest-fiscal-year contractual fees of the Fund and of other similar funds relate to average fund assets, with the subject Fund's contractual fee schedule superimposed.
Quality of Service — Performance
The quality-of-service evaluation focused on investment performance, which is the principal result of the investment management service. Each Fund's performance was reviewed over the past 1, 3, 5 and 10 years, as applicable, and compared with that of other funds in the same investment category and with a suitable market index.
In addition, I calculated and reviewed risk-adjusted returns relative to an index of similar mutual funds' returns and a suitable market index. The risk-adjusted returns analysis provides a way of determining the extent to which the Fund's return comparisons are mainly the product of investment value-added (or lack thereof) or alternatively taking considerably more or less risk than is typical in its investment category.
I also received and considered the history of portfolio manager changes for each Fund, as this provided an important context for evaluating the performance results.
Complex-Level Considerations
While this evaluation was conducted mainly at the individual fund level, there are some issues relating to the reasonableness of fees that can alternatively be considered across the whole fund complex:
I reviewed DeAM's profitability analysis for all DWS Funds, with a view toward determining if the allocation procedures used were reasonable and how profit levels compared with public data for other investment managers.
I considered whether DeAM and affiliates receive any significant ancillary or "fallout" benefits that should be considered in interpreting the direct profitability results. These would be situations where serving as the investment manager of the Funds is beneficial to another part of the Deutsche Bank organization.
I considered how aggregated DWS Fund expenses had varied over the years, by asset class and in the context of trends in asset levels.
I considered how aggregated DWS Fund performance measures relative to appropriate peers had varied by asset class and over time.
I reviewed the structure of the DeAM organization, trends in staffing levels, and information on compensation of investment management and other professionals compared with industry data.
Findings
Based on the process and analysis discussed above, which included reviewing a wide range of information from management and external data sources and considering among other factors the fees DeAM charges other clients, the fees charged by other fund managers, DeAM's costs and profits associated with managing the Funds, economies of scale, possible fall-out benefits, and the nature and quality of services provided, in my opinion the management fees charged the DWS Funds are reasonable.
Thomas H. Mack
President, Thomas H. Mack & Co., Inc.
Account Management Resources | |
| For More Information | | The automated telephone system allows you to access personalized account information and obtain information on other DWS funds using either your voice or your telephone keypad. Certain account types within Classes A, B, C and S also have the ability to purchase, exchange or redeem shares using this system. For more information, contact your financial advisor. You may also access our automated telephone system or speak with a DWS Investments representative by calling: (800) 728-3337 |
| Web Site | | www.dws-investments.com View your account transactions and balances, trade shares, monitor your asset allocation, and change your address, 24 hours a day. Obtain prospectuses and applications, blank forms, interactive worksheets, news about DWS funds, subscription to fund updates by e-mail, retirement planning information, and more. |
| Written Correspondence | | DWS Investments PO Box 219151 Kansas City, MO 64121-9151 |
| Proxy Voting | | The fund's policies and procedures for voting proxies for portfolio securities and information about how the fund voted proxies related to its portfolio securities during the 12-month period ended June 30 are available on our Web site — www.dws-investments.com (click on "proxy voting"at the bottom of the page) — or on the SEC's Web site — www.sec.gov. To obtain a written copy of the fund's policies and procedures without charge, upon request, call us toll free at (800) 728-3337 |
| Portfolio Holdings | | Following the fund's fiscal first and third quarter-end, a complete portfolio holdings listing is filed with the SEC on Form N-Q. This form will be available on the SEC's Web site at www.sec.gov, and it also may be reviewed and copied at the SEC's Public Reference Room in Washington, D.C. Information on the operation of the SEC's Public Reference Room may be obtained by calling (800) SEC-0330. The fund's portfolio holdings are also posted on www.dws-investments.com from time to time. Please see the fund's current prospectus for more information. |
| Principal Underwriter | | If you have questions, comments or complaints, contact: DWS Investments Distributors, Inc. 222 South Riverside Plaza Chicago, IL 60606-5808 (800) 621-1148 |
| Investment Management | | Deutsche Investment Management Americas Inc. ("DIMA" or the "Advisor"), which is part of Deutsche Asset & Wealth Management, is the investment advisor for the fund. DIMA and its predecessors have more than 80 years of experience managing mutual funds and DIMA provides a full range of investment advisory services to both institutional and retail clients. DIMA is an indirect, wholly owned subsidiary of Deutsche Bank AG. Deutsche Bank AG is a major global banking institution engaged in a wide variety of financial services, including investment management, retail, private and commercial banking, investment banking and insurance. DWS Investments is the retail brand name in the U.S. for the asset management activities of Deutsche Bank AG and DIMA. As such, DWS is committed to delivering the investing expertise, insight and resources of this global investment platform to American investors. |
DWS LifeCompass Retirement Fund
| | | Class A | Class B | Class C | Class S |
| Nasdaq Symbol | | SUCAX | SUCBX | SUCCX | SCPCX |
| CUSIP Number | | 23337A 608 | 23337A 707 | 23337A 806 | 23337A 871 |
| Fund Number | | 480 | 680 | 780 | 2080 |
DWS LifeCompass 2015 Fund
| | | Class A | Class B | Class C | Class S |
| Nasdaq Symbol | | SPDAX | SPDBX | SPDCX | SPBAX |
| CUSIP Number | | 23337A 103 | 23337A 202 | 23337A 301 | 23337A 509 |
| Fund Number | | 481 | 681 | 781 | 2081 |
DWS LifeCompass 2020 Fund
| | | Class A | Class B | Class C | Class S |
| Nasdaq Symbol | | SUPAX | SUPBX | SUPCX | SPGRX |
| CUSIP Number | | 23337A 863 | 23337A 855 | 23337A 848 | 23337A 822 |
| Fund Number | | 482 | 682 | 782 | 2082 |
DWS LifeCompass 2030 Fund
| | | Class A | Class B | Class C | Class S |
| Nasdaq Symbol | | PLUSX | PLSBX | PLSCX | PPLSX |
| CUSIP Number | | 23337A 814 | 23337A 798 | 23337A 780 | 23337A 772 |
| Fund Number | | 1084 | 1284 | 1384 | 2084 |
DWS LifeCompass 2040 Fund
| | | Class A | Class C | Class S |
| Nasdaq Symbol | | TGTAX | TGTCX | TGTSX |
| CUSIP Number | | 23337A 764 | 23337A 756 | 23337A 749 |
| Fund Number | | 457 | 757 | 2057 |
| FACTS | | What Does DWS Investments Do With Your Personal Information? |
| Why? | | Financial companies choose how they share your personal information. Federal law gives consumers the right to limit some but not all sharing. Federal law also requires us to tell you how we collect, share and protect your personal information. Please read this notice carefully to understand what we do. |
| What? | | The types of personal information we collect and share can include: • Social Security number • Account balances • Purchase and transaction history • Bank account information • Contact information such as mailing address, e-mail address and telephone number |
| How? | | All financial companies need to share customers' personal information to run their everyday business. In the section below, we list the reasons financial companies can share their customers' personal information, the reasons DWS Investments chooses to share and whether you can limit this sharing. |
| Reasons we can share your personal information | Does DWS Investments share? | Can you limit this sharing? |
For our everyday business purposes — such as to process your transactions, maintain your account(s), respond to court orders or legal investigations | Yes | No |
For our marketing purposes — to offer our products and services to you | Yes | No |
| For joint marketing with other financial companies | No | We do not share |
For our affiliates' everyday business purposes — information about your transactions and experiences | No | We do not share |
For our affiliates' everyday business purposes — information about your creditworthiness | No | We do not share |
| For non-affiliates to market to you | No | We do not share |
| Questions? | Call (800) 728-3337 or e-mail us at dws-investments.info@dws.com |
| Who we are |
| Who is providing this notice? | | DWS Investments Distributors, Inc.; Deutsche Investment Management Americas Inc.; DeAM Investor Services, Inc.; DWS Trust Company; the DWS Funds |
| What we do |
| How does DWS Investments protect my personal information? | | To protect your personal information from unauthorized access and use, we use security measures that comply with federal law. These measures include computer safeguards and secured files and buildings. |
| How does DWS Investments collect my personal information? | | We collect your personal information, for example. When you: • open an account • give us your contact information • provide bank account information for ACH or wire transactions • tell us where to send money • seek advice about your investments |
| Why can't I limit all sharing? | | Federal law gives you the right to limit only • sharing for affiliates' everyday business purposes — information about your creditworthiness • affiliates from using your information to market to you • sharing for nonaffiliates to market to you State laws and individual companies may give you additional rights to limit sharing. |
| Definitions |
| Affiliates | | Companies related by common ownership or control. They can be financial or non-financial companies. Our affiliates include financial companies with the DWS or Deutsche Bank ("DB") name, such as DB AG Frankfurt and DB Alex Brown. |
| Non-affiliates | | Companies not related by common ownership or control. They can be financial and non-financial companies. Non-affiliates we share with include account service providers, service quality monitoring services, mailing service providers and verification services to help in the fight against money laundering and fraud. |
| Joint marketing | | A formal agreement between non-affiliated financial companies that together market financial products or services to you. DWS Investments does not jointly market. |
Notes
Notes
Notes
Notes
Pursuant to the requirements of the Securities Exchange Act of 1934 and the Investment Company Act of 1940, the registrant has duly caused this report to be signed on its behalf by the undersigned, thereunto duly authorized.
Pursuant to the requirements of the Securities Exchange Act of 1934 and the Investment Company Act of 1940, this report has been signed below by the following persons on behalf of the registrant and in the capacities and on the dates indicated.