UNITED STATES
SECURITIES AND EXCHANGE COMMISSION
WASHINGTON, D. C. 20549
FORM N-CSR
Investment Company Act file number: 811-08606
Deutsche DWS Asset Allocation Trust
(Exact Name of Registrant as Specified in Charter)
875 Third Avenue
New York, NY 10022-6225
(Address of Principal Executive Offices) (Zip Code)
Registrant’s Telephone Number, including Area Code: (212) 454-4500
Diane Kenneally
100 Summer Street
Boston, MA 02110
(Name and Address of Agent for Service)
| Date of fiscal year end: | 8/31 |
| Date of reporting period: | 8/31/2021 |
| ITEM 1. | REPORT TO STOCKHOLDERS |
| (a) |


| 2 | | | DWS Equity Sector Strategy Fund |
 |  Hepsen Uzcan President, DWS Funds |
| DWS Equity Sector Strategy Fund | | | 3 |
| Portfolio Management Review | (Unaudited) |
| 4 | | | DWS Equity Sector Strategy Fund |
| DWS Equity Sector Strategy Fund | | | 5 |
| 6 | | | DWS Equity Sector Strategy Fund |
| DWS Equity Sector Strategy Fund | | | 7 |
| 8 | | | DWS Equity Sector Strategy Fund |
| Performance Summary | August 31, 2021 (Unaudited) |
| Class A | 1-Year | 5-Year | 10-Year |
| Average Annual Total Returns as of 8/31/21 | |||
| Unadjusted for Sales Charge | 25.86% | 9.75% | 7.38% |
| Adjusted for the Maximum Sales Charge (max 5.75% load) | 18.62% | 8.46% | 6.75% |
| S&P 500® Index† | 31.17% | 18.02% | 16.34% |
| S&P Target Risk Moderate Index †† | 12.03% | 7.75% | 6.86% |
| Class C | 1-Year | 5-Year | 10-Year |
| Average Annual Total Returns as of 8/31/21 | |||
| Unadjusted for Sales Charge | 24.84% | 8.93% | 6.57% |
| Adjusted for the Maximum Sales Charge (max 1.00% CDSC) | 24.84% | 8.93% | 6.57% |
| S&P 500® Index† | 31.17% | 18.02% | 16.34% |
| S&P Target Risk Moderate Index †† | 12.03% | 7.75% | 6.86% |
| Class S | 1-Year | 5-Year | 10-Year |
| Average Annual Total Returns as of 8/31/21 | |||
| No Sales Charges | 26.23% | 10.03% | 7.64% |
| S&P 500® Index† | 31.17% | 18.02% | 16.34% |
| S&P Target Risk Moderate Index †† | 12.03% | 7.75% | 6.86% |
| DWS Equity Sector Strategy Fund | | | 9 |
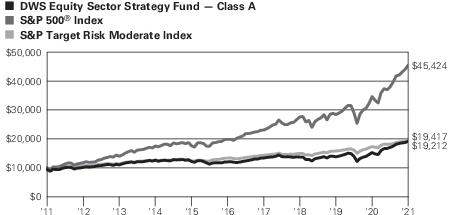
| † | S&P 500 Index is an unmanaged, capitalization-weighted index of 500 stocks. The index is designed to measure performance of the broad domestic economy through changes in the aggregate market value of 500 stocks representing all major industries. |
| †† | S&P Target Risk Moderate Index offers significant exposure to fixed income, while also increasing opportunities for higher returns through equities.On August 9, 2021, the Fund’s investment strategy changed and the S&P 500® Index replaced the S&P Target Risk Moderate Index as the Fund’s principal benchmark index because the Advisor believes the S&P 500® Index more accurately reflects the Fund’s current investment strategy. On each of July 29, 2019 and October 19, 2015, the Fund’s investment strategy changed. In addition, prior to July 8, 2013, the Fund had a sub-advisor and a different portfolio management team that operated with a different investment strategy. Performance would have been different if the Fund’s current investment strategy had been in effect during the prior periods. |
| 10 | | | DWS Equity Sector Strategy Fund |
| Class A | Class C | Class S | |
| Net Asset Value | |||
| 8/31/21 | $19.81 | $19.65 | $19.83 |
| 8/31/20 | $16.02 | $15.90 | $16.03 |
| Distribution Information as of 8/31/21 | |||
| Income Dividends, Twelve Months | $ .31 | $ .17 | $ .35 |
| DWS Equity Sector Strategy Fund | | | 11 |
| Portfolio Summary | (Unaudited) |
| Asset Allocation (As a % of Investment Portfolio) | 8/31/21 |
| Common Stocks | 97% |
| Cash Equivalents | 3% |
| 100% |
| Sector Diversification (As a % of Common Stocks) | 8/31/21 |
| Information Technology | 29% |
| Health Care | 18% |
| Financials | 14% |
| Consumer Discretionary | 12% |
| Communication Services | 11% |
| Consumer Staples | 5% |
| Industrials | 5% |
| Real Estate | 3% |
| Utilities | 3% |
| 100% |
| Ten Largest Equity Holdings at August 31, 2021 (31.1% of Net Assets) | |
| 1 Apple, Inc. | 6.6% |
| Designs, manufactures and markets personal computers and related computing and mobile-communication devices | |
| 2 Microsoft Corp. | 6.1% |
| Develops, manufactures, licenses, sells and supports software products | |
| 3 Alphabet, Inc. | 4.6% |
| Holding company with subsidiaries that provide Web-based search, maps, hardware products and various software applications | |
| 4 Amazon.com, Inc. | 3.3% |
| Online retailer offering a wide range of products | |
| 5 Facebook, Inc. | 2.4% |
| Operator of social networking website | |
| 6 JPMorgan Chase & Co. | 2.0% |
| Provider of global financial services | |
| 7 Berkshire Hathaway, Inc. | 1.6% |
| Holding company of insurance business and a variety of other businesses | |
| 8 NVIDIA Corp. | 1.6% |
| Designs, develops and markets three dimensional (3D) graphic processors | |
| 9 Johnson & Johnson | 1.5% |
| Provider of health care products | |
| 10 Home Depot, Inc. | 1.4% |
| Home improvement retailer that sells building materials and home improvement products | |
| 12 | | | DWS Equity Sector Strategy Fund |
| Investment Portfolio | as of August 31, 2021 |
| Shares | Value ($) | ||
| Common Stocks 97.1% | |||
| Communication Services 11.0% | |||
| Diversified Telecommunication Services 1.1% | |||
| AT&T, Inc. | 16,363 | 448,673 | |
| Lumen Technologies, Inc. | 2,283 | 28,081 | |
| Verizon Communications, Inc. | 9,488 | 521,840 | |
| 998,594 | |||
| Entertainment 1.3% | |||
| Activision Blizzard, Inc. | 1,315 | 108,316 | |
| Electronic Arts, Inc. | 484 | 70,282 | |
| Netflix, Inc.* | 751 | 427,462 | |
| Take-Two Interactive Software, Inc.* | 196 | 31,599 | |
| Walt Disney Co.* | 3,077 | 557,860 | |
| 1,195,519 | |||
| Interactive Media & Services 7.1% | |||
| Alphabet, Inc. “A” * | 740 | 2,141,523 | |
| Alphabet, Inc. “C” * | 701 | 2,039,377 | |
| Facebook, Inc. “A” * | 5,898 | 2,237,583 | |
| Twitter, Inc.* | 1,965 | 126,743 | |
| 6,545,226 | |||
| Media 1.5% | |||
| Charter Communications, Inc. “A” * | 396 | 323,397 | |
| Comcast Corp. “A” | 13,183 | 799,945 | |
| DISH Network Corp. “A” * | 714 | 31,123 | |
| Fox Corp. “A” | 940 | 35,194 | |
| Interpublic Group of Companies, Inc. | 1,132 | 42,144 | |
| Omnicom Group, Inc. | 618 | 45,250 | |
| ViacomCBS, Inc. “B” | 1,742 | 72,206 | |
| 1,349,259 | |||
| Consumer Discretionary 11.2% | |||
| Hotels, Restaurants & Leisure 2.4% | |||
| Booking Holdings, Inc.* | 123 | 282,860 | |
| Caesars Entertainment, Inc.* | 624 | 63,417 | |
| Carnival Corp.* | 2,386 | 57,598 | |
| Chipotle Mexican Grill, Inc.* | 84 | 159,880 | |
| Darden Restaurants, Inc. | 391 | 58,904 | |
| Domino’s Pizza, Inc. | 116 | 59,959 | |
| Hilton Worldwide Holdings, Inc.* | 833 | 104,008 | |
| DWS Equity Sector Strategy Fund | | | 13 |
| Shares | Value ($) | ||
| Las Vegas Sands Corp.* | 982 | 43,807 | |
| Marriott International, Inc. “A” * | 799 | 107,977 | |
| McDonald’s Corp. | 2,231 | 529,773 | |
| MGM Resorts International | 1,217 | 51,869 | |
| Norwegian Cruise Line Holdings Ltd.* | 1,106 | 28,579 | |
| Penn National Gaming, Inc.* | 444 | 36,009 | |
| Royal Caribbean Cruises Ltd.* | 655 | 54,188 | |
| Starbucks Corp. | 3,523 | 413,917 | |
| Wynn Resorts Ltd.* | 315 | 32,032 | |
| Yum! Brands, Inc. | 890 | 116,617 | |
| 2,201,394 | |||
| Household Durables 1.0% | |||
| D.R. Horton, Inc. | 1,829 | 174,889 | |
| Garmin Ltd. | 836 | 145,824 | |
| Leggett & Platt, Inc. | 744 | 36,002 | |
| Lennar Corp. “A” | 1,538 | 165,043 | |
| Mohawk Industries, Inc.* | 326 | 64,470 | |
| Newell Brands, Inc. | 2,113 | 53,691 | |
| NVR, Inc.* | 19 | 98,419 | |
| PulteGroup, Inc. | 1,476 | 79,497 | |
| Whirlpool Corp. | 349 | 77,314 | |
| 895,149 | |||
| Internet & Direct Marketing Retail 3.5% | |||
| Amazon.com, Inc.* | 859 | 2,981,409 | |
| eBay, Inc. | 1,298 | 99,609 | |
| Etsy, Inc.* | 255 | 55,146 | |
| Expedia Group, Inc.* | 423 | 61,123 | |
| 3,197,287 | |||
| Specialty Retail 3.2% | |||
| Advance Auto Parts, Inc. | 242 | 49,089 | |
| AutoZone, Inc.* | 80 | 123,932 | |
| Best Buy Co., Inc. | 827 | 96,354 | |
| CarMax, Inc.* | 606 | 75,877 | |
| Home Depot, Inc. | 3,943 | 1,286,128 | |
| Lowe’s Companies, Inc. | 2,621 | 534,395 | |
| O’Reilly Automotive, Inc.* | 259 | 153,867 | |
| Ross Stores, Inc. | 1,322 | 156,525 | |
| TJX Companies, Inc. | 4,472 | 325,204 | |
| 14 | | | DWS Equity Sector Strategy Fund |
| Shares | Value ($) | ||
| Tractor Supply Co. | 428 | 83,139 | |
| Ulta Beauty, Inc.* | 203 | 78,624 | |
| 2,963,134 | |||
| Textiles, Apparel & Luxury Goods 1.1% | |||
| NIKE, Inc. “B” | 5,098 | 839,845 | |
| PVH Corp.* | 285 | 29,865 | |
| Tapestry, Inc.* | 1,115 | 44,957 | |
| VF Corp. | 1,286 | 98,340 | |
| 1,013,007 | |||
| Consumer Staples 5.1% | |||
| Beverages 1.9% | |||
| Brown-Forman Corp. “B” | 589 | 41,360 | |
| Coca-Cola Co. | 12,523 | 705,170 | |
| Constellation Brands, Inc. “A” | 545 | 115,071 | |
| Molson Coors Beverage Co. “B” | 608 | 28,898 | |
| Monster Beverage Corp.* | 1,194 | 116,499 | |
| PepsiCo, Inc. | 4,459 | 697,343 | |
| 1,704,341 | |||
| Food & Staples Retailing 1.8% | |||
| Costco Wholesale Corp. | 1,395 | 635,409 | |
| Kroger Co. | 2,388 | 109,920 | |
| Sysco Corp. | 1,613 | 128,475 | |
| Walgreens Boots Alliance, Inc. | 2,264 | 114,898 | |
| Walmart, Inc. | 4,332 | 641,569 | |
| 1,630,271 | |||
| Household Products 0.3% | |||
| Colgate-Palmolive Co. | 529 | 41,236 | |
| Kimberly-Clark Corp. | 211 | 29,078 | |
| Procter & Gamble Co. | 1,532 | 218,141 | |
| 288,455 | |||
| Tobacco 1.1% | |||
| Altria Group, Inc. | 7,522 | 377,830 | |
| Philip Morris International, Inc. | 6,336 | 652,608 | |
| 1,030,438 | |||
| Financials 13.9% | |||
| Banks 6.6% | |||
| Bank of America Corp. | 28,900 | 1,206,575 | |
| DWS Equity Sector Strategy Fund | | | 15 |
| Shares | Value ($) | ||
| Citigroup, Inc. | 7,922 | 569,671 | |
| Citizens Financial Group, Inc. | 1,631 | 71,421 | |
| Comerica, Inc. | 534 | 39,468 | |
| Fifth Third Bancorp. | 2,699 | 104,883 | |
| First Republic Bank | 674 | 134,086 | |
| Huntington Bancshares, Inc. | 5,656 | 87,838 | |
| JPMorgan Chase & Co. | 11,600 | 1,855,420 | |
| KeyCorp. | 3,717 | 75,529 | |
| M&T Bank Corp. | 492 | 68,885 | |
| PNC Financial Services Group, Inc. | 1,628 | 311,111 | |
| Regions Financial Corp. | 3,685 | 75,285 | |
| SVB Financial Group* | 215 | 120,292 | |
| Truist Financial Corp. | 5,154 | 294,087 | |
| U.S. Bancorp. | 5,194 | 298,084 | |
| Wells Fargo & Co. | 15,841 | 723,934 | |
| Zions Bancorp. NA | 628 | 36,361 | |
| 6,072,930 | |||
| Capital Markets 2.5% | |||
| Ameriprise Financial, Inc. | 229 | 62,496 | |
| Bank of New York Mellon Corp. | 1,590 | 87,800 | |
| BlackRock, Inc. | 280 | 264,121 | |
| Charles Schwab Corp. | 2,957 | 215,417 | |
| CME Group, Inc. | 708 | 142,818 | |
| Intercontinental Exchange, Inc. | 1,110 | 132,678 | |
| MarketAxess Holdings, Inc. | 75 | 35,694 | |
| Moody’s Corp. | 317 | 120,704 | |
| Morgan Stanley | 2,934 | 306,398 | |
| MSCI, Inc. | 163 | 103,437 | |
| Nasdaq, Inc. | 227 | 44,442 | |
| Northern Trust Corp. | 411 | 48,712 | |
| Raymond James Financial, Inc. | 241 | 33,716 | |
| S&P Global, Inc. | 475 | 210,815 | |
| State Street Corp. | 686 | 63,736 | |
| T. Rowe Price Group, Inc. | 447 | 100,070 | |
| The Goldman Sachs Group, Inc. | 671 | 277,465 | |
| 2,250,519 | |||
| Diversified Financial Services 1.6% | |||
| Berkshire Hathaway, Inc. “B” * | 5,092 | 1,455,141 | |
| Insurance 3.2% | |||
| Aflac, Inc. | 2,572 | 145,781 | |
| 16 | | | DWS Equity Sector Strategy Fund |
| Shares | Value ($) | ||
| Allstate Corp. | 1,218 | 164,771 | |
| American International Group, Inc. | 3,491 | 190,469 | |
| Aon PLC “A” | 918 | 263,337 | |
| Arthur J. Gallagher & Co. | 834 | 119,779 | |
| Assurant, Inc. | 246 | 41,847 | |
| Chubb Ltd. | 1,829 | 336,390 | |
| Cincinnati Financial Corp. | 610 | 75,274 | |
| Everest Re Group Ltd. | 163 | 43,179 | |
| Globe Life, Inc. | 386 | 37,083 | |
| Hartford Financial Services Group, Inc. | 1,452 | 97,603 | |
| Lincoln National Corp. | 728 | 49,977 | |
| Loews Corp. | 910 | 50,842 | |
| Marsh & McLennan Companies, Inc. | 2,069 | 325,247 | |
| MetLife, Inc. | 3,027 | 187,674 | |
| Principal Financial Group, Inc. | 1,029 | 68,747 | |
| Progressive Corp. | 2,380 | 229,289 | |
| Prudential Financial, Inc. | 1,603 | 169,726 | |
| Travelers Companies, Inc. | 1,023 | 163,383 | |
| W.R. Berkley Corp. | 570 | 42,927 | |
| Willis Towers Watson PLC | 525 | 115,878 | |
| 2,919,203 | |||
| Health Care 17.3% | |||
| Biotechnology 2.8% | |||
| AbbVie, Inc. | 6,079 | 734,222 | |
| Amgen, Inc. | 1,978 | 446,098 | |
| Biogen, Inc.* | 518 | 175,555 | |
| Gilead Sciences, Inc. | 4,318 | 314,264 | |
| Incyte Corp.* | 643 | 49,183 | |
| Moderna, Inc.* | 1,050 | 395,525 | |
| Regeneron Pharmaceuticals, Inc.* | 360 | 242,424 | |
| Vertex Pharmaceuticals, Inc.* | 891 | 178,458 | |
| 2,535,729 | |||
| Health Care Equipment & Supplies 4.6% | |||
| Abbott Laboratories | 5,164 | 652,575 | |
| ABIOMED, Inc.* | 132 | 48,043 | |
| Align Technology, Inc.* | 209 | 148,181 | |
| Baxter International, Inc. | 1,462 | 111,434 | |
| Becton, Dickinson & Co. | 845 | 212,686 | |
| Boston Scientific Corp.* | 4,130 | 186,469 | |
| Danaher Corp. | 1,845 | 598,075 | |
| DWS Equity Sector Strategy Fund | | | 17 |
| Shares | Value ($) | ||
| DENTSPLY SIRONA, Inc. | 634 | 39,118 | |
| DexCom, Inc.* | 281 | 148,767 | |
| Edwards Lifesciences Corp.* | 1,807 | 211,744 | |
| Hologic, Inc.* | 745 | 58,967 | |
| IDEXX Laboratories, Inc.* | 248 | 167,092 | |
| Intuitive Surgical, Inc.* | 344 | 362,425 | |
| Medtronic PLC | 3,910 | 521,907 | |
| ResMed, Inc. | 423 | 122,894 | |
| STERIS PLC | 284 | 61,063 | |
| Stryker Corp. | 953 | 264,076 | |
| Teleflex, Inc. | 136 | 53,783 | |
| The Cooper Companies, Inc. | 143 | 64,451 | |
| West Pharmaceutical Services, Inc. | 215 | 97,098 | |
| Zimmer Biomet Holdings, Inc. | 606 | 91,173 | |
| 4,222,021 | |||
| Health Care Providers & Services 3.4% | |||
| AmerisourceBergen Corp. | 471 | 57,561 | |
| Anthem, Inc. | 780 | 292,601 | |
| Cardinal Health, Inc. | 924 | 48,501 | |
| Centene Corp.* | 1,857 | 116,954 | |
| Cigna Corp. | 1,093 | 231,333 | |
| CVS Health Corp. | 4,194 | 362,320 | |
| DaVita, Inc.* | 223 | 29,162 | |
| HCA Healthcare, Inc. | 837 | 211,744 | |
| Henry Schein, Inc.* | 448 | 33,864 | |
| Humana, Inc. | 411 | 166,628 | |
| Laboratory Corp. of America Holdings* | 311 | 94,351 | |
| McKesson Corp. | 504 | 102,887 | |
| Quest Diagnostics, Inc. | 416 | 63,577 | |
| UnitedHealth Group, Inc. | 3,007 | 1,251,724 | |
| Universal Health Services, Inc. “B” | 249 | 38,784 | |
| 3,101,991 | |||
| Health Care Technology 0.1% | |||
| Cerner Corp. | 1,765 | 134,758 | |
| Life Sciences Tools & Services 1.7% | |||
| Agilent Technologies, Inc. | 957 | 167,925 | |
| Bio-Rad Laboratories, Inc. “A” * | 68 | 54,728 | |
| Charles River Laboratories International, Inc.* | 158 | 70,130 | |
| Illumina, Inc.* | 460 | 210,294 | |
| IQVIA Holdings, Inc.* | 604 | 156,877 | |
| 18 | | | DWS Equity Sector Strategy Fund |
| Shares | Value ($) | ||
| Mettler-Toledo International, Inc.* | 73 | 113,356 | |
| PerkinElmer, Inc. | 353 | 65,234 | |
| Thermo Fisher Scientific, Inc. | 1,239 | 687,583 | |
| Waters Corp.* | 194 | 80,320 | |
| 1,606,447 | |||
| Pharmaceuticals 4.7% | |||
| Bristol-Myers Squibb Co. | 6,814 | 455,584 | |
| Catalent, Inc.* | 519 | 67,698 | |
| Eli Lilly & Co. | 2,428 | 627,128 | |
| Johnson & Johnson | 8,032 | 1,390,580 | |
| Merck & Co., Inc. | 7,723 | 589,188 | |
| Pfizer, Inc. | 17,075 | 786,645 | |
| Viatris, Inc. | 3,685 | 53,912 | |
| Zoetis, Inc. | 1,448 | 296,203 | |
| 4,266,938 | |||
| Industrials 4.6% | |||
| Aerospace & Defense 1.5% | |||
| Boeing Co.* | 1,328 | 291,496 | |
| General Dynamics Corp. | 553 | 110,771 | |
| Howmet Aerospace, Inc. | 943 | 29,940 | |
| L3Harris Technologies, Inc. | 495 | 115,340 | |
| Lockheed Martin Corp. | 591 | 212,642 | |
| Northrop Grumman Corp. | 362 | 133,107 | |
| Raytheon Technologies Corp. | 3,659 | 310,137 | |
| Teledyne Technologies, Inc.* | 112 | 51,899 | |
| Textron, Inc. | 545 | 39,605 | |
| TransDigm Group, Inc.* | 133 | 80,794 | |
| 1,375,731 | |||
| Industrial Conglomerates 1.3% | |||
| 3M Co. | 1,499 | 291,915 | |
| General Electric Co. | 2,839 | 299,259 | |
| Honeywell International, Inc. | 1,796 | 416,510 | |
| Roper Technologies, Inc. | 272 | 131,452 | |
| 1,139,136 | |||
| Machinery 1.8% | |||
| Caterpillar, Inc. | 1,448 | 305,340 | |
| Cummins, Inc. | 386 | 91,088 | |
| Deere & Co. | 825 | 311,875 | |
| Dover Corp. | 381 | 66,431 | |
| DWS Equity Sector Strategy Fund | | | 19 |
| Shares | Value ($) | ||
| Fortive Corp. | 894 | 66,040 | |
| IDEX Corp. | 201 | 45,024 | |
| Illinois Tool Works, Inc. | 760 | 176,974 | |
| Ingersoll Rand, Inc.* | 1,026 | 54,399 | |
| Otis Worldwide Corp. | 1,066 | 98,306 | |
| PACCAR, Inc. | 917 | 75,075 | |
| Parker-Hannifin Corp. | 341 | 101,164 | |
| Pentair PLC | 439 | 33,873 | |
| Snap-on, Inc. | 143 | 32,168 | |
| Stanley Black & Decker, Inc. | 427 | 82,526 | |
| Westinghouse Air Brake Technologies Corp. | 470 | 42,201 | |
| Xylem, Inc. | 476 | 64,884 | |
| 1,647,368 | |||
| Information Technology 27.9% | |||
| IT Services 5.3% | |||
| Accenture PLC “A” | 1,645 | 553,641 | |
| Akamai Technologies, Inc.* | 422 | 47,792 | |
| Automatic Data Processing, Inc. | 1,101 | 230,153 | |
| Broadridge Financial Solutions, Inc. | 301 | 51,838 | |
| Cognizant Technology Solutions Corp. “A” | 1,365 | 104,163 | |
| DXC Technology Co.* | 660 | 24,235 | |
| Fidelity National Information Services, Inc. | 1,605 | 205,071 | |
| Fiserv, Inc.* | 1,542 | 181,632 | |
| FleetCor Technologies, Inc.* | 216 | 56,869 | |
| Gartner, Inc.* | 223 | 68,849 | |
| Global Payments, Inc. | 765 | 124,420 | |
| International Business Machines Corp. | 2,313 | 324,606 | |
| Jack Henry & Associates, Inc. | 192 | 33,865 | |
| MasterCard, Inc. “A” | 2,265 | 784,211 | |
| Paychex, Inc. | 830 | 95,010 | |
| PayPal Holdings, Inc.* | 3,041 | 877,815 | |
| VeriSign, Inc.* | 257 | 55,579 | |
| Visa, Inc. “A” | 4,379 | 1,003,229 | |
| 4,822,978 | |||
| Semiconductors & Semiconductor Equipment 6.0% | |||
| Advanced Micro Devices, Inc.* | 3,101 | 343,343 | |
| Analog Devices, Inc. | 1,374 | 223,820 | |
| Applied Materials, Inc. | 2,343 | 316,610 | |
| Broadcom, Inc. | 1,042 | 518,093 | |
| Enphase Energy, Inc.* | 347 | 60,284 | |
| 20 | | | DWS Equity Sector Strategy Fund |
| Shares | Value ($) | ||
| Intel Corp. | 10,305 | 557,088 | |
| KLA Corp. | 392 | 133,264 | |
| Lam Research Corp. | 364 | 220,154 | |
| Microchip Technology, Inc. | 698 | 109,837 | |
| Micron Technology, Inc.* | 2,863 | 211,003 | |
| Monolithic Power Systems, Inc. | 109 | 53,947 | |
| NVIDIA Corp. | 6,360 | 1,423,686 | |
| NXP Semiconductors NV | 703 | 151,236 | |
| Qorvo, Inc.* | 287 | 53,965 | |
| QUALCOMM, Inc. | 2,879 | 422,320 | |
| Skyworks Solutions, Inc. | 421 | 77,237 | |
| Teradyne, Inc. | 424 | 51,491 | |
| Texas Instruments, Inc. | 2,357 | 449,975 | |
| Xilinx, Inc. | 628 | 97,711 | |
| 5,475,064 | |||
| Software 9.7% | |||
| Adobe, Inc.* | 1,181 | 783,830 | |
| ANSYS, Inc.* | 216 | 78,918 | |
| Autodesk, Inc.* | 544 | 168,689 | |
| Cadence Design Systems, Inc.* | 687 | 112,311 | |
| Citrix Systems, Inc. | 307 | 31,581 | |
| Fortinet, Inc.* | 335 | 105,572 | |
| Intuit, Inc. | 675 | 382,124 | |
| Microsoft Corp. | 18,607 | 5,617,081 | |
| NortonLifeLock, Inc. | 1,431 | 38,007 | |
| Oracle Corp. | 4,488 | 400,015 | |
| Paycom Software, Inc.* | 122 | 59,646 | |
| PTC, Inc.* | 260 | 34,232 | |
| salesforce.com, Inc.* | 2,385 | 632,669 | |
| ServiceNow, Inc.* | 488 | 314,096 | |
| Synopsys, Inc.* | 377 | 125,254 | |
| Tyler Technologies, Inc.* | 100 | 48,570 | |
| 8,932,595 | |||
| Technology Hardware, Storage & Peripherals 6.9% | |||
| Apple, Inc. | 39,627 | 6,016,567 | |
| Hewlett Packard Enterprise Co. | 3,298 | 50,987 | |
| HP, Inc. | 3,035 | 90,261 | |
| NetApp, Inc. | 562 | 49,979 | |
| DWS Equity Sector Strategy Fund | | | 21 |
| Shares | Value ($) | ||
| Seagate Technology Holdings PLC | 503 | 44,058 | |
| Western Digital Corp.* | 774 | 48,917 | |
| 6,300,769 | |||
| Real Estate 3.1% | |||
| Equity Real Estate Investment Trusts (REITs) 3.0% | |||
| Alexandria Real Estate Equities, Inc. | 390 | 80,484 | |
| American Tower Corp. | 1,293 | 377,776 | |
| AvalonBay Communities, Inc. | 397 | 91,143 | |
| Boston Properties, Inc. | 404 | 45,648 | |
| Crown Castle International Corp. | 1,229 | 239,274 | |
| Digital Realty Trust, Inc. | 801 | 131,292 | |
| Duke Realty Corp. | 1,066 | 55,976 | |
| Equinix, Inc. | 255 | 215,080 | |
| Equity Residential | 978 | 82,220 | |
| Essex Property Trust, Inc. | 185 | 61,187 | |
| Extra Space Storage, Inc. | 380 | 71,026 | |
| Healthpeak Properties, Inc. | 1,533 | 55,188 | |
| Host Hotels & Resorts, Inc.* | 2,011 | 33,302 | |
| Iron Mountain, Inc. | 822 | 39,250 | |
| Kimco Realty Corp. | 1,708 | 37,217 | |
| Mid-America Apartment Communities, Inc. | 326 | 62,713 | |
| Prologis, Inc. | 2,104 | 283,325 | |
| Public Storage | 433 | 140,123 | |
| Realty Income Corp. | 1,062 | 76,698 | |
| Regency Centers Corp. | 450 | 30,879 | |
| SBA Communications Corp. | 311 | 111,640 | |
| Simon Property Group, Inc. | 934 | 125,576 | |
| UDR, Inc. | 844 | 45,593 | |
| Ventas, Inc. | 1,066 | 59,632 | |
| Welltower, Inc. | 1,187 | 103,898 | |
| Weyerhaeuser Co. | 2,129 | 76,644 | |
| 2,732,784 | |||
| Real Estate Management & Development 0.1% | |||
| CBRE Group, Inc. “A” * | 1,037 | 99,863 | |
| Utilities 3.0% | |||
| Electric Utilities 2.0% | |||
| Alliant Energy Corp. | 752 | 45,714 | |
| American Electric Power Co., Inc. | 1,502 | 134,534 | |
| Duke Energy Corp. | 2,312 | 241,974 | |
| 22 | | | DWS Equity Sector Strategy Fund |
| Shares | Value ($) | ||
| Edison International | 1,140 | 65,938 | |
| Entergy Corp. | 603 | 66,698 | |
| Evergy, Inc. | 689 | 47,162 | |
| Eversource Energy | 1,033 | 93,724 | |
| Exelon Corp. | 2,937 | 143,972 | |
| FirstEnergy Corp. | 1,636 | 63,591 | |
| NextEra Energy, Inc. | 5,895 | 495,121 | |
| NRG Energy, Inc. | 735 | 33,567 | |
| Pinnacle West Capital Corp. | 338 | 25,992 | |
| PPL Corp. | 2,313 | 67,887 | |
| Southern Co. | 3,181 | 209,087 | |
| Xcel Energy, Inc. | 1,618 | 111,238 | |
| 1,846,199 | |||
| Independent Power & Renewable Electricity Producers 0.1% | |||
| AES Corp. | 2,594 | 61,919 | |
| Multi-Utilities 0.9% | |||
| Ameren Corp. | 781 | 68,509 | |
| CenterPoint Energy, Inc. | 1,776 | 44,560 | |
| CMS Energy Corp. | 885 | 56,755 | |
| Consolidated Edison, Inc. | 1,048 | 79,072 | |
| Dominion Energy, Inc. | 2,466 | 191,953 | |
| DTE Energy Co. | 592 | 71,241 | |
| Public Service Enterprise Group, Inc. | 1,544 | 98,723 | |
| Sempra Energy | 963 | 127,463 | |
| WEC Energy Group, Inc. | 964 | 91,079 | |
| 829,355 | |||
| Total Common Stocks (Cost $87,021,849) | 88,841,512 | ||
| Cash Equivalents 3.0% | |||
| DWS Central Cash Management Government Fund, 0.03% (a) (b) (Cost $2,778,020) | 2,778,020 | 2,778,020 | |
| % of Net Assets | Value ($) | ||
| Total Investment Portfolio (Cost $89,799,869) | 100.1 | 91,619,532 | |
| Other Assets and Liabilities, Net | (0.1) | (73,564) | |
| Net Assets | 100.0 | 91,545,968 |
| DWS Equity Sector Strategy Fund | | | 23 |
| Value ($) at 8/31/2020 | Pur- chases Cost ($) | Sales Proceeds ($) | Net Real- ized Gain/ (Loss) ($) | Net Change in Unreal- ized Appreci- ation (Depreci- ation) ($) | Income ($) | Capital Gain Distri- butions ($) | Number of Shares at 8/31/2021 | Value ($) at 8/31/2021 |
| Equity — Equity Funds 0.0% | ||||||||
| DWS Core Equity Fund “Institutional” (a) | ||||||||
| 23,838,219 | 1,762,412 | 30,604,325 | 8,846,543 | (3,842,849) | 252,062 | 1,381,650 | — | — |
| DWS Emerging Markets Equity Fund “Institutional” (a) | ||||||||
| 1,187,979 | 16,726 | 1,359,922 | 233,278 | (78,061) | 16,726 | — | — | — |
| DWS Equity 500 Index Fund “Institutional” (a) | ||||||||
| 15,639,092 | 2,550,603 | 19,336,283 | 1,794,900 | (648,312) | 203,153 | 2,209,129 | — | — |
| DWS RREEF Global Infrastructure Fund “Institutional” (a) | ||||||||
| 1,560,399 | 415,988 | 2,185,583 | 225,090 | (15,894) | 15,458 | 20,531 | — | — |
| DWS RREEF Real Estate Securities Fund “Institutional” (a) | ||||||||
| 3,565,434 | 1,321,997 | 5,362,632 | 272,641 | 202,560 | 32,998 | — | — | — |
| DWS Small Cap Core Fund “S” (a) | ||||||||
| 1,826,285 | 831,534 | 4,125,916 | 1,509,364 | (41,267) | 10,664 | — | — | — |
| Fixed Income — Bond Funds 0.0% | ||||||||
| DWS Enhanced Commodity Strategy Fund “Institutional” (a) | ||||||||
| 1,202,147 | 361,844 | 1,799,383 | 351,595 | (116,203) | 11,144 | — | — | — |
| DWS GNMA Fund “Institutional” (a) | ||||||||
| 1,983,930 | 661,765 | 2,621,224 | 41,874 | (66,345) | 28,755 | — | — | — |
| DWS High Income Fund “Institutional” (a) | ||||||||
| 2,794,392 | 168,987 | 3,013,565 | 276,301 | (226,115) | 96,086 | — | — | — |
| Cash Equivalents 3.0% | ||||||||
| DWS Central Cash Management Government Fund, 0.03% (a) (b) | ||||||||
| 3,492,180 | 73,275,380 | 73,989,540 | — | — | 1,101 | — | 2,778,020 | 2,778,020 |
| 57,090,057 | 81,367,236 | 144,398,373 | 13,551,586 | (4,832,486) | 668,147 | 3,611,310 | 2,778,020 | 2,778,020 |
| * | Non-income producing security. |
| (a) | Affiliated fund managed by DWS Investment Management Americas, Inc. |
| (b) | The rate shown is the annualized seven-day yield at period end. |
| 24 | | | DWS Equity Sector Strategy Fund |
| Assets | Level 1 | Level 2 | Level 3 | Total |
| Common Stocks (a) | $88,841,512 | $— | $— | $88,841,512 |
| Short-Term Investments | 2,778,020 | — | — | 2,778,020 |
| Total | $91,619,532 | $ — | $ — | $91,619,532 |
| (a) | See Investment Portfolio for additional detailed categorizations. |
| DWS Equity Sector Strategy Fund | | | 25 |
| Assets | |
| Investments in non-affiliated securities, at value (cost $87,021,849) | $ 88,841,512 |
| Investment in DWS Central Cash Management Government Fund (cost $2,778,020) | 2,778,020 |
| Cash | 4,932 |
| Receivable for Fund shares sold | 4,551 |
| Dividends receivable | 74,395 |
| Interest receivable | 106 |
| Other assets | 10,112 |
| Total assets | 91,713,628 |
| Liabilities | |
| Payable for Fund shares redeemed | 47,900 |
| Accrued management fee | 6,024 |
| Accrued Trustees' fees | 1,168 |
| Other accrued expenses and payables | 112,568 |
| Total liabilities | 167,660 |
| Net assets, at value | $ 91,545,968 |
| Net Assets Consist of | |
| Distributable earnings (loss) | 22,232,364 |
| Paid-in capital | 69,313,604 |
| Net assets, at value | $ 91,545,968 |
| 26 | | | DWS Equity Sector Strategy Fund |
| Net Asset Value | |
| Class A | |
| Net Asset Value and redemption price per share ($37,445,168 ÷ 1,890,132 outstanding shares of beneficial interest, $.01 par value, unlimited number of shares authorized) | $ 19.81 |
| Maximum offering price per share (100 ÷ 94.25 of $19.81) | $ 21.02 |
| Class C | |
| Net Asset Value, offering and redemption price (subject to contingent deferred sales charge) per share ($921,541 ÷ 46,898 outstanding shares of beneficial interest, $.01 par value, unlimited number of shares authorized) | $ 19.65 |
| Class S | |
| Net Asset Value, offering and redemption price per share ($53,179,259 ÷ 2,681,607 outstanding shares of beneficial interest, $.01 par value, unlimited number of shares authorized) | $ 19.83 |
| DWS Equity Sector Strategy Fund | | | 27 |
| Investment Income | |
| Income: | |
| Dividends | $ 638,894 |
| Income distributions from affiliated investments | 668,147 |
| Total income | 1,307,041 |
| Expenses: | |
| Management fee | 97,940 |
| Administration fee | 82,152 |
| Services to shareholders | 156,684 |
| Distribution and service fees | 94,868 |
| Custodian fee | 2,944 |
| Professional fees | 70,564 |
| Reports to shareholders | 20,277 |
| Registration fees | 45,915 |
| Trustees' fees and expenses | 4,527 |
| Other | 7,637 |
| Total expenses before expense reductions | 583,508 |
| Expense reductions | (40,105) |
| Total expenses after expense reductions | 543,403 |
| Net investment income | 763,638 |
| Realized and Unrealized Gain (Loss) | |
| Net realized gain (loss) from: | |
| Sale of affiliated investments | 13,551,586 |
| Sale of non-affiliated investments | 5,640,053 |
| Capital gain distributions from affiliated investments | 3,611,310 |
| Capital gain distributions from non-affiliated investments | 11,855 |
| Futures | 543,481 |
| Payments by affiliates (see Note G) | 4,932 |
| 23,363,217 | |
| Change in net unrealized appreciation (depreciation) on: | |
| Affiliated investments | (4,832,486) |
| Non-affiliated investments | 248,640 |
| Futures | 8,094 |
| Foreign currency | 13,699 |
| (4,562,053) | |
| Net gain (loss) | 18,801,164 |
| Net increase (decrease) in net assets resulting from operations | $ 19,564,802 |
| 28 | | | DWS Equity Sector Strategy Fund |
| Years Ended August 31, | ||
| Increase (Decrease) in Net Assets | 2021 | 2020 |
| Operations: | ||
| Net investment income | $ 763,638 | $ 1,029,344 |
| Net realized gain (loss) | 23,363,217 | 909,438 |
| Change in net unrealized appreciation (depreciation) | (4,562,053) | 5,818,011 |
| Net increase (decrease) in net assets resulting from operations | 19,564,802 | 7,756,793 |
| Distributions to shareholders: | ||
| Class A | (599,295) | (2,490,491) |
| Class C | (12,735) | (86,891) |
| Class S | (956,259) | (3,651,502) |
| Total distributions | (1,568,289) | (6,228,884) |
| Fund share transactions: | ||
| Proceeds from shares sold | 2,764,076 | 2,551,589 |
| Reinvestment of distributions | 1,531,544 | 6,072,103 |
| Payments for shares redeemed | (10,024,675) | (11,335,087) |
| Net increase (decrease) in net assets from Fund share transactions | (5,729,055) | (2,711,395) |
| Increase (decrease) in net assets | 12,267,458 | (1,183,486) |
| Net assets at beginning of period | 79,278,510 | 80,461,996 |
| Net assets at end of period | $ 91,545,968 | $ 79,278,510 |
| DWS Equity Sector Strategy Fund | | | 29 |
| DWS Equity Sector Strategy Fund — Class A | |||||
| Years Ended August 31, | |||||
| 2021 | 2020 | 2019 | 2018 | 2017 | |
| Selected Per Share Data | |||||
| Net asset value, beginning of period | $16.02 | $15.64 | $15.88 | $15.73 | $14.61 |
| Income (loss) from investment operations: | |||||
| Net investment incomea | .14 | .18 | .34 | .28 | .26 |
| Net realized and unrealized gain (loss) | 3.96 | 1.43 | (.29) | .13 | 1.31 |
| Total from investment operations | 4.10 | 1.61 | .05 | .41 | 1.57 |
| Less distributions from: | |||||
| Net investment income | (.31) | (1.18) | (.29) | (.26) | (.45) |
| Net realized gains | — | (.05) | — | — | — |
| Total distributions | (.31) | (1.23) | (.29) | (.26) | (.45) |
| Net asset value, end of period | $19.81 | $16.02 | $15.64 | $15.88 | $15.73 |
| Total Return (%)b,c,d | 25.86 | 10.44 | .56 | 2.59 | 11.05 |
| Ratios to Average Net Assets and Supplemental Data | |||||
| Net assets, end of period ($ millions) | 37 | 32 | 33 | 37 | 39 |
| Ratio of expenses before expense reductions (%)e | .81 | .86 | .87 | .83 | .83 |
| Ratio of expenses after expense reductions (%)e | .76 | .71 | .69 | .70 | .63 |
| Ratio of net investment income (%) | .78 | 1.19 | 2.24 | 1.75 | 1.74 |
| Portfolio turnover rate (%) | 136 | 63 | 93 | 35 | 11 |
| a | Based on average shares outstanding during the period. |
| b | Total return does not reflect the effect of any sales charges. |
| c | Total return would have been lower had certain expenses not been reduced. |
| d | Total return would have been lower if the Advisor had not reduced some Underlying DWS Funds’ expenses. |
| e | The Fund invested in other funds and indirectly bore its proportionate share of fees and expenses incurred by the Underlying Funds in which the Fund was invested. This ratio does not include these indirect fees and expenses. |
| 30 | | | DWS Equity Sector Strategy Fund |
| DWS Equity Sector Strategy Fund — Class C | |||||
| Years Ended August 31, | |||||
| 2021 | 2020 | 2019 | 2018 | 2017 | |
| Selected Per Share Data | |||||
| Net asset value, beginning of period | $15.90 | $15.52 | $15.75 | $15.60 | $14.49 |
| Income (loss) from investment operations: | |||||
| Net investment income (loss)a | (.01) | .07 | .23 | .18 | .15 |
| Net realized and unrealized gain (loss) | 3.93 | 1.40 | (.28) | .11 | 1.30 |
| Total from investment operations | 3.92 | 1.47 | (.05) | .29 | 1.45 |
| Less distributions from: | |||||
| Net investment income | (.17) | (1.04) | (.18) | (.14) | (.34) |
| Net realized gains | — | (.05) | — | — | — |
| Total distributions | (.17) | (1.09) | (.18) | (.14) | (.34) |
| Net asset value, end of period | $19.65 | $15.90 | $15.52 | $15.75 | $15.60 |
| Total Return (%)b,c,d | 24.84 | 9.57 | (.15) | 1.82 | 10.27 |
| Ratios to Average Net Assets and Supplemental Data | |||||
| Net assets, end of period ($ millions) | 1 | 1 | 1 | 2 | 7 |
| Ratio of expenses before expense reductions (%)e | 1.65 | 1.69 | 1.65 | 1.59 | 1.60 |
| Ratio of expenses after expense reductions (%)e | 1.58 | 1.46 | 1.44 | 1.45 | 1.38 |
| Ratio of net investment income (loss) (%) | (.07) | .44 | 1.53 | 1.11 | .99 |
| Portfolio turnover rate (%) | 136 | 63 | 93 | 35 | 11 |
| a | Based on average shares outstanding during the period. |
| b | Total return does not reflect the effect of any sales charges. |
| c | Total return would have been lower had certain expenses not been reduced. |
| d | Total return would have been lower if the Advisor had not reduced some Underlying DWS Funds’ expenses. |
| e | The Fund invested in other funds and indirectly bore its proportionate share of fees and expenses incurred by the Underlying Funds in which the Fund was invested. This ratio does not include these indirect fees and expenses. |
| DWS Equity Sector Strategy Fund | | | 31 |
| DWS Equity Sector Strategy Fund — Class S | |||||
| Years Ended August 31, | |||||
| 2021 | 2020 | 2019 | 2018 | 2017 | |
| Selected Per Share Data | |||||
| Net asset value, beginning of period | $16.03 | $15.66 | $15.90 | $15.75 | $14.63 |
| Income (loss) from investment operations: | |||||
| Net investment incomea | .18 | .22 | .38 | .33 | .30 |
| Net realized and unrealized gain (loss) | 3.97 | 1.43 | (.29) | .12 | 1.31 |
| Total from investment operations | 4.15 | 1.65 | .09 | .45 | 1.61 |
| Less distributions from: | |||||
| Net investment income | (.35) | (1.23) | (.33) | (.30) | (.49) |
| Net realized gains | — | (.05) | — | — | — |
| Total distributions | (.35) | (1.28) | (.33) | (.30) | (.49) |
| Net asset value, end of period | $19.83 | $16.03 | $15.66 | $15.90 | $15.75 |
| Total Return (%)b,c | 26.23 | 10.66 | .82 | 2.85 | 11.32 |
| Ratios to Average Net Assets and Supplemental Data | |||||
| Net assets, end of period ($ millions) | 53 | 46 | 46 | 51 | 56 |
| Ratio of expenses before expense reductions (%)d | .58 | .63 | .65 | .60 | .61 |
| Ratio of expenses after expense reductions (%)d | .53 | .46 | .44 | .45 | .38 |
| Ratio of net investment income (%) | 1.01 | 1.44 | 2.50 | 2.03 | 1.99 |
| Portfolio turnover rate (%) | 136 | 63 | 93 | 35 | 11 |
| a | Based on average shares outstanding during the period. |
| b | Total return would have been lower had certain expenses not been reduced. |
| c | Total return would have been lower if the Advisor had not reduced some Underlying DWS Funds’ expenses. |
| d | The Fund invested in other funds and indirectly bore its proportionate share of fees and expenses incurred by the Underlying Funds in which the Fund was invested. This ratio does not include these indirect fees and expenses. |
| 32 | | | DWS Equity Sector Strategy Fund |
| A. | Organization and Significant Accounting Policies |
| DWS Equity Sector Strategy Fund | | | 33 |
| 34 | | | DWS Equity Sector Strategy Fund |
| DWS Equity Sector Strategy Fund | | | 35 |
| Undistributed ordinary income* | $ 256,359 |
| Undistributed long-term capital gains | $ 20,156,338 |
| Net unrealized appreciation (depreciation) on investments | $ 1,819,663 |
| Years Ended August 31, | ||
| 2021 | 2020 | |
| Distributions from ordinary income* | $ 1,568,289 | $ 3,864,375 |
| Distributions from long-term capital gains | $ — | $ 2,364,509 |
| * | For tax purposes, short-term capital gain distributions are considered ordinary income distributions. |
| 36 | | | DWS Equity Sector Strategy Fund |
| B. | Derivative Instruments |
| DWS Equity Sector Strategy Fund | | | 37 |
| Realized Gain (Loss) | Futures Contracts |
| Equity Contracts (a) | $ 596,978 |
| Interest Rate Contracts (a) | (53,497) |
| $ 543,481 | |
| The above derivative is located in the following Statement of Operations account: | |
| (a) | Net realized gain (loss) from futures |
| Change in Net Unrealized Appreciation (Depreciation) | Futures Contracts |
| Equity Contracts (a) | $ 7,627 |
| Interest Rate Contracts (a) | 467 |
| $ 8,094 | |
| The above derivative is located in the following Statement of Operations account: | |
| (a) | Change in net unrealized appreciation (depreciation) on futures |
| C. | Purchases and Sales of Securities |
| D. | Related Parties |
| 38 | | | DWS Equity Sector Strategy Fund |
| Class A | 1.12% |
| Class C | 1.87% |
| Class S | .87% |
| Class A | 1.95% | |
| Class C | 2.70% | |
| Class S | 1.70% |
| Class A | .73% | ||
| Class C | 1.48% | ||
| Class S | .48% |
| DWS Equity Sector Strategy Fund | | | 39 |
| Class A | $ 14,827 |
| Class C | 774 |
| Class S | 24,504 |
| $ 40,105 |
| Services to Shareholders | Total Aggregated | Unpaid at August 31, 2021 |
| Class A | $ 23,662 | $ 3,803 |
| Class C | 1,411 | 199 |
| Class S | 65,120 | 10,475 |
| $ 90,193 | $ 14,477 |
| 40 | | | DWS Equity Sector Strategy Fund |
| Sub-Recordkeeping | Total Aggregated |
| Class A | $ 25,460 |
| Class C | 1,181 |
| Class S | 14,603 |
| $ 41,244 |
| Distribution Fee | Total Aggregated | Unpaid at August 31, 2021 |
| Class C | $ 8,426 | $ 579 |
| Service Fee | Total Aggregated | Unpaid at August 31, 2021 | Annual Rate |
| Class A | $ 83,639 | $ 15,347 | .24% |
| Class C | 2,803 | 471 | .25% |
| $ 86,442 | $ 15,818 |
| DWS Equity Sector Strategy Fund | | | 41 |
| E. | Line of Credit |
| 42 | | | DWS Equity Sector Strategy Fund |
| F. | Fund Share Transactions |
| Year Ended August 31, 2021 | Year Ended August 31, 2020 | |||
| Shares | Dollars | Shares | Dollars | |
| Shares sold | ||||
| Class A | 70,356 | $ 1,278,371 | 106,129 | $ 1,645,533 |
| Class C | 1,809 | 31,296 | 4,691 | 70,542 |
| Class S | 83,033 | 1,454,409 | 53,867 | 835,514 |
| $ 2,764,076 | $ 2,551,589 | |||
| Shares issued to shareholders in reinvestment of distributions | ||||
| Class A | 34,013 | $ 583,669 | 153,080 | $ 2,414,072 |
| Class C | 722 | 12,359 | 5,380 | 84,629 |
| Class S | 54,549 | 935,516 | 226,739 | 3,573,402 |
| $ 1,531,544 | $ 6,072,103 | |||
| Shares redeemed | ||||
| Class A | (228,571) | $ (4,046,676) | (332,386) | $ (5,156,502) |
| Class C | (32,749) | (593,862) | (23,761) | (373,550) |
| Class S | (312,358) | (5,384,137) | (386,486) | (5,805,035) |
| $ (10,024,675) | $ (11,335,087) | |||
| Net increase (decrease) | ||||
| Class A | (124,202) | $ (2,184,636) | (73,177) | $ (1,096,897) |
| Class C | (30,218) | (550,207) | (13,690) | (218,379) |
| Class S | (174,776) | (2,994,212) | (105,880) | (1,396,119) |
| $ (5,729,055) | $ (2,711,395) | |||
| G. | Payments by Affiliates |
| H. | Other — COVID-19 Pandemic |
| DWS Equity Sector Strategy Fund | | | 43 |
| 44 | | | DWS Equity Sector Strategy Fund |
| DWS Equity Sector Strategy Fund | | | 45 |

| 46 | | | DWS Equity Sector Strategy Fund |
| — | Actual Fund Return. This helps you estimate the actual dollar amount of ongoing expenses (but not transaction costs) paid on a $1,000 investment in the Fund using the Fund’s actual return during the period. To estimate the expenses you paid over the period, simply divide your account value by $1,000 (for example, an $8,600 account value divided by $1,000 = 8.6), then multiply the result by the number in the “Expenses Paid per $1,000” line under the share class you hold. |
| — | Hypothetical 5% Fund Return. This helps you to compare your Fund’s ongoing expenses (but not transaction costs) with those of other mutual funds using the Fund’s actual expense ratio and a hypothetical rate of return of 5% per year before expenses. Examples using a 5% hypothetical fund return may be found in the shareholder reports of other mutual funds. The hypothetical account values and expenses may not be used to estimate the actual ending account balance or expenses you paid for the period. |
| DWS Equity Sector Strategy Fund | | | 47 |
| Actual Fund Return | Class A | Class C | Class S |
| Beginning Account Value 3/1/21 | $1,000.00 | $1,000.00 | $1,000.00 |
| Ending Account Value 8/31/21 | $1,125.60 | $1,120.90 | $1,127.30 |
| Expenses Paid per $1,000* | $ 4.07 | $ 8.66 | $ 2.90 |
| Hypothetical 5% Fund Return | Class A | Class C | Class S |
| Beginning Account Value 3/1/21 | $1,000.00 | $1,000.00 | $1,000.00 |
| Ending Account Value 8/31/21 | $1,021.37 | $1,017.04 | $1,022.48 |
| Expenses Paid per $1,000* | $ 3.87 | $ 8.24 | $ 2.75 |
| * | Expenses are equal to the Fund’s annualized expense ratio for each share class, multiplied by the average account value over the period, multiplied by 184 (the number of days in the most recent six-month period), then divided by 365. |
| Annualized Expense Ratios** | Class A | Class C | Class S |
| DWS Equity Sector Strategy Fund | .76% | 1.62% | .54% |
| ** | The Fund invested in other funds and indirectly bore its proportionate share of fees and expenses incurred by the Underlying Funds in which the Fund was invested. These ratios do not include these indirect fees and expenses. |
| 48 | | | DWS Equity Sector Strategy Fund |
| Tax Information | (Unaudited) |
| DWS Equity Sector Strategy Fund | | | 49 |
| — | During the entire process, all of the Funds’ Trustees were independent of DIMA and its affiliates (the “Independent Trustees” ). |
| — | The Board met frequently during the past year to discuss fund matters and dedicated a substantial amount of time to contract review matters. Over the course of several months, the Board reviewed extensive materials received from DIMA, independent third parties and independent counsel. These materials included an analysis of the Funds' performance, fees and expenses, and profitability from a fee consultant retained by the Funds' Independent Trustees (the “Fee Consultant” ). |
| — | The Board also received extensive information throughout the year regarding performance of the Funds. |
| — | The Independent Trustees regularly met privately with counsel to discuss contract review and other matters. In addition, the Independent Trustees were advised by the Fee Consultant in the course of their review of the Funds' contractual arrangements and considered a comprehensive report prepared by the Fee Consultant in connection with their deliberations. |
| — | In connection with reviewing the Agreement, the Board also reviewed the terms of each Fund’s Rule 12b-1 plan, distribution agreement, administrative services agreement, transfer agency agreement and other material service agreements. |
| 50 | | | DWS Equity Sector Strategy Fund |
| DWS Equity Sector Strategy Fund | | | 51 |
| 52 | | | DWS Equity Sector Strategy Fund |
| DWS Equity Sector Strategy Fund | | | 53 |
| 54 | | | DWS Equity Sector Strategy Fund |
| DWS Equity Sector Strategy Fund | | | 55 |
| — | With the exception of the revised reduced management fee schedule on direct investments, the terms of the Agreement remained the same. |
| — | DIMA’s statement that there would be no reduction in services to the Fund as a result of the revised reduced management fee schedule on direct investments. |
| 56 | | | DWS Equity Sector Strategy Fund |
| Name, Year of Birth, Position with the Trust/ Corporation and Length of Time Served1 | Business Experience and Directorships During the Past Five Years | Number of Funds in DWS Fund Complex Overseen | Other Directorships Held by Board Member |
| Keith R. Fox, CFA (1954)Chairperson since 2017, and Board Member since 1996 | Managing General Partner, Exeter Capital Partners (a series of private investment funds) (since 1986). Directorships: Progressive International Corporation (kitchen goods importer and distributor); former Chairman, National Association of Small Business Investment Companies; Former Directorships: ICI Mutual Insurance Company; BoxTop Media Inc. (advertising); Sun Capital Advisers Trust (mutual funds) | 72 | — |
| DWS Equity Sector Strategy Fund | | | 57 |
| Name, Year of Birth, Position with the Trust/ Corporation and Length of Time Served1 | Business Experience and Directorships During the Past Five Years | Number of Funds in DWS Fund Complex Overseen | Other Directorships Held by Board Member |
| John W. Ballantine (1946)Board Member since 1999 | Retired; formerly, Executive Vice President and Chief Risk Management Officer, First Chicago NBD Corporation/The First National Bank of Chicago (1996–1998); Executive Vice President and Head of International Banking (1995–1996); Not-for-Profit Directorships: Palm Beach Civic Assn.; Window to the World Communications (public media); Life Director of Harris Theater for Music and Dance (Chicago); Life Director of Hubbard Street Dance Chicago; Former Directorships: Director and Chairman of the Board, Healthways, Inc.2 (population wellbeing and wellness services) (2003–2014); Stockwell Capital Investments PLC (private equity); Enron Corporation; FNB Corporation; Tokheim Corporation; First Oak Brook Bancshares, Inc.; Oak Brook Bank; Portland General Electric2 (utility company (2003–2021); and Prisma Energy International; Former Not-for-Profit Directorships: Public Radio International | 72 | — |
| Dawn-Marie Driscoll (1946)Board Member since 1987 | Advisory Board and former Executive Fellow, Hoffman Center for Business Ethics, Bentley University; formerly: Partner, Palmer & Dodge (law firm) (1988–1990); Vice President of Corporate Affairs and General Counsel, Filene’s (retail) (1978–1988); Directorships: Trustee and former Chairman of the Board, Southwest Florida Community Foundation (charitable organization); Former Directorships: ICI Mutual Insurance Company (2007–2015); Sun Capital Advisers Trust (mutual funds) (2007–2012), Investment Company Institute (audit, executive, nominating committees) and Independent Directors Council (governance, executive committees) | 72 | — |
| 58 | | | DWS Equity Sector Strategy Fund |
| Name, Year of Birth, Position with the Trust/ Corporation and Length of Time Served1 | Business Experience and Directorships During the Past Five Years | Number of Funds in DWS Fund Complex Overseen | Other Directorships Held by Board Member |
| Richard J. Herring (1946)Board Member since 1990 | Jacob Safra Professor of International Banking and Professor of Finance, The Wharton School, University of Pennsylvania (since July 1972); Director, The Wharton Financial Institutions Center (1994–2020); formerly: Vice Dean and Director, Wharton Undergraduate Division (1995–2000) and Director, The Lauder Institute of International Management Studies (2000–2006); Member FDIC Systemic Risk Advisory Committee since 2011, member Systemic Risk Council since 2012 and member of the Advisory Board at the Yale Program on Financial Stability since 2013; Former Directorships: Co-Chair of the Shadow Financial Regulatory Committee (2003–2015), Executive Director of The Financial Economists Roundtable (2008–2015), Director of The Thai Capital Fund (2007–2013), Director of The Aberdeen Singapore Fund (2007–2018), and Nonexecutive Director of Barclays Bank DE (2010–2018) | 72 | Director, Aberdeen Japan Fund (since 2007) |
| William McClayton (1944)Board Member since 2004 | Private equity investor (since October 2009); formerly: Managing Director, Diamond Management & Technology Consultants, Inc. (global consulting firm) (2001–2009); Senior Partner, Arthur Andersen LLP (accounting) (1966–2001); Former Directorships: Board of Managers, YMCA of Metropolitan Chicago; Trustee, Ravinia Festival | 72 | — |
| Rebecca W. Rimel (1951)Board Member since 1995 | Senior Advisor, The Pew Charitable Trusts (charitable organization) (since July 2020); Director, The Bridgespan Group (nonprofit organization) (since October 2020); formerly: Executive Vice President, The Glenmede Trust Company (investment trust and wealth management) (1983–2004); Board Member, Investor Education (charitable organization) (2004–2005); Former Directorships: Trustee, Executive Committee, Philadelphia Chamber of Commerce (2001–2007); Director, Viasys Health Care2 (January 2007–June 2007); Trustee, Thomas Jefferson Foundation (charitable organization) (1994–2012); President, Chief Executive Officer and Director, The Pew Charitable Trusts (charitable organization) (1994–2020); Director, BioTelemetry Inc.2 (acquired by Royal Philips in 2021) (healthcare) (2009–2021) | 72 | Director, Becton Dickinson and Company2 (medical technology company) (2012–present) |
| William N. Searcy, Jr. (1946)Board Member since 1993 | Private investor since October 2003; formerly: Pension & Savings Trust Officer, Sprint Corporation2 (telecommunications) (November 1989–September 2003); Former Directorships: Trustee, Sun Capital Advisers Trust (mutual funds) (1998–2012) | 72 | — |
| DWS Equity Sector Strategy Fund | | | 59 |
| Name, Year of Birth, Position with the Trust/Corporation and Length of Time Served4 | Business Experience and Directorships During the Past Five Years |
| Hepsen Uzcan5 (1974)President and Chief Executive Officer, 2017–present | Fund Administration (Head since 2017), DWS; Secretary, DWS USA Corporation (2018–present); Assistant Secretary, DWS Distributors, Inc. (2018–present); Director and Vice President, DWS Service Company (2018–present); Assistant Secretary, DWS Investment Management Americas, Inc. (2018–present); Director and President, DB Investment Managers, Inc. (2018–present); President and Chief Executive Officer, The European Equity Fund, Inc., The New Germany Fund, Inc. and The Central and Eastern Europe Fund, Inc. (2017–present); formerly: Vice President for the Deutsche funds (2016–2017); Assistant Secretary for the DWS funds (2013–2019); Assistant Secretary, The European Equity Fund, Inc., The New Germany Fund, Inc. and The Central and Eastern Europe Fund, Inc. (2013–2020); Directorships: Interested Director, The European Equity Fund, Inc., The New Germany Fund, Inc. and The Central and Eastern Europe Fund, Inc. (since June 25, 2020); ICI Mutual Insurance Company (since October 16, 2020); and Episcopalian Charities of New York (2018–present) |
| John Millette6 (1962)Vice President and Secretary, 1999–present | Legal (Associate General Counsel), DWS; Chief Legal Officer, DWS Investment Management Americas, Inc. (2015–present); Director and Vice President, DWS Trust Company (2016–present); Secretary, DBX ETF Trust (2020–present); Vice President, DBX Advisors LLC (2021–present); Secretary, The European Equity Fund, Inc., The New Germany Fund, Inc. and The Central and Eastern Europe Fund, Inc. 2011–present); formerly: Secretary, Deutsche Investment Management Americas Inc. (2015–2017); and Assistant Secretary, DBX ETF Trust (2019–2020) |
| Ciara Crawford7 (1984)Assistant Secretary, (2019–present) | Fund Administration (Specialist), DWS (2015–present); formerly, Legal Assistant at Accelerated Tax Solutions. |
| Diane Kenneally6 (1966)Chief Financial Officer and Treasurer, 2018–present | Fund Administration Treasurer’s Office (Co-Head since 2018), DWS; Treasurer, Chief Financial Officer and Controller, DBX ETF Trust (2019–present); Treasurer and Chief Financial Officer, The European Equity Fund, Inc., The New Germany Fund, Inc. and The Central and Eastern Europe Fund, Inc. (2018–present); formerly: Assistant Treasurer for the DWS funds (2007–2018) |
| Paul Antosca6 (1957)Assistant Treasurer, 2007–present | Fund Administration Tax (Head), DWS; and Assistant Treasurer, DBX ETF Trust (2019–present) |
| Sheila Cadogan6 (1966)Assistant Treasurer, 2017–present | Fund Administration Treasurer’s Office (Co-Head since 2018), DWS; Director and Vice President, DWS Trust Company (2018–present); Assistant Treasurer, DBX ETF Trust (2019–present); Assistant Treasurer, The European Equity Fund, Inc., The New Germany Fund, Inc. and The Central and Eastern Europe Fund, Inc. (2018–present) |
| Scott D. Hogan6 (1970)Chief Compliance Officer, 2016–present | Anti-Financial Crime & Compliance US (Senior Team Lead), DWS; Chief Compliance Officer, The European Equity Fund, Inc., The New Germany Fund, Inc. and The Central and Eastern Europe Fund, Inc. (2016–present) |
| 60 | | | DWS Equity Sector Strategy Fund |
| Name, Year of Birth, Position with the Trust/Corporation and Length of Time Served4 | Business Experience and Directorships During the Past Five Years |
| Caroline Pearson6 (1962)Chief Legal Officer, 2010–present | Legal (Senior Team Lead), DWS; Assistant Secretary, DBX ETF Trust (2020–present); Chief Legal Officer, DBX Advisors LLC (2020–present); Chief Legal Officer, The European Equity Fund, Inc., The New Germany Fund, Inc. and The Central and Eastern Europe Fund, Inc. (2012–present); formerly: Secretary, Deutsche AM Distributors, Inc. (2002–2017); Secretary, Deutsche AM Service Company (2010–2017); and Chief Legal Officer, DBX Strategic Advisors LLC (2020–2021) |
| Christian Rijs5 (1980)Anti-Money Laundering Compliance Officer, since October 6, 2021 | DWS Americas Head of Anti-Financial Crime and AML Officer, DWS; AML Officer, DWS Trust Company (since October 6, 2021); AML Officer, DBX ETF Trust (since October 6, 2021); AML Officer, The European Equity Fund, Inc., The New Germany Fund, Inc. and The Central and Eastern Europe Fund, Inc. (since October 6, 2021.); formerly: DWS UK & Ireland Head of Anti-Financial Crime and MLRO |
| 1 | The length of time served represents the year in which the Board Member joined the board of one or more DWS funds currently overseen by the Board. |
| 2 | A publicly held company with securities registered pursuant to Section 12 of the Securities Exchange Act of 1934. |
| 3 | As a result of their respective positions held with the Advisor or its affiliates, these individuals are considered “interested persons” of the Advisor within the meaning of the 1940 Act. Interested persons receive no compensation from the Fund. |
| 4 | The length of time served represents the year in which the officer was first elected in such capacity for one or more DWS funds. |
| 5 | Address: 875 Third Avenue, New York, NY 10022. |
| 6 | Address: 100 Summer Street, Boston, MA 02110. |
| 7 | Address: 5022 Gate Parkway, Suite 400, Jacksonville, FL 32256. |
| DWS Equity Sector Strategy Fund | | | 61 |
| For More Information | The automated telephone system allows you to access personalized account information and obtain information on other DWS funds using either your voice or your telephone keypad. Certain account types within Classes A, C and S also have the ability to purchase, exchange or redeem shares using this system. |
| For more information, contact your financial representative. You may also access our automated telephone system or speak with a Shareholder Service representative by calling: (800) 728-3337 | |
| Web Site | dws.com View your account transactions and balances, trade shares, monitor your asset allocation, subscribe to fund and account updates by e-mail, and change your address, 24 hours a day. |
| Obtain prospectuses and applications, news about DWS funds, insight from DWS economists and investment specialists and access to DWS fund account information. | |
| Written Correspondence | DWSPO Box 219151 Kansas City, MO 64121-9151 |
| Proxy Voting | The Fund’s policies and procedures for voting proxies for portfolio securities and information about how the Fund voted proxies related to its portfolio securities during the most recent 12-month period ended June 30 are available on our Web site — dws.com/en-us/resources/proxy-voting — or on the SEC’s Web site — sec.gov. To obtain a written copy of the Fund’s policies and procedures without charge, upon request, call us toll free at (800) 728-3337. |
| Portfolio Holdings | Following the Fund’s fiscal first and third quarter-end, a complete portfolio holdings listing is posted on dws.com, and is available free of charge by contacting your financial intermediary, or if you are a direct investor, by calling (800) 728-3337. In addition, the portfolio holdings listing is filed with SEC on the Fund’s Form N-PORT and will be available on the SEC’s Web site at sec.gov. Additional portfolio holdings for the Fund are also posted on dws.com from time to time. Please see the Fund’s current prospectus for more information. |
| Principal Underwriter | If you have questions, comments or complaints, contact: DWS Distributors, Inc. 222 South Riverside Plaza Chicago, IL 60606-5808 (800) 621-1148 |
| 62 | | | DWS Equity Sector Strategy Fund |
| Investment Management | DWS Investment Management Americas, Inc. (“DIMA” or the “Advisor” ), which is part of the DWS Group GmbH & Co. KGaA (“DWS Group” ), is the investment advisor for the Fund. DIMA and its predecessors have more than 90 years of experience managing mutual funds and DIMA provides a full range of investment advisory services to both institutional and retail clients. DIMA is an indirect, wholly owned subsidiary of DWS Group. |
| DWS Group is a global organization that offers a wide range of investing expertise and resources, including hundreds of portfolio managers and analysts and an office network that reaches the world’s major investment centers. This well-resourced global investment platform brings together a wide variety of experience and investment insight across industries, regions, asset classes and investing styles. |
| Class A | Class C | Class S | |
| Nasdaq Symbol | SUPAX | SUPCX | SPGRX |
| CUSIP Number | 25158W 783 | 25158W 817 | 25158W 825 |
| Fund Number | 482 | 782 | 2082 |
| DWS Equity Sector Strategy Fund | | | 63 |

| (b) Not applicable | |
| ITEM 2. | CODE OF ETHICS |
As of the end of the period covered by this report, the registrant has adopted a code of ethics, as defined in Item 2 of Form N-CSR that applies to its Principal Executive Officer and Principal Financial Officer.
There have been no amendments to, or waivers from, a provision of the code of ethics during the period covered by this report that would require disclosure under Item 2.
A copy of the code of ethics is filed as an exhibit to this Form N-CSR. | |
| ITEM 3. | AUDIT COMMITTEE FINANCIAL EXPERT |
| The fund’s audit committee is comprised solely of trustees who are "independent" (as such term has been defined by the Securities and Exchange Commission ("SEC") in regulations implementing Section 407 of the Sarbanes-Oxley Act (the "Regulations")). The fund’s Board of Trustees has determined that there are several "audit committee financial experts" (as such term has been defined by the Regulations) serving on the fund’s audit committee including Mr. William McClayton, the chair of the fund’s audit committee. An “audit committee financial expert” is not an “expert” for any purpose, including for purposes of Section 11 of the Securities Act of 1933 and the designation or identification of a person as an “audit committee financial expert” does not impose on such person any duties, obligations or liability that are greater than the duties, obligations and liability imposed on such person as a member of the audit committee and board of directors in the absence of such designation or identification. | |
| ITEM 4. | PRINCIPAL ACCOUNTANT FEES AND SERVICES |
DWS Equity Sector Strategy Fund
(formerly DWS MULTI-aSSET gROWTH aLLOCATION Fund)
form n-csr disclosure re: AUDIT FEES
The following table shows the amount of fees that Ernst & Young LLP (“EY”), the Fund’s Independent Registered Public Accounting Firm, billed to the Fund during the Fund’s last two fiscal years. The Audit Committee approved in advance all audit services and non-audit services that EY provided to the Fund.
Services that the Fund’s Independent Registered Public Accounting Firm Billed to the Fund
| Fiscal Year Ended August 31, | Audit Fees Billed to Fund | Audit-Related Fees Billed to Fund | Tax Fees Billed to Fund | All Other Fees Billed to Fund |
| 2021 | $48,611 | $0 | $7,880 | $0 |
| 2020 | $48,611 | $0 | $7,880 | $0 |
The above “Tax Fees” were billed for professional services rendered for tax preparation.
Services that the Fund’s Independent Registered Public Accounting Firm Billed to the Adviser and Affiliated Fund Service Providers
The following table shows the amount of fees billed by EY to DWS Investment Management Americas, Inc. (“DIMA” or the “Adviser”), and any entity controlling, controlled by or under common control with DIMA (“Control Affiliate”) that provides ongoing services to the Fund (“Affiliated Fund Service Provider”), for engagements directly related to the Fund’s operations and financial reporting, during the Fund’s last two fiscal years.
| Fiscal Year Ended August 31, | Audit-Related Fees Billed to Adviser and Affiliated Fund Service Providers | Tax Fees Billed to Adviser and Affiliated Fund Service Providers | All Other Fees Billed to Adviser and Affiliated Fund Service Providers |
| 2021 | $0 | $487,049 | $0 |
| 2020 | $0 | $625,431 | $0 |
The above “Tax Fees” were billed in connection with tax compliance services and agreed upon procedures.
Non-Audit Services
The following table shows the amount of fees that EY billed during the Fund’s last two fiscal years for non-audit services. The Audit Committee pre-approved all non-audit services that EY provided to the Adviser and any Affiliated Fund Service Provider that related directly to the Fund’s operations and financial reporting. The Audit Committee requested and received information from EY about any non-audit services that EY rendered during the Fund’s last fiscal year to the Adviser and any Affiliated Fund Service Provider. The Committee considered this information in evaluating EY’s independence.
| Fiscal Year Ended August 31, | Total Non-Audit Fees Billed to Fund (A) | Total Non-Audit Fees billed to Adviser and Affiliated Fund Service Providers (engagements related directly to the operations and financial reporting of the Fund) (B) | Total Non-Audit Fees billed to Adviser and Affiliated Fund Service Providers (all other engagements) (C) | Total of (A), (B) and (C) |
| 2021 | $7,880 | $487,049 | $0 | $494,929 |
| 2020 | $7,880 | $625,431 | $0 | $633,311 |
All other engagement fees were billed for services in connection with agreed upon procedures and tax compliance for DIMA and other related entities.
Audit Committee Pre-Approval Policies and Procedures. Generally, each Fund’s Audit Committee must pre approve (i) all services to be performed for a Fund by a Fund’s Independent Registered Public Accounting Firm and (ii) all non-audit services to be performed by a Fund’s Independent Registered Public Accounting Firm for the DIMA Entities with respect to operations and financial reporting of the Fund, except that the Chairperson or Vice Chairperson of each Fund’s Audit Committee may grant the pre-approval for non-audit services described in items (i) and (ii) above for non-prohibited services for engagements of less than $100,000. All such delegated pre approvals shall be presented to each Fund’s Audit Committee no later than the next Audit Committee meeting.
There were no amounts that were approved by the Audit Committee pursuant to the de minimis exception under Rule 2-01 of Regulation S-X.
According to the registrant’s principal Independent Registered Public Accounting Firm, substantially all of the principal Independent Registered Public Accounting Firm's hours spent on auditing the registrant's financial statements were attributed to work performed by full-time permanent employees of the principal Independent Registered Public Accounting Firm.
***
In connection with the audit of the 2020 and 2021 financial statements, the Fund entered into an engagement letter with EY. The terms of the engagement letter required by EY, and agreed to by the Audit Committee, include a provision mandating the use of mediation and arbitration to resolve any controversy or claim between the parties arising out of or relating to the engagement letter or services provided thereunder.
***
Pursuant to PCAOB Rule 3526, EY is required to describe in writing to the Fund’s Audit Committee, on at least an annual basis, all relationships between EY, or any of its affiliates, and the DWS Funds, including the Fund, or persons in financial reporting oversight roles at the DWS Funds that, as of the date of the communication, may reasonably be thought to bear on EY’s independence. Pursuant to PCAOB Rule 3526, EY has reported the matters set forth below that may reasonably be thought to bear on EY’s independence. With respect to each reported matter in the aggregate, EY advised the Audit Committee that, after careful consideration of the facts and circumstances and the applicable independence rules, it concluded that the matters do not and will not impair EY’s ability to exercise objective and impartial judgement in connection with the audits of the financial statements for the Fund and a reasonable investor with knowledge of all relevant facts and circumstances would conclude that EY has been and is capable of exercising objective and impartial judgment on all issues encompassed within EY’s audit engagements. EY also confirmed to the Audit Committee that it can continue to act as the Independent Registered Public Accounting Firm for the Fund.
| · | EY advised the Fund’s Audit Committee that various covered persons within EY and EY’s affiliates held investments in, or had other financial relationships with, entities within the DWS Funds “investment company complex” (as defined in Regulation S-X) (the “DWS Funds Complex”). EY informed the Audit Committee that these investments and financial relationships were inconsistent with Rule 2-01(c)(1) of Regulation S-X. EY reported that all breaches have been resolved and that none of the breaches involved any professionals who were part of the audit engagement team for the Fund or in the position to influence the audit engagement team for the Fund. |
| ITEM 5. | AUDIT COMMITTEE OF LISTED REGISTRANTS | |
| Not applicable | ||
| ITEM 6. | SCHEDULE OF INVESTMENTS | |
| Not applicable | ||
| ITEM 7. | DISCLOSURE OF PROXY VOTING POLICIES AND PROCEDURES FOR CLOSED-END MANAGEMENT INVESTMENT COMPANIES | |
| Not applicable | ||
| ITEM 8. | PORTFOLIO MANAGERS OF CLOSED-END MANAGEMENT INVESTMENT COMPANIES | |
| Not applicable | ||
| ITEM 9. | PURCHASES OF EQUITY SECURITIES BY CLOSED-END MANAGEMENT INVESTMENT COMPANY AND AFFILIATED PURCHASERS | |
| Not applicable | ||
| ITEM 10. | SUBMISSION OF MATTERS TO A VOTE OF SECURITY HOLDERS | |
| There were no material changes to the procedures by which shareholders may recommend nominees to the Fund’s Board. The primary function of the Nominating and Governance Committee is to identify and recommend individuals for membership on the Board and oversee the administration of the Board Governance Guidelines. Shareholders may recommend candidates for Board positions by forwarding their correspondence by U.S. mail or courier service to Keith R. Fox, DWS Funds Board Chair, c/o Thomas R. Hiller, Ropes & Gray LLP, Prudential Tower, 800 Boylston Street, Boston, MA 02199-3600. | ||
| ITEM 11. | CONTROLS AND PROCEDURES | |
| (a) | The Chief Executive and Financial Officers concluded that the Registrant’s Disclosure Controls and Procedures are effective based on the evaluation of the Disclosure Controls and Procedures as of a date within 90 days of the filing date of this report. | |
| (b) | There have been no changes in the registrant’s internal control over financial reporting that occurred during the period covered by this report that has materially affected, or is reasonably likely to materially affect, the registrant’s internal controls over financial reporting. | |
| ITEM 12. | Disclosure of Securities Lending Activities for Closed-End Management Investment Companies | |
| Not applicable | ||
| ITEM 13. | EXHIBITS | |
| (a)(1) | Code of Ethics pursuant to Item 2 of Form N-CSR is filed and attached hereto as EX-99.CODE ETH. | |
| (a)(2) | Certification pursuant to Rule 30a-2(a) under the Investment Company Act of 1940 (17 CFR 270.30a-2(a)) is filed and attached hereto as Exhibit 99.CERT. | |
| (b) | Certification pursuant to Rule 30a-2(b) under the Investment Company Act of 1940 (17 CFR 270.30a-2(b)) is furnished and attached hereto as Exhibit 99.906CERT. | |
SIGNATURES
Pursuant to the requirements of the Securities Exchange Act of 1934 and the Investment Company Act of 1940, the registrant has duly caused this report to be signed on its behalf by the undersigned, thereunto duly authorized.
| Registrant: | DWS Equity Sector Strategy Fund, a series of Deutsche DWS Asset Allocation Trust |
| By: | /s/Hepsen Uzcan Hepsen Uzcan President |
| Date: | 10/29/2021 |
Pursuant to the requirements of the Securities Exchange Act of 1934 and the Investment Company Act of 1940, this report has been signed below by the following persons on behalf of the registrant and in the capacities and on the dates indicated.
| By: | /s/Hepsen Uzcan Hepsen Uzcan President |
| Date: | 10/29/2021 |
| By: | /s/Diane Kenneally Diane Kenneally Chief Financial Officer and Treasurer |
| Date: | 10/29/2021 |