UNITED STATES
SECURITIES AND EXCHANGE COMMISSION
WASHINGTON, D. C. 20549
FORM N-CSR
Investment Company Act file number: 811-08606
Deutsche DWS Asset Allocation Trust
(Exact Name of Registrant as Specified in Charter)
875 Third Avenue
New York, NY 10022-6225
(Address of Principal Executive Offices) (Zip Code)
Registrant’s Telephone Number, including Area Code: (212) 454-4500
Diane Kenneally
100 Summer Street
Boston, MA 02110
(Name and Address of Agent for Service)
| Date of fiscal year end: | 8/31 |
| | |
| Date of reporting period: | 8/31/2023 |
| ITEM 1. | REPORT TO STOCKHOLDERS |
| | |
| | (a) |
August 31, 2023
Annual Report
to Shareholders
DWS Equity Sector Strategy Fund
This report must be preceded or accompanied by a prospectus. To obtain a summary prospectus, if available, or prospectus for any of our funds, refer to the Account Management Resources information provided in the back of this booklet. We advise you to consider the Fund’s objectives, risks, charges and expenses carefully before investing. The summary prospectus and prospectus contain this and other important information about the Fund. Please read the prospectus carefully before you invest.
Stocks may decline in value. Any fund that focuses in a particular segment of the market or region of the world will generally be more volatile than a fund that invests more broadly. Investing in derivatives entails special risks relating to liquidity, leverage and credit that may reduce returns and/or increase volatility. The Fund may lend securities to approved institutions. Please read the prospectus for details.
War, terrorism, sanctions, economic uncertainty, trade disputes, public health crises, natural disasters, climate change and related geopolitical events have led and, in the future, may lead to significant disruptions in U.S. and world economies and markets, which may lead to increased market volatility and may have significant adverse effects on the Fund and its investments.
The brand DWS represents DWS Group GmbH & Co. KGaA and any of its subsidiaries such as DWS Distributors, Inc. which offers investment products or DWS Investment Management Americas, Inc. and RREEF America L.L.C. which offer advisory services.
NOT FDIC/NCUA INSURED NO BANK GUARANTEE MAY LOSE VALUE
NOT A DEPOSIT NOT INSURED BY ANY FEDERAL GOVERNMENT AGENCY
| | DWS Equity Sector Strategy Fund |
Letter to Shareholders
Dear Shareholder:
This past year can be described as one where there were major structural disruptions and challenges impacting financial markets: record high inflation; end of ultra-loose monetary policy; impact of slower growth in China; ongoing political attacks on global trade; demographic change profoundly affecting more and more countries; and finally, the Ukraine conflict, the future course of which continues to be highly unpredictable.
It is therefore apparent that there will be no lack of challenges for investors in 2023. With looming recession concerns in the U.S. and Europe, we believe the prospects for equity returns will be challenging for the remainder of 2023. Further, aggressive tightening by the Federal Reserve and international monetary authorities has increased pressure on banks and their ability to lend, and also negatively impacted the performance of fixed income securities. Inflation continues to remain above monetary authority targets, however there is evidence that rate hikes by the Federal Reserve are beginning to take effect and cool the pace of rising prices.
Consequently, we believe that it is important for investors to diversify their investments given the level of volatility in markets. Balanced portfolios can help mitigate the negative impact of unexpected economic, geopolitical, and market events. While investment objectives are unique to each investor, we do believe there may be benefits to owning corporate and government bonds given their potential for yield as well as holding equities for their ability to counter the negative effects of persistent inflation.
In our view, these factors of market volatility, unpredictable economic events, and complex geo-political forces strongly underscore the value add of active portfolio management. The partnership between our portfolio managers and our CIO Office — which synthesizes the views of more than 900 DWS economists, analysts and investment professionals around the world — makes an important difference in making strategic and tactical decisions for the DWS Funds. Thank you for your trust. For ongoing updates to our market and economic outlook, please visit the “Insights” section of dws.com.
Best regards,
Hepsen Uzcan
President, DWS Funds
Assumptions, estimates and opinions contained in this document constitute our judgment as of the date of the document and are subject to change without notice. Any projections are based on a number of assumptions as to market conditions and there can be no guarantee that any projected results will be achieved. Past performance is not a guarantee of future results.
DWS Equity Sector Strategy Fund | | |
Portfolio Management Review(Unaudited)
Market Overview and Fund Performance
All performance information below is historical and does not guarantee future results. Returns shown are for Class A shares, unadjusted for sales charges. Investment return and principal fluctuate, so your shares may be worth more or less when redeemed. Current performance may be lower or higher than the performance data quoted. Please visit dws.com for the most recent month-end performance of all share classes. Fund performance includes reinvestment of all distributions. Unadjusted returns do not reflect sales charges and would have been lower if they had. Please refer to pages 10 through 11 for more complete performance information.
DWS Equity Sector Strategy Fund returned 14.32% in the 12-month period that ended on August 31, 2023, underperforming the 15.94% return of its benchmark, the S&P 500® Index.
U.S. equities posted strong gains in the annual period, as a steady decline in inflation fueled optimism that world central banks could stop raising interest rates in 2023. In addition, positive global growth led to mounting expectations that the world economy—rather than falling into a recession as many anticipated in late 2022—would in fact experience a “soft landing.” In the same vein, corporate profits came in better than feared and were steady on a year-over-year basis.
Although the S&P 500 Index produced a strong return at the headline level, more than half of the gain came from information technology stocks. Within the sector, much of the positive performance was driven by a narrow group of mega-cap companies that strongly outpaced their sector peers. Communication services also outperformed, but again with narrow
Management Process
Portfolio management evaluates each sector and industry for its total return potential versus that of the benchmark. When making upwards or downwards adjustments to benchmark sector and industry positions, portfolio management utilizes a macro-minded (focused on broad market and industry factors) and intrinsic valuation oriented (using a disciplined process to evaluate deviations from estimates of intrinsic value) framework. This framework includes a fundamental assessment of the earnings outlook and observed valuation of each industry and sector. Assessments utilize the macro views of the DWS Chief Investment Officer (CIO) Americas strategy team and key global DWS CIO View forecasts. Based on this fundamental assessment of the earnings outlook and observed valuation of each industry and sector, portfolio management identifies sector and industry preferences.
| | DWS Equity Sector Strategy Fund |
leadership from large, internet-service related firms in the interactive media industry. Only one other sector—industrials—outpaced the broader market, while eight of the eleven sectors lagged. The energy, materials, and consumer discretionary sectors posted solid gains, albeit behind that of the S&P 500 Index, while healthcare, financials, and consumer staples logged single-digit returns. Utilities and real estate, both of which have above-average interest-rate sensitivity and defensive characteristics that were out of step at a time of elevated investor risk appetites, suffered losses.
"We continued to emphasize areas where we saw growth at a reasonable price.”
Fund Performance
The Fund’s underweight allocation to the information technology sector, especially semiconductor stocks, was the primary source of its underperformance in the annual period. We had a generally cautious outlook overall, as we believed the backdrop of slowing growth and rising interest rates would likely lead to softer earnings results for both the broader market and information technology companies. The tech sector indeed experienced flat earnings growth over the course of the year, but this trend was accompanied by another development we didn’t anticipate: a sizable expansion of valuations. As a result, we missed out on a portion of the rally in this market segment. We remained underweight in technology at the close of the period, as we continued to see valuations as being too high relative to the sector’s growth prospects.
Our cautious view also translated to a cash position that was above typical levels. We held cash in a range of about 7% to 13% of assets over the course of the year, which prevented the Fund from fully capitalizing on the gain for the broader market. Underweight positions in the specialty retail and machinery industries—segments of the consumer discretionary and industrials sectors, respectively—detracted, as well.
On the positive side, several aspects of our industry-level positioning contributed to performance. We were helped by having an underweight in the auto industry, where we saw earnings as being unsustainably high coming into the Fund’s fiscal year. In addition, we believed Tesla*, Inc.—which has a heavy weighting in the industry group—was too richly
DWS Equity Sector Strategy Fund | | |
valued. An overweight in oil services contributed positively, as well. While we were neutral in the energy sector as a whole, we believed the oil services group stood to benefit from higher capital expenditures by the major integrated companies. Overweights in pharmaceutical and biotechnology stocks within the healthcare sector were additional contributors of note. We believed companies in these areas featured robust long-term growth potential at very reasonable valuations. Healthcare stocks have lagged somewhat on concerns about the declining revenues from COVID-19 vaccines, but we think this obscures the attractive pipelines of new drugs to treat obesity, diabetes, neurological diseases, and cancer. We remained overweight in pharmaceutical and biotechnology stocks at the close of the period.
An overweight in the communication services sector was a further plus. We believed the interactive media companies Alphabet, Inc. (parent of Google) and Meta Platforms, Inc. (formerly Facebook) were inexpensive in light of their growth potential and ability to capitalize on the opportunity in artificial intelligence. An overweight in the communications equipment industry, which we saw as being well positioned to benefit from rising corporate spending to upgrade enterprise communications infrastructure, was an additional positive.
Outlook and Positioning
The Fund closed the period slightly overweight in financials, with overweights in the insurance industry and larger banks counterbalanced by underweights in smaller banks, capital markets firms, and consumer finance companies. Earnings at the largest banks were boosted by higher interest rates, but the benefit was offset by valuation compression caused, in part, by the lingering concerns about the banking-sector turmoil in March 2023. However, we continue to favor the sector based on expectations for modest earnings growth and improving valuations in the year ahead. On the other hand, we believe smaller banks and consumer finance stocks could prove vulnerable to slowing economic growth.
We rotated the Fund’s positioning within the market’s defensive sectors over the course of the period. The Fund entered the fiscal year with an overweight in utilities, but we gradually reduced the position to a market weight due to the category’s above-average interest rate sensitivity. We maintained an underweight in real estate for the same reason. We instead sought to achieve the Fund’s defensive exposure in consumer staples,
| | DWS Equity Sector Strategy Fund |
prompting us to move from a small underweight in the sector to a modest overweight. The sector, in addition to being less rate-sensitive, offered better valuations than other defensive market segments. We believed this was particularly true with respect to companies in the beverage, household products, and personal care products categories. Conversely, we maintained an underweight in the packaged foods industry due to its weaker earnings and less attractive valuation profile.
The past year was a challenging time given the extent to which a narrow group of technology stocks led the market higher. We believe this trend may largely have run its course, however, providing the chance for better performance in other market segments that offer the combination of healthy earnings growth and more favorable valuations. More broadly speaking, we continued to emphasize areas where we saw growth at a reasonable price. We believe companies with this combination of traits currently offer a better risk/return profile than those with more deeply discounted valuations that may in fact be cheap for a reason. We also prefer these types of companies to the more richly valued stocks in the technology sector. We have identified many such opportunities in health care, communications, industrials and the hotel/restaurants/leisure segment of consumer discretionary, as well as in other areas. In our view, this approach is preferable to one that seeks to “chase” returns in tech stocks that have already produced sizable gains in the past year.
*
Not held at August 31, 2023.
Portfolio Management Team
Prior to April 25, 2023, the portfolio management team was as follows:
David Bianco, CFA, Chief Investment Officer Americas
Portfolio Manager of the Fund. Began managing the Fund in 2021.
—Rejoined DWS in 2012 with 15 years of industry experience; previously worked as Chief US Equity Strategist at Deutsche Bank and, before rejoining, at BofA Merrill Lynch and at UBS, as the Valuation & Accounting Strategist at UBS, a Quantitative Strategist at Deutsche Bank and an industry equity analyst at Deutsche Bank, Credit Suisse and at NatWest Markets.
—Chief Investment Strategist and Head of US Active Equity Management: New York.
—BS in Economics, University of Pennsylvania.
Di Kumble, CFA, Senior Portfolio Manager Equity
Portfolio Manager of the Fund. Began managing the Fund in 2021.
—Joined DWS in 2003 with seven years of industry experience. Prior to joining, she served
DWS Equity Sector Strategy Fund | | |
as a Portfolio Manager at Graham Capital Management. Previously, she worked as a Quantitative Strategist at ITG Inc. and Morgan Stanley.
—Senior Portfolio Manager, Head of Tax Managed Equities: New York.
—BS, Beijing University; PhD in Chemistry, Princeton University.
Dokyoung Lee, CFA, Regional Head of Multi Asset & Solutions
Portfolio Manager of the Fund. Began managing the Fund in 2018.
—Joined DWS in 2018 with 24 years of industry experience; previously, worked as Head of Research and Portfolio Manager in the Global Multi-Asset Group at Oppenheimer Funds, and in research and portfolio management roles at AllianceBernstein.
—Americas Multi-Asset Head: New York.
—BSE, Princeton University.
Effective April 25, 2023, the portfolio management team is as follows:
David Bianco, CFA, Chief Investment Officer Americas
Portfolio Manager of the Fund. Began managing the Fund in 2021.
—Rejoined DWS in 2012 with 15 years of industry experience; previously worked as Chief US Equity Strategist at Deutsche Bank and, before rejoining, at BofA Merrill Lynch and at UBS, as the Valuation & Accounting Strategist at UBS, a Quantitative Strategist at Deutsche Bank and an industry equity analyst at Deutsche Bank, Credit Suisse and at NatWest Markets.
—Chief Investment Strategist and Head of US Active Equity Management: New York.
—BS in Economics, University of Pennsylvania.
Di Kumble, CFA, Senior Portfolio Manager Equity
Portfolio Manager of the Fund. Began managing the Fund in 2021.
—Joined DWS in 2003 with seven years of industry experience. Prior to joining, she served as a Portfolio Manager at Graham Capital Management. Previously, she worked as a Quantitative Strategist at ITG Inc. and Morgan Stanley.
—Senior Portfolio Manager, Head of Tax Managed Equities: New York.
—BS, Beijing University; PhD in Chemistry, Princeton University.
Hiten Shah, Portfolio Manager Equity
Portfolio Manager of the Fund. Began managing the Fund on April 25, 2023.
—Joined DWS in 2017 with 19 years of industry experience; previously, Senior Consultant at the firm with responsibility for the implementation of BlackRock’s Aladdin platform in the US; Portfolio Manager for multi-asset portable alpha strategies at Oppenheimer Funds; Portfolio Manager for global macro and fixed income at various companies, including True North Partners, HSBC, Societe General and GE; and Analyst, Metlife Investments.
—Portfolio Manager for Quantitative Equity: New York.
—BA in Economics, Rutgers University.
John Moody, Portfolio Manager Equity.
Portfolio Manager of the Fund. Began managing the Fund on April 25, 2023.
—Joined DWS in 1998. Prior to his current role, served as a Business Manager for Active Equity. Previously, he was a Portfolio Analyst for EAFE, Global and Technology Funds and an Investment Accountant for International Funds. He began his career as a Client Service Associate for the International Institutional Equity Group.
—Portfolio Analyst/Portfolio Manager: New York.
—BS in Business Management, Fairfield University.
| | DWS Equity Sector Strategy Fund |
The views expressed reflect those of the portfolio management team only through the end of the period of the report as stated on the cover. The management team’s views are subject to change at any time based on market and other conditions and should not be construed as a recommendation. Past performance is no guarantee of future results. Current and future portfolio holdings are subject to risk.
Terms to Know
The S&P 500 Index is an unmanaged, capitalization-weighted index of 500 stocks. The index is designed to measure performance of the broad domestic economy through changes in the aggregate market value of 500 stocks representing all major industries.
Contributors and detractors incorporate both a stock’s return and its weight. If two stocks have the same return but one has a larger weighting in the Fund, it will have a larger contribution to return in the period.
Overweight means the Fund holds a higher weighting in a given sector or security than the benchmark. Underweight means the Fund holds a lower weighting.
DWS Equity Sector Strategy Fund | | |
Performance SummaryAugust 31, 2023 (Unaudited)
| | | |
Average Annual Total Returns as of 8/31/23 |
Unadjusted for Sales Charge | | | |
Adjusted for the Maximum Sales Charge
(max 5.75% load) | | | |
| | | |
| | | |
Average Annual Total Returns as of 8/31/23 |
Unadjusted for Sales Charge | | | |
Adjusted for the Maximum Sales Charge
(max 1.00% CDSC) | | | |
| | | |
| | | |
Average Annual Total Returns as of 8/31/23 |
| | | |
| | | |
| |
Average Annual Total Returns as of 8/31/23 |
| |
| |
Performance in the Average Annual Total Returns table above and the Growth of an Assumed $10,000 Investment line graph that follows is historical and does not guarantee future results. Investment return and principal fluctuate, so your shares may be worth more or less when redeemed. Current performance may be lower or higher than the performance data quoted. Please visit dws.com for the Fund’s most recent month-end performance. Fund performance includes reinvestment of all distributions. Unadjusted returns do not reflect sales charges and would have been lower if they had.
The gross expense ratios of the Fund, as stated in the fee table of the prospectus dated December 1, 2022 are 1.02%, 1.91%, 0.80% and 0.98% for Class A, Class C, Class S and Institutional Class shares, respectively, and may differ from the expense ratios disclosed in the Financial Highlights tables in this report.
Index returns do not reflect any fees or expenses and it is not possible to invest directly into an index.
Performance figures do not reflect the deduction of taxes that a shareholder would pay on fund distributions or the redemption of fund shares.
On each of August 9, 2021, July 29, 2019 and October 19, 2015, the Fund’s investment strategy changed. Performance would have been different if the Fund’s current investment strategy had been in effect during the prior periods.
| | DWS Equity Sector Strategy Fund |
Generally accepted accounting principles require adjustments to be made to the net assets of the Fund at period end for financial reporting purposes only, and as such, the total return based on the unadjusted net asset value per share may differ from the total return reported in the financial highlights.
Growth of an Assumed $10,000 Investment
(Adjusted for Maximum Sales Charge)
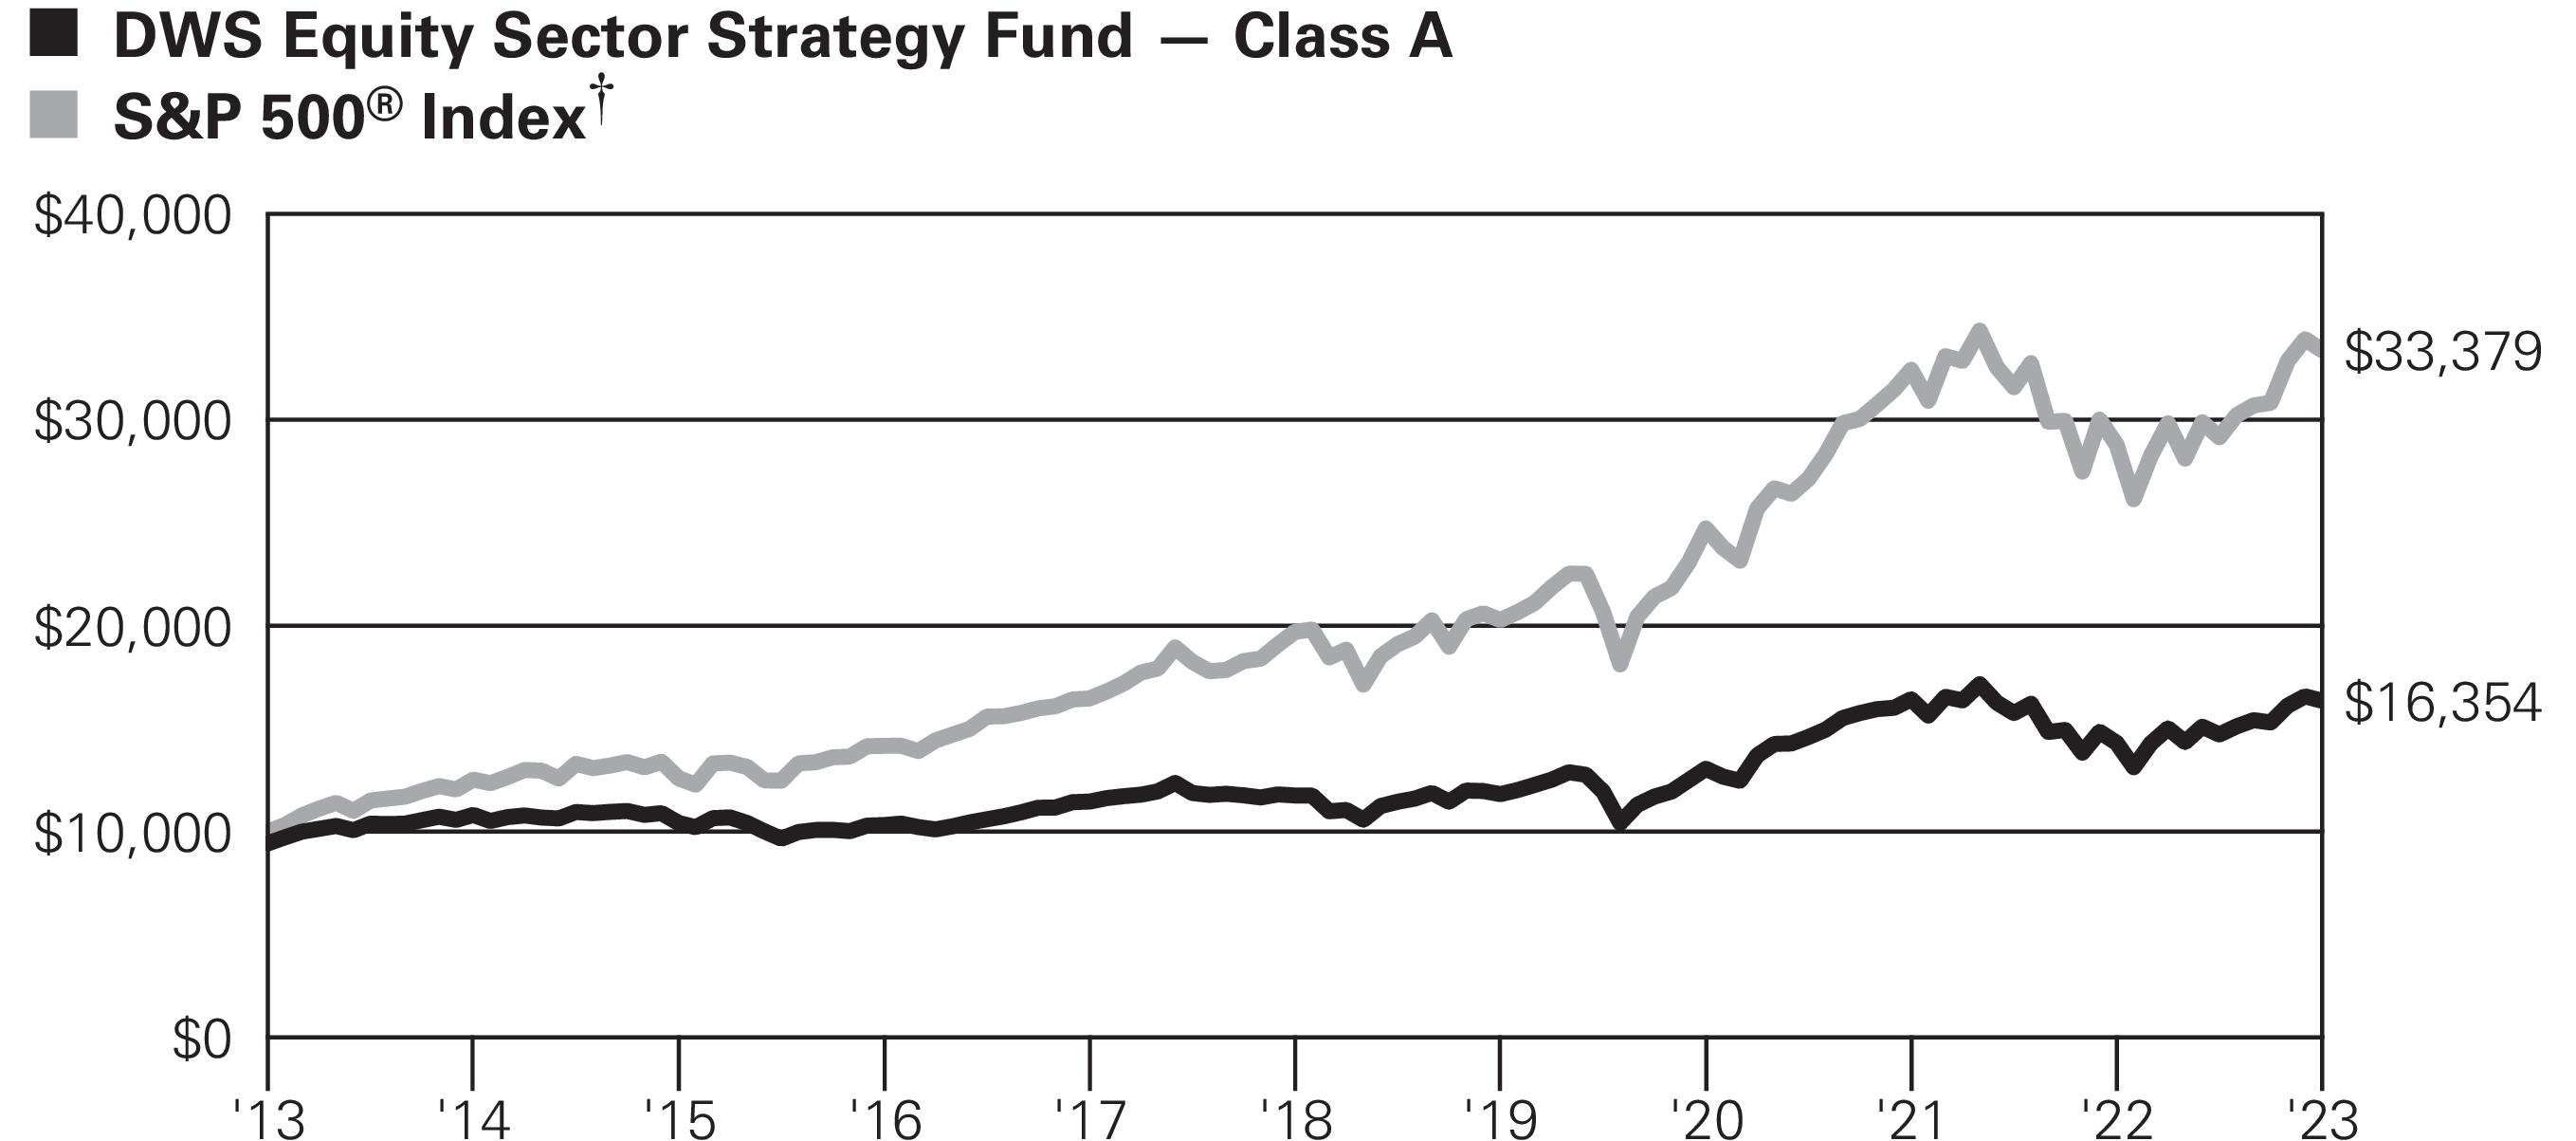 Yearly periods ended August 31
The Fund’s growth of an assumed $10,000 investment is adjusted for the maximum sales charge of 5.75%. This results in a net initial investment of $9,425.
The growth of $10,000 is cumulative.
Performance of other share classes will vary based on the sales charges and the fee structure of those classes.
| Institutional Class shares commenced operations on December 1, 2022. |
| S&P 500 Index is an unmanaged, capitalization-weighted index of 500 stocks. The index is designed to measure performance of the broad domestic economy through changes in the aggregate market value of 500 stocks representing all major industries. |
| | | | |
|
| | | | |
12/1/22 (commencement of
operations of Institutional Class) | | | | |
| | | | |
Distribution Information as of 8/31/23 |
Income Dividends, Twelve Months | | | | |
| For the period from December 1, 2022 (commencement of operations of Institutional Class) through August 31, 2023. |
DWS Equity Sector Strategy Fund | | |
Portfolio Summary(Unaudited)
Asset Allocation (As a % of Investment Portfolio excluding Securities Lending Collateral) | | |
| | |
| | |
| | |
| | |
Sector Diversification (As a % of Common Stocks and Exchange-Traded Funds) | | |
| | |
| | |
| | |
| | |
| | |
| | |
| | |
| | |
| | |
| | |
| | |
| | |
| | DWS Equity Sector Strategy Fund |
Ten Largest Equity Holdings at August 31, 2023 (28.1% of Net Assets) |
| |
Develops, manufactures, licenses, sells and supports software products | |
| |
Designs, manufactures and markets personal computers and related
computing and mobile-communication devices | |
| |
Holding company with subsidiaries that provide Web-based search, maps, hardware products and various software applications | |
| |
Online retailer offering a wide range of products | |
| |
Operator of social networking web site | |
| |
Provider of global financial services | |
| |
Producer of pharmaceuticals | |
| |
Provider of health care products | |
9Berkshire Hathaway, Inc. | |
Holding company of insurance business and a variety of other businesses | |
10UnitedHealth Group, Inc. | |
Operator of organized health systems | |
Portfolio holdings and characteristics are subject to change.
For more complete details about the Fund’s investment portfolio, see page 14. A quarterly Fact Sheet is available on dws.com or upon request. Please see the Account Management Resources section on page 60 for contact information.
DWS Equity Sector Strategy Fund | | |
Investment Portfolioas of August 31, 2023
| | |
| |
Communication Services 10.2% | |
Diversified Telecommunication Services 1.1% | |
| | | |
Verizon Communications, Inc. | | | |
| | | |
| |
| | | |
Live Nation Entertainment, Inc.* | | | |
| | | |
Take-Two Interactive Software, Inc.* | | | |
| | | |
Warner Bros Discovery, Inc.* | | | |
| | | |
Interactive Media & Services 6.4% | |
| | | |
| | | |
| | | |
Meta Platforms, Inc. “A” * | | | |
| | | |
| |
Charter Communications, Inc. “A” * | | | |
| | | |
| | | |
| | | |
Wireless Telecommunication Services 0.3% | |
| | | |
Consumer Discretionary 6.2% | |
Automobile Components 0.5% | |
| | | |
| | | |
| | | |
| |
| | | |
Hotels, Restaurants & Leisure 1.9% | |
| | | |
Chipotle Mexican Grill, Inc.* | | | |
The accompanying notes are an integral part of the financial statements.
| | DWS Equity Sector Strategy Fund |
| | |
| | | |
| | | |
| | | |
Hilton Worldwide Holdings, Inc. | | | |
Marriott International, Inc. “A” | | | |
| | | |
MGM Resorts International* | | | |
| | | |
| | | |
| | | |
| |
| | | |
| | | |
| | | |
O’Reilly Automotive, Inc.* | | | |
| | | |
| | | |
| | | |
| | | |
| | | |
Textiles, Apparel & Luxury Goods 0.2% | |
| | | |
| |
| |
| | | |
| | | |
Constellation Brands, Inc. “A” | | | |
| | | |
Molson Coors Beverage Co. “B” | | | |
| | | |
| | | |
| | | |
Consumer Staples Distribution & Retail 1.8% | |
| | | |
| | | |
| | | |
| | | |
| | | |
| | | |
The accompanying notes are an integral part of the financial statements.
DWS Equity Sector Strategy Fund | | |
| | |
Walgreens Boots Alliance, Inc. | | | |
| | | |
| | | |
| |
Church & Dwight Co., Inc. | | | |
| | | |
| | | |
| | | |
| | | |
| | | |
Personal Care Products 0.1% | |
Estee Lauder Companies, Inc. “A” | | | |
| |
| | | |
Philip Morris International, Inc. | | | |
| | | |
| |
Energy Equipment & Services | |
| | | |
| | | |
| | | |
| | | |
| |
| |
| | | |
| | | |
| | | |
| | | |
PNC Financial Services Group, Inc. | | | |
| | | |
| | | |
| | | |
| | | |
| |
| | | |
| |
Berkshire Hathaway, Inc. “B” * | | | |
The accompanying notes are an integral part of the financial statements.
| | DWS Equity Sector Strategy Fund |
| | |
Fidelity National Information Services, Inc. | | | |
| | | |
FleetCor Technologies, Inc.* | | | |
| | | |
Jack Henry & Associates, Inc. | | | |
| | | |
| | | |
| | | |
| | | |
| |
| | | |
| | | |
American International Group, Inc. | | | |
| | | |
| | | |
Arthur J. Gallagher & Co. | | | |
| | | |
| | | |
| | | |
Cincinnati Financial Corp. | | | |
| | | |
| | | |
Hartford Financial Services Group, Inc. | | | |
| | | |
| | | |
Marsh & McLennan Companies, Inc. | | | |
| | | |
Principal Financial Group, Inc. | | | |
| | | |
Prudential Financial, Inc. | | | |
Travelers Companies, Inc. | | | |
| | | |
| | | |
| | | |
| |
| |
| | | |
| | | |
| | | |
| | | |
The accompanying notes are an integral part of the financial statements.
DWS Equity Sector Strategy Fund | | |
| | |
| | | |
| | | |
Regeneron Pharmaceuticals, Inc.* | | | |
Vertex Pharmaceuticals, Inc.* | | | |
| | | |
Health Care Equipment & Supplies 4.1% | |
| | | |
| | | |
Baxter International, Inc. | | | |
| | | |
| | | |
| | | |
| | | |
Edwards Lifesciences Corp.* | | | |
GE HealthCare Technologies, Inc. | | | |
| | | |
IDEXX Laboratories, Inc.* | | | |
| | | |
Intuitive Surgical, Inc.* | | | |
| | | |
| | | |
| | | |
| | | |
| | | |
The Cooper Companies, Inc. | | | |
Zimmer Biomet Holdings, Inc. | | | |
| | | |
Health Care Providers & Services 2.5% | |
| | | |
| | | |
| | | |
| | | |
| | | |
| | | |
| | | |
| | | |
| | | |
The accompanying notes are an integral part of the financial statements.
| | DWS Equity Sector Strategy Fund |
| | |
Life Sciences Tools & Services 0.6% | |
| | | |
Thermo Fisher Scientific, Inc. | | | |
| | | |
| |
| | | |
| | | |
| | | |
| | | |
| | | |
| | | |
| | | |
| | | |
| | | |
| | | |
| |
| |
| | | |
| | | |
| | | |
| | | |
Huntington Ingalls Industries, Inc. | | | |
L3Harris Technologies, Inc. | | | |
| | | |
| | | |
| | | |
| | | |
| | | |
| | | |
Electrical Equipment 1.3% | |
| | | |
| | | |
| | | |
| | | |
Rockwell Automation, Inc. | | | |
| | | |
Ground Transportation 1.1% | |
| | | |
J.B. Hunt Transport Services, Inc. | | | |
The accompanying notes are an integral part of the financial statements.
DWS Equity Sector Strategy Fund | | |
| | |
| | | |
Old Dominion Freight Line, Inc. | | | |
| | | |
| | | |
Industrial Conglomerates 0.8% | |
| | | |
| | | |
Honeywell International, Inc. | | | |
| | | |
| |
| | | |
| | | |
| | | |
| | | |
| | | |
| | | |
Illinois Tool Works, Inc. | | | |
| | | |
| | | |
Westinghouse Air Brake Technologies Corp. | | | |
| | | |
| | | |
| |
| | | |
American Airlines Group, Inc.* | | | |
| | | |
| | | |
United Airlines Holdings, Inc.* | | | |
| | | |
Information Technology 20.7% | |
Communications Equipment 1.8% | |
| | | |
| | | |
| | | |
| | | |
| | | |
| | | |
The accompanying notes are an integral part of the financial statements.
| | DWS Equity Sector Strategy Fund |
| | |
| |
| | | |
Akamai Technologies, Inc.* | | | |
Cognizant Technology Solutions Corp. “A” | | | |
| | | |
| | | |
International Business Machines Corp. | | | |
| | | |
| | | |
Semiconductors & Semiconductor Equipment 2.7% | |
Advanced Micro Devices, Inc.* | | | |
| | | |
| | | |
| | | |
| | | |
| | | |
| | | |
Microchip Technology, Inc. | | | |
| | | |
| | | |
| | | |
| | | |
| | | |
| | | |
| | | |
| |
| | | |
| | | |
| | | |
Cadence Design Systems, Inc.* | | | |
| | | |
| | | |
| | | |
| | | |
Palo Alto Networks, Inc.* | | | |
| | | |
| | | |
| | | |
| | | |
| | | |
The accompanying notes are an integral part of the financial statements.
DWS Equity Sector Strategy Fund | | |
| | |
Technology Hardware, Storage & Peripherals 5.8% | |
| | | |
| |
| |
Air Products & Chemicals, Inc. | | | |
| | | |
| | | |
| | | |
| | | |
| | | |
International Flavors & Fragrances, Inc. | | | |
| | | |
| | | |
| | | |
| | | |
| | | |
| |
| | | |
| | | |
| | | |
| |
Hotel & Resort REITs 0.1% | |
Host Hotels & Resorts, Inc. | | | |
| |
| | | |
Simon Property Group, Inc. | | | |
| | | |
| |
| | | |
| | | |
Digital Realty Trust, Inc. | | | |
| | | |
Extra Space Storage, Inc. | | | |
| | | |
| | | |
| | | |
The accompanying notes are an integral part of the financial statements.
| | DWS Equity Sector Strategy Fund |
| | |
| | | |
| | | |
| | | |
| |
| |
| | | |
American Electric Power Co., Inc. | | | |
Constellation Energy Corp. | | | |
| | | |
| | | |
| | | |
| | | |
| | | |
| | | |
| | | |
| | | |
| | | |
| | | |
Pinnacle West Capital Corp. | | | |
| | | |
| | | |
| | | |
| | | |
| |
| | | |
Independent Power & Renewable Electricity Producers 0.0% | |
| | | |
Total Common Stocks (Cost $60,927,771) | |
Exchange-Traded Funds 3.6% |
Energy Select Sector SPDR Fund (Cost $2,125,343) | | | |
Securities Lending Collateral 0.0% |
DWS Government & Agency Securities Portfolio “DWS Government Cash Institutional Shares” , 5.27% (b) (c)
(Cost $21,995) | | | |
The accompanying notes are an integral part of the financial statements.
DWS Equity Sector Strategy Fund | | |
| | |
|
DWS Central Cash Management Government Fund, 5.35% (b) (Cost $7,659,274) | | | |
| | | |
Total Investment Portfolio (Cost $70,734,383) | | | |
Other Assets and Liabilities, Net | | | |
| | | |
A summary of the Fund’s transactions with affiliated investments during the year ended August 31, 2023 are as follows:
| | | Net
Real-
ized
Gain/
(Loss)
($) | Net
Change
in
Unreal-
ized
Appreci-
ation
(Depreci-
ation)
($) | | Capital
Gain
Distri-
butions
($) | Number of
Shares at
8/31/2023 | |
Securities Lending Collateral 0.0% |
DWS Government & Agency Securities Portfolio “DWS Government Cash Institutional Shares” , 5.27% (b) (c) |
| | | | | | | | |
|
DWS Central Cash Management Government Fund, 5.35% (b) |
| | | | | | | | |
| | | | | | | | |
| Non-income producing security. |
| All or a portion of these securities were on loan. In addition, “Other Assets and Liabilities, Net” may include pending sales that are also on loan. The value of securities loaned at August 31, 2023 amounted to $21,413, which is 0.0% of net assets. |
| Affiliated fund managed by DWS Investment Management Americas, Inc. The rate shown is the annualized seven-day yield at period end. |
| Represents cash collateral held in connection with securities lending. Income earned by the Fund is net of borrower rebates. |
| Represents the net increase (purchase cost) or decrease (sales proceeds) in the amount invested in cash collateral for the year ended August 31, 2023. |
REIT: Real Estate Investment Trust |
SPDR: Standard & Poor’s Depositary Receipt |
The accompanying notes are an integral part of the financial statements.
| | DWS Equity Sector Strategy Fund |
Fair Value Measurements
Various inputs are used in determining the value of the Fund’s investments. These inputs are summarized in three broad levels. Level 1 includes quoted prices in active markets for identical securities. Level 2 includes other significant observable inputs (including quoted prices for similar securities, interest rates, prepayment speeds and credit risk). Level 3 includes significant unobservable inputs (including the Fund’s own assumptions in determining the fair value of investments). The level assigned to the securities valuations may not be an indication of the risk or liquidity associated with investing in those securities.
The following is a summary of the inputs used as of August 31, 2023 in valuing the Fund’s investments. For information on the Fund’s policy regarding the valuation of investments, please refer to the Security Valuation section of Note A in the accompanying Notes to Financial Statements.
| | | | |
| | | | |
| | | | |
Short-Term Investments (a) | | | | |
| | | | |
| See Investment Portfolio for additional detailed categorizations. |
The accompanying notes are an integral part of the financial statements.
DWS Equity Sector Strategy Fund | | |
Statement of Assets and Liabilities
as of August 31, 2023
| |
Investments in non-affiliated securities, at value (cost $63,053,114) — including $21,413 of securities loaned | |
Investment in DWS Government & Agency Securities Portfolio | |
Investment in DWS Central Cash Management Government Fund (cost $7,659,274) | |
| |
Receivable for Fund shares sold | |
| |
| |
| |
| |
| |
Payable upon return of securities loaned | |
Payable for Fund shares redeemed | |
| |
Other accrued expenses and payables | |
| |
| |
| |
Distributable earnings (loss) | |
| |
| |
*
Represents collateral on securities loaned.
The accompanying notes are an integral part of the financial statements.
| | DWS Equity Sector Strategy Fund |
Statement of Assets and Liabilities as of August 31, 2023 (continued)
| |
| |
Net Asset Value and redemption price per share
($29,746,531 ÷ 2,042,530 outstanding shares of beneficial interest,
$.01 par value, unlimited number of shares authorized) | |
Maximum offering price per share (100 ÷ 94.25 of $14.56) | |
| |
Net Asset Value, offering and redemption price
(subject to contingent deferred sales charge) per share
($581,340 ÷ 40,686 outstanding shares of beneficial interest, $.01 par value, unlimited number of shares authorized) | |
| |
Net Asset Value, offering and redemption price per share
($44,310,832 ÷ 3,029,884 outstanding shares of beneficial interest, $.01 par value, unlimited number of shares authorized) | |
| |
Net Asset Value, offering and redemption price per share
($83,189 ÷ 5,689 outstanding shares of beneficial interest, $.01 par value, unlimited number of shares authorized) | |
The accompanying notes are an integral part of the financial statements.
DWS Equity Sector Strategy Fund | | |
Statement of Operations
for the year ended August 31, 2023
| |
| |
Dividends (net of foreign taxes withheld of $184) | |
Income distributions — DWS Central Cash Management Government Fund | |
| |
| |
| |
| |
| |
Distribution and service fees | |
| |
| |
| |
| |
| |
| |
Trustees' fees and expenses | |
| |
Total expenses before expense reductions | |
| |
Total expenses after expense reductions | |
| |
Realized and Unrealized Gain (Loss) | |
Net realized gain (loss) from investments | |
Change in net unrealized appreciation (depreciation) on investments | |
| |
Net increase (decrease) in net assets resulting from operations | |
The accompanying notes are an integral part of the financial statements.
| | DWS Equity Sector Strategy Fund |
Statements of Changes in Net Assets
| |
Increase (Decrease) in Net Assets | | |
| | |
| | |
| | |
Change in net unrealized appreciation
(depreciation) | | |
Net increase (decrease) in net assets resulting from operations | | |
Distributions to shareholders: | | |
| | |
| | |
| | |
| | |
| | |
| | |
Proceeds from shares sold | | |
Reinvestment of distributions | | |
Payments for shares redeemed | | |
Net increase (decrease) in net assets from Fund share transactions | | |
Increase (decrease) in net assets | | |
Net assets at beginning of period | | |
Net assets at end of period | | |
| For the period from December 1, 2022 (commencement of operations of Institutional Class) through August 31, 2023. |
The accompanying notes are an integral part of the financial statements.
DWS Equity Sector Strategy Fund | | |
Financial Highlights
DWS Equity Sector Strategy Fund — Class A |
| |
| | | | | |
|
Net asset value, beginning of period | | | | | |
Income (loss) from investment operations: | | | | | |
| | | | | |
Net realized and unrealized gain (loss) | | | | | |
Total from investment operations | | | | | |
| | | | | |
| | | | | |
| | | | | |
| | | | | |
Net asset value, end of period | | | | | |
| | | | | |
Ratios to Average Net Assets and Supplemental Data |
Net assets, end of period ($ millions) | | | | | |
Ratio of expenses before expense reductions (%) | | | | | |
Ratio of expenses after expense reductions (%) | | | | | |
Ratio of net investment income (%) | | | | | |
Portfolio turnover rate (%) | | | | | |
| Based on average shares outstanding during the period. |
| Total return does not reflect the effect of any sales charges. |
| Total return would have been lower had certain expenses not been reduced. |
| Total return would have been lower if the Advisor had not reduced some Underlying DWS Funds’ expenses. |
| The Fund invested in other funds and indirectly bore its proportionate share of fees and expenses incurred by the Underlying Funds in which the Fund was invested. This ratio does not include these indirect fees and expenses. |
The accompanying notes are an integral part of the financial statements.
| | DWS Equity Sector Strategy Fund |
DWS Equity Sector Strategy Fund — Class C |
| |
| | | | | |
|
Net asset value, beginning of period | | | | | |
Income (loss) from investment operations: | | | | | |
Net investment income (loss)a | | | | | |
Net realized and unrealized gain (loss) | | | | | |
Total from investment operations | | | | | |
| | | | | |
| | | | | |
| | | | | |
| | | | | |
Net asset value, end of period | | | | | |
| | | | | |
Ratios to Average Net Assets and Supplemental Data |
Net assets, end of period ($ millions) | | | | | |
Ratio of expenses before expense reductions (%) | | | | | |
Ratio of expenses after expense reductions (%) | | | | | |
Ratio of net investment income (loss) (%) | | | | | |
Portfolio turnover rate (%) | | | | | |
| Based on average shares outstanding during the period. |
| Total return does not reflect the effect of any sales charges. |
| Total return would have been lower had certain expenses not been reduced. |
| Total return would have been lower if the Advisor had not reduced some Underlying DWS Funds’ expenses. |
| The Fund invested in other funds and indirectly bore its proportionate share of fees and expenses incurred by the Underlying Funds in which the Fund was invested. This ratio does not include these indirect fees and expenses. |
The accompanying notes are an integral part of the financial statements.
DWS Equity Sector Strategy Fund | | |
DWS Equity Sector Strategy Fund — Class S |
| |
| | | | | |
|
Net asset value, beginning of period | | | | | |
Income (loss) from investment operations: | | | | | |
| | | | | |
Net realized and unrealized gain (loss) | | | | | |
Total from investment operations | | | | | |
| | | | | |
| | | | | |
| | | | | |
| | | | | |
Net asset value, end of period | | | | | |
| | | | | |
Ratios to Average Net Assets and Supplemental Data |
Net assets, end of period ($ millions) | | | | | |
Ratio of expenses before expense reductions (%) | | | | | |
Ratio of expenses after expense reductions (%) | | | | | |
Ratio of net investment income (%) | | | | | |
Portfolio turnover rate (%) | | | | | |
| Based on average shares outstanding during the period. |
| Total return would have been lower had certain expenses not been reduced. |
| Total return would have been lower if the Advisor had not reduced some Underlying DWS Funds’ expenses. |
| The Fund invested in other funds and indirectly bore its proportionate share of fees and expenses incurred by the Underlying Funds in which the Fund was invested. This ratio does not include these indirect fees and expenses. |
The accompanying notes are an integral part of the financial statements.
| | DWS Equity Sector Strategy Fund |
DWS Equity Sector Strategy Fund — Institutional Class |
| |
| |
|
Net asset value, beginning of period | |
Income (loss) from investment operations: | |
| |
Net realized and unrealized gain (loss) | |
Total from investment operations | |
| |
| |
Net asset value, end of period | |
| |
Ratios to Average Net Assets and Supplemental Data |
Net assets, end of period ($ thousands) | |
Ratio of expenses before expense reductions (%) | |
Ratio of expenses after expense reductions (%) | |
Ratio of net investment income (%) | |
Portfolio turnover rate (%) | |
| For the period from December 1, 2022 (commencement of operations) to August 31, 2023. |
| Based on average shares outstanding during the period. |
| Total return would have been lower had certain expenses not been reduced. |
| Represents the Fund’s portfolio turnover rate for the year ended August 31, 2023. |
| |
| |
The accompanying notes are an integral part of the financial statements.
DWS Equity Sector Strategy Fund | | |
Notes to Financial Statements
A.
Organization and Significant Accounting Policies
DWS Equity Sector Strategy Fund is a diversified series of Deutsche DWS Asset Allocation Trust (the “Trust” ), which is registered under the Investment Company Act of 1940, as amended (the “1940 Act” ), as an open-end management investment company organized as a Massachusetts business trust.
The Fund offers multiple classes of shares which provide investors with different purchase options. Class A shares are subject to an initial sales charge. Class C shares are not subject to an initial sales charge but are subject to higher ongoing expenses than Class A shares and a contingent deferred sales charge payable upon certain redemptions within one year of purchase. Class C shares automatically convert to Class A shares in the same fund after 8 years, provided that the Fund or the financial intermediary through which the shareholder purchased the Class C shares has records verifying that the Class C shares have been held for at least 8 years. Class S shares are not subject to initial or contingent deferred sales charges and are available through certain intermediary relationships with financial services firms, or can be purchased by establishing an account directly with the Fund’s transfer agent. Institutional Class shares commenced operations on December 1, 2022. Institutional Class shares are not subject to initial or contingent deferred sales charges and are generally available only to qualified institutions.
Investment income, realized and unrealized gains and losses, and certain fund-level expenses and expense reductions, if any, are borne pro rata on the basis of relative net assets by the holders of all classes of shares, except that each class bears certain expenses unique to that class such as distribution and service fees, services to shareholders and certain other class-specific expenses. Differences in class-level expenses may result in payment of different per share dividends by class. All shares of the Fund have equal rights with respect to voting subject to class-specific arrangements.
The Fund’s financial statements are prepared in accordance with accounting principles generally accepted in the United States of America (“U.S. GAAP” ) which require the use of management estimates. Actual results could differ from those estimates. The Fund qualifies as an investment company under Topic 946 of Accounting Standards Codification of U.S. GAAP. The policies described below are followed consistently by the Fund in the preparation of its financial statements.
Security Valuation. Investments are stated at value determined as of the close of regular trading on the New York Stock Exchange on each day the exchange is open for trading.
| | DWS Equity Sector Strategy Fund |
The Fund’s Board has designated DWS Investment Management Americas, Inc. (the “Advisor” ) as the valuation designee for the Fund pursuant to Rule 2a-5 under the 1940 Act. The Advisor’s Pricing Committee (the “Pricing Committee” ) typically values securities using readily available market quotations or prices supplied by independent pricing services (which are considered fair values under Rule 2a-5). The Advisor has adopted fair valuation procedures that provide methodologies for fair valuing securities.
Various inputs are used in determining the value of the Fund’s investments. These inputs are summarized in three broad levels. Level 1 includes quoted prices in active markets for identical securities. Level 2 includes other significant observable inputs (including quoted prices for similar securities, interest rates, prepayment speeds and credit risk). Level 3 includes significant unobservable inputs (including the Fund’s own assumptions in determining the fair value of investments). The level assigned to the securities valuations may not be an indication of the risk or liquidity associated with investing in those securities.
Equity securities and exchange-traded funds (“ETFs” ) are valued at the most recent sale price or official closing price reported on the exchange (U.S. or foreign) or over-the-counter market on which they trade. Equity securities or ETFs for which no sales are reported are valued at the calculated mean between the most recent bid and asked quotations on the relevant market or, if a mean cannot be determined, at the most recent bid quotation. Equity securities and ETFs are generally categorized as Level 1.
Investments in open-end investment companies are valued at their net asset value each business day and are categorized as Level 1.
Securities and other assets for which market quotations are not readily available or for which the above valuation procedures are deemed not to reflect fair value are valued in a manner that is intended to reflect their fair value as determined in accordance with procedures approved by the Pricing Committee and are generally categorized as Level 3. In accordance with the Fund’s valuation procedures, factors considered in determining value may include, but are not limited to, the type of the security; the size of the holding; the initial cost of the security; the existence of any contractual restrictions on the security’s disposition; the price and extent of public trading in similar securities of the issuer or of comparable companies; quotations or evaluated prices from broker-dealers and/or pricing services; information obtained from the issuer, analysts, and/or the appropriate stock exchange (for exchange-traded securities); an analysis of the company’s or issuer’s financial statements; an evaluation of the forces that influence the issuer and the market(s) in which the security is purchased and sold; and with respect to debt securities, the maturity, coupon, creditworthiness, currency denomination and the movement of
DWS Equity Sector Strategy Fund | | |
the market in which the security is normally traded. The value determined under these procedures may differ from published values for the same securities.
Disclosure about the classification of fair value measurements is included in a table following the Fund’s Investment Portfolio.
Securities Lending. Deutsche Bank AG, as securities lending agent, lends securities of the Fund to certain financial institutions under the terms of its securities lending agreement. During the term of the loans, the Fund continues to receive interest and dividends generated by the securities and to participate in any changes in their market value. The Fund requires the borrowers of the securities to maintain collateral with the Fund consisting of either cash or liquid, unencumbered assets having a value at least equal to the value of the securities loaned. When the collateral falls below specified amounts, the securities lending agent will use its best efforts to obtain additional collateral on the next business day to meet required amounts under the securities lending agreement. During the year ended August 31, 2023, the Fund invested the cash collateral, if any, into a joint trading account in DWS Government & Agency Securities Portfolio, an affiliated money market fund managed by DWS Investment Management Americas, Inc. DWS Investment Management Americas, Inc. receives a management/administration fee (0.08% annualized effective rate as of August 31, 2023) on the cash collateral invested in DWS Government & Agency Securities Portfolio. The Fund receives compensation for lending its securities either in the form of fees or by earning interest on invested cash collateral net of borrower rebates and fees paid to a securities lending agent. Either the Fund or the borrower may terminate the loan at any time, and the borrower, after notice, is required to return borrowed securities within a standard time period. There may be risks of delay and costs in recovery of securities or even loss of rights in the collateral should the borrower of the securities fail financially. If the Fund is not able to recover securities lent, the Fund may sell the collateral and purchase a replacement investment in the market, incurring the risk that the value of the replacement security is greater than the value of the collateral. The Fund is also subject to all investment risks associated with the reinvestment of any cash collateral received, including, but not limited to, interest rate, credit and liquidity risk associated with such investments.
As of August 31, 2023, the Fund had securities on loan, which were classified as common stocks in the Investment Portfolio. The value of the related collateral exceeded the value of the securities loaned at period end. As of period end, the remaining contractual maturity of the collateral agreements was overnight and continuous.
Federal Income Taxes. The Fund’s policy is to comply with the requirements of the Internal Revenue Code of 1986, as amended, which
| | DWS Equity Sector Strategy Fund |
are applicable to regulated investment companies, and to distribute all of its taxable income to its shareholders.
At August 31, 2023, the Fund had net tax basis capital loss carryforwards of approximately $4,006,000, including short-term losses ($704,000) and long-term losses ($3,302,000), which may be applied against realized net taxable capital gains indefinitely.
The Fund has reviewed the tax positions for the open tax years as of August 31, 2023 and has determined that no provision for income tax and/or uncertain tax positions is required in the Fund’s financial statements. The Fund’s federal tax returns for the prior three fiscal years remain open subject to examination by the Internal Revenue Service.
Distribution of Income and Gains. Distributions from net investment income of the Fund, if any, are declared and distributed to shareholders annually. Net realized gains from investment transactions, in excess of available capital loss carryforwards, would be taxable to the Fund if not distributed, and, therefore, will be distributed to shareholders at least annually. The Fund may also make additional distributions for tax purposes if necessary.
The timing and characterization of certain income and capital gain distributions are determined annually in accordance with federal tax regulations which may differ from accounting principles generally accepted in the United States of America. These differences primarily relate to certain securities sold at a loss. The Fund may utilize a portion of the proceeds from capital shares redeemed as a distribution from net investment income and realized capital gains. As a result, net investment income (loss) and net realized gain (loss) on investment transactions for a reporting period may differ significantly from distributions during such period. Accordingly, the Fund may periodically make reclassifications among certain of its capital accounts without impacting the net asset value of the Fund.
At August 31, 2023, the Fund’s components of distributable earnings (accumulated losses) on a net tax basis were as follows:
Capital loss carryforwards | |
Net unrealized appreciation (depreciation) on investments | |
At August 31, 2023, the aggregate cost of investments for federal income tax purposes was $71,707,255. The net unrealized appreciation for all investments based on tax cost was $2,997,292. This consisted of aggregate gross unrealized appreciation for all investments for which there was an excess of value over tax cost of $8,092,185 and aggregate gross unrealized depreciation for all investments for which there was an excess of tax cost over value of $5,094,893.
DWS Equity Sector Strategy Fund | | |
In addition, the tax character of distributions paid to shareholders by the Fund is summarized as follows:
| |
| | |
Distributions from ordinary income* | | |
Distributions from long-term capital gains | | |
| For tax purposes, short-term capital gain distributions are considered ordinary income distributions. |
Expenses. Expenses of the Trust arising in connection with a specific fund are allocated to that fund. Other Trust expenses which cannot be directly attributed to a fund are apportioned among the funds in the Trust based upon the relative net assets or other appropriate measures.
Contingencies. In the normal course of business, the Fund may enter into contracts with service providers that contain general indemnification clauses. The Fund’s maximum exposure under these arrangements is unknown, as this would involve future claims that may be made against the Fund that have not yet been made. However, based on experience, the Fund expects the risk of loss to be remote.
Other. Investment transactions are accounted for on a trade date plus one basis for daily net asset value calculations. However, for financial reporting purposes, investment transactions are reported on trade date. Interest income is recorded on the accrual basis. Dividend income is recorded on the ex-dividend date net of foreign withholding taxes. Realized gains and losses from investment transactions are recorded on an identified cost basis. Proceeds from litigation payments, if any, are included in net realized gain (loss) from investments.
B.
Purchases and Sales of Securities
During the year ended August 31, 2023, purchases and sales of investment securities (excluding short-term investments) aggregated $27,266,024 and $34,716,401, respectively.
Management Agreement. Under the Investment Management Agreement with DWS Investment Management Americas, Inc. (“DIMA” or the “Advisor” ), an indirect, wholly owned subsidiary of DWS Group GmbH & Co. KGaA (“DWS Group” ), the Advisor directs the investments of the Fund in accordance with its investment objectives, policies and restrictions. The Advisor determines the securities, instruments and other contracts relating to investments to be purchased, sold or entered into by the Fund.
| | DWS Equity Sector Strategy Fund |
Under the Restated Investment Management Agreement with the Advisor, the Fund pays a monthly management fee of: (a) 0.10% based on the Fund’s average daily net assets invested in exchange-traded funds and mutual funds, and (b) 0.30% on the Fund’s average daily net assets not covered in (a) above.
Accordingly, for the year ended August 31, 2023, the fee pursuant to the Restated Investment Management Agreement was equivalent to an annual rate (exclusive of any applicable waivers/reimbursements) of 0.27% of the Fund’s average daily net assets.
For the period from September 1, 2022 and for the period from December 1, 2022 (commencement of operations) for Institutional Class shares through November 30, 2023, the Advisor has contractually agreed to waive its fees and/or reimburse certain operating expenses of the Fund to the extent necessary to maintain the total annual operating expenses (excluding certain expenses such as extraordinary expenses, taxes, brokerage and interest expense) of each class as follows:
For the year ended August 31, 2023 and for the period from December 1, 2022 (commencement of operations) to August 31, 2023 for Institutional Class shares, fees waived and/or expenses reimbursed for each class are as follows:
Administration Fee. Pursuant to an Administrative Services Agreement, DIMA provides most administrative services to the Fund. For all services provided under the Administrative Services Agreement, the Fund pays the Advisor an annual fee (“Administration Fee” ) of 0.097% of the Fund’s average daily net assets, computed and accrued daily and payable monthly. For the year ended August 31, 2023, the Administration Fee was $70,094, of which $6,134 is unpaid.
Service Provider Fees. DWS Service Company (“DSC” ), an affiliate of the Advisor, is the transfer agent, dividend-paying agent and shareholder service agent for the Fund. Pursuant to a sub-transfer agency agreement
DWS Equity Sector Strategy Fund | | |
between DSC and SS&C GIDS, Inc. (“SS&C” ), DSC has delegated certain transfer agent, dividend-paying agent and shareholder service agent functions to SS&C. DSC compensates SS&C out of the shareholder servicing fee it receives from the Fund. For the year ended August 31, 2023 and for the period from December 1, 2022 (commencement of operations) to August 31, 2023 for Institutional Class shares, the amounts charged to the Fund by DSC were as follows:
In addition, for the year ended August 31, 2023 and for the period from December 1, 2022 (commencement of operations) to August 31, 2023 for Institutional Class shares, the amounts charged to the Fund for recordkeeping and other administrative services provided by unaffiliated third parties, included in the Statement of Operations under “Services to shareholders,” were as follows:
Distribution and Service Fees. Under the Fund’s Class C 12b-1 Plan, DWS Distributors, Inc. (“DDI” ), an affiliate of the Advisor, receives a fee (“Distribution Fee” ) of 0.75% of the average daily net assets of Class C shares. In accordance with the Fund’s Underwriting and Distribution Services Agreement, DDI enters into related selling group agreements with various firms at various rates for sales of Class C shares. For the year ended August 31, 2023, the Distribution Fee was as follows:
In addition, DDI provides information and administrative services for a fee (“Service Fee” ) to Class A and C shareholders at an annual rate of up to 0.25% of the average daily net assets for each such class. DDI in turn has
| | DWS Equity Sector Strategy Fund |
various agreements with financial services firms that provide these services and pays these fees based upon the assets of shareholder accounts the firms service. For the year ended August 31, 2023, the Service Fee was as follows:
Underwriting Agreement and Contingent Deferred Sales Charge. DDI is the principal underwriter for the Fund. Underwriting commissions paid in connection with the distribution of Class A shares for the year ended August 31, 2023 aggregated $615.
In addition, DDI receives any contingent deferred sales charge (“CDSC” ) from Class C share redemptions occurring within one year of purchase. There is no such charge upon redemption of any share appreciation or reinvested dividends. The CDSC is 1% of the value of the shares redeemed for Class C. For the year ended August 31, 2023, the CDSC for Class C shares aggregated $8. A deferred sales charge of up to 1% is assessed on certain redemptions of Class A shares.
Other Service Fees. Under an agreement with the Fund, DIMA is compensated for providing regulatory filing services to the Fund. For the year ended August 31, 2023, the amount charged to the Fund by DIMA included in the Statement of Operations under “Reports to shareholders” aggregated $1,490, of which $439 is unpaid.
Trustees’ Fees and Expenses. The Fund paid retainer fees to each Trustee not affiliated with the Advisor, plus specified amounts to the Board Chairperson and to each committee Chairperson.
Affiliated Cash Management Vehicles. The Fund may invest uninvested cash balances in DWS Central Cash Management Government Fund and DWS ESG Liquidity Fund, affiliated money market funds which are managed by the Advisor. Each affiliated money market fund is managed in accordance with Rule 2a-7 under the 1940 Act, which governs the quality, maturity, diversity and liquidity of instruments in which a money market fund may invest. DWS Central Cash Management Government Fund seeks to maintain a stable net asset value, and DWS ESG Liquidity Fund maintains a floating net asset value. The Fund indirectly bears its proportionate share of the expenses of each affiliated money market fund in which it invests. DWS Central Cash Management Government Fund does not pay the Advisor an investment management fee.
DWS Equity Sector Strategy Fund | | |
The Fund and other affiliated funds (the “Participants” ) share in a $375 million revolving credit facility provided by a syndication of banks. The Fund may borrow for temporary or emergency purposes, including the meeting of redemption requests that otherwise might require the untimely disposition of securities. The Participants are charged an annual commitment fee, which is allocated based on net assets, among each of the Participants. Interest is calculated at a daily fluctuating rate per annum equal to the sum of 0.10% plus the higher of the Federal Funds Effective Rate and the Overnight Bank Funding Rate, plus 1.25%. The Fund may borrow up to a maximum of 33 percent of its net assets under the agreement. The Fund had no outstanding loans at August 31, 2023.
E.
Fund Share Transactions
The following table summarizes share and dollar activity in the Fund:
| Year Ended
August 31, 2023 | Year Ended
August 31, 2022 |
| | | | |
|
| | | | |
| | | | |
| | | | |
| | | | |
| | | | |
Shares issued to shareholders in reinvestment of distributions |
| | | | |
| | | | |
| | | | |
| | | | |
| | | | |
|
| | | | |
| | | | |
| | | | |
| | | | |
| | DWS Equity Sector Strategy Fund |
| Year Ended August 31, 2023 | Year Ended August 31, 2022 |
| | | | |
|
| | | | |
| | | | |
| | | | |
| | | | |
| | | | |
| For the period from December 1, 2022 (commencement of operations of Institutional Class) through August 31, 2023. |
DWS Equity Sector Strategy Fund | | |
Report of Independent Registered Public Accounting Firm
To the Board of Trustees of Deutsche DWS Asset Allocation Trust and Shareholders of DWS Equity Sector Strategy Fund:
Opinion on the Financial Statements
We have audited the accompanying statement of assets and liabilities of DWS Equity Sector Strategy Fund (the “Fund” ) (one of the funds constituting Deutsche DWS Asset Allocation Trust) (the “Trust” ), including the investment portfolio, as of August 31, 2023, and the related statement of operations for the year then ended, the statements of changes in net assets for each of the two years in the period then ended, the financial highlights for each of the five years in the period then ended and the related notes (collectively referred to as the “financial statements” ). In our opinion, the financial statements present fairly, in all material respects, the financial position of the Fund (one of the funds constituting Deutsche DWS Asset Allocation Trust) at August 31, 2023, the results of its operations for the year then ended, the changes in its net assets for each of the two years in the period then ended and its financial highlights for each of the five years in the period then ended, in conformity with U.S. generally accepted accounting principles.
Basis for Opinion
These financial statements are the responsibility of the Trust’s management. Our responsibility is to express an opinion on the Fund’s financial statements based on our audits. We are a public accounting firm registered with the Public Company Accounting Oversight Board (United States) (“PCAOB” ) and are required to be independent with respect to the Trust in accordance with the U.S. federal securities laws and the applicable rules and regulations of the Securities and Exchange Commission and the PCAOB.
We conducted our audits in accordance with the standards of the PCAOB. Those standards require that we plan and perform the audit to obtain reasonable assurance about whether the financial statements are free of material misstatement, whether due to error or fraud. The Trust is not required to have, nor were we engaged to perform, an audit of the Trust’s internal control over financial reporting. As part of our audits, we are required to obtain an understanding of internal control over financial reporting, but not for the purpose of expressing an opinion on the effectiveness of the Trust’s internal control over financial reporting. Accordingly, we express no such opinion.
| | DWS Equity Sector Strategy Fund |
Our audits included performing procedures to assess the risks of material misstatement of the financial statements, whether due to error or fraud, and performing procedures that respond to those risks. Such procedures included examining, on a test basis, evidence regarding the amounts and disclosures in the financial statements. Our procedures included confirmation of securities owned as of August 31, 2023, by correspondence with the custodian, brokers, and others; when replies were not received from brokers and others, we performed other auditing procedures. Our audits also included evaluating the accounting principles used and significant estimates made by management, as well as evaluating the overall presentation of the financial statements. We believe that our audits provide a reasonable basis for our opinion.
We have served as the auditor of one or more investment companies in the DWS family of funds since at least 1979, but we are unable to determine the specific year.
Boston, Massachusetts
October 23, 2023
DWS Equity Sector Strategy Fund | | |
Other Information (Unaudited)
Regulatory Update — Tailored Shareholder Report
Effective January 24, 2023, the SEC amended the rules for mutual fund and exchange-traded fund (“ETF” ) annual and semi-annual shareholder reports. The amended rules apply to mutual funds and ETFs that are registered on Form N-1A (i.e., open-end funds) and implement a new streamlined disclosure framework requiring “concise and visually engaging” shareholder reports highlighting key information, including a simplified expense presentation, performance information, portfolio holdings and certain fund statistics. The amended rules seek to simplify shareholder reporting by consolidating investor friendly data in one report and moving other data to Form N-CSR, creating a layered disclosure framework. Certain information from the Fund’s current shareholder reports, including the Fund’s investment portfolio, financial statements and financial highlights, will move to Form N-CSR. This information must be available online, delivered free of charge upon request and filed on a semiannual basis on Form N-CSR. Notably, the amended rules will require mutual funds and ETFs to prepare separate individual shareholder reports for each fund share class. The amendments also include a revised definition of “appropriate broad-based securities market index” that will affect performance presentations in the new streamlined reports and mutual fund and ETF prospectuses. The amended rules and related form amendments have a compliance date of July 24, 2024. At this time, management is evaluating the impact of the amended rules and form amendments on the content of the Fund’s current shareholder reports.
| | DWS Equity Sector Strategy Fund |
Information About Your Fund’s Expenses
As an investor of the Fund, you incur two types of costs: ongoing expenses and transaction costs. Ongoing expenses include management fees, distribution and service (12b-1) fees and other Fund expenses. Examples of transaction costs include sales charges (loads) and account maintenance fees, which are not shown in this section. The following tables are intended to help you understand your ongoing expenses (in dollars) of investing in the Fund and to help you compare these expenses
with the ongoing expenses of investing in other mutual funds. In the most recent six-month period, the Fund limited these expenses; had it not done
so, expenses would have been higher. The example in the table is based on an investment of $1,000 invested at the beginning of the six-month period and held for the entire period (March 1, 2023 to August 31, 2023).
The tables illustrate your Fund’s expenses in two ways:
—
Actual Fund Return. This helps you estimate the actual dollar amount of ongoing expenses (but not transaction costs) paid on a $1,000 investment in the Fund using the Fund’s actual return during the period. To estimate the expenses you paid over the period, simply divide your account value by $1,000 (for example, an $8,600 account value divided by $1,000 = 8.6), then multiply the result by the number in the “Expenses Paid per $1,000” line under the share class you hold.
—
Hypothetical 5% Fund Return. This helps you to compare your Fund’s ongoing expenses (but not transaction costs) with those of other mutual funds using the Fund’s actual expense ratio and a hypothetical rate of return of 5% per year before expenses. Examples using a 5% hypothetical fund return may be found in the shareholder reports of other mutual funds. The hypothetical account values and expenses may not be used to estimate the actual ending account balance or expenses you paid for the period.
Please note that the expenses shown in these tables are meant to highlight your ongoing expenses only and do not reflect any transaction costs. The “Expenses Paid per $1,000” line of the tables is useful in comparing ongoing expenses only and will not help you determine the
relative total expense of owning different funds. Subject to certain exceptions, an account maintenance fee of $20.00 assessed once per calendar year for Classes A, C and S shares may apply for accounts with balances less than $10,000. This fee is not included in these tables. If it was, the estimate of expenses paid for Classes A, C and S shares during the period would be higher, and account value during the period would be lower, by this amount.
DWS Equity Sector Strategy Fund | | |
Expenses and Value of a $1,000 Investment
for the six months ended August 31, 2023 (Unaudited)
| | | | |
Beginning Account Value 3/1/23 | | | | |
Ending Account Value 8/31/23 | | | | |
Expenses Paid per $1,000* | | | | |
Hypothetical 5% Fund Return | | | | |
Beginning Account Value 3/1/23 | | | | |
Ending Account Value 8/31/23 | | | | |
Expenses Paid per $1,000* | | | | |
| Expenses are equal to the Fund’s annualized expense ratio for each share class, multiplied by the average account value over the period, multiplied by 184 (the number of days in the most recent six-month period), then divided by 365. |
Annualized Expense Ratios | | | | |
DWS Equity Sector Strategy Fund | | | | |
For more information, please refer to the Fund’s prospectus.
For an analysis of the fees associated with an investment in the Fund or similar funds, please refer to tools.finra.org/fund_analyzer/.
Tax Information (Unaudited)
For corporate shareholders, 76% of the ordinary dividends (i.e., income dividends plus short-term capital gains) paid during the Fund’s fiscal year ended August 31, 2023, qualified for the dividends received deduction.
For federal income tax purposes, the Fund designates approximately $1,274,000, or the maximum amount allowable under tax law, as qualified dividend income.
Please consult a tax advisor if you have questions about federal or state income tax laws, or on how to prepare your tax returns. If you have specific questions about your account, please call (800) 728-3337.
| | DWS Equity Sector Strategy Fund |
Advisory Agreement Board Considerations and Fee Evaluation
The Board of Trustees (hereinafter referred to as the “Board” or “Trustees” ) approved the renewal of DWS Equity Sector Strategy Fund’s (the “Fund” ) investment management agreement (the “Agreement” ) with DWS Investment Management Americas, Inc. (“DIMA” ) in September 2022.
In terms of the process that the Board followed prior to approving the Agreement, shareholders should know that:
—
During the entire process, all of the Fund’s Trustees were independent of DIMA and its affiliates (the “Independent Trustees” ).
—
The Board met frequently during the past year to discuss fund matters and dedicated a substantial amount of time to contract review matters. Over the course of several months, the Board reviewed extensive materials received from DIMA, independent third parties and independent counsel. These materials included an analysis of the Fund’s performance, fees and expenses, and profitability from a fee consultant retained by the Fund’s Independent Trustees (the “Fee Consultant” ).
—
The Board also received extensive information throughout the year regarding performance of the Fund.
—
The Independent Trustees regularly met privately with counsel to discuss contract review and other matters. In addition, the Independent Trustees were advised by the Fee Consultant in the course of their review of the Fund’s contractual arrangements and considered a comprehensive report prepared by the Fee Consultant in connection with their deliberations.
—
In connection with reviewing the Agreement, the Board also reviewed the terms of the Fund’s Rule 12b-1 plan, distribution agreement, administrative services agreement, transfer agency agreement and other material service agreements.
In connection with the contract review process, the Board considered the factors discussed below, among others. The Board also considered that DIMA and its predecessors have managed the Fund since its inception, and the Board believes that a long-term relationship with a capable, conscientious advisor is in the best interests of the Fund. The Board considered, generally, that shareholders chose to invest or remain invested in the Fund knowing that DIMA managed the Fund. DIMA is part of DWS Group GmbH & Co. KGaA (“DWS Group” ). DWS Group is a global asset management business that offers a wide range of investing expertise and resources, including research capabilities in many countries throughout the world. In 2018, approximately 20% of DWS Group’s
DWS Equity Sector Strategy Fund | | |
shares were sold in an initial public offering, with Deutsche Bank AG owning the remaining shares.
As part of the contract review process, the Board carefully considered the fees and expenses of each DWS fund overseen by the Board in light of the fund’s performance. In many cases, this led to the negotiation and implementation of expense caps.
While shareholders may focus primarily on fund performance and fees, the Fund’s Board considers these and many other factors, including the quality and integrity of DIMA’s personnel and administrative support services provided by DIMA, such as back-office operations, fund valuations, and compliance policies and procedures.
Nature, Quality and Extent of Services. The Board considered the terms of the Agreement, including the scope of advisory services provided under the Agreement. The Board noted that, under the Agreement, DIMA provides portfolio management services to the Fund and that, pursuant to a separate administrative services agreement, DIMA provides administrative services to the Fund. The Board considered the experience and skills of senior management and investment personnel and the resources made available to such personnel. The Board also considered the risks to DIMA in sponsoring or managing the Fund, including financial, operational and reputational risks, the potential economic impact to DIMA from such risks and DIMA’s approach to addressing such risks. The Board reviewed the Fund’s performance over short-term and long-term periods and compared those returns to various agreed-upon performance measures, including market index(es) and a peer universe compiled using information supplied by Morningstar Direct (“Morningstar” ), an independent fund data service. The Board also noted that it has put into place a process of identifying “Funds in Review” (e.g., funds performing poorly relative to a peer universe), and receives additional reporting from DIMA regarding such funds and, where appropriate, DIMA’s plans to address underperformance. The Board believes this process is an effective manner of identifying and addressing underperforming funds. Based on the information provided, the Board noted that, for the one-, three- and five-year periods ended December 31, 2021, the Fund’s performance (Class A shares) was in the 4th quartile of the applicable Morningstar universe (the 1st quartile being the best performers and the 4th quartile being the worst performers). The Board also observed that the Fund has underperformed its benchmark in the one-, three- and five-year periods ended December 31, 2021. The Board noted the disappointing investment performance of the Fund in recent periods and continued to discuss with senior management of DIMA the factors contributing to such underperformance and actions being taken to improve performance. The Board noted that effective August 9, 2021, the Fund’s strategy changed from a multi-asset growth allocation strategy to an equity sector allocation strategy. The Board also noted certain changes in the Fund’s portfolio
| | DWS Equity Sector Strategy Fund |
management team that were made effective on August 9, 2021, in connection with the Fund’s strategy change. The Board recognized the efforts by DIMA in recent years to enhance its investment platform and improve long-term performance across the DWS fund complex.
Fees and Expenses. The Board considered the Fund’s investment management fee schedule, operating expenses and total expense ratios, and comparative information provided by Broadridge Financial Solutions, Inc. (“Broadridge” ) and the Fee Consultant regarding investment management fee rates paid to other investment advisors by similar funds (1st quartile being the most favorable and 4th quartile being the least favorable). With respect to management fees paid to other investment advisors by similar funds, the Board noted that the contractual fee rates paid by the Fund, which include a 0.097% fee paid to DIMA under the Fund’s administrative services agreement, were lower than the median of the applicable Broadridge peer group (based on Broadridge data provided as of December 31, 2021). The Board noted that, effective August 9, 2021, DIMA agreed to reduce the Fund’s contractual management fee by 0.25% on assets invested in direct investments, in connection with the Fund’s strategy change. The Board noted that the Fund’s Class A shares total (net) operating expenses (excluding 12b-1 fees) were expected to be lower than the median of the applicable Broadridge expense universe (based on Broadridge data provided as of December 31, 2021, and analyzing Broadridge expense universe Class A (net) expenses less any applicable 12b-1 fees (“Broadridge Universe Expenses” ). The Board also reviewed data comparing each other operational share class’s total (net) operating expenses to the applicable Broadridge Universe Expenses. The Board noted that the expense limitations agreed to by DIMA were expected to help the Fund’s total (net) operating expenses remain competitive. The Board considered the Fund’s management fee rate as compared to fees charged by DIMA to comparable DWS U.S. registered funds (“DWS Funds” ), noting that DIMA indicated that it does not provide services to any other comparable DWS Funds. The information requested by the Board as part of its review of fees and expenses also included information about institutional accounts (including any sub-advised funds and accounts) and funds offered primarily to European investors (“DWS Europe Funds” ) managed by DWS Group. The Board noted that DIMA indicated that DWS Group does not manage any institutional accounts or DWS Europe Funds comparable to the Fund.
On the basis of the information provided, the Board concluded that management fees were reasonable and appropriate in light of the nature, quality and extent of services provided by DIMA.
Profitability. The Board reviewed detailed information regarding revenues received by DIMA under the Agreement. The Board considered the estimated costs to DIMA, and pre-tax profits realized by DIMA, from
DWS Equity Sector Strategy Fund | | |
advising the DWS Funds, as well as estimates of the pre-tax profits attributable to managing the Fund in particular. The Board also received information regarding the estimated enterprise-wide profitability of DIMA and its affiliates with respect to all fund services in totality and by fund. The Board and the Fee Consultant reviewed DIMA’s methodology in allocating its costs to the management of the Fund. Based on the information provided, the Board concluded that the pre-tax profits realized by DIMA in connection with the management of the Fund were not unreasonable. The Board also reviewed certain publicly available information regarding the profitability of certain similar investment management firms. The Board noted that, while information regarding the profitability of such firms is limited (and in some cases is not necessarily prepared on a comparable basis), DIMA and its affiliates’ overall profitability with respect to the DWS Funds (after taking into account distribution and other services provided to the funds by DIMA and its affiliates) was lower than the overall profitability levels of most
comparable firms for which such data was available.
Economies of Scale. The Board considered whether there are economies of scale with respect to the management of the Fund and whether the Fund benefits from any economies of scale. In this regard, the Board observed that while the Fund’s current investment management fee schedule does not include breakpoints, the Fund’s fee schedule represents an appropriate sharing between the Fund and DIMA of such economies of scale as may exist in the management of the Fund at current asset levels.
Other Benefits to DIMA and Its Affiliates. The Board also considered the character and amount of other incidental or “fall-out” benefits received by DIMA and its affiliates, including any fees received by DIMA for administrative services provided to the Fund, any fees received by an affiliate of DIMA for transfer agency services provided to the Fund and any fees received by an affiliate of DIMA for distribution services. The Board also considered benefits to DIMA related to brokerage and soft-dollar allocations, including allocating brokerage to pay for research generated by parties other than the executing broker dealers, which pertain primarily to funds investing in equity securities. In addition, the Board considered the incidental public relations benefits to DIMA related to DWS Funds advertising and cross-selling opportunities among DIMA products and services. The Board considered these benefits in reaching its conclusion that the Fund’s management fees were reasonable.
Compliance. The Board considered the significant attention and resources dedicated by DIMA to its compliance processes in recent years. The Board noted in particular (i) the experience, seniority and time commitment of the individuals serving as DIMA’s and the Fund’s chief compliance officers
| | DWS Equity Sector Strategy Fund |
and (ii) the substantial commitment of resources by DIMA and its affiliates to compliance matters, including the retention of compliance personnel.
Based on all of the information considered and the conclusions reached, the Board determined that the continuation of the Agreement is in the best interests of the Fund. In making this determination, the Board did not give particular weight to any single factor identified above. The Board considered these factors over the course of numerous meetings, certain of which were in executive session with only the Independent Trustees and counsel present. It is possible that individual Independent Trustees may have weighed these factors differently in reaching their individual decisions to approve the continuation of the Agreement.
DWS Equity Sector Strategy Fund | | |
Board Members and Officers
The following table presents certain information regarding the Board Members and Officers of the Trust/Corporation. Each Board Member’s year of birth is set forth in parentheses after his or her name. Unless otherwise noted, (i) each Board Member has engaged in the principal occupation(s) noted in the table for at least the most recent five years, although not necessarily in the same capacity; and (ii) the address of each Independent Board Member is c/o Keith R. Fox, DWS Funds Board Chair, c/o Thomas R. Hiller, Ropes & Gray LLP, Prudential Tower, 800 Boylston
Street, Boston, MA 02199-3600. Except as otherwise noted below, the term of office for each Board Member is until the election and qualification of a successor, or until such Board Member sooner dies, resigns, is removed or as otherwise provided in the governing documents of the Trust/Corporation. Because the Fund does not hold an annual meeting of shareholders, each Board Member will hold office for an indeterminate period.
The Board Members may also serve in similar capacities with other funds in the fund complex. The number of funds in the DWS fund complex shown in the table below includes all registered open- and closed-end funds (including all of their portfolios) advised by the Advisor and any registered funds that have an investment advisor that is an affiliated person of the Advisor.
Independent Board Members/Independent Advisory Board Members
Name, Year of
Birth, Position
with the Trust/
Corporation
and Length of
| Business Experience and Directorships
During the Past Five Years | Number of
Funds in
DWS Fund
Complex
Overseen | Other
Directorships
Held by Board
Member |
Keith R. Fox, CFA (1954) Chairperson since 2017, and Board Member since 1996 | Managing General Partner, Exeter Capital Partners (a series of private investment funds) (since 1986); Former Chairman, National Association of Small Business Investment Companies; Former Directorships: ICI Mutual Insurance Company; BoxTop Media Inc. (advertising); Sun Capital Advisers Trust (mutual funds); Progressive International Corporation (kitchen goods designer and distributor) | | |
| | DWS Equity Sector Strategy Fund |
Name, Year of Birth, Position with the Trust/ Corporation and Length of Time Served1 | Business Experience and Directorships During the Past Five Years | Number of Funds in DWS Fund Complex Overseen | Other Directorships Held by Board Member |
John W. Ballantine (1946) Board Member since 1999 | Retired; formerly: Executive Vice President and Chief Risk Management Officer, First Chicago NBD Corporation/The First National Bank of Chicago (1996–1998); Executive Vice President and Head of International Banking (1995–1996); Not-for-Profit Directorships: Window to the World Communications (public media); Life Director of Harris Theater for Music and Dance (Chicago); Life Director of Hubbard Street Dance Chicago; Former Directorships: Director and Chairman of the Board, Healthways Inc.2(population well-being and wellness services) (2003–2014); Stockwell Capital Investments PLC (private equity); Enron Corporation; FNB Corporation; Tokheim Corporation; First Oak Brook Bancshares, Inc.; Oak Brook Bank; Portland General Electric2 (utility company) (2003–2021); and Prisma Energy International; Former Not-for-Profit Directorships: Public Radio International; Palm Beach Civic Assn. | | |
Mary Schmid Daugherty, NACD.DC, PHD, CFA (1958) Board Member or Advisory Board Member | Senior Fellow in Applied Finance, Department of Finance, Opus College of Business at the University of St. Thomas (1987–present); Directorships: The Meritex Company (2017–present); Driessen Water, Inc. (2016–present); and The Hardenbergh Foundation (2021–present); Former Directorships: Mairs & Power Funds Trust (mutual funds) (2010–2022); and Crescent Electric Supply Company (2010–2019) | | |
Dawn-Marie Driscoll (1946) Board Member since 1987 | Emeritus Advisory Board and former Executive Fellow, Hoffman Center for Business Ethics, Bentley University; formerly: Partner, Palmer & Dodge (law firm) (1988–1990); Vice President of Corporate Affairs and General Counsel, Filene’s (retail) (1978–1988); Directorships: Trustee and former Chairman of the Board, Southwest Florida Community Foundation (charitable organization); Former Directorships: ICI Mutual Insurance Company (2007–2015); Sun Capital Advisers Trust (mutual funds) (2007–2012); Investment Company Institute (audit, executive, nominating committees) and Independent Directors Council (governance, executive committees) | | |
DWS Equity Sector Strategy Fund | | |
Name, Year of Birth, Position with the Trust/ Corporation and Length of Time Served1 | Business Experience and Directorships During the Past Five Years | Number of Funds in DWS Fund Complex Overseen | Other Directorships Held by Board Member |
Richard J. Herring (1946) Board Member since 1990 | Jacob Safra Professor of International Banking and Professor of Finance, The Wharton School, University of Pennsylvania (1972–present); formerly: Director, The Wharton Financial Institutions Center (1994–2020); Vice Dean and Director, Wharton Undergraduate Division (1995–2000) and Director, The Lauder Institute of International Management Studies (2000–2006); Member FDIC Systemic Risk Advisory Committee (2011–present), member Systemic Risk Council (2012–present) and member of the Advisory Board of the Yale Program on Financial Stability (2013–present); Former Directorships: Co-Chair of the Shadow Financial Regulatory Committee (2003–2015), Executive Director of The Financial Economists Roundtable (2008–2015), Director of The Thai Capital Fund (2007–2013), Director of The Aberdeen Singapore Fund (2007–2018), Director, The Aberdeen Japan Fund (2007–2021) and Nonexecutive Director of Barclays Bank DE (2010–2018) | | |
Chad D. Perry (1972) Board Member or Advisory Board Member | Executive Vice President and General Counsel, RLJ Lodging Trust2 (since 2023); formerly Executive Vice President, General Counsel and Secretary, Tanger Factory Outlet Centers, Inc.2 (2011–2023); Executive Vice President and Deputy General Counsel, LPL Financial Holdings Inc.2 (2006–2011); Senior Corporate Counsel, EMC Corporation (2005–2006); Associate, Ropes & Gray LLP (1997–2005) | | Director, Great Elm Capital Corp. (business development company) (since 2022) |
Rebecca W. Rimel (1951) Board Member since 1995 | Directorships: Washington College (since July 2023); Formerly: Executive Vice President, The Glenmede Trust Company (investment trust and wealth management) (1983–2004); Board Member, Investor Education (charitable organization) (2004–2005); Former Directorships: Trustee, Executive Committee, Philadelphia Chamber of Commerce (2001–2007); Director, Viasys Health Care2 (January 2007–June 2007); Trustee, Thomas Jefferson Foundation (charitable organization) (1994–2012); President, Chief Executive Officer and Director (1994–2020) and Senior Advisor (2020–2021), The Pew Charitable Trusts (charitable organization); Director, BioTelemetry Inc.2 (acquired by Royal Philips in 2021) (healthcare) (2009–2021); Director, Becton Dickinson and Company2 (medical technology company) (2012–2022) | | Director, The Bridgespan Group (nonprofit organization) (since October 2020) |
| | DWS Equity Sector Strategy Fund |
Name, Year of Birth, Position with the Trust/ Corporation and Length of Time Served1 | Business Experience and Directorships During the Past Five Years | Number of Funds in DWS Fund Complex Overseen | Other Directorships Held by Board Member |
Catherine Schrand (1964) Board Member since 2021 | Celia Z. Moh Professor of Accounting (2016–present) and Professor of Accounting (1994–present); Directorships: Director, the Jacobs Levy Center, The Wharton School, University of Pennsylvania (since 2023); Former positions: Vice Dean, Wharton Doctoral Programs, The Wharton School, University of Pennsylvania (2016–2019) | | |
William N. Searcy, Jr. (1946) Board Member since 1993 | Private investor since October 2003; formerly: Pension & Savings Trust Officer, Sprint Corporation2 (telecommunications) (November 1989–September 2003); Former Directorships: Trustee, Sun Capital Advisers Trust (mutual funds) (1998–2012) | | |
Officers5
Name, Year of Birth, Position
with the Trust/Corporation
and Length of Time Served6 | Business Experience and Directorships During the
Past Five Years |
Hepsen Uzcan7 (1974) President and Chief Executive Officer, 2017–present | Head of Americas CEO Office, DWS (2023–present), Head of Fund Administration, Head of Product Americas and Head of U.S. Mutual Funds, DWS (2017–present); Assistant Secretary, DWS Distributors, Inc. (2018–present); Vice President, DWS Service Company (2018–present); President, DB Investment Managers, Inc.(2018–present); President and Chief Executive Officer, The European Equity Fund, Inc., The New Germany Fund, Inc. and The Central and Eastern Europe Fund, Inc. (2017–present); formerly: Vice President for the Deutsche funds (2016–2017); Assistant Secretary for the DWS funds (2013–2019); Secretary, DWS USA Corporation (2018–2023); Assistant Secretary, DWS Investment Management Americas, Inc. (2018–2023); Assistant Secretary, DWS Trust Company (2018–2023); Assistant Secretary, The European Equity Fund, Inc., The New Germany Fund, Inc. and The Central and Eastern Europe Fund, Inc. (2013–2020); Directorships: Director of DWS Service Company (2018–present); Director of DB Investment Managers, Inc. (2018–present); Director of Episcopalian Charities of New York (2018–present); Interested Director of The European Equity Fund, Inc., The New Germany Fund, Inc. and The Central and Eastern Europe Fund, Inc. (2020–present); Director of ICI Mutual Insurance Company (2020–present); Director of DWS USA Corporation (2023–present); Director of DWS Investment Management Americas, Inc. (2023–present); and Manager of DBX Advisors LLC. (2023–present) |
DWS Equity Sector Strategy Fund | | |
Name, Year of Birth, Position with the Trust/Corporation and Length of Time Served6 | Business Experience and Directorships During the Past Five Years |
John Millette8 (1962) Vice President and Secretary, 1999–present | Legal (Associate General Counsel), DWS; Chief Legal Officer, DWS Investment Management Americas, Inc. (2015–present); Director and Vice President, DWS Trust Company (2016–present); Secretary, DBX ETF Trust (2020–present); Vice President, DBX Advisors LLC (2021–present); Secretary, The European Equity Fund, Inc., The New Germany Fund, Inc. and The Central and Eastern Europe Fund, Inc. (2011–present); formerly: Secretary, Deutsche Investment Management Americas Inc. (2015–2017); and Assistant Secretary, DBX ETF Trust (2019–2020) |
Ciara Crawford9 (1984) Assistant Secretary, 2019–present | Fund Administration (Specialist), DWS (2015–present); Assistant Secretary, DWS Service Company (2018–present); Assistant Secretary of U.S. Mutual Funds, DWS (2019–present); Assistant Secretary, DWS USA Corporation (2023–present); Assistant Secretary, DBX Advisors, LLC (2023–present); Assistant Secretary, DWS Investment Management Americas, Inc. (2023–present); Assistant Clerk, DWS Trust Company (2023–present); formerly, Legal Assistant at Accelerated Tax Solutions |
Diane Kenneally8 (1966) Chief Financial Officer and Treasurer, 2018–present | Fund Administration Treasurer’s Office (Co-Head since 2018), DWS; Treasurer, Chief Financial Officer and Controller, DBX ETF Trust (2019–present); Treasurer and Chief Financial Officer, The European Equity Fund, Inc., The New Germany Fund, Inc. and The Central and Eastern Europe Fund, Inc. (2018–present); formerly: Assistant Treasurer for the DWS funds (2007–2018) |
Sheila Cadogan8 (1966) Assistant Treasurer, 2017–present | Fund Administration Treasurer’s Office (Co-Head since 2018), DWS; Director and Vice President, DWS Trust Company (2018–present); Assistant Treasurer, DBX ETF Trust (2019–present); Assistant Treasurer, The European Equity Fund, Inc., The New Germany Fund, Inc. and The Central and Eastern Europe Fund, Inc. (2018–present) |
Scott D. Hogan8 (1970) Chief Compliance Officer, 2016–present | Anti-Financial Crime & Compliance US (Senior Team Lead), DWS; Chief Compliance Officer, The European Equity Fund, Inc., The New Germany Fund, Inc. and The Central and Eastern Europe Fund, Inc. (2016–present) |
Caroline Pearson8 (1962) Chief Legal Officer, 2010–present | Legal (Senior Team Lead), DWS; Assistant Secretary, DBX ETF Trust (2020–present); Chief Legal Officer, DBX Advisors LLC (2020–present); Chief Legal Officer, The European Equity Fund, Inc., The New Germany Fund, Inc. and The Central and Eastern Europe Fund, Inc. (2012–present); formerly: Secretary, Deutsche AM Distributors, Inc. (2002–2017); Secretary, Deutsche AM Service Company (2010–2017); and Chief Legal Officer, DBX Strategic Advisors LLC (2020–2021) |
Christian Rijs7 (1980) Anti-Money Laundering
Compliance Officer, 2021–present | Senior Team Lead Anti-Financial Crime and Compliance, DWS; AML Officer, DWS Trust Company (2021–present); AML Officer, DBX ETF Trust (2021–present); AML Officer, The European Equity Fund, Inc., The New Germany Fund, Inc. and The Central and Eastern Europe Fund, Inc. (2021–present); formerly: DWS UK & Ireland Head of Anti-Financial Crime and MLRO |
| The length of time served represents the year in which the Board Member joined the board of one or more DWS funds currently overseen by the Board. |
| | DWS Equity Sector Strategy Fund |
| A publicly held company with securities registered pursuant to Section 12 of the Securities Exchange Act of 1934. |
| Mr. Perry and Ms. Daugherty are each an Advisory Board Member of Deutsche DWS Asset Allocation Trust, Deutsche DWS Equity 500 Index Portfolio, Deutsche DWS Global/International Fund, Inc., Deutsche DWS Income Trust, Deutsche DWS Institutional Funds, Deutsche DWS International Fund, Inc., Deutsche DWS Investment Trust, Deutsche DWS Investments VIT Funds, Deutsche DWS Money Market Trust, Deutsche DWS Municipal Trust, Deutsche DWS Portfolio Trust, Deutsche DWS Securities Trust, Deutsche DWS Tax Free Trust, Deutsche DWS Variable Series I and Government Cash Management Portfolio. Mr. Perry and Ms. Daugherty are each a Board Member of each other Trust. |
| Mr. Perry and Ms. Daugherty each oversees 21 funds in the DWS Fund Complex as a Board Member of various Trusts. Mr. Perry and Ms. Daugherty are each an Advisory Board Member of various Trusts/Corporations comprised of 48 funds in the DWS Fund Complex. |
| As a result of their respective positions held with the Advisor or its affiliates, these individuals are considered “interested persons” of the Advisor within the meaning of the 1940 Act. Interested persons receive no compensation from the Fund. |
| The length of time served represents the year in which the officer was first elected in such capacity for one or more DWS funds. |
| Address: 875 Third Avenue, New York, New York 10022. |
| Address: 100 Summer Street, Boston, MA 02110. |
| Address: 5201 Gate Parkway, Jacksonville, FL 32256. |
Certain officers hold similar positions for other investment companies for which DIMA or an affiliate serves as the Advisor.
The Fund’s Statement of Additional Information (“SAI” ) includes additional information about the Board Members. The SAI is available, without charge, upon request. If you would like to request a copy of the SAI, you may do so by calling the following toll-free number: (800) 728-3337.
DWS Equity Sector Strategy Fund | | |
Account Management Resources
| The automated telephone system allows you to access personalized account information and obtain information on other DWS funds using either your voice or your telephone keypad. Certain account types within Classes A, C and S also have the ability to purchase, exchange or redeem shares using this system. |
For more information, contact your financial representative. You may also access our automated telephone system or speak with a Shareholder Service representative by calling: (800) 728-3337 |
| dws.com View your account transactions and balances, trade shares, monitor your asset allocation, subscribe to fund and account updates by e-mail, and change your address, 24 hours a day. |
Obtain prospectuses and applications, news about DWS funds, insight from DWS economists and investment specialists and access to DWS fund account information. |
| DWS PO Box 219151 Kansas City, MO 64121-9151 |
| The Fund’s policies and procedures for voting proxies for portfolio securities and information about how the Fund voted proxies related to its portfolio securities during the most recent 12-month period ended June 30 are available on our Web site — dws.com/en-us/resources/proxy-voting — or on the SEC’s Web site — sec.gov. To obtain a written copy of the Fund’s policies and procedures without charge, upon request, call us toll free at (800) 728-3337. |
| Following the Fund’s fiscal first and third quarter-end, a complete portfolio holdings listing is posted on dws.com and is available free of charge by contacting your financial intermediary or, if you are a direct investor, by calling (800) 728-3337. In addition, the portfolio holdings listing is filed with the SEC on the Fund’s Form N-PORT and will be available on the SEC’s Web site at sec.gov. Additional portfolio holdings for the Fund are also posted on dws.com from time to time. Please see the Fund’s current prospectus for more information. |
| If you have questions, comments or complaints, contact: DWS Distributors, Inc. 222 South Riverside Plaza Chicago, IL 60606-5808 (800) 621-1148 |
| | DWS Equity Sector Strategy Fund |
| DWS Investment Management Americas, Inc. (“DIMA” or the “Advisor” ), which is part of the DWS Group GmbH & Co. KGaA (“DWS Group” ), is the investment advisor for the Fund. DIMA and its predecessors have more than 90 years of experience managing mutual funds and DIMA provides a full range of investment advisory services to both institutional and retail clients. DIMA is an indirect, wholly owned subsidiary of DWS Group. |
| DWS Group is a global organization that offers a wide range of investing expertise and resources, including hundreds of portfolio managers and analysts and an office network that reaches the world’s major investment centers. This well-resourced global investment platform brings together a wide variety of experience and investment insight across industries, regions, asset classes and investing styles. |
DWS Equity Sector Strategy Fund | | |
222 South Riverside Plaza
Chicago, IL 60606-5808
| | |
| | (b) Not applicable |
| | |
| ITEM 2. | CODE OF ETHICS |
| | |
| | As of the end of the period covered by this report, the registrant has adopted a code of ethics, as defined in Item 2 of Form N-CSR that applies to its Principal Executive Officer and Principal Financial Officer. There have been no amendments to, or waivers from, a provision of the code of ethics during the period covered by this report that would require disclosure under Item 2. A copy of the code of ethics is filed as an exhibit to this Form N-CSR. |
| | |
| ITEM 3. | AUDIT COMMITTEE FINANCIAL EXPERT |
| | |
| | The fund’s audit committee is comprised solely of trustees who are "independent" (as such term has been defined by the Securities and Exchange Commission ("SEC") in regulations implementing Section 407 of the Sarbanes-Oxley Act (the "Regulations")). The fund’s Board of Trustees has determined that there are several "audit committee financial experts" (as such term has been defined by the Regulations) serving on the fund’s audit committee including Ms. Catherine Schrand, the chair of the fund’s audit committee. An “audit committee financial expert” is not an “expert” for any purpose, including for purposes of Section 11 of the Securities Act of 1933 and the designation or identification of a person as an “audit committee financial expert” does not impose on such person any duties, obligations or liability that are greater than the duties, obligations and liability imposed on such person as a member of the audit committee and board of directors in the absence of such designation or identification. |
| | |
| ITEM 4. | PRINCIPAL ACCOUNTANT FEES AND SERVICES |
| | |
DWS equity sector strategy Fund
form n-csr disclosure re: AUDIT FEES
The following table shows the amount of fees that Ernst & Young LLP (“EY”), the Fund’s Independent Registered Public Accounting Firm, billed to the Fund during the Fund’s last two fiscal years. The Audit Committee approved in advance all audit services and non-audit services that EY provided to the Fund.
Services that the Fund’s Independent Registered Public Accounting Firm Billed to the Fund
Fiscal Year
Ended
August 31, | Audit Fees Billed to Fund | Audit-Related
Fees Billed to Fund | Tax Fees Billed to Fund | All
Other Fees Billed to Fund |
| 2023 | $46,180 | $0 | $8,948 | $0 |
| 2022 | $46,180 | $0 | $7,880 | $0 |
The above “Tax Fees” were billed for professional services rendered for tax preparation.
Services that the Fund’s Independent Registered Public Accounting Firm Billed to the Adviser and Affiliated Fund Service Providers
The following table shows the amount of fees billed by EY to DWS Investment Management Americas, Inc. (“DIMA” or the “Adviser”), and any entity controlling, controlled by or under common control with DIMA (“Control Affiliate”) that provides ongoing services to the Fund (“Affiliated Fund Service Provider”), for engagements directly related to the Fund’s operations and financial reporting, during the Fund’s last two fiscal years.
Fiscal Year
Ended
August 31, | Audit-Related
Fees Billed to Adviser and Affiliated Fund Service Providers | Tax Fees Billed to Adviser and Affiliated Fund Service Providers | All
Other Fees Billed to Adviser and Affiliated Fund Service Providers |
| 2023 | $0 | $539,907 | $0 |
| 2022 | $0 | $32,448 | $0 |
The above “Tax Fees” were billed in connection with tax compliance services and agreed upon procedures.
Non-Audit Services
The following table shows the amount of fees that EY billed during the Fund’s last two fiscal years for non-audit services. The Audit Committee pre-approved all non-audit services that EY provided to the Adviser and any Affiliated Fund Service Provider that related directly to the Fund’s operations and financial reporting. The Audit Committee requested and received information from EY about any non-audit services that EY rendered during the Fund’s last fiscal year to the Adviser and any Affiliated Fund Service Provider. The Committee considered this information in evaluating EY’s independence.
Fiscal Year
Ended
August 31, | Total
Non-Audit Fees Billed to Fund
(A) | Total Non-Audit Fees billed to Adviser and Affiliated Fund Service Providers (engagements related directly to the operations and financial reporting of the Fund)
(B) | Total Non-Audit Fees billed to Adviser and Affiliated Fund Service Providers (all other engagements)
(C) | Total of
(A), (B) and (C) |
| 2023 | $8,948 | $539,907 | $0 | $548,855 |
| 2022 | $7,880 | $32,448 | $0 | $40,328 |
All other engagement fees were billed for services in connection with agreed upon procedures and tax compliance for DIMA and other related entities.
Audit Committee Pre-Approval Policies and Procedures. Generally, each Fund’s Audit Committee must pre approve (i) all services to be performed for a Fund by a Fund’s Independent Registered Public Accounting Firm and (ii) all non-audit services to be performed by a Fund’s Independent Registered Public Accounting Firm for the DIMA Entities with respect to operations and financial reporting of the Fund, except that the Chairperson or Vice Chairperson of each Fund’s Audit Committee may grant the pre-approval for non-audit services described in items (i) and (ii) above for non-prohibited services for engagements of less than $100,000. All such delegated pre approvals shall be presented to each Fund’s Audit Committee no later than the next Audit Committee meeting.
There were no amounts that were approved by the Audit Committee pursuant to the de minimis exception under Rule 2-01 of Regulation S-X.
According to the registrant’s principal Independent Registered Public Accounting Firm, substantially all of the principal Independent Registered Public Accounting Firm's hours spent on auditing the registrant's financial statements were attributed to work performed by full-time permanent employees of the principal Independent Registered Public Accounting Firm and (i) and (j) are not applicable.
***
In connection with the audit of the 2022 and 2023 financial statements, the Fund entered into an engagement letter with EY. The terms of the engagement letter required by EY, and agreed to by the Audit Committee, include a provision mandating the use of mediation and arbitration to resolve any controversy or claim between the parties arising out of or relating to the engagement letter or services provided thereunder.
***
Pursuant to PCAOB Rule 3526, EY is required to describe in writing to the Fund’s Audit Committee, on at least an annual basis, all relationships between EY, or any of its affiliates, and the DWS Funds, including the Fund, or persons in financial reporting oversight roles at the DWS Funds that, as of the date of the communication, may reasonably be thought to bear on EY’s independence. Pursuant to PCAOB Rule 3526, EY has reported the matters set forth below that may reasonably be thought to bear on EY’s independence. With respect to each reported matter in the aggregate, EY advised the Audit Committee that, after careful consideration of the facts and circumstances and the applicable independence rules, it concluded that the matters do not and will not impair EY’s ability to exercise objective and impartial judgement in connection with the audits of the financial statements for the Fund and a reasonable investor with knowledge of all relevant facts and circumstances would conclude that EY has been and is capable of exercising objective and impartial judgment on all issues encompassed within EY’s audit engagements. EY also confirmed to the Audit Committee that it can continue to act as the Independent Registered Public Accounting Firm for the Fund.
| · | EY advised the Fund’s Audit Committee that various covered persons within EY and EY’s affiliates held investments in, or had other financial relationships with, entities within the DWS Funds “investment company complex” (as defined in Regulation S-X) (the “DWS Funds Complex”). EY informed the Audit Committee that these investments and financial relationships were inconsistent with Rule 2-01(c)(1) of Regulation S-X. EY reported that all breaches have been resolved and that none of the breaches involved any professionals who were part of the audit engagement team for the Fund or in the position to influence the audit engagement team for the Fund. |
| | |
| ITEM 5. | AUDIT COMMITTEE OF LISTED REGISTRANTS |
| | |
| | Not applicable |
| | |
| ITEM 6. | INVESTMENTS |
| | |
| | Not applicable |
| | |
| ITEM 7. | DISCLOSURE OF PROXY VOTING POLICIES AND PROCEDURES FOR CLOSED-END MANAGEMENT INVESTMENT COMPANIES |
| | |
| | Not applicable |
| | |
| ITEM 8. | PORTFOLIO MANAGERS OF CLOSED-END MANAGEMENT INVESTMENT COMPANIES |
| | |
| | Not applicable |
| | |
| ITEM 9. | PURCHASES OF EQUITY SECURITIES BY CLOSED-END MANAGEMENT INVESTMENT COMPANY AND AFFILIATED PURCHASERS |
| | |
| | Not applicable |
| | |
| ITEM 10. | SUBMISSION OF MATTERS TO A VOTE OF SECURITY HOLDERS |
| | |
| | There were no material changes to the procedures by which shareholders may recommend nominees to the Fund’s Board. The primary function of the Nominating and Governance Committee is to identify and recommend individuals for membership on the Board and oversee the administration of the Board Governance Guidelines. Shareholders may recommend candidates for Board positions by forwarding their correspondence by U.S. mail or courier service to Keith R. Fox, DWS Funds Board Chair, c/o Thomas R. Hiller, Ropes & Gray LLP, Prudential Tower, 800 Boylston Street, Boston, MA 02199-3600. |
| | |
| ITEM 11. | CONTROLS AND PROCEDURES |
| | |
| | (a) | The Chief Executive and Financial Officers concluded that the Registrant’s Disclosure Controls and Procedures are effective based on the evaluation of the Disclosure Controls and Procedures as of a date within 90 days of the filing date of this report. |
| | |
| | (b) | There have been no changes in the registrant’s internal control over financial reporting that occurred during the period covered by this report that has materially affected, or is reasonably likely to materially affect, the registrant’s internal controls over financial reporting. |
| | |
| ITEM 12. | Disclosure of Securities Lending Activities for Closed-End Management Investment Companies |
| | |
| | Not applicable |
| | |
| ITEM 13. | EXHIBITS |
| | |
| | (a)(1) | Code of Ethics pursuant to Item 2 of Form N-CSR is filed and attached hereto as EX-99.CODE ETH. |
| | |
| | (a)(2) | Certification pursuant to Rule 30a-2(a) under the Investment Company Act of 1940 (17 CFR 270.30a-2(a)) is filed and attached hereto as Exhibit 99.CERT. |
| | |
| | (b) | Certification pursuant to Rule 30a-2(b) under the Investment Company Act of 1940 (17 CFR 270.30a-2(b)) is furnished and attached hereto as Exhibit 99.906CERT. |
SIGNATURES
Pursuant to the requirements of the Securities Exchange Act of 1934 and the Investment Company Act of 1940, the registrant has duly caused this report to be signed on its behalf by the undersigned, thereunto duly authorized.
| Registrant: | DWS Equity Sector Strategy Fund, a series of Deutsche DWS Asset Allocation Trust |
| | |
| | |
| By: | /s/Hepsen Uzcan Hepsen Uzcan President |
| | |
| Date: | 10/30/2023 |
Pursuant to the requirements of the Securities Exchange Act of 1934 and the Investment Company Act of 1940, this report has been signed below by the following persons on behalf of the registrant and in the capacities and on the dates indicated.
| By: | /s/Hepsen Uzcan Hepsen Uzcan President |
| | |
| Date: | 10/30/2023 |
| | |
| | |
| | |
| By: | /s/Diane Kenneally Diane Kenneally Chief Financial Officer and Treasurer |
| | |
| Date: | 10/30/2023 |