Table of Contents
Exhibit (c)(1)

PRESIDENTIAL HOUSE
1572 NE 191st Street
North Miami Beach, Miami-Dade County, Florida 33179
CBRE File No. 07-397MI-015
Client Reference No. 000500
1572 NE 191st Street
North Miami Beach, Miami-Dade County, Florida 33179
CBRE File No. 07-397MI-015
Client Reference No. 000500
 | Self Contained Appraisal Report |
Prepared for:
Myles Diamond
AVP/Senior Analyst
CAPMARK FINANCE, INC.
116 Welsh Road
Horsham, PA 19044
AVP/Senior Analyst
CAPMARK FINANCE, INC.
116 Welsh Road
Horsham, PA 19044
| VALUATION & ADVISORY SERVICES |  |

Table of Contents
VALUATION & ADVISORY SERVICES

777 Brickell Avenue, Suite 910
Miami, FL 33131
Miami, FL 33131
T (305) 381-6449
F (305) 381-6441
F (305) 381-6441
www.cbre.com
July 19, 2007
Myles Diamond
AVP/Senior Analyst
CAPMARK FINANCE, INC.
116 Welsh Road
Horsham, PA 19044
AVP/Senior Analyst
CAPMARK FINANCE, INC.
116 Welsh Road
Horsham, PA 19044
| RE: | Appraisal of Presidential House | |
| 1572 NE 191st Street | ||
| North Miami Beach, Miami-Dade County, Florida | ||
| CBRE File No 07-397MI-015 | ||
| Client Reference No 000500 |
Dear Mr. Diamond:
At your request and authorization, CB Richard Ellis (CBRE) has prepared an appraisal of the market value of the referenced property. Our analysis is presented in the following Self Contained Appraisal Report.
The subject is a 203-unit mid-rise style, apartment property located at 1572 NE 191st Street in North Miami Beach, Miami-Dade County, Florida. It was built in 1966 and is situated on a 5.790-acre site. Currently the facility is 94.6% occupied and is considered to be in average condition. It is considered to be a Class C property in this market. The subject is more fully described, legally and physically, within the enclosed report.
Based on the analysis contained in the following report, the market value of the subject is concluded as follows:
MARKET VALUE CONCLUSION
| Appraisal Premise | Interest Appraised | Date of Value | Value Conclusion | |||||||
| As Is | Fee Simple Estate | July 17, 2007 | $ | 17,600,000 | ||||||
| Compiled by CBRE | ||
Data, information, and calculations leading to the value conclusion are incorporated in the report following this letter. The report, in its entirety, including all assumptions and limiting conditions, is an integral part of, and inseparable from, this letter.
©2007 CB Richard Ellis, Inc.
Table of Contents
Myles Diamond
July 19, 2007
Page 2
July 19, 2007
Page 2
The following appraisal sets forth the most pertinent data gathered, the techniques employed, and the reasoning leading to the opinion of value. The analyses, opinions and conclusions were developed based on, and this report has been prepared in conformance with, our interpretation of the guidelines and recommendations set forth in the Uniform Standards of Professional Appraisal Practice (USPAP), the requirements of the Code of Professional Ethics and Standards of Professional Appraisal Practice of the Appraisal Institute, the Financial Institutions Reform, Recovery, and Enforcement Act of 1989 (FIRREA), Title XI Regulations and FNMA underwriting guidelines.
The report is for the sole use of the client; however, client may provide only complete, final copies of the appraisal report in its entirety (but not component parts) to third parties who shall review such reports in connection with loan underwriting or securitization efforts. Appraiser is not required to explain or testify as to appraisal results other than to respond to the client for routine and customary questions. Please note that our consent to allow an appraisal report prepared by CBRE or portions of such report, to become part of or be referenced in any public offering, the granting of such consent will be at our sole discretion and, if given, will be on condition that we will be provided with an Indemnification Agreement and/or Non-Reliance letter, in a form and content satisfactory to us, by a party satisfactory to us. We do consent to your submission of the reports to rating agencies, loan participants or your auditors in its entirety (but not component parts) without the need to provide us with an Indemnification Agreement and/or Non-Reliance letter.
CBRE hereby expressly granted to Client the right to copy this report and distribute it to other parties in the transaction for which this report has been prepared, including employees of Client, other lenders in the transaction, and the borrower, if any. It has been a pleasure to assist you in this assignment. If you have any questions concerning the analysis, or if CBRE can be of further service, please contact us.
Respectfully submitted,
CBRE - VALUATION & ADVISORY SERVICES
 |  | |
| Buddy R. Urban, MAI | James. E. Agner, MAI | |
| Vice President/Multi-family Specialist | Managing Director | |
| St. Cert. Gen. REA RZ2815 | St. Cert. Gen. REA RZ382 | |
| Phone: (305) 381-6449 | Phone: (305) 381-6480 | |
| Fax: (305) 381-6441 | Fax: (305) 381-6441 | |
| Email: buddy.urban@cbre.com | Email: james.agner@cbre.com |
©2007 CB Richard Ellis, Inc.
Table of Contents
| PRESIDENTIAL HOUSE | CERTIFICATION OF THE APPRAISAL |
CERTIFICATION OF THE APPRAISAL
We certify to the best of our knowledge and belief:
| 1. | The statements of fact contained in this report are true and correct. | |
| 2. | The reported analyses, opinions, and conclusions are limited only by the reported assumptions and limiting conditions and are our personal, impartial and unbiased professional analyses, opinions, and conclusions. | |
| 3. | We have no present or prospective interest in or bias with respect to the property that is the subject of this report and have no personal interest in or bias with respect to the parties involved with this assignment. | |
| 4. | Our engagement in this assignment was not contingent upon developing or reporting predetermined results. | |
| 5. | Our compensation for completing this assignment is not contingent upon the development or reporting of a predetermined value or direction in value that favors the cause of the client, the amount of the value opinion, the attainment of a stipulated result, or the occurrence of a subsequent event directly related to the intended use of this appraisal. | |
| 6. | This appraisal assignment was not based upon a requested minimum valuation, a specific valuation, or the approval of a loan. | |
| 7. | Our analyses, opinions, and conclusions were developed, and this report has been prepared, in conformity with the Uniform Standards of Professional Appraisal, as well as the requirements of the State of Florida. | |
| 8. | The reported analyses, opinions, and conclusions were developed, and this report has been prepared, in conformity with the requirements of the Code of Professional Ethics and the Standards of Professional Appraisal Practice of the Appraisal Institute, which include the Uniform Standards of Professional Appraisal Practice. | |
| 9. | The use of this report is subject to the requirements of the Appraisal Institute relating to review by its duly authorized representatives. | |
| 10. | As of the date of this report, Buddy R. Urban, MAI and James. E. Agner, MAI have completed the continuing education program of the Appraisal Institute. | |
| 11. | Buddy R. Urban, MAI has and James. E. Agner, MAI has not made a personal inspection of the property that is the subject of this report. | |
| 12. | Donna Urban provided significant real property appraisal assistance to the persons signing this report. | |
| 13. | Valuation & Advisory Services operates as an independent economic entity within CBRE. Although employees of other CBRE divisions may be contacted as a part of our routine market research investigations, absolute client confidentiality and privacy are maintained at all times with regard to this assignment without conflict of interest. |
| | |
| Buddy R. Urban, MAI | James. E. Agner, MAI | |
| St. Cert. Gen. REA RZ2815 | St. Cert. Gen. REA RZ382 |
©2007 CB Richard Ellis, Inc.
i
Table of Contents
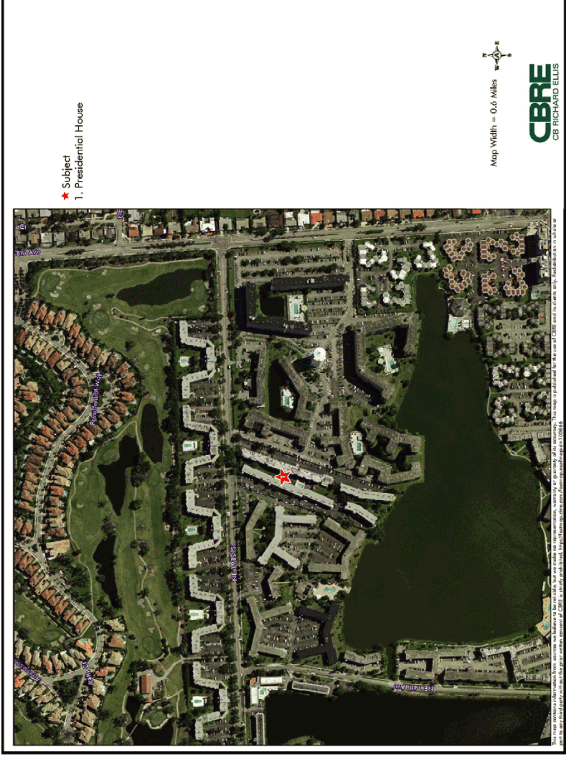
Table of Contents
| PRESIDENTIAL HOUSE | SUBJECT PHOTOGRAPHS |
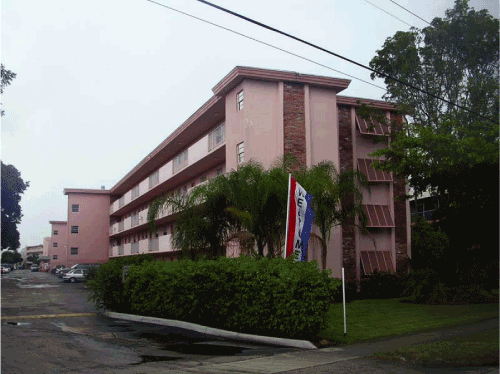
TYPICAL VIEW OF THE SUBJECT

TYPICAL VIEW OF THE SUBJECT LEASING OFFICE
©2007 CB Richard Ellis, Inc.
iii
Table of Contents
| PRESIDENTIAL HOUSE | SUBJECT PHOTOGRAPHS |
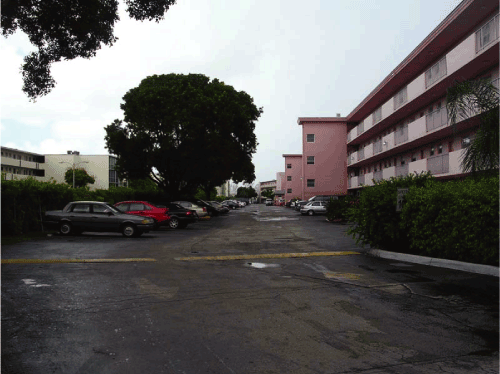
VIEW OF THE PARKING AREA
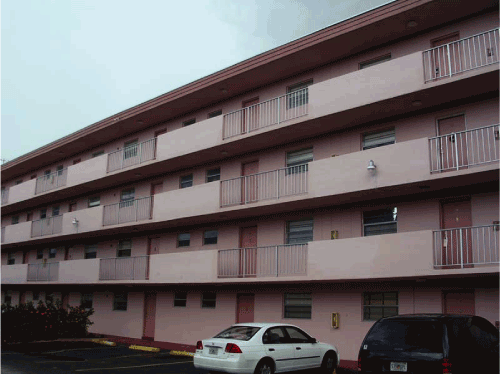
VIEW OF A TYPICAL BUILDING ELEVATION
©2007 CB Richard Ellis, Inc.
iv
Table of Contents
| PRESIDENTIAL HOUSE | SUBJECT PHOTOGRAPHS |
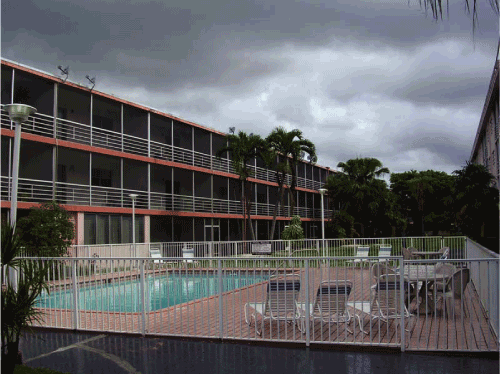
VIEW OF THE POOL AND DECK AREA
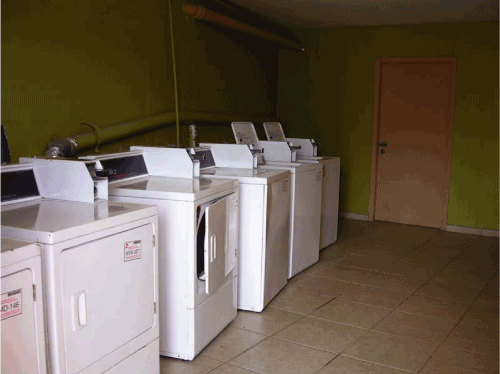
VIEW OF A TYPICAL LAUNDRY ROOM
©2007 CB Richard Ellis, Inc.
v
Table of Contents
| PRESIDENTIAL HOUSE | SUBJECT PHOTOGRAPHS |
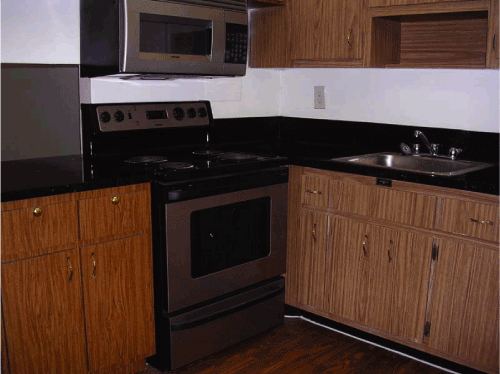
VIEW OF AN UPGRADED KITCHEN INTERIOR
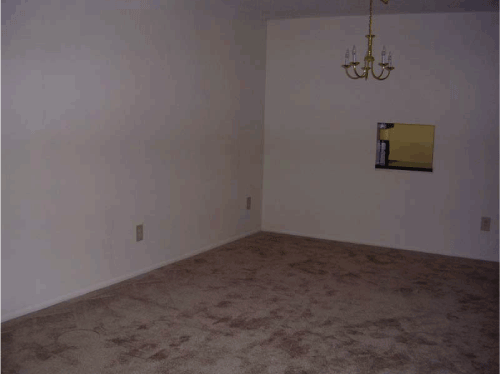
VIEW OF A TYPICAL LIVING ROOM AND DINING ROOM
©2007 CB Richard Ellis, Inc.
vi
Table of Contents
| PRESIDENTIAL HOUSE | SUBJECT PHOTOGRAPHS |
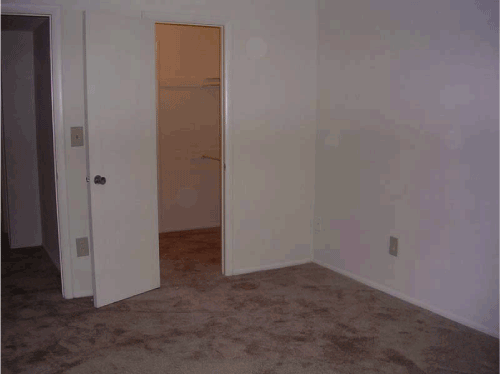
VIEW OF A TYPICAL BEDROOM
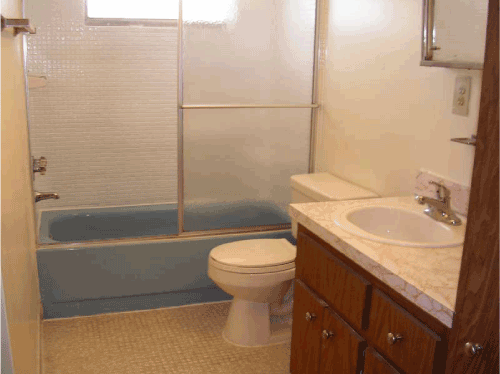
VIEW OF A TYPICAL BATHROOM
©2007 CB Richard Ellis, Inc.
vii
Table of Contents
| PRESIDENTIAL HOUSE | SUBJECT PHOTOGRAPHS |
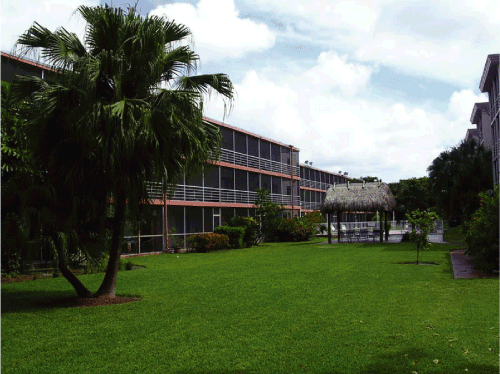
VIEW OF THE COURTYARD BETWEEN BUILDINGS
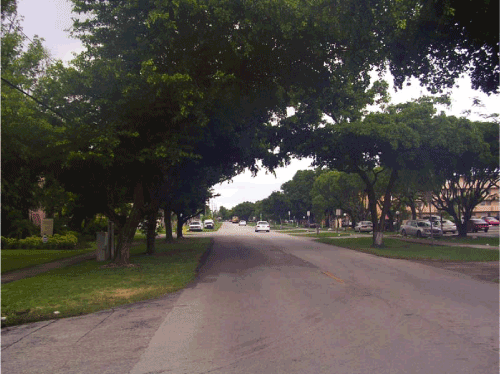
VIEW OF THE NE 191ST STREET FRONTAGE, LOOKING WEST
©2007 CB Richard Ellis, Inc.
viii
Table of Contents
| PRESIDENTIAL HOUSE | SUMMARY OF SALIENT FACTS |
SUMMARY OF SALIENT FACTS
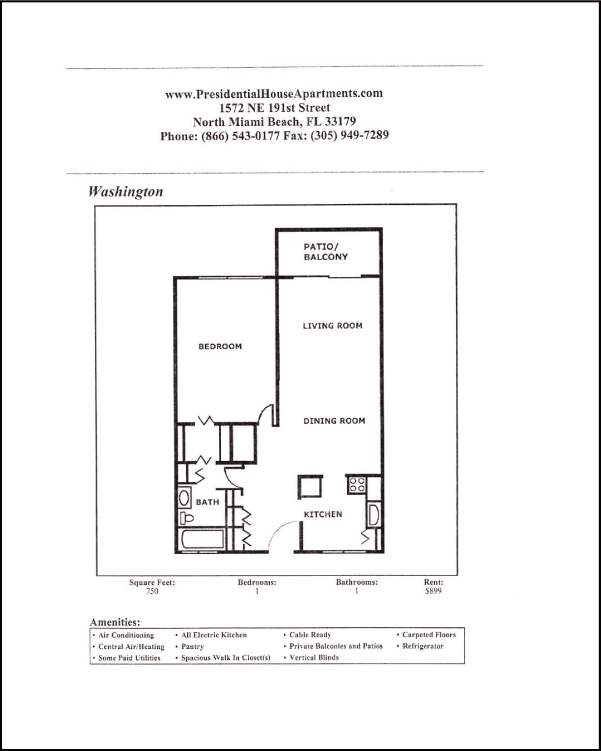
Property Name | Presidential House | |
Location | 1572 NE 191st Street, North Miami Beach, Miami- Dade County, Florida 33179 | |
Client Reference Number | 000500 | |
Assessor’s Parcel Number | 30-2205-000-0235 | |
Highest and Best Use | ||
| As Vacant | Multi-family Residential | |
| As Improved | Multi-family Residential | |
Property Rights Appraised | Fee Simple Estate | |
Land Area | 5.79 AC 252,212 SF | |
Improvements | ||
| Property Type | Apartment (Multi-family Mid/High Rise) | |
| Number of Buildings | 4 | |
| Number of Stories | 3 & 4 | |
| Gross Building Area | 184,650 SF | |
| Net Rentable Area | 183,150 SF | |
| Number of Units | 203 | |
| Average Unit Size | 902 SF | |
| Year Built | 1966 | |
| Condition | Average | |
Estimated Exposure Time | 9 Months | |
Financial Indicators | ||
| Current Occupancy | 94.6% | |
| Stabilized Occupancy | 95.0% | |
| Stabilized Credit Loss | 2.0% | |
| Overall Capitalization Rate | 6.00% | |
| Discount Rate | 8.25% | |
| Terminal Capitalization Rate | 6.50% |
| Pro Forma Operating Data | Total | Per Unit | ||||||
| Effective Gross Income | $ | 2,309,636 | $ | 11,378 | ||||
| Operating Expenses | $ | 1,254,536 | $ | 6,180 | ||||
| Expense Ratio | 54.32 | % | ||||||
| Net Operating Income | $ | 1,055,100 | $ | 5,198 | ||||
©2007 CB Richard Ellis, Inc.
ix
Table of Contents
| PRESIDENTIAL HOUSE | SUMMARY OF SALIENT FACTS |
| VALUATION | Total | Per Unit | ||||||
| Land Value | $ | 4,700,000 | $ | 23,153 | ||||
| Cost Approach | $ | 17,600,000 | $ | 86,700 | ||||
| Sales Comparison Approach | $ | 17,600,000 | $ | 86,700 | ||||
| Income Capitalization Approach | $ | 17,600,000 | $ | 86,700 | ||||
| Insurable Value | $ | 14,410,000 | $ | 70,985 | ||||
CONCLUDED MARKET VALUE
| Appraisal Premise | Interest Appraised | Date of Value | Value | |||||||
| As Is | Fee Simple Estate | July 17, 2007 | $ | 17,600,000 | ||||||
| Compiled by CBRE | ||
EXTRAORDINARY ASSUMPTIONS & HYPOTHETICAL CONDITIONS
None noted.
©2007 CB Richard Ellis, Inc.
x
| PRESIDENTIAL HOUSE | TABLE OF CONTENTS |
TABLE OF CONTENTS
| i | ||||
| ii | ||||
| ix | ||||
| xi | ||||
| 1 | ||||
| 5 | ||||
| 8 | ||||
| 12 | ||||
| 28 | ||||
| 34 | ||||
| 39 | ||||
| 41 | ||||
| 45 | ||||
| 48 | ||||
| 49 | ||||
| 54 | ||||
| 58 | ||||
| 60 | ||||
| 66 | ||||
| 93 | ||||
| 94 | ||||
© 2007 CB Richard Ellis, Inc.
xi
Table of Contents
| PRESIDENTIAL HOUSE | INTRODUCTION |
INTRODUCTION
PROPERTY IDENTIFICATION
The subject is a 203-unit garden-style, apartment property located at 1572 NE 191st Street in North Miami Beach. It was built in 1966 and is situated on a 5.790-acre site. Currently the facility is 94.6% occupied and is considered to be in average condition. It is considered to be a Class C property in this market. The subject is more fully described, legally and physically, within the enclosed report.
OWNERSHIP AND PROPERTY HISTORY
Title to the property is currently vested in the name of AIMCO, who acquired title to the property in October 1984, as improved for $7,300,000, cash, as recorded in Book 12306, Page 1871 of the Miami-Dade County Deed Records. This most recent sale transaction of the subject was intended to be an arm’s length transaction.
To the best of our knowledge, there has been no other ownership transfer of the property during the previous three years.
PREMISE OF THE APPRAISAL/RELEVANT DATES
The following table illustrates the various dates associated with the valuation of the subject and the valuation premise(s):
PREMISE OF THE APPRAISAL/RELEVANT DATES
| Date of Report: | July 19, 2007 | |||
| Date of Inspection: | July 17, 2007 | |||
| Date of Value | ||||
| As Is: | July 17, 2007 | |||
| Compiled by CBRE | ||
TERMS AND DEFINITIONS
The current economic definition agreed upon by agencies that regulate federal financial institutions in the U.S. (and used herein) is as follows:
The most probable price which a property should bring in a competitive and open market under all conditions requisite to a fair sale, the buyer and seller each acting prudently and knowledgeably, and assuming the price is not affected by undue stimulus. Implicit in this definition is the consummation of a sale as of a specified date and the passing of title from seller to buyer under conditions whereby:
©2007 CB Richard Ellis, Inc.
1
Table of Contents
| PRESIDENTIAL HOUSE | INTRODUCTION |
| 1. | buyer and seller are typically motivated; | ||
| 2. | both parties are well informed or well advised, and acting in what they consider their own best interests; | ||
| 3. | a reasonable time is allowed for exposure in the open market; | ||
| 4. | payment is made in terms of cash in U.S. dollars or in terms of financial arrangements comparable thereto; and | ||
| 5. | the price represents the normal consideration for the property sold unaffected by special or creative financing or sales concessions granted by anyone associated with the sale.1 |
The Glossary of Terms in the addenda provides definitions for additional terms that are, and may be used in this appraisal.
INTENDED USE AND USER OF REPORT
This appraisal is to be used by the client for mortgage underwriting purposes.
SCOPE OF WORK
The scope of the assignment relates to the extent and manner in which research is conducted, data is gathered and analysis is applied, all based upon the following problem-identifying factors stated elsewhere in this report:
| • | Client | ||
| • | Intended use | ||
| �� | Intended user | ||
| • | Type of opinion | ||
| • | Effective date of opinion | ||
| • | Relevant characteristics about the subject | ||
| • | Assignment conditions |
This appraisal of the subject has been presented in the form of a Self-Contained Appraisal Report, which is intended to comply with the reporting requirements set forth under Standards Rule 2-2(a) of USPAP. That is, this report incorporates, to the fullest extent possible, practical explanation of the data, reasoning and analysis that were used to develop the opinion of value. This report also includes thorough descriptions of the subject and the market for the property type. CBRE completed the following steps for this assignment:
Extent to Which the Property is Identified
CBRE collected the relevant information about the subject from the owner (or representatives), public records and through an inspection of the subject. The property was legally identified through its
| 1 | Office of Comptroller of the Currency (OCC), 12 CFR Part 34, Subpart C – Appraisals, 34.42 (g); Office of Thrift Supervision (OTS), 12 CFR 564.2 (g); Appraisal Institute,The Dictionary of Real Estate Appraisal, 4th ed. (Chicago: Appraisal Institute, 2002), 177-178. This is also compatible with the RTC, FDIC, FRS and NCUA definitions of market value as well as the example referenced in theUniform Standards of Professional Appraisal Practice (USPAP). |
© 2007 CB Richard Ellis, Inc.
2
Table of Contents
| PRESIDENTIAL HOUSE | INTRODUCTION |
postal address, assessor’s records and legal description. Economic characteristics of the subject were identified via a recent rent roll, and historical operating statements.
Extent to Which the Property is Inspected
CBRE inspected both the interior and exterior of the subject, as well as its surrounding environs on the effective date of appraisal.
Type and Extent of the Data Researched
CBRE reviewed the micro and/or macro market environments with respect to physical and economic factors relevant to the valuation process. This process included interviews with regional and/or local market participants, available published data, and other various resources. CBRE also conducted regional and/or local research with respect to applicable tax data, zoning requirements, flood zone status, demographics, income and expense data, and comparable listing, sale and rental information.
Type and Extent of Analysis Applied
CBRE analyzed the data gathered through the use of appropriate and accepted appraisal methodology to arrive at a probable value indication via each applicable approach to value. Approaches to value used include the Cost Approach, Sales Comparison Approach and Income Approach. The steps required to complete each approach are discussed in the methodology section. CBRE then correlated and reconciled the results into a reasonable and defensible value conclusion, as defined herein. A reasonable exposure time and marketing time associated with the value estimate presented has also been concluded.
SPECIAL APPRAISAL INSTRUCTIONS
There have been no special appraisal instructions for this assignment.
EXPOSURE/MARKETING TIME
Current appraisal guidelines require an estimate of a reasonable time period in which the subject could be brought to market and sold. This reasonable time frame can either be examined historically or prospectively. In a historical analysis, this is referred to as exposure time. Exposure time always precedes the date of value, with the underlying premise being the time a property would have been on the market prior to the date of value, such that it would sell at its appraised value as of the date of value. On a prospective basis, the term marketing time is most often used. The exposure/marketing time is a function of price, time, and use. It is not an isolated estimate of time alone. In consideration of these factors, we have analyzed the following:
| • | exposure periods for comparable sales used in this appraisal; | ||
| • | marketing time information from the CBRENational Investor Survey; and |
©2007 CB Richard Ellis, Inc.
3
Table of Contents
| PRESIDENTIAL HOUSE | INTRODUCTION |
| • | the opinions of market participants. |
The following table presents the information derived from these sources.
EXPOSURE TIME INFORMATION
| Exposure Time (Months) | ||||||||
| Investment Type | Range | Average | ||||||
| CBRE Apartments | ||||||||
| Class A | 1.0 - 9.0 | 4.1 | ||||||
| Class B | 1.0 - 6.0 | 3.7 | ||||||
| Class C | 3.0 - 12.0 | 7.2 | ||||||
Korpacz Apartment | ||||||||
| National Data | 1.0 - 12.0 | 5.7 | ||||||
| Local Market Professionals | 6.0 - 12.0 | 9.0 | ||||||
CBRE Estimate | 9 Months | |||||||
| Source: CBRE National Investor Survey & Korpacz Real Estate Investor Survey | ||
In general, the improved sales indicate exposure times in the upper portion of the range indicated by the investor survey. In addition to the sales and survey data, we have also reviewed the assumptions and conclusions reached, particularly the income estimates and rates of return and there potential impact on exposure/marketing time. Based on these analyses, we have concluded an exposure/marketing time of 9 months or less would be considered reasonable for the subject.
This exposure/marketing time reflects current economic conditions, current real estate investment market conditions, the terms and availability of financing for real estate acquisitions, and property and market-specific factors. It assumes that the subject is (or has been) actively and professionally marketed. The marketing/exposure time would apply to all valuation premises included in this report.
©2007 CB Richard Ellis, Inc.
4
Table of Contents
| PRESIDENTIAL HOUSE | AREA ANALYSIS |
AREA ANALYSIS
Economy.com provides the following Miami metro area economic summary as of March 2007. The full Economy.com report is presented in the Addenda.
MIAMI ECONOMIC ANALYSIS
| Indicators | 1999 | 2000 | 2001 | 2002 | 2003 | 2004 | 2005 | 2006 | 2007 | 2008 | 2009 | 2010 | ||||||||||||||||||||||||||||||||||||
| Gross Metro Product, C$B | 71.5 | 73.7 | 74.1 | 76.9 | 79.9 | 84.1 | 87.1 | 88.9 | 91.3 | 93.9 | 96.5 | 99.2 | ||||||||||||||||||||||||||||||||||||
| % Change | 3.3 | 3.1 | 0.6 | 3.7 | 4.0 | 5.2 | 3.5 | 2.1 | 2.8 | 2.7 | 2.8 | 2.8 | ||||||||||||||||||||||||||||||||||||
| Total Employment (000) | 996.3 | 1,008.5 | 991.3 | 984.3 | 1,005.8 | 1,029.9 | 1,047.4 | 1,063.5 | 1,075.8 | 1,090.2 | 1,106.2 | 1,122.6 | ||||||||||||||||||||||||||||||||||||
| % Change | 2.7 | 1.2 | -1.7 | -0.7 | 2.2 | 2.4 | 1.7 | 1.5 | 1.2 | 1.3 | 1.5 | 1.5 | ||||||||||||||||||||||||||||||||||||
| Unemployment Rate | 5.1 | 6.0 | 6.5 | 5.9 | 5.5 | 4.4 | 3.8 | 3.5 | 3.5 | 3.5 | 3.5 | 3.5 | ||||||||||||||||||||||||||||||||||||
| Personal Income Growth | 8.4 | 4.3 | 3.7 | 3.8 | 8.3 | 5.5 | 6.9 | 6.5 | 4.6 | 4.6 | 4.9 | 5.2 | ||||||||||||||||||||||||||||||||||||
| Population (000) | 2,260.5 | 2,287.3 | 2,315.2 | 2,334.1 | 2,356.2 | 2,373.1 | 2,402.8 | 2,432.7 | 2,460.3 | 2,490.3 | 2,524.0 | 2,563.3 | ||||||||||||||||||||||||||||||||||||
| Single-Family Permits | 5,998 | 6,828 | 6,374 | 8,740 | 9,603 | 9,922 | 6,910 | 5,811 | 6,378 | 6,556 | 6,723 | 6,899 | ||||||||||||||||||||||||||||||||||||
| Multifamily Permits | 6,477 | 7,168 | 8,232 | 6,793 | 13,253 | 16,198 | 14,071 | 8,754 | 9,295 | 9,732 | 10,178 | 10,536 | ||||||||||||||||||||||||||||||||||||
| Existing Home Price ($Ths) | 138.2 | 159.5 | 184.3 | 221.2 | 271.8 | 349.9 | 375.3 | 360.8 | 357.6 | 365.8 | 375.2 | 384.5 | ||||||||||||||||||||||||||||||||||||
| Mortgage Originations ($Mil) | 8,131 | 13,801 | 18,319 | 28,675 | 27,761 | 36,356 | 30,442 | 29,612 | 26,475 | 26,935 | 27,534 | 27,980 | ||||||||||||||||||||||||||||||||||||
| Net Migration (000) | 24.8 | 12.0 | 12.5 | 3.5 | 8.1 | 2.5 | 14.2 | 14.3 | 11.7 | 13.9 | 17.4 | 22.6 | ||||||||||||||||||||||||||||||||||||
| Personal Bankruptcies | 12,446 | 14,447 | 14,607 | 14,487 | 12,604 | 16,579 | 8,020 | 9,629 | 10,465 | 11,617 | 12,773 | 13,487 | ||||||||||||||||||||||||||||||||||||
| Source: Economy.com | ||
©2007 CB Richard Ellis, Inc.
5
Table of Contents
| PRESIDENTIAL HOUSE | AREA ANALYSIS |
RECENT PERFORMANCE
Miami’s economy is expanding at a moderate but stable pace. Unlike most other Florida metro areas, Miami’s growth did not slow significantly over the past year; job growth no longer lags behind the heretofore surging Ft. Lauderdale and West Palm Beach areas, due in part to more stable construction employment. Miami is now only growing marginally slower than the state, the remaining gap being accounted for by slower population growth.
Benchmark revisions marked stronger construction job growth through mid-2006 in Miami, although it did falter in recent months. Miami’s financial services industry, which boomed in 2006, provides some support for the labor market in the wake of the construction downturn. This, too, may falter as mortgage lending eases, but labor markets remain decidedly tight with a jobless rate below 3.5%, the lowest on record.
Other indicators, however, show some weaknesses emerging. Household credit quality is deteriorating rapidly, residential construction permits have fallen by nearly half over the past year, and the area’s hotel occupancy rate is down from a mid-2006 peak.
HOUSING
The construction boom will peter out later in the year, and while an outright bust may not occur, housing-related activity and house prices will continue to sag until the accumulated excesses have been worked off. Miami is running behind the rest of the state in the housing cycle; the metro division’s housing markets are faring better than in many other parts of the state. There are still no signs of a trend decline in home prices in the metro division. The median house price for existing homes hit a trough last fall but has rebounded since and even hit a record high in January according to the Florida Association of Realtors. But all is not well. Home sales have been sagging since the spring of 2006 and saw a further drop in the first two months of this year. The buildup of inventory of unsold homes has reached dizzying heights and, if unleashed on the market, will no doubt cause prices to drop. This inventory is already discouraging new construction as indicated by the fall-off in permits.
TOURISM
Buoyant tourism and business travel benefit the area’s hotel industry with high utilization rates in the form of rapid room rate growth and record-high revenue per room. Miami’s tourism industry saw a near-record number of visitors in 2006. Added capacity and softening visitor numbers are, however, chipping away at utilization rates. A weakened dollar keeps international visitation strong, but the weaker U.S. economy will slow domestic visitors, making the coming year somewhat leaner for the industry.
©2007 CB Richard Ellis, Inc.
6
Table of Contents
| PRESIDENTIAL HOUSE | AREA ANALYSIS |
POPULATION
Miami’s population growth remained stable in 2006 in contrast to sharp decelerations elsewhere in southeast Florida. The rate of growth is broadly in line with the nation, but considerably slower than fast-growing Florida, reflecting that Miami is nearly fully built and faces constraints, such as a shortage of land, which dampens the feasible pace of expansion. Traditional migration patterns persist: net international in-migration exceeds net domestic out-migration, resulting in a small net positive total. Miami serves as an immigration hub, with a younger age structure, but many immigrants subsequently resettle elsewhere.
CONCLUSION
Miami’s near-term outlook is for a slight moderation of growth, due to a slowdown in construction and housing-related industries. It will likely take longer for the housing correction to work itself through in Miami than in other Florida metro areas, as the metro division’s demographic fundamentals are weaker than the rest of the state. Demographics will also hamper the long-term growth prospects of the metro division, resulting in moderate long-term growth performance.
©2007 CB Richard Ellis, Inc.
7
Table of Contents
| PRESIDENTIAL HOUSE | NEIGHBORHOOD ANALYSIS |
NEIGHBORHOOD ANALYSIS
LOCATION
The subject is in the city of North Miami Beach and is considered a suburban location. The city of North Miami Beach is situated in northeast Miami-Dade County, about 12 miles north of the Miami Central Business District.
BOUNDARIES
The neighborhood boundaries are detailed as follows:
| North: | Ives Dairy Road | |||
| South: | NE 135thStreet | |||
| East: | Biscayne Boulevard | |||
| West: | Interstate 95 |
LAND USE
Land uses within the subject neighborhood consist of a harmonious mixture of commercial and residential development. The immediate area surrounding the subject is an older area of development, consisting primarily of residential uses with much of the development being built during the 190s through 1979. The majority of the single-family residential development within a one mile
©2007 CB Richard Ellis, Inc.
8
Table of Contents
| PRESIDENTIAL HOUSE | NEIGHBORHOOD ANALYSIS |
radius of the subject range in the $150,000-$300,000 price range. According to demographic data over 74% of the homes built within a three-mile radius of the subject were constructed between 1940s and 1979. The average home value within a three-mile radius is about $194,308. The Presidential Golf Course is located just north of the subject and the Aventura Mall, a large regional shopping facility is located approximately 11/2 miles east of the subject.
ACCESS
Access to the City of North Miami Beach and the overall subject area is primarily provided via Interstate 95, Biscayne Boulevard (U.S. Highway No. 1), Miami Gardens, NW/NE 135th Street, and West Dixie Highway. Interstate 95 is the major north/south expressway providing direct access to the southeastern and northeastern areas of Miami-Dade County, as well as Broward County to the north and is within 2 miles east of the subject neighborhood. Biscayne Boulevard (U.S. Highway No. 1) reflects a well-traveled artery providing northerly/southerly access from SE 3rd street at the south to the Broward County line at the north. Miami Gardens and NW/NE 135th Street provide east/west access.
In addition, the Palmetto Expressway (State Road No. 826) and the Ronald Reagan Turnpike interchange located approximately 3 miles southwest of the subject area at the Golden Glades Exchange reflect major thoroughfares within the overall Miami-Dade County area. Furthermore, the subject neighborhood is located within proximity to the Atlantic Ocean/beach, with good accessibility, as well as view/exposure characteristics afforded many high-rise properties. Overall, access to and throughout the subject neighborhood is considered good.
DEMOGRAPHICS
Selected neighborhood demographics in a one-, three-, and five-mile radius from the subject are shown in the following table:
©2007 CB Richard Ellis, Inc.
9
Table of Contents
| PRESIDENTIAL HOUSE | NEIGHBORHOOD ANALYSIS |
SELECTED NEIGHBORHOOD DEMOGRAPHICS
| 1560 NE 191st Street | Radius 1.0 | Radius 3.0 | Radius 5.0 | |||||||||
| Miami, FL | Mile | Mile | Mile | |||||||||
| Population | ||||||||||||
| 2012 Population | 21,667 | 197,186 | 453,470 | |||||||||
| 2007 Population | 20,991 | 189,936 | 439,128 | |||||||||
| 2000 Population | 20,099 | 181,818 | 424,032 | |||||||||
| 1990 Population | 16,973 | 149,287 | 362,564 | |||||||||
| Annual Growth 2007 - 2012 | 0.64 | % | 0.75 | % | 0.64 | % | ||||||
| Annual Growth 2000 - 2007 | 0.62 | % | 0.63 | % | 0.50 | % | ||||||
| Annual Growth 1990 - 2000 | 1.70 | % | 1.99 | % | 1.58 | % | ||||||
| Households | ||||||||||||
| 2012 Households | 8,885 | 77,896 | 175,179 | |||||||||
| 2007 Households | 8,570 | 75,041 | 170,889 | |||||||||
| 2000 Households | 8,168 | 71,968 | 167,389 | |||||||||
| 1990 Households | 7,831 | 64,339 | 154,336 | |||||||||
| Annual Growth 2007 - 2012 | 0.72 | % | 0.75 | % | 0.50 | % | ||||||
| Annual Growth 2000 - 2007 | 0.69 | % | 0.60 | % | 0.30 | % | ||||||
| Annual Growth 1990 - 2000 | 0.42 | % | 1.13 | % | 0.82 | % | ||||||
| Income | ||||||||||||
| 2007 Median HH Inc | $ | 37,290 | $ | 37,534 | $ | 37,598 | ||||||
| 2007 Estimated Average Household Income | $ | 51,128 | $ | 55,530 | $ | 53,843 | ||||||
| 2007 Estimated Per Capita Income | $ | 21,162 | $ | 22,066 | $ | 21,146 | ||||||
| Age 25+ College Graduates - 2000 | 3,083 | 26,353 | 57,920 | |||||||||
| Age 25+ Percent College Graduates - 2007 | 20.9 | % | 20.4 | % | 19.6 | % | ||||||
| Source: CBRE | ||
GROWTH AND TRENDS
The preceding table indicates the subject area to be experiencing nominal increases in population and households. During the past seven years, population has increased at overall rates of 0.62%, - -0.63% and 0.50% within the one, three and five-mile radius, respectively, while the households have decreased 0.69%, 0.60% and 0.30% within the one, three and five-mile radius. In addition, population and households are projected to exhibit similar population/household formation patterns over the next five years. Nominal changes in population and household formation reflect the built-up nature of the neighborhood.
As is typical of older, built-up areas, new development comes at the expense of razing older developments from a site. A prime example of this is Land Sale Three discussed in the Land Valuation section. This tract is currently improved with an older mobile home park, but has recently been acquired for re-development into a garden style multi-family complex. The new development plans
© 2007 CB Richard Ellis, Inc.
10
Table of Contents
| PRESIDENTIAL HOUSE | NEIGHBORHOOD ANALYSIS |
received an “up-zoning” from the City whereby the density will be allowed to increase from 12.9 units per acre to 25.4 units per acre. Also benefiting the neighborhood is the revitalization of the northern portion of the Biscayne Corridor. Biscayne Boulevard is located about one-mile east of the subject and over the past two years has seen resurgence in retail centers, office buildings, condominiums and entertainment venues. Again, all of the newer development is replacing older properties, or represents a repositioning of older properties, similar to the repositioning plans for the subject.
CONCLUSION
In summary, the subject neighborhood is a desirable business and residential location that is reflected in the average quality of the building improvements. Neighborhood improvements are relatively old, but the existing improvements are in average condition. Overall, it is our opinion that the subject neighborhood will continue to remain a desirable area and will experience additional new redevelopment over the next decade, with good potential for property appreciation.
©2007 CB Richard Ellis, Inc.
11
Table of Contents
| PRESIDENTIAL HOUSE | MARKET ANALYSIS |
MARKET ANALYSIS
The market analysis forms a basis for assessing market area boundaries, supply and demand factors, and indications of financial feasibility. Primary data sources utilized for this analysis includes Reinhold Wolff.
The subject is located in the North Miami Beach submarket and is considered a Class C, mid-rise apartment complex. According to the Institute of Real Estate Management (viaIncome/Expense Analysis: Conventional Apartments 2003), the following property definitions may be applicable towards the subject property:
High Rise Elevator Projects:This group is confined to elevator buildings, which are four stories or more in height.
Low-Rise Projects (25 units or more):Includes walk-up buildings and elevator buildings 3 stories or less.
DEMOGRAPHIC ANALYSIS
Demand for additional residential property is a direct function of population change. Multi-family communities are products of a clearly definable demand relating directly to population shifts.
Housing, Population and Household Formation
The following table illustrates the population and household changes for the subject neighborhood.
POPULATION AND HOUSEHOLD PROJECTIONS
| Radius 1.0 | Radius 3.0 | Radius 5.0 | ||||||||||
| Mile | Mile | Mile | ||||||||||
| Population | ||||||||||||
| 2012 Population | 21,667 | 197,186 | 453,470 | |||||||||
| 2007 Population | 20,991 | 189,936 | 439,128 | |||||||||
| 2000 Population | 20,099 | 181,818 | 424,032 | |||||||||
| 1990 Population | 16,973 | 149,287 | 362,564 | |||||||||
| Annual Growth 2007 - 2012 | 0.64 | % | 0.75 | % | 0.64 | % | ||||||
| Annual Growth 2000 - 2007 | 0.62 | % | 0.63 | % | 0.50 | % | ||||||
| Annual Growth 1990 - 2000 | 1.70 | % | 1.99 | % | 1.58 | % | ||||||
| Households | ||||||||||||
| 2012 Households | 8,885 | 77,896 | 175,179 | |||||||||
| 2007 Households | 8,570 | 75,041 | 170,889 | |||||||||
| 2000 Households | 8,168 | 71,968 | 167,389 | |||||||||
| 1990 Households | 7,831 | 64,339 | 154,336 | |||||||||
| Annual Growth 2007 - 2012 | 0.72 | % | 0.75 | % | 0.50 | % | ||||||
| Annual Growth 2000 - 2007 | 0.69 | % | 0.60 | % | 0.30 | % | ||||||
| Annual Growth 1990 - 2000 | 0.42 | % | 1.13 | % | 0.82 | % | ||||||
| Source: CBRE | ||
©2007 CB Richard Ellis, Inc.
12
Table of Contents
| PRESIDENTIAL HOUSE | MARKET ANALYSIS |
Households represent a basic unit of demand in the housing market. According to the data, the subject’s neighborhood is experiencing virtually no change in both population and households. Increases in population and households are limited due to the built-up nature of the neighborhood.
Income Distributions
Household income available for expenditure on housing and other consumer items is a primary factor in determining the price/rent level of housing demand in a market area. In the case of this study, projections of household income, particularly for renters, identifies in gross terms the market from which the subject submarket draws. The following table illustrates estimated household income distribution for the subject neighborhood.
HOUSEHOLD INCOME DISTRIBUTION
| Radius 1.0 | Radius 3.0 | Radius 5.0 | ||||||||||
| Mile | Mile | Mile | ||||||||||
| Households by Income Distribution - 2007 | ||||||||||||
| Less than $15K | 20.15 | % | 18.99 | % | 18.63 | % | ||||||
| $15K - $25K | 14.19 | % | 14.79 | % | 14.59 | % | ||||||
| $25K - $35K | 12.71 | % | 13.07 | % | 13.54 | % | ||||||
| $35K - $50K | 18.20 | % | 17.06 | % | 16.84 | % | ||||||
| $50K - $75K | 17.21 | % | 16.73 | % | 17.04 | % | ||||||
| $75K - $100K | 7.47 | % | 7.65 | % | 8.17 | % | ||||||
| $100K - $150K | 5.83 | % | 6.40 | % | 6.74 | % | ||||||
| $150K - $250K | 2.89 | % | 3.23 | % | 2.78 | % | ||||||
| $250K - $500K | 0.99 | % | 1.28 | % | 1.01 | % | ||||||
| $500K or more | 0.34 | % | 0.79 | % | 0.64 | % | ||||||
| Source: CBRE | ||
The following table illustrates the median and average household income levels for the subject neighborhood.
HOUSEHOLD INCOME LEVELS
| Radius 1.0 | Radius 3.0 | Radius 5.0 | ||||||||||
| Mile | Mile | Mile | ||||||||||
| Income | ||||||||||||
| 2007 Median HH Inc | $ | 37,290 | $ | 37,534 | $ | 37,598 | ||||||
| 2007 Estimated Average Household Income | $ | 51,128 | $ | 55,530 | $ | 53,843 | ||||||
| 2007 Estimated Per Capita Income | $ | 21,162 | $ | 22,066 | $ | 21,146 | ||||||
| Source: CBRE | ||
An analysis of the income data indicates that the submarket is generally comprised of lower to middle-income economic cohort groups, which include the target groups to which the subject property is oriented.
©2007 CB Richard Ellis, Inc.
13
Table of Contents
| PRESIDENTIAL HOUSE | MARKET ANALYSIS |
Employment
An employment breakdown typically indicates the working class characteristics for a given market area. The specific employment population within the indicated radii of the subject is as follows:
EMPLOYMENT BY INDUSTRY
| Radius 1.0 | Radius 3.0 | Radius 5.0 | ||||||||||
| Mile | Mile | Mile | ||||||||||
| Occupation | ||||||||||||
| Agr/Frst/Fish/Hunt/Mine | 0.07 | % | 0.14 | % | 0.18 | % | ||||||
| Construction | 5.24 | % | 5.42 | % | 5.95 | % | ||||||
| Total Manufacturing | 6.34 | % | 5.47 | % | 5.66 | % | ||||||
| Wholesale Trade | 6.40 | % | 5.05 | % | 4.49 | % | ||||||
| Retail Trade | 15.41 | % | 14.97 | % | 13.80 | % | ||||||
| Transport/Warehse/Utils | 5.35 | % | 5.86 | % | 6.74 | % | ||||||
| Information | 2.66 | % | 2.90 | % | 3.00 | % | ||||||
| Fin/Insur/RE/Rent/Lse | 8.87 | % | 9.03 | % | 8.39 | % | ||||||
| Prof/Sci/Tech/Admin | 6.49 | % | 5.92 | % | 5.14 | % | ||||||
| Mgmt of Companies | 0.00 | % | 0.05 | % | 0.03 | % | ||||||
| Admin/Spprt/Waste Mgmt | 5.89 | % | 5.72 | % | 6.01 | % | ||||||
| Educational Svcs | 6.96 | % | 6.09 | % | 6.84 | % | ||||||
| Health Care/Soc Asst | 11.46 | % | 12.69 | % | 12.75 | % | ||||||
| Entertainment & Rec Services | 2.22 | % | 2.13 | % | 2.31 | % | ||||||
| Accommdtn/Food Svcs | 8.65 | % | 8.53 | % | 8.14 | % | ||||||
| Oth Svcs, Not Pub Admin | 5.55 | % | 5.76 | % | 5.83 | % | ||||||
| Public Administration | 2.44 | % | 4.24 | % | 4.73 | % | ||||||
| Source: CBRE | ||
The previous table illustrates the employment character of the submarket, indicating a predominantly lower to middle-income employment profile, with the majority of the population holding retail trade, manufacturing, health care and financial and real estate related jobs.
Outlook
Based on this analysis, the immediate area surrounding the subject property is projected to experience very little growth relative to households and population in the near future. Given the area demographics, it appears that demand for both comparable surrounding area apartment units and the subject property will continue to be favorable. New construction in the area is predominately condominiums, most of which have sold out prior to beginning construction. Others, not yet in the construction phase may not be developed, as the condo market has flattened significantly in the past year and development plans are likely to be put on hold at a number of planned projects.
The overall market is expected to experience a continuation of the operating environment that has existed recently and should remain stable. Further, while new construction is occurring in many sectors, overbuilding is not anticipated during the near term.
©2007 CB Richard Ellis, Inc.
14
Table of Contents
| PRESIDENTIAL HOUSE | MARKET ANALYSIS |
MARKET OVERVIEW
The following discussion illustrates some general observations in the surrounding apartment market. The Valuation and Advisory Services Group of CB Richard Ellis, Inc. publishes a National Investor Survey on a periodic basis. This issue, which is the seventeenth, contains responses from 50 investors covering 15 various properties type and three property classes. The three property types are defined as follows:
Class-A Property - Top quality, institutional-grade property, generally defined as properties in major metropolitan areas with values in excess of $10.0 million dollars that are characterized by strong credit tenancy.
Class-B Property- Average-quality, non-institutional-grade property with average credit tenancy. These properties are typically characterized by second tier locations within the market, or by lower quality of construction relative to Class A properties.
Class-C Property - Low-quality, developer/speculator-type property. Typically entails value-added scenarios, tenant leasing/absorption issues, pending capital expenditures, etc.
The subject is considered a Class C apartment building of non-institutional-grade quality. The respondents represent a cross section of the national real estate investment community.
Acquisition Focus
For acquisitions, investors are generally focusing on top-quality, investment-grade properties located in high-growth or development-constrained areas. Most are looking to purchase stabilized properties at or below replacement cost (leased at or below market rental rates and/or with strong credit tenants). For under-performing or “value-added” properties, investors are buying current income at high cap rates. Emphasis is placed on cash-on-cash returns, IRRs, and a balance between current or going-in yields and future appreciation potential.
Preferred Property Types
Based upon the total number of investment criteria responses, the multi-housing market was ranked in the CB Richard Ellis, Inc. National Investor Survey as the most preferred property type out of nine property types. Over the past two years the multi-housing property type has been the most preferred property type. Growth in the apartment market, both in terms of rental rate increases and price appreciation, is expected to continue in the short term, albeit at a more moderate pace for the South Florida market area.
©2007 CB Richard Ellis, Inc.
15
Table of Contents
| PRESIDENTIAL HOUSE | MARKET ANALYSIS |
Investor Activity
Investor activity in the multi-housing market has been strong throughout all the major submarkets, with numerous sales over the past 12 months. Based on the CB Richard Ellis, Inc. National Investor Survey, multi-housing properties are the number one choice of investors in the marketplace.
With regard to investment criteria, the CB Richard Ellis, Inc. Survey reported typical going-in overall capitalization rates for Class C properties ranged from 6.00% to 9.00% with an average of 7.37%. Terminal Capitalization rates for Class C properties range from 6.50% to 9.00%, with an average of 7.96%. The discount rates for Class C properties ranged from 7.00% to 10.00%, with an average of 9.17%. These rates are generally down from our prior survey, indicating the desirability of this investment type.
In addition, we consulted the Korpacz Real Estate Investor Survey, Second Quarter 2007 that reported overall capitalization rates of 3.5% to 8.00% with an average of 5.80%. Terminal Capitalization rates range from 4.50% to 8.50%, with an average of 6.61%. The discount rates ranged from 6.00% to 12.00%, with an average of 8.36%. Korpacz reported overall and terminal rates down 21 and 52 basis points from one-year ago.
MIAMI-DADE COUNTY APARTMENT MARKET ANALYSIS
An overview of local market conditions is a necessary aspect of the appraisal process. The market analysis forms a basis for assessing market area boundaries, supply and demand factors, and indications of financial feasibility. In this section CB Richard Ellis, Inc. discusses the status of relevant market characteristics.
The following information on rental apartments in Miami-Dade County is based on a quarterly survey prepared by CB Richard Ellis, Inc. and Reinhold P. Wolff Economic Research, Inc.
MARKET SUMMARY
Market statistics for Miami-Dade County and the North Miami Beach (subject) submarket is shown in the following table:
©2007 CB Richard Ellis, Inc.
16
Table of Contents
| PRESIDENTIAL HOUSE | MARKET ANALYSIS |
APARTMENT MARKET STATISTICS
| North Miami Beach | ||||||||
| Category | Miami-Dade County | Submarket | ||||||
| Existing Supply (Units) | 30,071 | 2,741 | ||||||
| New Construction (Units) | 521 | 0 | ||||||
| Annual Absorption (Units) | 420 | 0 | ||||||
| Average Occupancy | 97.2 | % | 95.5 | % | ||||
| Average Rent | $ Per Unit | $ Per SF | $ Per Unit | $ Per SF | ||||||||||||
| All Apartments | $ | 1,192 | $ | 1.388 | $ | 1,319 | $ | 1.244 | ||||||||
| Efficiency | $ | 847 | $ | 1.844 | N/A | N/A | ||||||||||
| One-Bedroom | $ | 1,038 | $ | 1.451 | $ | 1,050 | $ | 1.270 | ||||||||
| Two-Bedroom | $ | 1,334 | $ | 1.334 | $ | 1,473 | $ | 1.227 | ||||||||
| Three-Bedroom | $ | 1,592 | $ | 1.299 | $ | 1,585 | $ | 1.225 | ||||||||
| Date of Survey | May 2007 | May 2007 | ||||||||||||||
| Source: Reinhold Wolff | ||
| Compiled by: CB Richard Ellis, Inc. | ||
As shown above, the average occupancy rate for the North Miami Beach submarket is lower than the overall market area and the average per unit rent is lower. Absorption over the past four quarters was positive for the overall market area while no units were absorbed in the submarket.
MARKET TRENDS
The table below presents the quarterly trends in rental rates and occupancy for the Miami-Dade County and local submarkets over the past five and a half years:
©2007 CB Richard Ellis, Inc.
17
Table of Contents
| PRESIDENTIAL HOUSE | MARKET ANALYSIS |
APARTMENT MARKET TRENDS
| Miami-Dade County | North Miami Beach Submarket | |||||||||||||||
| Date | Rent PSF | Occupancy | Rent PSF | Occupancy | ||||||||||||
1st Qtr 2002 | $ | 1.059 | 96.0 | % | $ | 1.150 | 95.3 | % | ||||||||
2nd Qtr. 2002 | $ | 1.020 | 98.0 | % | $ | 1.104 | 92.5 | % | ||||||||
3rd Qtr. 2002 | $ | 1.033 | 97.6 | % | $ | 1.190 | 93.2 | % | ||||||||
4th Qtr. 2002 | $ | 1.035 | 96.9 | % | $ | 1.203 | 91.8 | % | ||||||||
1st Qtr 2003 | $ | 1.082 | 95.3 | % | $ | 1.200 | 91.6 | % | ||||||||
2nd Qtr 2003 | $ | 1.079 | 95.6 | % | $ | 1.187 | 93.5 | % | ||||||||
3rd Qtr 2003 | $ | 1.101 | 95.7 | % | $ | 1.208 | 95.3 | % | ||||||||
4th Qtr 2003 | $ | 1.100 | 95.3 | % | $ | 1.215 | 93.3 | % | ||||||||
1st Qtr 2004 | $ | 1.134 | 94.9 | % | $ | 1.192 | 94.1 | % | ||||||||
2nd Qtr 2004 | $ | 1.147 | 95.9 | % | $ | 1.241 | 95.3 | % | ||||||||
3rd Qtr 2004 | $ | 1.139 | 96.0 | % | $ | 1.235 | 95.8 | % | ||||||||
4th Qtr 2004 | $ | 1.160 | 96.3 | % | $ | 1.244 | 94.8 | % | ||||||||
1st Qtr 2005 | $ | 1.138 | 96.4 | % | $ | 1.182 | 97.7 | % | ||||||||
2nd Qtr 2005 | $ | 1.141 | 98.2 | % | $ | 1.195 | 97.2 | % | ||||||||
3rd Qtr 2005 | $ | 1.187 | 98.4 | % | $ | 1.156 | 97.6 | % | ||||||||
4th Qtr 2005 | $ | 1.215 | 98.2 | % | $ | 1.162 | 98.9 | % | ||||||||
1st Qtr 2006 | $ | 1.255 | 98.1 | % | $ | 1.242 | 98.6 | % | ||||||||
2nd Qtr 2006 | $ | 1.266 | 99.0 | % | $ | 1.239 | 98.0 | % | ||||||||
3rd Qtr 2006 | $ | 1.300 | 98.9 | % | $ | 1.227 | 98.6 | % | ||||||||
4th Qtr 2006 | $ | 1.316 | 98.3 | % | $ | 1.277 | 97.6 | % | ||||||||
1st Qtr 2007 | $ | 1.378 | 96.5 | % | $ | 1.241 | 95.6 | % | ||||||||
2nd Qtr 2007 | $ | 1.388 | 97.2 | % | $ | 1.244 | 95.5 | % | ||||||||
| Source: Reinhold Wolff | ||
| Compiled by: CB Richard Ellis, Inc. | ||
Both the overall market area and the local submarket have maintained stabilized and/or improving occupancy rates over the past five and a half years. Over the same time frame, rental rates in the submarket has been following a moderately increasing trend with a noted decrease in the 1st quarter 2005 due to higher-end units in the submarket being removed from rental operation and converted to condos. Rates began to climb again in the 1st quarter of 2006 and for the most part have continued to increase, albeit at a slower pace in 2007 than experienced in the later part of 2006. The long-term trend is reflective of the overall strength of the apartment market in South Florida.
The primary driver behind the past high occupancy levels and increasing rents can be found in the shrinking supply of rental units throughout the tri-county area (Miami-Dade, Broward and Palm Beach). The chart below summarizes the reduction in rental units for the tri-county area since 2002.
©2007 CB Richard Ellis, Inc.
18
Table of Contents
| PRESIDENTIAL HOUSE | MARKET ANALYSIS |
APARTMENT INVENTORY
| Year | Total Complexes | % Change | Total Units | % Change | ||||||||||||
| 2002 | 637 | — | 174,995 | — | ||||||||||||
| 2003 | 615 | (3.45 | %) | 167,218 | (4.44 | %) | ||||||||||
| 2004 | 552 | (10.24 | % | 161,621 | (3.35 | %) | ||||||||||
| 2005 | 398 | (27.90 | %) | 104,714 | (35.2 | %) | ||||||||||
Total Change Since 2002 | (37.52 | %) | (40.16 | %) | ||||||||||||
| Source: McCabe Research & Consulting, LLC | ||
Combine the unit reduction due to condo conversion with the lack of substantial new project development and the recent historical trend of high occupancy and increasing rents is easily explained. However, many projects were not successful with condo conversion plans and have reverted back to rental operations. The reversion trend is less apparent in Miami-Dade, as it was the first of the tri-counties to begin with the conversion trend and was basically out of this type inventory by the time the condo conversion market collapsed.
APARTMENT VACANCY
The vacancy rate in mature (18+ months old) rental apartment complexes in Miami-Dade County declined somewhat from 3.5% in February to 2.8% in May 2007, considerably higher than the 1.0% level of May 2006. The following is a summary of vacancy trends.
VACANCIES IN RENTAL APARTMENTS
BUILDINGS 18-MONTHS OLD OR OLDER
MIAMI-DADE COUNTY
BUILDINGS 18-MONTHS OLD OR OLDER
MIAMI-DADE COUNTY
| # UNITS | # UNITS | PERCENT | ||||||||||
| DATE | SURVEYED | VACANT | VACANT | |||||||||
| May 2006 | 29,986 | 287 | 1.0 | % | ||||||||
| February 2007 | 30,430 | 1,066 | 3.5 | % | ||||||||
| May 2007 | 30,268 | 843 | 2.8 | % | ||||||||
| Compiled By: Reinhold P. Wolff Economic Research, Inc. | ||
The vacancy rate was found to be the highest in the Northeast Miami area (Area 4) at 6.5%, followed by the North Miami Beach area (Area 1) at 4.5% and the Carol City area (Area 3) at 4.3%. Sunset/East Sunset/West Sunset submarkets reported vacancy below 1.0%.
At the end of March 2007, there were only 94 new, never before occupied rental units available in inventory throughout Miami-Dade County. This is slightly greater than the 61 units available in December 2006. Based on the estimated annual demand for about 6,200 new apartments in Miami-Dade County the inventory could total 3,100 units without being excessive.
©2007 CB Richard Ellis, Inc.
19
Table of Contents
| PRESIDENTIAL HOUSE | MARKET ANALYSIS |
Following is a summary of sub-market vacancy trends.
APARTMENT VACANCY RATES BY AREA
BUILDINGS 18-MONTHS OLD OR OLDER
MIAMI-DADE COUNTY
MAY 2007
BUILDINGS 18-MONTHS OLD OR OLDER
MIAMI-DADE COUNTY
MAY 2007
| # UNITS | # VACANT | PERCENT | ||||||||||
AREA | SURVEYED | UNITS | VACANT | |||||||||
AREA 1 | ||||||||||||
North Miami Beach | 2,741 | 124 | 4.5 | % | ||||||||
| AREA 2 | ||||||||||||
| North Miami | 1,478 | 35 | 2.4 | % | ||||||||
| AREA 3 | ||||||||||||
| Carol City | 1,469 | 63 | 4.3 | % | ||||||||
| AREA 3A | ||||||||||||
| Miami Lakes | 3,286 | 109 | 3.3 | % | ||||||||
| AREA 4 | ||||||||||||
| Northeast Miami | 1,135 | 74 | 6.5 | % | ||||||||
| AREA 5 | ||||||||||||
| Northwest Miami | 1,140 | 28 | 2.5 | % | ||||||||
| AREA 6 | ||||||||||||
| Hialeah | 699 | 7 | 1.0 | % | ||||||||
| AREA 7 | ||||||||||||
| Miami Springs/Flagler North | 2,984 | 81 | 2.7 | % | ||||||||
| AREA 10 | ||||||||||||
| Bayshore | 493 | 15 | 3.0 | % | ||||||||
| AREA 8, 9, 11 & 12 | ||||||||||||
| Old Southwest/ N. Gables/ S. Gables/ S. Miami | 1,804 | 26 | 1.4 | % | ||||||||
| AREA 13, 14, & 15 | ||||||||||||
| Sunset/ East Sunset/ West Sunset | 1,161 | 3 | 0.3 | % | ||||||||
| AREA 16 | ||||||||||||
| Eastern Kendall | 2,405 | 32 | 1.3 | % | ||||||||
| AREA 17 & 18 | ||||||||||||
| Kendall West | 3,405 | 49 | 1.4 | % | ||||||||
| AREA 19, 20, & 21 | ||||||||||||
| Howard/Tamari/ W. Dade/ Perrine/ Cutler Ridge | 1,135 | 48 | 4.2 | % | ||||||||
| AREA 22, 23, & 24 | ||||||||||||
| S. W. Dade/ Homestead | 1,604 | 50 | 3.1 | % | ||||||||
| AREA 26 | ||||||||||||
| South Beach | 1,851 | 52 | 2.8 | % | ||||||||
| AREA 27-30 | ||||||||||||
| Central Beach/ No. Beach/ Surfside/ Beach Areas No. | 1,281 | 47 | 3.7 | % | ||||||||
TOTAL MIAMI-DADE COUNTY | 30,071 | 843 | 2.8 | % | ||||||||
| Compiled by: Reinhold P. Wolff Economic Research, Inc. | ||
The subject property is located in theNorth Miami Beachsubmarket. The current vacancy rate in the North Miami Beach submarket is 4.5%. This vacancy rate is up from the 2.0% rate found in May 2006 and up from the 2.8% rate found in May of 2005. The overall market area has maintained stabilized and/or improving occupancy rates over the past five and a half years.
©2007 CB Richard Ellis, Inc.
20
Table of Contents
| PRESIDENTIAL HOUSE | MARKET ANALYSIS |
COMPETITIVE PROPERTIES
Comparable properties have been surveyed in order to identify the occupancy trends within the immediate submarket. The comparable data is summarized in the following table:
SUMMARY OF COMPARABLE APARTMENT RENTALS
| Comp. | ||||||
| No. | Name | Location | Occupancy | |||
| 1 | Asbury Park | 17600 NW 5th Avenue, Miami Gardens, FL | 88% | |||
| 2 | Aventura Harbor | 19455 NE 10th Avenue, Miami, FL | 98% | |||
| 3 | Forest Place | 1600 NE 135th Street, North Miami, FL | 90% | |||
| 4 | Horizons North | 665 Ives Dairy Road, North Miami Beach, FL | 96% | |||
| 5 | Portofino at Biscayne | 1820-1860 NE 142nd Street, North Miami, FL | 100% | |||
| 6 | Somervale Apartments fka Oasis Club | 21010 NW 7th Avenue, Miami, FL | 88% | |||
| Subject | Presidential House | 1572 NE 191st Street, North Miami Beach, Florida | 95% | |||
| Compiled by CBRE | ||
The comparable properties surveyed reported vacancy rates ranging from 0% to 12%, with an overall weighted average of 4.6%. The majority of the comparable properties surveyed reported occupancy rates of 90% or better, and all are currently in average condition. Comparable One is in the process of major renovations as the units become vacant and occupancy is held down due to the renovations. Comparable Six is slated for condo conversion and has intentionally held units from rental operations so as to have units available for sale. Excluding these comparables, the overall weighted average vacancy is 2.3%.
© 2007 CB Richard Ellis, Inc.
21
Table of Contents
| PRESIDENTIAL HOUSE | MARKET ANALYSIS |
SUBJECT TRENDS AND PROJECTIONS
Occupancy
Occupancy rate is the relationship between the actual income received from a property and the income that would be received if the entire space were occupied. Consequently, the occupancy rate is a product of both (1) the relationship between the amount of occupied space in a building or market (physical) and (2) the relationship between the contract rent for the occupied building or market space and the total rent estimated for all space in the building or market (economic).
Subject’s Historical Trends
The subject has exhibited a relatively stable occupancy pattern in recent years, generally performing better than 95% since 2005. The subject’s occupancy is detailed in the following chart.
OCCUPANCY
| Year | % PGI | |||
| 2005 | 98 | % | ||
| 2006 | 96 | % | ||
| 2007 Annualized | 95 | % | ||
| June 2007 T-12 | 95 | % | ||
CBRE Estimate | 95 | % | ||
| Compiled by CBRE | ||
Submarket Trends
Over the past two years, occupancy levels in the overall Miami-Dade market have ranged from approximately 96% to 99%, while the local submarket has performed similarly at approximately 94% to 99%. The lowest occupancy in the North Miami Beach submarket performance occurred in the first quarter 2003; however, this trend has reversed in subsequent quarters and is generally attributable to the lower tier submarket with lower rents and older properties, aimed at a lower income tenant profile. With no new construction planned, the submarket will likely continue to outperform the overall market in terms of occupancy for the near to mid term.
Conclusion
Based on the foregoing analysis, CBRE’s conclusion of stabilized occupancy for the subject is illustrated in the following table. This estimate considers both the physical and economic factors of the market.
©2007 CB Richard Ellis, Inc.
22
Table of Contents
| PRESIDENTIAL HOUSE | MARKET ANALYSIS |
OCCUPANCY CONCLUSIONS
| Miami-Dade County | 97.2 | % | ||||||
| North Miami Beach Submarket | 95.5 | % | ||||||
| Rent Comparables | 95.4 | % | ||||||
| Subject’s Current Occupancy | 94.6 | % | ||||||
| Subject’s Stabilized Occupancy | 95.0 | % | ||||||
| Compiled by CBRE | ||
Absorption
During the first quarter of 2007, 118 new rental apartment units were absorbed in Miami-Dade County. This is 2.4 times more than the 50 units absorbed in the preceding quarter but 35.9% less than the 184 units absorbed in the first quarter of 2006. The 486 new apartments absorbed during 2006 were 48.5% less than the 944 absorbed during the same period of 2005.
A total of 151 new apartment units were completed in Miami-Dade County during the first quarter 2007 while none were completed in the preceding quarter and none in the first quarter 2006. A total of 179 new apartments were started under construction in the first quarter of 2007 compared to none in the fourth quarter 2006 and in the first quarter 2006.
For the six-month period ending with March 2007, an average of only 28 new rental units was absorbed each month. A total of 94 new units were available at the end of March 2007, and this represents 3.4 months of supply at the pace of absorption over the past six months. It is estimated that there is an annual demand for about 6,200 apartment units in Miami-Dade County and at this demand level the market could support up to 3,100 available new units. During the six month period only 25 new apartment units were completed per month and 30 were started monthly during the period.
Only about 521 apartment units are under construction in Miami-Dade County. New rental apartment building activity remains notably below the estimated demand level for 6,200 units per year. Apartment vacancy rates should remain low (at shortage levels) in Miami-Dade County on an overall basis for the near-term future as new supply remains well under the indicated demand for additional apartments.
Lease-up Discount
The value indications employed for the subject property by the various approaches to value are reflective of a property operating at a stabilized level. A stabilized occupancy for the subject has been estimated to be 95%, while the subject is currently 94.6% occupied. As such, a discount for lease-up is not warranted.
© 2007 CB Richard Ellis, Inc.
23
Table of Contents
| PRESIDENTIAL HOUSE | MARKET ANALYSIS |
New Construction
Following is a summary of new apartment projects under construction in South Florida Market:
FORECAST APARTMENT UNIT COMPLETIONS BY SUBMARKET
OCTOBER 2006 – SEPTEMBER 2007
OCTOBER 2006 – SEPTEMBER 2007
| PROJECT | ADDRESS | DEVELOPER | FINISHED | # UNITS | ||||||||||
| Los Suenos* | 500 NW 36thStreet, Miami | Pinnacle Housing Grp | 08/06 | 179 | ||||||||||
| Corinthian | 7705 NW 22ndAve, Miami | Pinnacle Housing Group | 02/07 | 126 | ||||||||||
Miami Dade County | 305 | |||||||||||||
| Harbour Cove* | 100 NW 9thTer, Hallandale Bch | Cornerstone Group | 10/06 | 212 | ||||||||||
| Crystal Lakes | 3100 N 24thAvenue, Hollywood | Pinnacle Housing Group | 06/07 | 190 | ||||||||||
| Village Green | 8703 W. Sample Rd. Coral Sprg | Symphony Builders, LLC | 11/06 | 22 | ||||||||||
Broward County | 424 | |||||||||||||
| Heritage at Green Cay | Jog Rd., Boynton Beach | Housing Trust Group | 05/07 | 160 | ||||||||||
| Gables Marbella | 22182 Bella Lago, Boca Raton | Gables Residential | 06/07 | 297 | ||||||||||
| Villa Toscana at Lakes of Laguna | 4600 Portofina Way, WPB | Epoch Properties | 12/06 | 396 | ||||||||||
PalmBeachCounty | 853 | |||||||||||||
TOTAL SOUTH FLORIDA AREA | 1,582 | |||||||||||||
| * | Low Income Housing Tax Credit | |
| Compiled by: M/PF Research, Inc.. | ||
New supply now under way in South Florida is well distributed among the regions three metropolitan areas – Dade County, Broward County and Palm Beach County. Palm Beach County registers a meaningfully higher percentage of the region’s ongoing apartment development activity with 853 units completed or under way for slightly more than one-half share (54%) of the region’s scheduled new supply. Apartment building activity in Broward currently accounts for 27% of scheduled new supply, while Dade County has a 19% share of South Florida recently completed or new construction.
Rental Rates
The overall average monthly rent for apartments in mature rental developments in Miami-Dade County has been on the rise over the past year. The table below presents the trends in rental rates for the various units for the Miami-Dade County over the past year:
© 2007 CB Richard Ellis, Inc.
24
Table of Contents
| PRESIDENTIAL HOUSE | MARKET ANALYSIS |
APARTMENT RENT TRENDS
MIAMI-DADE COUNTY
MIAMI-DADE COUNTY
| Average Monthly Rent | Percent Change | |||||||||||||||||||
| Unit Type | May-07 | Feb-07 | May-06 | 02/07-05/07 | 05/06-05/07 | |||||||||||||||
| All Apartments | $ | 1,192 | $ | 1,182 | $ | 1,076 | + 0.8 | % | + 10.8 | % | ||||||||||
| Efficiency | $ | 847 | $ | 839 | $ | 726 | + 1.0 | % | + 16.7 | % | ||||||||||
| One-Bedroom | $ | 1,038 | $ | 1,026 | $ | 929 | + 1.2 | % | + 11.7 | % | ||||||||||
| Two Bedroom | $ | 1,334 | $ | 1,325 | $ | 1,206 | + 0.7 | % | + 10.6 | % | ||||||||||
| Three-Bedroom | $ | 1,592 | $ | 1,600 | $ | 1,452 | -0.5 | % | + 9.6 | % | ||||||||||
| Source: Reinhold Wolff | ||
| Compiled by: CB Richard Ellis, Inc. | ||
The overall average monthly rent for apartments in mature rental developments in Miami-Dade County increased by $10 to a total of $1,192 from February to May 2007. The May 2007 overall average rent of $1,192 is 10.8% more than the $1,076 average rent found one year earlier and 18.3% higher than the $1,008 average rent found in May 2005, indicating an annual average compounded increase of 8.7% over the past two years. Over the past quarter, efficiency rents increased by $8 to $847, one-bedroom rents increased by $12 to $1,038, two-bedroom rents increased by $9 to $1,334 and three-bedroom rents declined by $8 to $1,592. Changes in projects participating in the surveys from one period to another can result in considerable fluctuations for efficiency and three-bedroom units where the supply is more limited. It should be noted that the rents revealed by these survey data are not necessarily representative of rents, which might be found in a new rental development. The rents are averaged from projects including some small and older complexes.
The current average monthly rental rate per unit in the North Miami Beach sub-market is $1,319 or $1.244 per square foot. This represents a 0.4% increase from the $1.239 average per square foot one year ago and a 4.1% increase from the $1.195 average per square foot two years ago. This indicates an average annual increase of 2% over the past two years.
The current average monthly rents in the sub-market are $1,050 or $1.270 per square foot for a one-bedroom unit, $1,473 or $1.227 per square foot for a two-bedroom unit and $1,585 or $1.225 per square foot for a three-bedroom unit.
It should be noted that the rents revealed by these survey data are not necessarily representative of rents that might be obtained in a new rental development. The rents are averaged from projects including many small and older complexes.
Distribution of Apartment Units
Following is a summary by number of bedrooms within the geographic areas of Miami-Dade County:
©2007 CB Richard Ellis, Inc.
25
Table of Contents
| PRESIDENTIAL HOUSE | MARKET ANALYSIS |
DISTRIBUTION OF APARTMENT UNITS
MIAMI-DADE COUNTY
MIAMI-DADE COUNTY
| PROJECT/ | EFFICIENCY/ | ONE | TWO | THREE | ||||||||||||
| LOCATION | STUDIO | BEDROOM | BEDROOMS | BEDROOMS | ||||||||||||
| AREA A | 0.0 | % | 0.0 | % | 0.0 | % | 0.0 | % | ||||||||
| Homestead | ||||||||||||||||
| AREA B | 8.0 | % | 41.1 | % | 49.2 | % | 1.6 | % | ||||||||
| Redlands/Goulds | ||||||||||||||||
| AREA C | 2.9 | % | 43.2 | % | 44.6 | % | 9.3 | % | ||||||||
| Perrine/Cutler Ridge | ||||||||||||||||
| AREA D | 0.0 | % | 35.2 | % | 64.8 | % | 0.0 | % | ||||||||
| South Bayfront | ||||||||||||||||
| AREA E | 2.2 | % | 45.7 | % | 45.9 | % | 6.2 | % | ||||||||
| Kendall West | ||||||||||||||||
| AREA F | 0.9 | % | 45.9 | % | 46.3 | % | 6.9 | % | ||||||||
| Kendall | ||||||||||||||||
| AREA G | 0.0 | % | 31.8 | % | 67.3 | % | 0.9 | % | ||||||||
| West Dade | ||||||||||||||||
| AREA H | 0.5 | % | 31.6 | % | 59.8 | % | 8.1 | % | ||||||||
| West Miami/Sweetwater | ||||||||||||||||
| AREA I | 0.0 | % | 24.1 | % | 55.4 | % | 20.5 | % | ||||||||
| Deering Bay/Coral Gables/Coconut Grove | ||||||||||||||||
| AREA J | 1.2 | % | 49.9 | % | 46.0 | % | 3.0 | % | ||||||||
| Miami | ||||||||||||||||
| AREA K | 0.0 | % | 36.2 | % | 55.5 | % | 8.3 | % | ||||||||
| Doral | ||||||||||||||||
| AREA L | 0.0 | % | 45.0 | % | 54.1 | % | 0.9 | % | ||||||||
| Hialeah | ||||||||||||||||
| AREA M | 6.9 | % | 47.2 | % | 39.7 | % | 6.2 | % | ||||||||
| Opa Locka/Carol City | ||||||||||||||||
| AREA N | 4.3 | % | 58.7 | % | 37.1 | % | 0.0 | % | ||||||||
| Miami Shores/North Miami | ||||||||||||||||
| AREA O | 0.3 | % | 44.2 | % | 48.0 | % | 7.5 | % | ||||||||
| North Bayfront | ||||||||||||||||
| AREA P | 4.2 | % | 52.1 | % | 41.7 | % | 1.9 | % | ||||||||
| Key Biscayne/Fisher Island/Miami Beach | ||||||||||||||||
| AREA Q | 0.6 | % | 48.9 | % | 47.8 | % | 2.8 | % | ||||||||
| Miami Lakes | ||||||||||||||||
| TOTAL MIAMI-DADE COUNTY | 1.6 | % | 44.1 | % | 48.9 | % | 5.3 | % | ||||||||
| Source: Real Estate Market Profiles, The Meyers Group (Totals do not equal 100% due to exclusion of 4 BR units, 0.1%) | ||
CONCLUSION
Demand for apartment buildings continues to be strong, particularly in luxury Class A projects. Class B & C projects are also receiving plenty of attention from investors looking for value-add opportunities where they can perform basic renovations and cosmetic upgrades and significantly enhance cash flows. Due to the uncertain supply of multi-family product due to reversions, rental rates have begun to stabilize from the highs of six to eight months ago and in some cases have shown declines from
©2007 CB Richard Ellis, Inc.
26
Table of Contents
| PRESIDENTIAL HOUSE | MARKET ANALYSIS |
previous quarters. The subject submarket has shown significant increase in rents in the past year; however, occupancy has suffered in the North Miami Beach submarket, and rents have fallen slightly. In our opinion, the current rental rate trend is temporary and will stabilize at typical rate increases of between 3% and 5% once the supply have been established and the reverting units have been absorbed. In the long term, and considering the only new supply coming into the market is generally from reverted units, the apartment market is expected to perform well.
With respect to the subject property in particular, we believe the subject is well located for an apartment project. The site is conveniently located with respect to employment centers and major roadways, and the surrounding apartment developments are experiencing average to above average levels of demand. Based upon our analysis, the existing subject property should continue to experience good market acceptance for the foreseeable future.
©2007 CB Richard Ellis, Inc.
27
Table of Contents
| PRESIDENTIAL HOUSE | SITE ANALYSIS |
SITE ANALYSIS
The following chart summarizes the salient characteristics of the subject site.
SITE SUMMARY
Physical Description | ||||
| Gross Site Area | 5.79 Acres 252,212 Sq. Ft. | |||
| Net Site Area | 5.79 Acres 252,212 Sq. Ft. | |||
| Primary Road Frontage | NE 191st Street | |||
| Excess Land Area | None | |||
| Surplus Land Area | None | |||
| Zoning District | RU-4, High Density Apartment House District | |||
| Flood Map Panel No. & Date | 12025C0083J 2-Mar-94 | |||
| Flood Zone | AE | |||
| Source: Various sources compiled by CBRE | ||
LOCATION
The subject is on the south side of NE 191st Street, about one-half mile north of Miami Gardens Drive. The street address is 1572 NE 191st Street. Ingress and egress is available to the site via two curb cuts along the southern right-of-way of NE 191st Street.
ASSESSOR’S PARCEL NUMBER
The Miami-Dade County Tax Assessor’s parcel number is as follows: 30-2205-000-0235.
LAND AREA
The site is considered adequate in terms of size and utility. There is no unusable, excess or surplus land area.
SHAPE AND FRONTAGE
The site is irregular in shape and has adequate frontage along a secondary residential thoroughfare within the neighborhood.
INGRESS/EGRESS
Ingress and egress is available to the site via two curb cuts along the southern right-of-way of NE 191st Street.
©2007 CB Richard Ellis, Inc.
28
Table of Contents
| PRESIDENTIAL HOUSE | SITE ANALYSIS |
NE 191st Street, at the subject, is an east/west residential street that is improved with one lane of traffic in each direction. Street improvements include asphalt paving, open drainage and sidewalks, and street lighting. Street parking is not permitted.
Please refer to the prior aerial exhibit for the layout of the streets that provide access to the subject.
TOPOGRAPHY AND DRAINAGE
The site is generally level and at street grade. The topography of the site is not seen as an impediment to the development of the property. During our inspection of the site, we observed no drainage problems and assume that none exist.
SOILS
A soils analysis for the site has not been provided for the preparation of this appraisal. In the absence of a soils report, it is a specific assumption that the site has adequate soils to support the highest and best use.
EASEMENTS AND ENCROACHMENTS
Based on an inspection and review of the site plan, the property does not appear to be adversely affected by any easements or encroachments. It is recommended that the client/reader obtain a current title policy outlining all easements and encroachments on the property, if any, prior to making a business decision.
COVENANTS, CONDITIONS AND RESTRICTIONS
There are no known covenants, conditions and restrictions impacting the site that are considered to affect the marketability or highest and best use.
UTILITIES AND SERVICES
The site is within the jurisdiction of North Miami Beach and is provided all municipal services, including police, fire and refuse garbage collection. All utilities are available to the site in adequate quality and quantity to service the highest and best use.
FLOOD ZONE
According to flood hazard maps published by the Federal Emergency Management Agency (FEMA), the site is within Zone AE, as indicated on the indicated Community Map Panel No. 12025C0083J.
FEMA Zone AE: Special flood hazard areas subject to inundation by the 100-year flood determined in a Flood Insurance Study by detailed methods. Base flood
©2007 CB Richard Ellis, Inc.
29
Table of Contents
| PRESIDENTIAL HOUSE | SITE ANALYSIS |
elevations are shown within these zones. Mandatory flood insurance purchase requirements apply.
ENVIRONMENTAL ISSUES
CBRE has not observed and is not qualified to detect, the existence of potentially hazardous material or underground storage tanks which may be present on or near the site. The existence of hazardous materials or underground storage tanks may affect the value of the property. For this appraisal, CBRE has specifically assumed that the property is not affected by any hazardous materials that may be present on or near the property.
ADJACENT PROPERTIES
The adjacent land uses are summarized as follows:
North: | Condominiums, followed by the Presidential Golf Course | |
South: | Lake, followed by condos | |
East: | Jade Winds Condos | |
West: | New Horizons Condos |
The adjacent properties are improved with developments similar in age to the subject, as well as overall condition.
CONCLUSION
The site is located in an area dominated by residential improvements. The majority of development is mid-rise condominiums. Commercial support developments are generally along Miami Gardens, just south of the subject and along Biscayne Boulevard, about one-mile east of the subject. The size of the subject site is typical for the area and use, and there are no known detrimental uses in the immediate vicinity. Overall, there are no known factors which are considered to prevent the site from development to its highest and best use, as if vacant, or adverse to the existing use of the site.
©2007 CB Richard Ellis, Inc.
30
Table of Contents
| PRESIDENTIAL HOUSE | IMPROVEMENTS ANALYSIS |
ONE-BEDROOM/ONE BATHROOM LAYOUT
©2007 CB Richard Ellis, Inc.
31
Table of Contents
| PRESIDENTIAL HOUSE | IMPROVEMENTS ANALYSIS |
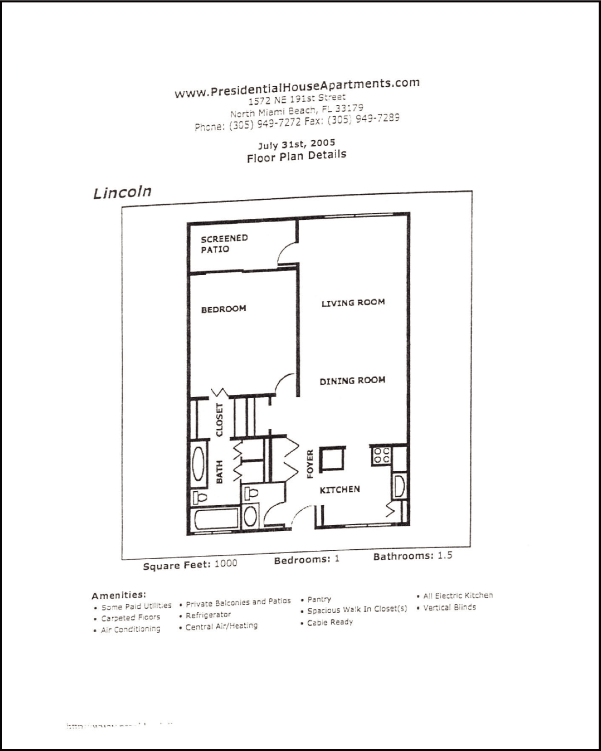
ONE-BEDROOM/ONE & HALF BATHROOM LAYOUT
©2007 CB Richard Ellis, Inc.
32
Table of Contents
| PRESIDENTIAL HOUSE | IMPROVEMENTS ANALYSIS |
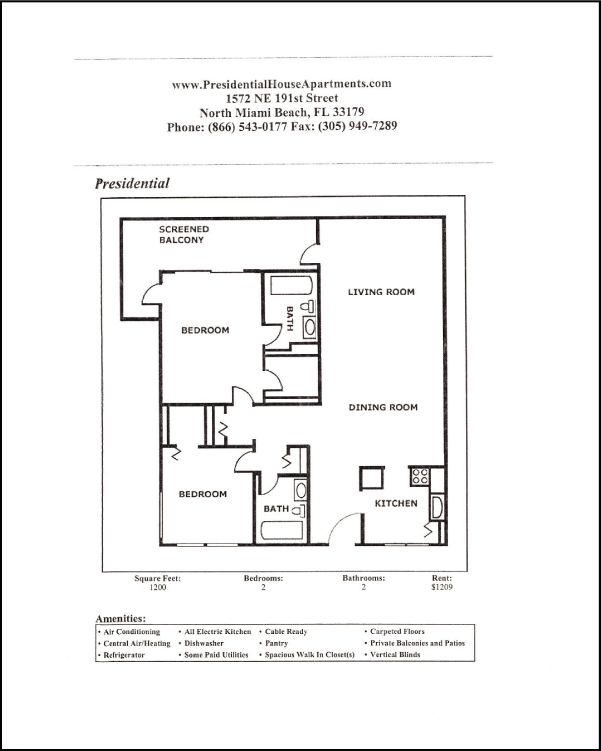
TWO-BEDROOM/TWO BATHROOM LAYOUT
©2007 CB Richard Ellis, Inc.
33
Table of Contents
| PRESIDENTIAL HOUSE | IMPROVEMENTS ANALYSIS |
IMPROVEMENTS ANALYSIS
The following chart depicts a summary of the improvements.
IMPROVEMENTS SUMMARY
| Property Type | Apartment (Multi-family Mid/High Rise) | |
| Number of Buildings | 4 | |
| Number of Stories | 3 & 4 | |
| Gross Building Area | 184,650 SF | |
| Net Rentable Area | 183,150 SF | |
| Number of Units | 203 | |
| Average Unit Size | 902 SF | |
| Development Density | 35.1 Units/Acre | |
| Parking Improvements | Open | |
| Total Spaces: | 233 | |
| Parking Ratio (spaces/unit) | 1.15 |
| No. of | Percent of | Unit Size | ||||||||||||||||||
| Unit Mix | Comments | Units | Total | (SF) | NRA (SF) | |||||||||||||||
| 1BR/1BA | 113 | 55.7 | % | 750 | 84,750 | |||||||||||||||
| 1BR/1.5BA | 48 | 23.6 | % | 1,000 | 48,000 | |||||||||||||||
| 2BR/2BA | 42 | 20.7 | % | 1,200 | 50,400 | |||||||||||||||
| Total/Average: | 203 | 100.0 | % | 902 | 183,150 | |||||||||||||||
| Source: Various sources compiled by CBRE | ||
Building plans and specifications were not provided for the preparation of this appraisal. The following is a description of the subject improvements and basic construction features derived from CBRE’s inspection.
YEAR BUILT
The subject was built in 1966 and continues to be renovated and upgraded. Renovations completed include new appliances in 10 units. As units become vacant, new appliances, refinished countertops and carpeting are being installed.
FOUNDATION
The foundation consists of poured reinforced concrete/perimeter footings and column pads.
CONSTRUCTION COMPONENTS
The construction components include a concrete block frame with concrete truss and joist floor structure and floor deck.
© 2007 CB Richard Ellis, Inc.
34
Table of Contents
| PRESIDENTIAL HOUSE | IMPROVEMENTS ANALYSIS |
FLOOR STRUCTURE
The floor structure is summarized as follows:
| Ground Floor: | Concrete slab on compacted fill | |
| Other Floors: | Concrete |
EXTERIOR WALLS
The exterior wall structure is concrete block frame with painted stucco veneer and concrete accents and trim. The buildings have single pane aluminum frame windows.
ROOF COVER
All buildings have flat roofs with a roll composition shingle covering.
ELEVATOR/STAIR SYSTEM
Two sets of stairwells are located at each end of the buildings. The buildings also include six passenger elevators (1,750 lbs.) generally located in the center of the buildings.
HVAC
The HVAC system is assumed to be in good working order and adequate for the building.
UTILITIES
Each unit is individually metered for electrical usage. Current operations indicate the landlord is responsible for water, sewer and trash removal costs to the individual units with the tenants paying all other utility costs.
SECURITY
The improvements are encircled by fencing, although there are no security gates at the vehicle access points. Although the management office features a security alarm system, there is no alarm oriented security system for the individual units.
FIRE PROTECTION
The improvements are not fire sprinklered, although all units are equipped with smoke detectors. It is assumed the improvements have adequate fire alarm systems, fire exits, fire extinguishers, fire escapes and/or other fire protection measures to meet local fire marshal requirements.
© 2007 CB Richard Ellis, Inc.
35
Table of Contents
| PRESIDENTIAL HOUSE | IMPROVEMENTS ANALYSIS |
PROJECT AMENITIES
The project amenities include one community pool, children’s playground (courtyard) and combination leasing office/clubhouse. The clubhouse facility includes a full-size kitchen and small banquet room with tables and chairs for dining. Additionally, the project features six laundry facilities each equipped with approximately 6 clothes washers and dryers (three each).
UNIT AMENITIES
Kitchens
Each unit features a full appliance package including an electric range/oven, vent-hood in the renovated units, frost-free refrigerator, dishwasher (in the 1/11/2 and 2/2’s), and built-in microwave oven in the renovated units. The majority of the units have not been upgraded and there is no vent hood or microwave oven in these units. Additionally, each unit features laminate cabinets with Formica countertops and vinyl or ceramic tile flooring in the kitchen area. According to management, the project has experienced an adequate on-going replacement program for all kitchen appliances and no appliances are known to be inoperable.
Bathrooms
The bathrooms within each unit feature combination tub/showers with ceramic tile wainscot. Additionally, each bathroom features a commode, laminate cabinet with Formica counter and built-in porcelain sink, wall-mounted medicine cabinet with vanity mirror and vinyl or ceramic tile flooring.
Interior Lighting
Each unit features incandescent lighting in appropriate interior and exterior locations with fluorescent lighting in the kitchen area.
Patios, Balconies and Storage
All units include a private patio or balcony area.
SITE AMENITIES
Parking and Drives
The project features adequate surface parking, including reserved handicap spaces. Access to the property is controlled via electronic security gates located at the primary entry point. All parking spaces and vehicle drives are asphalt paved and considered to be in average condition.
© 2007 CB Richard Ellis, Inc.
36
Table of Contents
| PRESIDENTIAL HOUSE | IMPROVEMENTS ANALYSIS |
Landscaping
Landscaping is considered to be in average condition and well maintained.
QUALITY AND STRUCTURAL CONDITION
The overall quality of the project is considered average for the neighborhood and age. CBRE did not observe any evidence of structural fatigue and the improvements appear structurally sound for occupancy. However, CBRE is not qualified to determine structural integrity and it is recommended that the client/reader retain the services of a qualified, independent engineer or contractor to determine the structural integrity of the improvements prior to making a business decision.
FUNCTIONAL UTILITY
All of the floor plans are considered to feature functional layouts and the layout of the overall project is considered functional in utility. Therefore, the unit mix is also functional and no conversion is warranted to the existing improvements.
PROJECT DENSITY
The project’s development density is commensurate with other competing properties in the neighborhood.
ADA COMPLIANCE
All common areas of the property appear to have handicap accessibility and all first floor units are handicap accessible. The client/reader’s attention is directed to the specific limiting conditions regarding ADA compliance.
FURNITURE, FIXTURES AND EQUIPMENT
The apartment units are rented on an unfurnished basis. However, miscellaneous maintenance tools, pool furniture, leasing office furniture, recreational room and clubhouse furniture, and various exercise machines are examples of personal property associated with and typically included in the sale of multifamily apartment complexes. The personal property items contained in the project are not considered to contribute significantly to the overall value of the real estate.
ENVIRONMENTAL ISSUES
CBRE has not observed and is not qualified to detect the existence of any potentially hazardous materials such as lead paint, asbestos, urea formaldehyde foam insulation, or other potentially hazardous construction materials on or in the improvements. The existence of such substances may affect the value of the property. For the purpose of this assignment, we have specifically assumed that any hazardous materials that would cause a loss in value do not affect the subject.
© 2007 CB Richard Ellis, Inc.
37
Table of Contents
| PRESIDENTIAL HOUSE | IMPROVEMENTS ANALYSIS |
DEFERRED MAINTENANCE
Our inspection of the property indicated no major items of deferred maintenance.
ECONOMIC AGE AND LIFE
CBRE’s estimate of the subject improvements effective age and remaining economic life is depicted in the following chart:
ECONOMIC AGE AND LIFE
| Actual Age | 41 Years | |||
| Effective Age | 26 Years | |||
| MVS Expected Life | 55 Years | |||
| Remaining Economic Life | 29 Years | |||
| Accrued Physical Incurable Depreciation | 47.3 | % | ||
| Compiled by CBRE | ||
The overall life expectancy is based upon our on-site observations and a comparative analysis of typical life expectancies reported for buildings of similar construction as published by Marshall and Swift, LLC, in theMarshall Valuation Servicecost guide. While CBRE did not observe anything to suggest a different economic life, a capital improvement program could extend the life expectancy.
CONCLUSION
The improvements are in average overall condition. Overall, there are no known factors that adversely impact the marketability of the improvements.
© 2007 CB Richard Ellis, Inc.
38
Table of Contents
| PRESIDENTIAL HOUSE | ZONING |
ZONING
The following chart summarizes the subject’s zoning requirements.
| ZONING SUMMARY | ||
| Current Zoning | RU-4, High Density Apartment House District | |
| Legally Conforming | No, leaglly non-conforming due to parking | |
| Uses Permitted | Multi-family apartment houses with less than 11 units per building (site plan review needed for more units); uses permitted in the RU-1 thru RU-3 and the RU-TH districts | |
| Zoning Change | Not likely | |
| Category | Zoning Requirement | |
| F. A. R. | 1 story .40; plus .20 for each add’l story, max F.A.R. of 2.00 | |
| Min lot width and area | 100 feet and 10,000 square feet, resp. | |
| Max lot coverage | 40% of total lot area | |
| Front setback | 25 feet upto 35 feet in bldg. height; over 35 feet high, increase by 40% of add’l bldg height, max setback 50 feet | |
| Rear setback | 25 feet upto 35 feet in bldg. height; over 35 feet high, increase by 40% of add’l bldg height | |
| Side yard setbacks | To be determined by a 63º line projected from side property line towards center of site; min setback 25 feet | |
| Setback between bldgs | 20 feet minimum | |
| Height limit | Bldgs over 100 feet high on sites that abut right-of-way 100 feet or wider width must satisfy 12:00 noon shadow/41º sun angle requirement. All other sites, bldgs must be no higher than width of right-of-way sites abut | |
| Max no. dwelling units | 50 units per acre or 871.2 SF of lot area per unit | |
| Minimum Open Space | 40% of total lot area | |
| Parking | 1.5 spaces per 1-bedroom or efficiency unit, 1.75 foreach 2-bedroom unit and 2 for each 3-bedroom unit or more (Required - 326 spaces) | |
| Subject’s Actual Parking | 1.15 spaces/unit | |
| Source: Miami-Dade County Planning & Zoning Dept. | ||
© 2007 CB Richard Ellis, Inc.
39
Table of Contents
| PRESIDENTIAL HOUSE | ZONING |
ANALYSIS AND CONCLUSION
The improvements represent a legally-nonconforming use due to parking, but, if damaged, may be restored without special permit application. If additional information is required, please contact the local planning and/or zoning office.
© 2007 CB Richard Ellis, Inc.
40
Table of Contents
| PRESIDENTIAL HOUSE | TAX AND ASSESSMENT DATA |
TAX AND ASSESSMENT DATA
Real estate in Miami-Dade County is assessed at 100% of the assessor’s estimated “Just Value”. Just Value has been equated to market value less closing costs. The assessment for real estate purposes is made as of January 1 of each year. The county commission sets the millage rate to be used in calculating the tax bill in September or October of each year. The Miami-Dade County tax collector issues the tax bills providing for a 4% discount if the bill is paid in November, 3% for bills paid in December, 2% for bills paid in January, and a 1% discount for February payment. All tax bills are delinquent after March 31 of each year.
Prudent management normally pays taxes in November in order to save 4% on the tax bill. In our income projections, we have assumed the owner will take advantage of the early payment discount. The subject’s market value, assessed value, and taxes are summarized below, and do not include any furniture, fixtures and equipment.
AD VALOREM TAX INFORMATION
| Assessor’s Market Value | 2005 | 2006 | Pro Forma | |||||||||||||
| 30-2205-000-0235 | $ | 9,084,200 | $ | 9,900,000 | ||||||||||||
| Subtotal | $ | 9,084,200 | $ | 9,900,000 | $ | 13,200,000 | ||||||||||
| Assessed Value @ | 100 | % | 100 | % | 100 | % | ||||||||||
| $ | 9,084,200 | $ | 9,900,000 | $13,200,000 | ||||||||||||
| General Tax Rate | (per $1,000 A.V.) | 3.000000 | 21.316300 | 21.316300 | ||||||||||||
General Tax: | $ | 27,253 | $ | 211,031 | $ | 281,375 | ||||||||||
| Special Assessments: | — | — | — | |||||||||||||
| Effective Tax Rate | (per $1,000 A.V.) | 3.000000 | 21.316300 | 21.316300 | ||||||||||||
Gross Taxes | 27,253 | 211,031 | 281,375 | |||||||||||||
| Less Prepayment Discount 4.00% | (1,090 | ) | (8,441 | ) | (11,255 | ) | ||||||||||
Total Real Estate Taxes | 26,162 | 202,590 | 270,120 | |||||||||||||
Personal Property Taxes | 3,577 | 2,571 | 2,571 | |||||||||||||
Total Taxes | $ | 29,739 | $ | 205,161 | $ | 272,691 | ||||||||||
| Source: Assessor’s Office | ||
The property appraiser’s office has assessed the subject property for 2006 at $9,900,000. Based on the 2006 millage rate, the subject’s gross taxes are estimated at $211,031. Assuming a 4.0% discount for early payment and adding the personal property taxes, if applicable, the amount would be reduced to $205,161or $1,011 per unit, including personal property taxes. According to a
© 2007 CB Richard Ellis, Inc.
41
Table of Contents
| PRESIDENTIAL HOUSE | TAX AND ASSESSMENT DATA |
representative of Miami-Dade County Property Appraisers office, there are no delinquent property taxes encumbering the subject. The next re-assessment of the subject will be in January 2008, with tax bills presented to property owners in September or October 2008.
TAX COMPARABLES
As a crosscheck to the subject’s applicable real estate taxes, CBRE has reviewed the real estate tax information according to the Miami-Dade County for comparable properties in the market area. The following table summarizes the comparables employed for this analysis:
AD VALOREM TAX COMPARABLES
| 1820-1860 | |||||||||||||||||||||||||||||||||
| 17600 NW | 19455 NE | 1600 NE | 665 Ives | NE 142nd | 21010 NW | Subject Pro | |||||||||||||||||||||||||||
| Comparable Rental | 5th Avenue | 10th Avenue | 135th Street | Dairy Road | Street | 7th Avenue | Subject | Forma | |||||||||||||||||||||||||
| Year Built | 1972 | 1986 | 1971 | 1988 | 1974 | 1974 | 1966 | 1966 | |||||||||||||||||||||||||
| No. Units | 234 | 690 | 202 | 276 | 866 | 412 | 203 | 203 | |||||||||||||||||||||||||
| Tax Year | 2006 | 2006 | 2006 | 2006 | 2006 | 2006 | 2006 | 2007 | |||||||||||||||||||||||||
Total Assessed Value | $ | 10,700,000 | $ | 33,800,000 | $ | 12,524,000 | $ | 21,900,000 | $ | 60,975,000 | $ | 18,981,098 | $ | 9,900,000 | $ | 13,200,000 | |||||||||||||||||
AV Per Unit | $ | 45,726 | $ | 48,986 | $ | 62,000 | $ | 79,348 | $ | 70,410 | $ | 46,071 | $ | 48,768 | $ | 65,025 | |||||||||||||||||
Total Taxes | $ | 251,507 | $ | 701,242 | $ | 329,088 | $ | 454,355 | $ | 1,602,216 | $ | 445,080 | $ | 27,253 | $ | 281,375 | |||||||||||||||||
Per Unit | $ | 1,075 | $ | 1,016 | $ | 1,629 | $ | 1,646 | $ | 1,850 | $ | 1,080 | $ | 134 | $ | 1,386 | |||||||||||||||||
| Source: Assessor’s Office | ||
CONCLUSION
The tax comparables reflected an assessed value range from $45,726 to $79,348 per unit and total taxes of $1,016 to $1,646 per unit. These comparables are similar Class B/C apartment complexes located in proximity to the subject and similar in condition to the subject property. Generally, the tax appraisers’ office will assess the property based on 70% to 85% of the recorded purchase price of the property. The current assessed value of $9,900,000 (56.3% of the estimated value) is low and will likely be adjusted upward during the next re-assessment period. As such we have not relied on the current estimate in our report when estimating the market value of the property.
The following schedule summarizes the ratio of assessed value to sales price for three improved sales in Miami-Dade County.
© 2007 CB Richard Ellis, Inc.
42
Table of Contents
| PRESIDENTIAL HOUSE | TAX AND ASSESSMENT DATA |
RATIO OF ASSESSED VALUE TO SALE PRICE
| 1595 NE 135th | 4540 NW 107th | 1300 West 54th | Subject Pro | ||||||||||||||||||
| Comparable Sale | Street | Avenue | Street | Subject | Forma | ||||||||||||||||
| Year Built | 1971 | 1998 | 1969 | 1966 | 1966 | ||||||||||||||||
| No. Units | 127 | 258 | 258 | 203 | 203 | ||||||||||||||||
| Tax Year | 2006 | 2006 | 2006 | 2006 | 2007 | ||||||||||||||||
Total Assessed Value | $ | 7,700,000 | $ | 46,000,000 | $ | 17,000,000 | $ | 9,900,000 | $ | 13,200,000 | |||||||||||
| Date of Sale | Aug-05 | Oct-05 | Jul-05 | ||||||||||||||||||
Sales Price | $ | 11,100,000 | $ | 57,300,000 | $ | 21,177,500 | |||||||||||||||
AV Ratio | 69 | % | 80 | % | 80 | % | |||||||||||||||
Estimated Value of Subject | $ | 17,600,000 | $ | 17,600,000 | |||||||||||||||||
AV Ratio | 56 | % | 75 | % | |||||||||||||||||
| Source: Assessor’s Office | ||
Based on the above analysis, we have estimated that the subject building will be reassessed upon the sale of the property at approximately 75% of our estimated value. Based on the above analysis we have estimated the total assessment and real estate tax burden in the first year of our valuation projection as stabilized as follows:
SUBJECT AD VALOREM TAX EXPENSE
| 203 Units x $65,025 | per unit | $ | 13,200,000 | |||||
| Combined Millage Rate | 0.02131630 | |||||||
| Gross Real Estate Taxes | $ | 281,375 | ||||||
| Less Prepayment Discount | 4.00 | % | ( | $ | 11,255 | ) | ||
| Net Real Estate Taxes | $ | 270,120 | ||||||
| Plus: Personal Property Taxes | $ | 2,571 | ||||||
| Total Taxes | $ | 272,691 | ||||||
| Taxes per Unit | $ | 1,343 | ||||||
| Source: Compiled by CBRE | ||
The above estimated assessment and tax burden for the subject property equates to $65,025 per unit and taxes of $1,343 per unit, within the range of the tax comparables and reasonable based on similar reassessments in the marketplace. Should the subject property sell at or near our value estimate, the assessed value will be adjusted. The Property Appraiser will have this information and will adjust the assessed value accordingly. Although sales of similar properties have some effect on changes in the assessed value, the actual sale of the property being assessed has more significance and a change is almost assured.
Assessments in Miami-Dade County are reviewed annually and are subject to modification. Considering the assessment of comparable properties, sales of similar properties, assessed value
© 2007 CB Richard Ellis, Inc.
43
Table of Contents
| PRESIDENTIAL HOUSE | TAX AND ASSESSMENT DATA |
ratios of similar properties, which have recently sold, rent levels in the surrounding neighborhood and the market value/assessed value ratio of the subject property, it appears the projected assessment and tax burden estimated for the subject property is reasonable.
© 2007 CB Richard Ellis, Inc.
44
Table of Contents
| PRESIDENTIAL HOUSE | HIGHEST AND BEST USE |
HIGHEST AND BEST USE
In appraisal practice, the concept of highest and best use represents the premise upon which value is based. The four criteria the highest and best use must meet are:
| • | legal permissibility; | ||
| • | physical possibility; | ||
| • | financial feasibility; and | ||
| • | maximum profitability. |
Highest and best use analysis involves assessing the subject both as if vacant and as improved.
AS VACANT
Legal Permissibility
The legally permissible uses were discussed in detail in the Site Analysis and Zoning Sections.
Physical Possibility
The subject is adequately served by utilities, has an adequate shape and size, sufficient access, etc., to be a separately developable site. The subject site would reasonably accept a site layout for any of the legally probable uses. There are no known physical reasons why the subject site would not support any legally probable development. The existence of the present development on the site provides additional evidence for the physical possibility of development.
Financial Feasibility
The determination of financial feasibility is dependent primarily on the relationship of supply and demand for the legally probable land uses versus the cost to create the uses. As discussed in the market analysis of this report, the subject apartment market is generally stabilized. Development of new apartment properties has occurred in the past few years. Further, within the subject market, there are no proposed or under construction rental apartment projects in the competitive market. These factors indicate that it would be financially feasible to complete a new apartment project if the site acquisition cost was low enough to provide an adequate developer’s profit.
Maximum Profitability
The final test of highest and best use of the site as though vacant is that the use be maximally productive, yielding the highest return to the land. In the case of the subject as if vacant, the analysis has indicated that a new apartment project would be most appropriate.
© 2007 CB Richard Ellis, Inc.
45
Table of Contents
| PRESIDENTIAL HOUSE | HIGHEST AND BEST USE |
CONCLUSION: HIGHEST AND BEST USE AS VACANT
Based on the information presented above and upon information contained in the market and neighborhood analysis, we conclude that the highest and best use of the subject as if vacant, would be the development an apartment property. Our analysis of the subject and its respective market characteristics indicate the most likely buyer, as if vacant, would be an investor (land speculation) or a developer.
AS IMPROVED
Legal Permissibility
As discussed, the subject site’s zoning and legal restrictions permit a variety of land uses. The site has been improved with an apartment development that is a legal, nonconforming use due to the number of parking spaces.
Physical Possibility
The physical characteristics of the subject improvements were discussed in detail in the improvements analysis. Both the layout and positioning of the improvements are considered functional for apartment use. While it would be physically possible for a wide variety of uses, based on the legal restrictions and the design of the improvements, the continued use of the property for apartment users would be the most functional use.
Financial Feasibility
The financial feasibility of an apartment property is based on the amount of rent which can be generated, less operating expenses required to generate that income; if a residual amount existing, then the land is being put to a productive use. As will be indicated in the income capitalization approach, the subject is producing a positive net cash flow and continued utilization of the improvements for apartment purposes is considered financially feasible.
Maximum Profitability
The maximally profitable use of the subject as improved should conform to neighborhood trends and be consistent with existing land uses. Although several uses may generate sufficient revenue to satisfy the required rate of return on investment and provide a return on the land, the single use that produces the highest price or value is typically the highest and best use. As shown in the applicable valuation sections, buildings that are similar to the subject have been acquired or continue to be used by apartment owners/tenants. Two of the comparable sales were been acquired for conversion to condominiums; however, this market has softened considerably in recent months and conversion to condos is not a financially feasible alternative for the subject. The other comparables would indicate
© 2007 CB Richard Ellis, Inc.
46
Table of Contents
| PRESIDENTIAL HOUSE | HIGHEST AND BEST USE |
that the maximally productive use of the property is consistent with the existing use as an apartment property.
CONCLUSION: HIGHEST AND BEST USE AS IMPROVED
Based on the foregoing, the highest and best use of the property, as improved, is consistent with the existing use, as an apartment development.
© 2007 CB Richard Ellis, Inc.
47
Table of Contents
| PRESIDENTIAL HOUSE | APPRAISAL METHODOLOGY |
APPRAISAL METHODOLOGY
In appraisal practice, an approach to value is included or omitted based on its applicability to the property type being valued and the quality and quantity of information available.
COST APPROACH
The cost approach is based upon the proposition that the informed purchaser would pay no more for the subject than the cost to produce a substitute property with equivalent utility. This approach is particularly applicable when the property being appraised involves relatively new improvements that represent the highest and best use of the land, or when it is improved with relatively unique or specialized improvements for which there exist few sales or leases of comparable properties.
SALES COMPARISON APPROACH
The sales comparison approach utilizes sales of comparable properties, adjusted for differences, to indicate a value for the subject. Valuation is typically accomplished using physical units of comparison such as price per square foot, price per unit, price per floor, etc., or economic units of comparison such as gross rent multiplier. Adjustments are applied to the physical units of comparison derived from the comparable sale. The unit of comparison chosen for the subject is then used to yield a total value. Economic units of comparison are not adjusted, but rather analyzed as to relevant differences, with the final estimate derived based on the general comparisons.
INCOME CAPITALIZATION APPROACH
The income capitalization approach reflects the subject’s income-producing capabilities. This approach is based on the assumption that value is created by the expectation of benefits to be derived in the future. Specifically estimated is the amount an investor would be willing to pay to receive an income stream plus reversion value from a property over a period of time. The two common valuation techniques associated with the income capitalization approach are direct capitalization and the discounted cash flow (DCF) analysis.
METHODOLOGY APPLICABLE TO THE SUBJECT
In valuing the subject, all three approaches are applicable and have been utilized. In addition, the replacement cost has been utilized within the analysis of insurable value.
© 2007 CB Richard Ellis, Inc.
48
Table of Contents
| PRESIDENTIAL HOUSE | LAND VALUE |
LAND VALUE
The following map and table summarize the comparable data used in the valuation of the subject site. A detailed description of each transaction is included in the addenda.

SUMMARY OF COMPARABLE LAND SALES
| Transaction | Density | Adjusted Sale | Price Per | Price Per | ||||||||||||||||
| No. | Property Location | Type | Date | Zoning | (UPA) | Price1 | Acre | Bldg Unit | ||||||||||||
| 1 | 3372 N.W. 17th Avenue, Miami, FL | Sale | Mar-06 | R-4 & G/I | 149.86 | $6,800,000 | $ | 2,403,421 | $ | 16,038 | ||||||||||
| 2 | 1551 N.W. 36th Street, Miami, FL | Sale | Jan-07 | C-2 | 114.44 | $2,749,000 | $ | 3,419,580 | $ | 29,880 | ||||||||||
| 3 | 12000 NE 16th Avenue, North Miami, FL | Sale | Feb-07 | RU-3M | 25.11 | $5,100,000 | $ | 569,196 | $ | 22,667 | ||||||||||
| Subject | 1572 NE 191st Street, | — | — | RU-4, High Density | 35.06 | — | — | — | ||||||||||||
| North Miami Beach, Florida | Apartment House District | |||||||||||||||||||
| 1 | Transaction amount adjusted for cash equivalency and/or development costs (where applicable) Compiled by CBRE |
© 2007 CB Richard Ellis, Inc.
49
Table of Contents
| PRESIDENTIAL HOUSE | LAND VALUE |
The sales utilized represent the best data available for comparison with the subject and were selected from within Miami-Dade County. These sales were chosen based upon similar uses after the sale.
DISCUSSION/ANALYSIS OF LAND SALES
Land Sale One
This comparable represents 2.8293 acres at 3372 N.W. 17th Avenue. The site has a rectangular shape with generally level topography and exhibits the following frontage: N.W. 33rd Street and N.W. 17th Avenue. At the time of the sale, the property was improved with a vacated building. The site is zoned R-4 & G/I, and the proposed use is for affordable housing. All utilities were available to the site. The property sold in March 2006 for $6,800,000, or $16,038 per proposed unit ($2,403,421 per acre). 424 units are proposed, for an overall density of 149.86 units per acre.
The upward market conditions (time) adjustment of 40% reflects the improved market conditions since the date of sale. The -5% downward adjustment for size reflects this comparable’s superior feature with respect to economies of scale regarding parcel size. With respect to zoning/density, this comparable was considered superior in this aspect and received a downward adjustment of
-10% because of a less restrictive zoning classification. Overall, this comparable was deemed superior in comparison to the subject and a downward net adjustment was warranted to the sales price indicator.
-10% because of a less restrictive zoning classification. Overall, this comparable was deemed superior in comparison to the subject and a downward net adjustment was warranted to the sales price indicator.
Land Sale Two
This comparable represents 0.8039 acres at 1551 N.W. 36th Street. The site has an irregular shape with generally level topography and exhibits the following frontage: N.W. 36th Street/N.W. 37th Street and N.W. 15th Avenue. At the time of the sale, the property was improved with a 2 story building with parking lot. The site is zoned C-2, and the proposed use is to 92-unit residential development. All utilities were available to the site. The property sold in January 2007 for $2,749,000, or $29,880 per proposed unit ($3,419,580 per acre). 92 units are proposed, for an overall density of 114.44 units per acre.
The -20% downward adjustment for size reflects this comparable’s superior feature with respect to economies of scale. With respect to zoning/density, this comparable was considered superior in this aspect and received a downward adjustment of -5% because of less restrictive zoning density. Overall, this comparable was deemed superior in comparison to the subject and a downward net adjustment was warranted to the sales price indicator.
Land Sale Three
This comparable represents 8.96 acres at 12000 NE 16th Avenue. The site has a rectangular shape with level, at street grade topography and exhibits the following frontage: NE 16th Avenue and NE 14th Avenue. At the time of the sale, the property was improved with a mobile home park. The site is
© 2007 CB Richard Ellis, Inc.
50
Table of Contents
| PRESIDENTIAL HOUSE | LAND VALUE |
zoned RU-3M, and the proposed use is for apartments. All utilities were available to the site. The property sold in February 2007 for $5,100,000, or $22,667 per proposed unit ($569,196 per acre). 225 units are proposed, for an overall density of 25.11 units per acre.
The 5% upward adjustment for size reflects this comparable’s inferior feature with respect to economies of scale. Overall, this comparable was deemed inferior in comparison to the subject and an upward net adjustment was warranted to the sales price indicator.
SUMMARY OF ADJUSTMENTS
Based on our comparative analysis, the following chart summarizes the adjustments warranted to each comparable.
© 2007 CB Richard Ellis, Inc.
51
Table of Contents
| PRESIDENTIAL HOUSE | LAND VALUE |
LAND SALES ADJUSTMENT GRID
| Comparable Number | 1 | 2 | 3 | Subject | ||||
| Transaction Type | Sale | Sale | Sale | — | ||||
| Transaction Date | Mar-06 | Jan-07 | Feb-07 | — | ||||
| Zoning | R-4 & G/I | C-2 | RU-3M | RU-4, High Density | ||||
| Density (UPA) | 149.86 | 114.44 | 25.11 | 35.06 | ||||
| Actual Sale Price | $6,800,000 | $2,725,000 | $5,100,000 | — | ||||
Adjusted Sale Price 1 | $6,800,000 | $2,749,000 | $5,100,000 | — | ||||
| Size (Acres) | 2.83 | 0.80 | 8.96 | 5.79 | ||||
| Size (SF) | 123,244 | 35,018 | 390,298 | 252,212 | ||||
| Price Per Acre | $2,403,421 | $3,419,580 | $569,196 | — | ||||
| Price Per SF | $55.18 | $78.50 | $13.07 | — | ||||
| Price Per Unit | $16,038 | $29,880 | $22,667 | — | ||||
| Price ($ Per Unit) | $16,038 | $29,880 | $22,667 | |||||
| Property Rights Conveyed | 0% | 0% | 0% | |||||
Financing Terms 1 | 0% | 0% | 0% | |||||
| Conditions of Sale | 0% | 0% | 0% | |||||
| Market Conditions (Time) | 40% | 0% | 0% | |||||
| Subtotal | $22,453 | $29,880 | $22,667 | |||||
| Size | -5% | -20% | 5% | |||||
| Location | 0% | 0% | 0% | |||||
| Zoning/Density | -10% | -5% | 0% | |||||
| Utilities | 0% | 0% | 0% | |||||
| Highest & Best Use | 0% | 0% | 0% | |||||
| Total Other Adjustments | -15% | -25% | 5% | |||||
| Value Indication for Subject | $19,085 | $22,410 | $23,800 | |||||
1 Transaction amount adjusted for cash equivalency and/or development costs (where applicable) Compiled by CBRE |
CONCLUSION
Based on the preceding analysis, Comparable Three was the most representative of the subject site, and warranted greatest consideration because it is a recent transaction that required minimal adjustments when compared to the subject. In conclusion, a price per unit indication towards the upper end of the range was most appropriate for the subject. The following table presents the valuation conclusion:
© 2007 CB Richard Ellis, Inc.
52
Table of Contents
| PRESIDENTIAL HOUSE | LAND VALUE |
CONCLUDED LAND VALUE
| $ Per Unit | Subject Units | Total | ||||||||||||||
| $20,000 | x | 203 | = | $ | 4,060,000 | |||||||||||
| $23,500 | x | 203 | = | $ | 4,770,500 | |||||||||||
Indicated Value: | $ | 4,700,000 | ||||||||||||||
| Compiled by CBRE |
The value equates to approximately $23,150 per unit. This falls within the range of $16,038 to $29,880 indicated by the comparable sales, thereby lending support to our value conclusion.
© 2007 CB Richard Ellis, Inc.
53
Table of Contents
| PRESIDENTIAL HOUSE | COST APPROACH |
COST APPROACH
In estimating the replacement cost new for the subject, the following methods/data sources have been utilized (where available):
| • | the comparative unit method has been employed, utilizing the Marshall Valuation Service (MVS) cost guide, published by Marshall and Swift, LLC; |
MARSHALL VALUATION SERVICE
Direct Cost
Salient details regarding the direct costs are summarized in the Cost Approach Conclusion at the end of this section. TheMVScost estimates include the following:
| 1. | average architect’s and engineer’s fees for plans, plan check, building permits and survey(s) to establish building line; | ||
| 2. | normal interest in building funds during the period of construction plus a processing fee or service charge; | ||
| 3. | materials, sales taxes on materials, and labor costs; | ||
| 4. | normal site preparation including finish grading and excavation for foundation and backfill; | ||
| 5. | utilities from structure to lot line figured for typical setback; | ||
| 6. | contractor’s overhead and profit, including job supervision, workmen’s compensation, fire and liability insurance, unemployment insurance, equipment, temporary facilities, security, etc.; | ||
| 7. | site improvements (included as lump sum additions); and | ||
| 8. | initial tenant improvement costs are included inMVScost estimate. However, additional lease-up costs such as advertising, marketing and leasing commissions are not included. |
Base building costs (direct costs) are adjusted to reflect the physical characteristics of the subject. Making these adjustments, including the appropriate local and current cost multipliers, the direct building cost is indicated.
Additions
Items not included in the direct building cost estimate include parking and walks, signage, landscaping, and miscellaneous site improvements. The cost for these items is estimated separately using the segregated cost sections of theMVScost guide.
Indirect Cost Items
Several indirect cost items are not included in the direct building cost figures derived through theMVScost guide. These items include developer overhead (general and administrative costs), property taxes, legal and insurance costs, local development fees and contingencies, lease-up and marketing costs and miscellaneous costs. Research into these cost items indicates that an average property requires an allowance of about 25% to 35% of the total direct costs.
© 2007 CB Richard Ellis, Inc.
54
Table of Contents
| PRESIDENTIAL HOUSE | COST APPROACH |
MVS Conclusion
The concluded direct and indirect building cost estimate obtained via the MVS cost guide (Section 12, Page 14) is illustrated as follows:
MARSHALL VALUATION SERVICE COST SCHEDULE
| Primary Building Type: | Apartment | Height per Story: | 8’ | |||
| Effective Age: | 26 YRS | Number of Buildings: | 4 | |||
| Quality/Condition: | Average | Gross Building Area: | 184,650 SF | |||
| Exterior Wall: | Concrete Block | Net Rentable Area: | 183,150 SF | |||
| Number of Units: | 203 | Average Unit Size: | 902 SF | |||
| Number of Stories: | 3 & 4 | Average Floor Area: | N/A |
| MVS Sec/Page/Class | 12/14/C-Good | |||||||
Building Component | Multiple | |||||||
| Residences | ||||||||
Component Sq. Ft. | 184,650 SF | |||||||
Base Square Foot Cost | $ | 81.37 | ||||||
Square Foot Refinements | ||||||||
| Heating and Cooling | $ | 0.00 | ||||||
| Sprinklers | $ | 0.00 | ||||||
| Appliances | $2,500 each | $ | 2.75 | |||||
| Patios & Balconies | $ | 3.74 | ||||||
| Subtotal | $ | 87.86 | ||||||
Height and Size Refinements | ||||||||
| Number of Stories Multiplier | 1.00 | |||||||
| Height per Story Multiplier | 1.00 | |||||||
| Floor Area Multiplier | 1.00 | |||||||
| Subtotal | $ | 87.86 | ||||||
Cost Multipliers | ||||||||
| Current Cost Multiplier | 1.05 | |||||||
| Local Multiplier | 0.94 | |||||||
Final Square Foot Cost | $ | 86.72 | ||||||
Base Component Cost | $ | 16,012,162 | ||||||
Base Building Cost | (via Marshall Valuation Service cost data) | $ | 16,012,162 | |||||
Additions | ||||||||
| Signage, Landscaping & Misc. Site Improvements | $ | 150,000 | ||||||
| Parking/Walks | $ | 1,000,000 | ||||||
| Other | $ | 0 | ||||||
Direct Building Cost | $ | 17,162,162 | ||||||
Indirect Costs | 30.0% of Direct Building Cost | $ | 5,148,649 | |||||
Direct and Indirect Building Cost | $ | 22,310,810 | ||||||
Rounded | $ | 22,311,000 | ||||||
| Compiled by CBRE |
DIRECT AND INDIRECT COST CONCLUSION
The indicated direct and indirect building costs for the subject are illustrated as follows:
© 2007 CB Richard Ellis, Inc.
55
Table of Contents
| PRESIDENTIAL HOUSE | COST APPROACH |
DIRECT AND INDIRECT COST CONCLUSION
| Source | Total | Per Unit | Per SF | |||||||||
| MVS Cost Guide | $ | 22,311,000 | $ | 109,906 | $ | 120.83 | ||||||
CBRE Estimate | $ | 22,311,000 | $ | 109,906 | $ | 120.83 | ||||||
| Compiled by CBRE |
The MVS cost guide was given most consideration towards a cost conclusion for the subject.
ENTREPRENEURIAL PROFIT
Entrepreneurial profit represents the return to the developer, and is separate from contractor’s overhead and profit. This line item, which is a subjective figure, tends to range from 5% to 15% of total direct and indirect costs for this property type, based on discussions with developers active in this market.
ACCRUED DEPRECIATION
There are essentially three sources of accrued depreciation:
| 1. | physical deterioration, both curable and incurable; | ||
| 2. | functional obsolescence, both curable and incurable; and | ||
| 3. | external obsolescence. |
Physical Deterioration
The subject’s physical condition was detailed in the improvements analysis. Curable deterioration affecting the improvements results from deferred maintenance and, if applicable, was previously discussed. With regard to incurable deterioration, the subject improvements are considered to have deteriorated due to normal wear and tear associated with natural aging. The following chart provides a summary of the remaining economic life.
ECONOMIC AGE AND LIFE
| Actual Age | 41 Years | |||
| Effective Age | 26 Years | |||
| MVS Expected Life | 55 Years | |||
| Remaining Economic Life | 29 Years | |||
| Accrued Physical Incurable Depreciation | 47.3 | % | ||
| Compiled by CBRE |
Functional Obsolescence
Based on a review of the design and layout of the improvements, no forms of curable functional obsolescence were noted. Because replacement cost considers the construction of the subject
© 2007 CB Richard Ellis, Inc.
56
Table of Contents
| PRESIDENTIAL HOUSE | COST APPROACH |
improvements utilizing modern materials and current standards, design and layout, functional incurable obsolescence normally is not applicable.
External Obsolescence
Based on a review of the local market and neighborhood, no forms of external obsolescence affect the subject.
COST APPROACH CONCLUSION
The value estimate is calculated as follows.
COST APPROACH CONCLUSION
| Building Type: | Apartment | Height per Story: | 8’ | |||
| Effective Age: | 26 YRS | Number of Buildings: | 4 | |||
| Quality/Condition: | Average | Gross Building Area: | 184,650 SF | |||
| Exterior Wall: | Concrete Block | Net Rentable Area: | 183,150 SF | |||
| Number of Units: | 203 | Average Unit Size: | 902 SF | |||
| Number of Stories: | 3 & 4 | Average Floor Area: | N/A |
Direct and Indirect Building Cost | $ | 22,311,000 | ||||||||
Entrepreneurial Profit | 10.0% of Total Building Cost | $ | 2,231,100 | |||||||
Replacement Cost New | $ | 24,542,100 | ||||||||
Accrued Depreciation | ||||||||||
| Incurable Physical Deterioration | 47.3% of Replacement Cost New less | $ | (11,601,720 | ) | ||||||
| Curable Physical Deterioration | ||||||||||
| Functional Obsolescence | $ | 0 | ||||||||
| External Obsolescence | $ | 0 | ||||||||
| Total Accrued Depreciation | 47.3% of Replacement Cost New | $ | (11,601,720 | ) | ||||||
Depreciated Replacement Cost | $ | 12,940,380 | ||||||||
Land Value | $ | 4,700,000 | ||||||||
Stabilized Value Indication | $ | 17,640,380 | ||||||||
Curable Physical Deterioration | $ | 0 | ||||||||
Lease-Up Discount | $ | 0 | ||||||||
Value Indication | $ | 17,640,380 | ||||||||
Rounded | $ | 17,600,000 | ||||||||
Value Per Unit | $ | 86,700 | ||||||||
| Compiled by CBRE |
© 2007 CB Richard Ellis, Inc.
57
Table of Contents
| PRESIDENTIAL HOUSE | INSURABLE VALUE |
INSURABLE VALUE
As part of the client’s requested scope of work, an estimate of insurable value is provided herein. CBRE has followed traditional appraisal standards to develop a reasonable calculation based upon industry practices and industry accepted publications such as Marshall Valuation Service. The methodology employed is a derivation of the cost approach and is not reliable for insurable value estimates. Actual construction costs and related estimates can vary greatly from this estimate.
The insurable value estimate presented herein is intended to reflect the value of the destructible portions of the subject, based on the replacement of physical items that are subject to loss from hazards (excluding indestructible items such as basement excavation, foundation, site work, land value and indirect costs). In the case of the subject, this estimate is based upon the base building costs (direct costs) as obtained via the Marshall Valuation Service handbook, with appropriate deductions.
This analysis should not be relied upon to determine proper insurance coverage as only consultants considered experts in cost estimation and insurance underwriting are qualified to provide an insurable value. It is provided to aid the client/reader/user as part of their overall decision making process and no representations or warranties are made by CBRE regarding the accuracy of this estimate and it is strongly recommend that other sources be utilized to develop any estimate of insurable value.
© 2007 CB Richard Ellis, Inc.
58
Table of Contents
| PRESIDENTIAL HOUSE | INSURABLE VALUE |
INSURABLE VALUE CONCLUSION
| Building Type: | Apartment | Height per Story: | 8’ | |||
| Effective Age: | 26 YRS | Number of Buildings: | 4 | |||
| Quality/Condition: | Average | Gross Building Area: | 184,650 SF | |||
| Exterior Wall: | Concrete Block | Net Rentable Area: | 183,150 SF | |||
| Number of Units: | 203 | Average Unit Size: | 902 SF | |||
| Number of Stories: | 3 & 4 | Average Floor Area: | N/A |
| MVS Sec/Page/Class | 12/14/C-Good | |||||||
Building Component | Multiple | |||||||
| Residences | ||||||||
Component Sq. Ft. | 184,650 SF | |||||||
Base Square Foot Cost | $ | 81.37 | ||||||
Square Foot Refinements | ||||||||
| Heating and Cooling | ||||||||
| Appliances | $2,500each | $ | 2.75 | |||||
| Patios & Balconies | $ | 3.74 | ||||||
| Subtotal | $ | 87.86 | ||||||
Height and Size Refinements | ||||||||
| Number of Stories Multiplier | 1.00 | |||||||
| Height per Story Multiplier | 1.00 | |||||||
| Floor Area Multiplier | 1.00 | |||||||
| Subtotal | $ | 87.86 | ||||||
Cost Multipliers | ||||||||
| Current Cost Multiplier | 1.05 | |||||||
| Local Multiplier | 0.94 | |||||||
Final Square Foot Cost | $ | 86.72 | ||||||
Base Component Cost | $ | 16,012,162 | ||||||
Base Building Cost | (via Marshall Valuation Service cost data) | $ | 16,012,162 | |||||
Insurable Value Exclusions | 10.0% of Total Building Cost | $ | (1,601,216 | ) | ||||
Insurable Value Indication | $ | 14,410,946 | ||||||
Rounded | $ | 14,410,000 | ||||||
Value Per Unit | $ | 70,985 | ||||||
Compiled by CBRE
© 2007 CB Richard Ellis, Inc.
59
Table of Contents
| PRESIDENTIAL HOUSE | SALES COMPARISON APPROACH |
SALES COMPARISON APPROACH
The following map and table summarize the comparable data used in the valuation of the subject. A detailed description of each transaction is included in the addenda.
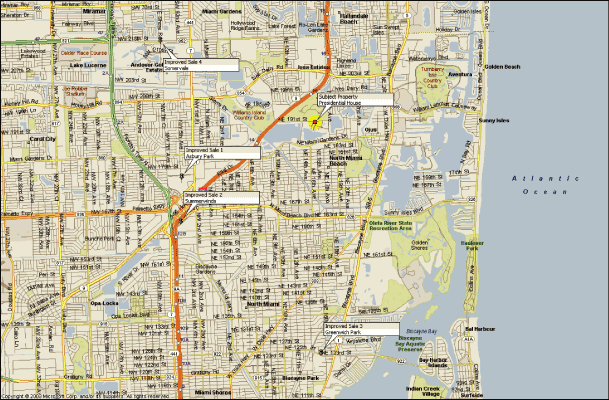
SUMMARY OF COMPARABLE APARTMENT SALES
| Transaction | Year | No. | Avg. Unit | Adjusted | Price Per | NOI Per | |||||||||||||||||||||||||||||||||||
| No. | Name | Type | Date | Built | Units | Size | Sale Price1 | Unit1 | Occ. | Unit | OAR | ||||||||||||||||||||||||||||||
| 1 | Asbury Park Apartments, Miami, FL | Sale | Mar-06 | 1972 | 234 | 737 | $ | 15,896,227 | $ | 67,933 | 96 | % | $ | 4,558 | 6.71 | % | |||||||||||||||||||||||||
| 2 | Summerwinds, North Miami, FL | Sale | Aug-06 | 1972 | 348 | 838 | $ | 32,000,000 | $ | 91,954 | 98 | % | $ | 5,595 | 6.09 | % | |||||||||||||||||||||||||
| 3 | Greenwich Park, North Miami, FL | Contract | Mar-07 | 1985 | 402 | 827 | $ | 43,000,000 | $ | 106,965 | 98 | % | $ | 5,828 | 5.45 | % | |||||||||||||||||||||||||
| 4 | Somervale Apartments, Miami, FL | Contract | May-07 | 1974 | 412 | 1,042 | $ | 39,000,000 | $ | 94,660 | 91 | % | $ | 5,755 | 6.08 | % | |||||||||||||||||||||||||
| Subj. Pro Forma | Presidential House, North Miami Beach, Florida | — | — | 1966 | 203 | 902 | — | — | 95 | % | $ | 5,198 | — | ||||||||||||||||||||||||||||
1 Transaction amount adjusted for cash equivalency and/or deferred maintenance (where applicable) Compiled by CBRE
© 2007 CB Richard Ellis, Inc.
60
Table of Contents
| PRESIDENTIAL HOUSE | SALES COMPARISON APPROACH |
The sales utilized represent the best data available for comparison with the subject. They were selected from our research of comparable improved sales within a four-mile radius of the subject. These sales were chosen as they represent multi-family projects with similar income characteristics as the subject.
DISCUSSION/ANALYSIS OF IMPROVED SALES
Improved Sale One
This comparable represents a garden-style multifamily property consisting of 234 units and is situated on an 8-acre parcel at 17600 N.W. 5th Avenue, Miami, FL. The improvements were originally constructed in 1972 and were considered in fair condition at the time of sale. The exterior walls depict concrete construction components. The average unit size was 737 square feet and project/unit amenities included leasing/management office, on-site laundry, security patrol and tot-lot. The property sold in March 2006 for $15,896,227, or $67,933 per unit. Existing net operating income at the time of sale was $1,066,662, or $4,558 per unit, for an overall capitalization rate of 6.71%. The property’s EGIM was calculated at 8.29 and occupancy at the time of sale was 96%. This complex of 234 units is located at the southwest corner of N.W. 177th Street and N.W. 5th Avenue, in northwest Miami-Dade County.
In terms of average unit size, this comparable was judged inferior and received an upward adjustment of 8% for this characteristic. An upward adjustment of 20% was applied to this comparable for its inferior condition attribute when compared to the subject, based upon our inspection of the property at the time of sale. Overall, this comparable was deemed inferior in comparison to the subject and an upward net adjustment was warranted to the sales price indicator.
Improved Sale Two
This comparable represents a mid-rise style multifamily property consisting of 348 units and is situated on an 8.89-acre parcel at 490 NW 165th Street Road, North Miami, FL. The improvements were originally constructed in 1972 and were considered in average condition at the time of sale. The exterior walls depict concrete construction components. The average unit size was 838 square feet and project/unit amenities included pool, clubhouse, and fitness center. The property sold in August 2006 for $32,000,000, or $91,954 per unit. Pro Forma net operating income at the time of sale was $1,947,333, or $5,596 per unit, for an overall capitalization rate of 6.09%. The property’s EGIM was calculated at 7.91 and occupancy at the time of sale was 98%. This property was purchased for condo conversion. The sale property is a four building six-story mid-rise type development located just southeast of Interstate 95 and the Golden Glades interchange.
A downward adjustment of -5% was applied to this comparable for its superior age/condition attribute when compared to the subject, based upon our physical inspection of the property for the sale.
© 2007 CB Richard Ellis, Inc.
61
Table of Contents
| PRESIDENTIAL HOUSE | SALES COMPARISON APPROACH |
Overall, this comparable was deemed superior in comparison to the subject and a downward net adjustment was warranted to the sales price indicator.
Improved Sale Three
This comparable represents a mid-rise style multifamily property consisting of 402 units and is situated on a 9.44-acre parcel at 1550 NE 123rd Street, North Miami, FL. The improvements were originally constructed in 1985 and were considered in average condition at the time of sale. The exterior walls depict concrete construction components. The average unit size was 827 square feet and project/unit amenities included gated entry, two pools, fitness center, clubhouse, tennis courts, indoor racquetball court, spa and laundry on each floor. The property was placed under contract in March 2007 for $43,000,000, or $106,965 per unit. Pro Forma net operating income at the time of contract was $2,343,197, or $5,829 per unit, for an overall capitalization rate of 5.45%. The property’s EGIM was calculated at 8.51 and occupancy at the time of contract was 98%. This contract for sale is part of the Greenwich Park apartments. One of the buildings is condominiums and is not included. The property for sale includes six, five-story buildings containing 402 units with a mix of studio, one-bedroom and two-bedroom units.
A downward adjustment of -20% was applied to this comparable for its superior age/condition attribute when compared to the subject, based upon our physical inspection of the comparable for the sale. Overall, this comparable was deemed superior in comparison to the subject and a downward net adjustment was warranted to the sales price indicator.
Improved Sale Four
This comparable represents a mid-rise-style multifamily property consisting of 412 units and is situated on a 13.78-acre parcel at 21010 NW 7th Avenue, Miami, FL. The improvements were originally constructed in 1974 and were considered in average condition at the time of sale. The exterior walls depict concrete construction components. The average unit size was 1,042 square feet and project/unit amenities included pool, fitness center, business center, tennis courts, and laundry facilities. The property was placed under contract in May 2007 for $39,000,000, or $94,660 per unit. Pro Forma net operating income at the time of contract was $2,371,305, or $5,756 per unit, for an overall capitalization rate of 6.08%. The property’s EGIM was calculated at 7.68 and occupancy at the time of contract was 91%. This project is under contract and slated for condo conversion after the purchase. The income and expense data is based on actual at the time of sale adjusted for taxes in line with the sale price ($1,665/unit) and reserves of $200 were included.
In terms of average unit size, this comparable was judged superior and received a downward adjustment of -7% for this characteristic. Overall, this comparable was deemed superior in comparison to the subject and a downward net adjustment was warranted to the sales price indicator.
© 2007 CB Richard Ellis, Inc.
62
Table of Contents
| PRESIDENTIAL HOUSE | SALES COMPARISON APPROACH |
SUMMARY OF ADJUSTMENTS
Based on our comparative analysis, the following chart summarizes the adjustments warranted to each comparable.
APARTMENT SALES ADJUSTMENT GRID
| Comparable Number | 1 | 2 | 3 | 4 | Subj. Pro Forma | |||||||||||||||
| Transaction Type | Sale | Sale | Contract | Contract | — | |||||||||||||||
| Transaction Date | Mar-06 | Aug-06 | Mar-07 | May-07 | — | |||||||||||||||
| Year Built | 1972 | 1972 | 1985 | 1974 | 1966 | |||||||||||||||
| No. Units | 234 | 348 | 402 | 412 | 203 | |||||||||||||||
| Avg. Unit Size | 737 | 838 | 827 | 1,042 | 902 | |||||||||||||||
| Actual Sale Price | $ | 15,400,000 | $ | 32,000,000 | $ | 43,000,000 | $ | 39,000,000 | — | |||||||||||
Adjusted Sale Price1 | $ | 15,896,227 | $ | 32,000,000 | $ | 43,000,000 | $ | 39,000,000 | — | |||||||||||
Price Per Unit1 | $ | 67,933 | $ | 91,954 | $ | 106,965 | $ | 94,660 | — | |||||||||||
| Occupancy | 96 | % | 98 | % | 98 | % | 91 | % | 95 | % | ||||||||||
| NOI Per Unit | $ | 4,558 | $ | 5,595 | $ | 5,828 | $ | 5,755 | $ | 5,198 | ||||||||||
| OAR | 6.71 | % | 6.09 | % | 5.45 | % | 6.08 | % | — | |||||||||||
| Adj. Price Per Unit | $ | 67,933 | $ | 91,954 | $ | 106,965 | $ | 94,660 | ||||||||||||
| Property Rights Conveyed | 0 | % | 0 | % | 0 | % | 0 | % | ||||||||||||
Financing Terms1 | 0 | % | 0 | % | 0 | % | 0 | % | ||||||||||||
| Conditions of Sale | 0 | % | 0 | % | 0 | % | 0 | % | ||||||||||||
| Market Conditions (Time) | 0 | % | 0 | % | 0 | % | 0 | % | ||||||||||||
| Subtotal — Price Per Unit | $ | 67,933 | $ | 91,954 | $ | 106,965 | $ | 94,660 | ||||||||||||
| Location | 0 | % | 0 | % | 0 | % | 0 | % | ||||||||||||
| Project Size | 0 | % | 0 | % | 0 | % | 0 | % | ||||||||||||
| Avg. Unit Size | 8 | % | 0 | % | 0 | % | -7 | % | ||||||||||||
| Age/Condition | 20 | % | -5 | % | -20 | % | 0 | % | ||||||||||||
| Quality of Construction | 0 | % | 0 | % | 0 | % | 0 | % | ||||||||||||
| Project Amenities | 0 | % | 0 | % | 0 | % | 0 | % | ||||||||||||
| Parking | 0 | % | 0 | % | 0 | % | 0 | % | ||||||||||||
| Other | 0 | % | 0 | % | 0 | % | 0 | % | ||||||||||||
| Total Other Adjustments | 28 | % | -5 | % | -20 | % | -7 | % | ||||||||||||
Indicated Value Per Unit | $ | 86,954 | $ | 87,356 | $ | 85,572 | $ | 88,034 | ||||||||||||
1 Transaction amount adjusted for cash equivalency and/or deferred maintenance (where applicable) Compiled by CBRE
Overall, Comparables Two and Four were the most representative of the subject, and warranted greatest consideration because they required the fewest and smallest net adjustments when compared to the subject. The following chart presents the valuation conclusion:
© 2007 CB Richard Ellis, Inc.
63
Table of Contents
| PRESIDENTIAL HOUSE | SALES COMPARISON APPROACH |
EFFECTIVE GROSS INCOME MULTIPLIER ANALYSIS
The EGIM reflects the relationship between effective gross annual income and sales price. The EGIM is a unit of comparison that cannot be adjusted and, there, it is primarily utilized to indicate a point of tendency. The following illustrates the EGIM for each of the sales analyzed herein.
EFFECTIVE GROSS INCOME MULTIPLIER ANALYSIS
| Sale No. | Occupancy | OER | EGIM | |||||||||||||
| 1 | 96 | % | 44.35 | % | 8.29 | |||||||||||
| 2 | 98 | % | 51.89 | % | 7.91 | |||||||||||
| 3 | 98 | % | 53.64 | % | 8.51 | |||||||||||
| 4 | 91 | % | 53.31 | % | 7.68 | |||||||||||
| Subj. | 93 | % | 54.32 | % | — | |||||||||||
| Compiled by CBRE |
Generally speaking, as occupancy levels and expense ratios increase, EGIMs tend to decrease. Based upon this relationship, and given the subject’s stabilized occupancy and OER estimates, an EGIM towards the lower end of the range is appropriate.
SALES COMPARISON APPROACH CONCLUSION
The following table presents the estimated value for the subject as indicated by the sales comparison approach.
© 2007 CB Richard Ellis, Inc.
64
Table of Contents
| PRESIDENTIAL HOUSE | SALES COMPARISON APPROACH |
SALES COMPARISON APPROACH
| Total Units | X | Value Per Unit | = | Value | ||||||||||||||||
| 203 | X | $ | 86,000 | = | $ | 17,458,000 | ||||||||||||||
| 203 | X | $ | 88,000 | = | $ | 17,864,000 | ||||||||||||||
| EGI | X | EGIM | = | Value | ||||||||||||||||
| $ | 2,309,636 | X | 7.5 | = | $ | 17,322,269 | ||||||||||||||
VALUE CONCLUSION | ||||
Indicated Stabilized Value | $ | 17,600,000 | ||
| Deferred Maintenance | $ | 0 | ||
| Lease-Up Discount | $ | 0 | ||
Value Indication | $ | 17,600,000 | ||
Rounded | $ | 17,600,000 | ||
Value Per Unit | $ | 86,700 |
| Compiled by CBRE |
©2007 CB Richard Ellis, Inc.
65
Table of Contents
| PRESIDENTIAL HOUSE | INCOME CAPITALIZATION APPROACH |
INCOME CAPITALIZATION APPROACH
The following map and table summarize the comparable data used in the valuation of the subject. A detailed description of each transaction is included in the addenda.
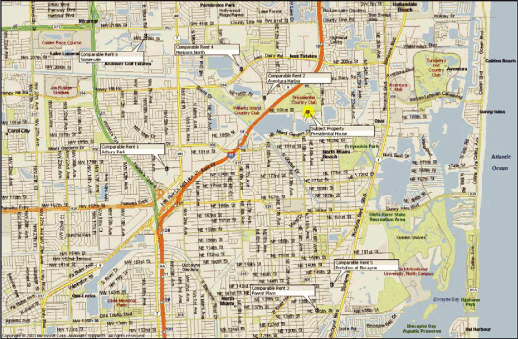
SUMMARY OF COMPARABLE APARTMENT RENTALS
| Comp. | Year | No. | Avg. Rent | |||||||||||||||||
| No. | Property Name | Location | Built | Occ. | Units | Per Unit | ||||||||||||||
| 1 | Asbury Park | 17600 NW 5th Avenue, Miami Gardens, FL | 1972 | 88 | % | 234 | $ | 917 | ||||||||||||
| 2 | Aventura Harbor | 19455 NE 10th Avenue, Miami, FL | 1986 | 98 | % | 690 | $ | 1,160 | ||||||||||||
| 3 | Forest Place | 1600 NE 135th Street, North Miami, FL | 1971 | 90 | % | 202 | $ | 1,058 | ||||||||||||
| 4 | Horizons North | 665 Ives Dairy Road, North Miami Beach, FL | 1988 | 96 | % | 276 | $ | 1,095 | ||||||||||||
| 5 | Portofino at Biscayne | 1820-1860 NE 142nd Street, North Miami, FL | 1974 | 100 | % | 866 | $ | 1,042 | ||||||||||||
| 6 | Somervale Apartments fka Oasis Club | 21010 NW 7th Avenue, Miami, FL | 1974 | 88 | % | 412 | $ | 992 | ||||||||||||
| Subj. Pro Forma | Presidential House | 1572 NE 191st Street, North Miami Beach, Florida | 1966 | 95 | % | 203 | — | |||||||||||||
| Compiled by CBRE |
© 2007 CB Richard Ellis, Inc.
66
Table of Contents
| PRESIDENTIAL HOUSE | INCOME CAPITALIZATION APPROACH |
The rentals utilized represent the best data available for comparison with the subject. They were selected from our research within a four-mile radius of the subject.
DISCUSSION/ANALYSIS OF RENT COMPARABLES
Rent Comparable One
This comparable rental represents the Asbury Park apartments, a 234-unit mid-rise-style multifamily property at 17600 NW 5th Avenue, Miami Gardens, FL. The improvements were originally constructed in 1972 and were considered in average condition at the time of our research. The structure’s exterior walls depict masonry construction components and the average unit size is 737 square feet. Project/unit amenities include the following: laundry rooms, elevators, and gated entry. According to the unit mix and asking rates for this property, the average base rental rate is $1.25 per square foot annually ($917/unit), based upon typical lease terms of 12 months. No rent premiums were reported. Utilities included with the rent consist of water, sewer, trash and concessions are not currently offered. The property is currently 88% leased.
As compared to the subject, this project was viewed as inferior with respect to location and unit size, while regarded as similar in terms of quality of construction, project amenities and design appeal. Overall, the subject should command higher rent on a per unit basis, but lower on a per square foot basis.
Rent Comparable Two
This comparable rental represents the Aventura Harbor apartments, a 690-unit mid-rise-style multifamily property at 19455 NE 10th Avenue, Miami, FL. The improvements were originally constructed in 1986 and were considered in average condition at the time of our research. The structure’s exterior walls depict cement block construction components and the average unit size is 925 square feet. Project/unit amenities include the following: 2 pools, spa, 2 tennis courts, playground, clubhouse, volleyball, and picnic/bbq area. According to the unit mix and asking rates for this property, the average base rental rate is $1.25 per square foot annually ($1,160/unit), based upon typical lease terms of 7 and 12 months. No rent premiums were reported. Utilities included with the rent consist of trash and pest control and concessions are not currently offered. The property is currently 98% leased. This mid-rise apartment complex is located in northeast Miami-Dade County. The property comprises 690 units housed in 6, five-story buildings having a mix of efficiencies, one- and two-bedroom units. Project density is 41.45 units per acre. Residents are responsible for water and sewer costs.
As compared to the subject, this project was viewed as similar with respect to location, quality of construction, while regarded as superior in terms of age/condition and project amenities. An upward
©2007 CB Richard Ellis, Inc.
67
Table of Contents
| PRESIDENTIAL HOUSE | INCOME CAPITALIZATION APPROACH |
adjustment is warranted for the resident paid utilities. Overall, the subject should command lower rents than this comparable.
Rent Comparable Three
This comparable rental represents the Forest Place apartments, a 202-unit high-rise-style multifamily property at 1600 NE 135th Street, North Miami, FL. The improvements were originally constructed in 1971 and were considered in average condition at the time of our research. The structure’s exterior walls depict cement block construction components and the average unit size is 1,086 square feet. Project/unit amenities include the following: laundry facility, sauna, pool and picnic area. According to the unit mix and asking rates for this property, the average base rental rate is $0.97 per square foot annually ($1,058/unit), based upon typical lease terms of 7 and 12 months. Rent premiums were reported for the following: reserved parking $50, floor $10-105. Utilities included with the rent consist of trash & pest control and concessions are not currently offered. The property is currently 90% leased. This 202-unit high rise apartment complex is comprised of two, nine-story buildings with a mix of one, two and penthouse units situated on a 2.8 acre site indicating a density of 72.1 units per acre. Residents are responsible for water and sewer costs.
As compared to the subject, this project was viewed as similar with respect to location, quality of construction, project amenities and design appeal, while regarded as inferior in terms of utilities included in the rent. Overall, this comparable is physically similar, but an upward adjustment is warranted for the utilities included in the rent at the subject.
Rent Comparable Four
This comparable rental represents the Horizons North apartments, a 276-unit garden-style multifamily property at 665 Ives Dairy Road, North Miami Beach, FL. The improvements were originally constructed in 1988 and were considered in average condition at the time of our research. The structure’s exterior walls depict concrete / stucco construction components and the average unit size is 1,001 square feet. Project/unit amenities include the following: pool, gym, gated access, spa, laundry, and clubhouse. According to the unit mix and asking rates for this property, the average base rental rate is $1.09 per square foot annually ($1,095/unit), based upon typical lease terms of 7 – 12 months. No rent premiums were reported. Utilities included with the rent consist of trash and pest and concessions currently offered consist of 1 month free on a 13-month lease. The stated rents are net of the concessions. The property is currently 96% leased. Horizons North is a 276 unit apartment complex located in North Miami Beach, Miami-Dade, Florida. The complex is in average condition and contains one, two and three bedroom floor plans. Tenants pay water/sewer.
As compared to the subject, this project was viewed as similar with respect to location, quality of construction and design appeal, while regarded as inferior in terms of utilities included in the rent at the subject. Additionally, this comparable is considered superior to the subject in terms of
©2007 CB Richard Ellis, Inc.
68
Table of Contents
| PRESIDENTIAL HOUSE | INCOME CAPITALIZATION APPROACH |
age/condition. Overall, this comparable is superior to the subject and the subject should command lower rents than this comparable.
Rent Comparable Five
This comparable rental represents the Portofino at Biscayne apartments, an 866-unit high-rise-style multifamily property at 1820-1860 NE 142nd Street, North Miami, FL. The improvements were originally constructed in 1974 and were considered in average condition at the time of our research. The structure’s exterior walls depict cement block construction components and the average unit size is 779 square feet. Project/unit amenities include the following: 2 lighted tennis courts, 2 pools, fitness center, 24-hour attended gatehouse, and picnic area. According to the unit mix and asking rates for this property, the average base rental rate is $1.34 per square foot annually ($1,042/unit), based upon typical lease terms of 7 & 12 months. Rent premiums were reported for the following: balcony $25, renovated units $50. Utilities included with the rent consist of water & sewer and trash removal and concessions are not currently offered. The property is currently 100% leased. This high-rise apartment complex is located in North Miami and comprises five 10-story buildings. The tenant profile at this complex is mainly singles and small families. There are 866 rental units. The apartment complex was renovated in 2004 and 2005.
As compared to the subject, this project was viewed as similar with respect to quality of construction, while regarded as superior in terms of location/view and condition. Overall, the subject should command lower rents than this comparable.
Rent Comparable Six
This comparable rental represents the Somervale apartments, a 412-unit mid/high-rise style multifamily property at 21010 NW 7th Avenue, Miami, FL. The improvements were originally constructed in 1974 and were considered in good condition at the time of our research. The structure’s exterior walls depict concrete block/ stucco construction components and the average unit size is 1,042 square feet. Project/unit amenities include the following: pool, fitness center, gated access, tennis court, laundry, and clubhouse. According to the unit mix and asking rates for this property, the average base rental rate is $0.95 per square foot annually ($992/unit), based upon typical lease terms of 12 months. No rent premiums were reported. Utilities included with the rent consist of trash and pest and concessions are not currently offered. The property is currently 88% leased; however, units are being held from rental operations in preparation of the conversion to condos.
As compared to the subject, this project was viewed as similar with respect to location, quality of construction, condition and design appeal, while regarded as inferior in terms of utilities included in the rent. Overall, this comparable is physically similar, but an upward adjustment is warranted for the utilities included in the rent at the subject.
©2007 CB Richard Ellis, Inc.
69
Table of Contents
| PRESIDENTIAL HOUSE | INCOME CAPITALIZATION APPROACH |
SUBJECT RENTAL INFORMATION
The following table depicts the subject’s unit mix and rental rates.
SUBJECT RENTAL INFORMATION
| No. of | Unit | Unit | Quoted | Rent | ||||||||||||||||
| Type | Units | Size (SF) | Occ. | Rents | Per SF | |||||||||||||||
| 1BR/1BA | 113 | 750 SF | 95 | % | $ | 869 | $ | 1.16 | ||||||||||||
| 1BR/1.5BA | 48 | 1,000 SF | 92 | % | $ | 929 | $ | 0.93 | ||||||||||||
| 2BR/2BA | 42 | 1,200 SF | 98 | % | $ | 1,209 | $ | 1.01 | ||||||||||||
| Upgraded Units | 10 | $ | 30 | |||||||||||||||||
| Total/Average: | 203 | 902 SF | 95 | % | $ | 955 | $ | 1.06 | ||||||||||||
Compiled by CBRE
According to on-site management, the most recent rental increases were implemented in June 2007 and were approximately $40.00 per unit per month for the small one-bedroom plan types and $10.00 per unit per month for the large one-bedroom and two-bedroom plan types. The subject has not yet implemented a RUBS program whereas the rental rates depicted are inclusive of gas, water, sewer and trash removal costs. Concessions are currently offered at the subject in terms of one month of free rent spread over a 13-month lease period. The concessions only apply to certain units and are not across the board.
ESTIMATE OF MARKET RENT
In order to estimate the market rates for the various floor plans, the subject unit types have been compared with similar units in the comparable projects. The following is a discussion of each unit type.
©2007 CB Richard Ellis, Inc.
70
Table of Contents
| PRESIDENTIAL HOUSE | INCOME CAPITALIZATION APPROACH |
One-Bedroom Units
SUMMARY OF COMPARABLE RENTALS
ONE BEDROOM UNITS
ONE BEDROOM UNITS
| Rental Rates | ||||||||||||||
| Comparable | Plan Type | Size | $/Mo. | $/SF | ||||||||||
Subject | 1BR/1.5BA | 1,000 SF | $ | 899 | $ | 0.90 | ||||||||
| Forest Place | 1 BR, 1 BA, Den | 1,200 SF | $ | 1,105 | $ | 0.92 | ||||||||
| Forest Place | 1 BR, 1 BA | 975 SF | $ | 925 | $ | 0.95 | ||||||||
| Forest Place | 1 BR, 1 BA | 911 SF | $ | 910 | $ | 1.00 | ||||||||
| Horizons North | 1 BR, 1.5 BA, Pent | 1,222 SF | $ | 1,223 | $ | 1.00 | ||||||||
| Somervale Apartments fka Oasis Club | 1 BD, 1.5 BA | 915 SF | $ | 920 | $ | 1.01 | ||||||||
| Somervale Apartments fka Oasis Club | 1 BD, 1 BA | 800 SF | $ | 905 | $ | 1.13 | ||||||||
Subject | 1BR/1BA | 750 SF | $ | 869 | $ | 1.16 | ||||||||
| Aventura Harbor | 1 BR, 1 BA | 850 SF | $ | 995 | $ | 1.17 | ||||||||
| Portofino at Biscayne | 1 BD/1 BA w/out Balc | 750 SF | $ | 979 | $ | 1.31 | ||||||||
| Horizons North | 1 BR, 1.5 BA | 690 SF | $ | 905 | $ | 1.31 | ||||||||
| Asbury Park | 1 BD, 1 BA | 625 SF | $ | 824 | $ | 1.32 | ||||||||
| Portofino at Biscayne | 1 BD/1 BA w/ Balcony | 750 SF | $ | 1,004 | $ | 1.34 | ||||||||
Compiled by CBRE
The subject’s quoted rental rates are within or at the lower end of the range indicated by the rent comparables. The subject’s rent roll indicates that a majority of the occupied one-bedroom units are leased at below the quoted rates, which is indicative of recent rental increases that have taken effect. The most recent leases of one bedroom units have been signed at the quoted rates, which when compared to the comparable data set is low. Considering the available data, the monthly market rent for the subject’s 750 square foot one-bedroom units is estimated at $875 per unit or $1.17 per square foot. The monthly market rent for the subject’s 1,000 square foot one-bedroom unit is estimated at $950 per unit or $0.95 per square foot. Both market rent estimates are well within the range indicated by the comparables.
©2007 CB Richard Ellis, Inc.
71
Table of Contents
| PRESIDENTIAL HOUSE | INCOME CAPITALIZATION APPROACH |
Two-Bedroom Units
SUMMARY OF COMPARABLE RENTALS
TWO BEDROOM UNITS
TWO BEDROOM UNITS
| Rental Rates | ||||||||||||||
| Comparable | Plan Type | Size | $/Mo. | $/SF | ||||||||||
| Somervale Apartments fka Oasis Club | 2 BD, 2 BA | 1,420 SF | $ | 1,140 | $ | 0.80 | ||||||||
| Somervale Apartments fka Oasis Club | 2 BD, 2 BA | 1,320 SF | $ | 1,120 | $ | 0.85 | ||||||||
| Somervale Apartments fka Oasis Club | 2 BD, 2 BA | 1,205 SF | $ | 1,105 | $ | 0.92 | ||||||||
| Horizons North | 2 BR, 2 BA, Pent | 1,476 SF | $ | 1,357 | $ | 0.92 | ||||||||
| Forest Place | 2 BR, 2 BA | 1,200 SF | $ | 1,190 | $ | 0.99 | ||||||||
Subject | 2BR/2BA | 1,200 SF | $ | 1,209 | $ | 1.01 | ||||||||
| Forest Place | 2 BR, 2.5 BA PH | 2,100 SF | $ | 2,200 | $ | 1.05 | ||||||||
| Horizons North | 2 BR, 2 BA w/Den | 1,015 SF | $ | 1,112 | $ | 1.10 | ||||||||
| Horizons North | 2 BR, 2 BA | 955 SF | $ | 1,052 | $ | 1.10 | ||||||||
| Aventura Harbor | 2 BR, 2 BA | 1,200 SF | $ | 1,350 | $ | 1.13 | ||||||||
| Portofino at Biscayne | 2 BD/2 BA w/Balcony | 1,070 SF | $ | 1,294 | $ | 1.21 | ||||||||
| Asbury Park | 2 BD, 1 BA | 800 SF | $ | 985 | $ | 1.23 | ||||||||
| Aventura Harbor | 2 BR, 2 BA | 980 SF | $ | 1,250 | $ | 1.28 | ||||||||
| Aventura Harbor | 2 BR, 1 BA | 930 SF | $ | 1,225 | $ | 1.32 | ||||||||
| Portofino at Biscayne | 2 BD/1 BA | 900 SF | $ | 1,194 | $ | 1.33 | ||||||||
Compiled by CBRE
The subject’s quoted rental rates are within the range indicated by the rent comparables. The subject’s rent roll indicates that a majority of the occupied two-bedroom units are leased at below the quoted rates, which is indicative of recent rental increases that have taken effect. The most recent leases of two bedroom units have been signed at varying rates, but generally near the quoted rate. Considering the available data, the monthly market rent for the subject units is estimated at $1,209 per unit or $1.01 per square foot.
MARKET RENT CONCLUSIONS
The following chart depicts the market rent conclusions for the subject:
MARKET RENT CONCLUSIONS
| No. | Unit | Monthly Rent | Annual Rent | Annual | ||||||||||||||||||||||||||||||||
| Units | Unit Type | Size | Total SF | $/Unit | $/SF | PRI | $/Unit | $/SF | Total | |||||||||||||||||||||||||||
| 113 | 1BR/1BA | 750 SF | 84,750 SF | $ | 875 | $ | 1.17 | $ | 98,875 | $ | 10,500 | $ | 14.00 | $ | 1,186,500 | |||||||||||||||||||||
| 48 | 1BR/1.5BA | 1,000 SF | 48,000 SF | $ | 950 | $ | 0.95 | $ | 45,600 | $ | 11,400 | $ | 11.40 | $ | 547,200 | |||||||||||||||||||||
| 42 | 2BR/2BA | 1,200 SF | 50,400 SF | $ | 1,209 | $ | 1.01 | $ | 50,778 | $ | 14,508 | $ | 12.09 | $ | 609,336 | |||||||||||||||||||||
| 10 | Upgraded Units | $ | 30 | $ | 300 | $ | 360 | $ | 3,600 | |||||||||||||||||||||||||||
| 203 | 902 SF | 183,150 SF | $ | 963 | $ | 1.07 | $ | 195,553 | $ | 11,560 | $ | 12.81 | $ | 2,346,636 | ||||||||||||||||||||||
Compiled by CBRE
© 2007CB Richard Ellis, Inc.
72
Table of Contents
| PRESIDENTIAL HOUSE | INCOME CAPITALIZATION APPROACH |
RENT ADJUSTMENTS
Rent adjustments are sometimes necessary to account for differences in rental rates applicable to different units within similar floor plans due to items such as location within the property, view, and level of amenities. These rental adjustments may be in the form of rent premiums or rent discounts.
As noted, the rental rates for some of the subject’s units vary depending upon whether or not they have been upgraded and modernized. According to the manager, the premium for upgraded units is $30 per month, which is in line with other multi-family projects that have renovated units in a similar fashion as the subject units.
RENT ROLL ANALYSIS
The rent roll analysis serves as a crosscheck to the estimate of market rent for the subject. The collections shown on the rent roll include rent premiums and/or discounts.
RENT ROLL ANALYSIS
| Total | Total | |||||||||||||||
| Revenue Component | Monthly Rent | Annual Rent | ||||||||||||||
| 192 Occupied Units at Contract Rates | $ | 179,412 | $ | 2,152,944 | ||||||||||||
| 11 Vacant Units at Quoted Rates | $ | 10,139 | $ | 121,668 | ||||||||||||
| 203 Total Units @ Contract Rent | $ | 189,551 | $ | 2,274,612 | ||||||||||||
| 203 Total Units @ Market Rent | $ | 195,553 | $ | 2,346,636 | ||||||||||||
Compiled by CBRE
The variation between the total annual rent reflected in the rent roll analysis and the market rent conclusion owes to older leases that do not reflect recent increases in rental rates, as well as our projections for higher rent on the one-bedroom units. Property management indicated that the majority of units are being signed at the quoted rates upon lease renewal. The recent rent roll provided also reflects that recently leased units are achieving the quoted rates, which when compared to the comparable data set is slightly low.
POTENTIAL RENTAL INCOME CONCLUSION
Within this analysis, potential rental income is estimated based upon the forward looking market rental rates over the next twelve months. This method of calculating rental income is most prevalent in the local market and is consistent with the method used to derive overall capitalization rates from the comparable sales data.
©2007 CB Richard Ellis, Inc.
73
Table of Contents
| PRESIDENTIAL HOUSE | INCOME CAPITALIZATION APPROACH |
POTENTIAL RENTAL INCOME
| Year | Total | % Change | ||||||
| 2005 | $ | 2,222,664 | — | |||||
| 2006 | $ | 2,420,206 | 9 | % | ||||
| 2007 Annualized | $ | 2,317,769 | -4 | % | ||||
| June 2007 T-12 | $ | 2,370,502 | 2 | % | ||||
CBRE Estimate | $ | 2,346,636 | -1 | % | ||||
| Compiled by CBRE | ||
Our pro forma estimate is approximately 3% less than the most recent full year due to pricing structure at the subject. In the past two full years, the subject has incurred a significant loss to lease due to quoting higher rents and achieving rates lower than the quoted rents. Thus far in 2007, the loss to lease is significantly lower; therefore the pro forma estimate should be in line with the annualized year amount.
In estimating the subject’s pro forma operating data, the actual operating history and budgets have been analyzed. The following table presents the available operating data history for the subject.
OPERATING HISTORY
| 2007 | June 2007 | |||||||||||||||||||||||||||||||
| Year-Occupancy | 2005 | 98% | 2006 | 96% | Annualized | 95% | T-12 | 95% | ||||||||||||||||||||||||
| Total | $/Unit | Total | $/Unit | Total | $/Unit | Total | $/Unit | |||||||||||||||||||||||||
Income | ||||||||||||||||||||||||||||||||
| Rental Income | $ | 2,172,432 | $ | 10,702 | $ | 2,318,315 | $ | 11,420 | $ | 2,204,662 | $ | 10,860 | $ | 2,243,206 | $ | 11,050 | ||||||||||||||||
| Loss To Lease | (186,576 | ) | (919 | ) | (182,598 | ) | (899 | ) | (43,950 | ) | (217 | ) | (90,502 | ) | (446 | ) | ||||||||||||||||
| Concessions | (102,820 | ) | (507 | ) | (75,761 | ) | (373 | ) | (54,520 | ) | (269 | ) | (47,937 | ) | (236 | ) | ||||||||||||||||
| Credit Loss | (40,504 | ) | (200 | ) | (90,085 | ) | (444 | ) | (74,814 | ) | (369 | ) | (114,089 | ) | (562 | ) | ||||||||||||||||
| Other Income | 76,091 | 375 | 123,024 | 606 | 179,990 | 887 | 165,064 | 813 | ||||||||||||||||||||||||
| Effective Gross Income | $ | 1,918,623 | $ | 9,451 | $ | 2,092,895 | $ | 10,310 | $ | 2,211,368 | $ | 10,893 | $ | 2,155,742 | $ | 10,619 | ||||||||||||||||
Expenses | ||||||||||||||||||||||||||||||||
| Real Estate Taxes | $ | 188,807 | $ | 930 | $ | 231,616 | $ | 1,141 | $ | 250,610 | $ | 1,235 | $ | 223,971 | $ | 1,103 | ||||||||||||||||
| Property Insurance | 75,782 | 373 | 132,319 | 652 | 92,222 | 454 | 118,144 | 582 | ||||||||||||||||||||||||
| Natural Gas | 30,489 | 150 | 34,790 | 171 | 37,246 | 183 | 33,924 | 167 | ||||||||||||||||||||||||
| Electricity | 32,403 | 160 | 49,752 | 245 | 39,880 | 196 | 49,408 | 243 | ||||||||||||||||||||||||
| Water & Sewer | 52,509 | 259 | 60,393 | 298 | 45,760 | 225 | 48,839 | 241 | ||||||||||||||||||||||||
| Cable Television | — | — | — | — | — | — | — | — | ||||||||||||||||||||||||
| Trash Removal | 22,988 | 113 | 22,878 | 113 | 41,524 | 205 | 36,058 | 178 | ||||||||||||||||||||||||
| Administrative & General | 44,332 | 218 | 66,669 | 328 | 85,906 | 423 | 76,597 | 377 | ||||||||||||||||||||||||
| Repairs & Maintenance | 52,536 | 259 | 67,296 | 332 | 87,786 | 432 | 79,853 | 393 | ||||||||||||||||||||||||
| Painting & Decorating | 37,040 | 182 | 40,504 | 200 | 48,314 | 238 | 46,207 | 228 | ||||||||||||||||||||||||
| Grounds (Landscaping) | 2,812 | 14 | 4,900 | 24 | 10,800 | 53 | 10,300 | 51 | ||||||||||||||||||||||||
| Management Fee | 95,595 | 471 | 101,901 | 502 | 105,824 | 521 | 103,405 | 509 | ||||||||||||||||||||||||
| Administrative Payroll | 121,271 | 597 | 126,982 | 626 | 130,896 | 645 | 123,639 | 609 | ||||||||||||||||||||||||
| Maintenance Payroll | 65,177 | 321 | 90,609 | 446 | 102,708 | 506 | 102,253 | 504 | ||||||||||||||||||||||||
| Employee Taxes & Benefits | 58,413 | 288 | 53,640 | 264 | 62,408 | 307 | 57,863 | 285 | ||||||||||||||||||||||||
| Employee Apts. (Non-Revenue Units) | 21,470 | 106 | 13,075 | 64 | 34,170 | 168 | 23,662 | 117 | ||||||||||||||||||||||||
| Advertising & Leasing | 36,648 | 181 | 48,927 | 241 | 114,848 | 566 | 86,871 | 428 | ||||||||||||||||||||||||
| Reserves for Replacement | — | — | — | — | — | — | — | — | ||||||||||||||||||||||||
| Operating Expenses | $ | 938,272 | $ | 4,622 | $ | 1,146,251 | $ | 5,647 | $ | 1,290,902 | $ | 6,359 | $ | 1,220,994 | $ | 6,015 | ||||||||||||||||
Net Operating Income | $ | 980,351 | $ | 4,829 | $ | 946,644 | $ | 4,663 | $ | 920,466 | $ | 4,534 | $ | 934,748 | $ | 4,605 | ||||||||||||||||
Annualized Amounts Represent 6 Months (Jan. through June 2007)
| Source: Operating statements | ||
© 2007 CB Richard Ellis, Inc.
74
Table of Contents
| PRESIDENTIAL HOUSE | INCOME CAPITALIZATION APPROACH |
LOSS TO LEASE
Within the local market, buyers and sellers typically recognize a reduction in potential rental income due to the difference between market and contract rental rates. In this market, lease rates are typically flat and are anticipated to roll to market every 12 months on average. As a result, actual collections typically lag behind market rates by approximately six months. Based upon the difference between market rent and contract rent, the loss to lease associated with the subject is estimated at 1.50% of gross rental income. This method of calculating rental income is most prevalent in the local market and is consistent with the method used to derive overall capitalization rates from the comparable sales data.
RENT CONCESSIONS
Rent concessions are currently not prevalent in the local market although the subject is quoting concessions on select units. With the subject’s occupancy at 94.6%, we have not considered any concessions going forward.
VACANCY
The subject’s estimated stabilized occupancy rate was previously discussed in the market analysis. The subject’s vacancy is detailed as follows:
VACANCY
| Year | % PGI | |||
| 2005 | 2 | % | ||
| 2006 | 4 | % | ||
| 2007 Annualized | 5 | % | ||
| June 2007 T-12 | 5 | % | ||
| Current | 5 | % | ||
CBRE Estimate | 5 | % | ||
| Compiled by CBRE | ||
CREDIT LOSS
The credit loss estimate is an allowance for nonpayment of rent or other income. The subject’s credit loss is detailed as follows:
© 2007 CB Richard Ellis, Inc.
75
Table of Contents
| PRESIDENTIAL HOUSE | INCOME CAPITALIZATION APPROACH |
CREDIT LOSS
| Year | % PGI | |||
| 2005 | -2.1 | % | ||
| 2006 | -4.2 | % | ||
| 2007 Annualized | -3.4 | % | ||
| June 2007 T-12 | -5.1 | % | ||
CBRE Estimate | -2.0 | % | ||
| Compiled by CBRE | ||
OTHER INCOME
Other income is supplemental to that derived from leasing of the improvements. This includes categories such as forfeited deposits, vending machines, late charges, etc. The subject’s ancillary income is detailed as follows:
OTHER INCOME
| Year | Total | $/Unit | ||||||
| 2005 | $ | 76,091 | $ | 375 | ||||
| 2006 | $ | 123,024 | $ | 606 | ||||
| 2007 Annualized | $ | 179,990 | $ | 887 | ||||
| June 2007 T-12 | $ | 165,064 | $ | 813 | ||||
CBRE Estimate | $ | 160,000 | $ | 788 | ||||
| Compiled by CBRE | ||
The primary source of other income is laundry income, late charges, lease cancellation fees and non-refundable administrative fees. Our estimate is slightly above the average Other Income for 2006 and 2007 Annualized and is generally supported by the available historical financial data.
EFFECTIVE GROSS INCOME
The subject’s effective gross income is detailed as follows:
EFFECTIVE GROSS INCOME
| Year | Total | % Change | ||||||
| 2005 | $ | 1,918,623 | — | |||||
| 2006 | $ | 2,092,895 | 9 | % | ||||
| 2007 Annualized | $ | 2,211,368 | 6 | % | ||||
| June 2007 T-12 | $ | 2,155,742 | -3 | % | ||||
CBRE Estimate | $ | 2,309,636 | 7 | % | ||||
| Compiled by CBRE | ||
© 2007 CB Richard Ellis, Inc.
76
Table of Contents
| PRESIDENTIAL HOUSE | INCOME CAPITALIZATION APPROACH |
Our pro forma estimate is approximately 4% higher than the current annualized year due to our estimate of lower loss to lease and credit loss. Our market rent estimate is supported by the market and the subject should be able to command the pro forma rates and only experience loss to lease as future rental rate increases take place. Further, the subject has experienced an unusually high credit loss. Prudent management is assumed and would typically not tolerate credit loss in excess of 2%.
OPERATING EXPENSE ANALYSIS
Expense Comparables
The following chart summarizes expenses obtained from recognized industry publications and/or comparable properties.
EXPENSE COMPARABLES
| Comparable Number | 1 | 2 | 3 | |||||||||
| Location | Miami | Miami | Miami | |||||||||
| Units | 412 | 402 | 196 | |||||||||
| Year Built | 1974 | 1985 | 1982 | |||||||||
| Expense Year | 2006 | 2006 | 2006 Annualized | |||||||||
| Effective Gross Income | $ | 10,029 | $ | 11,352 | $ | 8,813 | ||||||
| Other Income | $ | 603 | $ | 524 | $ | 105 | ||||||
| $/Unit | $/Unit | $/Unit | ||||||||||
| Expenses | ||||||||||||
| Real Estate Taxes | $ | 1,074 | $ | 1,783 | $ | 995 | ||||||
| Property Insurance | 848 | 249 | 699 | |||||||||
| Natural Gas | — | 204 | — | |||||||||
| Electricity | 357 | 258 | 197 | |||||||||
| Water & Sewer | 367 | 577 | 344 | |||||||||
| Cable Television | — | — | — | |||||||||
| Trash Removal | 124 | 119 | 102 | |||||||||
| Administrative & General | 165 | 164 | 370 | |||||||||
| Repairs & Maintenance | 919 | 101 | 314 | |||||||||
| Painting & Decorating | 584 | 278 | 20 | |||||||||
| Grounds (Landscaping) | 419 | 289 | 21 | |||||||||
| Management Fee | 393 | 454 | 536 | |||||||||
| (as a % of EGI) | 3.9 | % | 4.0 | % | 6.1 | % | ||||||
| Administrative Payroll | 1,471 | 299 | 367 | |||||||||
| Maintenance Payroll | — | 627 | 364 | |||||||||
| Employee Taxes & Benefits | — | 234 | 193 | |||||||||
| Employee Apts. (Non-Revenue Units) | 72 | 34 | — | |||||||||
| Advertising & Leasing | 89 | 43 | 23 | |||||||||
| Reserves for Replacement | — | — | — | |||||||||
| Operating Expenses | $ | 6,882 | $ | 5,713 | $ | 4,545 | ||||||
| Operating Expense Ratio | 68.6 | % | 50.3 | % | 51.6 | % | ||||||
| Source: Actual Operating Statements | ||
© 2007 CB Richard Ellis, Inc.
77
Table of Contents
| PRESIDENTIAL HOUSE | INCOME CAPITALIZATION APPROACH |
The following subsections represent the analysis for the pro forma estimate of each category of the subject’s stabilized expenses.
Real Estate Taxes
The real estate taxes for the subject were previously discussed. The subject’s expense is detailed as follows:
REAL ESTATE TAXES
| Year | Total | $/Unit | ||||||
| 2005 | $ | 188,807 | $ | 930 | ||||
| 2006 | $ | 231,616 | $ | 1,141 | ||||
| 2007 Annualized | $ | 250,610 | $ | 1,235 | ||||
| June 2007 T-12 | $ | 223,971 | $ | 1,103 | ||||
| Expense Comparable 1 | N/A | $ | 1,074 | |||||
| Expense Comparable 2 | N/A | $ | 1,783 | |||||
| Expense Comparable 3 | N/A | $ | 995 | |||||
CBRE Estimate | $ | 272,691 | $ | 1,343 | ||||
| Compiled by CBRE | ||
The subject’s recent historical and budgeted amounts are generally consistent and based upon the historical assessment of the property. Our estimate is based on a higher property assessment, in line with the estimated value and the trends of the Assessor’s office and current tax rate. This estimate is consistent with other properties operating in the area.
Property Insurance
Property insurance expenses typically include fire and extended coverage and owner’s liability coverage. The subject’s expense is detailed as follows:
PROPERTY INSURANCE
| Year | Total | $/Unit | ||||||
| 2005 | $ | 75,782 | $ | 373 | ||||
| 2006 | $ | 132,319 | $ | 652 | ||||
| 2007 Annualized | $ | 92,222 | $ | 454 | ||||
| June 2007 T-12 | $ | 118,144 | $ | 582 | ||||
| Expense Comparable 1 | N/A | $ | 848 | |||||
| Expense Comparable 2 | N/A | $ | 249 | |||||
| Expense Comparable 3 | N/A | $ | 699 | |||||
CBRE Estimate | $ | 131,950 | $ | 650 | ||||
| Compiled by CBRE | ||
© 2007 CB Richard Ellis, Inc.
78
Table of Contents
| PRESIDENTIAL HOUSE | INCOME CAPITALIZATION APPROACH |
We note that beginning in the Spring 2006, the availability of insurance within the wind zone of the Gulf and Atlantic Ocean Coastal regions has become extremely challenging. This has been largely a result of two very active seasons of hurricane activity, with recent forecast of more active years to follow combined with new models of damage estimates should a major storm affect a populated region. There are several factors that cause the volatility, including age of structure, age/type of roof and window systems, and location relative to the coast. Since March, we have witnessed insurance rates increase dramatically, particularly for those properties built prior to the 2000 Wind Code. For many assets, we’ve witnessed increases of 100 to 200 percent over 2005 rates, and in some cases as dramatic as 10 times the 2005 rate. Our pro forma estimate is based on the most recent full year, which is in line with other insurance premium quotes we have seen for similar product.
Natural Gas
The subject includes natural gas for the operation of various equipment and/or appliances. The subject’s expense is detailed as follows:
NATURAL GAS
| Year | Total | $/Unit | ||||||
| 2005 | $ | 30,489 | $ | 150 | ||||
| 2006 | $ | 34,790 | $ | 171 | ||||
| 2007 Annualized | $ | 37,246 | $ | 183 | ||||
| June 2007 T-12 | $ | 33,924 | $ | 167 | ||||
| Expense Comparable 1 | N/A | $ | 0 | |||||
| Expense Comparable 2 | N/A | $ | 204 | |||||
| Expense Comparable 3 | N/A | $ | 0 | |||||
CBRE Estimate | $ | 34,510 | $ | 170 | ||||
| Compiled by CBRE | ||
Our estimate is consistent with the most recent full year amount, and in line with the trailing 12-month amount.
Electricity
Electricity expenses are typically very property specific, and comparables offer a minimal indication of an appropriate level. We have found the best indication of this expense is the subject’s recent historical and budgeted level. The subject’s expense is detailed as follows:
© 2007 CB Richard Ellis, Inc.
79
Table of Contents
| PRESIDENTIAL HOUSE | INCOME CAPITALIZATION APPROACH |
ELECTRICITY
| Year | Total | $/Unit | ||||||
| 2005 | $ | 32,403 | $ | 160 | ||||
| 2006 | $ | 49,752 | $ | 245 | ||||
| 2007 Annualized | $ | 39,880 | $ | 196 | ||||
| June 2007 T-12 | $ | 49,408 | $ | 243 | ||||
| Expense Comparable 1 | N/A | $ | 357 | |||||
| Expense Comparable 2 | N/A | $ | 258 | |||||
| Expense Comparable 3 | N/A | $ | 197 | |||||
CBRE Estimate | $ | 48,720 | $ | 240 | ||||
| Compiled by CBRE | ||
Our estimate is consistent with the most recent full year amount, and in line with the trailing 12-month amount.
Water & Sewer
As with the other utility expenses, water and sewer costs are typically very property specific. This expense has increased during recent years, which is a function of normal inflationary pressures. This expense typically ranges from approximately $150 to $300 net per unit annually, with most properties being toward the middle to upper end of the range. The subject’s expense is detailed as follows:
WATER & SEWER
| Year | Total | $/Unit | ||||||
| 2005 | $ | 52,509 | $ | 259 | ||||
| 2006 | $ | 60,393 | $ | 298 | ||||
| 2007 Annualized | $ | 45,760 | $ | 225 | ||||
| June 2007 T-12 | $ | 48,839 | $ | 241 | ||||
| Expense Comparable 1 | N/A | $ | 367 | |||||
| Expense Comparable 2 | N/A | $ | 577 | |||||
| Expense Comparable 3 | N/A | $ | 344 | |||||
CBRE Estimate | $ | 50,750 | $ | 250 | ||||
| Compiled by CBRE | ||
The most recent full year is below the lower end of the expense comparables, but has been relatively consistent and we have therefore concluded the subject’s pro forma estimate in line with the available historical financial data.
© 2007 CB Richard Ellis, Inc.
80
Table of Contents
| PRESIDENTIAL HOUSE | INCOME CAPITALIZATION APPROACH |
Trash Removal
The subject’s weekly refuse services are provided by a local contractor. The subject’s expense is detailed as follows:
TRASH REMOVAL
| Year | Total | $/Unit | ||||||
| 2005 | $ | 22,988 | $ | 113 | ||||
| 2006 | $ | 22,878 | $ | 113 | ||||
| 2007 Annualized | $ | 41,524 | $ | 205 | ||||
| June 2007 T-12 | $ | 36,058 | $ | 178 | ||||
| Expense Comparable 1 | N/A | $ | 124 | |||||
| Expense Comparable 2 | N/A | $ | 119 | |||||
| Expense Comparable 3 | N/A | $ | 102 | |||||
CBRE Estimate | $ | 36,540 | $ | 180 | ||||
| Compiled by CBRE | ||
The most recent full year is consistent with the mid-point of the expense comparables, but lower than the 2007 annualized amount and the trailing 12-month amount. Our estimate is based on the trailing 12-month amount as this includes an apparent increase in the cost to remove trash from the subject.
Administrative & General
Administrative expenses typically include legal costs, accounting, items which are not provided by off-site management, telephone, supplies, furniture, and temporary help. The subject’s expense is detailed as follows:
ADMINISTRATIVE & GENERAL
| Year | Total | $/Unit | ||||||
| 2005 | $ | 44,332 | $ | 218 | ||||
| 2006 | $ | 66,669 | $ | 328 | ||||
| 2007 Annualized | $ | 85,906 | $ | 423 | ||||
| June 2007 T-12 | $ | 76,597 | $ | 377 | ||||
| Expense Comparable 1 | N/A | $ | 165 | |||||
| Expense Comparable 2 | N/A | $ | 164 | |||||
| Expense Comparable 3 | N/A | $ | 370 | |||||
CBRE Estimate | $ | 71,050 | $ | 350 | ||||
| Compiled by CBRE | ||
© 2007 CB Richard Ellis, Inc.
81
Table of Contents
| PRESIDENTIAL HOUSE | INCOME CAPITALIZATION APPROACH |
The most recent full year is in the upper portion of the expense comparables and we have therefore concluded the subject’s pro forma estimate in line with the mid-point of the most recent full year and the trailing 12-month amount. Our estimate is consistent with other properties operating in the area and generally supported by the available historical and budgeted financial data.
Repairs & Maintenance
This expense category includes the cost of routine repairs to the apartments units. The subject’s expense is detailed as follows:
REPAIRS & MAINTENANCE
| Year | Total | $/Unit | ||||||
| 2005 | $ | 52,536 | $ | 259 | ||||
| 2006 | $ | 67,296 | $ | 332 | ||||
| 2007 Annualized | $ | 87,786 | $ | 432 | ||||
| June 2007 T-12 | $ | 79,853 | $ | 393 | ||||
| Expense Comparable 1 | N/A | $ | 919 | |||||
| Expense Comparable 2 | N/A | $ | 101 | |||||
| Expense Comparable 3 | N/A | $ | 314 | |||||
CBRE Estimate | $ | 81,200 | $ | 400 | ||||
| Compiled by CBRE | ||
The subject’s recent historical amounts are relatively consistent. The current annualized year is slightly below the mid-point of the expense comparables and we have therefore concluded the subject’s pro forma estimate in line with the trailing 12-month estimate.
Painting & Decorating
This expense category includes normal cleaning, painting, decorating and other “make ready” costs expended prior to the initial move-in of a tenant. The subject’s expense is detailed as follows:
© 2007 CB Richard Ellis, Inc.
82
Table of Contents
| PRESIDENTIAL HOUSE | INCOME CAPITALIZATION APPROACH |
PAINTING & DECORATING
| Year | Total | $/Unit | ||||||
| 2005 | $ | 37,040 | $ | 182 | ||||
| 2006 | $ | 40,504 | $ | 200 | ||||
| 2007 Annualized | $ | 48,314 | $ | 238 | ||||
| June 2007 T-12 | $ | 46,207 | $ | 228 | ||||
| Expense Comparable 1 | N/A | $ | 584 | |||||
| Expense Comparable 2 | N/A | $ | 278 | |||||
| Expense Comparable 3 | N/A | $ | 20 | |||||
CBRE Estimate | $ | 46,690 | $ | 230 | ||||
| Compiled by CBRE | ||
The subject’s recent historical amounts are relatively consistent. Our estimate is consistent with the available historical financial data.
Grounds (Landscaping)
This expense item covers normal landscaping and grounds maintenance of the property. The subject’s expense is detailed as follows:
GROUNDS (LANDSCAPING)
| Year | Total | $/Unit | ||||||
| 2005 | $ | 2,812 | $ | 14 | ||||
| 2006 | $ | 4,900 | $ | 24 | ||||
| 2007 Annualized | $ | 10,800 | $ | 53 | ||||
| June 2007 T-12 | $ | 10,300 | $ | 51 | ||||
| Expense Comparable 1 | N/A | $ | 419 | |||||
| Expense Comparable 2 | N/A | $ | 289 | |||||
| Expense Comparable 3 | N/A | $ | 21 | |||||
CBRE Estimate | $ | 10,150 | $ | 50 | ||||
| Compiled by CBRE | ||
The subject’s recent historical amounts vary; however, the 2007 annualized amount and the trailing 12-month amount are consistent. Our estimate is consistent with the current annualized year and the trailing 12-month data.
Management Fee
Management expenses are typically negotiated as a percentage of collected revenues (i.e., effective gross income). The subject’s expense is detailed as follows:
© 2007 CB Richard Ellis, Inc.
83
Table of Contents
| PRESIDENTIAL HOUSE | INCOME CAPITALIZATION APPROACH |
MANAGEMENT FEE
| Year | Total | % EGI | ||||||
| 2005 | $ | 95,595 | 5.0 | % | ||||
| 2006 | $ | 101,901 | 4.9 | % | ||||
| 2007 Annualized | $ | 105,824 | 4.8 | % | ||||
| June 2007 T-12 | $ | 103,405 | 4.8 | % | ||||
CBRE Estimate | $ | 69,289 | 3.0 | % | ||||
| Compiled by CBRE | ||
Professional management fees in the local market range from 3.0% to 5.0% for comparable properties. Historically, the subject has incurred a 4.8% to 5.0% management fee, which is high in the current market. Given the subject’s size and the competitiveness of the local market area, we believe an appropriate management expense for the subject would be towards the lower end of the range.
Administrative Payroll
This expense item reflects payroll costs associated with on-site management and other administrative personnel. The subject’s expense is detailed as follows:
ADMINISTRATIVE PAYROLL
| Year | Total | $/Unit | ||||||
| 2005 | $ | 121,271 | $ | 597 | ||||
| 2006 | $ | 126,982 | $ | 626 | ||||
| 2007 Annualized | $ | 130,896 | $ | 645 | ||||
| June 2007 T-12 | $ | 123,639 | $ | 609 | ||||
| Expense Comparable 1 | N/A | $ | 1,471 | |||||
| Expense Comparable 2 | N/A | $ | 299 | |||||
| Expense Comparable 3 | N/A | $ | 367 | |||||
CBRE Estimate | $ | 126,875 | $ | 625 | ||||
| Compiled by CBRE | ||
The subject’s recent historical amounts are relatively consistent and provide a good indicator of this expense for the subject. Our estimate is consistent with the mid-point of the available historical financial data.
Maintenance Payroll
This expense item reflects payroll costs associated with the upkeep and maintenance of the property, including engineering and other maintenance personnel. The subject’s expense is detailed as follows:
©2007 CB Richard Ellis, Inc.
84
Table of Contents
| PRESIDENTIAL HOUSE | INCOME CAPITALIZATION APPROACH | |
MAINTENANCE PAYROLL
| Year | Total | $/Unit | ||||||
| 2005 | $ | 65,177 | $ | 321 | ||||
| 2006 | $ | 90,609 | $ | 446 | ||||
| 2007 Annualized | $ | 102,708 | $ | 506 | ||||
| June 2007 T-12 | $ | 102,253 | $ | 504 | ||||
| Expense Comparable 1 | N/A | $ | 0 | |||||
| Expense Comparable 2 | N/A | $ | 627 | |||||
| Expense Comparable 3 | N/A | $ | 364 | |||||
CBRE Estimate | $ | 101,500 | $ | 500 | ||||
| Compiled by CBRE | ||
The subject’s recent historical amounts are relatively consistent and provide a good indicator of this expense for the subject. Our estimate is consistent with the mid-point of the available historical financial data.
Employee Taxes & Benefits
This expense item includes all employee payroll taxes and other employment benefits for the subject. The subject’s expense is detailed as follows:
EMPLOYEE TAXES & BENEFITS
| Year | Total | $/Unit | ||||||
| 2005 | $ | 58,413 | $ | 288 | ||||
| 2006 | $ | 53,640 | $ | 264 | ||||
| 2007 Annualized | $ | 62,408 | $ | 307 | ||||
| June 2007 T-12 | $ | 57,863 | $ | 285 | ||||
| Expense Comparable 1 | N/A | $ | 0 | |||||
| Expense Comparable 2 | N/A | $ | 234 | |||||
| Expense Comparable 3 | N/A | $ | 193 | |||||
CBRE Estimate | $ | 55,825 | $ | 275 | ||||
| Compiled by CBRE | ||
The subject’s recent historical amounts are relatively consistent and provide a good indicator of this expense for the subject. Our estimate is consistent with the mid-point of the available historical financial data.
©2007 CB Richard Ellis, Inc.
85
Table of Contents
| PRESIDENTIAL HOUSE | INCOME CAPITALIZATION APPROACH | |
Employee Apartments (Non-Revenue Units)
Apartment properties typically include units that are non-revenue producing. These may include model units, employee units, employee discounts or others. The subject’s expense is detailed as follows:
EMPLOYEE APTS. (NON-REVENUE UNITS)
| Year | Total | $/Unit | ||||||
| 2005 | $ | 21,470 | $ | 106 | ||||
| 2006 | $ | 13,075 | $ | 64 | ||||
| 2007 Annualized | $ | 34,170 | $ | 168 | ||||
| June 2007 T-12 | $ | 23,662 | $ | 117 | ||||
| Expense Comparable 1 | N/A | $ | 72 | |||||
| Expense Comparable 2 | N/A | $ | 34 | |||||
| Expense Comparable 3 | N/A | $ | 0 | |||||
CBRE Estimate | $ | 23,345 | $ | 115 | ||||
| Compiled by CBRE | ||
The subject’s recent historical amounts vary and are typically higher than the comparables. Our estimate is consistent with the trailing 12-month estimate as this represents the current non-revenue unit operation at the subject.
Advertising & Leasing
This expense category accounts for placement of advertising, commissions, signage, brochures, and newsletters. The subject’s expense is detailed as follows:
ADVERTISING & LEASING
| Year | Total | $/Unit | ||||||
| 2005 | $ | 36,648 | $ | 181 | ||||
| 2006 | $ | 48,927 | $ | 241 | ||||
| 2007 Annualized | $ | 114,848 | $ | 566 | ||||
| June 2007 T-12 | $ | 86,871 | $ | 428 | ||||
| Expense Comparable 1 | N/A | $ | 89 | |||||
| Expense Comparable 2 | N/A | $ | 43 | |||||
| Expense Comparable 3 | N/A | $ | 23 | |||||
CBRE Estimate | $ | 42,630 | $ | 210 | ||||
| Compiled by CBRE | ||
This expense category has significantly decreased in the past year or two due to the overall demand for multi-family rental units at a time when units were being taken from rental operations and
©2007 CB Richard Ellis, Inc.
86
Table of Contents
| PRESIDENTIAL HOUSE | INCOME CAPITALIZATION APPROACH | |
converted to condos. The subject’s 2007 annualized amount and trailing 12-month amount include a significant increase in National Media Advertising. Based on the current occupancy, which is actually below the occupancy in 2005 and 2006, this expenditure does not appear to be successful and would likely be suspended under different ownership. Our estimate is consistent with the midpoint of the 2005 and 2006 data, but well above the comparables.
Reserves for Replacement
Reserves for replacement have been estimated based on discussions with knowledgeable market participants who indicate a range from $150 to $300 per unit for comparable properties. The subject’s expense is detailed as follows:
RESERVES FOR REPLACEMENT
| Year | Total | $/Unit | ||||||
| 2005 | $ | 0 | $ | 0 | ||||
| 2006 | $ | 0 | $ | 0 | ||||
| 2007 Annualized | $ | 0 | $ | 0 | ||||
| June 2007 T-12 | $ | 0 | $ | 0 | ||||
| Expense Comparable 1 | N/A | $ | 0 | |||||
| Expense Comparable 2 | N/A | $ | 0 | |||||
| Expense Comparable 3 | N/A | $ | 0 | |||||
CBRE Estimate | $ | 50,750 | $ | 250 | ||||
| Compiled by CBRE | ||
OPERATING EXPENSE CONCLUSION
The subject’s expense is detailed as follows:
OPERATING EXPENSES
| Year | Total | $/Unit | ||||||
| 2005 | $ | 938,272 | $ | 4,622 | ||||
| 2006 | $ | 1,146,251 | $ | 5,647 | ||||
| 2007 Annualized | $ | 1,290,902 | $ | 6,359 | ||||
| June 2007 T-12 | $ | 1,220,994 | $ | 6,015 | ||||
| Expense Comparable 1 | N/A | $ | 6,882 | |||||
| Expense Comparable 2 | N/A | $ | 5,713 | |||||
| Expense Comparable 3 | N/A | $ | 4,545 | |||||
CBRE Estimate | $ | 1,254,536 | $ | 6,180 | ||||
| Compiled by CBRE | ||
©2007 CB Richard Ellis, Inc.
87
Table of Contents
| PRESIDENTIAL HOUSE | INCOME CAPITALIZATION APPROACH |
The subject’s per unit operating expense pro forma is in line with the total per unit operating expenses indicated by the expense comparables. It also is supported by the current annualized amount and the trailing 12-month amount indicated above.
NET OPERATING INCOME CONCLUSION
The subject’s net operating income is detailed as follows:
NET OPERATING INCOME
| Year | Total | $/Unit | ||||||
| 2005 | $ | 980,351 | $ | 4,829 | ||||
| 2006 | $ | 946,644 | $ | 4,663 | ||||
| 2007 Annualized | $ | 920,466 | $ | 4,534 | ||||
| June 2007 T-12 | $ | 934,748 | $ | 4,605 | ||||
CBRE Estimate | $ | 1,055,100 | $ | 5,198 | ||||
| Compiled by CBRE | ||
Our pro forma estimate is approximately 11.5% higher than the most recent full year due to recently implemented rental rate increases at the subject, which are not reflected in the historical data, as well as our projections for higher rent on the one-bedroom units.
DIRECT CAPITALIZATION
Direct capitalization is a method used to convert a single year’s estimated stabilized net operating income into a value indication. The following subsections represent different techniques for deriving an overall capitalization rate for direct capitalization.
Comparable Sales
The overall capitalization rates (OARs) confirmed for the comparable sales analyzed in the sales comparison approach are as follows:
COMPARABLE CAPITALIZATION RATES
| Sale | Sale Price | |||||||||||||||
| Sale | Date | $/Unit | Occupancy | OAR | ||||||||||||
| 1 | Mar-06 | $ | 67,933 | 96 | % | 6.71 | % | |||||||||
| 2 | Aug-06 | $ | 91,954 | 98 | % | 6.09 | % | |||||||||
| 3 | Mar-07 | $ | 106,965 | 98 | % | 5.45 | % | |||||||||
| 4 | May-07 | $ | 94,660 | 91 | % | 6.08 | % | |||||||||
Indicated OAR: | 93 | % | 6.00 | % | ||||||||||||
| Compiled by: CBRE | ||
©2007 CB Richard Ellis, Inc.
88
Table of Contents
| PRESIDENTIAL HOUSE | INCOME CAPITALIZATION APPROACH | |
The overall capitalization rates for these sales were derived based upon the actual or pro-forma income characteristics of the property. Sale Nos. Three and Four transpired within the past three months, while Sale Nos. One and Two represent slightly older transaction dates. Therefore, primary emphasis has been placed upon the more recent data, which is generally reflective of current market trends, interest rates, and buyer’s expectations and motivation in the market. Overall, an OAR in the middle of the range indicated by the comparables is considered appropriate for the following reasons:
| • | The subject is located in a strong rental market and near several of the major thoroughfares in the area; | ||
| • | The subject, although an older complex, is highly competitive with similar, yet newer properties in the area; | ||
| • | The subject has maintained an occupancy level of 95% or better for the past three years, which is slightly above that of the overall market and in line with the submarket for the same property type. |
Published Investor Surveys
The results of the most recentNational Investor Survey, published by CBRE, are summarized in the following chart.
OVERALL CAPITALIZATION RATES
| Investment Type | OAR Range | Average | ||||||
CBRE Apartments | ||||||||
| Class A | 5.00% - 8.00 | % | 6.07 | % | ||||
| Class B | 5.00% - 8.00 | % | 6.58 | % | ||||
| Class C | 6.00% - 9.00 | % | 7.37 | % | ||||
Korpacz Apartment | ||||||||
| National Data | 3.50% - 8.00 | % | 5.80 | % | ||||
Indicated OAR: | 6.00 | % | ||||||
| Source: CBRE National Investor Survey & Korpacz Real Estate Investor Survey | ||
The subject is considered to be a Class C property. Because of the subject’s location in a submarket with good occupancy and the lack of new construction due to the absence of available land, an OAR near the lower end of the range indicated by Class C properties in the preceding table is considered appropriate.
Market Participants
The results of recent interviews with knowledgeable real estate professionals are summarized in the following table.
©2007 CB Richard Ellis, Inc.
89
Table of Contents
| PRESIDENTIAL HOUSE | INCOME CAPITALIZATION APPROACH | |
OVERALL CAPITALIZATION RATES — APARTMENT
| Respondent | Company | OAR | Income | Date of Survey | ||||||||||||
| Robert Givens | CB Richard Ellis, Inc. | 5.50%-6.00 | % | Pro Forma | Jun-07 | |||||||||||
| Bob Miller | CB Richard Ellis, Inc. | 5.50%-6.00 | % | Pro Forma | Jun-07 | |||||||||||
| Jamie May | JBM Realty Advisors, Inc. | 5.75%-6.00 | % | Next Year | Jun-07 | |||||||||||
Indicated OAR: | 6.00% | |||||||||||||||
| Compiled by: CBRE | ||
In deriving an appropriate overall capitalization rate for the subject, numerous market participants were interviewed and consulted in gathering applicable information. Three real estate professionals that are active in the local market were interviewed and all indicated that they have recently negotiated similar property sales in the 5.50% to 6.0% OAR range based upon pro forma net operating income. Based upon current market trends, they would anticipate pro forma OARs to fall within the 5.50% to 6.0% range. The respondents further indicated that the subject would be viewed generally favorably as compared to other available properties in the market due to the tight rental market in the area and the lack of new construction.
Band of Investment
The band of the investment technique has been utilized as a crosscheck to the foregoing techniques. The analysis is shown in the following table.
BAND OF INVESTMENT
| Mortgage Interest Rate | 6.50 | % | ||||||||||||||||||
| Mortgage Term (Amortization Period) | 30 Years | |||||||||||||||||||
| Mortgage Ratio (Loan-to-Value) | 75 | % | ||||||||||||||||||
| Mortgage Constant | 0.07585 | |||||||||||||||||||
| Equity Dividend Rate (EDR) | 4 | % | ||||||||||||||||||
| Mortgage Requirement | 75 | % | x | 0.07585 | = | 0.05689 | ||||||||||||||
| Equity Requirement | 25 | % | x | 0.04000 | = | 0.01000 | ||||||||||||||
| 100 | % | 0.06689 | ||||||||||||||||||
Indicated OAR: | 6.70 | % | ||||||||||||||||||
| Compiled by: CBRE | ||
Capitalization Rate Conclusion
The following chart summarizes the OAR conclusions.
©2007 CB Richard Ellis, Inc.
90
Table of Contents
| PRESIDENTIAL HOUSE | INCOME CAPITALIZATION APPROACH |
OVERALL CAPITALIZATION RATE — CONCLUSION
| Source | Indicated OAR | |||
| Comparable Sales | 6.00 | % | ||
National Investor Survey | 6.00 | % | ||
| Market Participants | 6.00 | % | ||
| Band of Investment | 6.70 | % | ||
CBRE Estimate | 6.00 | % | ||
| Compiled by: CBRE | ||
In concluding an overall capitalization rate for the subject, primary reliance has been placed upon the data obtained from the comparable sales and interviews with active market participants. This data tends to provide the most accurate depiction of both buyer’s and seller’s expectations within the market and the ranges indicated are relatively tight. Further secondary support for our conclusion is noted via both the CBRE National Investor Survey and the band of investment methodology. Considering the data presented, the concluded overall capitalization rate appears to be well supported in the local market.
Direct Capitalization Summary
A summary of the direct capitalization at stabilized occupancy is illustrated in the following chart.
©2007 CB Richard Ellis, Inc.
91
Table of Contents
| PRESIDENTIAL HOUSE | INCOME CAPITALIZATION APPROACH |
DIRECT CAPITALIZATION SUMMARY
| $/Unit/Yr | Total | |||||||||||
Income | ||||||||||||
| Potential Rental Income | $ | 11,560 | $ | 2,346,636 | ||||||||
| Loss to Lease | 1.50 | % | (173 | ) | (35,200 | ) | ||||||
| Concessions | 0.00 | % | 0 | — | ||||||||
Adjusted Rental Income | $ | 11,386 | 2,311,436 | |||||||||
| Credit Loss | 2.00 | % | (228 | ) | (46,229 | ) | ||||||
| Vacancy | 5.00 | % | (569 | ) | (115,572 | ) | ||||||
Net Rental Income | $ | 10,589 | $ | 2,149,636 | ||||||||
| Other Income | 788 | 160,000 | ||||||||||
Effective Gross Income | $ | 11,378 | $ | 2,309,636 | ||||||||
Expenses | ||||||||||||
| Real Estate Taxes | $ | 1,343 | $ | 272,691 | ||||||||
| Property Insurance | 650 | 131,950 | ||||||||||
| Natural Gas | 170 | 34,510 | ||||||||||
| Electricity | 240 | 48,720 | ||||||||||
| Water & Sewer | 250 | 50,750 | ||||||||||
| Cable Television | 0 | 71 | ||||||||||
| Trash Removal | 180 | 36,540 | ||||||||||
| Administrative & General | 350 | 71,050 | ||||||||||
| Repairs & Maintenance | 400 | 81,200 | ||||||||||
| Painting & Decorating | 230 | 46,690 | ||||||||||
| Grounds (Landscaping) | 50 | 10,150 | ||||||||||
| Management Fee | 3.00 | % | 341 | 69,289 | ||||||||
| Administrative Payroll | 625 | 126,875 | ||||||||||
| Maintenance Payroll | 500 | 101,500 | ||||||||||
| Employee Taxes & Benefits | 275 | 55,825 | ||||||||||
| Employee Apts. (Non-Revenue Units) | 115 | 23,345 | ||||||||||
| Advertising & Leasing | 210 | 42,630 | ||||||||||
| Reserves for Replacement | 250 | 50,750 | ||||||||||
Operating Expenses | $ | 6,180 | $ | 1,254,536 | ||||||||
Operating Expense Ratio | 54.32 | % | ||||||||||
Net Operating Income | $ | 5,198 | $ | 1,055,100 | ||||||||
OAR | / | 6.00 | % | |||||||||
Indicated Stabilized Value | $ | 17,584,994 | ||||||||||
Rounded | $ | 17,580,000 | ||||||||||
| Deferred Maintenance | — | |||||||||||
| Lease-Up Discount | — | |||||||||||
Value Indication | $ | 17,584,994 | ||||||||||
Rounded | $ | 17,600,000 | ||||||||||
Value Per Unit | $ | 86,626 | ||||||||||
| Cap Rate | Value | |||||||||||
Matrix Analysis | ||||||||||||
| 5.75 | % | $ | 18,349,600 | |||||||||
| 6.00 | % | $ | 17,585,000 | |||||||||
| 6.25 | % | $ | 16,881,600 | |||||||||
| Compiled by CBRE | ||
©2007 CB Richard Ellis, Inc.
92
Table of Contents
| PRESIDENTIAL HOUSE | RECONCILIATION OF VALUE |
RECONCILIATION OF VALUE
The value indications from the approaches to value are summarized as follows:
SUMMARY OF VALUE CONCLUSIONS
| Cost Approach | $ | 17,600,000 | ||
| Sales Comparison Approach | $ | 17,600,000 | ||
| Income Capitalization Approach | $ | 17,600,000 | ||
| Reconciled Value | $ | 17,600,000 | ||
| Compiled by CBRE |
The cost approach typically gives a reliable value indication when there is strong support for the replacement cost estimate and when there is minimal depreciation. Considering the substantial amount of depreciation present in the property, the reliability of the cost approach is somewhat diminished. Therefore, the cost approach is considered less applicable to the subject and is used primarily as a test of reasonableness against the other valuation techniques.
In the sales comparison approach, the subject is compared to similar properties that have been sold recently or for which listing prices or offers are known. The sales used in this analysis are considered highly comparable to the subject, and the required adjustments were based on reasonable and well-supported rationale. In addition, market participants are currently analyzing purchase prices on investment properties as they relate to available substitutes in the market. Therefore, the sales comparison approach is considered to provide a reliable value indication, but has been given secondary emphasis in the final value reconciliation.
The income capitalization approach is applicable to the subject since it is an income producing property leased in the open market. Market participants are primarily analyzing properties based on their income generating capability. Therefore, the income capitalization approach is considered a reasonable and substantiated value indicator and has been given primary emphasis in the final value estimate.
Based on the foregoing, the market value of the subject has been concluded as follows:
MARKET VALUE CONCLUSION
| Appraisal Premise | Interest Appraised | Date of Value | Value Conclusion | |||
| As Is | Fee Simple Estate | July 17, 2007 | $17,600,000 | |||
| Compiled by CBRE |
©2007 CB Richard Ellis, Inc.
93
Table of Contents
| PRESIDENTIAL HOUSE | ASSUMPTIONS AND LIMITING CONDITIONS |
ASSUMPTIONS AND LIMITING CONDITIONS
| 1. | Unless otherwise specifically noted in the body of the report, it is assumed that title to the property or properties appraised is clear and marketable and that there are no recorded or unrecorded matters or exceptions to title that would adversely affect marketability or value. CBRE is not aware of any title defects nor has it been advised of any unless such is specifically noted in the report. CBRE, however, has not examined title and makes no representations relative to the condition thereof. Documents dealing with liens, encumbrances, easements, deed restrictions, clouds and other conditions that may affect the quality of title have not been reviewed. Insurance against financial loss resulting in claims that may arise out of defects in the subject’s title should be sought from a qualified title company that issues or insures title to real property. |
| 2. | Unless otherwise specifically noted in the body of this report, it is assumed: that the existing improvements on the property or properties being appraised are structurally sound, seismically safe and code conforming; that all building systems (mechanical/electrical, HVAC, elevator, plumbing, etc.) are in good working order with no major deferred maintenance or repair required; that the roof and exterior are in good condition and free from intrusion by the elements; that the property or properties have been engineered in such a manner that the improvements, as currently constituted, conform to all applicable local, state, and federal building codes and ordinances. CBRE professionals are not engineers and are not competent to judge matters of an engineering nature. CBRE has not retained independent structural, mechanical, electrical, or civil engineers in connection with this appraisal and, therefore, makes no representations relative to the condition of improvements. Unless otherwise specifically noted in the body of the report: no problems were brought to the attention of CBRE by ownership or management; CBRE inspected less than 100% of the entire interior and exterior portions of the improvements; and CBRE was not furnished any engineering studies by the owners or by the party requesting this appraisal. If questions in these areas are critical to the decision process of the reader, the advice of competent engineering consultants should be obtained and relied upon. It is specifically assumed that any knowledgeable and prudent purchaser would, as a precondition to closing a sale, obtain a satisfactory engineering report relative to the structural integrity of the property and the integrity of building systems. Structural problems and/or building system problems may not be visually detectable. If engineering consultants retained should report negative factors of a material nature, or if such are later discovered, relative to the condition of improvements, such information could have a substantial negative impact on the conclusions reported in this appraisal. Accordingly, if negative findings are reported by engineering consultants, CBRE reserves the right to amend the appraisal conclusions reported herein. |
| 3. | Unless otherwise stated in this report, the existence of hazardous material, which may or may not be present on the property was not observed by the appraisers. CBRE has no knowledge of the existence of such materials on or in the property. CBRE, however, is not qualified to detect such substances. The presence of substances such as asbestos, urea formaldehyde foam insulation, contaminated groundwater or other potentially hazardous materials may affect the value of the property. The value estimate is predicated on the assumption that there is no such material on or in the property that would cause a loss in value. No responsibility is assumed for any such conditions, or for any expertise or engineering knowledge required to discover them. The client is urged to retain an expert in this field, if desired. |
We have inspected, as thoroughly as possible by observation, the land; however, it was impossible to personally inspect conditions beneath the soil. Therefore, no representation is made as to these matters unless specifically considered in the appraisal.
| 4. | All furnishings, equipment and business operations, except as specifically stated and typically considered as part of real property, have been disregarded with only real property being considered in the report unless otherwise stated. Any existing or proposed improvements, on or off-site, as well as any alterations or repairs considered, are assumed to be completed in a workmanlike manner according to standard practices based upon the information submitted to CBRE This report may be subject to amendment upon re-inspection of the subject subsequent to repairs, modifications, alterations and completed new construction. Any estimate of Market Value is as of the date indicated; based upon the information, conditions and projected levels of operation. |
| 5. | It is assumed that all factual data furnished by the client, property owner, owner’s representative, or persons designated by the client or owner to supply said data are accurate and correct unless otherwise specifically noted in the appraisal report. Unless otherwise specifically noted in the appraisal report, CBRE has no reason to believe that any of the data furnished contain any material error. Information and data referred to in this paragraph include, without being limited to, numerical street addresses, lot and block numbers, Assessor’s Parcel Numbers, land dimensions, square footage area of the land, dimensions of the improvements, gross building areas, net rentable areas, usable areas, unit count, room count, rent schedules, income data, historical operating expenses, budgets, and related data. Any material error in any of the above data could have a substantial impact on the conclusions reported. Thus, CBRE reserves the right to amend conclusions reported if made aware of any such error. Accordingly, the client-addressee should carefully review |
©2007 CB Richard Ellis, Inc.
94
Table of Contents
| PRESIDENTIAL HOUSE | ASSUMPTIONS AND LIMITING CONDITIONS |
all assumptions, data, relevant calculations, and conclusions within 30 days after the date of delivery of this report and should immediately notify CBRE of any questions or errors.
| 6. | The date of value to which any of the conclusions and opinions expressed in this report apply, is set forth in the Letter of Transmittal. Further, that the dollar amount of any value opinion herein rendered is based upon the purchasing power of the American Dollar on that date. This appraisal is based on market conditions existing as of the date of this appraisal. Under the terms of the engagement, we will have no obligation to revise this report to reflect events or conditions which occur subsequent to the date of the appraisal. However, CBRE will be available to discuss the necessity for revision resulting from changes in economic or market factors affecting the subject. | |
| 7. | CBRE assumes no private deed restrictions, limiting the use of the subject in any way. | |
| 8. | Unless otherwise noted in the body of the report, it is assumed that there are no mineral deposit or subsurface rights of value involved in this appraisal, whether they be gas, liquid, or solid. Nor are the rights associated with extraction or exploration of such elements considered unless otherwise stated in this appraisal report. Unless otherwise stated it is also assumed that there are no air or development rights of value that may be transferred. | |
| 9. | CBRE is not aware of any contemplated public initiatives, governmental development controls, or rent controls that would significantly affect the value of the subject. | |
| 10. | The estimate of Market Value, which may be defined within the body of this report, is subject to change with market fluctuations over time. Market value is highly related to exposure, time promotion effort, terms, motivation, and conclusions surrounding the offering. The value estimate(s) consider the productivity and relative attractiveness of the property, both physically and economically, on the open market. | |
| 11. | Any cash flows included in the analysis are forecasts of estimated future operating characteristics are predicated on the information and assumptions contained within the report. Any projections of income, expenses and economic conditions utilized in this report are not predictions of the future. Rather, they are estimates of current market expectations of future income and expenses. The achievement of the financial projections will be affected by fluctuating economic conditions and is dependent upon other future occurrences that cannot be assured. Actual results may vary from the projections considered herein. CBRE does not warrant these forecasts will occur. Projections may be affected by circumstances beyond the current realm of knowledge or control of CBRE | |
| 12. | Unless specifically set forth in the body of the report, nothing contained herein shall be construed to represent any direct or indirect recommendation of CBRE to buy, sell, or hold the properties at the value stated. Such decisions involve substantial investment strategy questions and must be specifically addressed in consultation form. | |
| 13. | Also, unless otherwise noted in the body of this report, it is assumed that no changes in the present zoning ordinances or regulations governing use, density, or shape are being considered. The property is appraised assuming that all required licenses, certificates of occupancy, consents, or other legislative or administrative authority from any local, state, nor national government or private entity or organization have been or can be obtained or renewed for any use on which the value estimates contained in this report is based, unless otherwise stated. | |
| 14. | This study may not be duplicated in whole or in part without the specific written consent of CBRE nor may this report or copies hereof be transmitted to third parties without said consent, which consent CBRE reserves the right to deny. Exempt from this restriction is duplication for the internal use of the client-addressee and/or transmission to attorneys, accountants, or advisors of the client-addressee. Also exempt from this restriction is transmission of the report to any court, governmental authority, or regulatory agency having jurisdiction over the party/parties for whom this appraisal was prepared, provided that this report and/or its contents shall not be published, in whole or in part, in any public document without the express written consent of CBRE which consent CBRE reserves the right to deny. Finally, this report shall not be advertised to the public or otherwise used to induce a third party to purchase the property or to make a “sale” or “offer for sale” of any “security”, as such terms are defined and used in the Securities Act of 1933, as amended. Any third party, not covered by the exemptions herein, who may possess this report, is advised that they should rely on their own independently secured advice for any decision in connection with this property. CBRE shall have no accountability or responsibility to any such third party. | |
| 15. | Any value estimate provided in the report applies to the entire property, and any pro ration or division of the title into fractional interests will invalidate the value estimate, unless such pro ration or division of interests has been set forth in the report. | |
| 16. | The distribution of the total valuation in this report between land and improvements applies only under the existing program of utilization. Component values for land and/or buildings are not intended to be used in conjunction with any other property or appraisal and are invalid if so used. |
©2007 CB Richard Ellis, Inc.
95
Table of Contents
| PRESIDENTIAL HOUSE | ASSUMPTIONS AND LIMITING CONDITIONS |
| 17. | The maps, plats, sketches, graphs, photographs and exhibits included in this report are for illustration purposes only and are to be utilized only to assist in visualizing matters discussed within this report. Except as specifically stated, data relative to size or area of the subject and comparable properties has been obtained from sources deemed accurate and reliable. None of the exhibits are to be removed, reproduced, or used apart from this report. | |
| 18. | No opinion is intended to be expressed on matters which may require legal expertise or specialized investigation or knowledge beyond that customarily employed by real estate appraisers. Values and opinions expressed presume that environmental and other governmental restrictions/conditions by applicable agencies have been met, including but not limited to seismic hazards, flight patterns, decibel levels/noise envelopes, fire hazards, hillside ordinances, density, allowable uses, building codes, permits, licenses, etc. No survey, engineering study or architectural analysis has been made known to CBRE unless otherwise stated within the body of this report. If the Consultant has not been supplied with a termite inspection, survey or occupancy permit, no responsibility or representation is assumed or made for any costs associated with obtaining same or for any deficiencies discovered before or after they are obtained. No representation or warranty is made concerning obtaining these items. CBRE assumes no responsibility for any costs or consequences arising due to the need, or the lack of need, for flood hazard insurance. An agent for the Federal Flood Insurance Program should be contacted to determine the actual need for Flood Hazard Insurance. | |
| 19. | Acceptance and/or use of this report constitutes full acceptance of the Contingent and Limiting Conditions and special assumptions set forth in this report. It is the responsibility of the Client, or client’s designees, to read in full, comprehend and thus become aware of the aforementioned contingencies and limiting conditions. Neither the Appraiser nor CBRE assumes responsibility for any situation arising out of the Client’s failure to become familiar with and understand the same. The Client is advised to retain experts in areas that fall outside the scope of the real estate appraisal/consulting profession if so desired. | |
| 20. | CBRE assumes that the subject analyzed herein will be under prudent and competent management and ownership; neither inefficient or super-efficient. | |
| 21. | It is assumed that there is full compliance with all applicable federal, state, and local environmental regulations and laws unless noncompliance is stated, defined and considered in the appraisal report. | |
| 22. | No survey of the boundaries of the property was undertaken. All areas and dimensions furnished are presumed to be correct. It is further assumed that no encroachments to the realty exist. | |
| 23. | TheAmericans with Disabilities Act(ADA) became effective January 26, 1992. Notwithstanding any discussion of possible readily achievable barrier removal construction items in this report, CBRE has not made a specific compliance survey and analysis of this property to determine whether it is in conformance with the various detailed requirements of the ADA. It is possible that a compliance survey of the property together with a detailed analysis of the requirements of the ADA could reveal that the property is not in compliance with one or more of the requirements of the ADA. If so, this fact could have a negative effect on the value estimated herein. Since CBRE has no specific information relating to this issue, nor is CBRE qualified to make such an assessment, the effect of any possible non-compliance with the requirements of the ADA was not considered in estimating the value of the subject. | |
| 24. | Client shall not indemnify Appraiser or hold Appraiser harmless unless and only to the extent that the Client misrepresents, distorts, or provides incomplete or inaccurate appraisal results to others, which acts of the Client proximately result in damage to Appraiser. The Client shall indemnify and hold Appraiser harmless from any claims, expenses, judgments or other items or costs arising as a result of the Client’s failure or the failure of any of the Client’s agents to provide a complete copy of the appraisal report to any third party. In the event of any litigation between the parties, the prevailing party to such litigation shall be entitled to recover from the other reasonable attorney fees and costs. | |
| 25. | The report is for the sole use of the client; however, client may provide only complete, final copies of the appraisal report in its entirety (but not component parts) to third parties who shall review such reports in connection with loan underwriting or securitization efforts. Appraiser is not required to explain or testify as to appraisal results other than to respond to the client for routine and customary questions. Please note that our consent to allow an appraisal report prepared by CBRE or portions of such report, to become part of or be referenced in any public offering, the granting of such consent will be at our sole discretion and, if given, will be on condition that we will be provided with an Indemnification Agreement and/or Non-Reliance letter, in a form and content satisfactory to us, by a party satisfactory to us. We do consent to your submission of the reports to rating agencies, loan participants or your auditors in its entirety (but not component parts) without the need to provide us with an Indemnification Agreement and/or Non-Reliance letter. | |
| 26. | As part of the client’s requested scope of work, an estimate of insurable value is provided herein. CBRE has followed traditional appraisal standards to develop a reasonable calculation based upon industry practices and industry accepted publications such as the Marshal Valuation Service handbook. The methodology employed is a derivation of the cost |
©2007 CB Richard Ellis, Inc.
96
Table of Contents
| PRESIDENTIAL HOUSE | ASSUMPTIONS AND LIMITING CONDITIONS |
approach which is primarily used as an academic exercise to help support the market value estimate and therefore is not reliable for Insurable Value estimates. Actual construction costs and related estimates can vary greatly from this estimate.
This analysis should not be relied upon to determine proper insurance coverage which can only be properly estimated by consultants considered experts in cost estimation and insurance underwriting. It is provided to aid the client/reader/user as part of their overall decision making process and no representations or warranties are made by CBRE regarding the accuracy of this estimate and it is strongly recommend that other sources be utilized to develop any estimate of insurable value.
©2007 CB Richard Ellis, Inc.
97
Table of Contents
Table of Contents
Table of Contents
PRESIDENTIAL HOUSE
assessed value Assessed value applies in ad valorem taxation and refers to the value of a property according to the tax rolls. Assessed value may not conform to market value, but it is usually calculated in relation to a market value base.†
cash equivalency The procedure in which the sale prices of comparable properties sold with atypical financing are adjusted to reflect typical market terms.
contract rent The actual rental income specified in a lease.‡
effective rent The rental rate net of financial concessions such as periods of no rent during the lease term; may be calculated on a discounted basis, reflecting the time value of money, or on a simple, straight-line basis.‡
excess land In regard to an improved site, the land not needed to serve or support the existing improvement. In regard to a vacant site or a site considered as though vacant, the land no needed to accommodate the site’s primary highest and best use. Such land may be separated from the larger site and have its own highest and best use, or it may allow for future expansion of the existing or anticipated improvement.See also surplus land.‡
extraordinary assumption An assumption directly related to a specific assignment, which, if found to be false, could alter the appraiser’s opinions or conclusions. Extraordinary assumptions presume as fact otherwise uncertain information about physical, legal, or economic characteristics of the subject property; or about conditions external to the property such as market conditions or trends; or about the integrity of data used in an analysis.See also hypothetical condition.‡
fee simple estate Absolute ownership unencumbered by any other interest or estate, subject only to the limitations imposed by the governmental powers of taxation, eminent domain, police power, and escheat.‡
floor area ratio (FAR) The relationship between the above-ground floor area of a building, as described by the building code, and the area of the plot on which it stands; in planning and zoning, often expressed as a decimal, e.g., a ratio of 2.0 indicates that the permissible floor area of a building is twice the total land area; also calledbuilding-to-land ratio.‡
full service lease A lease in which rent covers all operating expenses. Typically, full service leases are combined with anexpense stop, the expense level covered by the contract lease payment. Increases in expenses above the expense stop level are passed through to the tenant and are known asexpense pass-throughs.
going concern value Going concern value is the value of a proven property operation. It includes the incremental value associated with the business concern, which is distinct from the value of the real estate only. Going concern value includes an intangible enhancement of the value of an operating business enterprise which is produced by the assemblage of the land, building, labor, equipment, and marketing operation. This process creates an economically viable business that is expected to continue. Going concern value refers to the total value of a property, including both real property and intangible personal property attributed to the business value.†
gross building area (GBA) The total floor area of a building, including below-grade space but excluding unenclosed areas, measured from the exterior of the walls. Gross building area for office buildings is computed by measuring to the outside finished surface of permanent outer building walls without any deductions. All enclosed floors of the building including basements, mechanical equipment floors, penthouses, and the like are included in the measurement. Parking spaces and parking garages are excluded.‡
hypothetical condition That which is contrary to what exists but is supposed for the purpose of analysis. Hypothetical conditions assume conditions contrary to known facts about physical, legal, or economic characteristics of the subject property; or about conditions external to the property, such as market conditions or trends; or about the integrity of data used in an analysis.See alsoextraordinary assumption.‡
insurable value Insurable Value is based on the replacement and/or reproduction cost of physical items that are subject to loss from hazards. Insurable value is that portion of the value of an asset or asset group that is acknowledged or recognized under the provisions of an applicable loss insurance policy. This value is often controlled by state law and varies from state to state.†
investment value Investment value is the value of an investment to a particular investor based on his or her investment requirements. In contrast to market value, investment value is value to an individual, not value in the marketplace. Investment value reflects the subjective relationship between a particular investor and a given investment. When measured in dollars, investment value is the price an investor would pay for an investment in light of its perceived capacity to satisfy his or her desires, needs, or investment goals. To estimate investment value, specific investment criteria must be known. Criteria to evaluate a real estate
©2007 CB Richard Ellis, Inc.
Table of Contents
PRESIDENTIAL HOUSE
investment are not necessarily set down by the individual investor; they may be established by an expert on real estate and its value, that is, an appraiser.†
leased fee
Seeleased fee estate
Seeleased fee estate
leased fee estate An ownership interest held by a landlord with the right of use and occupancy conveyed by lease to others. The rights of the lessor (the leased fee owner) and the leased fee are specified by contract terms contained within the lease.‡
leasehold
Seeleasehold estate
Seeleasehold estate
leasehold estate The interest held by the lessee (the tenant or renter) through a lease conveying the rights of use and occupancy for a stated term under certain conditions.‡
market rent The most probable rent that a property should bring in a competitive and open market reflecting all conditions and restrictions of the specified lease agreement including term, rental adjustment and revaluation, permitted uses, use restrictions, and expense obligations.‡
market value Market value is one of the central concepts of the appraisal practice. Market value is differentiated from other types of value in that it is created by the collective patterns of the market. Market value means the most probable price which a property should bring in a competitive and open market under all conditions requisite to a fair sale, the buyer and seller each acting prudently and knowledgeably, and assuming the price is not affected by undue stimulus. Implicit in this definition is the consummation of a sale as of a specified date and the passing of title from seller to buyer under conditions whereby: 1) A reasonable time is allowed for exposure in the open market; 2) Both parties are well informed or well advised, and acting in what they consider their own best interests; 3) Buyer and seller are typically motivated; 4) Payment is made in terms of cash in U.S. dollars or in terms of financial arrangements comparable thereto; and 5) The price represents the normal consideration for the property sold unaffected by special or creative financing or sales concessions granted by anyone associated with the sale.§
marketing period The time it takes an interest in real property to sell on the market subsequent to the date of an appraisal.‡
net lease Lease in which all or some of the operating expenses are paid directly by the tenant. The landlord never takes possession of the expense payment. In aTriple Net Leaseall operating expenses are the responsibility of the tenant, including property taxes, insurance, interior maintenance, and other miscellaneous expenses. However, management fees and exterior maintenance are often the responsibility of the lessor in a triple net lease. Amodified net leaseis one in which some expenses are paid separately by the tenant and some are included in the rent.
net rentable area (NRA)1) The area on which rent is computed. 2) The Rentable Area of a floor shall be computed by measuring to the inside finished surface of the dominant portion of the permanent outer building walls, excluding any major vertical penetrations of the floor. No deductions shall be made for columns and projections necessary to the building. Include space such as mechanical room, janitorial room, restrooms, and lobby of the floor. *
occupancy rate The relationship or ratio between the income received from the rented units in a property and the income that would be received if all the units were occupied.‡
prospective value opinion A forecast of the value expected at a specified future date. A prospective value opinion is most frequently sought in connection with real estate projects that are proposed, under construction, or under conversion to a new us, or those that have not achieved sellout or a stabilized level of long-term occupancy at the time the appraisal report is written.‡
reasonable exposure time The estimated length of time the property interest being appraised would have been offered on the market prior to the hypothetical consummation of a sale at market value on the effective date of the appraisal; a retrospective opinion based upon an analysis of past events assuming a competitive and open market.††
rent
See
full service lease
net lease
market rent
contract, coupon, face, or nominal rent
effective rent
See
full service lease
net lease
market rent
contract, coupon, face, or nominal rent
effective rent
shell rent The typical rent paid for retail, office, or industrial tenant space based on minimal “shell” interior finishes (called plain vanilla finish in some areas). Usually the landlord delivers the main building shell space or some minimum level of interior build-out, and the tenant completes the interior finish, which can include wall, ceiling, and floor finishes; mechanical systems, interior electric, and plumbing. Typically these
©2007 CB Richard Ellis, Inc.
Table of Contents
PRESIDENTIAL HOUSE
are long-term leases with tenants paying all or most property expenses.‡
surplus land Land not necessary to support the highest and best use of the existing improvement but, because of physical limitations, building placement, or neighborhood norms, cannot be sold off separately. Such land may or may not contribute positively to value and may or may not accommodate future expansion of an existing or anticipated improvement.See alsoexcess land.‡
usable area1) The area actually used by individual tenants. 2) The Usable Area of an office building is computed by measuring to the finished surface of the office side of corridor and other permanent walls, to the center of partitions that separate the office from adjoining usable areas, and to the inside finished surface of the dominant portion of the permanent outer building walls. Excludes areas such as mechanical rooms, janitorial room, restrooms, lobby, and any major vertical penetrations of a multi-tenant floor.*
use value Use value is a concept based on the productivity of an economic good. Use value is the value a specific property has for a specific use. Use value focuses on the value the real estate contributes to the enterprise of which it is a part, without regard to the property’s highest and best use or the monetary amount that might be realized upon its sale.†
value indication An opinion of value derived through application of the appraisal process.‡
| † | The Appraisal of Real Estate, Twelfth Edition, Appraisal Institute, 2001. | |
| ‡ | The Dictionary of Real Estate Appraisal, Fourth Edition, Appraisal Institute, 2002. | |
| § | Office of Comptroller of the Currency (OCC), 12 CFR Part 34, Subpart C – Appraisals, 34.42 (g); Office of Thrift Supervision (OTS), 12 CFR 564.2 (g); Appraisal Institute,The Dictionary of Real Estate Appraisal, 4th ed. (Chicago: Appraisal Institute, 2002), 177-178. This is also compatible with the RTC, FDIC, FRS and NCUA definitions of market value as well as the example referenced in theUniform Standards of Professional Appraisal Practice (USPAP). | |
| * | 2000 BOMA Experience Exchange Report, Income/Expense Analysis for Office Buildings (Building Owners and Managers Association, 2000) | |
| †† | Statement on Appraisal Standard No. 6, Appraisal Standards Board of The Appraisal Foundation, September 16, 1993, revised June 15, 2004. |
©2007 CB Richard Ellis, Inc.
Table of Contents
Table of Contents
LAND SALE SUMMARY
| Price Per | ||||||||||||||||||||||||||||||
| Sale | Trans Type | Sales | Size | Proposed | Price | Price PSF | Permitted | |||||||||||||||||||||||
| No. | Property Location | Date | Price | (Acres) | Use | Per Acre | of Land Area | Unit | ||||||||||||||||||||||
| 1 | 3372 N.W. 17th Avenue | Sale | $ | 6,800,000 | 3.59 | Affordable Housing | $ | 2,403,421 | $ | 55.18 | $ | 16,038 | ||||||||||||||||||
| Miami,FL 33142 | 3/2006 | |||||||||||||||||||||||||||||
| 2 | 1551 N.W. 36th Street | Sale | $ | 2,725,000 | 1.09 | 92-Unit Residential Dev | $ | 3,419,579 | $ | 78.50 | $ | 29,880 | ||||||||||||||||||
| Miami,FL 33142 | 1/2007 | |||||||||||||||||||||||||||||
| 3 | 12000 NE 16th Avenue | Sale | $ | 5,100,000 | 8.96 | Apartments | $ | 569,196 | $ | 13.07 | $ | 22,667 | ||||||||||||||||||
| North Miami,FL 33161 | 2/2007 | |||||||||||||||||||||||||||||
 © 2007 CB Richard Ellis, Inc.
Table of Contents
MULTI-FAMILY LAND SALE No. 1
Villa Amalia
Location Data
| Location: | 3372 N.W. 17th Avenue | |
| Miami,FL 33142 | ||
| County: | Miami-Dade | |
| Assessor’s Parcel No: | 01-3127-103-0010 | |
| Atlas Ref: | N/A |
Physical Data
| Type: | Multi-Family | |||
| Land Area: | Gross | Usable | ||
| Acres: | 3.5900 | 2.8293 | ||
| Square Feet: | 156,380 | 123,244 | ||
| Topography: | Generally Level | |||
| Shape: | Rectangular | |||
| Utilities: | All Available | |||
| Zoning: | R-4 & G/I | |||
| Allowable Bldg Area: | 311,647 | |||
| Floor Area Ratio: | 1.99 | |||
| No. of units: | 424 | |||
| Max FAR: | N/A | |||
| Frontage: | N.W. 33rd Street; N.W. 17th Avenue | |||
Analysis
| Use At Sale: | Vacated Building | |
| Proposed Use or Dev. | Affordable Housing | |
| Price Per Acre: | $2,403,421 | |
| Price Per SF of Land: | $55.18 | |
| Price Per Unit: | $16,038 | |
| Price Per SF of Bldg: | $21.82 |
Sale Data
| Transaction Type: | Sale | |
| Date: | 3/2006 | |
| Marketing Time: | N/A | |
| Grantor: | 733 NW LLC. | |
| Grantee: | GMN Development, LLC | |
| Document No.: | 24348/3560 | |
| Sale Price: | $6,800,000 | |
| Financing: | Cash to Seller | |
| Cash Eq.Price: | $6,800,000 | |
| Onsite/Offsite Costs: | $0 | |
| Adj. Sale Price: | $6,800,000 | |
| Verification: | Confidential |
Comments
This sale reflects the land transfer of 2.83 acres, located at the northwest corner of N.W. 17th Avenue and N.W. 33rd Street, in Miami, Miami-Dade County. At the time of sale, this property was improved with older, dilapidated buildings that were not being utiilzed, and were previously utilized as a religous institution. The site was purchased with the intent to develop affordable housing for senior citizens, and is currently in the application stage of the zoning approval process for 424 units providing a total allowable building area of 311,647 SF. This site purchased March 2006 for $6,800,000, which equates to $55.18/SF of land area, as well as $16,038/unit and $21.82/SF.
© 2007 CB Richard Ellis, Inc.
Table of Contents
RESIDENTIAL SUBDIVISION LAND SALE No. 2
Friendship Tower
Location Data
| Location: | 1551 N.W. 36th Street | |
| Miami,FL 33142 | ||
| County: | Miami-Dade | |
| Assessor’s Parcel No: | 01-3123-019-0120 | |
| Atlas Ref: | N/A |
Physical Data
| Type: | Residential Subdivision | |||
| Land Area: | Gross | Usable | ||
| Acres: | 1.0856 | 0.8039 | ||
| Square Feet: | 47,289 | 35,018 | ||
| Topography: | Generally Level | |||
| Shape: | Irregular | |||
| Utilities: | All Available | |||
| Zoning: | C-2 | |||
| Allowable Bldg Area: | 81,214 | |||
| Floor Area Ratio: | 1.72 | |||
| No. of units: | 92 | |||
| Max FAR: | ||||
| Frontage: | N.W. 36th Street/N.W. 37th Street; | |||
| N.W. 15th Avenue | ||||
Analysis
| Use At Sale: | 2 Story Bldg w/ Parking Lot | |
| Proposed Use or Dev. | 92-Unit Residential Dev | |
| Price Per Acre: | $3,419,579 | |
| Price Per SF of Land: | $78.50 | |
| Price Per Unit: | $29,880 | |
| Price Per SF of Bldg: | $33.85 |
Sale Data
| Transaction Type: | Sale | |
| Date: | 1/2007 | |
| Marketing Time: | N/A | |
| Grantor: | 665 Invest, Inc. | |
| Grantee: | Friendship Tower, LTD. | |
| Document No.: | 25331/1009 | |
| Sale Price: | $2,725,000 | |
| Financing: | Not Available | |
| Cash Eq.Price: | $2,725,000 | |
| Onsite/Offsite Costs: | $24,000 | |
| Adj. Sale Price: | $2,749,000 | |
| Verification: | Confidential |
Comments
This sale that reflects the land transfer of 0.80 acres, located at the southwest corner of N.W. 37th Street and N.W. 15th Avenue, within Allapattah, Miami, Miami-Dade County. At the time of the contract, the property was improved with a vacant two-story building that consists of 12,533 SF of net rentable area. The site is under contract with the intent to redevelop the site with affordable housing for senior citizens that will be known as Friendship Tower. The project will consist of one, 10-story building with ground retail space and 92 residential units with a mixture of 54 one-bedroom units and 38 two-bedroom units. This site was originally under contract for $2,800,000 in June 2006. During July 31, 2006, the original purchaser assigned all of its rights to the new purchaser, Friendship Tower, LTD for $2,725,000, which equates to $78.50/SF of land area, $33.85/SF of allowable building SF and $29,880/unit as per the proposed development plan. It should be noted that the property was to close by November 2006, however, was extended for an additional extension fee of $24,000 and closed in January 2007. As of January 2007, the project is in the preliminary stages of development with the City of Miami Planning and Zoning Department.
© 2007 CB Richard Ellis, Inc.
Table of Contents
MOBILE HOME PARK LAND SALE No. 3
Palm Trailer Park
Location Data
| Location: | 12000 NE 16th Avenue | |
| North Miami,FL 33161 | ||
| County: | Miami-Dade | |
| Assessor’s Parcel No: | 30-2229-001-0030 | |
| Atlas Ref: | N/A |
Physical Data
| Type: | Mobile Home Park | |||
| Land Area: | Gross | Usable | ||
| Acres: | 8.9600 | 8.9600 | ||
| Square Feet: | 390,298 | 390,298 | ||
| Topography: | Level, At Street Grade | |||
| Shape: | Rectangular | |||
| Utilities: | All Available | |||
| Zoning: | RU-3M | |||
| Allowable Bldg Area: | 195,149 | |||
| Floor Area Ratio: | 0.50 | |||
| No. of units: | 225 | |||
| Max FAR: | ||||
| Frontage: | NE 16th Avenue; NE 14th Avenue | |||
Analysis
| Use At Sale: | Mobile Home Park | |
| Proposed Use or Dev. | Apartments | |
| Price Per Acre: | $569,196 | |
| Price Per SF of Land: | $13.07 | |
| Price Per Unit: | $22,667 | |
| Price Per SF of Bldg: | $26.13 |
Sale Data
| Transaction Type: | Sale | |
| Date: | 2/2007 | |
| Marketing Time: | N/A | |
| Grantor: | Vimarju Corp. & Luxury Inc., et al | |
| Grantee: | Confidential | |
| Document No.: | N/A | |
| Sale Price: | $5,100,000 | |
| Financing: | Cash to Seller | |
| Cash Eq.Price: | $5,100,000 | |
| Onsite/Offsite Costs: | $0 | |
| Adj. Sale Price: | $5,100,000 | |
| Verification: | Broker |
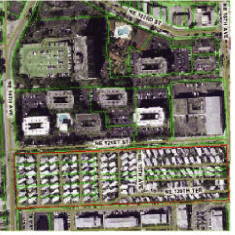
Comments
This tract is currently improved with the Palm Trailer Park. The property has frontage on both NE 16th Avenue and NE 14th Avenue, south of NE 123rd Street, in North Miami. Plans are to re-develop the site with a 225 unit apartment complex. The density of 25.4 units per acre is an up-zone from the original allowable density of 12.9 units per acre. The sale price per square foot of building area (FAR) is based on the existing density of 0.50 square feet of building area per square foot of land area. The final development plans may change; however, this represents the current right of use of the property. Closing occurred in February 2007; however, the recording information is not yet available.
© 2007 CB Richard Ellis, Inc.
Table of Contents
Table of Contents
APARTMENT SALE SUMMARY
| Sale | Trans Type | Yr.Built | NRA | Adj.Sale Price | Income Based On | Price | Price | |||||||||||||||||||||||||||||||||
| No. | Name / Location | Date | No.Units | Avg Unit | Occ. at Sale | NOI | OAR | EGIM | OER | PSF | Per Unit | |||||||||||||||||||||||||||||
| 1 | Asbury Park Apartments | Sale | 1972 | 172,350 | $ | 15,896,227 | $ | 1,066,662 | Existing | $ | 92.23 | $ | 67,932 | |||||||||||||||||||||||||||
| 17600 N.W. 5th Avenue | 3/2006 | 234 | 737 | 96 | % | 6.71 | % | 8.29 | 44.35 | % | ||||||||||||||||||||||||||||||
| Miami,FL | ||||||||||||||||||||||||||||||||||||||||
| 2 | Summerwinds | Sale | 1972 | 291,744 | $ | 32,000,000 | $ | 1,947,333 | Pro Forma | $ | 109.69 | $ | 91,954 | |||||||||||||||||||||||||||
| 490 NW 165th Street Road | 8/2006 | 348 | 838 | 97.7 | % | 6.09 | % | 7.91 | 51.89 | % | ||||||||||||||||||||||||||||||
| North Miami,FL | ||||||||||||||||||||||||||||||||||||||||
| 3 | Greenwich Park | Contract | 1985 | 332,300 | $ | 43,000,000 | $ | 2,343,197 | Pro Forma | $ | 129.40 | $ | 106,965 | |||||||||||||||||||||||||||
| 1550 NE 123rd Street | 3/2007 | 402 | 827 | 98 | % | 5.45 | % | 8.51 | 53.64 | % | ||||||||||||||||||||||||||||||
| North Miami,FL | ||||||||||||||||||||||||||||||||||||||||
| 4 | Somervale Apartments | Contract | 1974 | 429,350 | $ | 39,000,000 | $ | 2,371,305 | Pro Forma | $ | 90.83 | $ | 94,660 | |||||||||||||||||||||||||||
| 21010 NW 7th Avenue | 5/2007 | 412 | 1,042 | 91.3 | % | 6.08 | % | 7.68 | 53.31 | % | ||||||||||||||||||||||||||||||
| Miami,FL | ||||||||||||||||||||||||||||||||||||||||
© 2007 CB Richard Ellis, Inc.
Table of Contents
APARTMENT SALE No. 1
Asbury Park Apartments
Location Data
| Location: | 17600 N.W. 5th Avenue | |
| Miami,FL 33169 | ||
| County: | Miami-Dade | |
| Assessor’s Parcel No: | 34-2112-029-0010 | |
| Atlas Ref: | N/A |
Physical Data
| Type: | Multi-family Garden | |
| Land Area: | 8.000 Acres | |
| Grs Liv.Area | 172,350 SF | |
| Number of Units: | 234 | |
| Average Unit Size: | 737 SF | |
| Year Built: | 1972 | |
| No. of Stories: | 3 | |
| Exterior: | Concrete | |
| Condition: | Average | |
| Amenities: | Leasing/management office, on-site laundry, security patrol and tot-lot. |
Sale Data
| Transaction Type: | Sale | |
| Date: | 3/2006 | |
| Marketing Time: | N/A | |
| Grantor: | Advenir at Asbury, L.L.C. | |
| Grantee: | Hialeah Realty, L.L.C. | |
| Document No.: | N/A | |
| Sale Price: | $15,400,000 | |
| Financing: | Cash to Seller | |
| Cash Eq.Price: | $15,400,000 | |
| Req.Capital Cost: | $496,227 | |
| Adj. Sale Price: | $15,896,227 | |
| Verification: | Grantee |
Analysis
| Buyers Und. Crit.: | Direct Cap | |
| Overall Cap. Rate (OAR): | 6.71 % | |
| Projected IRR: | N/A % | |
| Eff. Gross Multiplier (EGIM): | 8.29 | |
| Oper. Expense Ratio (OER): | 44.35 % | |
| Price Per Square Foot: | $92.23 | |
| Price Per Unit: | $67,932 |
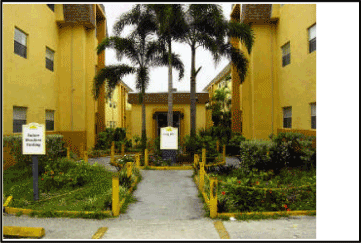
Financial Data
| Source: | Buyer | |
| Occupancy at Sale: | 96% | |
| Existing or ProForma Inc: | Existing |
| Total | Per Unit | |||||||
| Potential Gross Income: | $ | 1,975,940 | $ | 8,444 | ||||
| Vacancy and Credit Loss: | $ | 59,278 | $ | 253 | ||||
| Effective Gross Income: | $ | 1,916,662 | $ | 8,190 | ||||
| Expenses and Reserves: | $ | 850,000 | $ | 3,632 | ||||
| Net Operating Income: | $ | 1,066,662 | $ | 4,558 | ||||
Unit Mix
| Unit Type | No. | SF | % | |||||||||
| 1BR/1BA | 126 | 625 | 53 | |||||||||
| 2BR/1BA | 90 | 800 | 38 | |||||||||
| 3BR/2BA | 18 | 1200 | 7 | |||||||||
Totals | 234 | 172,350 | 100 | |||||||||
Comments
This complex of 234 units is located at the southwest corner of N.W. 177th Street and N.W. 5th Avenue, in northwest Miami-Dade County. This complex consists of one, two and three-bedroom unit types, ranging in size from 625 SF to 1,200 SF, with an overall average unit size of 737 SF. The property is currently under contract for $15,400,000 plus a $496,227 adjustment for escrow of required capital improvements. The adjusted sale price of $15,896,227 equates to $67,932 per unit. The financials include existing rental rates in place and historical expense figures. The buyer plans an extensive capital improvement program resulting in higher rental rates and net operating income at the property. This complex previously Sold in March of 2004 for $10,750,000 ($45,940/unit).
© 2007 CB Richard Ellis, Inc.
Table of Contents
APARTMENT SALE No. 2
Summerwinds
Location Data
| Location: | 490 NW 165th Street Road | |
| North Miami,FL 33169 | ||
| County: | Miami-Dade | |
| Assessor’s Parcel No: | 30-2113-000-0270 | |
| Atlas Ref: | N/A |
Physical Data
| Type: | Multi-family Mid/High Rise | |
| Land Area: | 8.890 Acres | |
| Grs Liv.Area | 291,744 SF | |
| Number of Units: | 348 | |
| Average Unit Size: | 838 SF | |
| Year Built: | 1972 | |
| No. of Stories: | 6 | |
| Exterior: | Concrete | |
| Condition: | Average | |
| Amenities: | Pool, clubhouse, fitness center |
Sale Data
| Transaction Type: | Sale | |
| Date: | 8/2006 | |
| Marketing Time: | N/A | |
| Grantor: | Waterton Summer, LLC | |
| Grantee: | Summerwinds Revocable Statutory | |
| Document No.: | 24882/0478 | |
| Sale Price: | $32,000,000 | |
| Financing: | Market Terms | |
| Cash Eq.Price: | $32,000,000 | |
| Req.Capital Cost: | $0 | |
| Adj. Sale Price: | $32,000,000 | |
| Verification: | Purchase Contract and Buyer |
Analysis
| Buyers Und. Crit.: | Other | |
| Overall Cap. Rate (OAR): | 6.09 % | |
| Projected IRR: | N/A % | |
| Eff. Gross Multiplier (EGIM): | 7.91 | |
| Oper. Expense Ratio (OER): | 51.89 % | |
| Price Per Square Foot: | $109.69 | |
| Price Per Unit: | $91,954 |
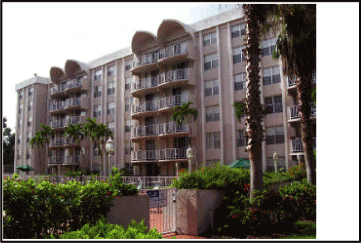
Financial Data
| Source: | Buyer | |
| Occupancy at Sale: | 97.7% | |
| Existing or ProForma Inc: | Pro Forma |
| Total | Per Unit | |||||||
| Potential Gross Income: | $ | 4,151,567 | $ | 11,929 | ||||
| Vacancy and Credit Loss: | $ | 103,789 | $ | 298 | ||||
| Effective Gross Income: | $ | 4,047,778 | $ | 11,631 | ||||
| Expenses and Reserves: | $ | 2,100,445 | $ | 6,035 | ||||
| Net Operating Income: | $ | 1,947,333 | $ | 5,595 | ||||
Unit Mix
| Unit Type | No. | SF | % | |||||||||
| 1BR/1BA | 156 | 696 | 44 | |||||||||
| 2BR/2BA | 96 | 863 | 27 | |||||||||
| 2BR/2BA | 96 | 1045 | 27 | |||||||||
Totals | 348 | 291,744 | 100 | |||||||||
Comments
This property was purchased for condo conversion. The sale property is a four building six-story mid-rise type development located just southeast of Interstate 95 and the Golden Glades interchange. Rental rates at the time of sale were $889 for the one-bedroom units, and $1,035 and $1,075 for the two-bedroom units, respectively. The pro forma overall average rent is $1.17/SF, about 10% above the existing contract rents. Expenses were based on actual historical, adjusted for higher insurance and including $200/unit for reserves. The sale was renegotiated downward upon receipt of the new insurance policy. The actual insurance quote was $2,390 per unit.
© 2007 CB Richard Ellis, Inc.
Table of Contents
APARTMENT SALE No. 3
Greenwich Park
Location Data
| Location: | 1550 NE 123rd Street | |
| North Miami,FL | ||
| County: | Miami-Dade | |
| Assessor’s Parcel No: | 06-2229-083-0050 + | |
| Atlas Ref: | N/A |
Physical Data
| Type: | Multi-family Mid/High Rise | |
| Land Area: | 9.440 Acres | |
| Grs Liv.Area | 332,300 SF | |
| Number of Units: | 402 | |
| Average Unit Size: | 827 SF | |
| Year Built: | 1985 thru 1989 | |
| No. of Stories: | 5 | |
| Exterior: | Concrete | |
| Condition: | Average | |
| Amenities: | Gated entry, two pools, fitness center, clubhouse, tennis courts, indoor racquetball court, spa and |
Sale Data
| Transaction Type: | Contract | |
| Date: | 3/2007 | |
| Marketing Time: | N/A | |
| Grantor: | Alliance TD, Ltd. | |
| Grantee: | N/A | |
| Document No.: | N/A | |
| Sale Price: | $43,000,000 | |
| Financing: | Not Available | |
| Cash Eq.Price: | $43,000,000 | |
| Req.Capital Cost: | $0 | |
| Adj. Sale Price: | $43,000,000 | |
| Verification: | Broker |
Analysis
| Buyers Und. Crit.: | Direct Cap | |
| Overall Cap. Rate (OAR): | 5.45 % | |
| Projected IRR: | N/A % | |
| Eff. Gross Multiplier (EGIM): | 8.51 | |
| Oper. Expense Ratio (OER): | 53.64 % | |
| Price Per Square Foot: | $129.40 | |
| Price Per Unit: | $106,965 |
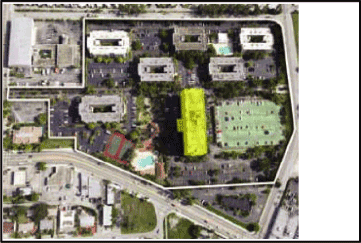
Financial Data
| Source: | Appraiser | |
| Occupancy at Sale: | 98% | |
| Existing or ProForma Inc: | Pro Forma |
| Total | Per Unit | |||||||
| Potential Gross Income: | $ | 5,183,408 | $ | 12,894 | ||||
| Vacancy and Credit Loss: | $ | 129,585 | $ | 322 | ||||
| Effective Gross Income: | $ | 5,053,823 | $ | 12,571 | ||||
| Expenses and Reserves: | $ | 2,710,626 | $ | 6,742 | ||||
| Net Operating Income: | $ | 2,343,197 | $ | 5,828 | ||||
Unit Mix
| Unit Type | No. | SF | % | |||||||||
| Studio | 6 | 550 | 1 | |||||||||
| 1BR/1BA | 184 | 750 | 45 | |||||||||
| 1BR/1BA | 52 | 750 | 12 | |||||||||
| 2BR/2BA | 80 | 950 | 19 | |||||||||
| 2BR/2BA | 80 | 950 | 19 | |||||||||
Totals | 402 | 332,300 | 100 | |||||||||
Comments
This contract for sale is part of the Greenwich Park apartments. One of the buildings is condominiums and is not indlcuded. The property for sale includes six, five-story buildings containing 402 units with a mix of studio, one-bedroom and two-bedroom units. The income and expense data was estimated by the appraiser based on the actual operating statements as of 12/31/2006, adjusted for rents in line with the market, higher taxes at an assessed value of 75% of contract price and insurance at $875 per unit.
© 2007 CB Richard Ellis, Inc.
Table of Contents
APARTMENT SALE No. 4
Somervale Apartments
Location Data
| Location: | 21010 NW 7th Avenue | |
| Miami,FL 33169 | ||
| County: | Miami-Dade | |
| Assessor’s Parcel No: | 34-1135-019-0010+ | |
| Atlas Ref: | N/A |
Physical Data
| Type: | Multi-family Mid/High Rise | |
| Land Area: | 13.780 Acres | |
| Grs Liv.Area | 429,350 SF | |
| Number of Units: | 412 | |
| Average Unit Size: | 1,042 SF | |
| Year Built: | 1974 | |
| No. of Stories: | 7 | |
| Exterior: | Concrete | |
| Condition: | Average | |
| Amenities: | Pool, fitness center, business center, tennis courts, laundry facilities |
Sale Data
| Transaction Type: | Contract | |
| Date: | 5/2007 | |
| Marketing Time: | N/A | |
| Grantor: | Oasis Club FF, LLC, Oasis Club RA, | |
| Grantee: | Breakstone Homes | |
| Document No.: | N/A | |
| Sale Price: | $39,000,000 | |
| Financing: | Cash to Seller | |
| Cash Eq.Price: | $39,000,000 | |
| Req.Capital Cost: | $0 | |
| Adj. Sale Price: | $39,000,000 | |
| Verification: | Purchase Contract & Buyer |
Analysis
| Buyers Und. Crit.: | Direct Cap and DCF | |
| Overall Cap. Rate (OAR): | 6.08 % | |
| Projected IRR: | N/A % | |
| Eff. Gross Multiplier (EGIM): | 7.68 | |
| Oper. Expense Ratio (OER): | 53.31 % | |
| Price Per Square Foot: | $90.83 | |
| Price Per Unit: | $94,660 |
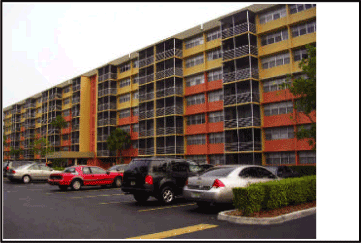
Financial Data
| Source: | Appraiser | |
| Occupancy at Sale: | 91.3% | |
| Existing or ProForma Inc: | Pro Forma |
| Total | Per Unit | |||||||
| Potential Gross Income: | $ | 5,403,583 | $ | 13,115 | ||||
| Vacancy and Credit Loss: | $ | 324,215 | $ | 786 | ||||
| Effective Gross Income: | $ | 5,079,368 | $ | 12,328 | ||||
| Expenses and Reserves: | $ | 2,708,063 | $ | 6,572 | ||||
| Net Operating Income: | $ | 2,371,305 | $ | 5,755 | ||||
Unit Mix
| Unit Type | No. | SF | % | |||||||||
| Studio | 6 | 625 | 1 | |||||||||
| 1BR/1BA | 89 | 800 | 21 | |||||||||
| 1BR/1.5BA | 164 | 915 | 39 | |||||||||
| 2BR/2BA | 28 | 1205 | 6 | |||||||||
| 2BR/2BA | 69 | 1320 | 16 | |||||||||
| 2BR/2BA | 56 | 1420 | 13 | |||||||||
Totals | 412 | 429,350 | 100 | |||||||||
Comments
This project is under contract and slated for condo conversion after the purchase. The income and expense data is based on actual at the time of sale adjusted for taxes in line with the sale price ($1,665/unit) and reserves of $200 were included. Insurance was $900 per unit, while payroll was $1,200 per unit, The other operating expenses totaled $2,608 per unit. The project had recently been renovated including exterior painting and replacement of applicance in 95 of the units. The prospective buyers are budgteing sale prices of $115,000 for the studio units, $134,990 and $145,990 for the one-bedroom units and a range between $179,990 and $199,990 for the two-bedroom units.
© 2007 CB Richard Ellis, Inc.
Table of Contents
Table of Contents
APARTMENT COMPARABLE SUMMARY
| No. of | Year Built | Floor | Size | Rent / | Rent / | |||||||||||||||||||
| No. | Name / Location | Units | Occupancy | Plan | (SF) | Month $ | SF $ | |||||||||||||||||
| 1 | Asbury Park | 234 | 1972 | 1 BD, 1 BA | 625 | 824 | 1.32 | |||||||||||||||||
| 17600 NW 5th Avenue | 88 | % | 2 BD, 1 BA | 800 | 985 | 1.23 | ||||||||||||||||||
| Miami Gardens,FL | 3 BD, 2 BA | 1200 | 1234 | 1.03 | ||||||||||||||||||||
| 2 | Aventura Harbor | 690 | 1986 | Studio | 550 | 895 | 1.63 | |||||||||||||||||
| 19455 NE 10th Avenue | 98 | % | 1 BR, 1 BA | 850 | 995 | 1.17 | ||||||||||||||||||
| Miami,FL | 2 BR, 1 BA | 930 | 1225 | 1.32 | ||||||||||||||||||||
| 2 BR, 2 BA | 980 | 1250 | 1.28 | |||||||||||||||||||||
| 2 BR, 2 BA | 1200 | 1350 | 1.13 | |||||||||||||||||||||
| 3 | Forest Place | 202 | 1971 | 1 BR, 1 BA | 911 | 910 | 1.00 | |||||||||||||||||
| 1600 NE 135th Street | 90 | % | 1 BR, 1 BA, Den | 1200 | 1105 | 0.92 | ||||||||||||||||||
| North Miami,FL | 1 BR, 1 BA | 975 | 925 | 0.95 | ||||||||||||||||||||
| 2 BR, 2 BA | 1200 | 1190 | 0.99 | |||||||||||||||||||||
| 2 BR, 2.5 BA PH | 2100 | 2200 | 1.05 | |||||||||||||||||||||
| 4 | Horizons North | 276 | 1988 | 1 BR, 1.5 BA | 690 | 905 | 1.31 | |||||||||||||||||
| 665 Ives Dairy Road | 96 | % | 1 BR, 1.5 BA, Pent | 1222 | 1223 | 1.00 | ||||||||||||||||||
| North Miami Beach,FL | 2 BR, 2 BA | 955 | 1052 | 1.10 | ||||||||||||||||||||
| 2 BR, 2 BA, Pent | 1476 | 1357 | 0.92 | |||||||||||||||||||||
| 2 BR, 2 BA w/Den | 1015 | 1112 | 1.10 | |||||||||||||||||||||
| 3 BR, 2 BA | 1015 | 1140 | 1.12 | |||||||||||||||||||||
| 3 BR, 2 BA, Pent | 1482 | 1380 | 0.93 | |||||||||||||||||||||
| 5 | Portofino at Biscayne | 866 | 1974 | Studio w/out Balcony | 510 | 834 | 1.64 | |||||||||||||||||
| 1820-1860 NE 142nd Street | 99.77 | % | Studio w/ Balcony | 510 | 859 | 1.68 | ||||||||||||||||||
| North Miami,FL | 1 BD/1 BA w/out Balc | 750 | 979 | 1.31 | ||||||||||||||||||||
| 1 BD/1 BA w/ Balcony | 750 | 1004 | 1.34 | |||||||||||||||||||||
| 2 BD/1 BA | 900 | 1194 | 1.33 | |||||||||||||||||||||
| 2 BD/2 BA w/Balcony | 1070 | 1294 | 1.21 | |||||||||||||||||||||
| 3 BD/2 BA | 1300 | 1385 | 1.07 | |||||||||||||||||||||
| 6 | Somervale Apartments fka Oasis Club | 412 | 1974 | Studio | 625 | 875 | 1.40 | |||||||||||||||||
| 21010 NW 7th Avenue | 88 | % | 1 BD, 1 BA | 800 | 905 | 1.13 | ||||||||||||||||||
| Miami,FL | 1 BD, 1.5 BA | 915 | 920 | 1.01 | ||||||||||||||||||||
| 2 BD, 2 BA | 1205 | 1105 | 0.92 | |||||||||||||||||||||
| 2 BD, 2 BA | 1320 | 1120 | 0.85 | |||||||||||||||||||||
| 2 BD, 2 BA | 1420 | 1140 | 0.80 | |||||||||||||||||||||

©2007 CB Richard Ellis, Inc.
Table of Contents
APARTMENT COMPARABLE No. 1
Asbury Park
Location Data
| Location: | 17600 NW 5th Avenue Miami Gardens,FL 33169 | |
| County: | Miami-Dade | |
| Assessor’s Parcel No: | 34-2112-029-0010 | |
| Atlas Ref: | N/A |
Physical Data
| Type: | Multi-family Mid/High Rise | |
| Number of Units: | 234 | |
| Year Built: | 1972 | |
| No. of Stories: | 3 | |
| Average Unit Size: | 737 SF | |
| Exterior: | Masonry | |
| Condition: | Fair | |
| Amenities: | Laundry rooms, elevators, and gated. |
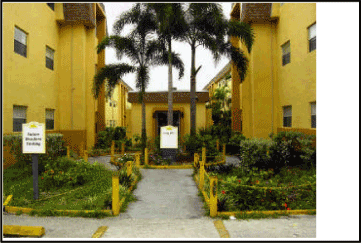
Occupancy / Lease Data
| Occupancy: | 88% | |
| Rent Premiums: | None | |
| Concessions: | None | |
| Typical Lease Term: | 12 months | |
| Utilities incl. in Rent: | Water, Sewer, Trash | |
| Tenant Profile: | Mixed | |
| Management Co.: | Manager | |
| Phone No: | (305)652-7858 | |
| Survey Date: | 7/2007 |
Rent Summary
| Unit Type | No. | SF | Rent | Rent PSF | ||||||||||||
| 1 BD, 1 BA | 126 | 625 | 824 | 1.32 | ||||||||||||
| 2 BD, 1 BA | 90 | 800 | 985 | 1.23 | ||||||||||||
| 3 BD, 2 BA | 18 | 1200 | 1234 | 1.03 | ||||||||||||
Totals | 234 | 172,350 | $ | 917 | $ | 1.25 | ||||||||||
Comments
This three-story mid-rise apartment complex is in average condition. The complex contains one, two and three bedroom apartments with an average unit size of 736 square feet. Rent concessions are not currently offered. Last survey 06/2006: overall rents $1.12 psf; occupancy 99%.
©2007 CB Richard Ellis, Inc.Table of Contents
APARTMENT COMPARABLE No. 2
Aventura Harbor
Location Data
| Location: | 19455 NE 10th Avenue | |
| Miami,FL 33179 | ||
| County: | Miami-Dade | |
| Assessor’s Parcel No: | 30-2205-000-0100R | |
| Atlas Ref: | N/A |
Physical Data
| Type: | Multi-family Mid/High Rise | |
| Number of Units: | 690 | |
| Year Built: | 1986 | |
| No. of Stories: | 5 | |
| Average Unit Size: | 925 SF | |
| Exterior: | Cement Block | |
| Condition: | Average | |
| Amenities: | 2 Pools, Spa, 2 Tennis Cts, Playground, Clubhouse, Volleyball, Picnic/BBQ area |
Occupancy / Lease Data
| Occupancy: | 98% | |
| Rent Premiums: | None | |
| Concessions: | None | |
| Typical Lease Term: | 7 and 12 months | |
| Utilities incl. in Rent: | Trash and Pest Control | |
| Tenant Profile: | Young professionals | |
| Management Co.: | United Property Mgmt/Lorena | |
| Phone No: | (305)654-7500 | |
| Survey Date: | 07/2007 |
Rent Summary
| Unit Type | No. | SF | Rent | Rent PSF | ||||||||||||
| Studio | 25 | 550 | 895 | 1.63 | ||||||||||||
| 1 BR, 1 BA | 205 | 850 | 995 | 1.17 | ||||||||||||
| 2 BR, 1 BA | 205 | 930 | 1225 | 1.32 | ||||||||||||
| 2 BR, 2 BA | 210 | 980 | 1250 | 1.28 | ||||||||||||
| 2 BR, 2 BA | 45 | 1200 | 1350 | 1.13 | ||||||||||||
Totals | 690 | 638,450 | $ | 1160 | $ | 1.25 | ||||||||||
Comments
This mid-rise apartment complex is located in northeast Miami-Dade County. The property comprises 690 units housed in 6, five-story buildings having a mix of efficiencies, one- and two-bedroom units. Project density is 41.45 units per acre. Project amenities include 2 swimming pools, 2 lighted tennis courts, a combination clubhouse/office/fitness center, 24-hour controlled access, and 160 parking garage spaces. Rental concessions are not currently offered. Survey 05/2007: overall rents $1.14 psf; occupancy 99%. Survey 04/2007: overall rents $1.09 psf; occupancy 95%. Survey 10/2006: overall rents $1.16 psf; occupancy 99%.
©2007 CB Richard Ellis, Inc.Table of Contents
APARTMENT COMPARABLE No. 3
Forest Place
Location Data
| Location: | 1600 NE 135th Street North Miami,FL 33181 | |
| County: | Miami-Dade | |
| Assessor’s Parcel No: | 06-2229-033-0100R | |
| Atlas Ref: | N/A |
Physical Data
| Type: | Multi-family Mid/High Rise | |
| Number of Units: | 202 | |
| Year Built: | 1971 | |
| No. of Stories: | 9 | |
| Average Unit Size: | 1,086 SF | |
| Exterior: | Cement Block | |
| Condition: | Average | |
| Amenities: | Laundry Facility, Sauna, Pool and Picnic Area |
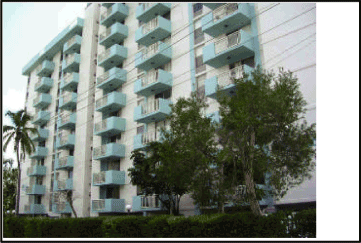
Occupancy / Lease Data
| Occupancy: | 90% | |
| Rent Premiums: | Resrv Park $50, Floor $10-105 | |
| Concessions: | None | |
| Typical Lease Term: | 7 and 12 Months | |
| Utilities incl. in Rent: | Trash & Pest Control | |
| Tenant Profile: | Singles, Families and Professionals | |
| Management Co.: | JMG/Annie | |
| Phone No: | (305)895-0270 | |
| Survey Date: | 07/2007 |
Rent Summary
| Unit Type | No. | SF | Rent | Rent PSF | ||||||||||||
| 1 BR, 1 BA | 36 | 911 | 910 | 1.00 | ||||||||||||
| 1 BR, 1 BA, Den | 18 | 1200 | 1105 | 0.92 | ||||||||||||
| 1 BR, 1 BA | 72 | 975 | 925 | 0.95 | ||||||||||||
| 2 BR, 2 BA | 72 | 1200 | 1190 | 0.99 | ||||||||||||
| 2 BR, 2.5 BA PH | 4 | 2100 | 2200 | 1.05 | ||||||||||||
Totals | 202 | 219,396 | $ | 1058 | $ | 0.97 | ||||||||||
Comments
This 202-unit high rise apartment complex is comprised of two, nine-story buildings with a mix of one, two and penthouse units situated on a 2.8 acre site indicating a density of 72.1 units per acre. Project amenities include laundry facility, sauna, picnic area and pool. Monthly rental premiums include reserved parking $50 and floor elevations ranging from $10 to $105. The tenants are individually metered for water and sewer. Rental concessions are not currently offered. Last survey 07/2007: overall rents $0.91 psf; occupancy 98%. Survey 10/2006: overall rents $0.94 psf; occupancy 92%.
©2007 CB Richard Ellis, Inc.Table of Contents
APARTMENT COMPARABLE No. 4
Horizons North
Location Data
| Location: | 665 Ives Dairy Road North Miami Beach,FL 33179 | |
| County: | Miami-Dade | |
| Assessor’s Parcel No: | 30-1231-014-0010 | |
| Atlas Ref: | N/A |
Physical Data
| Type: | Multi-family Garden | |
| Number of Units: | 276 | |
| Year Built: | 1988 | |
| No. of Stories: | 4 | |
| Average Unit Size: | 1,001 SF | |
| Exterior: | Concrete / Stucco | |
| Condition: | Average | |
| Amenities: | Pool, Gym, Gated Access, Spa, Laundry, Clubhouse |

Occupancy / Lease Data
| Occupancy: | 96% | |
| Rent Premiums: | None | |
| Concessions: | 1 month free | |
| Typical Lease Term: | 7 – 12 months | |
| Utilities incl. in Rent: | Trash and Pest | |
| Tenant Profile: | Singles and Families | |
| Management Co.: | Fifteenth Mgmt Corp/Behania | |
| Phone No: | 305-652-1258 | |
| Survey Date: | 07/2007 |
Rent Summary
| Unit Type | No. | SF | Rent | Rent PSF | ||||||||||||
| 1 BR, 1.5 BA | 21 | 690 | 905 | 1.31 | ||||||||||||
| 1 BR, 1.5 BA, Pent | 3 | 1222 | 1223 | 1.00 | ||||||||||||
| 2 BR, 2 BA | 123 | 955 | 1052 | 1.10 | ||||||||||||
| 2 BR, 2 BA, Pent | 16 | 1476 | 1357 | 0.92 | ||||||||||||
| 2 BR, 2 BA w/Den | 60 | 1015 | 1112 | 1.10 | ||||||||||||
| 3 BR, 2 BA | 48 | 1015 | 1140 | 1.12 | ||||||||||||
| 3 BR, 2 BA, Pent | 5 | 1482 | 1380 | 0.93 | ||||||||||||
Totals | 276 | 276,267 | $ | 1095 | $ | 1.09 | ||||||||||
Comments
Horizons North is a 276 unit apartment complex located in North Miami Beach, Miami-Dade, Florida. The complex is in average condition and contains one, two and three bedroom floorplans. Tenants pay water/sewer. Rental concession currently offered is on all units and includes one month free rent on a 13-month lease. The rates shown above are net of the concessions. Last survey 05/2007: overall rents $1.18 psf; occupancy 95%. Survey 08/2006: overall rents $1.15 psf; occupancy 98%.
©2007 CB Richard Ellis, Inc.Table of Contents
APARTMENT COMPARABLE No. 5
Portofino at Biscayne
Location Data
| Location: | 1820-1860 NE 142nd Street | |
| North Miami,FL 33181 | ||
| County: | Miami-Dade | |
| Assessor’s Parcel No: | 06-2221-023-0010R | |
| Atlas Ref: | N/A |
Physical Data
| Type: | Multi-family Mid/High Rise | |
| Number of Units: | 866 | |
| Year Built: | 1974 2004 Renov. | |
| No. of Stories: | 10 | |
| Average Unit Size: | 779 SF | |
| Exterior: | Cement Block | |
| Condition: | Average | |
| Amenities: | 2 lighted tennis courts, 2 pools, fitness center, 24-hour attended gatehouse, picnic area |
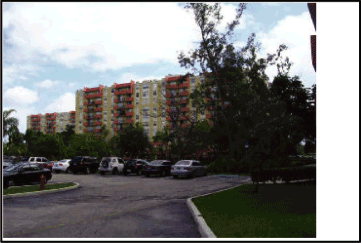
Occupancy / Lease Data
| Occupancy: | 99.77% | |
| Rent Premiums: | Balcony $25, Renovated $50 | |
| Concessions: | None | |
| Typical Lease Term: | 7 & 12 Months | |
| Utilities incl. in Rent: | Water & Sewer and Trash Removal | |
| Tenant Profile: | Singles, Families and Professionals | |
| Management Co.: | Riverstone Residential/Lucia | |
| Phone No: | (305)919-9720 | |
| Survey Date: | 07/2007 |
Rent Summary
| Unit Type | No. | SF | Rent | Rent PSF | ||||||||||||
| Studio w/out Balcony | 47 | 510 | 834 | 1.64 | ||||||||||||
| Studio w/ Balcony | 45 | 510 | 859 | 1.68 | ||||||||||||
| 1 BD/1 BA w/out Balc | 45 | 750 | 979 | 1.31 | ||||||||||||
| 1 BD/1 BA w/ Balcony | 529 | 750 | 1004 | 1.34 | ||||||||||||
| 2 BD/1 BA | 99 | 900 | 1194 | 1.33 | ||||||||||||
| 2 BD/2 BA w/Balcony | 100 | 1070 | 1294 | 1.21 | ||||||||||||
| 3 BD/2 BA | 1 | 1300 | 1385 | 1.07 | ||||||||||||
Totals | 866 | 674,820 | $ | 1042 | $ | 1.34 | ||||||||||
Comments
This high-rise apartment complex is located in North Miami and comprises five 10-story buildings. The tenant profile at this complex is mainly singles and small families. There are 866 rental units. The apartment complex was renovated in 2004 and 2005. Monthly rental premiums include $50 for units that have been renovated and $25 for units with balconies. Rent concessions are not currently offered. Last survey 04/2007: overall rents $1.34 psf; occupancy 97.8%. Survey 10/2006: overall rents $1.32 psf; occupancy 94.6%.
©2007 CB Richard Ellis, Inc.Table of Contents
APARTMENT COMPARABLE No. 6
Somervale Apartments fka Oasis Club
Location Data
| Location: | 21010 NW 7th Avenue Miami,FL 33169 | |
| County: | Miami-Dade | |
| Assessor’s Parcel No: | 34-1135-019-0010 | |
| Atlas Ref: | N/A |
Physical Data
| Type: | Multi-family Mid/High Rise | |
| Number of Units: | 412 | |
| Year Built: | 1974 | |
| No. of Stories: | 7 | |
| Average Unit Size: | 1,042 SF | |
| Exterior: | CBS | |
| Condition: | Good | |
| Amenities: | Laundry Facilities, Pool, Exercise Center, Business Center, Tennis |
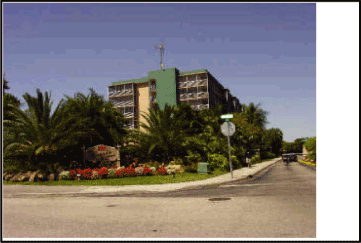
Occupancy / Lease Data
| Occupancy: | 88% | |
| Rent Premiums: | None | |
| Concessions: | None | |
| Typical Lease Term: | 12 Months | |
| Utilities incl. in Rent: | Trash | |
| Tenant Profile: | Families, Singles and Professionals | |
| Management Co.: | Fairfield Residential/Javier | |
| Phone No: | (305)651-8773 | |
| Survey Date: | 07/2007 |
Rent Summary
| Unit Type | No. | SF | Rent | Rent PSF | ||||||||||||
| Studio | 6 | 625 | 875 | 1.40 | ||||||||||||
| 1 BD, 1 BA | 89 | 800 | 905 | 1.13 | ||||||||||||
| 1 BD, 1.5 BA | 164 | 915 | 920 | 1.01 | ||||||||||||
| 2 BD, 2 BA | 28 | 1205 | 1105 | 0.92 | ||||||||||||
| 2 BD, 2 BA | 69 | 1320 | 1120 | 0.85 | ||||||||||||
| 2 BD, 2 BA | 56 | 1420 | 1140 | 0.80 | ||||||||||||
Totals | 412 | 429,350 | $ | 992 | $ | 0.95 | ||||||||||
Comments
This is a 412-unit mid rise apartment complex comprised of three, seven-story buildings with a mix of one and two-bedroom units situated on a 10.6 acres with a density of 38.9 units per acre. Project amenities include laundry facilities (three washer/dryer on every floor), pool, exercise center, business center, tennis court. Tenants pay water/sewer. Last survey 05/2007: overall rents $0.96 psf; occupancy 91.3%. The project is under contract for $39,000,000 and is slated for condo conversion.
©2007 CB Richard Ellis, Inc.Table of Contents
Table of Contents
| AIMCO 12 Month Operating Trend — Detail | ||||
| 000500 — Presidential House | ||||
| For the Period Ended June 2007 (1212OTD) | ||||
| APPLICATION :AIMCOPROPERTY | Run Date: 7/10/2007 12:40 PM | USER ID: gcoalson |
| JLY 06 | AUG 06 | SEP 06 | OCT 06 | NOV 06 | DEC 06 | JAN 07 | FEB 07 | MAR 07 | APR 07 | MAY 07 | JUN 07 | Total | ||||||||||||||||||||||||||||||||||||||||
INCOME | ||||||||||||||||||||||||||||||||||||||||||||||||||||
| 500000 - Market Rent | 206,987 | 200,487 | 199,357 | 200,487 | 200,907 | 199,777 | 188,487 | 186,227 | 186,227 | 192,977 | 200,797 | 201,740 | 2,364,457 | |||||||||||||||||||||||||||||||||||||||
| 500001 - Leases Under/Over Schedule | (23,577 | ) | (17,923 | ) | 7,079 | (9,310 | ) | (11,386 | ) | (13,410 | ) | (1,822 | ) | 2,603 | 2,590 | (2,777 | ) | (11,187 | ) | (11,382 | ) | (90,502 | ) | |||||||||||||||||||||||||||||
| 500501 - Renewal Price Adjustment | (383 | ) | (383 | ) | (383 | ) | (214 | ) | (190 | ) | (190 | ) | (90 | ) | 0 | 0 | 0 | 0 | 0 | (1,833 | ) | |||||||||||||||||||||||||||||||
| 512300 - Commercial Rent | 12 | 12 | 0 | 0 | 0 | 0 | 0 | 0 | 0 | 0 | 0 | 0 | 24 | |||||||||||||||||||||||||||||||||||||||
Non-subsidized Rental Income | 183,039 | 182,193 | 206,053 | 190,963 | 189,331 | 186,177 | 186,575 | 188,830 | 188,817 | 190,200 | 189,610 | 190,358 | 2,272,146 | |||||||||||||||||||||||||||||||||||||||
Total Gross Potential Rent | 183,039 | 182,193 | 206,053 | 190,963 | 189,331 | 186,177 | 186,575 | 188,830 | 188,817 | 190,200 | 189,610 | 190,358 | 2,272,146 | |||||||||||||||||||||||||||||||||||||||
| 519100 - Concessions Reimbursement | 0 | 0 | 0 | 0 | 0 | 0 | 0 | 0 | 0 | 0 | 135 | 544 | 679 | |||||||||||||||||||||||||||||||||||||||
| 625002 - Concessions/Special Promotior | (3,060 | ) | (7,191 | ) | (1,383 | ) | (945 | ) | (3,057 | ) | (4,185 | ) | (7,448 | ) | (7,614 | ) | (2,631 | ) | (279 | ) | (230 | ) | (416 | ) | (38,440 | ) | ||||||||||||||||||||||||||
| 625005 - Renewal Concession | (4,059 | ) | (3,066 | ) | (1,888 | ) | (1,127 | ) | (910 | ) | (1,019 | ) | (2,140 | ) | (1,605 | ) | (1,171 | ) | (1,191 | ) | (1,229 | ) | (1,121 | ) | (20,526 | ) | ||||||||||||||||||||||||||
| 625006 - Discount - Residents Monthly | (133 | ) | (181 | ) | (181 | ) | (181 | ) | (175 | ) | (156 | ) | (156 | ) | (156 | ) | (144 | ) | (34 | ) | (34 | ) | (1 | ) | (1,532 | ) | ||||||||||||||||||||||||||
| 625009 - Concession Amortization | 2,433 | 5,957 | 306 | (175 | ) | 906 | 2,795 | 5,988 | 4,427 | (976 | ) | (2,936 | ) | (3,446 | ) | (3,395 | ) | 11,883 | ||||||||||||||||||||||||||||||||||
Total Concessions | (4,819 | ) | (4,481 | ) | (3,146 | ) | (2,428 | ) | (3,236 | ) | (2,566 | ) | (3,756 | ) | (4,948 | ) | (4,922 | ) | (4,440 | ) | (4,804 | ) | (4,389 | ) | (47,937 | ) | ||||||||||||||||||||||||||
| 522000 - Vacancy Loss | (12,308 | ) | (8,106 | ) | (3,053 | ) | (3,778 | ) | (17,593 | ) | (20,546 | ) | (18,982 | ) | (14,139 | ) | (4,737 | ) | (2,104 | ) | (4,806 | ) | (9,267 | ) | (119,418 | ) | ||||||||||||||||||||||||||
Total Vacancy Loss | (12,308 | ) | (8,106 | ) | (3,053 | ) | (3,778 | ) | (17,593 | ) | (20,546 | ) | (18,982 | ) | (14,139 | ) | (4,737 | ) | (2,104 | ) | (4,806 | ) | (9,267 | ) | (119,418 | ) | ||||||||||||||||||||||||||
| 631200 - Administrative Units | (959 | ) | (919 | ) | (909 | ) | (919 | ) | (919 | ) | (909 | ) | (849 | ) | (829 | ) | (829 | ) | (859 | ) | (899 | ) | (940 | ) | (10,739 | ) | ||||||||||||||||||||||||||
Total Other Rental Losses | (959 | ) | (919 | ) | (909 | ) | (919 | ) | (919 | ) | (909 | ) | (849 | ) | (829 | ) | (829 | ) | (859 | ) | (899 | ) | (940 | ) | (10,739 | ) | ||||||||||||||||||||||||||
Total Rental Loss | (18,086 | ) | (13,506 | ) | (7,108 | ) | (7,125 | ) | (21,748 | ) | (24,021 | ) | (23,587 | ) | (19,916 | ) | (10,488 | ) | (7,403 | ) | (10,510 | ) | (14,596 | ) | (178,094 | ) | ||||||||||||||||||||||||||
Net Rental Income | 164,953 | 168,687 | 198,945 | 183,837 | 167,583 | 162,156 | 162,989 | 168,914 | 178,329 | 182,797 | 179,101 | 175,762 | 2,094,052 | |||||||||||||||||||||||||||||||||||||||
| 590508 - Resident Util Pymts: Electricity | 0 | 0 | 0 | 0 | 30 | 0 | 0 | 0 | 0 | 25 | 0 | 0 | 55 | |||||||||||||||||||||||||||||||||||||||
| 590514 - Resident Util Pymts: Misc | 0 | 196 | 208 | 529 | 1,210 | 2,014 | 660 | 584 | 1,018 | (187 | ) | 856 | 318 | 7,405 | ||||||||||||||||||||||||||||||||||||||
| 590530 - Resid Util Pymts: Accr Adjs | 0 | 0 | 0 | 0 | 0 | 0 | 0 | 0 | 0 | 0 | 0 | (372 | ) | (372 | ) | |||||||||||||||||||||||||||||||||||||
Total Utility Payments from Reside | 0 | 196 | 208 | 529 | 1,240 | 2,014 | 660 | 584 | 1,018 | (162 | ) | 856 | (54 | ) | 7,089 | |||||||||||||||||||||||||||||||||||||
| 591000 - Laundry Income | 2,174 | 2,017 | 1,624 | 2,146 | 3,603 | 2,299 | 0 | 2,026 | 1,897 | 1,403 | 2,319 | 2,436 | 23,944 | |||||||||||||||||||||||||||||||||||||||
| 591007 - AS-Cable TV | 0 | 2,397 | 0 | 0 | 0 | 1,247 | 0 | 2,241 | 0 | 2,574 | 0 | 0 | 8,458 | |||||||||||||||||||||||||||||||||||||||
| 591008 - AS - Local Telephone | 418 | 40 | 0 | 0 | 453 | (7 | ) | 0 | 451 | 0 | 0 | 0 | 199 | 1,554 | ||||||||||||||||||||||||||||||||||||||
| 591011 - Soft Drink Vending | 0 | 0 | 0 | 21 | 0 | 2 | 50 | 0 | 0 | 36 | 0 | 0 | 108 | |||||||||||||||||||||||||||||||||||||||
| 591030 - AS - Accrual Adjustments | 0 | 0 | 0 | 0 | 0 | 0 | 0 | 0 | 0 | 0 | 0 | 71 | 71 | |||||||||||||||||||||||||||||||||||||||
Total Ancillary Services Income | 2,592 | 4,454 | 1,624 | 2,167 | 4,056 | 3,541 | 50 | 4,718 | 1,897 | 4,013 | 2,319 | 2,707 | 34,136 | |||||||||||||||||||||||||||||||||||||||
| 500005 - Month to Month Fee | 747 | 953 | 1,233 | 360 | 193 | 27 | 213 | 453 | 0 | 400 | 407 | 413 | 5,400 | |||||||||||||||||||||||||||||||||||||||
| 500006 - Short Term Lease Fee | 0 | 0 | 0 | 0 | 0 | 0 | 0 | 0 | 0 | 0 | 40 | 75 | 115 | |||||||||||||||||||||||||||||||||||||||
| 592001 - Late Charges | 2,300 | 2,500 | 4,500 | 1,319 | 3,000 | 2,000 | 3,400 | 3,100 | 2,500 | 3,200 | 3,400 | 2,900 | 34,119 | |||||||||||||||||||||||||||||||||||||||
| 592002 - NSF Charges | 0 | 40 | 120 | 280 | 160 | 40 | 40 | 40 | 120 | 40 | 40 | 80 | 1,000 | |||||||||||||||||||||||||||||||||||||||
| 592004 - Admin Fees - Resident Charges | 0 | 0 | 0 | 0 | 700 | 0 | 0 | 0 | 0 | 0 | 0 | 0 | 700 | |||||||||||||||||||||||||||||||||||||||
| 592006 - Keys, Locks, Lock Changes | 0 | 0 | 0 | 50 | 0 | 0 | 0 | 0 | 50 | 0 | 50 | 0 | 150 | |||||||||||||||||||||||||||||||||||||||
| 592009 - Miscellaneous Resident Charge | 0 | 1,191 | 370 | 145 | 848 | 100 | 0 | 0 | 550 | 350 | 725 | 250 | 4,529 | |||||||||||||||||||||||||||||||||||||||
| 592010 - Non-refundable Admin Fees | 1,400 | 2,800 | 1,000 | 1,400 | 800 | 1,200 | 2,300 | 3,600 | 2,600 | 1,400 | 800 | 800 | 20,100 | |||||||||||||||||||||||||||||||||||||||
| 593000 - Cleaning & Damage Fees | 894 | 1,555 | 1,034 | 1,176 | 968 | 82 | 121 | 92 | 1,593 | 1,614 | 4,094 | 2,366 | 15,589 | |||||||||||||||||||||||||||||||||||||||
©2007 CB Richard Ellis, Inc.
1
Table of Contents
| AIMCO 12 Month Operating Trend — Detail | ||||
| 000500 — Presidential House | ||||
| For the Period Ended June 2007 (1212OTD) | ||||
| APPLICATION :AIMCOPROPERTY | Run Date: 7/10/2007 12:40 PM | USER ID: gcoalson |
| JLY 06 | AUG 06 | SEP 06 | OCT 06 | NOV 06 | DEC 06 | JAN 07 | FEB 07 | MAR 07 | APR 07 | MAY 07 | JUN 07 | Total | ||||||||||||||||||||||||||||||||||||||||
| 593002 - Pet Damage Charges | 0 | 0 | 877 | 470 | 120 | 0 | 0 | 0 | 0 | 0 | 0 | 0 | 1,467 | |||||||||||||||||||||||||||||||||||||||
| 593003 - Contra Cleaning and Damage | 0 | 0 | 0 | 0 | 0 | 0 | 0 | 0 | (375 | ) | (363 | ) | (1,478 | ) | (772 | ) | (2,988 | ) | ||||||||||||||||||||||||||||||||||
| 599002 - Legal Fees | 0 | 0 | 2,045 | 1,470 | 995 | 245 | 245 | 0 | 980 | 1,355 | 1,715 | 1,035 | 10,085 | |||||||||||||||||||||||||||||||||||||||
| 599003 - Non-refundable Pet Fees | 0 | 150 | 0 | 0 | 450 | 0 | 0 | 0 | 150 | 400 | 1,150 | 600 | 2,900 | |||||||||||||||||||||||||||||||||||||||
| 599004 - Lease Cancellation Fees | 63 | 3,523 | 2,008 | 4,164 | 10,072 | 1,001 | 2,727 | 4,415 | 2,786 | (818 | ) | 6,948 | 6,784 | 43,674 | ||||||||||||||||||||||||||||||||||||||
| 599005 - Application Fees | 850 | 1,125 | 475 | 425 | 325 | 1,700 | 2,250 | 3,000 | 2,325 | 1,140 | 375 | 550 | 14,540 | |||||||||||||||||||||||||||||||||||||||
| 599007 - Clubhouse Rentals | 0 | 0 | 0 | 0 | 0 | 0 | 0 | 0 | 0 | 0 | 200 | 0 | 200 | |||||||||||||||||||||||||||||||||||||||
| 599013 - Monthly Pet Rent | 0 | 17 | 20 | 20 | 49 | 60 | 60 | 60 | 95 | 130 | 171 | 336 | 1,019 | |||||||||||||||||||||||||||||||||||||||
| 599014 - Contra Lease Cancellation Fees | 0 | (1,706 | ) | (2,556 | ) | (3,714 | ) | (2,987 | ) | (6,793 | ) | (2,327 | ) | (1,383 | ) | (1,395 | ) | 0 | (4,541 | ) | (1,357 | ) | (28,759 | ) | ||||||||||||||||||||||||||||
Total Miscellaneous Income | 6,253 | 12,148 | 11,126 | 7,565 | 15,693 | (338 | ) | 9,029 | 13,378 | 11,980 | 8,848 | 14,096 | 14,061 | 123,839 | ||||||||||||||||||||||||||||||||||||||
Total Other Income | 8,845 | 16,798 | 12,958 | 10,261 | 20,988 | 5,218 | 9,738 | 18,679 | 14,895 | 12,698 | 17,270 | 16,714 | 165,063 | |||||||||||||||||||||||||||||||||||||||
| 637000 - Bad Debt Expense | (5,951 | ) | (12,687 | ) | (9,235 | ) | (14,201 | ) | (27,209 | ) | (6,074 | ) | (4,924 | ) | (6,070 | ) | (1,708 | ) | (2,921 | ) | (10,456 | ) | (11,335 | ) | (112,770 | ) | ||||||||||||||||||||||||||
| 637001 - Bad Debt Collections | 0 | 0 | 0 | 0 | 0 | 0 | 175 | 486 | 0 | 0 | 0 | 0 | 661 | |||||||||||||||||||||||||||||||||||||||
| 637003 - Bad Debt Collection: Professior | 0 | 0 | 48 | 0 | 0 | 0 | 201 | 0 | 0 | 0 | 377 | 0 | 626 | |||||||||||||||||||||||||||||||||||||||
| 637005 - Bank Reconciliation Adjustment | 0 | 10 | (1,347 | ) | (625 | ) | 0 | 589 | 4 | (300 | ) | 0 | (2 | ) | (934 | ) | 0 | (2,605 | ) | |||||||||||||||||||||||||||||||||
Total Bad Debt Expense | (5,951 | ) | (12,677 | ) | (10,534 | ) | (14,826 | ) | (27,209 | ) | (5,485 | ) | (4,544 | ) | (5,885 | ) | (1,708 | ) | (2,923 | ) | (11,012 | ) | (11,335 | ) | (114,089 | ) | ||||||||||||||||||||||||||
Effective Gross Income | 167,847 | 172,808 | 201,369 | 179,273 | 161,363 | 161,888 | 168,183 | 181,709 | 191,516 | 192,572 | 185,358 | 181,141 | 2,145,026 | |||||||||||||||||||||||||||||||||||||||
OPERATING EXPENSES | ||||||||||||||||||||||||||||||||||||||||||||||||||||
| 615600 - Fire Protection | 0 | 0 | 0 | 0 | 0 | 0 | 0 | 0 | 0 | 0 | 13 | 78 | 91 | |||||||||||||||||||||||||||||||||||||||
| 618601 -Cleaning Supplies | 0 | 0 | 0 | 0 | 0 | 0 | 0 | 93 | 730 | 0 | 0 | 0 | 823 | |||||||||||||||||||||||||||||||||||||||
| 619300 - Lease - Equipment | 0 | 0 | 0 | 0 | 0 | 552 | 0 | 0 | 0 | 0 | 169 | 186 | 906 | |||||||||||||||||||||||||||||||||||||||
Common Area Expense | 0 | 0 | 0 | 0 | 0 | 552 | 0 | 93 | 730 | 0 | 182 | 264 | 1,821 | |||||||||||||||||||||||||||||||||||||||
| 645001 - Electricity - Vacant | 2,239 | 2,292 | 2,442 | 2,560 | 2,263 | 1,971 | 1,714 | 890 | 775 | 673 | 597 | 1,078 | 19,494 | |||||||||||||||||||||||||||||||||||||||
| 645003 - Electricity - List Bills | 2,689 | 2,443 | 2,496 | 3,034 | 2,589 | 2,450 | 2,476 | 2,301 | 2,508 | 2,391 | 2,329 | 2,208 | 29,914 | |||||||||||||||||||||||||||||||||||||||
| 645100 - Water | (2,500 | ) | 2,245 | 1,731 | 1,547 | 880 | 1,500 | 556 | 726 | 727 | 635 | 562 | 248 | 8,857 | ||||||||||||||||||||||||||||||||||||||
| 645203 - Gas - - List Bills | 3,161 | 2,526 | 2,111 | 2,525 | 2,100 | 2,878 | 4,254 | 3,158 | 3,100 | 3,250 | 2,463 | 2,397 | 33,924 | |||||||||||||||||||||||||||||||||||||||
| 645300 - Sewer | (1,789 | ) | 6,573 | 4,358 | 3,964 | 3,129 | 3,000 | 3,952 | 2,884 | 3,004 | 2,849 | 2,665 | 2,372 | 36,961 | ||||||||||||||||||||||||||||||||||||||
| 647000 - Fees, Penalties - Utilities | 0 | 31 | 0 | 0 | 0 | 0 | 291 | 0 | 0 | 0 | 0 | 0 | 321 | |||||||||||||||||||||||||||||||||||||||
| 647001 - Utility Processing Fees | 20 | 25 | 0 | 45 | 160 | 84 | 121 | 140 | 0 | 170 | 50 | 50 | 865 | |||||||||||||||||||||||||||||||||||||||
| 649000 - Misc Utility Charges | 112 | 180 | 156 | 168 | 142 | 198 | 221 | 177 | 150 | 112 | 103 | 115 | 1,835 | |||||||||||||||||||||||||||||||||||||||
Total Utilities Expense | 3,933 | 16,314 | 13,294 | 13,844 | 11,262 | 12,081 | 13,584 | 10,278 | 10,263 | 10,080 | 8,770 | 8,468 | 132,171 | |||||||||||||||||||||||||||||||||||||||
| 631701 - Contract Common Area Cleanir | 0 | 0 | 0 | 280 | 0 | 50 | 0 | 0 | 755 | 0 | 420 | 0 | 1,505 | |||||||||||||||||||||||||||||||||||||||
| 651900 - Contract Exterminating | 305 | 305 | 305 | 620 | 305 | 0 | 624 | 320 | 420 | 320 | 320 | 620 | 4,461 | |||||||||||||||||||||||||||||||||||||||
| 652500 - Contract Trash Removal | 1,605 | 2,403 | 3,413 | 2,808 | 2,041 | 3,026 | 1,857 | 2,396 | 3,258 | 3,427 | 1,617 | 8,206 | 36,058 | |||||||||||||||||||||||||||||||||||||||
| 653002 - Contract Courtesy Patrol | 255 | 255 | 0 | 0 | 0 | 0 | 0 | 0 | 0 | 0 | 0 | 0 | 509 | |||||||||||||||||||||||||||||||||||||||
| 653004 - Contract Alarm System | 0 | 0 | 0 | 0 | 0 | 0 | 0 | 0 | 243 | 0 | 2,957 | (308 | ) | 2,892 | ||||||||||||||||||||||||||||||||||||||
| 653700 - Contract Yards and Grounds | 400 | 900 | 0 | 900 | 900 | 1,800 | 900 | 900 | 900 | 900 | 900 | 900 | 10,300 | |||||||||||||||||||||||||||||||||||||||
| 654200 - Contract Repairs | 0 | 0 | 51 | 0 | 0 | 0 | 0 | 28 | 0 | 0 | 0 | 0 | 79 | |||||||||||||||||||||||||||||||||||||||
| 654402 - Plumbing Contract | 97 | (285 | ) | 0 | 0 | 0 | 340 | 0 | 0 | 0 | (340 | ) | 0 | 0 | (188 | ) | ||||||||||||||||||||||||||||||||||||
| 654501 - Contract Elevator | 542 | 542 | 542 | 542 | 542 | 542 | 1,058 | 542 | 542 | 542 | 542 | (584 | ) | 5,894 | ||||||||||||||||||||||||||||||||||||||
| 654702 - Pool Contract | 255 | 255 | 595 | 0 | 365 | 305 | 305 | 315 | 305 | 305 | 305 | 460 | 3,770 | |||||||||||||||||||||||||||||||||||||||
©2007 CB Richard Ellis, Inc.
2
Table of Contents
| AIMCO 12 Month Operating Trend — Detail | ||||
| 000500 — Presidential House | ||||
| For the Period Ended June 2007 (1212OTD) | ||||
| APPLICATION :AIMCOPROPERTY | Run Date: 7/10/2007 12:40 PM | USER ID: gcoalson |
| JLY 06 | AUG 06 | SEP 06 | OCT 06 | NOV 06 | DEC 06 | JAN 07 | FEB 07 | MAR 07 | APR 07 | MAY 07 | JUN 07 | Total | ||||||||||||||||||||||||||||||||||||||||
| 654703 - Spa-contract cleaning | 0 | 0 | 0 | 0 | 0 | 0 | 0 | 0 | 0 | 670 | 200 | 328 | 1,198 | |||||||||||||||||||||||||||||||||||||||
| 669900 - Other Contracts | 0 | 0 | 0 | 0 | 0 | 7,012 | 133 | 865 | 747 | 0 | 248 | 0 | 9,005 | |||||||||||||||||||||||||||||||||||||||
Total Contract Service | 3,458 | 4,374 | 4,906 | 5,150 | 4,153 | 13,075 | 4,877 | 5,366 | 7,170 | 5,824 | 7,509 | 9,621 | 75,482 | |||||||||||||||||||||||||||||||||||||||
| 617600 - Window & Glass Repair | 3 | 20 | 117 | (37 | ) | 58 | 0 | 26 | 75 | (140 | ) | 431 | 402 | 90 | 1,045 | |||||||||||||||||||||||||||||||||||||
| 621300 - Kitchen Equipment | 0 | 0 | 0 | 0 | 0 | 0 | 0 | 0 | 0 | 191 | 0 | 0 | 191 | |||||||||||||||||||||||||||||||||||||||
| 651500 - Cleaning Supplies | 45 | 73 | 278 | 270 | 66 | 0 | 157 | 0 | (197 | ) | 0 | 201 | 661 | 1,555 | ||||||||||||||||||||||||||||||||||||||
| 652000 - Exterminating Supplies | 0 | 0 | 0 | 0 | 0 | 0 | 8 | 0 | 0 | 0 | 16 | 0 | 24 | |||||||||||||||||||||||||||||||||||||||
| 652300 - Gas/Oil/Mileage | 15 | 0 | 0 | 0 | 0 | 0 | 0 | 0 | 0 | 26 | 0 | 0 | 41 | |||||||||||||||||||||||||||||||||||||||
| 654004 - Handyman - Other Materials | 0 | 0 | 0 | 0 | 64 | 0 | 0 | 0 | 0 | 0 | 0 | 0 | 64 | |||||||||||||||||||||||||||||||||||||||
| 654100 - Repairs/Maint. - Materials | 50 | 0 | 0 | 0 | 0 | 0 | 0 | 0 | 2,238 | 79 | 164 | 55 | 2,586 | |||||||||||||||||||||||||||||||||||||||
| 654101 - Electrical Supplies | 419 | (1 | ) | 775 | 805 | 164 | 528 | 1,285 | 824 | (286 | ) | (527 | ) | 1,639 | 395 | 6,019 | ||||||||||||||||||||||||||||||||||||
| 654102 - Plumbing Supplies | 93 | 14 | 1,635 | 1,116 | 343 | 567 | 1,182 | 705 | (1,234 | ) | (114 | ) | 1,766 | 393 | 6,466 | |||||||||||||||||||||||||||||||||||||
| 654103 -Appliance Parts | 123 | 148 | 27 | 181 | 54 | 69 | 280 | 104 | 53 | 167 | 83 | 320 | 1,608 | |||||||||||||||||||||||||||||||||||||||
| 654105 - Plumbing Fixtures/Repairs | 183 | 596 | 52 | 403 | 153 | 5,641 | 4,094 | 550 | 102 | (476 | ) | 1,546 | (550 | ) | 12,294 | |||||||||||||||||||||||||||||||||||||
| 654109 - Window Replacement | 40 | 0 | 0 | 0 | 0 | 0 | 0 | 0 | 0 | 0 | 0 | 0 | 40 | |||||||||||||||||||||||||||||||||||||||
| 654120 - Keys and Locks | 33 | 4 | 347 | 661 | 74 | 0 | 278 | 133 | (162 | ) | 59 | 711 | 102 | 2,239 | ||||||||||||||||||||||||||||||||||||||
| 654125 - Water Extraction | 0 | 0 | 775 | 0 | 0 | 0 | 0 | 0 | 0 | 0 | 0 | 0 | 775 | |||||||||||||||||||||||||||||||||||||||
| 654199 - Other Maintenance Materials | 62 | (1 | ) | 468 | 2 | 79 | 35 | 185 | 221 | 496 | 480 | 1,086 | 247 | 3,362 | ||||||||||||||||||||||||||||||||||||||
| 654201 - Roof Repairs | 0 | 0 | 0 | 0 | 0 | 0 | 0 | 725 | 0 | 0 | 0 | 0 | 725 | |||||||||||||||||||||||||||||||||||||||
| 654205 - Interior Building Improvements | 0 | 0 | 0 | 685 | 0 | 0 | 0 | 990 | 150 | 0 | 76 | 165 | 2,065 | |||||||||||||||||||||||||||||||||||||||
| 654206 - Exterior Building Improvements | 0 | 0 | 9 | 0 | 0 | 0 | 0 | 0 | 0 | 0 | 1,000 | 0 | 1,009 | |||||||||||||||||||||||||||||||||||||||
| 654601 - HVAC Parts & Supplies | 516 | 5 | 170 | 889 | 0 | 218 | 931 | 1 | (18 | ) | (1 | ) | 299 | 402 | 3,410 | |||||||||||||||||||||||||||||||||||||
| 654700 - Pool Expense | 0 | 0 | 0 | 0 | 0 | 0 | 0 | 0 | 0 | 0 | 46 | 0 | 46 | |||||||||||||||||||||||||||||||||||||||
| 655200 - R & M Rebate - MRO | (178 | ) | (4 | ) | (86 | ) | (178 | ) | (50 | ) | (7 | ) | (56 | ) | (198 | ) | 61 | (37 | ) | (141 | ) | (206 | ) | (1,080 | ) | |||||||||||||||||||||||||||
| 655201 - R & M Rebate - Other | (193 | ) | (129 | ) | 54 | (44 | ) | (176 | ) | (137 | ) | 27 | 47 | (204 | ) | (102 | ) | (91 | ) | 13 | (933 | ) | ||||||||||||||||||||||||||||||
| 656005 - Light Bulbs | 16 | (10 | ) | 147 | 269 | 115 | 0 | 318 | 142 | (7 | ) | (135 | ) | 289 | 37 | 1,182 | ||||||||||||||||||||||||||||||||||||
| 656300 - Misc. | 0 | 0 | 0 | 0 | 62 | 0 | 0 | 0 | 0 | 0 | 0 | 0 | 62 | |||||||||||||||||||||||||||||||||||||||
| 659001 - Fire Protection Equip Maint | 0 | 0 | 0 | 0 | 0 | 835 | 1,131 | 2,148 | 0 | 0 | 0 | 0 | 4,114 | |||||||||||||||||||||||||||||||||||||||
Total Repairs & Maintenance | 1,228 | 716 | 4,768 | 5,023 | 1,006 | 7,749 | 9,845 | 6,468 | 852 | 39 | 9,092 | 2,124 | 48,908 | |||||||||||||||||||||||||||||||||||||||
| 651700 - Contract Cleaning | 1,080 | 490 | 675 | 1,590 | 580 | 2,010 | 0 | 1,735 | 695 | (170 | ) | 205 | 480 | 9,370 | ||||||||||||||||||||||||||||||||||||||
| 656002 - Contract Carpet Cleaning and D | 950 | 405 | 701 | 795 | 170 | 1,315 | 1,235 | 30 | 860 | 510 | 605 | 435 | 8,011 | |||||||||||||||||||||||||||||||||||||||
| 656003 - Contract Painting - Interior | 1,653 | 965 | 1,889 | 1,850 | 185 | 1,271 | (652 | ) | 1,582 | 3,181 | 355 | 891 | 2,554 | 15,724 | ||||||||||||||||||||||||||||||||||||||
| 656101 - Drapery/Miniblinds Repairs | (1 | ) | 0 | 163 | (7 | ) | 0 | 303 | 85 | 0 | 0 | 0 | 7 | 0 | 550 | |||||||||||||||||||||||||||||||||||||
| 656102 - Painting Supplies | 680 | (35 | ) | 186 | 807 | 28 | 1,351 | 236 | 5,270 | 1,877 | (554 | ) | 2,725 | (20 | ) | 12,552 | ||||||||||||||||||||||||||||||||||||
Total Turnover Expense | 4,363 | 1,825 | 3,614 | 5,036 | 963 | 6,249 | 904 | 8,617 | 6,613 | 141 | 4,433 | 3,449 | 46,207 | |||||||||||||||||||||||||||||||||||||||
| 617104 - Radios/Pagers | 0 | 58 | 198 | 29 | 8 | 702 | 18 | 25 | 0 | 439 | 0 | 15 | 1,492 | |||||||||||||||||||||||||||||||||||||||
| 631100 - Office Supplies | 491 | 25 | 158 | 20 | 84 | 15 | (118 | ) | 128 | 9 | 171 | 1,054 | 748 | 2,783 | ||||||||||||||||||||||||||||||||||||||
| 631101 - Office Equipment | 67 | 0 | 0 | 200 | 0 | 375 | 0 | 375 | 0 | 0 | 0 | 245 | 1,262 | |||||||||||||||||||||||||||||||||||||||
| 631102 - Bank Charges | 173 | 96 | 0 | 228 | 201 | 0 | 239 | 20 | 138 | 146 | 267 | 75 | 1,583 | |||||||||||||||||||||||||||||||||||||||
| 631104 - Applicant Screening | 0 | 73 | 157 | 0 | 136 | 85 | 280 | 349 | 379 | 370 | 159 | 64 | 2,050 | |||||||||||||||||||||||||||||||||||||||
| 631105 - Uniforms | 71 | 70 | 120 | 73 | 54 | 70 | 0 | 278 | 58 | 47 | 795 | 58 | 1,694 | |||||||||||||||||||||||||||||||||||||||
| 631106 - Express Mail, Stamps | 25 | 0 | 0 | 160 | 51 | 68 | 80 | 127 | 58 | 144 | 111 | 19 | 845 | |||||||||||||||||||||||||||||||||||||||
| 631108 - Credit Card Service Fees | 422 | 392 | 336 | 477 | 427 | 366 | 382 | 557 | 517 | 660 | 434 | 551 | 5,520 | |||||||||||||||||||||||||||||||||||||||
| 631111 - Resident Eviction/Separation | 620 | 0 | 3,100 | 773 | 3,570 | 1,245 | 0 | 1,105 | 735 | 1,230 | 1,600 | 0 | 13,978 | |||||||||||||||||||||||||||||||||||||||
| 631112 - Office Supplies Rebates | 0 | (6 | ) | 0 | 0 | 0 | 0 | 0 | 0 | 0 | 0 | 0 | 0 | (6 | ) | |||||||||||||||||||||||||||||||||||||
| 631650 - Fines and Penalties | 0 | 0 | 0 | 0 | 0 | 0 | 0 | 0 | 1,105 | 0 | 0 | 0 | 1,105 | |||||||||||||||||||||||||||||||||||||||
| 632500 - Professional Fees | 0 | 0 | 0 | 0 | 0 | 0 | 0 | 0 | 0 | 0 | 0 | 51 | 51 | |||||||||||||||||||||||||||||||||||||||
©2007 CB Richard Ellis, Inc.
3
Table of Contents
| AIMCO 12 Month Operating Trend — Detail | ||||
| 000500 — Presidential House | ||||
| For the Period Ended June 2007 (1212OTD) | ||||
| APPLICATION :AIMCOPROPERTY | Run Date: 7/10/2007 12:40 PM | USER ID: gcoalson |
| JLY 06 | AUG 06 | SEP 06 | OCT 06 | NOV 06 | DEC 06 | JAN 07 | FEB 07 | MAR 07 | APR 07 | MAY 07 | JUN 07 | Total | ||||||||||||||||||||||||||||||||||||||||
| 632525 - H/R-Personnel Costs | 0 | 0 | 0 | 173 | 167 | 0 | 67 | 0 | 2,985 | 134 | 0 | 9 | 3,535 | |||||||||||||||||||||||||||||||||||||||
| 632800 - Administrative Support - Fees | 0 | 0 | 0 | 0 | 0 | 0 | 0 | 50 | 0 | 0 | 0 | 0 | 50 | |||||||||||||||||||||||||||||||||||||||
| 632918 - Answering Service | 59 | 0 | 133 | 59 | 118 | 0 | 0 | 118 | 0 | 0 | 0 | 0 | 487 | |||||||||||||||||||||||||||||||||||||||
| 633400 - Temp Agency Help | 0 | 0 | 0 | 0 | 0 | 5 | 0 | 0 | 130 | 105 | 143 | 144 | 527 | |||||||||||||||||||||||||||||||||||||||
| 634000 - Legal Fees | 0 | 95 | 310 | 0 | 2 | 301 | 19 | 226 | 19 | 136 | 245 | 242 | 1,596 | |||||||||||||||||||||||||||||||||||||||
| 636000 - Telephone | (611 | ) | 83 | 2,081 | 791 | 796 | 1,617 | 712 | 633 | 0 | 548 | 0 | 1,394 | 8,045 | ||||||||||||||||||||||||||||||||||||||
| 639004 - Computer Maint & Supplies | 104 | 104 | 225 | 239 | 325 | 225 | 212 | 112 | 507 | 397 | 755 | 542 | 3,748 | |||||||||||||||||||||||||||||||||||||||
| 639007 - Trainings Travel | 32 | 246 | 168 | 473 | 473 | 481 | 0 | 277 | 640 | 170 | 2,651 | 551 | 6,160 | |||||||||||||||||||||||||||||||||||||||
| 639099 - Miscellaneous Administrative | 0 | (670 | ) | 153 | 0 | 244 | 147 | 0 | 216 | 14 | 389 | 156 | 255 | 903 | ||||||||||||||||||||||||||||||||||||||
| 655100 - Residnt Pmt Platform | 0 | 0 | 0 | 0 | 0 | 0 | 9 | 0 | 0 | 0 | 0 | 0 | 9 | |||||||||||||||||||||||||||||||||||||||
| 656006 - Clubhouse Equip/Supplies | 177 | 0 | 0 | 630 | 259 | 0 | 0 | 0 | 0 | 0 | 0 | 0 | 1,065 | |||||||||||||||||||||||||||||||||||||||
Total Administrative Expenses | 1,630 | 565 | 7,140 | 4,324 | 6,915 | 5,703 | 1,899 | 4,596 | 7,294 | 5,085 | 8,369 | 4,961 | 58,482 | |||||||||||||||||||||||||||||||||||||||
| 621003- Periodicals | 56 | 3,974 | 0 | 309 | 34 | 1,049 | 0 | 0 | 0 | 0 | 0 | 78 | 5,500 | |||||||||||||||||||||||||||||||||||||||
Periodicals | 56 | 3,974 | 0 | 309 | 34 | 1,049 | 0 | 0 | 0 | 0 | 0 | 78 | 5,500 | |||||||||||||||||||||||||||||||||||||||
| 611200 - Web Advertising | 878 | 673 | 223 | 223 | 355 | 1,243 | 231 | 223 | 273 | 463 | 318 | 306 | 5,408 | |||||||||||||||||||||||||||||||||||||||
Internet Leads | 878 | 673 | 223 | 223 | 355 | 1,243 | 231 | 223 | 273 | 463 | 318 | 306 | 5,408 | |||||||||||||||||||||||||||||||||||||||
| 621020 - National Web Advertising | 0 | 0 | 627 | 970 | 874 | 862 | 863 | 964 | 2,756 | 381 | 3,459 | 1,920 | 13,675 | |||||||||||||||||||||||||||||||||||||||
| 621030 - National Print/Periodical Adverti | 0 | 0 | 56 | 568 | 0 | 668 | 797 | 797 | 2,165 | 1,332 | 3,769 | 2,895 | 13,047 | |||||||||||||||||||||||||||||||||||||||
National Media Advertising | 0 | 0 | 683 | 1,538 | 874 | 1,530 | 1,660 | 1,760 | 4,921 | 1,713 | 7,228 | 4,815 | 26,722 | |||||||||||||||||||||||||||||||||||||||
| 625001 - Referral Fees | 500 | 0 | 4,500 | 4,500 | 0 | 7,000 | 3,000 | 5,750 | 3,849 | 2,250 | 1,500 | 750 | 33,599 | |||||||||||||||||||||||||||||||||||||||
| 625008 - Resident Referral Concessions | 500 | 1,000 | 0 | 500 | 500 | 0 | 0 | 500 | 1,000 | 1,000 | 1,000 | 1,000 | 7,000 | |||||||||||||||||||||||||||||||||||||||
| 625010 - Resident Referral Amortization | 450 | (50 | ) | 750 | 300 | 200 | 550 | 400 | (100 | ) | (500 | ) | (500 | ) | (450 | ) | (450 | ) | 600 | |||||||||||||||||||||||||||||||||
| 625012 - Referral Fee Amortization | (300 | ) | 200 | (3,850 | ) | (3,550 | ) | 950 | (5,350 | ) | (1,050 | ) | (3,225 | ) | (939 | ) | 885 | 1,735 | 2,560 | (11,934 | ) | |||||||||||||||||||||||||||||||
Apartment Brokers | 1,150 | 1,150 | 1,400 | 1,750 | 1,650 | 2,200 | 2,350 | 2,925 | 3,410 | 3,635 | 3,785 | 3,860 | 29,265 | |||||||||||||||||||||||||||||||||||||||
| 621013 - Leasing Promotions | 0 | 180 | 3 | 21 | 2 | 103 | 48 | 2 | 0 | 0 | 0 | 30 | 390 | |||||||||||||||||||||||||||||||||||||||
Active Outreach | 0 | 180 | 3 | 21 | 2 | 103 | 48 | 2 | 0 | 0 | 0 | 30 | 390 | |||||||||||||||||||||||||||||||||||||||
| 611100 - Marketing Phone Services | 59 | 0 | 0 | 25 | 60 | 47 | 49 | 10 | 59 | 0 | 0 | 569 | 878 | |||||||||||||||||||||||||||||||||||||||
| 621007 - Brochures - New Leases | 0 | 0 | 0 | 0 | 91 | 0 | 1 | 1 | (91 | ) | 0 | 0 | 0 | 2 | ||||||||||||||||||||||||||||||||||||||
| 621011 - Flags/Banners | 0 | 0 | 0 | 0 | 0 | 0 | 0 | 0 | 0 | 25 | 0 | 0 | 25 | |||||||||||||||||||||||||||||||||||||||
| 621012 - Move-in Gifts | 0 | 0 | 0 | 0 | 75 | 0 | 0 | 0 | 0 | 0 | 0 | 0 | 75 | |||||||||||||||||||||||||||||||||||||||
| 621050 - Renewal/Resident Gift Expense | 0 | 0 | 0 | 41 | 0 | 0 | 0 | 0 | 0 | 0 | 0 | 0 | 41 | |||||||||||||||||||||||||||||||||||||||
| 625000 - Signage | 0 | 14 | 0 | 0 | 133 | 0 | 0 | 0 | 0 | 0 | 49 | 84 | 280 | |||||||||||||||||||||||||||||||||||||||
| 626001 - Furniture - Models | 0 | 0 | 97 | 0 | 0 | 0 | 0 | 0 | 0 | 0 | 0 | 0 | 97 | |||||||||||||||||||||||||||||||||||||||
| 629002 - Phone Sales | 886 | 723 | 533 | 549 | 401 | 336 | 581 | 1,020 | 1,132 | 1,377 | 889 | 771 | 9,199 | |||||||||||||||||||||||||||||||||||||||
Point of Sale | 945 | 737 | 630 | 614 | 760 | 383 | 632 | 1,032 | 1,100 | 1,402 | 939 | 1,423 | 10,596 | |||||||||||||||||||||||||||||||||||||||
| 621014 - Newsletters | 0 | 0 | 0 | 0 | 0 | 0 | 11 | 0 | 0 | 0 | 0 | 0 | 11 | |||||||||||||||||||||||||||||||||||||||
| 621015 - Resident Relations | 0 | 0 | 0 | 750 | 0 | 0 | 0 | 0 | 0 | 111 | 0 | 64 | 924 | |||||||||||||||||||||||||||||||||||||||
| 621017 - Resident Collaterals | 0 | 0 | 36 | 0 | 0 | 0 | 0 | 0 | 0 | 0 | 0 | 0 | 36 | |||||||||||||||||||||||||||||||||||||||
| 625007 - Resident Relations Concession: | 0 | 0 | 0 | 100 | 0 | 0 | 195 | 480 | 76 | 35 | 0 | 4,654 | 5,540 | |||||||||||||||||||||||||||||||||||||||
| 625101 - Resident Functions | 132 | 0 | 0 | 0 | 0 | 500 | 0 | (4 | ) | 0 | 0 | 0 | 0 | 628 | ||||||||||||||||||||||||||||||||||||||
Retention | 132 | 0 | 36 | 850 | 0 | 500 | 206 | 476 | 76 | 146 | 0 | 4,718 | 7,139 | |||||||||||||||||||||||||||||||||||||||
| 621099 - Advertising - Other | 222 | 89 | 0 | 0 | 0 | 300 | 8 | 146 | 787 | 292 | 0 | 8 | 1,851 | |||||||||||||||||||||||||||||||||||||||
©2007 CB Richard Ellis, Inc.
4
Table of Contents
| AIMCO 12 Month Operating Trend — Detail | ||||
| 000500 — Presidential House | ||||
| For the Period Ended June 2007 (1212OTD) | ||||
| APPLICATION :AIMCOPROPERTY | Run Date: 7/10/2007 12:40 PM | USER ID: gcoalson |
| JLY 06 | AUG 06 | SEP 06 | OCT 06 | NOV 06 | DEC 06 | JAN 07 | FEB 07 | MAR 07 | APR 07 | MAY 07 | JUN 07 | Total | ||||||||||||||||||||||||||||||||||||||||
Other Marketing | 222 | 89 | 0 | 0 | 0 | 300 | 8 | 146 | 787 | 292 | 0 | 8 | 1,851 | |||||||||||||||||||||||||||||||||||||||
| �� | ||||||||||||||||||||||||||||||||||||||||||||||||||||
Total Marketing Expense | 3,383 | 6,802 | 2,974 | 5,305 | 3,675 | 7,308 | 5,134 | 6,564 | 10,567 | 7,650 | 12,269 | 15,240 | 86,871 | |||||||||||||||||||||||||||||||||||||||
| 621000 - Leasing Payroll | 3,226 | 2,825 | 2,039 | 2,082 | 3,536 | 3,700 | 5,873 | 4,053 | 3,950 | 3,965 | 3,948 | 4,066 | 43,263 | |||||||||||||||||||||||||||||||||||||||
| 627000 - Commissions & Bonus | 0 | 0 | 0 | 0 | 0 | 0 | 65 | 0 | 123 | 34 | 69 | 89 | 380 | |||||||||||||||||||||||||||||||||||||||
| 627200 - Miscellaneous Incentives | 0 | 500 | 700 | 500 | 0 | 0 | 0 | 0 | 0 | 0 | 0 | 0 | 1,700 | |||||||||||||||||||||||||||||||||||||||
| 627300 - Leasing Commissions | 0 | 1,400 | 1,200 | 0 | 0 | 0 | 0 | 0 | 0 | 0 | 0 | 0 | 2,600 | |||||||||||||||||||||||||||||||||||||||
| 627301 - Commission Amortization | (1,780 | ) | 63 | (313 | ) | 0 | 0 | 0 | 0 | 0 | 0 | 0 | 0 | 0 | (2,030 | ) | ||||||||||||||||||||||||||||||||||||
| 627400 - Leasing Renewal Incentives | 4,000 | 675 | 1,350 | 0 | 0 | 0 | 0 | 0 | 0 | 0 | 0 | 0 | 6,025 | |||||||||||||||||||||||||||||||||||||||
| 627700 - Leasing Comm - Amortizable | 0 | 0 | 0 | 1,100 | 0 | 0 | 840 | 910 | 1,050 | 1,500 | 625 | 375 | 6,400 | |||||||||||||||||||||||||||||||||||||||
| 627701 - Amortization on Leasing Comm | 0 | 0 | 0 | (3,518 | ) | 1,507 | 1,847 | 928 | (1,100 | ) | (1,922 | ) | 1,017 | 1,506 | 740 | 1,005 | ||||||||||||||||||||||||||||||||||||
| 627800 - Renewal Incent - Amortizable | 0 | 0 | 0 | 5,300 | 800 | 0 | 0 | 2,450 | 3,600 | 0 | 0 | 1,024 | 13,174 | |||||||||||||||||||||||||||||||||||||||
| 627500 - Coast-to-Coast Incentive | 0 | 0 | 0 | 100 | 0 | 0 | 0 | 0 | 0 | 0 | 0 | 0 | 100 | |||||||||||||||||||||||||||||||||||||||
| 631000 - Salaries - Administrative | 5,235 | 3,252 | 3,569 | 3,190 | 2,662 | 1,093 | 0 | 660 | 0 | 0 | 0 | 0 | 19,662 | |||||||||||||||||||||||||||||||||||||||
| 633000 - Salaries - Manager | 0 | 0 | 0 | 0 | 0 | 2,520 | 4,385 | 5,519 | 3,462 | 3,462 | 3,462 | 3,462 | 26,270 | |||||||||||||||||||||||||||||||||||||||
| 633100 - Employee Apartments | 174 | 174 | 174 | 174 | 174 | 174 | 1,923 | 1,908 | 1,908 | 1,978 | 2,082 | 2,082 | 12,923 | |||||||||||||||||||||||||||||||||||||||
| 654000 - Salaries - Maintenance | 12,093 | 7,516 | 8,638 | 8,055 | 8,006 | 8,204 | 12,009 | 8,025 | 7,674 | 8,778 | 7,694 | 10,099 | 106,792 | |||||||||||||||||||||||||||||||||||||||
| 659500 - Outsourced Services | 75 | 99 | 104 | 128 | 115 | 27 | 143 | 152 | 29 | 242 | 242 | 242 | 1,596 | |||||||||||||||||||||||||||||||||||||||
| 659800 - Payroll Adjustment | (7,346 | ) | 1,637 | 2,112 | 1,567 | 1,294 | 2,702 | 0 | 0 | 0 | 0 | 0 | 0 | 1,966 | ||||||||||||||||||||||||||||||||||||||
| 659811 - Admin Salary Expense Adj | 0 | 0 | 0 | 0 | 0 | 0 | (2,088 | ) | 207 | 235 | 286 | 373 | 290 | (697 | ) | |||||||||||||||||||||||||||||||||||||
| 659812 - Mgm’t Salary Expense Adj | 0 | 0 | 0 | 0 | 0 | 0 | (886 | ) | 649 | (137 | ) | 245 | 334 | 194 | 399 | |||||||||||||||||||||||||||||||||||||
| 659813 - Maint Salary Expense Adj | 0 | 0 | 0 | 0 | 0 | 0 | (3,255 | ) | 25 | 737 | 1,012 | 281 | 1,822 | 622 | ||||||||||||||||||||||||||||||||||||||
| 659814 - Payroll Tax Expense Adj | 0 | 0 | 0 | 0 | 0 | 0 | (345 | ) | 242 | (101 | ) | (38 | ) | 55 | 204 | 17 | ||||||||||||||||||||||||||||||||||||
| 659815 - Workers Comp Expense Adj | 0 | 0 | 0 | 0 | 0 | 0 | (444 | ) | 160 | 36 | 30 | 42 | 168 | (8 | ) | |||||||||||||||||||||||||||||||||||||
| 659900 - Repairs Payroll Capitalized | (1,588 | ) | (377 | ) | (889 | ) | (907 | ) | (339 | ) | (25 | ) | (660 | ) | (70 | ) | 53 | (204 | ) | (1,139 | ) | (2,577 | ) | (8,723 | ) | |||||||||||||||||||||||||||
| 671100 - Payroll Taxes | 1,998 | 1,404 | 1,472 | 1,772 | 1,456 | 1,498 | 2,719 | 2,773 | 1,307 | 1,285 | 1,152 | 1,394 | 20,231 | |||||||||||||||||||||||||||||||||||||||
| 671115 - SUI/FUTA Payroll Tax Adjust | 0 | 0 | 0 | 0 | 0 | 0 | 0 | 0 | (1,287 | ) | 97 | 97 | 97 | (997 | ) | |||||||||||||||||||||||||||||||||||||
| 672200 - Workers Compensation | 1,473 | 968 | 1,049 | 1,220 | 900 | 1,056 | 1,390 | 1,565 | 1,074 | 1,064 | 948 | 1,147 | 13,855 | |||||||||||||||||||||||||||||||||||||||
| 672300 - Health Ins. & Other Benefits | 2,300 | 1,421 | 1,016 | 1,806 | 1,852 | 1,997 | 2,723 | 2,405 | 1,382 | 2,718 | 2,379 | 2,766 | 24,765 | |||||||||||||||||||||||||||||||||||||||
| 672301 - Benefits Expense Adjustment | 0 | 0 | 0 | 0 | 0 | 0 | (908 | ) | 0 | 908 | 0 | 0 | 0 | 0 | ||||||||||||||||||||||||||||||||||||||
| 831001 - Ranking Bonus | 619 | 619 | 475 | 1,003 | 1,114 | 0 | 991 | (2,016 | ) | 926 | 309 | 991 | 358 | 5,388 | ||||||||||||||||||||||||||||||||||||||
Total Payroll Expense | 20,479 | 22,174 | 22,696 | 23,573 | 23,078 | 24,793 | 25,402 | 28,517 | 25,006 | 27,779 | 25,140 | 28,041 | 296,678 | |||||||||||||||||||||||||||||||||||||||
| 630306 - Srv Coord. Postage | 0 | 32 | 60 | (93 | ) | 0 | 0 | 0 | 0 | 0 | 0 | 0 | 0 | 0 | ||||||||||||||||||||||||||||||||||||||
Total Service Coordinator | 0 | 32 | 60 | (93 | ) | 0 | 0 | 0 | 0 | 0 | 0 | 0 | 0 | 0 | ||||||||||||||||||||||||||||||||||||||
| 659700 - Construction Period Operating ( | (99 | ) | 0 | 0 | 0 | 0 | 0 | 0 | 0 | 0 | 0 | 0 | 0 | (99 | ) | |||||||||||||||||||||||||||||||||||||
Total Construction Period Operatir | (99 | ) | 0 | 0 | 0 | 0 | 0 | 0 | 0 | 0 | 0 | 0 | 0 | (99 | ) | |||||||||||||||||||||||||||||||||||||
Total Controllable Operating Exper | 38,375 | 52,803 | 59,452 | 62,162 | 51,051 | 77,510 | 61,646 | 70,498 | 68,495 | 56,599 | 75,764 | 72,167 | 746,521 | |||||||||||||||||||||||||||||||||||||||
Controllable NOI | 129,472 | 120,005 | 141,917 | 117,111 | 110,311 | 84,378 | 106,537 | 111,211 | 123,022 | 135,974 | 109,595 | 108,973 | 1,398,506 | |||||||||||||||||||||||||||||||||||||||
ON-CONTROLLABLE OPERATING EXPENSES
©2007 CB Richard Ellis, Inc.
5
Table of Contents
| AIMCO 12 Month Operating Trend — Detail | ||||
| 000500 — Presidential House | ||||
| For the Period Ended June 2007 (1212OTD) | ||||
| APPLICATION :AIMCOPROPERTY | Run Date: 7/10/2007 12:40 PM | USER ID: gcoalson |
| JLY 06 | AUG 06 | SEP 06 | OCT 06 | NOV 06 | DEC 06 | JAN 07 | FEB 07 | MAR 07 | APR 07 | MAY 07 | JUN 07 | Total | ||||||||||||||||||||||||||||||||||||||||
TAXES & INSURANCE | ||||||||||||||||||||||||||||||||||||||||||||||||||||
| 639002 - Ad Valorem Tax Service | 0 | 76 | 0 | 0 | 0 | 0 | 0 | 0 | 63 | 7,500 | 0 | 48 | 7,687 | |||||||||||||||||||||||||||||||||||||||
| 671001 - Real Estate Taxes | 22,158 | 22,158 | 22,158 | 22,158 | (11,626 | ) | 19,087 | 20,884 | 20,884 | 20,884 | 20,885 | 20,884 | 20,884 | 221,400 | ||||||||||||||||||||||||||||||||||||||
| 671002 - Personal Property Tax | 0 | 0 | 0 | 0 | 2,571 | 0 | 0 | 0 | 0 | 0 | 0 | 0 | 2,571 | |||||||||||||||||||||||||||||||||||||||
| 671005 -Tax Refund - Prior Years | 0 | 0 | 0 | 0 | 0 | 0 | 0 | 0 | 0 | (31,867 | ) | 0 | 0 | (31,867 | ) | |||||||||||||||||||||||||||||||||||||
| 671099 - Other Tax | 0 | 0 | 0 | 0 | 0 | 0 | 0 | 0 | 0 | 0 | 115 | 21 | 136 | |||||||||||||||||||||||||||||||||||||||
| 671900 - Business Licenses and Permits | 7,000 | (216 | ) | 824 | (174 | ) | 50 | 310 | 200 | 0 | 0 | 2,800 | 0 | 0 | 10,794 | |||||||||||||||||||||||||||||||||||||
| 671902 - Sales and Use Tax | 0 | 0 | 0 | 0 | 0 | 0 | 2 | 0 | 0 | 0 | 0 | 0 | 2 | |||||||||||||||||||||||||||||||||||||||
| 832038 - Construction Period Taxes | (402 | ) | 0 | (3 | ) | 0 | 0 | 0 | 0 | 0 | 0 | 0 | 0 | 0 | (405 | ) | ||||||||||||||||||||||||||||||||||||
Total Taxes | 28,756 | 22,019 | 22,979 | 21,984 | (9,005 | ) | 19,397 | 21,086 | 20,884 | 20,947 | (682 | ) | 20,999 | 20,953 | 210,318 | |||||||||||||||||||||||||||||||||||||
| 672000 - Hazard Insurance | 11,890 | 11,890 | 11,890 | 11,890 | 11,890 | 11,890 | 10,951 | 10,951 | 4,419 | 4,419 | 4,419 | 4,419 | 110,917 | |||||||||||||||||||||||||||||||||||||||
| 672100 - Fidelity Bond Insurance | 108 | 108 | 120 | 120 | 120 | 120 | 120 | 120 | 120 | 120 | 120 | 120 | 1,413 | |||||||||||||||||||||||||||||||||||||||
| 672900 - Other Insurance | 0 | 0 | 0 | 0 | 0 | 0 | 939 | 939 | 939 | 939 | 939 | 1,121 | 5,814 | |||||||||||||||||||||||||||||||||||||||
Total Insurance | 11,997 | 11,997 | 12,010 | 12,010 | 12,010 | 12,010 | 12,010 | 12,010 | 5,477 | 5,477 | 5,477 | 5,660 | 118,144 | |||||||||||||||||||||||||||||||||||||||
Total Taxes & Insurance | 40,754 | 34,016 | 34,989 | 33,994 | 3,005 | 31,407 | 33,096 | 32,894 | 26,424 | 4,796 | 26,476 | 26,613 | 328,462 | |||||||||||||||||||||||||||||||||||||||
Reportable NOI | 88,719 | 85,989 | 106,928 | 83,117 | 107,306 | 52,971 | 73,442 | 78,317 | 96,597 | 131,178 | 83,119 | 82,360 | 1,070,044 | |||||||||||||||||||||||||||||||||||||||
IR NON-CONTROLLABLE OPERATING EXPENSES | ||||||||||||||||||||||||||||||||||||||||||||||||||||
| 632000 - Management Fees | 8,496 | 8,908 | 8,215 | 8,340 | 8,622 | 7,913 | 8,368 | 8,071 | 9,508 | 8,567 | 9,472 | 8,926 | 103,405 | |||||||||||||||||||||||||||||||||||||||
Total Management & Accounting F | 8,496 | 8,908 | 8,215 | 8,340 | 8,622 | 7,913 | 8,368 | 8,071 | 9,508 | 8,567 | 9,472 | 8,926 | 103,405 | |||||||||||||||||||||||||||||||||||||||
Management, Acctg & Oth Fees | 8,496 | 8,908 | 8,215 | 8,340 | 8,622 | 7,913 | 8,368 | 8,071 | 9,508 | 8,567 | 9,472 | 8,926 | 103,405 | |||||||||||||||||||||||||||||||||||||||
Property Net Operating Income | 80,222 | 77,081 | 98,713 | 74,777 | 98,684 | 45,059 | 65,074 | 70,247 | 87,090 | 122,611 | 73,646 | 73,434 | 966,639 | |||||||||||||||||||||||||||||||||||||||
| 654215 - Insurance Damage Expense | (1,469 | ) | 7,735 | 319 | (37,590 | ) | (350 | ) | 0 | 0 | 0 | 4,569 | 0 | 975 | 1,200 | (24,611 | ) | |||||||||||||||||||||||||||||||||||
| 915000 - Casualty Basis Write-Off | 0 | 0 | 0 | 0 | (250,000 | ) | 0 | 0 | 0 | (145,927 | ) | (71,187 | ) | 0 | (80,818 | ) | (547,932 | ) | ||||||||||||||||||||||||||||||||||
Total Casualty G/L | (1,469 | ) | 7,735 | 319 | (37,590 | ) | (250,350 | ) | 0 | 0 | 0 | (141,358 | ) | (71,187 | ) | 975 | (79,618 | ) | (572,543 | ) | ||||||||||||||||||||||||||||||||
| 662000 - Deprec. - Buildings | 4,550 | 4,512 | 4,512 | 4,564 | 4,643 | 6,262 | 39,336 | 7,839 | 7,743 | 8,555 | 8,260 | 8,250 | 109,026 | |||||||||||||||||||||||||||||||||||||||
| 666000 - Deprec. - Furnishings | 11,196 | 11,114 | 11,116 | 11,432 | 11,380 | 11,268 | 9,283 | 7,058 | 7,253 | 7,115 | 7,185 | 7,542 | 112,942 | |||||||||||||||||||||||||||||||||||||||
| 669510 - Deprec. - Non RE Assets | 0 | 0 | 0 | 0 | 0 | 0 | 106 | 106 | 103 | 100 | 100 | 120 | 633 | |||||||||||||||||||||||||||||||||||||||
Total Depreciation Expense | 15,746 | 15,627 | 15,628 | 15,996 | 16,023 | 17,529 | 48,725 | 15,002 | 15,099 | 15,770 | 15,545 | 15,912 | 222,602 | |||||||||||||||||||||||||||||||||||||||
| 834000 - Legal | 0 | 0 | 0 | 7 | 283 | 0 | 0 | 0 | 0 | 0 | 0 | 0 | 289 | |||||||||||||||||||||||||||||||||||||||
| 834500 - Prof Exp | 0 | 0 | 0 | 0 | 0 | (156 | ) | 0 | 0 | 0 | 1 | 0 | 0 | (155 | ) | |||||||||||||||||||||||||||||||||||||
Total Partnership Legal | 0 | 0 | 0 | 7 | 283 | (156 | ) | 0 | 0 | 0 | 1 | 0 | 0 | 134 | ||||||||||||||||||||||||||||||||||||||
Total Partnership Expense | 0 | 0 | 0 | 7 | 283 | (156 | ) | 0 | 0 | 0 | 1 | 0 | 0 | 134 | ||||||||||||||||||||||||||||||||||||||
| 671205 - Non-Capitalized Redevelopmen | 0 | 0 | 0 | 0 | 0 | 48,529 | 0 | 0 | 0 | 0 | 0 | 0 | 48,529 | |||||||||||||||||||||||||||||||||||||||
| 840000 - Prior Year Extraordinary Expen | 0 | 0 | 0 | 0 | 0 | 0 | 0 | 0 | 0 | 0 | 0 | 531 | 531 | |||||||||||||||||||||||||||||||||||||||
©2007 CB Richard Ellis, Inc.
6
Table of Contents
| AIMCO 12 Month Operating Trend — Detail | ||||
| 000500 — Presidential House | ||||
| For the Period Ended June 2007 (1212OTD) | ||||
| APPLICATION :AIMCOPROPERTY | Run Date: 7/10/2007 12:40 PM | USER ID: gcoalson |
| JLY 06 | AUG 06 | SEP 06 | OCT 06 | NOV 06 | DEC 06 | JAN 07 | FEB 07 | MAR 07 | APR 07 | MAY 07 | JUN 07 | Total | ||||||||||||||||||||||||||||||||||||||||
Total Other Non-Controllable Expe | 0 | 0 | 0 | 0 | 0 | 48,529 | 0 | 0 | 0 | 0 | 0 | 531 | 49,060 | |||||||||||||||||||||||||||||||||||||||
Total Noncontrollable Operating E | 63,527 | 66,286 | 59,151 | 20,747 | (222,417 | ) | 105,221 | 90,188 | 55,966 | (90,327 | ) | (42,054 | ) | 52,468 | (27,636 | ) | 131,120 | |||||||||||||||||||||||||||||||||||
Total Operating Expenses | 101,902 | 119,088 | 118,603 | 82,909 | (171,366 | ) | 182,732 | 151,834 | 126,464 | (21,833 | ) | 14,545 | 128,232 | 44,531 | 877,641 | |||||||||||||||||||||||||||||||||||||
Operating Income | 65,945 | 53,719 | 82,766 | 96,364 | 332,729 | (20,843 | ) | 16,349 | 55,245 | 213,349 | 178,027 | 57,126 | 136,610 | 1,267,386 | ||||||||||||||||||||||||||||||||||||||
NON-OPERATING EXPENSES | ||||||||||||||||||||||||||||||||||||||||||||||||||||
| 916003- Amort DLC - 1st | 702 | 702 | 702 | 701 | 702 | 701 | 701 | 701 | 702 | 701 | 701 | 701 | 8,418 | |||||||||||||||||||||||||||||||||||||||
| 916023 - Amort DLC - Other | 192 | 192 | 192 | 192 | 192 | 192 | 192 | 192 | 192 | 192 | 192 | 192 | 2,303 | |||||||||||||||||||||||||||||||||||||||
Total Property Amort Def Loan Exp | 893 | 893 | 893 | 893 | 893 | 893 | 893 | 893 | 893 | 893 | 893 | 893 | 10,721 | |||||||||||||||||||||||||||||||||||||||
| 682001 - Interest Expense Secured Fixed | 23,338 | 23,491 | 23,415 | 23,104 | 23,260 | 23,182 | 22,865 | 23,024 | 22,945 | 22,621 | 22,784 | 22,703 | 276,731 | |||||||||||||||||||||||||||||||||||||||
| 682002 - Interest Expense Secured Fixed | 5,665 | 5,710 | 5,687 | 5,596 | 5,642 | 5,619 | 5,526 | 5,573 | 5,550 | 5,456 | 5,503 | 5,479 | 67,005 | |||||||||||||||||||||||||||||||||||||||
Total Property Mortgage Expense | 29,002 | 29,201 | 29,102 | 28,699 | 28,902 | 28,801 | 28,391 | 28,597 | 28,494 | 28,077 | 28,287 | 28,182 | 343,736 | |||||||||||||||||||||||||||||||||||||||
| 832037 - Construction Period Interest | (5,792 | ) | 0 | (31 | ) | 0 | 0 | 0 | 0 | 0 | 0 | 0 | 0 | 0 | (5,823 | ) | ||||||||||||||||||||||||||||||||||||
Total CAP Interest | (5,792 | ) | 0 | (31 | ) | 0 | 0 | 0 | 0 | 0 | 0 | 0 | 0 | 0 | (5,823 | ) | ||||||||||||||||||||||||||||||||||||
Total Interest Expense | 24,104 | 30,094 | 29,964 | 29,593 | 29,795 | 29,694 | 29,284 | 29,491 | 29,388 | 28,970 | 29,180 | 29,076 | 348,635 | |||||||||||||||||||||||||||||||||||||||
| 545000 - IN Conc Interest Income | (525 | ) | (622 | ) | (356 | ) | (366 | ) | (406 | ) | (238 | ) | (109 | ) | (288 | ) | (577 | ) | (788 | ) | (412 | ) | (761 | ) | (5,447 | ) | ||||||||||||||||||||||||||
Total Interest Income | (525 | ) | (622 | ) | (356 | ) | (366 | ) | (406 | ) | (238 | ) | (109 | ) | (288 | ) | (577 | ) | (788 | ) | (412 | ) | (761 | ) | (5,447 | ) | ||||||||||||||||||||||||||
Total Non-Operating Expenses | 23,579 | 29,473 | 29,608 | 29,227 | 29,390 | 29,456 | 29,176 | 29,202 | 28,811 | 28,183 | 28,769 | 28,315 | 343,188 | |||||||||||||||||||||||||||||||||||||||
Net Income(Loss) | 42,366 | 24,247 | 53,158 | 67,137 | 303,339 | (50,299 | ) | (12,827 | ) | 26,042 | 184,538 | 149,844 | 28,358 | 108,295 | 924,198 | |||||||||||||||||||||||||||||||||||||
CHANGE IN ASSETS | ||||||||||||||||||||||||||||||||||||||||||||||||||||
| 113000 - Tenant/Member Accts. Rec. | (4,744 | ) | (5,719 | ) | (4,026 | ) | 8,856 | (24,731 | ) | 32,209 | 2,498 | (2,864 | ) | 611 | (3,026 | ) | (9,186 | ) | (7,079 | ) | (17,202 | ) | ||||||||||||||||||||||||||||||
| 113600 - Credit Card Receivable | 0 | 0 | (1,621 | ) | 2,968 | (3,484 | ) | 1,605 | 1,779 | (10,102 | ) | 8,369 | 788 | (4,271 | ) | 759 | (3,210 | ) | ||||||||||||||||||||||||||||||||||
| 114089 - Allowance for Bad Debt | 4,576 | 5,019 | (2,481 | ) | (6,579 | ) | 24,687 | (23,098 | ) | (2,881 | ) | 2,889 | (2,740 | ) | 982 | 2,584 | 8,031 | 10,988 | ||||||||||||||||||||||||||||||||||
Change In Tenants’ Rent Receivab | (168 | ) | (700 | ) | (8,128 | ) | 5,244 | (3,528 | ) | 10,715 | 1,396 | (10,077 | ) | 6,240 | (1,257 | ) | (10,874 | ) | 1,710 | (9,425 | ) | |||||||||||||||||||||||||||||||
| 114000 - Accounts Receivable (Other) | 0 | 0 | 0 | 0 | 0 | (217 | ) | 217 | (418 | ) | 418 | 0 | 0 | (213 | ) | (213 | ) | |||||||||||||||||||||||||||||||||||
| 114001 - Ancillary Services A/R | 0 | 0 | 0 | 0 | 0 | 346 | 0 | 0 | 0 | 0 | 0 | 5,715 | 6,061 | |||||||||||||||||||||||||||||||||||||||
| 114004 - A/R AIMCO | 0 | 0 | 0 | 0 | 0 | (106 | ) | 0 | 106 | 0 | 0 | 0 | 0 | 0 | ||||||||||||||||||||||||||||||||||||||
| 114011 - AR - Rebates | (34 | ) | 103 | (21 | ) | 128 | (132 | ) | (344 | ) | 263 | (368 | ) | (283 | ) | 881 | (385 | ) | (14 | ) | (206 | ) | ||||||||||||||||||||||||||||||
| 114075 - A/R - Insurance Proceeds | 0 | 0 | 0 | 0 | (250,000 | ) | 0 | 48,569 | 97,357 | (145,927 | ) | (71,187 | ) | 71,187 | (80,818 | ) | (330,818 | ) | ||||||||||||||||||||||||||||||||||
| 114205 - Ancillary Inc A/R - Laundry | 0 | 0 | 0 | 0 | 0 | 0 | 0 | 0 | 0 | 0 | 0 | (1,965 | ) | (1,965 | ) | |||||||||||||||||||||||||||||||||||||
| 114206 - Ancillary Inc A/R - Cable TV | 0 | 0 | 0 | 0 | 0 | 0 | 0 | 0 | 0 | 0 | 0 | (2,897 | ) | (2,897 | ) | |||||||||||||||||||||||||||||||||||||
| 114207 - Ancillary Inc A/R - Phone | 0 | 0 | 0 | 0 | 0 | 0 | 0 | 0 | 0 | 0 | 0 | (532 | ) | (532 | ) | |||||||||||||||||||||||||||||||||||||
| 114208 - Ancillary Inc A/R - Vending | 0 | 0 | 0 | 0 | 0 | 0 | 0 | 0 | 0 | 0 | 0 | (21 | ) | (21 | ) | |||||||||||||||||||||||||||||||||||||
©2007 CB Richard Ellis, Inc.
7
Table of Contents
| AIMCO Statement of Operations — Detail | ||||
| 000500 — Presidential House | ||||
| For the Period Ended June 2007 (12OSD) | ||||
| APPLICATION : AIMCOPROPERTY | Run Date: 7/10/2007 2:08 PM | USER ID: gcoalson |
| Current | Current | Current | Previous Yr | Previous Yr | Current | Current | Current | Previous | Previous Yr | |||||||||||||||||||||||||||||||
| Month | Month | Month | Month | Cur Month | YTD | YTD | YTD | Year | Current YTD | |||||||||||||||||||||||||||||||
| Actual | Budget | Variance | Actual | Variance | Actual | Budget | Variance | Actual | Variance | |||||||||||||||||||||||||||||||
INCOME | ||||||||||||||||||||||||||||||||||||||||
| 201,740 | 190,995 | 10,745 | 213,787 | (12,047 | ) | 500000 - Market Rent | 1,156,455 | 1,122,197 | 34,258 | 1,206,422 | (49,967 | ) | ||||||||||||||||||||||||||||
| (11,382 | ) | 0 | (11,382 | ) | (30,693 | ) | 19,311 | 500001 - Leases Under/Over Schedule | (21,975 | ) | 0 | (21,975 | ) | (114,071 | ) | 92,096 | ||||||||||||||||||||||||
| 0 | 0 | 0 | (383 | ) | 383 | 500501 - Renewal Price Adjustment | (90 | ) | 0 | (90 | ) | (3,607 | ) | 3,517 | ||||||||||||||||||||||||||
| 0 | 0 | 0 | 12 | (12 | ) | 512300 - Commercial Rent | 0 | 0 | 0 | 72 | (72 | ) | ||||||||||||||||||||||||||||
| 190,358 | 190,995 | (637 | ) | 182,723 | 7,635 | Non-subsidized Rental Income | 1,134,390 | 1,122,197 | 12,194 | 1,088,816 | 45,575 | |||||||||||||||||||||||||||||
| 190,358 | 190,995 | (637 | ) | 182,723 | 7,635 | Total Gross Potential Rent | 1,134,390 | 1,122,197 | 12,194 | 1,088,816 | 45,575 | |||||||||||||||||||||||||||||
| 544 | 0 | 544 | 0 | 544 | 519100 - Concessions Reimbursement | 679 | 0 | 679 | 0 | 679 | ||||||||||||||||||||||||||||||
| 0 | 0 | 0 | 0 | 0 | 522025 - Service Maintenance Guarante | 0 | 0 | 0 | (140 | ) | 140 | |||||||||||||||||||||||||||||
| (416 | ) | (6,877 | ) | 6,460 | (192 | ) | (224 | ) | 625002 - Concessions/Special Promotio | (18,619 | ) | (40,823 | ) | 22,204 | (1,351 | ) | (17,268 | ) | ||||||||||||||||||||||
| (1,121 | ) | 0 | (1,121 | ) | (5,915 | ) | 4,794 | 625005 - Renewal Concession | (8,457 | ) | 0 | (8,457 | ) | (51,437 | ) | 42,980 | ||||||||||||||||||||||||
| (1 | ) | 0 | (1 | ) | (90 | ) | 89 | 625006 - Discount - Residents Monthly | (525 | ) | 0 | (525 | ) | (514 | ) | (11 | ) | |||||||||||||||||||||||
| (3,395 | ) | 0 | (3,395 | ) | (267 | ) | (3,127 | ) | 625009 - Concession Amortization | (337 | ) | 0 | (337 | ) | (1,642 | ) | 1,305 | |||||||||||||||||||||||
| (4,389 | ) | (6,877 | ) | 2,488 | (6,465 | ) | 2,076 | Total Concessions | (27,260 | ) | (40,823 | ) | 13,563 | (55,084 | ) | 27,824 | ||||||||||||||||||||||||
| (9,267 | ) | (5,730 | ) | (3,537 | ) | (11,866 | ) | 2,599 | 522000 - Vacancy Loss | (54,034 | ) | (33,666 | ) | (20,368 | ) | (25,375 | ) | (28,659 | ) | |||||||||||||||||||||
| (9,267 | ) | (5,730 | ) | (3,537 | ) | (11,866 | ) | 2,599 | Total Vacancy Loss | (54,034 | ) | (33,666 | ) | (20,368 | ) | (25,375 | ) | (28,659 | ) | |||||||||||||||||||||
| (940 | ) | 0 | (940 | ) | (999 | ) | 59 | 631200 -Administrative Units | (5,205 | ) | 0 | (5,205 | ) | (999 | ) | (4,206 | ) | |||||||||||||||||||||||
| (940 | ) | 0 | (940 | ) | (999 | ) | 59 | Total Other Rental Losses | (5,205 | ) | 0 | (5,205 | ) | (999 | ) | (4,206 | ) | |||||||||||||||||||||||
| (14,596 | ) | (12,607 | ) | (1,989 | ) | (19,329 | ) | 4,734 | Total Rental Loss | (86,499 | ) | (74,489 | ) | (12,010 | ) | (81,458 | ) | (5,041 | ) | |||||||||||||||||||||
| 175,762 | 178,388 | (2,626 | ) | 163,393 | 12,369 | Net Rental Income | 1,047,891 | 1,047,708 | 183 | 1,007,358 | 40,533 | |||||||||||||||||||||||||||||
| 0 | 0 | 0 | 0 | 0 | 590508 - Resident Util Pymts: Electricity | 25 | 0 | 25 | 0 | 25 | ||||||||||||||||||||||||||||||
| 318 | 0 | 318 | 167 | 151 | 590514 - Resident Util Pymts: Misc | 3,248 | 0 | 3,248 | 1,296 | 1,953 | ||||||||||||||||||||||||||||||
| (372 | ) | 0 | (372 | ) | 0 | (372 | ) | 590530 - Resid Util Pymts: Acer Adjs | (372 | ) | 0 | (372 | ) | 0 | (372 | ) | ||||||||||||||||||||||||
| (54 | ) | 0 | (54 | ) | 167 | (221 | ) | Total Utility Payments from Reside | 2,902 | 0 | 2,902 | 1,296 | 1,606 | |||||||||||||||||||||||||||
| 2,436 | 1,750 | 686 | 1,638 | 798 | 591000 - Laundry Income | 10,081 | 10,500 | (419 | ) | 7,525 | 2,556 | |||||||||||||||||||||||||||||
| 0 | 750 | (750 | ) | 2,334 | (2,334 | ) | 591007 - AS - Cable TV | 4,815 | 4,500 | 315 | 6,295 | (1,480 | ) | |||||||||||||||||||||||||||
| 199 | 100 | 99 | 0 | 199 | 591008 - AS - Local Telephone | 650 | 600 | 50 | 923 | (273 | ) | |||||||||||||||||||||||||||||
| 0 | 0 | 0 | 0 | 0 | 591011 - Soft Drink Vending | 85 | 0 | 85 | 0 | 85 | ||||||||||||||||||||||||||||||
| 71 | 0 | 71 | 0 | 71 | 591030 - AS - Accrual Adjustments | 71 | 0 | 71 | 0 | 71 | ||||||||||||||||||||||||||||||
©2007 CB Richard Ellis, Inc.
1
Table of Contents
| AIMCO Statement of Operations — Detail | ||||
| 000500 — Presidential House | ||||
| For the Period Ended June 2007 (12OSD) | ||||
| APPLICATION :AIMCOPROPERTY | Run Date: 7/10/2007 2:08 PM | USER ID: gcoalson |
| Current | Current | Current | Previous Yr | Previous Yr | Current | Current | Current | Previous | Previous Yr | |||||||||||||||||||||||||||||||
| Month | Month | Month | Month | Cur Month | YTD | YTD | YTD | Year | Current YTD | |||||||||||||||||||||||||||||||
| Actual | Budget | Variance | Actual | Variance | Actual | Budget | Variance | Actual | Variance | |||||||||||||||||||||||||||||||
| 2,707 | 2,600 | 107 | 3,972 | (1,265 | ) | Total Ancillary Services Income | 15,702 | 15,600 | 102 | 14,744 | 959 | |||||||||||||||||||||||||||||
| 413 | 500 | (87 | ) | 200 | 213 | 500005 - Month to Month Fee | 1,887 | 3,000 | (1,113 | ) | 1,493 | 393 | ||||||||||||||||||||||||||||
| 75 | 0 | 75 | 0 | 75 | 500006 - Short Term Lease Fee | 115 | 0 | 115 | 0 | 115 | ||||||||||||||||||||||||||||||
| 2,900 | 2,500 | 400 | 2,600 | 300 | 592001 -Late Charges | 18,500 | 15,000 | 3,500 | 12,500 | 6,000 | ||||||||||||||||||||||||||||||
| 80 | 250 | (170 | ) | 200 | (120 | ) | 592002 - NSF Charges | 360 | 1,500 | (1,140 | ) | 2,200 | (1,840 | ) | ||||||||||||||||||||||||||
| 0 | 0 | 0 | 0 | 0 | 592006 - Keys, Locks, Lock Changes | 100 | 0 | 100 | 0 | 100 | ||||||||||||||||||||||||||||||
| 250 | 75 | 175 | 0 | 250 | 592009 - Miscellaneous Resident Charg | 1,875 | 450 | 1,425 | 0 | 1,875 | ||||||||||||||||||||||||||||||
| 800 | 1,000 | (200 | ) | 400 | 400 | 592010 - Non-refundable Admin Fees | 11,500 | 6,000 | 5,500 | 5,000 | 6,500 | |||||||||||||||||||||||||||||
| 2,366 | 500 | 1,866 | 30 | 2,336 | 593000 - Cleaning & Damage Fees | 9,880 | 3,000 | 6,880 | 147 | 9,733 | ||||||||||||||||||||||||||||||
| 0 | 75 | (75 | ) | 0 | 0 | 593002 - Pet Damage Charges | 0 | 450 | (450 | ) | 0 | 0 | ||||||||||||||||||||||||||||
| (772 | ) | 0 | (772 | ) | 0 | (772 | ) | 593003 - Contra Cleaning and Damage | (2,988 | ) | 0 | (2,988 | ) | 0 | (2,988 | ) | ||||||||||||||||||||||||
| 1,035 | 350 | 685 | 1,375 | (340 | ) | 599002 - Legal Fees | 5,330 | 2,100 | 3,230 | 1,878 | 3,452 | |||||||||||||||||||||||||||||
| 600 | 0 | 600 | 0 | 600 | 599003 - Non-refundable Pet Fees | 2,300 | 0 | 2,300 | 0 | 2,300 | ||||||||||||||||||||||||||||||
| 6,784 | 2,000 | 4,784 | 2,063 | 4,722 | 599004 - Lease Cancellation Fees | 22,843 | 12,000 | 10,843 | 14,183 | 8,659 | ||||||||||||||||||||||||||||||
| 550 | 500 | 50 | 635 | (85 | ) | 599005 - Application Fees | 9,640 | 3,000 | 6,640 | 2,670 | 6,970 | |||||||||||||||||||||||||||||
| 0 | 0 | 0 | 0 | 0 | 599007 - Clubhouse Rentals | 200 | 0 | 200 | 0 | 200 | ||||||||||||||||||||||||||||||
| 336 | 0 | 336 | 0 | 336 | 599013-Monthly Pet Rent | 853 | 0 | 853 | 0 | 853 | ||||||||||||||||||||||||||||||
| (1,357 | ) | (1,250 | ) | (107 | ) | (805 | ) | (552 | ) | 599014 - Contra Lease Cancellation Fee | (11,003 | ) | (7,500 | ) | (3,503 | ) | (8,252 | ) | (2,751 | ) | ||||||||||||||||||||
| 14,061 | 6,500 | 7,561 | 6,698 | 7,363 | Total Miscellaneous Income | 71,391 | 39,000 | 32,391 | 31,820 | 39,571 | ||||||||||||||||||||||||||||||
| 16,714 | 9,100 | 7,614 | 10,837 | 5,877 | Total Other Income | 89,995 | 54,600 | 35,395 | 47,859 | 42,136 | ||||||||||||||||||||||||||||||
| (11,335 | ) | (2,371 | ) | (8,964 | ) | (2,825 | ) | (8,510 | ) | 637000 - Bad Debt Expense | (37,414 | ) | (13,941 | ) | (23,473 | ) | (11,323 | ) | (26,091 | ) | ||||||||||||||||||||
| 0 | 0 | 0 | 0 | 0 | 637001 - Bad Debt Collections | 661 | 0 | 661 | 0 | 661 | ||||||||||||||||||||||||||||||
| 0 | 0 | 0 | 98 | (98 | ) | 637003 - Bad Debt Collection: Professio | 578 | 0 | 578 | 134 | 444 | |||||||||||||||||||||||||||||
| 0 | 0 | 0 | 5,437 | (5,437 | ) | 637005 - Bank Reconciliation Adjustment | (1,232 | ) | 0 | (1,232 | ) | (2,215 | ) | 983 | ||||||||||||||||||||||||||
| (11,335 | ) | (2,371 | ) | (8,964 | ) | 2,710 | (14,045 | ) | Total Bad Debt Expense | (37,407 | ) | (13,941 | ) | (23,467 | ) | (13,403 | ) | (24,004 | ) | |||||||||||||||||||||
| 181,141 | 185,117 | (3,976 | ) | 176,940 | 4,200 | Effective Gross Income | 1,100,479 | 1,088,367 | 12,112 | 1,041,814 | 58,665 | |||||||||||||||||||||||||||||
OPERATING EXPENSES | ||||||||||||||||||||||||||||||||||||||||
| 0 | 200 | 200 | 0 | 0 | 690000 - Elderly & Congregate Serv Exp | 0 | 1,200 | 1,200 | 0 | 0 | ||||||||||||||||||||||||||||||
| 0 | 200 | 200 | 0 | 0 | Total Elderly & Congregate Care | 0 | 1,200 | 1,200 | 0 | 0 | ||||||||||||||||||||||||||||||
| 0 | 200 | 200 | 0 | 0 | Total Resident Services Expenses | 0 | 1,200 | 1,200 | 0 | 0 | ||||||||||||||||||||||||||||||
| 78 | 0 | (78 | ) | 2,535 | 2,457 | 615600-Fire Protection | 92 | 0 | (92 | ) | 2,535 | 2,443 | ||||||||||||||||||||||||||||
©2007 CB Richard Ellis, Inc.
2
Table of Contents
| AIMCO Statement of Operations — Detail | ||||
| 000500 — Presidential House | ||||
| For the Period Ended June 2007 (12OSD) | ||||
| APPLICATION :AIMCOPROPERTY | Run Date: 7/10/2007 2:08 PM | USER ID: gcoalson |
| Current | Current | Current | Previous Yr | Previous Yr | Current | Current | Current | Previous | Previous Yr | |||||||||||||||||||||||||||||||
| Month | Month | Month | Month | Cur Month | YTD | YTD | YTD | Year | Current YTD | |||||||||||||||||||||||||||||||
| Actual | Budget | Variance | Actual | Variance | Actual | Budget | Variance | Actual | Variance | |||||||||||||||||||||||||||||||
| 0 | 0 | 0 | 0 | 0 | 618601 - Cleaning Supplies | 823 | 0 | (823 | ) | 0 | (823 | ) | ||||||||||||||||||||||||||||
| 186 | 0 | (186 | ) | 0 | (186 | ) | 619300 - Lease - Equipment | 354 | 0 | (354 | ) | 45 | (310 | ) | ||||||||||||||||||||||||||
| 264 | 0 | (264 | ) | 2,535 | 2,271 | Common Area Expense | 1,270 | 0 | (1,270 | ) | 2,580 | 1,310 | ||||||||||||||||||||||||||||
| 1,078 | 2,000 | 922 | 936 | (142 | ) | 645001 - Electricity - Vacant | 5,727 | 12,000 | 6,273 | 4,413 | (1,314 | ) | ||||||||||||||||||||||||||||
| 2,208 | 2,500 | 292 | 2,381 | 172 | 645003 - Electricity - List Bills | 14,213 | 15,000 | 787 | 15,871 | 1,658 | ||||||||||||||||||||||||||||||
| 248 | 2,000 | 1,752 | 985 | 737 | 645100 - Water | 3,454 | 12,000 | 8,546 | 9,243 | 5,788 | ||||||||||||||||||||||||||||||
| 2,397 | 2,750 | 353 | 2,850 | 453 | 645203 - Gas - List Bills | 18,623 | 16,500 | (2,123 | ) | 19,489 | 866 | |||||||||||||||||||||||||||||
| 2,372 | 4,000 | 1,628 | 3,792 | 1,421 | 645300 - Sewer | 17,725 | 24,000 | 6,275 | 24,438 | 6,713 | ||||||||||||||||||||||||||||||
| 0 | 25 | 25 | 0 | 0 | 647000 - Fees, Penalties - Utilities | 291 | 150 | (141 | ) | 68 | (222 | ) | ||||||||||||||||||||||||||||
| 50 | 15 | (35 | ) | 5 | (45 | ) | 647001 - Utility Processing Fees | 531 | 90 | (441 | ) | 110 | (421 | ) | ||||||||||||||||||||||||||
| 115 | 75 | (40 | ) | 112 | (3 | ) | 649000 - Misc Utility Charges | 879 | 450 | (429 | ) | 575 | (304 | ) | ||||||||||||||||||||||||||
| 8,468 | 13,365 | 4,897 | 11,061 | 2,593 | Total Utilities Expense | 61,443 | 80,190 | 18,747 | 74,207 | 12,764 | ||||||||||||||||||||||||||||||
| 0 | 250 | 250 | 0 | 0 | 631701 - Contract Common Area Cleani | 1,175 | 1,500 | 325 | 95 | (1,080 | ) | |||||||||||||||||||||||||||||
| 620 | 305 | (315 | ) | 305 | (315 | ) | 651900 - Contract Exterminating | 2,623 | 1,830 | (793 | ) | 1,712 | (911 | ) | ||||||||||||||||||||||||||
| 8,206 | 2,000 | (6,206 | ) | 2,893 | (5,313 | ) | 652500 - Contract Trash Removal | 20,762 | 12,000 | (8,762 | ) | 7,582 | (13,180 | ) | ||||||||||||||||||||||||||
| 0 | 255 | 255 | 255 | 255 | 653002 - Contract Courtesy Patrol | 0 | 1,530 | 1,530 | 2,356 | 2,356 | ||||||||||||||||||||||||||||||
| (308 | ) | 0 | 308 | 0 | 308 | 653004 - Contract Alarm System | 2,892 | 0 | (2,892 | ) | 0 | (2,892 | ) | |||||||||||||||||||||||||||
| 900 | 1,250 | 350 | 0 | (900 | ) | 653700 - Contract Yards and Grounds | 5,400 | 7,500 | 2,100 | 0 | (5,400 | ) | ||||||||||||||||||||||||||||
| 0 | 60 | 60 | 0 | 0 | 654200 - Contract Repairs | 28 | 360 | 332 | 455 | 427 | ||||||||||||||||||||||||||||||
| 0 | 20 | 20 | 0 | 0 | 654202 - Maintenance Contract | 0 | 120 | 120 | 256 | 256 | ||||||||||||||||||||||||||||||
| 0 | 60 | 60 | 0 | 0 | 654402 - Plumbing Contract | (340 | ) | 360 | 700 | 920 | 1,260 | |||||||||||||||||||||||||||||
| (584 | ) | 542 | 1,126 | 542 | 1,126 | 654501 - Contract Elevator | 2,642 | 3,252 | 610 | 3,252 | 610 | |||||||||||||||||||||||||||||
| 460 | 255 | (205 | ) | 255 | (205 | ) | 654702 - Pool Contract | 1,995 | 1,530 | (465 | ) | 1,580 | (415 | ) | ||||||||||||||||||||||||||
| 328 | 0 | (328 | ) | 0 | (328 | ) | 654703 - Spa-contract cleaning | 1,198 | 0 | (1,198 | ) | 0 | (1,198 | ) | ||||||||||||||||||||||||||
| 0 | 0 | 0 | 0 | 0 | 669900 - Other Contracts | 1,993 | 0 | (1,993 | ) | 0 | (1,993 | ) | ||||||||||||||||||||||||||||
| 9,621 | 4,997 | (4,624 | ) | 4,249 | (5,372 | ) | Total Contract Service | 40,366 | 29,982 | (10,384 | ) | 18,208 | (22,158 | ) | ||||||||||||||||||||||||||
| 0 | 25 | 25 | 0 | 0 | 612800-Irrigation Maint | 0 | 150 | 150 | 19 | 19 | ||||||||||||||||||||||||||||||
| 90 | 25 | (65 | ) | 56 | (34 | ) | 617600 - Window & Glass Repair | 884 | 150 | (734 | ) | 98 | (786 | ) | ||||||||||||||||||||||||||
| 0 | 0 | 0 | 0 | 0 | 621300 - Kitchen Equipment | 191 | 0 | (191 | ) | 0 | (191 | ) | ||||||||||||||||||||||||||||
| 661 | 75 | (586 | ) | 39 | (622 | ) | 651500 - Cleaning Supplies | 822 | 450 | (372 | ) | 372 | (450 | ) | ||||||||||||||||||||||||||
| 0 | 0 | 0 | 8 | 8 | 652000 - Exterminating Supplies | 24 | 0 | (24 | ) | 8 | (16 | ) | ||||||||||||||||||||||||||||
| 0 | 5 | 5 | 0 | 0 | 652300 - Gas/Oil/Mileage | 26 | 30 | 4 | 47 | 21 | ||||||||||||||||||||||||||||||
| 0 | 5 | 5 | 0 | 0 | 652501 - Dumpster Expense | 0 | 30 | 30 | 25 | 25 | ||||||||||||||||||||||||||||||
| 0 | 5 | 5 | 0 | 0 | 653600 - Landscaping Supplies | 0 | 30 | 30 | 66 | 66 | ||||||||||||||||||||||||||||||
| 0 | 20 | 20 | 0 | 0 | 654004 - Handyman - Other Materials | 0 | 120 | 120 | 202 | 202 | ||||||||||||||||||||||||||||||
| 55 | 40 | (15 | ) | 0 | (55 | ) | 654100 - Repairs/Maint. - Materials | 2,536 | 240 | (2,296 | ) | 418 | (2,119 | ) | ||||||||||||||||||||||||||
| 395 | 300 | (95 | ) | 967 | 573 | 654101 - Electrical Supplies | 3,329 | 1,800 | (1,529 | ) | 2,437 | (893 | ) | |||||||||||||||||||||||||||
| 393 | 400 | 7 | 615 | 222 | 654102 - Plumbing Supplies | 2,697 | 2,400 | (297 | ) | 3,037 | 340 | |||||||||||||||||||||||||||||
©2007 CB Richard Ellis, Inc.
3
Table of Contents
| AIMCO Statement of Operations — Detail | ||||
| 000500 — Presidential House | ||||
| For the Period Ended June 2007 (12OSD) | ||||
| APPLICATION :AIMCOPROPERTY | Run Date: 7/10/2007 2:08 PM | USER ID: gcoalson |
| Current | Current | Current | Previous Yr | Previous Yr | Current | Current | Current | Previous | Previous Yr | |||||||||||||||||||||||||||||||
| Month | Month | Month | Month | Cur Month | YTD | YTD | YTD | Year | Current YTD | |||||||||||||||||||||||||||||||
| Actual | Budget | Variance | Actual | Variance | Actual | Budget | Variance | Actual | Variance | |||||||||||||||||||||||||||||||
| 320 | 75 | (245 | ) | 62 | (258 | ) | 654103 - Appliance Parts | 1,007 | 450 | (557 | ) | 690 | (317 | ) | ||||||||||||||||||||||||||
| (550 | ) | 500 | 1,050 | 601 | 1,151 | 654105 - Plumbing Fixtures/Repairs | 5,266 | 3,000 | (2,266 | ) | 5,552 | 286 | ||||||||||||||||||||||||||||
| 102 | 100 | (2 | ) | 197 | 96 | 654120 - Keys and Locks | 1,120 | 600 | (520 | ) | 923 | (197 | ) | |||||||||||||||||||||||||||
| 0 | 75 | 75 | 0 | 0 | 654125 - Water Extraction | 0 | 450 | 450 | 0 | 0 | ||||||||||||||||||||||||||||||
| 247 | 150 | (97 | ) | 125 | (123 | ) | 654199 - Other Maintenance Materials | 2,715 | 900 | (1,815 | ) | 1,070 | (1,646 | ) | ||||||||||||||||||||||||||
| 0 | 0 | 0 | 0 | 0 | 654201 - Roof Repairs | 725 | 0 | (725 | ) | 0 | (725 | ) | ||||||||||||||||||||||||||||
| 165 | 0 | (165 | ) | 0 | (165 | ) | 654205 - Interior Building Improvements | 1,380 | 0 | (1,380 | ) | 0 | (1,380 | ) | ||||||||||||||||||||||||||
| 0 | 50 | 50 | 0 | 0 | 654206 - Exterior Building Improvements | 1,000 | 300 | (700 | ) | 585 | (415 | ) | ||||||||||||||||||||||||||||
| 0 | 0 | 0 | 0 | 0 | 654207 - Paving/Concrete/Striping | 0 | 14 | 14 | 14 | 14 | ||||||||||||||||||||||||||||||
| 0 | 30 | 30 | 230 | 230 | 654500 - Elevator Expense | 0 | 180 | 180 | 326 | 326 | ||||||||||||||||||||||||||||||
| 402 | 200 | (202 | ) | 424 | 22 | 654601 - HVAC Parts & Supplies | 1,613 | 1,200 | (413 | ) | 1,716 | 103 | ||||||||||||||||||||||||||||
| 0 | 25 | 25 | 0 | 0 | 654700 - Pool Expense | 46 | 150 | 104 | 17 | (29 | ) | |||||||||||||||||||||||||||||
| (206 | ) | (60 | ) | 146 | (102 | ) | 104 | 655200 - R & M Rebate - MRO | (578 | ) | (360 | ) | 218 | (497 | ) | 81 | ||||||||||||||||||||||||
| 13 | (25 | ) | (38 | ) | 109 | 96 | 655201 - R & M Rebate - Other | (309 | ) | (150 | ) | 159 | (289 | ) | 20 | |||||||||||||||||||||||||
| 37 | 50 | 13 | 108 | 70 | 656005 - Light Bulbs | 644 | 300 | (344 | ) | 476 | (168 | ) | ||||||||||||||||||||||||||||
| 0 | 50 | 50 | 0 | 0 | 656300 - Misc. | 0 | 300 | 300 | 665 | 665 | ||||||||||||||||||||||||||||||
| 0 | 15 | 15 | 0 | 0 | 659001 - Fire Protection Equip Maint | 3,279 | 90 | (3,189 | ) | 154 | (3,125 | ) | ||||||||||||||||||||||||||||
| 2,124 | 2,135 | 11 | 3,440 | 1,316 | Total Repairs & Maintenance | 28,419 | 12,824 | (15,595 | ) | 18,130 | (10,289 | ) | ||||||||||||||||||||||||||||
| 480 | 938 | 458 | 992 | 512 | 651700 - Contract Cleaning | 2,945 | 4,381 | 1,436 | 3,546 | 601 | ||||||||||||||||||||||||||||||
| 435 | 600 | 165 | 558 | 123 | 656002 - Contract Carpet Cleaning and | 3,675 | 2,802 | (873 | ) | 2,022 | (1,653 | ) | ||||||||||||||||||||||||||||
| 2,554 | 1,942 | (612 | ) | 2,220 | (334 | ) | 656003 - Contract Painting - Interior | 7,911 | 9,074 | 1,163 | 8,879 | 968 | ||||||||||||||||||||||||||||
| 0 | 24 | 24 | 0 | 0 | 656099 - Decorating - Contract Other | 0 | 112 | 112 | 0 | 0 | ||||||||||||||||||||||||||||||
| 0 | 0 | 0 | 151 | 151 | 656101 - Drapery/Miniblinds Repairs | 92 | 0 | (92 | ) | 151 | 60 | |||||||||||||||||||||||||||||
| (20 | ) | 730 | 750 | 1,454 | 1,475 | 656102 - Painting Supplies | 9,535 | 3,409 | (6,125 | ) | 3,856 | (5,678 | ) | |||||||||||||||||||||||||||
| 3,449 | 4,233 | 784 | 5,376 | 1,927 | Total Turnover Expense | 24,157 | 19,779 | (4,378 | ) | 18,455 | (5,703 | ) | ||||||||||||||||||||||||||||
| 15 | 30 | 15 | 18 | 3 | 617104 - Radios/Pagers | 497 | 180 | (317 | ) | 198 | (299 | ) | ||||||||||||||||||||||||||||
| 748 | 250 | (498 | ) | 250 | (497 | ) | 631100 - Office Supplies | 1,990 | 1,500 | (490 | ) | 2,138 | 148 | |||||||||||||||||||||||||||
| 245 | 15 | (230 | ) | 0 | (245 | ) | 631101 - Office Equipment | 621 | 90 | (531 | ) | 73 | (548 | ) | ||||||||||||||||||||||||||
| 75 | 100 | 26 | 144 | 69 | 631102 - Bank Charges | 885 | 600 | (285 | ) | 981 | 96 | |||||||||||||||||||||||||||||
| 64 | 100 | 36 | 99 | 35 | 631104 - Applicant Screening | 1,599 | 600 | (999 | ) | 293 | (1,306 | ) | ||||||||||||||||||||||||||||
| 58 | 80 | 22 | 93 | 35 | 631105 - Uniforms | 1,236 | 480 | (756 | ) | 645 | (591 | ) | ||||||||||||||||||||||||||||
| 19 | 25 | 6 | 85 | 66 | 631106 - Express Mail, Stamps | 540 | 150 | (390 | ) | 271 | (269 | ) | ||||||||||||||||||||||||||||
| 551 | 339 | (212 | ) | 357 | (194 | ) | 631108 - Credit Card Service Fees | 3,100 | 2,017 | (1,083 | ) | 2,036 | (1,064 | ) | ||||||||||||||||||||||||||
| 0 | 600 | 600 | 1,350 | 1,350 | 631111 - Resident Eviction/Separation | 4,670 | 3,600 | (1,070 | ) | 3,514 | (1,156 | ) | ||||||||||||||||||||||||||||
| 0 | 0 | 0 | 0 | 0 | 631650 - Fines and Penalties | 1,105 | 0 | (1,105 | ) | 0 | (1,105 | ) | ||||||||||||||||||||||||||||
| 51 | 0 | (51 | ) | 0 | (51 | ) | 632500 - Professional Fees | 51 | 0 | (51 | ) | 0 | (51 | ) | ||||||||||||||||||||||||||
| 9 | 181 | 172 | 0 | (9 | ) | 632525 - H/R-Personnel Costs | 3,195 | 1,086 | (2,109 | ) | 0 | (3,195 | ) | |||||||||||||||||||||||||||
| 0 | 0 | 0 | 0 | 0 | 632800 - Administrative Support - Fees | 50 | 0 | (50 | ) | 0 | (50 | ) | ||||||||||||||||||||||||||||
| 0 | 795 | 795 | 0 | 0 | 632801 - Prop IT Infrastruct | 0 | 3,180 | 3,180 | 0 | 0 | ||||||||||||||||||||||||||||||
©2007 CB Richard Ellis, Inc.
4
Table of Contents
| AIMCO Statement of Operations — Detail | ||||
| 000500 — Presidential House | ||||
| For the Period Ended June 2007 (12OSD) | ||||
| APPLICATION :AIMCOPROPERTY | Run Date: 7/10/2007 2:08 PM | USER ID: gcoalson |
| Current | Current | Current | Previous Yr | Previous Yr | Current | Current | Current | Previous | Previous Yr | |||||||||||||||||||||||||||||||
| Month | Month | Month | Month | Cur Month | YTD | YTD | YTD | Year | Current YTD | |||||||||||||||||||||||||||||||
| Actual | Budget | Variance | Actual | Variance | Actual | Budget | Variance | Actual | Variance | |||||||||||||||||||||||||||||||
| 0 | 50 | 50 | 259 | 259 | 632918 - Answering Service | 118 | 300 | 182 | 642 | 524 | ||||||||||||||||||||||||||||||
| 144 | 0 | (144 | ) | 0 | (144 | ) | 633400 - Temp Agency Help | 521 | 0 | (521 | ) | 0 | (521 | ) | ||||||||||||||||||||||||||
| 242 | 150 | (92 | ) | 99 | (142 | ) | 634000 - Legal Fees | 887 | 900 | 13 | 537 | (350 | ) | |||||||||||||||||||||||||||
| 1,394 | 600 | (794 | ) | 780 | (614 | ) | 636000 - Telephone | 3,286 | 3,600 | 314 | 5,546 | 2,260 | ||||||||||||||||||||||||||||
| 542 | 100 | (442 | ) | 404 | (138 | ) | 639004 - Computer Maint & Supplies | 2,525 | 600 | (1,925 | ) | 1,333 | (1,192 | ) | ||||||||||||||||||||||||||
| 0 | 5 | 5 | 0 | 0 | 639006 - Parking Expense | 0 | 30 | 30 | 16 | 16 | ||||||||||||||||||||||||||||||
| 551 | 200 | (351 | ) | 98 | (453 | ) | 639007 - Training & Travel | 4,289 | 1,200 | (3,089 | ) | 2,103 | (2,185 | ) | ||||||||||||||||||||||||||
| 255 | (6 | ) | (261 | ) | 0 | (255 | ) | 639099 - Miscellaneous Administrative | 1,029 | (33 | ) | (1,062 | ) | 1,728 | 699 | |||||||||||||||||||||||||
| 0 | 37 | 37 | 167 | 167 | 655100 - Residnt Pmt Platform | 9 | 601 | 592 | 541 | 531 | ||||||||||||||||||||||||||||||
| 0 | 25 | 25 | 0 | 0 | 656006 - Clubhouse Equip/Supplies | 0 | 150 | 150 | 133 | 133 | ||||||||||||||||||||||||||||||
| 4,961 | 3,676 | (1,285 | ) | 4,204 | (756 | ) | Total Administrative Expenses | 32,204 | 20,831 | (11,373 | ) | 22,730 | (9,474 | ) | ||||||||||||||||||||||||||
| 78 | 122 | 44 | 415 | 336 | 621003 - Periodicals | 78 | 732 | 654 | 1,457 | 1,378 | ||||||||||||||||||||||||||||||
| 78 | 122 | 44 | 415 | 336 | Periodicals | 78 | 732 | 654 | 1,457 | 1,378 | ||||||||||||||||||||||||||||||
| 306 | 203 | (103 | ) | 260 | (46 | ) | 611200 - Web Advertising | 1,814 | 1,218 | (596 | ) | 3,660 | 1,846 | |||||||||||||||||||||||||||
| 306 | 203 | (103 | ) | 260 | (46 | ) | Internet Leads | 1,814 | 1,218 | (596 | ) | 3,660 | 1,846 | |||||||||||||||||||||||||||
| 1,920 | 930 | (990 | ) | 0 | (1,920 | ) | 621020 - National Web Advertising | 10,343 | 5,580 | (4,763 | ) | 0 | (10,343 | ) | ||||||||||||||||||||||||||
| 2,895 | 339 | (2,556 | ) | 0 | (2,895 | ) | 621030 - National Print/Periodical Adver | 11,754 | 2,034 | (9,720 | ) | 0 | (11,754 | ) | ||||||||||||||||||||||||||
| 4,815 | 1,269 | (3,546 | ) | 0 | (4,815 | ) | National Media Advertising | 22,097 | 7,614 | (14,483 | ) | 0 | (22,097 | ) | ||||||||||||||||||||||||||
| 0 | 500 | 500 | 0 | 0 | 621001 - Newspaper Advertising | 0 | 3,000 | 3,000 | 0 | 0 | ||||||||||||||||||||||||||||||
| 0 | 500 | 500 | 0 | 0 | Newspapers | 0 | 3,000 | 3,000 | 0 | 0 | ||||||||||||||||||||||||||||||
| 750 | 1,000 | 250 | 0 | (750 | ) | 625001 - Referral Fees | 17,099 | 6,000 | (11,099 | ) | 0 | (17,099 | ) | |||||||||||||||||||||||||||
| 1,000 | 500 | (500 | ) | 1,000 | 0 | 625008 - Resident Referral Concessions | 4,500 | 3,000 | (1,500 | ) | 6,000 | 1,500 | ||||||||||||||||||||||||||||
| (450 | ) | 410 | 860 | (50 | ) | 400 | 625010 - Resident Referral Amortization | (1,600 | ) | (1,275 | ) | 325 | (300 | ) | 1,300 | |||||||||||||||||||||||||
| 2,560 | 200 | (2,360 | ) | 150 | (2,410 | ) | 625012 - Referral Fee Amortization | (34 | ) | (100 | ) | (66 | ) | 1,493 | 1,527 | |||||||||||||||||||||||||
| 3,860 | 2,110 | (1,750 | ) | 1,100 | (2,760 | ) | Apartment Brokers | 19,965 | 7,625 | (12,340 | ) | 7,193 | (12,772 | ) | ||||||||||||||||||||||||||
| 30 | 1,052 | 1,022 | 101 | 70 | 621013 - Leasing Promotions | 81 | 6,312 | 6,231 | 101 | 19 | ||||||||||||||||||||||||||||||
| 30 | 1,052 | 1,022 | 101 | 70 | Active Outreach | 81 | 6,312 | 6,231 | 101 | 19 | ||||||||||||||||||||||||||||||
| 569 | 100 | (469 | ) | 0 | (569 | ) | 611100 - Marketing Phone Services | 687 | 600 | (87 | ) | 0 | (687 | ) | ||||||||||||||||||||||||||
| 0 | 50 | 50 | 0 | 0 | 621007 - Brochures - New Leases | (89 | ) | 300 | 389 | 0 | 89 | |||||||||||||||||||||||||||||
| 0 | 50 | 50 | 0 | 0 | 621011 - Flags/Banners | 25 | 300 | 275 | 0 | (25 | ) | |||||||||||||||||||||||||||||
| 0 | 250 | 250 | 0 | 0 | 621012 - Move-in Gifts | 0 | 1,500 | 1,500 | 0 | 0 | ||||||||||||||||||||||||||||||
| 0 | 250 | 250 | 0 | 0 | 621050 - Renewal/Resident Gift Expens | 0 | 1,500 | 1,500 | 0 | 0 | ||||||||||||||||||||||||||||||
| 84 | 50 | (34 | ) | 0 | (84 | ) | 625000 - Signage | 133 | 300 | 167 | 0 | (133 | ) | |||||||||||||||||||||||||||
©2007 CB Richard Ellis, Inc.
5
Table of Contents
| AIMCO Statement of Operations - Detail | ||||
| 000500 — Presidential House | ||||
| For the Period Ended June 2007 (12OSD) | ||||
| APPLICATION :AIMCOPROPERTY | Run Date: 7/10/2007 2:08 PM | USER ID: gcoalson |
| Current | Current | Current | Previous Yr | Previous Yr | Current | Current | Current | Previous | Previous Yr | |||||||||||||||||||||||||||||||
| Month | Month | Month | Month | Cur Month | YTD | YTD | YTD | Year | Current YTD | |||||||||||||||||||||||||||||||
| Actual | Budget | Variance | Actual | Variance | Actual | Budget | Variance | Actual | Variance | |||||||||||||||||||||||||||||||
| 771 | 819 | 49 | 916 | 146 | 629002 - Phone Sales | 5,771 | 4,916 | (855 | ) | 5,210 | (561 | ) | ||||||||||||||||||||||||||||
| 1,423 | 1,569 | 146 | 916 | (507 | ) | Point of Sale | 6,527 | 9,416 | 2,889 | 5,210 | (1,317 | ) | ||||||||||||||||||||||||||||
| 0 | 50 | 50 | 0 | 0 | 621014 - Newsletters | 11 | 300 | 289 | 0 | (11 | ) | |||||||||||||||||||||||||||||
| 64 | 100 | 36 | 0 | (64 | ) | 621015 - Resident Relations | 174 | 600 | 426 | 0 | (174 | ) | ||||||||||||||||||||||||||||
| 4,654 | 100 | (4,554 | ) | 0 | (4,654 | ) | 625007 - Resident Relations Concessior | 5,440 | 600 | (4,840 | ) | 0 | (5,440 | ) | ||||||||||||||||||||||||||
| 0 | 250 | 250 | 0 | 0 | 625101 - Resident Functions | (4 | ) | 1,500 | 1,504 | 0 | 4 | |||||||||||||||||||||||||||||
| 4,718 | 500 | (4,218 | ) | 0 | (4,718 | ) | Retention | 5,622 | 3,000 | (2,622 | ) | 0 | (5,622 | ) | ||||||||||||||||||||||||||
| 8 | 250 | 242 | 686 | 678 | 621099 - Advertising - Other | 1,240 | 1,500 | 260 | 1,860 | 620 | ||||||||||||||||||||||||||||||
| 8 | 250 | 242 | 686 | 678 | Other Marketing | 1,240 | 1,500 | 260 | 1,860 | 620 | ||||||||||||||||||||||||||||||
| 15,240 | 7,575 | (7,665 | ) | 3,477 | (11,762 | ) | Total Marketing Expense | 57,424 | 40,416 | (17,007 | ) | 19,480 | (37,944 | ) | ||||||||||||||||||||||||||
| 0 | 154 | 154 | 0 | 0 | 610600 - Administrative Salary | 0 | 930 | 930 | 0 | 0 | ||||||||||||||||||||||||||||||
| 4,066 | 3,973 | (93 | ) | 2,596 | (1,470 | ) | 621000 - Leasing Payroll | 25,855 | 23,966 | (1,889 | ) | 21,435 | (4,420 | ) | ||||||||||||||||||||||||||
| 89 | 0 | (89 | ) | 0 | (89 | ) | 627000 - Commissions & Bonus | 380 | 0 | (380 | ) | 0 | (380 | ) | ||||||||||||||||||||||||||
| 0 | 100 | 100 | 0 | 0 | 627200 - Miscellaneous Incentives | 0 | 600 | 600 | 0 | 0 | ||||||||||||||||||||||||||||||
| 0 | 0 | 0 | 450 | 450 | 627300 - Leasing Commissions | 0 | 0 | 0 | 2,420 | 2,420 | ||||||||||||||||||||||||||||||
| 0 | 0 | 0 | 1,062 | 1,062 | 627301 - Commission Amortization | 0 | 0 | 0 | 855 | 855 | ||||||||||||||||||||||||||||||
| 0 | 0 | 0 | 250 | 250 | 627400 - Leasing Renewal Incentives | 0 | 0 | 0 | 7,900 | 7,900 | ||||||||||||||||||||||||||||||
| 375 | 550 | 175 | 0 | (375 | ) | 627700 - Leasing Comm - Amortizable | 5,300 | 3,233 | (2,067 | ) | 0 | (5,300 | ) | |||||||||||||||||||||||||||
| 740 | 0 | (740 | ) | 0 | (740 | ) | 627701 - Amortization on Leasing Comn | 1,168 | 0 | (1,168 | ) | 0 | (1,168 | ) | ||||||||||||||||||||||||||
| 1,024 | 750 | (274 | ) | 0 | (1,024 | ) | 627800 - Renewal Incent - Amortizable | 7,074 | 4,500 | (2,574 | ) | 0 | (7,074 | ) | ||||||||||||||||||||||||||
| 0 | 0 | 0 | 0 | 0 | 627500 - Coast-to-Coast Incentive | 0 | 0 | 0 | 100 | 100 | ||||||||||||||||||||||||||||||
| 0 | 2,681 | 2,681 | 4,148 | 4,148 | 631000 - Salaries - Administrative | 660 | 16,175 | 15,516 | 25,067 | 24,407 | ||||||||||||||||||||||||||||||
| 3,462 | 3,002 | (459 | ) | 0 | (3,462 | ) | 633000 - Salaries - Manager | 23,750 | 18,108 | (5,642 | ) | 0 | (23,750 | ) | ||||||||||||||||||||||||||
| 2,082 | 174 | (1,908 | ) | 174 | (1,908 | ) | 633100 - Employee Apartments | 11,880 | 1,044 | (10,836 | ) | 5,500 | (6,380 | ) | ||||||||||||||||||||||||||
| 10,099 | 7,654 | (2,445 | ) | 7,966 | (2,133 | ) | 654000 - Salaries - Maintenance | 54,280 | 46,168 | (8,112 | ) | 42,869 | (11,411 | ) | ||||||||||||||||||||||||||
| 242 | 17 | (225 | ) | 70 | (172 | ) | 659500 - Outsourced Services | 1,049 | 572 | (477 | ) | 70 | (979 | ) | ||||||||||||||||||||||||||
| 0 | 0 | 0 | 2,477 | 2,477 | 659800 - Payroll Adjustment | 0 | 0 | 0 | 1,101 | 1,101 | ||||||||||||||||||||||||||||||
| 290 | 0 | (290 | ) | 0 | (290 | ) | 659811 - Admin Salary Expense Adj | (697 | ) | 0 | 697 | 0 | 697 | |||||||||||||||||||||||||||
| 194 | 0 | (194 | ) | 0 | (194 | ) | 659812 - Mgm’t Salary Expense Adj | 399 | 0 | (399 | ) | 0 | (399 | ) | ||||||||||||||||||||||||||
| 1,822 | 0 | (1,822 | ) | 0 | (1,822 | ) | 659813 - Maint Salary Expense Adj | 622 | 0 | (622 | ) | 0 | (622 | ) | ||||||||||||||||||||||||||
| 204 | 0 | (204 | ) | 0 | (204 | ) | 659814 - Payroll Tax Expense Adj | 17 | 0 | (17 | ) | 0 | (17 | ) | ||||||||||||||||||||||||||
| 168 | 0 | (168 | ) | 0 | (168 | ) | 659815 - Workers Comp Expense Adj | (8 | ) | 0 | 8 | 0 | 8 | |||||||||||||||||||||||||||
| (2,577 | ) | (1,026 | ) | 1,551 | (794 | ) | 1,783 | 659900 - Repairs Payroll Capitalized | (4,597 | ) | (6,197 | ) | (1,600 | ) | (4,330 | ) | 268 | |||||||||||||||||||||||
| 1,394 | 1,732 | 338 | 1,257 | (137 | ) | 671100 - Payroll Taxes | 10,630 | 10,437 | (194 | ) | 9,097 | (1,534 | ) | |||||||||||||||||||||||||||
| 97 | 0 | (97 | ) | 0 | (97 | ) | 671115 - SUI/FUTA Payroll Tax Adjust | (997 | ) | 0 | 997 | 0 | 997 | |||||||||||||||||||||||||||
| 1,147 | 1,039 | (108 | ) | 925 | (222 | ) | 672200 - Workers Compensation | 7,188 | 6,264 | (924 | ) | 6,554 | (634 | ) | ||||||||||||||||||||||||||
| 2,766 | 2,271 | (495 | ) | 1,420 | (1,346 | ) | 672300 - Health Ins. & Other Benefits | 14,374 | 13,631 | (743 | ) | 11,330 | (3,044 | ) | ||||||||||||||||||||||||||
©2007 CB Richard Ellis, Inc.
6
Table of Contents
| AIMCO Statement of Operations — Detail | ||||
| 000500 — Presidential House | ||||
| For the Period Ended June 2007 (12OSD) | ||||
| APPLICATION :AIMCOPROPERTY | Run Date: 7/10/2007 2:08 PM | USER ID: gcoalson |
| Current | Current | Current | Previous Yr | Previous Yr | Current | Current | Current | Previous | Previous Yr | |||||||||||||||||||||||||||||||
| Month | Month | Month | Month | Cur Month | YTD | YTD | YTD | Year | Current YTD | |||||||||||||||||||||||||||||||
| Actual | Budget | Variance | Actual | Variance | Actual | Budget | Variance | Actual | Variance | |||||||||||||||||||||||||||||||
| 358 | 959 | 601 | 606 | 249 | 831001 - Ranking Bonus | 1,559 | 5,786 | 4,227 | 11,014 | 9,454 | ||||||||||||||||||||||||||||||
| 28,041 | 24,031 | (4,010 | ) | 22,608 | (5,433 | ) | Total Payroll Expense | 159,884 | 145,217 | (14,667 | ) | 140,981 | (18,903 | ) | ||||||||||||||||||||||||||
| 0 | 0 | 0 | (96 | ) | (96 | ) | 659700 - Construction Period Operating | 0 | 0 | 0 | (96 | ) | (96 | ) | ||||||||||||||||||||||||||
| 0 | 0 | 0 | (96 | ) | (96 | ) | Total Construction Period Operating | 0 | 0 | 0 | (96 | ) | (96 | ) | ||||||||||||||||||||||||||
| 72,167 | 60,212 | (11,955 | ) | 56,855 | (15,312 | ) | Total Controllable Operating Expe | 405,167 | 350,439 | (54,728 | ) | 314,675 | (90,493 | ) | ||||||||||||||||||||||||||
| 108,973 | 124,905 | (15,932 | ) | 120,086 | (11,112 | ) | Controllable NOI | 695,312 | 737,928 | (42,616 | ) | 727,139 | (31,828 | ) | ||||||||||||||||||||||||||
| NON-CONTROLLABLE OPERATING EXPENSES | ||||||||||||||||||||||||||||||||||||||||
TAXES & INSURANCE | ||||||||||||||||||||||||||||||||||||||||
| 48 | 787 | 739 | 0 | (48 | ) | 639002 - Ad Valorem Tax Service | 7,611 | 4,723 | (2,888 | ) | 7,559 | (52 | ) | |||||||||||||||||||||||||||
| 20,884 | 20,884 | 0 | 22,158 | 1,274 | 671001 - Real Estate Taxes | 125,305 | 125,307 | 1 | 132,950 | 7,645 | ||||||||||||||||||||||||||||||
| 0 | 0 | 0 | 0 | 0 | 671003 - Real Estate Tax - Prior Year | 0 | 0 | 0 | 0 | 0 | ||||||||||||||||||||||||||||||
| 0 | 0 | 0 | 0 | 0 | 671005 - Tax Refund - Prior Years | (31,867 | ) | 0 | 31,867 | 666 | 32,533 | |||||||||||||||||||||||||||||
| 21 | 0 | (21 | ) | 0 | (21 | ) | 671099 - Other Tax | 136 | 0 | (136 | ) | 0 | (136 | ) | ||||||||||||||||||||||||||
| 0 | 1,037 | 1,037 | 216 | 216 | 671900 - Business Licenses and Permits | 3,000 | 6,223 | 3,223 | 2,626 | (374 | ) | |||||||||||||||||||||||||||||
| 0 | 56 | 56 | 0 | 0 | 671902 - Sales and Use Tax | 2 | 338 | 336 | 546 | 544 | ||||||||||||||||||||||||||||||
| 0 | 0 | 0 | (339 | ) | (339 | ) | 832038 - Construction Period Taxes | 0 | 0 | 0 | (339 | ) | (339 | ) | ||||||||||||||||||||||||||
| 20,953 | 22,765 | 1,812 | 22,036 | 1,082 | Total Taxes | 104,187 | 136,590 | 32,403 | 144,008 | 39,820 | ||||||||||||||||||||||||||||||
| 4,419 | 10,951 | 6,532 | 11,890 | 7,471 | 672000 - Hazard Insurance | 39,578 | 65,707 | 26,129 | 59,531 | 19,953 | ||||||||||||||||||||||||||||||
| 120 | 138 | 18 | 108 | (12 | ) | 672100 - Fidelity Bond Insurance | 719 | 829 | 110 | 645 | (74 | ) | ||||||||||||||||||||||||||||
| 1,121 | 1,026 | (95 | ) | 0 | (1,121 | ) | 672900 - Other Insurance | 5,814 | 5,719 | (95 | ) | 110 | (5,704 | ) | ||||||||||||||||||||||||||
| 5,660 | 12,116 | 6,456 | 11,997 | 6,338 | Total Insurance | 46,111 | 72,255 | 26,144 | 60,286 | 14,175 | ||||||||||||||||||||||||||||||
| 26,613 | 34,881 | 8,268 | 34,033 | 7,420 | Total Taxes & Insurance | 150,298 | 208,845 | 58,547 | 204,294 | 53,996 | ||||||||||||||||||||||||||||||
| 82,360 | 90,025 | (7,664 | ) | 86,052 | (3,692 | ) | Reportable NOI | 545,013 | 529,083 | 15,930 | 522,845 | 22,168 | ||||||||||||||||||||||||||||
| OTHER NON-CONTROLLABLE OPERATING EXPENSES | ||||||||||||||||||||||||||||||||||||||||
| 8,926 | 9,295 | 368 | 8,787 | (140 | ) | 632000 - Management Fees | 52,912 | 54,651 | 1,739 | 51,407 | (1,504 | ) | ||||||||||||||||||||||||||||
©2007 CB Richard Ellis, Inc.
7
Table of Contents
| AIMCO Statement of Operations — Detail | ||||
| 000500 — Presidential House | ||||
| For the Period Ended June 2007 (12OSD) | ||||
| APPLICATION :AIMCOPROPERTY | Run Date: 7/10/2007 2:08 PM | USER ID: gcoalson |
| Current | Current | Current | Previous Yr | Previous Yr | Current | Current | Current | Previous | Previous Yr | |||||||||||||||||||||||||||||||
| Month | Month | Month | Month | Cur Month | YTD | YTD | YTD | Year | Current YTD | |||||||||||||||||||||||||||||||
| Actual | Budget | Variance | Actual | Variance | Actual | Budget | Variance | Actual | Variance | |||||||||||||||||||||||||||||||
| 8,926 | 9,295 | 368 | 8,787 | (140 | ) | Total Management & Accounting F | 52,912 | 54,651 | 1,739 | 51,407 | (1,504 | ) | ||||||||||||||||||||||||||||
| 8,926 | 9,295 | 368 | 8,787 | (140 | ) | Management, Acctg & Oth Fees | 52,912 | 54,651 | 1,739 | 51,407 | (1,504 | ) | ||||||||||||||||||||||||||||
| 73,434 | 80,730 | (7,296 | ) | 77,266 | (3,832 | ) | Property Net Operating Income | 492,102 | 474,432 | 17,670 | 471,438 | 20,664 | ||||||||||||||||||||||||||||
| 1,200 | 0 | (1,200 | ) | 44,626 | 43,426 | 654215 - Insurance Damage Expense | 6,744 | 0 | (6,744 | ) | (72,569 | ) | (79,313 | ) | ||||||||||||||||||||||||||
| (80,818 | ) | 0 | 80,818 | 0 | 80,818 | 915000 - Casualty Basis Write-Off | (297,932 | ) | 0 | 297,932 | 0 | 297,932 | ||||||||||||||||||||||||||||
| (79,618 | ) | 0 | 79,618 | 44,626 | 124,244 | Total Casualty GIL | (291,188 | ) | 0 | 291,188 | (72,569 | ) | 218,619 | |||||||||||||||||||||||||||
| 8,250 | 7,000 | (1,250 | ) | 4,676 | (3,574 | ) | 662000 - Deprec. - Buildings | 79,983 | (370,697 | ) | (450,680 | ) | 27,200 | (52,782 | ) | |||||||||||||||||||||||||
| 7,542 | 7,006 | (536 | ) | 11,082 | 3,541 | 666000 - Deprec. - Furnishings | 45,437 | 44,793 | (644 | ) | 65,391 | 19,954 | ||||||||||||||||||||||||||||
| 120 | 100 | (20 | ) | 0 | (120 | ) | 669510 - Deprec. - Non RE Assets | 633 | 613 | (20 | ) | 0 | (633 | ) | ||||||||||||||||||||||||||
| 15,912 | 14,106 | (1,806 | ) | 15,759 | (153 | ) | Total Depreciation Expense | 126,053 | (325,291 | ) | (451,344 | ) | 92,591 | (33,462 | ) | |||||||||||||||||||||||||
| 0 | 0 | 0 | 0 | 0 | 834000 - Legal | 0 | 0 | 0 | 13 | 13 | ||||||||||||||||||||||||||||||
| 0 | 0 | 0 | 504 | 504 | 834500 - Prof Exp | 1 | 0 | (1 | ) | 504 | 503 | |||||||||||||||||||||||||||||
| 0 | 0 | 0 | 504 | 504 | Total Partnership Legal | 1 | 0 | (1 | ) | 517 | 516 | |||||||||||||||||||||||||||||
| 0 | 0 | 0 | 119 | 119 | 831600 - Txs Fees & Lic | 0 | 0 | 0 | 119 | 119 | ||||||||||||||||||||||||||||||
| 0 | 0 | 0 | 800 | 800 | 839000 - Partnership Misc Exp | 0 | 0 | 0 | 800 | 800 | ||||||||||||||||||||||||||||||
| 0 | 0 | 0 | 919 | 919 | Total Partnership Other Expense | 0 | 0 | 0 | 919 | 919 | ||||||||||||||||||||||||||||||
| 0 | 0 | 0 | 1,423 | 1,423 | Total Partnership Expense | 1 | 0 | (1 | ) | 1,436 | 1,435 | |||||||||||||||||||||||||||||
| 0 | 0 | 0 | 0 | 0 | 793100 - Grant Expense | 0 | 0 | 0 | 312 | 312 | ||||||||||||||||||||||||||||||
| 531 | 0 | (531 | ) | 0 | (531 | ) | 840000 - Prior Year Extraordinary Exper | 531 | 0 | (531 | ) | 0 | (531 | ) | ||||||||||||||||||||||||||
| 531 | 0 | (531 | ) | 0 | (531 | ) | Total Other Non-Controllable Expe | 531 | 0 | (531 | ) | 312 | (219 | ) | ||||||||||||||||||||||||||
| (27,636 | ) | 58,281 | 85,917 | 104,627 | 132,263 | Total Noncontrollable Operating E | 38,606 | (61,796 | ) | (100,402 | ) | 277,471 | 238,865 | |||||||||||||||||||||||||||
| 44,531 | 118,493 | 73,962 | 161,482 | 116,951 | Total Operating Expenses | 443,774 | 288,644 | (155,130 | ) | 592,146 | 148,372 | |||||||||||||||||||||||||||||
| 136,610 | 66,624 | 69,985 | 15,459 | 121,151 | Operating Income | 656,705 | 799,724 | (143,018 | ) | 449,668 | 207,037 | |||||||||||||||||||||||||||||
| NON-OPERATING EXPENSES | ||||||||||||||||||||||||||||||||||||||||
| 701 | 701 | 0 | 702 | 0 | 916003 - Amort DLC - 1st | 4,209 | 4,209 | 0 | 4,209 | 0 | ||||||||||||||||||||||||||||||
©2007 CB Richard Ellis, Inc.
8
Table of Contents
| AIMCO Statement of Operations — Detail | ||||
| 000500 — Presidential House | ||||
| For the Period Ended December 2006 (12OSD1) | ||||
| APPLICATION :AIMCOPROPERTY | Run Date: 4/27/2007 9:33 AM | USER ID: gcoalson |
| Current | Current | Current | Previous Yr | Previous Yr | Current | Current | Current | Previous | Previous Yr | |||||||||||||||||||||||||||||||
| Month | Month | Month | Month | Cur Month | YTD | YTD | YTD | Year | Current YTD | |||||||||||||||||||||||||||||||
| Actual | Budget | Variance | Actual | Variance | Actual | Budget | Variance | Actual | Variance | |||||||||||||||||||||||||||||||
| INCOME | ||||||||||||||||||||||||||||||||||||||||
| 199,777 | 184,552 | 15,225 | 186,437 | 13,340 | 500000 - Market Rent | 2,414,424 | 2,190,406 | 224,018 | 2,224,864 | 189,560 | ||||||||||||||||||||||||||||||
| (13,410 | ) | 0 | (13,410 | ) | (8,258 | ) | (5,152 | ) | 500001 - Leases Under/Over Schedule | (182,598 | ) | 0 | (182,598 | ) | (186,576 | ) | 3,977 | |||||||||||||||||||||||
| (190 | ) | 0 | (190 | ) | (829 | ) | 639 | 500501 - Renewal Price Adjustment | (5,350 | ) | 0 | (5,350 | ) | (4,618 | ) | (732 | ) | |||||||||||||||||||||||
| 0 | 132 | (132 | ) | 12 | (12 | ) | 512300 - Commercial Rent | 96 | 1,568 | (1,472 | ) | 1,453 | (1,357 | ) | ||||||||||||||||||||||||||
| 186,177 | 184,685 | 1,492 | 177,362 | 8,815 | Non-subsidized Rental Income | 2,226,571 | 2,191,974 | 34,597 | 2,035,123 | 191,448 | ||||||||||||||||||||||||||||||
| 186,177 | 184,685 | 1,492 | 177,362 | 8,815 | Total Gross Potential Rent | 2,226,571 | 2,191,974 | 34,597 | 2,035,123 | 191,448 | ||||||||||||||||||||||||||||||
| 0 | 0 | 0 | 0 | 0 | 522025 - Service Maintenance Guarantee | (140 | ) | 0 | (140 | ) | 0 | (140 | ) | |||||||||||||||||||||||||||
| (4,185 | ) | 0 | (4,185 | ) | (264 | ) | (3,921 | ) | 625002 - Concessions/Special Promotion | (21,172 | ) | 0 | (21,172 | ) | (3,494 | ) | (17,678 | ) | ||||||||||||||||||||||
| (1,019 | ) | (11,122 | ) | 10,102 | (11,051 | ) | 10,032 | 625005 - Renewal Concession | (63,506 | ) | (131,999 | ) | 68,493 | (98,387 | ) | 34,881 | ||||||||||||||||||||||||
| (156 | ) | 0 | (156 | ) | (270 | ) | 114 | 625006 - Discount - Residents Monthly | (1,521 | ) | 0 | (1,521 | ) | (2,460 | ) | 939 | ||||||||||||||||||||||||
| 2,795 | 0 | 2,795 | 385 | 2,410 | 625009 - Concession Amortization | 10,579 | 0 | 10,579 | 1,522 | 9,057 | ||||||||||||||||||||||||||||||
| (2,566 | ) | (11,122 | ) | 8,555 | (11,200 | ) | 8,634 | Total Concessions | (75,761 | ) | (131,999 | ) | 56,238 | (102,820 | ) | 27,059 | ||||||||||||||||||||||||
| (20,546 | ) | (6,193 | ) | (14,353 | ) | (2,207 | ) | (18,339 | ) | 522000 - Vacancy Loss | (90,759 | ) | (73,503 | ) | (17,255 | ) | (47,814 | ) | (42,945 | ) | ||||||||||||||||||||
| (20,546 | ) | (6,193 | ) | (14,353 | ) | (2,207 | ) | (18,339 | ) | Total Vacancy Loss | (90,759 | ) | (73,503 | ) | (17,255 | ) | (47,814 | ) | (42,945 | ) | ||||||||||||||||||||
| (909 | ) | 0 | (909 | ) | 0 | (909 | ) | 631200 - Administrative Units | (6,533 | ) | 0 | (6,533 | ) | 0 | (6,533 | ) | ||||||||||||||||||||||||
| (909 | ) | 0 | (909 | ) | 0 | (909 | ) | Total Other Rental Losses | (6,533 | ) | 0 | (6,533 | ) | 0 | (6,533 | ) | ||||||||||||||||||||||||
| (24,021 | ) | (17,315 | ) | (6,707 | ) | (13,407 | ) | (10,614 | ) | Total Rental Loss | (173,053 | ) | (205,503 | ) | 32,450 | (150,634 | ) | (22,419 | ) | |||||||||||||||||||||
| 162,156 | 167,370 | (5,214 | ) | 163,955 | (1,799 | ) | Net Rental Income | 2,053,519 | 1,986,471 | 67,047 | 1,884,489 | 169,029 | ||||||||||||||||||||||||||||
| 0 | 0 | 0 | 0 | 0 | 590508 - Resident Util Pymts: Electricity | 30 | 254 | (224 | ) | 163 | (133 | ) | ||||||||||||||||||||||||||||
| 2,014 | 0 | 2,014 | 0 | 2,014 | 590514 - Resident Util Pymts: Misc | 5,453 | 0 | 5,453 | 0 | 5,453 | ||||||||||||||||||||||||||||||
| 2,014 | 0 | 2,014 | 0 | 2,014 | Total Utility Payments from Reside | 5,483 | 254 | 5,228 | 163 | 5,319 | ||||||||||||||||||||||||||||||
| 2,299 | 150 | 2,149 | 2,746 | (447 | ) | 591000 - Laundry Income | 21,388 | 1,800 | 19,588 | 16,394 | 4,994 | |||||||||||||||||||||||||||||
| 1,247 | 0 | 1,247 | 2,677 | (1,430 | ) | 591007 - AS - Cable TV | 9,939 | 0 | 9,939 | 9,399 | 540 | |||||||||||||||||||||||||||||
| (7 | ) | 40 | (47 | ) | 412 | (419 | ) | 591008 - AS - Local Telephone | 1,827 | 480 | 1,347 | 1,859 | (31 | ) | ||||||||||||||||||||||||||
| 2 | 10 | (8 | ) | 18 | (15 | ) | 591011 - Soft Drink Vending | 23 | 120 | (97 | ) | 123 | (100 | ) | ||||||||||||||||||||||||||
| 3,541 | 200 | 3,341 | 5,852 | (2,311 | ) | Total Ancillary Services Income | 33,177 | 2,400 | 30,777 | 27,775 | 5,402 | |||||||||||||||||||||||||||||
| 27 | 300 | (273 | ) | 7 | 20 | 500005 - Month to Month Fee | 5,007 | 3,600 | 1,407 | 2,107 | 2,900 | |||||||||||||||||||||||||||||
| 2,000 | 1,500 | 500 | 1,220 | 780 | 592001 - Late Charges | 28,119 | 18,000 | 10,119 | 20,909 | 7,209 | ||||||||||||||||||||||||||||||
| 40 | 250 | (210 | ) | 120 | (80 | ) | 592002 - NSF Charges | 2,840 | 3,000 | (160 | ) | 2,129 | 711 | |||||||||||||||||||||||||||
©2007 CB Richard Ellis, Inc.
1
Table of Contents
| AIMCO Statement of Operations — Detail | ||||
| 000500 — Presidential House | ||||
| For the Period Ended December 2006 (12OSD1) | ||||
| APPLICATION :AIMCOPROPERTY | Run Date: 4/27/2007 9:33 AM | USER ID: gcoalson |
| Current | Current | Current | Previous Yr | Previous Yr | Current | Current | Current | Previous | Previous Yr | |||||||||||||||||||||||||||||||
| Month | Month | Month | Month | Cur Month | YTD | YTD | YTD | Year | Current YTD | |||||||||||||||||||||||||||||||
| Actual | Budget | Variance | Actual | Variance | Actual | Budget | Variance | Actual | Variance | |||||||||||||||||||||||||||||||
| 0 | 0 | 0 | 0 | 0 | 592004 - Admin Fees - Resident Charges | 700 | 0 | 700 | 0 | 700 | ||||||||||||||||||||||||||||||
| 0 | 25 | (25 | ) | 0 | 0 | 592006 - Keys, Locks, Lock Changes | 50 | 300 | (250 | ) | 50 | 0 | ||||||||||||||||||||||||||||
| 100 | 0 | 100 | 0 | 100 | 592009 - Miscellaneous Resident Charge | 2,654 | 0 | 2,654 | 373 | 2,280 | ||||||||||||||||||||||||||||||
| 1,200 | 500 | 700 | 800 | 400 | 592010 - Non-refundable Admin Fees | 13,600 | 6,000 | 7,600 | 6,400 | 7,200 | ||||||||||||||||||||||||||||||
| 82 | 50 | 32 | 230 | (148 | ) | 593000 - Cleaning & Damage Fees | 5,856 | 600 | 5,256 | 1,973 | 3,884 | |||||||||||||||||||||||||||||
| 0 | 718 | (718 | ) | 0 | 0 | 593002 - Pet Damage Charges | 1,467 | 1,292 | 175 | 563 | 904 | |||||||||||||||||||||||||||||
| 245 | 75 | 170 | 300 | (55 | ) | 599002 - Legal Fees | 6,633 | 900 | 5,733 | 1,987 | 4,646 | |||||||||||||||||||||||||||||
| 0 | 0 | 0 | 0 | 0 | 599003 - Non-refundable Pet Fees | 600 | 0 | 600 | 0 | 600 | ||||||||||||||||||||||||||||||
| 1,001 | 1,000 | 1 | 2,133 | (1,132 | ) | 599004 - Lease Cancellation Fees | 35,014 | 12,000 | 23,014 | 12,611 | 22,404 | |||||||||||||||||||||||||||||
| 1,700 | 250 | 1,450 | 390 | 1,310 | 599005 - Application Fees | 7,570 | 3,000 | 4,570 | 3,900 | 3,670 | ||||||||||||||||||||||||||||||
| 60 | 20 | 40 | 0 | 60 | 599013 - Monthly Pet Rent | 166 | 240 | (74 | ) | 186 | (20 | ) | ||||||||||||||||||||||||||||
| (6,793 | ) | (125 | ) | (6,668 | ) | (620 | ) | (6,173 | ) | 599014 - Contra Lease Cancellation Fees | (26,008 | ) | (1,500 | ) | (24,508 | ) | (6,463 | ) | (19,545 | ) | ||||||||||||||||||||
| 0 | 427 | (427 | ) | 0 | 0 | 599099 - Miscellaneous Income | 0 | 427 | (427 | ) | 0 | 0 | ||||||||||||||||||||||||||||
| 0 | 0 | 0 | 0 | 0 | 599200 - Fee Adjustments | 0 | 0 | 0 | (25 | ) | 25 | |||||||||||||||||||||||||||||
| (338 | ) | 4,990 | (5,328 | ) | 4,580 | (4,918 | ) | Total Miscellaneous Income | 84,268 | 47,859 | 36,409 | 46,700 | 37,567 | |||||||||||||||||||||||||||
| 5,218 | 5,190 | 28 | 10,432 | (5,215 | ) | Total Other Income | 122,928 | 50,514 | 72,414 | 74,639 | 48,289 | |||||||||||||||||||||||||||||
| (6,074 | ) | (1,726 | ) | (4,348 | ) | (3,053 | ) | (3,020 | ) | 637000 - Bad Debt Expense | (86,679 | ) | (20,370 | ) | (66,309 | ) | (28,717 | ) | (57,962 | ) | ||||||||||||||||||||
| 0 | 0 | 0 | 0 | 0 | 637003 - Bad Debt Collection: Profession | 183 | 0 | 183 | 1,208 | (1,025 | ) | |||||||||||||||||||||||||||||
| 589 | 0 | 589 | (4,408 | ) | 4,997 | 637005 - Bank Reconciliation Adjustment | (3,588 | ) | 0 | (3,588 | ) | (12,995 | ) | 9,407 | ||||||||||||||||||||||||||
| (5,485 | ) | (1,726 | ) | (3,759 | ) | (7,462 | ) | 1,977 | Total Bad Debt Expense | (90,085 | ) | (20,370 | ) | (69,715 | ) | (40,504 | ) | (49,580 | ) | |||||||||||||||||||||
| 161,888 | 170,834 | (8,946 | ) | 166,926 | (5,037 | ) | Effective Gross Income | 2,086,361 | 2,016,615 | 69,746 | 1,918,624 | 167,737 | ||||||||||||||||||||||||||||
OPERATING EXPENSES | ||||||||||||||||||||||||||||||||||||||||
| 0 | 0 | 0 | 4,293 | 4,293 | 615600 - Fire Protection | 2,535 | 0 | (2,535 | ) | 7,225 | 4,691 | |||||||||||||||||||||||||||||
| 552 | 0 | (552 | ) | 0 | (552 | ) | 619300 - Lease - Equipment | 596 | 0 | (596 | ) | 0 | (596 | ) | ||||||||||||||||||||||||||
| 552 | 0 | (552 | ) | 4,293 | 3,741 | Common Area Expense | 3,131 | 0 | (3,131 | ) | 7,225 | 4,094 | ||||||||||||||||||||||||||||
| 1,971 | 200 | (1,771 | ) | 791 | (1,181 | ) | 645001 - Electricity - Vacant | 18,180 | 2,400 | (15,780 | ) | 6,121 | (12,059 | ) | ||||||||||||||||||||||||||
| 2,450 | 1,798 | (652 | ) | 4,488 | 2,038 | 645003 - Electricity - List Bills | 31,572 | 25,680 | (5,892 | ) | 26,282 | (5,290 | ) | |||||||||||||||||||||||||||
| 1,500 | 801 | (699 | ) | 1,331 | (169 | ) | 645100 - Water | 14,645 | 11,448 | (3,197 | ) | 13,240 | (1,405 | ) | ||||||||||||||||||||||||||
| 2,878 | 3,000 | 122 | 3,050 | 171 | 645203 - Gas - List Bills | 34,790 | 36,000 | 1,210 | 30,489 | (4,301 | ) | |||||||||||||||||||||||||||||
| 3,000 | 3,027 | 27 | 4,209 | 1,209 | 645300 - Sewer | 43,674 | 43,248 | (426 | ) | 39,044 | (4,630 | ) | ||||||||||||||||||||||||||||
| 0 | 0 | 0 | 68 | 68 | 647000 - Fees, Penalties - Utilities | 99 | 0 | (99 | ) | 139 | 40 | |||||||||||||||||||||||||||||
| 84 | 25 | (59 | ) | 0 | (84 | ) | 647001 - Utility Processing Fees | 444 | 294 | (150 | ) | 0 | (444 | ) | ||||||||||||||||||||||||||
| 198 | 0 | (198 | ) | 30 | (168 | ) | 649000 - Misc Utility Charges | 1,531 | 0 | (1,531 | ) | 86 | (1,446 | ) | ||||||||||||||||||||||||||
©2007 CB Richard Ellis, Inc.
2
Table of Contents
| AIMCO Statement of Operations — Detail | ||||
| 000500 — Presidential House | ||||
| For the Period Ended December 2006 (12OSD1) | ||||
| APPLICATION :AIMCOPROPERTY | Run Date: 4/27/2007 9:33 AM | USER ID: gcoalson |
| Current | Current | Current | Previous Yr | Previous Yr | Current | Current | Current | Previous | Previous Yr | |||||||||||||||||||||||||||||||
| Month | Month | Month | Month | Cur Month | YTD | YTD | YTD | Year | Current YTD | |||||||||||||||||||||||||||||||
| Actual | Budget | Variance | Actual | Variance | Actual | Budget | Variance | Actual | Variance | |||||||||||||||||||||||||||||||
| 12,081 | 8,851 | (3,231 | ) | 13,965 | 1,883 | Total Utilities Expense | 144,935 | 119,070 | (25,865 | ) | 115,400 | (29,535 | ) | |||||||||||||||||||||||||||
| 50 | 42 | (8 | ) | 100 | 50 | 631701 - Contract Common Area Cleanir | 425 | 500 | 75 | 413 | (13 | ) | ||||||||||||||||||||||||||||
| 0 | 265 | 265 | 254 | 254 | 651900 - Contract Exterminating | 3,550 | 3,180 | (370 | ) | 3,381 | (169 | ) | ||||||||||||||||||||||||||||
| 3,026 | 2,000 | (1,026 | ) | 1,605 | (1,421 | ) | 652500 - Contract Trash Removal | 22,878 | 24,000 | 1,122 | 22,988 | 109 | ||||||||||||||||||||||||||||
| 0 | 600 | 600 | 528 | 528 | 653002 - Contract Courtesy Patrol | 2,866 | 7,200 | 4,334 | 3,237 | 371 | ||||||||||||||||||||||||||||||
| 0 | 42 | 42 | 0 | 0 | 653004 - Contract Alarm System | 0 | 500 | 500 | 251 | 251 | ||||||||||||||||||||||||||||||
| 1,800 | 167 | (1,633 | ) | 0 | (1,800 | ) | 653700 - Contract Yards and Grounds | 4,900 | 2,000 | (2,900 | ) | 2,812 | (2,088 | ) | ||||||||||||||||||||||||||
| 0 | 125 | 125 | 0 | 0 | 654200 - Contract Repairs | 506 | 1,500 | 994 | 1,992 | 1,486 | ||||||||||||||||||||||||||||||
| 0 | 0 | 0 | 0 | 0 | 654202 - Maintenance Contract | 256 | 0 | (256 | ) | 0 | (256 | ) | ||||||||||||||||||||||||||||
| 0 | 42 | 42 | 0 | 0 | 654302 - Electrical - Contract | 0 | 500 | 500 | 0 | 0 | ||||||||||||||||||||||||||||||
| 340 | 42 | (298 | ) | 150 | (190 | ) | 654402 - Plumbing Contract | 1,072 | 500 | (572 | ) | 956 | (116 | ) | ||||||||||||||||||||||||||
| 542 | 560 | 18 | 657 | 115 | 654501 - Contract Elevator | 6,504 | 6,720 | 216 | 6,752 | 248 | ||||||||||||||||||||||||||||||
| 305 | 275 | (30 | ) | 1,044 | 739 | 654702 - Pool Contract | 3,355 | 3,300 | (55 | ) | 3,269 | (86 | ) | |||||||||||||||||||||||||||
| 7,012 | 17 | (6,995 | ) | 0 | (7,012 | ) | 669900 - Other Contracts | 7,012 | 200 | (6,812 | ) | 67 | (6,945 | ) | ||||||||||||||||||||||||||
| 13,075 | 4,175 | (8,900 | ) | 4,337 | (8,738 | ) | Total Contract Service | 53,324 | 50,100 | (3,224 | ) | 46,117 | (7,207 | ) | ||||||||||||||||||||||||||
| 0 | 29 | 29 | 0 | 0 | 612800 - Irrigation Maint | 19 | 350 | 331 | 211 | 192 | ||||||||||||||||||||||||||||||
| 0 | 42 | 42 | 0 | 0 | 617600 - Window & Glass Repair | 260 | 500 | 240 | 86 | (174 | ) | |||||||||||||||||||||||||||||
| 0 | 42 | 42 | 89 | 89 | 651500 - Cleaning Supplies | 1,105 | 500 | (605 | ) | 367 | (738 | ) | ||||||||||||||||||||||||||||
| 0 | 0 | 0 | 0 | 0 | 652000 - Exterminating Supplies | 8 | 0 | (8 | ) | 0 | (8 | ) | ||||||||||||||||||||||||||||
| 0 | 33 | 33 | 20 | 20 | 652300 - Gas/Oil/Mileage | 62 | 400 | 338 | 111 | 49 | ||||||||||||||||||||||||||||||
| 0 | 33 | 33 | 0 | 0 | 652501 - Dumpster Expense | 25 | 400 | 375 | 176 | 151 | ||||||||||||||||||||||||||||||
| 0 | 13 | 13 | 0 | 0 | 653600 - Landscaping Supplies | 66 | 150 | 84 | 84 | 19 | ||||||||||||||||||||||||||||||
| 0 | 0 | 0 | 81 | 81 | 654003 - Handyman Materials | 0 | 0 | 0 | 117 | 117 | ||||||||||||||||||||||||||||||
| 0 | 75 | 75 | 10 | 10 | 654004 - Handyman - Other Materials | 265 | 900 | 635 | 494 | 229 | ||||||||||||||||||||||||||||||
| 0 | 200 | 200 | 248 | 248 | 654100 - Repairs/Maint. - Materials | 467 | 2,400 | 1,933 | 2,383 | 1,915 | ||||||||||||||||||||||||||||||
| 528 | 200 | (328 | ) | 586 | 59 | 654101 - Electrical Supplies | 5,126 | 2,400 | (2,726 | ) | 3,198 | (1,929 | ) | |||||||||||||||||||||||||||
| 567 | 250 | (317 | ) | 1,286 | 719 | 654102 - Plumbing Supplies | 6,805 | 3,000 | (3,805 | ) | 4,807 | (1,999 | ) | |||||||||||||||||||||||||||
| 69 | 125 | 56 | 133 | 64 | 654103 - Appliance Parts | 1,291 | 1,500 | 209 | 903 | (388 | ) | |||||||||||||||||||||||||||||
| 0 | 0 | 0 | 0 | 0 | 654104 - Equipment Rental/Repair | 0 | 0 | 0 | 6 | 6 | ||||||||||||||||||||||||||||||
| 5,641 | 150 | (5,491 | ) | 325 | (5,316 | ) | 654105 - Plumbing Fixtures/Repairs | 12,580 | 1,800 | (10,780 | ) | 2,210 | (10,370 | ) | ||||||||||||||||||||||||||
| 0 | 21 | 21 | 0 | 0 | 654109 - Window Replacement | 40 | 250 | 210 | 110 | 70 | ||||||||||||||||||||||||||||||
| 0 | 75 | 75 | 147 | 147 | 654120 - Keys and Locks | 2,042 | 900 | (1,142 | ) | 626 | (1,416 | ) | ||||||||||||||||||||||||||||
| 0 | 0 | 0 | 0 | 0 | 654125 - Water Extraction | 775 | 0 | (775 | ) | 0 | (775 | ) | ||||||||||||||||||||||||||||
| 35 | 200 | 165 | 237 | 202 | 654199 - Other Maintenance Materials | 1,716 | 2,400 | 684 | 2,149 | 433 | ||||||||||||||||||||||||||||||
| 0 | 0 | 0 | 0 | 0 | 654205 - Interior Building Improvements | 685 | 0 | (685 | ) | 0 | (685 | ) | ||||||||||||||||||||||||||||
| 0 | 250 | 250 | 41 | 41 | 654206 - Exterior Building Improvements | 594 | 3,000 | 2,406 | 3,138 | 2,545 | ||||||||||||||||||||||||||||||
| 0 | 17 | 17 | 0 | 0 | 654207 - Paving/Concrete/Striping | 14 | 200 | 186 | 0 | (14 | ) | |||||||||||||||||||||||||||||
| 0 | 83 | 83 | 0 | 0 | 654500 - Elevator Expense | 326 | 1,000 | 674 | 610 | 284 | ||||||||||||||||||||||||||||||
| 218 | 250 | 32 | 330 | 112 | 654601 - HVAC Parts & Supplies | 3,513 | 3,000 | (513 | ) | 2,354 | (1,159 | ) | ||||||||||||||||||||||||||||
| 0 | 21 | 21 | 495 | 495 | 654700 - Pool Expense | 17 | 250 | 233 | 648 | 631 | ||||||||||||||||||||||||||||||
©2007 CB Richard Ellis, Inc.
3
Table of Contents
| AIMCO Statement of Operations — Detail | ||||
| 000500 — Presidential House | ||||
| For the Period Ended December 2006 (12OSD1) | ||||
| APPLICATION :AIMCOPROPERTY | Run Date: 4/27/2007 9:33 AM | USER ID: gcoalson |
| Current | Current | Current | Previous Yr | Previous Yr | Current | Current | Current | Previous | Previous Yr | |||||||||||||||||||||||||||||||
| Month | Month | Month | Month | Cur Month | YTD | YTD | YTD | Year | Current YTD | |||||||||||||||||||||||||||||||
| Actual | Budget | Variance | Actual | Variance | Actual | Budget | Variance | Actual | Variance | |||||||||||||||||||||||||||||||
| 0 | 10 | 10 | 0 | 0 | 654903 - Doors | 0 | 120 | 120 | 37 | 37 | ||||||||||||||||||||||||||||||
| (7 | ) | (167 | ) | (160 | ) | 84 | 91 | 655200 - R & M Rebate - MRO | (999 | ) | (2,000 | ) | (1,001 | ) | (1,767 | ) | (768 | ) | ||||||||||||||||||||||
| (137 | ) | (42 | ) | 95 | (282 | ) | (145 | ) | 655201 - R & M Rebate - Other | (913 | ) | (500 | ) | 413 | (304 | ) | 609 | |||||||||||||||||||||||
| 0 | 83 | 83 | 232 | 232 | 656005 - Light Bulbs | 1,014 | 1,000 | (14 | ) | 1,120 | 106 | |||||||||||||||||||||||||||||
| 0 | 427 | 427 | 69 | 69 | 656300 - Misc. | 726 | 5,124 | 4,398 | 185 | (541 | ) | |||||||||||||||||||||||||||||
| 835 | 100 | (735 | ) | 0 | (835 | ) | 659001 - Fire Protection Equip Maint | 989 | 1,200 | 211 | 935 | (54 | ) | |||||||||||||||||||||||||||
| 7,749 | 2,520 | (5,229 | ) | 4,131 | (3,617 | ) | Total Repairs & Maintenance | 38,619 | 30,244 | (8,375 | ) | 24,994 | (13,625 | ) | ||||||||||||||||||||||||||
| 2,010 | 523 | (1,487 | ) | 910 | (1,100 | ) | 651700 - Contract Cleaning | 9,971 | 6,375 | (3,596 | ) | 5,063 | (4,908 | ) | ||||||||||||||||||||||||||
| 1,315 | 349 | (966 | ) | 300 | (1,015 | ) | 656002 - Contract Carpet Cleaning and | 6,358 | 4,250 | (2,108 | ) | 4,055 | (2,303 | ) | ||||||||||||||||||||||||||
| 1,271 | 1,134 | (137 | ) | 2,325 | 1,054 | 656003 - Contract Painting - Interior | 16,692 | 13,812 | (2,880 | ) | 19,812 | 3,120 | ||||||||||||||||||||||||||||
| 0 | 87 | 87 | 0 | 0 | 656099 - Decorating - Contract Other | 0 | 1,062 | 1,062 | 280 | 280 | ||||||||||||||||||||||||||||||
| 303 | 0 | (303 | ) | 0 | (303 | ) | 656101 - Drapery/Miniblinds Repairs | 610 | 0 | (610 | ) | 0 | (610 | ) | ||||||||||||||||||||||||||
| 1,351 | 698 | (653 | ) | 728 | (623 | ) | 656102 - Painting Supplies | 6,874 | 8,500 | 1,626 | 7,831 | 957 | ||||||||||||||||||||||||||||
| 6,249 | 2,791 | (3,459 | ) | 4,263 | (1,986 | ) | Total Turnover Expense | 40,504 | 33,999 | (6,505 | ) | 37,040 | (3,465 | ) | ||||||||||||||||||||||||||
| 702 | 20 | (682 | ) | 0 | (702 | ) | 617104 - Radios/Pagers | 1,193 | 240 | (953 | ) | 96 | (1,098 | ) | ||||||||||||||||||||||||||
| 15 | 177 | 162 | 18 | 3 | 631100 - Office Supplies | 2,931 | 2,122 | (809 | ) | 1,953 | (978 | ) | ||||||||||||||||||||||||||||
| 375 | 84 | (291 | ) | 375 | 0 | 631101 - Office Equipment | 715 | 1,004 | 289 | 1,426 | 711 | |||||||||||||||||||||||||||||
| 0 | 155 | 155 | 165 | 165 | 631102 - Bank Charges | 1,679 | 1,862 | 183 | 1,909 | 230 | ||||||||||||||||||||||||||||||
| 85 | 71 | (14 | ) | 504 | 418 | 631104 - Applicant Screening | 744 | 857 | 113 | 1,685 | 941 | |||||||||||||||||||||||||||||
| 70 | 98 | 28 | 90 | 20 | 631105 - Uniforms | 1,102 | 1,179 | 76 | 920 | (183 | ) | |||||||||||||||||||||||||||||
| 68 | 46 | (22 | ) | 25 | (43 | ) | 631106 - Express Mail, Stamps | 576 | 551 | (25 | ) | 507 | (69 | ) | ||||||||||||||||||||||||||
| 366 | 340 | (26 | ) | 345 | (21 | ) | 631108 - Credit Card Service Fees | 4,456 | 4,080 | (376 | ) | 4,275 | (181 | ) | ||||||||||||||||||||||||||
| 1,245 | 408 | (837 | ) | 801 | (444 | ) | 631111 - Resident Eviction/Separation | 12,822 | 4,896 | (7,926 | ) | 801 | (12,021 | ) | ||||||||||||||||||||||||||
| 0 | 0 | 0 | 0 | 0 | 631112 - Office Supplies Rebates | (6 | ) | 0 | 6 | 0 | 6 | |||||||||||||||||||||||||||||
| 0 | 15 | 15 | 0 | 0 | 632500 - Professional Fees | 0 | 180 | 180 | 141 | 141 | ||||||||||||||||||||||||||||||
| 0 | 0 | 0 | 0 | 0 | 632525 - H/R-Personnel Costs | 340 | 0 | (340 | ) | 0 | (340 | ) | ||||||||||||||||||||||||||||
| 0 | 0 | 0 | 0 | 0 | 632918 - Answering Service | 1,011 | 0 | (1,011 | ) | 0 | (1,011 | ) | ||||||||||||||||||||||||||||
| 5 | 0 | (5 | ) | 0 | (5 | ) | 633400 - Temp Agency Help | 5 | 0 | (5 | ) | 0 | (5 | ) | ||||||||||||||||||||||||||
| 301 | 100 | (201 | ) | 140 | (161 | ) | 634000 - Legal Fees | 1,246 | 1,200 | (46 | ) | 6,451 | 5,204 | |||||||||||||||||||||||||||
| 1,617 | 825 | (792 | ) | 955 | (662 | ) | 636000 - Telephone | 10,304 | 9,900 | (404 | ) | 10,375 | 71 | |||||||||||||||||||||||||||
| 0 | 21 | 21 | 0 | 0 | 639003 - Computer Lease | 0 | 250 | 250 | 225 | 225 | ||||||||||||||||||||||||||||||
| 225 | 200 | (25 | ) | 106 | (119 | ) | 639004 - Computer Maint & Supplies | 2,556 | 2,400 | (156 | ) | 2,133 | (423 | ) | ||||||||||||||||||||||||||
| 0 | 0 | 0 | 8 | 8 | 639006 - Parking Expense | 16 | 0 | (16 | ) | 42 | 26 | |||||||||||||||||||||||||||||
| 481 | 170 | (311 | ) | 0 | (481 | ) | 639007 - Training & Travel | 3,975 | 2,040 | (1,935 | ) | 1,632 | (2,343 | ) | ||||||||||||||||||||||||||
| 147 | 117 | (30 | ) | 309 | 163 | 639099 - Miscellaneous Administrative | 1,602 | 1,404 | (198 | ) | 1,776 | 173 | ||||||||||||||||||||||||||||
| 0 | 122 | 122 | 0 | 0 | 655100 - Residnt Pmt Platform | 541 | 1,461 | 921 | 957 | 417 | ||||||||||||||||||||||||||||||
| 0 | 70 | 70 | 128 | 128 | 656006 - Clubhouse Equip/Supplies | 1,198 | 840 | (358 | ) | 794 | (404 | ) | ||||||||||||||||||||||||||||
| 5,703 | 3,039 | (2,665 | ) | 3,968 | (1,735 | ) | Total Administrative Expenses | 49,008 | 36,465 | (12,543 | ) | 38,096 | (10,911 | ) | ||||||||||||||||||||||||||
| 1,049 | 83 | (965 | ) | 915 | (133 | ) | 621003 - Periodicals | 6,879 | 1,000 | (5,879 | ) | 3,966 | (2,912 | ) | ||||||||||||||||||||||||||
©2007 CB Richard Ellis, Inc.
4
Table of Contents
| AIMCO Statement of Operations — Detail | ||||
| 000500 — Presidential House | ||||
| For the Period Ended December 2006 (12OSD1) | ||||
| APPLICATION :AIMCOPROPERTY | Run Date: 4/27/2007 9:33 AM | USER ID: gcoalson | ||
| Current | Current | Current | Previous Yr | Previous Yr | Current | Current | Current | Previous | Previous Yr | |||||||||||||||||||||||||||||||
| Month | Month | Month | Month | Cur Month | YTD | YTD | YTD | Year | Current YTD | |||||||||||||||||||||||||||||||
| Actual | Budget | Variance | Actual | Variance | Actual | Budget | Variance | Actual | Variance | |||||||||||||||||||||||||||||||
| 1,049 | 83 | (965 | ) | 915 | (133 | ) | Periodicals | 6,879 | 1,000 | (5,879 | ) | 3,966 | (2,912 | ) | ||||||||||||||||||||||||||
| 1,243 | 523 | (719 | ) | 524 | (719 | ) | 611200 - Web Advertising | 7,254 | 6,321 | (934 | ) | 6,439 | (815 | ) | ||||||||||||||||||||||||||
| �� | 1,243 | 523 | (719 | ) | 524 | (719 | ) | Internet Leads | 7,254 | 6,321 | (934 | ) | 6,439 | (815 | ) | |||||||||||||||||||||||||
| 862 | 0 | (862 | ) | 0 | (862 | ) | 621020 - National Web Advertising | 3,332 | 0 | (3,332 | ) | 0 | (3,332 | ) | ||||||||||||||||||||||||||
| 668 | 0 | (668 | ) | 0 | (668 | ) | 621030 - National Print/Periodical Advert | 1,293 | 0 | (1,293 | ) | 0 | (1,293 | ) | ||||||||||||||||||||||||||
| 1,530 | 0 | (1,530 | ) | 0 | (1,530 | ) | National Media Advertising | 4,625 | 0 | (4,625 | ) | 0 | (4,625 | ) | ||||||||||||||||||||||||||
| 0 | 9 | 9 | 0 | 0 | 621001 - Newspaper Advertising | 0 | 144 | 144 | 0 | 0 | ||||||||||||||||||||||||||||||
| 0 | 9 | 9 | 0 | 0 | Newspapers | 0 | 144 | 144 | 0 | 0 | ||||||||||||||||||||||||||||||
| 7,000 | 127 | (6,873 | ) | 1,500 | (5,500 | ) | 625001 - Referral Fees | 16,500 | 1,528 | (14,972 | ) | 2,950 | (13,550 | ) | ||||||||||||||||||||||||||
| 0 | 548 | 548 | 0 | 0 | 625008 - Resident Referral Concessions | 8,500 | 6,578 | (1,922 | ) | 9,000 | 500 | |||||||||||||||||||||||||||||
| 550 | 210 | (340 | ) | 700 | 150 | 625010 - Resident Referral Amortization | 1,900 | (1,268 | ) | (3,168 | ) | (1,900 | ) | (3,800 | ) | |||||||||||||||||||||||||
| (5,350 | ) | 0 | 5,350 | (1,233 | ) | 4,118 | 625012 - Referral Fee Amortization | (10,408 | ) | 461 | 10,869 | 2,805 | 13,213 | |||||||||||||||||||||||||||
| 2,200 | 886 | (1,314 | ) | 968 | (1,233 | ) | Apartment Brokers | 16,493 | 7,300 | (9,192 | ) | 12,855 | (3,637 | ) | ||||||||||||||||||||||||||
| 103 | 82 | (21 | ) | 0 | (103 | ) | 621013 - Leasing Promotions | 410 | 987 | 577 | 200 | (210 | ) | |||||||||||||||||||||||||||
| 103 | 82 | (21 | ) | 0 | (103 | ) | Active Outreach | 410 | 987 | 577 | 200 | (210 | ) | |||||||||||||||||||||||||||
| 47 | 45 | (2 | ) | 0 | (47 | ) | 611100 - Marketing Phone Services | 191 | 540 | 349 | 393 | 202 | ||||||||||||||||||||||||||||
| 0 | 0 | 0 | 0 | 0 | 621007 - Brochures — New Leases | 91 | 0 | (91 | ) | 0 | (91 | ) | ||||||||||||||||||||||||||||
| 0 | 77 | 77 | 0 | 0 | 621011 -Flags/Banners | 0 | 923 | 923 | 26 | 26 | ||||||||||||||||||||||||||||||
| 0 | 50 | 50 | 0 | 0 | 621012 - Move-in Gifts | 75 | 600 | 525 | 0 | (75 | ) | |||||||||||||||||||||||||||||
| 0 | 125 | 125 | 0 | 0 | 621050 - Renewal/Resident Gift Expense | 41 | 1,500 | 1,459 | 0 | (41 | ) | |||||||||||||||||||||||||||||
| 0 | 21 | 21 | 0 | 0 | 625000 - Signage | 147 | 250 | 103 | 30 | (117 | ) | |||||||||||||||||||||||||||||
| 0 | 42 | 42 | 0 | 0 | 626001 - Furniture - Models | 97 | 500 | 403 | 0 | (97 | ) | |||||||||||||||||||||||||||||
| 336 | 950 | 614 | 765 | 429 | 629002 - Phone Sales | 8,638 | 11,400 | 2,762 | 8,795 | 157 | ||||||||||||||||||||||||||||||
| 383 | 1,309 | 926 | 765 | 382 | Point of Sale | 9,278 | 15,713 | 6,435 | 9,244 | (35 | ) | |||||||||||||||||||||||||||||
| 0 | 55 | 55 | 0 | 0 | 621015 - Resident Relations | 750 | 658 | (92 | ) | 360 | (390 | ) | ||||||||||||||||||||||||||||
| 0 | 27 | 27 | 0 | 0 | 621017 - Resident Collaterals | 36 | 329 | 293 | 0 | (36 | ) | |||||||||||||||||||||||||||||
| 0 | 228 | 228 | 1,200 | 1,200 | 625007 - Resident Relations Concession | 100 | 2,741 | 2,641 | 1,915 | 1,815 | ||||||||||||||||||||||||||||||
| 500 | 55 | (445 | ) | 0 | (500 | ) | 625101 - Resident Functions | 632 | 658 | 26 | 0 | (632 | ) | |||||||||||||||||||||||||||
| 500 | 365 | (135 | ) | 1,200 | 700 | Retention | 1,517 | 4,385 | 2,868 | 2,274 | 757 | |||||||||||||||||||||||||||||
| 300 | 351 | 51 | 602 | 302 | 621099 - Advertising - Other | 2,471 | 4,930 | 2,459 | 1,669 | (802 | ) | |||||||||||||||||||||||||||||
| 300 | 351 | 51 | 602 | 302 | Other Marketing | 2,471 | 4,930 | 2,459 | 1,669 | (802 | ) | |||||||||||||||||||||||||||||
| 7,308 | 3,609 | (3,699 | ) | 4,973 | (2,335 | ) | Total Marketing Expense | 48,927 | 40,779 | (8,148 | ) | 36,648 | (12,280 | ) | ||||||||||||||||||||||||||
© 2007 CB Richard Ellis, Inc.
5
Table of Contents
| AIMCO Statement of Operations — Detail | ||||
| 000500 — Presidential House | ||||
| For the Period Ended December 2006 (12OSD1) | ||||
| APPLICATION :AIMCOPROPERTY | Run Date: 4/27/2007 9:33 AM | USER ID: gcoalson | ||
| Current | Current | Current | Previous Yr | Previous Yr | Current | Current | Current | Previous | Previous Yr | |||||||||||||||||||||||||||||||
| Month | Month | Month | Month | Cur Month | YTD | YTD | YTD | Year | Current YTD | |||||||||||||||||||||||||||||||
| Actual | Budget | Variance | Actual | Variance | Actual | Budget | Variance | Actual | Variance | |||||||||||||||||||||||||||||||
| 3,700 | 1,899 | (1,801 | ) | 2,215 | (1,485 | ) | 621000 - Leasing Payroll | 38,842 | 22,584 | (16,259 | ) | 44,987 | 6,144 | |||||||||||||||||||||||||||
| 0 | 0 | 0 | 0 | 0 | 627200 - Miscellaneous Incentives | 1,700 | 0 | (1,700 | ) | 0 | (1,700 | ) | ||||||||||||||||||||||||||||
| 0 | 1,008 | 1,008 | 1,620 | 1,620 | 627300 - Leasing Commissions | 5,020 | 11,963 | 6,943 | 12,220 | 7,200 | ||||||||||||||||||||||||||||||
| 0 | 0 | 0 | (1,196 | ) | (1,196 | ) | 627301 - Commission Amortization | (1,174 | ) | 0 | 1,174 | 2,493 | 3,667 | |||||||||||||||||||||||||||
| 0 | 0 | 0 | 1,500 | 1,500 | 627400 - Leasing Renewal Incentives | 13,925 | 0 | (13,925 | ) | 11,380 | (2,545 | ) | ||||||||||||||||||||||||||||
| 0 | 0 | 0 | 0 | 0 | 627700 - Leasing Comm — Amortizable | 1,100 | 0 | (1,100 | ) | 0 | (1,100 | ) | ||||||||||||||||||||||||||||
| 1,847 | 0 | (1,847 | ) | 0 | (1,847 | ) | 627701 - Amortization on Leasing Comm | (163 | ) | 0 | 163 | 0 | 163 | |||||||||||||||||||||||||||
| 0 | 0 | 0 | 0 | 0 | 627800 - Renewal Incent — Amortizable | 6,100 | 0 | (6,100 | ) | 0 | (6,100 | ) | ||||||||||||||||||||||||||||
| 0 | 0 | 0 | 0 | 0 | 627500 - Coast-to-Coast Incentive | 200 | 0 | (200 | ) | 0 | (200 | ) | ||||||||||||||||||||||||||||
| 1,093 | 2,652 | 1,559 | 3,544 | 2,450 | 631000 - Salaries — Administrative | 44,069 | 31,512 | (12,557 | ) | 38,408 | (5,661 | ) | ||||||||||||||||||||||||||||
| 2,520 | 0 | (2,520 | ) | 0 | (2,520 | ) | 633000 - Salaries — Manager | 2,520 | 0 | (2,520 | ) | 7,198 | 4,678 | |||||||||||||||||||||||||||
| 174 | 1,768 | 1,594 | 1,858 | 1,684 | 633100 - Employee Apartments | 6,542 | 21,216 | 14,674 | 21,470 | 14,928 | ||||||||||||||||||||||||||||||
| 8,204 | 7,920 | (284 | ) | 4,287 | (3,917 | ) | 654000 - Salaries — Maintenance | 95,381 | 94,221 | (1,160 | ) | 86,929 | (8,453 | ) | ||||||||||||||||||||||||||
| 27 | 0 | (27 | ) | 0 | (27 | ) | 659500 - Outsourced Services | 617 | 0 | (617 | ) | 0 | (617 | ) | ||||||||||||||||||||||||||
| 2,702 | 219 | (2,483 | ) | (40 | ) | (2,742 | ) | 659800 - Payroll Adjustment | 3,067 | 0 | (3,067 | ) | (10,562 | ) | (13,629 | ) | ||||||||||||||||||||||||
| (25 | ) | (804 | ) | (779 | ) | (206 | ) | (181 | ) | 659900 - Repairs Payroll Capitalized | (8,456 | ) | (9,571 | ) | (1,115 | ) | (11,190 | ) | (2,734 | ) | ||||||||||||||||||||
| 1,498 | 1,079 | (419 | ) | 1,211 | (287 | ) | 671 100 - Payroll Taxes | 18,697 | 15,177 | (3,521 | ) | 18,393 | (304 | ) | ||||||||||||||||||||||||||
| 1,056 | 828 | (228 | ) | 1,185 | 129 | 672200 - Workers Compensation | 13,221 | 9,843 | (3,379 | ) | 14,833 | 1,612 | ||||||||||||||||||||||||||||
| 1,997 | 2,426 | 429 | 2,006 | 10 | 672300 - Health Ins. & Other Benefits | 21,722 | 29,091 | 7,369 | 25,187 | 3,466 | ||||||||||||||||||||||||||||||
| 0 | 619 | 619 | 0 | 0 | 831001 - Ranking Bonus | 14,843 | 7,351 | (7,492 | ) | 4,585 | (10,258 | ) | ||||||||||||||||||||||||||||
| 24,793 | 19,615 | (5,178 | ) | 17,985 | (6,808 | ) | Total Payroll Expense | 277,774 | 233,387 | (44,388 | ) | 266,332 | (11,442 | ) | ||||||||||||||||||||||||||
| 0 | 0 | 0 | 0 | 0 | 659700 - Construction Period Operating | (195 | ) | 0 | 195 | (556 | ) | (361 | ) | |||||||||||||||||||||||||||
| 0 | 0 | 0 | 0 | 0 | Total Construction Period Operating | (195 | ) | 0 | 195 | (556 | ) | (361 | ) | |||||||||||||||||||||||||||
| 77,510 | 44,599 | (32,911 | ) | 57,915 | (19,595 | ) | Total Controllable Operating Expe | 656,028 | 544,044 | (111,984 | ) | 571,297 | (84,731 | ) | ||||||||||||||||||||||||||
| 84,378 | 126,235 | (41,857 | ) | 109,010 | (24,632 | ) | Controllable NOI | 1,430,333 | 1,472,572 | (42,238 | ) | 1,347,327 | 83,006 | |||||||||||||||||||||||||||
NON-CONTROLLABLE OPERATING EXPENSES | ||||||||||||||||||||||||||||||||||||||||
TAXES & INSURANCE | ||||||||||||||||||||||||||||||||||||||||
| 0 | 442 | 442 | 0 | 0 | 639002 - Ad Valorem Tax Service | 7,635 | 5,298 | (2,337 | ) | 5,298 | (2,337 | ) | ||||||||||||||||||||||||||||
| 19,087 | 22,158 | 3,071 | 15,436 | (3,651 | ) | 671001 - Real Estate Taxes | 229,045 | 265,900 | 36,855 | 185,230 | (43,815 | ) | ||||||||||||||||||||||||||||
| 0 | 313 | 313 | 0 | 0 | 671002 - Personal Property Tax | 2,571 | 3,756 | 1,184 | 3,577 | 1,006 | ||||||||||||||||||||||||||||||
| 0 | 0 | 0 | 0 | 0 | 671003 - Real Estate Tax — Prior Year | 0 | 0 | 0 | 0 | 0 | ||||||||||||||||||||||||||||||
| 0 | 0 | 0 | 0 | 0 | 671 005 - Tax Refund — Prior Years | 666 | 0 | (666 | ) | (14,003 | ) | (14,669 | ) | |||||||||||||||||||||||||||
| 310 | 199 | (111 | ) | 516 | 206 | 671900 - Business Licenses and Permits | 10,419 | 2,383 | (8,037 | ) | 2,313 | (8,106 | ) | |||||||||||||||||||||||||||
© 2007 CB Richard Ellis, Inc.
6
Table of Contents
| AIMCO Statement of Operations — Detail | ||||
| 000500 — Presidential House | ||||
| For the Period Ended December 2006 (12OSD1) | ||||
| APPLICATION :AIMCOPROPERTY | Run Date: 4/27/2007 9:33 AM | USER ID: gcoalson | ||
| Current | Current | Current | Previous Yr | Previous Yr | Current | Current | Current | Previous | Previous Yr | |||||||||||||||||||||||||||||||
| Month | Month | Month | Month | Cur Month | YTD | YTD | YTD | Year | Current YTD | |||||||||||||||||||||||||||||||
| Actual | Budget | Variance | Actual | Variance | Actual | Budget | Variance | Actual | Variance | |||||||||||||||||||||||||||||||
| 0 | 100 | 100 | 4 | 4 | 671902 - Sales and UseTax. | 546 | 1,200 | 654 | 54 | (493 | ) | |||||||||||||||||||||||||||||
| 0 | 0 | 0 | 0 | 0 | 832038 - Construction PeriodTaxes | (744 | ) | 0 | 744 | (878 | ) | (134 | ) | |||||||||||||||||||||||||||
| 19,397 | 23,211 | 3,814 | 15,956 | (3,441 | ) | Total Taxes | 250,139 | 278,536 | 28,398 | 181,590 | (68,548 | ) | ||||||||||||||||||||||||||||
| 11,890 | 5,709 | (6,181 | ) | 6,002 | (5,888 | ) | 672000 - Hazard Insurance | 130,869 | 68,505 | (62,365 | ) | 75,635 | (55,235 | ) | ||||||||||||||||||||||||||
| 120 | 108 | (12 | ) | 108 | (12 | ) | 672100 - Fidelity Bond Insurance | 1,340 | 1,291 | (49 | ) | 823 | (517 | ) | ||||||||||||||||||||||||||
| 0 | 980 | 980 | 111 | 111 | 672900 - Other Insurance | 110 | 11,757 | 11,647 | (676 | ) | (786 | ) | ||||||||||||||||||||||||||||
| 12,010 | 6,796 | (5,214 | ) | 6,221 | (5,789 | ) | Total Insurance | 132,319 | 81,553 | (50,767 | ) | 75,782 | (56,537 | ) | ||||||||||||||||||||||||||
| 31,407 | 30,007 | (1,399 | ) | 22,177 | (9,230 | ) | Total Taxes & Insurance | 382,458 | 360,089 | (22,369 | ) | 257,372 | (125,086 | ) | ||||||||||||||||||||||||||
| 52,971 | 96,228 | (43,256 | ) | 86,834 | (33,862 | ) | Reportable NOI | 1,047,876 | 1,112,483 | (64,607 | ) | 1,089,955 | (42,079 | ) | ||||||||||||||||||||||||||
OTHER NON-CONTROLLABLE OPERATING EXPENSES | ||||||||||||||||||||||||||||||||||||||||
| 7,913 | 8,421 | 508 | 9,410 | 1,497 | 632000 - Management Fees | 101,901 | 99,379 | (2,522 | ) | 95,595 | (6,306 | ) | ||||||||||||||||||||||||||||
| 7,913 | 8,421 | 508 | 9,410 | 1,497 | Total Management & Accounting F | 101,901 | 99,379 | (2,522 | ) | 95,595 | (6,306 | ) | ||||||||||||||||||||||||||||
| 0 | 0 | 0 | 0 | 0 | 615700 - Environmental Expenses | 0 | 0 | 0 | 5 | 5 | ||||||||||||||||||||||||||||||
| 0 | 0 | 0 | 0 | 0 | Total Property Upgrades | 0 | 0 | 0 | 5 | 5 | ||||||||||||||||||||||||||||||
| 7,913 | 8,421 | 508 | 9,410 | 1,497 | Management, Acctg & Oth Fees | 101,901 | 99,379 | (2,522 | ) | 95,599 | (6,302 | ) | ||||||||||||||||||||||||||||
| 45,059 | 87,807 | (42,748 | ) | 77,424 | (32,365 | ) | Property Net Operating Income | 945,975 | 1,013,104 | (67,129 | ) | 994,356 | (48,381 | ) | ||||||||||||||||||||||||||
| 0 | 0 | 0 | 157,091 | 157,091 | 654215 - Insurance Damage Expense | (103,924 | ) | 0 | 103,924 | 219,222 | 323,146 | |||||||||||||||||||||||||||||
| 0 | 0 | 0 | 0 | 0 | 915000 - Casualty Basis Write-Off | (250,000 | ) | 0 | 250,000 | 0 | 250,000 | |||||||||||||||||||||||||||||
| 0 | 0 | 0 | 157,091 | 157,091 | Total Casualty G/L | (353,924 | ) | 0 | 353,924 | 219,222 | 573,146 | |||||||||||||||||||||||||||||
| 6,262 | 0 | (6,262 | ) | 4,222 | (2,040 | ) | 662000 - Deprec. - Buildings | 56,244 | 0 | (56,244 | ) | 58,826 | 2,582 | |||||||||||||||||||||||||||
| 11,268 | 1,942 | (9,326 | ) | 10,652 | (616 | ) | 666000 - Deprec. - Furnishings | 132,896 | 12,274 | (120,622 | ) | 102,441 | (30,455 | ) | ||||||||||||||||||||||||||
| 17,529 | 1,942 | (15,587 | ) | 14,874 | (2,655 | ) | Total Depreciation Expense | 189,140 | 12,274 | (176,866 | ) | 161,266 | (27,873 | ) | ||||||||||||||||||||||||||
| 0 | 12 | 12 | 0 | 0 | 834000 - Legal | 302 | 146 | (156 | ) | 81 | (221 | ) | ||||||||||||||||||||||||||||
| (156 | ) | 0 | 156 | 0 | 156 | 834500 - Prof Exp | 348 | 0 | (348 | ) | 0 | (348 | ) | |||||||||||||||||||||||||||
| (156 | ) | 12 | 168 | 0 | 156 | Total Partnership Legal | 650 | 146 | (504 | ) | 81 | (569 | ) | |||||||||||||||||||||||||||
| 0 | 0 | 0 | 0 | 0 | 831600 - Txs Fees & Lic | 119 | 0 | (119 | ) | 0 | (119 | ) | ||||||||||||||||||||||||||||
| 0 | 0 | 0 | 0 | 0 | 839000 - Partnership Misc Exp | 800 | 0 | (800 | ) | 0 | (800 | ) | ||||||||||||||||||||||||||||
| 0 | 0 | 0 | 0 | 0 | 931 000 -Office Payroll | 0 | 7,212 | 7,212 | 7,212 | 7,212 | ||||||||||||||||||||||||||||||
© 2007 CB Richard Ellis, Inc.
7
Table of Contents
| AIMCO Statement of Operations — Detail | ||||
| 000500 — Presidential House | ||||
| For the Period Ended December 2006 (12OSD1) | ||||
| APPLICATION :AIMCOPROPERTY | Run Date: 4/27/2007 9:33 AM | USER ID: gcoalson | ||
| Current | Current | Current | Previous Yr | Previous Yr | Current | Current | Current | Previous | Previous Yr | |||||||||||||||||||||||||||||||
| Month | Month | Month | Month | Cur Month | YTD | YTD | YTD | Year | Current YTD | |||||||||||||||||||||||||||||||
| Actual | Budget | Variance | Actual | Variance | Actual | Budget | Variance | Actual | Variance | |||||||||||||||||||||||||||||||
| 0 | 0 | 0 | 0 | 0 | Total Partnership Other Expense | 919 | 7,212 | 6,292 | 7,212 | 6,292 | ||||||||||||||||||||||||||||||
| (156 | ) | 12 | 168 | 0 | 156 | Total Partnership Expense | 1,570 | 7,358 | 5,788 | 7,293 | 5,723 | |||||||||||||||||||||||||||||
| 48,529 | 0 | (48,529 | ) | 0 | (48,529 | ) | 671205 - Non-Capitalized Redevelopmer | 48,529 | 0 | (48,529 | ) | 0 | (48,529 | ) | ||||||||||||||||||||||||||
| 0 | 0 | 0 | 0 | 0 | 793100 -Grant Expense | 312 | 0 | (312 | ) | 0 | (312 | ) | ||||||||||||||||||||||||||||
| 48,529 | 0 | (48,529 | ) | 0 | (48,529 | ) | Total Other Non-Controllable Expe | 48,841 | 0 | (48,841 | ) | 0 | (48,841 | ) | ||||||||||||||||||||||||||
| 105,221 | 40,382 | (64,839 | ) | 203,552 | 98,330 | Total Noncontrollable Operating E) | 369,985 | 479,099 | 109,115 | 740,752 | 370,768 | |||||||||||||||||||||||||||||
| 182,732 | 84,981 | (97,750 | ) | 261,467 | 78,735 | Total Operating Expenses | 1,026,013 | 1,023,143 | (2,870 | ) | 1,312,049 | 286,036 | ||||||||||||||||||||||||||||
| (20,843 | ) | 85,853 | (106,696 | ) | (94,541 | ) | 73,698 | Operating Income | 1,060,349 | 993,472 | 66,876 | 606,575 | 453,774 | |||||||||||||||||||||||||||
NON-OPERATING EXPENSES | ||||||||||||||||||||||||||||||||||||||||
| 701 | 58 | (643 | ) | 702 | 0 | 916003- Amort DLC - 1st | 8,418 | 702 | (7,716 | ) | 8,418 | 0 | ||||||||||||||||||||||||||||
| 192 | 16 | (176 | ) | 192 | 0 | 916023 - Amort DLC — Other | 2,304 | 192 | (2,112 | ) | 2,304 | 0 | ||||||||||||||||||||||||||||
| 893 | 74 | (819 | ) | 893 | 0 | Total Property Amort Def Loan Exp | 10,722 | 894 | (9,828 | ) | 10,722 | 0 | ||||||||||||||||||||||||||||
| 0 | 0 | 0 | 0 | 0 | 681114 -Interest on Corp AR | 842 | 0 | (842 | ) | 0 | (842 | ) | ||||||||||||||||||||||||||||
| 23,182 | 23,182 | 0 | 24,085 | 903 | 682001 - Interest Expense Secured Fixec | 282,315 | 283,225 | 910 | 292,840 | 10,525 | ||||||||||||||||||||||||||||||
| 5,619 | 5,619 | 0 | 5,886 | 268 | 682002 - Interest Expense Secured Fixec | 68,644 | 68,915 | 271 | 71,789 | 3,145 | ||||||||||||||||||||||||||||||
| 28,801 | 28,801 | 0 | 29,972 | 1,171 | Total Property Mortgage Expense | 351,801 | 352,140 | 339 | 364,629 | 12,828 | ||||||||||||||||||||||||||||||
| 0 | 0 | 0 | 0 | 0 | 832037 - Construction Period Interest | (11,072 | ) | 0 | 11,072 | (2,204 | ) | 8,868 | ||||||||||||||||||||||||||||
| 0 | 0 | 0 | 0 | 0 | Total CAP Interest | (11,072 | ) | 0 | 11,072 | (2,204 | ) | 8,868 | ||||||||||||||||||||||||||||
| 0 | 0 | 0 | 0 | 0 | 682099 - Misc Fin Exp | 0 | 0 | 0 | 248 | 248 | ||||||||||||||||||||||||||||||
| 0 | 0 | 0 | 0 | 0 | Total Financial Expense | 0 | 0 | 0 | 248 | 248 | ||||||||||||||||||||||||||||||
| 29,694 | 28,875 | (819 | ) | 30,865 | 1,171 | Total Interest Expense | 351,451 | 353,034 | 1,583 | 373,395 | 21,945 | |||||||||||||||||||||||||||||
| (238 | ) | 0 | 238 | (232 | ) | 7 | 545000 - IN Cone Interest Income | (2,967 | ) | 0 | 2,967 | (3,044 | ) | (76 | ) | |||||||||||||||||||||||||
| (238 | ) | 0 | 238 | (232 | ) | 7 | Total Interest Income | (2,967 | ) | 0 | 2,967 | (3,044 | ) | (76 | ) | |||||||||||||||||||||||||
| 29,456 | 28,875 | (581 | ) | 30,634 | 1,178 | Total Non-Operating Expenses | 348,484 | 353,034 | 4,550 | 370,352 | 21,868 | |||||||||||||||||||||||||||||
| (50,299 | ) | 56,978 | (107,277 | ) | (125,175 | ) | 74,875 | Net Income(Loss) | 711,865 | 640,439 | 71,426 | 236,223 | 475,642 | |||||||||||||||||||||||||||
© 2007 CB Richard Ellis, Inc.
8
Table of Contents
| AIMCO Statement of Operations — Detail | ||||
| 000500 — Presidential House | ||||
| For the Period Ended December 2005 (12OSD2) | ||||
| APPLICATION :AIMCOPROPERTY | Run Date: 4/27/2007 9:19 AM | USER ID: gcoalson | ||
| Current | Current | Current | Previous Yr | Previous Yr | Current | Current | Current | Previous | Previous Yr | |||||||||||||||||||||||||||||||
| Month | Month | Month | Month | Cur Month | YTD | YTD | YTD | Year | Current YTD | |||||||||||||||||||||||||||||||
| Actual | Budget | Variance | Actual | Variance | Actual | Budget | Variance | Actual | Variance | |||||||||||||||||||||||||||||||
INCOME | ||||||||||||||||||||||||||||||||||||||||
| 186,437 | 157,249 | 29,188 | 169,707 | 16,730 | 500000 - Market Rent | 2,224,864 | 1,862,045 | 362,819 | 1,911,954 | 312,910 | ||||||||||||||||||||||||||||||
| (8,258 | ) | 0 | (8,258 | ) | (10,354 | ) | 2,096 | 500001 - Leases Under/Over Schedule | (186,576 | ) | 0 | (186,576 | ) | (49,311 | ) | (137,265 | ) | |||||||||||||||||||||||
| 0 | 0 | 0 | 0 | 0 | 500500 - Rent — Right Price Adjustment | 0 | 0 | 0 | (2,555 | ) | 2,555 | |||||||||||||||||||||||||||||
| (829 | ) | 0 | (829 | ) | (563 | ) | (266 | ) | 500501 - Renewal Price Adjustment | (4,618 | ) | 0 | (4,618 | ) | (30,981 | ) | 26,362 | |||||||||||||||||||||||
| 12 | 113 | (101 | ) | 239 | (227 | ) | 512300 - Commercial Rent | 1,453 | 1,338 | 115 | 1,515 | (62 | ) | |||||||||||||||||||||||||||
| 177,362 | 157,362 | 19,999 | 159,029 | 18,333 | Non-subsidized Rental Income | 2,035,123 | 1,863,383 | 171,740 | 1,830,623 | 204,500 | ||||||||||||||||||||||||||||||
| 177,362 | 157,362 | 19,999 | 159,029 | 18,333 | Total Gross Potential Rent | 2,035,123 | 1,863,383 | 171,740 | 1,830,623 | 204,500 | ||||||||||||||||||||||||||||||
| 0 | 0 | 0 | 54 | (54 | ) | 519100 - Concessions Reimbursement | 0 | 0 | 0 | 54 | (54 | ) | ||||||||||||||||||||||||||||
| (264 | ) | 0 | (264 | ) | (617 | ) | 353 | 625002 - Concessions/Special Promotior | (3,494 | ) | 0 | (3,494 | ) | (10,559 | ) | 7,064 | ||||||||||||||||||||||||
| (11,051 | ) | 0 | (11,051 | ) | (3,631 | ) | (7,420 | ) | 625005 - Renewal Concession | (98,387 | ) | 0 | (98,387 | ) | (20,135 | ) | (78,252 | ) | ||||||||||||||||||||||
| (270 | ) | 0 | (270 | ) | 0 | (270 | ) | 625006 - Discount — Residents Monthly | (2,460 | ) | 0 | (2,460 | ) | 0 | (2,460 | ) | ||||||||||||||||||||||||
| 385 | 0 | 385 | (173 | ) | 558 | 625009 - Concession Amortization | 1,522 | 0 | 1,522 | (161 | ) | 1,682 | ||||||||||||||||||||||||||||
| (11,200 | ) | 0 | (11,200 | ) | (4,367 | ) | (6,833 | ) | Total Concessions | (102,820 | ) | 0 | (102,820 | ) | (30,801 | ) | (72,019 | ) | ||||||||||||||||||||||
| (2,207 | ) | (6,364 | ) | 4,157 | (3,107 | ) | 900 | 522000 - Vacancy Loss | (47,814 | ) | (71,207 | ) | 23,393 | (107,151 | ) | 59,336 | ||||||||||||||||||||||||
| (2,207 | ) | (6,364 | ) | 4,157 | (3,107 | ) | 900 | Total Vacancy Loss | (47,814 | ) | (71,207 | ) | 23,393 | (107,151 | ) | 59,336 | ||||||||||||||||||||||||
| (13,407 | ) | (6,364 | ) | (7,043 | ) | (7,474 | ) | (5,932 | ) | Total Rental Loss | (150,634 | ) | (71,207 | ) | (79,427 | ) | (137,951 | ) | (12,683 | ) | ||||||||||||||||||||
| 163,955 | 150,999 | 12,956 | 151,554 | 12,401 | Net Rental Income | 1,884,489 | 1,792,176 | 92,314 | 1,692,672 | 191,817 | ||||||||||||||||||||||||||||||
| 0 | 17 | (17 | ) | 0 | 0 | 590508 - Resident Util Pymts: Electricity | 163 | 239 | (76 | ) | 222 | (59 | ) | |||||||||||||||||||||||||||
| 0 | 17 | (17 | ) | 0 | 0 | Total Utility Payments from Reside | 163 | 239 | (76 | ) | 222 | (59 | ) | |||||||||||||||||||||||||||
| 2,746 | 1,200 | 1,546 | 1,335 | 1,411 | 591000 - Laundry Income | 16,394 | 14,400 | 1,994 | 12,348 | 4,046 | ||||||||||||||||||||||||||||||
| 2,677 | 600 | 2,077 | 0 | 2,677 | 591007 -AS -Cable TV | 9,399 | 7,200 | 2,199 | 7,444 | 1,954 | ||||||||||||||||||||||||||||||
| 412 | 120 | 292 | 471 | (59 | ) | 591008 - AS — Local Telephone | 1,859 | 1,440 | 419 | 1,881 | (22 | ) | ||||||||||||||||||||||||||||
| 18 | 0 | 18 | (123 | ) | 140 | 591 01 1 - Soft Drink Vending | 123 | 0 | 123 | (121 | ) | 245 | ||||||||||||||||||||||||||||
| 5,852 | 1,920 | 3,932 | 1,683 | 4,169 | Total Ancillary Services Income | 27,775 | 23,040 | 4,735 | 21,552 | 6,223 | ||||||||||||||||||||||||||||||
| 7 | (126 | ) | 133 | 300 | (293 | ) | 500005 - Month to Month Fee | 2,107 | 2,253 | (146 | ) | 2,600 | (493 | ) | ||||||||||||||||||||||||||
| 0 | 0 | 0 | 0 | 0 | 500006 - Short Term Lease Fee | 0 | 925 | (925 | ) | 903 | (903 | ) | ||||||||||||||||||||||||||||
| 1,220 | 1,000 | 220 | 1,780 | (560 | ) | 592001 - Late Charges | 20,909 | 12,000 | 8,909 | 20,341 | 569 | |||||||||||||||||||||||||||||
| 120 | 125 | (5 | ) | 120 | 0 | 592002 - NSF Charges | 2,129 | 1,500 | 629 | 1,600 | 529 | |||||||||||||||||||||||||||||
| 0 | 0 | 0 | 0 | 0 | 592006 - Keys, Locks, Lock Changes | 50 | 0 | 50 | 0 | 50 | ||||||||||||||||||||||||||||||
| 0 | 25 | (25 | ) | 0 | 0 | 592009 - Miscellaneous Resident Charge | 373 | 300 | 73 | 75 | 298 | |||||||||||||||||||||||||||||
© 2007 CB Richard Ellis, Inc.
1
Table of Contents
| AIMCO Statement of Operations — Detail | ||||
| 000500 — Presidential House | ||||
| For the Period Ended December 2005 (12OSD2) | ||||
| APPLICATION :AIMCOPROPERTY | Run Date: 4/27/2007 9:19 AM | USER ID: gcoalson |
| Current | Current | Current | Previous Yr | Previous Yr | Current | Current | Current | Previous | Previous Yr | |||||||||||||||||||||||||||||||
| Month | Month | Month | Month | Cur Month | YTD | YTD | YTD | Year | Current YTD | |||||||||||||||||||||||||||||||
| Actual | Budget | Variance | Actual | Variance | Actual | Budget | Variance | Actual | Variance | |||||||||||||||||||||||||||||||
| 800 | 328 | 472 | 1,200 | (400 | ) | 592010 - Non-refundable Admin Fees | 6,400 | 8,318 | (1,918 | ) | 7,400 | (1,000 | ) | |||||||||||||||||||||||||||
| 230 | 109 | 121 | 1,215 | (985 | ) | 593000 - Cleaning & Damage Fees | 1,973 | 2,788 | (815 | ) | 6,320 | (4,347 | ) | |||||||||||||||||||||||||||
| 0 | 0 | 0 | 741 | (741 | ) | 593002 - Pet Damage Charges | 563 | 0 | 563 | 741 | (178 | ) | ||||||||||||||||||||||||||||
| 300 | 75 | 225 | 227 | 73 | 599002 - Legal Fees | 1,987 | 900 | 1,087 | 846 | 1,141 | ||||||||||||||||||||||||||||||
| 0 | 14 | (14 | ) | 0 | 0 | 599003 - Non-refundable Pet Fees | 0 | 347 | (347 | ) | 300 | (300 | ) | |||||||||||||||||||||||||||
| 2,133 | 750 | 1,383 | 2,754 | (621 | ) | 599004 - Lease Cancellation Fees | 12,611 | 9,000 | 3,611 | 14,514 | (1,903 | ) | ||||||||||||||||||||||||||||
| 390 | 136 | 254 | 455 | (65 | ) | 599005 - Application Fees | 3,900 | 3,444 | 456 | 3,310 | 590 | |||||||||||||||||||||||||||||
| 0 | 50 | (50 | ) | 32 | (32 | ) | 599013 - Monthly Pet Rent | 186 | 600 | (414 | ) | 409 | (223 | ) | ||||||||||||||||||||||||||
| (620 | ) | 0 | (620 | ) | 0 | (620 | ) | 599014 - Contra Lease Cancellation Fees | (6,463 | ) | 0 | (6,463 | ) | 0 | (6,463 | ) | ||||||||||||||||||||||||
| 0 | 50 | (50 | ) | 441 | (441 | ) | 599099 - Miscellaneous Income | 0 | 600 | (600 | ) | 1,072 | (1,072 | ) | ||||||||||||||||||||||||||
| 0 | 0 | 0 | 0 | 0 | 599200 - Fee Adjustments | (25 | ) | 0 | (25 | ) | 0 | (25 | ) | |||||||||||||||||||||||||||
| 4,580 | 2,535 | 2,046 | 9,264 | (4,684 | ) | Total Miscellaneous Income | 46,700 | 42,975 | 3,726 | 60,429 | (13,729 | ) | ||||||||||||||||||||||||||||
| 10,432 | 4,472 | 5,961 | 10,947 | (515 | ) | Total Other Income | 74,639 | 66,254 | 8,385 | 82,203 | (7,565 | ) | ||||||||||||||||||||||||||||
| (3,053 | ) | (2,363 | ) | (690 | ) | (6,311 | ) | 3,258 | 637000 - Bad Debt Expense | (28,717 | ) | (28,257 | ) | (460 | ) | (40,819 | ) | 12,102 | ||||||||||||||||||||||
| 0 | 177 | (177 | ) | 0 | 0 | 637001 - Bad Debt Collections | 0 | 2,119 | (2,119 | ) | 0 | 0 | ||||||||||||||||||||||||||||
| 0 | 0 | 0 | 0 | 0 | 637003 - Bad Debt Collection: Profession | 1,208 | 0 | 1,208 | 0 | 1,208 | ||||||||||||||||||||||||||||||
| (4,408 | ) | (95 | ) | (4,314 | ) | (2,009 | ) | (2,399 | ) | 637005 - Bank Reconciliation Adjustment | (12,995 | ) | (1,130 | ) | (11,865 | ) | (2,567 | ) | (10,428 | ) | ||||||||||||||||||||
| (7,462 | ) | (2,281 | ) | (5,181 | ) | (8,321 | ) | 859 | Total Bad Debt Expense | (40,504 | ) | (27,268 | ) | (13,236 | ) | (43,385 | ) | 2,881 | ||||||||||||||||||||||
| 166,926 | 153,190 | 13,736 | 154,181 | 12,745 | Effective Gross Income | 1,918,624 | 1,831,162 | 87,462 | 1,731,490 | 187,134 | ||||||||||||||||||||||||||||||
OPERATING EXPENSES | ||||||||||||||||||||||||||||||||||||||||
| 4,293 | 55 | (4,238 | ) | 0 | (4,293 | ) | 615600 - Fire Protection | 7,225 | 658 | (6,568 | ) | 645 | (6,580 | ) | ||||||||||||||||||||||||||
| 4,293 | 55 | (4,238 | ) | 0 | (4,293 | ) | Common Area Expense | 7,225 | 658 | (6,568 | ) | 645 | (6,580 | ) | ||||||||||||||||||||||||||
| 791 | 750 | (41 | ) | 0 | (791 | ) | 645001 - Electricity — Vacant | 6,121 | 9,000 | 2,879 | 9,019 | 2,898 | ||||||||||||||||||||||||||||
| 4,488 | 2,000 | (2,488 | ) | 1,681 | (2,807 | ) | 645003 - Electricity — List Bills | 26,282 | 24,000 | (2,282 | ) | 22,346 | (3,936 | ) | ||||||||||||||||||||||||||
| 0 | 0 | 0 | 0 | 0 | 645004 - Utility | 0 | 0 | 0 | (373 | ) | (373 | ) | ||||||||||||||||||||||||||||
| 1,331 | 1,400 | 69 | 996 | (335 | ) | 645100 - Water | 13,240 | 16,800 | 3,560 | 16,165 | 2,925 | |||||||||||||||||||||||||||||
| 3,050 | 2,000 | (1,050 | ) | 2,126 | (924 | ) | 645203 - Gas — List Bills | 30,489 | 24,000 | (6,489 | ) | 20,775 | (9,714 | ) | ||||||||||||||||||||||||||
| 4,209 | 2,200 | (2,009 | ) | 1,492 | (2,717 | ) | 645300 - Sewer | 39,044 | 26,400 | (12,644 | ) | 25,180 | (13,865 | ) | ||||||||||||||||||||||||||
| 68 | 0 | (68 | ) | 0 | (68 | ) | 647000 - Fees, Penalties — Utilities | 139 | 0 | (139 | ) | 0 | (139 | ) | ||||||||||||||||||||||||||
| 30 | 200 | 171 | 0 | (30 | ) | 649000 - Misc Utility Charges | 86 | 2,400 | 2,314 | 2,429 | 2,343 | |||||||||||||||||||||||||||||
| 13,965 | 8,550 | (5,415 | ) | 6,294 | (7,671 | ) | Total Utilities Expense | 115,400 | 102,600 | (12,800 | ) | 95,541 | (19,860 | ) | ||||||||||||||||||||||||||
| 100 | 150 | 50 | 0 | (100 | ) | 631701 - Contract Common Area Cleaning | 413 | 1,800 | 1,387 | 2,020 | 1,607 | |||||||||||||||||||||||||||||
| 254 | 260 | 6 | 254 | 0 | 651900 - Contract Exterminating | 3,381 | 3,120 | (261 | ) | 3,116 | (264 | ) | ||||||||||||||||||||||||||||
© 2007 CB Richard Ellis, Inc.
2
Table of Contents
| AIMCO Statement of Operations — Detail | ||||
| 000500 — Presidential House | ||||
| For the Period Ended December 2005 (12OSD2) | ||||
| APPLICATION :AIMCOPROPERTY | Run Date: 4/27/2007 9:19 AM | USER ID: gcoalson |
| Current | Current | Current | Previous Yr | Previous Yr | Current | Current | Current | Previous | Previous Yr | |||||||||||||||||||||||||||||||
| Month | Month | Month | Month | Cur Month | YTD | YTD | YTD | Year | Current YTD | |||||||||||||||||||||||||||||||
| Actual | Budget | Variance | Actual | Variance | Actual | Budget | Variance | Actual | Variance | |||||||||||||||||||||||||||||||
| 1,605 | 1,600 | (5 | ) | 1,962 | 357 | 652500 - Contract Trash Removal | 22,988 | 19,200 | (3,788 | ) | 20,784 | (2,203 | ) | |||||||||||||||||||||||||||
| 528 | 0 | (528 | ) | 0 | (528 | ) | 653002 - Contract Courtesy Patrol | 3,237 | 0 | (3,237 | ) | 272 | (2,964 | ) | ||||||||||||||||||||||||||
| 0 | 0 | 0 | 119 | 119 | 653004 - Contract Alarm System | 251 | 0 | (251 | ) | 711 | 459 | |||||||||||||||||||||||||||||
| 0 | 20 | 20 | 0 | 0 | 653005 - Alarm Repair | 0 | 236 | 236 | 119 | 119 | ||||||||||||||||||||||||||||||
| 0 | 1,100 | 1,100 | 0 | 0 | 653700 - Contract Yards and Grounds | 2,812 | 13,200 | 10,388 | 8,517 | 5,705 | ||||||||||||||||||||||||||||||
| 0 | 500 | 500 | 0 | 0 | 654200 - Contract Repairs | 1,992 | 6,000 | 4,008 | 8,981 | 6,989 | ||||||||||||||||||||||||||||||
| 0 | 0 | 0 | 0 | 0 | 654202 - Maintenance Contract | 0 | 0 | 0 | 1,562 | 1,562 | ||||||||||||||||||||||||||||||
| 0 | 100 | 100 | 0 | 0 | 654302 - Electrical — Contract | 0 | 1,200 | 1,200 | 1,236 | 1,236 | ||||||||||||||||||||||||||||||
| 150 | 50 | (100 | ) | 0 | (150 | ) | 654402 - Plumbing Contract | 956 | 600 | (356 | ) | 521 | (435 | ) | ||||||||||||||||||||||||||
| 657 | 563 | (94 | ) | 542 | (115 | ) | 654501 - Contract Elevator | 6,752 | 6,661 | (91 | ) | 6,504 | (248 | ) | ||||||||||||||||||||||||||
| 0 | 0 | 0 | 0 | 0 | 654602 - Contract HVAC | 0 | 0 | 0 | 180 | 180 | ||||||||||||||||||||||||||||||
| 1,044 | 275 | (769 | ) | 255 | (789 | ) | 654702 - Pool Contract | 3,269 | 3,300 | 31 | 3,145 | (124 | ) | |||||||||||||||||||||||||||
| 0 | 0 | 0 | 0 | 0 | 669900 - Other Contracts | 67 | 382 | 314 | 375 | 307 | ||||||||||||||||||||||||||||||
| 4,337 | 4,618 | 280 | 3,132 | (1,205 | ) | Total Contract Service | 46,117 | 55,699 | 9,582 | 58,044 | 11,927 | |||||||||||||||||||||||||||||
| 0 | 66 | 66 | 0 | 0 | 612800 - Irrigation Maint | 211 | 791 | 580 | 776 | 565 | ||||||||||||||||||||||||||||||
| 0 | 50 | 50 | 0 | 0 | 617600 - Window & Glass Repair | 86 | 600 | 514 | 649 | 563 | ||||||||||||||||||||||||||||||
| 89 | 150 | 61 | 0 | (89 | ) | 651500 - Cleaning Supplies | 367 | 1,800 | 1,433 | 1,357 | 990 | |||||||||||||||||||||||||||||
| 20 | 2 | (18 | ) | 0 | (20 | ) | 652300 - Gas/Oil/Mileage | 111 | 27 | (84 | ) | 26 | (85 | ) | ||||||||||||||||||||||||||
| 0 | 155 | 155 | 0 | 0 | 652501 - Dumpster Expense | 176 | 1,860 | 1,684 | 980 | 804 | ||||||||||||||||||||||||||||||
| 0 | 25 | 25 | 0 | 0 | 653600 - Landscaping Supplies | 84 | 300 | 216 | 110 | 26 | ||||||||||||||||||||||||||||||
| 81 | 0 | (81 | ) | 0 | (81 | ) | 654003 - Handyman Materials | 117 | 0 | (117 | ) | 0 | (117 | ) | ||||||||||||||||||||||||||
| 10 | 38 | 28 | 0 | (10 | ) | 654004 - Handyman — Other Materials | 494 | 459 | (35 | ) | 0 | (494 | ) | |||||||||||||||||||||||||||
| 248 | 284 | 36 | 0 | (248 | ) | 654100 - Repairs/Maint. — Materials | 2,383 | 948 | (1,435 | ) | 329 | (2,054 | ) | |||||||||||||||||||||||||||
| 586 | 300 | (286 | ) | 69 | (518 | ) | 654101 - Electrical Supplies | 3,198 | 3,600 | 402 | 3,380 | 182 | ||||||||||||||||||||||||||||
| 1,286 | 300 | (986 | ) | 134 | (1,152 | ) | 654102 - Plumbing Supplies | 4,807 | 3,600 | (1,207 | ) | 2,911 | (1,896 | ) | ||||||||||||||||||||||||||
| 133 | 100 | (33 | ) | 21 | (112 | ) | 654103 - Appliance Parts | 903 | 1,200 | 297 | 1,342 | 440 | ||||||||||||||||||||||||||||
| 0 | 5 | 5 | 0 | 0 | 654104 - Equipment Rental/Repair | 6 | 17 | 11 | 0 | (6 | ) | |||||||||||||||||||||||||||||
| 325 | 200 | (125 | ) | 0 | (325 | ) | 654105 - Plumbing Fixtures/Repairs | 2,210 | 2,400 | 190 | 1,031 | (1,179 | ) | |||||||||||||||||||||||||||
| 0 | 296 | 296 | 0 | 0 | 654109 - Window Replacement | 110 | 1,927 | 1,817 | 1,331 | 1,220 | ||||||||||||||||||||||||||||||
| 147 | 75 | (72 | ) | 0 | (147 | ) | 654120 - Keys and Locks | 626 | 900 | 274 | 880 | 254 | ||||||||||||||||||||||||||||
| 237 | 350 | 113 | 0 | (237 | ) | 654199 - Other Maintenance Materials | 2,149 | 4,200 | 2,051 | 3,516 | 1,367 | |||||||||||||||||||||||||||||
| 41 | 50 | 9 | 0 | (41 | ) | 654206 - Exterior Building Improvements | 3,138 | 600 | (2,538 | ) | 713 | (2,425 | ) | |||||||||||||||||||||||||||
| 0 | 0 | 0 | 140 | 140 | 654207 - Paving/Concrete/Striping | 0 | 0 | 0 | 385 | 385 | ||||||||||||||||||||||||||||||
| 0 | 10 | 10 | 0 | 0 | 654232 - Limited Access Gate Repairs | 0 | 120 | 120 | 55 | 55 | ||||||||||||||||||||||||||||||
| 0 | 44 | 44 | 0 | 0 | 654500 - Elevator Expense | 610 | 530 | (80 | ) | 520 | (90 | ) | ||||||||||||||||||||||||||||
| 330 | 250 | (80 | ) | 35 | (295 | ) | 654601 - HVAC Parts & Supplies | 2,354 | 3,000 | 646 | 1,969 | (385 | ) | |||||||||||||||||||||||||||
| 495 | 50 | (445 | ) | 0 | (495 | ) | 654700 - Pool Expense | 648 | 600 | (48 | ) | 349 | (298 | ) | ||||||||||||||||||||||||||
| 0 | 36 | 36 | 0 | 0 | 654903 - Doors | 37 | 434 | 397 | 311 | 273 | ||||||||||||||||||||||||||||||
| 84 | (200 | ) | (284 | ) | 562 | 477 | 655200 - R & M Rebate — MRO | (1,767 | ) | (2,400 | ) | (633 | ) | (2,107 | ) | (340 | ) | |||||||||||||||||||||||
| (282 | ) | (75 | ) | 207 | 35 | 317 | 655201 - R & M Rebate — Other | (304 | ) | (900 | ) | (596 | ) | (596 | ) | (292 | ) | |||||||||||||||||||||||
| 232 | 50 | (182 | ) | 0 | (232 | ) | 656005 - Light Bulbs | 1,120 | 600 | (520 | ) | 520 | (600 | ) | ||||||||||||||||||||||||||
© 2007 CB Richard Ellis, Inc.
3
Table of Contents
| AIMCO Statement of Operations — Detail | ||||
| 000500 — Presidential House | ||||
| For the Period Ended December 2005 (12OSD2) | ||||
| APPLICATION :AIMCOPROPERTY | Run Date: 4/27/2007 9:19 AM | USER ID: gcoalson |
| Current | Current | Current | Previous Yr | Previous Yr | Current | Current | Current | Previous | Previous Yr | |||||||||||||||||||||||||||||||
| Month | Month | Month | Month | Cur Month | YTD | YTD | YTD | Year | Current YTD | |||||||||||||||||||||||||||||||
| Actual | Budget | Variance | Actual | Variance | Actual | Budget | Variance | Actual | Variance | |||||||||||||||||||||||||||||||
| 69 | 31 | (38 | ) | 0 | (69 | ) | 656300 - Misc. | 185 | 92 | (94 | ) | 25 | (161 | ) | ||||||||||||||||||||||||||
| 0 | 0 | 0 | 0 | 0 | 659001 - Fire Protection Equip Maint | 935 | 0 | (935 | ) | 0 | (935 | ) | ||||||||||||||||||||||||||||
| 4,131 | 2,643 | (1,488 | ) | 995 | (3,136 | ) | Total Repairs & Maintenance | 24,994 | 27,305 | 2,311 | 20,761 | (4,233 | ) | |||||||||||||||||||||||||||
| 910 | 600 | (310 | ) | 680 | (230 | ) | 651700 - Contract Cleaning | 5,063 | 7,200 | 2,137 | 5,710 | 647 | ||||||||||||||||||||||||||||
| 300 | 299 | (1 | ) | 190 | (110 | ) | 656002 - Contract Carpet Cleaning and D | 4,055 | 7,593 | 3,538 | 6,747 | 2,692 | ||||||||||||||||||||||||||||
| 2,325 | 764 | (1,561 | ) | 0 | (2,325 | ) | 656003 - Contract Painting — Interior | 19,812 | 19,407 | (405 | ) | 9,318 | (10,493 | ) | ||||||||||||||||||||||||||
| 0 | 47 | 47 | 0 | 0 | 656099 - Decorating — Contract Other | 280 | 1,202 | 922 | 1,040 | 760 | ||||||||||||||||||||||||||||||
| 0 | 29 | 29 | 0 | 0 | 656101 - Drapery/Miniblinds Repairs | 0 | 749 | 749 | 61 | 61 | ||||||||||||||||||||||||||||||
| 728 | 303 | (425 | ) | 17 | (711 | ) | 656102 - Painting Supplies | 7,831 | 7,695 | (135 | ) | 5,830 | (2,000 | ) | ||||||||||||||||||||||||||
| 4,263 | 2,043 | (2,220 | ) | 887 | (3,376 | ) | Total Turnover Expense | 37,040 | 43,845 | 6,805 | 28,706 | (8,334 | ) | |||||||||||||||||||||||||||
| 0 | 0 | 0 | 19 | 19 | 617104 - Radios/Pagers | 96 | 0 | (96 | ) | 663 | 567 | |||||||||||||||||||||||||||||
| 0 | 0 | 0 | 0 | 0 | 621008 - Newspaper Adv. — Personnel | 0 | 85 | 85 | 84 | 84 | ||||||||||||||||||||||||||||||
| 0 | 0 | 0 | 0 | 0 | 629001 - Dues and Subscriptions | 0 | 123 | 123 | 0 | 0 | ||||||||||||||||||||||||||||||
| 18 | 300 | 282 | 14 | (5 | ) | 631100 - Office Supplies | 1,953 | 3,600 | 1,647 | 2,708 | 755 | |||||||||||||||||||||||||||||
| 375 | 150 | (225 | ) | 392 | 17 | 631101 - Office Equipment | 1,426 | 1,800 | 374 | 1,636 | 210 | |||||||||||||||||||||||||||||
| 165 | 100 | (65 | ) | 334 | 170 | 631102 - Bank Charges | 1,909 | 1,200 | (709 | ) | 1,592 | (317 | ) | |||||||||||||||||||||||||||
| 504 | 350 | (154 | ) | 0 | (504 | ) | 631104 - Applicant Screening | 1,685 | 4,200 | 2,515 | 3,628 | 1,943 | ||||||||||||||||||||||||||||
| 90 | 75 | (15 | ) | 67 | (22 | ) | 631105 - Uniforms | 920 | 900 | (20 | ) | 585 | (335 | ) | ||||||||||||||||||||||||||
| 25 | 50 | 25 | 0 | (25 | ) | 631106 - Express Mail, Stamps | 507 | 600 | 93 | 455 | (52 | ) | ||||||||||||||||||||||||||||
| 345 | 300 | (45 | ) | 485 | 140 | 631108 - Credit Card Service Fees | 4,275 | 3,600 | (675 | ) | 4,123 | (152 | ) | |||||||||||||||||||||||||||
| 801 | 0 | (801 | ) | 0 | (801 | ) | 631111 - Resident Eviction/Separation | 801 | 0 | (801 | ) | 0 | (801 | ) | ||||||||||||||||||||||||||
| 0 | 100 | 100 | 0 | 0 | 632500 - Professional Fees | 141 | 1,200 | 1,059 | 2,794 | 2,653 | ||||||||||||||||||||||||||||||
| 0 | 0 | 0 | 0 | 0 | 633400 - Temp Agency Help | 0 | 0 | 0 | 5,596 | 5,596 | ||||||||||||||||||||||||||||||
| 140 | 200 | 60 | 313 | 173 | 634000 - Legal Fees | 6,451 | 2,400 | (4,051 | ) | 2,923 | (3,528 | ) | ||||||||||||||||||||||||||||
| 955 | 950 | (5 | ) | 856 | (99 | ) | 636000 - Telephone | 10,375 | 11,400 | 1,025 | 8,758 | (1,617 | ) | |||||||||||||||||||||||||||
| 0 | 5 | 5 | 0 | 0 | 639003 - Computer Lease | 225 | 59 | (166 | ) | 0 | (225 | ) | ||||||||||||||||||||||||||||
| 106 | 200 | 94 | 95 | (10 | ) | 639004 - Computer Maint & Supplies | 2,133 | 2,400 | 267 | 2,386 | 253 | |||||||||||||||||||||||||||||
| 8 | 0 | (8 | ) | 0 | (8 | ) | 639006 - Parking Expense | 42 | 0 | (42 | ) | 0 | (42 | ) | ||||||||||||||||||||||||||
| 0 | 150 | 150 | 0 | 0 | 639007 - Training & Travel | 1,632 | 1,800 | 168 | 1,589 | (43 | ) | |||||||||||||||||||||||||||||
| 309 | 250 | (59 | ) | 20 | (289 | ) | 639099 - Miscellaneous Administrative | 1,776 | 3,000 | 1,224 | 3,091 | 1,316 | ||||||||||||||||||||||||||||
| 0 | 100 | 100 | 0 | 0 | 655100 - Residnt Pmt Platform | 957 | 1,200 | 243 | 0 | (957 | ) | |||||||||||||||||||||||||||||
| 128 | 139 | 11 | 0 | (128 | ) | 656006 - Clubhouse Equip/Supplies | 794 | 1,668 | 874 | 1,467 | 673 | |||||||||||||||||||||||||||||
| 3,968 | 3,419 | (549 | ) | 2,596 | (1,372 | ) | Total Administrative Expenses | 38,096 | 41,236 | 3,139 | 44,077 | 5,981 | ||||||||||||||||||||||||||||
| 915 | 676 | (239 | ) | 676 | (240 | ) | 621003 - Periodicals | 3,966 | 8,112 | 4,146 | 8,538 | 4,572 | ||||||||||||||||||||||||||||
| 915 | 676 | (239 | ) | 676 | (240 | ) | Periodicals | 3,966 | 8,112 | 4,146 | 8,538 | 4,572 | ||||||||||||||||||||||||||||
| 524 | 662 | 138 | 662 | 138 | 611200 - Web Advertising | 6,439 | 7,944 | 1,505 | 5,569 | (870 | ) | |||||||||||||||||||||||||||||
| 524 | 662 | 138 | 662 | 138 | Internet Leads | 6,439 | 7,944 | 1,505 | 5,569 | (870 | ) | |||||||||||||||||||||||||||||
© 2007 CB Richard Ellis, Inc.
4
Table of Contents
| AIMCO Statement of Operations — Detail | ||||
| 000500 — Presidential House | ||||
| For the Period Ended December 2005 (12OSD2) | ||||
| APPLICATION :AIMCOPROPERTY | Run Date: 4/27/2007 9:19 AM | USER ID: gcoalson |
| Current | Current | Current | Previous Yr | Previous Yr | Current | Current | Current | Previous | Previous Yr | |||||||||||||||||||||||||||||||
| Month | Month | Month | Month | Cur Month | YTD | YTD | YTD | Year | Current YTD | |||||||||||||||||||||||||||||||
| Actual | Budget | Variance | Actual | Variance | Actual | Budget | Variance | Actual | Variance | |||||||||||||||||||||||||||||||
| 0 | 0 | 0 | 0 | 0 | 621001 - Newspaper Advertising | 0 | 0 | 0 | 767 | 767 | ||||||||||||||||||||||||||||||
| 0 | 0 | 0 | 0 | 0 | Newspapers | 0 | 0 | 0 | 767 | 767 | ||||||||||||||||||||||||||||||
| 1,500 | 1,500 | 0 | 300 | (1,200 | ) | 625001 - Referral Fees | 2,950 | 18,000 | 15,050 | 14,050 | 11,100 | |||||||||||||||||||||||||||||
| 0 | 200 | 200 | 0 | 0 | 625008 - Resident Referral Concessions | 9,000 | 2,400 | (6,600 | ) | 3,000 | (6,000 | ) | ||||||||||||||||||||||||||||
| 700 | (280 | ) | (980 | ) | 300 | (400 | ) | 625010 - Resident Referral Amortization | (1,900 | ) | (3,361 | ) | (1,461 | ) | (1,800 | ) | 100 | |||||||||||||||||||||||
| (1,233 | ) | 0 | 1,233 | 1,020 | 2,253 | 625012 - Referral Fee Amortization | 2,805 | (2,003 | ) | (4,808 | ) | (4,748 | ) | (7,553 | ) | |||||||||||||||||||||||||
| 968 | 1,420 | 452 | 1,620 | 653 | Apartment Brokers | 12,855 | 15,037 | 2,182 | 10,502 | (2,353 | ) | |||||||||||||||||||||||||||||
| 0 | 0 | 0 | 0 | 0 | 621004 - Radio & TV | 0 | 5 | 5 | 0 | 0 | ||||||||||||||||||||||||||||||
| 0 | 0 | 0 | 0 | 0 | 621013 - Leasing Promotions | 200 | 0 | (200 | ) | 1,651 | 1,451 | |||||||||||||||||||||||||||||
| 0 | 0 | 0 | 0 | 0 | Active Outreach | 200 | 5 | (195 | ) | 1,651 | 1,451 | |||||||||||||||||||||||||||||
| 0 | 200 | 200 | 177 | 177 | 611100 - Marketing Phone Services | 393 | 2,400 | 2,007 | 1,593 | 1,200 | ||||||||||||||||||||||||||||||
| 0 | 100 | 100 | 0 | 0 | 621007 - Brochures — New Leases | 0 | 1,200 | 1,200 | 1,392 | 1,392 | ||||||||||||||||||||||||||||||
| 0 | 50 | 50 | 0 | 0 | 621011 - Flags/Banners | 26 | 600 | 574 | 873 | 847 | ||||||||||||||||||||||||||||||
| 0 | 50 | 50 | 0 | 0 | 621012 - Move-in Gifts | 0 | 600 | 600 | 74 | 74 | ||||||||||||||||||||||||||||||
| 0 | 75 | 75 | 0 | 0 | 625000 - Signage | 30 | 900 | 870 | 0 | (30 | ) | |||||||||||||||||||||||||||||
| 0 | 0 | 0 | 0 | 0 | 626001 - Furniture — Models | �� | 0 | 0 | 0 | 783 | 783 | |||||||||||||||||||||||||||||
| 765 | 515 | (249 | ) | 252 | (513 | ) | 629002 - Phone Sales | 8,795 | 4,192 | (4,603 | ) | 1,382 | (7,413 | ) | ||||||||||||||||||||||||||
| 765 | 990 | 226 | 429 | (336 | ) | Point of Sale | 9,244 | 9,892 | 649 | 6,097 | (3,146 | ) | ||||||||||||||||||||||||||||
| 0 | 200 | 200 | 0 | 0 | 621015 - Resident Relations | 360 | 2,400 | 2,040 | 2,642 | 2,282 | ||||||||||||||||||||||||||||||
| 1,200 | 50 | (1,150 | ) | 0 | (1,200 | ) | 625007 - Resident Relations Concession | 1,915 | 600 | (1,315 | ) | 400 | (1,515 | ) | ||||||||||||||||||||||||||
| 0 | 100 | 100 | 0 | 0 | 625101 - Resident Functions | 0 | 400 | 400 | 40 | 40 | ||||||||||||||||||||||||||||||
| 1,200 | 350 | (850 | ) | 0 | (1,200 | ) | Retention | 2,274 | 3,400 | 1,126 | 3,081 | 807 | ||||||||||||||||||||||||||||
| 602 | 0 | (602 | ) | 0 | (602 | ) | 621099 - Advertising — Other | 1,669 | 0 | (1,669 | ) | 10 | (1,659 | ) | ||||||||||||||||||||||||||
| 602 | 0 | (602 | ) | 0 | (602 | ) | Other Marketing | 1,669 | 0 | (1,669 | ) | 10 | (1,659 | ) | ||||||||||||||||||||||||||
| 4,973 | 4,099 | (875 | ) | 3,387 | (1,587 | ) | Total Marketing Expense | 36,648 | 44,390 | 7,743 | 36,216 | (432 | ) | |||||||||||||||||||||||||||
| 2,215 | 4,658 | 2,443 | 4,175 | 1,960 | 621000 - Leasing Payroll | 44,987 | 55,900 | 10,913 | 13,741 | (31,246 | ) | |||||||||||||||||||||||||||||
| 1,620 | 1,194 | (426 | ) | 0 | (1,620 | ) | 627300 - Leasing Commissions | 12,220 | 14,119 | 1,899 | 9,923 | (2,298 | ) | |||||||||||||||||||||||||||
| (1,196 | ) | 0 | 1,196 | 1,677 | 2,873 | 627301 - Commission Amortization | 2,493 | 0 | (2,493 | ) | (2,938 | ) | (5,431 | ) | ||||||||||||||||||||||||||
| 1,500 | 1,200 | (300 | ) | 0 | (1,500 | ) | 627400 - Leasing Renewal Incentives | 11,380 | 14,400 | 3,020 | 11,860 | 481 | ||||||||||||||||||||||||||||
| 0 | 0 | 0 | 0 | 0 | 627500 - Coast-to-Coast Incentive | 0 | 102 | 102 | 100 | 100 | ||||||||||||||||||||||||||||||
| 0 | 0 | 0 | 0 | 0 | 627900 - Mentor/Referral/$1300 Club Bo | 0 | 33 | 33 | 33 | 33 | ||||||||||||||||||||||||||||||
| 3,544 | 0 | (3,544 | ) | 0 | (3,544 | ) | 631000 - Salaries — Administrative | 38,408 | 0 | (38,408 | ) | 24,040 | (14,368 | ) | ||||||||||||||||||||||||||
| 0 | 3,500 | 3,500 | 2,461 | 2,461 | 633000 - Salaries — Manager | 7,198 | 42,000 | 34,802 | 38,718 | 31,520 | ||||||||||||||||||||||||||||||
| 1,858 | 1,858 | 0 | 1,858 | 0 | 633100 - Employee Apartments | 21,470 | 22,296 | 826 | 13,827 | (7,643 | ) | |||||||||||||||||||||||||||||
| 0 | 0 | 0 | 0 | 0 | 653500 - Grnd Pr Payroll | 0 | 0 | 0 | 3,420 | 3,420 | ||||||||||||||||||||||||||||||
© 2007 CB Richard Ellis, Inc.
5
Table of Contents
| AIMCO Statement of Operations — Detail | ||||
| 000500 — Presidential House | ||||
| For the Period Ended December 2005 (12OSD2) | ||||
| APPLICATION :AIMCOPROPERTY | Run Date: 4/27/2007 9:19 AM | USER ID: gcoalson |
| Current | Current | Current | Previous Yr | Previous Yr | Current | Current | Current | Previous | Previous Yr | |||||||||||||||||||||||||||||||
| Month | Month | Month | Month | Cur Month | YTD | YTD | YTD | Year | Current YTD | |||||||||||||||||||||||||||||||
| Actual | Budget | Variance | Actual | Variance | Actual | Budget | Variance | Actual | Variance | |||||||||||||||||||||||||||||||
| 4,287 | 7,174 | 2,887 | 8,331 | 4,044 | 654000 - Salaries — Maintenance | 86,929 | 86,086 | (843 | ) | 85,369 | (1,560 | ) | ||||||||||||||||||||||||||||
| (40 | ) | 0 | 40 | 8,776 | 8,816 | 659800 - Payroll Adjustment | (10,562 | ) | 0 | 10,562 | 7,238 | 17,800 | ||||||||||||||||||||||||||||
| (206 | ) | (1,284 | ) | (1,077 | ) | (644 | ) | (437 | ) | 659900 - Repairs Payroll Capitalized | (11,190 | ) | (15,503 | ) | (4,313 | ) | (11,882 | ) | (692 | ) | ||||||||||||||||||||
| 1,211 | 1,356 | 145 | 1,285 | 74 | 671100 - Payroll Taxes | 18,393 | 18,371 | (22 | ) | 19,253 | 860 | |||||||||||||||||||||||||||||
| 0 | (1,240 | ) | (1,240 | ) | 0 | 0 | 671109 - Laundry Payroll Taxes | 0 | (14,984 | ) | (14,984 | ) | 0 | 0 | ||||||||||||||||||||||||||
| 1,185 | 932 | (253 | ) | 814 | (371 | ) | 672200 - Workers Compensation | 14,833 | 11,186 | (3,647 | ) | 9,130 | (5,703 | ) | ||||||||||||||||||||||||||
| 2,006 | 1,338 | (668 | ) | 1,465 | (541 | ) | 672300 - Health Ins. & Other Benefits | 25,187 | 16,061 | (9,126 | ) | 18,920 | (6,267 | ) | ||||||||||||||||||||||||||
| 0 | 0 | 0 | 438 | 438 | 831001 - Ranking Bonus | 4,585 | 0 | (4,585 | ) | 2,524 | (2,061 | ) | ||||||||||||||||||||||||||||
| 17,985 | 20,687 | 2,703 | 30,635 | 12,651 | Total Payroll Expense | 266,332 | 250,068 | (16,264 | ) | 243,277 | (23,055 | ) | ||||||||||||||||||||||||||||
| 0 | 0 | 0 | 0 | 0 | 659700 - Construction Period Operating | (556 | ) | 0 | 556 | 0 | 556 | |||||||||||||||||||||||||||||
| 0 | 0 | 0 | 0 | 0 | Total Construction Period Operating | (556 | ) | 0 | 556 | 0 | 556 | |||||||||||||||||||||||||||||
| 57,915 | 46,114 | (11,801 | ) | 47,927 | (9,989 | ) | Total Controllable Operating Expenses | 571,297 | 565,801 | (5,496 | ) | 527,266 | (44,030 | ) | ||||||||||||||||||||||||||
| 109,010 | 107,076 | 1,935 | 106,254 | 2,756 | Controllable NOI | 1,347,327 | 1,265,361 | 81,966 | 1,204,224 | 143,103 | ||||||||||||||||||||||||||||||
NON-CONTROLLABLE OPERATING EXPENSES | ||||||||||||||||||||||||||||||||||||||||
TAXES & INSURANCE | ||||||||||||||||||||||||||||||||||||||||
| 0 | 0 | 0 | 2,328 | 2,328 | 639002 - Ad Valorem Tax Service | 5,298 | 0 | (5,298 | ) | 26,690 | 21,392 | |||||||||||||||||||||||||||||
| 15,436 | 16,957 | 1,521 | 15,416 | (20 | ) | 671001 - Real Estate Taxes | 185,230 | 203,485 | 18,255 | 184,986 | (244 | ) | ||||||||||||||||||||||||||||
| 0 | 369 | 369 | 0 | 0 | 671002 - Personal Property Tax | 3,577 | 4,433 | 857 | 3,809 | 233 | ||||||||||||||||||||||||||||||
| 0 | 0 | 0 | 0 | 0 | 671003 - Real Estate Tax — Prior Year | 0 | 0 | 0 | 5,845 | 5,845 | ||||||||||||||||||||||||||||||
| 0 | 0 | 0 | 0 | 0 | 671005 - Tax Refund — Prior Years | (14,003 | ) | 0 | 14,003 | 0 | 14,003 | |||||||||||||||||||||||||||||
| 516 | 355 | (161 | ) | (826 | ) | (1,342 | ) | 671900 - Business Licenses and Permits | 2,313 | 4,264 | 1,951 | 3,678 | 1,365 | |||||||||||||||||||||||||||
| 4 | 4 | 0 | 4 | 0 | 671902 - Sales and Use Tax | 54 | 47 | (6 | ) | 50 | (3 | ) | ||||||||||||||||||||||||||||
| 0 | 0 | 0 | 0 | 0 | 832038 - Construction Period Taxes | (878 | ) | 0 | 878 | 0 | 878 | |||||||||||||||||||||||||||||
| 15,956 | 17,686 | 1,730 | 16,921 | 965 | Total Taxes | 181,590 | 212,229 | 30,639 | 225,058 | 43,467 | ||||||||||||||||||||||||||||||
| 6,002 | 7,796 | 1,794 | 7,796 | 1,794 | 672000 - Hazard Insurance | 75,635 | 93,555 | 17,920 | 94,241 | 18,606 | ||||||||||||||||||||||||||||||
| 108 | 63 | (45 | ) | 66 | (41 | ) | 672100 - Fidelity Bond Insurance | 823 | 750 | (73 | ) | 713 | (110 | ) | ||||||||||||||||||||||||||
| 111 | (105 | ) | (216 | ) | 38 | (73 | ) | 672900 - Other Insurance | (676 | ) | (1,259 | ) | (583 | ) | (1,197 | ) | (521 | ) | ||||||||||||||||||||||
| 6,221 | 7,754 | 1,533 | 7,900 | 1,680 | Total Insurance | 75,782 | 93,046 | 17,264 | 93,757 | 17,976 | ||||||||||||||||||||||||||||||
| 22,177 | 25,440 | 3,263 | 24,821 | 2,645 | Total Taxes & Insurance | 257,372 | 305,275 | 47,903 | 318,815 | 61,443 | ||||||||||||||||||||||||||||||
©2007 CB Richard Ellis, Inc.
6
Table of Contents
| AIMCO Statement of Operations — Detail | ||||
| 000500 — Presidential House | ||||
| For the Period Ended December 2005 (12OSD2) | ||||
| APPLICATION :AIMCOPROPERTY | Run Date: 4/27/2007 9:19 AM | USER ID: gcoalson |
| Current | Current | Current | Previous Yr | Previous Yr | Current | Current | Current | Previous | Previous Yr | |||||||||||||||||||||||||||||||
| Month | Month | Month | Month | Cur Month | YTD | YTD | YTD | Year | Current YTD | |||||||||||||||||||||||||||||||
| Actual | Budget | Variance | Actual | Variance | Actual | Budget | Variance | Actual | Variance | |||||||||||||||||||||||||||||||
| 86,834 | 81,636 | 5,197 | 81,433 | 5,401 | Reportable NOI | 1,089,955 | 960,086 | 129,869 | 885,409 | 204,546 | ||||||||||||||||||||||||||||||
OTHER NON-CONTROLLABLE OPERATING EXPENSES | ||||||||||||||||||||||||||||||||||||||||
| 0 | 0 | 0 | 0 | 0 | 625013 - Topside Comm/Ref Amortization | 0 | 0 | 0 | (7,044 | ) | (7,044 | ) | ||||||||||||||||||||||||||||
| 0 | 0 | 0 | 0 | 0 | Total Misc Non-Controllable Rev & | 0 | 0 | 0 | (7,044 | ) | (7,044 | ) | ||||||||||||||||||||||||||||
| 9,410 | 7,708 | (1,702 | ) | 8,028 | (1,381 | ) | 632000 - Management Fees | 95,595 | 91,598 | (3,997 | ) | 85,700 | (9,894 | ) | ||||||||||||||||||||||||||
| 9,410 | 7,708 | (1,702 | ) | 8,028 | (1,381 | ) | Total Management & Accounting F | 95,595 | 91,598 | (3,997 | ) | 85,700 | (9,894 | ) | ||||||||||||||||||||||||||
| 0 | 0 | 0 | 0 | 0 | 615700 - Environmental Expenses | 5 | 524 | 520 | 2,003 | 1,998 | ||||||||||||||||||||||||||||||
| 0 | 0 | 0 | 0 | 0 | Total Property Upgrades | 5 | 524 | 520 | 2,003 | 1,998 | ||||||||||||||||||||||||||||||
| 9,410 | 7,708 | (1,702 | ) | 8,028 | (1,381 | ) | Management, Acctg & Oth Fees | 95,599 | 92,123 | (3,477 | ) | 80,660 | (14,940 | ) | ||||||||||||||||||||||||||
| 77,424 | 73,929 | 3,496 | 73,404 | 4,020 | Property Net Operating Income | 994,356 | 867,963 | 126,392 | 804,749 | 189,606 | ||||||||||||||||||||||||||||||
| 157,091 | 0 | (157,091 | ) | 0 | (157,091 | ) | 654215 - Insurance Damage Expense | 219,222 | 0 | (219,222 | ) | 2,000 | (217,222 | ) | ||||||||||||||||||||||||||
| 0 | 0 | 0 | 0 | 0 | 915000 - Casualty Basis Write-Off | 0 | 0 | 0 | (36,566 | ) | (36,566 | ) | ||||||||||||||||||||||||||||
| 157,091 | 0 | (157,091 | ) | 0 | (157,091 | ) | Total Casualty G/L | 219,222 | 0 | (219,222 | ) | (34,566 | ) | (253,788 | ) | |||||||||||||||||||||||||
| 4,222 | 4,855 | 633 | 4,897 | 675 | 662000 - Deprec. — Buildings | 58,826 | 58,319 | (507 | ) | 49,022 | (9,803 | ) | ||||||||||||||||||||||||||||
| 10,652 | 5,944 | (4,708 | ) | 8,668 | (1,985 | ) | 666000 - Deprec. — Furnishings | 102,441 | 81,269 | (21,172 | ) | 112,179 | 9,738 | |||||||||||||||||||||||||||
| 14,874 | 10,799 | (4,075 | ) | 13,565 | (1,309 | ) | Total Depreciation Expense | 161,266 | 139,588 | (21,678 | ) | 161,201 | (66 | ) | ||||||||||||||||||||||||||
| 0 | 0 | 0 | 20 | 20 | 834000 - Legal | 81 | 1,146 | 1,065 | 1,136 | 1,055 | ||||||||||||||||||||||||||||||
| 0 | 0 | 0 | 20 | 20 | Total Partnership Legal | 81 | 1,146 | 1,065 | 1,136 | 1,055 | ||||||||||||||||||||||||||||||
| 0 | 0 | 0 | 3,350 | 3,350 | 839100 - Asset Disposal Costs | 0 | 0 | 0 | 3,350 | 3,350 | ||||||||||||||||||||||||||||||
| 0 | 0 | 0 | 0 | 0 | 931000 - Office Payroll | 7,212 | (431 | ) | (7,643 | ) | (423 | ) | (7,635 | ) | ||||||||||||||||||||||||||
| 0 | 0 | 0 | 3,350 | 3,350 | Total Partnership Other Expense | 7,212 | (431 | ) | (7,643 | ) | 2,927 | (4,285 | ) | |||||||||||||||||||||||||||
| 0 | 0 | 0 | 3,370 | 3,370 | Total Partnership Expense | 7,293 | 714 | (6,579 | ) | 4,063 | (3,230 | ) | ||||||||||||||||||||||||||||
| 203,552 | 43,947 | (159,605 | ) | 49,784 | (153,767 | ) | Total Noncontrollable Operating E | 740,752 | 537,700 | (203,053 | ) | 530,172 | (210,580 | ) | ||||||||||||||||||||||||||
| 261,467 | 90,061 | (171,406 | ) | 97,711 | (163,756 | ) | Total Operating Expenses | 1,312,049 | 1,103,500 | (208,549 | ) | 1,057,438 | (254,610 | ) | ||||||||||||||||||||||||||
| (94,541 | ) | 63,129 | (157,670 | ) | 56,470 | (151,011 | ) | Operating Income | 606,575 | 727,661 | (121,086 | ) | 674,052 | (67,477 | ) | |||||||||||||||||||||||||
© 2007 CB Richard Ellis, Inc.
7
Table of Contents
Table of Contents
LEAGL DESCRIPTION
5.79 acres beginning 1,177.4 feet east and 35 feet south of the center section of NW 191st Street, then south 19 degrees west 859 feet, then meandering southeast 277 feet along the edge of East Lake, then north 19 degrees east 1,047 feet to the point of beginning.
©2007 CB Richard Ellis, Inc.
Table of Contents
Table of Contents
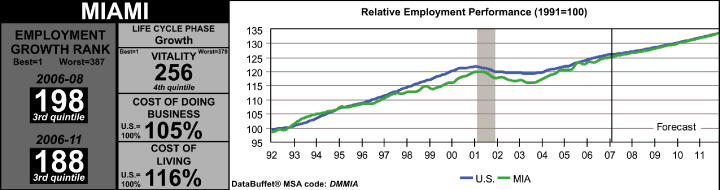
| 2000 | 2001 | 2002 | 2003 | 2004 | 2005 | 2006 | Indicators | 2007 | 2008 | 2009 | 2010 | 2011 | ||||||||||||||||||||||||||||||||||||
| 71.5 | 73.7 | 74.1 | 76.9 | 80.0 | 84.1 | 87.1 | Gross Metro Product, C$B | 88.9 | 91.3 | 93.9 | 96.5 | 99.2 | ||||||||||||||||||||||||||||||||||||
| 3.3 | 3.1 | 0.6 | 3.7 | 4.0 | 5.2 | 3.5 | % Change | 2.1 | 2.8 | 2.7 | 2.8 | 2.8 | ||||||||||||||||||||||||||||||||||||
| 996.3 | 1,008.5 | 991.3 | 984.3 | 1,005.8 | 1,029.9 | 1,047.4 | Total Employment (000) | 1,063.5 | 1,075.8 | 1,090.2 | 1,106.2 | 1,122.6 | ||||||||||||||||||||||||||||||||||||
| 2.7 | 1.2 | -1.7 | -0.7 | 2.2 | 2.4 | 1.7 | % Change | 1.5 | 1.2 | 1.3 | 1.5 | 1.5 | ||||||||||||||||||||||||||||||||||||
| 5.1 | 6.1 | 6.5 | 5.9 | 5.5 | 4.4 | 3.8 | Unemployment Rate | 3.5 | 3.5 | 3.5 | 3.5 | 3.5 | ||||||||||||||||||||||||||||||||||||
| 8.4 | 4.3 | 3.7 | 3.8 | 8.3 | 5.5 | 6.9 | Personal Income Growth | 6.5 | 4.6 | 4.6 | 4.9 | 5.2 | ||||||||||||||||||||||||||||||||||||
| 2,260.5 | 2,287.3 | 2,315.2 | 2,334.1 | 2,356.2 | 2,373.1 | 2,402.8 | Population (000) | 2,432.7 | 2,460.3 | 2,490.3 | 2,524.0 | 2,563.3 | ||||||||||||||||||||||||||||||||||||
| 5,998 | 6,828 | 6,374 | 8,740 | 9,603 | 9,922 | 6,910 | Single-Family Permits | 5,811 | 6,378 | 6,556 | 6,723 | 6,899 | ||||||||||||||||||||||||||||||||||||
| 6,477 | 7,168 | 8,232 | 6,793 | 13,253 | 16,198 | 14,071 | Multifamily Permits | 8,754 | 9,295 | 9,732 | 10,178 | 10,536 | ||||||||||||||||||||||||||||||||||||
| 138.2 | 159.5 | 184.3 | 221.2 | 271.8 | 349.9 | 375.3 | Existing Home Price ($Ths) | 360.8 | 357.6 | 365.8 | 375.2 | 384.5 | ||||||||||||||||||||||||||||||||||||
| 8,131 | 13,801 | 18,319 | 28,675 | 27,761 | 36,356 | 30,442 | Mortgage Originations ($Mil) | 29,612 | 26,475 | 26,935 | 27,534 | 27,980 | ||||||||||||||||||||||||||||||||||||
| 24.8 | 12.0 | 12.5 | 3.5 | 8.1 | 2.5 | 14.2 | Net Migration (000) | 14.3 | 11.7 | 13.9 | 17.4 | 22.6 | ||||||||||||||||||||||||||||||||||||
| 12,446 | 14,447 | 14,607 | 14,487 | 12,604 | 16,579 | 8,020 | Personal Bankruptcies | 9,629 | 10,465 | 11,617 | 12,773 | 13,487 | ||||||||||||||||||||||||||||||||||||
STRENGTHS & WEAKNESSES
STRENGTHS
| § | U.S. gateway to fast growing economies of Latin America. |
| § | Seen as a gateway to U.S. Hispanic market by foreign fi rms. |
| § | Well-developed shipping and distribution infrastructure. |
WEAKNESSES
| § | Low housing affordability and high crime rates. | |
| § | Proximity to Everglades limits westward expansion. | |
| § | Congested roads and airport. |
CURRENT EMPLOYMENT TRENDS
January 2007 Employment Growth
% change year ago, 3 mo. MA
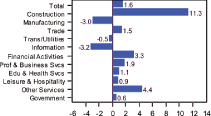
FORECAST RISKS
SHORT | é | LONG | ê | RISK-ADJUSTED | -0.53% | ||||
TERM | TERM | RETURN, ’06-11 |
UPSIDE
| • | Free Trade Area of the Americas is created, with MIA as Secretariat. | |
| • | Cuba opens up to greater foreign investment. |
DOWNSIDE
| • | A severe downturn in the housing market. | |
| • | In-migration from Latin America deteriorates. | |
| • | Rising insurance premiums and costs of living hamper business expansion. |
ANALYSIS
Recent Performance. Miami’s economy is expanding at a moderate but stable pace. Unlike most other Florida metro areas, MIA’s growth did not slow significantly over the past year; job growth no longer lags behind the heretofore surging Ft. Lauderdale and West Palm Beach areas, due in part to more stable construction employment. MIA is now only growing marginally slower than the state, the remaining gap being accounted for by slower population growth.
Benchmark revisions marked stronger construction job growth through mid-2006 in MIA, although it did falter in recent months. MIA’s financial services industry, which boomed in 2006, provides some support for the labor market in the wake of the construction downturn. This, too, may falter as mortgage lending eases, but labor markets remain decidedly tight with a jobless rate below 3.5%, the lowest on record.
Other indicators, however, show some weaknesses emerging. Household credit quality is deteriorating rapidly, residential construction permits have fallen by nearly half over the past year, and the area’s hotel occupancy rate is down from a mid-2006 peak.
Housing. The construction boom will peter out later in the year, and while an outright bust may not occur, housing-related activity and house prices will continue to sag until the accumulated excesses have been worked off. MIA is running behind the rest of the state in the housing cycle; the metro division’s housing markets are faring better than in many other parts of the state. There are still no signs of a trend decline in home prices in the metro division. The median house price for existing homes hit a trough last fall but has rebounded since and even hit a record high in January according to the Florida Association of Realtors. But all is not well. Home sales have been sagging since the spring of 2006 and saw a further drop in the first two months of this year. The buildup of inventory of unsold homes has reached dizzying heights and, if unleashed on the market, will no doubt cause prices to drop. This inventory is already discouraging new construction as indicated by the fall-off in permits.
Tourism. Buoyant tourism and business travel benefit the area’s hotel industry with high utilization rates in the form of rapid room rate growth and record-high revenue per room. MIA’s tourism industry saw a near-record number of visitors in 2006. Added capacity and softening visitor numbers are, however, chipping away at utilization rates. A weakened dollar keeps international visitation strong, but the weaker U.S. economy will slow domestic visitors, making the coming year somewhat leaner for the industry.
Population. MIA’s population growth remained stable in 2006 in contrast to sharp decelerations elsewhere in southeast Florida. The rate of growth is broadly in line with the nation, but considerably slower than fast-growing Florida, reflecting that MIA is nearly fully built and faces constraints, such as a shortage of land, which dampens the feasible pace of expansion. Traditional migration patterns persist: net international in-migration exceeds net domestic out-migration, resulting in a small net positive total. MIA serves as an immigration hub, with a younger age structure, but many immigrants subsequently resettle elsewhere.
Miami’s near-term outlook is for a slight moderation of growth, due to a slowdown in construction and housing-related industries. It will likely take longer for the housing correction to work itself through in MIA than in other Florida metro areas, as the metro division’s demographic fundamentals are weaker than the rest of the state. Demographics will also hamper the long-term growth prospects of the metro division, resulting in moderate long-term growth performance.
Per Gunnar Berglund
March 2007
March 2007
| ©2007 CB Richard Ellis, Inc. | Moody’s Economy.com, Inc.• www.economy.com• help@economy.com• Précis METRO |
Table of Contents
EMPLOYMENT & INDUSTRY
TOP EMPLOYERS
| Baptist HealthSystems of Southern Florida | 10,683 | |||
| Jackson Health System | 10,453 | |||
| University of Miami | 9,367 | |||
| American Airlines | 9,000 | |||
| Miami-Dade Community College | 5,400 | |||
| United Parcel Service, Inc. | 5,000 | |||
| BellSouth Corporation | 4,800 | |||
| Winn-Dixie Stores, Inc. | 4,616 | |||
| Precision Response Corporation | 4,196 | |||
| Publix Supermarkets, Inc. | 4,000 | |||
| Florida Power & Light Company | 3,665 | |||
| Florida International University | 3,500 | |||
| Macy’s of Florida | 3,368 | |||
| Royal Caribbean Intl./Celebrity Cruise | 3,300 | |||
| Carnival Cruise Lines | 3,000 | |||
| Mount Sinai Medical Center | 3,000 | |||
| American Sales & Management | 2,800 | |||
| Miami Children’s Hospital | 2,571 | |||
| Wachovia Corporation | 2,500 | |||
| Mercy Hospital | 2,433 |
| Source: The Beacon Council, December 2005 | ||
Public
| Federal | 20,033 | |||
| State | 16,841 | |||
| Local | 114,985 | |||
2006 |
COMPARATIVE EMPLOYMENT AND INCOME
| % of Total Employment | Average Annual Earnings | |||||||||||||||||||||||
| Sector | MIA | FL | US | MIA | FL | US | ||||||||||||||||||
| Construction | 5.1 | % | 8.0 | % | 5.6 | % | $ | 49,104 | $ | 40,555 | $ | 45,244 | ||||||||||||
| Manufacturing | 4.6 | % | 5.0 | % | 10.4 | % | $ | 49,781 | $ | 56,862 | $ | 65,673 | ||||||||||||
Durable | 57.9 | % | 68.5 | % | 63.4 | % | nd | $ | 59,015 | $ | 67,102 | |||||||||||||
Nondurable | 42.1 | % | 31.5 | % | 36.6 | % | nd | $ | 52,665 | $ | 63,325 | |||||||||||||
| Transportation/Utilities | 5.9 | % | 3.1 | % | 3.7 | % | nd | $ | 45,949 | $ | 54,428 | |||||||||||||
| Wholesale Trade | 7.1 | % | 4.3 | % | 4.3 | % | $ | 59,869 | $ | 57,872 | $ | 62,643 | ||||||||||||
| Retail Trade | 12.0 | % | 12.6 | % | 11.3 | % | $ | 28,642 | $ | 27,160 | $ | 26,652 | ||||||||||||
| Information | 2.1 | % | 2.1 | % | 2.2 | % | $ | 96,063 | $ | 64,910 | $ | 79,678 | ||||||||||||
| Financial Activities | 7.1 | % | 6.8 | % | 6.1 | % | $ | 48,572 | $ | 37,821 | $ | 51,729 | ||||||||||||
| Prof. and Bus. Services | 14.7 | % | 16.7 | % | 12.9 | % | $ | 42,082 | $ | 38,450 | $ | 49,211 | ||||||||||||
| Educ. and Health Services | 13.4 | % | 12.1 | % | 13.1 | % | $ | 40,111 | $ | 40,236 | $ | 39,829 | ||||||||||||
| Leisure and Hosp. Services | 9.6 | % | 11.3 | % | 9.6 | % | $ | 25,527 | $ | 22,018 | $ | 19,370 | ||||||||||||
| Other Services | 4.0 | % | 4.2 | % | 4.0 | % | $ | 17,887 | $ | 20,926 | $ | 22,940 | ||||||||||||
| Government | 14.5 | % | 13.7 | % | 16.1 | % | $ | 59,239 | $ | 53,890 | $ | 53,033 | ||||||||||||
| Sources: Percent of total employment — Moody’s Economy.com & BLS, 2006; Average annual earnings — BEA, 2004 | ||
HOUSE PRICES
| Source: OFHEO, 1987Q1=100, NSA | ||
CREDIT QUALITY
MOODY’S | ||||
| RATING | COUNTY | Aa3 |
LEADING INDUSTRIES
| NAICS | Industry | Employees (000) | ||||
| GVSL | State & Local Government | 131.8 | ||||
| 6221 | General Medical and Surgical Hospitals | 35.0 | ||||
| 7221 | Full-Service Restaurants | 30.3 | ||||
| 7222 | Limited-Service Eating Places | 26.9 | ||||
| 7211 | Traveler Accommodation | 23.8 | ||||
| 5613 | Employment Services | 22.6 | ||||
| 4451 | Grocery Stores | 21.7 | ||||
| 5411 | Legal Services | 20.3 | ||||
| GVF | Federal Government | 20.0 | ||||
| 6211 | Offices of Physicians | 19.7 | ||||
| 5616 | Investigation and Security Services | 18.2 | ||||
| 5221 | Depository Credit Intermediation | 16.6 | ||||
| 2382 | Building Equipment Contractors | 15.5 | ||||
| 5617 | Services to Buildings and Dwellings | 14.3 | ||||
| 4481 | Clothing Stores | 13.7 | ||||
| High-tech employment | 28.2 | |||||
| As % of total employment | 2.7 | |||||
| Sources: BLS, Moody’s Economy.com, 2006 | ||
MIGRATION FLOWS
| Number | Median | |||||||
| Into Miami, FL | of Migrants | Income | ||||||
| Fort Lauderdale, FL | 14,911 | 23,681 | ||||||
| New York, NY | 6,301 | 23,211 | ||||||
| West Palm Beach, FL | 1,855 | 19,571 | ||||||
| Orlando, FL | 1,745 | 16,506 | ||||||
| Tampa, FL | 1,260 | 17,759 | ||||||
| Atlanta, GA | 989 | 23,024 | ||||||
| Los Angeles, CA | 877 | 20,546 | ||||||
| Washington, DC | 866 | 33,694 | ||||||
| Chicago, IL | 854 | 26,098 | ||||||
| Nassau, NY | 667 | 25,492 | ||||||
| Total Inmigration | 63,153 | 20,199 | ||||||
From Miami, FL | ||||||||
| Fort Lauderdale, FL | 29,184 | 26,290 | ||||||
| Orlando, FL | 4,280 | 17,472 | ||||||
| West Palm Beach, FL | 3,493 | 22,571 | ||||||
| Cape Coral, FL | 3,355 | 17,671 | ||||||
| Tampa, FL | 2,795 | 18,150 | ||||||
| New York, NY | 2,632 | 18,555 | ||||||
| Atlanta, GA | 2,172 | 21,947 | ||||||
| Naples, FL | 1,777 | 17,999 | ||||||
| Jacksonville, FL | 1,104 | 23,446 | ||||||
| Port St. Lucie, FL | 1,103 | 26,577 | ||||||
| Total Outmigration | 90,336 | 21,790 | ||||||
Net Migration | -27,184 | -1,591 | ||||||
Net Migration, MIA
| 2003 | 2004 | 2005 | 2006 | |||||||||||
Domestic | -36,030 | -28,689 | -27,673 | -29,360 | ||||||||||
Foreign | 40,302 | 36,479 | 38,663 | 38,723 | ||||||||||
Total | 4,272 | 7,790 | 10,990 | 9,363 | ||||||||||
| Sources: IRS (top), 2005; Census Bureau, 2006 | ||
PER CAPITA INCOME
| Source: Bureau of Economic Analysis, 2004 | ||
Moody’s Economy.com, Inc.• www.economy.com• help@economy.com• Précis METRO
©2007 CB Richard Ellis, Inc.
Table of Contents
Miami
MIA’s housing markets have held up somewhat better than has been the case in many other parts of the state. And unlike many other parts of the state, residential construction remains vibrant in MIA. Even so, the metro area’s house prices have decelerated sharply; by some measures they have even started to fall in absolute terms. Still more troubling is the rapid buildup of inventories of unsold homes, which have reached levels three to four times higher than what is widely considered equilibrium. Going forward, these excessive inventories will weigh on house prices and also, ultimately, on new construction.
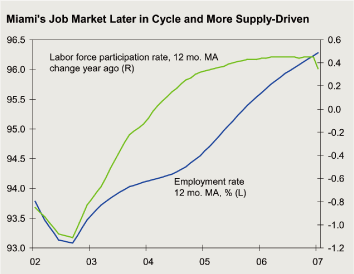
MIA’s labor market displays different dynamics than most other parts of the state. While the metro area’s unemployment rate is low compared to the nation, it remains higher than that of the state. The gap between MIA’s and Florida’s performances has narrowed in recent months, however, as MIA’s growth remains steady while Florida’s growth has moderated. Florida’s labor market is demand-driven, with labor force participation responding to lower unemployment rates. In MIA, however, changes in the labor force participation rate have preceded those of its employment rate, suggesting that the metro area’s labor market is more supply-driven.
©2007 CB Richard Ellis, Inc.
Moody’s Economy.com, Inc. • www.economy.com • help@economy.com • PrécisMETRO
Table of Contents
Table of Contents
| VALUATION & ADVISORY SERVICES | |
101 East Kennedy Boulevard, Suite 3140
Tampa, Florida 33602
Phone-813-261-4510
Fax – 813-261-4502
Tampa, Florida 33602
Phone-813-261-4510
Fax – 813-261-4502
201 South Orange Avenue, Suite 1500
Orlando, Florida 32801
Phone -407.839-3163
Fax — 407.839-3132
Orlando, Florida 32801
Phone -407.839-3163
Fax — 407.839-3132
Jerry P. Gisclair II, MAI
Managing Director
St. Cert. Gen. REA RZ2379
Managing Director
St. Cert. Gen. REA RZ2379
July 6th, 2007
Myles Diamond
Senior Vice President
CAPMARK FINANCE, INC.
200 Whitmer Road
Horsham, PA 19044
Senior Vice President
CAPMARK FINANCE, INC.
200 Whitmer Road
Horsham, PA 19044
| Phone: | (215) 328-1323 | |
| Fax: | (215) 328-0315 | |
| E-Mail: | Myles_Diamond@GMACCM.com |
| RE: | Appraisal Agreement See Portfolio List below |
Dear Mr. Diamond:
We are pleased to submit this proposal and our Terms and Conditions for the appraisal of the referenced real estate.
| We are pleased to submit this proposal and our Terms and Conditions for the appraisal of the referenced real estate. |
PROPOSAL SPECIFICATIONS
| Purpose: | To estimate the Market Value of the referenced real estate. | |
| Premise: | As Is, As Complete, and As Stabilized, as applicable | |
| Rights Appraised: | Fee Simple | |
| Intended Use: | Mortgage Underwriting purposes | |
| Appraisal Process: | Complete | |
| Report Type: | Self-Contained | |
| Appraisal Standards: | Client Guidelines (Freddie Mac or Fannie Mae)/USPAP/FIRREA | |
| Fee: | $118,000 | |
| Expenses: | Fee includes all associated expenses | |
| Retainer: | A retainer is not required for this assignment | |
| Payment Terms: | Final payment is due and payable upon delivery of the final report or within thirty (30) days of your receipt of our draft report, whichever is sooner. If a draft report is requested, the fee is considered earned upon delivery of our draft report. | |
| We will invoice you for a portion of the assignment which has been completed at the end of each calendar month. |
©2007 CB Richard Ellis, Inc.
Table of Contents
Myles Diamond
Page 2 of 7
Page 2 of 7
| Report Copies: | Electronic draft copies and Three (3) bound final copies | |
| Delivery Date: | Delivery of the appraisal conclusions and/or report(s) will be completed according to the following Delivery Schedule. | |
| Delivery Schedule: | ||
| Draft Report: | Three (3) from engagement | |
| Final Report: | Three (3) Days following warranted corrections and client request for finals | |
| Start Date: | The appraisal process will start upon receipt of your signed agreement and the property specific data. | |
| Acceptance Date: | These specifications are subject to modification if this proposal is not accepted within three (3) business days from the date of this letter. |
If available, we will need the following information to complete this assignment.
| • | Site plan/survey with Legal description | ||
| • | Property contact | ||
| • | Three (3) years of operating statements and current operating budget | ||
| • | Current rent roll | ||
| • | Engineering studies, environmental reports, etc. | ||
| • | Current real estate tax bill | ||
| • | Recent sale information (if sold within the past three years) | ||
| • | Any other information relevant to the valuation of the subject. |
SCOPE OF WORK
The scope of work identified for this assignment includes the following steps:
Extent to Which the Property is Identified
CBRE will collect the relevant physical characteristics about the subject via a physical identification and inspection of both the interior and exterior of the subject property. The physical property will be legally identified through its postal address, assessor’s records, the provided legal description and the provided title report. Economic characteristics of the subject will be identified via an analysis of leases and/or lease briefs between the lessor and lessee, recent rent roll and historical operating statements.
Extent to Which the Property is Inspected
CBRE will conduct a physical inspection of both the interior and exterior of the subject property, as well as its surrounding environs on the effective date of appraisal.
Type and Extent of the Data Researched
CBRE will physically inspect the micro and/or macro market environments with respect to physical and economic factors relevant to the valuation process. This knowledge will
| ©2007 CB Richard Ellis, Inc. |  |
Table of Contents
Myles Diamond
Page 3 of 7
Page 3 of 7
be expanded through interviews with regional and/or local market participants, available published data and other various resources. CBRE will also conduct regional and/or local research with respect to applicable tax data, zoning requirements, flood zone status, demographics, income and expense data, and comparable listing, sale and rental information.
Type and Extent of Analysis Applied
CBRE will analyze the data gathered through the use of appropriate and accepted appraisal methodology to arrive at a probable value indication via each applicable approach to value. All three traditional approaches to value will be considered and utilized. CBRE will then correlate and reconciled the results into a reasonable and defensible value conclusion, and estimated a reasonable exposure time and marketing time associated with the value estimate presented.
Please note if it’s a requirement per your underwriting or guidelines to have all three approaches to value, although some approaches may be limited in application.
TERMS AND CONDITIONS
The attached Terms and Conditions and Specific Property Data Request are deemed a part of this agreement as though set forth in full herein.
We appreciate this opportunity to be of service to you on this assignment. If you have additional questions, please contact us.
Sincerely,
CB RICHARD ELLIS, INC.
Valuation & Advisory Services
Valuation & Advisory Services

Jerry P. Gisclair II, MAI
Managing Director
St. Cert. Gen. REA RZ2379
Managing Director
St. Cert. Gen. REA RZ2379
Phone: (813) 261-4510
Fax: (813) 261-4502
E-mail:jerry.gisclair@cbre.com
Fax: (813) 261-4502
E-mail:jerry.gisclair@cbre.com
The following list of properties represents the subject.
| ©2007 CB Richard Ellis, Inc. | |
Table of Contents
Myles Diamond
Page 4 of 7
Page 4 of 7
| Number of | ||||||||||||||||||
| PROPERTY NAME | Street Address | City | State | units | Fee | Timing | ||||||||||||
| 1 | COUNTRY LAKES I #041515 | 1598 Fairway Drive | Naperville | IL | 240 | $ | 4,500 | 3 weeks | ||||||||||
| 2 | FERNTREE APARTMENTS #041723 | 5023 N. 18th Street | Phoenix | AZ | 219 | $ | 5,500 | 3 weeks | ||||||||||
| 3 | COUNTRY LAKES II #042527 | 1598 Fairway Drive | Naperville | IL | 400 | $ | 4,500 | 3 weeks | ||||||||||
| 4 | ECHO VALLEY APARTMENTS #042905 | 56 Maple Avenue | West Warwick | Rl | 100 | $ | 5,500 | 3 weeks | ||||||||||
| 5 | PARKWAY (VA) #038679 | 416 Merrimac Trail | Williamsburg | VA | 148 | $ | 6,000 | 3 weeks | ||||||||||
| 6 | TOWNSHIP AT HIGHLANDS APTS. #042932 | 901 East Phillips Lane | Littleton | CO | 161 | $ | 5,500 | 3 weeks | ||||||||||
| 7 | WINDRIFT APARTMENTS #038835 | 949 Crowsnest Circle | Orlando | FL | 288 | $ | 5,500 | 3 weeks | ||||||||||
| 8 | AUTUMN RUN #008677 | 1627 Country Lakes Drive | Naperville | IL | 320 | $ | 4,500 | 3 weeks | ||||||||||
| 9 | BALDWIN OAKS #038404 | 299 Baldwin Road | Parsippany | NJ | 251 | $ | 5,500 | 3 weeks | ||||||||||
| 10 | BRIGHTON CREST #000713 | 1650 Barnes Mill Road | Marietta | GA | 320 | $ | 5,500 | 3 weeks | ||||||||||
| 11 | COLONY AT KENILWORTH #008637 | 1 Bonrock Ct | Towson | MD | 383 | $ | 6,000 | 3 weeks | ||||||||||
| 12 | GOVERNORS PARK #000712 | 700 East Drake Road | Fort Collins | CO | 188 | $ | 6,000 | 3 weeks | ||||||||||
| 13 | LAMPLIGHTER PARK #005762 | 825 156th Avenue, NE | Bellevue | WA | 174 | $ | 6,000 | 3 weeks | ||||||||||
| 14 | PEAKVIEW PLACE #008656 | 9959 East PeakView Ave | Englewood | CO | 296 | $ | 5,500 | 3 weeks | ||||||||||
| 15 | POST RIDGE APTS.#005741 | 595 Hicks Road | Nashville | TN | 150 | $ | 5,500 | 3 weeks | ||||||||||
| 16 | PRESIDENTIAL HOUSE #000500 | 1572 NE 191st Street | North Miami Beach | FL | 203 | $ | 5,500 | 3 weeks | ||||||||||
| 17 | VILLAGE GREEN #005705 | 112 Essex Avenue | Altamonte Springs | FL | 164 | $ | 5,500 | 3 weeks | ||||||||||
| 18 | DEER CREEK #006000 | 305 Deer Creek Drive | Plainsboro | NJ | 288 | $ | 5,000 | 3 weeks | ||||||||||
| 19 | HUNTERS GLEN IV #000517* | 1109 Hunters Glen Drive | Plainsboro | NJ | 264 | $ | 4,750 | 3 weeks | ||||||||||
| 20 | HUNTERS GLEN V & VI #000518 #000519 | 1109 Hunters Glen Drive | Plainsboro | NJ | 328 | $ | 4,750 | 3 weeks | ||||||||||
| 21 | TWIN LAKES APARTMENTS #000270 | 31790 US Hwy 19 North | Palm Harbor | FL | 262 | $ | 5,500 | 3 weeks | ||||||||||
| 22 | WILLOW PARK | 375 Palm Springs Drive | Altamonte Springs | FL | 185 | $ | 5,500 | 3 weeks | ||||||||||
| Portfolio Totals | 5,332 | $ | 118,000 | |||||||||||||||
AGREED AND ACCEPTED
FOR MYLES DIAMOND / CAPMARK FINANCE, INC.:
| ©2007 CB Richard Ellis, Inc. | |
Table of Contents
Table of Contents
QUALIFICATIONS
QUALIFICATIONS OF
CLAUDE R. “BUDDY” URBAN, MAI
Senior Real Estate Analyst/Multi-family Specialist
Senior Real Estate Analyst/Multi-family Specialist
CB Richard Ellis, Inc., Valuation and Advisory Services
777 Brickell Avenue, Suite 910
Miami, Florida 33131
(305) 381-6449
777 Brickell Avenue, Suite 910
Miami, Florida 33131
(305) 381-6449
EDUCATIONAL
Bachelor of Business Administration, Sam Houston State University, Huntsville, Texas
LICENSE(S)/CERTIFICATION(S)
Certified General Real Estate Appraiser: State of Florida (No. RZ 2815)
Certified General Real Estate Appraiser: State of Nevada (No. 04813)
Certified General Real Estate Appraiser: State of Texas (No. TX-1320516-G)
Licensed Real Estate Broker: State of Texas
Certified General Real Estate Appraiser: State of Nevada (No. 04813)
Certified General Real Estate Appraiser: State of Texas (No. TX-1320516-G)
Licensed Real Estate Broker: State of Texas
PROFESSIONAL
Appraisal Institute
Designed Member (MAI), Certificate No. 9260
EMPLOYMENT EXPERIENCE
| 1984 to 1986 | Associate Consultant/Appraiser, Michael J. Urban & Assoc., Inc. Houston, TX | |
| 1986 to 1992 | Associate Consultant/Appraiser, Dominy, Ford & McPherson, Inc., Houston, TX | |
| 1992 to 1994 | President and Principal Appraiser, Buddy R. Urban & Assoc., Houston, TX | |
| 1994 to 1998 | President and Principal, NaturaLawn of America and Burnett Pipeline Co., Houston, TX | |
| 1998-2003 | Associate Consultant/Appraiser, Gerald A. Teel, Inc., Houston, TX | |
| 2003-Present | CB Richard Ellis, Inc., Miami, FL |
Professional experience has been in the fee preparation/review of real estate appraisals, feasibility studies, rent analyses and market studies of commercial and residential properties. Primary experience encompasses a wide variety of property types including office, retail, industrial, multifamily, hotel, medical office, restaurant, parking garage, car wash, low-income housing, bond financed multi-family, residential subdivision, master-planned business park, bank branch, special purpose, and single family.
Assignments completed in Florida, Louisiana, Mississippi, Nevada, New Mexico, Virgin Islands, Puerto Rico and Texas.
©2007 CB Richard Ellis, Inc.
Table of Contents
Table of Contents
QUALIFICATIONS
QUALIFICATIONS OF
JAMES E. AGNER, MAI, SGA
Managing Director – Florida
Nat. Director — Net Lease Valuation Group
Nat. Director – Golf Valuation Group
Managing Director – Florida
Nat. Director — Net Lease Valuation Group
Nat. Director – Golf Valuation Group
CB Richard Ellis, Inc., Valuation and Advisory Services
777 Brickell Avenue, Suite 910
Miami, Florida 33131
(305) 381-6480
777 Brickell Avenue, Suite 910
Miami, Florida 33131
(305) 381-6480
EDUCATIONAL
BS, Marketing, Florida State University, Tallahassee, Florida — 1981
Real Estate Major, Florida Atlantic University — 1984
Appraisal Institute
Real Estate Major, Florida Atlantic University — 1984
Appraisal Institute
Appraisal Institute Courses 1A and 1B. Attended numerous educational seminars sponsored by the Appraisal Institute including Standards of Professional Practice, Market and Feasibility Studies for Shopping Centers, USPAP Florida State Law, Public Safety and Property Values and Real Estate Valuation in the Appraisal Industry.
LICENSE(S)/CERTIFICATION(S)
Registered Real Estate Broker-Salesman; State of Florida (No. BL0404088)
Certified General Appraiser; State of Florida (No. RZ382)
Certified General Appraiser; State of Florida (No. RZ382)
PROFESSIONAL
Appraisal Institute
Designated Member (MAI), Certificate No. 7791
South Florida Caribbean Board of Directors (Past Director)
Society of Golf Appraisers – Designated Member (SGA) — 2005
South Florida Caribbean Board of Directors (Past Director)
Society of Golf Appraisers – Designated Member (SGA) — 2005
Qualified Expert Witness
Circuit Courts — State of Florida
United States Bankruptcy Courts
Circuit Courts — State of Florida
United States Bankruptcy Courts
EMPLOYMENT EXPERIENCE
Twenty-six years of Real Estate Appraisal and Consulting experience throughout the State of Florida and in the Caribbean.
| 1981 to 1984 | Florida Dept. of Transportation | Ft. Lauderdale, FL | ||
| 1984 to 1985 | Raymond Kaiser Engineer | Ft. Lauderdale, FL | ||
| 1985 to 1995 | Quinlivan Appraisal & Consulting | South Miami, FL | ||
| 4/95 to 10/95 | Coastal Appraisal Services | Naples, FL | ||
| 1995-Present | CB Richard Ellis, Inc. - | Miami, FL | ||
| Valuation and Advisory Services – Managing Director — Florida | ||||
© 2007 CB Richard Ellis, Inc.
Table of Contents