Exhibit 99.6
![]()
575 Lexington Avenue, New York, New York 10022
Tel: 212.906.9400 Fax: 212.935.5935
Appraisal of
Peak at Vinings
100 Woodbridge Drive
Atlanta, Georgia 30339
![]()
January 28, 2013
Ms. Lisa Cohn
Executive Vice President
Fox Partners II
c/o AIMCO
4582 South Ulster Street, Suite 1100
Denver, CO 80237
| Re: | Appraisal of Peak at Vinings |
100 Woodbridge Drive
Atlanta, Georgia 30339
KTR No. 12-1-00362 (A)
Dear Ms. Cohn:
In accordance with our agreement dated December 20, 2012, KTR Real Estate Advisors LLC (“KTR”) has performed an Appraisal of the above-referenced property and has communicated the results in the attached Self-contained Appraisal Report. The purpose of this appraisal is to determine the Market Value of the Leased Fee Interest in the subject property as of January 18, 2013, the date of inspection.
Situated as noted, the subject property consists of a 22.00-acre site improved with a 280-unit gated garden-style apartment complex. The subject was developed in 1981 and underwent a major renovation between 2008 and 2009. It contains 272,390 square feet of rentable area. Additional site improvements include a clubhouse with business center, meeting room, kitchen/gaming area, fitness center, swimming pool and mature landscaping. The property is operating at stabilized occupancy and is in good physical condition. The subject property is more fully described, legally and physically, within the attached report.
Based on the analysis contained in the attached report, the Market Value of the Leased Fee Interest in the subject property free and clear of financing, as of January 18, 2013 is:
THIRTY FOUR MILLION SIX HUNDRED THOUSAND DOLLARS
($34,600,000)
The attached report, in its entirety, including all assumptions and limiting conditions, which is an integral part of, and inseparable from, this transmittal letter, contains the data, information, analyses and calculations upon which the value conclusion indicated herein are based. The report was prepared in compliance with the Uniform Standards of Professional Appraisal Practice (USPAP) as set forth by the Appraisal Foundation and in accordance with the Code of Professional Ethics and Standards of Professional Practice of the Appraisal Institute.
575 Lexington Avenue, New York, NY 10022
TEL 212.906.9400 •FAX 212.935.5935
Fox Partners II Peak at Vinings January 28, 2013 Page 2 |
It has been a pleasure to be of service to you. Please do not hesitate to call either Terence Tener at (212) 906-9403 or Thomas Tener at (212) 906-9499 with any questions you may have regarding our assumptions, observations or conclusions.
Respectfully submitted,
KTR REAL ESTATE ADVISORS LLC | ||||||||
 |  | |||||||
| By: | Terence Tener, MAI, ASA Managing Partner | By: | Thomas J. Tener Managing Partner | |||||
 | ||||||||
| By: | Shaun Kest Appraiser | |||||||
| Peak at Vinings | January 28, 2013 | |
| Atlanta, Georgia | Page i |
| INTRODUCTION | ||||
Title Page | ||||
Letter of Transmittal | ||||
Table of Contents | i | |||
Certificate of Appraisal | ii | |||
Basic Assumptions and Limiting Conditions | iii | |||
Subject Property Photographs | v | |||
Location Map | vi | |||
| PREMISES OF THE APPRAISAL | ||||
Summary of Salient Facts and Conclusions | 1 | |||
Property Identification | 2 | |||
Sales History | 2 | |||
Purpose and Scope of the Appraisal | 2 | |||
Definition of Market Value | 3 | |||
Property Rights Appraised | 3 | |||
Intended Use and User | 3 | |||
Exposure Time | 4 | |||
| PRESENTATION OF DATA | ||||
Regional and Area Analysis | 5 | |||
Neighborhood Analysis | 9 | |||
Site Analysis | 11 | |||
Improvement Analysis | 14 | |||
Zoning Analysis | 17 | |||
Real Estate Assessments and Taxes | 19 | |||
Apartment Market Analysis | 20 | |||
| ANALYSIS OF DATA AND CONCLUSIONS | ||||
Highest and Best Use | 31 | |||
Valuation Process | 32 | |||
Income Capitalization Approach | 34 | |||
Sales Comparison Approach | 43 | |||
Reconciliation and Final Value Conclusion | 52 | |||
| ADDENDA | ||||
Additional Subject Property Photographs | ||||
Submitted Information | ||||
Qualifications of the Appraiser | ||||
KTR Real Estate Advisors LLC
| Peak at Vinings | January 28, 2013 | |
| Atlanta, Georgia | Page ii |
CERTIFICATE OF APPRAISAL
We, Terence Tener, MAI, ASA, Thomas J. Tener and Shaun Kest certify that to the best of our knowledge and belief:
The statements of fact contained in this report are true and correct.
The reported analyses, opinions, and conclusions are limited only by the reported assumptions and limiting conditions, and are our personal, unbiased professional analyses, opinions, and conclusions.
We have no present or prospective interest in the property that is the subject of this report, and we have no personal interest or bias with respect to the parties involved.
Our compensation is not contingent upon the reporting of a predetermined value or direction in value that favors the cause of the client, the value estimate, the attainment of a stipulated result, or the occurrence of a subsequent event.
Our analyses, opinions, and conclusions were developed, and this report has been prepared, in conformity with theUniform Standards of Professional Appraisal Practice.
Shaun Kest has made a personal inspection of the property that is the subject of this report.
Terence Tener, MAI, ASA and Thomas J. Tener have not made a personal inspection of the property that is the subject of this report.
This appraisal was not prepared in conjunction with a request for a specific value or a value within a given range or predicated upon loan approval.
The reported analyses, opinions and conclusions were developed, and this report has been prepared, in conformity with the requirements of the Code of Professional Ethics and the Standards of Professional Appraisal Practice of the Appraisal Institute.
The use of this report is subject to the requirements of the Appraisal Institute relating to review by its duly authorized representatives.
As of the date of this report, Terence Tener, MAI, ASA has completed the continuing education program of the Appraisal Institute.
Thomas J. Tener has been certified to transact business in Georgia as a Real Estate General Appraiser (License No. 343948).
Terence Tener, MAI, ASA, Thomas J. Tener and Shaun Kest have extensive experience in the appraisal of similar properties.
We have not performed an appraisal and appraisal consulting services regarding the subject property within the three-year period immediately preceding this assignment.
KTR REAL ESTATE ADVISORS LLC
|  |  | ||||||||
| By: | Terence Tener, MAI, ASA | By: | Thomas J. Tener | By: | Shaun Kest | |||||
| Managing Partner | Managing Partner | Appraiser | ||||||||
KTR Real Estate Advisors LLC
| Peak at Vinings | January 28, 2013 | |
| Atlanta, Georgia | Page iii |
BASIC ASSUMPTIONS AND LIMITING CONDITIONS
This appraisal report is subject to the following assumptions and limiting conditions:
| 1. | No responsibility is assumed for the legal description or for matters including legal or title considerations. Title to the property is assumed to be good and marketable unless otherwise stated. |
| 2. | The property is appraised free and clear of any or all liens or encumbrances unless otherwise stated. |
| 3. | Responsible ownership and competent property management are assumed. |
| 4. | The information furnished by others is believed to be reliable. However, no warranty is given for its accuracy. |
| 5. | All engineering is assumed to be correct. The plot plans and illustrative material in this report are included only to assist the reader in visualizing the property. |
| 6. | It is assumed that there are no hidden or unapparent conditions of the property, subsoil, or structures that render it more or less valuable. No responsibility is assumed for such conditions or for arranging for engineering studies that may be required to discover them. |
| 7. | It is assumed that there is full compliance with all applicable federal, state, and local environmental regulations and laws unless noncompliance is stated, defined, and considered in the appraisal report. |
| 8. | It is assumed that all applicable zoning and use regulations and restrictions have been complied with, unless nonconformity has been stated, defined, and considered in the appraisal report. |
| 9. | It is assumed that all required licenses, certificates of occupancy, consents, or other legislative or administrative authority from any local, state, or national government or private entity or organization have been or can be obtained or renewed for any use on which the value estimate contained in this report is based. |
| 10. | It is assumed that the utilization of the land and improvements is within the boundaries or property lines of the property described and that there is no encroachment or trespass unless noted in the report. |
| 11. | The distribution, if any, of the total valuation in this report between land and improvements applies only under the stated program of utilization. The separate allocations for land and buildings must not be used in conjunction with any other appraisal and are invalid if so used. |
| 12. | Unless otherwise stated, possession of this report, or a copy thereof, does not carry with it the right of publication. |
| 13. | The appraiser, by reason of this appraisal, is not required to give further consultation, testimony, or be in attendance in court with reference to the property in question unless arrangements have been previously made. |
| 14. | Unless otherwise stated, neither all nor any part of the contents of this report (especially any conclusions as to value, the identity of the appraiser, or the firm with which the appraiser is connected) shall be disseminated to the public through advertising, public relations, news, sales, or other media without prior written consent and approval of the appraisers. |
KTR Real Estate Advisors LLC
| Peak at Vinings | January 28, 2013 | |
| Atlanta, Georgia | Page iv |
| 15. | Unless otherwise stated in this report, the existence of hazardous substances, including without limitation asbestos, polychlorinated biphenyls, petroleum leakage, or agricultural chemicals, which may or may not be present on the property, or other environmental conditions, were not called to the attention of nor did the appraiser become aware of such during the appraiser’s inspection. The appraiser has no knowledge of the existence of such materials on or in the property unless otherwise stated. The appraiser, however, is not qualified to test such substances or conditions. If the presence of such substances, such as asbestos, urea formaldehyde foam insulation, or other hazardous substances or environmental conditions, may affect the value of the property, the value is predicated on the assumption that there is no such condition on or in the property or in such proximity thereto that it would cause a loss in value. No responsibility is assumed for any such conditions, or for any expertise or engineering knowledge required to discover them. The client is urged to retain an expert in this field, if desired. |
| 16. | The Americans with Disabilities Act (“ADA”) became effective January 26, 1992. The appraiser has not made a specific compliance survey and analysis of this property to determine whether or not it is in conformity with the various detailed requirements of the ADA. It is possible that a compliance survey of the property, together with a detailed analysis of the requirements of the ADA, could reveal that the property is not in compliance with one or more of the requirements of the Act. If so, this fact could have a negative effect upon the value of the property. Since the appraiser has no direct evidence relating to this issue, he did not consider possible non-compliance with the requirements of the ADA in estimating the value of the property. |
| 17. | Former personal property items such as kitchen and bathroom appliances are now either permanently affixed to the real estate or are implicitly part of the real estate in that tenants expect the use of such items in exchange for rent and never gain any of the rights of ownership. Furthermore, the intention of the owners is not to remove the articles which are required under the implied or express Warranty of Habitability. The accounting for the short-lived nature of such items is reflected in a reserves for replacement expense category. |
KTR Real Estate Advisors LLC
| Peak at Vinings | January 28, 2013 | |
| Atlanta, Georgia | Page v |
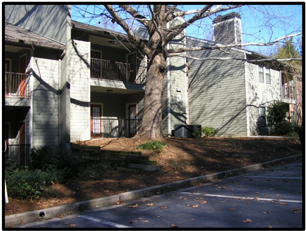
SUBJECT PROPERTY PHOTOGRAPHS
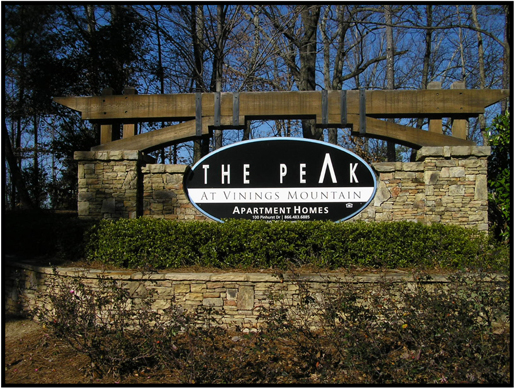
View of typical building

KTR Real Estate Advisors LLC
| Peak at Vinings | January 28, 2013 | |
| Atlanta, Georgia | Page vi |
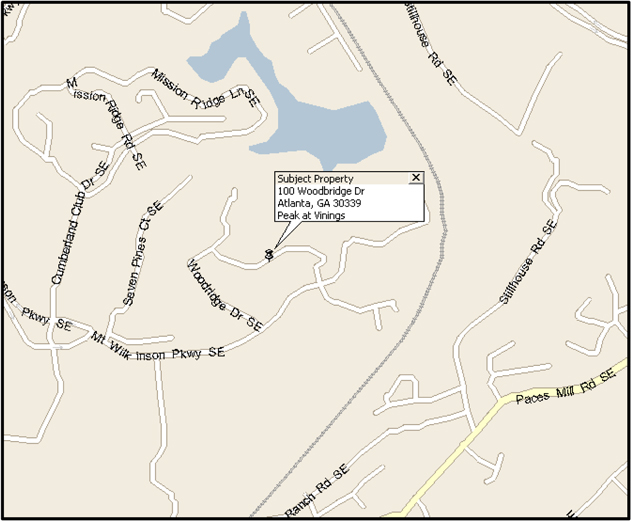
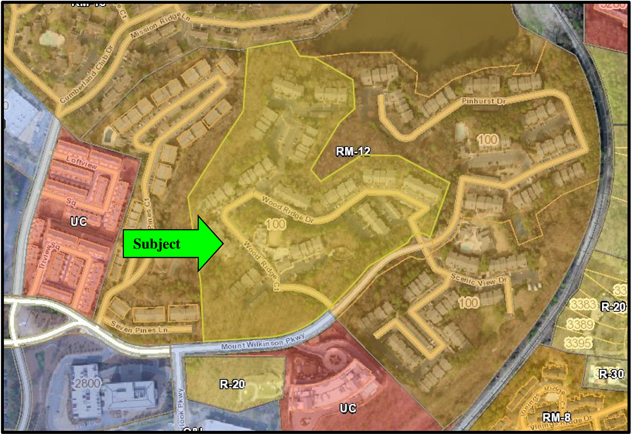
LOCATION MAP
KTR Real Estate Advisors LLC
| Peak at Vinings | January 28, 2013 | |
| Atlanta, Georgia | Page 1 |
| SUMMARY OF SALIENT FACTS AND CONCLUSIONS | ||
| Date of Value | January 18, 2013 | |
| Date of Inspection | January 18, 2013 | |
| Property Name | Peak at Vinings | |
| Property Address | 100 Woodbridge Drive | |
| Atlanta, Georgia 30339 | ||
| Property Location | North side of Mt. Wilkinson Parkway (where the street dead ends), in an unincorporated section of the City of Atlanta, Georgia. | |
| Tax Identification | 17-0910-0-006-0. | |
| Purpose of the Appraisal | The purpose of the appraisal is to estimate the market value of the Leased Fee Interest in the subject property as of the date of value. | |
| Site Size | Irregular shaped site that contains a total of 22.00 acres | |
| Zoning | RM – 12 (Residential) | |
| Improvements | A 280-unit gated garden apartment complex completed in 1981 with 14 apartment buildings, a clubhouse with business center, meeting room, kitchen/gaming area, fitness center, swimming pool and mature landscaping. It is noted that there was a major renovation spanning between 2008 and 2009 upgrading all of the units and amenities at the property. The property is operating at stabilized occupancy and is in good physical condition. | |
| 2012 Assessed Value | $8,948,312 | |
| Highest and Best Use | ||
As If Vacant | Residential development. | |
As Improved | Continued use of the existing improvements. | |
| VALUATION INDICATIONS | ||
| Income Capitalization | $34,600,000 | |
Stabilized NOI | $1,992,038 | |
Cap Rate | 5.75% | |
Value per Unit | $123,581 | |
Value per Sq Ft | $127.02 | |
| Sales Comparison | $35,000,000 | |
Value per Unit | $125,000 | |
Value per Sq Ft | $128.49 | |
| Cost Approach | N/A | |
| APPRAISED VALUE | $34,600,000 | |
Value per Unit | $123,581 | |
Value per Sq Ft | $127.02 | |
KTR Real Estate Advisors LLC
| Peak at Vinings | January 28, 2013 | |
| Atlanta, Georgia | Page 2 |
| PREMISES OF THE APPRAISAL | ||
| Identification | The subject property consists of the land and improvements at 100 Woodbridge Drive within an unincorporated area of Atlanta, Cobb County, Georgia. The Cobb County Assessor identifies the property as Tax Parcel Identification Number 17-0910-0-006-0. The property consists of a 22.00- acre site improved with 280-unit apartment complex known as Peak at Vinings. | |
| Sales History of the Subject Property | According to public records, the current owner of the subject property is Peak at Vinings LLC, who has owned the property since October 2009 when it was transferred from Century Properties Fund XIX for $20,325,000. It is noted that the recent sale included the adjacent property, Lakeside at Vinings and was a related transfer. We are not aware of any transfers of ownership within the three-year period prior to the effective date of value. It is our understanding that the subject property is not being listed for sale and we are not aware of any contracts of sale pending as of the date this report was prepared. | |
| Purpose and Scope of the Appraisal | The purpose of the appraisal is to estimate the market value of the subject property as of the date of value. It is the intent of the appraisers that the analysis, opinions and conclusions of this report be considered an unbiased, objective investigation performed by a disinterested third party with complete objectivity as to the outcome of the analysis. | |
| According to the Appraisal Institute’s Code of Professional Ethics and Uniform Standards of Professional Appraisal Practice, the scope of the appraisal is cited as “the extent of the process of collecting, confirming, and reporting data” included in an appraisal report. All appropriate data deemed pertinent to the solution of the appraisal problem has been collected and confirmed. In the appraisal, we have: | ||
1. Inspected the subject property and its environs. | ||
2. Reviewed demographic and other socioeconomic trends pertaining to the city and region. | ||
3. Examined regional apartment market conditions, with special emphasis on the subject’s submarket. | ||
4. Investigated lease and sale transactions involving comparable properties in the influencing market. | ||
5. Reviewed the existing rent roll and discussed the leasing status with the building manager and leasing agent. In addition, we have reviewed the subject property’s recent operating history and those of competing properties. | ||
6. Utilized appropriate appraisal methodology to derive estimates of value. | ||
7. Reconciled the estimates of value into a single value conclusion. | ||
KTR Real Estate Advisors LLC
| Peak at Vinings | January 28, 2013 | |
| Atlanta, Georgia | Page 3 |
| Definition of Market Value | The definition of Market Value used in this appraisal report is taken from the Appraisal Institute’sThe Dictionary of Real Estate Appraisal, Fifth Edition, Chicago, Illinois, Appraisal Institute, 2010, which states:
“The most probable price that a property should bring in a competitive and open market under all conditions requisite to a fair sales, the buyer and seller each acting prudently and knowledgeably, and assuming the price is not affected by undue stimulus. Implicit in this definition is the consummation of a sale as of a specified date and the passing of title from seller to buyer under conditions whereby: | |
1. Buyer and seller are typically motivated; | ||
2. Both parties are well informed or well advised and acting in what they consider their best interests; | ||
3. A reasonable time is allowed for exposure in the open market; | ||
4. Payment is made in terms of cash in U.S. dollars or in terms of financial arrangements comparable thereto; and | ||
5. The price represents the normal consideration for the property sold unaffected by special or creative financing or sales concessions granted by anyone associated with the sale.” | ||
| Property Rights Appraised | The interest being appraised is the Leased Fee Interest. Leased Fee Interest is defined in The Dictionary of Real Estate Appraisal, Fifth Edition, Chicago, Illinois, Appraisal Institute, 2010, as:
“An ownership interest where the possessory interest has been granted to another party by creation of a contractual landlord tenant relationship, i.e. a lease. The rights of the lessor (the leased fee owner) and the leased fee are specified by contract terms contained within the lease.” | |
| Intended Use and Intended User | The intended user of the report is Fox Partners VII. It is understood that this appraisal will be utilized by the intended user as an aid in asset evaluation and financial reporting. All others reading or relying on this appraisal are considered unintended users. The appraisal cannot be used for any other reason than that stated above. The appraisers are not responsible for unauthorized use of this report. | |
| This appraisal has been prepared in compliance with the Uniform Standards of Professional Appraisal Practice (USPAP) as promulgated by the Appraisal Standards Board of the Appraisal Foundation as well as the Code of Professional Ethics and Standards of Professional Appraisal Practice of the Appraisal Institute. The presentation of data and results of our analysis are presented in a Self-Contained Report format as set forth under Standards Rule 2-2 of the USPAP. | ||
KTR Real Estate Advisors LLC
| Peak at Vinings | January 28, 2013 | |
| Atlanta, Georgia | Page 4 |
| Exposure Time | According to the previously stated definition of Market Value, the property must be allowed a reasonable time to be exposed in the open market to achieve the appraised value. Exposure is defined by the Appraisal Institute,The Dictionary of Real Estate Appraisal, Fifth Edition, Chicago, Illinois, Appraisal Institute, 2010, as: | |
| “1. The time a property remains on the market. | ||
| 2. The estimated length of time the property interest being appraised would have been offered on the market prior to the hypothetical consummation of a sale at market value on the effective date of the appraisal; a retrospective estimate based upon an analysis of past events assuming a competitive and open market.” | ||
| Exposure time is always presumed to occur prior to the effective date of the appraisal. The overall concept of reasonable exposure encompasses not only adequate, sufficient and reasonable time but also adequate, sufficient and reasonable effort. Exposure time is different for various types of real estate and value ranges and under various market conditions. | ||
| Review of transfer records suggests that there is an active investor market for good quality apartment properties; however, conventional sources of capital is somewhat limited and mortgage underwriting has remained conservative with a greater level of equity required to obtain financing in comparison to the period leading up to September 2008. These factors have impacted sales activity for most types of investment grade real estate. | ||
| We believe that if the subject property were exposed to the market for a reasonable period of time prior to the effective date of this appraisal, which we consider to be a period of up to 12 months, the subject would transfer at an appropriate price, that is to say, the appraised value. Support for this exposure period is provided by thePwC Real Estate Investor Survey Fourth Quarter 2012, which indicates that marketing times for apartment properties in the national market range from none to 18 months. The average marketing time equates to 5.1 months, down slightly from 5.2 months reported one year ago. In addition, thePwC Surveyindicates that marketing time for apartment properties in the Southeast Region range from one to 18 months. The average marketing time equates to 6.5 months, down slightly from 6.7 months reported one year ago. This marketing period is supported by data in the local market. | ||
| We acknowledge that in appraising the property to sell after the aforementioned exposure period, we must place most emphasis on the buyer’s expectations and yield requirements. The value conclusion rendered for the property through implementation of the Income Capitalization Approach has been accorded most weight as this technique most closely emulates buyer’s expectations and yield requirements. The market value estimate concluded herein assumes an exposure and marketing period of up to 12 months. | ||
KTR Real Estate Advisors LLC
| Peak at Vinings | January 28, 2013 | |
| Atlanta, Georgia | Page 5 |
| REGIONAL ANALYSIS | ||
| Overview | The subject is located in Cobb County which is part of the Atlanta-Sandy Springs-Marietta Metropolitan Statistical Area (MSA). The MSA is comprised of 28 counties including Barrow, Bartow, Butts, Carroll, Cherokee, Clayton, Cobb, Coweta, Dawson, DeKalb, Douglas, Fayette, Forsyth, Fulton, Gwinnett, Haralson, Heard, Henry, Jasper, Lamar, Meriwether, Newton, Paulding, Pickens, Pike, Rockdale, Spalding and Walton. The Atlanta metropolitan area is located in north central Georgia in the foothills of the Appalachian Mountains. Once a rail hub in the mid-nineteenth century, Atlanta is now the major distribution, trade and financial center of the southeastern United States. | |
| During the 1980s, Atlanta enjoyed high levels of growth, reaching new levels of social and economic diversity. Much of the momentum built in the 1980s, however, was lost during the recessionary period of the early 1990s and the region suffered its first year-over-year job loss since the mid-1970s. Growth returned in 1992 and Metropolitan Atlanta enjoyed another period of substantial growth in jobs, population, households and personal income. The rate of growth surpassed that of the United States as a whole during this period. The geographic expansion and decentralization of metropolitan areas is perhaps best exemplified by the evolution and development of the Atlanta metropolitan area. Much of the region’s growth has been concentrated in the area north of the City’s downtown from I-75 to I-85. When built in the 1970s, the I-285 beltway defined the northern boundary with the Perimeter neighborhood and mall named to reflect at the time this edge location. Since then, the continued push north has been dramatic particularly along the region’s extensive expressway network. | ||
Population | The population of the MSA has grown steadily since 1980 at rates exceeding the State of Georgia as a whole. In fact, approximately 70.0% of the State’s population growth has occurred within the MSA. This trend is projected to continue over the next five years. The Atlanta MSA, with the addition of 1.0+ million new residents was the nation’s fastest growing MSA since 2000. Population estimates for Cobb County as of 2012 were 700,521, indicating an average annual increase of 1.27% over the 2000 population of 607,746. The County’s population is forecast to increase at a slightly slower pace through 2017 to 737,098. The rate of growth in the County has been less than the MSA and State. Population growth has been concentrated in Counties outside the beltway along major interstates such as Forsyth, Newton, Henry, Barrow, Cherokee, Walton, Dawson, Douglas and Pickens. The following table details historic and projected population trends for the County, MSA and the State. | |
KTR Real Estate Advisors LLC
| Peak at Vinings | January 28, 2013 | |
| Atlanta, Georgia | Page 6 |
| POPULATION TRENDS | ||||||||||||||||||||
| Average Annual Growth | ||||||||||||||||||||
| 2000 Census | 2012 Estimate | 2017 Projection | 2000 - 2012 | 2012 -2017 | ||||||||||||||||
Cobb County | 607,746 | 700,521 | 737,098 | 1.27 | % | 1.04 | % | |||||||||||||
Atlanta MSA | 4,247,984 | 5,405,084 | 5,809,570 | 2.27 | % | 1.50 | % | |||||||||||||
Georgia | 8,186,384 | 9,890,616 | 10,479,874 | 1.73 | % | 1.19 | % | |||||||||||||
| Source: DemographicsNow.com; Compiled by KTR | ||||||||||||||||||||
| Economic Overview | According to the United States Bureau of Labor Statistics, the MSA’s total civilian labor force was 2,743,100 as of October 2012. The non-farm labor force as of October 2012 was 2,354,200. The unemployment rate stood at 8.2% as of October 2012, lower than the State and above the National unemployment rate of 8.7% and 7.9%, respectively. Unemployment in the MSA is down from 9.4% one year ago.
The MSA is ranked third after New York and Houston as a Fortune 500 headquarter city. Numerous major companies have made Atlanta their headquarters including The Coca-Cola Company, Home Depot and the United Parcel Service. AT&T (formerly Bell South), Delta Airlines, Turner Broadcasting and Cox Enterprises also have a large presence in the area. | |
| A majority of the MSA’s work force is employed in the Trade, Transportation and Utilities, Services, and Government sectors. Total employment in the MSA increased by 1.5% or 34,400 jobs over the past year. The Construction sector has been hit the hardest over the past year with a decrease of 3.7%. The following table illustrates the diversification of the Atlanta MSA’s work force as of October 2012, the most recent information available at the time of the report. | ||
ATLANTA-SANDY SPRINGS-MARIETTA MSA WORK FORCE BY INDUSTRY – AS OF OCTOBER 2012 | ||||||||
Industry Category | Number Employed (In Thousands) | 12-Month Percent Change | ||||||
Mining and Logging | 1.3 | 0.0 | % | |||||
Construction | 86.9 | -3.7 | % | |||||
Manufacturing | 152.6 | 3.3 | % | |||||
Trade, Transportation and Utilities | 547.6 | 3.5 | % | |||||
Information | 79.0 | 0.4 | % | |||||
Financial Activities | 134.3 | -3.3 | % | |||||
Professional and Business Services | 423.1 | 3.4 | % | |||||
Educational and Health Services | 300.4 | 2.3 | % | |||||
Leisure and Hospitality | 223.6 | 0.7 | % | |||||
Other Services | 93.8 | 1.2 | % | |||||
Government | 311.6 | -1.6 | % | |||||
|
|
|
| |||||
Total Nonfarm Employment | 2,354.2 | 1.5 | % | |||||
Source: Bureau of Labor Statistics; Compiled by KTR
| Income | According to DemographicsNow.com, the 2012 average household income in Cobb County was $88,590 indicating an average annual increase of 1.70% over the 2000 average of $73,549. The average household income |
KTR Real Estate Advisors LLC
| Peak at Vinings | January 28, 2013 | |
| Atlanta, Georgia | Page 7 |
| is projected to reach $96,214 in 2017, a projected average annual increase of 1.72%. The County’s average household income growth was below the MSA and State between 2000 and 2012. This trend is projected to continue over the next five years. The County’s median household income grew at a slower pace increasing from $58,562 to $62,478 between 2000 and 2012 indicating an average annual increase of 0.56%. The median household income is projected to reach $71,913 in 2017 indicating an average annual increase of 3.02%. The County’s median household income growth was less than the MSA and State between 2000 and 2012, however, it is projected to growth is at a faster rate than both over the next five years. The average, median and per capita household incomes (2000 census, 2012 estimates and 2017 projections) for Cobb County, the Atlanta MSA and Georgia are presented in following table: |
| INCOME TRENDS | ||||||||||||||||||||
Category | 2000 Census | 2012 Estimates | 2017 Projections | Avg. Annual Growth 2000 - 2012 | Avg. Annual Growth 2012 - 2017 | |||||||||||||||
Average HH Income | ||||||||||||||||||||
Cobb County | $ | 73,549 | $ | 88,590 | $ | 96,214 | 1.70 | % | 1.72 | % | ||||||||||
Atlanta MSA | $ | 66,875 | $ | 81,219 | $ | 90,067 | 1.79 | % | 2.18 | % | ||||||||||
Georgia | $ | 56,611 | $ | 69,537 | $ | 77,310 | 1.90 | % | 2.24 | % | ||||||||||
Median HH Income | ||||||||||||||||||||
Cobb County | $ | 58,562 | $ | 62,478 | $ | 71,913 | 0.56 | % | 3.02 | % | ||||||||||
Atlanta MSA | $ | 51,888 | $ | 57,247 | $ | 65,855 | 0.86 | % | 3.01 | % | ||||||||||
Georgia | $ | 42,783 | $ | 48,611 | $ | 55,278 | 1.14 | % | 2.74 | % | ||||||||||
Per Capita Income | ||||||||||||||||||||
Cobb County | $ | 27,531 | $ | 33,234 | $ | 36,177 | 1.73 | % | 1.77 | % | ||||||||||
Atlanta MSA | $ | 24,467 | $ | 29,455 | $ | 32,746 | 1.70 | % | 2.23 | % | ||||||||||
Georgia | $ | 20,790 | $ | 25,737 | $ | 28,682 | 1.98 | % | 2.29 | % | ||||||||||
| Source: DemographicsNow.com; Compiled by KTR | ||||||||||||||||||||
| Transportation | Atlanta is at the hub of major highways and interstates connecting it with all major areas within the MSA and with all surrounding regions. Three major interstates, I-20, I 75 and I 85 converge in downtown Atlanta which is circled by I-285. MARTA operates bus and rail service in Dekalb and Fulton Counties with service to Downtown, Midtown, Buckhead and the Central Perimeter submarkets. The Hartsfield-Jackson International Airport is situated on the south side of the city, just inside the beltway. More than 1,300 flights on average leave daily to nearly 165 cities in the U.S. and 85 foreign cities making Hartsfield-Jackson the world’s top airport in passenger traffic. | |
| Conclusion | The Atlanta region benefits from its diverse economy, concentration of quality colleges and universities and high–tech infrastructure. The area has begun to rebound from the national recession with job increases in most industries. Given the regions location, transportation network, diverse and highly educated workforce, the region has good potential for growth over the long-term. | |
KTR Real Estate Advisors LLC
| Peak at Vinings | January 28, 2013 | |
| Atlanta, Georgia | Page 8 |
REGIONAL MAP

KTR Real Estate Advisors LLC
| Peak at Vinings | January 28, 2013 | |
| Atlanta, Georgia | Page 9 |
| NEIGHBORHOOD ANALYSIS | ||
| Overview | The subject property is located in an unincorporated suburban neighborhood within the City of Atlanta. Atlanta is the state capital and represents the most populous city in Georgia and is the third largest city in the United States. Atlanta today is the major economic center for the southeast region with a large presence of Fortune 500 companies. Atlanta is at the hub of major highways and interstates and is home to the world’s top airport in passenger traffic making it a major transportation hub for the United States. | |
| Population | The population in the subject’s zip code (30339) grew at an annual rate of 1.12% from 2000 to 2012, slower than the growth rate of Cobb County and the State of Georgia. DemographicsNow.com projects that the growth in the subject’s zip code will continue at a slightly slower pace through 2017. The following table illustrates the population statistics for the 30339 zip code, Cobb County and the State of Georgia from 2000 through 2017. | |
| HISTORICAL POPULATION AND PROJECTIONS | ||||||||||||||||||||
| Average Annual Growth | ||||||||||||||||||||
| 2000 Census | 2012 Estimate | 2017 Projection | 2000 - 2012 | 2012 - 2017 | ||||||||||||||||
30339 Zip Code | 17,849 | 20,248 | 21,142 | 1.12 | % | 0.88 | % | |||||||||||||
Cobb County | 607,746 | 700,521 | 737,098 | 1.27 | % | 1.04 | % | |||||||||||||
Georgia | 8,186,384 | 9,890,616 | 10,479,874 | 1.73 | % | 1.19 | % | |||||||||||||
Source: DemographicsNow |
| |||||||||||||||||||
| Income | According to DemographicsNow.com, the 2012 average household income in the subject’s zip code was $94,868 indicating an average annual increase of 1.38% over the 2000 average of $81,391. The average household income is projected to reach $102,571 in 2017, a projected average annual increase of 1.62%. The subject’s zip code median household income grew at a slower pace increasing from $57,546 to $60,170 between 2000 and 2012 indicating an average annual increase of 0.38%. The median household income is projected to reach $67,823 in 2017 indicating an average annual increase of 2.54%. The subject’s zip code per capita household income increased from $44,287 to $52,888 between 2000 and 2012 indicating an average annual increase of 1.62%. The per capita household income is projected to reach $56,403 in 2017 indicating an average annual increase of 1.33%. The average, median and per capita household incomes (2000 census, 2012 estimates and 2017 projections) for the subject’s zip code are presented in following table: |
KTR Real Estate Advisors LLC
| Peak at Vinings | January 28, 2013 | |
| Atlanta, Georgia | Page 10 |
INCOME TRENDS
| Average Annual Growth | ||||||||||||||||||||
| 2000 Census | 2012 Estimate | 2017 Projection | 2000 -2012 | 2012 -2017 | ||||||||||||||||
Average HH Inc. | $ | 81,391 | $ | 94,868 | $ | 102,571 | 1.38 | % | 1.62 | % | ||||||||||
Median HH Inc. | $ | 57,546 | $ | 60,170 | $ | 67,823 | 0.38 | % | 2.54 | % | ||||||||||
Per Capita HH Inc. | $ | 44,287 | $ | 52,888 | $ | 56,403 | 1.62 | % | 1.33 | % | ||||||||||
Source: DemographicsNow.com; Compiled by KTR
| Transportation | The subject neighborhood is well served by an extensive highway system including I-75 and I-285. Several secondary thoroughfares also traverse the immediate area and include Cumberland Parkway and Paces Ferry Road. Bus service is available via the 12 Howell Mill /Cumberland line. | |
| Surrounding Improvements | Surrounding improvements consist of gated garden style apartment complexes and some commercial uses. | |
| Conclusion | The subject neighborhood is considered to be an attractive residential location because of its excellent highway access and proximity to Atlanta’s Central Business District. | |
NEIGHBORHOOD MAP

KTR Real Estate Advisors LLC
| Peak at Vinings | January 28, 2013 | |
| Atlanta, Georgia | Page 11 |
| SITE ANALYSIS | ||
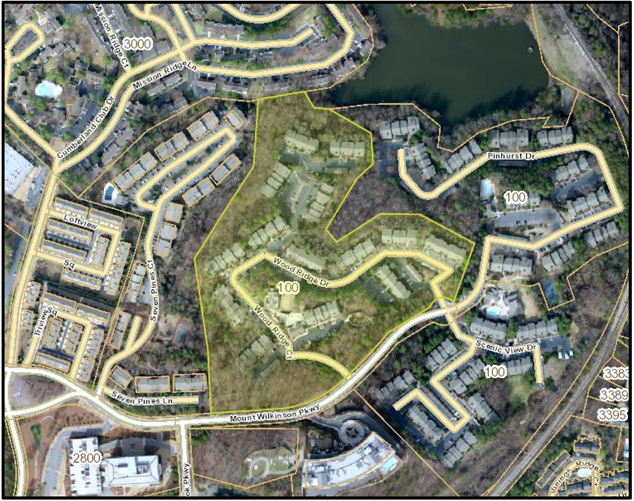
| Location | North side of Mt. Wilkinson Parkway, in an unincorporated section of the City of Atlanta, Georgia. Woodbridge Drive is the interior street within the development The physical address of the property is 100 Woodbridge Drive, City of Atlanta Georgia. | |
| Site Area | 22.00 acres, which equates to 958,320 square feet. | |
| Street Frontage | The subject has frontage along the north side of Mt. Wilkinson Parkway. | |
| Topography | The site slopes upward from the Mt. Wilkinson Parkway frontage. | |
| Shape | The parcel is irregularly shaped. The size, shape, and configuration of the subject property provide a functional layout, which is similar to competitors. | |
| Excess/Surplus Land | Traffic circulation throughout the property and an adequate number of parking spaces is provided on concrete paved drives and surface lots. The building setbacks allow for landscaped buffers, similar to surrounding properties. There does not appear to be excess or surplus land. | |
| Utilities | All customary municipal services and utility hookups are provided. | |
| Soil Information | No adverse conditions were readily apparent. | |
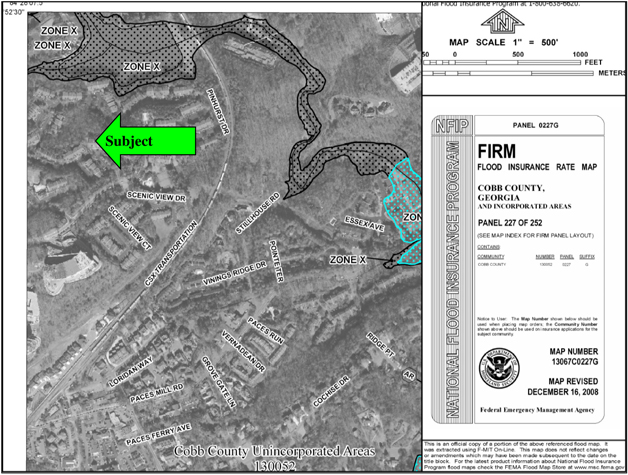
| Flood Information | The subject property is situated in Flood Zone “X”, which is an area outside of the 100-year flood plain, according to the FEMA Map 13067C0227G, dated December 16, 2008. | |
| Easements and Encroachments | No title report or survey showing the location of easements was provided in connection with this assignment. Thus, it is not possible to make a definitive conclusion regarding any potential impacts on value of the location of any such easements or encroachments. Visual observations of the site revealed no adverse easements or encroachments. It appears as though the subject is encumbered by utility and access easements typical of a developed site. It is specifically assumed that any easements, restrictions or encroachments that might appear against the title would have no adverse impact on marketability or value. | |
| Environmental | No readily observable adverse environmental site conditions were noted. No environmental reports were provided for review. | |
| Accessibility/Visibility | Ingress and egress to the property is via the Mt. Wilkinson Parkway frontage. Accessibility of the site is good. The buildings are at street grade and visible to passing traffic. | |
| Improvements | There are 14 apartment buildings, clubhouse with business center, meeting room, kitchen/gaming area, fitness center, swimming pool and mature landscaping. | |
| Conclusions | The site attributes are well suited for the existing development and use. | |
KTR Real Estate Advisors LLC
| Peak at Vinings | January 28, 2013 | |
| Atlanta, Georgia | Page 12 |
SITE MAP
KTR Real Estate Advisors LLC
| Peak at Vinings | January 28, 2013 | |
| Atlanta, Georgia | Page 13 |
FLOOD MAP
KTR Real Estate Advisors LLC
| Peak at Vinings | January 28, 2013 | |
| Atlanta, Georgia | Page 14 |
| IMPROVEMENT ANALYSIS | ||
| Year Built/Renovated | The facility was completed in 1981 as a gated garden-style apartment complex. There was a major renovation of the subject between 2008 and 2009 that upgraded all of the units and the amenities. | |
| Layout & Configuration | The complex consists of 280 apartment units within 14 apartment buildings and contains 272,390 square feet of rentable area. The buildings are sited along internal drives that are integrated with the parking lots. In addition, the property also contains a clubhouse with business center, meeting room, kitchen/gaming area, fitness center and swimming pool. | |
| Leasable Area/Unit Mix | The following chart summarizes the unit mix and sizes of the various floor plans at the subject property as indicated by a review of client provided rent roll data and floor plans. | |
UNIT MIX AND FLOOR AREAS
Type | Mix | Size | Total Area | |||||||||
1 Bed/1 Bath | 50 | 705 | 35,250 | |||||||||
1 Bed/1 Bath | 90 | 850 | 76,500 | |||||||||
2 Bed/2 Bath | 90 | 1,111 | 99,990 | |||||||||
2 Bed/2 Bath | 50 | 1,213 | 60,650 | |||||||||
Totals/Averages | 280 | 973 | 272,390 | |||||||||
Source: Client provided rent roll data and floor plans; compiled by KTR
| Floor Plans | As indicated, the property offers a variety of one-and two-bedroom floor plans. Each floor plan provides a living room off a small entry foyer and dining room off the kitchen area. Washer and dryers are provided in all of the units. In addition each unit has a private balcony. | |
| EXTERIOR | ||
| Structure | The foundations consist of reinforced concrete slabs, poured on grade. Structural framing is wood stud walls with interior gypsum-clad drywall. | |
| Floors | The floors are constructed of engineered wood trusses. The ceiling heights are approximately 10 feet. | |
| Walls | The exterior of the buildings are vinyl siding and brick. | |
| Windows | Individual unit windows are double pane glass set in aluminum frames. Entry doors are metal set in wood frames. Glass doors provide access to the balconies. | |
| Roof | The buildings have single pitched roofs with composition shingles. | |
KTR Real Estate Advisors LLC
| Peak at Vinings | January 28, 2013 | |
| Atlanta, Georgia | Page 15 |
| INTERIOR FINISHES | ||
| Walls and Ceilings | Textured and painted drywall. | |
| Flooring | Flooring consists of carpeting, wood and tile. | |
| Kitchens | Typical appliance package consisting of a refrigerator/freezer, full-size electric range with oven, microwave and dishwasher. Cabinets are wood and countertops are granite. | |
| Bathrooms | Shower/tub, toilet, vanity with sink and mirrored medicine cabinet. Tubs have a ceramic tile wainscoting. | |
| Unit Amenities | All of the units have washers/dryers, walk-in closets and balconies. Some of the units have a fireplace and built in dry or wet-bars. | |
| MECHANICAL | ||
| SYSTEMS HVAC | Air and heat is provided by individual split systems with exterior condensers. The system is similar to competing properties. | |
| Electric Service | Adequate electric service is provided. Each apartment has a separate panel. | |
| Plumbing | Apartment-grade plumbing systems are installed. Each unit is serviced by an electric water heater. | |
| Fire Protection | The subject property is not equipped with a fire sprinkler system. The apartments are fit with smoke detectors. | |
| ANCILLARY AREAS | ||
| Landscaping | Landscaping is of mature vegetation. Native trees and shrubs are plentiful throughout the common areas and between buildings. Seasonal color is provided in beds along the main entrance points and near the pool and office area. | |
| Parking | The internal drive incorporates the surface parking lots. There are an adequate number of parking spaces provided. The drives and parking lots are concrete paved. | |
| Recreational Amenities | A clubhouse with business center, meeting room, kitchen/gaming area, fitness center, swimming pool and mature landscaping. In addition, the property has shared amenities with the 2 adjacent sister properties providing additional swimming pools, fitness center, a golf simulator, movie screening room, billiards/game rooms, massage room, wine tasting room, barbeque areas, putting green and a tennis court. | |
| FF&E | ||
| Personal Property | The subject property has office furnishings at the clubhouse, clubhouse furniture and various chairs and tables for the pool deck. Kitchen appliances are considered personal property. The FF&E is similar to competitive properties. | |
KTR Real Estate Advisors LLC
| Peak at Vinings | January 28, 2013 | |
| Atlanta, Georgia | Page 16 |
| CONDITION/MAINTENANCE | ||
| Exterior | Good condition. Overall maintenance appears adequate. | |
| Roof | Good condition. | |
| Interiors | Good condition. Overall maintenance appears adequate. | |
| Common Area Amenities | Good condition. Overall maintenance appears adequate. | |
| Sidewalks & Paving | Good condition. Overall maintenance appears adequate. | |
| Landscaping | Good condition. Overall maintenance appears adequate. | |
| Environmental Conditions | No readily observable adverse conditions were noted during the site visit. | |
| ELEMENTS OF DEPRECIATION | ||
| Based on our field inspection, we note that some elements of depreciation are present at the subject property. | ||
| Physical Deterioration | The overall physical condition is average with adequate maintenance levels. Physical deterioration is primarily limited to general aging and normal wear and tear. No material elements of deferred maintenance were noted during the appraiser’s inspection of the property. Carpet and mechanical equipment in the individual units are updated and/or replaced on an as-needed basis. According to Marshall Valuation Service, buildings similar to the subject property have an economic life of approximately 50 years. The actual age of the property is 32 years. As a result of on-going maintenance and the recent renovations, the effective age is estimated to be less than the actual age. | |
Capital Improvements
Functional Obsolescence | No major capital improvements are planned in the near term.
The subject property’s design, systems and floor plans are consistent with traditional garden style apartment complexes. The property has operated at rental rates and occupancy levels that are consistent with that of other similar properties within the influencing market, attesting to its functional adequacy and market acceptance. Considering these factors, no adjustment for functional obsolescence is required. | |
| External Obsolescence | External obsolescence is a loss in value resulting from conditions that are present outside the property and is usually incurable. No site-specific external obsolescence was noted. | |
| Conclusions | The subject improvements have adequate functional utility, conforms well to the general character of the neighborhood and is generally similar to competitors. | |
KTR Real Estate Advisors LLC
| Peak at Vinings | January 28, 2013 | |
| Atlanta, Georgia | Page 17 |
| ZONING ANALYSIS | ||
| Introduction | According to Cobb County, the subject property is situated in an RM - 12 Residential Multifamily District. The purpose and intent of the RM - 12 District is to provide locations for multifamily residential uses or residentially compatible institutional and recreational uses which are within properties delineated for high density residential and regional activity center categories. | |
| The bulk restrictions in the RM - 12 - Residential Multifamily District are summarized in the following table. | ||
RM - 12 - RESIDENTIAL MULTIFAMILY DISTRICT
RESTRICTION | SIZE | |
Minimum lot area | 80,000 sq. ft | |
Minimum lot width | 75 Feet | |
Minimum front yards | 75 Feet | |
Minimum side yards | 35 Feet | |
Minimum rear yard | 40 Feet | |
Maximum height | 4 stories or 40 Feet | |
Maximum building coverage | 35 Percent | |
Maximum Units Per Acre | 12 | |
Minimum Parking | ||
Multifamily Uses | 1.75 spaces per unit |
Source: Cobb County Code of Ordinances; Compiled by KTR.
| Conclusions | The subject is built to a density of 12.73 units per acre, above the maximum of 12 units per acre. The exact number of parking spaces was not reported to the appraiser; however, according to the zoning department, the number of spaces at the subject meets current requirements. The subject property was constructed prior to the adoption of the RM-12 zoning designation in November 1990. As such, the subject appears to represent a legal and conforming use with a legal and non-complying density. |
KTR Real Estate Advisors LLC
| Peak at Vinings | January 28, 2013 | |
| Atlanta, Georgia | Page 18 |
ZONING MAP
KTR Real Estate Advisors LLC
| Peak at Vinings | January 28, 2013 | |
| Atlanta, Georgia | Page 19 |
| REAL ESTATE ASSESSMENTS AND TAXES | ||
| Overview | According to the Cobb County tax record, the subject property is identified as Parcel Number 17-0910-0-006-0. The taxes are billed annually in July and are paid in October. The taxable value is multiplied by the current tax rate to calculate the taxes payable. Revaluations occur every year. The 2013 assessment has not been released and therefore, the 2012 assessment has been utilized in this report. The subject’s 2012 assessment is shown below. | |
SUBJECT PROPERTY ASSESSMENT
Land Value | Building Value | Taxable Value | ||||||
$1,568,160 | $ | 7,380,152 | $ | 8,948,312 | ||||
Source: Cobb County Assessor’s Office
| Comparable Assessments | Similar properties within the area were surveyed to ascertain the reasonableness of the subject’s current assessment. The subject’s current assessment is $31,958 per unit. The comparables range between $32,451 and $36,719 per unit. The subject’s assessment falls slightly below the comparable range; however, based on discussions with the County Assessor, the assessment appears reasonable and has been processed. |
TAX COMPARABLES
| Property Name | Tax ID | Taxable Value | Year Built | Assessed Units | Assessment Per Unit | |||||||||||||||
Peaks at Vinings (Subject) | 17-0910-0-006-0 | $ | 8,948,312 | 1981 | 280 | $ | 31,958 | |||||||||||||
Lakeside at Vinings | 17-0950-0-061-0 | $ | 7,315,284 | 1982 | 220 | $ | 33,251 | |||||||||||||
Views at Vinings | 17-0951-0-005-0 | $ | 5,841,256 | 1983 | 180 | $ | 32,451 | |||||||||||||
Magnolia Vinings | 17-0818-0-007-0 | $ | 14,344,308 | 1997 | 400 | $ | 35,861 | |||||||||||||
Stonewood Vinings | 17-0818-0-002-0 | $ | 11,382,945 | 1997 | 310 | $ | 36,719 | |||||||||||||
Source: Cobb County Assessor, compiled by KTR
| Mill Rate | Mill rates have remained relatively stable over the past several years. The 2012 total mill rate applicable for all taxing authorities with jurisdiction over the subject property equates to $30.21 per $1,000 of assessed value. According to the County Assessor, the new mill rate will be published in July 2013. | |
| Real Estate Tax Projection | Future increases in reassessments are expected to reflect annual increases near the anticipated inflation rate during the same period. Tax rates are expected to remain relatively stable. The total amount is anticipated to increase at a rate near the long-term average inflation rate | |
| Tax Calculation | The subject’s real estate tax liability is calculated utilizing the current assessment and the prior year’s tax rate, which equates to $270,328.50. The current tax liability has been adjusted for inflation resulting in a projected tax liability of $278,438, which has been processed in the valuation. | |
KTR Real Estate Advisors LLC
| Peak at Vinings | January 28, 2013 | |
| Atlanta, Georgia | Page 20 |
| APARTMENT MARKET ANALYSIS | ||
| Area Housing Market | According to Red Capital Group, the subject is located in the Vinings area of the Smyrna submarket. Red Capital Group tracks only the Smyrna market as a whole. The immediate area is comprised of gated garden style apartment complexes with approximately 8,300 apartments. Red Capital Group indicates that as of the First Quarter 2012, the most recent data available, the vacancy rate in the submarket was 4.7%, lower than the previous year vacancy rate of 6.8%. The average asking rental rate was $723 per month an increase over the prior year’s estimate which was $704 per month. Additionally, an article published by Property Management Insider in April 2012, indicates that the Vinings area has outperformed the rest of the Atlanta Metro Area since the recession in 2009. In late 2009, at the height of the recession, occupancy in the area dropped to a low of 91.4%, which was still 300 basis points above the entire Metro Area. The article supports Red Capital Group’s current occupancy estimate at 95% and 96%. New construction in the area consists of a 302-unit project called The Heights at Stillhouse Ridge and a 314-unit project called Walton Riverwood. The Heights at Stillhouse Ridge is a luxury mid-rise community which opened in October 2012 and Walton Riverwood is a luxury mid-rise community which is scheduled to open in the Fall of 2013. | |
| Subject Property | The subject’s units have average sizes and finishes consistent with that of the market. According to the December 25, 2012 rent roll, the subject’s contract rent averages $957.16 per month. The one-bedroom units indicate an average rental range between $805.13 and $877.91 per month and the two-bedroom apartments indicate an average rental range between $1,031.27 and $1,118.93 per month. | |
| According to the December 25, 2012 rent roll, there were 15 units vacant. The average asking rents for the one bedroom apartments are $799 per month and the average asking rents for two-bedroom apartments range between $989 and $1,109 per month. Based on conversations with management, the indicated asking rents on the supplied rent roll is low due to the fact that there was reduced leasing activity in the Fourth Quarter of 2012. Management indicated that commencing in late December leasing activity picked up and asking rates continued to rise with reduced availability. | ||
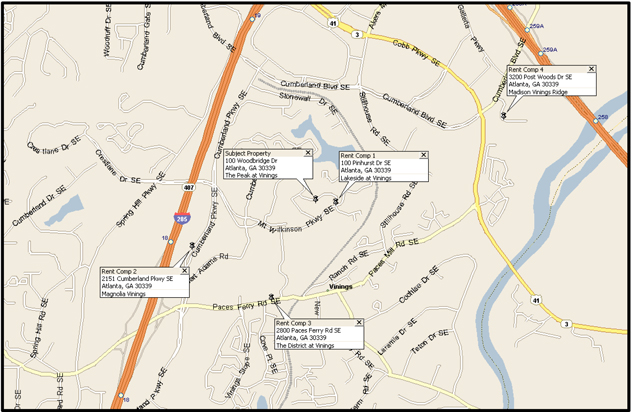
| Competitive Set | In order to determine the reasonableness of the subject’s asking rents, a survey of comparable apartment complexes in the market was conducted. The subject competes with a number of properties in the area. All of the properties are in close proximity to the subject and define the range of unit types and rental rates in the market. The information regarding the rent comparables was obtained through physical inspections and direct interviews with rental agents and property managers. The following map illustrates the location of the comparable properties in relation to the subject. Data sheets summarizing details of the comparable properties follow the map. | |
KTR Real Estate Advisors LLC
| Peak at Vinings | January 28, 2013 | |
| Atlanta, Georgia | Page 21 |
COMPARABLE RENTAL MAP
KTR Real Estate Advisors LLC
| Peak at Vinings | January 28, 2013 | |
| Atlanta, Georgia | Page 22 |
| COMPARABLE RENTAL 1 | Lakeside at Vinings 100 Pinhurst Drive Atlanta, GA 30339 |
 |  |
| Units | 220 | |
| Year Built/Renovated | 1982/2008 | |
| Occupancy | 92.7% | |
| Amenities | Washer/dryer in each unit, kitchens with standard appliances, balcony/patio and walk-in closets. Complex amenities include a business center, movie room, swimming pool and a car care center. | |
| Concessions | Prices change often and rents for individual floor plans are reduced as needed to help bolster occupancy. There are currently no concessions being offered at this comparable. | |
RENTAL DATA
Type | Size | Rent | Rent/SF | |||||||||
1 Bed/1 Bath | 705 | $ | 829 | $ | 1.18 | |||||||
1 Bed/1 Bath | 850 | $ | 929 | $ | 1.09 | |||||||
2 Bed/1 Bath | 1,111 | $ | 1,165 | $ | 1.05 | |||||||
2 Bed/2 Bath | 1,111 | $ | 1,258 | $ | 1.13 | |||||||
2 Bed/2 Bath | 1,213 | $ | 1,179 | $ | 0.97 | |||||||
3 Bed/2 Bath | 1,415 | $ | 1,389 | $ | 0.98 | |||||||
| Comments | Property is a “sister” property to subject; however, slightly superior. It is noted that the asking rents for this comparable are from the December 25, 2012 rent roll. Based on conversations with management the asking rents for the subject property should be slightly below the asking rents indicated by this comparable. |
KTR Real Estate Advisors LLC
| Peak at Vinings | January 28, 2013 | |
| Atlanta, Georgia | Page 23 |
| COMPARABLE RENTAL 2 | Magnolia Vinings 2151 Cumberland Parkway Atlanta, GA 30339 |
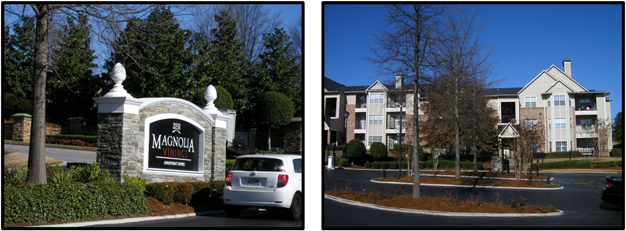
| Units | 400 | |
| Year Built | 1997 | |
| Occupancy | 95%-98% | |
| Amenities | Washer/dryer connections, butler’s pantry, walk-in closets, patios/balconies with storage space and kitchens with standard appliances. Complex amenities include a gated entrance, swimming pool, clubhouse with media lounge, tennis courts and fitness center. | |
| Concessions | Prices change often and rents for individual floor plans are reduced as needed to help bolster occupancy. There are currently no concessions being offered at this comparable. | |
RENTAL DATA
Type | Size | Rent | Rent/SF | |||||||||
1 Bed/1 Bath | 572 | $ | 765-$831 | $ | 1.34-$1.45 | |||||||
1 Bed/1 Bath | 753 | $ | 815-$935 | $ | 1.08-$1.24 | |||||||
2 Bed/1 Bath | 967 | $ | 975-1,050 | $ | 1.01-$1.09 | |||||||
2 Bed/2 Bath | 1,113 | $ | 1,015-$1,170 | $ | 0.91-$1.05 | |||||||
3 Bed/2 Bath | 1,366 | $ | 1,200-$1,370 | $ | 0.88-$1.00 | |||||||
| Comments | Property is located approximately 0.6 mile southwest of the subject property. This property is in similar condition to the subject and is in a similar area. |
KTR Real Estate Advisors LLC
| Peak at Vinings | January 28, 2013 | |
| Atlanta, Georgia | Page 24 |
| COMPARABLE RENTAL 3 | The District at Vinings 2800 Paces Ferry Road Atlanta, NC 30339 |
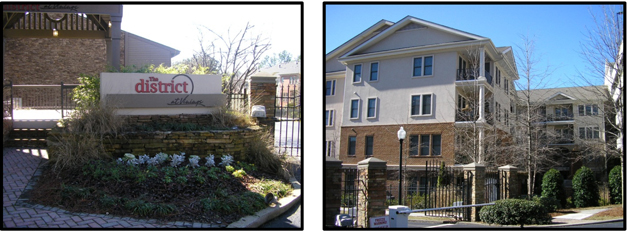
| Units | 464 | |
| Year Built/Renovated | 1971/1993 | |
| Occupancy | 95% | |
| Amenities | Washer/dryer connections in some units, patios/balconies, vaulted ceilings, ceiling fan, kitchens with standard appliances including a dishwasher and walk-in closets. Complex amenities include a laundry room, swimming pool, fitness center, putting green, 3 lakes, a Yoga/Pilates room, picnic areas with grills, walking trails, tennis courts, Dog Park, clubhouse and a business center. | |
| Concessions | Prices change often and rents for individual floor plans are reduced as needed to help bolster occupancy. There are currently no concessions being offered at this comparable. | |
KTR Real Estate Advisors LLC
| Peak at Vinings | January 28, 2013 | |
| Atlanta, Georgia | Page 25 |
RENTAL DATA
Type | Size | Rent | Rent/SF | |||||||||
Studio/1 Bath | 703 | $ | 849 | $ | 1.21 | |||||||
1 Bed/1 Bath | 758 | $ | 899 | $ | 1.19 | |||||||
1 Bed/1 Bath | 770 | $ | 949 | $ | 1.23 | |||||||
2 Bed/2 Bath | 1,048 | $ | 999 | $ | 0.95 | |||||||
2 Bed/2 Bath | 1,051 | $ | 999 | $ | 0.95 | |||||||
2 Bed/2 Bath | 1,100 | $ | 1,029 | $ | 0.94 | |||||||
2 Bed/2 Bath | 1,121 | $ | 1,029 | $ | 0.92 | |||||||
2 Bed/2 Bath | 1,288 | $ | 1,200 | $ | 0.93 | |||||||
3 Bed/2 Bath | 1,366 | $ | 1,300 | $ | 0.95 | |||||||
| Comments | Property is located approximately 0.4 miles south of the subject property. This property is in slightly inferior condition to the subject and located in a similar area. | |
KTR Real Estate Advisors LLC
| Peak at Vinings | January 28, 2013 | |
| Atlanta, Georgia | Page 26 |
| COMPARABLE RENTAL 4 | Madison at Vinings Ridge 3200 Post Woods Drive Atlanta, NC 30339 |
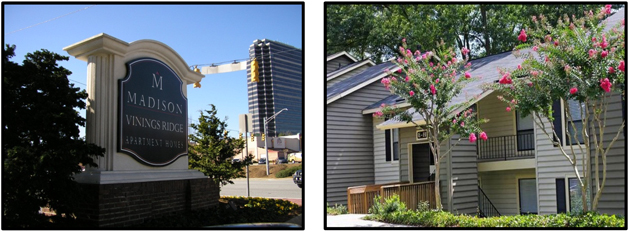
| Units | 494 | |
| Year Built | 1977 | |
| Occupancy | 96% | |
| Amenities | Washer/dryer in all units, patios/balconies, ceiling fan, kitchens with standard appliances, and fireplaces and sunrooms in select units. Complex amenities include a swimming pool, fitness center, sundeck/lounge area, tennis court, jogging trail, picnic areas with BBQ grills, clubhouse and a business center. | |
| Concessions | Prices change often and rents for individual floor plans are reduced as needed to help bolster occupancy. There are currently no concessions being offered at this comparable. | |
KTR Real Estate Advisors LLC
| Peak at Vinings | January 28, 2013 | |
| Atlanta, Georgia | Page 27 |
RENTAL DATA
Type | Size | Rent | Rent/SF | |||
1 Bed/1 Bath | 526 | $753-$818 | $1.43-$1.56 | |||
1 Bed/1 Bath | 578 | $785-$852 | $1.36-$1.47 | |||
1 Bed/1 Bath | 731-757 | $916-$995 | $1.21-$1.36 | |||
1 Bed/1 Bath | 849 | $987-$1,071 | $1.16-$1.26 | |||
2 Bed/1 Bath | 1,082 | $982-$1,052 | $0.91-$0.97 | |||
2 Bed/1 Bath | 988-1,068 | $1,043-$1,120 | $0.98-$1.13 | |||
2 Bed/1 Bath | 965-1,071 | $1,068-$1,147 | $1.00-$1.19 | |||
2 Bed/2 Bath | 1,021-1,127 | $1,083-$1,163 | $0.96-$1.14 | |||
2 Bed/2 Bath | 1,055-1,135 | $1,083-$1,159 | $0.95-$1.10 | |||
2 Bed/2 Bath | 1,184 | $1,139-$1,251 | $0.96-$1.06 | |||
2 Bed/2 Bath | 1,308 | $1,189-$1,281 | $0.91-$0.98 | |||
2 Bed/2 Bath | 1,335 | $1,267 | $0.95 | |||
2 Bed/2.5 Bath | 1,375 | $1,114-$1,1196 | $0.81-$0.87 | |||
3 Bed/2 Bath | 1,502 | $1,572-$1,611 | $1.05-$1.07 |
| Comments | Property is located approximately 0.75 miles northeast of the subject property. It is in similar condition and located in a similar area. |
KTR Real Estate Advisors LLC
| Peak at Vinings | January 28, 2013 | |
| Atlanta, Georgia | Page 28 |
| ANALYSIS | The comparable rental properties are all in the vicinity of the subject property. The comparable properties were constructed between 1971 and 1997 with subsequent renovations to most. The units and complex amenities are similar to the subject. The rental rates illustrated by the comparable properties provide a good indication as to the appropriate market rent of the subject property. As noted in the beginning of this section, management indicated that the asking rents on the supplied rent roll are low due to the fact that there was reduced leasing activity in the Fourth Quarter of 2012. Management indicated that commencing in late December leasing activity picked up and asking rates will continue to rise with reduced availability. Additionally, management feels that the asking rents for the subject property should be slightly below the asking rents indicated by Lakeside at Vinings, the adjacent “sister” property. | |
| One-Bedroom Units | The subject property offers two variations of one-bedroom floor plans, ranging between 705 and 850 square feet. The asking rental rates for the subject’s units both being $799 per month or between $0.94 and $1.13 per square foot. The following chart outlines rental rates for similar sized one – bedroom floor plans within the competing apartment properties. | |
ONE-BEROOM FLOOR PLANS
| Unit Size (SF) | Rent/Month | Rent/SF | Comment | |||||||||||||
Subject | 705 | $ | 799 | $ | 1.13 | Subject | ||||||||||
| 850 | $ | 799 | $ | 0.94 | Subject | |||||||||||
Lakeside at Vinings | 705 | $ | 829 | $ | 1.18 | Slightly Superior | ||||||||||
| 850 | $ | 929 | $ | 1.09 | Slightly Superior | |||||||||||
Magnolia Vinings | 572 | $ | 765-$831 | $ | 1.34-$1.45 | Smaller | ||||||||||
| 753 | $ | 815-$935 | $ | 1.08-$1.24 | Similar | |||||||||||
The District at Vinings | 758 | $ | 899 | $ | 1.19 | Similar | ||||||||||
| 770 | $ | 949 | $ | 1.23 | Similar | |||||||||||
Madison Vinings Ridge | 526 | $ | 753-$818 | $ | 1.43-$1.56 | Smaller | ||||||||||
| 578 | $ | 785-$852 | $ | 1.36-$1.47 | Smaller | |||||||||||
| 731-757 | $ | 916-$995 | $ | 1.21-$1.36 | Similar | |||||||||||
| 849 | $ | 987-$1,071 | $ | 1.16-$1.26 | Similar | |||||||||||
|
|
|
|
|
| |||||||||||
Subject Range | 705-850 | $ | 799 | $ | 0.94-$1.13 | |||||||||||
Comparable Range | 526-850 | $ | 753-$1,071 | $ | 1.08-$1.56 | |||||||||||
| The comparable one-bedroom units range from 526 to 850 square feet with asking rents between $753 and $1,071 per unit or $1.08 to $1.56 per square foot. The comparable properties are all similar to the subject in terms of location and physical characteristics. Based on the asking rents indicated by Lakeside at Vinings, the subject’s asking rents for the 705 square foot units appear reasonable, whereas the asking rents for the 850 square foot units appears low. Considerate of the $30 per month difference between the 705 square foot units at the two properties, an average asking rent of $899 per month has been processed for the 850 square foot. |
KTR Real Estate Advisors LLC
| Peak at Vinings | January 28, 2013 | |
| Atlanta, Georgia | Page 29 |
| Two-Bedroom Units | The subject property offers two variations of the two-bedroom floor plans, which range from 1,111 to 1,213 square feet with asking rents ranging between $989 and $1,109 per month or $0.89 to $0.91 per square foot. The comparable two-bedroom units range in size from 965 to 1,375 square feet and have monthly asking rents ranging from $975 to $1,281 or $0.81 to $1.19 per square foot. |
TWO-BEDROOM FLOOR PLANS
| Unit Size (SF) | Rent/Month | Rent/SF | Comment | |||||||||||||
Subject | 1,111 | $ | 989 | $ | 0.89 | Subject | ||||||||||
| 1,213 | $ | 1,109 | $ | 0.91 | Subject | |||||||||||
Lakeside at Vinings | 1,111 | $ | 1,165 | $ | 1.05 | Slightly Superior | ||||||||||
| 1,111 | $ | 1,258 | $ | 1.13 | Slightly Superior | |||||||||||
| 1,213 | $ | 1,179 | $ | 0.97 | Slightly Superior | |||||||||||
Magnolia Vinings | 967 | $ | 975-1,050 | $ | 1.01-$1.09 | Similar | ||||||||||
| 1,113 | $ | 1,015-$1,170 | $ | 0.91-$1.05 | Similar | |||||||||||
The District at Vinings | 1,048 | $ | 999 | $ | 0.95 | Similar | ||||||||||
| 1,051 | $ | 999 | $ | 0.95 | Similar | |||||||||||
| 1,100 | $ | 1,029 | $ | 0.94 | Similar | |||||||||||
| 1,121 | $ | 1,029 | $ | 0.92 | Similar | |||||||||||
| 1,288 | $ | 1,200 | $ | 0.93 | Similar | |||||||||||
Madison Vinings Ridge | 1,082 | $ | 982-$1,052 | $ | 0.91-$0.97 | Similar | ||||||||||
| 988-1,068 | $ | 1,043-$1,120 | $ | 0.98-$1.13 | Similar | |||||||||||
| 965-1,071 | $ | 1,068-$1,147 | $ | 1.00-$1.19 | Similar | |||||||||||
| 1,021-1,127 | $ | 1,083-$1,163 | $ | 0.96-$1.14 | Similar | |||||||||||
| 1,055-1,135 | $ | 1,083-$1,159 | $ | 0.95-$1.10 | Similar | |||||||||||
| 1,184 | $ | 1,139-$1,251 | $ | 0.96-$1.06 | Similar | |||||||||||
| 1,308 | $ | 1,189-$1,281 | $ | 0.91-$0.98 | Larger | |||||||||||
| 1,335 | $ | 1,267 | $ | 0.95 | Larger | |||||||||||
| 1,375 | $ | 1,114-$1,1196 | $ | 0.81-$0.87 | Larger | |||||||||||
|
|
|
|
|
| |||||||||||
Subject Range | 1,111-1,213 | $ | 989-$1,109 | $ | 0.89-$0.91 | |||||||||||
Comparable Range | 965-1,375 | $ | 975-$1,281 | $ | 0.81-$1.19 | |||||||||||
| The comparable properties are similar to the subject in terms of location and physical characteristics. Although the subject’s asking rents are bracketed by the rents in competing properties, they are considered below market. Considerate of the $30 per month difference between the 705 square foot one-bedroom units at the two properties, an average asking rent of $1,135 per month has been processed for the 1,111 square foot unit and $1,149 per month has been processed for the 1,213 square foot unit. |
KTR Real Estate Advisors LLC
| Peak at Vinings | January 28, 2013 | |
| Atlanta, Georgia | Page 30 |
| Conclusions | The subject is expected to continue to capture a proportionate and resaonable share of the market at the indicated economic rates. The subject’s potential gross on a monthly rent basis is summarized in the following chart. |
SUMMARY OF ECONOMIC RENT POTENTIAL
Type | Mix | Size | Total Area | Rent | Rent/SF | Total Rent | ||||||||||||||||||
1 Bed/1 Bath | 50 | 705 | 35,250 | $ | 799 | $ | 1.13 | $ | 39,950 | |||||||||||||||
1 Bed/1 Bath | 90 | 850 | 76,500 | $ | 899 | $ | 1.06 | $ | 80,910 | |||||||||||||||
2 Bed/2 Bath | 90 | 1,111 | 99,990 | $ | 1,135 | $ | 1.02 | $ | 102,150 | |||||||||||||||
2 Bed/2 Bath | 50 | 1,213 | 60,650 | $ | 1,149 | $ | 0.95 | $ | 57,450 | |||||||||||||||
|
|
|
|
|
|
|
|
|
|
|
| |||||||||||||
Totals/Averages | 280 | 973 | 272,390 | $ | 1,002 | $ | 1.03 | $ | 280,460 | |||||||||||||||
|
|
|
|
|
|
|
|
|
|
|
| |||||||||||||
KTR Real Estate Advisors LLC
| Peak at Vinings | January 28, 2013 | |
| Atlanta, Georgia | Page 31 |
| HIGHEST AND BEST USE | ||
| Introduction | Highest and Best Use is defined by the Appraisal Institute inTheDictionary of Real Estate Appraisal, Fifth Edition, Chicago, Illinois, Appraisal Institute, 2010, which states: | |
| That reasonably probable and legal use of vacant land or an improved property, which is physically possible, appropriately supported, financially feasible and that results in the highest value. The four criteria the highest and best use must meet are legal permissibility, physical possibility, financial feasibility and maximum productivity. | ||
| There are typically two Highest and Best Use scenarios: the Highest and Best Use of the property as vacant and the Highest and Best Use of the site as if improved. | ||
HIGHEST AND BEST USE AS VACANT
| ||
| Definition | Highest and Best Use As Vacant is defined as “among all reasonable, alternative uses, the use that yields the highest present land value, after payments are made for labor, capital, and coordination. The use of a property based on the assumption that the parcel of land is vacant or can be made vacant by demolishing any improvements.” | |
| The site is zoned within the RM - 12 Residential Multifamily Zoning District that allows for a variety of residential uses. The maximum value of a property is typically realized when a reasonable degree of homogeneity is present. Thus, conformity in use is usually a highly desirable aspect of real property, since it creates and/or maintains value. The immediate area is primarily developed with garden style apartment complexes. Based on the principal of conformity and the subject’s zoning, the highest and best use of the property, if vacant, is residential development. | ||
HIGHEST AND BEST USE AS IMPROVED
| Definition | Highest and Best Use As Improved is defined as “the use that should be made of a property as it exists. An existing property should be renovated or retained as is so long as it continues to contribute to the total market value of the property, or until the return from a new improvement would more than offset the cost of demolishing the existing building and constructing a new one”. | |
| The subject represents a legal, conforming improvement relative to current zoning restrictions. No redevelopment of the site would provide a greater return to the land. Based on the fact that the potential income associated with the existing improvements provide a fair return to the land with residual income to the improvements, the highest and best use of the subject, as improved, is its current use. | ||
KTR Real Estate Advisors LLC
| Peak at Vinings | January 28, 2013 | |
| Atlanta, Georgia | Page 32 |
| VALUATION PROCESS | ||
| Introduction | There are three traditional approaches that can be employed in establishing the market value of the subject property. In practice, an approach to value is included or omitted based on the property type and the quality and quantity of information available in the marketplace. These approaches and their applicability to the valuation of the subject are summarized as follows. | |
| Income Approach | The Income Capitalization Approach is based on the premise that value is derived by converting anticipated benefits into property value. Anticipated benefits include the present value of the net income and the present value of the net proceeds resulting from the re-sale of the property. | |
| There are two methods of accomplishing this: (1) direct capitalization of a single year’s income by an overall capitalization rate and; (2) the discounted cash flow in which the annual cash flows and reversionary value are discounted to a present value for the remainder of the property’s productive life or over a reasonable holding (ownership) period. | ||
| The subject property has an adequate operating history to determine the income-producing capabilities over the near future. In addition, performance levels of competitive properties serve as an adequate check as to the reasonableness of the subject property’s actual performance. As such, the income capitalization approach is utilized in this appraisal. | ||
| Sales Comparison Approach | The sales comparison approach is an estimate of value based upon a process of comparing recent sales of similar properties in the surrounding or competing areas to the subject property. Inherent in and central to this approach is the principle of substitution. This comparative process involves judgment as to the similarity of the subject property and the comparable sales with respect to many value factors such as location, contract rent levels, quality of construction, reputation and prestige, age and condition and the interest transferred, among others. The value estimated through this approach represents the probable price at which the subject property would be sold by a willing seller to a willing and knowledgeable buyer as of the date of value. | |
| The reliability of this technique is dependent upon the availability of comparable sales data, the verification of the sales data, the degree of comparability and extent of adjustment necessary for differences and the absence of atypical conditions affecting the individual sales prices. Research revealed adequate sales activity to form a reasonable estimation of value via this approach. | ||
KTR Real Estate Advisors LLC
| Peak at Vinings | January 28, 2013 | |
| Atlanta, Georgia | Page 33 |
| Cost Approach | The application of the cost approach is based on the principle of substitution. This principle may be stated as follows: no one is justified in paying more for a property than the cost to develop a substitute property of equivalent desirability and utility. In the case of a new building, no deficiencies in the building should exist. The Cost Approach is typically only a reliable indicator of value for (a) new properties; (b) special use properties; and (c) where the cost of reproducing the improvements is easily and accurately quantified and there is no external obsolescence. In all instances, the issue of an appropriate entrepreneurial profit—the reward for undertaking the risk of construction—remains a highly subjective factor. | |
| Investors are generally not buying, selling, or lending with reliance placed on the methodology of the Cost Approach to establish value. Furthermore, based on the age of the improvements and the legal non-conforming zoning of the subject property, the Cost Approach would lend little insight into the market value of the property. Accordingly, the Cost Approach has been excluded from the scope of this appraisal. | ||
| Reconciliation | The final step in the appraisal process is to reconcile the various value indications into a single final estimate. Each approach is reviewed in order to determine its appropriateness relative to the subject. The accuracy of the data available and the quantity of evidence are weighted in each approach. The resulting estimate represents the subject property’s market value as defined in the appraisal. | |
KTR Real Estate Advisors LLC
| Peak at Vinings | January 28, 2013 | |
| Atlanta, Georgia | Page 34 |
| INCOME CAPITALIZATION APPROACH | ||
| Introduction | The Income Capitalization Approach is based on the theory that value is the present worth of future benefits. The future benefits of ownership consist of the present worth of the net income which will accrue to the owner of the property, plus the present value of the net proceeds resulting from the eventual disposition of the property. The two most commonly used techniques of converting net income into value in the Income Capitalization Approach are Direct Capitalization and the Discounted Cash Flow Analysis. | |
| The Direct Capitalization method is considered most relevant and has been processed. Direct Capitalization is a method utilized to convert a single year’s estimate of net income (before debt service) into an indication of value by the use of an Overall Capitalization Rate. | ||
Revenue Analysis Potential Gross Income | The potential gross income has been calculated to be $280,460 per month or $3,365,520 for the appraised year based on the analysis and conclusions derived in the Apartment Market Analysis section. | |
| Loss to Lease/Excess Rent | Loss to lease considers a loss in income due to leases in effect, whereby effective rental rates are lower than asking or market rental rates. Conversely when rental rates are higher than asking, or market rental rates there is excess rent. In the case of the subject property, the loss to lease also accounts partially for concessions that are offered in the form of reduced rent. | |
| Loss to lease was 2.1% in 2010, 5.6% in 2011, 2.0% in 2012 and is not budgeted in 2013. The submitted rent roll indicates there is excess rent of approximately 4.5%; however, some of the asking rents at the subject were considered to be below market and have been adjusted accordingly. Based on the processed market rents and the historical, current and budgeted amounts, a stabilized loss to lease of 2.0% has been utilized. | ||
| Concessions | Concessions within the subject’s influencing area are common. Each of the properties surveyed as rent comparables offer some form of rent concession. The concessions consist of reduced rent or free rent over a portion of the lease term. As indicated above, concessions are also accounted for in the loss to lease allowance. | |
| As a percentage of the gross rent potential, the subject’s historical rent concessions have decreased as market conditions have improved being less than 1.0% in 2012. As such, concessions have not been processed. | ||
KTR Real Estate Advisors LLC
| Peak at Vinings | January 28, 2013 | |
| Atlanta, Georgia | Page 35 |
| Vacancy & Credit Loss | The subject was reportedly 96.7% occupied in 2010, 96.2% occupied in 2011, 95.2% occupied in 2012 and is budgeted for 2013 to be 94.6% occupied. As of the December 25, 2012 rent roll, the property was 94.6% occupied. It is noted that the historical and budgeted amounts include approximately 0.5%, to account for bad debt. This has been considered in the stabilized vacancy selection. The historical, current and budgeted occupancy levels are consistent with the range of occupancy levels reported by competitors in the immediate vicinity. Occupancy levels for the competing properties in the influencing market area are outlined as follows: | |
OVERVIEW OF COMPETITIVE OCCUPANCY LEVELS
Name | Year Built | Total Units | Occupancy | |||||||
Subject | 1981 | 280 | 94.6% | |||||||
Lakeside at Vinings | 1982 | 220 | 92.7% | |||||||
Magnolia Vinings | 1997 | 400 | 95.0%-98.0% | |||||||
The District at Vinings | 1971 | 464 | 95.0% | |||||||
Madison Vinings Ridge | 1977 | 494 | 96.0% | |||||||
Source: Field Survey performed by KTR
| The subject is currently operating at stabilized occupancy and should reasonably maintain this level into the foreseeable future. Considerate of such and the 0.5% bad debt inclusion, a stabilized vacancy and credit loss of 5.0% has been utilized in this appraisal. | ||
| Administrative Units | The historical operating statements indicate that there were administrative units in 2010 and 2011 that were being utilized as a model apartment. Additionally, there was a model unit for a portion of 2012 that was converted to a rental unit. According to management this unit will not be utilized as such in 2013 and therefore no administrative unit will be processed in the valuation. | |
| Other Income | The subject property receives additional revenue from sources such as utility reimbursements, parking income, vending, application fees, late fees, bad check charges and deposit forfeitures. Other income receipts at the subject property increased significantly from $929 to $1,266 per unit between 2010 and 2012. The 2013 budget is for $1,180 per unit. Based on the historical amounts, the budget appears reasonable and has been processed at $1,180 per unit or $330,299 annually. | |
| OPERATING EXPENSES | In order to estimate expenses for the subject property, we have analyzed the subject’s operating expenses for 2010, 2011 and 2012 as well as the 2013 budget. These historical amounts have been compared to the median dollar amount per unit reported by IREM for garden apartments in the Atlanta MSA. The subject’s operating statements under review have been reconstructed and summarized in the table on the following page. | |
KTR Real Estate Advisors LLC
| Peak at Vinings | January 28, 2013 | |
| Atlanta, Georgia | Page 36 |
RECONSTRUCTED OPERATING STATEMENTS
No. of Units Year | Actual | 280 2010 Per Unit | Percent | Actual | 280 2011 Per Unit | Percent | Actual | 280 2012 Per Unit | Percent | Budget | 280 2013 Per Unit | Percent | 2011 IREM Median $/Unit Atlanta MSA | |||||||||||||||||||||||||||||||||||||||
INCOME | % of GRP | % of GRP | % of GRP | % of GRP | ||||||||||||||||||||||||||||||||||||||||||||||||
Gross Rent Potential (Market Rent) | $ | 3,157,410 | $ | 11,276 | 100.0 | % | $ | 3,274,694 | $ | 11,695 | 100.0 | % | $ | 3,276,670 | $ | 11,702 | 100.0 | % | $ | 3,306,335 | $ | 11,808 | 100.0 | % | ||||||||||||||||||||||||||||
Loss to Lease | $ | (67,238 | ) | $ | (240 | ) | -2.1 | % | $ | (182,963 | ) | $ | (653 | ) | -5.6 | % | $ | (64,402 | ) | $ | (230 | ) | -2.0 | % | $ | 0 | $ | 0 | 0.0 | % | ||||||||||||||||||||||
Concessions | $ | (271,590 | ) | $ | (970 | ) | -8.6 | % | $ | (95,431 | ) | $ | (341 | ) | -2.9 | % | $ | (25,810 | ) | $ | (92 | ) | -0.8 | % | $ | 7,994 | $ | 29 | 0.2 | % | ||||||||||||||||||||||
Vacancy & Credit Loss | $ | (104,807 | ) | $ | (374 | ) | -3.3 | % | $ | (124,868 | ) | $ | (446 | ) | -3.8 | % | $ | (158,792 | ) | $ | (567 | ) | -4.8 | % | $ | (178,477 | ) | $ | (637 | ) | -5.4 | % | ||||||||||||||||||||
|
|
|
|
|
|
|
|
|
|
|
|
|
|
|
|
|
|
|
|
|
|
|
| |||||||||||||||||||||||||||||
Net Rental Income (NRI) | $ | 2,713,775 | $ | 9,692 | 86.0 | % | $ | 2,871,432 | $ | 10,255 | 87.7 | % | $ | 3,027,666 | $ | 10,813 | 92.4 | % | $ | 3,135,852 | $ | 11,199 | 94.8 | % | ||||||||||||||||||||||||||||
Administrative Units | $ | (11,229 | ) | $ | (40 | ) | -0.4 | % | $ | (13,158 | ) | $ | (47 | ) | -0.4 | % | $ | (6,005 | ) | $ | (21 | ) | -0.2 | % | $ | 0 | $ | 0 | 0.0 | % | ||||||||||||||||||||||
Other Income | $ | 260,212 | $ | 929 | 8.2 | % | $ | 270,041 | $ | 964 | 8.2 | % | $ | 354,383 | $ | 1,266 | 10.8 | % | $ | 330,299 | $ | 1,180 | 10.0 | % | ||||||||||||||||||||||||||||
|
|
|
|
|
|
|
|
|
|
|
|
|
|
|
|
|
|
|
|
|
|
|
| |||||||||||||||||||||||||||||
Total Property Income (EGI) | $ | 2,962,758 | $ | 10,581 | 93.8 | % | $ | 3,128,315 | $ | 11,173 | 95.5 | % | $ | 3,376,044 | $ | 12,057 | 103.0 | % | $ | 3,466,151 | $ | 12,379 | 104.8 | % | ||||||||||||||||||||||||||||
EXPENSES | % of EGI | % of EGI | % of EGI | % of EGI | ||||||||||||||||||||||||||||||||||||||||||||||||
Utilities | $ | 149,893 | $ | 535 | 5.1 | % | $ | 173,789 | $ | 621 | 5.6 | % | $ | 185,187 | $ | 661 | 5.5 | % | $ | 188,275 | $ | 672 | 5.4 | % | $ | 626 | ||||||||||||||||||||||||||
Maintenance & Repairs | $ | 180,080 | $ | 643 | 6.1 | % | $ | 150,823 | $ | 539 | 4.8 | % | $ | 150,910 | $ | 539 | 4.5 | % | $ | 148,271 | $ | 530 | 4.3 | % | $ | 656 | ||||||||||||||||||||||||||
Payroll | $ | 423,950 | $ | 1,514 | 14.3 | % | $ | 400,508 | $ | 1,430 | 12.8 | % | $ | 346,044 | $ | 1,236 | 10.3 | % | $ | 329,478 | $ | 1,177 | 9.5 | % | $ | 734 | ||||||||||||||||||||||||||
Marketing | $ | 84,868 | $ | 303 | 2.9 | % | $ | 63,844 | $ | 228 | 2.0 | % | $ | 58,884 | $ | 210 | 1.7 | % | $ | 52,510 | $ | 188 | 1.5 | % | $ | 0 | ||||||||||||||||||||||||||
Administration/Office | $ | 99,514 | $ | 355 | 3.4 | % | $ | 116,683 | $ | 417 | 3.7 | % | $ | 144,507 | $ | 516 | 4.3 | % | $ | 129,620 | $ | 463 | 3.7 | % | $ | 695 | ||||||||||||||||||||||||||
Management Fee | $ | 147,391 | $ | 526 | 5.0 | % | $ | 156,303 | $ | 558 | 5.0 | % | $ | 168,380 | $ | 601 | 5.0 | % | $ | 173,308 | $ | 619 | 5.0 | % | $ | 287 | ||||||||||||||||||||||||||
Insurance | $ | 82,047 | $ | 293 | 2.8 | % | $ | 103,527 | $ | 370 | 3.3 | % | $ | 88,750 | $ | 317 | 2.6 | % | $ | 90,533 | $ | 323 | 2.6 | % | $ | 169 | ||||||||||||||||||||||||||
Real Estate Taxes | $ | 214,086 | $ | 765 | 7.2 | % | $ | 174,854 | $ | 624 | 5.6 | % | $ | 283,974 | $ | 1,014 | 8.4 | % | $ | 281,140 | $ | 1,004 | 8.1 | % | $ | 876 | ||||||||||||||||||||||||||
Reserves | $ | 0 | $ | 0 | 0.0 | % | $ | 0 | $ | 0 | 0.0 | % | $ | 0 | $ | 0 | 0.0 | % | $ | 0 | $ | 0 | 0.0 | % | $ | 0 | ||||||||||||||||||||||||||
|
|
|
|
|
|
|
|
|
|
|
|
|
|
|
|
|
|
|
| |||||||||||||||||||||||||||||||||
TOTAL EXPENSES | $ | 1,381,829 | $ | 4,935 | 46.6 | % | $ | 1,340,331 | $ | 4,787 | 42.8 | % | $ | 1,426,636 | $ | 5,095 | 42.3 | % | $ | 1,393,135 | $ | 4,975 | 40.2 | % | $ | 4,043 | ||||||||||||||||||||||||||
NET OPERATING INCOME | $ | 1,580,929 | $ | 5,646 | 53.4 | % | $ | 1,787,984 | $ | 6,386 | 57.2 | % | $ | 1,949,408 | $ | 6,962 | 57.7 | % | $ | 2,073,016 | $ | 7,404 | 59.8 | % | ||||||||||||||||||||||||||||
Source: Client Submitted Information; compiled by KTR
KTR Real Estate Advisors LLC
| Peak at Vinings | January 28, 2013 | |
| Atlanta, Georgia | Page 37 |
| Overview | All of the expenses have fluctuated during the past couple of years. In general, expenses are consistent with market data and reflect stabilized operations. No major changes in operations are expected or appear to be required. Expenses are expected to grow at the average annual inflation rate. Each of the expense items is discussed separately below. | |
| Utilities | This expense line item includes charges for common area and individual unit gas, electricity, water/sewer and trash collection. At the subject property, electric is directly metered, while water, gas and trash are billed to tenants by the owner. Utility reimbursements are included in the other income receipts. | |
| The utility expenses at the subject property were $535 per unit in 2010, $621 per unit in 2011, $661 per unit in 2012 and are budgeted at $672 per unit in 2013. The IREM survey indicated that the median for garden complexes in the MSA is $626 per unit, below the budgeted amount. The historical expenses have been utilized as the primary basis for projecting utilities at the subject. Considerate of the fact that the historical utilities expense have increased between 6% and 16% annually since 2010 and the budget represents only a 2% increase over the 2012 amount, the budget appears low. Based on such, the 2012 expense has been increased by 5% to the amount of $695 per unit or $194,600, annually, which has been processed. | ||
| Repairs & Maintenance | This expense line item includes charges for general maintenance and repairs, alarm monitoring and protection services, landscaping and make-ready/turnover. The property appears adequately maintained with no noticeable items of deferred maintenance observed during the walk-thru. | |
| The repairs and maintenance expense at the subject property were $643 per unit in 2010, $539 per unit in 2011, $539 per unit in 2012 and are budgeted at $530 per unit in 2013. The IREM survey indicated that the median for garden complexes in the MSA is $656 per unit, above the historical amounts. As repairs and maintenance vary from property to property the historical expenses appear reasonable. As the budget represents a slight decrease from the 2011 and 2012 historical amounts, which are both just over $150,000 annually, a repairs and maintenance expense of $150,000 or $536 per unit has been processed. A separate Reserves category has been processed in this analysis. | ||
| Payroll | This expense includes payroll and benefits for the property manager, leasing agent(s), housekeeping and maintenance personnel. The payroll expenses were $1,514 per unit in 2010, $1,430 per unit in 2011, $1,236 per unit in 2012 and are budgeted at $1,177 per unit in 2013. Based on discussion with management, the payroll decrease between 2010 and 2011 was due to the reduction of previously increased staffing associated with the significant renovation. The expense decreased further between 2011 and 2012 due to the elimination of the general manager position and overtime hours. Management budgeted for a further decrease in 2013, which will fully reflect the loss decrease in staffing and overtime hours. The IREM survey indicated that the median for garden complexes in the MSA is $734 per unit, below the historical amounts; however, some of this expense is combined with the administrative expense. Considerate of the historical expense data, the budgeted payroll expense has been processed at $1,177 per unit or $329,480 (rounded) annually. | |
KTR Real Estate Advisors LLC
| Peak at Vinings | January 28, 2013 | |
| Atlanta, Georgia | Page 38 |
| Marketing | This expense includes advertising, the cost of resident and locator referrals, internal leasing commissions, brochures, newsletters and resident activities. The historical marketing charges at the subject property were $303 per unit in 2010, $228 per unit 2011, $210 per unit in 2012 and are budgeted at $188 per unit in 2013. The IREM survey did not report a marketing expense. This expense fluctuates based on occupancy and market conditions. Considerate of the improved market conditions over the past few years, the subject’s current occupancy and the historical amounts, the budgeted marketing expense of $188 per unit or $52,510 annually has been processed. | |
| Administration/Office | This category includes administrative charges and costs associated with the running of the management/leasing office including telephone service, office supplies equipment rental, computers, etc. The administrative expenses at the subject property were $355 per unit in 2010, $417 per unit in 2011, $516 per unit in 2012 and are budgeted at $463 per unit in 2013. The IREM survey indicated that the median for garden complexes in the MSA is $695 per unit, above the historical amounts; however, some of this expense may be considered part of the payroll expense. Based on the historical data, the budgeted administrative expense of $463 per unit or $129,620 has been processed. | |
| Management Fee | In the local market management services are typically a function of the revenues produced by the property. The historical and budgeted statements indicate that the subject property has been managed for a fee that is equivalent to approximately 5.0% of collected income and therefore, has been processed as such. | |
| Insurance | Insurance includes fire, liability, theft, and boiler, exclusive of the premiums paid to employee benefit plans. The historical insurance expenses at the subject property were $293 per unit in 2010, $370 per unit in 2011, $317 per unit in 2012 and are budgeted at $323 per unit in 2013. The IREM survey indicated that the median for garden complexes in the MSA is $169 per unit, below the historical amounts. Most reliance has been placed on the historical expenses. As such, the budgeted insurance expense of $323 per unit or $90,535 (rounded) annually has been processed. | |
| Real Estate Taxes | Real estate taxes are processed as discussed within the Real Estate Assessment and Tax Analysis section of this appraisal. The real estate tax projection is $278,438. It is noted that the supplied statements include personal property taxes resulting in higher amounts than the processed taxes. | |
| Reserves | Prudent management budgets a certain amount each year in a sinking fund to replace short-lived items including kitchen appliances and cabinets, bathroom fixtures and tiling, flooring repairs, HVAC replacement and common elements such as the roof, exterior wood and parking areas. | |
KTR Real Estate Advisors LLC
| Peak at Vinings | January 28, 2013 | |
| Atlanta, Georgia | Page 39 |
| Reserves for replacement, while typically not found in submitted operating statements, are necessary in estimating a realistic operating budget so as to maintain the habitability of the apartments. Reserves for replacement for a property of this vintage typically range from $200 to $300 per unit. As such, reserves of $250 per unit or $70,000 annually have been processed. | ||
| Total Expenses | On a stabilized basis, the subject’s projected expenses including reserves are projected at $1,468,195, or $5,244 per unit. The indicated operating expense ratio is 42.4% when including reserves and 40.4% without reserves. The IREM survey indicated total operating expenses slightly below the projected amounts, largely due to taxes, marketing fees and reserves. Therefore, these expenses are considered reasonable and have been processed. | |
| VALUATION PRO FORMA | The following pro forma summarizes the stabilized income and expenses described above for the appraised fiscal year. | |
STABILIZED PRO FORMA
| Total | Per Unit | Percent | ||||||||||
INCOME | % of GPI | |||||||||||
Gross Rent Potential (Market Rent) | $ | 3,365,520 | $ | 12,020 | 100.0 | % | ||||||
Loss to Lease | $ | (67,310 | ) | $ | (240 | ) | -2.0 | % | ||||
Concessions | $ | 0 | $ | 0 | 0.0 | % | ||||||
Vacancy & Credit Loss | $ | (168,276 | ) | $ | (601 | ) | -5.0 | % | ||||
|
|
|
|
|
| |||||||
Net Rental Income (NRI) | $ | 3,129,934 | $ | 11,178 | 93.0 | % | ||||||
Administrative Units | $ | 0 | $ | 0 | 0.0 | % | ||||||
Other Income | $ | 330,299 | $ | 1,180 | 9.8 | % | ||||||
|
|
|
|
|
| |||||||
Total Property Income (EGI) | $ | 3,460,233 | $ | 12,358 | 102.8 | % | ||||||
EXPENSES | % of EGI | |||||||||||
Utilities | $ | 194,600 | $ | 695 | 5.6 | % | ||||||
Maintenance & Repairs | $ | 150,000 | $ | 536 | 4.3 | % | ||||||
Payroll | $ | 329,480 | $ | 1,177 | 9.5 | % | ||||||
Marketing | $ | 52,510 | $ | 188 | 1.5 | % | ||||||
Administration/Office | $ | 129,620 | $ | 463 | 3.7 | % | ||||||
Management Fee | $ | 173,012 | $ | 618 | 5.0 | % | ||||||
Insurance | $ | 90,535 | $ | 323 | 3.0 | % | ||||||
Real Estate Taxes | $ | 278,438 | $ | 994 | 8.0 | % | ||||||
Reserves | $ | 70,000 | $ | 250 | 2.0 | % | ||||||
|
|
|
|
|
| |||||||
TOTAL EXPENSES | $ | 1,468,195 | $ | 5,244 | 42.4 | % | ||||||
NET OPERATING INCOME | $ | 1,992,038 | $ | 7,114 | 57.6 | % | ||||||
DERIVATION OF OVERALL CAPITALIZATION RATE
| Overall Capitalization Rate | This appraisal will consider the following techniques; (a) derivation from comparable sales and (b) investor surveys. | |
| Derivation from Sales | The following table summarizes five sales of garden apartment complexes in the competing market that closed between March and December 2012. The overall capitalization rates range from 4.8% to 6.5%. This data is supportive of the range indicated by the PwC Investor Survey for apartments in the Southeast Region. | |
KTR Real Estate Advisors LLC
| Peak at Vinings | January 28, 2013 | |
| Atlanta, Georgia | Page 40 |
CAPITALIZATION RATES
Name - Address | # of Units | Year Built | Date of Sale | Consideration | Overall Rate | |||||||||
Arbor Hills—2696 N Druid Hills Rd NE | 500 | 1987 | Dec-12 | $ | 48,200,000 | 5.00 | % | |||||||
The Arlington at Perimeter Center—57 Trowbridge Lake Rd | 204 | 1980 | Oct-12 | $ | 16,800,000 | 6.50 | % | |||||||
Legacy Century Center—100 Windmont Dr | 178 | 1978 | Aug-12 | $ | 11,850,000 | 6.25 | % | |||||||
West Haven Apartments—3000 Paces Walk NW | 610 | 1984 | May-12 | $ | 57,000,000 | 5.50 | % | |||||||
Mariposa Loft Apartments—100 Montag Cir | 253 | 2004 | Mar-12 | $ | 40,000,000 | 4.80 | % | |||||||
| Average | 5.61 | % | ||||||||||||
Source: Costar
| The capitalization rates produced by these sales are reliable indicators regarding an appropriate rate for the subject property. All of the comparables are considered similar in terms of size and are current sales. The subject property would likely trade at a rate within the range indicated by these properties. | ||
| Investor Surveys | According to thePwC Real Estate Investor Survey, Fourth Quarter 2012rates for apartments reported by survey participants active in the market presently range as shown. | |
SOUTHEAST REGION APARTMENT MARKET SURVEY
| 4.50% - 7.00% | Range | |||||
Overall Capitalization Rate | ||||||
| 5.94% | Average | |||||
| (10.00%) - 4.00% | Range | |||||
Annual Rent Growth Rate | ||||||
| 1.38% | Average | |||||
| 1.00% - 3.00% | Range | |||||
Annual Expense Growth Rate | ||||||
| 2.58% | Average |
Source: PwC Real Estate Investor Survey, Fourth Quarter 2012
| As indicated as follows, overall rates in the National Apartment Market began to increase in the Third Quarter 2008 and continued this trend through the Fourth Quarter of 2009; however, during the remainder of 2010 and 2011, average overall rates decreased by an average of 28 basis points per quarter. In 2012, the average overall rate increased slightly in the Frist Quarter then decreased by 11 basis points at the end of the year. This data seems to support the overall perception that multi-family housing has passed its nadir and is attracting significant investor interest resulting in appreciation over 2009 levels. |
KTR Real Estate Advisors LLC
| Peak at Vinings | January 28, 2013 | |
| Atlanta, Georgia | Page 41 |
OVERALL CAPITALIZATION RATE TRENDS
Quarter | Average | Basis Point Change | ||
4Q12 | 5.72 % | -2 | ||
3Q12 | 5.74 % | -2 | ||
2Q12 | 5.76 % | -7 | ||
1Q12 | 5.83 % | 3 | ||
4Q11 | 5.80 % | -18 | ||
3Q11 | 5.98 % | -12 | ||
2Q11 | 6.10 % | -19 | ||
1Q11 | 6.29 % | -22 | ||
4Q10 | 6.51 % | -61 | ||
3Q10 | 7.12 % | -56 | ||
2Q10 | 7.68 % | -17 | ||
1Q10 | 7.85 % | -18 | ||
4Q09 | 8.03 % | 19 | ||
3Q09 | 7.84 % | 35 | ||
2Q09 | 7.49 % | 61 | ||
1Q09 | 6.88 % | 75 | ||
4Q08 | 6.13 % | 27 | ||
3Q08 | 5.86 % | 11 | ||
2Q08 | 5.75 % | -4 | ||
1Q08 | 5.79 % | 4 |
Source: PwC Real Estate Investor Survey
| Conclusion of OAR | The subject is a good quality apartment complex situated in an established residential neighborhood with good access. The property is proximate to employment centers, shopping and neighborhood support facilities. The subject has unit sizes that reflect market parameters and an amenity package that is typical of the properties in the competitive market. The subject was 94.6% occupied as of the December 25, 2012 rent roll. | |
| An OAR ranging between 4.8% and 6.5% was indicated from comparable sales. The PwC survey indicates an average rate for the national apartment market of 5.72% and an average rate for the South Region apartment market of 5.94% as of the Fourth Quarter 2012. The subject property is a good quality property and should trade at an overall rate in-line with the survey average. In consideration of the preceding data, with primary emphasis placed on the rates extracted from sales data, a rate of 5.75% has been processed. | ||
KTR Real Estate Advisors LLC
| Peak at Vinings | January 28, 2013 | |
| Atlanta, Georgia | Page 42 |
| Value by Direct Capitalization | Value is calculated by dividing the stabilized net operating income, including an allowance for Reserves by the concluded overall capitalization rate. Thus, the market value of the leased fee interest is calculated as follows: | |
| $1,992,038 ÷ 5.75% = $34,644,139 | ||
| Direct Capitalization Value | ||
| Conclusion | The Market Value of the Leased Fee Interest in the subject property, free and clear of financing, by the Direct Capitalization method of the Income Capitalization Approach, as of January 18, 2013, is rounded to: | |
| THIRTY FOUR MILLION SIX HUNDRED THOUSAND DOLLARS | ||
| ($34,600,000) | ||
KTR Real Estate Advisors LLC
| Peak at Vinings | January 28, 2013 | |
| Atlanta, Georgia | Page 43 |
SALES COMPARISON APPROACH
VALUATION METHODOLOGY | The basic steps in processing the sales comparison approach are outlined as follows: | |
1. Research the market for recent sales transactions, listings, and offers to purchase or sell properties similar to the subject property. | ||
2. Select a relevant unit of comparison and develop a comparative analysis. | ||
3. Compare comparable properties with the subject using the elements of comparison and adjust the price of each comparable to the subject property. | ||
4. Reconcile the various value indications produced by the analysis of the comparables. | ||
REGIONAL SALES MARKET | The local market has been active in terms of investment sales of similar properties. Adequate sales exist to formulate a defensible value for the subject property via sales comparison. | |
PRESENTATION OF COMPARABLE SALES | To estimate the property value by the sales comparison approach, comparable sales from the influencing market that are most similar to the subject property in terms of age, size, tenant profile and location have been analyzed. The sales are compared on a price-per-unit basis, as this is a common method of comparison for such properties. | |
| The comparable sales summarized in the table that follows and plotted on the following map, range in price from $87,237 to $136,290 per unit. While these unit prices implicitly contain both the physical and economic factors affecting real estate, these statistics do not explicitly convey many of the details surrounding a specific property. Thus, this single index to the valuation of the subject property has some limitations. | ||
KTR Real Estate Advisors LLC
| Peak at Vinings | January 28, 2013 | |
| Atlanta, Georgia | Page 44 |
PRESENTATION OF COMPARABLE SALES DATA
Sale No. | Subject | 1 | 2 | 3 | 4 | |||||
Name | Peak at Vinings | Parc at Perimeter | Stonewood at Vinings | Vinings at River Parkway | West Haven Apartments | |||||
Location | 100 Woodbridge Dr | 6210 Peachtree Dunwoody Rd NE | 2158 Cumberland Parkway | 4545 River Parkway | 3000 Paces Walk NW | |||||
| Atlanta, GA | Atlanta, GA | Atlanta, GA | Atlanta, GA | Atlanta, GA | ||||||
Grantor | Centennial Perimeter Park, LLC | Broadstone at Vinings Prisa 1058, LLC | CRP-2 Holdings Vinings, LLC | ERP Operating | ||||||
Grantee | SCG/TB Century Perimeter Park, LLC | Fairfield Vinings LLC | Northside Parkway Partners, LLC | The Realty Associates Fund X, LP | ||||||
Sales Price | $39,700,000 | $42,250,000 | $37,250,000 | $57,000,000 | ||||||
Sale Date | 10/12/2012 | 9/4/2012 | 8/20/2012 | 5/29/2012 | ||||||
Year Built | 1981/2008-09 | 1998 | 1997 | 1973 | 1989 | |||||
No. of Units | 280 | 298 | 310 | 427 | 610 | |||||
Net Rentable Area (SF) | 272,390 | 337,527 | 364,988 | 491,640 | 593,922 | |||||
Avg. Unit Size (SF) | 973 | 1,133 | 1,177 | 1,151 | 974 | |||||
Occuapncy | 94.6% | 99.0% | 97.0% | 93.0% | 96.0% | |||||
Price/SF | $117.62 | $115.76 | $75.77 | $95.97 | ||||||
Price/Unit | $133,221 | $136,290 | $87,237 | $93,443 | ||||||
Net Income | N/A | N/A | N/A | $3,135,000 | ||||||
NOI/SF | N/A | N/A | N/A | $5.28 | ||||||
NOI/Unit | N/A | N/A | N/A | $5,139 | ||||||
Cap Rate (OAR) | N/A | N/A | N/A | 5.50% | ||||||
EGIM | N/A | N/A | N/A | N/A | ||||||
Expense Ratio (OER) | N/A | N/A | N/A | N/A |
COMPARABLE SALES MAP
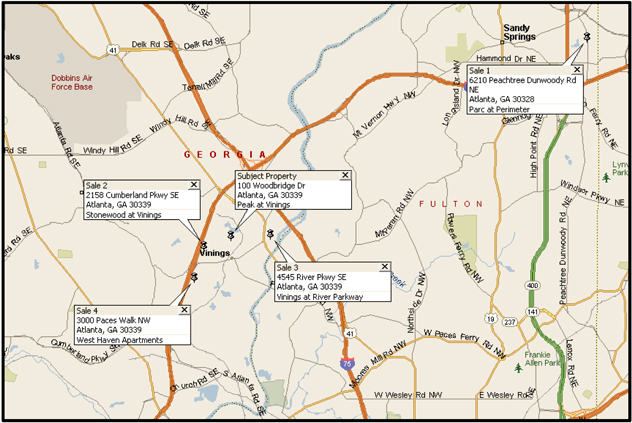
KTR Real Estate Advisors LLC
| Peak at Vinings | January 28, 2013 | |
| Atlanta, Georgia | Page 45 |
ANALYSIS OF SALES | The comparables are examined by considering the following adjustment factors. | |
Ownership Interest | No adjustments are necessary, since all of the sales reflect a 100.0% transfer of ownership interest. | |
Financing Terms | The comparable sales were either all cash transactions or were financed by primary lenders at market-oriented rates. Considerate of such, no adjustments for any unusual or atypical financing is required. | |
Conditions of Sale | Adjustments for conditions of sale usually reflect the motivations of the buyer and the seller. We are not aware of any atypical circumstances regarding any of the comparable sales. Personal property is included as all facilities have similar unit appliance requirements and miscellaneous office and common area FF&E. | |
Expenditures Made | Any required major capital costs incurred by the buyer immediately after the sale is appropriately added to the purchase price. None of the sales required any specific sale price adjustments other than what is included in general comparisons based on condition. | |
Market Conditions (Time) | Comparable sales that occurred under different market conditions than those applicable to the subject property as of the effective date of appraisal require adjustment for any differences that affect their values. The comparable sales illustrated in the survey occurred between May and October 2012. A matched sale analysis was conducted so as to afford insight into an appropriate time adjustment. Matched sales of two properties were uncovered. The first is Sale No. 1, which sold in December 2009 for $33,000,000 and was resold in October 2012 for $39,700,000 representing an approximate 0.6% per month increase between the sales. The second sale is of the Mariposa Loft Apartments which sold in September 2009 for $28,750,000 and was resold in March 2012 for $40,000,000 representing an approximate 1.3% per month increase between the sales. Since the comparables represent the sale and subsequent re-sale of the same property, no other adjustments were necessary and the results are considered excellent indicators of an appropriate time adjustment. It is noted however, that the majority of the appreciation happened between 2009 and the year-end 2011 as evidenced by the relatively flat OARs in 2012. Based on such, no adjustment has been applied to the comparable sales to account for market conditions. | |
Location | An adjustment for location is appropriate when the location characteristics of a comparable property are different than those of the subject. Adjustments have been made on an individual basis. | |
Physical Characteristics | Physical differences include differences in building size, quality of construction, building materials, age, condition, functional utility and appearance. Typically significantly larger complexes trade for less on a per unit basis. Adjustments to the comparables have been applied on an individual basis. | |
KTR Real Estate Advisors LLC
| Peak at Vinings | January 28, 2013 | |
| Atlanta, Georgia | Page 46 |
Average Unit Size | The analysis is processed based on the price per unit. The subject has an average unit size of 973 square feet. Properties with larger average unit sizes tend to trade at higher prices, all other factors being equal. Conversely, properties with smaller unit sizes tend to trade at a lower price per unit. The average unit size of each comparable property is compared to the subject and applicable adjustments are applied when warranted. | |
Amenities | The subject offers an amenity package that is typical in the market. All of the comparables offer similar amenities and as such no adjustments have been applied to the comparables. | |
Economic Characteristics | Economic characteristics include all the attributes of a property that affect its income. The subject’s processed average market rent is $1,002 per unit per month. Adjustments to the comparables have been made on an individual basis. | |
| The following is a brief description of the relevant building sales considered pertinent in the valuation of the subject property. | ||
KTR Real Estate Advisors LLC
| Peak at Vinings | January 28, 2013 | |
| Atlanta, Georgia | Page 47 |
Comparable Sale No. 1
Property Name: | Parc at Perimeter | |
Location: | 6210 Peachtree Dunwoody Road NE | |
Neighborhood: | Atlanta, GA | |
Parcel ID: | 17-0018-LL-099 | |
Date of Sale: | October 21, 2012 | |
Grantor: | Centennial Perimeter Park, LLC | |
Grantee: | SCG/TB Century Perimeter Park, LLC | |
Consideration: | $39,700,000 | |
Number of Units: | 298 | |
Size (Sq. Ft.): | 337,527 square feet | |
Year Built: | 1998 | |
1998Occupancy: | 99.0% | |
Price per Unit: | $133,221 per unit | |
Price per Square Foot: | $117.62 per square foot | |
OAR: | N/A |
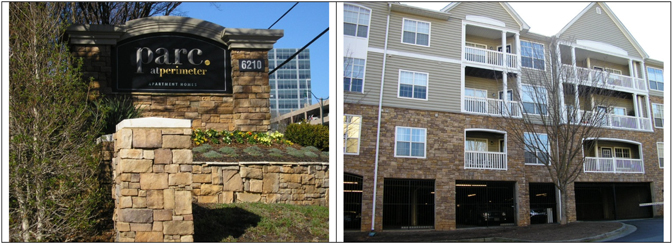
Analysis: | An upward adjustment for market conditions has been processed resulting in a time adjusted price of $137,218 per unit. The comparable is located in the Sandy Springs section of Atlanta, which is considered a superior location to that of the subject and accordingly a slight downward adjustment has been applied for location. Age, condition and quality are considered similar requiring no adjustment. This comparable’s average unit size is 1,133 square feet which is considered superior to the subject’s average unit size of 973 square feet and therefore a downward adjustment has been applied for average unit size. Amenities at the comparable are considered similar and no adjustment has been applied. The average rent for this comparable is $1,172 per unit per month. The subject’s average rent is $1,002 per unit per month, inferior to the comparable and a downward adjustment has been processed for economics. Overall, a downward adjustment to the market adjusted unit price is warranted. |
KTR Real Estate Advisors LLC
| Peak at Vinings | January 28, 2013 | |
| Atlanta, Georgia | Page 48 |
Comparable Sale No. 2
Property Name: | Stonewood at Vinings | |
Location: | 2158 Cumberland Parkway | |
Neighborhood: | Atlanta, GA | |
Parcel ID: | 17-0818-0-002-0 | |
Date of Sale: | September 4, 2012 | |
Grantor: | Broadstone at Vinings Prisa 1058, LLC | |
Grantee: | Fairfield Vinings LLC | |
Consideration: | $42,250,000 | |
Number of Units: | 310 | |
Size (Sq. Ft.): | 364,988 square feet | |
Year Built: | 1997 | |
Occupancy: | 97.0% | |
Price per Unit: | $136,290 per unit | |
Price per Square Foot: | $115.76 per square foot | |
OAR: | N/A |
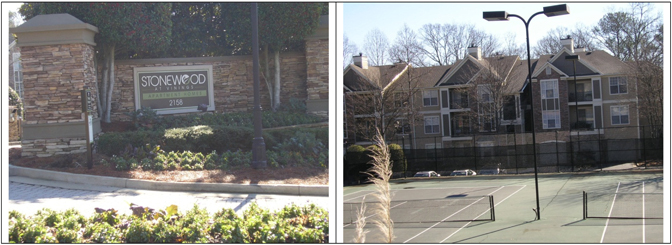
Analysis: | An upward adjustment for market conditions has been processed resulting in a time adjusted price of $141,742 per unit. The comparable is located in a similar area of the Vinings neighborhood and no adjustment is warranted for location. Age, condition and quality are considered similar requiring an no adjustment. This comparable’s average unit size is 1,177 square feet which is considered superior to the subject’s average unit size of 973 square feet and therefore a downward adjustment has been applied for average unit size. Amenities at the comparable are considered similar and no adjustment has been applied. The average rent for this comparable is $1,084 per unit per month. The subject’s average rent is $1,002 per unit per month, similar to the comparable and no adjustment has been processed for economics. Overall, a downward adjustment to the market adjusted unit price is warranted. |
KTR Real Estate Advisors LLC
| Peak at Vinings | January 28, 2013 | |
| Atlanta, Georgia | Page 49 |
Comparable Sale No. 3
Property Name: | Vinings at River Parkway | |
Location: | 4545 River Parkway | |
Neighborhood: | Atlanta, GA | |
Parcel ID: | 17-1016-0-003-0 | |
Date of Sale: | August 20, 2012 | |
Grantor: | CRP-2 Holdings Vinings, LLC | |
Grantee: | Northside Parkway Partners, LLC | |
Consideration: | $37,250,000 | |
Number of Units: | 427 | |
Size (Sq. Ft.): | 491,640 square feet | |
Year Built: | 1973 | |
Occupancy: | 93.0% | |
Price per Unit: | $87,237 per unit | |
Price per Square Foot: | $75.77 per square foot | |
OAR: | N/A |
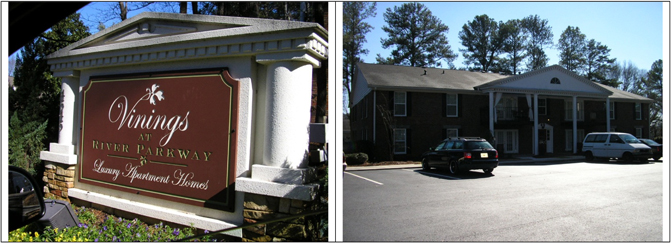
| Analysis: | An upward adjustment for market conditions has been processed resulting in a time adjusted price of $91,599 per unit. The comparable is located in a slightly inferior area of the Vinings neighborhood and an upward adjustment is warranted for location. Age, condition and quality are considered inferior requiring an upward adjustment. This comparable’s average unit size is 1,151 square feet which is considered superior to the subject’s average unit size of 973 square feet and therefore a downward adjustment has been applied for average unit size. Amenities at the comparable are considered similar and no adjustment has been applied. The average rent for this comparable is $950 per unit per month. The subject’s average rent is $1,002 per unit per month, similar to the comparable and no adjustment has been processed for economics. Overall, an upward adjustment to the market adjusted unit price is warranted. |
KTR Real Estate Advisors LLC
| Peak at Vinings | January 28, 2013 | |
| Atlanta, Georgia | Page 50 |
Comparable Sale No. 4
Property Name: | West Haven Apartments | |
Location: | 3000 Paces Walk NW | |
Neighborhood: | Atlanta, GA | |
Parcel ID: | 17-0887-0-115-0, 17-0888-0-019-0, 17-0888-0-001-0 & | |
| 17-0839-0-039-0 | ||
Date of Sale: | May 29, 2012 | |
Grantor: | ERP Operating | |
Grantee: | The Realty Associates Fund X, LP | |
Consideration: | $57,000,000 | |
Number of Units: | 610 | |
Size (Sq. Ft.): | 593,922 square feet | |
Year Built: | 1989 | |
Occupancy: | 96.0% | |
Price per Unit: | $93,443 per unit | |
Price per Square Foot: | $95.97 per square foot | |
OAR: | 5.5% |
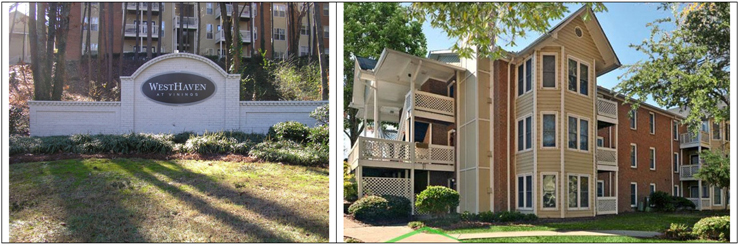
| Analysis: | An upward adjustment for market conditions has been processed resulting in a time adjusted price of $99,984 per unit. The comparable is located in a similar area of the Vinings neighborhood and no adjustment is warranted for location. Age, condition and quality are considered inferior requiring an upward adjustment. This comparable’s average unit size is 974 square feet which is considered similar to the subject’s average unit size of 973 square feet and therefore no adjustment has been applied for average unit size. Amenities at the comparable are considered similar and no adjustment has been applied. The average rent for this comparable is $958 per unit per month. The subject’s average rent is $1,002 per unit per month, similar to the comparable and no adjustment has been processed for economics. Overall, an upward adjustment to the market adjusted unit price is warranted. |
KTR Real Estate Advisors LLC
| Peak at Vinings | January 28, 2013 | |
| Atlanta, Georgia | Page 51 |
COMPARABLE SALES ADJUSTMENT GRID
Sale No. | Subject | 1 | 2 | 3 | 4 | |||||||||||||
Name | Peak at Vinings | Parc at Perimeter | Stonewood at Vinings | Vinings at River Parkway | West Haven Apartments | |||||||||||||
Address | 100 Woodbridge Dr | | 6210 Peachtree Dunwoody Rd NE | | | 2158 Cumberland Parkway | | 4545 River Parkway | 3000 Paces Walk NW | |||||||||
| Atlanta, GA | Atlanta, GA | Atlanta, GA | Atlanta, GA | Atlanta, GA | ||||||||||||||
Sale Date | 10/12/2012 | 9/4/2012 | 8/20/2012 | 5/29/2012 | ||||||||||||||
Price per Unit | $ | 133,221 | $ | 136,290 | $ | 87,237 | $ | 93,443 | ||||||||||
ADJUSTMENTS | ||||||||||||||||||
Financing Adjustment | $ | 0 | $ | 0 | $ | 0 | $ | 0 | ||||||||||
|
|
|
|
|
|
|
| |||||||||||
Adjusted for Financing per Unit | $ | 133,221 | $ | 136,290 | $ | 87,237 | $ | 93,443 | ||||||||||
Conditions of Sale Adjustment | $ | 0 | $ | 0 | $ | 0 | $ | 0 | ||||||||||
|
|
|
|
|
|
|
| |||||||||||
Adjusted for Special Conditions | $ | 133,221 | $ | 136,290 | $ | 87,237 | $ | 93,443 | ||||||||||
Time | 0.0 | % | 0.0 | % | 0.0 | % | 0.0 | % | ||||||||||
|
|
|
|
|
|
|
| |||||||||||
Time Adjusted Price per Unit | $ | 133,221 | $ | 136,290 | $ | 87,237 | $ | 93,443 | ||||||||||
Location | -5 | % | 0 | % | 5 | % | 0 | % | ||||||||||
Age/Condition/Quality | 0 | % | 0 | % | 5 | % | 5 | % | ||||||||||
Average Unit Size | -5 | % | -5 | % | -5 | % | 0 | % | ||||||||||
Amenities | 0 | % | 0 | % | 0 | % | 0 | % | ||||||||||
Economics | -5 | % | 0 | % | 0 | % | 0 | % | ||||||||||
|
|
|
|
|
|
|
| |||||||||||
Total Adjustments (%) | -15 | % | -5 | % | 5 | % | 5 | % | ||||||||||
Adjusted Price per Unit | $ | 113,238 | $ | 129,476 | $ | 91,599 | $ | 98,115 | ||||||||||
| VALUE CONCLUSION | After analysis and adjustments, a value range of $91,599 to $129,476 per unit is indicated. Sale Nos. 2, 3 and 4 required the least adjustment. All of these sales are located in the Vinings neighborhood, with Sale No. 2 being the most proximate to the subject property. As such most reliance has been placed on Sale No. 2 which represents the high end of the adjusted range. Based on such, a unit value of $125,000 per unit is concluded for the subject property. | |
| 280 units x $125,000 per unit = $35,000,000 | ||
| Accordingly, the Market Value of the Leased Fee Interest in the subject property as of January 18, 2013, free and clear of financing, via the Sales Comparison Approach, is rounded to: | ||
THIRTY FIVE MILLION DOLLARS ($35,000,000) | ||
KTR Real Estate Advisors LLC
| Peak at Vinings | January 28, 2013 | |
| Atlanta, Georgia | Page 52 |
| RECONCILIATION AND FINAL ESTIMATE OF VALUE | ||
| Review | The purpose of this appraisal is to provide an estimate of the market value of the leased fee interest in the subject property, free and clear of financing. The date of value is January 18, 2013. The indicated market value estimates for the real property interest appraised are: | |
| Income Capitalization Approach $34,600,000 | ||
| Sales Comparison Approach $35,000,000 | ||
| Income Approach | The Income Capitalization Approach seeks to view the subject property’s value from the perspective of the typical investor. This approach reflects the relationship between the income a property is capable of generating and its true value in the marketplace. Typical investors judge the value of a property based upon the quality and quantity of the income generated, as well as the likely impact of market conditions on future income generation. The Income Capitalization Approach, by considering these factors provides a good measure of value for this type of property and has been utilized as the primary approach in concluding to value. | |
| Sales Approach | This approach provides an estimate of value based upon the recent activities of buyers and sellers in the marketplace. This approach is generally considered to be reliable in active markets where the motivations of buyers and sellers are known and the operating characteristics of the properties being transferred are available for scrutiny. Market research revealed adequate sales of properties that are considered comparable to the subject property. The value conclusion derived via this approach is considered directly supportive of that concluded via the Income Approach. | |
| Cost Approach | The Cost Approach was excluded from the scope of this assignment. | |
| Conclusions | Both the Income Capitalization and Sales Comparison Approaches to value have been processed and suggest a market value between $34,600,000 and $35,000,000. Most reliance has been placed on the Income Capitalization Approach. Based on the data, analyses and conclusions contained within this appraisal report, the Market Value of the Leased Fee Interest in the subject property, free and clear of financing, as of January 18, 2013 is: | |
THIRTY FOUR MILLION SIX HUNDRED THOUSAND DOLLARS ($34,600,000) | ||
KTR Real Estate Advisors LLC
| Peak at Vinings | January 28, 2013 | |
| Atlanta, Georgia | Addenda |
ADDENDA
KTR Real Estate Advisors LLC
| Peak at Vinings | January 28, 2013 | |
| Atlanta, Georgia | Addenda |
ADDITIONAL SUBJECT PROPERTY PHOTOGRAPHS
KTR Real Estate Advisors LLC
| Peak at Vinings | January 28, 2013 | |
| Atlanta, Georgia | Addenda |
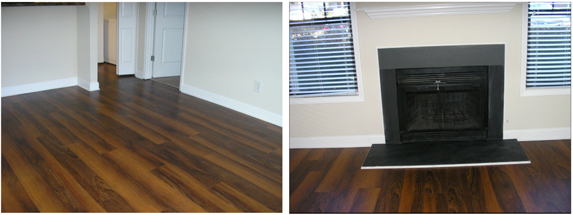
| Living Room Area | Living Room Area |
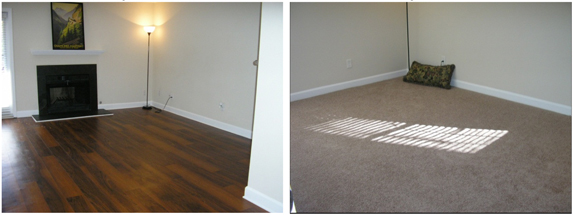
| Living Room Area | Bedroom |
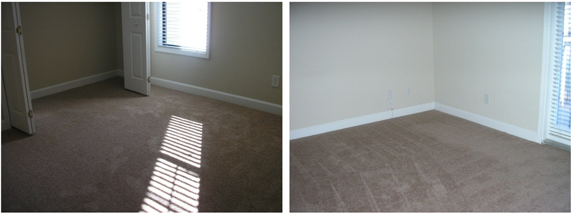
| Bedroom | Bedroom |
KTR Real Estate Advisors LLC
| Peak at Vinings | January 28, 2013 | |
| Atlanta, Georgia | Addenda |
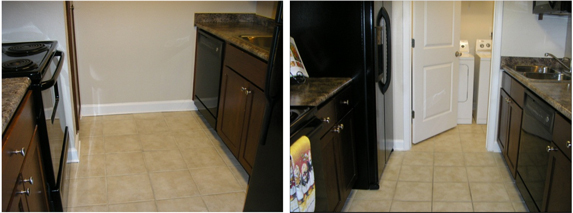
| Kitchen | Kitchen |
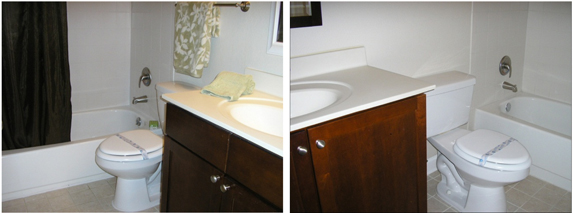
| Bathroom | Bathroom |
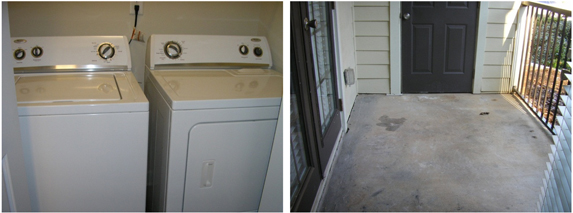
| Washer/Dryer | Balcony |
KTR Real Estate Advisors LLC
| Peak at Vinings | January 28, 2013 | |
| Atlanta, Georgia | Addenda |
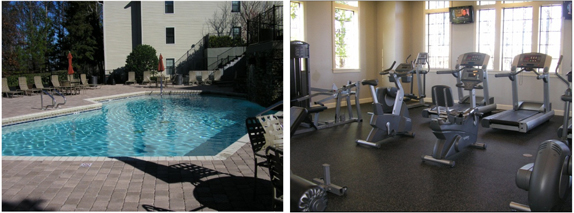
| Pool | Fitness Center |
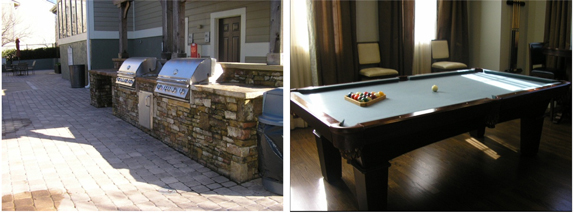
| BBQ Area | Game Room |
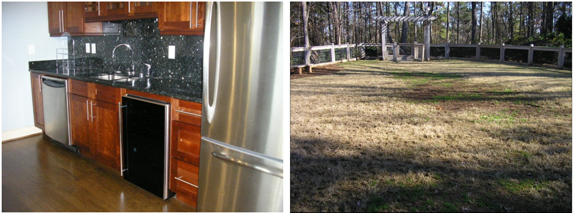
| Clubhouse Kitchen | Dog Park |
KTR Real Estate Advisors LLC
| Peak at Vinings | January 28, 2013 | |
| Atlanta, Georgia | Addenda |
SUBMITTED INFORMATION
KTR Real Estate Advisors LLC
| Peak at Vinings | January 28, 2013 | |
| Atlanta, Georgia | Addenda |
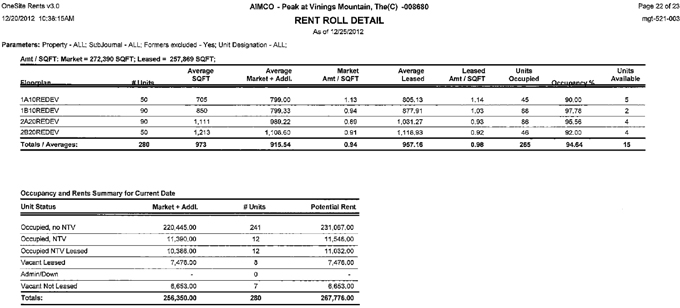
KTR Real Estate Advisors LLC
| Peak at Vinings | January 28, 2013 | |
| Atlanta, Georgia | Addenda |
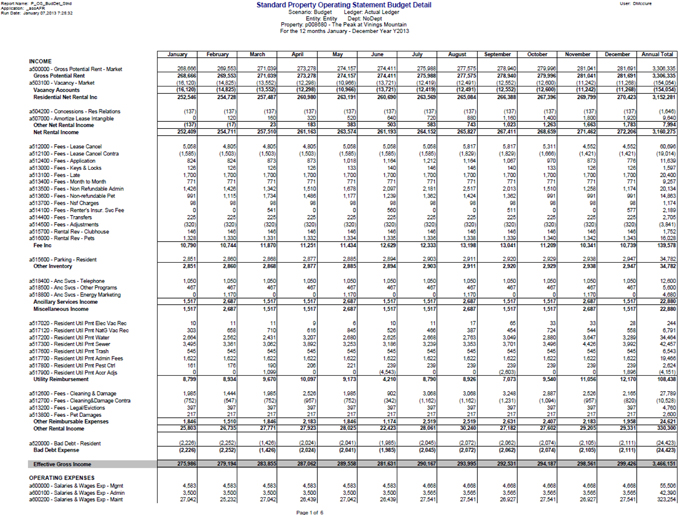
KTR Real Estate Advisors LLC
| Peak at Vinings | January 28, 2013 | |
| Atlanta, Georgia | Addenda |
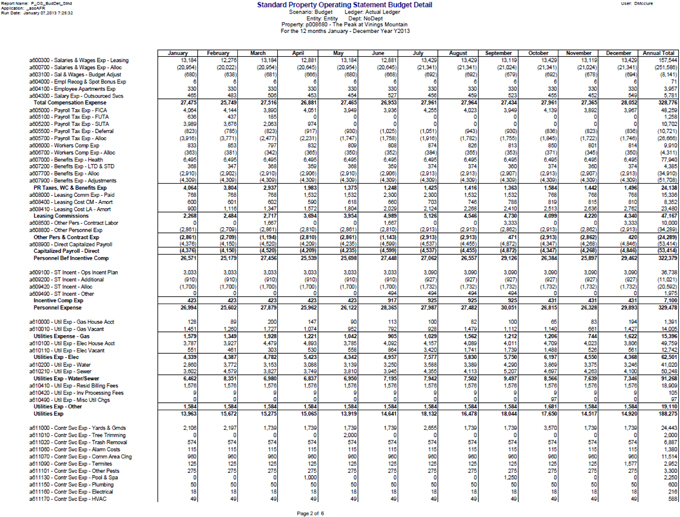
KTR Real Estate Advisors LLC
| Peak at Vinings | January 28, 2013 | |
| Atlanta, Georgia | Addenda |
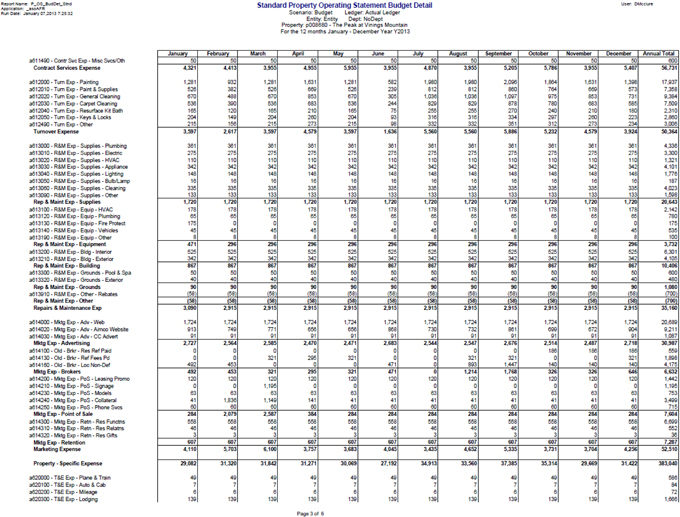
KTR Real Estate Advisors LLC
| Peak at Vinings | January 28, 2013 | |
| Atlanta, Georgia | Addenda |
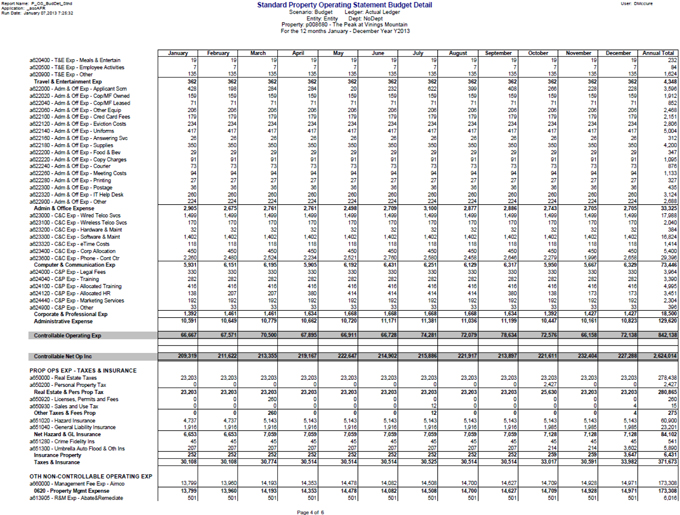
KTR Real Estate Advisors LLC
| Peak at Vinings | January 28, 2013 | |
| Atlanta, Georgia | Addenda |
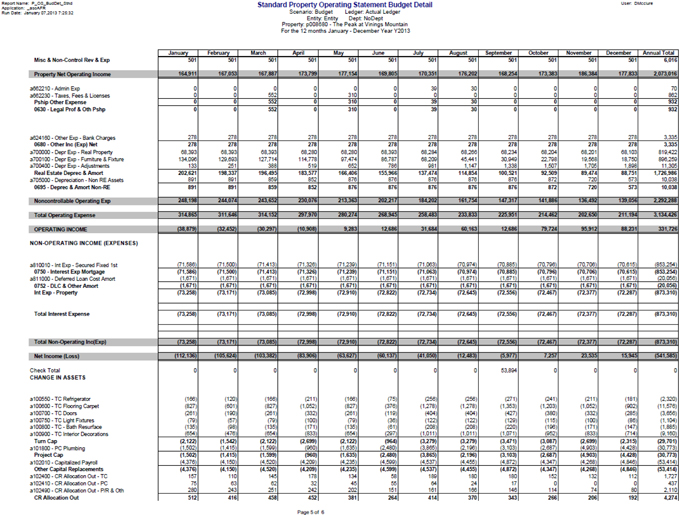
KTR Real Estate Advisors LLC
| Peak at Vinings | January 28, 2013 | |
| Atlanta, Georgia | Addenda |
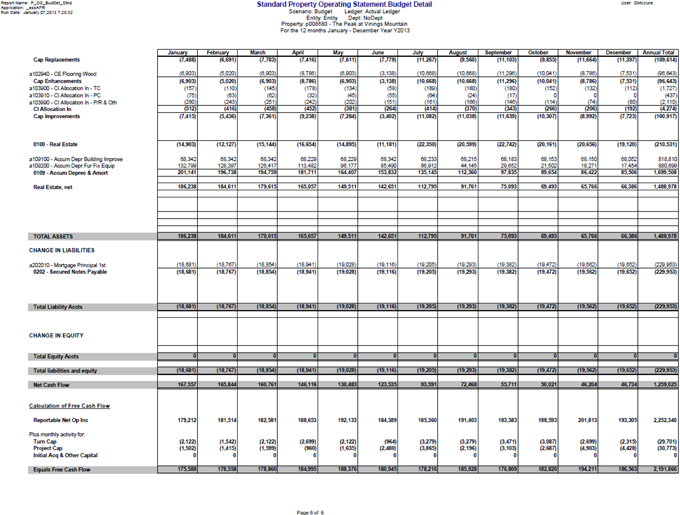
KTR Real Estate Advisors LLC
| Peak at Vinings | January 28, 2013 | |
| Atlanta, Georgia | Addenda |
QUALIFICATIONS OF THE APPRAISER
KTR Real Estate Advisors LLC
| Peak at Vinings | January 28, 2013 | |
| Atlanta, Georgia | Addenda |
PROFESSIONAL QUALIFICATIONS
TERENCETENER, MAI, ASA
MANAGING PARTNER
| EXPERIENCE | Mr. Tener is a founding principal of KTR Real Estate Advisors LLC. Over the course of his career, Mr. Tener has appraised many prominent commercial properties, including the GM Building, 101 Park Avenue, 500 Park Avenue, 410 Park Avenue, 437 Madison Avenue, 475 Fifth Avenue, the Seagrams Building, 900 Third Avenue, Park Avenue Plaza and the Lever House. In addition, Mr. Tener has served as an expert witness in various federal and state courts including New York, New Jersey, Connecticut and Delaware. He has also valued such notable residential and mixed-use properties as CitiSpire, Metropolitan Tower and River Tower. He has been responsible for the valuation of hotels throughout the United States, including the New York Hilton, Washington Hilton, Pittsburgh Hilton, the American Stanhope and a chain of hotels located in Mexico, owned by Groupo Situr. In addition, Mr. Tener has consulted on the valuation of numerous retail properties, including the Smithaven Mall, Herald Center, Sony Entertainment Center in San Francisco and 730 North Michigan Avenue. | |
| LICENSES | Connecticut Certified General Appraiser | |
| Massachusetts Certified General Appraiser | ||
| Missouri Certified General Appraiser | ||
| New Hampshire Certified General Appraiser | ||
| New Jersey Certified General Appraiser | ||
| New York Certified General Appraiser | ||
| Vermont Certified General Appraiser | ||
| Wyoming Certified General Appraiser | ||
| New York Real Estate Broker | ||
| MEMBERSHIPS | Appraisal Institute—MAI Designation since 1978 | |
| American Society of Appraisers (ASA)—Senior Member and former member of the Board of Governors for the NY Chapter | ||
| MBA of New York—Board of Governors | ||
| Real Estate Board of New York—Appraisal Committee | ||
| National Association of Real Estate Fiduciaries | ||
| Long Island Board of Realtors | ||
| International Council of Shopping Centers (ICSC) | ||
| Mortgage Bankers Association of America | ||
| Young Mortgage Bankers Association | ||
| Appraisal Institute Metropolitan New York Chapter—Admissions Committee and Ethics Committee | ||
| Appraisal Journal Review Committee | ||
| New York’s East Side Association—Former director | ||
| Cardinal’s Committee of the Archdiocese of New York | ||
KTR Real Estate Advisors LLC
| Peak at Vinings | January 28, 2013 | |
| Atlanta, Georgia | Addenda |
PROFESSIONAL QUALIFICATIONS
THOMAS J. TENER
MANAGING PARTNER
| EXPERIENCE | Mr. Tener is a founding principal of KTR Real Estate Advisors LLC. He has more than 20 years of broad based experience as a real estate professional, including appraisal, physical condition assessments, environmental site assessments, construction, development, brokerage, property management and receivership. Prior to forming KTR, Mr. Tener was the Chief Operating Officer of a national full service commercial due diligence firm. Under his direction, this firm provided appraisal, environmental, engineering and construction consultation on thousands for investment grade properties annually. Mr. Tener has extensive experience in appraisal, including such unique properties as the former Shoreham Nuclear power plant, the Perimeter Center in Atlanta, GA and numerous trophy office buildings. Mr. Tener has been a guest lecturer and panel member on various appraisal and due diligence topics. | |
| LICENSES | New York Certified General Appraiser #46000033225 | |
| New York Real Estate Broker | ||
| USCG – Third Assistant Engineer | ||
| Receiver NYS Supreme Court | ||
| MEMBERSHIPS | Appraisal Institute – Associate Member | |
| Association of Real Estate Women | ||
| MBA of New York | ||
| National Association of Real Estate Fiduciaries | ||
| Mortgage Bankers Association of America | ||
| Young Mortgage Bankers Association | ||
| ASTM International | ||
| EDUCATION | United States Merchant Marine Academy, Kings Point, NY | |
• BS Marine Engineering | ||
• BS Mechanical Engineering and Thermal Systems Design | ||
KTR Real Estate Advisors LLC
| Peak at Vinings | January 28, 2013 | |
| Atlanta, Georgia | Addenda |
PROFESSIONAL QUALIFICATIONS
SHAUN KEST
APPRAISER
| EXPERIENCE | Shaun Kest is an Appraiser with KTR Real Estate Advisors LLC. He has seven years of commercial appraisal experience. Mr. Kest is actively pursuing designation as a member of the Appraisal Institute.
Prior to joining the firm, Mr. Kest worked for the Chatham at North Hills where he assisted in the development of a townhouse community development and for East End Properties where he assisted in the development of a shopping center. | |
| LICENSES | New York Certified General Appraiser #46000049297 | |
| MEMBERSHIPS | Appraisal Institute—Associate Member since 2007 | |
| EDUCATION | University of Miami, Miami, Florida—BBA (Finance) | |
| Appraisal Institute: | ||
• Introduction to Real Estate Appraisal (R-1) | ||
• Basic Valuation Principles & Procedures (R-2) | ||
• Appraisal Fair Housing (AQ-1) | ||
• National USPAP Appraisal Course (15-Hour) | ||
• Introduction to Income Property Valuation (G-1) | ||
• Principles of Income Property (G-2) | ||
• Applied Income Property Valuation (G-3) | ||
KTR Real Estate Advisors LLC