Exhibit 99.2
sparton
Empowering your Vision
Fiscal 2011 Third Quarter Financial Results Conference Call
May 12, 2011
Safe Harbor Statement
sparton
Empowering your Vision
Certain statements herein constitute forward-looking statements within the meaning of the Securities Act of 1933, as amended and the Securities Exchange Act of 1934, as amended. When used herein, words such as “believe,” “expect,” “anticipate,” “project,” “plan,” “estimate,” “will” or “intend” and similar words or expressions as they relate to the Company or its management constitute forward-looking statements. These forward-looking statements reflect our current views with respect to future events and are based on currently available financial, economic and competitive data and our current business plans. The Company is under no obligation to, and expressly disclaims any obligation to, update or alter its forward-looking statements whether as a result of such changes, new information, subsequent events or otherwise. Actual results could vary materially depending on risks and uncertainties that may affect our operations, markets, prices and other factors. Important factors that could cause actual results to differ materially from those forward-looking statements include those contained under the heading of risk factors and in the management’s discussion and analysis contained from time-to-time in the Company’s filings with the Securities and Exchange Commission.
2
Today’s Agenda
sparton
Empowering your Vision
Fiscal 2011 3rd Quarter Consolidated Results
3rd Quarter Segmented Operating Results
Liquidity & Capital Resources
SMS Colorado 3rd Quarter Financial Results
Outlook
Q & A
3
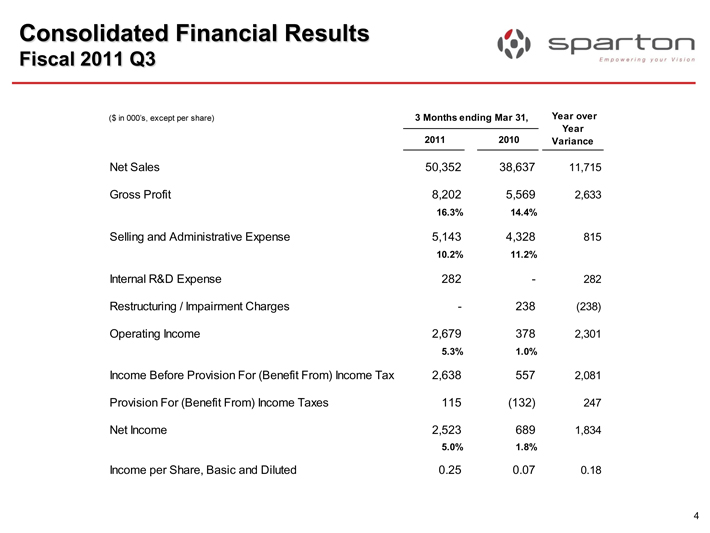
Consolidated Financial Results
Fiscal 2011 Q3
sparton
Empowering your Vision
($ in 000’s, except per share) 3 Months ending Mar 31,
2011 2010 Year over Year Variance
Net Sales 50,352 38,637 11,715
Gross Profit 8,202 5,569 2,633
16.3% 14.4%
Selling and Administrative Expense 5,143 4,328 815
10.2% 11.2%
Internal R&D Expense 282 - 282
Restructuring / Impairment Charges - 238 (238)
Operating Income 2,679 378 2,301
5.3% 1.0%
Income Before Provision For (Benefit From) Income Tax 2,638 557 2,081
Provision For (Benefit From) Income Taxes 115 (132) 247
Net Income 2,523 689 1,834
5.0% 1.8%
Income per Share, Basic and Diluted 0.25 0.07 0.18
4
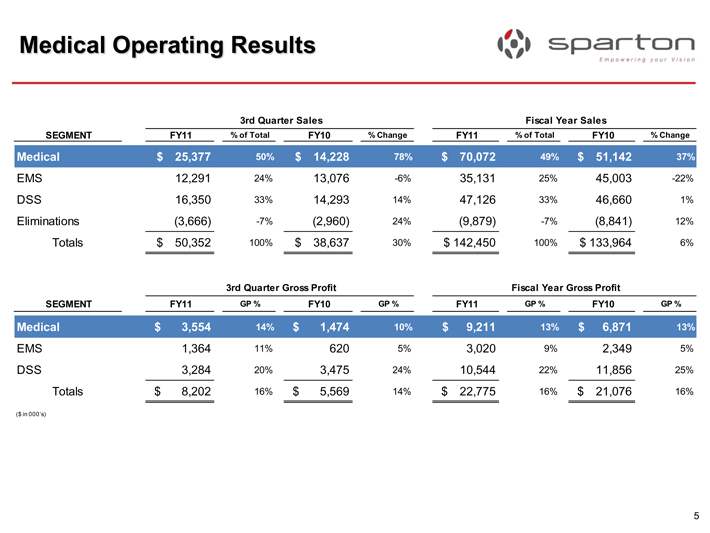
Medical Operating Results
sparton
Empowering your Vision
3rd Quarter Sales Fiscal Year Sales
SEGMENT FY11 % of Total FY10 % Change FY11 % of Total FY10 % Change
Medical $ 25,377 50% $ 14,228 78% $ 70,072 49% $ 51,142 37%
EMS 12,291 24% 13,076 -6% 35,131 25% 45,003 -22%
DSS 16,350 33% 14,293 14% 47,126 33% 46,660 1%
Eliminations (3,666) -7% (2,960) 24% (9,879) -7% (8,841) 12%
Totals $ 50,352 100% $ 38,637 30% $ 142,450 100% $ 133,964 6%
3rd Quarter Gross Profit Fiscal Year Gross Profit
SEGMENT FY11 GP % FY10 GP % FY11 GP % FY10 GP %
Medical $ 3,554 14% $ 1,474 10% $ 9,211 13% $ 6,871 13%
EMS 1,364 11% 620 5% 3,020 9% 2,349 5%
DSS 3,284 20% 3,475 24% 10,544 22% 11,856 25%
Totals $ 8,202 16% $ 5,569 14% $ 22,775 16% $ 21,076 16%
($ in 000’s)
5
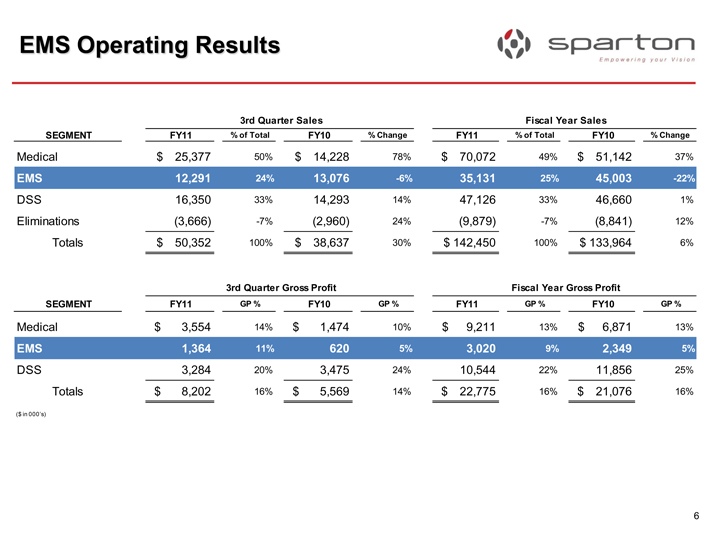
EMS Operating Results
sparton
Empowering your Vision
3rd Quarter Sales Fiscal Year Sales
SEGMENT FY11 % of Total FY10 % Change FY11 % of Total FY10 % Change
Medical $ 25,377 50% $ 14,228 78% $ 70,072 49% $ 51,142 37%
EMS 12,291 24% 13,076 -6% 35,131 25% 45,003 -22%
DSS 16,350 33% 14,293 14% 47,126 33% 46,660 1%
Eliminations (3,666) -7% (2,960) 24% (9,879) -7% (8,841) 12%
Totals $ 50,352 100% $ 38,637 30% $ 142,450 100% $ 133,964 6%
3rd Quarter Gross Profit Fiscal Year Gross Profit
SEGMENT FY11 GP % FY10 GP % FY11 GP % FY10 GP %
Medical $ 3,554 14% $ 1,474 10% $ 9,211 13% $ 6,871 13%
EMS 1,364 11% 620 5% 3,020 9% 2,349 5%
DSS 3,284 20% 3,475 24% 10,544 22% 11,856 25%
Totals $ 8,202 16% $ 5,569 14% $ 22,775 16% $ 21,076 16%
($ in 000’s)
6
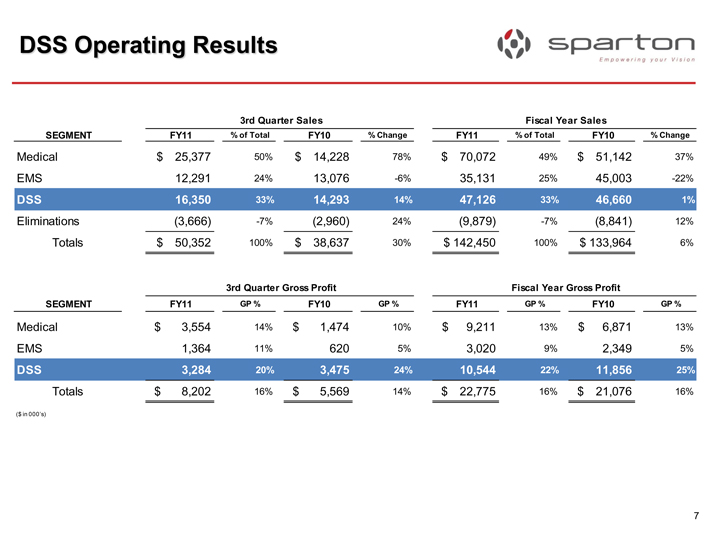
DSS Operating Results
sparton
Empowering your Vision
3rd Quarter Sales Fiscal Year Sales
SEGMENT FY11 % of Total FY10 % Change FY11 % of Total FY10 % Change
Medical $ 25,377 50% $ 14,228 78% $ 70,072 49% $ 51,142 37%
EMS 12,291 24% 13,076 -6% 35,131 25% 45,003 -22%
DSS 16,350 33% 14,293 14% 47,126 33% 46,660 1%
Eliminations (3,666) -7% (2,960) 24% (9,879) -7% (8,841) 12%
Totals $ 50,352 100% $ 38,637 30% $ 142,450 100% $ 133,964 6%
3rd Quarter Gross Profit Fiscal Year Gross Profit
SEGMENT FY11 GP % FY10 GP % FY11 GP % FY10 GP %
Medical $ 3,554 14% $ 1,474 10% $ 9,211 13% $ 6,871 13%
EMS 1,364 11% 620 5% 3,020 9% 2,349 5%
DSS 3,284 20% 3,475 24% 10,544 22% 11,856 25%
Totals $ 8,202 16% $ 5,569 14% $ 22,775 16% $ 21,076 16%
($ in 000’s)
7
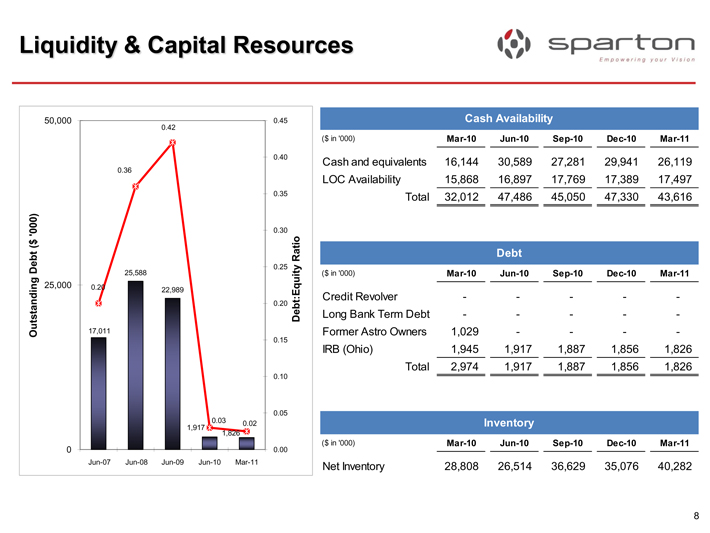
Liquidity & Capital Resources
sparton
Empowering your Vision
Outstanding Debt ($ ’000)
50,000
25,000
0
0.20
17,011
0.36
25,588
0.42
22,989
0.03
0.02
1,917
1,826
0.45
0.40
0.35
0.30
0.25
0.20
0.15
0.10
0.05
0.00
Debt:Equity Ratio
Jun-07 Jun-08 Jun-09 Jun-10 Mar-11
Cash Availability
($ in ’000) Mar-10 Jun-10 Sep-10 Dec-10 Mar-11
Cash and equivalents 16,144 30,589 27,281 29,941 26,119
LOC Availability 15,868 16,897 17,769 17,389 17,497
Total 32,012 47,486 45,050 47,330 43,616
Debt
($ in ’000) Mar-10 Jun-10 Sep-10 Dec-10 Mar-11
Credit Revolver - - - -
Long Bank Term Debt - - - -
Former Astro Owners 1,029 - - -
IRB (Ohio) 1,945 1,917 1,887 1,856 1,826
Total 2,974 1,917 1,887 1,856 1,826
Inventory
($ in ’000) Mar-10 Jun-10 Sep-10 Dec-10 Mar-11
Net Inventory 28,808 26,514 36,629 35,076 40,282
8
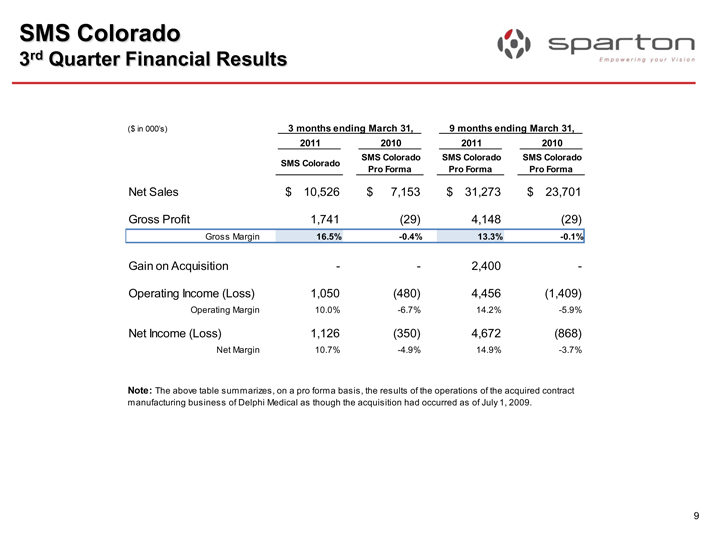
SMS Colorado
3rd Quarter Financial Results
sparton
Empowering your Vision
($ in 000’s) 3 months ending March 31, 9 months ending March 31,
2011 2010 2011 2010
SMS Colorado SMS Colorado Pro Forma SMS Colorado Pro Forma SMS Colorado Pro Forma
Net Sales $ 10,526 $ 7,153 $ 31,273 $ 23,701
Gross Profit 1,741 (29) 4,148 (29)
Gross Margin 16.5% -0.4% 13.3% -0.1%
Gain on Acquisition - - 2,400 -
Operating Income (Loss) 1,050 (480) 4,456 (1,409)
Operating Margin 10.0% -6.7% 14.2% -5.9%
Net Income (Loss) 1,126 (350) 4,672 (868)
Net Margin 10.7% -4.9% 14.9% -3.7%
Note: The above table summarizes, on a pro forma basis, the results of the operations of the acquired contract manufacturing business of Delphi Medical as though the acquisition had occurred as of July 1, 2009.
9
Acquisition
Byers Peak
sparton
Empowering your Vision
Acquired assets of Byers Peak for $4.35 million in March 2011
Estimated annual revenue of approximately $10 million with a new and diversified customer base is immediately accretive
Continues the expansion into the high growth Therapeutic Devices market and adds field service to Sparton’s list of capabilities
Customers are interested in Sparton’s capabilities such as internal CCA, low cost country manufacturing, engineering support, and rapid prototyping
Continues the growth of Sparton’s western geographic footprint
Enhances the Medical segment’s leadership
Solid business development funnel in place
Synergistic operational opportunities have been identified and will be implemented as part of the 100-day integration plan
10
Fiscal 2011 Outlook
sparton
Empowering your Vision
Focus on sustained profitability
Continue margin improvements in EMS
Maintain the successful operating performance at the Frederick facility
Further improvements in operating performance through lean and quality efforts
Implement the strategic growth plan
Enhance the Business Development organization
Leverage the new marketing strategy
Invest in new product development
Win more new business
Complete the integration of Byers Peak
Continue to look at complementary and compatible acquisitions
11
Q & A
sparton
Empowering your Vision
WELCOME TO A NEW ERA
12