Fiscal 2012 First Quarter Financial Results Conference Call November 9, 2011 Exhibit 99.2 |
2 Safe Harbor Statement Safe Harbor Statement Certain statements herein constitute forward-looking statements within the meaning of the Securities Act of 1933, as amended and the Securities Exchange Act of 1934, as amended. When used herein, words such as “believe,” “expect,” “anticipate,” “project,” “plan,” “estimate,” “will” or “intend” and similar words or expressions as they relate to the Company or its management constitute forward-looking statements. These forward-looking statements reflect our current views with respect to future events and are based on currently available financial, economic and competitive data and our current business plans. The Company is under no obligation to, and expressly disclaims any obligation to, update or alter its forward-looking statements whether as a result of such changes, new information, subsequent events or otherwise. Actual results could vary materially depending on risks and uncertainties that may affect our operations, markets, prices and other factors. Important factors that could cause actual results to differ materially from those forward-looking statements include those contained under the heading of risk factors and in the management’s discussion and analysis contained from time-to-time in the Company’s filings with the Securities and Exchange Commission. Adjusted operating income, adjusted net income and adjusted income per share – basic and diluted are non-GAAP financial measures that exclude or add the effect of certain gains and charges, including imputing taxes at a 36% effective rate. Sparton believes that the presentation of non- GAAP financial information provides useful supplemental information to management and investors regarding financial and business trends relating to the Company’s financial results. More detailed information, including period over period segment comparisons, non-GAAP reconciliation tables and the reasons management believes non-GAAP measures provide useful information to investors, is included in the Fiscal 2012 First Quarter Financial Results press release and Form 10-Q dated November 8, 2011. |
3 • 1 Quarter Highlights • Fiscal 2012 First Quarter Results • 1 Quarter Segmented Operating Results • Liquidity & Capital Resources • Outlook • Q & A Today’s Agenda Today’s Agenda st st |
4 • Net sales of $51.8 million, up 13% from prior year quarter • Gross margins up to 16% from 15% in prior year quarter • Net income of $1.5 million, or $0.15 per share, versus adjusted net income of $1.1 million, or $0.11 per share in the prior year quarter • Awarded nine new business programs from new and existing customers with a potential fiscal 2012 revenue impact in excess of $6.0 million • Launched new and advanced navigation sensors and hydrophone products for military and commercial uses at the AUVSI Unmanned Vehicle trade show • Seventh consecutive quarter of growing sales backlog to approximately $145 million, representing a 6% increase over the previous quarter and a 28% increase over a year ago • Reached agreement to sell non-performing investment in Cybernet Systems Corporation for $1.75 million with proceeds to be received in the fiscal 2012 second quarter 1 1st st Quarter Highlights Quarter Highlights |
5 Consolidated Financial Results Consolidated Financial Results Fiscal 2012 First Quarter Fiscal 2012 First Quarter (Adjusted) 2011 2010 2011 2010 Net Sales $ 51,833 $ 45,767 $ 51,833 $ 45,767 $ 6,066 Gross Profit 8,344 7,026 8,344 7,026 1,318 16.1% 15.4% 16.1% 15.4% Selling and Administrative Expense 5,411 4,834 5,411 4,834 (577) 10.4% 10.6% 10.4% 10.6% Internal R&D Expense 398 127 398 127 (271) Amortization of intangible assets 111 110 - - Restructuring and Impairment Charges - 77 - - Gain On Acquisition - (2,550) - - Other operationg expense, net 35 192 35 192 157 Operating Income 2,389 4,254 2,389 1,763 626 4.6% 9.3% 4.6% 3.9% Income Before Provision For (Benefit From) Income Tax 2,358 4,216 2,358 1,725 633 Provision For (Benefit From) Income Taxes 849 (14) 849 621 (228) Net Income $ 1,509 $ 4,230 $ 1,509 $ 1,104 $ 405 2.9% 9.2% 2.9% 2.4% Income per Share, Basic and Diluted $ 0.15 $ 0.41 $ 0.15 $ 0.11 $ 0.04 ($ in 000’s, except per share) (adjusted removes certain gains and charges, including imputing taxes at 36% effective rate) Quarter ended Sept 30, Quarter ended Sept 30, YoY Variance (Reported) (Adjusted) |
6 Operating Results Operating Results Medical Medical SEGMENT FY12 % of Total FY11 % Change Medical $ 27,460 53% $ 19,045 44% Complex Systems 12,560 24% 12,328 2% DSS 15,287 30% 17,597 -13% Eliminations (3,474) -7% (3,203) 8% Totals $ 51,833 100% $ 45,767 13% SEGMENT FY12 GP % FY11 GP % Medical $ 3,614 13% $ 1,867 10% Complex Systems 1,088 9% 907 7% DSS 3,642 24% 4,252 24% Totals $ 8,344 16% $ 7,026 15% ($ in 000’s) 1st Quarter Sales 1st Quarter Gross Profit |
7 Operating Results Operating Results Complex Systems Complex Systems SEGMENT FY12 % of Total FY11 % Change Medical $ 27,460 53% $ 19,045 44% Complex Systems 12,560 24% 12,328 2% DSS 15,287 30% 17,597 -13% Eliminations (3,474) -7% (3,203) 8% Totals $ 51,833 100% $ 45,767 13% SEGMENT FY12 GP % FY11 GP % Medical $ 3,614 13% $ 1,867 10% Complex Systems 1,088 9% 907 7% DSS 3,642 24% 4,252 24% Totals $ 8,344 16% $ 7,026 15% ($ in 000’s) 1st Quarter Sales 1st Quarter Gross Profit |
8 Operating Results Operating Results Defense & Security Systems Defense & Security Systems SEGMENT FY12 % of Total FY11 % Change Medical $ 27,460 53% $ 19,045 44% Complex Systems 12,560 24% 12,328 2% DSS 15,287 30% 17,597 -13% Eliminations (3,474) -7% (3,203) 8% Totals $ 51,833 100% $ 45,767 13% SEGMENT FY12 GP % FY11 GP % Medical $ 3,614 13% $ 1,867 10% Complex Systems 1,088 9% 907 7% DSS 3,642 24% 4,252 24% Totals $ 8,344 16% $ 7,026 15% ($ in 000’s) 1st Quarter Sales 1st Quarter Gross Profit |
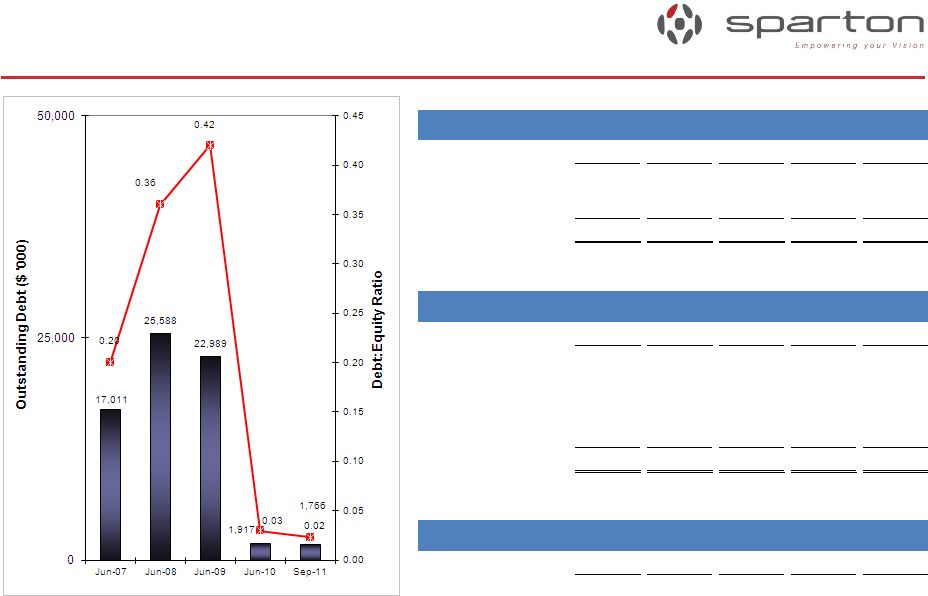
9 Liquidity & Capital Resources Liquidity & Capital Resources ($ in '000) Sep-10 Dec-10 Mar-11 Jun-11 Sep-11 Cash and equivalents 27,281 29,941 26,119 24,550 26,984 LOC Availability 17,769 17,389 17,497 17,541 17,533 Total 45,050 47,330 43,616 42,091 44,517 ($ in '000) Sep-10 Dec-10 Mar-11 Jun-11 Sep-11 Credit Revolver - - - - - Long Bank Term Debt - - - - - Former Astro Owners - - - - - IRB (Ohio) 1,887 1,856 1,826 1,796 1,766 Total 1,887 1,856 1,826 1,796 1,766 ($ in '000) Sep-10 Dec-10 Mar-11 Jun-11 Sep-11 Net Inventory 36,629 35,076 40,282 38,752 41,816 Cash Availability Debt Inventory |
10 • Focus on sustained profitability – Continue margin improvements in Complex Systems • Targeted gross margin range adjusted up to 7%-10% – Backfill Medical revenue losses with new business – Offset reduced U.S. Navy sonobuoy contracts with foreign sonobuoy sales – Continue improvements in operating performance through lean and quality efforts • Implementation of the strategic growth plan – Continue refining the new business development process to increase the new business opportunity funnel and win more new business – Continue to target the right trade show venues – Continue to invest in internal R&D for new product introductions – Challenge the technical staff to develop new & innovative ideas – Continue to look at complementary and compatible acquisitions • Continue to participate in upcoming trade shows and investor relations events Fiscal 2012 Outlook Fiscal 2012 Outlook |
11 Q & A |