Capital Markets Day May 18, 2016 Exhibit 99.1
This presentation contains forward-looking statements within the meaning of the federal securities laws. All statements in this presentation, other than statements of historical fact, are forward-looking statements and include, among other things, statements about our expectations, beliefs, intentions and/or strategies for the future. Words such as “expect,” “will,” “plan,” “anticipate,” “believe,” “forecast,” “guidance,” “outlook,” “goals” and similar expressions are intended to identify forward-looking statements. These forward-looking statements could include but are not limited to statements regarding our future operations, financial condition and prospects, expectations for treatment growth rates, revenue per treatment, expense growth, levels of the provision for uncollectible accounts receivable, operating income, cash flow, operating cash flow, estimated tax rates, capital expenditures, the development of new dialysis centers and dialysis center acquisitions, government and commercial payment rates, revenue estimating risk and the impact of our level of indebtedness on our financial performance, including earnings per share. Additionally, forward-looking statements may include statements that identify uncertainties or trends, discuss the possible future effects of current trends or uncertainties, or indicate that the future effects of known trends or uncertainties cannot be predicted, guaranteed or assured. Our actual results could differ materially from these forward-looking statements due to numerous factors that involve substantial known and unknown risks and uncertainties, including without limitation the risks and uncertainties associated with the risk factors set forth in our annual report on Form 10-K for the year ended December 31, 2015, as well as other risks and uncertainties set forth from time to time in the reports we file with the US. Securities and Exchange Commission, including without limitation our most recently filed report on Form 10-Q for the quarter ended March 31, 2016. All forward-looking statements in this presentation are based on information available to us on the date of this presentation. We undertake no obligation to update or revise any forward-looking statements, whether as a result of changed circumstances, new information, future events or otherwise.

Chairman & Chief Executive Officer Kent Thiry
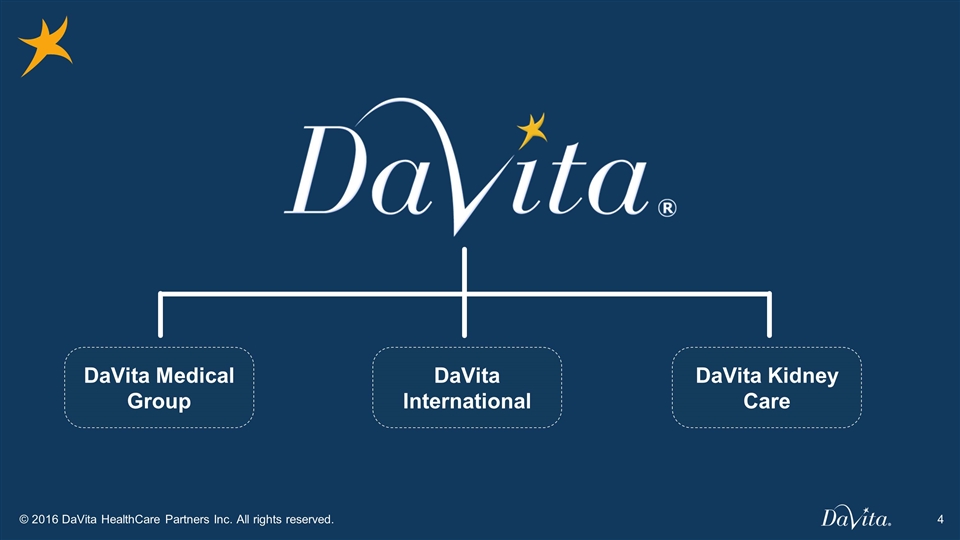
DaVita Medical Group DaVita International DaVita Kidney Care

DaVita Kidney Care Enterprise Summary DaVita International DaVita Medical Group Introduction
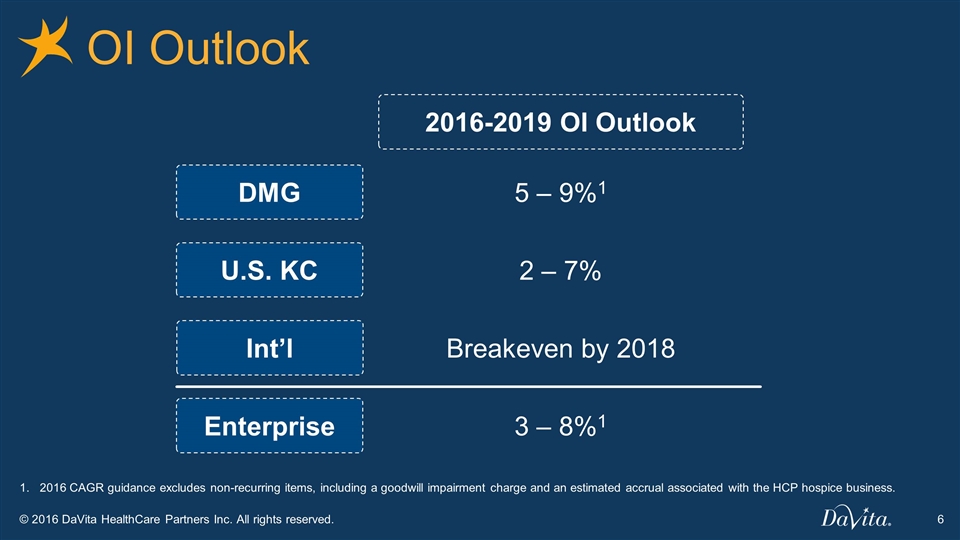
OI Outlook DMG U.S. KC Int’l 5 – 9%1 2 – 7% Breakeven by 2018 2016-2019 OI Outlook Enterprise 3 – 8%1 1. 2016 CAGR guidance excludes non-recurring items, including a goodwill impairment charge and an estimated accrual associated with the HCP hospice business.
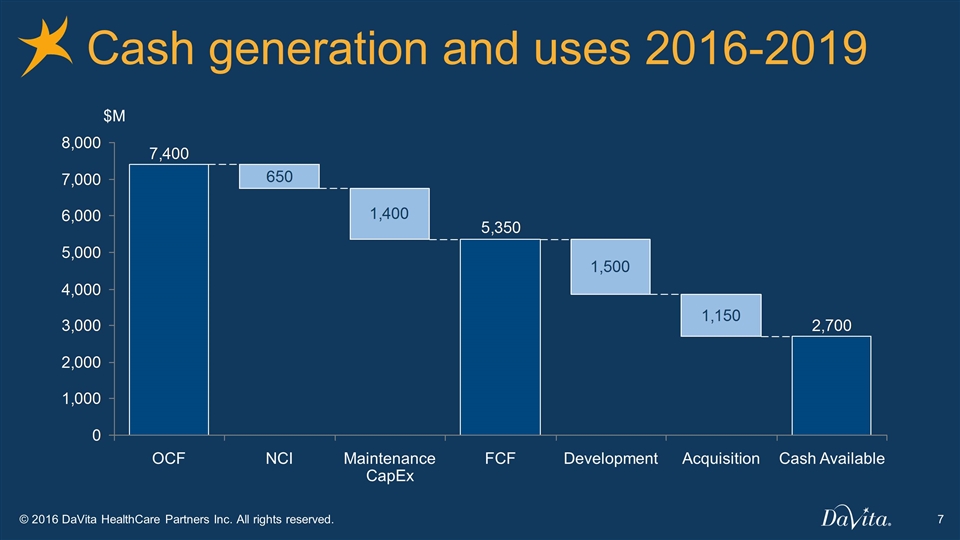
Cash generation and uses 2016-2019 Cash Available $M
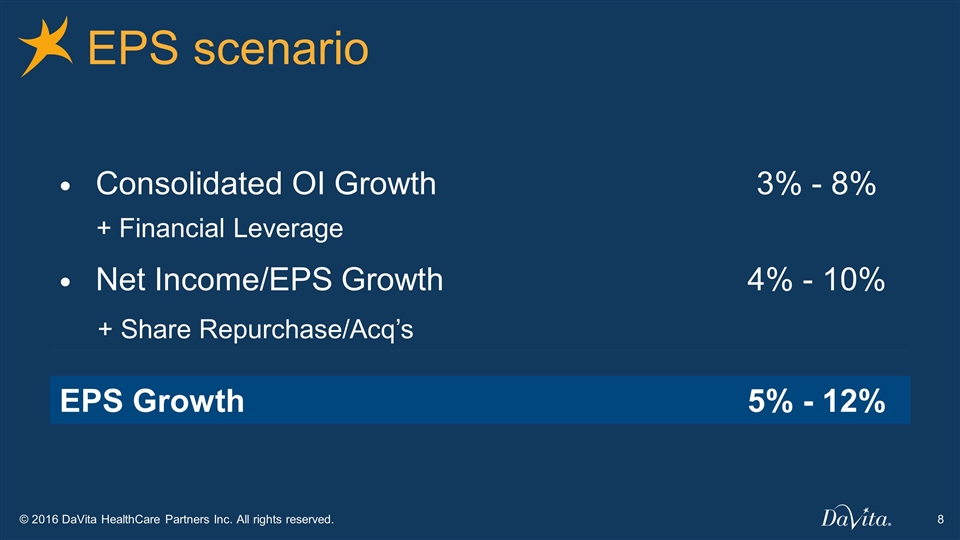
EPS scenario Consolidated OI Growth 3% - 8% + Financial Leverage Net Income/EPS Growth 4% - 10% + Share Repurchase/Acq’s EPS Growth 5% - 12%
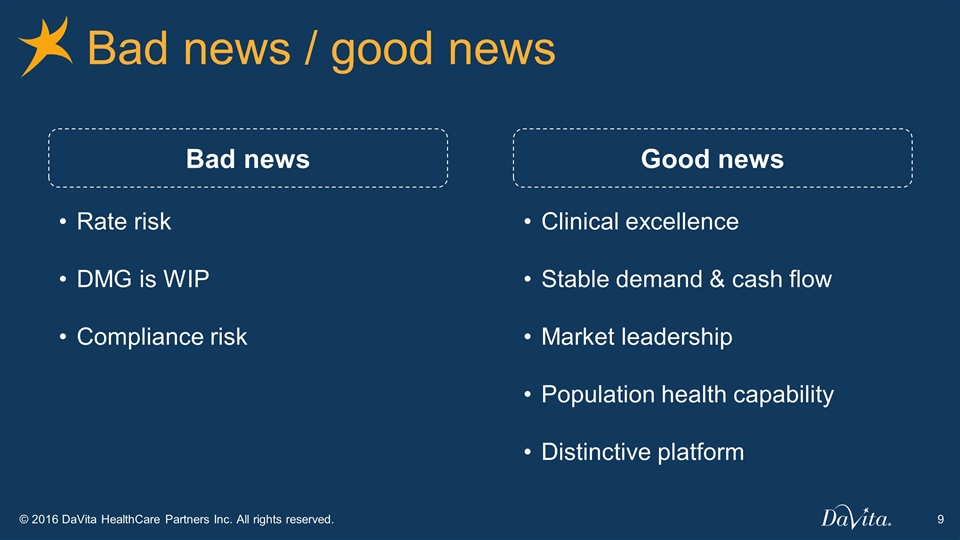
Bad news / good news Rate risk DMG is WIP Compliance risk Bad news Good news Clinical excellence Stable demand & cash flow Market leadership Population health capability Distinctive platform
DaVita Kidney Care Enterprise Summary DaVita International DaVita Medical Group Introduction
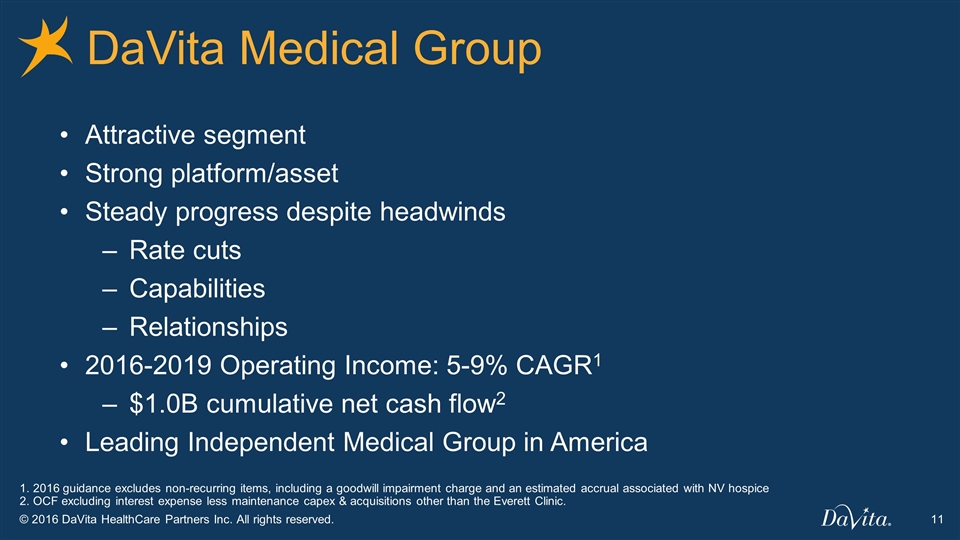
DaVita Medical Group Attractive segment Strong platform/asset Steady progress despite headwinds Rate cuts Capabilities Relationships 2016-2019 Operating Income: 5-9% CAGR1 $1.0B cumulative net cash flow2 Leading Independent Medical Group in America 1. 2016 guidance excludes non-recurring items, including a goodwill impairment charge and an estimated accrual associated with NV hospice 2. OCF excluding interest expense less maintenance capex & acquisitions other than the Everett Clinic.
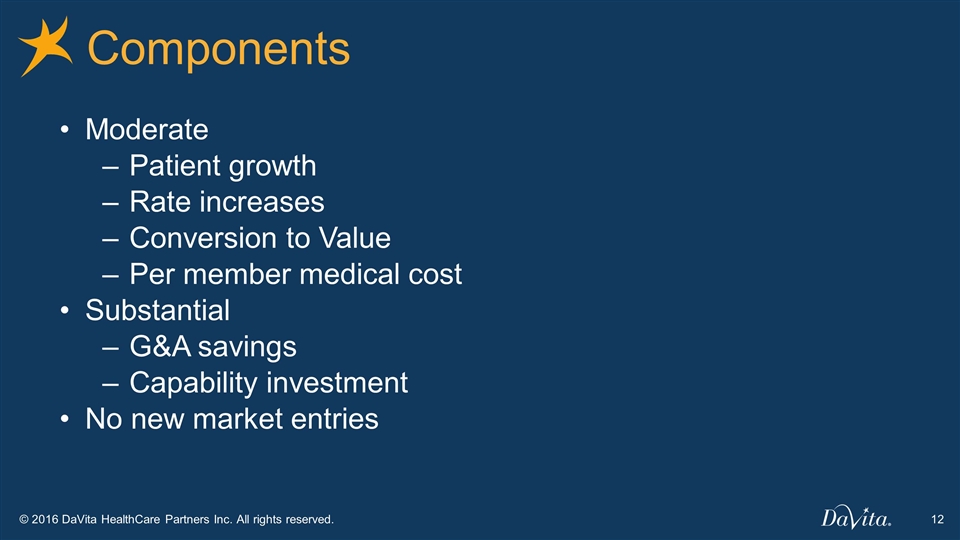
Components Moderate Patient growth Rate increases Conversion to Value Per member medical cost Substantial G&A savings Capability investment No new market entries
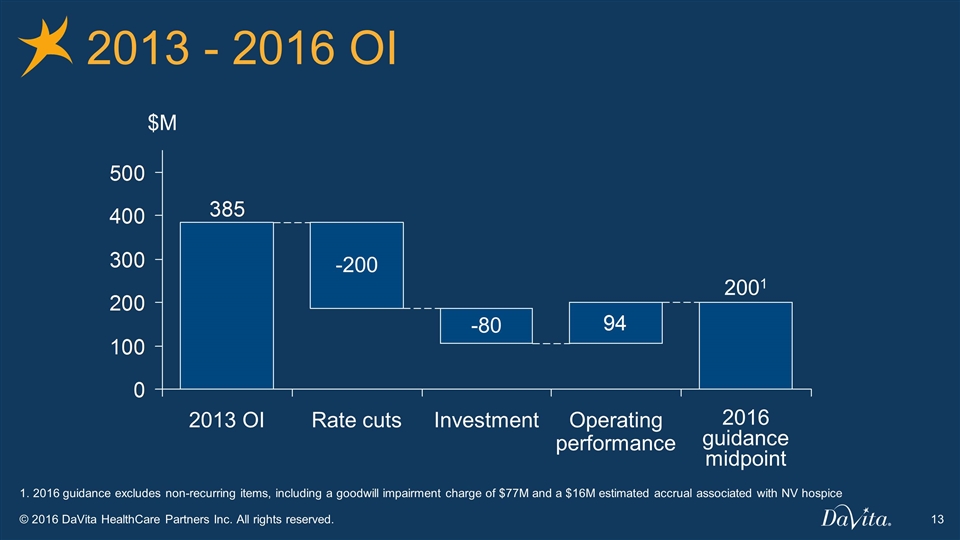
2013 - 2016 OI $M Operating performance OI 1 1. 2016 guidance excludes non-recurring items, including a goodwill impairment charge of $77M and a $16M estimated accrual associated with NV hospice
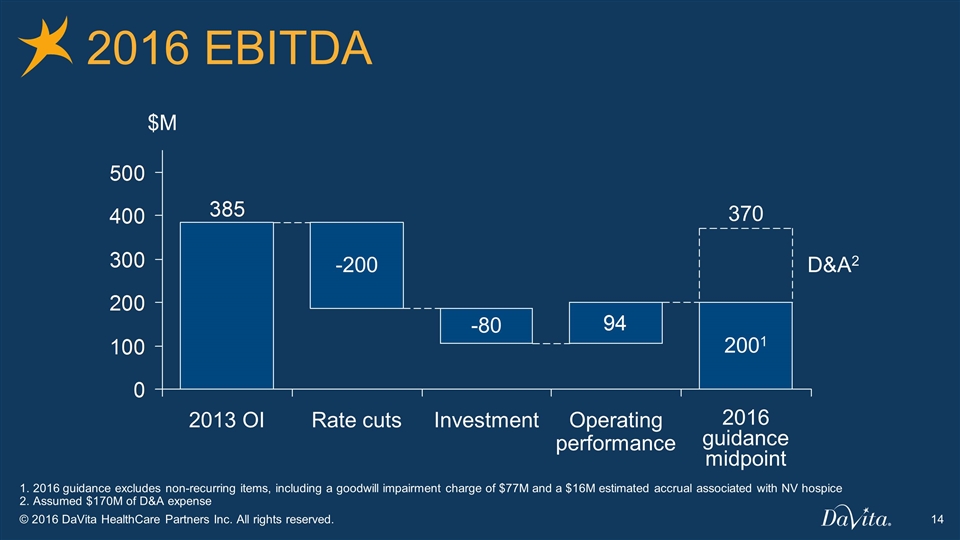
2016 EBITDA $M 2001 Operating performance OI D&A2 1. 2016 guidance excludes non-recurring items, including a goodwill impairment charge of $77M and a $16M estimated accrual associated with NV hospice 2. Assumed $170M of D&A expense
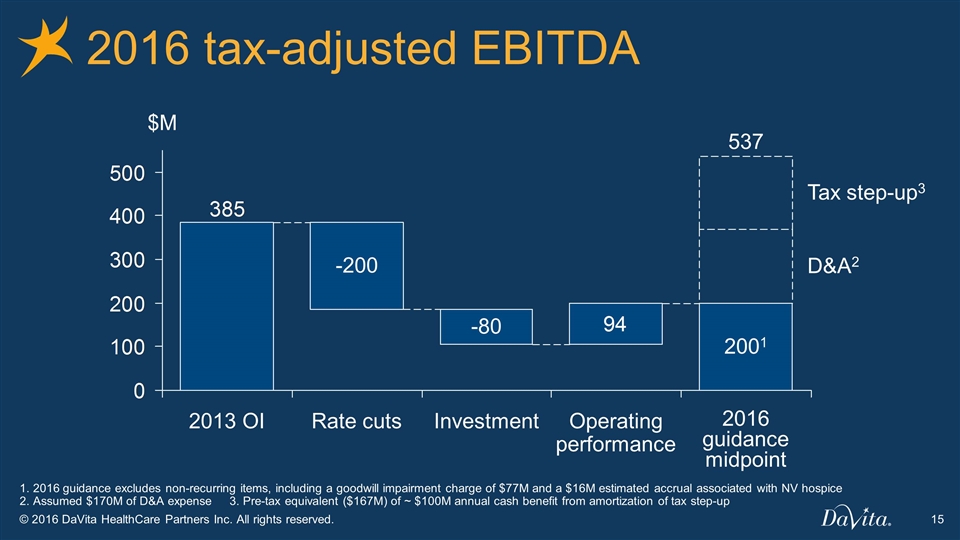
2016 tax-adjusted EBITDA Tax step-up3 $M D&A2 2001 Operating performance OI 1. 2016 guidance excludes non-recurring items, including a goodwill impairment charge of $77M and a $16M estimated accrual associated with NV hospice 2. Assumed $170M of D&A expense 3. Pre-tax equivalent ($167M) of ~ $100M annual cash benefit from amortization of tax step-up
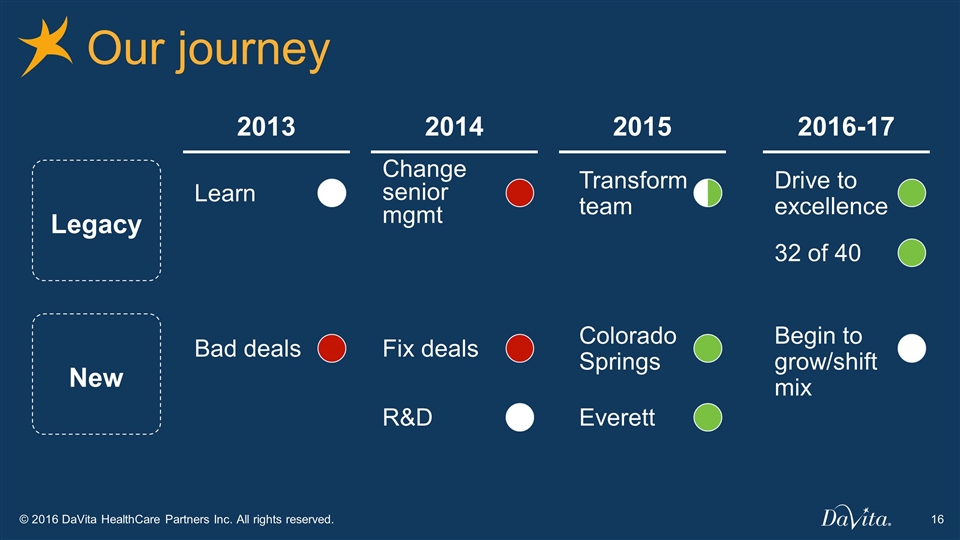
Our journey Legacy New 2013 Learn 2014 2015 2016-17 Change senior mgmt Transform team Drive to excellence 32 of 40 Bad deals Fix deals Colorado Springs Begin to grow/shift mix R&D Everett
President, DaVita Medical Group California Jim Rechtin
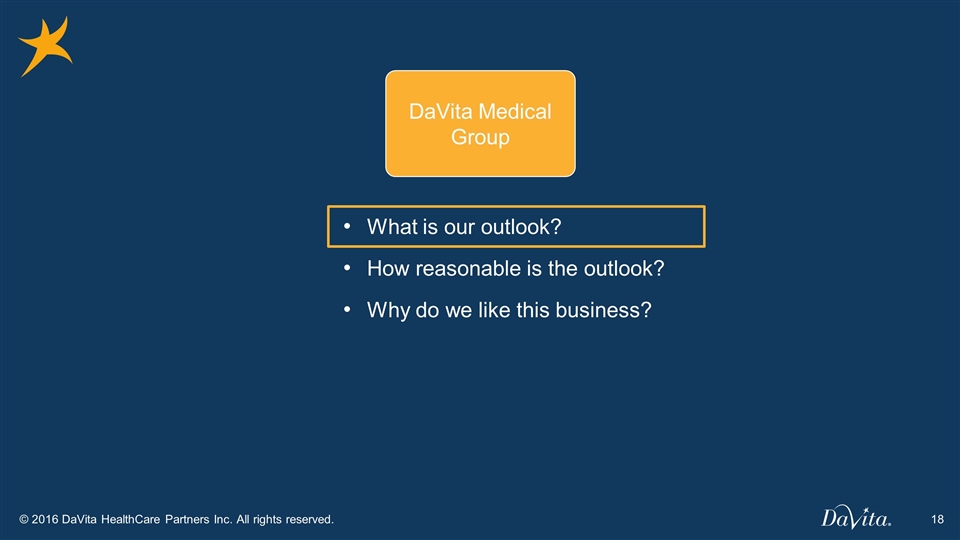
What is our outlook? How reasonable is the outlook? Why do we like this business? DaVita Medical Group
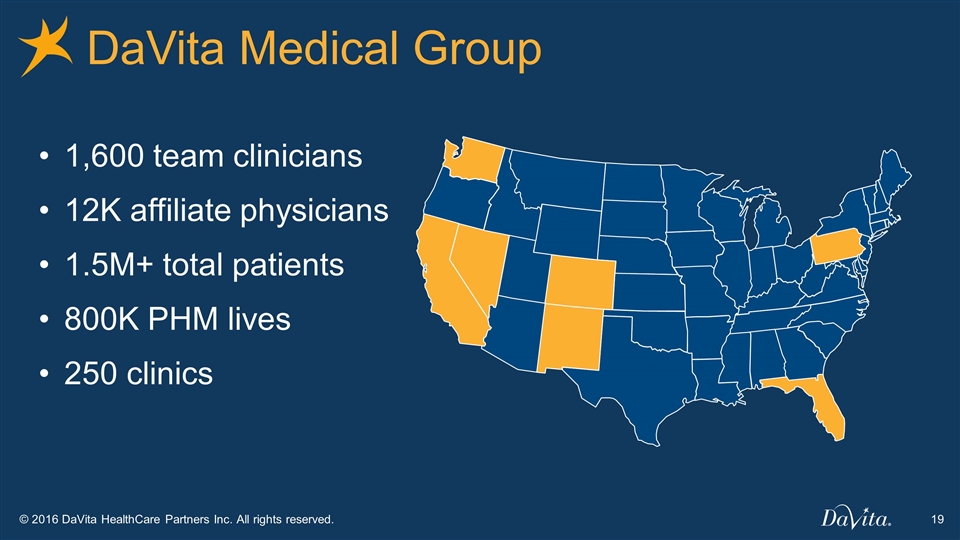
DaVita Medical Group 1,600 team clinicians 12K affiliate physicians 1.5M+ total patients 800K PHM lives 250 clinics
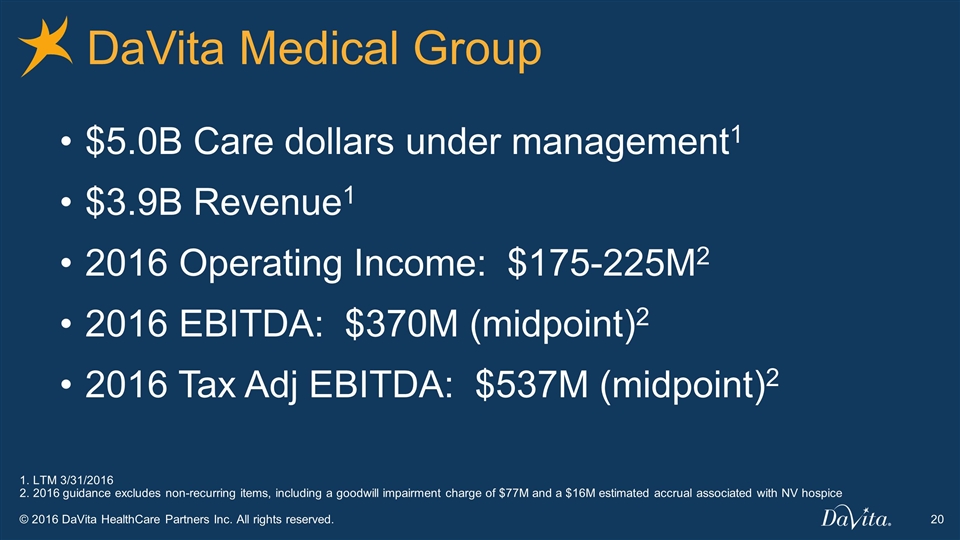
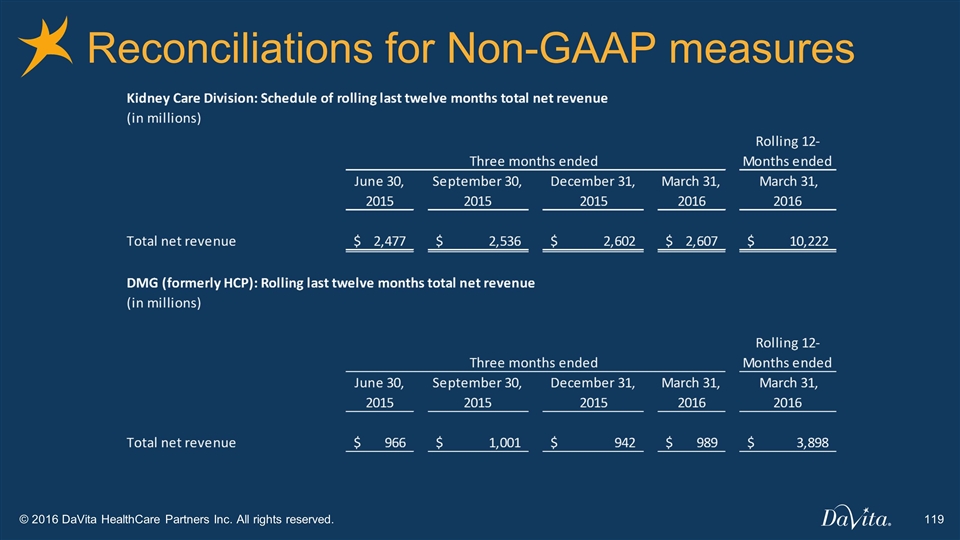
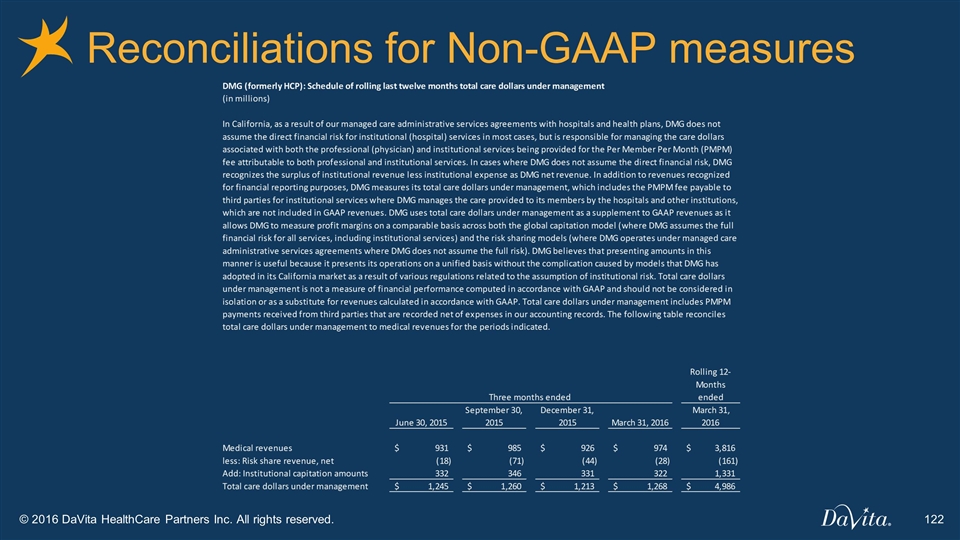
DaVita Medical Group $5.0B Care dollars under management1 $3.9B Revenue1 2016 Operating Income: $175-225M2 2016 EBITDA: $370M (midpoint)2 2016 Tax Adj EBITDA: $537M (midpoint)2 1. LTM 3/31/2016 2. 2016 guidance excludes non-recurring items, including a goodwill impairment charge of $77M and a $16M estimated accrual associated with NV hospice
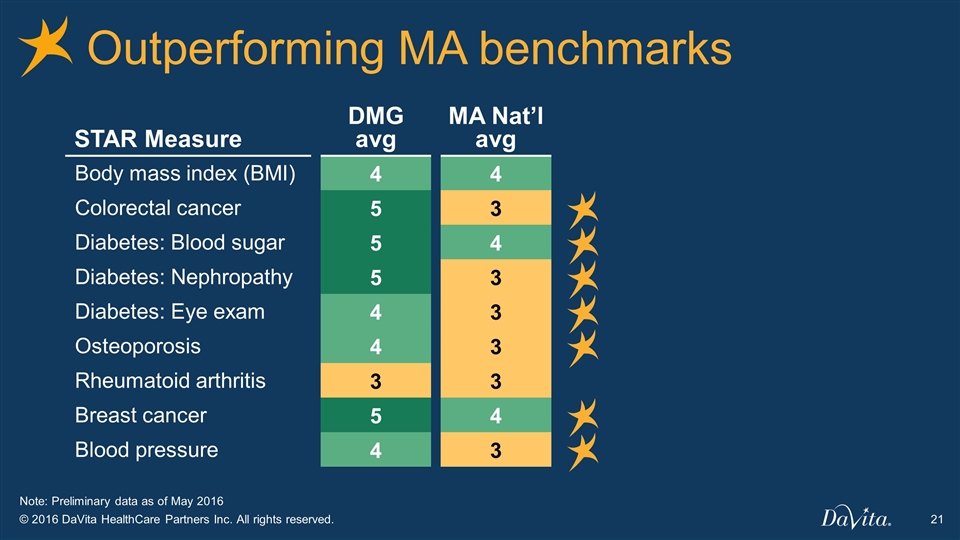
Outperforming MA benchmarks STAR Measure DMG avg MA Nat’l avg Body mass index (BMI) 4 4 Colorectal cancer 5 3 Diabetes: Blood sugar 5 4 Diabetes: Nephropathy 5 3 Diabetes: Eye exam 4 3 Osteoporosis 4 3 Rheumatoid arthritis 3 3 Breast cancer 5 4 Blood pressure 4 3 Note: Preliminary data as of May 2016
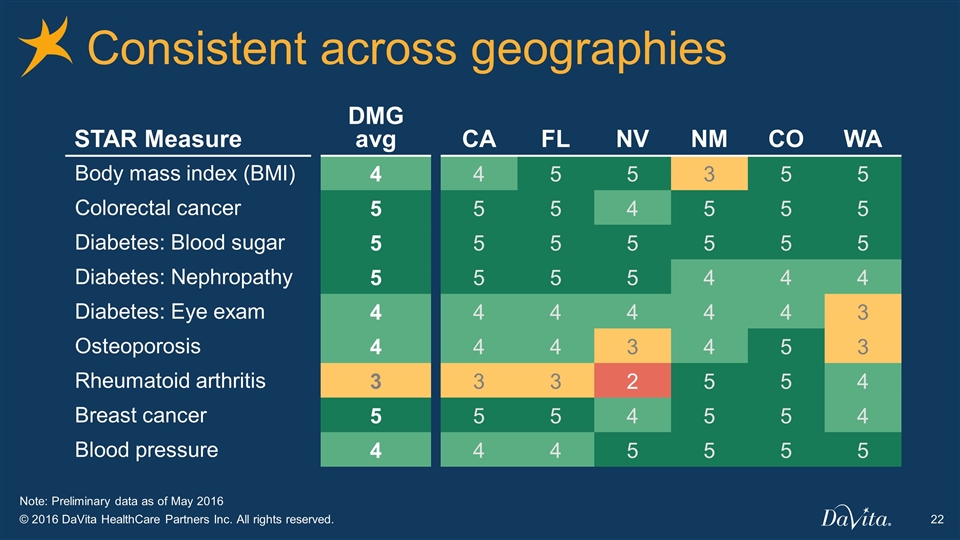
Consistent across geographies STAR Measure DMG avg CA FL NV NM CO WA Body mass index (BMI) 4 4 5 5 3 5 5 Colorectal cancer 5 5 5 4 5 5 5 Diabetes: Blood sugar 5 5 5 5 5 5 5 Diabetes: Nephropathy 5 5 5 5 4 4 4 Diabetes: Eye exam 4 4 4 4 4 4 3 Osteoporosis 4 4 4 3 4 5 3 Rheumatoid arthritis 3 3 3 2 5 5 4 Breast cancer 5 5 5 4 5 5 4 Blood pressure 4 4 4 5 5 5 5 Note: Preliminary data as of May 2016
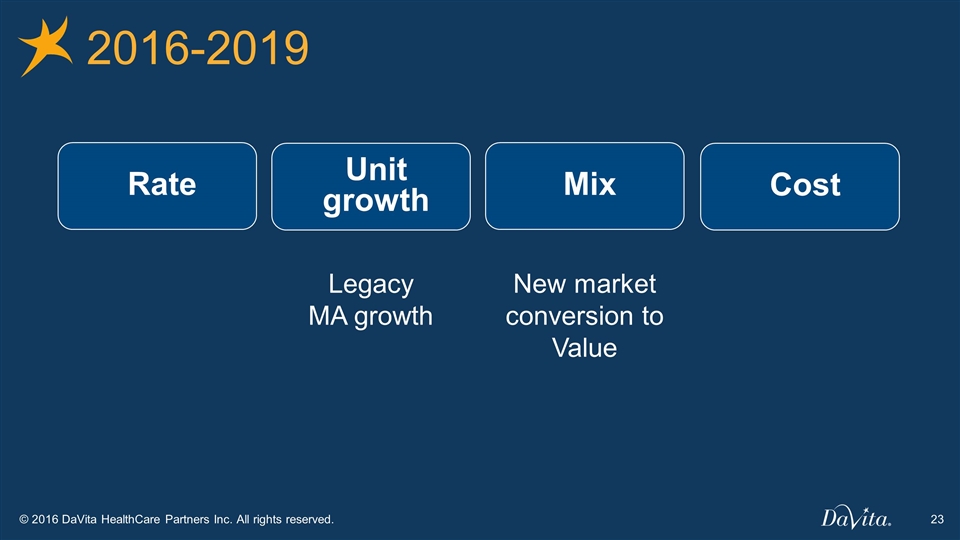
2016-2019 Rate Unit growth Cost Mix Legacy MA growth New market conversion to Value
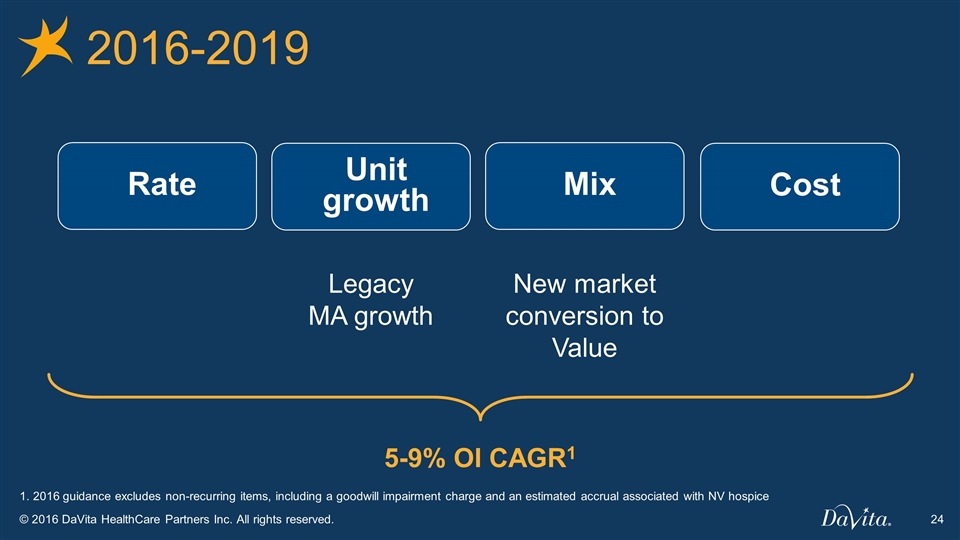
2016-2019 5-9% OI CAGR1 Rate Unit growth Cost Mix Legacy MA growth New market conversion to Value 1. 2016 guidance excludes non-recurring items, including a goodwill impairment charge and an estimated accrual associated with NV hospice
What is our outlook? How reasonable is the outlook? Why do we like this business? DaVita Medical Group
2016-2019 Rate Unit growth Cost Mix
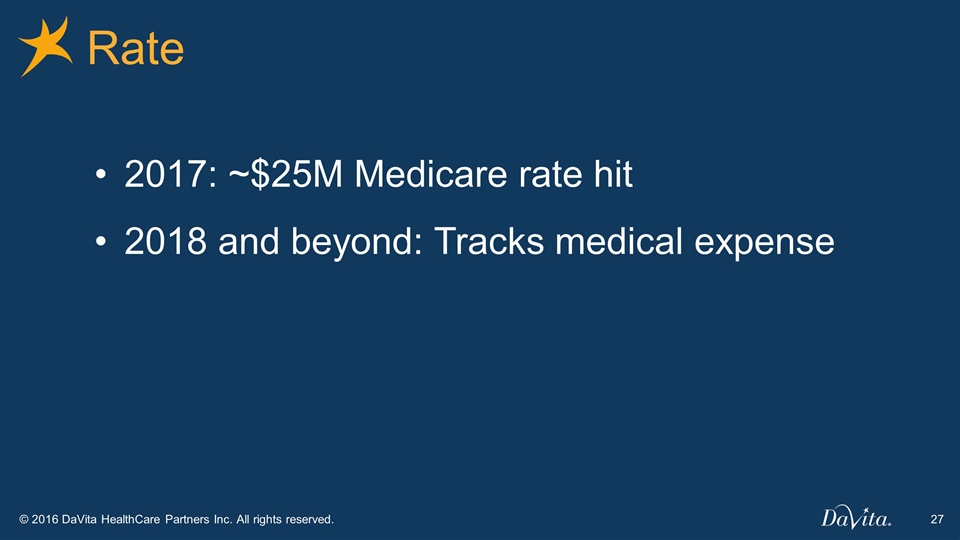
Rate 2017: ~$25M Medicare rate hit 2018 and beyond: Tracks medical expense
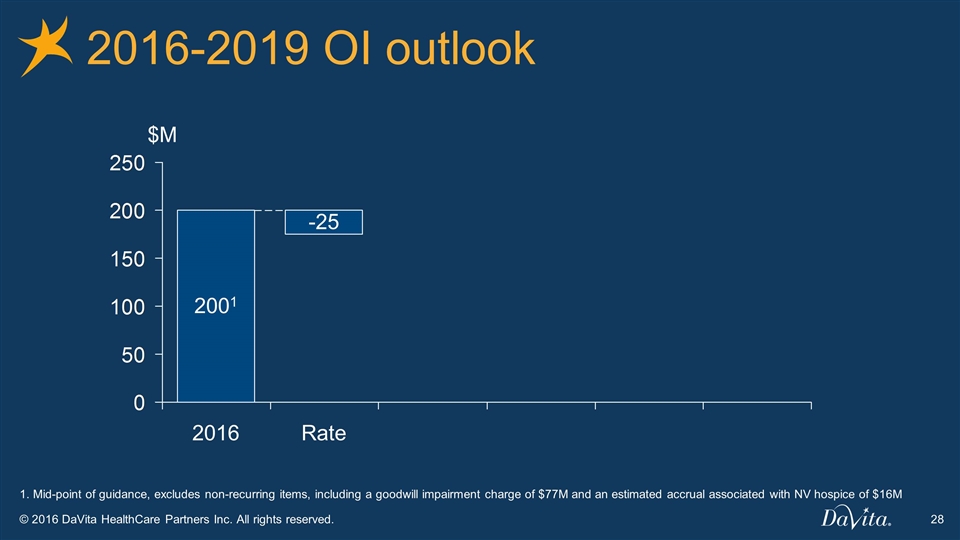
2016-2019 OI outlook $M Rate 1 1. Mid-point of guidance, excludes non-recurring items, including a goodwill impairment charge of $77M and an estimated accrual associated with NV hospice of $16M
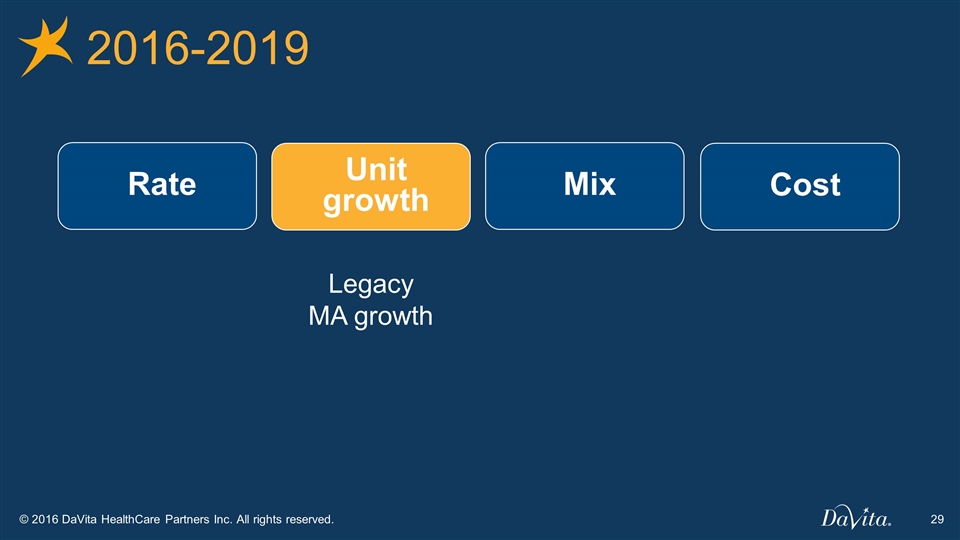
2016-2019 Rate Unit growth Cost Mix Legacy MA growth
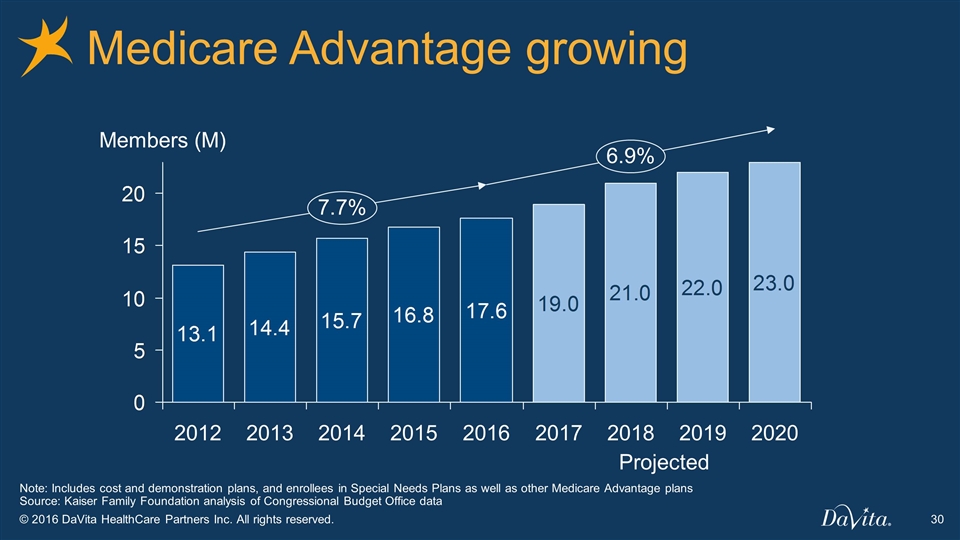
Medicare Advantage growing Members (M) Note: Includes cost and demonstration plans, and enrollees in Special Needs Plans as well as other Medicare Advantage plans Source: Kaiser Family Foundation analysis of Congressional Budget Office data Projected
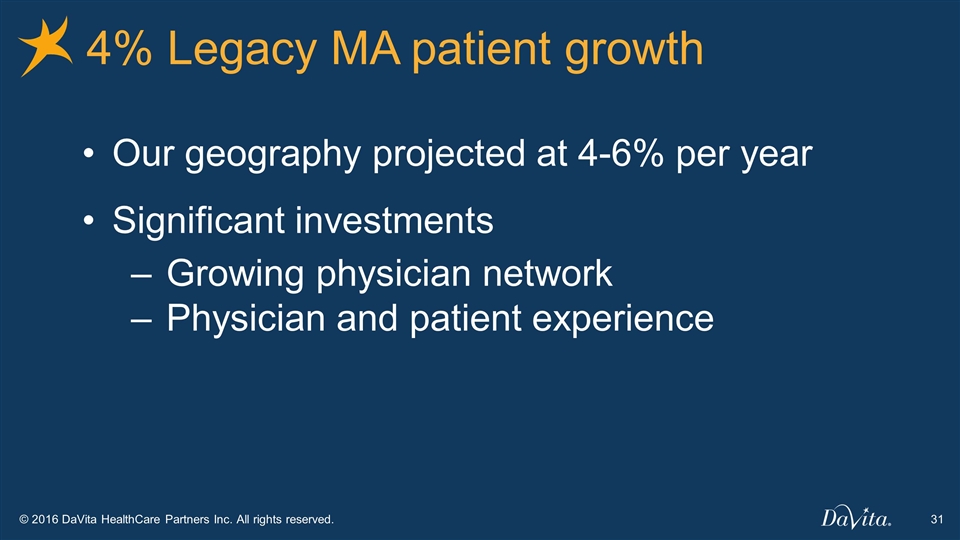
4% Legacy MA patient growth Our geography projected at 4-6% per year Significant investments Growing physician network Physician and patient experience
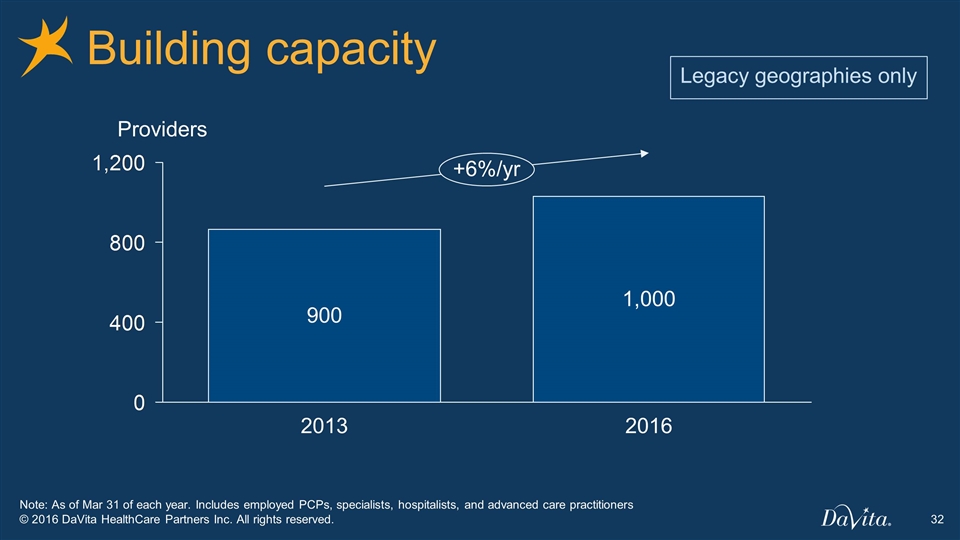
Building capacity 1,000 900 /yr Providers Note: As of Mar 31 of each year. Includes employed PCPs, specialists, hospitalists, and advanced care practitioners Legacy geographies only
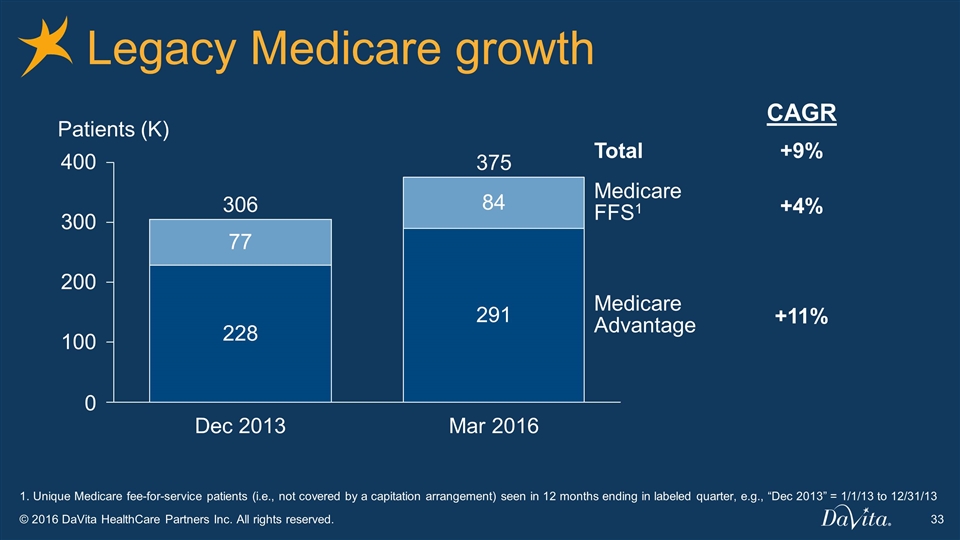
Legacy Medicare growth Patients (K) Medicare Advantage Medicare FFS1 1. Unique Medicare fee-for-service patients (i.e., not covered by a capitation arrangement) seen in 12 months ending in labeled quarter, e.g., “Dec 2013” = 1/1/13 to 12/31/13 +4% +11% CAGR Total +9%
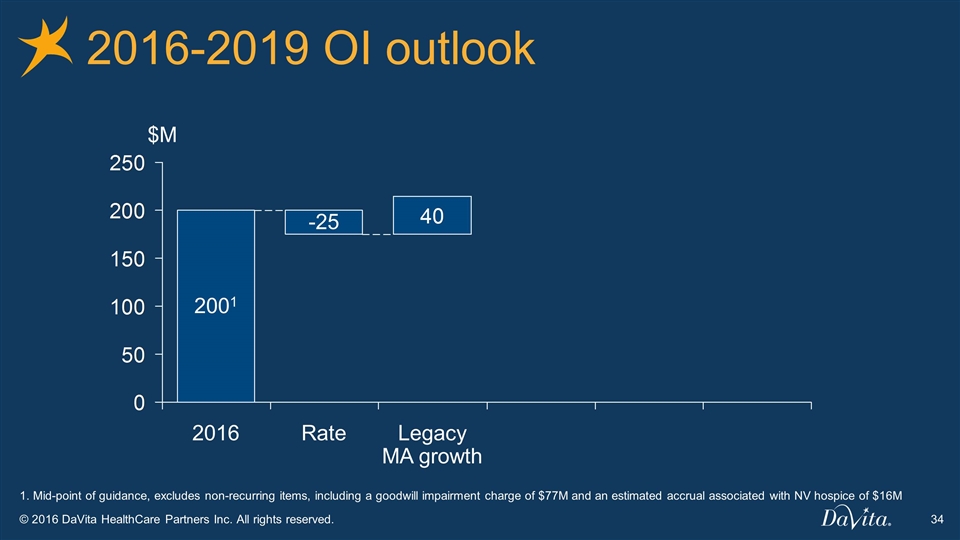
2016-2019 OI outlook $M Legacy MA growth Rate 1 1. Mid-point of guidance, excludes non-recurring items, including a goodwill impairment charge of $77M and an estimated accrual associated with NV hospice of $16M
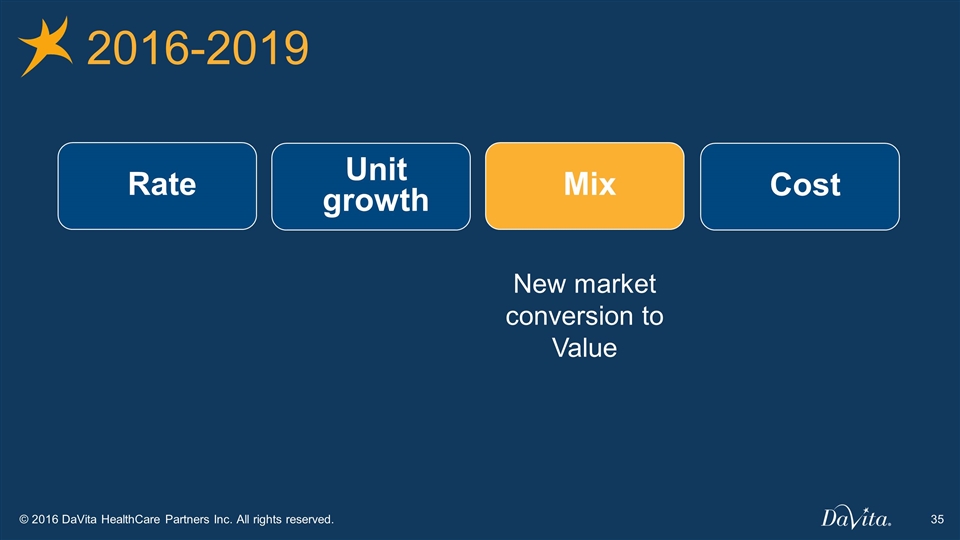
2016-2019 Rate Unit growth Cost Mix New market conversion to Value
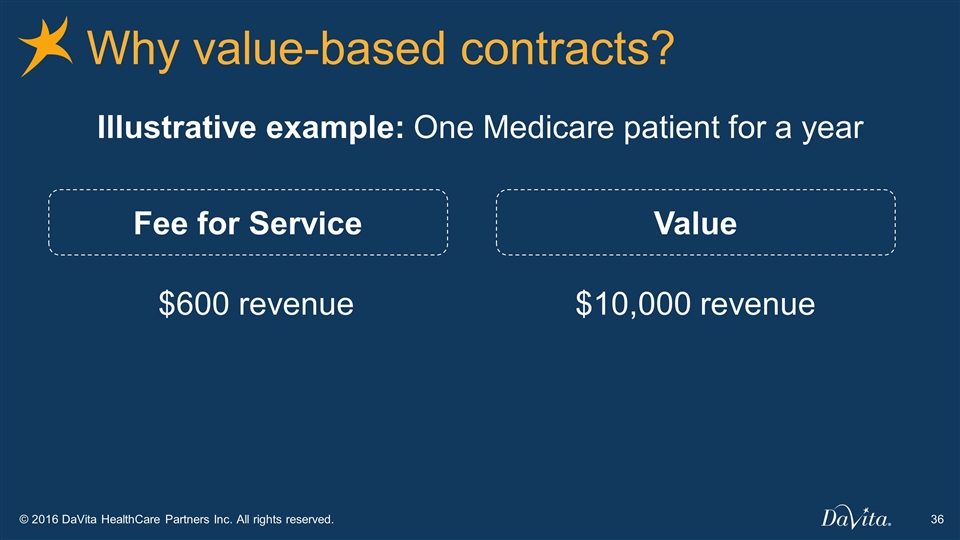
Why value-based contracts? Fee for Service $600 revenue Illustrative example: One Medicare patient for a year Value $10,000 revenue
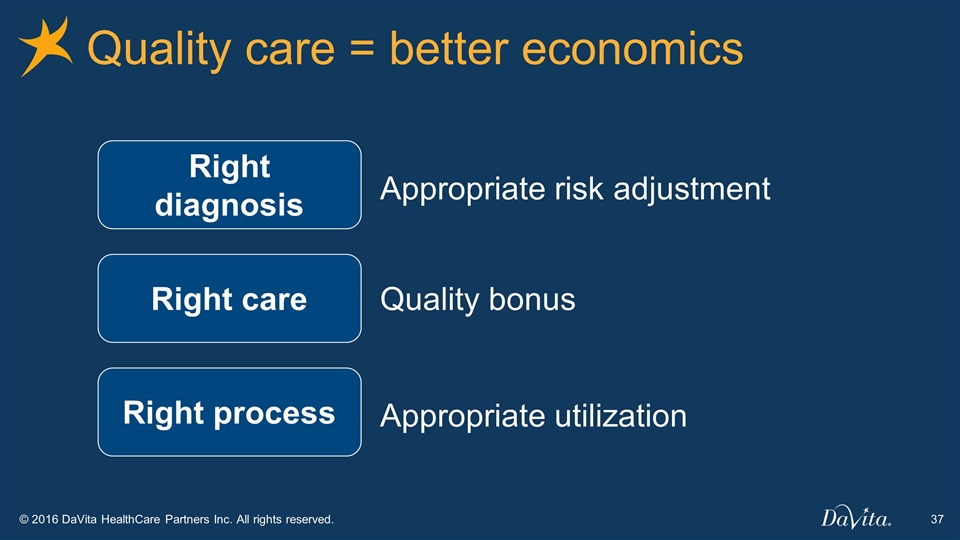
Quality care = better economics Right care Right diagnosis Right process Appropriate risk adjustment Quality bonus Appropriate utilization
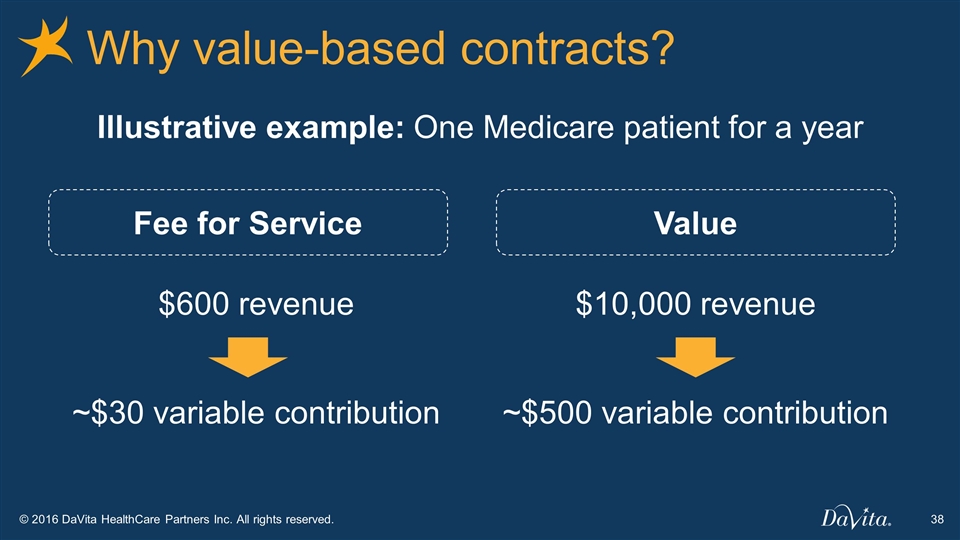
Why value-based contracts? Fee for Service $600 revenue ~$30 variable contribution Illustrative example: One Medicare patient for a year Value $10,000 revenue ~$500 variable contribution
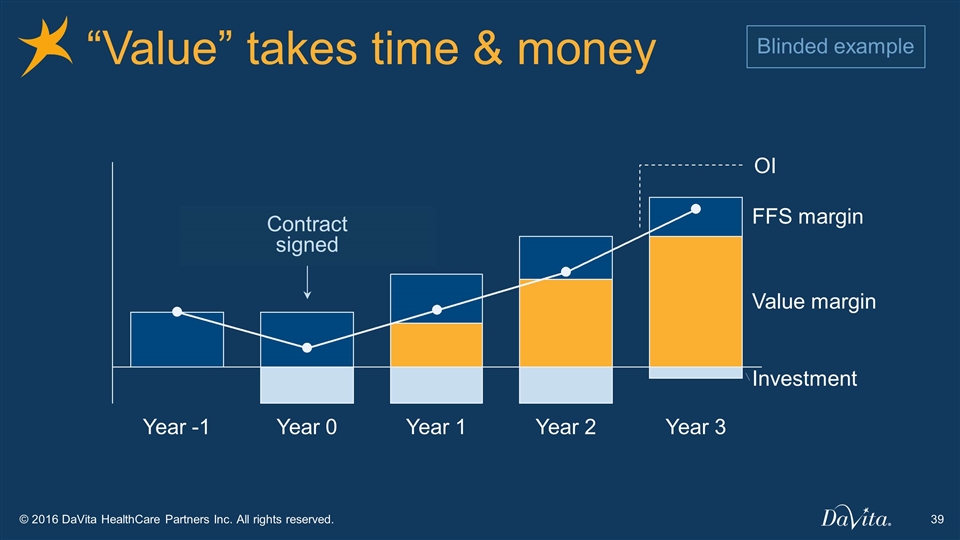
“Value” takes time & money Investment FFS margin Value margin OI Blinded example Contract signed
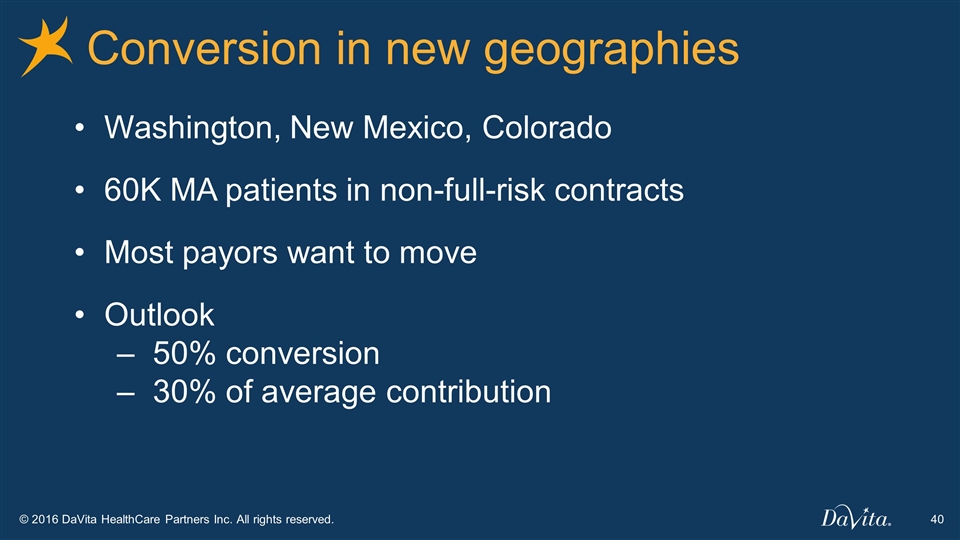
Conversion in new geographies Washington, New Mexico, Colorado 60K MA patients in non-full-risk contracts Most payors want to move Outlook 50% conversion 30% of average contribution
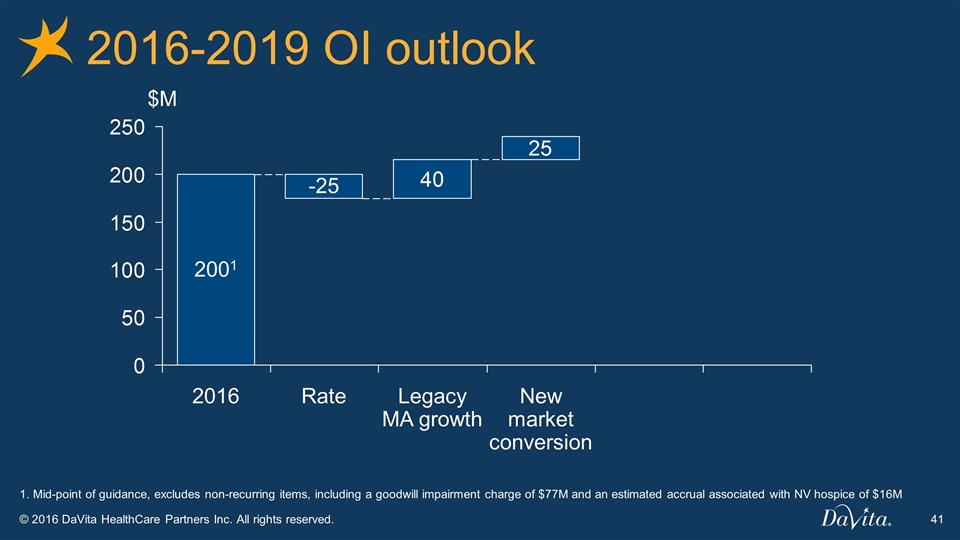
2016-2019 OI outlook New market conversion Legacy MA growth Rate 1 $M 1. Mid-point of guidance, excludes non-recurring items, including a goodwill impairment charge of $77M and an estimated accrual associated with NV hospice of $16M
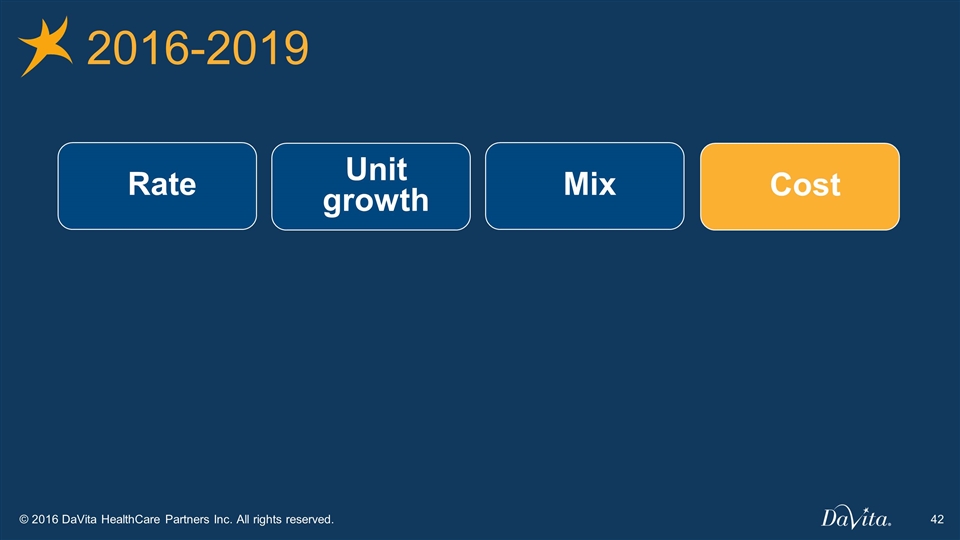
2016-2019 Rate Unit growth Cost Mix
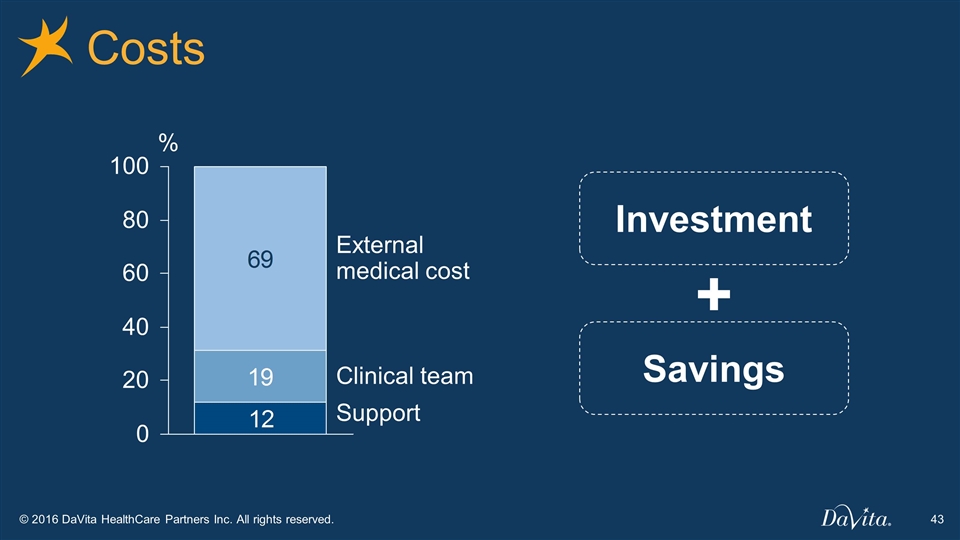
Costs Support Clinical team External medical cost % Investment Savings +
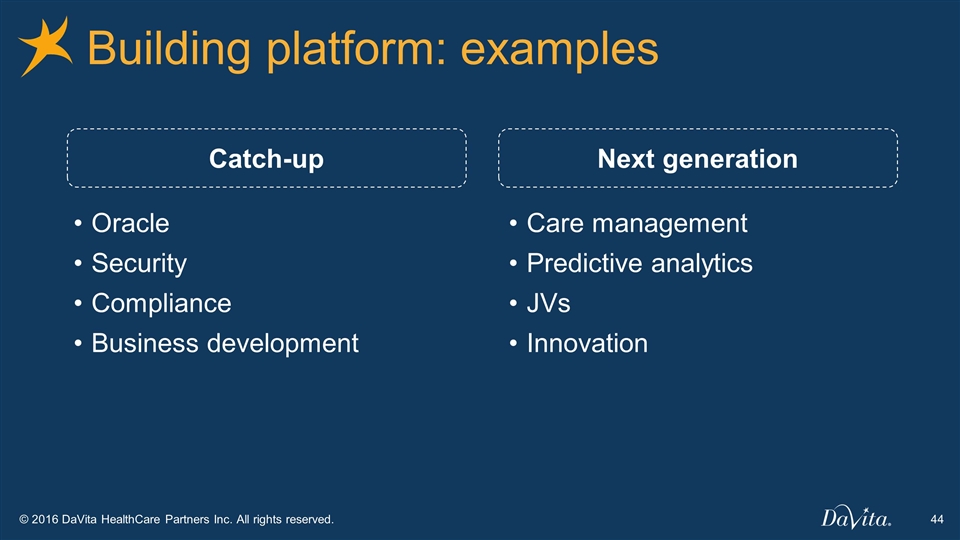
Building platform: examples Oracle Security Compliance Business development Care management Predictive analytics JVs Innovation Catch-up Next generation
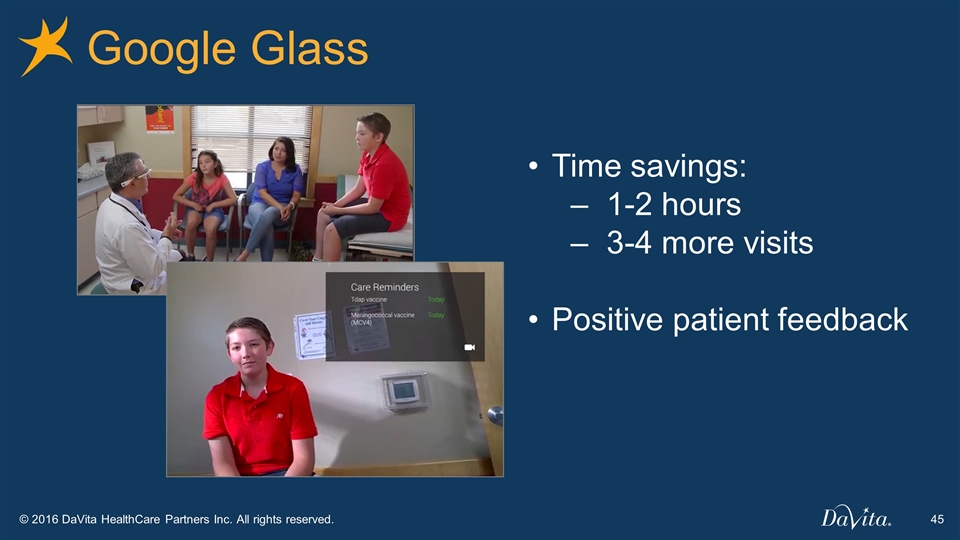
Google Glass Time savings: 1-2 hours 3-4 more visits Positive patient feedback
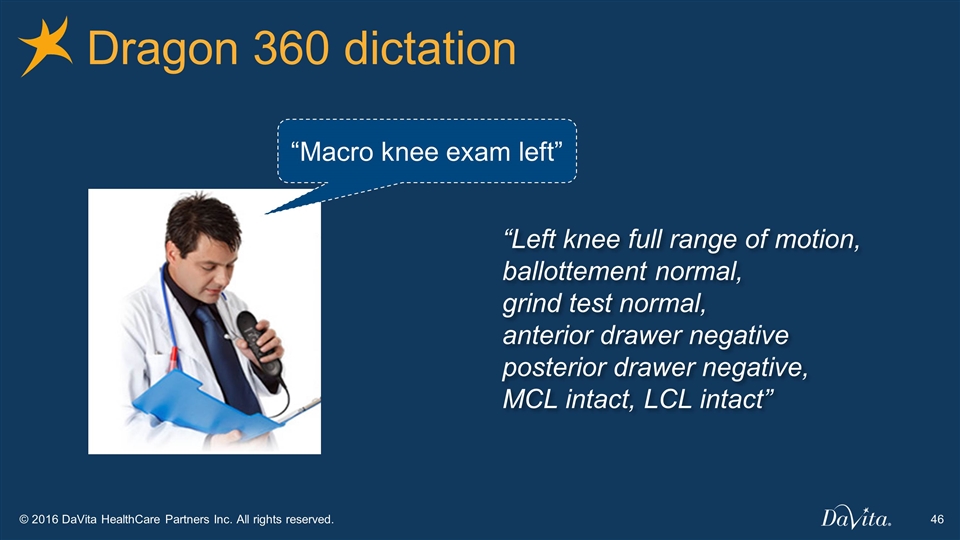
Dragon 360 dictation “Left knee full range of motion, ballottement normal, grind test normal, anterior drawer negative posterior drawer negative, MCL intact, LCL intact” “Macro knee exam left”
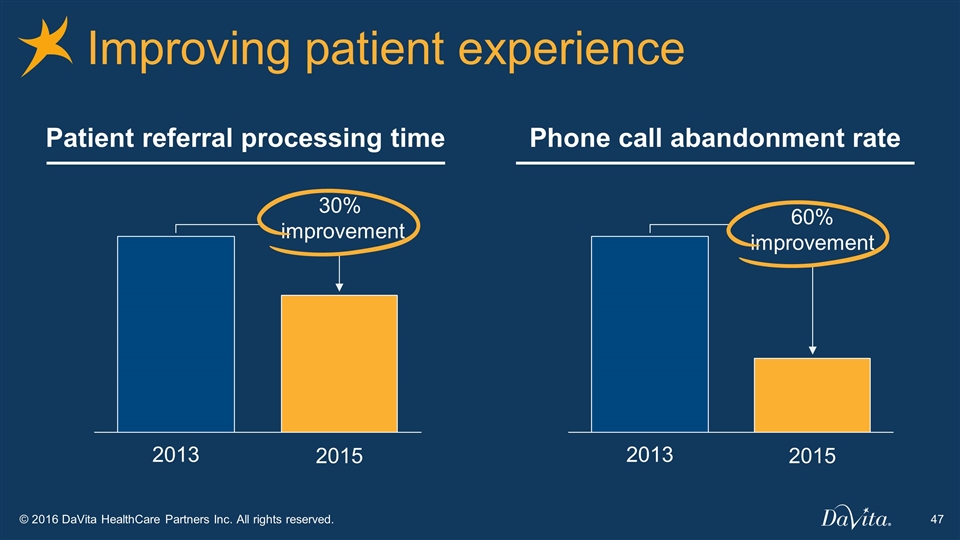
Improving patient experience Patient referral processing time Phone call abandonment rate 2013 2015 2013 2015 30% improvement 60% improvement
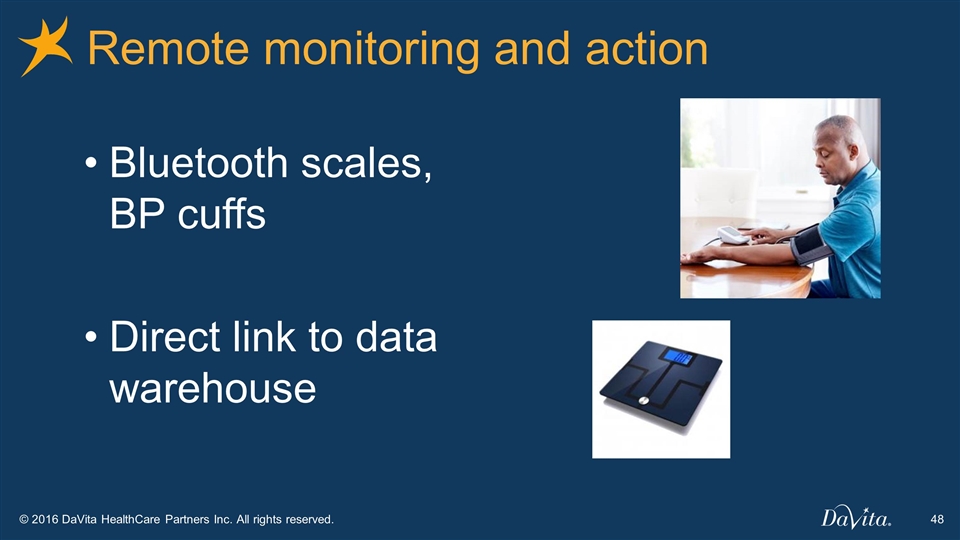
Remote monitoring and action Bluetooth scales, BP cuffs Direct link to data warehouse
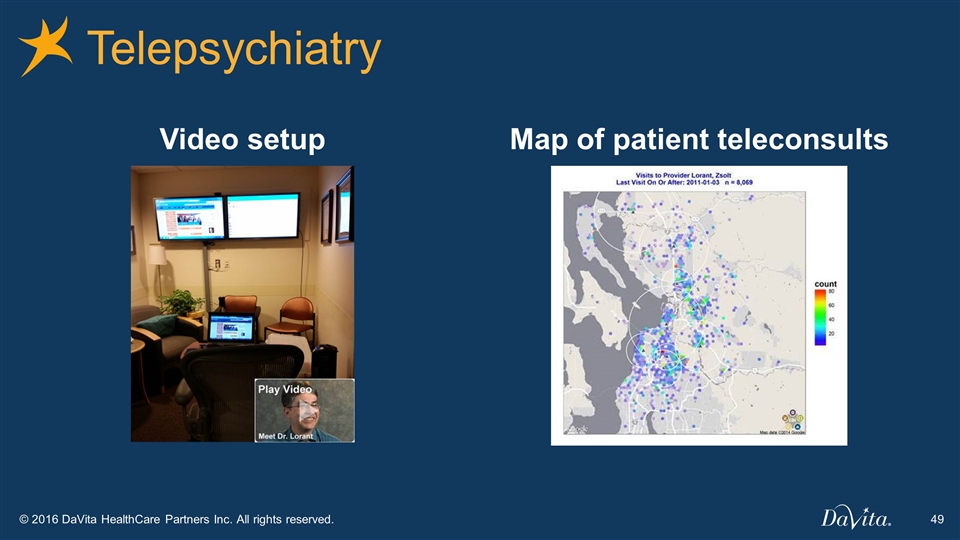
Telepsychiatry Video setup Map of patient teleconsults
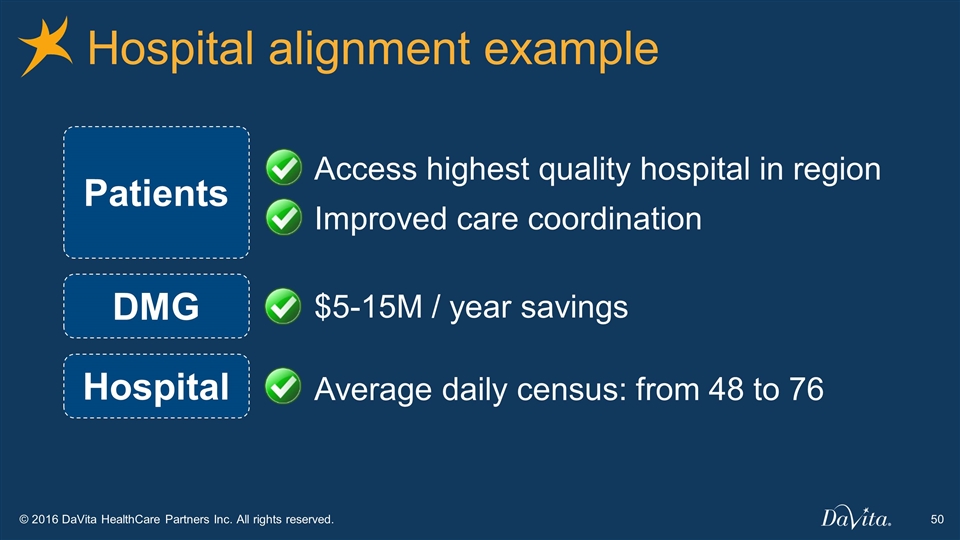
Hospital alignment example Access highest quality hospital in region Patients $5-15M / year savings DMG Hospital Average daily census: from 48 to 76 Improved care coordination
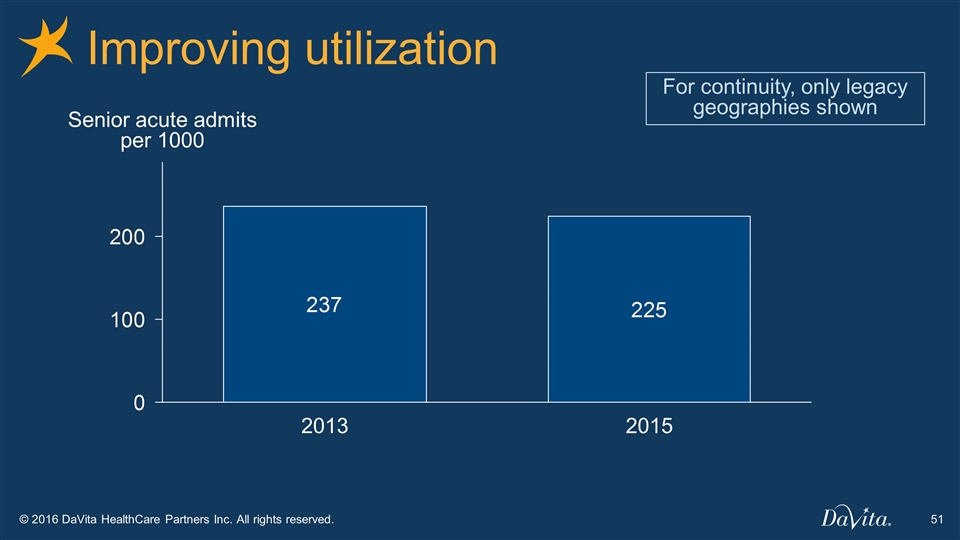
Improving utilization Senior acute admits per 1000 For continuity, only legacy geographies shown
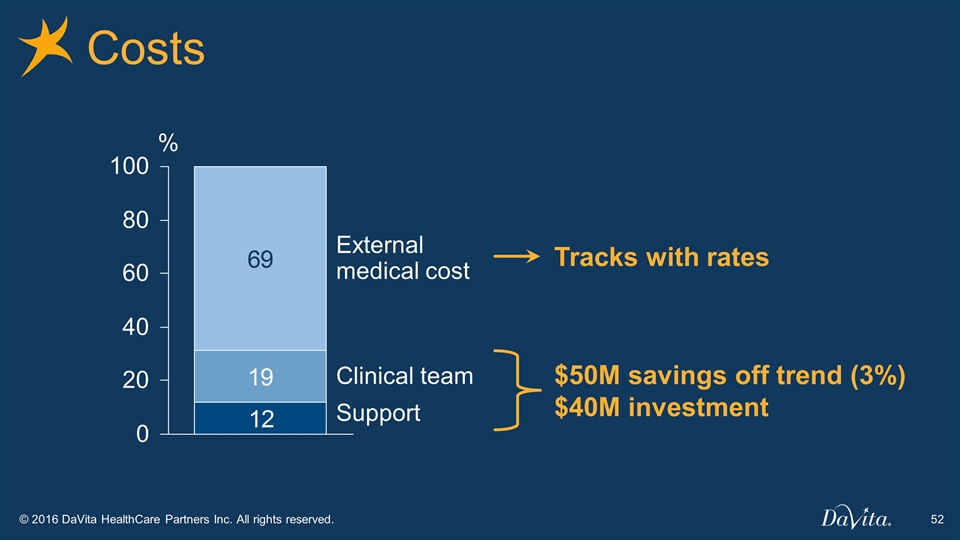
Costs Support Clinical team External medical cost % $50M savings off trend (3%) $40M investment Tracks with rates
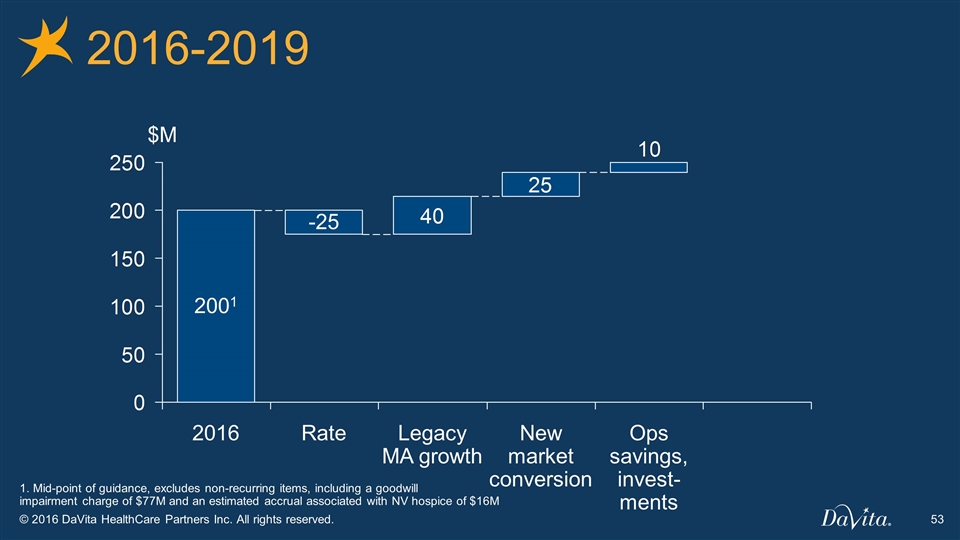
2016-2019 $M Ops savings, invest-ments New market conversion Legacy MA growth Rate 1 1. Mid-point of guidance, excludes non-recurring items, including a goodwill impairment charge of $77M and an estimated accrual associated with NV hospice of $16M
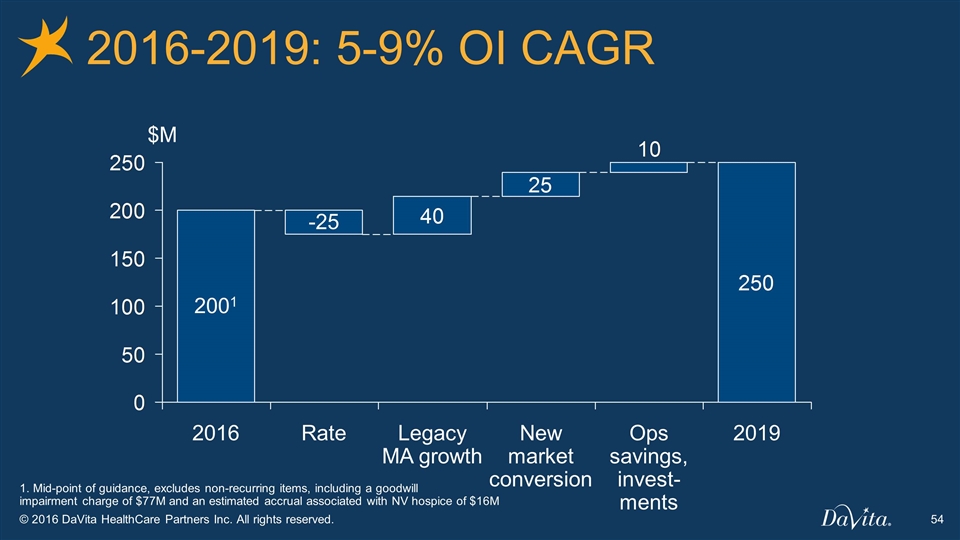
2016-2019: 5-9% OI CAGR 1 Legacy MA growth Rate $M Ops savings, invest-ments New market conversion 1. Mid-point of guidance, excludes non-recurring items, including a goodwill impairment charge of $77M and an estimated accrual associated with NV hospice of $16M
Other opportunities Commercial (included branded product) Medicaid / Dual-Eligibles Specialty drug management Post-acute management
What is our outlook? How reasonable is the outlook? Why do we like this business? DaVita Medical Group

Why do we like this business? Strong fundamentals Cash flow dynamics Optionality
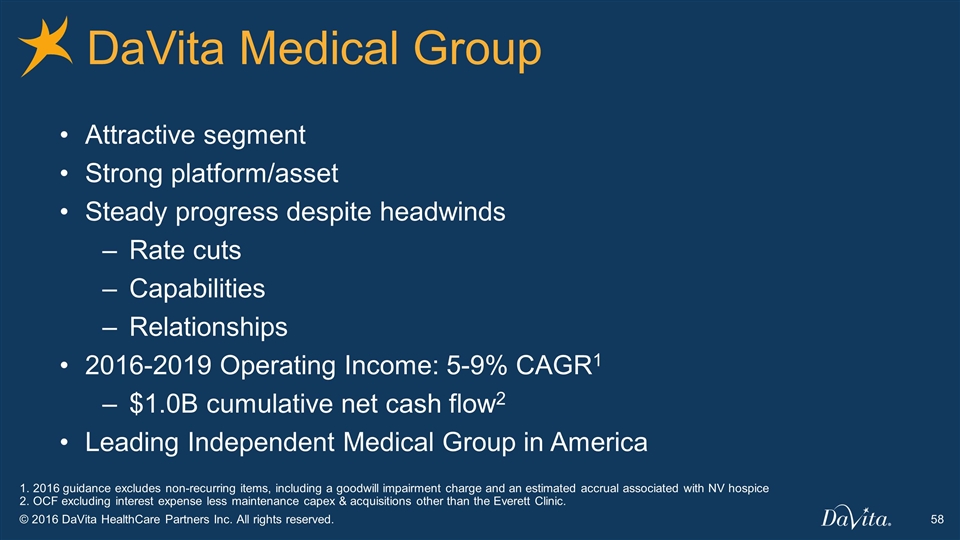
DaVita Medical Group Attractive segment Strong platform/asset Steady progress despite headwinds Rate cuts Capabilities Relationships 2016-2019 Operating Income: 5-9% CAGR1 $1.0B cumulative net cash flow2 Leading Independent Medical Group in America 1. 2016 guidance excludes non-recurring items, including a goodwill impairment charge and an estimated accrual associated with NV hospice 2. OCF excluding interest expense less maintenance capex & acquisitions other than the Everett Clinic.
DaVita Kidney Care Enterprise Summary DaVita International DaVita Medical Group Introduction
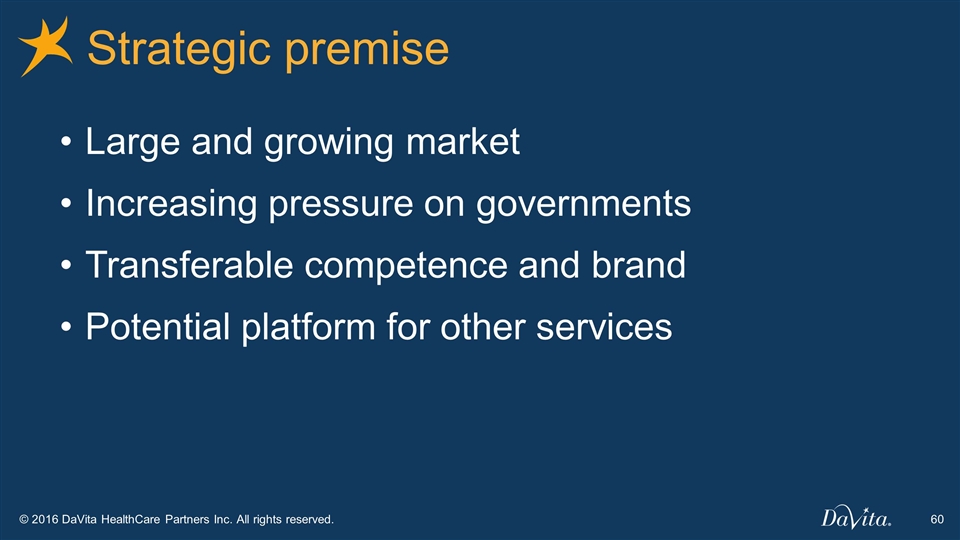
Strategic premise Large and growing market Increasing pressure on governments Transferable competence and brand Potential platform for other services
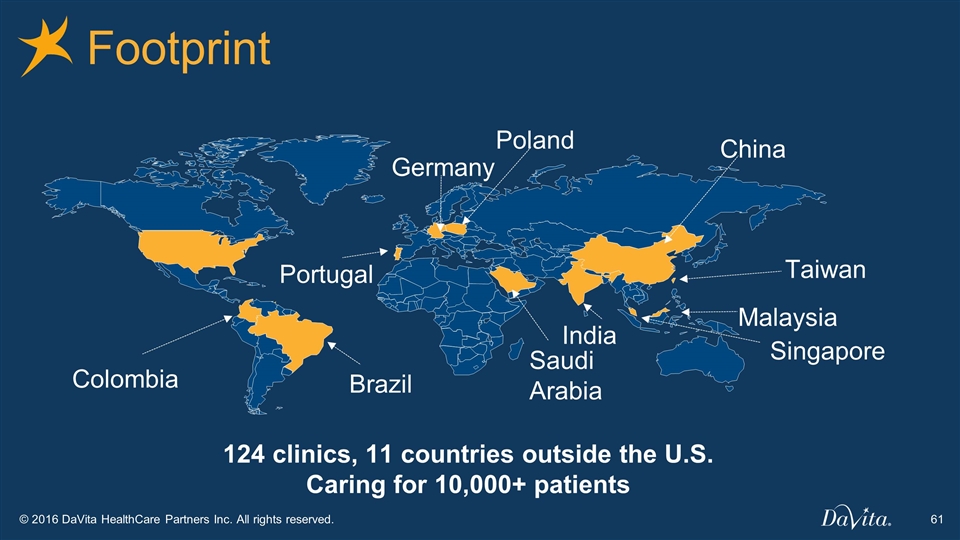
Portugal Footprint India China Saudi Arabia Taiwan Singapore Malaysia Poland 124 clinics, 11 countries outside the U.S. Caring for 10,000+ patients Colombia Germany Brazil
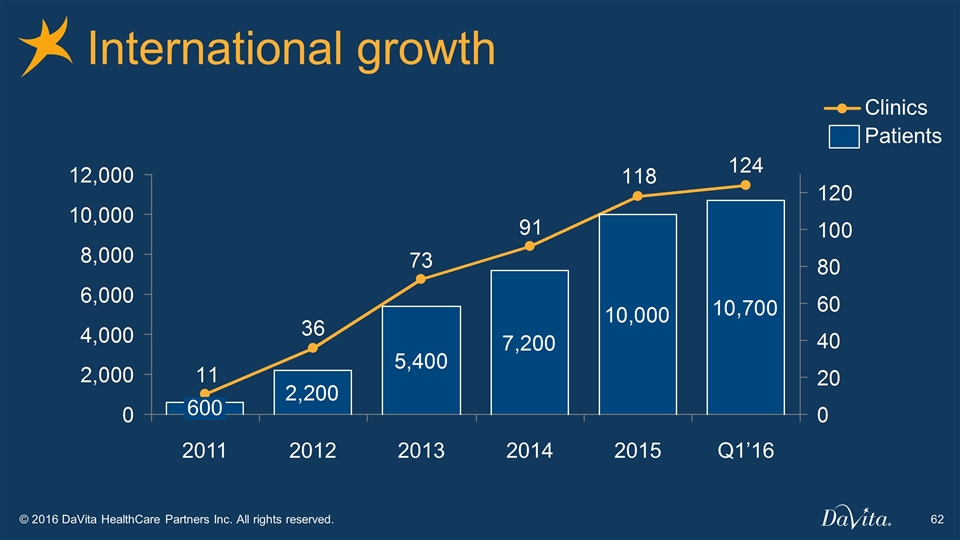
International growth Q1’16
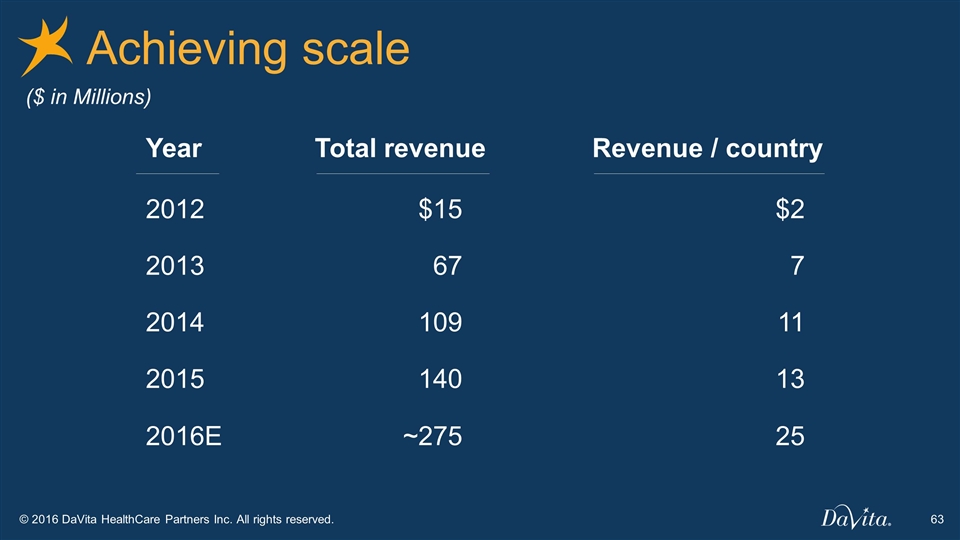
Achieving scale Year Revenue / country 2012 $2 2013 7 2014 11 2015 13 2016E 25 Total revenue $15 67 109 140 ~275 ($ in Millions)
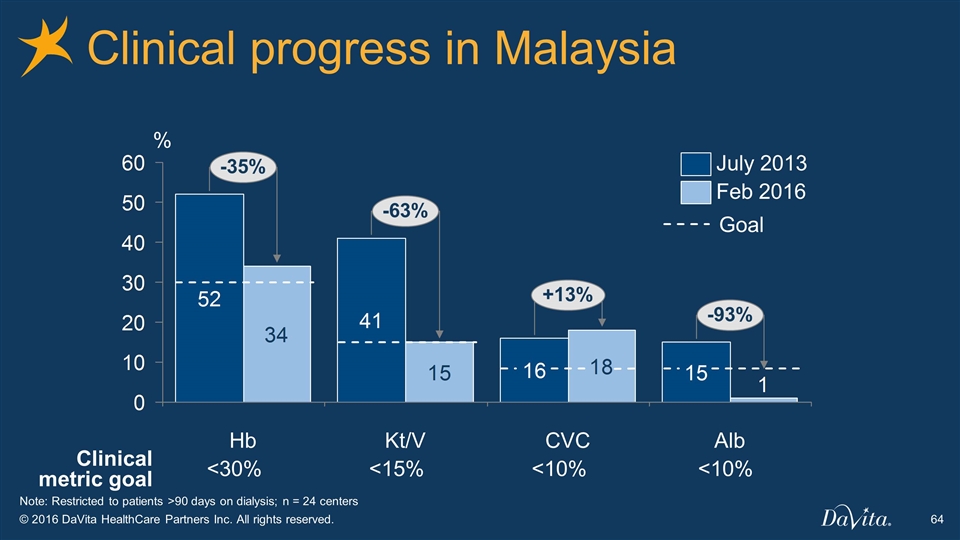
Clinical progress in Malaysia Clinical metric goal <30% <15% <10% <10% Note: Restricted to patients >90 days on dialysis; n = 24 centers % Feb 2016 July 2013 Goal
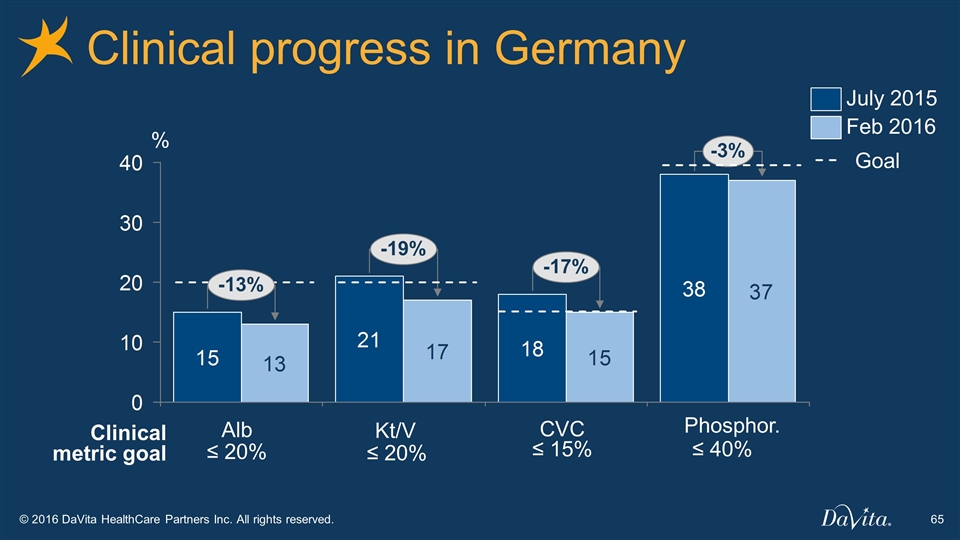
Clinical progress in Germany % Feb 2016 July 2015 Phosphor. Clinical metric goal ≤ 15% ≤ 20% ≤ 20% ≤ 40% Goal
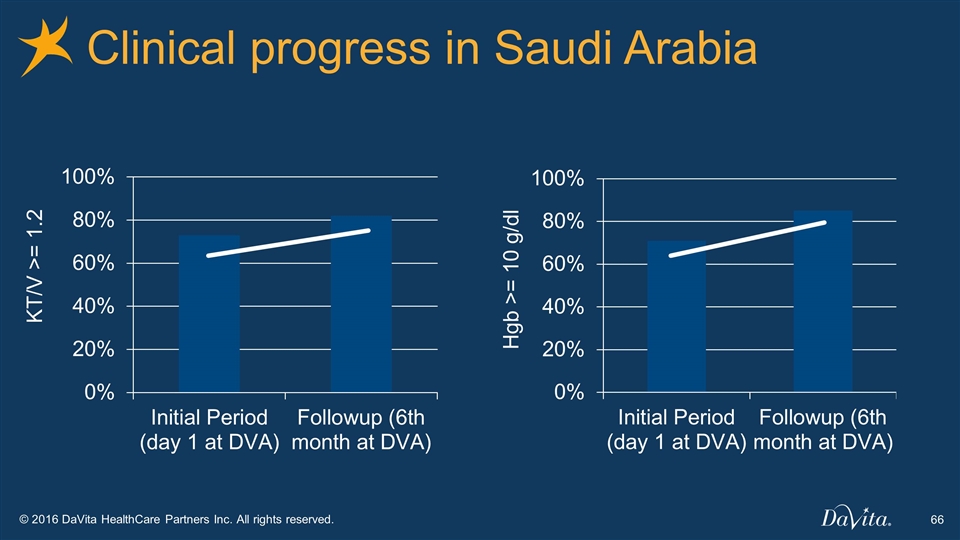
Clinical progress in Saudi Arabia KT/V >= 1.2 Hgb >= 10 g/dl
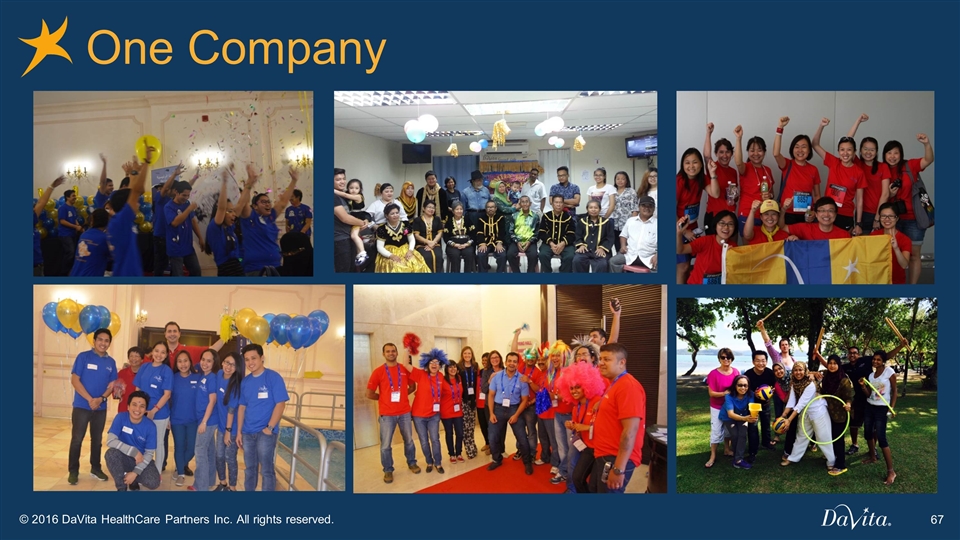
One Company

Financial outlook 2016 2018 OI Guidance ~($40M) Breakeven
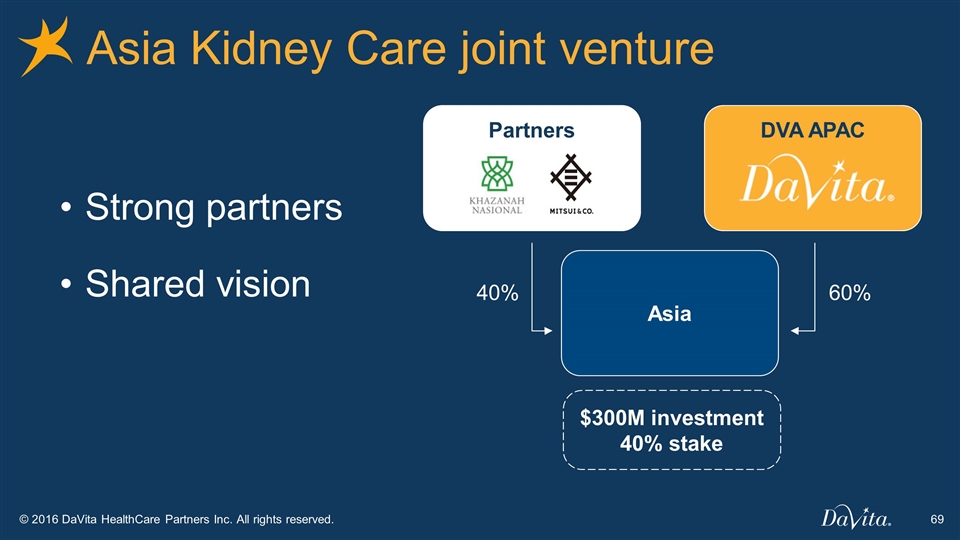
Asia Kidney Care joint venture Strong partners Shared vision Partners DVA APAC Asia $300M investment 40% stake 40% 60%
DaVita Kidney Care Enterprise Summary DaVita International DaVita Medical Group Introduction
Chief Executive Officer, DaVita Kidney Care Javier Rodriguez
Industry Overview Company Overview Outlook DaVita Kidney Care
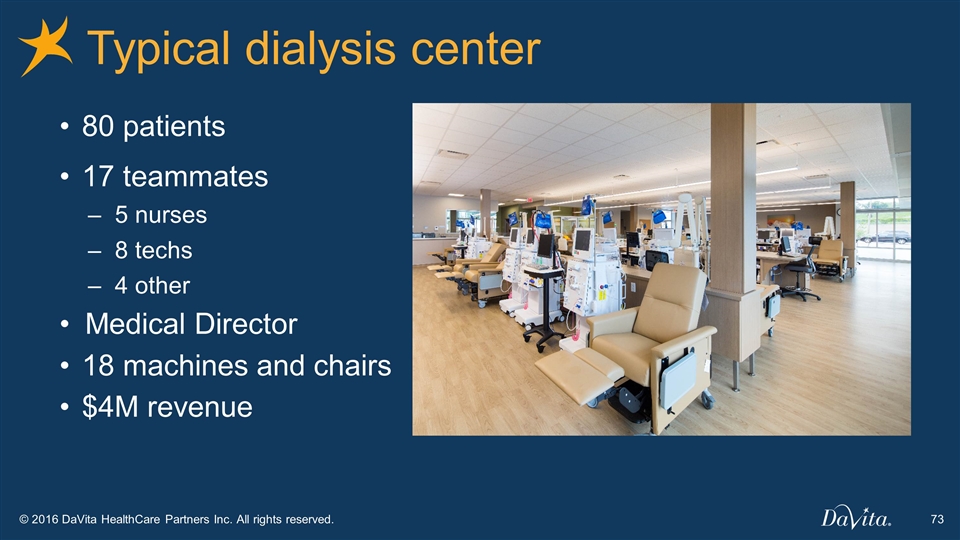
80 patients 17 teammates 5 nurses 8 techs 4 other Medical Director 18 machines and chairs $4M revenue Typical dialysis center
Industry overview Stable demand growth Strong cash flow generation Significant government engagement Private payors subsidize government Dynamic payor landscape and ESA marketplace
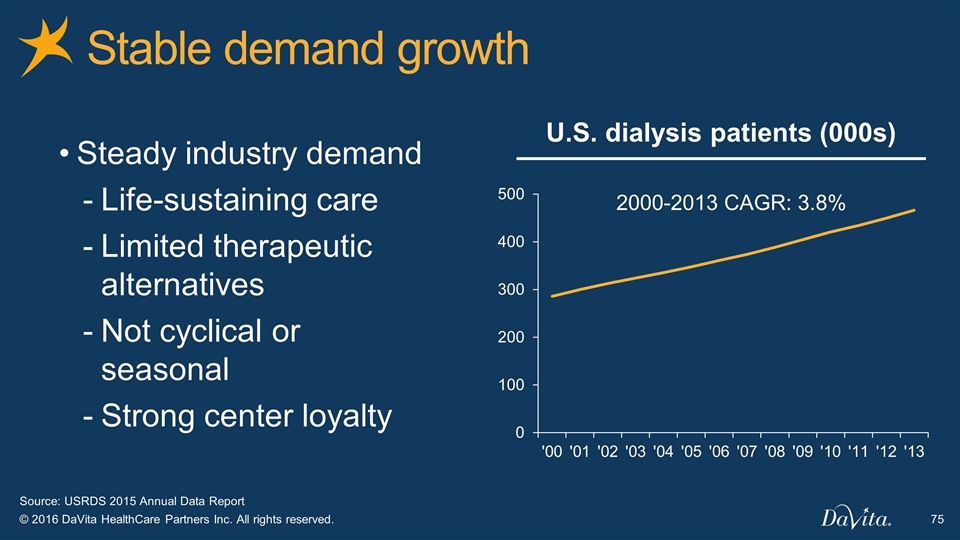
Stable demand growth U.S. dialysis patients (000s) 2000-2013 CAGR: 3.8% Steady industry demand Life-sustaining care Limited therapeutic alternatives Not cyclical or seasonal Strong center loyalty Source: USRDS 2015 Annual Data Report

ESRD population growth profile Impact on ESRD growth Industry dynamic 65+ age population growing Growing Hispanic population at higher risk Management of diabetes and hypertension Historical improvement in mortality slowing
Significant government engagement Dialysis represents ~1% of Medicare patients, but ~7% of total Medicare budget Fragile patient population ~90% of DaVita’s patients funded by government payors Transparent economics
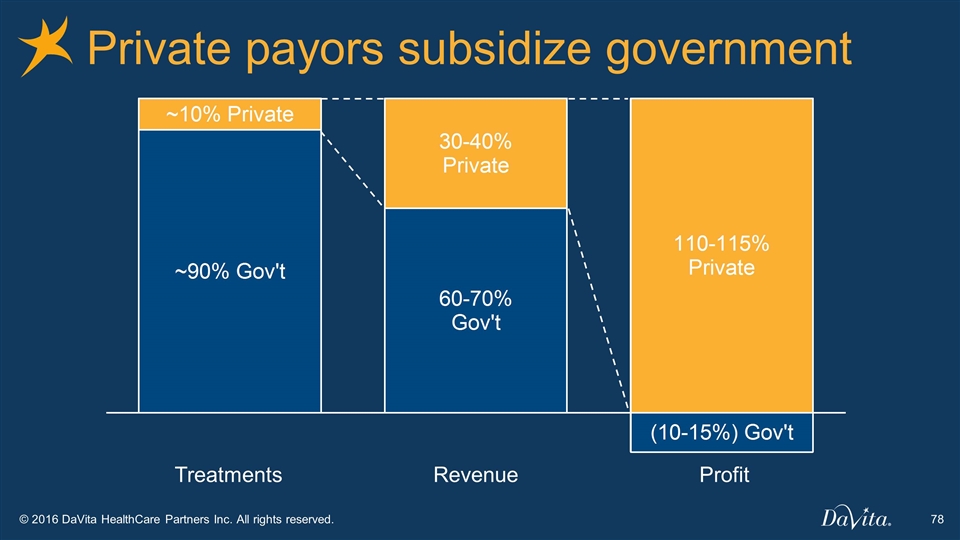
Private payors subsidize government Treatments Revenue Profit
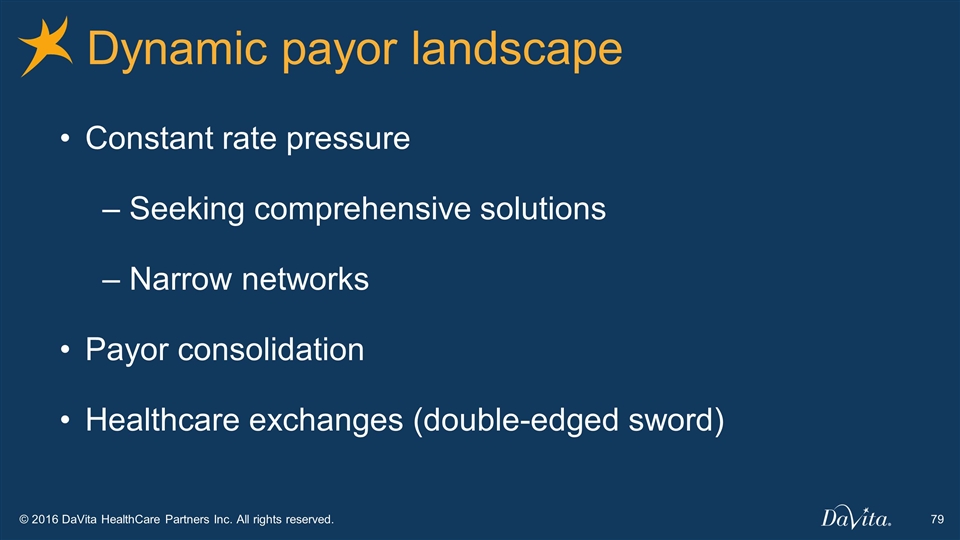
Dynamic payor landscape Constant rate pressure Seeking comprehensive solutions Narrow networks Payor consolidation Healthcare exchanges (double-edged sword)
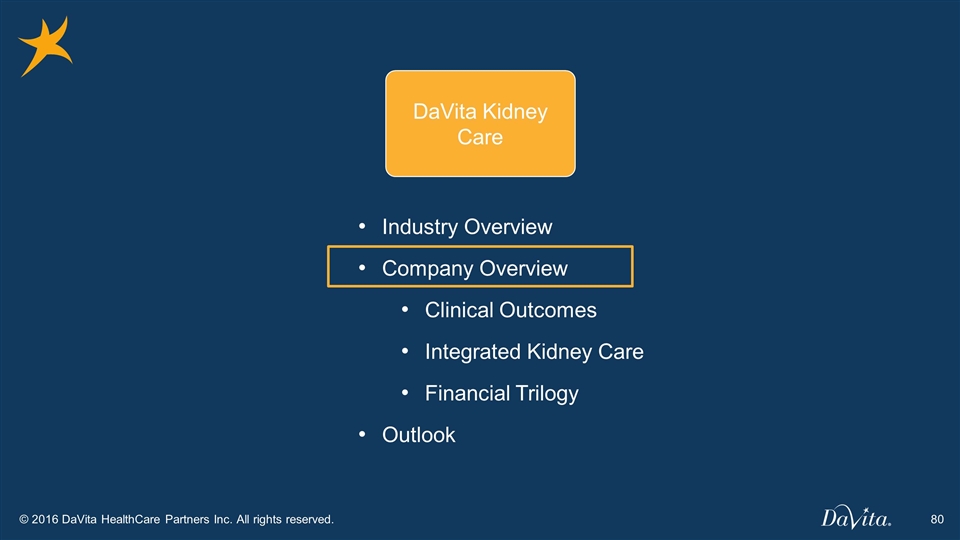
Industry Overview Company Overview Clinical Outcomes Integrated Kidney Care Financial Trilogy Outlook DaVita Kidney Care
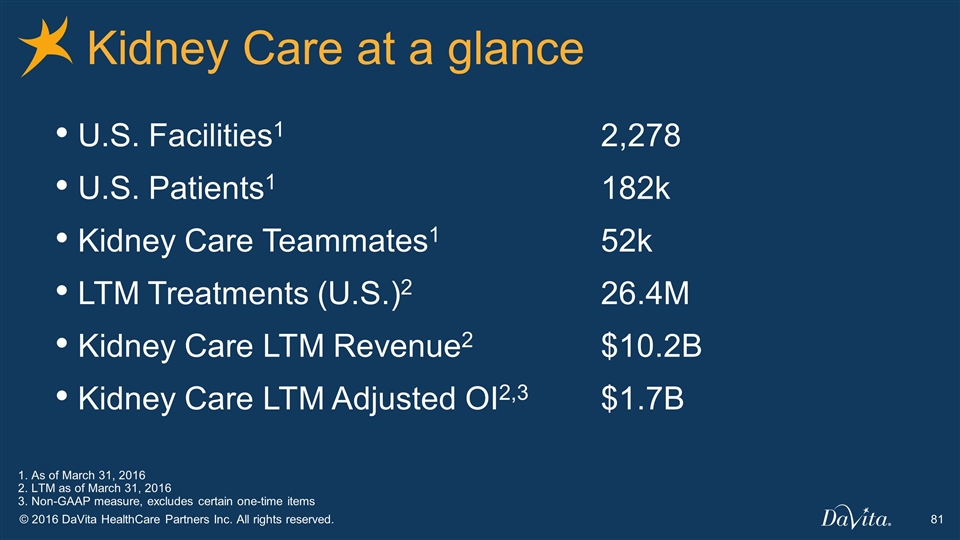
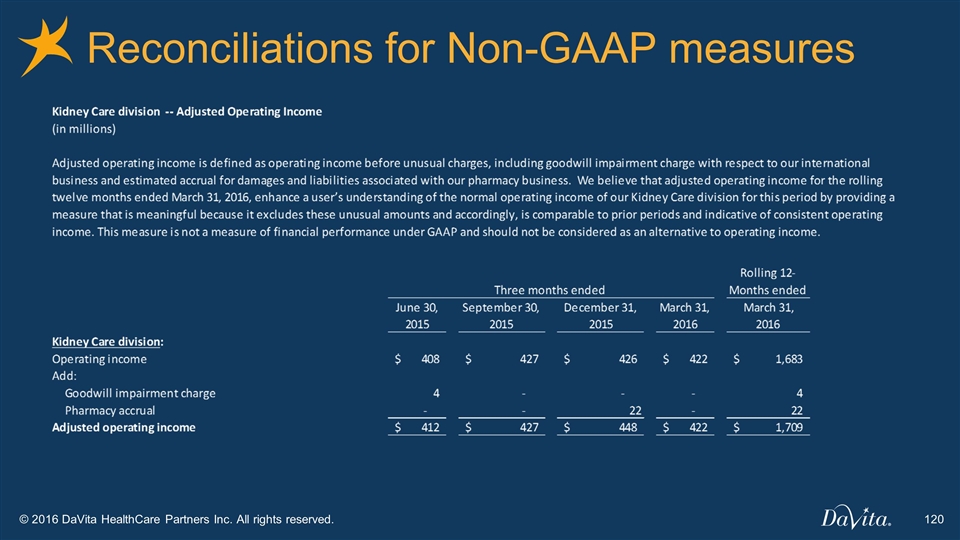
U.S. Facilities1 2,278 U.S. Patients1 182k Kidney Care Teammates1 52k LTM Treatments (U.S.)2 26.4M Kidney Care LTM Revenue2 $10.2B Kidney Care LTM Adjusted OI2,3 $1.7B Kidney Care at a glance 1. As of March 31, 2016 2. LTM as of March 31, 2016 3. Non-GAAP measure, excludes certain one-time items
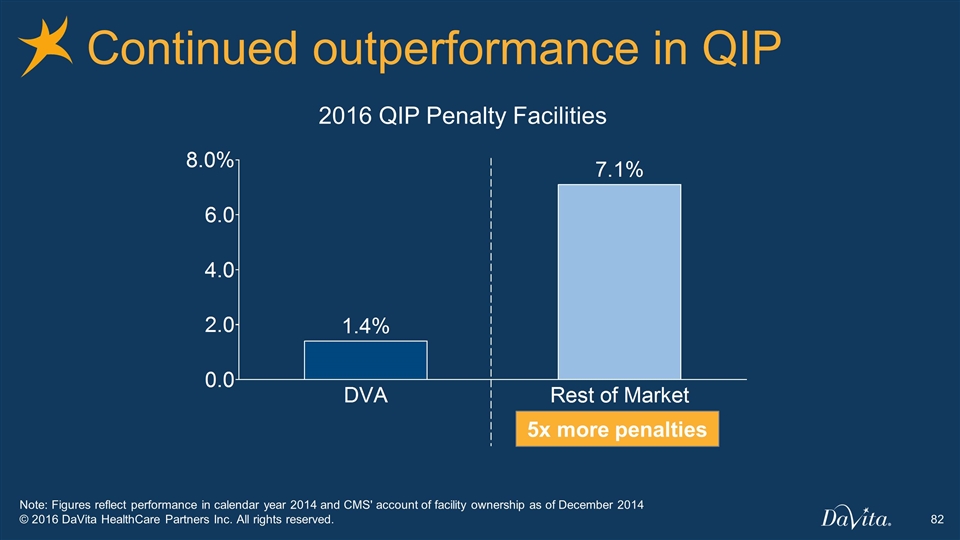
Continued outperformance in QIP Note: Figures reflect performance in calendar year 2014 and CMS' account of facility ownership as of December 2014 2016 QIP Penalty Facilities 5x more penalties
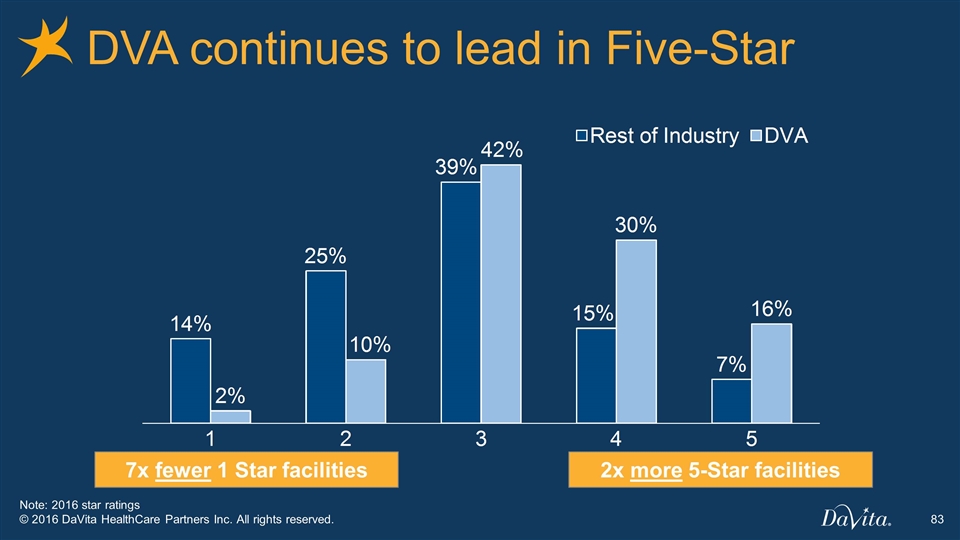
DVA continues to lead in Five-Star Note: 2016 star ratings 7x fewer 1 Star facilities 2x more 5-Star facilities
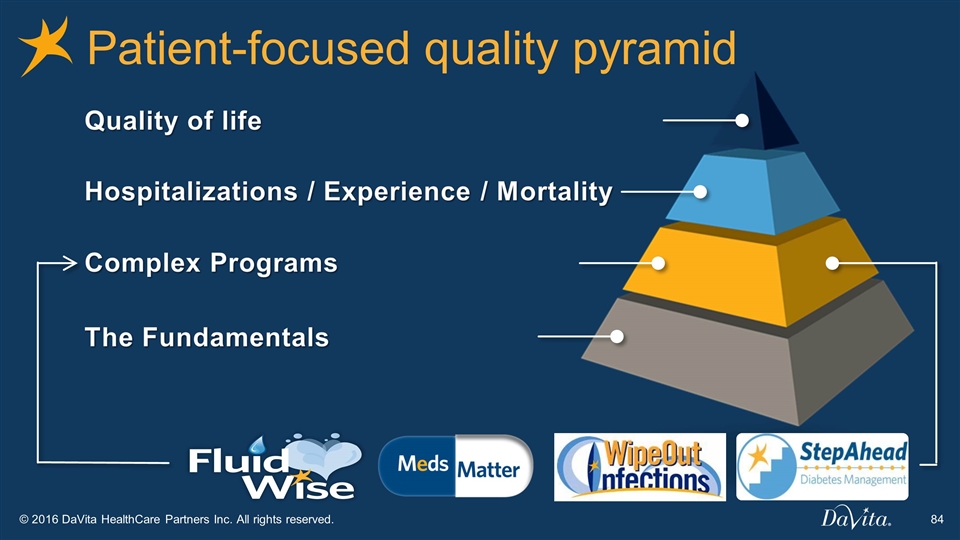
Patient-focused quality pyramid Quality of life Hospitalizations / Experience / Mortality Complex Programs The Fundamentals
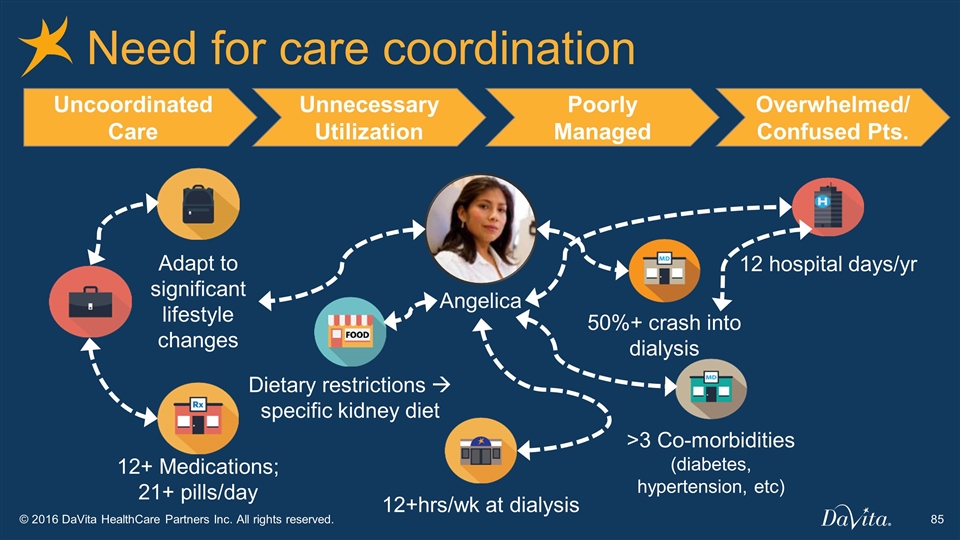
Need for care coordination Uncoordinated Care Unnecessary Utilization Poorly Managed Overwhelmed/ Confused Pts. Adapt to significant lifestyle changes 12+ Medications; 21+ pills/day Dietary restrictions à specific kidney diet 12+hrs/wk at dialysis 12 hospital days/yr 50%+ crash into dialysis >3 Co-morbidities (diabetes, hypertension, etc) Angelica
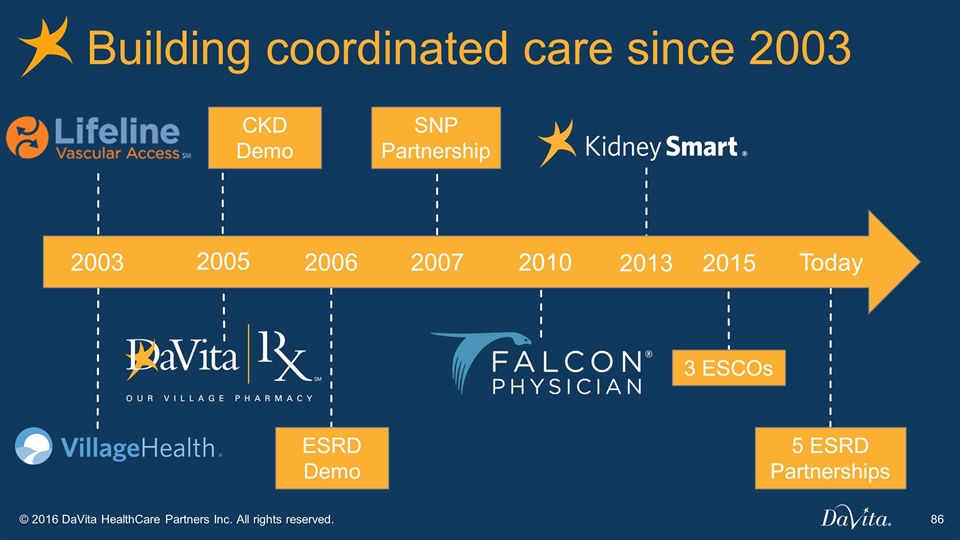
CKD Demo Building coordinated care since 2003 2003 2005 Today 2006 2007 2010 2015 ESRD Demo SNP Partnership 3 ESCOs 5 ESRD Partnerships 2013
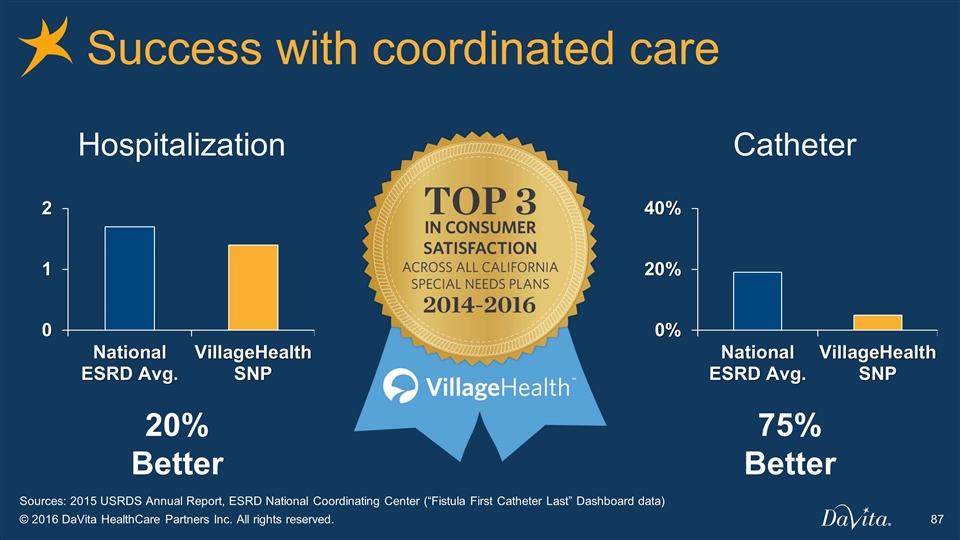
Sources: 2015 USRDS Annual Report, ESRD National Coordinating Center (“Fistula First Catheter Last” Dashboard data) Success with coordinated care 20% Better 75% Better Hospitalization Catheter
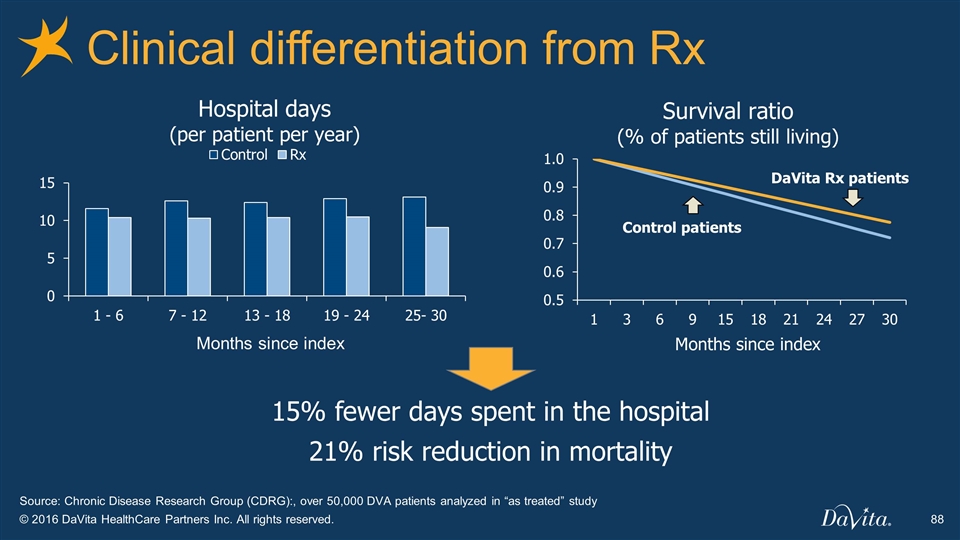
Source: Chronic Disease Research Group (CDRG):, over 50,000 DVA patients analyzed in “as treated” study 15% fewer days spent in the hospital 21% risk reduction in mortality Clinical differentiation from Rx Survival ratio (% of patients still living) Months since index Hospital days (per patient per year) Months since index DaVita Rx patients Control patients
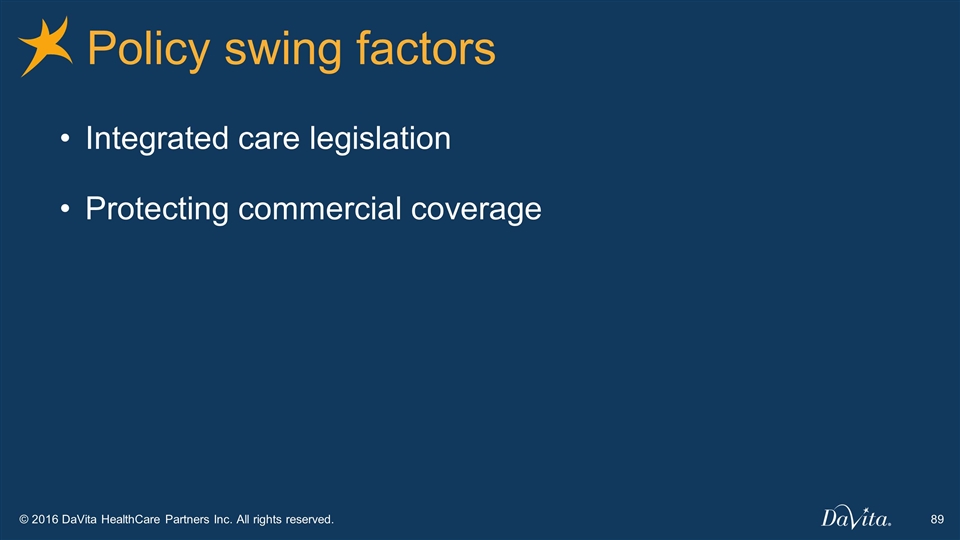
Policy swing factors Integrated care legislation Protecting commercial coverage
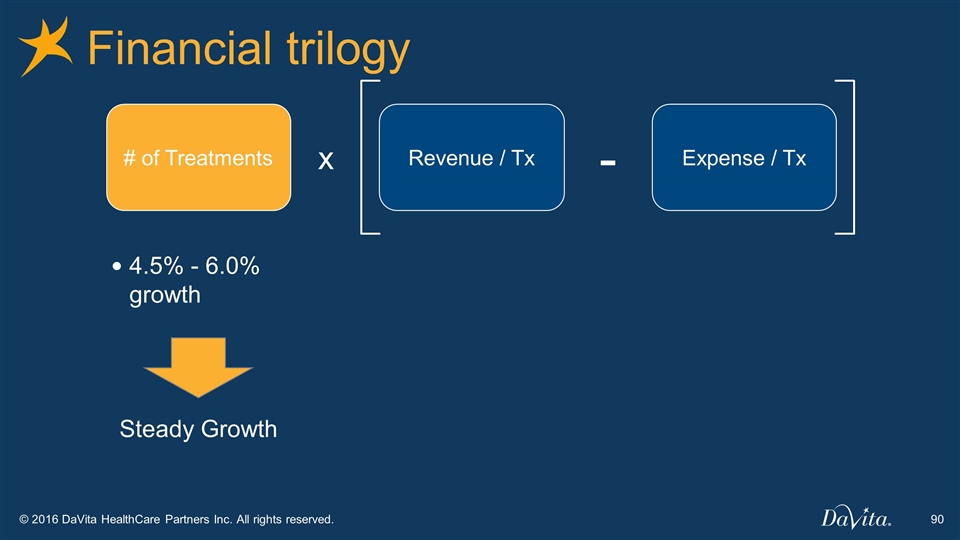
Financial trilogy 4.5% - 6.0% growth Steady Growth # of Treatments Revenue / Tx Expense / Tx - x
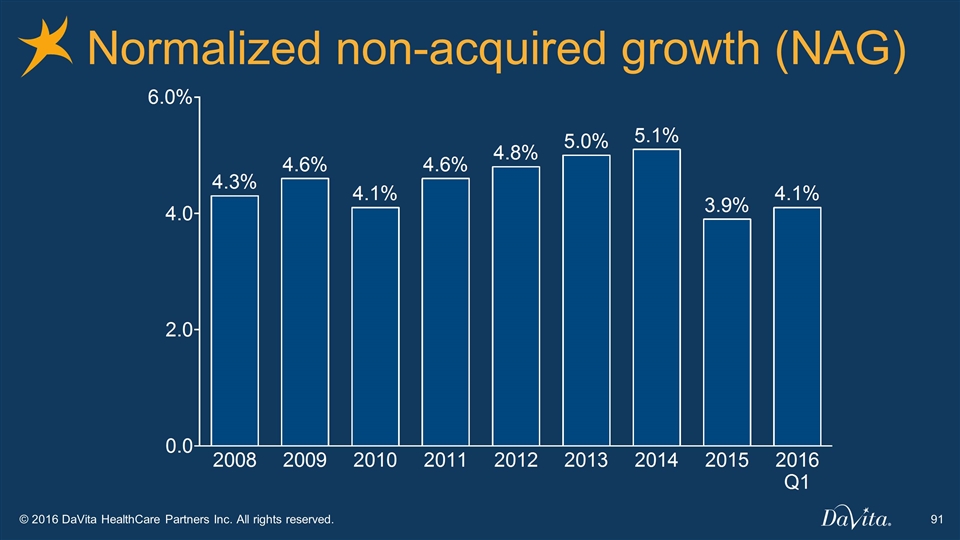
Normalized non-acquired growth (NAG)
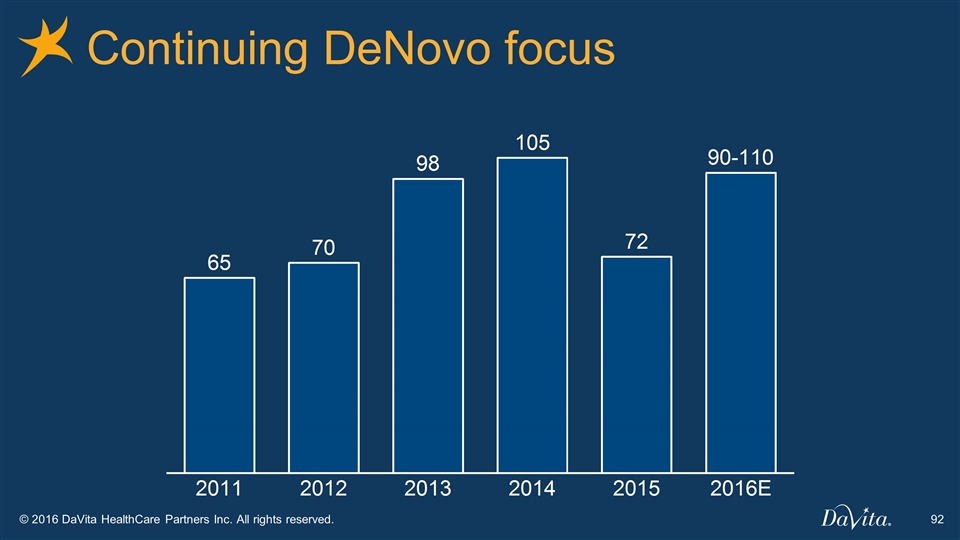
Continuing DeNovo focus
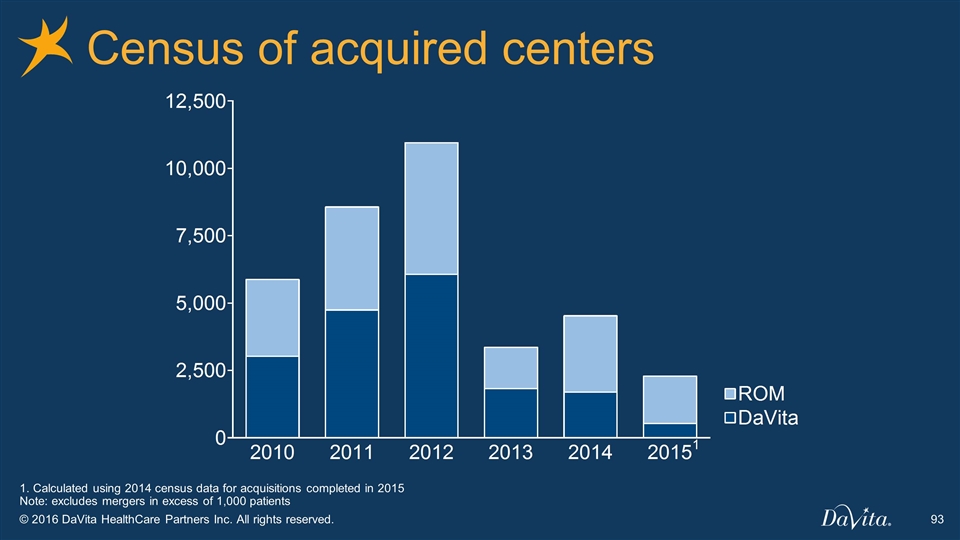
Census of acquired centers 1. Calculated using 2014 census data for acquisitions completed in 2015 Note: excludes mergers in excess of 1,000 patients 1
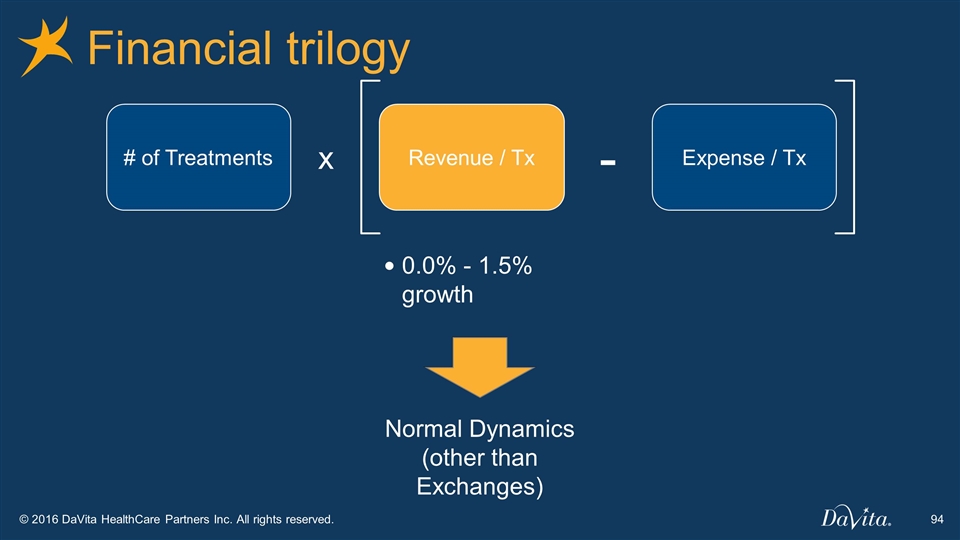
Financial trilogy 0.0% - 1.5% growth Normal Dynamics (other than Exchanges) # of Treatments Revenue / Tx Expense / Tx - x
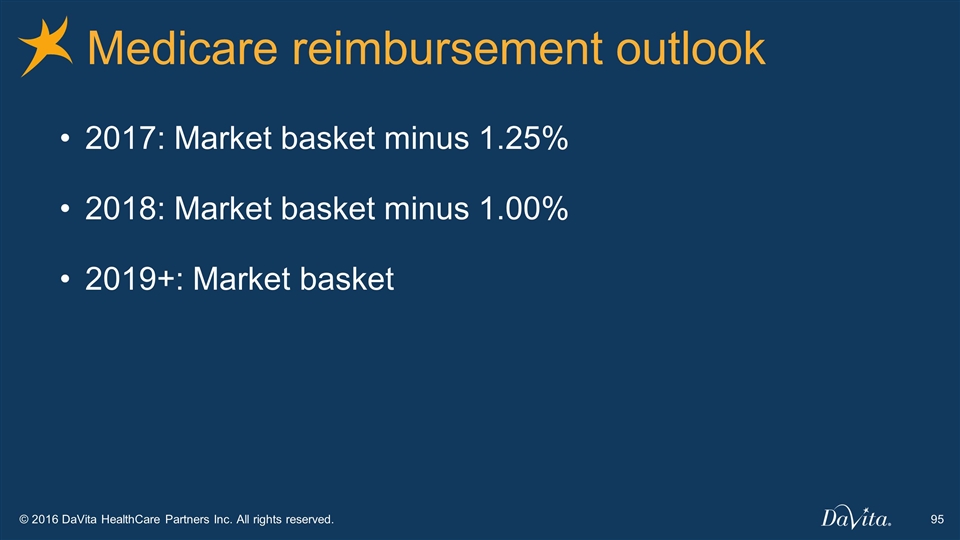
Medicare reimbursement outlook 2017: Market basket minus 1.25% 2018: Market basket minus 1.00% 2019+: Market basket
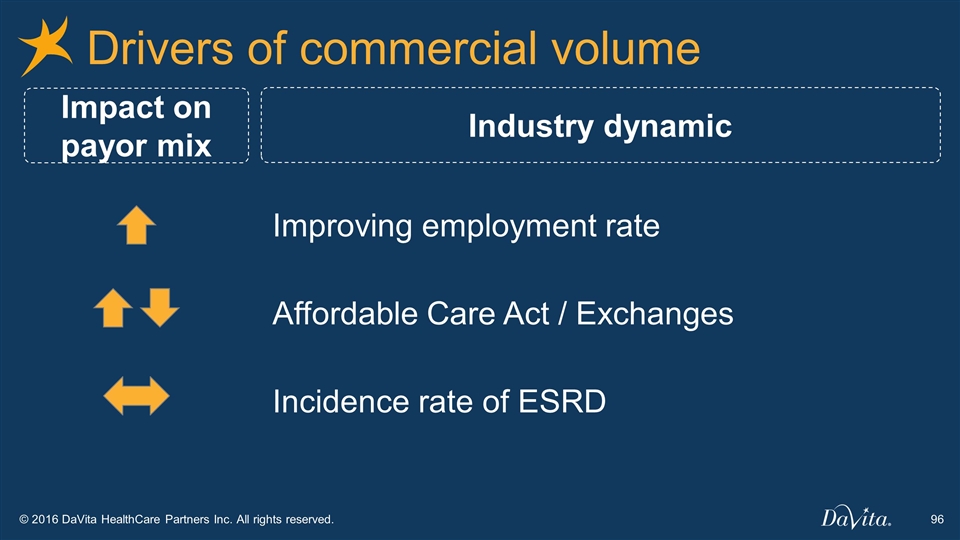
Improving employment rate Drivers of commercial volume Impact on payor mix Industry dynamic Affordable Care Act / Exchanges Incidence rate of ESRD
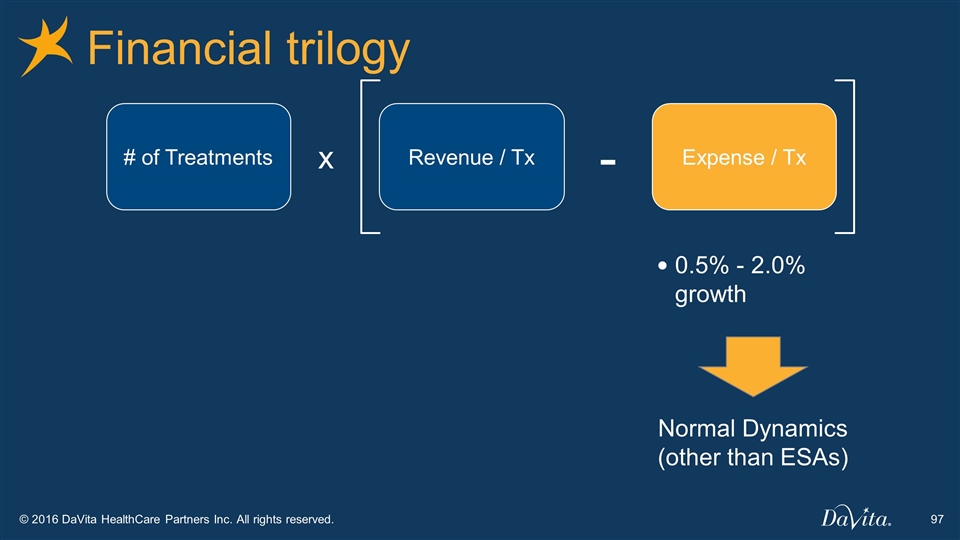
Financial trilogy 0.5% - 2.0% growth Normal Dynamics (other than ESAs) # of Treatments Revenue / Tx Expense / Tx - x
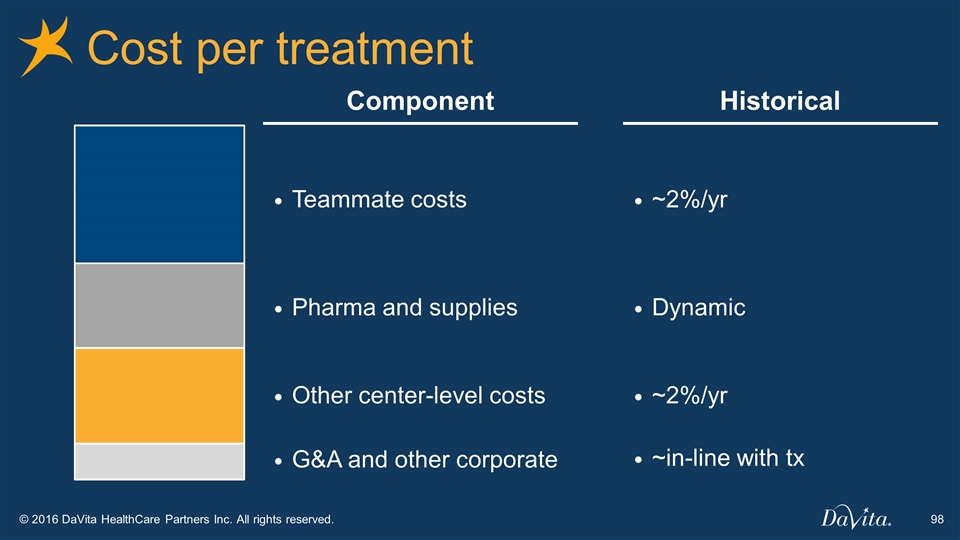
Cost per treatment Teammate costs Pharma and supplies Other center-level costs G&A and other corporate Component Historical ~2%/yr Dynamic ~2%/yr ~in-line with tx
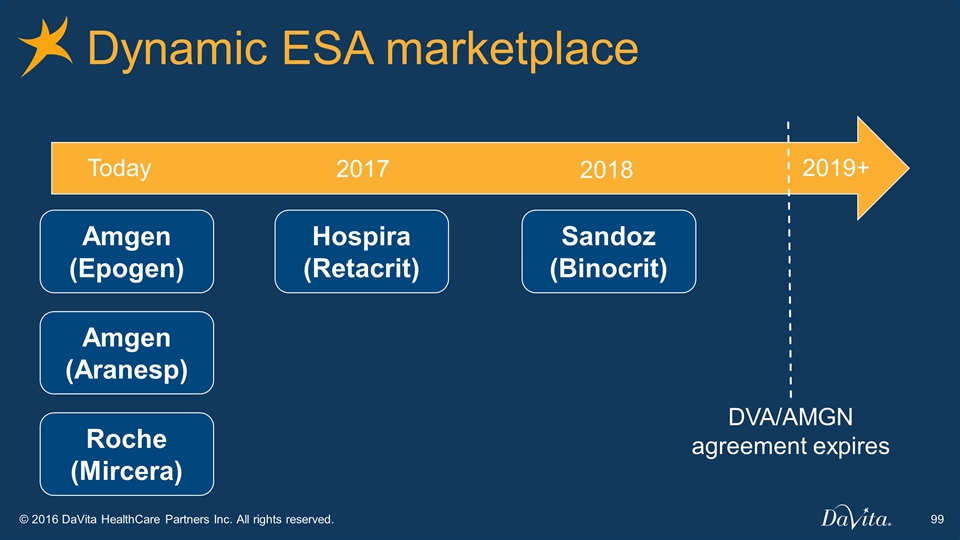
Roche (Mircera) Hospira (Retacrit) Sandoz (Binocrit) Dynamic ESA marketplace Today 2017 2018 2019+ Amgen (Aranesp) DVA/AMGN agreement expires Amgen (Epogen)
Industry Overview Company Overview Outlook DaVita Kidney Care
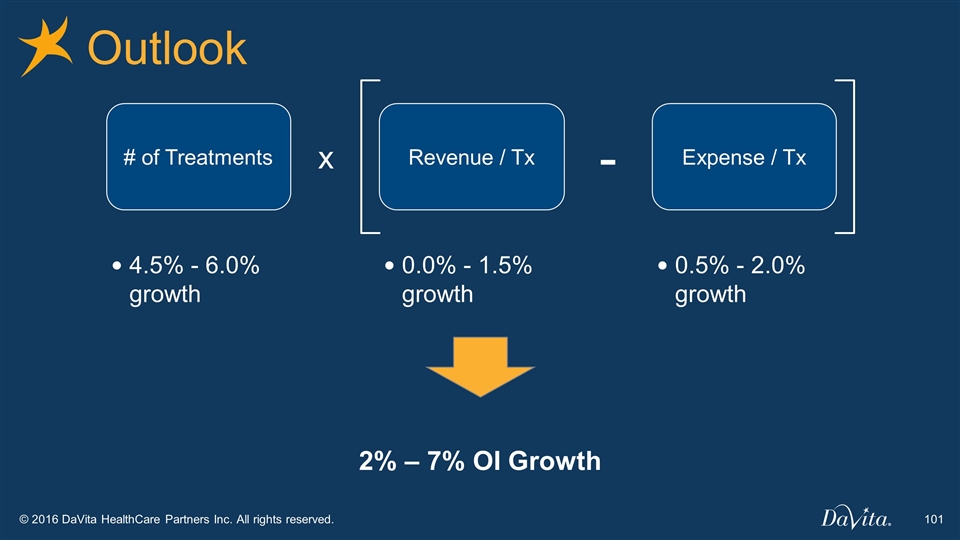
Outlook 4.5% - 6.0% growth 0.0% - 1.5% growth 0.5% - 2.0% growth # of Treatments Revenue / Tx Expense / Tx - x 2% – 7% OI Growth
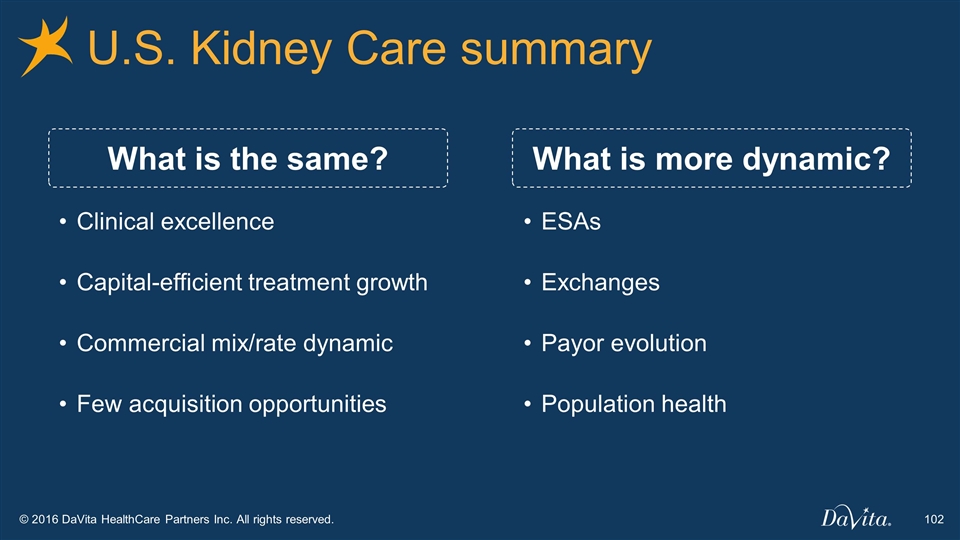
What is more dynamic? What is the same? U.S. Kidney Care summary Clinical excellence Capital-efficient treatment growth Commercial mix/rate dynamic Few acquisition opportunities ESAs Exchanges Payor evolution Population health
DaVita Kidney Care Enterprise Summary DaVita International DaVita Medical Group Introduction

Interim Chief Financial Officer & Chief Accounting Officer Jim Hilger
Capital Structure Capital Deployment Summary Enterprise Summary
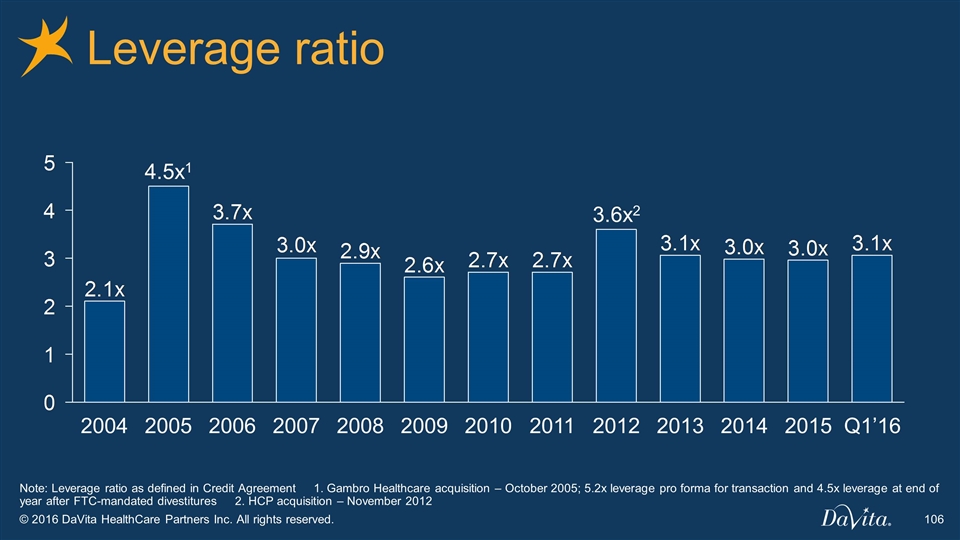
Leverage ratio Note: Leverage ratio as defined in Credit Agreement 1. Gambro Healthcare acquisition – October 2005; 5.2x leverage pro forma for transaction and 4.5x leverage at end of year after FTC-mandated divestitures 2. HCP acquisition – November 2012 2015 2 1
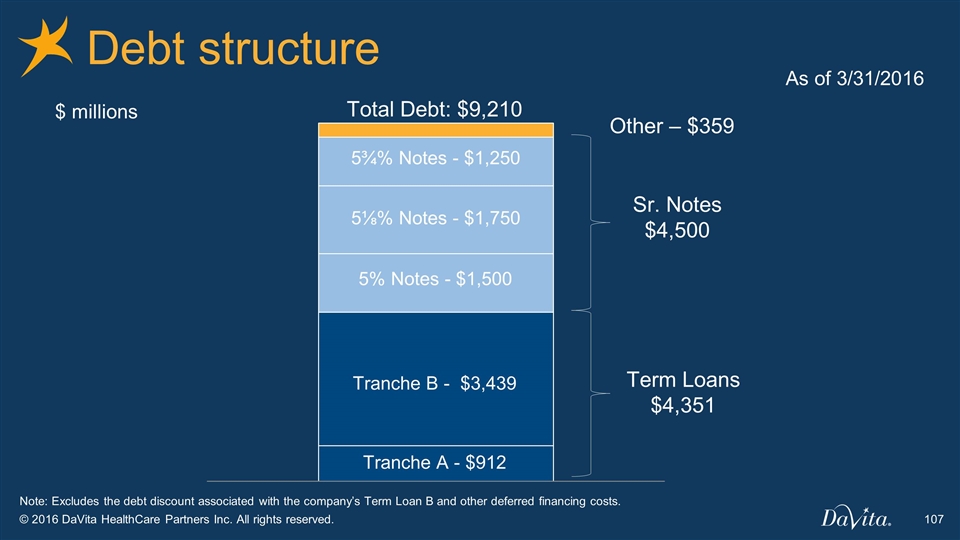
$ millions Total Debt: $9,210 Other – $359 5% Notes - $1,500 5¾% Notes - $1,250 Sr. Notes $4,500 Term Loans $4,351 Tranche A - $912 Tranche B - $3,439 5⅛% Notes - $1,750 Debt structure Note: Excludes the debt discount associated with the company’s Term Loan B and other deferred financing costs. As of 3/31/2016
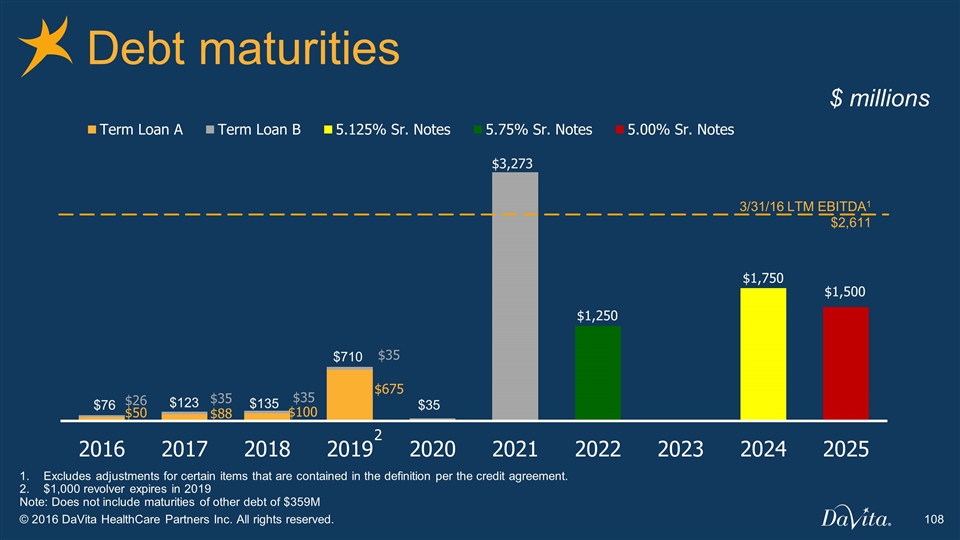
Debt maturities $ millions $710 $76 $123 $135 $35 Excludes adjustments for certain items that are contained in the definition per the credit agreement. $1,000 revolver expires in 2019 Note: Does not include maturities of other debt of $359M 3/31/16 LTM EBITDA1 $2,611
Capital Structure Capital Deployment Summary Enterprise Summary
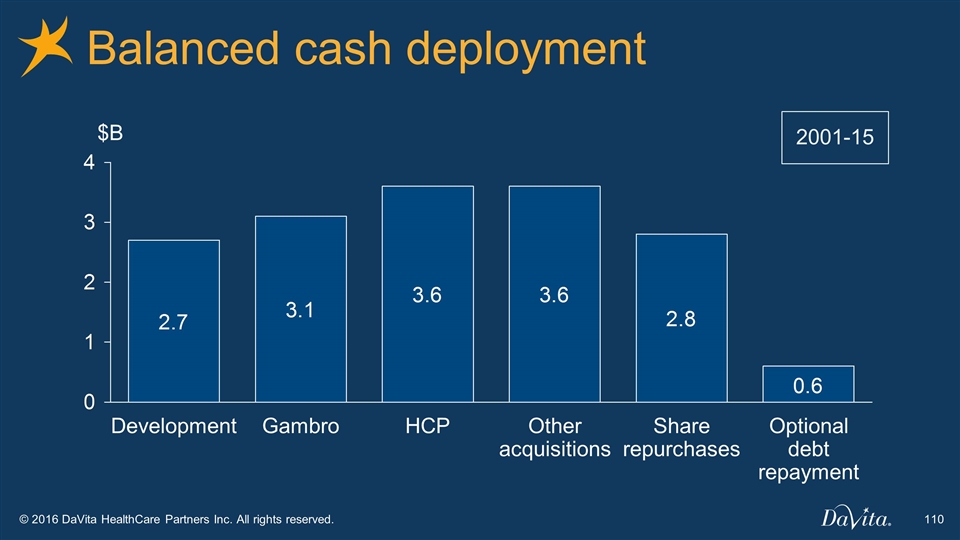
Balanced cash deployment $B Optional debt repayment Share repurchases Other acquisitions HCP Gambro Development 2001-15
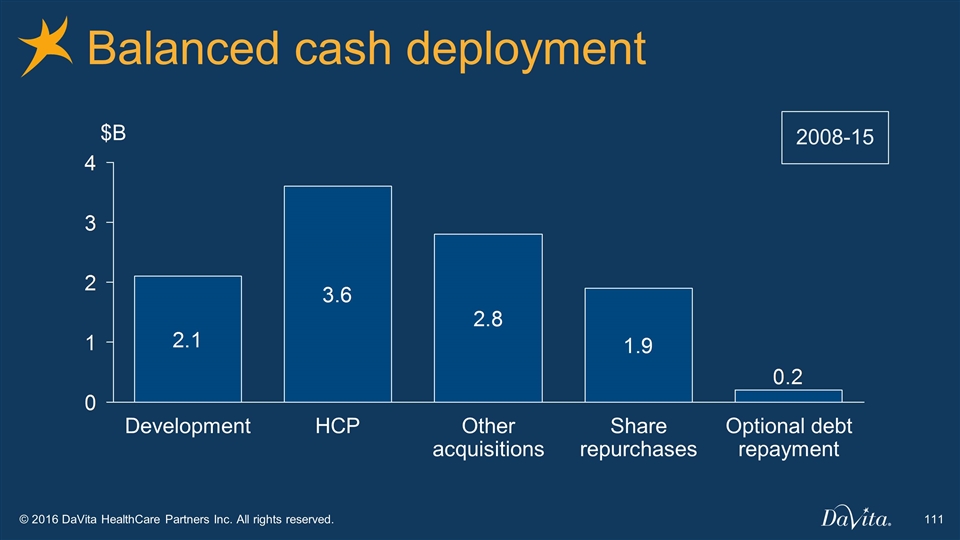
Balanced cash deployment Share repurchases Other acquisitions HCP Development Optional debt repayment $B 2008-15
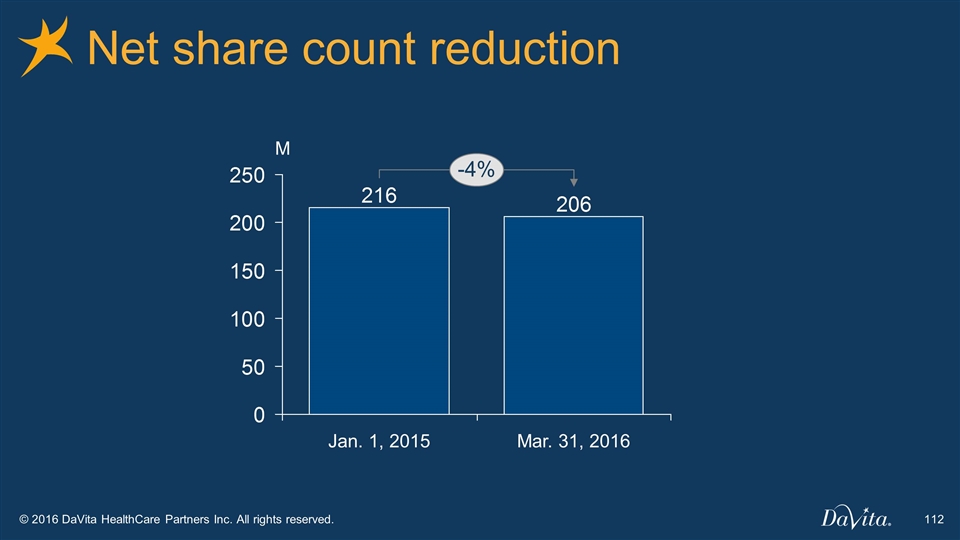
Net share count reduction M
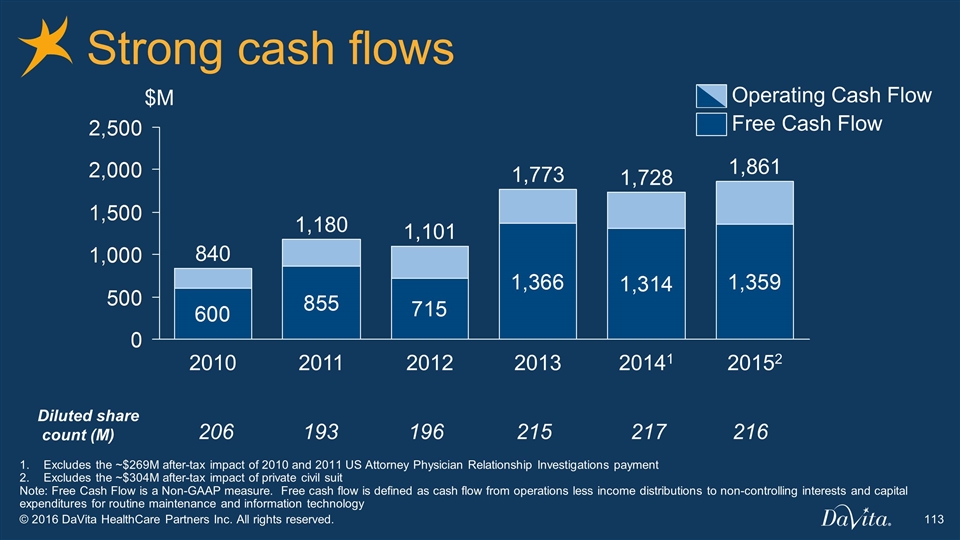
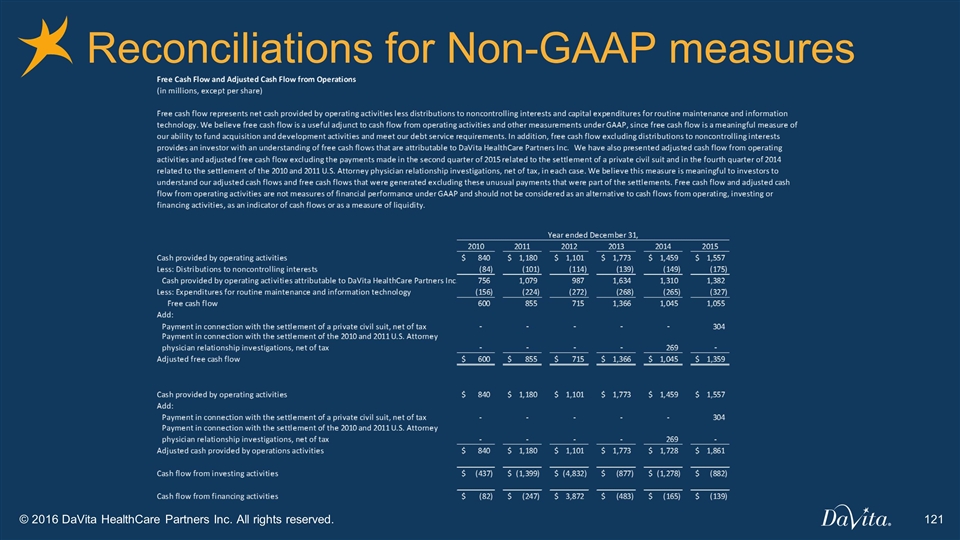
Strong cash flows Excludes the ~$269M after-tax impact of 2010 and 2011 US Attorney Physician Relationship Investigations payment Excludes the ~$304M after-tax impact of private civil suit Note: Free Cash Flow is a Non-GAAP measure. Free cash flow is defined as cash flow from operations less income distributions to non-controlling interests and capital expenditures for routine maintenance and information technology $M 2 1 Free Cash Flow Operating Cash Flow Diluted share count (M) 206 193 196 215 217 216
Capital Structure Capital Deployment Summary Enterprise Summary
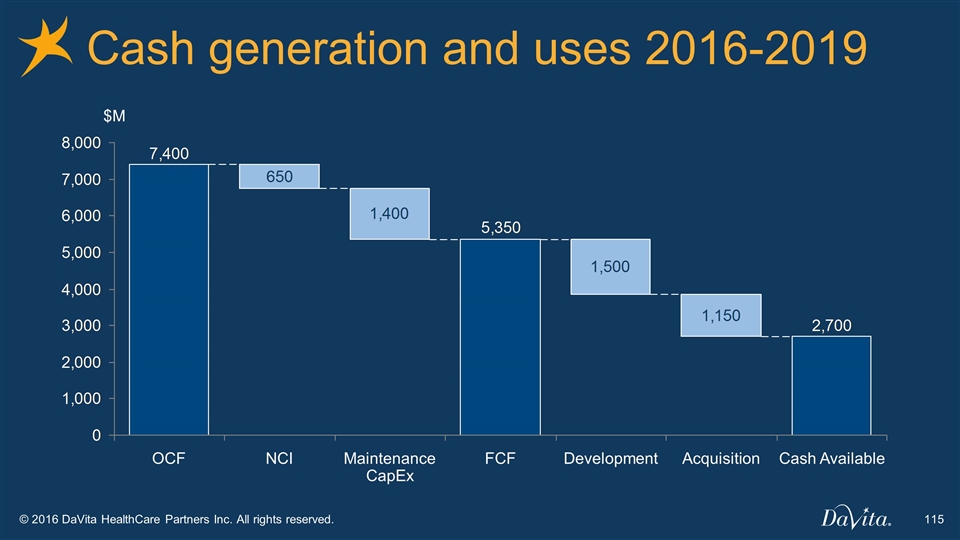
Cash generation and uses 2016-2019 Cash Available $M
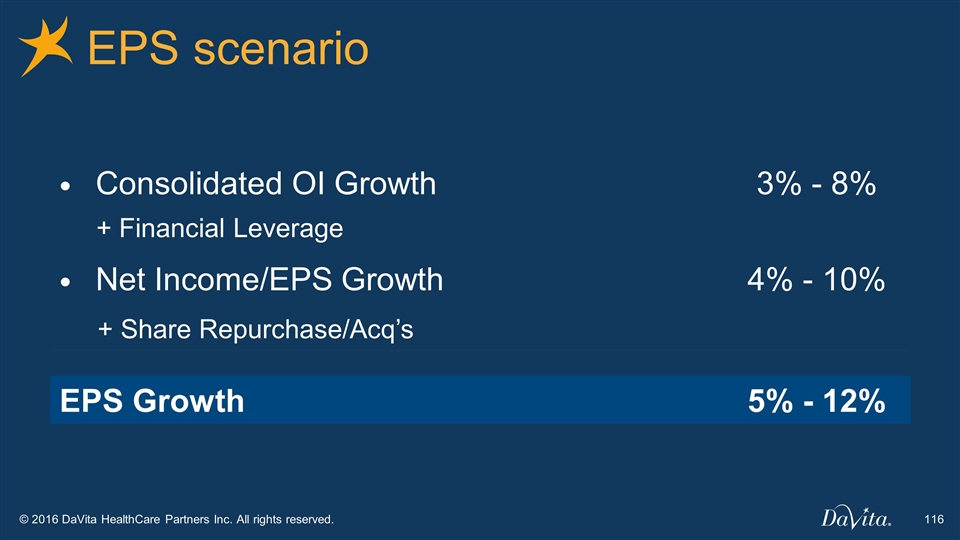
EPS scenario Consolidated OI Growth 3% - 8% + Financial Leverage Net Income/EPS Growth 4% - 10% + Share Repurchase/Acq’s EPS Growth 5% - 12%
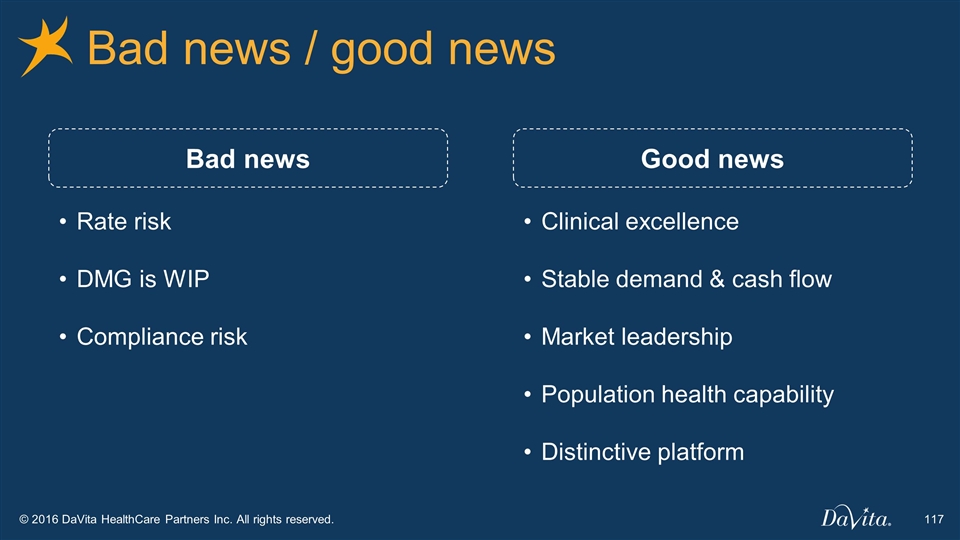
Bad news / good news Rate risk DMG is WIP Compliance risk Bad news Good news Clinical excellence Stable demand & cash flow Market leadership Population health capability Distinctive platform
Capital Markets Day May 18, 2016
Reconciliations for Non-GAAP measures
Reconciliations for Non-GAAP measures
Reconciliations for Non-GAAP measures
Reconciliations for Non-GAAP measures


