Exhibit 99.1

Link to searchable text of slide shown above
Link to searchable text of slide shown above
Link to searchable text of slide shown above
Link to searchable text of slide shown above
Link to searchable text of slide shown above
Link to searchable text of slide shown above
Link to searchable text of slide shown above
Link to searchable text of slide shown above
Link to searchable text of slide shown above
Link to searchable text of slide shown above
Link to searchable text of slide shown above
Link to searchable text of slide shown above
Link to searchable text of slide shown above
Link to searchable text of slide shown above
Link to searchable text of slide shown above
Link to searchable text of slide shown above
Link to searchable text of slide shown above
Link to searchable text of slide shown above
Link to searchable text of slide shown above
Link to searchable text of slide shown above
Link to searchable text of slide shown above
Link to searchable text of slide shown above
Link to searchable text of slide shown above
Link to searchable text of slide shown above
Link to searchable text of slide shown above
Link to searchable text of slide shown above

Link to searchable text of slide shown above
Searchable text section of graphics shown above
[LOGO]
Smart Space for Small BusinessSM
[LOGO]
Forward - Looking Statements
This presentation includes “forward looking statements” within the meaning of Section 21E of the Securities Exchange Act of 1934 and Section 27A of the Securities Act of 1933. Although the company believes that the expectations and assumptions reflected in the forward-looking statements are reasonable, these statements are not guarantees of future performance and involve certain risks, uncertainties and assumptions, which are difficult to predict and many of which are beyond the company’s control. Therefore, actual outcomes and results may differ materially from what is expressed, forecasted or implied in such forward-looking statements.
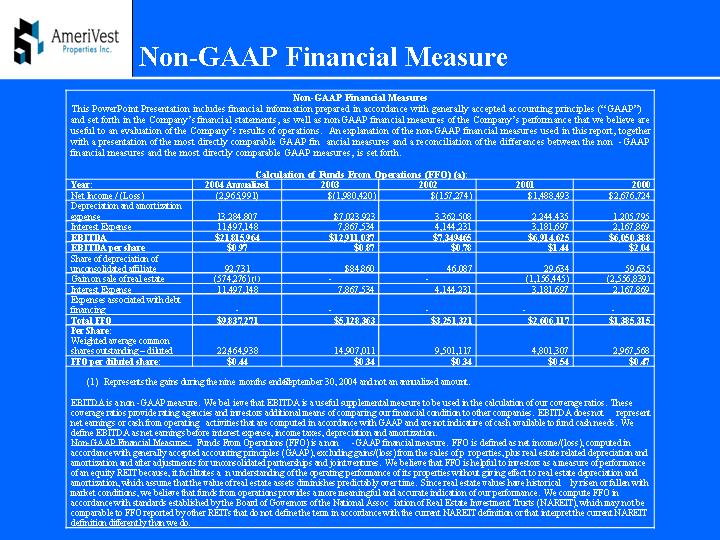
Non-GAAP Financial Measure
Non-GAAP Financial Measures
This PowerPoint Presentation includes financial information prepared in accordance with generally accepted accounting principles (“GAAP”) and set forth in the Company’s financial statements, as well as non-GAAP financial measures of the Company’s performance that we believe are useful to an evaluation of the Company’s results of operations. An explanation of the non-GAAP financial measures used in this report, together with a presentation of the most directly comparable GAAP financial measures and a reconciliation of the differences between the non-GAAP financial measures and the most directly comparable GAAP measures, is set forth.
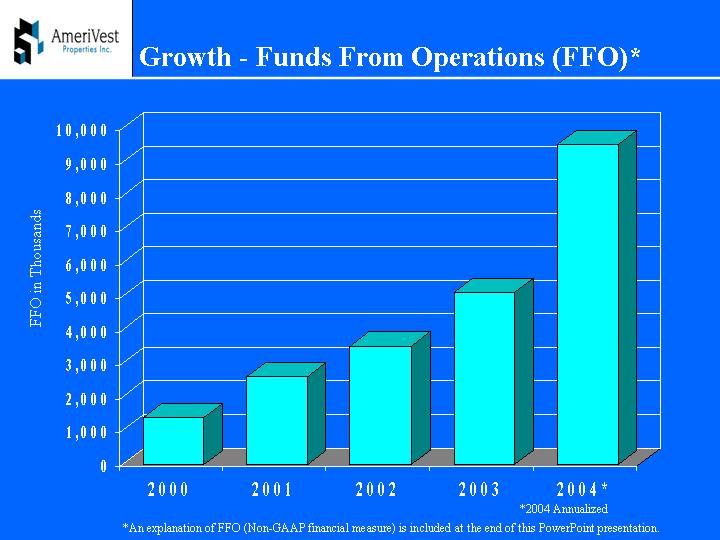
Calculation of Funds From Operations (FFO) (a):
Year: | | 2004 Annualized | | 2003 | | 2002 | | 2001 | | 2000 | |
Net Income / (Loss) | | (2,965,991 | ) | $ | (1,980,420 | ) | $ | (157,274 | ) | $ | 1,488,493 | | $ | 2,676,724 | |
Depreciation and amortization expense | | 13,284,807 | | $ | 7,023,923 | | 3,362,508 | | 2,244,435 | | 1,205,795 | |
Interest Expense | | 11,497,148 | | 7,867,534 | | 4,144,231 | | 3,181,697 | | 2,167,869 | |
EBITDA | | $ | 21,815,964 | | $ | 12,911,037 | | $ | 7,349465 | | $ | 6,914,625 | | $ | 6,050,388 | |
EBITDA per share | | $ | 0.97 | | $ | 0.87 | | $ | 0.78 | | $ | 1.44 | | $ | 2.04 | |
Share of depreciation of unconsolidated affiliate | | 92,731 | | $ | 84,860 | | 46,087 | | 29,634 | | 59,635 | |
Gain on sale of real estate | | (574,276 | (1) | — | | — | | (1,156,445 | ) | (2,556,839 | ) |
Interest Expense | | 11,497,148 | | 7,867,534 | | 4,144,231 | | 3,181,697 | | 2,167,869 | |
Expenses associated with debt financing | | — | | — | | — | | — | | — | |
Total FFO | | $ | 9,837,271 | | $ | 5,128,363 | | $ | 3,251,321 | | $ | 2,606,117 | | $ | 1,385,315 | |
Per Share: | | | | | | | | | | | |
Weighted average common shares outstanding – diluted | | 22,464,938 | | 14,907,011 | | 9,501,117 | | 4,801,307 | | 2,967,568 | |
FFO per diluted share: | | $ | 0.44 | | $ | 0.34 | | $ | 0.34 | | $ | 0.54 | | $ | 0.47 | |
(1) Represents the gains during the nine months ended September 30, 2004 and not an annualized amount.
EBITDA is a non-GAAP measure. We believe that EBITDA is a useful supplemental measure to be used in the calculation of our coverage ratios. These coverage ratios provide rating agencies and investors additional means of comparing our financial condition to other companies. EBITDA does not represent net earnings or cash from operating activities that are computed in accordance with GAAP and are not indicative of cash available to fund cash needs. We define EBITDA as net earnings before interest expense, income taxes, depreciation and amortization.
Non-GAAP Financial Measures: Funds From Operations (FFO) is a non-GAAP financial measure. FFO is defined as net income/(loss), computed in accordance with generally accepted accounting principles (GAAP), excluding gains/(loss) from the sales of properties, plus real estate related depreciation and amortization and after adjustments for unconsolidated partnerships and joint ventures. We believe that FFO is helpful to investors as a measure of performance of an equity REIT because, it facilitates an understanding of the operating performance of its properties without giving effect to real estate depreciation and amortization, which assume that the value of real estate assets diminishes predictably over time. Since real estate values have historically risen or fallen with market conditions, we believe that funds from operations provides a more meaningful and accurate indication of our performance. We compute FFO in accordance with standards established by the Board of Governors of the National Association of Real Estate Investment Trusts (NAREIT), which may not be comparable to FFO reported by other REITs that do not define the term in accordance with the current NAREIT definition or that interpret the current NAREIT definition differently than we do.
Investment Profile
• Growth Story – More than 50 % per year for 5 years
• Niche Strategy – pure play on small business growth
• Inherent Economic Advantages– higher occupancy, higher going-in cap rates, higher returns
• Recent Infrastructure Investments – corporate and regional teams in place with scalable systems
• Evolving Capital Structure – debt repositioning and availability; improved liquidity
• Inflection Point – positioned for growth, bottom line impact
Company Profile
• | Office REIT focused on small to medium-sized tenants; public since late 1996 |
| | |
• | AMEX Symbol: | AMV |
| | |
• | Recent share price: | $6.40 (11/26/04) |
| | |
• | Current Dividend: | $0.13 per quarter |
| | |
• | Dividend Yield: | 8.12 % |
| | |
• | Market Capitalization: | $153,313,708 |
| | |
• | Inside Ownership: | 10.0% |
| | |
• | Institutional Ownership: | Approx. 7.0% |
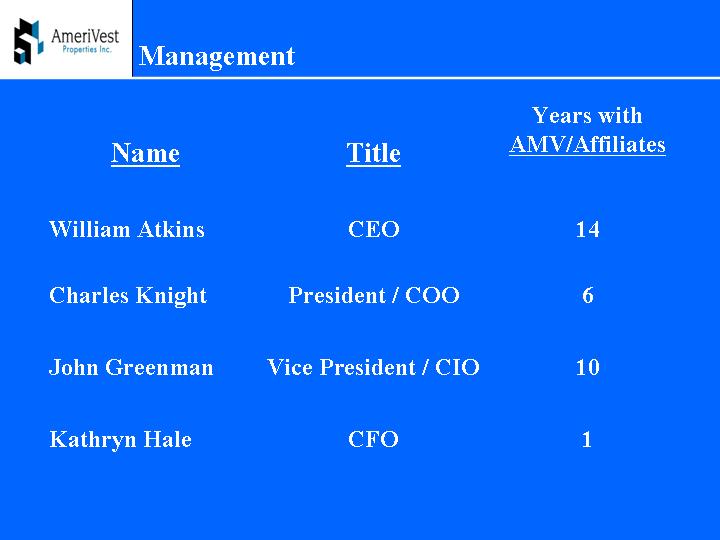
Management
Name | | Title | | Years with
AMV/Affiliates |
| | | | |
William Atkins | | CEO | | 14 |
Charles Knight | | President / COO | | 6 |
John Greenman | | Vice President / CIO | | 10 |
Kathryn Hale | | CFO | | 1 |
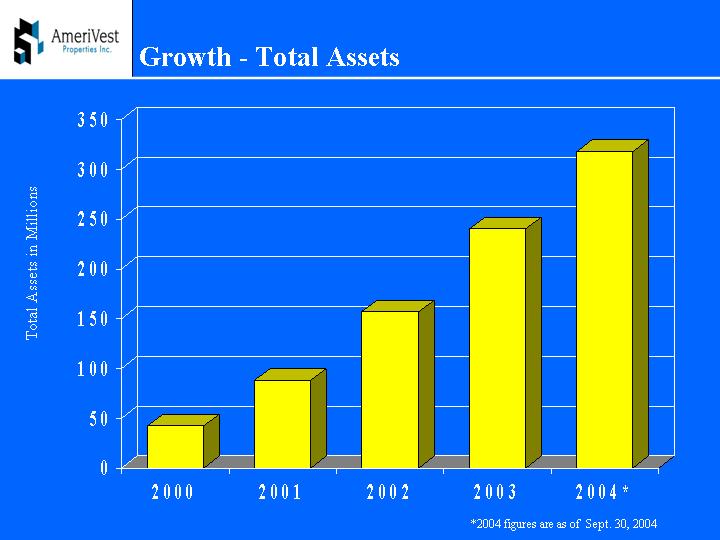
Growth - Total Assets
[CHART]
*2004 figures are as of Sept. 30, 2004
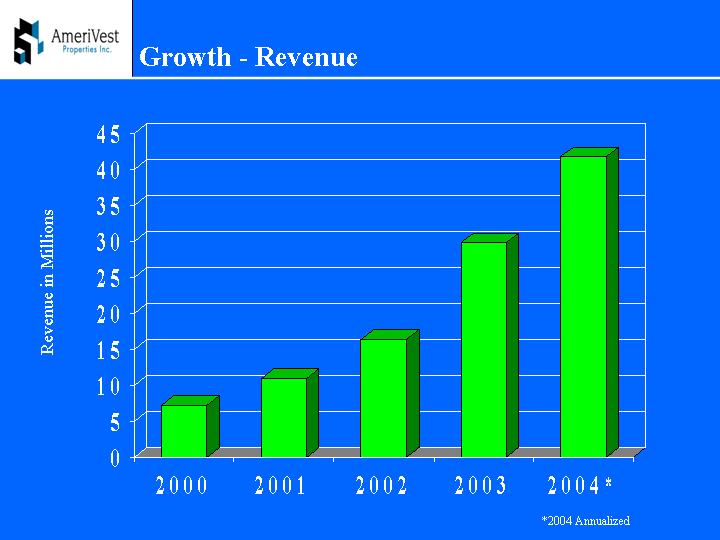
Growth - Revenue
[CHART]
*2004 Annualized
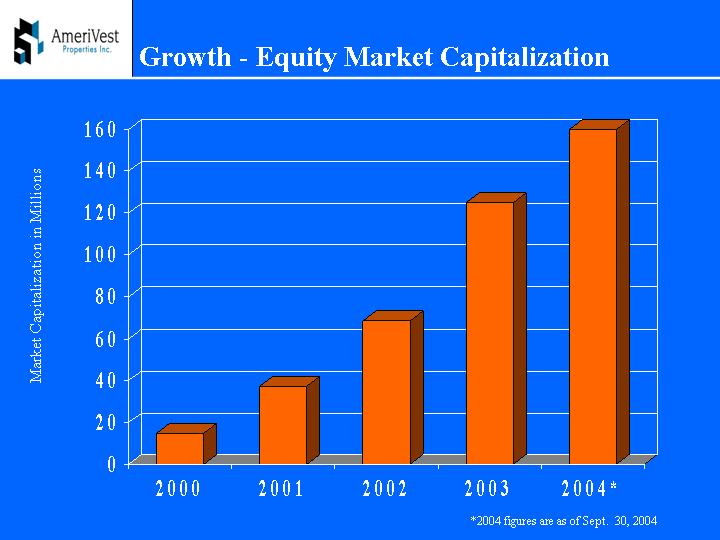
Growth - Equity Market Capitalization
[CHART]
*2004 figures are as of Sept. 30, 2004
Growth - Funds From Operations (FFO)*
[CHART]
*2004 Annualized
*An explanation of FFO (Non-GAAP financial measure) is included at the end of this PowerPoint presentation.
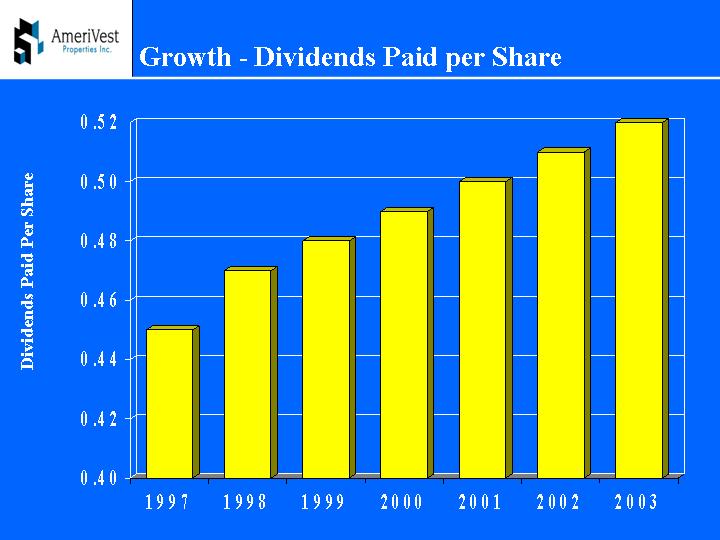
Growth - Dividends Paid per Share
[CHART]
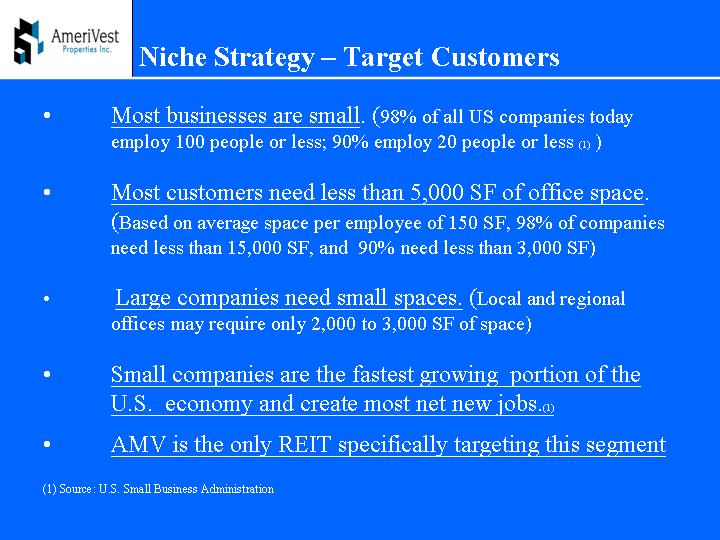
Niche Strategy – Target Customers
• Most businesses are small. (98% of all US companies today employ 100 people or less; 90% employ 20 people or less (1))
• Most customers need less than 5,000 SF of office space. (Based on average space per employee of 150 SF, 98% of companies need less than 15,000 SF, and 90% need less than 3,000 SF)
• Large companies need small spaces. (Local and regional offices may require only 2,000 to 3,000 SF of space)
• Small companies are the fastest growing portion of the U.S. economy and create most net new jobs.(1)
• AMV is the only REIT specifically targeting this segment
(1) Source: U.S. Small Business Administration
Niche Strategy – Underserved Market
• Perceived Credit Risk
• Diversified income stream
• Low concentration risk
• Perceived Management Intensity
• Systems approach to operations
• Regional management structure
Niche Strategy – Targeted Product
• 100,000 SF+ buildings with appropriate floor plates and bay depths
• Institutionally sized growth markets
• Large business amenities for smaller companies
• High quality design standards
• Customer service mentality
• Long-term ownership perspective
Economic Advantages
• Superior going-in cap rates
• Higher and more stable occupancies
• Long-term total return to shareholders
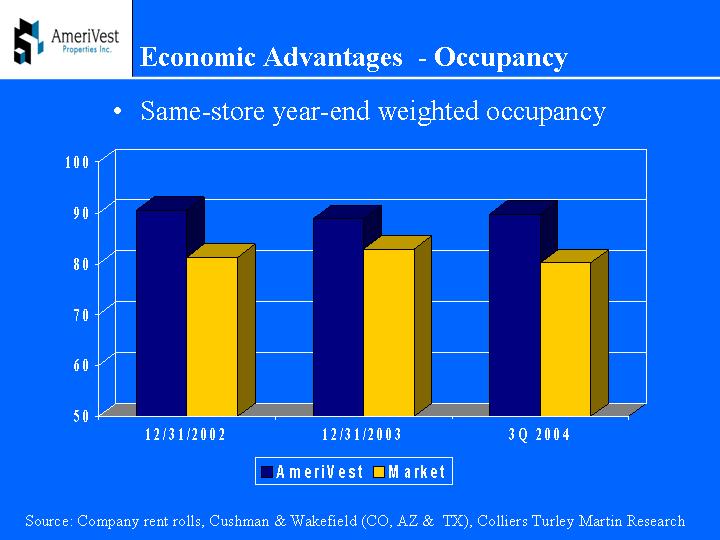
Economic Advantages - Occupancy
• Same-store year-end weighted occupancy
[CHART]
Source: Company rent rolls, Cushman & Wakefield (CO, AZ & TX), Colliers Turley Martin Research
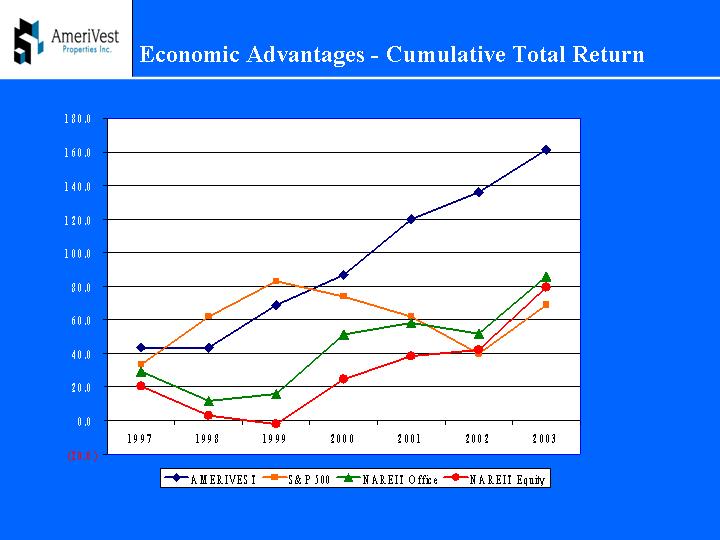
Economic Advantages - Cumulative Total Return
[CHART]
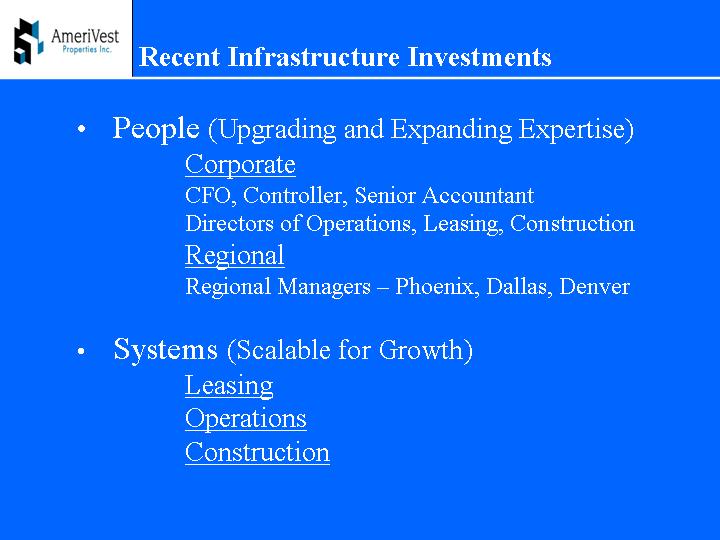
Recent Infrastructure Investments
• People (Upgrading and Expanding Expertise)
Corporate
CFO, Controller, Senior Accountant
Directors of Operations, Leasing, Construction
Regional
Regional Managers – Phoenix, Dallas, Denver
• Systems (Scalable for Growth)
Leasing
Operations
Construction
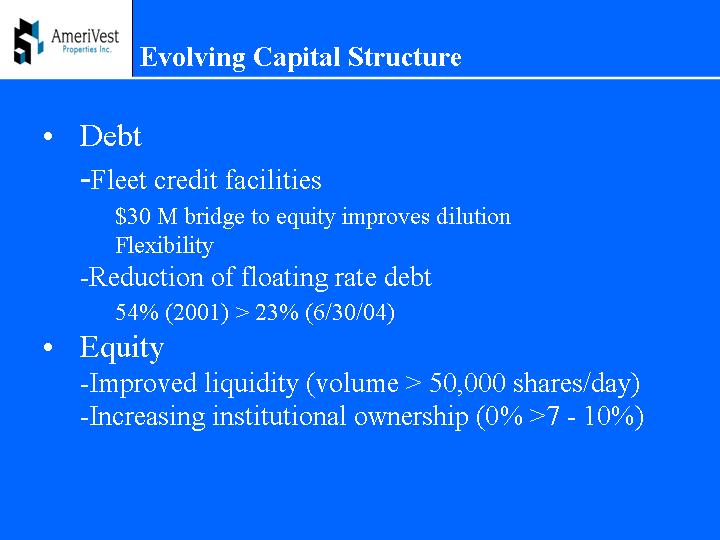
Evolving Capital Structure
• Debt
• Fleet credit facilities
$30 M bridge to equity improves dilution Flexibility
• Reduction of floating rate debt
54% (2001) > 23% (6/30/04)
• Equity
• Improved liquidity (volume > 50,000 shares/day)
• Increasing institutional ownership (0% >7 - - 10%)
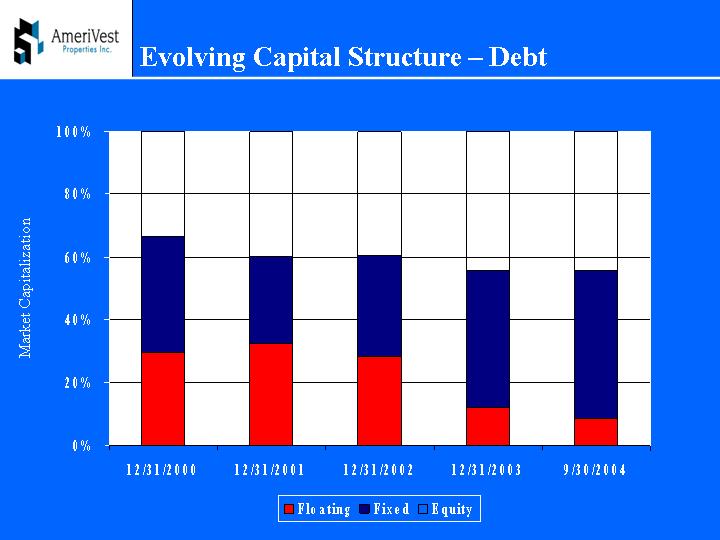
Evolving Capital Structure – Debt
[CHART]
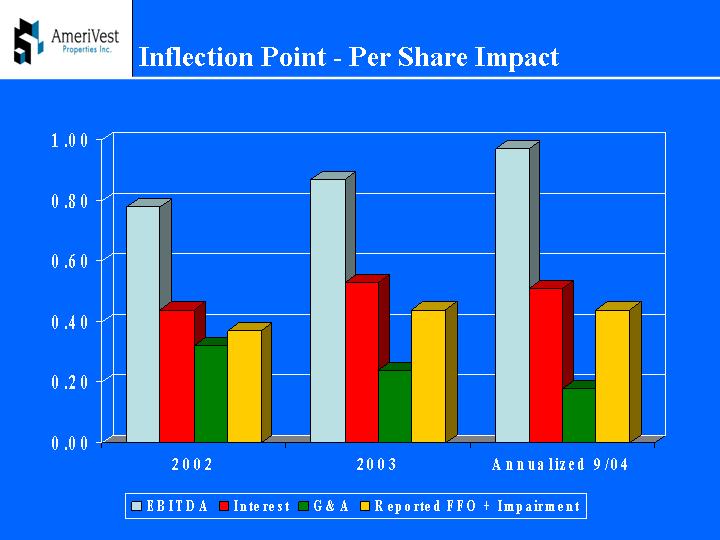
Inflection Point - Per Share Impact
[CHART]
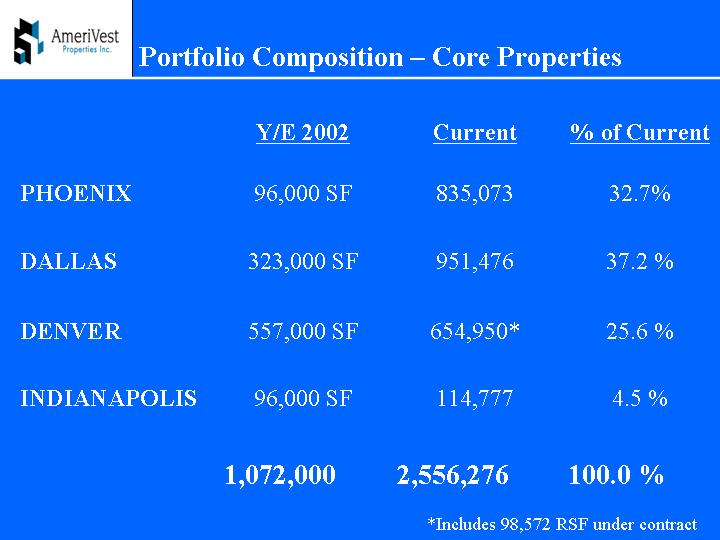
Portfolio Composition – Core Properties
| | Y/E 2002 | | Current | | % of Current | |
| | | | | | | |
PHOENIX | | 96,000 | SF | 835,073 | | 32.7 | % |
| | | | | | | |
DALLAS | | 323,000 | SF | 951,476 | | 37.2 | % |
| | | | | | | |
DENVER | | 557,000 | SF | 654,950 | * | 25.6 | % |
| | | | | | | |
INDIANAPOLIS | | 96,000 | SF | 114,777 | | 4.5 | % |
| | | | | | | |
| | 1,072,000 | | 2,556,276 | | 100.0 | % |
*Includes 98,572 RSF under contract
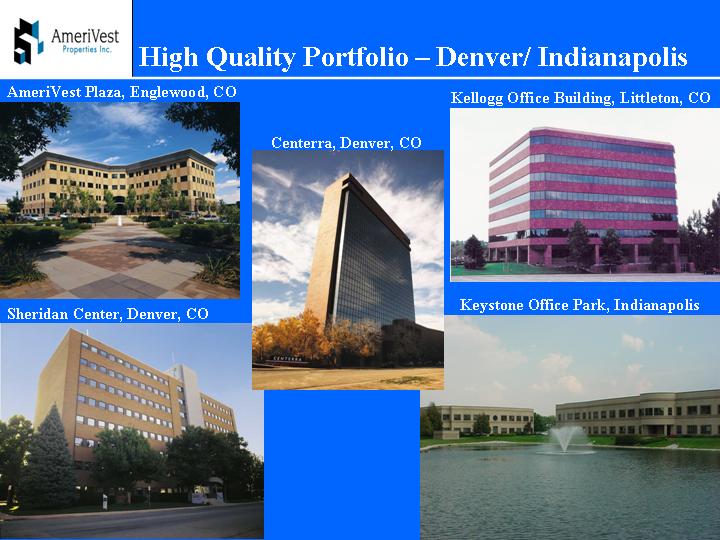
High Quality Portfolio – Denver/ Indianapolis
AmeriVest Plaza, Englewood, CO | | | | Kellogg Office Building, Littleton, CO |
[GRAPHIC] | | | | [GRAPHIC] |
| | Centerra, Denver, CO | | |
| | [GRAPHIC] | | |
Sheridan Center, Denver, CO | | | | Keystone Office Park, Indianapolis |
[GRAPHIC] | | | | [GRAPHIC] |
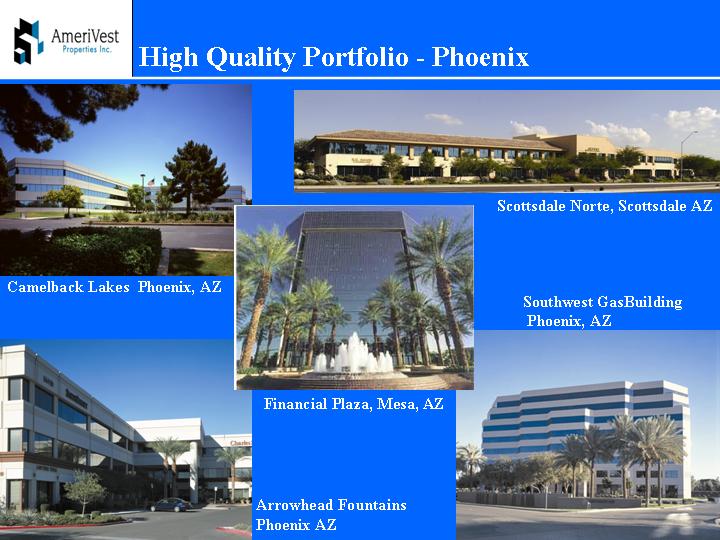
High Quality Portfolio - Phoenix
[GRAPHIC] | | | | [GRAPHIC] |
Camelback Lakes Phoenix, AZ | | | | Scottsdale Norte, Scottsdale AZ |
| | | | |
| | | | Southwest GasBuilding Phoenix, AZ |
| | [GRAPHIC] | | [GRAPHIC] |
| | Financial Plaza, Mesa, AZ | | |
| | | | |
[GRAPHIC] | | Arrowhead Fountains Phoenix AZ | | |
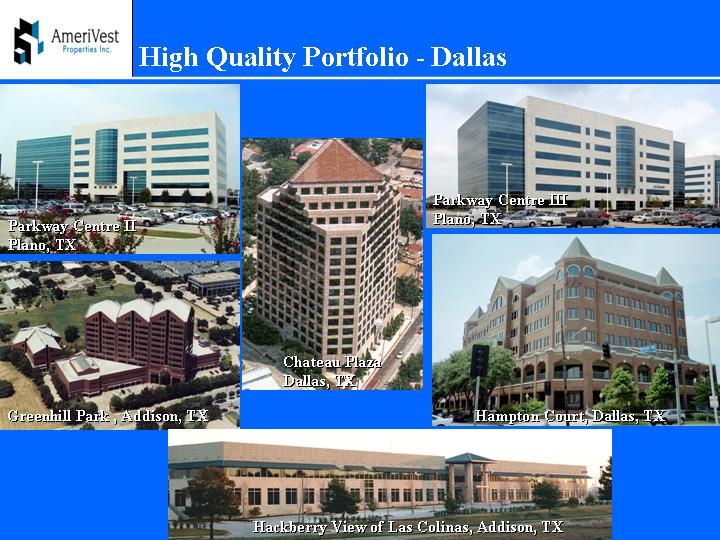
High Quality Portfolio - Dallas
[GRAPHIC] | | | | [GRAPHIC] |
Parkway Centre II Plano, TX | | | | Parkway Centre III Plano, TX |
| | | | |
| | [GRAPHIC] | | |
| | Chateau Plaza Dallas, TX | | |
| | | | |
[GRAPHIC] | | | | [GRAPHIC] |
Greenhill Park , Addison, TX | | | | Hampton Court, Dallas, TX |
| | | | |
| | [GRAPHIC] | | |
| | Hackberry View of Las Colinas, Addison, TX | | |
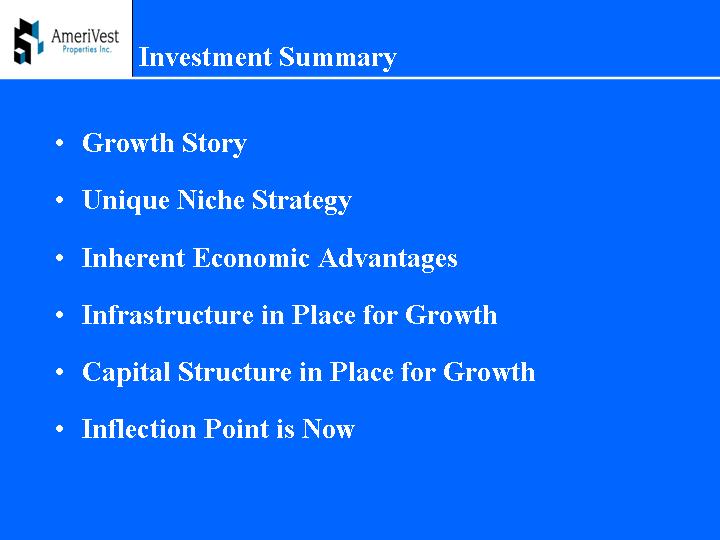
Investment Summary
• Growth Story
• Unique Niche Strategy
• Inherent Economic Advantages
• Infrastructure in Place for Growth
• Capital Structure in Place for Growth
• Inflection Point is Now
[LOGO]
Smart Space for Small BusinessSM