Exhibit 99.2

Supplemental Operating and Financial Information
Fourth Quarter 2005
Table of Contents
Corporate Information | 1 |
| | |
Financial Information | |
| Selected Financial Data | 3 |
| Consolidated Statements of Operations | 4 |
| Same Store Property Results and Analysis | 5 |
| Non-GAAP Financial Measures | 6 |
| Consolidated Balance Sheets | 7 |
| Debt Summary | 8 |
| | |
Portfolio Information | |
| Property Summary | 9 |
| Lease Expiration Information | 10-11 |
| Other Property Information | 12 |
| Strategic Assets Sales Information | 13 |
Selected Financial Data
Company Overview
AmeriVest Properties Inc. is a real estate investment trust (REIT) which owns and operates commercial office buildings in selected markets catering to small and medium size businesses. At December 31, 2005, AmeriVest owned 14 properties totaling approximately 2,160,000 square feet located in metropolitan Denver, Dallas, Phoenix and Indianapolis. The Company sold its Indianapolis property and a Phoenix property in January 2006, totalling 424,751 square feet. In February 2006, the Company's Board of Directors approved a plan of liquidation. The Plan is subject to approval by the Company’s stockholders holding a majority of the Company’s outstanding shares of common stock.
Strategy
We believe that office space for small to medium size businesses is a large and underserved market. According to data compiled by the Office of Advocacy of the U.S. Small Business Administration, 89% of all U.S. businesses employed fewer than 20 employees. As a result, we believe that many businesses have office space requirements of no more than 4,000 square feet.
Small to medium size businesses often have specific needs and limitations that are different from larger businesses. For example, small and medium size businesses generally cannot afford large corporate staffs to manage their office leasing requirements. These businesses have needs similar to larger firms, such as access to cutting edge technology, conference facilities, high quality telecommunications services and other amenities, but may not have a comparable budget. Our strategy is to focus on providing an office product targeted to this large market and its unmet needs in a cost effective manner. The key elements of our strategy include:
Provide a superior, consistent product - - We provide amenities for the small and medium size businesses in our office properties that usually only larger companies would be able to obtain, such as conference rooms with the latest telecommunication and presentation equipment, high levels of common area and tenant finish, including well-designed, pre-built move-in ready space, and depending on the location, various other technology and service amenities relative to the needs of our targeted small business tenant.
Streamline the leasing process - - Our leasing process is designed to meet the unique needs of a small to medium size tenant with limited real estate expertise, through our "no hassle" leasing philosophy which reduces the lease transaction time and cost for the tenant and us.
Provide a high level of service - - With our deliberate focus on small and medium size businesses, we have developed a positive, service-oriented approach specifically tailored for our customer base.
Target select cities - - We have historically targeted cities that have excellent small business growth demographics.
As a result of our focused strategy, we believe that our properties provide office space that is particularly attractive for small and medium size businesses. By executing on our strategy, we believe we have been able to maintain high occupancy rates while still maintaining strong rent per square foot trends in our core markets as compared to the general office market.
1
Directors and Executive Officers
Name | | Position | | Initial Date
as Director | |
Charles K. Knight | | Chief Executive Officer, President and Director | | 1999 | |
| | | | | |
Kathryn L. Hale | | Chief Financial Officer and Secretary | | — | |
| | | | | |
William T. Atkins | | Director and Chairman of the Board | | 1999 | |
| | | | | |
Patrice Derrington | | Outside Director | | 2003 | |
| | | | | |
Harry P. Gelles | | Outside Director | | 2000 | |
| | | | | |
Alexander S. Hewitt | | Director and Vice Chairman | | 2004 | |
| | | | | |
Robert W. Holman, Jr. | | Lead Outside Director | | 2001 | |
| | | | | |
John A. Labate | | Outside Director | | 1995 | |
| | | | | |
Jerry J. Tepper | | Outside Director | | 2000 | |
| | | | | |
Corporate Headquarters | | Investor Relations | | | |
| | | | | |
1780 South Bellaire Street | | Becky Nichols | | | |
Suite 100 | | (303) 297-1800 x 104 | | | |
Denver, Colorado 80222 | | beckyn@amvproperties.com | | | |
(303) 297-1800 | | | | | |
| | | | | |
Stock Exchange | | Ticker | | | |
| | | | | |
American Stock Exchange | | AMV | | | |
2
Financial Information
Selected Financial Data
| | As of and for the three months ended | |
| | 12/31/2005 | | 9/30/2005 | | 6/30/2005 | | 3/31/2005 | | 12/31/2004 | |
| | (amounts in thousands, except share, per share and property data) | |
| | | | | | | | | | | |
Operating Data | | | | | | | | | | | |
Real estate operating revenue (1) | | $ | 8,917 | | $ | 8,609 | | $ | 8,622 | | $ | 8,722 | | $ | 8,335 | |
General and administrative expenses | | $ | 986 | | $ | 1,082 | | $ | 1,483 | | $ | 1,316 | | $ | 1,671 | |
G&A as a percentage of revenue | | 11.1 | % | 12.6 | % | 17.2 | % | 15.1 | % | 20.0 | % |
| | | | | | | | | | | |
Real estate operating revenue (2) | | $ | 12,069 | | $ | 11,995 | | $ | 12,242 | | $ | 12,903 | | $ | 12,644 | |
G&A as a percentage of revenue (2) | | 8.2 | % | 9.0 | % | 12.1 | % | 10.2 | % | 13.2 | % |
| | | | | | | | | | | |
Property operating expenses (1) | | $ | 3,716 | | $ | 3,282 | | $ | 3,691 | | $ | 3,456 | | $ | 3,475 | |
Net operating income (1) (3) | | $ | 5,201 | | $ | 5,327 | | $ | 4,931 | | $ | 5,266 | | $ | 4,860 | |
| | | | | | | | | | | |
Gain/(Loss) Per Share | | | | | | | | | | | |
Net income/(loss) | | $ | 407 | | $ | (5,430 | ) | $ | (3,091 | ) | $ | (2,584 | ) | $ | (3,678 | ) |
Income/(loss) per share - basic | | 0.02 | | (0.23 | ) | (0.13 | ) | (0.11 | ) | (0.15 | ) |
Income/(loss) per share - diluted | | 0.02 | | (0.23 | ) | (0.13 | ) | (0.11 | ) | (0.15 | ) |
| | | | | | | | | | | |
| | | | | | | | | | | |
Funds from Operations (FFO) (4) | | | | | | | | | | | |
FFO | | $ | (5,121 | ) | $ | (849 | ) | $ | 1,371 | | $ | 2,398 | | $ | 654 | |
FFO per share - basic | | (0.21 | ) | (0.04 | ) | 0.06 | | 0.10 | | 0.03 | |
FFO per share - diluted | | (0.21 | ) | (0.04 | ) | 0.06 | | 0.10 | | 0.03 | |
| | | | | | | | | | | |
| | | | | | | | | | | |
Balance Sheet Data | | | | | | | | | | | |
Net investment in real estate | | $ | 269,603 | | $ | 312,792 | | $ | 322,884 | | $ | 322,606 | | $ | 330,814 | |
Total assets | | 283,910 | | 332,519 | | 338,743 | | 338,705 | | 347,954 | |
Total liabilities | | 200,493 | | 249,571 | | 249,193 | | 246,208 | | 252,904 | |
Minority interest | | — | | — | | 1,379 | | 1,492 | | 1,580 | |
Total shareholders’ equity | | 83,417 | | 82,948 | | 88,171 | | 91,005 | | 93,470 | |
| | | | | | | | | | | |
| | | | | | | | | | | |
Common Stock Data | | | | | | | | | | | |
Common shares outstanding | | 24,121,306 | | 24,105,464 | | 24,062,639 | | 24,022,597 | | 23,982,233 | |
Weighted average shares - basic | | 24,114,460 | | 24,074,937 | | 24,046,982 | | 24,011,672 | | 23,959,656 | |
Weighted average shares - diluted (FFO) | | 24,114,460 | | 24,074,937 | | 24,093,637 | | 24,098,003 | | 24,076,729 | |
Closing share price | | $ | 4.17 | | $ | 4.09 | | $ | 4.17 | | $ | 5.18 | | $ | 6.40 | |
Closing share price range for period (high - low) | | $4.29 - $3.35 | | $4.77 - $3.81 | | $5.45 - $3.95 | | $6.64 - $5.08 | | $7.30 -$6.26 | |
| | | | | | | | | | | |
| | | | | | | | | | | |
Dividends declared per share | | $ | — | | $ | — | | $ | — | | $ | — | | $ | 0.13 | |
Annualized dividend yield | | N/A | | N/A | | N/A | | N/A | | 8.1 | % |
Market value of common equity | | $ | 100,586 | | $ | 98,591 | | $ | 100,341 | | $ | 124,437 | | $ | 153,486 | |
Total liabilities | | 200,493 | | 249,571 | | 249,193 | | 246,208 | | 252,904 | |
Total market capitalization | | $ | 301,079 | | $ | 348,162 | | $ | 349,534 | | $ | 370,645 | | $ | 406,390 | |
| | | | | | | | | | | |
| | | | | | | | | | | |
Property Data | | | | | | | | | | | |
Properties owned | | 14 | | 16 | | 17 | | 17 | | 30 | |
Rentable square feet | | 2,159,679 | | 2,451,002 | | 2,508,066 | | 2,508,115 | | 2,732,957 | |
Occupancy (5) | | 90.5 | % | 89.6 | % | 89.4 | % | 89.0 | % | 88.3 | % |
(1) All periods exclude the results from discontinued operations.
(2) All periods include the results from discontinued operations.
(3) See page 6 for a definition of net operating income and a reconciliation of net operating income to net income/(loss).
(4) See page 6 for a reconciliation of FFO to net gain/(loss) and a comparison of FFO per share to net income/(loss) per share, the most directly comparable GAAP measures. FFO is not intended to be a measure of cash flow or liquidity.
(5) See page 9 for more information on the Company’s occupancy at December 31, 2005.
3
Consolidated Statement of Operations
| | Three months ended
December 31, | | Twelve months ended
December 31, | |
| | 2005 | | 2004 | | 2005 | | 2004 | |
| | | | | | | | | |
Real Estate Operating Revenue | | | | | | | | | |
Rental revenue | | $ | 8,916,751 | | $ | 8,334,751 | | $ | 34,869,604 | | $ | 28,052,920 | |
| | | | | | | | | |
Real Estate Operating Expenses | | | | | | | | | |
Property operating expenses - | | | | | | | | | |
Operating expenses | | 2,515,169 | | 2,259,050 | | 9,417,061 | | 8,276,494 | |
Real estate taxes | | 1,200,633 | | 1,216,355 | | 4,728,154 | | 3,528,564 | |
General and administrative expenses | | 985,552 | | 1,671,314 | | 4,720,958 | | 4,694,029 | |
Interest expense | | 3,135,298 | | 2,159,111 | | 11,996,147 | | 8,163,031 | |
Depreciation and amortization expense | | 3,072,562 | | 2,979,882 | | 12,763,733 | | 9,013,058 | |
Strategic alternatives expenses | | 563,219 | | — | | 708,491 | | — | |
Impairment of real estate | | 4,889,082 | | — | | 4,889,082 | | — | |
Total operating expenses | | 16,361,515 | | 10,285,712 | | 49,223,626 | | 33,675,176 | |
| | | | | | | | | |
Loss From Continuing Operations | | (7,444,764 | ) | (1,950,961 | ) | (14,354,022 | ) | (5,622,256 | ) |
| | | | | | | | | |
Other Income | | | | | | | | | |
Interest income | | 71,566 | | 31,621 | | 114,095 | | 87,016 | |
Total other income | | 71,566 | | 31,621 | | 114,095 | | 87,016 | |
| | | | | | | | | |
Loss Before Discontinued Operations | | (7,373,198 | ) | (1,919,340 | ) | (14,239,927 | ) | (5,535,240 | ) |
| | | | | | | | | |
Net Earnings/(Loss) from Discontinued Operations (1) | | 7,780,173 | | (1,759,119 | ) | 3,541,614 | | (367,712 | ) |
| | | | | | | | | |
Net Income/(Loss) | | $ | 406,975 | | $ | (3,678,459 | ) | $ | (10,698,313 | ) | $ | (5,902,952 | ) |
| | | | | | | | | |
Income/(Loss) Per Share | | | | | | | | | |
Basic | | $ | 0.02 | | $ | (0.15 | ) | $ | (0.44 | ) | $ | (0.26 | ) |
Diluted | | $ | 0.02 | | $ | (0.15 | ) | $ | (0.44 | ) | $ | (0.26 | ) |
| | | | | | | | | |
Weighted Average Common Shares Outstanding | | | | | | | | | |
Basic | | 24,114,460 | | 23,959,656 | | 24,062,330 | | 22,348,811 | |
Diluted | | 24,125,449 | | 23,959,656 | | 24,062,330 | | 22,348,811 | |
| | | | | | | | | |
| | | | | | | | | |
Reconciliation to Funds from Operations (FFO): (2) | | | | | | | | | |
Net income/(loss) | | $ | 406,975 | | $ | (3,678,459 | ) | $ | (10,698,313 | ) | $ | (5,902,952 | ) |
Depreciation and amortization expense on real estate investments | | 3,012,095 | | 4,332,521 | | 16,800,107 | | 14,157,113 | |
Gain on disposition of depreciated real estate | | (8,678,204 | ) | — | | (8,657,401 | ) | (574,276 | ) |
Loan costs associated with the disposition of real estate | | 137,982 | | — | | 353,975 | | — | |
FFO | | $ | (5,121,152 | ) | $ | 654,062 | | $ | (2,201,632 | ) | $ | 7,679,885 | |
| | | | | | | | | |
Funds from Operations per share - diluted | | $ | (0.21 | ) | $ | 0.03 | | $ | (0.09 | ) | $ | 0.34 | |
| | | | | | | | | |
Weighted Average Common Shares Outstanding - FFO Diluted | | 24,114,460 | | 24,076,729 | | 24,062,330 | | 22,464,707 | |
(1) The following amounts reflect net income/(loss) from real estate investments classified as discontinued operations, including net gains/(losses) on properties sold:
Rental revenue - properties sold | | $ | 1,185,238 | | $ | 2,261,690 | | $ | 6,589,508 | | $ | 9,311,324 | |
Property operating expenses - properties sold | | (539,691 | ) | (1,094,985 | ) | (3,035,976 | ) | (4,219,009 | ) |
Net operating income - properties sold | | 645,547 | | 1,166,705 | | 3,553,532 | | 5,092,315 | |
Rental revenue - properties held-for-sale | | 1,937,230 | | 2,047,112 | | 7,719,409 | | 7,982,984 | |
Property operating expenses - properties held-for-sale | | (863,974 | ) | (798,388 | ) | (3,422,900 | ) | (3,388,810 | ) |
Net operating income - properties held-for-sale | | 1,073,256 | | 1,248,724 | | 4,296,509 | | 4,594,174 | |
Interest expense | | (878,852 | ) | (1,661,638 | ) | (3,976,740 | ) | (4,304,704 | ) |
Deferred financing costs associated with the disposition of real estate | | (137,982 | ) | — | | (353,975 | ) | — | |
Depreciation and amortization expense | | — | | (1,443,944 | ) | (4,599,656 | ) | (5,401,943 | ) |
Minority interest | | — | | 91,034 | | 285,369 | | 256,246 | |
Equity in loss of affiliate | | — | | — | | — | | (18,076 | ) |
Impairment of real estate included in discontinued operations | | (1,600,000 | ) | (1,160,000 | ) | (4,320,826 | ) | (1,160,000 | ) |
Gain on sale | | 8,678,204 | | — | | 8,657,401 | | 574,276 | |
Net income/(loss) from discontinued operations | | $ | 7,780,173 | | $ | (1,759,119 | ) | $ | 3,541,614 | | $ | (367,712 | ) |
(2) See page 6 for a reconciliation of FFO to net income/(loss) and a comparison of FFO per share to net income/(loss) per share, the most directly comparable GAAP measures. FFO is not intended to be a measure of cash flow or liquidity.
4
Same Store Property Results and Analysis
| | Three months ended December 31, (1) | | Twelve months ended December 31, (2) | |
| | 2005 | | 2004 | | Change | | % Change | | 2005 | | 2004 | | Change | | % Change | |
| | | | | | | | | | | | | | | | | |
Real Estate Operating Revenue | | | | | | | | | | | | | | | | | |
Rental revenue (3) | | $ | 8,172,869 | | $ | 7,853,622 | | $ | 319,247 | | 4.1 | % | $ | 21,235,551 | | $ | 21,087,917 | | $ | 147,634 | | 0.7 | % |
| | | | | | | | | | | | | | | | | |
Real Estate Operating Expenses | | | | | | | | | | | | | | | | | |
Property operating expenses - | | | | | | | | | | | | | | | | | |
Operating expenses (3) (4) | | 2,328,230 | | 2,135,701 | | (192,529 | ) | -9.0 | % | 6,228,399 | | 6,732,225 | | 503,826 | | 7.5 | % |
Real estate taxes | | 1,149,562 | | 1,179,280 | | 29,718 | | 2.5 | % | 2,627,752 | | 2,615,067 | | (12,685 | ) | -0.5 | % |
Total property operating expenses | | 3,477,792 | | 3,314,981 | | (162,811 | ) | -4.9 | % | 8,856,151 | | 9,347,292 | | 491,141 | | 5.3 | % |
| | | | | | | | | | | | | | | | | |
Net Operating Income (5) | | $ | 4,695,077 | | $ | 4,538,641 | | $ | 156,436 | | 3.4 | % | $ | 12,379,400 | | $ | 11,740,625 | | $ | 638,775 | | 5.4 | % |
| | | | | | | | | | | | | | | | | |
Average rent per sq. foot at
December 31, (6) (7) | | $ | 20.18 | | $ | 20.08 | | $ | 0.10 | | 0.5 | % | $ | 19.32 | | $ | 19.33 | | $ | (0.01 | ) | -0.1 | % |
| | | | | | | | | | | | | | | | | |
Occupancy at December 31, (7) | | 90.7 | % | 87.2 | % | | | 3.5 | % | 88.6 | % | 87.2 | % | | | 1.4 | % |
(1) Includes the following properties, which were operational during the entire three months ended December 31, 2004 and 2005 (excludes properties classified as held-for-sale at December 31, 2005):
Property | | Sq Foot | |
Arrowhead Fountains | | 96,203 | |
Camelback Lakes | | 202,720 | |
Centerra | | 187,562 | |
Greenhill Park | | 247,269 | |
Hackberry View | | 114,598 | |
Kellogg Building | | 110,940 | |
Parkway Centre II | | 151,880 | |
Parkway Centre III | | 152,391 | |
Scottsdale Norte | | 78,800 | |
Sheridan Center | | 139,561 | |
Southwest Gas Building | | 144,821 | |
Total | | 1,626,745 | |
(2) Includes the following properties, which were operational during the entire twelve months ended December 31, 2004 and 2005 (excludes properties classified as held-for-sale at December 31, 2005):
Property | | Sq Foot | |
Arrowhead Fountains | | 96,203 | |
Centerra | | 187,562 | |
Greenhill Park | | 247,269 | |
Kellogg Building | | 110,940 | |
Parkway Centre II | | 151,880 | |
Scottsdale Norte | | 78,800 | |
Sheridan Center | | 139,561 | |
Southwest Gas Building | | 144,821 | |
Total | | 1,157,036 | |
(3) AmeriVest recorded a reclass between rental revenues and expenses related to certain utility reimbursements during the three months ended September 30, 2005. The effect of this adjustment on the three and twelve months ended December 31, 2004 would have been $80,000 and $82,500, respectively.
(4) The three and twelve months ended December 31, 2004 includes ground rent expense for Greenhill Park of approximately ($12,000) and $470,000, respectively.
(5) See page 6 for a reconciliation of Same Store Net Operating Income to Net Income/(Loss).
(6) The average rent per square foot is calculated using the base rate and does not include any adjustments for straight-line rent or expense recoveries.
(7) Reflects all signed leases, including leased but not yet occupied, at December 31, 2005 or 2004 for the respective same store populations. Signed leases do not impact revenues until the tenant has moved in and the lease has commenced, although the leased space is included in our occupancy rate.
5
Non-GAAP Financial Measures
Funds from Operations -
Funds from Operations (FFO) is a non-GAAP financial measure. We believe FFO, as defined by the Board of Governors of the National Association of Real Estate Investment Trusts (NAREIT) in the October 1999 White Paper (amended in April 2002), to be an appropriate measure of performance for an equity REIT, for reasons, and subject to the qualifications, specified in the paragraphs entitled "Non-GAAP Financial Measures" below. The following table reflects the reconciliation of FFO from net income/(loss) and a comparison of FFO per share to net income/(loss) per share, the most directly comparable GAAP measures:
| | Three months ended | |
| | 12/31/05 | | 9/30/05 | | 6/30/05 | | 3/31/05 | | 12/31/04 | |
| | (amounts in thousands, except share, per share and property data) | |
| | | | | | | | | | | |
Funds from Operations (FFO) - | | | | | | | | | | | |
Net income/(loss) | | $ | 407 | | $ | (5,430 | ) | $ | (3,091 | ) | $ | (2,584 | ) | $ | (3,678 | ) |
Depreciation and amortization expense | | 3,012 | | 4,582 | | 4,462 | | 4,774 | | 4,332 | |
Gain/loss on sale | | (8,678 | ) | (1 | ) | — | | 22 | | — | |
Loan costs associated with the disposition of real estate | | 138 | | — | | — | | 216 | | — | |
FFO | | $ | (5,121 | ) | $ | (849 | ) | $ | 1,371 | | $ | 2,428 | | $ | 654 | |
| | | | | | | | | | | |
Income/(loss) per share - diluted | | $ | 0.02 | | $ | (0.23 | ) | $ | (0.13 | ) | $ | (0.11 | ) | $ | (0.15 | ) |
| | | | | | | | | | | |
FFO per share - diluted | | $ | (0.21 | ) | $ | (0.04 | ) | $ | 0.06 | | $ | 0.10 | | $ | 0.03 | |
| | | | | | | | | | | |
Common Stock Data - | | | | | | | | | | | |
Weighted average shares - diluted | | 24,114,460 | | 24,074,937 | | 24,093,637 | | 24,098,003 | | 24,076,729 | |
Non-GAAP Financial Measures - Funds from Operations (FFO) is a non-GAAP financial measure. FFO is defined as net income or loss, computed in accordance with generally accepted accounting principles (GAAP), excluding gains or losses from sale of properties, plus real estate related depreciation and amortization and after adjustments for unconsolidated partnerships and joint ventures. We believe that FFO is helpful to investors as a measure of the performance of an equity REIT because it facilitates an understanding of the operations performance of its properties without giving effect to real estate depreciation and amortization, which assume that the value of real estate assets diminishes predictably over time. Since real estate values have historically risen or fallen with market conditions, we believe that FFO provides a more meaningful and accurate indication of our performance. We compute FFO in accordance with standards established by NAREIT, which may not be comparable to FFO reported by other REITs that do not define the term in accordance with the current NAREIT definition or that interpret the current NAREIT definition differently than we do. FFO does not represent cash generated from operating activities determined by GAAP and should not be considered as an alternative to net income or loss (determined in accordance with GAAP) as an indication of our financial performance or to cash flows from operating activities (determined in accordance with GAAP) as a measure of our liquidity, nor is it indicative of funds available to fund our cash needs, including our ability to make cash distributions. FFO may include funds that may not be available for our management's discretionary use due to requirements to conserve funds for capital expenditures, debt repayments, property acquisitions and other commitments and uncertainties.
Same Store Property Net Operating Income -
Net Operating Income (NOI) is a non-GAAP financial measure. NOI is defined as rental revenues less property operating expenses. Because historically, acquisitions from year to year have had a material impact on the Company's results of operations, we rely on Same Store NOI for assessing property performance. We also believe Same Store property NOI is a valuable means of comparing period-to-period property performance. The following is a reconciliation of Same Store Property NOI to Net Income/(Loss) (amounts in thousands):
| | Three months ended December 31, | | Twelve months ended December 31, | |
| | 2005 | | 2004 | | 2005 | | 2004 | |
| | | | | | | | | |
Same Store Property NOI | | $ | 4,695 | | $ | 4,539 | | $ | 12,379 | | $ | 11,741 | |
Non Same Store Property NOI | | 506 | | 320 | | 8,346 | | 4,507 | |
General and administrative expenses | | (986 | ) | (1,671 | ) | (4,721 | ) | (4,694 | ) |
Interest expense | | (3,135 | ) | (2,159 | ) | (11,996 | ) | (8,163 | ) |
Depreciation and amortization expense | | (3,073 | ) | (2,980 | ) | (12,764 | ) | (9,013 | ) |
Strategic alternative costs | | (563 | ) | — | | (708 | ) | — | |
Impairment of real estate | | (4,889 | ) | — | | (4,889 | ) | — | |
Interest income | | 72 | | 32 | | 114 | | 87 | |
Net earnings/(loss) from discontinued operations | | 7,780 | | 1,759 | | 3,542 | | (368 | ) |
Net income/(loss) | | $ | 407 | | $ | (3,678 | ) | $ | (10,698 | ) | $ | (5,903 | ) |
6
Consolidated Balance Sheets
| | December 31,
2005 | | December 31,
2004 | |
| | | | | |
Assets | | | | | |
Investment in real estate - | | | | | |
Land | | $ | 48,059,765 | | $ | 53,267,688 | |
Buildings and improvements | | 166,431,824 | | 217,453,719 | |
Furniture, fixtures and equipment | | 1,304,879 | | 1,277,308 | |
Tenant improvements | | 14,245,047 | | 12,622,620 | |
Tenant leasing commissions | | 3,479,965 | | 2,562,645 | |
Intangible assets | | 13,371,477 | | 16,801,808 | |
Real estate assets - held-for-sale, net | | 46,930,658 | | 47,971,383 | |
Less: accumulated depreciation and amortization | | (24,220,447 | ) | (21,143,422 | ) |
Net investment in real estate | | 269,603,168 | | 330,813,749 | |
| | | | | |
Cash and cash equivalents | | 988,420 | | 1,859,660 | |
Escrow deposits and restricted cash | | 4,920,968 | | 7,161,651 | |
Accounts receivable, net | | 1,310,627 | | 671,251 | |
Deferred rents receivable | | 4,511,512 | | 3,430,609 | |
Deferred financing costs, net | | 1,421,375 | | 2,927,696 | |
Prepaid expenses and other assets | | 923,928 | | 524,072 | |
Other assets - held-for-sale | | 229,792 | | 565,001 | |
Total assets | | $ | 283,909,790 | | $ | 347,953,689 | |
| | | | | |
Liabilities | | | | | |
Secured mortgage loans and notes payable | | $ | 127,673,784 | | $ | 182,845,387 | |
Unsecured line of credit | | 29,897,129 | | 24,857,063 | |
Secured mortgage loans - held-for-sale | | 28,232,661 | | 28,883,941 | |
Accounts payable and accrued expenses | | 6,917,218 | | 4,524,282 | |
Accrued real estate taxes | | 4,195,875 | | 4,486,712 | |
Prepaid rents, deferred revenue and security deposits | | 3,273,861 | | 3,930,017 | |
Dividends payable | | — | | 3,116,130 | |
Other liabilities - held-for-sale | | 302,208 | | 260,185 | |
Total liabilities | | 200,492,736 | | 252,903,717 | |
| | | | | |
Minority Interest | | — | | 1,580,057 | |
| | | | | |
Shareholders’ Equity | | | | | |
Preferred stock, $.001 par value | | | | | |
Authorized - 5,000,000 shares | | | | | |
Issued and outstanding - none | | — | | — | |
| | | | | |
Common stock, $.001 par value | | | | | |
Authorized - 75,000,000 shares | | | | | |
Issued and outstanding - 24,121,306 and 23,982,233 shares, respectively | | 24,121 | | 23,982 | |
Capital in excess of par value | | 133,231,147 | | 132,585,840 | |
Distributions in excess of accumulated earnings | | (49,838,214 | ) | (39,139,907 | ) |
Total shareholders’ equity | | 83,417,054 | | 93,469,915 | |
Total liabilities and shareholders’ equity | | $ | 283,909,790 | | $ | 347,953,689 | |
7
Debt Summary
| | | | December 31, 2005 | | December 31, 2004 | |
Lender | | Mortgaged Property | | Maturity Date | | Principal
Balance | | Interest
Rate (1) | | Principal
Balance | | Interest
Rate (1) | |
Fixed Rate - | | | | | | | | | | | | | |
Greenwich Capital Financial Products | | Parkway Centre II
Centerra | | 10/1/2008 | | $ | 37,306,859 | | 5.13 | % | $ | 38,115,018 | | 5.13 | % |
| | Southwest Gas Building | | | | | | | | | | | |
| | | | | | | | | | | | | |
Metropolitan Life Insurance Company | | Parkway Centre III | | 9/10/2009 | | 14,813,833 | | 4.47 | % | 15,154,645 | | 4.47 | % |
| | | | | | | | | | | | | |
Southern Farm Bureau Life Insurance Company | | Scottsdale Norte | | 4/1/2011 | | 6,507,070 | | 7.90 | % | 6,568,596 | | 7.90 | % |
| | | | | | | | | | | | | |
J. P. Morgan Chase | | Hackberry View - 1st | | 9/1/2012 | | 11,287,282 | | 6.57 | % | 11,424,345 | | 6.57 | % |
| | | | | | | | | | | | | |
J. P. Morgan Chase | | Hackberry View - 2nd (2) | | 9/1/2012 | | 937,796 | | 8.00 | % | 967,654 | | 8.00 | % |
| | | | | | | | | | | | | |
Teachers Insurance and Annuity Association of America | | Sheridan Center Arrowhead Fountains | | 1/1/2013 | | 28,360,682 | | 7.40 | % | 28,852,678 | | 7.40 | % |
| | Kellogg Building | | | | | | | | | | | |
| | | | | | | | | | | | | |
Allstate Life Insurance Company | | Camelback - 1st | | 9/5/2014 | | 15,631,631 | | 5.82 | % | 15,928,449 | | 5.82 | % |
| | | | | | | | | | | | | |
Allstate Life Insurance Company | | Camelback - 2nd | | 9/5/2014 | | 4,884,884 | | 5.82 | % | 4,977,640 | | 5.82 | % |
| | | | | | | | | | | | | |
GEMSA | | Hampton Court | | 11/1/2007 | | 7,900,000 | | 5.48 | % | 7,900,000 | | 5.48 | % |
| | | | | | | | | | | | | |
| | | | Subtotal | | 127,630,037 | | 5.98 | % | 129,889,025 | | 5.98 | % |
| | | | | | | | | | | | | |
Variable Rate - | | | | | | | | | | | | | |
KeyBank National Association - | | | | | | | | | | | | | |
Senior Secured Line of Credit | | Greenhill Park | | n/a | | — | | — | | 17,500,000 | | 4.96 | % |
| | | | | | | | | | | | | |
KeyBank National Association - | | | | | | | | | | | | | |
Unsecured Line of Credit | | Unsecured | | 4/1/2006 | (3) | 29,897,129 | | 6.91 | % | 24,857,063 | | 5.63 | % |
| | | | Subtotal | | 29,897,129 | | 6.91 | % | 42,357,063 | | 5.35 | % |
| | | | | | | | | | | | | |
Sold Properties - | | | | | | | | | | | | | |
Teachers Insurance and Annuity Association of America | | AmeriVest Plaza at Inverness | | | (4) | — | | — | | 14,412,347 | | 7.90 | % |
| | | | | | | | | | | | | |
KeyBank National Association - | | | | | | | | | | | | | |
Senior Secured Line of Credit | | Chateau Plaza | | | (4) | — | | — | | 15,400,000 | | 4.96 | % |
| | | | | | | | | | | | | |
Transatlantic Capital Company, LLC (5) | | Texas State Buildings | | n/a | | — | | — | | 5,579,891 | | 7.66 | % |
| | Subtotal - sold properties | | — | | — | | 35,392,238 | | 6.58 | % |
| | | | | | | | | | | | | |
Other notes payable - | | | | | | | | | | | | | |
Lease Capital Corporation | | Phone system | | 10/31/2007 | | 43,747 | | 11.11 | % | 64,124 | | 11.11 | % |
| | | | | | | | | | | | | |
| | Subtotal, excluding held-for-sale properties | | 157,570,913 | | 6.16 | % | 207,702,450 | | 5.96 | % |
| | | | | | | | | | | | | |
Held-for-Sale Portfolio: | | | | | | | | | | | | | |
Security Life of Denver Insurance Company | | Keystone Office Park - 1st | | 5/1/2022 | | 4,119,506 | | 8.00 | % | 4,236,333 | | 8.00 | % |
| | | | | | | | | | | | | |
Security Life of Denver Insurance Company | | Keystone Office Park - 2nd | | 5/1/2022 | | 462,967 | | 8.63 | % | 474,284 | | 8.63 | % |
| | | | | | | | | | | | | |
Allstate Life Insurance Company | | Financial Plaza | | 10/5/2010 | | 23,650,188 | | 5.25 | % | 24,173,324 | | 5.25 | % |
| | | | | | | | | | | | | |
| | Subtotal, held-for-sale properties | | 28,232,661 | | 5.71 | % | 28,883,941 | | 5.71 | % |
| | | | Total debt | | $ | 185,803,574 | | 6.09 | % | $ | 236,586,391 | | 5.92 | % |
| | | | | | | | | | | | | | | | | |
Scheduled maturities including scheduled principal payments (for the years ended December 31,) -
| | Including Held
for Sale | | Excluding Held
for Sale | |
2006 | | 32,980,663 | | 32,288,530 | |
2007 | | 11,167,322 | | 10,433,756 | |
2008 | | 38,057,507 | | 37,279,931 | |
2009 | | 15,982,950 | | 15,158,612 | |
2010 | | 22,992,739 | | 1,537,734 | |
Thereafter | | 64,622,393 | | 60,872,350 | |
Total | | $ | 185,803,574 | | $ | 157,570,913 | |
| | | | | | | |
Debt information, including held-for-sale properties (for the year ended December 31, 2005) -
Additions | | $ | 9,203,232 | |
Repayments | | (56,867,678 | ) |
Scheduled principal payments | | (3,118,371 | ) |
Net change in mortgage payable | | $ | (50,782,817 | ) |
(1) Interest only, does not include amortization of deferred financing costs or unused facility fees.
(2) The amount recorded reflects a net present value calculation based on a fair market value rate of 8%. The actual loan balance assumed was $697,847 at an interest rate of 15%.
(3) The unsecured line of credit was paid off in January 2006.
(4) The property was sold in December 2005.
(5) In March 2005, the Company completed a Deed-in-Lieu Agreement to return these properties to the lender to satisfy the outstanding balance of the mortgage payable.
8
Property Summary
| | | | | | December 31, 2005 | | December 31, 2004 | |
Building / Location | | Year
Acquired | | Rentable
Area (1) | | Occupancy
Rate (2) | | Average Rent
Per SF (3) | | Occupancy
Rate (4) | | Average Rent
Per SF (3) | |
Same Store | | | | | | | | | | | | | |
Sheridan Center | | | | | | | | | | | | | |
Denver, CO | | 2000 | | 139,561 | | 79.7 | % | $ | 15.95 | | 82.0 | % | $ | 15.94 | |
| | | | | | | | | | | | | |
Arrowhead Fountains | | | | | | | | | | | | | |
Peoria, AZ | | 2001 | | 96,203 | | 100.0 | % | 22.08 | | 100.0 | % | 21.85 | |
| | | | | | | | | | | | | |
Kellogg Building | | | | | | | | | | | | | |
Littleton, CO | | 2001 | | 110,940 | | 95.1 | % | 19.56 | | 93.0 | % | 19.56 | |
| | | | | | | | | | | | | |
Parkway Centre II | | | | | | | | | | | | | |
Plano, TX | | 2002 | | 151,880 | | 85.5 | % | 19.61 | | 94.8 | % | 19.01 | |
| | | | | | | | | | | | | |
Centerra | | | | | | | | | | | | | |
Denver, CO | | 2002 | | 187,562 | | 84.2 | % | 17.36 | | 85.2 | % | 18.09 | |
| | | | | | | | | | | | | |
Southwest Gas Building | | | | | | | | | | | | | |
Phoenix, AZ | | 2003 | | 144,821 | | 90.3 | % | 23.08 | | 87.1 | % | 22.64 | |
| | | | | | | | | | | | | |
Scottsdale Norte | | | | | | | | | | | | | |
Scottsdale, AZ | | 2003 | | 78,800 | | 100.0 | % | 22.76 | | 94.4 | % | 22.74 | |
| | | | | | | | | | | | | |
Greenhill Park | | | | | | | | | | | | | |
Addison, TX | | 2003 | | 247,269 | | 86.5 | % | 17.41 | | 77.0 | % | 17.71 | |
| | | | | | | | | | | | | |
Camelback Lakes | | | | | | | | | | | | | |
Phoenix, AZ | | 2004 | | 202,720 | | 100.0 | % | 23.78 | | 98.9 | % | 21.97 | |
| | | | | | | | | | | | | |
Hackberry View | | | | | | | | | | | | | |
Irving, TX | | 2004 | | 114,598 | | 95.7 | % | 21.01 | | 100.0 | % | 19.78 | |
| | | | | | | | | | | | | |
Parkway Centre III | | | | | | | | | | | | | |
Plano, TX | | 2004 | | 152,391 | | 91.2 | % | 20.61 | | 93.8 | % | 20.94 | |
| | | | | | | | | | | | | |
Hampton Court | | | | | | | | | | | | | |
Dallas, TX | | 2004 | | 108,183 | | 98.0 | % | 21.46 | | 100.0 | % | 21.13 | |
| | Subtotal | | 1,734,928 | | 91.2 | % | 20.26 | | 90.8 | % | 19.97 | |
Held-for-Sale | | | | | | | | | | | | | |
Keystone Office Park (5) | | | | | | | | | | | | | |
Indianapolis, IN | | 1999/2003 | | 114,980 | | 79.1 | % | 17.35 | | 76.8 | % | 17.69 | |
| | | | | | | | | | | | | |
Financial Plaza (5) | | | | | | | | | | | | | |
Mesa, AZ | | 2003 | | 309,771 | | 90.8 | % | 23.59 | | 83.0 | % | 23.51 | |
| | Subtotal | | 424,751 | | 76.8 | % | 21.82 | | 81.3 | % | 22.03 | |
| | | | | | | | | | | | | |
Sold Properties | | | | | | | | | | | | | |
AmeriVest Plaza at Inverness (6) | | | | | | | | | | | | | |
Englewood, CO | | 2001 | | n/a | | n/a | | n/a | | 93.9 | % | 21.03 | |
| | | | | | | | | | | | | |
Chateau Plaza (6) | | | | | | | | | | | | | |
Dallas, TX | | 2002 | | n/a | | n/a | | n/a | | 99.5 | % | 23.42 | |
| | | | | | | | | | | | | |
Panorama Falls - Joint Venture (7) | | | | | | | | | | | | | |
Englewood, CO | | 2000 | | n/a | | n/a | | n/a | | 64.8 | % | 19.84 | |
| | | | | | | | | | | | | |
Texas State Buildings | | | | | | | | | | | | | |
Texas | | 1997/1998 | | n/a | | n/a | | n/a | | 77.1 | % | 9.06 | |
| | Subtotal | | n/a | | n/a | | n/a | | 86.0 | % | 17.59 | |
| | Total | | 2,159,679 | | 90.5 | % | $ | 20.61 | | 88.3 | % | $ | 19.78 | |
(1) Includes office space but excludes storage, telecommunications and garage space.
(2) Includes approximately 37,000 square feet (1.7% of total rentable area) that has been leased but is not yet occupied and approximately 20,000 square feet (0.9% of total rentable area) that is leased but has been vacated.
(3) Annualized cash basis revenue divided by leased area.
(4) Includes approximately 73,000 square feet (2.7% of total rentable area) that has been leased but is not yet occupied and approximately 28,000 square feet (1.0% of total rentable area) that is leased but has been vacated. Excludes approximately 9,000 square feet (0.3% of total rentable area) that expired on or about December 31, 2004.
(5) These buildings were sold in January 2006.
(6) These buildings were sold in December 2005.
(7) AmeriVest sold its 20% interest in this joint venture property on September 30, 2005.
9
Lease Expiration Information
The following schedules detail the tenant lease expirations at December 31, 2005 in total and by geographic region, or
classification: (1)
Consolidated (excludes held-for-sale properties)
Year | | Number of
Leases | | Square
Footage | | Annual
Revenue (2) | | Percentage of Total
Annual Revenue | |
2006 | | 91 | | 238,975 | | 4,891,155 | | 15.6 | % |
2007 | | 71 | | 262,165 | | 5,325,820 | | 17.0 | % |
2008 | | 84 | | 262,931 | | 5,086,843 | | 16.2 | % |
2009 | | 47 | | 278,793 | | 6,242,796 | | 20.0 | % |
2010 | | 41 | | 322,942 | | 6,564,416 | | 20.9 | % |
2011 | | 21 | | 111,440 | | 2,205,774 | | 7.0 | % |
2012 | | 4 | | 18,988 | | 377,892 | | 1.2 | % |
2013 | | — | | — | | — | | — | |
2014 | | 3 | | 34,201 | | 487,774 | | 1.6 | % |
2015 | | 4 | | 10,073 | | 170,592 | | 0.5 | % |
2016 | | — | | — | | — | | — | |
Total | | 366 | | 1,540,508 | | $ | 31,353,062 | | 100.0 | % |
| | | | | | | | | | |
Denver (excludes held-for-sale properties)
Year | | Number of
Leases | | Square
Footage | | Annual
Revenue (2) | | Percentage of Total
Annual Revenue | |
2006 | | 54 | | 64,553 | | 1,148,911 | | 18.3 | % |
2007 | | 40 | | 70,608 | | 1,299,221 | | 20.7 | % |
2008 | | 42 | | 90,963 | | 1,681,836 | | 26.9 | % |
2009 | | 17 | | 29,632 | | 545,090 | | 8.7 | % |
2010 | | 6 | | 22,001 | | 340,073 | | 5.4 | % |
2011 | | 7 | | 34,279 | | 612,522 | | 9.8 | % |
2012 | | 2 | | 3,713 | | 71,101 | | 1.1 | % |
2013 | | — | | — | | — | | — | |
2014 | | 2 | | 29,937 | | 402,494 | | 6.4 | % |
2015 | | 4 | | 10,073 | | 170,592 | | 2.7 | % |
2016 | | — | | — | | — | | — | |
Total | | 174 | | 355,759 | | $ | 6,271,840 | | 100.0 | % |
| | | | | | | | | | |
Phoenix (excludes held-for-sale properties)
Year | | Number of
Leases | | Square
Footage | | Annual
Revenue (2) | | Percentage of Total
Annual Revenue | |
2006 | | 18 | | 95,801 | | 2,110,302 | | 17.9 | % |
2007 | | 13 | | 48,097 | | 1,125,530 | | 9.5 | % |
2008 | | 20 | | 60,343 | | 1,312,395 | | 11.1 | % |
2009 | | 17 | | 136,202 | | 3,389,295 | | 28.8 | % |
2010 | | 14 | | 138,461 | | 3,239,277 | | 27.5 | % |
2011 | | 5 | | 24,150 | | 613,134 | | 5.2 | % |
2012 | | — | | — | | — | | — | |
2013 | | — | | — | | — | | — | |
2014 | | — | | — | | — | | — | |
2015 | | — | | — | | — | | — | |
2016 | | — | | — | | — | | — | |
Total | | 87 | | 503,054 | | $ | 11,789,933 | | 100.0 | % |
| | | | | | | | | | |
10
Lease Expiration Information - continued
Dallas (excludes held-for-sale properties)
Year | | Number of
Leases | | Square
Footage | | Annual
Revenue (2) | | Percentage of Total
Annual Revenue | |
2006 | | 19 | | 78,621 | | 1,631,942 | | 12.3 | % |
2007 | | 18 | | 143,460 | | 2,901,069 | | 21.8 | % |
2008 | | 22 | | 111,625 | | 2,092,612 | | 15.7 | % |
2009 | | 13 | | 112,959 | | 2,308,411 | | 17.4 | % |
2010 | | 21 | | 162,480 | | 2,985,066 | | 22.5 | % |
2011 | | 9 | | 53,011 | | 980,118 | | 7.4 | % |
2012 | | 2 | | 15,275 | | 306,791 | | 2.3 | % |
2013 | | — | | — | | — | | — | |
2014 | | 1 | | 4,264 | | 85,280 | | 0.6 | % |
2015 | | — | | — | | — | | — | |
2016 | | — | | — | | — | | — | |
Total | | 105 | | 681,695 | | $ | 13,291,289 | | 100.0 | % |
| | | | | | | | | | |
Held-for-Sale Properties
Year | | Number of
Leases | | Square
Footage | | Annual
Revenue (2) | | Percentage of Total
Annual Revenue | |
2006 | | 21 | | 53,948 | | 1,172,983 | | 15.2 | % |
2007 | | 21 | | 104,350 | | 2,352,098 | | 30.3 | % |
2008 | | 14 | | 41,368 | | 871,990 | | 11.3 | % |
2009 | | 13 | | 48,367 | | 1,093,150 | | 14.1 | % |
2010 | | 11 | | 58,646 | | 1,108,154 | | 14.3 | % |
2011 | | 3 | | 11,930 | | 214,945 | | 2.8 | % |
2012 | | 3 | | 30,676 | | 678,186 | | 8.8 | % |
2013 | | — | | — | | — | | — | |
2014 | | — | | — | | — | | — | |
2015 | | 1 | | 14,379 | | 191,220 | | 2.5 | % |
2016 | | 1 | | 3,126 | | 57,831 | | 0.7 | % |
Total | | 88 | | 366,790 | | $ | 7,740,557 | | 100.0 | % |
| | | | | | | | | | |
(1) Excludes month-to-month tenants.
(2) Represents the annual base rent and excludes any adjustments for straight-line rent or expense recoveries.
11
Other Property Information
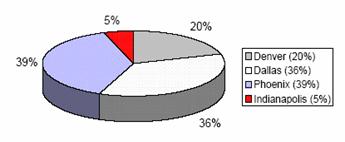
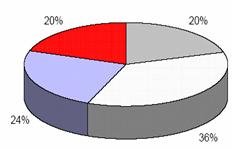
Geographic Distribution
The following chart illustrates the geographic distribution of our properties by square footage at December 31, 2005:
| 
| 
|
Regions including held-for-sale properties | Regions excluding held-for-sale | |
Portfolio by Lease Size, including held-for-sale-properties
Lease Size | | Occupied Area | | % of Occupied Area | | Number of
Leases | | % of Total
Leases | |
2,500 square feet and under | | 326,551 | | 17.1 | % | 245 | | 53.9 | % |
2,501 to 5,000 square feet | | 359,194 | | 18.8 | % | 103 | | 22.7 | % |
5,001 to 10,000 square feet | | 460,994 | | 24.2 | % | 67 | | 14.8 | % |
10,001 to 25,000 square feet | | 514,405 | | 27.0 | % | 33 | | 7.3 | % |
25,001 to 50,000 square feet | | 130,781 | | 6.9 | % | 4 | | 0.9 | % |
50,000 square feet and greater | | 115,373 | | 6.0 | % | 2 | | 0.4 | % |
| | 1,907,298 | | 100.0 | % | 454 | | 100.0 | % |
Ten Largest Customers
Tenant Name | | Tenant Industry | | Property | | Lease
Expiration | | Square Feet | | Annualized
Rent (1) | | % of Total
Consolidated
Annual
Revenue (1) | |
Southwest Gas Corporation | | Energy | | Southwest Gas | | 8/31/09 | | 60,046 | | 1,501,150 | | 4.8 | % |
Capstar Radio Operating Co. | | Entertainment | | Camelback Lakes | | 5/31/10 | | 55,327 | | 1,438,502 | | 4.6 | % |
Hewitt Associates L.L.C. | | Consulting/business services | | Hackberry View | | 1/31/10 | | 43,137 | | 938,230 | | 3.0 | % |
Humana Health Plan, Inc. | | Healthcare | | Camelback Lakes | | 3/14/06 | | 29,848 | | 597,830 | | 1.9 | % |
Axis Mortgage and Investment Co. | | Financial services - mortgage | | Financial Plaza | | 8/31/07 | | 29,226 | | 684,601 | | 2.2 | % |
DNA Productions | | Computer systems and software | | Hackberry View | | 6/30/09 | | 28,570 | | 582,131 | | 1.9 | % |
Schlumberger Technology Corp. | | Energy | | Greenhill Park | | 7/31/07 | | 24,606 | | 478,435 | | 1.5 | % |
Vision Offices Mesa, L.L.C. | | Consulting/business services | | Financial Plaza | | 10/31/12 | | 24,444 | | 558,832 | | 1.8 | % |
Compass Bank | | Financial services - bank | | Camelback Lakes | | 9/30/09 | | 23,883 | | 600,092 | | 1.9 | % |
DaimlerChrysler Services North America | | Wholesale trade, manufacturing | | Greenhill Park | | 12/31/10 | | 21,225 | | 339,600 | | 1.1 | % |
| | | | | | | | 340,312 | | 7,719,403 | | 24.7 | % |
Tenant Diversification by Industry
The following table categorizes the leased area of our properties, including held-for-sale, by our tenant’s industry at December 31, 2005:
Real estate | | 11.5 | % |
Consulting and business services | | 9.8 | % |
Healthcare | | 9.7 | % |
Financial services - mortgage | | 9.2 | % |
Financial services - advisement and brokerage | | 7.6 | % |
Financial services - insurance | | 6.8 | % |
Legal | | 6.1 | % |
Energy | | 6.1 | % |
Computer systems and software | | 5.9 | % |
Wholesale trade and manufacturing | | 5.3 | % |
Travel, entertainment and food service | | 4.4 | % |
Telecommunications | | 3.9 | % |
Financial services - banks | | 2.3 | % |
Accounting | | 2.2 | % |
Other | | 9.2 | % |
(1) Represents the current annualized base rent and excludes any adjustments for straight-line rent or expense recoveries.
12
Strategic Asset Sales Information
| | Chateau
Plaza (1) | | AmeriVest
Plaza (1) | | Financial
Plaza | | Keystone
Office Park | | Total | |
| | | | | | | | | | | |
Cap Rate Analysis | | | | | | | | | | | |
Market | | Dallas | | Denver | | Phoenix | | Indianapolis | | | |
RSF | | 171,294 | | 120,171 | | 310,838 | | 114,980 | | 717,283 | |
Occupancy:% leased | | 96 | % | 74 | % | 91 | % | 79 | % | | |
Closing date | | 12/12/2005 | | 12/15/2005 | | 1/23/2006 | | 1/24/2006 | | | |
| | | | | | | | | | | |
2005: Revenues | | $ | 3,943,720 | | $ | 1,945,850 | | $ | 6,225,734 | | $ | 1,493,675 | | $ | 13,608,979 | |
SL rent adjustment | | 391,655 | | (141,169 | ) | (227,967 | ) | (49,410 | ) | (26,891 | ) |
Operating expenses | | (1,617,797 | ) | (1,034,498 | ) | (2,613,613 | ) | (810,875 | ) | (6,076,783 | ) |
2005 Cash NOI (2) | | $ | 2,717,578 | | $ | 770,183 | | $ | 3,384,154 | | $ | 633,390 | | $ | 7,505,305 | |
| | | | | | | | | | | |
Sales price | | $ | 31,300,000 | | $ | 15,525,000 | | $ | 55,000,000 | | $ | 9,371,165 | | $ | 111,196,165 | |
2005 cap rate | | 8.7 | % | 5.0 | % | 6.2 | % | 6.8 | % | 6.7 | % |
$ per RSF | | $ | 183 | | $ | 129 | | $ | 177 | | $ | 82 | | $ | 155 | |
Closing Costs and Adjustments
Contract purchase price | | $ | 31,300,000 | | $ | 15,525,000 | | $ | 55,000,000 | | $ | 9,371,165 | | $ | 111,196,165 | | 100 | % |
| | | | | | | | | | | | | |
Sales Expenses | | | | | | | | | | | | | |
Commissions | | (430,000 | ) | (310,500 | ) | (495,000 | ) | (183,301 | ) | (1,418,801 | ) | -1.3 | % |
Filing, title and other fees | | (634 | ) | (5,321 | ) | (42,168 | ) | (1,735 | ) | (49,858 | ) | 0.0 | % |
Title insurance | | (97,976 | ) | (11,255 | ) | (46,032 | ) | (10,450 | ) | (165,713 | ) | -0.1 | % |
Total sales expenses | | (528,610 | ) | (327,076 | ) | (583,200 | ) | (195,486 | ) | (1,634,372 | ) | -1.5 | % |
| | | | | | | | | | | | | |
Closing Prorations | | | | | | | | | | | | | |
Credits to seller: TI/expenses | | 34,601 | | 71,611 | | 9,029 | | 1,379 | | 116,620 | | 0.1 | % |
Rent prorations | | (205,212 | ) | (50,356 | ) | (86,889 | ) | (33,400 | ) | (375,857 | ) | -0.3 | % |
Accrued interest | | — | | (94,048 | ) | (88,988 | ) | (24,574 | ) | (207,610 | ) | -0.2 | % |
Transfer of security deposits | | (54,946 | ) | (136,852 | ) | (255,046 | ) | (53,775 | ) | (500,619 | ) | -0.5 | % |
Property taxes payable | | (575,673 | ) | (387,262 | ) | (438,330 | ) | (154,437 | ) | (1,555,702 | ) | -1.4 | % |
Loan prepayment penalties | | — | | — | | — | | (204,540 | ) | (204,540 | ) | -0.2 | % |
Transfer of TI/commissions to buyer | | (844,249 | ) | — | | (453,986 | ) | (104,805 | ) | (1,403,040 | ) | -1.3 | % |
Total prorations | | (1,645,479 | ) | (596,907 | ) | (1,314,210 | ) | (574,152 | ) | (4,130,748 | ) | -3.7 | % |
| | | | | | | | | | | | | |
Total adjustments to sale price | | (2,174,089 | ) | (923,983 | ) | (1,897,410 | ) | (769,638 | ) | (5,765,120 | ) | -5.2 | % |
| | | | | | | | | | | | | |
Net proceeds to seller | | 29,125,911 | | 14,601,017 | | 53,102,590 | | 8,601,527 | | 105,431,045 | | 94.8 | % |
| | | | | | | | | | | | | |
Payoff of first mortgage | | — | | (14,238,653 | ) | (23,605,345 | ) | (4,571,236 | ) | (42,415,234 | ) | -38.1 | % |
| | | | | | | | | | | | | |
Release of net escrow balance to seller | | 1,824,062 | | 382,279 | | 271,104 | | — | | 2,477,445 | | 2.2 | % |
| | | | | | | | | | | | | |
Total cash received by seller | | 30,949,973 | | 744,643 | | 29,768,349 | | 4,030,291 | | 65,493,256 | | 58.9 | % |
| | | | | | | | | | | | | |
Application of Cash Proceeds | | | | | | | | | | | | | |
Payments on secured credit facility | | (30,747,547 | ) | — | | — | | — | | (30,747,547 | ) | -27.7 | % |
Payments on unsecured credit facility | | (202,426 | ) | (744,643 | ) | (29,768,349 | ) | (296,494 | ) | (31,011,912 | ) | -27.9 | % |
| | | | | | | | | | | | | |
Net cash retained by seller | | — | | — | | — | | $ | 3,733,797 | | $ | 3,733,797 | | 3.4 | % |
(1) 2005 amounts for Chateau Plaza and AmeriVest Plaza have been annualized based on November year-to-date figures to project results for the entire year.
(2) See page 6 for a reconciliation of property NOI to net income/(loss).
13