UNITED STATES
SECURITIES AND EXCHANGE COMMISSION
Washington, D.C. 20549
FORM N-CSR
CERTIFIED SHAREHOLDER REPORT OF REGISTERED
MANAGEMENT INVESTMENT COMPANIES
Investment Company Act file number 811-7205
Variable Insurance Products Fund III
(Exact name of registrant as specified in charter)
82 Devonshire St., Boston, Massachusetts 02109
(Address of principal executive offices) (Zip code)
Scott C. Goebel, Secretary
82 Devonshire St.
Boston, Massachusetts 02109
(Name and address of agent for service)
Registrant's telephone number, including area code: 617-563-7000
Date of fiscal year end: | December 31 |
| |
Date of reporting period: | December 31, 2011 |
Item 1. Reports to Stockholders
Fidelity® Variable Insurance Products:
Value Strategies Portfolio
Annual Report
December 31, 2011
Contents
Performance | (Click Here) | How the fund has done over time. |
Management's Discussion of Fund Performance | (Click Here) | The Portfolio Manager's review of fund performance and strategy. |
Shareholder Expense Example | (Click Here) | An example of shareholder expenses. |
Investment Changes | (Click Here) | A summary of major shifts in the fund's investments over the past six months. |
Investments | (Click Here) | A complete list of the fund's investments with their market values. |
Financial Statements | (Click Here) | Statements of assets and liabilities, operations, and changes in net assets, as well as financial highlights. |
Notes | (Click Here) | Notes to the financial statements. |
Report of Independent Registered Public Accounting Firm | (Click Here) | |
Trustees and Officers | (Click Here) | |
Distributions | (Click Here) | |
Board Approval of Investment Advisory Contracts and Management Fees | (Click Here) | |
To view a fund's proxy voting guidelines and proxy voting record for the 12-month period ended June 30, visit http://www.fidelity.com/proxyvotingresults or visit the Securities and Exchange Commission's (SEC) web site at http://www.sec.gov. You may also call 1-877-208-0098 to request a free copy of the proxy voting guidelines.
Fidelity® Variable Insurance Products are separate account options which are purchased through a variable insurance contract.
Standard & Poor's, S&P and S&P 500 are registered service marks of The McGraw-Hill Companies, Inc. and have been licensed for use by Fidelity Distributors Corporation.
Other third party marks appearing herein are the property of their respective owners.
All other marks appearing herein are registered or unregistered trademarks or service marks of FMR LLC or an affiliated company.
This report and the financial statements contained herein are submitted for the general information of the shareholders of the fund. This report is not authorized for distribution to prospective investors in the fund unless preceded or accompanied by an effective prospectus.
A fund files its complete schedule of portfolio holdings with the SEC for the first and third quarters of each fiscal year on Form N-Q. Forms N-Q are available on the SEC's web site at http://www.sec.gov. A fund's Forms N-Q may be reviewed and copied at the SEC's Public Reference Room in Washington, DC. Information regarding the operation of the SEC's Public Reference Room may be obtained by calling 1-800-SEC-0330. For a complete list of a fund's portfolio holdings, view the most recent holdings listing, semiannual report, or annual report on Fidelity's web site at http://www.fidelity.com, http://www.advisor.fidelity.com, or http://www.401k.com, as applicable.
NOT FDIC INSURED • MAY LOSE VALUE • NO BANK GUARANTEE
Neither the fund nor Fidelity Distributors Corporation is a bank.
Annual Report
Average annual total return reflects the change in the value of an investment, assuming reinvestment of the class' distributions from dividend income and capital gains (the profits earned upon the sale of securities that have grown in value, if any) and assuming a constant rate of performance each year. During periods of reimbursement by Fidelity, a fund's total return will be greater than it would be had the reimbursement not occurred. Performance numbers are net of all underlying fund operating expenses, but do not include any insurance charges imposed by your insurance company's separate account. If performance information included the effect of these additional charges, the total returns would have been lower. How a fund did yesterday is no guarantee of how it will do tomorrow.
Average Annual Total Returns
Periods ended December 31, 2011 | Past 1
year | Past 5
years | Life of
fund A |
VIP Value Strategies Portfolio - Initial Class | -8.81% | -1.24% | 4.88% |
VIP Value Strategies Portfolio - Service Class | -8.85% | -1.33% | 4.77% |
VIP Value Strategies Portfolio - Service Class 2 | -9.04% | -1.50% | 4.68% |
VIP Value Strategies Portfolio - Investor Class B | -8.92% | -1.34% | 4.80% |
A From February 20, 2002.
B The initial offering of Investor Class shares took place on July 21, 2005. Returns prior to July 21, 2005 are those of Initial Class. Had Investor Class's transfer agent fee been reflected, returns prior to July 21, 2005 would have been lower.
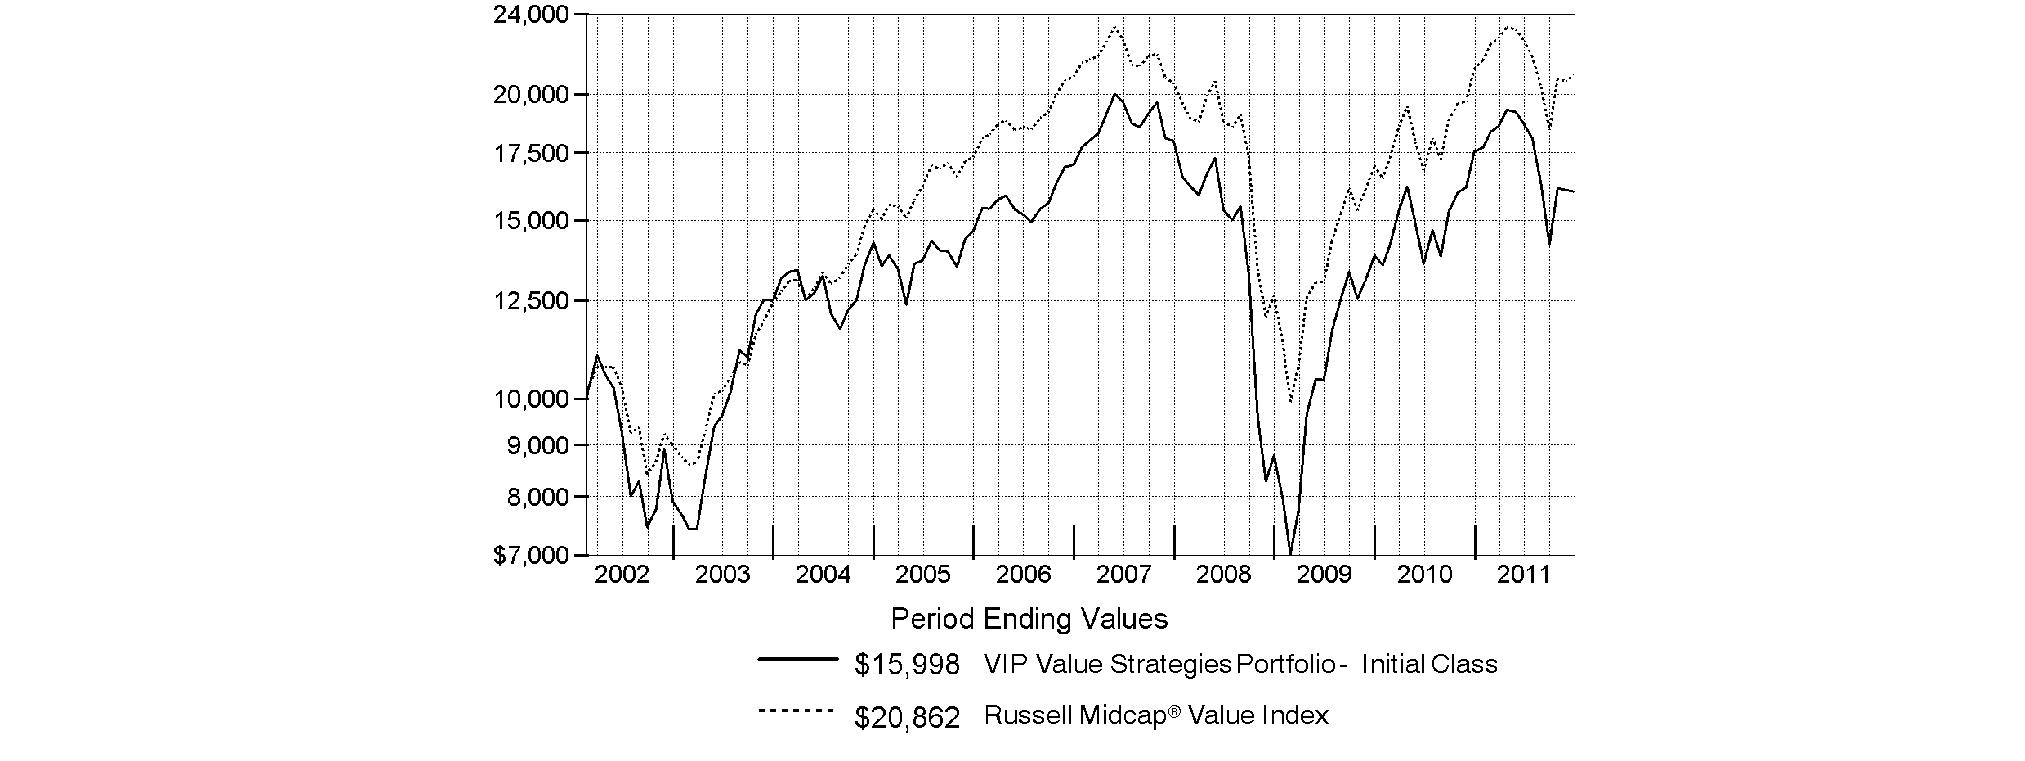
$10,000 Over Life of Fund
Let's say hypothetically that $10,000 was invested in VIP Value Strategies Portfolio - Initial Class on February 20, 2002, when the fund started. The chart shows how the value of your investment would have changed, and also shows how the Russell Midcap® Value Index performed over the same period.
Annual Report
Market Recap: Extreme market volatility took center stage during the 12 months ending December 31, 2011, stealing the spotlight from signs of progress in the global economy. Early in the year, aggressive monetary stimulus by the U.S. federal government, improving credit-market conditions and solid corporate earnings buoyed most major asset classes. As the period progressed, however, fresh worries about sovereign debt in Europe, inflation in China, gridlock over raising the debt ceiling in the U.S. - along with Standard & Poor's early-August downgrade of the nation's long-term sovereign credit rating - and a dimmed outlook for global growth punctured investor confidence and ignited market instability. Domestic equities, as measured by the broad-based S&P 500® Index, gained 2.11%, easily outpacing the 13.61% decline of MSCI® ACWI® (All Country World Index) ex USA Index, a proxy for foreign stocks. Within the MSCI index, emerging markets declined the most (-18%), with investments here generally held back by a stronger U.S. dollar. The U.K. (-3%) fared better than the rest of Europe (-15%), which was the second-worst-performing index component. Bolstered by periodic flights to quality, U.S. investment-grade bonds posted a 7.84% advance, as reflected by the Barclays Capital® U.S. Aggregate Bond Index, outperforming the 4.37% gain of high-yield securities, as represented by The BofA Merrill LynchSM US High Yield Constrained Index. Hampered by financial woes in Europe, the sovereign debt of major developed markets outside the U.S. rose 4.86%, according to the Citigroup® Non-USD Group-of-Seven (G7) Equal Weighted Index, while the JPMorgan Emerging Markets Bond Index Global (EMBI Global) advanced 8.46%, despite the currency head wind.
Comments from Thomas Soviero, Portfolio Manager of VIP Value Strategies Portfolio: For the year, the fund's share classes significantly underperformed the Russell Midcap® Value Index, which returned -1.38%. (For specific portfolio results, please refer to the performance section of this report.) The fund was hurt by security selection in consumer staples - particularly in food/beverage/tobacco - and in health care. An overweighting in information technology dampened results further, particularly within the lagging semiconductors and semiconductor equipment industry, as did an underweighting in the defensive utilities sector and investments in consumer discretionary. The biggest individual detractors included Canadian soft drink manufacturer Cott, semiconductor firm Spansion, wireless telecommunication services company NII Holdings, pharmaceutical company Zogenix and Canadian natural foods processor SunOpta. Conversely, the fund was helped by security selection in materials and an underweighting in the weak financials sector. Phosphates producer Innophos Holdings was the top contributor, with the fund's results also receiving a boost from international telecom company Global Crossing - which was acquired by Level 3 Communications in October - and energy firms C&J Energy Services and Cabot Oil & Gas. Most of the stocks I've mentioned were not part of the Russell index.
The views expressed above reflect those of the portfolio manager(s) only through the end of the period as stated on the cover of this report and do not necessarily represent the views of Fidelity or any other person in the Fidelity organization. Any such views are subject to change at any time based upon market or other conditions and Fidelity disclaims any responsibility to update such views. These views may not be relied on as investment advice and, because investment decisions for a Fidelity fund are based on numerous factors, may not be relied on as an indication of trading intent on behalf of any Fidelity fund.
Annual Report
As a shareholder of the Fund, you incur two types of costs: (1) transaction costs, and (2) ongoing costs, including management fees, distribution and/or service (12b-1) fees and other Fund expenses. This Example is intended to help you understand your ongoing costs (in dollars) of investing in the Fund and to compare these costs with the ongoing costs of investing in other mutual funds.
The Example is based on an investment of $1,000 invested at the beginning of the period and held for the entire period (July 1, 2011 to December 31, 2011).
Actual Expenses
The first line of the accompanying table for each class of the Fund provides information about actual account values and actual expenses. You may use the information in this line, together with the amount you invested, to estimate the expenses that you paid over the period. Simply divide your account value by $1,000.00 (for example, an $8,600 account value divided by $1,000.00 = 8.6), then multiply the result by the number in the first line for a class of the Fund under the heading entitled "Expenses Paid During Period" to estimate the expenses you paid on your account during this period. The estimate of expenses does not include any fees or other expenses of any variable annuity or variable life insurance product. If they were, the estimate of expenses you paid during the period would be higher, and your ending account value would be lower. In addition, the Fund, as a shareholder in the underlying Fidelity Central Funds, will indirectly bear its pro-rata share of the fees and expenses incurred by the underlying Fidelity Central Funds. These fees and expenses are not included in the Fund's annualized expense ratio used to calculate the expense estimate in the table below.
Hypothetical Example for Comparison Purposes
The second line of the accompanying table for each class of the Fund provides information about hypothetical account values and hypothetical expenses based on a Class' actual expense ratio and an assumed rate of return of 5% per year before expenses, which is not the Class' actual return. The hypothetical account values and expenses may not be used to estimate the actual ending account balance or expenses you paid for the period. You may use this information to compare the ongoing costs of investing in the Fund and other funds. To do so, compare this 5% hypothetical example with the 5% hypothetical examples that appear in the shareholder reports of the other funds. The estimate of expenses does not include any fees or other expenses of any variable annuity or variable life insurance product. If they were, the estimate of expenses you paid during the period would be higher, and your ending account value would be lower. In addition, the Fund, as a shareholder in the underlying Fidelity Central Funds, will indirectly bear its pro-rata share of the fees and expenses incurred by the underlying Fidelity Central Funds. These fees and expenses are not included in the Fund's annualized expense ratio used to calculate the expense estimate in the table below.
Please note that the expenses shown in the table are meant to highlight your ongoing costs only and do not reflect any transaction costs. Therefore, the second line of the table is useful in comparing ongoing costs only, and will not help you determine the relative total costs of owning different funds.
| Annualized Expense Ratio | Beginning
Account Value
July 1, 2011 | Ending
Account Value
December 31, 2011 | Expenses Paid
During Period*
July 1, 2011 to
December 31, 2011 |
Initial Class | .70% | | | |
Actual | | $ 1,000.00 | $ 858.20 | $ 3.28 |
HypotheticalA | | $ 1,000.00 | $ 1,021.68 | $ 3.57 |
Service Class | .79% | | | |
Actual | | $ 1,000.00 | $ 857.60 | $ 3.70 |
HypotheticalA | | $ 1,000.00 | $ 1,021.22 | $ 4.02 |
Service Class 2 | .94% | | | |
Actual | | $ 1,000.00 | $ 856.30 | $ 4.40 |
HypotheticalA | | $ 1,000.00 | $ 1,020.47 | $ 4.79 |
Investor Class | .78% | | | |
Actual | | $ 1,000.00 | $ 857.80 | $ 3.65 |
HypotheticalA | | $ 1,000.00 | $ 1,021.27 | $ 3.97 |
A 5% return per year before expenses
* Expenses are equal to each Class' annualized expense ratio, multiplied by the average account value over the period, multiplied by 184/365 (to reflect the one-half year period).
Annual Report
Investment Changes (Unaudited)
Top Ten Stocks as of December 31, 2011 |
| % of fund's
net assets | % of fund's net assets
6 months ago |
LyondellBasell Industries NV Class A | 5.5 | 4.7 |
GameStop Corp. Class A | 4.7 | 4.0 |
Cott Corp. | 4.4 | 3.7 |
Innophos Holdings, Inc. | 2.9 | 2.3 |
Target Corp. | 2.7 | 0.0 |
The AES Corp. | 2.3 | 1.9 |
PPG Industries, Inc. | 2.3 | 1.9 |
AFLAC, Inc. | 2.2 | 1.0 |
Union Pacific Corp. | 1.8 | 1.4 |
PulteGroup, Inc. | 1.6 | 0.7 |
| 30.4 | |
Top Five Market Sectors as of December 31, 2011 |
| % of fund's
net assets | % of fund's net assets
6 months ago |
Consumer Discretionary | 22.0 | 16.5 |
Materials | 14.5 | 13.4 |
Information Technology | 13.9 | 12.3 |
Financials | 8.9 | 9.4 |
Industrials | 8.9 | 11.3 |
Asset Allocation (% of fund's net assets) |
As of December 31, 2011* | As of June 30, 2011** |
 | Stocks 98.0% | | | Stocks 97.0% | |
 | Bonds 0.1% | | | Bonds 0.1% | |
 | Short-Term
Investments and
Net Other Assets 1.9% | | | Short-Term
Investments and
Net Other Assets 2.9% | |
*Foreign investments | 17.0% | | **Foreign investments | 19.6% | |

Annual Report
Investments December 31, 2011
Showing Percentage of Net Assets
Common Stocks - 97.8% |
| Shares | | Value |
CONSUMER DISCRETIONARY - 21.7% |
Auto Components - 1.0% |
Delphi Automotive PLC | 66,315 | | $ 1,285,583 |
TRW Automotive Holdings Corp. (a) | 48,700 | | 1,587,620 |
| | 2,873,203 |
Automobiles - 1.0% |
Bayerische Motoren Werke AG (BMW) | 11,836 | | 792,990 |
General Motors Co. (a) | 60,300 | | 1,222,281 |
Volkswagen AG | 6,015 | | 807,000 |
| | 2,822,271 |
Diversified Consumer Services - 0.9% |
Service Corp. International | 233,400 | | 2,485,710 |
Hotels, Restaurants & Leisure - 2.3% |
Ameristar Casinos, Inc. | 93,374 | | 1,614,436 |
Cedar Fair LP (depository unit) | 75,480 | | 1,622,820 |
O'Charleys, Inc. (a) | 131,545 | | 722,182 |
Wyndham Worldwide Corp. | 66,333 | | 2,509,377 |
| | 6,468,815 |
Household Durables - 3.9% |
KB Home | 73,806 | | 495,976 |
Lennar Corp. Class A | 65,214 | | 1,281,455 |
Newell Rubbermaid, Inc. | 24,000 | | 387,600 |
PulteGroup, Inc. (a) | 720,690 | | 4,547,554 |
Ryland Group, Inc. | 48,600 | | 765,936 |
Standard Pacific Corp. (a)(d) | 741,107 | | 2,356,720 |
Techtronic Industries Co. Ltd. | 1,271,500 | | 1,308,074 |
| | 11,143,315 |
Leisure Equipment & Products - 0.7% |
Hasbro, Inc. | 60,903 | | 1,942,197 |
Media - 1.9% |
Omnicom Group, Inc. | 39,988 | | 1,782,665 |
Regal Entertainment Group Class A (d) | 74,800 | | 893,112 |
Valassis Communications, Inc. (a)(d) | 113,511 | | 2,182,817 |
Virgin Media, Inc. | 28,200 | | 602,916 |
| | 5,461,510 |
Multiline Retail - 2.7% |
Target Corp. | 147,900 | | 7,575,438 |
Specialty Retail - 7.3% |
Advance Auto Parts, Inc. | 50,680 | | 3,528,848 |
Asbury Automotive Group, Inc. (a) | 157,159 | | 3,388,348 |
Casual Male Retail Group, Inc. (a) | 127,192 | | 434,997 |
GameStop Corp. Class A (a)(d) | 554,138 | | 13,371,350 |
| | 20,723,543 |
TOTAL CONSUMER DISCRETIONARY | | 61,496,002 |
CONSUMER STAPLES - 7.1% |
Beverages - 4.6% |
China New Borun Corp. ADR (a)(d) | 209,236 | | 654,909 |
Cott Corp. (a) | 1,971,857 | | 12,391,874 |
| | 13,046,783 |
|
| Shares | | Value |
Food & Staples Retailing - 0.6% |
SUPERVALU, Inc. | 90,200 | | $ 732,424 |
United Natural Foods, Inc. (a) | 24,900 | | 996,249 |
| | 1,728,673 |
Food Products - 1.9% |
Bunge Ltd. | 17,600 | | 1,006,720 |
Calavo Growers, Inc. (d) | 75,472 | | 1,938,121 |
SunOpta, Inc. (a) | 502,615 | | 2,422,605 |
| | 5,367,446 |
TOTAL CONSUMER STAPLES | | 20,142,902 |
ENERGY - 5.4% |
Energy Equipment & Services - 1.9% |
C&J Energy Services, Inc. (a)(e) | 113,214 | | 2,132,612 |
Ensco International Ltd. ADR | 24,500 | | 1,149,540 |
Halliburton Co. | 60,900 | | 2,101,659 |
| | 5,383,811 |
Oil, Gas & Consumable Fuels - 3.5% |
Cabot Oil & Gas Corp. | 50,100 | | 3,802,590 |
Denbury Resources, Inc. (a) | 166,720 | | 2,517,472 |
Forest Oil Corp. (a) | 49,495 | | 670,657 |
Suncor Energy, Inc. | 23,800 | | 686,610 |
Valero Energy Corp. | 23,900 | | 503,095 |
Williams Companies, Inc. | 50,300 | | 1,660,906 |
| | 9,841,330 |
TOTAL ENERGY | | 15,225,141 |
FINANCIALS - 8.9% |
Commercial Banks - 3.2% |
BB&T Corp. | 146,169 | | 3,679,074 |
Regions Financial Corp. | 259,337 | | 1,115,149 |
U.S. Bancorp | 158,316 | | 4,282,448 |
| | 9,076,671 |
Insurance - 4.7% |
AFLAC, Inc. | 143,245 | | 6,196,779 |
American International Group, Inc. (a) | 49,600 | | 1,150,720 |
Assurant, Inc. | 25,800 | | 1,059,348 |
Lincoln National Corp. | 166,900 | | 3,241,198 |
Unum Group | 79,940 | | 1,684,336 |
| | 13,332,381 |
Real Estate Investment Trusts - 0.7% |
CBL & Associates Properties, Inc. | 63,219 | | 992,538 |
Host Hotels & Resorts, Inc. | 66,100 | | 976,297 |
| | 1,968,835 |
Real Estate Management & Development - 0.3% |
Forest City Enterprises, Inc. Class A (a) | 66,300 | | 783,666 |
TOTAL FINANCIALS | | 25,161,553 |
Common Stocks - continued |
| Shares | | Value |
HEALTH CARE - 7.5% |
Health Care Equipment & Supplies - 2.4% |
Boston Scientific Corp. (a) | 248,800 | | $ 1,328,592 |
C. R. Bard, Inc. | 24,600 | | 2,103,300 |
Covidien PLC | 36,550 | | 1,645,116 |
Hill-Rom Holdings, Inc. | 17,100 | | 576,099 |
Orthofix International NV (a) | 30,700 | | 1,081,561 |
| | 6,734,668 |
Health Care Providers & Services - 2.0% |
DaVita, Inc. (a) | 26,302 | | 1,993,955 |
Universal Health Services, Inc. Class B | 92,486 | | 3,594,006 |
| | 5,587,961 |
Life Sciences Tools & Services - 1.2% |
Agilent Technologies, Inc. (a) | 58,800 | | 2,053,884 |
PerkinElmer, Inc. | 68,800 | | 1,376,000 |
| | 3,429,884 |
Pharmaceuticals - 1.9% |
Johnson & Johnson | 50,000 | | 3,279,000 |
Zogenix, Inc. (a)(d) | 1,006,139 | | 2,253,751 |
| | 5,532,751 |
TOTAL HEALTH CARE | | 21,285,264 |
INDUSTRIALS - 8.9% |
Aerospace & Defense - 2.6% |
Alliant Techsystems, Inc. | 57,700 | | 3,298,132 |
Esterline Technologies Corp. (a) | 32,478 | | 1,817,794 |
GeoEye, Inc. (a) | 36,653 | | 814,430 |
Textron, Inc. | 71,333 | | 1,318,947 |
| | 7,249,303 |
Building Products - 0.7% |
Armstrong World Industries, Inc. | 24,578 | | 1,078,237 |
Owens Corning (a) | 30,789 | | 884,260 |
| | 1,962,497 |
Commercial Services & Supplies - 0.2% |
Quad/Graphics, Inc. | 48,144 | | 690,385 |
Construction & Engineering - 0.4% |
Quanta Services, Inc. (a) | 49,200 | | 1,059,768 |
Electrical Equipment - 0.4% |
Regal-Beloit Corp. | 20,300 | | 1,034,691 |
Industrial Conglomerates - 0.9% |
Carlisle Companies, Inc. | 57,071 | | 2,528,245 |
Machinery - 1.8% |
Blount International, Inc. (a) | 93,096 | | 1,351,754 |
Ingersoll-Rand PLC | 68,500 | | 2,087,195 |
Stanley Black & Decker, Inc. | 23,680 | | 1,600,768 |
| | 5,039,717 |
Marine - 0.1% |
Ultrapetrol (Bahamas) Ltd. (a) | 148,247 | | 441,776 |
|
| Shares | | Value |
Road & Rail - 1.8% |
Union Pacific Corp. | 48,400 | | $ 5,127,496 |
TOTAL INDUSTRIALS | | 25,133,878 |
INFORMATION TECHNOLOGY - 13.9% |
Communications Equipment - 0.9% |
Cisco Systems, Inc. | 68,400 | | 1,236,672 |
Comverse Technology, Inc. (a) | 199,534 | | 1,368,803 |
| | 2,605,475 |
Computers & Peripherals - 1.9% |
Apple, Inc. (a) | 6,800 | | 2,754,000 |
SanDisk Corp. (a) | 24,907 | | 1,225,673 |
Western Digital Corp. (a) | 45,976 | | 1,422,957 |
| | 5,402,630 |
Electronic Equipment & Components - 1.3% |
Anixter International, Inc. (a) | 22,320 | | 1,331,165 |
Arrow Electronics, Inc. (a) | 45,443 | | 1,700,023 |
DDi Corp. | 58,900 | | 549,537 |
| | 3,580,725 |
IT Services - 1.1% |
Acxiom Corp. (a) | 70,218 | | 857,362 |
Fidelity National Information Services, Inc. | 85,640 | | 2,277,168 |
| | 3,134,530 |
Office Electronics - 0.5% |
Xerox Corp. | 182,569 | | 1,453,249 |
Semiconductors & Semiconductor Equipment - 6.5% |
Fairchild Semiconductor International, Inc. (a) | 100,800 | | 1,213,632 |
Intersil Corp. Class A | 251,622 | | 2,626,934 |
KLA-Tencor Corp. | 56,820 | | 2,741,565 |
Lam Research Corp. (a) | 69,000 | | 2,554,380 |
Marvell Technology Group Ltd. (a) | 265,200 | | 3,673,020 |
Micron Technology, Inc. (a) | 142,042 | | 893,444 |
ON Semiconductor Corp. (a) | 395,091 | | 3,050,103 |
Spansion, Inc. Class A (a) | 204,457 | | 1,692,904 |
| | 18,445,982 |
Software - 1.7% |
Microsoft Corp. | 142,476 | | 3,698,677 |
Nuance Communications, Inc. (a) | 49,600 | | 1,247,936 |
| | 4,946,613 |
TOTAL INFORMATION TECHNOLOGY | | 39,569,204 |
MATERIALS - 14.5% |
Chemicals - 13.2% |
Ashland, Inc. | 28,200 | | 1,611,912 |
Innophos Holdings, Inc. | 170,680 | | 8,288,221 |
LyondellBasell Industries NV Class A | 480,976 | | 15,626,909 |
PPG Industries, Inc. | 76,800 | | 6,412,032 |
Common Stocks - continued |
| Shares | | Value |
MATERIALS - continued |
Chemicals - continued |
Solutia, Inc. | 137,264 | | $ 2,371,922 |
W.R. Grace & Co. (a) | 71,272 | | 3,272,810 |
| | 37,583,806 |
Metals & Mining - 1.3% |
Carpenter Technology Corp. | 28,204 | | 1,451,942 |
Haynes International, Inc. | 5,500 | | 300,300 |
Newcrest Mining Ltd. | 40,515 | | 1,226,407 |
Titanium Metals Corp. | 47,700 | | 714,546 |
| | 3,693,195 |
TOTAL MATERIALS | | 41,277,001 |
TELECOMMUNICATION SERVICES - 3.0% |
Diversified Telecommunication Services - 2.5% |
CenturyLink, Inc. | 63,255 | | 2,353,086 |
Cogent Communications Group, Inc. (a) | 104,542 | | 1,765,714 |
Level 3 Communications, Inc. (a) | 185,165 | | 3,145,953 |
| | 7,264,753 |
Wireless Telecommunication Services - 0.5% |
NII Holdings, Inc. (a) | 63,177 | | 1,345,670 |
TOTAL TELECOMMUNICATION SERVICES | | 8,610,423 |
UTILITIES - 6.9% |
Electric Utilities - 1.7% |
American Electric Power Co., Inc. | 72,200 | | 2,982,582 |
FirstEnergy Corp. | 41,531 | | 1,839,823 |
| | 4,822,405 |
Independent Power Producers & Energy Traders - 3.9% |
Calpine Corp. (a) | 273,037 | | 4,458,694 |
The AES Corp. (a) | 559,892 | | 6,629,121 |
| | 11,087,815 |
Multi-Utilities - 1.3% |
Alliant Energy Corp. | 37,300 | | 1,645,303 |
Sempra Energy | 35,161 | | 1,933,855 |
| | 3,579,158 |
TOTAL UTILITIES | | 19,489,378 |
TOTAL COMMON STOCKS (Cost $270,581,538) | 277,390,746 |
Convertible Preferred Stocks - 0.2% |
| | | |
CONSUMER DISCRETIONARY - 0.2% |
Media - 0.2% |
LodgeNet Entertainment Corp. 10.00% (e) (Cost $679,000) | 700 | | 586,093 |
Nonconvertible Bonds - 0.1% |
| Principal Amount | | Value |
CONSUMER DISCRETIONARY - 0.1% |
Hotels, Restaurants & Leisure - 0.1% |
Chukchansi Economic Development Authority 8% 11/15/13 (e) (Cost $301,856) | | $ 355,000 | | $ 228,975 |
Money Market Funds - 4.5% |
| Shares | | |
Fidelity Cash Central Fund, 0.11% (b) | 5,800,249 | | 5,800,249 |
Fidelity Securities Lending Cash Central Fund, 0.13% (b)(c) | 6,852,127 | | 6,852,127 |
TOTAL MONEY MARKET FUNDS (Cost $12,652,376) | 12,652,376 |
TOTAL INVESTMENT PORTFOLIO - 102.6% (Cost $284,214,770) | 290,858,190 |
NET OTHER ASSETS (LIABILITIES) - (2.6)% | (7,280,573) |
NET ASSETS - 100% | $ 283,577,617 |
Legend |
(a) Non-income producing |
(b) Affiliated fund that is available only to investment companies and other accounts managed by Fidelity Investments. The rate quoted is the annualized seven-day yield of the fund at period end. A complete unaudited listing of the fund's holdings as of its most recent quarter end is available upon request. In addition, each Fidelity Central Fund's financial statements, which are not covered by the Fund's Report of Independent Registered Public Accounting Firm, are available on the SEC's website or upon request. |
(c) Investment made with cash collateral received from securities on loan. |
(d) Security or a portion of the security is on loan at period end. |
(e) Security exempt from registration under Rule 144A of the Securities Act of 1933. These securities may be resold in transactions exempt from registration, normally to qualified institutional buyers. At the end of the period, the value of these securities amounted to $2,947,680 or 1.0% of net assets. |
Affiliated Central Funds |
Information regarding fiscal year to date income earned by the Fund from investments in Fidelity Central Funds is as follows: |
Fund | Income earned |
Fidelity Cash Central Fund | $ 12,606 |
Fidelity Securities Lending Cash Central Fund | 114,616 |
Total | $ 127,222 |
Other Information |
The following is a summary of the inputs used, as of December 31, 2011, involving the Fund's assets and liabilities carried at fair value. The inputs or methodology used for valuing securities may not be an indication of the risk associated with investing in those securities. For more information on valuation inputs, and their aggregation into the levels used in the table below, please refer to the Security Valuation section in the accompanying Notes to Financial Statements. |
Valuation Inputs at Reporting Date: |
Description | Total | Level 1 | Level 2 | Level 3 |
Investments in Securities: | | | | |
Equities: | | | | |
Consumer Discretionary | $ 62,082,095 | $ 60,210,419 | $ 1,871,676 | $ - |
Consumer Staples | 20,142,902 | 20,142,902 | - | - |
Energy | 15,225,141 | 13,092,529 | 2,132,612 | - |
Financials | 25,161,553 | 25,161,553 | - | - |
Health Care | 21,285,264 | 21,285,264 | - | - |
Industrials | 25,133,878 | 25,133,878 | - | - |
Information Technology | 39,569,204 | 39,569,204 | - | - |
Materials | 41,277,001 | 41,277,001 | - | - |
Telecommunication Services | 8,610,423 | 8,610,423 | - | - |
Utilities | 19,489,378 | 19,489,378 | - | - |
Corporate Bonds | 228,975 | - | 228,975 | - |
Money Market Funds | 12,652,376 | 12,652,376 | - | - |
Total Investments in Securities: | $ 290,858,190 | $ 286,624,927 | $ 4,233,263 | $ - |
Distribution of investments by country of issue, as a percentage of total net assets, is as follows: (Unaudited) |
United States of America | 83.0% |
Netherlands | 5.5% |
Canada | 5.5% |
Bermuda | 1.7% |
Ireland | 1.3% |
Others (Individually Less Than 1%) | 3.0% |
| 100.0% |
See accompanying notes which are an integral part of the financial statements.
Annual Report
Statement of Assets and Liabilities
| December 31, 2011 |
Assets | | |
Investment in securities, at value (including securities loaned of $6,501,095) - See accompanying schedule: Unaffiliated issuers (cost $271,562,394) | $ 278,205,814 | |
Fidelity Central Funds (cost $12,652,376) | 12,652,376 | |
Total Investments (cost $284,214,770) | | $ 290,858,190 |
Receivable for fund shares sold | | 46,098 |
Dividends receivable | | 114,101 |
Interest receivable | | 3,589 |
Distributions receivable from Fidelity Central Funds | | 4,526 |
Prepaid expenses | | 902 |
Other receivables | | 2,582 |
Total assets | | 291,029,988 |
| | |
Liabilities | | |
Payable for fund shares redeemed | $ 369,051 | |
Accrued management fee | 132,507 | |
Distribution and service plan fees payable | 28,433 | |
Other affiliated payables | 28,773 | |
Other payables and accrued expenses | 41,480 | |
Collateral on securities loaned, at value | 6,852,127 | |
Total liabilities | | 7,452,371 |
| | |
Net Assets | | $ 283,577,617 |
Net Assets consist of: | | |
Paid in capital | | $ 373,295,805 |
Undistributed net investment income | | 14,750 |
Accumulated undistributed net realized gain (loss) on investments and foreign currency transactions | | (96,375,862) |
Net unrealized appreciation (depreciation) on investments and assets and liabilities in foreign currencies | | 6,642,924 |
Net Assets | | $ 283,577,617 |
Statement of Assets and Liabilities - continued
| December 31, 2011 |
Initial Class:
Net Asset Value, offering price and redemption price per share ($77,432,392 ÷ 8,822,389 shares) | | $ 8.78 |
| | |
Service Class:
Net Asset Value, offering price and redemption price per share ($27,695,225 ÷ 3,162,584 shares) | | $ 8.76 |
| | |
Service Class 2:
Net Asset Value, offering price and redemption price per share ($122,640,650 ÷ 13,884,452 shares) | | $ 8.83 |
| | |
Investor Class:
Net Asset Value, offering price and redemption price per share ($55,809,350 ÷ 6,385,424 shares) | | $ 8.74 |
See accompanying notes which are an integral part of the financial statements.
Annual Report
Financial Statements - continued
Statement of Operations
| Year ended December 31, 2011 |
| | |
Investment Income | | |
Dividends | | $ 3,712,341 |
Special dividends | | 1,778,916 |
Interest | | 51,715 |
Income from Fidelity Central Funds | | 127,222 |
Total income | | 5,670,194 |
| | |
Expenses | | |
Management fee | $ 1,824,551 | |
Transfer agent fees | 299,076 | |
Distribution and service plan fees | 409,350 | |
Accounting and security lending fees | 128,759 | |
Custodian fees and expenses | 18,173 | |
Independent trustees' compensation | 1,863 | |
Audit | 57,751 | |
Legal | 1,255 | |
Miscellaneous | 3,686 | |
Total expenses before reductions | 2,744,464 | |
Expense reductions | (16,645) | 2,727,819 |
Net investment income (loss) | | 2,942,375 |
Realized and Unrealized Gain (Loss) Net realized gain (loss) on: | | |
Investment securities: | | |
Unaffiliated issuers | 23,397,131 | |
Foreign currency transactions | 5,205 | |
Total net realized gain (loss) | | 23,402,336 |
Change in net unrealized appreciation (depreciation) on: Investment securities | (55,213,145) | |
Assets and liabilities in foreign currencies | 205 | |
Total change in net unrealized appreciation (depreciation) | | (55,212,940) |
Net gain (loss) | | (31,810,604) |
Net increase (decrease) in net assets resulting from operations | | $ (28,868,229) |
Statement of Changes in Net Assets
| Year ended
December 31,
2011 | Year ended
December 31,
2010 |
Increase (Decrease) in Net Assets | | |
Operations | | |
Net investment income (loss) | $ 2,942,375 | $ 988,992 |
Net realized gain (loss) | 23,402,336 | 17,169,129 |
Change in net unrealized appreciation (depreciation) | (55,212,940) | 53,908,482 |
Net increase (decrease) in net assets resulting
from operations | (28,868,229) | 72,066,603 |
Distributions to shareholders from net investment income | (2,744,535) | (1,278,453) |
Share transactions - net increase (decrease) | (35,855,285) | (18,798,502) |
Total increase (decrease) in net assets | (67,468,049) | 51,989,648 |
| | |
Net Assets | | |
Beginning of period | 351,045,666 | 299,056,018 |
End of period (including undistributed net investment income of $14,750 and distributions in excess of net investment income of $227,717, respectively) | $ 283,577,617 | $ 351,045,666 |
See accompanying notes which are an integral part of the financial statements.
Annual Report
Financial Highlights - Initial Class
Years ended December 31, | 2011 | 2010 | 2009 | 2008 | 2007 |
Selected Per-Share Data | | | | | |
Net asset value, beginning of period | $ 9.74 | $ 7.73 | $ 4.93 | $ 12.57 | $ 13.47 |
Income from Investment Operations | | | | | |
Net investment income (loss) C | .10 F | .04 G | .03 | .07 | .06 |
Net realized and unrealized gain (loss) | (.96) | 2.02 | 2.81 | (5.52) | .71 |
Total from investment operations | (.86) | 2.06 | 2.84 | (5.45) | .77 |
Distributions from net investment income | (.10) | (.05) | (.03) | (.07) | (.15) |
Distributions from net realized gain | - | - | - | (2.13) | (1.52) |
Tax return of capital | - | - | (.01) | - | - |
Total distributions | (.10) | (.05) | (.04) | (2.19) I | (1.67) |
Net asset value, end of period | $ 8.78 | $ 9.74 | $ 7.73 | $ 4.93 | $ 12.57 |
Total Return A,B | (8.81)% | 26.63% | 57.59% | (51.12)% | 5.64% |
Ratios to Average Net Assets D,H | | | | | |
Expenses before reductions | .70% | .72% | .75% | .74% | .70% |
Expenses net of fee waivers, if any | .70% | .71% | .75% | .74% | .70% |
Expenses net of all reductions | .70% | .70% | .74% | .74% | .70% |
Net investment income (loss) | 1.04% F | .44% G | .57% | .90% | .46% |
Supplemental Data | | | | | |
Net assets, end of period (000 omitted) | $ 77,432 | $ 90,459 | $ 76,479 | $ 52,414 | $ 131,665 |
Portfolio turnover rate E | 42% | 89% | 172% | 138% | 197% |
A Total returns do not reflect charges attributable to your insurance company's separate account. Inclusion of these charges would reduce the total returns shown.
B Total returns would have been lower if certain expenses had not been reduced during the applicable periods shown.
C Calculated based on average shares outstanding during the period.
D Fees and expenses of any underlying Fidelity Central Funds are not included in the Fund's expense ratio. The Fund indirectly bears its proportionate share of the expenses of any underlying Fidelity Central Funds.
E Amount does not include the portfolio activity of any underlying Fidelity Central Funds.
F Investment income per share reflects a special dividend which amounted to $.05 per share. Excluding the special dividend, the ratio of net investment income (loss) to average net assets would have been .49%.
G Investment income per share reflects a special dividend which amounted to $.01 per share. Excluding the special dividend, the ratio of net investment income (loss) to average net assets would have been .28%.
H Expense ratios reflect operating expenses of the class. Expenses before reductions do not reflect amounts reimbursed by the investment adviser or reductions from brokerage service arrangements or reductions from other expense offset arrangements and do not represent the amount paid by the class during periods when reimbursements or reductions occur. Expenses net of fee waivers reflect expenses after reimbursement by the investment adviser but prior to reductions from brokerage service arrangements or other expense offset arrangements. Expenses net of all reductions represent the net expenses paid by the class.
I Total distributions of $2.19 per share is comprised of distributions from net investment income of $.067 and distributions from net realized gain of $2.125 per share.
Financial Highlights - Service Class
Years ended December 31, | 2011 | 2010 | 2009 | 2008 | 2007 |
Selected Per-Share Data | | | | | |
Net asset value, beginning of period | $ 9.71 | $ 7.71 | $ 4.92 | $ 12.54 | $ 13.42 |
Income from Investment Operations | | | | | |
Net investment income (loss) C | .09 F | .03 G | .03 | .07 | .05 |
Net realized and unrealized gain (loss) | (.95) | 2.01 | 2.79 | (5.51) | .71 |
Total from investment operations | (.86) | 2.04 | 2.82 | (5.44) | .76 |
Distributions from net investment income | (.09) | (.04) | (.02) | (.06) | (.12) |
Distributions from net realized gain | - | - | - | (2.13) | (1.52) |
Tax return of capital | - | - | (.01) | - | - |
Total distributions | (.09) | (.04) | (.03) | (2.18) I | (1.64) |
Net asset value, end of period | $ 8.76 | $ 9.71 | $ 7.71 | $ 4.92 | $ 12.54 |
Total Return A,B | (8.85)% | 26.45% | 57.40% | (51.17)% | 5.60% |
Ratios to Average Net Assets D,H | | | | | |
Expenses before reductions | .80% | .81% | .84% | .83% | .80% |
Expenses net of fee waivers, if any | .80% | .80% | .84% | .83% | .80% |
Expenses net of all reductions | .79% | .79% | 83% | .83% | .79% |
Net investment income (loss) | .94% F | .35% G | .48% | .80% | .36% |
Supplemental Data | | | | | |
Net assets, end of period (000 omitted) | $ 27,695 | $ 35,780 | $ 33,533 | $ 21,294 | $ 63,242 |
Portfolio turnover rate E | 42% | 89% | 172% | 138% | 197% |
A Total returns do not reflect charges attributable to your insurance company's separate account. Inclusion of these charges would reduce the total returns shown.
B Total returns would have been lower if certain expenses had not been reduced during the applicable periods shown.
C Calculated based on average shares outstanding during the period.
D Fees and expenses of any underlying Fidelity Central Funds are not included in the Fund's expense ratio. The Fund indirectly bears its proportionate share of the expenses of any underlying Fidelity Central Funds.
E Amount does not include the portfolio activity of any underlying Fidelity Central Funds.
F Investment income per share reflects a special dividend which amounted to $.05 per share. Excluding the special dividend, the ratio of net investment income (loss) to average net assets would have been .40%.
G Investment income per share reflects a special dividend which amounted to $.01 per share. Excluding the special dividend, the ratio of net investment income (loss) to average net assets would have been .19%.
H Expense ratios reflect operating expenses of the class. Expenses before reductions do not reflect amounts reimbursed by the investment adviser or reductions from brokerage service arrangements or reductions from other expense offset arrangements and do not represent the amount paid by the class during periods when reimbursements or reductions occur. Expenses net of fee waivers reflect expenses after reimbursement by the investment adviser but prior to reductions from brokerage service arrangements or other expense offset arrangements. Expenses net of all reductions represent the net expenses paid by the class.
I Total distributions of $2.18 per share is comprised of distributions from net investment income of $.057 and distributions from net realized gain of $2.125 per share.
See accompanying notes which are an integral part of the financial statements.
Annual Report
Financial Highlights - Service Class 2
Years ended December 31, | 2011 | 2010 | 2009 | 2008 | 2007 |
Selected Per-Share Data | | | | | |
Net asset value, beginning of period | $ 9.79 | $ 7.77 | $ 4.96 | $ 12.62 | $ 13.49 |
Income from Investment Operations | | | | | |
Net investment income (loss) C | .08 F | .02 G | .02 | .05 | .03 |
Net realized and unrealized gain (loss) | (.97) | 2.03 | 2.81 | (5.54) | .70 |
Total from investment operations | (.89) | 2.05 | 2.83 | (5.49) | .73 |
Distributions from net investment income | (.07) | (.03) | (.01) | (.05) | (.08) |
Distributions from net realized gain | - | - | - | (2.13) | (1.52) |
Tax return of capital | - | - | (.01) | - | - |
Total distributions | (.07) | (.03) | (.02) | (2.17) I | (1.60) |
Net asset value, end of period | $ 8.83 | $ 9.79 | $ 7.77 | $ 4.96 | $ 12.62 |
Total Return A,B | (9.04)% | 26.34% | 57.15% | (51.28)% | 5.36% |
Ratios to Average Net Assets D,H | | | | | |
Expenses before reductions | .95% | .96% | .99% | .99% | .95% |
Expenses net of fee waivers, if any | .95% | .95% | .99% | .99% | .95% |
Expenses net of all reductions | .94% | .94% | 98% | 98% | .95% |
Net investment income (loss) | .79% F | .20% G | .33% | .65% | .21% |
Supplemental Data | | | | | |
Net assets, end of period (000 omitted) | $ 122,641 | $ 162,391 | $ 139,458 | $ 85,974 | $ 216,166 |
Portfolio turnover rate E | 42% | 89% | 172% | 138% | 197% |
A Total returns do not reflect charges attributable to your insurance company's separate account. Inclusion of these charges would reduce the total returns shown.
B Total returns would have been lower if certain expenses had not been reduced during the applicable periods shown.
C Calculated based on average shares outstanding during the period.
D Fees and expenses of any underlying Fidelity Central Funds are not included in the Fund's expense ratio. The Fund indirectly bears its proportionate share of the expenses of any underlying Fidelity Central Funds.
E Amount does not include the portfolio activity of any underlying Fidelity Central Funds.
F Investment income per share reflects a special dividend which amounted to $.05 per share. Excluding the special dividend, the ratio of net investment income (loss) to average net assets would have been .25%.
G Investment income per share reflects a special dividend which amounted to $.01 per share. Excluding the special dividend, the ratio of net investment income (loss) to average net assets would have been .04%.
H Expense ratios reflect operating expenses of the class. Expenses before reductions do not reflect amounts reimbursed by the investment adviser or reductions from brokerage service arrangements or reductions from other expense offset arrangements and do not represent the amount paid by the class during periods when reimbursements or reductions occur. Expenses net of fee waivers reflect expenses after reimbursement by the investment adviser but prior to reductions from brokerage service arrangements or other expense offset arrangements. Expenses net of all reductions represent the net expenses paid by the class.
I Total distributions of $2.17 per share is comprised of distributions from net investment income of $.045 and distributions from net realized gain of $2.125 per share.
Financial Highlights - Investor Class
Years ended December 31, | 2011 | 2010 | 2009 | 2008 | 2007 |
Selected Per-Share Data | | | | | |
Net asset value, beginning of period | $ 9.70 | $ 7.70 | $ 4.91 | $ 12.53 | $ 13.43 |
Income from Investment Operations | | | | | |
Net investment income (loss) C | .09 F | .03 G | .03 | .07 | .05 |
Net realized and unrealized gain (loss) | (.96) | 2.01 | 2.79 | (5.51) | .70 |
Total from investment operations | (.87) | 2.04 | 2.82 | (5.44) | .75 |
Distributions from net investment income | (.09) | (.04) | (.02) | (.06) | (.13) |
Distributions from net realized gain | - | - | - | (2.13) | (1.52) |
Tax return of capital | - | - | (.01) | - | - |
Total distributions | (.09) | (.04) | (.03) | (2.18) I | (1.65) |
Net asset value, end of period | $ 8.74 | $ 9.70 | $ 7.70 | $ 4.91 | $ 12.53 |
Total Return A,B | (8.92)% | 26.51% | 57.51% | (51.20)% | 5.53% |
Ratios to Average Net Assets D,H | | | | | |
Expenses before reductions | .78% | .80% | .84% | .83% | .82% |
Expenses net of fee waivers, if any | .78% | .79% | .84% | .83% | .82% |
Expenses net of all reductions | .78% | .78% | .83% | 83% | .81% |
Net investment income (loss) | .96% F | .36% G | .48% | .81% | .35% |
Supplemental Data | | | | | |
Net assets, end of period (000 omitted) | $ 55,809 | $ 62,416 | $ 49,586 | $ 29,121 | $ 70,472 |
Portfolio turnover rate E | 42% | 89% | 172% | 138% | 197% |
A Total returns do not reflect charges attributable to your insurance company's separate account. Inclusion of these charges would reduce the total returns shown.
B Total returns would have been lower if certain expenses had not been reduced during the applicable periods shown.
C Calculated based on average shares outstanding during the period.
D Fees and expenses of any underlying Fidelity Central Funds are not included in the Fund's expense ratio. The Fund indirectly bears its proportionate share of the expenses of any underlying Fidelity Central Funds.
E Amount does not include the portfolio activity of any underlying Fidelity Central Funds.
F Investment income per share reflects a special dividend which amounted to $.05 per share. Excluding the special dividend, the ratio of net investment income (loss) to average net assets would have been .41%.
G Investment income per share reflects a special dividend which amounted to $.01 per share. Excluding the special dividend, the ratio of net investment income (loss) to average net assets would have been .20%.
H Expense ratios reflect operating expenses of the class. Expenses before reductions do not reflect amounts reimbursed by the investment adviser or reductions from brokerage service arrangements or reductions from other expense offset arrangements and do not represent the amount paid by the class during periods when reimbursements or reductions occur. Expenses net of fee waivers reflect expenses after reimbursement by the investment adviser but prior to reductions from brokerage service arrangements or other expense offset arrangements. Expenses net of all reductions represent the net expenses paid by the class.
I Total distributions of $2.18 per share is comprised of distributions from net investment income of $.059 and distributions from net realized gain of $2.125 per share.
See accompanying notes which are an integral part of the financial statements.
Annual Report
Notes to Financial Statements
For the period ended December 31, 2011
1. Organization.
VIP Value Strategies Portfolio (the Fund) is a fund of Variable Insurance Products Fund III (the Trust) and is authorized to issue an unlimited number of shares. The Trust is registered under the Investment Company Act of 1940, as amended (the 1940 Act), as an open-end management investment company organized as a Massachusetts business trust. Shares of the Fund may only be purchased by insurance companies for the purpose of funding variable annuity or variable life insurance contracts. The Fund offers the following classes of shares: Initial Class shares, Service Class shares, Service Class 2 shares and Investor Class shares. All classes have equal rights and voting privileges, except for matters affecting a single class. Investment income, realized and unrealized capital gains and losses, the common expenses of the Fund, and certain fund-level expense reductions, if any, are allocated on a pro-rata basis to each class based on the relative net assets of each class to the total net assets of the Fund. Each class differs with respect to transfer agent and distribution and service plan fees incurred. Certain expense reductions may also differ by class.
2. Investments in Fidelity Central Funds.
The Fund invests in Fidelity Central Funds, which are open-end investment companies available only to other investment companies and accounts managed by Fidelity Management & Research Company (FMR) and its affiliates. The Fund's Schedule of Investments lists each of the Fidelity Central Funds held as of period end, if any, as an investment of the Fund, but do not include the underlying holdings of each Fidelity Central Fund. As an Investing Fund, the Fund indirectly bears its proportionate share of the expenses of the underlying Fidelity Central Funds.
The Money Market Central Funds seek preservation of capital and current income and are managed by Fidelity Investments Money Management, Inc. (FIMM), an affiliate of FMR.
A complete unaudited list of holdings for each Fidelity Central Fund is available upon request or at the Securities and Exchange Commission (the SEC) web site at www.sec.gov. In addition, the financial statements of the Fidelity Central Funds, which are not covered by the Fund's Report of Independent Registered Public Accounting Firm, are available on the SEC web site or upon request.
3. Significant Accounting Policies.
The financial statements have been prepared in conformity with accounting principles generally accepted in the United States of America (GAAP), which require management to make certain estimates and assumptions at the date of the financial statements. Actual results could differ from those estimates. Subsequent events, if any, through the date that the financial statements were issued have been evaluated in the preparation of the financial statements. The following summarizes the significant accounting policies of the Fund:
Security Valuation. Investments are valued as of 4:00 p.m. Eastern time on the last calendar day of the period. The Fund uses independent pricing services approved by the Board of Trustees to value its investments. When current market prices or quotations are not readily available or reliable, valuations may be determined in good faith in accordance with procedures adopted by the Board of Trustees. Factors used in determining value may include market or security specific events, changes in interest rates and credit quality. The frequency with which these procedures are used cannot be predicted and they may be utilized to a significant extent. The value used for net asset value (NAV) calculation under these procedures may differ from published prices for the same securities.
The Fund categorizes the inputs to valuation techniques used to value its investments into a disclosure hierarchy consisting of three levels as shown below:
Level 1 - quoted prices in active markets for identical investments
Level 2 - other significant observable inputs (including quoted prices for similar investments, interest rates, prepayment speeds, etc.)
Level 3 - unobservable inputs (including the Fund's own assumptions based on the best information available)
Changes in valuation techniques may result in transfers in or out of an assigned level within the disclosure hierarchy. The aggregate value of investments by input level, as of December 31, 2011, is included at the end of the Fund's Schedule of Investments. Valuation techniques used to value the Fund's investments by major category are as follows:
Equity securities, including restricted securities, for which market quotations are readily available, are valued at the last reported sale price or official closing price as reported by an independent pricing service on the primary market or exchange on which they are traded and are categorized as Level 1 in the hierarchy. In the event there were no sales during the day or closing prices are not available, securities are valued at the last quoted bid price or may be valued using the last available price and are generally categorized as Level 2 in the hierarchy. For foreign equity securities, when significant market or security specific events arise, comparisons to the valuation of American Depositary Receipts (ADRs), futures contracts, Exchange-traded funds (ETFs) and certain indexes as well as quoted prices for similar securities are used and are categorized as Level 2 in the hierarchy in these circumstances. Utilizing these techniques may result in transfers between Level 1 and Level 2. For restricted equity securities and private placements where observable inputs are limited, assumptions about market activity and risk are used and are categorized as Level 3 in the hierarchy.
Annual Report
Notes to Financial Statements - continued
3. Significant Accounting Policies - continued
Security Valuation - continued
Debt securities, including restricted securities, are valued based on evaluated prices received from independent pricing services or from dealers who make markets in such securities. For corporate bonds, pricing services utilize matrix pricing which considers yield or price of bonds of comparable quality, coupon, maturity and type as well as dealer supplied prices and are generally categorized as Level 2 in the hierarchy. When independent prices are unavailable or unreliable, debt securities may be valued utilizing pricing matrices which consider similar factors that would be used by independent pricing services. These are generally categorized as Level 2 in the hierarchy but may be Level 3 depending on the circumstances.
Investments in open-end mutual funds, including the Fidelity Central Funds, are valued at their closing net asset value each business day and are categorized as Level 1 in the hierarchy.
New Accounting Pronouncements. In May 2011, the Financial Accounting Standards Board issued Accounting Standard Update No. 2011-04, Fair Value Measurement (Topic 820) - Amendments to Achieve Common Fair Value Measurement and Disclosure Requirements in U.S. GAAP and IFRSs. The update is effective during interim and annual periods beginning after December 15, 2011 and will result in additional disclosure for transfers between levels as well as expanded disclosure for securities categorized as Level 3 under the fair value hierarchy.
In December 2011, the Financial Accounting Standards Board issued Accounting Standard Update No. 2011-11, Disclosures about Offsetting Assets and Liabilities. The update creates new disclosure requirements requiring entities to disclose both gross and net information for derivatives and other financial instruments that are either offset in the Statement of Assets and Liabilities or subject to an enforceable master netting arrangement or similar agreement. The disclosure requirements are effective for annual reporting periods beginning on or after January 1, 2013. Management is currently evaluating the impact of the update's adoption on the Fund's financial statement disclosures.
Foreign Currency. The Fund may use foreign currency contracts to facilitate transactions in foreign-denominated securities. Gains and losses from these transactions may arise from changes in the value of the foreign currency or if the counterparties do not perform under the contracts' terms.
Foreign-denominated assets, including investment securities, and liabilities are translated into U.S. dollars at the exchange rate at period end. Purchases and sales of investment securities, income and dividends received and expenses denominated in foreign currencies are translated into U.S. dollars at the exchange rate in effect on the transaction date.
The effects of exchange rate fluctuations on investments are included with the net realized and unrealized gain (loss) on investment securities. Other foreign currency transactions resulting in realized and unrealized gain (loss) are disclosed separately.
Investment Transactions and Income. For financial reporting purposes, the Fund's investment holdings and NAV include trades executed through the end of the last business day of the period. The NAV per share for processing shareholder transactions is calculated as of the close of business of the New York Stock Exchange (NYSE), normally 4:00 p.m. Eastern time and includes trades executed through the end of the prior business day. Gains and losses on securities sold are determined on the basis of identified cost and may include proceeds received from litigation. Dividend income is recorded on the ex-dividend date, except for certain dividends from foreign securities where the ex-dividend date may have passed, which are recorded as soon as the Fund is informed of the ex-dividend date. Non-cash dividends included in dividend income, if any, are recorded at the fair market value of the securities received. Distributions received on securities that represent a return of capital or capital gain are recorded as a reduction of cost of investments and/or as a realized gain. The Fund estimates the components of distributions received that may be considered return of capital distributions or capital gain distributions. Large, non-recurring dividends recognized by the Fund are presented separately on the Statement of Operations as "Special Dividends" and the impact of these dividends is presented in the Financial Highlights. Interest income and distributions from the Fidelity Central Funds are accrued as earned. Interest income includes coupon interest and amortization of premium and accretion of discount on debt securities. Investment income is recorded net of foreign taxes withheld where recovery of such taxes is uncertain.
Expenses. Expenses directly attributable to a fund are charged to that fund. Expenses attributable to more than one fund are allocated among the respective funds on the basis of relative net assets or other appropriate methods. Expense estimates are accrued in the period to which they relate and adjustments are made when actual amounts are known.
Income Tax Information and Distributions to Shareholders. Each year, the Fund intends to qualify as a regulated investment company, including distributing substantially all of its taxable income and realized gains under Subchapter M of the Internal Revenue Code. As a result, no provision for income taxes is required. As of December 31, 2011, the Fund did not have any unrecognized tax benefits in the financial statements; nor is the Fund aware of any tax positions for which it is reasonably possible that the total amounts of unrecognized tax benefits will significantly change in the next twelve months. The Fund files a U.S. federal tax return, in addition to state and local tax returns as required. A fund's tax returns are subject to examination by the Internal Revenue Service (IRS) for a period of three fiscal years. State and local tax returns may be subject to examination for an additional fiscal year depending on the jurisdiction. Foreign taxes are provided for based on the Fund's understanding of the tax rules and rates that exist in the foreign markets in which it invests.
Annual Report
3. Significant Accounting Policies - continued
Income Tax Information and Distributions to Shareholders - continued
Distributions are declared and recorded on the ex-dividend date. Income dividends and capital gain distributions are declared separately for each class. Income and capital gain distributions are determined in accordance with income tax regulations, which may differ from GAAP.
Capital accounts within the financial statements are adjusted for permanent book-tax differences. These adjustments have no impact on net assets or the results of operations. Temporary book-tax differences will reverse in a subsequent period.
Book-tax differences are primarily due to foreign currency transactions, market discount, partnerships, capital loss carryforwards and losses deferred due to wash sales.
The federal tax cost of investment securities and unrealized appreciation (depreciation) as of period end were as follows:
Gross unrealized appreciation | $ 39,225,470 |
Gross unrealized depreciation | (32,777,065) |
Net unrealized appreciation (depreciation) on securities and other investments | $ 6,448,405 |
| |
Tax Cost | $ 284,409,785 |
The tax-based components of distributable earnings as of period end were as follows:
Capital loss carryforward | $ (96,166,099) |
Net unrealized appreciation (depreciation) | $ 6,447,909 |
Capital loss carryforwards are only available to offset future capital gains of the Fund to the extent provided by regulations and may be limited. Under the Regulated Investment Company Modernization Act of 2010 (the Act), the Fund is permitted to carry forward capital losses incurred in taxable years beginning after December 22, 2010 for an unlimited period and such capital losses are required to be used prior to any losses that expire. Capital loss carryforwards were as follows:
Fiscal year of expiration | |
2016 | $ (45,722,325) |
2017 | (50,443,774) |
Total with expiration | $ (96,166,099) |
The tax character of distributions paid was as follows:
| December 31, 2011 | December 31, 2010 |
Ordinary Income | $ 2,744,535 | $ 1,278,453 |
4. Operating Policies.
Restricted Securities. The Fund may invest in securities that are subject to legal or contractual restrictions on resale. These securities generally may be resold in transactions exempt from registration or to the public if the securities are registered. Disposal of these securities may involve time-consuming negotiations and expense, and prompt sale at an acceptable price may be difficult. Information regarding restricted securities is included at the end of the Fund's Schedule of Investments.
5. Purchases and Sales of Investments.
Purchases and sales of securities, other than short-term securities, aggregated $134,432,554 and $167,646,880, respectively.
6. Fees and Other Transactions with Affiliates.
Management Fee. FMR and its affiliates provide the Fund with investment management related services for which the Fund pays a monthly management fee. The management fee is the sum of an individual fund fee rate that is based on an annual rate of .30% of the Fund's average net assets and an annualized group fee rate that averaged .26% during the period. The group fee rate is based upon the average net assets of all the mutual funds advised by FMR. The group fee rate decreases as assets under management increase and increases as assets under management decrease. For the period, the total annual management fee rate was .56% of the Fund's average net assets.
Annual Report
Notes to Financial Statements - continued
6. Fees and Other Transactions with Affiliates - continued
Distribution and Service Plan Fees. In accordance with Rule 12b-1 of the 1940 Act, the Fund has adopted separate 12b-1 Plans for each Service Class of shares. Each Service Class pays Fidelity Distributors Corporation (FDC), an affiliate of FMR, a service fee. For the period, the service fee is based on an annual rate of .10% of Service Class' average net assets and .25% of Service Class 2's average net assets.
For the period, total fees, all of which were re-allowed to insurance companies for the distribution of shares and providing shareholder support services were as follows:
Service Class | $ 30,616 |
Service Class 2 | 378,734 |
| $ 409,350 |
Transfer Agent Fees. Fidelity Investments Institutional Operations Company, Inc. (FIIOC), an affiliate of FMR, is the Fund's transfer, dividend disbursing, and shareholder servicing agent. FIIOC receives an asset-based fee with respect to each class. Each class (with the exception of Investor Class) pays a transfer agent fee, excluding out of pocket expenses, equal to an annual rate of .07% of average net assets. Investor Class pays a monthly asset-based transfer agent fee of .15% of average net assets. In addition, FIIOC receives an asset-based fee of .0045% of average net assets for typesetting, printing and mailing of shareholder reports, except proxy statements. FIIOC voluntarily agreed to waive this fee for the period August 1, 2011 through December 31, 2011 (see Expense Reductions note). For the period, transfer agent fees for each class, including printing and out of pocket expenses, were as follows:
Initial Class | $ 67,325 |
Service Class | 22,344 |
Service Class 2 | 111,998 |
Investor Class | 97,409 |
| $ 299,076 |
Accounting and Security Lending Fees. Fidelity Service Company, Inc. (FSC), an affiliate of FMR, maintains the Fund's accounting records. The accounting fee is based on the level of average net assets for the month. Under a separate contract, FSC administers the security lending program. The security lending fee is based on the number and duration of lending transactions.
Brokerage Commissions. The Fund placed a portion of its portfolio transactions with brokerage firms which are affiliates of the investment adviser. The commissions paid to these affiliated firms were $6,298 for the period.
7. Committed Line of Credit.
The Fund participates with other funds managed by FMR or an affiliate in a $4.0 billion credit facility (the "line of credit") to be utilized for temporary or emergency purposes to fund shareholder redemptions or for other short-term liquidity purposes. The Fund has agreed to pay commitment fees on its pro-rata portion of the line of credit, which amounted to $1,038 and is reflected in Miscellaneous expenses on the Statement of Operations. During the period, there were no borrowings on this line of credit.
8. Security Lending.
The Fund lends portfolio securities through a lending agent from time to time in order to earn additional income. For equity securities, a lending agent is used and may loan securities to certain qualified borrowers, including Fidelity Capital Markets (FCM), a broker-dealer affiliated with the Fund. On the settlement date of the loan, the Fund receives collateral (in the form of U.S. Treasury obligations, letters of credit and/or cash) against the loaned securities and maintains collateral in an amount not less than 100% of the market value of the loaned securities during the period of the loan. The market value of the loaned securities is determined at the close of business of the Fund and any additional required collateral is delivered to the Fund on the next business day. If the borrower defaults on its obligation to return the securities loaned because of insolvency or other reasons, a fund could experience delays and costs in recovering the securities loaned or in gaining access to the collateral. Any cash collateral received is invested in the Fidelity Securities Lending Cash Central Fund. The value of loaned securities and cash collateral at period end are disclosed on the Fund's Statement of Assets and Liabilities. Security lending income represents the income earned on investing cash collateral, less rebates paid to borrowers and any lending agent fees associated with the loan, plus any premium payments received for lending certain types of securities. Security lending income is presented in the Statement of Operations as a component of income from Fidelity Central Funds. Total security lending income during the period amounted to $114,616. During the period, there were no securities loaned to FCM.
Annual Report
9. Expense Reductions.
FMR or its affiliates agreed to waive certain fees during the period as noted in the table below.
Initial Class | $ 1,368 |
Service Class | 494 |
Service Class 2 | 2,447 |
Investor Class | 980 |
| $ 5,289 |
Many of the brokers with whom FMR places trades on behalf of the Fund provided services to the Fund in addition to trade execution. These services included payments of certain expenses on behalf of the Fund totaling $11,200 for the period. In addition, through arrangements with the Fund's custodian, credits realized as a result of uninvested cash balances were used to reduce the Fund's expenses. During the period, these credits reduced the Fund's custody expenses by $156.
10. Distributions to Shareholders.
Distributions to shareholders of each class were as follows:
Years ended December 31, | 2011 | 2010 |
From net investment income | | |
Initial Class | $ 866,164 | $ 442,492 |
Service Class | 245,784 | 142,647 |
Service Class 2 | 1,048,717 | 431,373 |
Investor Class | 583,870 | 261,941 |
Total | $ 2,744,535 | $ 1,278,453 |
11. Share Transactions.
Transactions for each class of shares were as follows:
| Shares | Dollars |
Years ended December 31, | 2011 | 2010 | 2011 | 2010 |
Initial Class | | | | |
Shares sold | 1,520,846 | 2,501,187 | $ 14,287,631 | $ 21,250,203 |
Reinvestment of distributions | 101,902 | 46,141 | 866,164 | 442,492 |
Shares redeemed | (2,091,817) | (3,150,871) | (20,064,606) | (26,092,333) |
Net increase (decrease) | (469,069) | (603,543) | $ (4,910,811) | $ (4,399,638) |
Service Class | | | | |
Shares sold | 607,385 | 1,049,158 | $ 5,549,249 | $ 9,061,518 |
Reinvestment of distributions | 28,984 | 14,906 | 245,784 | 142,647 |
Shares redeemed | (1,158,368) | (1,729,159) | (11,308,393) | (14,276,958) |
Net increase (decrease) | (521,999) | (665,095) | $ (5,513,360) | $ (5,072,793) |
Service Class 2 | | | | |
Shares sold | 3,076,448 | 5,715,026 | $ 29,814,169 | $ 48,723,280 |
Reinvestment of distributions | 122,514 | 44,702 | 1,048,717 | 431,373 |
Shares redeemed | (5,899,060) | (7,112,873) | (55,837,837) | (59,410,945) |
Net increase (decrease) | (2,700,098) | (1,353,145) | $ (24,974,951) | $ (10,256,292) |
Investor Class | | | | |
Shares sold | 1,794,080 | 2,535,356 | $ 16,949,297 | $ 21,780,728 |
Reinvestment of distributions | 68,934 | 27,400 | 583,870 | 261,941 |
Shares redeemed | (1,915,339) | (2,566,473) | (17,989,330) | (21,112,448) |
Net increase (decrease) | (52,325) | (3,717) | $ (456,163) | $ 930,221 |
Annual Report
Notes to Financial Statements - continued
12. Other.
The Fund's organizational documents provide former and current trustees and officers with a limited indemnification against liabilities arising in connection with the performance of their duties to the Fund. In the normal course of business, the Fund may also enter into contracts that provide general indemnifications. The Fund's maximum exposure under these arrangements is unknown as this would be dependent on future claims that may be made against the Fund. The risk of material loss from such claims is considered remote.
At the end of the period, FMR or its affiliates were the owners of record of 33% of the total outstanding shares of the Fund and two otherwise unaffiliated shareholders were the owners of record of 39% of the total outstanding shares of the Fund.
Annual Report
Report of Independent Registered Public Accounting Firm
To the Trustees of Variable Insurance Products Fund III and Shareholders of VIP Value Strategies Portfolio:
We have audited the accompanying statement of assets and liabilities of VIP Value Strategies Portfolio (the Fund), a fund of Variable Insurance Products Fund III, including the schedule of investments, as of December 31, 2011, and the related statement of operations for the year then ended, the statement of changes in net assets for each of the two years in the period then ended, and the financial highlights for each of the five years in the period then ended. These financial statements and financial highlights are the responsibility of the Fund's management. Our responsibility is to express an opinion on these financial statements and financial highlights based on our audits.
We conducted our audits in accordance with the standards of the Public Company Accounting Oversight Board (United States). Those standards require that we plan and perform the audit to obtain reasonable assurance about whether the financial statements and financial highlights are free of material misstatement. The Fund is not required to have, nor were we engaged to perform, an audit of its internal control over financial reporting. Our audits included consideration of internal control over financial reporting as a basis for designing audit procedures that are appropriate in the circumstances, but not for the purpose of expressing an opinion on the effectiveness of the Fund's internal control over financial reporting. Accordingly, we express no such opinion. An audit also includes examining, on a test basis, evidence supporting the amounts and disclosures in the financial statements, assessing the accounting principles used and significant estimates made by management, as well as evaluating the overall financial statement presentation. Our procedures included confirmation of securities owned as of December 31, 2011, by correspondence with the custodians and brokers. We believe that our audits provide a reasonable basis for our opinion.
In our opinion, the financial statements and financial highlights referred to above present fairly, in all material respects, the financial position of VIP Value Strategies Portfolio as of December 31, 2011, the results of its operations for the year then ended, the changes in its net assets for each of the two years in the period then ended, and the financial highlights for each of the five years in the period then ended, in conformity with accounting principles generally accepted in the United States of America.
DELOITTE & TOUCHE LLP
Boston, Massachusetts
February 10, 2012
Annual Report
The Trustees, Members of the Advisory Board, and executive officers of the trust and fund, as applicable, are listed below. The Board of Trustees governs the fund and is responsible for protecting the interests of shareholders. The Trustees are experienced executives who meet periodically throughout the year to oversee the fund's activities, review contractual arrangements with companies that provide services to the fund, oversee management of the risks associated with such activities and contractual arrangements, and review the fund's performance. Except for James C. Curvey, each of the Trustees oversees 226 funds advised by FMR or an affiliate. Mr. Curvey oversees 429 funds advised by FMR or an affiliate.
The Trustees hold office without limit in time except that (a) any Trustee may resign; (b) any Trustee may be removed by written instrument, signed by at least two-thirds of the number of Trustees prior to such removal; (c) any Trustee who requests to be retired or who has become incapacitated by illness or injury may be retired by written instrument signed by a majority of the other Trustees; and (d) any Trustee may be removed at any special meeting of shareholders by a two-thirds vote of the outstanding voting securities of the trust. Each Trustee who is not an interested person (as defined in the 1940 Act) (Independent Trustee), shall retire not later than the last day of the calendar year in which his or her 75th birthday occurs. The Independent Trustees may waive this mandatory retirement age policy with respect to individual Trustees. The executive officers and Advisory Board Members hold office without limit in time, except that any officer and Advisory Board Member may resign or may be removed by a vote of a majority of the Trustees at any regular meeting or any special meeting of the Trustees. Except as indicated, each individual has held the office shown or other offices in the same company for the past five years.
Experience, Skills, Attributes, and Qualifications of the Fund's Trustees. The Governance and Nominating Committee has adopted a statement of policy that describes the experience, qualifications, attributes, and skills that are necessary and desirable for potential Independent Trustee candidates (Statement of Policy). The Board believes that each Trustee satisfied at the time he or she was initially elected or appointed a Trustee, and continues to satisfy, the standards contemplated by the Statement of Policy. The Governance and Nominating Committee also engages professional search firms to help identify potential Independent Trustee candidates who have the experience, qualifications, attributes, and skills consistent with the Statement of Policy. From time to time, additional criteria based on the composition and skills of the current Independent Trustees, as well as experience or skills that may be appropriate in light of future changes to board composition, business conditions, and regulatory or other developments, have also been considered by the professional search firms and the Governance and Nominating Committee. In addition, the Board takes into account the Trustees' commitment and participation in Board and committee meetings, as well as their leadership of standing and ad hoc committees throughout their tenure.
In determining that a particular Trustee was and continues to be qualified to serve as a Trustee, the Board has considered a variety of criteria, none of which, in isolation, was controlling. The Board believes that, collectively, the Trustees have balanced and diverse experience, qualifications, attributes, and skills, which allow the Board to operate effectively in governing the fund and protecting the interests of shareholders. Information about the specific experience, skills, attributes, and qualifications of each Trustee, which in each case led to the Board's conclusion that the Trustee should serve (or continue to serve) as a trustee of the fund, is provided below.
Board Structure and Oversight Function. James C. Curvey is an interested person (as defined in the 1940 Act) and currently serves as Acting Chairman. The Trustees have determined that an interested Chairman is appropriate and benefits shareholders because an interested Chairman has a personal and professional stake in the quality and continuity of services provided to the fund. Independent Trustees exercise their informed business judgment to appoint an individual of their choosing to serve as Chairman, regardless of whether the Trustee happens to be independent or a member of management. The Independent Trustees have determined that they can act independently and effectively without having an Independent Trustee serve as Chairman and that a key structural component for assuring that they are in a position to do so is for the Independent Trustees to constitute a substantial majority for the Board. The Independent Trustees also regularly meet in executive session. Ned C. Lautenbach serves as Chairman of the Independent Trustees and as such (i) acts as a liaison between the Independent Trustees and management with respect to matters important to the Independent Trustees and (ii) with management prepares agendas for Board meetings.
Fidelity funds are overseen by different Boards of Trustees. The fund's Board oversees Fidelity's equity and high income funds and another Board oversees Fidelity's investment-grade bond, money market, and asset allocation funds. The asset allocation funds may invest in Fidelity funds overseen by the fund's Board. The use of separate Boards, each with its own committee structure, allows the Trustees of each group of Fidelity funds to focus on the unique issues of the funds they oversee, including common research, investment, and operational issues. On occasion, the separate Boards establish joint committees to address issues of overlapping consequences for the Fidelity funds overseen by each Board.
The Trustees operate using a system of committees to facilitate the timely and efficient consideration of all matters of importance to the Trustees, the fund, and fund shareholders and to facilitate compliance with legal and regulatory requirements and oversight of the fund's activities and associated risks. The Board, acting through its committees, has charged FMR and its affiliates with (i) identifying events or circumstances the occurrence of which could have demonstrably adverse effects on the fund's business and/or reputation; (ii) implementing processes and controls to lessen the possibility that such events or circumstances occur or to mitigate the effects of such events or circumstances if they do occur; and (iii) creating and maintaining a system designed to evaluate continuously business and market conditions in order to facilitate the identification and implementation processes described in (i) and (ii) above. Because the day-to-day operations and activities of the fund are carried out by or through FMR, its affiliates and other service providers, the fund's exposure to risks is mitigated but not eliminated by the processes overseen by the Trustees. While each of the Board's committees has responsibility for overseeing different aspects of the fund's activities, oversight is exercised primarily through the Operations, Audit, and Compliance Committees. In addition, the Independent Trustees have worked with FMR to enhance the Board's oversight of investment and financial risks, legal and regulatory risks, technology risks, and operational risks, including the development of additional risk reporting to the Board. For example, a working group comprised of Independent Trustees and FMR has worked and continues to work to review the Fidelity funds' valuation-related activities, reporting and risk management. Appropriate personnel, including but not limited to the fund's Chief Compliance Officer (CCO), FMR's internal auditor, the independent accountants, the fund's Treasurer and portfolio management personnel, make periodic reports to the Board's committees, as appropriate, including an annual review of FMR's risk management program for the Fidelity funds. The responsibilities of each standing committee, including their oversight responsibilities, are described further under "Standing Committees of the Fund's Trustees."
Annual Report
The fund's Statement of Additional Information (SAI) includes more information about the Trustees. To request a free copy, call Fidelity at 1-877-208-0098.
Interested Trustees*:
Correspondence intended for each Trustee who is an interested person may be sent to Fidelity Investments, 82 Devonshire Street, Boston, Massachusetts 02109.
Name, Age; Principal Occupations and Other Relevant Experience+ |
James C. Curvey (76) |
| Year of Election or Appointment: 2007 Mr. Curvey is Trustee and Acting Chairman of the Board of Trustees of certain Trusts. Mr. Curvey also serves as Trustee (2007-present) of other investment companies advised by FMR. Mr. Curvey is a Director of Fidelity Investments Money Management, Inc. (2009-present), Director of Fidelity Research & Analysis Co. (2009-present) and Director of FMR and FMR Co., Inc. (2007-present). Mr. Curvey is also Vice Chairman (2007-present) and Director of FMR LLC. In addition, Mr. Curvey serves as an Overseer for the Boston Symphony Orchestra and a member of the Trustees of Villanova University. Previously, Mr. Curvey was the Vice Chairman (2006-2007) and Director (2000-2007) of FMR Corp. |
Ronald P. O'Hanley (54) |
| Year of Election or Appointment: 2011 Mr. O'Hanley is Director of FMR Co., Inc. (2010-present), Director of Fidelity Investments Money Management, Inc. (2010-present), Director of Fidelity Research & Analysis Company (2010-present), President of Fidelity Asset Management and Corporate Services and a member of Fidelity's Executive Committee (2010-present). Previously, Mr. O'Hanley served as President and Chief Executive Officer of BNY Mellon Asset Management (2007-2010). Mr. O'Hanley also served as Vice Chairman of Bank New York Mellon Corp. and a member of that firm's Executive Committee. Prior to the 2007 merger of The Bank of New York and Mellon Financial Corporation, he was Vice Chairman of Mellon Financial Corporation and President and Chief Executive Officer of Mellon Asset Management. He joined Mellon in February 1997. Mr. O'Hanley currently serves as Chairman of the Boston Public Library Foundation Board of Directors and sits on the Board of Directors of Beth Israel Deaconess Medical Center, the Board of Trustees of the Marine Biological Laboratory and the Advisory Board of the Maxwell School of Citizenship and Public Administration at Syracuse University. Mr. O'Hanley also chairs the Council on Asset Management for the Financial Services Roundtable and is a member of the Board of Directors of Institutional Investor's U.S. Institute. |
* Trustees have been determined to be "Interested Trustees" by virtue of, among other things, their affiliation with the trust or various entities under common control with FMR.
+ The information above includes each Trustee's principal occupation during the last five years and other information relating to the experience, attributes, and skills relevant to each Trustee's qualifications to serve as a Trustee, which led to the conclusion that each Trustee should serve as a Trustee for the fund.
Independent Trustees:
Correspondence intended for each Independent Trustee (that is, the Trustees other than the Interested Trustees) may be sent to Fidelity Investments, P.O. Box 55235, Boston, Massachusetts 02205-5235.
Name, Age; Principal Occupations and Other Relevant Experience+ |
Dennis J. Dirks (63) |
| Year of Election or Appointment: 2005 Prior to his retirement in May 2003, Mr. Dirks was Chief Operating Officer and a member of the Board of The Depository Trust & Clearing Corporation (DTCC). He also served as President, Chief Operating Officer, and Board member of The Depository Trust Company (DTC) and President and Board member of the National Securities Clearing Corporation (NSCC). In addition, Mr. Dirks served as Chief Executive Officer and Board member of the Government Securities Clearing Corporation, Chief Executive Officer and Board member of the Mortgage-Backed Securities Clearing Corporation, as a Trustee and a member of the Finance Committee of Manhattan College (2005-2008), and as a Trustee and a member of the Finance Committee of AHRC of Nassau County (2006-2008). Mr. Dirks is a member of the Independent Directors Council (IDC) Governing Council (2010-present) and Board of Directors for The Brookville Center for Children's Services, Inc. (2009-present). |
Alan J. Lacy (58) |
| Year of Election or Appointment: 2008 Mr. Lacy serves as Senior Adviser (2007-present) of Oak Hill Capital Partners, L.P. (private equity). Mr. Lacy also served as Chief Executive Officer (2000-2005) and Vice Chairman (2005-2006) of Sears Holdings Corporation and Sears, Roebuck and Co. (retail). In addition, Mr. Lacy serves as a member of the Board of Directors of Dave & Buster's, Inc. (restaurant and entertainment complexes, 2010-present), The Hillman Companies, Inc. (hardware wholesalers, 2010-present), and Bristol-Myers Squibb Company (global pharmaceuticals, 2007-present). Mr. Lacy is a member of the Board of Trustees of The National Parks Conservation Association (2006-present). Previously, Mr. Lacy served as Chairman of the Board of Trustees of the National Parks Conservation Association (2008-2011) and as a member of the Board of Directors for the Western Union Company (global money transfer, 2006-2011). |
Ned C. Lautenbach (67) |
| Year of Election or Appointment: 2000 Mr. Lautenbach is Chairman of the Independent Trustees of the Equity and High Income Funds (2006-present). Mr. Lautenbach currently serves as the Lead Director of the Eaton Corporation Board of Directors (diversified industrial, 1997-present). Mr. Lautenbach is also a member of the Board of Directors of the Philharmonic Center for the Arts in Naples, Florida (1999-present); a member of the Board of Trustees of Fairfield University (2005-present); and a member of the Council on Foreign Relations (1994-present). Previously, Mr. Lautenbach was a Partner/Advisory Partner at Clayton, Dubilier & Rice, LLC (private equity investment, 1998-2010), as well as a Director of Sony Corporation (2006-2007). |
Joseph Mauriello (67) |
| Year of Election or Appointment: 2008 Prior to his retirement in January 2006, Mr. Mauriello served in numerous senior management positions including Deputy Chairman and Chief Operating Officer (2004-2005), and Vice Chairman of Financial Services (2002-2004) of KPMG LLP US (professional services, 1965-2005). Mr. Mauriello currently serves as a member of the Board of Directors of XL Group plc. (global insurance and re-insurance, 2006-present) and of Arcadia Resources Inc. (health care services and products, 2007-present). Previously, Mr. Mauriello served as a Director of the Hamilton Funds of the Bank of New York (2006-2007). |
Robert W. Selander (61) |
| Year of Election or Appointment: 2011 Previously, Mr. Selander served as a Member of the Advisory Board of Fidelity's Equity and High Income Funds (2011), Executive Vice Chairman (2010), Chief Executive Officer (2009-2010), and President and Chief Executive Officer (1997-2009) of Mastercard, Inc. |
Cornelia M. Small (67) |
| Year of Election or Appointment: 2005 Ms. Small is a member of the Board of Directors of the Teagle Foundation (2009-present). Ms. Small is also a member of the Investment Committee, and Chair (2008-present) and a member of the Board of Trustees of Smith College. In addition, Ms. Small serves on the Investment Committee of the Berkshire Taconic Community Foundation (2008-present). Previously, Ms. Small served as Chairperson of the Investment Committee (2002-2008) of Smith College. In addition, Ms. Small served as Chief Investment Officer, Director of Global Equity Investments, and a member of the Board of Directors of Scudder, Stevens & Clark and Scudder Kemper Investments. |
William S. Stavropoulos (72) |
| Year of Election or Appointment: 2002 Mr. Stavropoulos is Vice Chairman of the Independent Trustees of the Equity and High Income Funds (2006-present). Mr. Stavropoulos serves as President and Founder of the Michigan Baseball Foundation, the Great Lakes Loons (2007-present). Mr. Stavropoulos is Chairman Emeritus of the Board of Directors of The Dow Chemical Company, where he previously served in numerous senior management positions, including President, CEO (1995-2000; 2002-2004), Chairman of the Executive Committee (2000-2006), and as a member of the Board of Directors (1990-2006). Currently, Mr. Stavropoulos is Chairman of Univar (global distributor of commodity and specialty chemicals, 2010-present), a Director of Teradata Corporation (data warehousing and technology solutions, 2008-present), Chemical Financial Corporation, Maersk Inc. (industrial conglomerate), Tyco International, Inc. (multinational manufacturing and services, 2007-present), and a member of the Advisory Board for Metalmark Capital (private equity investment, 2005-present). Mr. Stavropoulos is a special advisor to Clayton, Dubilier & Rice, LLC (private equity investment). In addition, Mr. Stavropoulos is a member of the University of Notre Dame Advisory Council for the College of Science. |
David M. Thomas (62) |
| Year of Election or Appointment: 2008 Previously, Mr. Thomas served as Executive Chairman (2005-2006) and Chairman and Chief Executive Officer (2000-2005) of IMS Health, Inc. (pharmaceutical and healthcare information solutions). In addition, Mr. Thomas serves as a member of the Board of Directors of Fortune Brands, Inc. (consumer products), and Interpublic Group of Companies, Inc. (marketing communication, 2004-present). |
Michael E. Wiley (61) |
| Year of Election or Appointment: 2008 Mr. Wiley also serves as a Director of Asia Pacific Exploration Consolidated (international oil and gas exploration and production, 2008-present). Mr. Wiley serves as a Director of Tesoro Corporation (independent oil refiner and marketer, 2005-present), and a Director of Bill Barrett Corporation (exploration and production, 2005-present). In addition, Mr. Wiley also serves as a Director of Post Oak Bank (privately-held bank, 2004-present). Previously, Mr. Wiley served as a member of the Board of Trustees of the University of Tulsa (2000-2006; 2007-2010), as a Senior Energy Advisor of Katzenbach Partners, LLC (consulting, 2006-2007), as an Advisory Director of Riverstone Holdings (private investment), Chairman, President, and CEO of Baker Hughes, Inc. (oilfield services, 2000-2004), and as Director of Spinnaker Exploration Company (exploration and production, 2001-2005). |
+ The information above includes each Trustee's principal occupation during the last five years and other information relating to the experience, attributes, and skills relevant to each Trustee's qualifications to serve as a Trustee, which led to the conclusion that each Trustee should serve as a Trustee for the fund.
Advisory Board Members and Executive Officers:
Correspondence intended for each executive officer, Edward C. Johnson 3d, and Peter S. Lynch may be sent to Fidelity Investments, 82 Devonshire Street, Boston, Massachusetts 02109.
Name, Age; Principal Occupation |
Edward C. Johnson 3d (81) |
| Year of Election or Appointment: 2011 Member of the Advisory Board of Fidelity's Equity and High Income Funds. Mr. Johnson serves as Chief Executive Officer, Chairman, and a Director of FMR LLC, and also serves as Chairman and Director of FIL Limited. Previously, Mr. Johnson served as a Trustee and Chairman of the Board of certain Fidelity Trusts, Chairman and a Director of FMR, Chairman and a Director of FMR Co., Inc., and President of FMR LLC (2006-2007). |
Peter S. Lynch (67) |
| Year of Election or Appointment: 2003 Member of the Advisory Board of Fidelity's Equity and High Income Funds. Mr. Lynch is Vice Chairman and a Director of FMR and FMR Co., Inc. In addition, Mr. Lynch serves as a Trustee of Boston College and as the Chairman of the Inner-City Scholarship Fund. Previously, Mr. Lynch served on the Special Olympics International Board of Directors (1997-2006). |
Kenneth B. Robins (42) |
| Year of Election or Appointment: 2008 President and Treasurer of Fidelity's Equity and High Income Funds. Mr. Robins also serves as President and Treasurer (2010-present) and Assistant Treasurer (2009-present) of other Fidelity funds and is an employee of Fidelity Investments (2004-present). Previously, Mr. Robins served as Deputy Treasurer of the Fidelity funds (2005-2008) and Treasurer and Chief Financial Officer of The North Carolina Capital Management Trust: Cash and Term Portfolios (2006-2008). |
Brian B. Hogan (47) |
| Year of Election or Appointment: 2009 Vice President of Equity and High Income Funds. Mr. Hogan also serves as President of FMR's Equity Division (2009-present). Previously, Mr. Hogan served as Senior Vice President, Equity Research of FMR (2006-2009) and as a portfolio manager. |
Thomas C. Hense (47) |
| Year of Election or Appointment: 2008 or 2010 Vice President of Fidelity's High Income (2008), Small Cap (2008), and Value (2010) Funds. Previously, Mr. Hense served as a portfolio manager for Fidelity's Institutional Money Management Group (Pyramis) (2003-2008). |
Scott C. Goebel (43) |
| Year of Election or Appointment: 2008 Secretary and Chief Legal Officer (CLO) of the Fidelity funds. Mr. Goebel also serves as Secretary of Fidelity Investments Money Management, Inc. (FIMM) (2010-present) and Fidelity Research and Analysis Company (FRAC) (2010-present); Secretary and CLO of The North Carolina Capital Management Trust: Cash and Term Portfolios (2008-present); General Counsel, Secretary, and Senior Vice President of FMR (2008-present) and FMR Co., Inc. (2008-present); employed by FMR LLC or an affiliate (2001-present); Chief Legal Officer of Fidelity Management & Research (Hong Kong) Limited (2008-present) and Assistant Secretary of Fidelity Management & Research (Japan) Inc. (2008-present), and Fidelity Management & Research (U.K.) Inc. (2008-present). Previously, Mr. Goebel served as Assistant Secretary of FIMM (2008-2010), FRAC (2008-2010), and the Funds (2007-2008) and as Vice President and Secretary of Fidelity Distributors Corporation (FDC) (2005-2007). |
William C. Coffey (42) |
| Year of Election or Appointment: 2009 Assistant Secretary of Fidelity's Equity and High Income Funds. Mr. Coffey also serves as Senior Vice President and Deputy General Counsel of FMR LLC (2010-present), and is an employee of Fidelity Investments. Previously, Mr. Coffey served as Vice President and Associate General Counsel of FMR LLC (2005-2009). |
Holly C. Laurent (57) |
| Year of Election or Appointment: 2008 Anti-Money Laundering (AML) Officer of the Fidelity funds. Ms. Laurent also serves as AML Officer of The North Carolina Capital Management Trust: Cash and Term Portfolios (2008-present) and is an employee of Fidelity Investments. Previously, Ms. Laurent was Senior Vice President and Head of Legal for Fidelity Business Services India Pvt. Ltd. (2006-2008), and Senior Vice President, Deputy General Counsel and Group Head for FMR LLC (2005-2006). |
Christine Reynolds (53) |
| Year of Election or Appointment: 2008 Chief Financial Officer of the Fidelity funds. Ms. Reynolds became President of Fidelity Pricing and Cash Management Services (FPCMS) in August 2008. Ms. Reynolds served as Chief Operating Officer of FPCMS (2007-2008). Previously, Ms. Reynolds served as President, Treasurer, and Anti-Money Laundering officer of the Fidelity funds (2004-2007). |
Kenneth A. Rathgeber (64) |
| Year of Election or Appointment: 2004 Chief Compliance Officer of Fidelity's Equity and High Income Funds. Mr. Rathgeber is Chief Compliance Officer of Fidelity Management & Research (Hong Kong) Limited (2008-present), Fidelity Management & Research (Japan) Inc. (2008-present), FMR (2005-present), FMR Co., Inc. (2005-present), Fidelity Management & Research (U.K.) Inc. (2005-present), Fidelity Research & Analysis Company (2005-present), Fidelity Investments Money Management, Inc. (2005-present), Pyramis Global Advisors, LLC (2005-present), and Strategic Advisers, Inc. (2005-present). |
Jeffrey S. Christian (50) |
| Year of Election or Appointment: 2009 Deputy Treasurer of the Fidelity funds. Mr. Christian is an employee of Fidelity Investments. Previously, Mr. Christian served as Chief Financial Officer (2008-2009) of certain Fidelity funds and Senior Vice President of Fidelity Pricing and Cash Management Services (FPCMS) (2004-2009). |
Joseph F. Zambello (54) |
| Year of Election or Appointment: 2011 Deputy Treasurer of the Fidelity funds. Mr. Zambello is an employee of Fidelity Investments. Previously, Mr. Zambello served as Vice President of FMR's Program Management Group (2009-2011) and Vice President of the Transfer Agent Oversight Group (2005-2009). |
Adrien E. Deberghes (44) |
| Year of Election or Appointment: 2008 Deputy Treasurer of Fidelity's Equity and High Income Funds. Mr. Deberghes also serves as Vice President and Assistant Treasurer of Fidelity Rutland Square Trust II and Fidelity Commonwealth Trust II (2011-present), Assistant Treasurer of other Fidelity funds (2010-present), and is an employee of Fidelity Investments (2008-present). Previously, Mr. Deberghes served as Senior Vice President of Mutual Fund Administration at State Street Corporation (2007-2008), Senior Director of Mutual Fund Administration at Investors Bank & Trust (2005-2007), and Director of Finance for Dunkin' Brands (2000-2005). |
Stephanie J. Dorsey (42) |
| Year of Election or Appointment: 2010 Assistant Treasurer of Fidelity's Equity and High Income Funds. Ms. Dorsey also serves as Deputy Treasurer of other Fidelity funds (2008-present) and is an employee of Fidelity Investments (2008-present). Previously, Ms. Dorsey served as Treasurer (2004-2008) of the JPMorgan Mutual Funds and Vice President (2004-2008) of JPMorgan Chase Bank. |
John R. Hebble (53) |
| Year of Election or Appointment: 2009 Assistant Treasurer of Fidelity's Equity and High Income Funds. Mr. Hebble also serves as President (2011-present), Treasurer, and Chief Financial Officer of The North Carolina Capital Management Trust: Cash and Term Portfolios (2008-present), President and Treasurer of other Fidelity funds (2008-present) and is an employee of Fidelity Investments. |
Gary W. Ryan (53) |
| Year of Election or Appointment: 2005 Assistant Treasurer of the Fidelity funds. Mr. Ryan is an employee of Fidelity Investments. Previously, Mr. Ryan served as Vice President of Fund Reporting in Fidelity Pricing and Cash Management Services (FPCMS) (1999-2005). |
Jonathan Davis (43) |
| Year of Election or Appointment: 2010 Assistant Treasurer of the Fidelity funds. Mr. Davis is also Assistant Treasurer of Fidelity Rutland Square Trust II and Fidelity Commonwealth Trust II. Mr. Davis is an employee of Fidelity Investments. Previously, Mr. Davis served as Vice President and Associate General Counsel of FMR LLC (2003-2010). |
Annual Report
Initial Class, Service Class, Service Class 2, and Investor Class designates 100% of the dividend distributed in December during the fiscal year as qualifying for the dividends received deduction for corporate shareholders.
Annual Report
Board Approval of Investment Advisory Contracts and Management Fees
VIP Value Strategies Portfolio
Each year, the Board of Trustees, including the Independent Trustees (together, the Board), votes on the renewal of the management contract and sub-advisory agreements (together, the Advisory Contracts) for the fund. The Board, assisted by the advice of fund counsel and Independent Trustees' counsel, requests and considers a broad range of information relevant to the renewal of the Advisory Contracts throughout the year.
The Board meets regularly and considers at each of its meetings factors that are relevant to its annual consideration of the renewal of the fund's Advisory Contracts, including the services and support provided to the fund and its shareholders. The Board has established various standing committees, each composed of Independent Trustees with varying backgrounds, to which the Board has assigned specific subject matter responsibilities in order to enhance effective decision-making by the Board. The Board, acting directly and through its Committees, requests and receives information concerning the annual consideration of the renewal of the fund's Advisory Contracts. The Board also meets as needed to consider matters specifically related to the Board's annual consideration of the renewal of Advisory Contracts. Members of the Board may also meet with trustees of other Fidelity funds through ad hoc joint committees to discuss certain matters relevant to the Fidelity funds.
At its July 2011 meeting, the Board of Trustees, including the Independent Trustees, unanimously determined to renew the fund's Advisory Contracts. In reaching its determination, the Board considered all factors it believed relevant, including (i) the nature, extent, and quality of the services to be provided to the fund and its shareholders (including the investment performance of the fund); (ii) the competitiveness of the fund's management fee and total expense ratio; (iii) the total costs of the services to be provided by and the profits to be realized by Fidelity from its relationship with the fund; (iv) the extent to which economies of scale would be realized as the fund grows; and (v) whether fee levels reflect these economies of scale, if any, for the benefit of fund shareholders.
In considering whether to renew the Advisory Contracts for the fund, the Board reached a determination, with the assistance of fund counsel and Independent Trustees' counsel and through the exercise of its business judgment, that the renewal of the Advisory Contracts is in the best interests of the fund and its shareholders and that the compensation payable under the Advisory Contracts is fair and reasonable. The Board's decision to renew the Advisory Contracts was not based on any single factor, but rather was based on a comprehensive consideration of all the information provided to the Board at its meetings throughout the year. The Board, in reaching its determination to renew the Advisory Contracts, is aware that shareholders in the fund have a broad range of investment choices available to them, including a wide choice among mutual funds offered by Fidelity's competitors, and that the fund's shareholders, who have the opportunity to review and weigh the disclosure provided by the fund in its prospectus and other public disclosures, have chosen to invest in this fund, managed by Fidelity.
Nature, Extent, and Quality of Services Provided. The Board considered the staffing within the investment adviser, FMR, and the sub-advisers (together, the Investment Advisers), including the backgrounds of the fund's investment personnel and the fund's investment objective and discipline. The Independent Trustees also had discussions with senior management of Fidelity's investment operations and investment groups. The Board considered the structure of the portfolio manager compensation program and whether this structure provides appropriate incentives to act in the best interests of the fund.
Resources Dedicated to Investment Management and Support Services. The Board and the Fund Oversight and Research Committees reviewed the general qualifications and capabilities of the Investment Advisers' investment staff, including its size, education, experience, and resources, as well as the Investment Advisers' approach to recruiting, training, managing, and compensating investment personnel. The Board also noted that FMR has devoted increased resources to non-U.S. offices. The Board noted that Fidelity's analysts have extensive resources, tools and capabilities which allow them to conduct sophisticated quantitative and fundamental analysis, as well as credit analysis of issuers, counterparties and enhancers. The Board also believes that Fidelity's investment professionals have sufficient access to global information and data so as to provide competitive investment results over time, and that those professionals also have access to sophisticated tools which permit them to assess portfolio construction and risk and performance attribution characteristics continuously, as well as to transmit new information and research conclusions rapidly around the world. Additionally, in their deliberations, the Board considered the Investment Advisers' trading capabilities and resources which are an integral part of the investment management process.
Shareholder and Administrative Services. The Board considered (i) the nature, extent, quality, and cost of advisory, administrative, and shareholder services performed by the Investment Advisers and their affiliates under the Advisory Contracts and under separate agreements covering transfer agency, pricing and bookkeeping, and securities lending services for the fund; (ii) the nature and extent of the investment adviser's supervision of third party service providers, principally custodians and subcustodians; and (iii) the resources devoted to, and the record of compliance with, the fund's compliance policies and procedures. The Board also reviewed the allocation of fund brokerage, including allocations to brokers affiliated with the Investment Advisers, the use of brokerage commissions to pay fund expenses, and the use of "soft" commission dollars to pay for research services.
The Board noted that the growth of fund assets over time across the complex allows Fidelity to reinvest in the development of services designed to enhance the value or convenience of the Fidelity funds as investment vehicles. These services include 24-hour access to account information and market information through telephone representatives and over the Internet, investor education materials and asset allocation tools, and the expanded availability of Fidelity Investor Centers, with 35 new branches opening since 2010.
Annual Report
Board Approval of Investment Advisory Contracts and Management Fees - continued
Investment in a Large Fund Family. The Board considered the benefits to shareholders of investing in a Fidelity fund, including the benefits of investing in a fund that is part of a large family of funds offering a variety of investment disciplines and providing a large variety of mutual fund investor services. The Board noted that Fidelity had taken, or had made recommendations that resulted in the Fidelity funds taking, a number of actions over the previous year that benefited particular funds, including (i) continuing to dedicate additional resources to investment research and support of the senior management team that oversees asset management; (ii) rationalizing product lines through the mergers of six funds into other funds; (iii) continuing to migrate the Freedom Funds to dedicated lower cost underlying funds; (iv) obtaining shareholder approval to broaden the investment strategies for Fidelity Consumer Finance Portfolio, Fidelity Emerging Asia Fund, and Fidelity Environment and Alternative Energy Portfolio; (v) contractually agreeing to reduce the management fees and impose other expense limitations on Spartan 500 Index Fund and U.S. Bond Index Fund in connection with launching new institutional classes of these funds; (vi) changing the name, primary and supplemental benchmarks, and investment policies of Fidelity Global Strategies Fund to support the fund's flexible investment mandate and global orientation; and (vii) reducing the transfer agency account fee rates on certain accounts.
Investment Performance. The Board considered whether the fund has operated in accordance with its investment objective, as well as its record of compliance with its investment restrictions. It also reviewed the fund's absolute investment performance for each class, as well as the fund's relative investment performance for each class measured over multiple periods against (i) a broad-based securities market index, and (ii) a peer group of mutual funds deemed appropriate by Fidelity and reviewed by the Board. The following charts considered by the Board show, over the one-, three-, and five-year periods ended December 31, 2010, the cumulative total returns of Initial Class and Service Class 2 of the fund, the cumulative total returns of a broad-based securities market index ("benchmark"), and a range of cumulative total returns of a peer group of mutual funds identified by Morningstar, Inc. as having an investment style similar to that of the fund based on underlying portfolio holdings. The returns of Initial Class and Service Class 2 show the performance of the highest and lowest performing classes, respectively (based on five-year performance). The box within each chart shows the 25th percentile return (bottom of box) and the 75th percentile return (top of box) of the peer group. Returns shown above the box are in the first quartile and returns shown below the box are in the fourth quartile. The percentage beaten numbers noted below each chart correspond to the percentile box and represent the percentage of funds in the peer group whose performance was equal to or lower than that of the class indicated.
VIP Value Strategies Portfolio
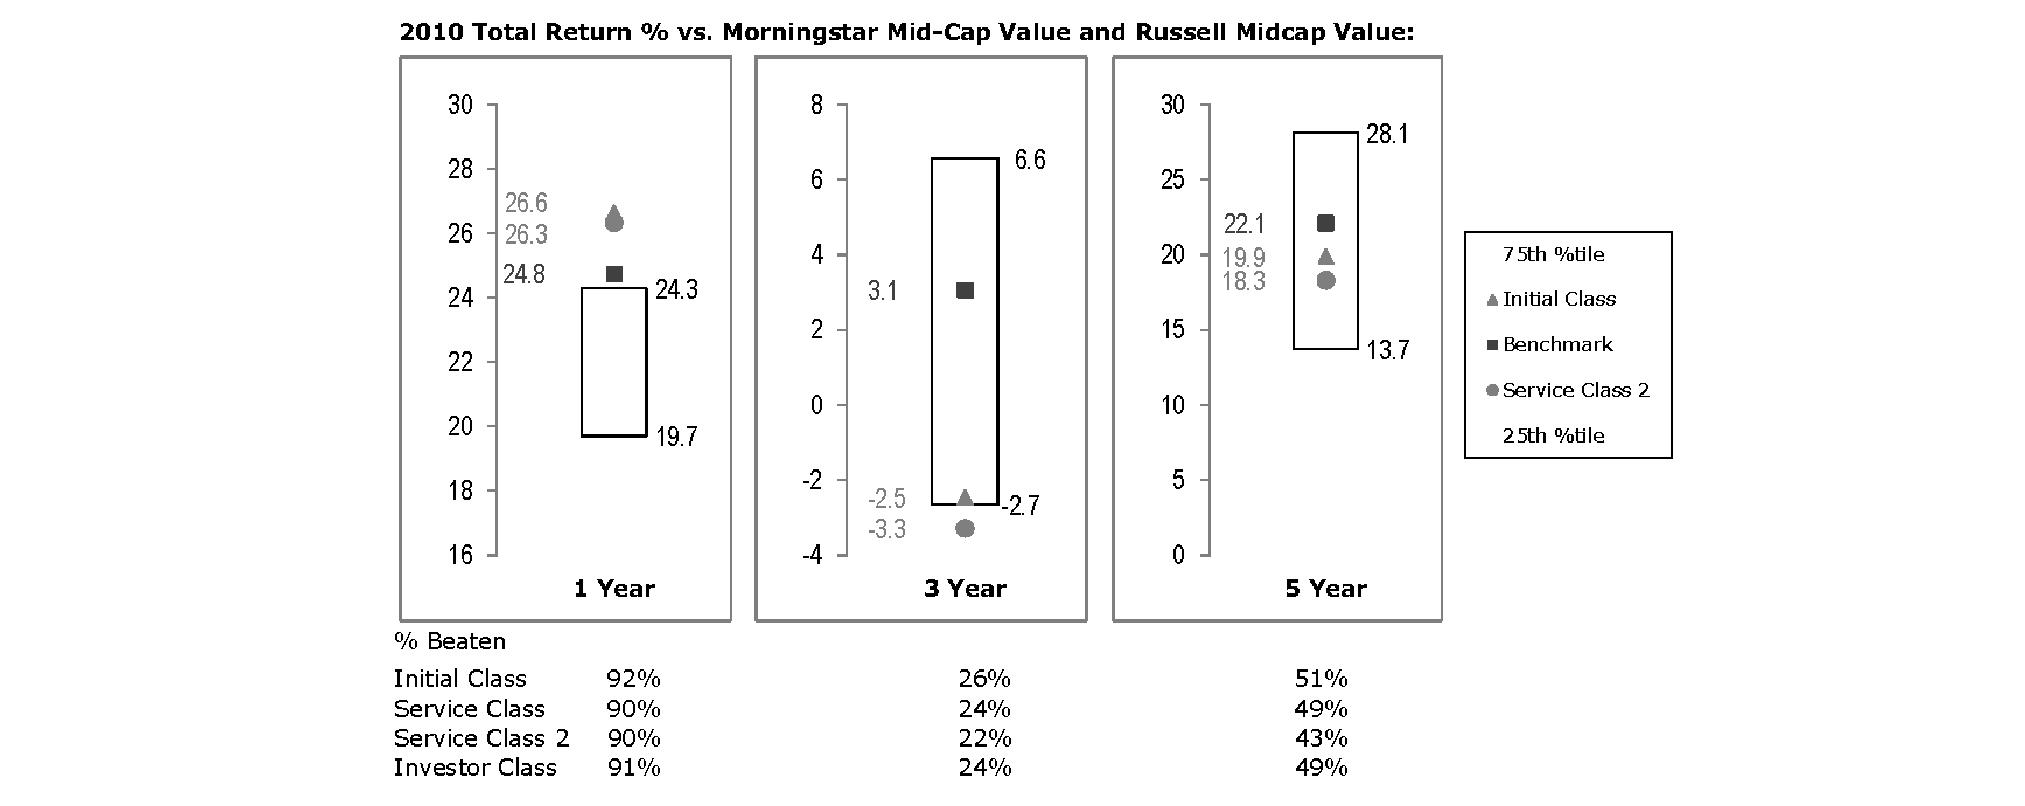
The Board reviewed the fund's relative investment performance against its peer group and noted that the performance of Initial Class of the fund was in the first quartile for the one-year period, the third quartile for the three-year period, and the second quartile for the five-year period. The Board also noted that the investment performance of the fund was lower than its benchmark for the three- and five-year periods, although the one-year total return of Initial Class compared favorably to its benchmark. The Board considered that the variations in performance among the fund's classes reflect the variations in class expenses, which result in lower performance for higher expense classes. The Board also reviewed the fund's performance since inception as well as performance in the current year.
Based on its review, the Board concluded that the nature, extent, and quality of services provided to the fund under the Advisory Contracts should benefit the fund's shareholders.
Competitiveness of Management Fee and Total Expense Ratio. The Board considered the fund's management fee and total expense ratio compared to "mapped groups" of competitive funds and classes. Fidelity creates "mapped groups" by combining similar Lipper investment objective categories that have comparable management fee characteristics. Combining Lipper investment objective categories aids the Board's management fee and total expense ratio comparisons by broadening the competitive group used for comparison and by reducing the number of universes to which various Fidelity funds are compared.
Annual Report
Management Fee. The Board considered two proprietary management fee comparisons for the 12-month periods shown in the chart below. The group of Lipper funds used by the Board for management fee comparisons is referred to below as the "Total Mapped Group." The Total Mapped Group comparison focuses on a fund's standing relative to the total universe of comparable funds available to investors in terms of gross management fees before expense reimbursements or caps. "TMG %" represents the percentage of funds in the Total Mapped Group that had management fees that were lower than the fund's. For example, a TMG % of 10% means that 90% of the funds in the Total Mapped Group had higher management fees than the fund. The "Asset-Size Peer Group" (ASPG) comparison focuses on a fund's standing relative to non-Fidelity funds similar in size to the fund within the Total Mapped Group. The ASPG represents at least 15% of the funds in the Total Mapped Group with comparable asset size and management fee characteristics, subject to a minimum of 50 funds (or all funds in the Total Mapped Group if fewer than 50). Additional information, such as the ASPG quartile in which the fund's management fee ranked, is also included in the chart and considered by the Board.
VIP Value Strategies Portfolio
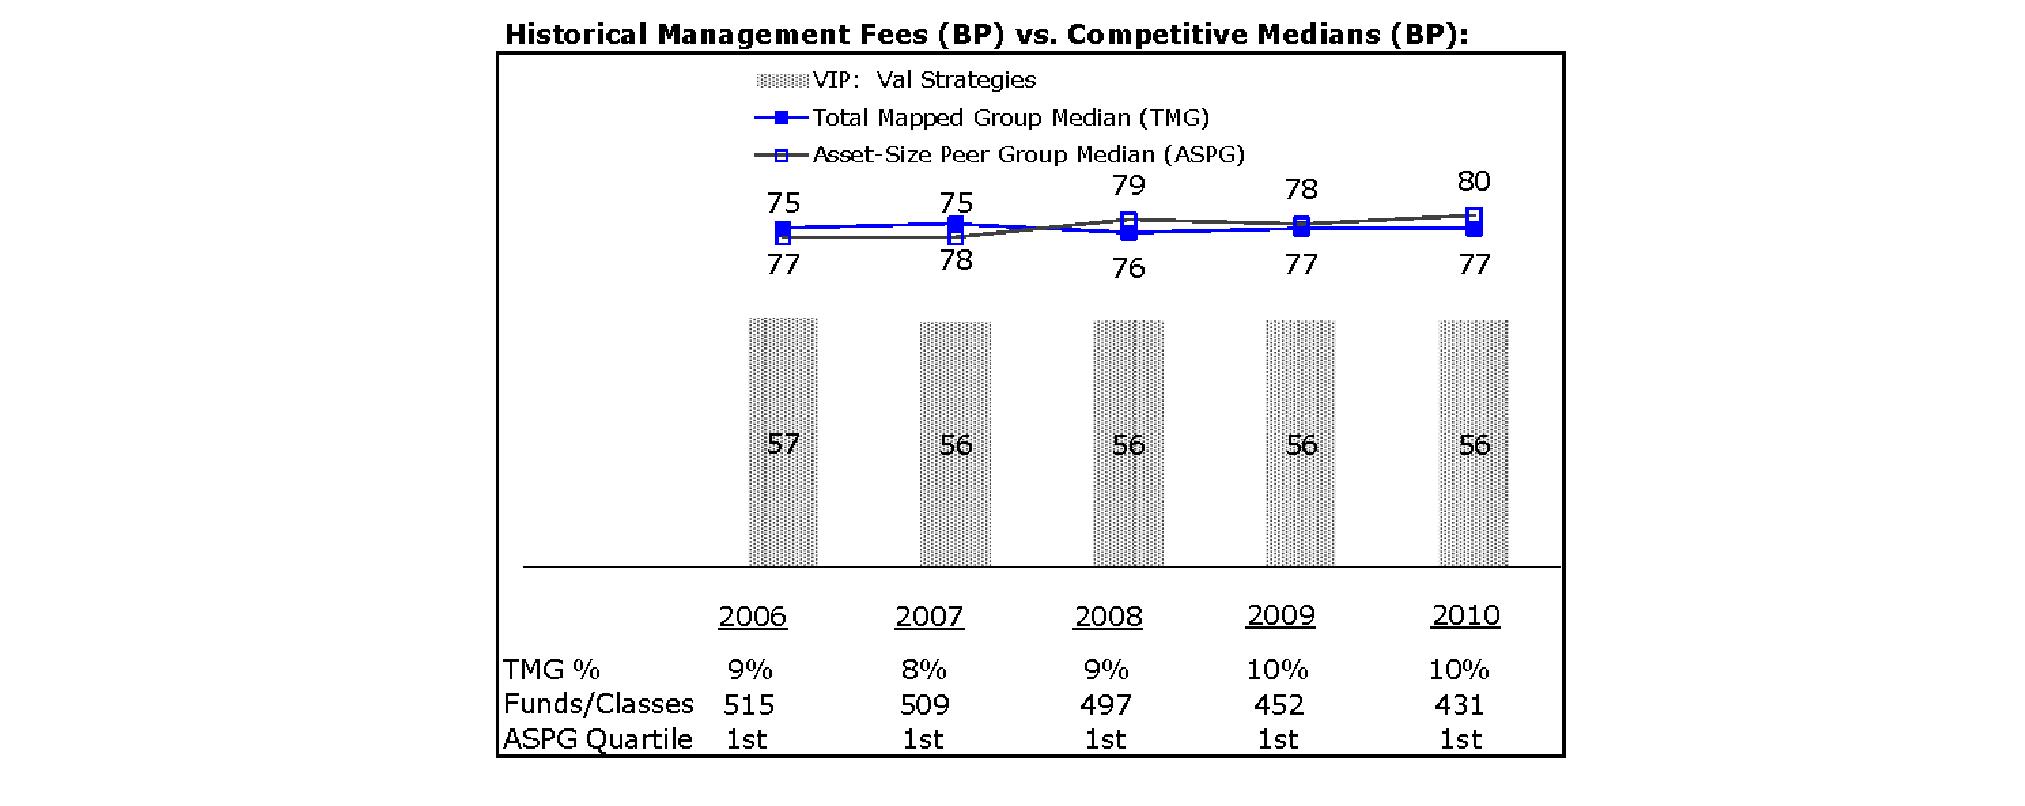
The Board noted that the fund's management fee ranked below the median of its Total Mapped Group and below the median of its ASPG for 2010.
Based on its review, the Board concluded that the fund's management fee is fair and reasonable in light of the services that the fund receives and the other factors considered.
Total Expense Ratio. In its review of each class's total expense ratio, the Board considered the fund's management fee as well as other fund or class expenses, as applicable, such as transfer agent fees, pricing and bookkeeping fees, fund-paid 12b-1 fees, and custodial, legal, and audit fees. The Board also noted the effects of any waivers and reimbursements on fees and expenses. As part of its review, the Board also considered the current and historical total expense ratios of each class of the fund compared to competitive fund median expenses. Each class of the fund is compared to those funds and classes in the Total Mapped Group (used by the Board for management fee comparisons) that have a similar sales load structure.
The Board noted that the total expense ratio of each of Initial Class, Investor Class, and Service Class ranked below its competitive median for 2010 and the total expense ratio of Service Class 2 ranked above its competitive median for 2010. The Board considered that various factors, including 12b-1 fees, positive or negative performance adjustments, and relatively higher other expenses in the case of small fund size, can affect total expense ratios. The Board also noted that Investor Class has higher transfer agent fees than traditional variable annuity classes because it is designed for lower cost annuity products, where the majority of servicing costs are incorporated into the funds' total expense ratios rather than being paid at the annuity level. The Board noted that the fund offers multiple classes, each of which has a different 12b-1 fee structure, and that the multiple structures are intended to offer a range of pricing options for the intermediary market. The Board also noted that the total expense ratios of the classes vary primarily by the level of their 12b-1 fees, although differences in transfer agent fees may also cause expenses to vary from class to class.
Fees Charged to Other Fidelity Clients. The Board also considered Fidelity fee structures and other information with respect to clients of FMR and its affiliates, such as other mutual funds advised or subadvised by FMR or its affiliates, pension plan clients, and other institutional clients. In March 2010, the Board created an ad hoc joint committee with the board of other Fidelity funds (the Committee) to review and compare Fidelity's institutional investment advisory business with its business of providing services to the Fidelity funds, including the differences in services provided, fees charged, and costs incurred, as well as competition in their respective marketplaces.
Annual Report
Board Approval of Investment Advisory Contracts and Management Fees - continued
Based on its review of total expense ratios and fees charged to other Fidelity clients, the Board concluded that the total expense ratio of each class of the fund was reasonable, although Service Class 2 was above the median of the universe presented for comparison, in light of the services that the fund and its shareholders receive and the other factors considered, including the findings of the Committee.
Costs of the Services and Profitability. The Board considered the revenues earned and the expenses incurred by Fidelity in conducting the business of developing, marketing, distributing, managing, administering and servicing the fund and its shareholders. The Board also considered the level of Fidelity's profits in respect of all the Fidelity funds.
On an annual basis, FMR presents to the Board Fidelity's profitability for the fund. Fidelity calculates the profitability for each fund, as well as aggregate profitability for groups of Fidelity funds and all Fidelity funds, using a series of detailed revenue and cost allocation methodologies which originate with the books and records of Fidelity on which Fidelity's audited financial statements are based. The Audit Committee of the Board reviews any significant changes from the prior year's methodologies.
PricewaterhouseCoopers LLP (PwC), independent registered public accounting firm and auditor to Fidelity and certain Fidelity funds, has been engaged annually by the Board as part of the Board's assessment of Fidelity's profitability analysis. PwC's engagement includes the review and assessment of Fidelity's methodologies used in determining the revenues and expenses attributable to Fidelity's mutual fund business, and completion of agreed-upon procedures surrounding the mathematical accuracy of fund profitability and its conformity to allocation methodologies. After considering PwC's reports issued under the engagement and information provided by Fidelity, the Board concluded that while other allocation methods may also be reasonable, Fidelity's profitability methodologies are reasonable in all material respects.
The Board also reviewed Fidelity's non-fund businesses and fall-out benefits related to the mutual fund business as well as cases where Fidelity's affiliates may benefit from or be related to the fund's business.
The Board considered the costs of the services provided by and the profits realized by Fidelity in connection with the operation of the fund and was satisfied that the profitability was not excessive in the circumstances.
Economies of Scale. The Board considered whether there have been economies of scale in respect of the management of the Fidelity funds, whether the Fidelity funds (including the fund) have appropriately benefited from any such economies of scale, and whether there is potential for realization of any further economies of scale. The Board considered the extent to which the fund will benefit from economies of scale through increased services to the fund, through waivers or reimbursements, or through fee or expense reductions. The Board also noted that in 2009, it and the board of other Fidelity funds created an ad hoc committee (the Economies of Scale Committee) to analyze whether FMR attains economies of scale in respect of the management and servicing of the Fidelity funds, whether the Fidelity funds have appropriately benefited from such economies of scale, and whether there is potential for realization of any further economies of scale.
The Board recognized that the fund's management contract incorporates a "group fee" structure, which provides for lower group fee rates as total fund assets under FMR's management increase, and for higher group fee rates as total fund assets under FMR's management decrease. FMR calculates the group fee rates based on a tiered asset "breakpoint" schedule that varies based on asset class. The Board considered that the group fee is designed to deliver the benefits of economies of scale to fund shareholders when total Fidelity fund assets increase, even if assets of any particular fund are unchanged or have declined, because some portion of Fidelity's costs are attributable to services provided to all Fidelity funds, and all funds benefit if those costs can be allocated among more assets. The Board concluded that, given the group fee structure, fund shareholders will benefit from lower management fees as assets under FMR's management increase at the fund complex level, regardless of whether Fidelity achieves any such economies of scale.
The Board concluded, taking into account the analysis of the Economies of Scale Committee, that any potential economies of scale are being appropriately shared between fund shareholders and Fidelity.
Additional Information Requested by the Board. In order to develop fully the factual basis for consideration of the Fidelity funds' Advisory Contracts, the Board requested and received additional information on certain topics, including (i) fund performance trends, actions to be taken by FMR to improve certain funds' overall performance, and Fidelity's long-term strategies for certain funds; (ii) portfolio manager changes that have occurred during the past year and length of portfolio manager tenure for different categories of funds over time; (iii) Fidelity's compensation structure for portfolio managers and other key personnel and strategies for attracting and retaining non-investment personnel; (iv) the amount of the investment that each portfolio manager has made in the Fidelity fund(s) that he or she manages; (v) historical trends in Fidelity's realization of fall-out benefits; (vi) Fidelity's group fee structures and the rationale for the individual fee rates of certain funds; (vii) fund profitability methodology and the impact of certain factors on fund profitability results; (viii) trends regarding industry use of performance fee structures and Fidelity's compliance practices with respect to performance adjustment calculations; (ix) the fee structures in place for certain other Fidelity clients; and (x) explanations regarding the relative total expense ratios of certain funds and classes, total expense competitive trends, and actions that might be taken by FMR to reduce total expense ratios for certain funds and classes.
Based on its evaluation of all of the conclusions noted above, and after considering all factors it believed relevant, the Board ultimately concluded that the advisory fee structures are fair and reasonable, and that the fund's Advisory Contracts should be renewed.
Annual Report
Investment Adviser
Fidelity Management & Research Company
Boston, MA
Investment Sub-Advisers
FMR Co., Inc.
Fidelity Management & Research (U.K.) Inc.
Fidelity Management & Research (Hong Kong) Limited
Fidelity Management & Research (Japan) Inc.
General Distributor
Fidelity Distributors Corporation
Boston, MA
Transfer and Service Agents
Fidelity Investments Institutional Operations Company, Inc.
Boston, MA
Fidelity Service Company, Inc.
Boston, MA
Custodian
The Bank of New York Mellon
New York, NY
VIPVS-ANN-0212
1.781994.109
Fidelity® Variable Insurance Products:
Dynamic Capital Appreciation Portfolio
Annual Report
December 31, 2011
Contents
Performance | (Click Here) | How the fund has done over time. |
Management's Discussion of Fund Performance | (Click Here) | The Portfolio Manager's review of fund performance and strategy. |
Shareholder Expense Example | (Click Here) | An example of shareholder expenses. |
Investment Changes | (Click Here) | A summary of major shifts in the fund's investments over the past six months. |
Investments | (Click Here) | A complete list of the fund's investments with their market values. |
Financial Statements | (Click Here) | Statements of assets and liabilities, operations, and changes in net assets, as well as financial highlights. |
Notes | (Click Here) | Notes to the financial statements. |
Report of Independent Registered Public Accounting Firm | (Click Here) | |
Trustees and Officers | (Click Here) | |
Distributions | (Click Here) | |
Board Approval of Investment Advisory Contracts and Management Fees | (Click Here) | |
To view a fund's proxy voting guidelines and proxy voting record for the 12-month period ended June 30, visit http://www.fidelity.com/proxyvotingresults or visit the Securities and Exchange Commission's (SEC) web site at http://www.sec.gov. You may also call 1-877-208-0098 to request a free copy of the proxy voting guidelines.
Fidelity Variable Insurance Products are separate account options which are purchased through a variable insurance contract.
Standard & Poor's, S&P and S&P 500 are registered service marks of The McGraw-Hill Companies, Inc. and have been licensed for use by Fidelity Distributors Corporation.
Other third party marks appearing herein are the property of their respective owners.
All other marks appearing herein are registered or unregistered trademarks or service marks of FMR LLC or an affiliated company.
This report and the financial statements contained herein are submitted for the general information of the shareholders of the fund. This report is not authorized for distribution to prospective investors in the fund unless preceded or accompanied by an effective prospectus.
A fund files its complete schedule of portfolio holdings with the SEC for the first and third quarters of each fiscal year on Form N-Q. Forms N-Q are available on the SEC's web site at http://www.sec.gov. A fund's Forms N-Q may be reviewed and copied at the SEC's Public Reference Room in Washington, DC. Information regarding the operation of the SEC's Public Reference Room may be obtained by calling 1-800-SEC-0330. For a complete list of a fund's portfolio holdings, view the most recent holdings listing, semiannual report, or annual report on Fidelity's web site at http://www.fidelity.com, http://www.advisor.fidelity.com, or http://www.401k.com, as applicable.
NOT FDIC INSURED • MAY LOSE VALUE • NO BANK GUARANTEE
Neither the fund nor Fidelity Distributors Corporation is a bank.
Annual Report
Average annual total return reflects the change in the value of an investment, assuming reinvestment of the class' distributions from dividend income and capital gains (the profits earned upon the sale of securities that have grown in value, if any) and assuming a constant rate of performance each year. During periods of reimbursement by Fidelity, a fund's total return will be greater than it would be had the reimbursement not occurred. Performance numbers are net of all underlying fund operating expenses, but do not include any insurance charges imposed by your insurance company's separate account. If performance information included the effect of these additional charges, the total returns would have been lower. How a fund did yesterday is no guarantee of how it will do tomorrow.
Average Annual Total Returns
Periods ended December 31, 2011 | Past 1
year | Past 5
years | Past 10
years |
VIP Dynamic Capital Appreciation Portfolio - Initial Class | -2.69% | -0.26% | 4.87% |
VIP Dynamic Capital Appreciation Portfolio - Service Class | -2.68% | -0.36% | 4.77% |
VIP Dynamic Capital Appreciation Portfolio - Service Class 2 | -2.77% | -0.50% | 4.59% |
VIP Dynamic Capital Appreciation Portfolio - Investor Class A | -2.64% | -0.33% | 4.83% |
A The initial offering of Investor Class shares took place on July 21, 2005. Returns prior to July 21, 2005, are those of Initial Class. Had Investor Class's transfer agent fee been reflected, returns prior to July 21, 2005, would have been lower.
$10,000 Over 10 Years
Let's say hypothetically that $10,000 was invested in VIP Dynamic Capital Appreciation Portfolio - Initial Class on December 31, 2001. The chart shows how the value of your investment would have changed, and also shows how the S&P 500® Index performed over the same period.
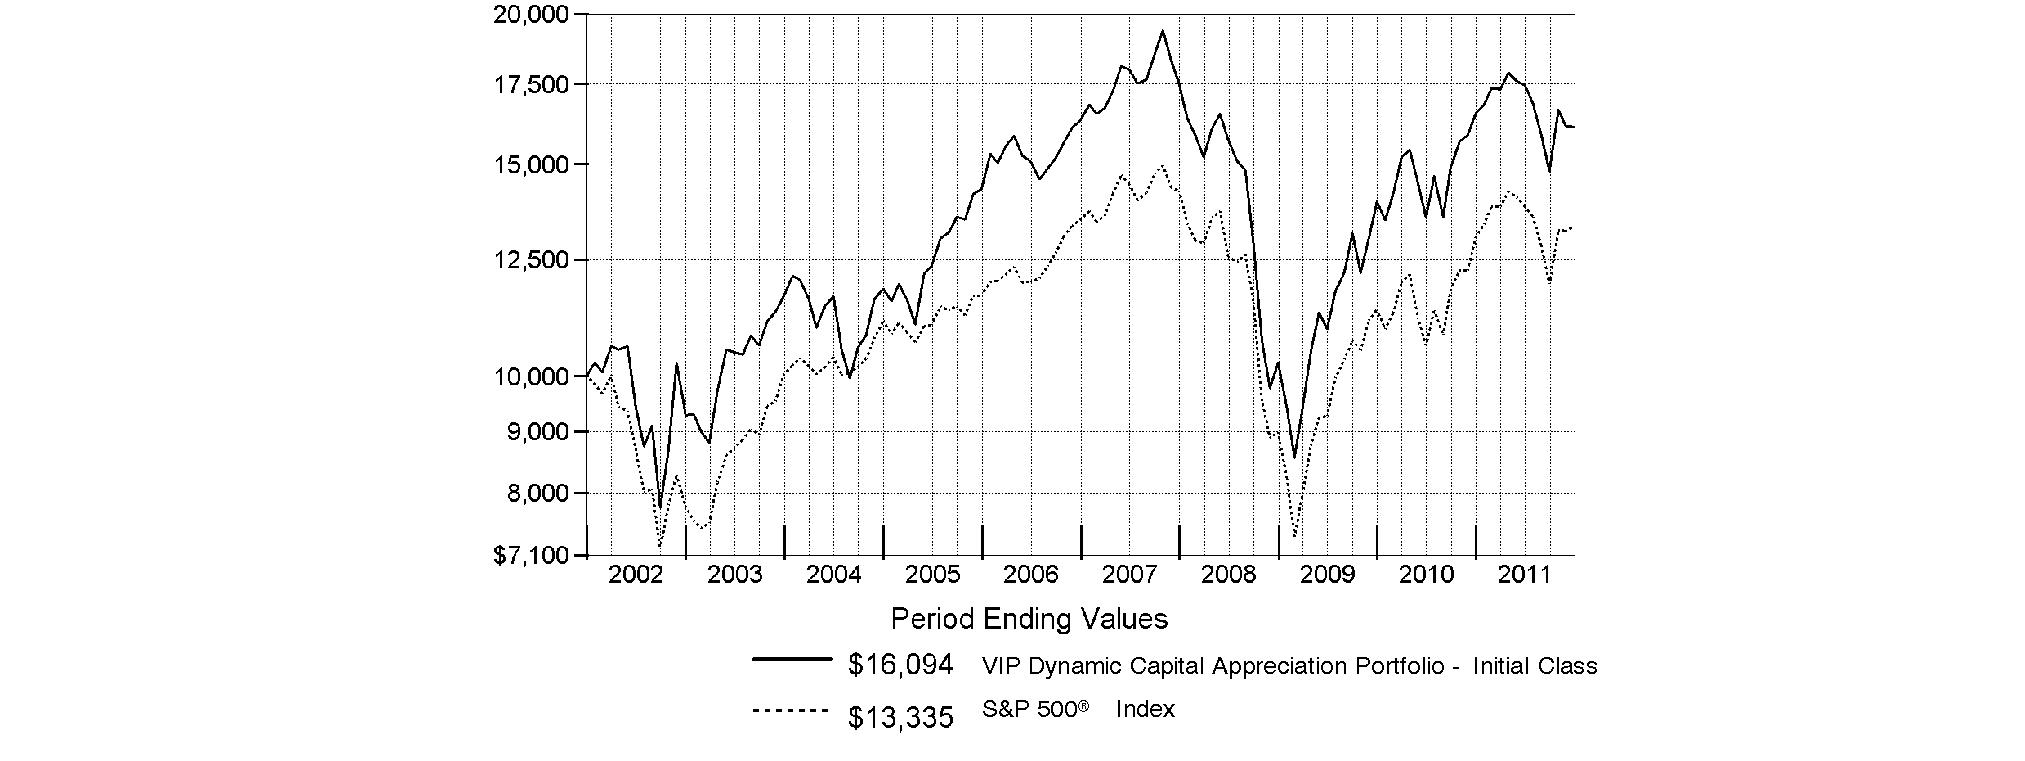
Annual Report
Market Recap: Extreme market volatility took center stage during the 12 months ending December 31, 2011, stealing the spotlight from signs of progress in the global economy. Early in the year, aggressive monetary stimulus by the U.S. federal government, improving credit-market conditions and solid corporate earnings buoyed most major asset classes. As the period progressed, however, fresh worries about sovereign debt in Europe, inflation in China, gridlock over raising the debt ceiling in the U.S. - along with Standard & Poor's early-August downgrade of the nation's long-term sovereign credit rating - and a dimmed outlook for global growth punctured investor confidence and ignited market instability. Domestic equities, as measured by the broad-based S&P 500® Index, gained 2.11%, easily outpacing the 13.61% decline of MSCI® ACWI® (All Country World Index) ex USA Index, a proxy for foreign stocks. Within the MSCI index, emerging markets declined the most (-18%), with investments here generally held back by a stronger U.S. dollar. The U.K. (-3%) fared better than the rest of Europe (-15%), which was the second-worst-performing index component. Bolstered by periodic flights to quality, U.S. investment-grade bonds posted a 7.84% advance, as reflected by the Barclays Capital® U.S. Aggregate Bond Index, outperforming the 4.37% gain of high-yield securities, as represented by The BofA Merrill LynchSM US High Yield Constrained Index. Hampered by financial woes in Europe, the sovereign debt of major developed markets outside the U.S. rose 4.86%, according to the Citigroup® Non-USD Group-of-Seven (G7) Equal Weighted Index, while the JPMorgan Emerging Markets Bond Index Global (EMBI Global) advanced 8.46%, despite the currency head wind.
Comments from J. Fergus Shiel, Portfolio Manager of VIP Dynamic Capital Appreciation Portfolio: For the past year, the fund's share classes fell considerably short of the S&P 500® Index. (For specific portfolio results, please refer to the performance section of this report.) Versus our benchmark, unrewarding stock selection in industrials - especially our airline positions - weighed on the fund's results. Weak picks and an underweighting in the relatively strong-performing energy sector also detracted, as did security selection in materials and information technology. Avoiding utilities - by far the period's best-performing sector - had a negative impact as well. Air carrier United Continental Holdings was the fund's biggest individual detractor and also its largest holding. Earlier in the period, airline stocks were hampered by rising crude oil prices, while recession fear stymied their progress later in the year. Similar comments apply to US Airways Group, our third-largest detractor. Also detracting from the fund's results were Virgin Media, a firm that provides telephone, cable television and broadband Internet services, mainly to customers in the United Kingdom, and French telecom equipment provider Alcatel-Lucent, the latter of which I sold. All of the detractors I've mentioned were out-of-benchmark positions. Conversely, overweighting the consumer discretionary sector was a good call, on balance, especially the consumer services group. My picks in retailing also added value but were mostly cancelled out by unrewarding stock selection elsewhere in the sector. In financials - by far the weakest-performing sector during the period - a sizable underweighting provided a large performance boost. Here, too, the benefit was muted by unrewarding stock selection. The top individual contributor was off-price clothing and home furnishings retailer TJX Companies, which was aided by consumers' penchant for bargain-hunting in a sluggish economy. Also bolstering the fund's results was drug maker Biogen Idec and minimal exposure to weak-performing benchmark component Bank of America.
The views expressed above reflect those of the portfolio manager(s) only through the end of the period as stated on the cover of this report and do not necessarily represent the views of Fidelity or any other person in the Fidelity organization. Any such views are subject to change at any time based upon market or other conditions and Fidelity disclaims any responsibility to update such views. These views may not be relied on as investment advice and, because investment decisions for a Fidelity fund are based on numerous factors, may not be relied on as an indication of trading intent on behalf of any Fidelity fund.
Annual Report
As a shareholder of the Fund, you incur two types of costs: (1) transaction costs, and (2) ongoing costs, including management fees, distribution and/or service (12b-1) fees and other Fund expenses. This Example is intended to help you understand your ongoing costs (in dollars) of investing in the Fund and to compare these costs with the ongoing costs of investing in other mutual funds.
The Example is based on an investment of $1,000 invested at the beginning of the period and held for the entire period (July 1, 2011 to December 31, 2011).
Actual Expenses
The first line of the accompanying table for each class of the Fund provides information about actual account values and actual expenses. You may use the information in this line, together with the amount you invested, to estimate the expenses that you paid over the period. Simply divide your account value by $1,000.00 (for example, an $8,600 account value divided by $1,000.00 = 8.6), then multiply the result by the number in the first line for a class of the Fund under the heading entitled "Expenses Paid During Period" to estimate the expenses you paid on your account during this period. The estimate of expenses does not include any fees or other expenses of any variable annuity or variable life insurance product. If they were, the estimate of expenses you paid during the period would be higher, and your ending account value would be lower. In addition, the Fund, as a shareholder in the underlying Fidelity Central Funds, will indirectly bear its pro-rata share of the fees and expenses incurred by the underlying Fidelity Central Funds. These fees and expenses are not included in the Fund's annualized expense ratio used to calculate the expense estimate in the table below.
Hypothetical Example for Comparison Purposes
The second line of the accompanying table for each class of the Fund provides information about hypothetical account values and hypothetical expenses based on a Class' actual expense ratio and an assumed rate of return of 5% per year before expenses, which is not the Class' actual return. The hypothetical account values and expenses may not be used to estimate the actual ending account balance or expenses you paid for the period. You may use this information to compare the ongoing costs of investing in the Fund and other funds. To do so, compare this 5% hypothetical example with the 5% hypothetical examples that appear in the shareholder reports of the other funds. The estimate of expenses does not include any fees or other expenses of any variable annuity or variable life insurance product. If they were, the estimate of expenses you paid during the period would be higher, and your ending account value would be lower. In addition, the Fund, as a shareholder in the underlying Fidelity Central Funds, will indirectly bear its pro-rata share of the fees and expenses incurred by the underlying Fidelity Central Funds. These fees and expenses are not included in the Fund's annualized expense ratio used to calculate the expense estimate in the table below.
Please note that the expenses shown in the table are meant to highlight your ongoing costs only and do not reflect any transaction costs. Therefore, the second line of the table is useful in comparing ongoing costs only, and will not help you determine the relative total costs of owning different funds.
| Annualized
Expense Ratio | Beginning
Account Value
July 1, 2011 | Ending
Account Value
December 31, 2011 | Expenses Paid
During Period*
July 1, 2011 to
December 31, 2011 |
Initial Class | .85% | | | |
Actual | | $ 1,000.00 | $ 922.00 | $ 4.12 |
Hypothetical A | | $ 1,000.00 | $ 1,020.92 | $ 4.33 |
Service Class | .94% | | | |
Actual | | $ 1,000.00 | $ 921.60 | $ 4.55 |
Hypothetical A | | $ 1,000.00 | $ 1,020.47 | $ 4.79 |
Service Class 2 | 1.10% | | | |
Actual | | $ 1,000.00 | $ 922.40 | $ 5.33 |
Hypothetical A | | $ 1,000.00 | $ 1,019.66 | $ 5.60 |
Investor Class | .93% | | | |
Actual | | $ 1,000.00 | $ 922.30 | $ 4.51 |
Hypothetical A | | $ 1,000.00 | $ 1,020.52 | $ 4.74 |
A 5% return per year before expenses
* Expenses are equal to each Class' annualized expense ratio, multiplied by the average account value over the period, multiplied by 184/365 (to reflect the one-half year period).
Annual Report
Investment Changes (Unaudited)
Top Ten Stocks as of December 31, 2011 |
| % of fund's
net assets | % of fund's net assets
6 months ago |
United Continental Holdings, Inc. | 4.4 | 4.8 |
Apple, Inc. | 3.6 | 3.3 |
Occidental Petroleum Corp. | 3.5 | 3.0 |
Lorillard, Inc. | 3.3 | 2.2 |
TJX Companies, Inc. | 3.2 | 2.2 |
Virgin Media, Inc. | 2.8 | 4.4 |
Biogen Idec, Inc. | 2.8 | 2.5 |
Citigroup, Inc. | 2.5 | 0.0 |
Reynolds American, Inc. | 2.3 | 1.4 |
Bed Bath & Beyond, Inc. | 2.3 | 1.4 |
| 30.7 | |
Top Five Market Sectors as of December 31, 2011 |
| % of fund's
net assets | % of fund's net assets
6 months ago |
Consumer Discretionary | 31.5 | 29.9 |
Information Technology | 12.9 | 11.4 |
Financials | 12.6 | 2.6 |
Industrials | 12.2 | 16.9 |
Consumer Staples | 9.2 | 10.5 |
Asset Allocation (% of fund's net assets) |
As of December 31, 2011* | As of June 30, 2011** |
 | Stocks 92.1% | | | Stocks 93.7% | |
 | Short-Term
Investments and
Net Other Assets 7.9% | | | Short-Term
nvestments and
Net Other Assets 6.3% | |
* Foreign investments | 3.2% | | ** Foreign investments | 14.2% | |

Annual Report
Investments December 31, 2011
Showing Percentage of Net Assets
Common Stocks - 92.1% |
| Shares | | Value |
CONSUMER DISCRETIONARY - 31.5% |
Automobiles - 1.8% |
Ford Motor Co. | 83,318 | | $ 896,502 |
Diversified Consumer Services - 0.7% |
ITT Educational Services, Inc. (a)(d) | 5,996 | | 341,112 |
Hotels, Restaurants & Leisure - 5.9% |
Arcos Dorados Holdings, Inc. | 7,300 | | 149,869 |
Chipotle Mexican Grill, Inc. (a) | 858 | | 289,781 |
McDonald's Corp. | 6,348 | | 636,895 |
Paddy Power PLC (Ireland) | 13,142 | | 757,245 |
Starbucks Corp. | 15,352 | | 706,346 |
Starwood Hotels & Resorts Worldwide, Inc. | 6,406 | | 307,296 |
| | 2,847,432 |
Media - 5.9% |
Interpublic Group of Companies, Inc. | 92,178 | | 896,892 |
Time Warner, Inc. | 16,985 | | 613,838 |
Virgin Media, Inc. | 64,424 | | 1,377,385 |
| | 2,888,115 |
Multiline Retail - 0.3% |
Dollar General Corp. (a) | 3,509 | | 144,360 |
Specialty Retail - 12.1% |
Bed Bath & Beyond, Inc. (a) | 19,510 | | 1,130,995 |
DSW, Inc. Class A | 23,835 | | 1,053,745 |
Express, Inc. | 22,361 | | 445,878 |
Home Depot, Inc. | 3,470 | | 145,879 |
Limited Brands, Inc. | 9,246 | | 373,076 |
Lowe's Companies, Inc. | 2,000 | | 50,760 |
Tiffany & Co., Inc. | 4,796 | | 317,783 |
TJX Companies, Inc. | 24,110 | | 1,556,301 |
Ulta Salon, Cosmetics & Fragrance, Inc. (a) | 6,161 | | 399,972 |
Williams-Sonoma, Inc. | 11,361 | | 437,399 |
| | 5,911,788 |
Textiles, Apparel & Luxury Goods - 4.8% |
Coach, Inc. | 7,959 | | 485,817 |
Oxford Industries, Inc. | 10,255 | | 462,706 |
PVH Corp. | 16,024 | | 1,129,532 |
VF Corp. | 2,000 | | 253,980 |
| | 2,332,035 |
TOTAL CONSUMER DISCRETIONARY | | 15,361,344 |
CONSUMER STAPLES - 9.2% |
Food & Staples Retailing - 1.3% |
Fresh Market, Inc. (a)(d) | 5,847 | | 233,295 |
Whole Foods Market, Inc. | 5,937 | | 413,096 |
| | 646,391 |
Food Products - 0.4% |
Mead Johnson Nutrition Co. Class A | 2,500 | | 171,825 |
|
| Shares | | Value |
Personal Products - 1.9% |
Elizabeth Arden, Inc. (a) | 7,273 | | $ 269,392 |
Nu Skin Enterprises, Inc. Class A | 13,295 | | 645,738 |
| | 915,130 |
Tobacco - 5.6% |
Lorillard, Inc. | 14,022 | | 1,598,508 |
Reynolds American, Inc. | 27,350 | | 1,132,837 |
| | 2,731,345 |
TOTAL CONSUMER STAPLES | | 4,464,691 |
ENERGY - 9.1% |
Energy Equipment & Services - 2.6% |
Baker Hughes, Inc. | 12,614 | | 613,545 |
National Oilwell Varco, Inc. | 7,553 | | 513,528 |
Oceaneering International, Inc. | 3,623 | | 167,129 |
| | 1,294,202 |
Oil, Gas & Consumable Fuels - 6.5% |
Chevron Corp. | 9,559 | | 1,017,078 |
Hess Corp. | 8,000 | | 454,400 |
Occidental Petroleum Corp. | 18,044 | | 1,690,723 |
| | 3,162,201 |
TOTAL ENERGY | | 4,456,403 |
FINANCIALS - 12.6% |
Capital Markets - 1.9% |
Morgan Stanley | 51,912 | | 785,429 |
UBS AG (a) | 9,940 | | 117,934 |
| | 903,363 |
Commercial Banks - 5.2% |
BB&T Corp. | 15,939 | | 401,185 |
Comerica, Inc. | 9,000 | | 232,200 |
Fifth Third Bancorp | 44,949 | | 571,751 |
Huntington Bancshares, Inc. | 15,000 | | 82,350 |
Regions Financial Corp. | 15,029 | | 64,625 |
SunTrust Banks, Inc. | 20,464 | | 362,213 |
Wells Fargo & Co. | 28,985 | | 798,827 |
| | 2,513,151 |
Diversified Financial Services - 4.1% |
Bank of America Corp. | 30,000 | | 166,800 |
Citigroup, Inc. | 45,929 | | 1,208,392 |
JPMorgan Chase & Co. | 19,022 | | 632,482 |
| | 2,007,674 |
Real Estate Management & Development - 1.4% |
CBRE Group, Inc. (a) | 45,799 | | 697,061 |
TOTAL FINANCIALS | | 6,121,249 |
HEALTH CARE - 4.6% |
Biotechnology - 4.1% |
Alexion Pharmaceuticals, Inc. (a) | 4,962 | | 354,783 |
Common Stocks - continued |
| Shares | | Value |
HEALTH CARE - continued |
Biotechnology - continued |
Amgen, Inc. | 4,000 | | $ 256,840 |
Biogen Idec, Inc. (a) | 12,419 | | 1,366,711 |
| | 1,978,334 |
Pharmaceuticals - 0.5% |
Shire PLC | 7,200 | | 250,254 |
TOTAL HEALTH CARE | | 2,228,588 |
INDUSTRIALS - 12.2% |
Aerospace & Defense - 1.7% |
Textron, Inc. | 45,067 | | 833,289 |
Airlines - 5.2% |
United Continental Holdings, Inc. (a)(d) | 114,207 | | 2,155,082 |
US Airways Group, Inc. (a)(d) | 71,126 | | 360,609 |
| | 2,515,691 |
Commercial Services & Supplies - 0.2% |
Stericycle, Inc. (a) | 1,274 | | 99,270 |
Electrical Equipment - 0.4% |
Emerson Electric Co. | 4,415 | | 205,695 |
Industrial Conglomerates - 1.2% |
Danaher Corp. | 12,498 | | 587,906 |
Machinery - 1.9% |
Cummins, Inc. | 1,451 | | 127,717 |
Greenbrier Companies, Inc. (a) | 6,066 | | 147,282 |
Joy Global, Inc. | 2,018 | | 151,289 |
Trinity Industries, Inc. | 4,250 | | 127,755 |
Wabtec Corp. | 5,089 | | 355,976 |
| | 910,019 |
Professional Services - 0.7% |
Robert Half International, Inc. | 12,871 | | 366,309 |
Trading Companies & Distributors - 0.9% |
Air Lease Corp. Class A (d) | 10,830 | | 256,779 |
WESCO International, Inc. (a) | 3,200 | | 169,632 |
| | 426,411 |
TOTAL INDUSTRIALS | | 5,944,590 |
INFORMATION TECHNOLOGY - 12.9% |
Computers & Peripherals - 3.6% |
Apple, Inc. (a) | 4,363 | | 1,767,015 |
Internet Software & Services - 2.4% |
eBay, Inc. (a) | 2,478 | | 75,158 |
VeriSign, Inc. | 30,359 | | 1,084,423 |
| | 1,159,581 |
|
| Shares | | Value |
IT Services - 0.7% |
Cognizant Technology Solutions Corp. Class A (a) | 1,621 | | $ 104,247 |
Paychex, Inc. | 8,381 | | 252,352 |
| | 356,599 |
Semiconductors & Semiconductor Equipment - 1.3% |
Altera Corp. | 10,577 | | 392,407 |
ASML Holding NV | 6,285 | | 262,650 |
| | 655,057 |
Software - 4.9% |
Ariba, Inc. (a) | 26,440 | | 742,435 |
Autodesk, Inc. (a) | 14,931 | | 452,857 |
Citrix Systems, Inc. (a) | 8,744 | | 530,936 |
Intuit, Inc. | 12,372 | | 650,643 |
| | 2,376,871 |
TOTAL INFORMATION TECHNOLOGY | | 6,315,123 |
TOTAL COMMON STOCKS (Cost $42,315,998) |
44,891,988
|
Money Market Funds - 9.2% |
| | | |
Fidelity Cash Central Fund, 0.11% (b) | 3,908,723 | | 3,908,723 |
Fidelity Securities Lending Cash Central Fund, 0.13% (b)(c) | 607,640 | | 607,640 |
TOTAL MONEY MARKET FUNDS (Cost $4,516,363) |
4,516,363
|
TOTAL INVESTMENT PORTFOLIO - 101.3% (Cost $46,832,361) | | 49,408,351 |
NET OTHER ASSETS (LIABILITIES) - (1.3)% | | (649,243) |
NET ASSETS - 100% | $ 48,759,108 |
Legend |
(a) Non-income producing |
(b) Affiliated fund that is available only to investment companies and other accounts managed by Fidelity Investments. The rate quoted is the annualized seven-day yield of the fund at period end. A complete unaudited listing of the fund's holdings as of its most recent quarter end is available upon request. In addition, each Fidelity Central Fund's financial statements, which are not covered by the Fund's Report of Independent Registered Public Accounting Firm, are available on the SEC's website or upon request. |
(c) Investment made with cash collateral received from securities on loan. |
(d) Security or a portion of the security is on loan at period end. |
Affiliated Central Funds |
Information regarding fiscal year to date income earned by the Fund from investments in Fidelity Central Funds is as follows: |
Fund | Income earned |
Fidelity Cash Central Fund | $ 4,221 |
Fidelity Securities Lending Cash Central Fund | 8,085 |
Total | $ 12,306 |
Other Information |
The following is a summary of the inputs used, as of December 31, 2011, involving the Fund's assets and liabilities carried at fair value. The inputs or methodology used for valuing securities may not be an indication of the risk associated with investing in those securities. For more information on valuation inputs, and their aggregation into the levels used in the table below, please refer to the Security Valuation section in the accompanying Notes to Financial Statements. |
Valuation Inputs at Reporting Date: |
Description | Total | Level 1 | Level 2 | Level 3 |
Investments in Securities: | | | | |
Equities: | | | | |
Consumer Discretionary | $ 15,361,344 | $ 15,361,344 | $ - | $ - |
Consumer Staples | 4,464,691 | 4,464,691 | - | - |
Energy | 4,456,403 | 4,456,403 | - | - |
Financials | 6,121,249 | 6,003,315 | 117,934 | - |
Health Care | 2,228,588 | 1,978,334 | 250,254 | - |
Industrials | 5,944,590 | 5,944,590 | - | - |
Information Technology | 6,315,123 | 6,315,123 | - | - |
Money Market Funds | 4,516,363 | 4,516,363 | - | - |
Total Investments in Securities: | $ 49,408,351 | $ 49,040,163 | $ 368,188 | $ - |
See accompanying notes which are an integral part of the financial statements.
Annual Report
Statement of Assets and Liabilities
| December 31, 2011 |
Assets | | |
Investment in securities, at value (including securities loaned of $586,322) - See accompanying schedule: Unaffiliated issuers (cost $42,315,998) | $ 44,891,988 | |
Fidelity Central Funds (cost $4,516,363) | 4,516,363 | |
Total Investments (cost $46,832,361) | | $ 49,408,351 |
Foreign currency held at value (cost $458) | | 459 |
Receivable for fund shares sold | | 1,789 |
Dividends receivable | | 33,855 |
Distributions receivable from Fidelity Central Funds | | 1,186 |
Prepaid expenses | | 141 |
Receivable from investment adviser for expense reductions | | 1,155 |
Other receivables | | 1,272 |
Total assets | | 49,448,208 |
| | |
Liabilities | | |
Payable for fund shares redeemed | $ 10,850 | |
Accrued management fee | 23,163 | |
Distribution and service plan fees payable | 2,537 | |
Other affiliated payables | 5,989 | |
Other payables and accrued expenses | 38,921 | |
Collateral on securities loaned, at value | 607,640 | |
Total liabilities | | 689,100 |
| | |
Net Assets | | $ 48,759,108 |
Net Assets consist of: | | |
Paid in capital | | $ 49,669,412 |
Accumulated undistributed net realized gain (loss) on investments and foreign currency transactions | | (3,486,295) |
Net unrealized appreciation (depreciation) on investments and assets and liabilities in foreign currencies | | 2,575,991 |
Net Assets | | $ 48,759,108 |
Statement of Assets and Liabilities - continued
| December 31, 2011 |
Initial Class:
Net Asset Value, offering price and redemption price per share ($13,816,538 ÷ 1,680,047 shares) | | $ 8.22 |
| | |
Service Class:
Net Asset Value, offering price and redemption price per share ($141,424 ÷ 17,305 shares) | | $ 8.17 |
| | |
Service Class 2:
Net Asset Value, offering price and redemption price per share ($12,013,933 ÷ 1,487,780 shares) | | $ 8.08 |
| | |
Investor Class:
Net Asset Value, offering price and redemption price per share ($22,787,213 ÷ 2,773,129 shares) | | $ 8.22 |
See accompanying notes which are an integral part of the financial statements.
Annual Report
Financial Statements - continued
Statement of Operations
| Year ended December 31, 2011 |
Investment Income | | |
Dividends | | $ 604,597 |
Income from Fidelity Central Funds | | 12,306 |
Total income | | 616,903 |
| | |
Expenses | | |
Management fee | $ 302,499 | |
Transfer agent fees | 68,018 | |
Distribution and service plan fees | 32,994 | |
Accounting and security lending fees | 21,771 | |
Custodian fees and expenses | 50,637 | |
Independent trustees' compensation | 309 | |
Audit | 42,327 | |
Legal | 204 | |
Miscellaneous | 526 | |
Total expenses before reductions | 519,285 | |
Expense reductions | (10,603) | 508,682 |
Net investment income (loss) | | 108,221 |
Realized and Unrealized Gain (Loss) Net realized gain (loss) on: | | |
Investment securities: | | |
Unaffiliated issuers | 3,451,259 | |
Foreign currency transactions | (146) | |
Total net realized gain (loss) | | 3,451,113 |
Change in net unrealized appreciation (depreciation) on: Investment securities | (4,899,964) | |
Assets and liabilities in foreign currencies | 69 | |
Total change in net unrealized appreciation (depreciation) | | (4,899,895) |
Net gain (loss) | | (1,448,782) |
Net increase (decrease) in net assets resulting from operations | | $ (1,340,561) |
Statement of Changes in Net Assets
| Year ended
December 31, 2011 | Year ended
December 31, 2010 |
Increase (Decrease) in Net Assets | | |
Operations | | |
Net investment income (loss) | $ 108,221 | $ (65,655) |
Net realized gain (loss) | 3,451,113 | (906,611) |
Change in net unrealized appreciation (depreciation) | (4,899,895) | 9,842,647 |
Net increase (decrease) in net assets resulting from operations | (1,340,561) | 8,870,381 |
Distributions to shareholders from net investment income | (83,148) | (111,880) |
Share transactions - net increase (decrease) | (7,669,372) | (73,862) |
Total increase (decrease) in net assets | (9,093,081) | 8,684,639 |
| | |
Net Assets | | |
Beginning of period | 57,852,189 | 49,167,550 |
End of period | $ 48,759,108 | $ 57,852,189 |
See accompanying notes which are an integral part of the financial statements.
Annual Report
Financial Highlights - Initial Class
Years ended December 31, | 2011 | 2010 | 2009 | 2008 | 2007 |
Selected Per-Share Data | | | | | |
Net asset value, beginning of period | $ 8.47 | $ 7.17 | $ 5.28 | $ 9.13 | $ 9.61 |
Income from Investment Operations | | | | | |
Net investment income (loss) C | .03 | - G | .03 | .03 | .04 |
Net realized and unrealized gain (loss) | (.26) | 1.32 | 1.88 | (3.78) | .65 |
Total from investment operations | (.23) | 1.32 | 1.91 | (3.75) | .69 |
Distributions from net investment income | (.02) | (.02) | (.02) | (.05) | (.04) |
Distributions from net realized gain | - | - | - | (.05) | (1.13) |
Total distributions | (.02) | (.02) | (.02) | (.10) | (1.17) |
Net asset value, end of period | $ 8.22 | $ 8.47 | $ 7.17 | $ 5.28 | $ 9.13 |
Total Return A, B | (2.69)% | 18.41% | 36.10% | (41.23)% | 7.12% |
Ratios to Average Net Assets D, F | | | | | |
Expenses before reductions | .87% | .88% | .93% | .84% | .77% |
Expenses net of fee waivers, if any | .85% | .85% | .85% | .84% | .77% |
Expenses net of all reductions | .84% | .83% | .83% | .84% | .76% |
Net investment income (loss) | .30% | (.02)% | .50% | .42% | .37% |
Supplemental Data | | | | | |
Net assets, end of period (000 omitted) | $ 13,817 | $ 18,907 | $ 16,986 | $ 15,794 | $ 42,887 |
Portfolio turnover rate E | 168% | 206% | 221% | 161% | 138% |
A Total returns do not reflect charges attributable to your insurance company's separate account. Inclusion of these charges would reduce the total returns shown.
B Total returns would have been lower if certain expenses had not been reduced during the applicable periods shown.
C Calculated based on average shares outstanding during the period.
D Fees and expenses of any underlying Fidelity Central Funds are not included in the Fund's expense ratio. The Fund indirectly bears its proportionate share of the expenses of any underlying Fidelity Central Funds.
E Amount does not include the portfolio activity of any underlying Fidelity Central Funds.
F Expense ratios reflect operating expenses of the class. Expenses before reductions do not reflect amounts reimbursed by the investment adviser or reductions from brokerage service arrangements or reductions from other expense offset arrangements and do not represent the amount paid by the class during periods when reimbursements or reductions occur. Expenses net of fee waivers reflect expenses after reimbursement by the investment adviser but prior to reductions from brokerage service arrangements or other expense offset arrangements. Expenses net of all reductions represent the net expenses paid by the class.
G Amount represents less than $.01 per share.
Financial Highlights - Service Class
Years ended December 31, | 2011 | 2010 | 2009 | 2008 | 2007 |
Selected Per-Share Data | | | | | |
Net asset value, beginning of period | $ 8.41 | $ 7.14 | $ 5.25 | $ 9.07 | $ 9.56 |
Income from Investment Operations | | | | | |
Net investment income (loss) C | .02 | (.01) | .02 | .02 | .03 |
Net realized and unrealized gain (loss) | (.25) | 1.30 | 1.88 | (3.75) | .64 |
Total from investment operations | (.23) | 1.29 | 1.90 | (3.73) | .67 |
Distributions from net investment income | (.01) | (.02) | (.01) | (.04) | (.03) |
Distributions from net realized gain | - | - | - | (.05) | (1.13) |
Total distributions | (.01) | (.02) | (.01) | (.09) | (1.16) |
Net asset value, end of period | $ 8.17 | $ 8.41 | $ 7.14 | $ 5.25 | $ 9.07 |
Total Return A, B | (2.68)% | 18.06% | 36.17% | (41.30)% | 6.93% |
Ratios to Average Net Assets D, F | | | | | |
Expenses before reductions | .95% | .96% | 1.02% | .94% | .86% |
Expenses net of fee waivers, if any | .95% | .95% | .95% | .94% | .86% |
Expenses net of all reductions | .94% | .93% | .94% | .93% | .86% |
Net investment income (loss) | .20% | (.12)% | .40% | .32% | .28% |
Supplemental Data | | | | | |
Net assets, end of period (000 omitted) | $ 141 | $ 181 | $ 217 | $ 226 | $ 666 |
Portfolio turnover rate E | 168% | 206% | 221% | 161% | 138% |
A Total returns do not reflect charges attributable to your insurance company's separate account. Inclusion of these charges would reduce the total returns shown.
B Total returns would have been lower if certain expenses had not been reduced during the applicable periods shown.
C Calculated based on average shares outstanding during the period.
D Fees and expenses of any underlying Fidelity Central Funds are not included in the Fund's expense ratio. The Fund indirectly bears its proportionate share of the expenses of any underlying Fidelity Central Funds.
E Amount does not include the portfolio activity of any underlying Fidelity Central Funds.
F Expense ratios reflect operating expenses of the class. Expenses before reductions do not reflect amounts reimbursed by the investment adviser or reductions from brokerage service arrangements or reductions from other expense offset arrangements and do not represent the amount paid by the class during periods when reimbursements or reductions occur. Expenses net of fee waivers reflect expenses after reimbursement by the investment adviser but prior to reductions from brokerage service arrangements or other expense offset arrangements. Expenses net of all reductions represent the net expenses paid by the class.
See accompanying notes which are an integral part of the financial statements.
Annual Report
Financial Highlights - Service Class 2
Years ended December 31, | 2011 | 2010 | 2009 | 2008 | 2007 |
Selected Per-Share Data | | | | | |
Net asset value, beginning of period | $ 8.31 | $ 7.06 | $ 5.20 | $ 8.98 | $ 9.48 |
Income from Investment Operations | | | | | |
Net investment income (loss) C | - G | (.02) | .01 | .01 | .01 |
Net realized and unrealized gain (loss) | (.23) | 1.29 | 1.85 | (3.70) | .63 |
Total from investment operations | (.23) | 1.27 | 1.86 | (3.69) | .64 |
Distributions from net investment income | - | (.02) | - G | (.04) | (.01) |
Distributions from net realized gain | - | - | - | (.05) | (1.13) |
Total distributions | - | (.02) | - G | (.09) | (1.14) |
Net asset value, end of period | $ 8.08 | $ 8.31 | $ 7.06 | $ 5.20 | $ 8.98 |
Total Return A, B | (2.77)% | 17.99% | 35.79% | (41.35)% | 6.73% |
Ratios to Average Net Assets D, F | | | | | |
Expenses before reductions | 1.11% | 1.13% | 1.19% | 1.12% | 1.04% |
Expenses net of fee waivers, if any | 1.10% | 1.10% | 1.10% | 1.10% | 1.04% |
Expenses net of all reductions | 1.09% | 1.08% | 1.08% | 1.09% | 1.03% |
Net investment income (loss) | .05% | (.27)% | .25% | .16% | .10% |
Supplemental Data | | | | | |
Net assets, end of period (000 omitted) | $ 12,014 | $ 14,492 | $ 14,190 | $ 11,801 | $ 22,687 |
Portfolio turnover rate E | 168% | 206% | 221% | 161% | 138% |
A Total returns do not reflect charges attributable to your insurance company's separate account. Inclusion of these charges would reduce the total returns shown.
B Total returns would have been lower if certain expenses had not been reduced during the applicable periods shown.
C Calculated based on average shares outstanding during the period.
D Fees and expenses of any underlying Fidelity Central Funds are not included in the Fund's expense ratio. The Fund indirectly bears its proportionate share of the expenses of any underlying Fidelity Central Funds.
E Amount does not include the portfolio activity of any underlying Fidelity Central Funds.
F Expense ratios reflect operating expenses of the class. Expenses before reductions do not reflect amounts reimbursed by the investment adviser or reductions from brokerage service arrangements or reductions from other expense offset arrangements and do not represent the amount paid by the class during periods when reimbursements or reductions occur. Expenses net of fee waivers reflect expenses after reimbursement by the investment adviser but prior to reductions from brokerage service arrangements or other expense offset arrangements. Expenses net of all reductions represent the net expenses paid by the class.
G Amount represents less than $.01 per share.
Financial Highlights - Investor Class
Years ended December 31, | 2011 | 2010 | 2009 | 2008 | 2007 |
Selected Per-Share Data | | | | | |
Net asset value, beginning of period | $ 8.46 | $ 7.17 | $ 5.28 | $ 9.12 | $ 9.61 |
Income from Investment Operations | | | | | |
Net investment income (loss) C | .02 | (.01) | .02 | .02 | .03 |
Net realized and unrealized gain (loss) | (.24) | 1.32 | 1.88 | (3.76) | .64 |
Total from investment operations | (.22) | 1.31 | 1.90 | (3.74) | .67 |
Distributions from net investment income | (.02) | (.02) | (.01) | (.05) | (.03) |
Distributions from net realized gain | - | - | - | (.05) | (1.13) |
Total distributions | (.02) | (.02) | (.01) | (.10) | (1.16) |
Net asset value, end of period | $ 8.22 | $ 8.46 | $ 7.17 | $ 5.28 | $ 9.12 |
Total Return A, B | (2.64)% | 18.27% | 36.01% | (41.25)% | 6.91% |
Ratios to Average Net Assets D, F | | | | | |
Expenses before reductions | .94% | .96% | 1.03% | .93% | .88% |
Expenses net of fee waivers, if any | .93% | .93% | .93% | .93% | .88% |
Expenses net of all reductions | .92% | .91% | .91% | .92% | .88% |
Net investment income (loss) | .22% | (.10)% | .43% | .33% | .25% |
Supplemental Data | | | | | |
Net assets, end of period (000 omitted) | $ 22,787 | $ 24,271 | $ 17,775 | $ 14,097 | $ 32,062 |
Portfolio turnover rate E | 168% | 206% | 221% | 161% | 138% |
A Total returns do not reflect charges attributable to your insurance company's separate account. Inclusion of these charges would reduce the total returns shown.
B Total returns would have been lower if certain expenses had not been reduced during the applicable periods shown.
C Calculated based on average shares outstanding during the period.
D Fees and expenses of any underlying Fidelity Central Funds are not included in the Fund's expense ratio. The Fund indirectly bears its proportionate share of the expenses of any underlying Fidelity Central Funds.
E Amount does not include the portfolio activity of any underlying Fidelity Central Funds.
F Expense ratios reflect operating expenses of the class. Expenses before reductions do not reflect amounts reimbursed by the investment adviser or reductions from brokerage service arrangements or reductions from other expense offset arrangements and do not represent the amount paid by the class during periods when reimbursements or reductions occur. Expenses net of fee waivers reflect expenses after reimbursement by the investment adviser but prior to reductions from brokerage service arrangements or other expense offset arrangements. Expenses net of all reductions represent the net expenses paid by the class.
See accompanying notes which are an integral part of the financial statements.
Annual Report
Notes to Financial Statements
For the period ended December 31, 2011
1. Organization.
VIP Dynamic Capital Appreciation Portfolio (the Fund) is a fund of Variable Insurance Products Fund III (the Trust) and is authorized to issue an unlimited number of shares. The Trust is registered under the Investment Company Act of 1940, as amended (the 1940 Act), as an open-end management investment company organized as a Massachusetts business trust. Shares of the Fund may only be purchased by insurance companies for the purpose of funding variable annuity or variable life insurance contracts. The Fund offers the following classes of shares: Initial Class shares, Service Class shares, Service Class 2 shares, and Investor Class shares. All classes have equal rights and voting privileges, except for matters affecting a single class. Investment income, realized and unrealized capital gains and losses, the common expenses of the Fund, and certain fund-level expense reductions, if any, are allocated on a pro-rata basis to each class based on the relative net assets of each class to the total net assets of the Fund. Each class differs with respect to transfer agent and distribution and service plan fees incurred. Certain expense reductions may also differ by class.
2. Investments in Fidelity Central Funds.
The Fund invests in Fidelity Central Funds, which are open-end investment companies available only to other investment companies and accounts managed by Fidelity Management & Research Company (FMR) and its affiliates. The Fund's Schedule of Investments lists each of the Fidelity Central Funds held as of period end, if any, as an investment of the Fund, but do not include the underlying holdings of each Fidelity Central Fund. As an Investing Fund, the Fund indirectly bears its proportionate share of the expenses of the underlying Fidelity Central Funds.
The Money Market Central Funds seek preservation of capital and current income and are managed by Fidelity Investments Money Management, Inc. (FIMM), an affiliate of FMR.
A complete unaudited list of holdings for each Fidelity Central Fund is available upon request or at the Securities and Exchange Commission (the SEC) web site at www.sec.gov. In addition, the financial statements of the Fidelity Central Funds, which are not covered by the Fund's Report of Independent Registered Public Accounting Firm, are available on the SEC web site or upon request.
3. Significant Accounting Policies.
The financial statements have been prepared in conformity with accounting principles generally accepted in the United States of America (GAAP), which require management to make certain estimates and assumptions at the date of the financial statements. Actual results could differ from those estimates. Subsequent events, if any, through the date that the financial statements were issued have been evaluated in the preparation of the financial statements. The following summarizes the significant accounting policies of the Fund:
Security Valuation. Investments are valued as of 4:00 p.m. Eastern time on the last calendar day of the period. The Fund uses independent pricing services approved by the Board of Trustees to value its investments. When current market prices or quotations are not readily available or reliable, valuations may be determined in good faith in accordance with procedures adopted by the Board of Trustees. Factors used in determining value may include market or security specific events. The frequency with which these procedures are used cannot be predicted and they may be utilized to a significant extent. The value used for net asset value (NAV) calculation under these procedures may differ from published prices for the same securities.
The Fund categorizes the inputs to valuation techniques used to value its investments into a disclosure hierarchy consisting of three levels as shown below:
Level 1 - quoted prices in active markets for identical investments
Level 2 - other significant observable inputs (including quoted prices for similar investments, interest rates, prepayment speeds, etc.)
Level 3 - unobservable inputs (including the Fund's own assumptions based on the best information available)
Changes in valuation techniques may result in transfers in or out of an assigned level within the disclosure hierarchy. The aggregate value of investments by input level, as of December 31, 2011, is included at the end of the Fund's Schedule of Investments. Valuation techniques used to value the Fund's investments by major category are as follows:
Equity securities, including restricted securities, for which market quotations are readily available, are valued at the last reported sale price or official closing price as reported by an independent pricing service on the primary market or exchange on which they are traded and are categorized as Level 1 in the hierarchy. In the event there were no sales during the day or closing prices are not available, securities are valued at the last quoted bid price or may be valued using the last available price and are generally categorized as Level 2 in the hierarchy. For foreign equity securities, when significant market or security specific events arise, comparisons to the valuation of American Depositary Receipts (ADRs), futures contracts, Exchange-traded funds (ETFs) and certain indexes as well as quoted prices for similar securities are used and are categorized as Level 2 in the hierarchy in these circumstances. Utilizing these techniques may result in transfers between Level 1 and Level 2. For restricted equity securities and private placements where observable inputs are limited, assumptions about market activity and risk are used and are categorized as Level 3 in the hierarchy.
Annual Report
Notes to Financial Statements - continued
3. Significant Accounting Policies - continued
Security Valuation - continued
Investments in open-end mutual funds, including the Fidelity Central Funds, are valued at their closing net asset value each business day and are categorized as Level 1 in the hierarchy.
New Accounting Pronouncements. In May 2011, the Financial Accounting Standards Board issued Accounting Standard Update No. 2011-04, Fair Value Measurement (Topic 820) - Amendments to Achieve Common Fair Value Measurement and Disclosure Requirements in U.S. GAAP and IFRSs. The update is effective during interim and annual periods beginning after December 15, 2011 and will result in additional disclosure for transfers between levels as well as expanded disclosure for securities categorized as Level 3 under the fair value hierarchy.
In December 2011, the Financial Accounting Standards Board issued Accounting Standard Update No. 2011-11, Disclosures about Offsetting Assets and Liabilities. The update creates new disclosure requirements requiring entities to disclose both gross and net information for derivatives and other financial instruments that are either offset in the Statement of Assets and Liabilities or subject to an enforceable master netting arrangement or similar agreement. The disclosure requirements are effective for annual reporting periods beginning on or after January 1, 2013. Management is currently evaluating the impact of the update's adoption on the Fund's financial statement disclosures.
Foreign Currency. The Fund may use foreign currency contracts to facilitate transactions in foreign-denominated securities. Gains and losses from these transactions may arise from changes in the value of the foreign currency or if the counterparties do not perform under the contracts' terms.
Foreign-denominated assets, including investment securities, and liabilities are translated into U.S. dollars at the exchange rate at period end. Purchases and sales of investment securities, income and dividends received and expenses denominated in foreign currencies are translated into U.S. dollars at the exchange rate in effect on the transaction date.
The effects of exchange rate fluctuations on investments are included with the net realized and unrealized gain (loss) on investment securities. Other foreign currency transactions resulting in realized and unrealized gain (loss) are disclosed separately.
Investment Transactions and Income. For financial reporting purposes, the Fund's investment holdings and NAV include trades executed through the end of the last business day of the period. The NAV per share for processing shareholder transactions is calculated as of the close of business of the New York Stock Exchange (NYSE), normally 4:00 p.m. Eastern time and includes trades executed through the end of the prior business day. Gains and losses on securities sold are determined on the basis of identified cost and may include proceeds received from litigation. Dividend income is recorded on the ex-dividend date, except for certain dividends from foreign securities where the ex-dividend date may have passed, which are recorded as soon as the Fund is informed of the ex-dividend date. Non-cash dividends included in dividend income, if any, are recorded at the fair market value of the securities received. Distributions received on securities that represent a return of capital or capital gain are recorded as a reduction of cost of investments and/or as a realized gain. The Fund estimates the components of distributions received that may be considered return of capital distributions or capital gain distributions. Interest income and distributions from the Fidelity Central Funds are accrued as earned. Interest income includes coupon interest and amortization of premium and accretion of discount on debt securities. Investment income is recorded net of foreign taxes withheld where recovery of such taxes is uncertain.
Expenses. Expenses directly attributable to a fund are charged to that fund. Expenses attributable to more than one fund are allocated among the respective funds on the basis of relative net assets or other appropriate methods. Expense estimates are accrued in the period to which they relate and adjustments are made when actual amounts are known.
Income Tax Information and Distributions to Shareholders. Each year, the Fund intends to qualify as a regulated investment company, including distributing substantially all of its taxable income and realized gains under Subchapter M of the Internal Revenue Code. As a result, no provision for income taxes is required. As of December 31, 2011, the Fund did not have any unrecognized tax benefits in the financial statements; nor is the Fund aware of any tax positions for which it is reasonably possible that the total amounts of unrecognized tax benefits will significantly change in the next twelve months. The Fund files a U.S. federal tax return, in addition to state and local tax returns as required. A fund's tax returns are subject to examination by the Internal Revenue Service (IRS) for a period of three fiscal years. State and local tax returns may be subject to examination for an additional fiscal year depending on the jurisdiction. Foreign taxes are provided for based on the Fund's understanding of the tax rules and rates that exist in the foreign markets in which it invests.
Distributions are declared and recorded on the ex-dividend date. Income dividends and capital gain distributions are declared separately for each class. Income and capital gain distributions are determined in accordance with income tax regulations, which may differ from GAAP.
Capital accounts within the financial statements are adjusted for permanent book-tax differences. These adjustments have no impact on net assets or the results of operations. Temporary book-tax differences will reverse in a subsequent period.
Book-tax differences are primarily due to foreign currency transactions, capital loss carryforwards, and losses deferred due to wash sales.
Annual Report
3. Significant Accounting Policies - continued
Income Tax Information and Distributions to Shareholders - continued
The federal tax cost of investment securities and unrealized appreciation (depreciation) as of period end were as follows:
Gross unrealized appreciation | $ 6,980,673 |
Gross unrealized depreciation | (4,720,063) |
Net unrealized appreciation (depreciation) on securities and other investments | $ 2,260,610 |
| |
Tax Cost | $ 47,147,741 |
The tax-based components of distributable earnings as of period end were as follows:
Capital loss carryforward | $ (3,170,915) |
Net unrealized appreciation (depreciation) | $ 2,260,610 |
Capital loss carryforwards are only available to offset future capital gains of the Fund to the extent provided by regulations and may be limited. Under the Regulated Investment Company Modernization Act of 2010 (the Act), the Fund is permitted to carry forward capital losses incurred in taxable years beginning after December 22, 2010 for an unlimited period and such capital losses are required to be used prior to any losses that expire. Capital loss carryforwards were as follows:
Fiscal year of expiration | |
2016 | $ (1,970,664) |
2018 | (1,200,251) |
Total with expiration | $ (3,170,915) |
The tax character of distributions paid was as follows:
| December 31, 2011 | December 31, 2010 |
Ordinary Income | $ 83,148 | $ 111,880 |
4. Purchases and Sales of Investments.
Purchases and sales of securities, other than short-term securities, aggregated $87,005,787 and $96,725,738, respectively.
5. Fees and Other Transactions with Affiliates.
Management Fee. FMR and its affiliates provide the Fund with investment management related services for which the Fund pays a monthly management fee. The management fee is the sum of an individual fund fee rate that is based on an annual rate of .30% of the Fund's average net assets and an annualized group fee rate that averaged .26% during the period. The group fee rate is based upon the average net assets of all the mutual funds advised by FMR. The group fee rate decreases as assets under management increase and increases as assets under management decrease. For the period, the total annual management fee rate was .56% of the Fund's average net assets.
Distribution and Service Plan Fees. In accordance with Rule 12b-1 of the 1940 Act, the Fund has adopted separate 12b-1 Plans for each Service Class of shares. Each Service Class pays Fidelity Distributors Corporation (FDC), an affiliate of FMR, a service fee. For the period, the service fee is based on an annual rate of .10% of Service Class' average net assets and .25% of Service Class 2's average net assets.
For the period, total fees, all of which were re-allowed to insurance companies for the distribution of shares and providing shareholder support services were as follows:
Service Class | $ 162 |
Service Class 2 | 32,832 |
| $ 32,994 |
Transfer Agent Fees. Fidelity Investments Institutional Operations Company, Inc. (FIIOC), an affiliate of FMR, is the Fund's transfer, dividend disbursing, and shareholder servicing agent. FIIOC receives an asset-based fee with respect to each class. Each class (with the exception of Investor Class) pays a transfer agent fee, excluding out of pocket expenses, equal to an annual rate of .07% of average net assets. Investor Class pays a monthly asset-based transfer agent fee of .15% of average net assets. In addition, FIIOC receives an asset-based fee of .0045% of average net assets for typesetting, printing and mailing of shareholder reports, except proxy statements. FIIOC voluntarily agreed to waive this fee for the period August 1, 2011
Annual Report
Notes to Financial Statements - continued
5. Fees and Other Transactions with Affiliates - continued
Transfer Agent Fees - continued
through December 31, 2011 (see Expense Reductions note). For the period, transfer agent fees for each class, including printing and out of pocket expenses, were as follows:
Initial Class | $ 15,289 |
Service Class | 121 |
Service Class 2 | 11,628 |
Investor Class | 40,980 |
| $ 68,018 |
Accounting and Security Lending Fees. Fidelity Service Company, Inc. (FSC), an affiliate of FMR, maintains the Fund's accounting records. The accounting fee is based on the level of average net assets for the month. Under a separate contract, FSC administers the security lending program. The security lending fee is based on the number and duration of lending transactions.
Brokerage Commissions. The Fund placed a portion of its portfolio transactions with brokerage firms which are affiliates of the investment adviser. The commissions paid to these affiliated firms were $4,519 for the period.
6. Committed Line of Credit.
The Fund participates with other funds managed by FMR or an affiliate in a $4.0 billion credit facility (the "line of credit") to be utilized for temporary or emergency purposes to fund shareholder redemptions or for other short-term liquidity purposes. The Fund has agreed to pay commitment fees on its pro-rata portion of the line of credit, which amounted to $171 and is reflected in Miscellaneous expenses on the Statement of Operations. During the period, there were no borrowings on this line of credit.
7. Security Lending.
The Fund lends portfolio securities through a lending agent from time to time in order to earn additional income. For equity securities, a lending agent is used and may loan securities to certain qualified borrowers, including Fidelity Capital Markets (FCM), a broker-dealer affiliated with the Fund. On the settlement date of the loan, the Fund receives collateral (in the form of U.S. Treasury obligations, letters of credit and/or cash) against the loaned securities and maintains collateral in an amount not less than 100% of the market value of the loaned securities during the period of the loan. The market value of the loaned securities is determined at the close of business of the Fund and any additional required collateral is delivered to the Fund on the next business day. If the borrower defaults on its obligation to return the securities loaned because of insolvency or other reasons, a fund could experience delays and costs in recovering the securities loaned or in gaining access to the collateral. Any cash collateral received is invested in the Fidelity Securities Lending Cash Central Fund. The value of loaned securities and cash collateral at period end are disclosed on the Fund's Statement of Assets and Liabilities. Security lending income represents the income earned on investing cash collateral, less rebates paid to borrowers and any lending agent fees associated with the loan, plus any premium payments received for lending certain types of securities. Security lending income is presented in the Statement of Operations as a component of income from Fidelity Central Funds. Total security lending income during the period amounted to $8,085. During the period, there were no securities loaned to FCM.
8. Expense Reductions.
In addition to FIIOC waiving a portion of its transfer agent fees, FMR voluntarily agreed to reimburse each class to the extent annual operating expenses exceeded certain levels of average net assets as noted in the table below. Some expenses, for example interest expense, including commitment fees, are excluded from this reimbursement.
Expenses were reimbursed and/or waived for the following classes during the period:
| Expense
Limitations | Reimbursement/Waiver |
Initial Class | .85% | $ 2,628 |
Service Class | .95% | 3 |
Service Class 2 | 1.10% | 1,507 |
Investor Class | .93% | 1,829 |
| | $ 5,967 |
Many of the brokers with whom FMR places trades on behalf of the Fund provided services to the Fund in addition to trade execution. These services included payments of certain expenses on behalf of the Fund totaling $4,636 for the period.
Annual Report
9. Distributions to Shareholders.
Distributions to shareholders of each class were as follows:
Years ended December 31, | 2011 | 2010 |
From net investment income | | |
Initial Class | $ 37,100 | $ 38,548 |
Service Class | 243 | 484 |
Service Class 2 | - | 31,994 |
Investor Class | 45,805 | 40,854 |
Total | $ 83,148 | $ 111,880 |
10. Share Transactions.
Transactions for each class of shares were as follows:
| Shares | Dollars |
Years ended December 31, | 2011 | 2010 | 2011 | 2010 |
Initial Class | | | | |
Shares sold | 128,856 | 527,464 | $ 1,113,861 | $ 4,026,651 |
Reinvestment of distributions | 4,586 | 5,636 | 37,100 | 38,548 |
Shares redeemed | (686,582) | (667,514) | (5,878,442) | (5,023,881) |
Net increase (decrease) | (553,140) | (134,414) | $ (4,727,481) | $ (958,682) |
Service Class | | | | |
Shares sold | 6 | 2,960 | $ 55 | $ 21,858 |
Reinvestment of distributions | 30 | 71 | 243 | 484 |
Shares redeemed | (4,275) | (11,855) | (34,821) | (89,736) |
Net increase (decrease) | (4,239) | (8,824) | $ (34,523) | $ (67,394) |
Service Class 2 | | | | |
Shares sold | 417,581 | 1,157,464 | $ 3,450,247 | $ 8,677,785 |
Reinvestment of distributions | - | 4,754 | - | 31,994 |
Shares redeemed | (673,455) | (1,428,138) | (5,611,915) | (10,749,664) |
Net increase (decrease) | (255,874) | (265,920) | $ (2,161,668) | $ (2,039,885) |
Investor Class | | | | |
Shares sold | 648,791 | 1,306,376 | $ 5,546,836 | $ 9,953,594 |
Reinvestment of distributions | 5,669 | 5,973 | 45,805 | 40,854 |
Shares redeemed | (750,190) | (920,849) | (6,338,341) | (7,002,349) |
Net increase (decrease) | (95,730) | 391,500 | $ (745,700) | $ 2,992,099 |
11. Other.
The Fund's organizational documents provide former and current trustees and officers with a limited indemnification against liabilities arising in connection with the performance of their duties to the Fund. In the normal course of business, the Fund may also enter into contracts that provide general indemnifications. The Fund's maximum exposure under these arrangements is unknown as this would be dependent on future claims that may be made against the Fund. The risk of material loss from such claims is considered remote.
At the end of the period, FMR or its affiliates were the owners of record of 75% of the total outstanding shares of the Fund and one otherwise unaffiliated shareholder was the owner of record of 11% of the total outstanding shares of the fund.
Annual Report
Report of Independent Registered Public Accounting Firm
To the Trustees of Variable Insurance Products Fund III and Shareholders of VIP Dynamic Capital Appreciation Portfolio:
We have audited the accompanying statement of assets and liabilities of VIP Dynamic Capital Appreciation Portfolio (the Fund), a fund of Variable Insurance Products Fund III, including the schedule of investments, as of December 31, 2011, and the related statement of operations for the year then ended, the statement of changes in net assets for each of the two years in the period then ended, and the financial highlights for each of the five years in the period then ended. These financial statements and financial highlights are the responsibility of the Fund's management. Our responsibility is to express an opinion on these financial statements and financial highlights based on our audits.
We conducted our audits in accordance with the standards of the Public Company Accounting Oversight Board (United States). Those standards require that we plan and perform the audit to obtain reasonable assurance about whether the financial statements and financial highlights are free of material misstatement. The Fund is not required to have, nor were we engaged to perform, an audit of its internal control over financial reporting. Our audits included consideration of internal control over financial reporting as a basis for designing audit procedures that are appropriate in the circumstances, but not for the purpose of expressing an opinion on the effectiveness of the Fund's internal control over financial reporting. Accordingly, we express no such opinion. An audit also includes examining, on a test basis, evidence supporting the amounts and disclosures in the financial statements, assessing the accounting principles used and significant estimates made by management, as well as evaluating the overall financial statement presentation. Our procedures included confirmation of securities owned as of December 31, 2011, by correspondence with the custodians and brokers. We believe that our audits provide a reasonable basis for our opinion.
In our opinion, the financial statements and financial highlights referred to above present fairly, in all material respects, the financial position of VIP Dynamic Capital Appreciation Portfolio as of December 31, 2011, the results of its operations for the year then ended, the changes in its net assets for each of the two years in the period then ended, and the financial highlights for each of the five years in the period then ended, in conformity with accounting principles generally accepted in the United States of America.
DELOITTE & TOUCHE LLP
Boston, Massachusetts
February 10, 2012
Annual Report
The Trustees, Members of the Advisory Board, and executive officers of the trust and fund, as applicable, are listed below. The Board of Trustees governs the fund and is responsible for protecting the interests of shareholders. The Trustees are experienced executives who meet periodically throughout the year to oversee the fund's activities, review contractual arrangements with companies that provide services to the fund, oversee management of the risks associated with such activities and contractual arrangements, and review the fund's performance. Except for James C. Curvey, each of the Trustees oversees 226 funds advised by FMR or an affiliate. Mr. Curvey oversees 429 funds advised by FMR or an affiliate.
The Trustees hold office without limit in time except that (a) any Trustee may resign; (b) any Trustee may be removed by written instrument, signed by at least two-thirds of the number of Trustees prior to such removal; (c) any Trustee who requests to be retired or who has become incapacitated by illness or injury may be retired by written instrument signed by a majority of the other Trustees; and (d) any Trustee may be removed at any special meeting of shareholders by a two-thirds vote of the outstanding voting securities of the trust. Each Trustee who is not an interested person (as defined in the 1940 Act) (Independent Trustee), shall retire not later than the last day of the calendar year in which his or her 75th birthday occurs. The Independent Trustees may waive this mandatory retirement age policy with respect to individual Trustees. The executive officers and Advisory Board Members hold office without limit in time, except that any officer and Advisory Board Member may resign or may be removed by a vote of a majority of the Trustees at any regular meeting or any special meeting of the Trustees. Except as indicated, each individual has held the office shown or other offices in the same company for the past five years.
Experience, Skills, Attributes, and Qualifications of the Fund's Trustees. The Governance and Nominating Committee has adopted a statement of policy that describes the experience, qualifications, attributes, and skills that are necessary and desirable for potential Independent Trustee candidates (Statement of Policy). The Board believes that each Trustee satisfied at the time he or she was initially elected or appointed a Trustee, and continues to satisfy, the standards contemplated by the Statement of Policy. The Governance and Nominating Committee also engages professional search firms to help identify potential Independent Trustee candidates who have the experience, qualifications, attributes, and skills consistent with the Statement of Policy. From time to time, additional criteria based on the composition and skills of the current Independent Trustees, as well as experience or skills that may be appropriate in light of future changes to board composition, business conditions, and regulatory or other developments, have also been considered by the professional search firms and the Governance and Nominating Committee. In addition, the Board takes into account the Trustees' commitment and participation in Board and committee meetings, as well as their leadership of standing and ad hoc committees throughout their tenure.
In determining that a particular Trustee was and continues to be qualified to serve as a Trustee, the Board has considered a variety of criteria, none of which, in isolation, was controlling. The Board believes that, collectively, the Trustees have balanced and diverse experience, qualifications, attributes, and skills, which allow the Board to operate effectively in governing the fund and protecting the interests of shareholders. Information about the specific experience, skills, attributes, and qualifications of each Trustee, which in each case led to the Board's conclusion that the Trustee should serve (or continue to serve) as a trustee of the fund, is provided below.
Board Structure and Oversight Function. James C. Curvey is an interested person (as defined in the 1940 Act) and currently serves as Acting Chairman. The Trustees have determined that an interested Chairman is appropriate and benefits shareholders because an interested Chairman has a personal and professional stake in the quality and continuity of services provided to the fund. Independent Trustees exercise their informed business judgment to appoint an individual of their choosing to serve as Chairman, regardless of whether the Trustee happens to be independent or a member of management. The Independent Trustees have determined that they can act independently and effectively without having an Independent Trustee serve as Chairman and that a key structural component for assuring that they are in a position to do so is for the Independent Trustees to constitute a substantial majority for the Board. The Independent Trustees also regularly meet in executive session. Ned C. Lautenbach serves as Chairman of the Independent Trustees and as such (i) acts as a liaison between the Independent Trustees and management with respect to matters important to the Independent Trustees and (ii) with management prepares agendas for Board meetings.
Fidelity funds are overseen by different Boards of Trustees. The fund's Board oversees Fidelity's equity and high income funds and another Board oversees Fidelity's investment-grade bond, money market, and asset allocation funds. The asset allocation funds may invest in Fidelity funds overseen by the fund's Board. The use of separate Boards, each with its own committee structure, allows the Trustees of each group of Fidelity funds to focus on the unique issues of the funds they oversee, including common research, investment, and operational issues. On occasion, the separate Boards establish joint committees to address issues of overlapping consequences for the Fidelity funds overseen by each Board.
The Trustees operate using a system of committees to facilitate the timely and efficient consideration of all matters of importance to the Trustees, the fund, and fund shareholders and to facilitate compliance with legal and regulatory requirements and oversight of the fund's activities and associated risks. The Board, acting through its committees, has charged FMR and its affiliates with (i) identifying events or circumstances the occurrence of which could have demonstrably adverse effects on the fund's business and/or reputation; (ii) implementing processes and controls to lessen the possibility that such events or circumstances occur or to mitigate the effects of such events or circumstances if they do occur; and (iii) creating and maintaining a system designed to evaluate continuously business and market conditions in order to facilitate the identification and implementation processes described in (i) and (ii) above. Because the day-to-day operations and activities of the fund are carried out by or through FMR, its affiliates and other service providers, the fund's exposure to risks is mitigated but not eliminated by the processes overseen by the Trustees. While each of the Board's committees has responsibility for overseeing different aspects of the fund's activities, oversight is exercised primarily through the Operations, Audit, and Compliance Committees. In addition, the Independent Trustees have worked with FMR to enhance the Board's oversight of investment and financial risks, legal and regulatory risks, technology risks, and operational risks, including the development of additional risk reporting to the Board. For example, a working group comprised of Independent Trustees and FMR has worked and continues to work to review the Fidelity funds' valuation-related activities, reporting and risk management. Appropriate personnel, including but not limited to the fund's Chief Compliance Officer (CCO), FMR's internal auditor, the independent accountants, the fund's Treasurer and portfolio management personnel, make periodic reports to the Board's committees, as appropriate, including an annual review of FMR's risk management program for the Fidelity funds. The responsibilities of each standing committee, including their oversight responsibilities, are described further under "Standing Committees of the Fund's Trustees."
Annual Report
The fund's Statement of Additional Information (SAI) includes more information about the Trustees. To request a free copy, call Fidelity at 1-877-208-0098.
Interested Trustees*:
Correspondence intended for each Trustee who is an interested person may be sent to Fidelity Investments, 82 Devonshire Street, Boston, Massachusetts 02109.
Name, Age; Principal Occupations and Other Relevant Experience+ |
James C. Curvey (76) |
| Year of Election or Appointment: 2007 Mr. Curvey is Trustee and Acting Chairman of the Board of Trustees of certain Trusts. Mr. Curvey also serves as Trustee (2007-present) of other investment companies advised by FMR. Mr. Curvey is a Director of Fidelity Investments Money Management, Inc. (2009-present), Director of Fidelity Research & Analysis Co. (2009-present) and Director of FMR and FMR Co., Inc. (2007-present). Mr. Curvey is also Vice Chairman (2007-present) and Director of FMR LLC. In addition, Mr. Curvey serves as an Overseer for the Boston Symphony Orchestra and a member of the Trustees of Villanova University. Previously, Mr. Curvey was the Vice Chairman (2006-2007) and Director (2000-2007) of FMR Corp. |
Ronald P. O'Hanley (54) |
| Year of Election or Appointment: 2011 Mr. O'Hanley is Director of FMR Co., Inc. (2010-present), Director of Fidelity Investments Money Management, Inc. (2010-present), Director of Fidelity Research & Analysis Company (2010-present), President of Fidelity Asset Management and Corporate Services and a member of Fidelity's Executive Committee (2010-present). Previously, Mr. O'Hanley served as President and Chief Executive Officer of BNY Mellon Asset Management (2007-2010). Mr. O'Hanley also served as Vice Chairman of Bank New York Mellon Corp. and a member of that firm's Executive Committee. Prior to the 2007 merger of The Bank of New York and Mellon Financial Corporation, he was Vice Chairman of Mellon Financial Corporation and President and Chief Executive Officer of Mellon Asset Management. He joined Mellon in February 1997. Mr. O'Hanley currently serves as Chairman of the Boston Public Library Foundation Board of Directors and sits on the Board of Directors of Beth Israel Deaconess Medical Center, the Board of Trustees of the Marine Biological Laboratory and the Advisory Board of the Maxwell School of Citizenship and Public Administration at Syracuse University. Mr. O'Hanley also chairs the Council on Asset Management for the Financial Services Roundtable and is a member of the Board of Directors of Institutional Investor's U.S. Institute. |
* Trustees have been determined to be "Interested Trustees" by virtue of, among other things, their affiliation with the trust or various entities under common control with FMR.
+ The information above includes each Trustee's principal occupation during the last five years and other information relating to the experience, attributes, and skills relevant to each Trustee's qualifications to serve as a Trustee, which led to the conclusion that each Trustee should serve as a Trustee for the fund.
Independent Trustees:
Correspondence intended for each Independent Trustee (that is, the Trustees other than the Interested Trustees) may be sent to Fidelity Investments, P.O. Box 55235, Boston, Massachusetts 02205-5235.
Name, Age; Principal Occupations and Other Relevant Experience+ |
Dennis J. Dirks (63) |
| Year of Election or Appointment: 2005 Prior to his retirement in May 2003, Mr. Dirks was Chief Operating Officer and a member of the Board of The Depository Trust & Clearing Corporation (DTCC). He also served as President, Chief Operating Officer, and Board member of The Depository Trust Company (DTC) and President and Board member of the National Securities Clearing Corporation (NSCC). In addition, Mr. Dirks served as Chief Executive Officer and Board member of the Government Securities Clearing Corporation, Chief Executive Officer and Board member of the Mortgage-Backed Securities Clearing Corporation, as a Trustee and a member of the Finance Committee of Manhattan College (2005-2008), and as a Trustee and a member of the Finance Committee of AHRC of Nassau County (2006-2008). Mr. Dirks is a member of the Independent Directors Council (IDC) Governing Council (2010-present) and Board of Directors for The Brookville Center for Children's Services, Inc. (2009-present). |
Alan J. Lacy (58) |
| Year of Election or Appointment: 2008 Mr. Lacy serves as Senior Adviser (2007-present) of Oak Hill Capital Partners, L.P. (private equity). Mr. Lacy also served as Chief Executive Officer (2000-2005) and Vice Chairman (2005-2006) of Sears Holdings Corporation and Sears, Roebuck and Co. (retail). In addition, Mr. Lacy serves as a member of the Board of Directors of Dave & Buster's, Inc. (restaurant and entertainment complexes, 2010-present), The Hillman Companies, Inc. (hardware wholesalers, 2010-present), and Bristol-Myers Squibb Company (global pharmaceuticals, 2007-present). Mr. Lacy is a member of the Board of Trustees of The National Parks Conservation Association (2006-present). Previously, Mr. Lacy served as Chairman of the Board of Trustees of the National Parks Conservation Association (2008-2011) and as a member of the Board of Directors for the Western Union Company (global money transfer, 2006-2011). |
Ned C. Lautenbach (67) |
| Year of Election or Appointment: 2000 Mr. Lautenbach is Chairman of the Independent Trustees of the Equity and High Income Funds (2006-present). Mr. Lautenbach currently serves as the Lead Director of the Eaton Corporation Board of Directors (diversified industrial, 1997-present). Mr. Lautenbach is also a member of the Board of Directors of the Philharmonic Center for the Arts in Naples, Florida (1999-present); a member of the Board of Trustees of Fairfield University (2005-present); and a member of the Council on Foreign Relations (1994-present). Previously, Mr. Lautenbach was a Partner/Advisory Partner at Clayton, Dubilier & Rice, LLC (private equity investment, 1998-2010), as well as a Director of Sony Corporation (2006-2007). |
Joseph Mauriello (67) |
| Year of Election or Appointment: 2008 Prior to his retirement in January 2006, Mr. Mauriello served in numerous senior management positions including Deputy Chairman and Chief Operating Officer (2004-2005), and Vice Chairman of Financial Services (2002-2004) of KPMG LLP US (professional services, 1965-2005). Mr. Mauriello currently serves as a member of the Board of Directors of XL Group plc. (global insurance and re-insurance, 2006-present) and of Arcadia Resources Inc. (health care services and products, 2007-present). Previously, Mr. Mauriello served as a Director of the Hamilton Funds of the Bank of New York (2006-2007). |
Robert W. Selander (61) |
| Year of Election or Appointment: 2011 Previously, Mr. Selander served as a Member of the Advisory Board of Fidelity's Equity and High Income Funds (2011), Executive Vice Chairman (2010), Chief Executive Officer (2009-2010), and President and Chief Executive Officer (1997-2009) of Mastercard, Inc. |
Cornelia M. Small (67) |
| Year of Election or Appointment: 2005 Ms. Small is a member of the Board of Directors of the Teagle Foundation (2009-present). Ms. Small is also a member of the Investment Committee, and Chair (2008-present) and a member of the Board of Trustees of Smith College. In addition, Ms. Small serves on the Investment Committee of the Berkshire Taconic Community Foundation (2008-present). Previously, Ms. Small served as Chairperson of the Investment Committee (2002-2008) of Smith College. In addition, Ms. Small served as Chief Investment Officer, Director of Global Equity Investments, and a member of the Board of Directors of Scudder, Stevens & Clark and Scudder Kemper Investments. |
William S. Stavropoulos (72) |
| Year of Election or Appointment: 2001 Mr. Stavropoulos is Vice Chairman of the Independent Trustees of the Equity and High Income Funds (2006-present). Mr. Stavropoulos serves as President and Founder of the Michigan Baseball Foundation, the Great Lakes Loons (2007-present). Mr. Stavropoulos is Chairman Emeritus of the Board of Directors of The Dow Chemical Company, where he previously served in numerous senior management positions, including President, CEO (1995-2000; 2002-2004), Chairman of the Executive Committee (2000-2006), and as a member of the Board of Directors (1990-2006). Currently, Mr. Stavropoulos is Chairman of Univar (global distributor of commodity and specialty chemicals, 2010-present), a Director of Teradata Corporation (data warehousing and technology solutions, 2008-present), Chemical Financial Corporation, Maersk Inc. (industrial conglomerate), Tyco International, Inc. (multinational manufacturing and services, 2007-present), and a member of the Advisory Board for Metalmark Capital (private equity investment, 2005-present). Mr. Stavropoulos is a special advisor to Clayton, Dubilier & Rice, LLC (private equity investment). In addition, Mr. Stavropoulos is a member of the University of Notre Dame Advisory Council for the College of Science. |
David M. Thomas (62) |
| Year of Election or Appointment: 2008 Previously, Mr. Thomas served as Executive Chairman (2005-2006) and Chairman and Chief Executive Officer (2000-2005) of IMS Health, Inc. (pharmaceutical and healthcare information solutions). In addition, Mr. Thomas serves as a member of the Board of Directors of Fortune Brands, Inc. (consumer products), and Interpublic Group of Companies, Inc. (marketing communication, 2004-present). |
Michael E. Wiley (61) |
| Year of Election or Appointment: 2008 Mr. Wiley also serves as a Director of Asia Pacific Exploration Consolidated (international oil and gas exploration and production, 2008-present). Mr. Wiley serves as a Director of Tesoro Corporation (independent oil refiner and marketer, 2005-present), and a Director of Bill Barrett Corporation (exploration and production, 2005-present). In addition, Mr. Wiley also serves as a Director of Post Oak Bank (privately-held bank, 2004-present). Previously, Mr. Wiley served as a member of the Board of Trustees of the University of Tulsa (2000-2006; 2007-2010), as a Senior Energy Advisor of Katzenbach Partners, LLC (consulting, 2006-2007), as an Advisory Director of Riverstone Holdings (private investment), Chairman, President, and CEO of Baker Hughes, Inc. (oilfield services, 2000-2004), and as Director of Spinnaker Exploration Company (exploration and production, 2001-2005). |
+ The information above includes each Trustee's principal occupation during the last five years and other information relating to the experience, attributes, and skills relevant to each Trustee's qualifications to serve as a Trustee, which led to the conclusion that each Trustee should serve as a Trustee for the fund.
Advisory Board Members and Executive Officers:
Correspondence intended for each executive officer, Edward C. Johnson 3d, and Peter S. Lynch may be sent to Fidelity Investments, 82 Devonshire Street, Boston, Massachusetts 02109.
Name, Age; Principal Occupation |
Edward C. Johnson 3d (81) |
| Year of Election or Appointment: 2011 Member of the Advisory Board of Fidelity's Equity and High Income Funds. Mr. Johnson serves as Chief Executive Officer, Chairman, and a Director of FMR LLC, and also serves as Chairman and Director of FIL Limited. Previously, Mr. Johnson served as a Trustee and Chairman of the Board of certain Fidelity Trusts, Chairman and a Director of FMR, Chairman and a Director of FMR Co., Inc., and President of FMR LLC (2006-2007). |
Peter S. Lynch (67) |
| Year of Election or Appointment: 2003 Member of the Advisory Board of Fidelity's Equity and High Income Funds. Mr. Lynch is Vice Chairman and a Director of FMR and FMR Co., Inc. In addition, Mr. Lynch serves as a Trustee of Boston College and as the Chairman of the Inner-City Scholarship Fund. Previously, Mr. Lynch served on the Special Olympics International Board of Directors (1997-2006). |
Kenneth B. Robins (42) |
| Year of Election or Appointment: 2008 President and Treasurer of Fidelity's Equity and High Income Funds. Mr. Robins also serves as President and Treasurer (2010-present) and Assistant Treasurer (2009-present) of other Fidelity funds and is an employee of Fidelity Investments (2004-present). Previously, Mr. Robins served as Deputy Treasurer of the Fidelity funds (2005-2008) and Treasurer and Chief Financial Officer of The North Carolina Capital Management Trust: Cash and Term Portfolios (2006-2008). |
Brian B. Hogan (47) |
| Year of Election or Appointment: 2009 Vice President of Equity and High Income Funds. Mr. Hogan also serves as President of FMR's Equity Division (2009-present). Previously, Mr. Hogan served as Senior Vice President, Equity Research of FMR (2006-2009) and as a portfolio manager. |
Thomas C. Hense (47) |
| Year of Election or Appointment: 2008 or 2010 Vice President of Fidelity's High Income (2008), Small Cap (2008), and Value (2010) Funds. Previously, Mr. Hense served as a portfolio manager for Fidelity's Institutional Money Management Group (Pyramis) (2003-2008). |
Scott C. Goebel (43) |
| Year of Election or Appointment: 2008 Secretary and Chief Legal Officer (CLO) of the Fidelity funds. Mr. Goebel also serves as Secretary of Fidelity Investments Money Management, Inc. (FIMM) (2010-present) and Fidelity Research and Analysis Company (FRAC) (2010-present); Secretary and CLO of The North Carolina Capital Management Trust: Cash and Term Portfolios (2008-present); General Counsel, Secretary, and Senior Vice President of FMR (2008-present) and FMR Co., Inc. (2008-present); employed by FMR LLC or an affiliate (2001-present); Chief Legal Officer of Fidelity Management & Research (Hong Kong) Limited (2008-present) and Assistant Secretary of Fidelity Management & Research (Japan) Inc. (2008-present), and Fidelity Management & Research (U.K.) Inc. (2008-present). Previously, Mr. Goebel served as Assistant Secretary of FIMM (2008-2010), FRAC (2008-2010), and the Funds (2007-2008) and as Vice President and Secretary of Fidelity Distributors Corporation (FDC) (2005-2007). |
William C. Coffey (42) |
| Year of Election or Appointment: 2009 Assistant Secretary of Fidelity's Equity and High Income Funds. Mr. Coffey also serves as Senior Vice President and Deputy General Counsel of FMR LLC (2010-present), and is an employee of Fidelity Investments. Previously, Mr. Coffey served as Vice President and Associate General Counsel of FMR LLC (2005-2009). |
Holly C. Laurent (57) |
| Year of Election or Appointment: 2008 Anti-Money Laundering (AML) Officer of the Fidelity funds. Ms. Laurent also serves as AML Officer of The North Carolina Capital Management Trust: Cash and Term Portfolios (2008-present) and is an employee of Fidelity Investments. Previously, Ms. Laurent was Senior Vice President and Head of Legal for Fidelity Business Services India Pvt. Ltd. (2006-2008), and Senior Vice President, Deputy General Counsel and Group Head for FMR LLC (2005-2006). |
Christine Reynolds (53) |
| Year of Election or Appointment: 2008 Chief Financial Officer of the Fidelity funds. Ms. Reynolds became President of Fidelity Pricing and Cash Management Services (FPCMS) in August 2008. Ms. Reynolds served as Chief Operating Officer of FPCMS (2007-2008). Previously, Ms. Reynolds served as President, Treasurer, and Anti-Money Laundering officer of the Fidelity funds (2004-2007). |
Kenneth A. Rathgeber (64) |
| Year of Election or Appointment: 2004 Chief Compliance Officer of Fidelity's Equity and High Income Funds. Mr. Rathgeber is Chief Compliance Officer of Fidelity Management & Research (Hong Kong) Limited (2008-present), Fidelity Management & Research (Japan) Inc. (2008-present), FMR (2005-present), FMR Co., Inc. (2005-present), Fidelity Management & Research (U.K.) Inc. (2005-present), Fidelity Research & Analysis Company (2005-present), Fidelity Investments Money Management, Inc. (2005-present), Pyramis Global Advisors, LLC (2005-present), and Strategic Advisers, Inc. (2005-present). |
Jeffrey S. Christian (50) |
| Year of Election or Appointment: 2009 Deputy Treasurer of the Fidelity funds. Mr. Christian is an employee of Fidelity Investments. Previously, Mr. Christian served as Chief Financial Officer (2008-2009) of certain Fidelity funds and Senior Vice President of Fidelity Pricing and Cash Management Services (FPCMS) (2004-2009). |
Joseph F. Zambello (54) |
| Year of Election or Appointment: 2011 Deputy Treasurer of the Fidelity funds. Mr. Zambello is an employee of Fidelity Investments. Previously, Mr. Zambello served as Vice President of FMR's Program Management Group (2009-2011) and Vice President of the Transfer Agent Oversight Group (2005-2009). |
Adrien E. Deberghes (44) |
| Year of Election or Appointment: 2008 Deputy Treasurer of Fidelity's Equity and High Income Funds. Mr. Deberghes also serves as Vice President and Assistant Treasurer of Fidelity Rutland Square Trust II and Fidelity Commonwealth Trust II (2011-present), Assistant Treasurer of other Fidelity funds (2010-present), and is an employee of Fidelity Investments (2008-present). Previously, Mr. Deberghes served as Senior Vice President of Mutual Fund Administration at State Street Corporation (2007-2008), Senior Director of Mutual Fund Administration at Investors Bank & Trust (2005-2007), and Director of Finance for Dunkin' Brands (2000-2005). |
Stephanie J. Dorsey (42) |
| Year of Election or Appointment: 2010 Assistant Treasurer of Fidelity's Equity and High Income Funds. Ms. Dorsey also serves as Deputy Treasurer of other Fidelity funds (2008-present) and is an employee of Fidelity Investments (2008-present). Previously, Ms. Dorsey served as Treasurer (2004-2008) of the JPMorgan Mutual Funds and Vice President (2004-2008) of JPMorgan Chase Bank. |
John R. Hebble (53) |
| Year of Election or Appointment: 2009 Assistant Treasurer of Fidelity's Equity and High Income Funds. Mr. Hebble also serves as President (2011-present), Treasurer, and Chief Financial Officer of The North Carolina Capital Management Trust: Cash and Term Portfolios (2008-present), President and Treasurer of other Fidelity funds (2008-present) and is an employee of Fidelity Investments. |
Gary W. Ryan (53) |
| Year of Election or Appointment: 2005 Assistant Treasurer of the Fidelity funds. Mr. Ryan is an employee of Fidelity Investments. Previously, Mr. Ryan served as Vice President of Fund Reporting in Fidelity Pricing and Cash Management Services (FPCMS) (1999-2005). |
Jonathan Davis (43) |
| Year of Election or Appointment: 2010 Assistant Treasurer of the Fidelity funds. Mr. Davis is also Assistant Treasurer of Fidelity Rutland Square Trust II and Fidelity Commonwealth Trust II. Mr. Davis is an employee of Fidelity Investments. Previously, Mr. Davis served as Vice President and Associate General Counsel of FMR LLC (2003-2010). |
Annual Report
Initial Class designates 100%, Service Class designates 100%, Service Class 2 designates 100%, and Investor Class designates 100% of the dividends distributed in during the fiscal year as qualifying for the dividends-received deduction for corporate shareholders.
Annual Report
Board Approval of Investment Advisory Contracts and Management Fees
VIP Dynamic Capital Appreciation Portfolio
Each year, the Board of Trustees, including the Independent Trustees (together, the Board), votes on the renewal of the management contract and sub-advisory agreements (together, the Advisory Contracts) for the fund. The Board, assisted by the advice of fund counsel and Independent Trustees' counsel, requests and considers a broad range of information relevant to the renewal of the Advisory Contracts throughout the year.
The Board meets regularly and considers at each of its meetings factors that are relevant to its annual consideration of the renewal of the fund's Advisory Contracts, including the services and support provided to the fund and its shareholders. The Board has established various standing committees, each composed of Independent Trustees with varying backgrounds, to which the Board has assigned specific subject matter responsibilities in order to enhance effective decision-making by the Board. The Board, acting directly and through its Committees, requests and receives information concerning the annual consideration of the renewal of the fund's Advisory Contracts. The Board also meets as needed to consider matters specifically related to the Board's annual consideration of the renewal of Advisory Contracts. Members of the Board may also meet with trustees of other Fidelity funds through ad hoc joint committees to discuss certain matters relevant to the Fidelity funds.
At its July 2011 meeting, the Board of Trustees, including the Independent Trustees, unanimously determined to renew the fund's Advisory Contracts. In reaching its determination, the Board considered all factors it believed relevant, including (i) the nature, extent, and quality of the services to be provided to the fund and its shareholders (including the investment performance of the fund); (ii) the competitiveness of the fund's management fee and total expense ratio; (iii) the total costs of the services to be provided by and the profits to be realized by Fidelity from its relationship with the fund; (iv) the extent to which economies of scale would be realized as the fund grows; and (v) whether fee levels reflect these economies of scale, if any, for the benefit of fund shareholders.
In considering whether to renew the Advisory Contracts for the fund, the Board reached a determination, with the assistance of fund counsel and Independent Trustees' counsel and through the exercise of its business judgment, that the renewal of the Advisory Contracts is in the best interests of the fund and its shareholders and that the compensation payable under the Advisory Contracts is fair and reasonable. The Board's decision to renew the Advisory Contracts was not based on any single factor, but rather was based on a comprehensive consideration of all the information provided to the Board at its meetings throughout the year. The Board, in reaching its determination to renew the Advisory Contracts, is aware that shareholders in the fund have a broad range of investment choices available to them, including a wide choice among mutual funds offered by Fidelity's competitors, and that the fund's shareholders, who have the opportunity to review and weigh the disclosure provided by the fund in its prospectus and other public disclosures, have chosen to invest in this fund, managed by Fidelity.
Nature, Extent, and Quality of Services Provided. The Board considered the staffing within the investment adviser, FMR, and the sub-advisers (together, the Investment Advisers), including the backgrounds of the fund's investment personnel and the fund's investment objective and discipline. The Independent Trustees also had discussions with senior management of Fidelity's investment operations and investment groups. The Board considered the structure of the portfolio manager compensation program and whether this structure provides appropriate incentives to act in the best interests of the fund.
Resources Dedicated to Investment Management and Support Services. The Board and the Fund Oversight and Research Committees reviewed the general qualifications and capabilities of the Investment Advisers' investment staff, including its size, education, experience, and resources, as well as the Investment Advisers' approach to recruiting, training, managing, and compensating investment personnel. The Board also noted that FMR has devoted increased resources to non-U.S. offices. The Board noted that Fidelity's analysts have extensive resources, tools and capabilities which allow them to conduct sophisticated quantitative and fundamental analysis, as well as credit analysis of issuers, counterparties and enhancers. The Board also believes that Fidelity's investment professionals have sufficient access to global information and data so as to provide competitive investment results over time, and that those professionals also have access to sophisticated tools which permit them to assess portfolio construction and risk and performance attribution characteristics continuously, as well as to transmit new information and research conclusions rapidly around the world. Additionally, in their deliberations, the Board considered the Investment Advisers' trading capabilities and resources which are an integral part of the investment management process.
Shareholder and Administrative Services. The Board considered (i) the nature, extent, quality, and cost of advisory, administrative, and shareholder services performed by the Investment Advisers and their affiliates under the Advisory Contracts and under separate agreements covering transfer agency, pricing and bookkeeping, and securities lending services for the fund; (ii) the nature and extent of the investment adviser's supervision of third party service providers, principally custodians and subcustodians; and (iii) the resources devoted to, and the record of compliance with, the fund's compliance policies and procedures. The Board also reviewed the allocation of fund brokerage, including allocations to brokers affiliated with the Investment Advisers, the use of brokerage commissions to pay fund expenses, and the use of "soft" commission dollars to pay for research services.
The Board noted that the growth of fund assets over time across the complex allows Fidelity to reinvest in the development of services designed to enhance the value or convenience of the Fidelity funds as investment vehicles. These services include 24-hour access to account information and market information through telephone representatives and over the Internet, investor education materials and asset allocation tools, and the expanded availability of Fidelity Investor Centers, with 35 new branches opening since 2010.
Annual Report
Board Approval of Investment Advisory Contracts and Management Fees - continued
Investment in a Large Fund Family. The Board considered the benefits to shareholders of investing in a Fidelity fund, including the benefits of investing in a fund that is part of a large family of funds offering a variety of investment disciplines and providing a large variety of mutual fund investor services. The Board noted that Fidelity had taken, or had made recommendations that resulted in the Fidelity funds taking, a number of actions over the previous year that benefited particular funds, including (i) continuing to dedicate additional resources to investment research and support of the senior management team that oversees asset management; (ii) rationalizing product lines through the mergers of six funds into other funds; (iii) continuing to migrate the Freedom Funds to dedicated lower cost underlying funds; (iv) obtaining shareholder approval to broaden the investment strategies for Fidelity Consumer Finance Portfolio, Fidelity Emerging Asia Fund, and Fidelity Environment and Alternative Energy Portfolio; (v) contractually agreeing to reduce the management fees and impose other expense limitations on Spartan 500 Index Fund and U.S. Bond Index Fund in connection with launching new institutional classes of these funds; (vi) changing the name, primary and supplemental benchmarks, and investment policies of Fidelity Global Strategies Fund to support the fund's flexible investment mandate and global orientation; and (vii) reducing the transfer agency account fee rates on certain accounts.
Investment Performance. The Board considered whether the fund has operated in accordance with its investment objective, as well as its record of compliance with its investment restrictions. It also reviewed the fund's absolute investment performance for each class, as well as the fund's relative investment performance for each class measured over multiple periods against (i) a broad-based securities market index, and (ii) a custom peer group of mutual funds deemed appropriate by Fidelity and reviewed by the Board. The following charts considered by the Board show, over the one-, three-, and five-year periods ended December 31, 2010, the cumulative total returns of Initial Class and Service Class 2 of the fund, the cumulative total returns of a broad-based securities market index ("benchmark"), and a range of cumulative total returns of a custom peer group of mutual funds defined by FMR based on categories assigned by Morningstar, Inc. The returns of Initial Class and Service Class 2 show the performance of the highest and lowest performing classes, respectively (based on five-year performance). The box within each chart shows the 25th percentile return (bottom of box) and the 75th percentile return (top of box) of the peer group. Returns shown above the box are in the first quartile and returns shown below the box are in the fourth quartile. The percentage beaten numbers noted below each chart correspond to the percentile box and represent the percentage of funds in the peer group whose performance was equal to or lower than that of the class indicated. The fund's custom peer group, defined by FMR, is a peer group that FMR believes provides a more meaningful performance comparison than the peer group assigned by Morningstar, Inc., which assigns mutual funds to categories based on their investment styles as measured by their underlying portfolio holdings.
VIP Dynamic Capital Appreciation Portfolio
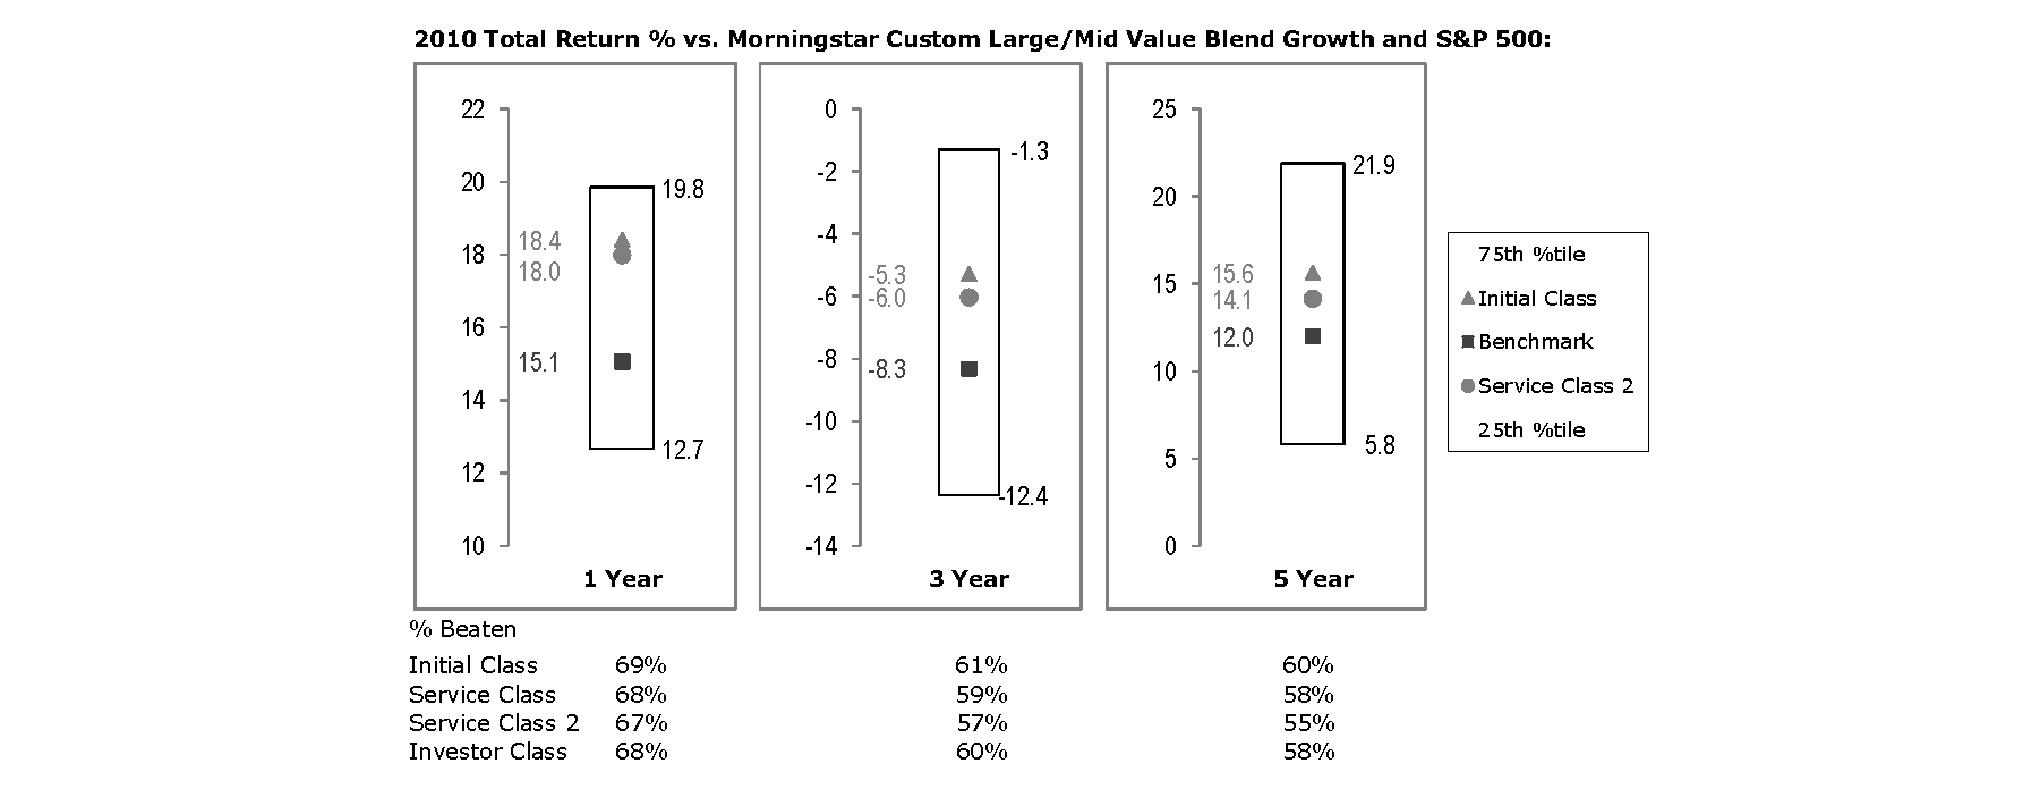
The Board reviewed the fund's relative investment performance against its peer group and noted that the performance of Initial Class of the fund was in the second quartile for all the periods shown. The Board also noted that the investment performance of Initial Class of the fund compared favorably to its benchmark for all the periods shown. The Board considered that the variations in performance among the fund's classes reflect the variations in class expenses, which result in lower performance for higher expense classes. The Board also reviewed the fund's performance since inception as well as performance in the current year.
Based on its review, the Board concluded that the nature, extent, and quality of services provided to the fund under the Advisory Contracts should benefit the fund's shareholders.
Competitiveness of Management Fee and Total Expense Ratio. The Board considered the fund's management fee and total expense ratio compared to "mapped groups" of competitive funds and classes. Fidelity creates "mapped groups" by combining similar Lipper investment objective categories that have comparable management fee characteristics. Combining Lipper investment objective categories aids the Board's management fee and total expense ratio comparisons by broadening the competitive group used for comparison and by reducing the number of universes to which various Fidelity funds are compared.
Annual Report
Management Fee. The Board considered two proprietary management fee comparisons for the 12-month periods shown in the chart below. The group of Lipper funds used by the Board for management fee comparisons is referred to below as the "Total Mapped Group." The Total Mapped Group comparison focuses on a fund's standing relative to the total universe of comparable funds available to investors in terms of gross management fees before expense reimbursements or caps. "TMG %" represents the percentage of funds in the Total Mapped Group that had management fees that were lower than the fund's. For example, a TMG % of 10% means that 90% of the funds in the Total Mapped Group had higher management fees than the fund. The "Asset-Size Peer Group" (ASPG) comparison focuses on a fund's standing relative to non-Fidelity funds similar in size to the fund within the Total Mapped Group. The ASPG represents at least 15% of the funds in the Total Mapped Group with comparable asset size and management fee characteristics, subject to a minimum of 50 funds (or all funds in the Total Mapped Group if fewer than 50). Additional information, such as the ASPG quartile in which the fund's management fee ranked, is also included in the chart and considered by the Board.
VIP Dynamic Capital Appreciation Portfolio
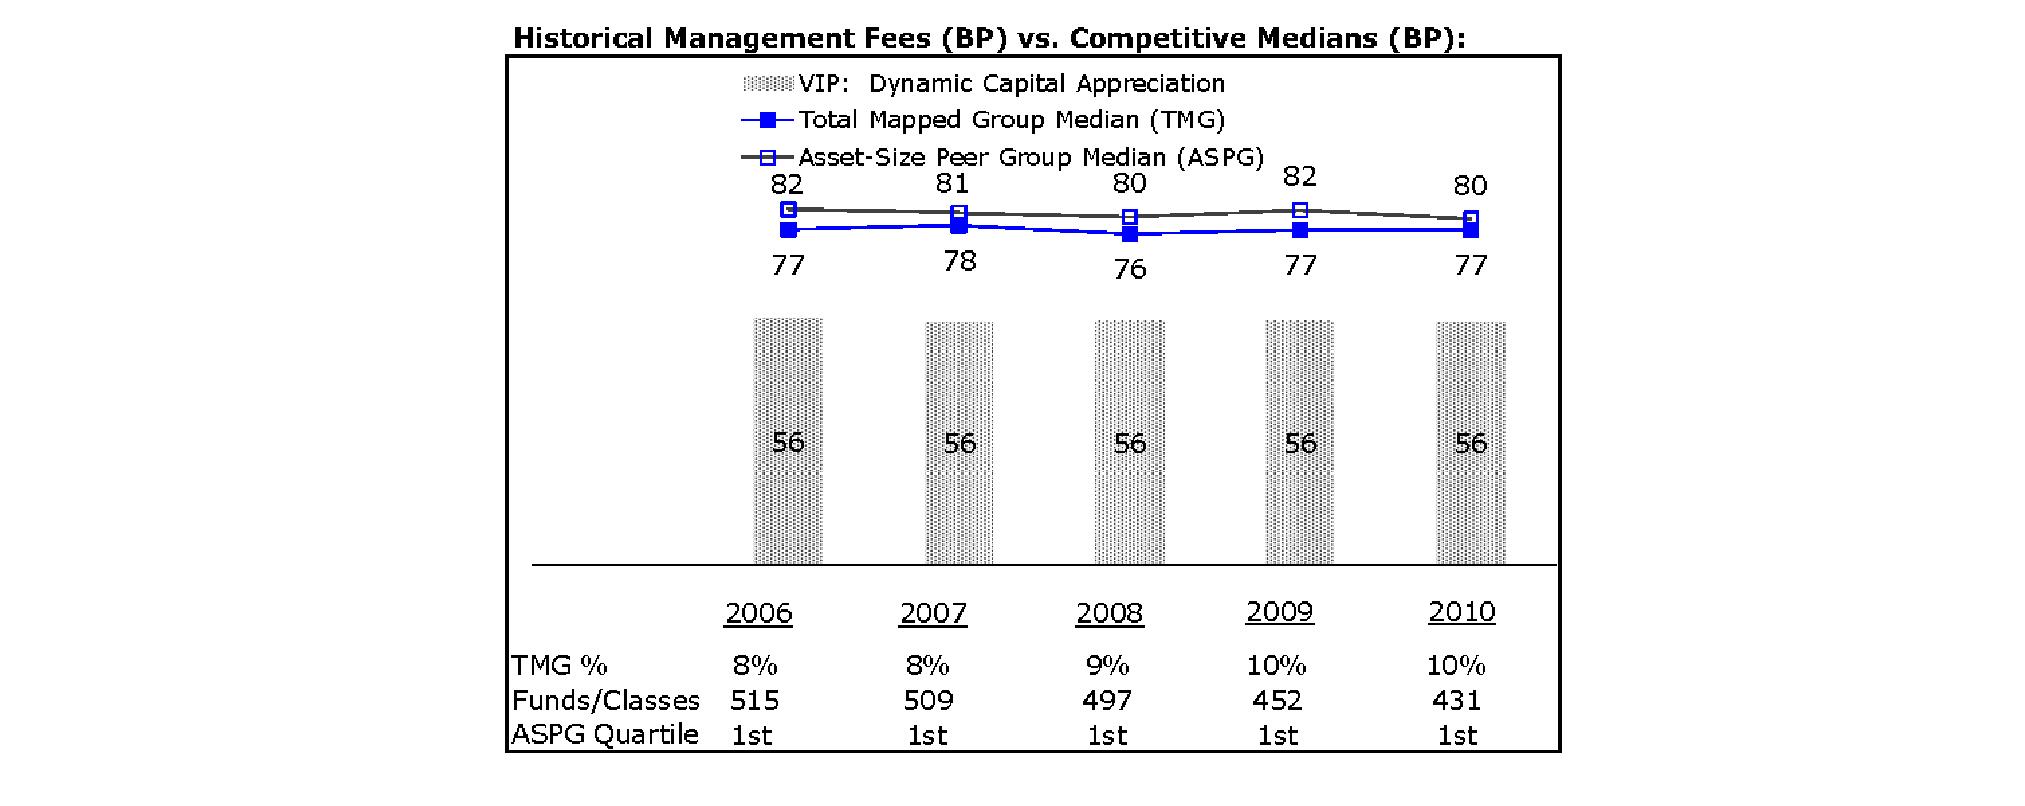
The Board noted that the fund's management fee ranked below the median of its Total Mapped Group and below the median of its ASPG for 2010.
Based on its review, the Board concluded that the fund's management fee is fair and reasonable in light of the services that the fund receives and the other factors considered.
Total Expense Ratio. In its review of each class's total expense ratio, the Board considered the fund's management fee as well as other fund or class expenses, as applicable, such as transfer agent fees, pricing and bookkeeping fees, fund-paid 12b-1 fees, and custodial, legal, and audit fees. The Board also noted the effects of any waivers and reimbursements on fees and expenses. As part of its review, the Board also considered the current and historical total expense ratios of each class of the fund compared to competitive fund median expenses. Each class of the fund is compared to those funds and classes in the Total Mapped Group (used by the Board for management fee comparisons) that have a similar sales load structure.
The Board noted that the total expense ratio of each of Initial Class and Investor Class ranked below its competitive median for 2010 and the total expense ratio of each of Service Class and Service Class 2 ranked above its competitive median for 2010. The Board considered that various factors, including 12b-1 fees, positive or negative performance adjustments, and relatively higher other expenses in the case of small fund size, can affect total expense ratios. The Board also noted that Investor Class has higher transfer agent fees than traditional variable annuity classes because it is designed for lower cost annuity products, where the majority of servicing costs are incorporated into the funds' total expense ratios rather than being paid at the annuity level. The Board noted that the fund offers multiple classes, each of which has a different 12b-1 fee structure, and that the multiple structures are intended to offer a range of pricing options for the intermediary market. The Board also noted that the total expense ratios of the classes vary primarily by the level of their 12b-1 fees, although differences in transfer agent fees may also cause expenses to vary from class to class.
Fees Charged to Other Fidelity Clients. The Board also considered Fidelity fee structures and other information with respect to clients of FMR and its affiliates, such as other mutual funds advised or subadvised by FMR or its affiliates, pension plan clients, and other institutional clients. In March 2010, the Board created an ad hoc joint committee with the board of other Fidelity funds (the Committee) to review and compare Fidelity's institutional investment advisory business with its business of providing services to the Fidelity funds, including the differences in services provided, fees charged, and costs incurred, as well as competition in their respective marketplaces.
Annual Report
Board Approval of Investment Advisory Contracts and Management Fees - continued
Based on its review of total expense ratios and fees charged to other Fidelity clients, the Board concluded that the total expense ratio of each class of the fund was reasonable, although in some cases above the median of the universe presented for comparison, in light of the services that the fund and its shareholders receive and the other factors considered, including the findings of the Committee.
Costs of the Services and Profitability. The Board considered the revenues earned and the expenses incurred by Fidelity in conducting the business of developing, marketing, distributing, managing, administering and servicing the fund and its shareholders. The Board also considered the level of Fidelity's profits in respect of all the Fidelity funds.
On an annual basis, FMR presents to the Board Fidelity's profitability for the fund. Fidelity calculates the profitability for each fund, as well as aggregate profitability for groups of Fidelity funds and all Fidelity funds, using a series of detailed revenue and cost allocation methodologies which originate with the books and records of Fidelity on which Fidelity's audited financial statements are based. The Audit Committee of the Board reviews any significant changes from the prior year's methodologies.
PricewaterhouseCoopers LLP (PwC), independent registered public accounting firm and auditor to Fidelity and certain Fidelity funds, has been engaged annually by the Board as part of the Board's assessment of Fidelity's profitability analysis. PwC's engagement includes the review and assessment of Fidelity's methodologies used in determining the revenues and expenses attributable to Fidelity's mutual fund business, and completion of agreed-upon procedures surrounding the mathematical accuracy of fund profitability and its conformity to allocation methodologies. After considering PwC's reports issued under the engagement and information provided by Fidelity, the Board concluded that while other allocation methods may also be reasonable, Fidelity's profitability methodologies are reasonable in all material respects.
The Board also reviewed Fidelity's non-fund businesses and fall-out benefits related to the mutual fund business as well as cases where Fidelity's affiliates may benefit from or be related to the fund's business.
The Board considered the costs of the services provided by and the profits realized by Fidelity in connection with the operation of the fund and was satisfied that the profitability was not excessive in the circumstances.
Economies of Scale. The Board considered whether there have been economies of scale in respect of the management of the Fidelity funds, whether the Fidelity funds (including the fund) have appropriately benefited from any such economies of scale, and whether there is potential for realization of any further economies of scale. The Board considered the extent to which the fund will benefit from economies of scale through increased services to the fund, through waivers or reimbursements, or through fee or expense reductions. The Board also noted that in 2009, it and the board of other Fidelity funds created an ad hoc committee (the Economies of Scale Committee) to analyze whether FMR attains economies of scale in respect of the management and servicing of the Fidelity funds, whether the Fidelity funds have appropriately benefited from such economies of scale, and whether there is potential for realization of any further economies of scale.
The Board recognized that the fund's management contract incorporates a "group fee" structure, which provides for lower group fee rates as total fund assets under FMR's management increase, and for higher group fee rates as total fund assets under FMR's management decrease. FMR calculates the group fee rates based on a tiered asset "breakpoint" schedule that varies based on asset class. The Board considered that the group fee is designed to deliver the benefits of economies of scale to fund shareholders when total Fidelity fund assets increase, even if assets of any particular fund are unchanged or have declined, because some portion of Fidelity's costs are attributable to services provided to all Fidelity funds, and all funds benefit if those costs can be allocated among more assets. The Board concluded that, given the group fee structure, fund shareholders will benefit from lower management fees as assets under FMR's management increase at the fund complex level, regardless of whether Fidelity achieves any such economies of scale.
The Board concluded, taking into account the analysis of the Economies of Scale Committee, that any potential economies of scale are being appropriately shared between fund shareholders and Fidelity.
Additional Information Requested by the Board. In order to develop fully the factual basis for consideration of the Fidelity funds' Advisory Contracts, the Board requested and received additional information on certain topics, including (i) fund performance trends, actions to be taken by FMR to improve certain funds' overall performance, and Fidelity's long-term strategies for certain funds; (ii) portfolio manager changes that have occurred during the past year and length of portfolio manager tenure for different categories of funds over time; (iii) Fidelity's compensation structure for portfolio managers and other key personnel and strategies for attracting and retaining non-investment personnel; (iv) the amount of the investment that each portfolio manager has made in the Fidelity fund(s) that he or she manages; (v) historical trends in Fidelity's realization of fall-out benefits; (vi) Fidelity's group fee structures and the rationale for the individual fee rates of certain funds; (vii) fund profitability methodology and the impact of certain factors on fund profitability results; (viii) trends regarding industry use of performance fee structures and Fidelity's compliance practices with respect to performance adjustment calculations; (ix) the fee structures in place for certain other Fidelity clients; and (x) explanations regarding the relative total expense ratios of certain funds and classes, total expense competitive trends, and actions that might be taken by FMR to reduce total expense ratios for certain funds and classes.
Annual Report
Based on its evaluation of all of the conclusions noted above, and after considering all factors it believed relevant, the Board ultimately concluded that the advisory fee structures are fair and reasonable, and that the fund's Advisory Contracts should be renewed.
Annual Report
Investment Adviser
Fidelity Management & Research Company
Boston, MA
Investment Sub-Advisers
FMR Co., Inc.
Fidelity Management & Research (U.K.) Inc.
Fidelity Management &
Research (Hong Kong) Limited
Fidelity Management &
Research (Japan) Inc.
General Distributor
Fidelity Distributors Corporation
Boston, MA
Transfer and Service Agents
Fidelity Investments Institutional Operations Company, Inc.
Boston, MA
Fidelity Service Company, Inc.
Boston, MA
Custodian
State Street Bank and Trust Company
Quincy, MA
VIPDCA-ANN-0212
1.751799.111
Fidelity® Variable Insurance Products:
Growth & Income Portfolio
Annual Report
December 31, 2011
Contents
Performance | (Click Here) | How the fund has done over time. |
Management's Discussion of Fund Performance | (Click Here) | The Portfolio Manager's review of fund performance and strategy. |
Shareholder Expense Example | (Click Here) | An example of shareholder expenses. |
Investment Changes | (Click Here) | A summary of major shifts in the fund's investments over the past six months. |
Investments | (Click Here) | A complete list of the fund's investments with their market values. |
Financial Statements | (Click Here) | Statements of assets and liabilities, operations, and changes in net assets, as well as financial highlights. |
Notes | (Click Here) | Notes to the financial statements. |
Report of Independent Registered Public Accounting Firm | (Click Here) | |
Trustees and Officers | (Click Here) | |
Distributions | (Click Here) | |
Board Approval of Investment Advisory Contracts and Management Fees | (Click Here) | |
To view a fund's proxy voting guidelines and proxy voting record for the 12-month period ended June 30, visit http://www.fidelity.com/proxyvotingresults or visit the Securities and Exchange Commission's (SEC) web site at http://www.sec.gov. You may also call 1-877-208-0098 to request a free copy of the proxy voting guidelines.
Fidelity Variable Insurance Products are separate account options which are purchased through a variable insurance contract.
Standard & Poor's, S&P and S&P 500 are registered service marks of The McGraw-Hill Companies, Inc. and have been licensed for use by Fidelity Distributors Corporation.
Other third party marks appearing herein are the property of their respective owners.
All other marks appearing herein are registered or unregistered trademarks or service marks of FMR LLC or an affiliated company.
This report and the financial statements contained herein are submitted for the general information of the shareholders of the fund. This report is not authorized for distribution to prospective investors in the fund unless preceded or accompanied by an effective prospectus.
A fund files its complete schedule of portfolio holdings with the SEC for the first and third quarters of each fiscal year on Form N-Q. Forms N-Q are available on the SEC's web site at http://www.sec.gov. A fund's Forms N-Q may be reviewed and copied at the SEC's Public Reference Room in Washington, DC. Information regarding the operation of the SEC's Public Reference Room may be obtained by calling 1-800-SEC-0330. For a complete list of a fund's portfolio holdings, view the most recent holdings listing, semiannual report, or annual report on Fidelity's web site at http://www.fidelity.com, http://www.advisor.fidelity.com, or http://www.401k.com, as applicable.
NOT FDIC INSURED • MAY LOSE VALUE • NO BANK GUARANTEE
Neither the fund nor Fidelity Distributors Corporation is a bank.
Annual Report
Average annual total return reflects the change in the value of an investment, assuming reinvestment of the class' distributions from dividend income and capital gains (the profits earned upon the sale of securities that have grown in value, if any) and assuming a constant rate of performance each year. During periods of reimbursement by Fidelity, a fund's total return will be greater than it would be had the reimbursement not occurred. Performance numbers are net of all underlying fund operating expenses, but do not include any insurance charges imposed by your insurance company's separate account. If performance information included the effect of these additional charges, the total returns would have been lower. How a fund did yesterday is no guarantee of how it will do tomorrow.
Average Annual Total Returns
Periods ended December 31, 2011 | Past 1
year | Past 5
years | Past 10
years |
VIP Growth & Income Portfolio - Initial Class | 1.69% | -0.60% | 2.59% |
VIP Growth & Income Portfolio - Service Class | 1.57% | -0.69% | 2.48% |
VIP Growth & Income Portfolio - Service Class 2 | 1.36% | -0.85% | 2.32% |
VIP Growth & Income Portfolio - Investor Class A | 1.53% | -0.69% | 2.51% |
A The initial offering of Investor Class shares took place on July 21, 2005. Returns prior to July 21, 2005 are those of Initial Class. Had Investor Class's transfer agent fee been reflected, returns prior to July 21, 2005 would have been lower.
$10,000 Over 10 Years
Let's say hypothetically that $10,000 was invested in VIP Growth & Income Portfolio - Initial Class on December 31, 2001. The chart shows how the value of your investment would have changed, and also shows how the S&P 500® Index performed over the same period.
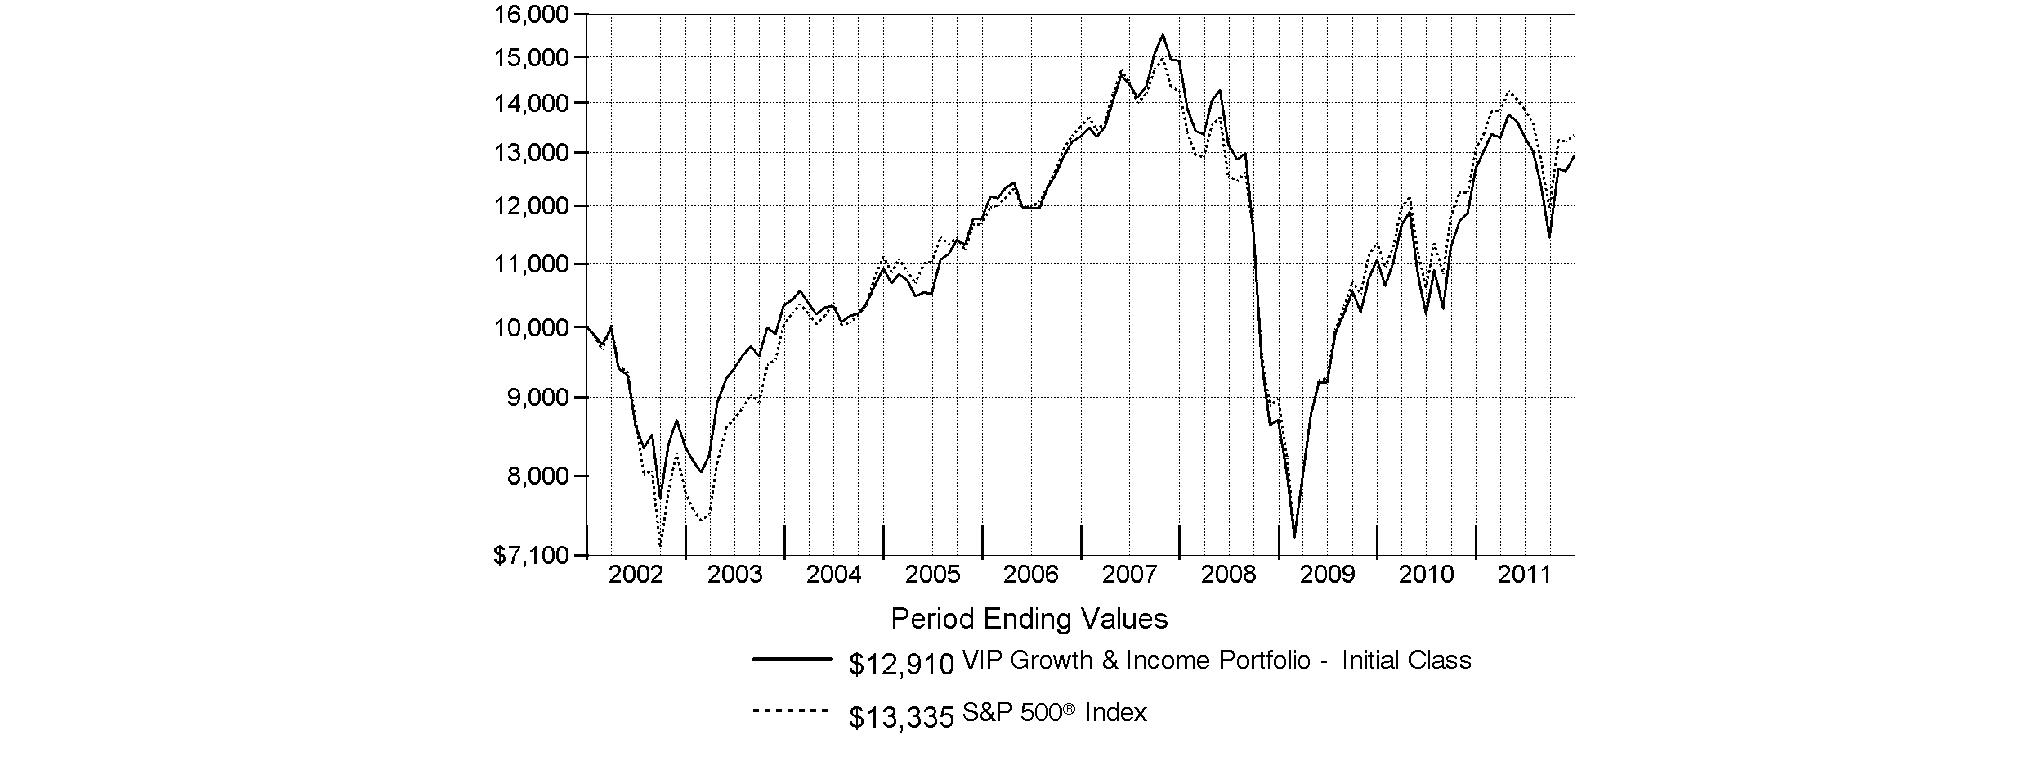
Annual Report
Market Recap: Extreme market volatility took center stage during the 12 months ending December 31, 2011, stealing the spotlight from signs of progress in the global economy. Early in the year, aggressive monetary stimulus by the U.S. federal government, improving credit-market conditions and solid corporate earnings buoyed most major asset classes. As the period progressed, however, fresh worries about sovereign debt in Europe, inflation in China, gridlock over raising the debt ceiling in the U.S. - along with Standard & Poor's early-August downgrade of the nation's long-term sovereign credit rating - and a dimmed outlook for global growth punctured investor confidence and ignited market instability. Domestic equities, as measured by the broad-based S&P 500® Index, gained 2.11%, easily outpacing the 13.61% decline of MSCI® ACWI® (All Country World Index) ex USA Index, a proxy for foreign stocks. Within the MSCI index, emerging markets declined the most (-18%), with investments here generally held back by a stronger U.S. dollar. The U.K. (-3%) fared better than the rest of Europe (-15%), which was the second-worst-performing index component. Bolstered by periodic flights to quality, U.S. investment-grade bonds posted a 7.84% advance, as reflected by the Barclays Capital® U.S. Aggregate Bond Index, outperforming the 4.37% gain of high-yield securities, as represented by The BofA Merrill LynchSM US High Yield Constrained Index. Hampered by financial woes in Europe, the sovereign debt of major developed markets outside the U.S. rose 4.86%, according to the Citigroup® Non-USD Group-of-Seven (G7) Equal Weighted Index, while the JPMorgan Emerging Markets Bond Index Global (EMBI Global) advanced 8.46%, despite the currency head wind.
Comments from Matthew Fruhan, who became Portfolio Manager of VIP Growth & Income Portfolio on February 1, 2011: For the year, the fund's share classes underperformed the S&P 500®. (For specific portfolio results, please refer to the performance section of this report.) The biggest negative impact came from security selection within the retailing and technology hardware/equipment industries. My picks in capitals goods, health care and consumer staples also detracted. The fund was hurt by an overweight in financials - especially banks - which was by far the worst-performing sector within the index. Conversely, security selection among software/services names boosted performance, as did my picks within financials, particularly diversified financials, and modest overweights in the strong-performing consumer staples sector and the pharmaceuticals/biotech/life science industry within health care. The biggest individual detractor was a sizable position in diversified financials firm JPMorgan Chase, which underperformed during the period. The fund's underweight in Philip Morris International detracted because the tobacco company increased earnings estimates, and the stock rose. I sold Philip Morris prior to period end. Within capital goods, the fund's stake in Ingersoll-Rand detracted, as the stock meaningfully underperformed after management's lack of execution resulted in disappointing second-quarter financial results and a significant downward revision to long-term earnings estimates. Another capital goods name, Koninklijke Philips Electronics, which was not in the index, suffered when the new CEO lowered long-term revenue and profit margin targets for the firm, and the stock lagged. The top individual contributor was an out-of-index stake in U.K.-based Autonomy, a provider of cloud computing services, which rose sharply in August on a takeover bid from Hewlett-Packard. I sold Autonomy shortly after the announcement, and the merger was completed in October. Also in software/services, card processor MasterCard had strong performance, based in part on higher revenue from growth in transaction volume and pricing. An overweight in restaurant chain McDonald's helped, as strong same-store sales led to positive earnings revisions.
The views expressed above reflect those of the portfolio manager(s) only through the end of the period as stated on the cover of this report and do not necessarily represent the views of Fidelity or any other person in the Fidelity organization. Any such views are subject to change at any time based upon market or other conditions and Fidelity disclaims any responsibility to update such views. These views may not be relied on as investment advice and, because investment decisions for a Fidelity fund are based on numerous factors, may not be relied on as an indication of trading intent on behalf of any Fidelity fund.
Annual Report
As a shareholder of the Fund, you incur two types of costs: (1) transaction costs, and (2) ongoing costs, including management fees, distribution and/or service (12b-1) fees and other Fund expenses. This Example is intended to help you understand your ongoing costs (in dollars) of investing in the Fund and to compare these costs with the ongoing costs of investing in other mutual funds.
The Example is based on an investment of $1,000 invested at the beginning of the period and held for the entire period (July 1, 2011 to December 31, 2011).
Actual Expenses
The first line of the accompanying table for each class of the Fund provides information about actual account values and actual expenses. You may use the information in this line, together with the amount you invested, to estimate the expenses that you paid over the period. Simply divide your account value by $1,000.00 (for example, an $8,600 account value divided by $1,000.00 = 8.6), then multiply the result by the number in the first line for a class of the Fund under the heading entitled "Expenses Paid During Period" to estimate the expenses you paid on your account during this period. The estimate of expenses does not include any fees or other expenses of any variable annuity or variable life insurance product. If they were, the estimate of expenses you paid during the period would be higher, and your ending account value would be lower. In addition, the Fund, as a shareholder in the underlying Fidelity Central Funds, will indirectly bear its pro-rata share of the fees and expenses incurred by the underlying Fidelity Central Funds. These fees and expenses are not included in the Fund's annualized expense ratio used to calculate the expense estimate in the table below.
Hypothetical Example for Comparison Purposes
The second line of the accompanying table for each class of the Fund provides information about hypothetical account values and hypothetical expenses based on a Class' actual expense ratio and an assumed rate of return of 5% per year before expenses, which is not the Class' actual return. The hypothetical account values and expenses may not be used to estimate the actual ending account balance or expenses you paid for the period. You may use this information to compare the ongoing costs of investing in the Fund and other funds. To do so, compare this 5% hypothetical example with the 5% hypothetical examples that appear in the shareholder reports of the other funds. The estimate of expenses does not include any fees or other expenses of any variable annuity or variable life insurance product. If they were, the estimate of expenses you paid during the period would be higher, and your ending account value would be lower. In addition, the Fund, as a shareholder in the underlying Fidelity Central Funds, will indirectly bear its pro-rata share of the fees and expenses incurred by the underlying Fidelity Central Funds. These fees and expenses are not included in the Fund's annualized expense ratio used to calculate the expense estimate in the table below.
Please note that the expenses shown in the table are meant to highlight your ongoing costs only and do not reflect any transaction costs. Therefore, the second line of the table is useful in comparing ongoing costs only, and will not help you determine the relative total costs of owning different funds.
| Annualized Expense Ratio | Beginning
Account Value
July 1, 2011 | Ending
Account Value
December 31, 2011 | Expenses Paid
During Period*
July 1, 2011 to
December 31, 2011 |
Initial Class | .59% | | | |
Actual | | $ 1,000.00 | $ 972.20 | $ 2.93 |
HypotheticalA | | $ 1,000.00 | $ 1,022.23 | $ 3.01 |
Service Class | .69% | | | |
Actual | | $ 1,000.00 | $ 971.60 | $ 3.43 |
HypotheticalA | | $ 1,000.00 | $ 1,021.73 | $ 3.52 |
Service Class 2 | .84% | | | |
Actual | | $ 1,000.00 | $ 970.60 | $ 4.17 |
HypotheticalA | | $ 1,000.00 | $ 1,020.97 | $ 4.28 |
Investor Class | .68% | | | |
Actual | | $ 1,000.00 | $ 971.30 | $ 3.38 |
HypotheticalA | | $ 1,000.00 | $ 1,021.78 | $ 3.47 |
A 5% return per year before expenses
* Expenses are equal to each Class' annualized expense ratio, multiplied by the average account value over the period, multiplied by 184/365 (to reflect the one-half year period).
Annual Report
Investment Changes (Unaudited)
Top Ten Stocks as of December 31, 2011 |
| % of fund's
net assets | % of fund's net assets
6 months ago |
Apple, Inc. | 3.9 | 2.9 |
Chevron Corp. | 3.8 | 3.7 |
Exxon Mobil Corp. | 3.6 | 3.6 |
Wells Fargo & Co. | 3.5 | 3.7 |
JPMorgan Chase & Co. | 3.3 | 3.2 |
General Electric Co. | 2.5 | 0.8 |
Google, Inc. Class A | 2.0 | 1.3 |
Procter & Gamble Co. | 1.9 | 1.7 |
Merck & Co., Inc. | 1.9 | 1.9 |
PepsiCo, Inc. | 1.8 | 2.2 |
| 28.2 | |
Top Five Market Sectors as of December 31, 2011 |
| % of fund's
net assets | % of fund's net assets
6 months ago |
Information Technology | 17.5 | 16.8 |
Financials | 17.0 | 18.2 |
Industrials | 13.7 | 12.8 |
Consumer Discretionary | 13.4 | 12.7 |
Energy | 12.0 | 11.1 |
Asset Allocation (% of fund's net assets) |
As of December 31, 2011 * | As of June 30, 2011 ** |
 | Stocks 99.3% | | | Stocks 99.6% | |
 | Bonds 0.2% | | | Bonds 0.2% | |
 | Short-Term
Investments and
Net Other Assets 0.5% | | | Short-Term
Investments and
Net Other Assets 0.2% | |
* Foreign investments | 13.0% | | ** Foreign investments | 19.7% | |

Annual Report
Investments December 31, 2011
Showing Percentage of Net Assets
Common Stocks - 97.9% |
| Shares | | Value |
CONSUMER DISCRETIONARY - 12.7% |
Auto Components - 0.2% |
Autoliv, Inc. | 19,901 | | $ 1,064,504 |
Automobiles - 0.1% |
Bayerische Motoren Werke AG (BMW) | 13,655 | | 914,860 |
Distributors - 0.4% |
Li & Fung Ltd. | 1,274,000 | | 2,358,834 |
LKQ Corp. (a) | 20,800 | | 625,664 |
| | 2,984,498 |
Hotels, Restaurants & Leisure - 2.3% |
Carnival Corp. unit | 6,600 | | 215,424 |
Darden Restaurants, Inc. | 22,400 | | 1,020,992 |
McDonald's Corp. | 104,515 | | 10,485,990 |
Yum! Brands, Inc. | 80,488 | | 4,749,597 |
| | 16,472,003 |
Household Durables - 1.4% |
D.R. Horton, Inc. | 210,188 | | 2,650,471 |
Lennar Corp. Class A | 19,800 | | 389,070 |
Ryland Group, Inc. | 191,659 | | 3,020,546 |
Toll Brothers, Inc. (a) | 210,050 | | 4,289,221 |
| | 10,349,308 |
Leisure Equipment & Products - 0.3% |
Hasbro, Inc. | 66,368 | | 2,116,476 |
Media - 4.1% |
Comcast Corp.: | | | |
Class A | 3,100 | | 73,501 |
Class A (special) (non-vtg.) | 367,391 | | 8,655,732 |
Informa PLC | 37,143 | | 208,429 |
Kabel Deutschland Holding AG (a) | 15,900 | | 807,082 |
Regal Entertainment Group Class A (d) | 44,675 | | 533,420 |
The Walt Disney Co. | 77,473 | | 2,905,238 |
Time Warner Cable, Inc. | 41,444 | | 2,634,595 |
Time Warner, Inc. | 306,995 | | 11,094,799 |
Viacom, Inc. Class B (non-vtg.) | 54,571 | | 2,478,069 |
| | 29,390,865 |
Multiline Retail - 1.6% |
Target Corp. | 228,990 | | 11,728,868 |
Specialty Retail - 2.2% |
Destination Maternity Corp. | 26,000 | | 434,720 |
Foot Locker, Inc. | 8,900 | | 212,176 |
Limited Brands, Inc. | 21,700 | | 875,595 |
Lowe's Companies, Inc. | 455,678 | | 11,565,108 |
Staples, Inc. | 218,970 | | 3,041,493 |
| | 16,129,092 |
Textiles, Apparel & Luxury Goods - 0.1% |
VF Corp. | 4,300 | | 546,057 |
TOTAL CONSUMER DISCRETIONARY | | 91,696,531 |
|
| Shares | | Value |
CONSUMER STAPLES - 11.9% |
Beverages - 4.0% |
Dr Pepper Snapple Group, Inc. | 110,171 | | $ 4,349,551 |
Molson Coors Brewing Co. Class B | 17,303 | | 753,373 |
PepsiCo, Inc. | 203,977 | | 13,533,874 |
The Coca-Cola Co. | 152,688 | | 10,683,579 |
| | 29,320,377 |
Food & Staples Retailing - 1.3% |
CVS Caremark Corp. | 91,464 | | 3,729,902 |
Sysco Corp. | 91,245 | | 2,676,216 |
Walgreen Co. | 96,878 | | 3,202,787 |
| | 9,608,905 |
Food Products - 0.7% |
Danone | 73,500 | | 4,620,872 |
Mead Johnson Nutrition Co. Class A | 2,900 | | 199,317 |
| | 4,820,189 |
Household Products - 3.8% |
Colgate-Palmolive Co. | 51,802 | | 4,785,987 |
Kimberly-Clark Corp. | 119,873 | | 8,817,858 |
Procter & Gamble Co. | 204,808 | | 13,662,742 |
WD-40 Co. | 4,372 | | 176,673 |
| | 27,443,260 |
Tobacco - 2.1% |
British American Tobacco PLC sponsored ADR | 100,500 | | 9,535,440 |
Lorillard, Inc. | 49,265 | | 5,616,210 |
| | 15,151,650 |
TOTAL CONSUMER STAPLES | | 86,344,381 |
ENERGY - 12.0% |
Energy Equipment & Services - 0.9% |
BW Offshore Ltd. | 95,600 | | 151,075 |
Exterran Partners LP | 78,985 | | 1,591,548 |
Halliburton Co. | 106,680 | | 3,681,527 |
Helmerich & Payne, Inc. | 12,084 | | 705,222 |
Schlumberger Ltd. | 1,100 | | 75,141 |
| | 6,204,513 |
Oil, Gas & Consumable Fuels - 11.1% |
ARC Resources Ltd. (d) | 61,700 | | 1,520,689 |
Atlas Pipeline Partners, LP | 41,100 | | 1,526,865 |
Bonavista Energy Corp. (e) | 30,600 | | 783,329 |
Chevron Corp. | 256,049 | | 27,243,614 |
EXCO Resources, Inc. | 80,000 | | 836,000 |
Exxon Mobil Corp. | 308,060 | | 26,111,166 |
Inergy LP | 37,560 | | 917,215 |
Inergy Midstream LP | 34,300 | | 649,985 |
Legacy Reserves LP | 31,702 | | 895,264 |
Occidental Petroleum Corp. | 16,600 | | 1,555,420 |
Penn West Petroleum Ltd. (d) | 55,400 | | 1,098,317 |
Royal Dutch Shell PLC Class A (United Kingdom) | 266,582 | | 9,781,649 |
Common Stocks - continued |
| Shares | | Value |
ENERGY - continued |
Oil, Gas & Consumable Fuels - continued |
Suncor Energy, Inc. | 157,800 | | $ 4,552,400 |
Talisman Energy, Inc. | 58,900 | | 750,709 |
Williams Companies, Inc. | 67,710 | | 2,235,784 |
| | 80,458,406 |
TOTAL ENERGY | | 86,662,919 |
FINANCIALS - 17.0% |
Capital Markets - 3.4% |
Apollo Global Management LLC Class A | 86,370 | | 1,071,852 |
Ashmore Group PLC | 510,571 | | 2,648,598 |
Bank of New York Mellon Corp. | 1,800 | | 35,838 |
BlackRock, Inc. Class A | 8,000 | | 1,425,920 |
Charles Schwab Corp. | 215,068 | | 2,421,666 |
Goldman Sachs Group, Inc. | 22,661 | | 2,049,234 |
Greenhill & Co., Inc. | 9,950 | | 361,882 |
KKR & Co. LP | 226,941 | | 2,911,653 |
Morgan Stanley | 193,671 | | 2,930,242 |
Northern Trust Corp. | 66,577 | | 2,640,444 |
State Street Corp. | 38,602 | | 1,556,047 |
T. Rowe Price Group, Inc. | 46,522 | | 2,649,428 |
The Blackstone Group LP | 159,285 | | 2,231,583 |
| | 24,934,387 |
Commercial Banks - 7.2% |
Bank of Montreal | 5,400 | | 296,300 |
BB&T Corp. | 292,058 | | 7,351,100 |
City National Corp. | 6,100 | | 269,498 |
Comerica, Inc. | 18,300 | | 472,140 |
DBS Group Holdings Ltd. | 37,193 | | 330,311 |
HSBC Holdings PLC sponsored ADR | 6,596 | | 251,308 |
Regions Financial Corp. | 561,511 | | 2,414,497 |
Standard Chartered PLC (United Kingdom) | 88,590 | | 1,938,693 |
SunTrust Banks, Inc. | 197,321 | | 3,492,582 |
U.S. Bancorp | 367,329 | | 9,936,249 |
Wells Fargo & Co. | 929,153 | | 25,607,457 |
| | 52,360,135 |
Diversified Financial Services - 4.4% |
Citigroup, Inc. | 143,800 | | 3,783,378 |
JPMorgan Chase & Co. | 703,852 | | 23,403,079 |
KKR Financial Holdings LLC | 497,490 | | 4,343,088 |
| | 31,529,545 |
Insurance - 0.4% |
MetLife, Inc. | 32,933 | | 1,026,851 |
MetLife, Inc. unit (a) | 30,400 | | 1,866,864 |
| | 2,893,715 |
Real Estate Investment Trusts - 1.4% |
American Capital Agency Corp. | 33,900 | | 951,912 |
BRE Properties, Inc. | 22,000 | | 1,110,560 |
|
| Shares | | Value |
CBL & Associates Properties, Inc. | 170,801 | | $ 2,681,576 |
Education Realty Trust, Inc. | 37,500 | | 383,625 |
Pennsylvania Real Estate Investment Trust (SBI) | 28,200 | | 294,408 |
Public Storage | 23,534 | | 3,164,382 |
Rayonier, Inc. | 14,000 | | 624,820 |
Ventas, Inc. | 11,069 | | 610,234 |
| | 9,821,517 |
Thrifts & Mortgage Finance - 0.2% |
First Niagara Financial Group, Inc. | 129,767 | | 1,119,889 |
MGIC Investment Corp. (a) | 3,300 | | 12,309 |
Radian Group, Inc. | 94,900 | | 222,066 |
| | 1,354,264 |
TOTAL FINANCIALS | | 122,893,563 |
HEALTH CARE - 10.2% |
Biotechnology - 1.3% |
Amgen, Inc. | 133,404 | | 8,565,871 |
ARIAD Pharmaceuticals, Inc. (a) | 65,700 | | 804,825 |
| | 9,370,696 |
Health Care Equipment & Supplies - 0.2% |
Meridian Bioscience, Inc. | 38,968 | | 734,157 |
St. Jude Medical, Inc. | 21,700 | | 744,310 |
| | 1,478,467 |
Health Care Providers & Services - 1.9% |
Aetna, Inc. | 24,278 | | 1,024,289 |
Brookdale Senior Living, Inc. (a) | 111,500 | | 1,938,985 |
Express Scripts, Inc. (a) | 23,595 | | 1,054,461 |
McKesson Corp. | 80,446 | | 6,267,548 |
Medco Health Solutions, Inc. (a) | 23,316 | | 1,303,364 |
WellPoint, Inc. | 37,815 | | 2,505,244 |
| | 14,093,891 |
Life Sciences Tools & Services - 0.1% |
QIAGEN NV (a) | 76,460 | | 1,055,913 |
Pharmaceuticals - 6.7% |
Abbott Laboratories | 94,100 | | 5,291,243 |
Cardiome Pharma Corp. (a) | 76,654 | | 201,600 |
GlaxoSmithKline PLC sponsored ADR | 147,800 | | 6,744,114 |
Johnson & Johnson | 119,623 | | 7,844,876 |
Merck & Co., Inc. | 359,877 | | 13,567,363 |
Pfizer, Inc. | 484,554 | | 10,485,749 |
Roche Holding AG (participation certificate) | 15,560 | | 2,637,653 |
Sanofi-aventis | 19,887 | | 1,453,862 |
| | 48,226,460 |
TOTAL HEALTH CARE | | 74,225,427 |
INDUSTRIALS - 13.7% |
Aerospace & Defense - 3.7% |
Honeywell International, Inc. | 98,243 | | 5,339,507 |
Common Stocks - continued |
| Shares | | Value |
INDUSTRIALS - continued |
Aerospace & Defense - continued |
MTU Aero Engines Holdings AG | 9,313 | | $ 595,987 |
Raytheon Co. | 57,655 | | 2,789,349 |
Rockwell Collins, Inc. | 93,600 | | 5,182,632 |
The Boeing Co. | 81,900 | | 6,007,365 |
United Technologies Corp. | 95,664 | | 6,992,082 |
| | 26,906,922 |
Air Freight & Logistics - 1.0% |
C.H. Robinson Worldwide, Inc. | 24,881 | | 1,736,196 |
United Parcel Service, Inc. Class B | 76,933 | | 5,630,726 |
| | 7,366,922 |
Building Products - 0.8% |
Lennox International, Inc. | 56,810 | | 1,917,338 |
Owens Corning (a) | 128,268 | | 3,683,857 |
| | 5,601,195 |
Commercial Services & Supplies - 0.6% |
Aggreko PLC | 2,490 | | 78,004 |
Healthcare Services Group, Inc. | 40,989 | | 725,095 |
Interface, Inc. Class A | 36,653 | | 422,976 |
Intrum Justitia AB | 15,591 | | 244,144 |
Republic Services, Inc. | 81,070 | | 2,233,479 |
Ritchie Brothers Auctioneers, Inc. (d) | 30,800 | | 680,064 |
US Ecology, Inc. | 12,015 | | 225,642 |
| | 4,609,404 |
Electrical Equipment - 0.7% |
Acuity Brands, Inc. | 4,000 | | 212,000 |
Emerson Electric Co. | 97,135 | | 4,525,520 |
Rockwell Automation, Inc. | 954 | | 69,995 |
Roper Industries, Inc. | 3,329 | | 289,190 |
Zumtobel AG | 15,744 | | 217,855 |
| | 5,314,560 |
Industrial Conglomerates - 4.4% |
3M Co. | 10,324 | | 843,781 |
Danaher Corp. | 103,900 | | 4,887,456 |
General Electric Co. | 993,424 | | 17,792,224 |
Koninklijke Philips Electronics NV (depositary receipt) (NY Reg.) (d) | 384,283 | | 8,050,729 |
Siemens AG | 3,610 | | 345,430 |
| | 31,919,620 |
Machinery - 1.2% |
Douglas Dynamics, Inc. | 99,837 | | 1,459,617 |
Graco, Inc. | 22,130 | | 904,896 |
Ingersoll-Rand PLC | 138,743 | | 4,227,499 |
PACCAR, Inc. | 32,158 | | 1,204,960 |
Pfeiffer Vacuum Technology AG (d) | 5,688 | | 497,855 |
| | 8,294,827 |
Professional Services - 1.0% |
Bureau Veritas SA | 39,607 | | 2,886,349 |
|
| Shares | | Value |
Michael Page International PLC | 477,588 | | $ 2,587,279 |
Robert Half International, Inc. | 48,537 | | 1,381,363 |
| | 6,854,991 |
Trading Companies & Distributors - 0.3% |
Watsco, Inc. | 32,197 | | 2,114,055 |
TOTAL INDUSTRIALS | | 98,982,496 |
INFORMATION TECHNOLOGY - 17.5% |
Communications Equipment - 2.1% |
Cisco Systems, Inc. | 534,770 | | 9,668,642 |
Juniper Networks, Inc. (a) | 136,835 | | 2,792,802 |
QUALCOMM, Inc. | 56,228 | | 3,075,672 |
| | 15,537,116 |
Computers & Peripherals - 5.2% |
Apple, Inc. (a) | 69,524 | | 28,157,207 |
EMC Corp. (a) | 206,467 | | 4,447,299 |
Hewlett-Packard Co. | 185,775 | | 4,785,564 |
| | 37,390,070 |
Electronic Equipment & Components - 0.7% |
Coretronic Corp. | 1,214,000 | | 821,760 |
Corning, Inc. | 236,808 | | 3,073,768 |
Everlight Electronics Co. Ltd. | 515,000 | | 896,170 |
Premier Farnell PLC | 177,795 | | 497,056 |
| | 5,288,754 |
Internet Software & Services - 2.0% |
Google, Inc. Class A (a) | 22,683 | | 14,650,950 |
IT Services - 5.1% |
Accenture PLC Class A | 14,800 | | 787,804 |
Cognizant Technology Solutions Corp. Class A (a) | 42,522 | | 2,734,590 |
Fidelity National Information Services, Inc. | 113,862 | | 3,027,591 |
International Business Machines Corp. | 33,500 | | 6,159,980 |
MasterCard, Inc. Class A | 20,711 | | 7,721,475 |
Paychex, Inc. | 312,762 | | 9,417,264 |
Visa, Inc. Class A | 67,391 | | 6,842,208 |
| | 36,690,912 |
Semiconductors & Semiconductor Equipment - 0.4% |
KLA-Tencor Corp. | 1,455 | | 70,204 |
Siliconware Precision Industries Co. Ltd. sponsored ADR | 419,270 | | 1,828,017 |
Taiwan Semiconductor Manufacturing Co. Ltd. sponsored ADR | 76,100 | | 982,451 |
| | 2,880,672 |
Software - 2.0% |
ANSYS, Inc. (a) | 17,463 | | 1,000,281 |
Microsoft Corp. | 323,250 | | 8,391,570 |
Oracle Corp. | 106,287 | | 2,726,262 |
Common Stocks - continued |
| Shares | | Value |
INFORMATION TECHNOLOGY - continued |
Software - continued |
Royalblue Group PLC | 20,052 | | $ 471,205 |
Solera Holdings, Inc. | 34,544 | | 1,538,590 |
| | 14,127,908 |
TOTAL INFORMATION TECHNOLOGY | | 126,566,382 |
MATERIALS - 0.6% |
Chemicals - 0.3% |
Air Products & Chemicals, Inc. | 13,862 | | 1,180,904 |
CF Industries Holdings, Inc. | 500 | | 72,490 |
E.I. du Pont de Nemours & Co. | 22,243 | | 1,018,285 |
| | 2,271,679 |
Metals & Mining - 0.3% |
Commercial Metals Co. | 64,008 | | 885,231 |
Nucor Corp. | 31,416 | | 1,243,131 |
| | 2,128,362 |
TOTAL MATERIALS | | 4,400,041 |
TELECOMMUNICATION SERVICES - 0.5% |
Diversified Telecommunication Services - 0.5% |
CenturyLink, Inc. | 43,644 | | 1,623,557 |
Koninklijke KPN NV | 152,065 | | 1,819,720 |
| | 3,443,277 |
UTILITIES - 1.8% |
Electric Utilities - 0.7% |
American Electric Power Co., Inc. | 30,038 | | 1,240,870 |
FirstEnergy Corp. | 12,222 | | 541,435 |
NextEra Energy, Inc. | 22,647 | | 1,378,749 |
PPL Corp. | 65,019 | | 1,912,859 |
| | 5,073,913 |
Gas Utilities - 0.3% |
National Fuel Gas Co. | 23,126 | | 1,285,343 |
ONEOK, Inc. | 8,600 | | 745,534 |
| | 2,030,877 |
|
| Shares | | Value |
Multi-Utilities - 0.8% |
National Grid PLC | 527,839 | | $ 5,102,472 |
TECO Energy, Inc. | 65,812 | | 1,259,642 |
| | 6,362,114 |
TOTAL UTILITIES | | 13,466,904 |
TOTAL COMMON STOCKS (Cost $681,134,249) |
708,681,921
|
Preferred Stocks - 1.4% |
| | | |
Convertible Preferred Stocks - 0.7% |
HEALTH CARE - 0.6% |
Health Care Equipment & Supplies - 0.5% |
Alere, Inc. 3.00% | 17,277 | | 3,628,170 |
Health Care Providers & Services - 0.1% |
Omnicare Capital Trust II Series B, 4.00% | 10,300 | | 466,796 |
TOTAL HEALTH CARE | | 4,094,966 |
UTILITIES - 0.1% |
Electric Utilities - 0.1% |
PPL Corp. 8.75% | 16,000 | | 877,760 |
TOTAL CONVERTIBLE PREFERRED STOCKS | | 4,972,726 |
Nonconvertible Preferred Stocks - 0.7% |
CONSUMER DISCRETIONARY - 0.7% |
Automobiles - 0.7% |
Porsche Automobil Holding SE (Germany) | 28,798 | | 1,541,368 |
Volkswagen AG | 23,490 | | 3,519,432 |
| | 5,060,800 |
TOTAL PREFERRED STOCKS (Cost $11,737,435) |
10,033,526
|
Corporate Bonds - 0.2% |
| Principal Amount | | |
Convertible Bonds - 0.2% |
HEALTH CARE - 0.2% |
Health Care Equipment & Supplies - 0.0% |
Integra LifeSciences Holdings Corp. 1.625% 12/15/16 (e) | | $ 250,000 | | 213,906 |
Health Care Providers & Services - 0.2% |
Omnicare, Inc. 3.75% 12/15/25 | | 710,000 | | 983,975 |
TOTAL HEALTH CARE | | 1,197,881 |
Corporate Bonds - continued |
| Principal Amount | | Value |
Nonconvertible Bonds - 0.0% |
FINANCIALS - 0.0% |
Thrifts & Mortgage Finance - 0.0% |
Radian Group, Inc. 5.625% 2/15/13 | | $ 700,000 | | $ 448,000 |
TOTAL CORPORATE BONDS (Cost $1,500,803) |
1,645,881
|
Money Market Funds - 1.4% |
| Shares | | |
Fidelity Cash Central Fund, 0.11% (b) | 3,593,162 | | 3,593,162 |
Fidelity Securities Lending Cash Central Fund, 0.13% (b)(c) | 6,594,152 | | 6,594,152 |
TOTAL MONEY MARKET FUNDS (Cost $10,187,314) |
10,187,314
|
TOTAL INVESTMENT PORTFOLIO - 100.9% (Cost $704,559,801) | | 730,548,642 |
NET OTHER ASSETS (LIABILITIES) - (0.9)% | | (6,229,000) |
NET ASSETS - 100% | $ 724,319,642 |
Legend |
(a) Non-income producing |
(b) Affiliated fund that is available only to investment companies and other accounts managed by Fidelity Investments. The rate quoted is the annualized seven-day yield of the fund at period end. A complete unaudited listing of the fund's holdings as of its most recent quarter end is available upon request. In addition, each Fidelity Central Fund's financial statements, which are not covered by the Fund's Report of Independent Registered Public Accounting Firm, are available on the SEC's website or upon request. |
(c) Investment made with cash collateral received from securities on loan. |
(d) Security or a portion of the security is on loan at period end. |
(e) Security exempt from registration under Rule 144A of the Securities Act of 1933. These securities may be resold in transactions exempt from registration, normally to qualified institutional buyers. At the end of the period, the value of these securities amounted to $997,235 or 0.1% of net assets. |
Affiliated Central Funds |
Information regarding fiscal year to date income earned by the Fund from investments in Fidelity Central Funds is as follows: |
Fund | Income earned |
Fidelity Cash Central Fund | $ 6,747 |
Fidelity Securities Lending Cash Central Fund | 92,111 |
Total | $ 98,858 |
Other Information |
The following is a summary of the inputs used, as of December 31, 2011, involving the Fund's assets and liabilities carried at fair value. The inputs or methodology used for valuing securities may not be an indication of the risk associated with investing in those securities. For more information on valuation inputs, and their aggregation into the levels used in the tables below, please refer to the Security Valuation section in the accompanying Notes to Financial Statements. |
Valuation Inputs at Reporting Date: |
Description | Total | Level 1 | Level 2 | Level 3 |
Investments in Securities: | | | | |
Equities: | | | | |
Consumer Discretionary | $ 96,757,331 | $ 96,757,331 | $ - | $ - |
Consumer Staples | 86,344,381 | 86,344,381 | - | - |
Energy | 86,662,919 | 76,881,270 | 9,781,649 | - |
Financials | 122,893,563 | 121,026,699 | 1,866,864 | - |
Health Care | 78,320,393 | 76,866,531 | 1,453,862 | - |
Industrials | 98,982,496 | 98,419,211 | 563,285 | - |
Information Technology | 126,566,382 | 126,566,382 | - | - |
Materials | 4,400,041 | 4,400,041 | - | - |
Telecommunication Services | 3,443,277 | 3,443,277 | - | - |
Utilities | 14,344,664 | 8,364,432 | 5,980,232 | - |
Corporate Bonds | 1,645,881 | - | 1,645,881 | - |
Money Market Funds | 10,187,314 | 10,187,314 | - | - |
Total Investments in Securities: | $ 730,548,642 | $ 709,256,869 | $ 21,291,773 | $ - |
The following is a reconciliation of Investments in Securities for which Level 3 inputs were used in determining value: |
Investments in Securities: | |
Beginning Balance | $ 390,000 |
Total Realized Gain (Loss) | (65,406) |
Total Unrealized Gain (Loss) | 10,000 |
Cost of Purchases | - |
Proceeds of Sales | (334,594) |
Amortization/Accretion | - |
Transfers in to Level 3 | - |
Transfers out of Level 3 | - |
Ending Balance | $ - |
The change in unrealized gain (loss) for the period attributable to Level 3 securities held at December 31, 2011 | $ - |
The information used in the above reconciliation represents fiscal year to date activity for any Investments in Securities identified as using Level 3 inputs at either the beginning or the end of the current fiscal period. Transfers in or out of Level 3 represent the beginning value of any Security or Instrument where a change in the pricing level occurred from the beginning to the end of the period. The cost of purchases and the proceeds of sales may include securities received or delivered through corporate actions or exchanges. Realized and unrealized gains (losses) disclosed in the reconciliation are included in Net Gain (Loss) on the Fund's Statement of Operations. |
Distribution of investments by country of issue, as a percentage of total net assets, is as follows: (Unaudited) |
United States of America | 87.0% |
United Kingdom | 5.6% |
Netherlands | 1.5% |
Canada | 1.3% |
France | 1.3% |
Germany | 1.1% |
Others (Individually Less Than 1%) | 2.2% |
| 100.0% |
See accompanying notes which are an integral part of the financial statements.
Annual Report
Statement of Assets and Liabilities
| December 31, 2011 |
| | |
Assets | | |
Investment in securities, at value (including securities loaned of $6,380,539) - See accompanying schedule: Unaffiliated issuers (cost $694,372,487) | $ 720,361,328 | |
Fidelity Central Funds (cost $10,187,314) | 10,187,314 | |
Total Investments (cost $704,559,801) | | $ 730,548,642 |
Cash | | 16,430 |
Foreign currency held at value (cost $10,871) | | 10,871 |
Receivable for investments sold | | 1,165,759 |
Receivable for fund shares sold | | 1,452,326 |
Dividends receivable | | 1,309,137 |
Interest receivable | | 16,044 |
Distributions receivable from Fidelity Central Funds | | 3,638 |
Prepaid expenses | | 1,942 |
Other receivables | | 128,665 |
Total assets | | 734,653,454 |
| | |
Liabilities | | |
Payable for investments purchased | $ 2,150,652 | |
Payable for fund shares redeemed | 1,134,036 | |
Accrued management fee | 272,924 | |
Distribution and service plan fees payable | 66,529 | |
Other affiliated payables | 64,848 | |
Other payables and accrued expenses | 50,671 | |
Collateral on securities loaned, at value | 6,594,152 | |
Total liabilities | | 10,333,812 |
| | |
Net Assets | | $ 724,319,642 |
Net Assets consist of: | | |
Paid in capital | | $ 825,303,306 |
Distributions in excess of net investment income | | (16,656) |
Accumulated undistributed net realized gain (loss) on investments and foreign currency transactions | | (126,954,657) |
Net unrealized appreciation (depreciation) on investments and assets and liabilities in foreign currencies | | 25,987,649 |
Net Assets | | $ 724,319,642 |
Statement of Assets and Liabilities - continued
| December 31, 2011 |
| | |
Initial Class:
Net Asset Value, offering price and redemption price per share ($262,593,801 ÷ 20,860,178 shares) | | $ 12.59 |
| | |
Service Class:
Net Asset Value, offering price and redemption price per share ($121,871,045 ÷ 9,743,658 shares) | | $ 12.51 |
| | |
Service Class 2:
Net Asset Value, offering price and redemption price per share ($273,490,983 ÷ 22,073,283 shares) | | $ 12.39 |
| | |
Investor Class:
Net Asset Value, offering price and redemption price per share ($66,363,813 ÷ 5,283,434 shares) | | $ 12.56 |
See accompanying notes which are an integral part of the financial statements.
Annual Report
Statement of Operations
| Year ended December 31, 2011 |
| | |
Investment Income | | |
Dividends | | $ 17,524,694 |
Interest | | 78,033 |
Income from Fidelity Central Funds | | 98,858 |
Total income | | 17,701,585 |
| | |
Expenses | | |
Management fee | $ 3,464,604 | |
Transfer agent fees | 624,857 | |
Distribution and service plan fees | 863,754 | |
Accounting and security lending fees | 267,365 | |
Custodian fees and expenses | 100,427 | |
Independent trustees' compensation | 4,298 | |
Audit | 60,877 | |
Legal | 3,645 | |
Interest | 143 | |
Miscellaneous | 7,429 | |
Total expenses before reductions | 5,397,399 | |
Expense reductions | (88,578) | 5,308,821 |
Net investment income (loss) | | 12,392,764 |
Realized and Unrealized Gain (Loss) Net realized gain (loss) on: | | |
Investment securities: | | |
Unaffiliated issuers | 105,007,475 | |
Foreign currency transactions | (85,016) | |
Total net realized gain (loss) | | 104,922,459 |
Change in net unrealized appreciation (depreciation) on: Investment securities | (105,254,152) | |
Assets and liabilities in foreign currencies | (7,003) | |
Total change in net unrealized appreciation (depreciation) | | (105,261,155) |
Net gain (loss) | | (338,696) |
Net increase (decrease) in net assets resulting from operations | | $ 12,054,068 |
Statement of Changes in Net Assets
| Year ended
December 31, 2011 | Year ended
December 31, 2010 |
Increase (Decrease) in Net Assets | | |
Operations | | |
Net investment income (loss) | $ 12,392,764 | $ 4,329,088 |
Net realized gain (loss) | 104,922,459 | 40,138,808 |
Change in net unrealized appreciation (depreciation) | (105,261,155) | 59,568,063 |
Net increase (decrease) in net assets resulting from operations | 12,054,068 | 104,035,959 |
Distributions to shareholders from net investment income | (12,483,991) | (4,426,980) |
Share transactions - net increase (decrease) | (71,250,007) | (114,258,676) |
Total increase (decrease) in net assets | (71,679,930) | (14,649,697) |
| | |
Net Assets | | |
Beginning of period | 795,999,572 | 810,649,269 |
End of period (including distributions in excess of net investment income of $16,656 and distributions in excess of net investment income of $3,718, respectively) | $ 724,319,642 | $ 795,999,572 |
See accompanying notes which are an integral part of the financial statements.
Annual Report
Financial Highlights - Initial Class
Years ended December 31, | 2011 | 2010 | 2009 | 2008 | 2007 |
Selected Per-Share Data | | | | | |
Net asset value, beginning of period | $ 12.62 | $ 11.07 | $ 8.79 | $ 17.01 | $ 16.12 |
Income from Investment Operations | | | | | |
Net investment income (loss) C | .22 | .08 | .10 | .15 | .14 |
Net realized and unrealized gain (loss) | (.01) | 1.55 | 2.29 | (6.71) | 1.73 |
Total from investment operations | .21 | 1.63 | 2.39 | (6.56) | 1.87 |
Distributions from net investment income | (.24) | (.08) | (.11) | (.16) | (.31) |
Distributions from net realized gain | - | - | - | (1.50) | (.67) |
Total distributions | (.24) | (.08) | (.11) | (1.66) | (.98) G |
Net asset value, end of period | $ 12.59 | $ 12.62 | $ 11.07 | $ 8.79 | $ 17.01 |
Total Return A,B | 1.69% | 14.78% | 27.20% | (41.70)% | 12.12% |
Ratios to Average Net Assets D,F | | | | | |
Expenses before reductions | .59% | .60% | .61% | .59% | .58% |
Expenses net of fee waivers, if any | .59% | .59% | .61% | .59% | .58% |
Expenses net of all reductions | .58% | .58% | .60% | .59% | .58% |
Net investment income (loss) | 1.76% | .69% | 1.05% | 1.15% | .88% |
Supplemental Data | | | | | |
Net assets, end of period (000 omitted) | $ 262,594 | $ 278,330 | $ 274,101 | $ 235,729 | $ 446,465 |
Portfolio turnover rate E | 126% | 100.% | 101% | 123% | 85% |
A Total returns do not reflect charges attributable to your insurance company's separate account. Inclusion of these charges would reduce the total returns shown.
B Total returns would have been lower if certain expenses had not been reduced during the applicable periods shown.
C Calculated based on average shares outstanding during the period.
D Fees and expenses of any underlying Fidelity Central Funds are not included in the Fund's expense ratio. The Fund indirectly bears its proportionate share of the expenses of any underlying Fidelity Central Funds.
E Amount does not include the portfolio activity of any underlying Fidelity Central Funds.
F Expense ratios reflect operating expenses of the class. Expenses before reductions do not reflect amounts reimbursed by the investment adviser or reductions from brokerage service arrangements or reductions from other expense offset arrangements and do not represent the amount paid by the class during periods when reimbursements or reductions occur. Expenses net of fee waivers reflect expenses after reimbursement by the investment adviser but prior to reductions from brokerage service arrangements or other expense offset arrangements. Expenses net of all reductions represent the net expenses paid by the class.
G Total distributions of $.98 per share is comprised of distributions from net investment income of $.310 and distributions from net realized gain of $.671 per share.
Financial Highlights - Service Class
Years ended December 31, | 2011 | 2010 | 2009 | 2008 | 2007 |
Selected Per-Share Data | | | | | |
Net asset value, beginning of period | $ 12.54 | $ 11.00 | $ 8.73 | $ 16.90 | $ 16.01 |
Income from Investment Operations | | | | | |
Net investment income (loss) C | .21 | .07 | .09 | .14 | .13 |
Net realized and unrealized gain (loss) | (.02) | 1.54 | 2.28 | (6.66) | 1.71 |
Total from investment operations | .19 | 1.61 | 2.37 | (6.52) | 1.84 |
Distributions from net investment income | (.22) | (.07) | (.10) | (.15) | (.28) |
Distributions from net realized gain | - | - | - | (1.50) | (.67) |
Total distributions | (.22) | (.07) | (.10) | (1.65) | (.95) G |
Net asset value, end of period | $ 12.51 | $ 12.54 | $ 11.00 | $ 8.73 | $ 16.90 |
Total Return A,B | 1.57% | 14.66% | 27.16% | (41.77)% | 12.00% |
Ratios to Average Net Assets D,F | | | | | |
Expenses before reductions | .69% | .69% | .70% | .69% | .68% |
Expenses net of fee waivers, if any | .69% | .68% | .70% | .69% | .68% |
Expenses net of all reductions | .68% | .68% | .70% | .69% | .68% |
Net investment income (loss) | 1.66% | .59% | .95% | 1.06% | .78% |
Supplemental Data | | | | | |
Net assets, end of period (000 omitted) | $ 121,871 | $ 146,736 | $ 165,361 | $ 162,731 | $ 371,692 |
Portfolio turnover rate E | 126% | 100% | 101% | 123% | 85% |
A Total returns do not reflect charges attributable to your insurance company's separate account. Inclusion of these charges would reduce the total returns shown.
B Total returns would have been lower if certain expenses had not been reduced during the applicable periods shown.
C Calculated based on average shares outstanding during the period.
D Fees and expenses of any underlying Fidelity Central Funds are not included in the Fund's expense ratio. The Fund indirectly bears its proportionate share of the expenses of any underlying Fidelity Central Funds.
E Amount does not include the portfolio activity of any underlying Fidelity Central Funds.
F Expense ratios reflect operating expenses of the class. Expenses before reductions do not reflect amounts reimbursed by the investment adviser or reductions from brokerage service arrangements or reductions from other expense offset arrangements and do not represent the amount paid by the class during periods when reimbursements or reductions occur. Expenses net of fee waivers reflect expenses after reimbursement by the investment adviser but prior to reductions from brokerage service arrangements or other expense offset arrangements. Expenses net of all reductions represent the net expenses paid by the class.
G Total distributions of $.95 per share is comprised of distributions from net investment income of $.279 and distributions from net realized gain of $.671 per share.
See accompanying notes which are an integral part of the financial statements.
Annual Report
Financial Highlights - Service Class 2
Years ended December 31, | 2011 | 2010 | 2009 | 2008 | 2007 |
Selected Per-Share Data | | | | | |
Net asset value, beginning of period | $ 12.43 | $ 10.90 | $ 8.65 | $ 16.76 | $ 15.86 |
Income from Investment Operations | | | | | |
Net investment income (loss) C | .19 | .05 | .07 | .12 | .10 |
Net realized and unrealized gain (loss) | (.03) | 1.53 | 2.26 | (6.60) | 1.70 |
Total from investment operations | .16 | 1.58 | 2.33 | (6.48) | 1.80 |
Distributions from net investment income | (.20) | (.05) | (.08) | (.13) | (.23) |
Distributions from net realized gain | - | - | - | (1.50) | (.67) |
Total distributions | (.20) | (.05) | (.08) | (1.63) | (.90) G |
Net asset value, end of period | $ 12.39 | $ 12.43 | $ 10.90 | $ 8.65 | $ 16.76 |
Total Return A,B | 1.36% | 14.55% | 27.02% | (41.90)% | 11.86% |
Ratios to Average Net Assets D,F | | | | | |
Expenses before reductions | .84% | .84% | .85% | .84% | .83% |
Expenses net of fee waivers, if any | .84% | .83% | .85% | .84% | .83% |
Expenses net of all reductions | .83% | .83% | .85% | .84% | .83% |
Net investment income (loss) | 1.51% | .44% | .80% | .91% | .63% |
Supplemental Data | | | | | |
Net assets, end of period (000 omitted) | $ 273,491 | $ 310,905 | $ 319,760 | $ 290,980 | $ 628,130 |
Portfolio turnover rate E | 126% | 100% | 101% | 123% | 85% |
A Total returns do not reflect charges attributable to your insurance company's separate account. Inclusion of these charges would reduce the total returns shown.
B Total returns would have been lower if certain expenses had not been reduced during the applicable periods shown.
C Calculated based on average shares outstanding during the period.
D Fees and expenses of any underlying Fidelity Central Funds are not included in the Fund's expense ratio. The Fund indirectly bears its proportionate share of the expenses of any underlying Fidelity Central Funds.
E Amount does not include the portfolio activity of any underlying Fidelity Central Funds.
F Expense ratios reflect operating expenses of the class. Expenses before reductions do not reflect amounts reimbursed by the investment adviser or reductions from brokerage service arrangements or reductions from other expense offset arrangements and do not represent the amount paid by the class during periods when reimbursements or reductions occur. Expenses net of fee waivers reflect expenses after reimbursement by the investment adviser but prior to reductions from brokerage service arrangements or other expense offset arrangements. Expenses net of all reductions represent the net expenses paid by the class.
G Total distributions of $.90 per share is comprised of distributions from net investment income of $.231 and distributions from net realized gain of $.671 per share.
Financial Highlights - Investor Class
Years ended December 31, | 2011 | 2010 | 2009 | 2008 | 2007 |
Selected Per-Share Data | | | | | |
Net asset value, beginning of period | $ 12.60 | $ 11.05 | $ 8.77 | $ 16.96 | $ 16.07 |
Income from Investment Operations | | | | | |
Net investment income (loss) C | .21 | .07 | .09 | .14 | .13 |
Net realized and unrealized gain (loss) | (.02) | 1.56 | 2.29 | (6.69) | 1.73 |
Total from investment operations | .19 | 1.63 | 2.38 | (6.55) | 1.86 |
Distributions from net investment income | (.23) | (.08) | (.10) | (.14) | (.29) |
Distributions from net realized gain | - | - | - | (1.50) | (.67) |
Total distributions | (.23) | (.08) | (.10) | (1.64) | (.97) G |
Net asset value, end of period | $ 12.56 | $ 12.60 | $ 11.05 | $ 8.77 | $ 16.96 |
Total Return A,B | 1.53% | 14.72% | 27.16% | (41.80)% | 12.05% |
Ratios to Average Net Assets D,F | | | | | |
Expenses before reductions | .68% | .68% | .71% | .68% | .70% |
Expenses net of fee waivers, if any | .68% | .68% | .71% | .68% | .70% |
Expenses net of all reductions | .67% | .67% | .71% | .68% | .70% |
Net investment income (loss) | 1.67% | .60% | .94% | 1.06% | .76% |
Supplemental Data | | | | | |
Net assets, end of period (000 omitted) | $ 66,364 | $ 60,029 | $ 51,427 | $ 42,423 | $ 98,623 |
Portfolio turnover rate E | 126% | 100% | 101% | 123% | 85% |
A Total returns do not reflect charges attributable to your insurance company's separate account. Inclusion of these charges would reduce the total returns shown.
B Total returns would have been lower if certain expenses had not been reduced during the applicable periods shown.
C Calculated based on average shares outstanding during the period.
D Fees and expenses of any underlying Fidelity Central Funds are not included in the Fund's expense ratio. The Fund indirectly bears its proportionate share of the expenses of any underlying Fidelity Central Funds.
E Amount does not include the portfolio activity of any underlying Fidelity Central Funds.
F Expense ratios reflect operating expenses of the class. Expenses before reductions do not reflect amounts reimbursed by the investment adviser or reductions from brokerage service arrangements or reductions from other expense offset arrangements and do not represent the amount paid by the class during periods when reimbursements or reductions occur. Expenses net of fee waivers reflect expenses after reimbursement by the investment adviser but prior to reductions from brokerage service arrangements or other expense offset arrangements. Expenses net of all reductions represent the net expenses paid by the class.
G Total distributions of $.97 per share is comprised of distributions from net investment income of $.294 and distributions from net realized gain of $.671 per share.
See accompanying notes which are an integral part of the financial statements.
Annual Report
Notes to Financial Statements
For the period ended December 31, 2011
1. Organization.
VIP Growth & Income Portfolio (the Fund) is a fund of Variable Insurance Products Fund III (the Trust) and is authorized to issue an unlimited number of shares. The Trust is registered under the Investment Company Act of 1940, as amended (the 1940 Act), as an open-end management investment company organized as a Massachusetts business trust. Shares of the Fund may only be purchased by insurance companies for the purpose of funding variable annuity or variable life insurance contracts. The Fund offers the following classes of shares: Initial Class shares, Service Class shares, Service Class 2 shares and Investor Class. All classes have equal rights and voting privileges, except for matters affecting a single class. Investment income, realized and unrealized capital gains and losses, the common expenses of the Fund, and certain fund-level expense reductions, if any, are allocated on a pro-rata basis to each class based on the relative net assets of each class to the total net assets of the Fund. Each class differs with respect to transfer agent and distribution and service plan fees incurred. Certain expense reductions may also differ by class.
2. Investments in Fidelity Central Funds.
The Fund invests in Fidelity Central Funds, which are open-end investment companies available only to other investment companies and accounts managed by Fidelity Management & Research Company (FMR) and its affiliates. The Fund's Schedule of Investments lists each of the Fidelity Central Funds held as of period end, if any, as an investment of the Fund, but do not include the underlying holdings of each Fidelity Central Fund. As an Investing Fund, the Fund indirectly bears its proportionate share of the expenses of the underlying Fidelity Central Funds.
The Money Market Central Funds seek preservation of capital and current income and are managed by Fidelity Investments Money Management, Inc. (FIMM), an affiliate of FMR.
A complete unaudited list of holdings for each Fidelity Central Fund is available upon request or at the Securities and Exchange Commission (the SEC) web site at www.sec.gov. In addition, the financial statements of the Fidelity Central Funds, which are not covered by the Fund's Report of Independent Registered Public Accounting Firm are available on the SEC web site or upon request.
3. Significant Accounting Policies.
The financial statements have been prepared in conformity with accounting principles generally accepted in the United States of America (GAAP), which require management to make certain estimates and assumptions at the date of the financial statements. Actual results could differ from those estimates. Subsequent events, if any, through the date that the financial statements were issued have been evaluated in the preparation of the financial statements. The following summarizes the significant accounting policies of the Fund:
Security Valuation. Investments are valued as of 4:00 p.m. Eastern time on the last calendar day of the period. The Fund uses independent pricing services approved by the Board of Trustees to value its investments. When current market prices or quotations are not readily available or reliable, valuations may be determined in good faith in accordance with procedures adopted by the Board of Trustees. Factors used in determining value may include market or security specific events, changes in interest rates and credit quality. The frequency with which these procedures are used cannot be predicted and they may be utilized to a significant extent. The value used for net asset value (NAV) calculation under these procedures may differ from published prices for the same securities.
The Fund categorizes the inputs to valuation techniques used to value its investments into a disclosure hierarchy consisting of three levels as shown below:
Level 1 - quoted prices in active markets for identical investments
Level 2 - other significant observable inputs (including quoted prices for similar investments, interest rates, prepayment speeds, etc.)
Level 3 - unobservable inputs (including the Fund's own assumptions based on the best information available)
Changes in valuation techniques may result in transfers in or out of an assigned level within the disclosure hierarchy. The aggregate value of investments by input level, as of December 31, 2011, as well as a roll forward of Level 3 securities, is included at the end of the Fund's Schedule of Investments. Valuation techniques used to value the Fund's investments by major category are as follows:
Equity securities, including restricted securities, for which market quotations are readily available, are valued at the last reported sale price or official closing price as reported by an independent pricing service on the primary market or exchange on which they are traded and are categorized as Level 1 in the hierarchy. In the event there were no sales during the day or closing prices are not available, securities are valued at the last quoted bid price or may be valued using the last available price and are generally categorized as Level 2 in the hierarchy. For foreign equity securities, when significant market or security specific events arise, comparisons to the valuation of American Depositary Receipts (ADRs), futures contracts, Exchange-traded funds (ETFs) and certain indexes as well as quoted prices for similar securities are used and are categorized as Level 2 in the hierarchy in these circumstances. Utilizing these techniques may result in transfers between Level 1 and Level 2. For restricted equity securities and private placements where observable inputs are limited, assumptions about market activity and risk are used and are categorized as Level 3 in the hierarchy.
Annual Report
3. Significant Accounting Policies - continued
Security Valuation - continued
Debt securities, including restricted securities, are valued based on evaluated prices received from independent pricing services or from dealers who make markets in such securities. For corporate bonds, pricing services utilize matrix pricing which considers yield or price of bonds of comparable quality, coupon, maturity and type as well as dealer supplied prices and are generally categorized as Level 2 in the hierarchy. When independent prices are unavailable or unreliable, debt securities may be valued utilizing pricing matrices which consider similar factors that would be used by independent pricing services. These are generally categorized as Level 2 in the hierarchy but may be Level 3 depending on the circumstances.
Investments in open-end mutual funds, including the Fidelity Central Funds, are valued at their closing net asset value each business day and are categorized as Level 1 in the hierarchy.
New Accounting Pronouncements. In May 2011, the Financial Accounting Standards Board issued Accounting Standard Update No. 2011-04, Fair Value Measurement (Topic 820) - Amendments to Achieve Common Fair Value Measurement and Disclosure Requirements in U.S. GAAP and IFRSs. The update is effective during interim and annual periods beginning after December 15, 2011 and will result in additional disclosure for transfers between levels as well as expanded disclosure for securities categorized as Level 3 under the fair value hierarchy.
In December 2011, the Financial Accounting Standards Board issued Accounting Standard Update No. 2011-11, Disclosures about Offsetting Assets and Liabilities. The update creates new disclosure requirements requiring entities to disclose both gross and net information for derivatives and other financial instruments that are either offset in the Statement of Assets and Liabilities or subject to an enforceable master netting arrangement or similar agreement. The disclosure requirements are effective for annual reporting periods beginning on or after January 1, 2013. Management is currently evaluating the impact of the update's adoption on the Fund's financial statement disclosures.
Foreign Currency. The Fund may use foreign currency contracts to facilitate transactions in foreign-denominated securities. Gains and losses from these transactions may arise from changes in the value of the foreign currency or if the counterparties do not perform under the contracts' terms.
Foreign-denominated assets, including investment securities, and liabilities are translated into U.S. dollars at the exchange rate at period end. Purchases and sales of investment securities, income and dividends received and expenses denominated in foreign currencies are translated into U.S. dollars at the exchange rate in effect on the transaction date.
The effects of exchange rate fluctuations on investments are included with the net realized and unrealized gain (loss) on investment securities. Other foreign currency transactions resulting in realized and unrealized gain (loss) are disclosed separately.
Investment Transactions and Income. For financial reporting purposes, the Fund's investment holdings and NAV include trades executed through the end of the last business day of the period. The NAV per share for processing shareholder transactions is calculated as of the close of business of the New York Stock Exchange (NYSE), normally 4:00 p.m. Eastern time and includes trades executed through the end of the prior business day. Gains and losses on securities sold are determined on the basis of identified cost and may include proceeds received from litigation. Dividend income is recorded on the ex-dividend date, except for certain dividends from foreign securities where the ex-dividend date may have passed, which are recorded as soon as the Fund is informed of the ex-dividend date. Non-cash dividends included in dividend income, if any, are recorded at the fair market value of the securities received. Distributions received on securities that represent a return of capital or capital gain are recorded as a reduction of cost of investments and/or as a realized gain. The Fund estimates the components of distributions received that may be considered return of capital distributions or capital gain distributions. The change in estimate has no impact on total net assets or total return of the fund. Interest income and distributions from the Fidelity Central Funds are accrued as earned. Interest income includes coupon interest and amortization of premium and accretion of discount on debt securities. Investment income is recorded net of foreign taxes withheld where recovery of such taxes is uncertain.
Expenses. Expenses directly attributable to a fund are charged to that fund. Expenses attributable to more than one fund are allocated among the respective funds on the basis of relative net assets or other appropriate methods. Expense estimates are accrued in the period to which they relate and adjustments are made when actual amounts are known.
Income Tax Information and Distributions to Shareholders. Each year, the Fund intends to qualify as a regulated investment company, including distributing substantially all of its taxable income and realized gains under Subchapter M of the Internal Revenue Code. As a result, no provision for income taxes is required. As of December 31, 2011, the Fund did not have any unrecognized tax benefits in the financial statements; nor is the Fund aware of any tax positions for which it is reasonably possible that the total amounts of unrecognized tax benefits will significantly change in the next twelve months. The Fund files a U.S. federal tax return, in addition to state and local tax returns as required. A fund's tax returns are subject to examination by the Internal Revenue Service (IRS) for a period of three fiscal years. State and local tax returns may be subject to examination for an additional fiscal year depending on the jurisdiction. Foreign taxes are provided for based on the Fund's understanding of the tax rules and rates that exist in the foreign markets in which it invests.
Annual Report
Notes to Financial Statements - continued
3. Significant Accounting Policies - continued
Income Tax Information and Distributions to Shareholders - continued
Distributions are declared and recorded on the ex-dividend date. Income dividends and capital gain distributions are declared separately for each class. Income and capital gain distributions are determined in accordance with income tax regulations, which may differ from GAAP.
Capital accounts within the financial statements are adjusted for permanent book-tax differences. These adjustments have no impact on net assets or the results of operations. Temporary book-tax differences will reverse in a subsequent period.
Book-tax differences are primarily due to foreign currency transactions, market discount, equity debt classifications, partnerships, capital loss carryforwards and losses deferred due to wash sales and excise tax regulations.
The federal tax cost of investment securities and unrealized appreciation (depreciation) as of period end were as follows:
Gross unrealized appreciation | $ 80,887,528 |
Gross unrealized depreciation | (61,697,146) |
Net unrealized appreciation (depreciation) on securities and other investments | $ 19,190,382 |
| |
Tax Cost | $ 711,358,260 |
The tax-based components of distributable earnings as of period end were as follows:
Capital loss carryforward | $ (120,143,867) |
Net unrealized appreciation (depreciation) | $ 19,189,190 |
Capital loss carryforwards are only available to offset future capital gains of the Fund to the extent provided by regulations and may be limited. Under the Regulated Investment Company Modernization Act of 2010 (the Act), the Fund is permitted to carry forward capital losses incurred in taxable years beginning after December 22, 2010 for an unlimited period and such capital losses are required to be used prior to any losses that expire. Capital loss carryforwards were as follows:
Fiscal year of expiration | |
2017 | $ (120,143,867) |
The tax character of distributions paid was as follows:
| December 31, 2011 | December 31, 2010 |
Ordinary Income | $ 12,483,991 | $ 4,426,980 |
4. Operating Policies.
Restricted Securities. The Fund may invest in securities that are subject to legal or contractual restrictions on resale. These securities generally may be resold in transactions exempt from registration or to the public if the securities are registered. Disposal of these securities may involve time-consuming negotiations and expense, and prompt sale at an acceptable price may be difficult. Information regarding restricted securities is included at the end of the Fund's Schedule of Investments.
5. Purchases and Sales of Investments.
Purchases and sales of securities, other than short-term securities, aggregated $954,109,537 and $1,006,245,357, respectively.
6. Fees and Other Transactions with Affiliates.
Management Fee. FMR and its affiliates provide the Fund with investment management related services for which the Fund pays a monthly management fee. The management fee is the sum of an individual fund fee rate that is based on an annual rate of .20% of the Fund's average net assets and an annualized group fee rate that averaged .26% during the period. The group fee rate is based upon the average net assets of all the mutual funds advised by FMR. The group fee rate decreases as assets under management increase and increases as assets under management decrease. For the period, the total annual management fee rate was .46% of the Fund's average net assets.
Annual Report
6. Fees and Other Transactions with Affiliates - continued
Distribution and Service Plan Fees. In accordance with Rule 12b-1 of the 1940 Act, the Fund has adopted separate 12b-1 Plans for each Service Class of shares. Each Service Class pays Fidelity Distributors Corporation (FDC), an affiliate of FMR, a service fee. For the period, the service fee is based on an annual rate of .10% of Service Class' average net assets and .25% of Service Class 2's average net assets.
For the period, total fees, all of which were re-allowed to insurance companies for the distribution of shares and providing shareholder support services were as follows:
Service Class | $ 131,790 |
Service Class 2 | 731,964 |
| $ 863,754 |
Transfer Agent Fees. Fidelity Investments Institutional Operations Company, Inc. (FIIOC), an affiliate of FMR, is the Fund's transfer, dividend disbursing, and shareholder servicing agent. FIIOC receives an asset-based fee with respect to each class. Each class (with the exception of Investor Class) pays a transfer agent fee, excluding out of pocket expenses, equal to an annual rate of .07% of average net assets. Investor Class pays a monthly asset-based transfer agent fee of .15% of average net assets. In addition, FIIOC receives an asset-based fee of .0045% of average net assets for typesetting, printing and mailing of shareholder reports, except proxy statements. FIIOC voluntarily agreed to waive this fee for the period August 1, 2011 through December 31, 2011 (see Expense Reductions note). For the period, transfer agent fees for each class, including printing and out of pocket expenses, were as follows:
Initial Class | $ 206,496 |
Service Class | 97,589 |
Service Class 2 | 216,155 |
Investor Class | 104,617 |
| $ 624,857 |
Accounting and Security Lending Fees. Fidelity Service Company, Inc. (FSC), an affiliate of FMR, maintains the Fund's accounting records. The accounting fee is based on the level of average net assets for the month. Under a separate contract, FSC administers the security lending program. The security lending fee is based on the number and duration of lending transactions.
Brokerage Commissions. The Fund placed a portion of its portfolio transactions with brokerage firms which are affiliates of the investment adviser. The commissions paid to these affiliated firms were $28,602 for the period.
Interfund Lending Program. Pursuant to an Exemptive Order issued by the SEC, the Fund, along with other registered investment companies having management contracts with FMR, may participate in an interfund lending program. This program provides an alternative credit facility allowing the funds to borrow from, or lend money to, other participating affiliated funds. At period end, there were no interfund loans outstanding. The Fund's activity in this program during the period for which loans were outstanding was as follows:
Borrower or Lender | Average Loan
Balance | Weighted Average Interest Rate | Interest Expense |
Borrower | $ 6,294,500 | .41% | $ 143 |
7. Committed Line of Credit.
The Fund participates with other funds managed by FMR or an affiliate in a $4.0 billion credit facility (the "line of credit") to be utilized for temporary or emergency purposes to fund shareholder redemptions or for other short-term liquidity purposes. The Fund has agreed to pay commitment fees on its pro-rata portion of the line of credit, which amounted to $2,360 and is reflected in Miscellaneous expenses on the Statement of Operations. During the period, there were no borrowings on this line of credit.
Annual Report
Notes to Financial Statements - continued
8. Security Lending.
The Fund lends portfolio securities through a lending agent from time to time in order to earn additional income. For equity securities, a lending agent is used and may loan securities to certain qualified borrowers, including Fidelity Capital Markets (FCM), a broker-dealer affiliated with the Fund. On the settlement date of the loan, the Fund receives collateral (in the form of U.S. Treasury obligations, letters of credit and/or cash) against the loaned securities and maintains collateral in an amount not less than 100% of the market value of the loaned securities during the period of the loan. The market value of the loaned securities is determined at the close of business of the Fund and any additional required collateral is delivered to the Fund on the next business day. If the borrower defaults on its obligation to return the securities loaned because of insolvency or other reasons, a fund could experience delays and costs in recovering the securities loaned or in gaining access to the collateral. Any cash collateral received is invested in the Fidelity Securities Lending Cash Central Fund. The value of loaned securities and cash collateral at period end are disclosed on the Fund's Statement of Assets and Liabilities. Security lending income represents the income earned on investing cash collateral, less rebates paid to borrowers and any lending agent fees associated with the loan, plus any premium payments received for lending certain types of securities. Security lending income is presented in the Statement of Operations as a component of income from Fidelity Central Funds. Total security lending income during the period amounted to $92,111. During the period, there were no securities loaned to FCM.
9. Expense Reductions.
FMR or its affiliates agreed to waive certain fees during the period as noted in the table below.
Initial Class | $ 4,625 |
Service Class | 2,272 |
Service Class 2 | 5,048 |
Investor Class | 1,114 |
| $ 13,059 |
Many of the brokers with whom FMR places trades on behalf of the Fund provided services to the Fund in addition to trade execution. These services included payments of certain expenses on behalf of the Fund totaling $75,519 for the period.
10. Distributions to Shareholders.
Distributions to shareholders of each class were as follows:
| Years ended
December 31, 2011 | Years ended
December 31, 2010 |
From net investment income | | |
Initial Class | $ 4,807,960 | $ 1,858,326 |
Service Class | 2,055,860 | 848,152 |
Service Class 2 | 4,454,421 | 1,371,134 |
Investor Class | 1,165,750 | 349,368 |
Total | $ 12,483,991 | $ 4,426,980 |
Annual Report
11. Share Transactions.
Transactions for each class of shares were as follows:
| Shares | Dollars |
Years ended December 31, | 2011 | 2010 | 2011 | 2010 |
Initial Class | | | | |
Shares sold | 2,500,985 | 2,667,658 | $ 31,799,068 | $ 30,210,563 |
Reinvestment of distributions | 395,067 | 150,811 | 4,807,960 | 1,858,326 |
Shares redeemed | (4,081,879) | (5,522,410) | (52,287,542) | (62,683,075) |
Net increase (decrease) | (1,185,827) | (2,703,941) | $ (15,680,514) | $ (30,614,186) |
Service Class | | | | |
Shares sold | 452,054 | 92,588 | $ 5,637,296 | $ 1,053,961 |
Reinvestment of distributions | 169,906 | 69,536 | 2,055,860 | 848,152 |
Shares redeemed | (2,577,228) | (3,492,879) | (32,688,840) | (39,398,076) |
Net increase (decrease) | (1,955,268) | (3,330,755) | $ (24,995,684) | $ (37,495,963) |
Service Class 2 | | | | |
Shares sold | 1,157,906 | 869,479 | $ 14,288,231 | $ 9,653,060 |
Reinvestment of distributions | 371,821 | 113,799 | 4,454,421 | 1,371,134 |
Shares redeemed | (4,474,801) | (5,293,237) | (55,948,396) | (59,042,064) |
Net increase (decrease) | (2,945,074) | (4,309,959) | $ (37,205,744) | $ (48,017,870) |
Investor Class | | | | |
Shares sold | 1,554,219 | 1,649,659 | $ 19,764,601 | $ 18,955,867 |
Reinvestment of distributions | 95,946 | 28,402 | 1,165,750 | 349,368 |
Shares redeemed | (1,131,506) | (1,565,867) | (14,298,416) | (17,435,892) |
Net increase (decrease) | 518,659 | 112,194 | $ 6,631,935 | $ 1,869,343 |
12. Other.
The Fund's organizational documents provide former and current trustees and officers with a limited indemnification against liabilities arising in connection with the performance of their duties to the Fund. In the normal course of business, the Fund may also enter into contracts that provide general indemnifications. The Fund's maximum exposure under these arrangements is unknown as this would be dependent on future claims that may be made against the Fund. The risk of material loss from such claims is considered remote.
At the end of the period, FMR or its affiliates were the owners of record of 20% of the total outstanding shares of the Fund and one otherwise unaffiliated shareholder was the owner of record of 38% of the total outstanding shares of the Fund.
Annual Report
Report of Independent Registered Public Accounting Firm
To the Trustees of Variable Insurance Products Fund III and Shareholders of VIP Growth & Income Portfolio:
We have audited the accompanying statement of assets and liabilities of VIP Growth & Income Portfolio (the Fund), a fund of Variable Insurance Products Fund III, including the schedule of investments, as of December 31, 2011, and the related statement of operations for the year then ended, the statement of changes in net assets for each of the two years in the period then ended, and the financial highlights for each of the five years in the period then ended. These financial statements and financial highlights are the responsibility of the Fund's management. Our responsibility is to express an opinion on these financial statements and financial highlights based on our audits.
We conducted our audits in accordance with the standards of the Public Company Accounting Oversight Board (United States). Those standards require that we plan and perform the audit to obtain reasonable assurance about whether the financial statements and financial highlights are free of material misstatement. The Fund is not required to have, nor were we engaged to perform, an audit of its internal control over financial reporting. Our audits included consideration of internal control over financial reporting as a basis for designing audit procedures that are appropriate in the circumstances, but not for the purpose of expressing an opinion on the effectiveness of the Fund's internal control over financial reporting. Accordingly, we express no such opinion. An audit also includes examining, on a test basis, evidence supporting the amounts and disclosures in the financial statements, assessing the accounting principles used and significant estimates made by management, as well as evaluating the overall financial statement presentation. Our procedures included confirmation of securities owned as of December 31, 2011, by correspondence with the custodians and brokers; where replies were not received from brokers, we performed other auditing procedures. We believe that our audits provide a reasonable basis for our opinion.
In our opinion, the financial statements and financial highlights referred to above present fairly, in all material respects, the financial position of VIP Growth & Income Portfolio as of December 31, 2011, the results of its operations for the year then ended, the changes in its net assets for each of the two years in the period then ended, and the financial highlights for each of the five years in the period then ended, in conformity with accounting principles generally accepted in the United States of America.
DELOITTE & TOUCHE LLP
Boston, Massachusetts
February 10, 2012
Annual Report
The Trustees, Members of the Advisory Board, and executive officers of the trust and fund, as applicable, are listed below. The Board of Trustees governs the fund and is responsible for protecting the interests of shareholders. The Trustees are experienced executives who meet periodically throughout the year to oversee the fund's activities, review contractual arrangements with companies that provide services to the fund, oversee management of the risks associated with such activities and contractual arrangements, and review the fund's performance. Except for James C. Curvey, each of the Trustees oversees 226 funds advised by FMR or an affiliate. Mr. Curvey oversees 429 funds advised by FMR or an affiliate.
The Trustees hold office without limit in time except that (a) any Trustee may resign; (b) any Trustee may be removed by written instrument, signed by at least two-thirds of the number of Trustees prior to such removal; (c) any Trustee who requests to be retired or who has become incapacitated by illness or injury may be retired by written instrument signed by a majority of the other Trustees; and (d) any Trustee may be removed at any special meeting of shareholders by a two-thirds vote of the outstanding voting securities of the trust. Each Trustee who is not an interested person (as defined in the 1940 Act) (Independent Trustee), shall retire not later than the last day of the calendar year in which his or her 75th birthday occurs. The Independent Trustees may waive this mandatory retirement age policy with respect to individual Trustees. The executive officers and Advisory Board Members hold office without limit in time, except that any officer and Advisory Board Member may resign or may be removed by a vote of a majority of the Trustees at any regular meeting or any special meeting of the Trustees. Except as indicated, each individual has held the office shown or other offices in the same company for the past five years.
Experience, Skills, Attributes, and Qualifications of the Fund's Trustees. The Governance and Nominating Committee has adopted a statement of policy that describes the experience, qualifications, attributes, and skills that are necessary and desirable for potential Independent Trustee candidates (Statement of Policy). The Board believes that each Trustee satisfied at the time he or she was initially elected or appointed a Trustee, and continues to satisfy, the standards contemplated by the Statement of Policy. The Governance and Nominating Committee also engages professional search firms to help identify potential Independent Trustee candidates who have the experience, qualifications, attributes, and skills consistent with the Statement of Policy. From time to time, additional criteria based on the composition and skills of the current Independent Trustees, as well as experience or skills that may be appropriate in light of future changes to board composition, business conditions, and regulatory or other developments, have also been considered by the professional search firms and the Governance and Nominating Committee. In addition, the Board takes into account the Trustees' commitment and participation in Board and committee meetings, as well as their leadership of standing and ad hoc committees throughout their tenure.
In determining that a particular Trustee was and continues to be qualified to serve as a Trustee, the Board has considered a variety of criteria, none of which, in isolation, was controlling. The Board believes that, collectively, the Trustees have balanced and diverse experience, qualifications, attributes, and skills, which allow the Board to operate effectively in governing the fund and protecting the interests of shareholders. Information about the specific experience, skills, attributes, and qualifications of each Trustee, which in each case led to the Board's conclusion that the Trustee should serve (or continue to serve) as a trustee of the fund, is provided below.
Board Structure and Oversight Function. James C. Curvey is an interested person (as defined in the 1940 Act) and currently serves as Acting Chairman. The Trustees have determined that an interested Chairman is appropriate and benefits shareholders because an interested Chairman has a personal and professional stake in the quality and continuity of services provided to the fund. Independent Trustees exercise their informed business judgment to appoint an individual of their choosing to serve as Chairman, regardless of whether the Trustee happens to be independent or a member of management. The Independent Trustees have determined that they can act independently and effectively without having an Independent Trustee serve as Chairman and that a key structural component for assuring that they are in a position to do so is for the Independent Trustees to constitute a substantial majority for the Board. The Independent Trustees also regularly meet in executive session. Ned C. Lautenbach serves as Chairman of the Independent Trustees and as such (i) acts as a liaison between the Independent Trustees and management with respect to matters important to the Independent Trustees and (ii) with management prepares agendas for Board meetings.
Fidelity funds are overseen by different Boards of Trustees. The fund's Board oversees Fidelity's equity and high income funds and another Board oversees Fidelity's investment-grade bond, money market, and asset allocation funds. The asset allocation funds may invest in Fidelity funds overseen by the fund's Board. The use of separate Boards, each with its own committee structure, allows the Trustees of each group of Fidelity funds to focus on the unique issues of the funds they oversee, including common research, investment, and operational issues. On occasion, the separate Boards establish joint committees to address issues of overlapping consequences for the Fidelity funds overseen by each Board.
The Trustees operate using a system of committees to facilitate the timely and efficient consideration of all matters of importance to the Trustees, the fund, and fund shareholders and to facilitate compliance with legal and regulatory requirements and oversight of the fund's activities and associated risks. The Board, acting through its committees, has charged FMR and its affiliates with (i) identifying events or circumstances the occurrence of which could have demonstrably adverse effects on the fund's business and/or reputation; (ii) implementing processes and controls to lessen the possibility that such events or circumstances occur or to mitigate the effects of such events or circumstances if they do occur; and (iii) creating and maintaining a system designed to evaluate continuously business and market conditions in order to facilitate the identification and implementation processes described in (i) and (ii) above. Because the day-to-day operations and activities of the fund are carried out by or through FMR, its affiliates and other service providers, the fund's exposure to risks is mitigated but not eliminated by the processes overseen by the Trustees. While each of the Board's committees has responsibility for overseeing different aspects of the fund's activities, oversight is exercised primarily through the Operations, Audit, and Compliance Committees. In addition, the Independent Trustees have worked with FMR to enhance the Board's oversight of investment and financial risks, legal and regulatory risks, technology risks, and operational risks, including the development of additional risk reporting to the Board. For example, a working group comprised of Independent Trustees and FMR has worked and continues to work to review the Fidelity funds' valuation-related activities, reporting and risk management. Appropriate personnel, including but not limited to the fund's Chief Compliance Officer (CCO), FMR's internal auditor, the independent accountants, the fund's Treasurer and portfolio management personnel, make periodic reports to the Board's committees, as appropriate, including an annual review of FMR's risk management program for the Fidelity funds. The responsibilities of each standing committee, including their oversight responsibilities, are described further under "Standing Committees of the Fund's Trustees."
Annual Report
The fund's Statement of Additional Information (SAI) includes more information about the Trustees. To request a free copy, call Fidelity at 1-800-208-0098.
Interested Trustees*:
Correspondence intended for each Trustee who is an interested person may be sent to Fidelity Investments, 82 Devonshire Street, Boston, Massachusetts 02109.
Name, Age; Principal Occupations and Other Relevant Experience+ |
James C. Curvey (76) |
| Year of Election or Appointment: 2007 Mr. Curvey is Trustee and Acting Chairman of the Board of Trustees of certain Trusts. Mr. Curvey also serves as Trustee (2007-present) of other investment companies advised by FMR. Mr. Curvey is a Director of Fidelity Investments Money Management, Inc. (2009-present), Director of Fidelity Research & Analysis Co. (2009-present) and Director of FMR and FMR Co., Inc. (2007-present). Mr. Curvey is also Vice Chairman (2007-present) and Director of FMR LLC. In addition, Mr. Curvey serves as an Overseer for the Boston Symphony Orchestra and a member of the Trustees of Villanova University. Previously, Mr. Curvey was the Vice Chairman (2006-2007) and Director (2000-2007) of FMR Corp. |
Ronald P. O'Hanley (54) |
| Year of Election or Appointment: 2011 Mr. O'Hanley is Director of FMR Co., Inc. (2010-present), Director of Fidelity Investments Money Management, Inc. (2010-present), Director of Fidelity Research & Analysis Company (2010-present), President of Fidelity Asset Management and Corporate Services and a member of Fidelity's Executive Committee (2010-present). Previously, Mr. O'Hanley served as President and Chief Executive Officer of BNY Mellon Asset Management (2007-2010). Mr. O'Hanley also served as Vice Chairman of Bank New York Mellon Corp. and a member of that firm's Executive Committee. Prior to the 2007 merger of The Bank of New York and Mellon Financial Corporation, he was Vice Chairman of Mellon Financial Corporation and President and Chief Executive Officer of Mellon Asset Management. He joined Mellon in February 1997. Mr. O'Hanley currently serves as Chairman of the Boston Public Library Foundation Board of Directors and sits on the Board of Directors of Beth Israel Deaconess Medical Center, the Board of Trustees of the Marine Biological Laboratory and the Advisory Board of the Maxwell School of Citizenship and Public Administration at Syracuse University. Mr. O'Hanley also chairs the Council on Asset Management for the Financial Services Roundtable and is a member of the Board of Directors of Institutional Investor's U.S. Institute. |
* Trustees have been determined to be "Interested Trustees" by virtue of, among other things, their affiliation with the trust or various entities under common control with FMR.
+ The information above includes each Trustee's principal occupation during the last five years and other information relating to the experience, attributes, and skills relevant to each Trustee's qualifications to serve as a Trustee, which led to the conclusion that each Trustee should serve as a Trustee for the fund.
Independent Trustees:
Correspondence intended for each Independent Trustee (that is, the Trustees other than the Interested Trustees) may be sent to Fidelity Investments, P.O. Box 55235, Boston, Massachusetts 02205-5235.
Name, Age; Principal Occupations and Other Relevant Experience+ |
Dennis J. Dirks (63) |
| Year of Election or Appointment: 2005 Prior to his retirement in May 2003, Mr. Dirks was Chief Operating Officer and a member of the Board of The Depository Trust & Clearing Corporation (DTCC). He also served as President, Chief Operating Officer, and Board member of The Depository Trust Company (DTC) and President and Board member of the National Securities Clearing Corporation (NSCC). In addition, Mr. Dirks served as Chief Executive Officer and Board member of the Government Securities Clearing Corporation, Chief Executive Officer and Board member of the Mortgage-Backed Securities Clearing Corporation, as a Trustee and a member of the Finance Committee of Manhattan College (2005-2008), and as a Trustee and a member of the Finance Committee of AHRC of Nassau County (2006-2008). Mr. Dirks is a member of the Independent Directors Council (IDC) Governing Council (2010-present) and Board of Directors for The Brookville Center for Children's Services, Inc. (2009-present). |
Alan J. Lacy (58) |
| Year of Election or Appointment: 2008 Mr. Lacy serves as Senior Adviser (2007-present) of Oak Hill Capital Partners, L.P. (private equity). Mr. Lacy also served as Chief Executive Officer (2000-2005) and Vice Chairman (2005-2006) of Sears Holdings Corporation and Sears, Roebuck and Co. (retail). In addition, Mr. Lacy serves as a member of the Board of Directors of Dave & Buster's, Inc. (restaurant and entertainment complexes, 2010-present), The Hillman Companies, Inc. (hardware wholesalers, 2010-present), and Bristol-Myers Squibb Company (global pharmaceuticals, 2007-present). Mr. Lacy is a member of the Board of Trustees of The National Parks Conservation Association (2006-present). Previously, Mr. Lacy served as Chairman of the Board of Trustees of the National Parks Conservation Association (2008-2011) and as a member of the Board of Directors for the Western Union Company (global money transfer, 2006-2011). |
Ned C. Lautenbach (67) |
| Year of Election or Appointment: 2000 Mr. Lautenbach is Chairman of the Independent Trustees of the Equity and High Income Funds (2006-present). Mr. Lautenbach currently serves as the Lead Director of the Eaton Corporation Board of Directors (diversified industrial, 1997-present). Mr. Lautenbach is also a member of the Board of Directors of the Philharmonic Center for the Arts in Naples, Florida (1999-present); a member of the Board of Trustees of Fairfield University (2005-present); and a member of the Council on Foreign Relations (1994-present). Previously, Mr. Lautenbach was a Partner/Advisory Partner at Clayton, Dubilier & Rice, LLC (private equity investment, 1998-2010), as well as a Director of Sony Corporation (2006-2007). |
Joseph Mauriello (67) |
| Year of Election or Appointment: 2008 Prior to his retirement in January 2006, Mr. Mauriello served in numerous senior management positions including Deputy Chairman and Chief Operating Officer (2004-2005), and Vice Chairman of Financial Services (2002-2004) of KPMG LLP US (professional services, 1965-2005). Mr. Mauriello currently serves as a member of the Board of Directors of XL Group plc. (global insurance and re-insurance, 2006-present) and of Arcadia Resources Inc. (health care services and products, 2007-present). Previously, Mr. Mauriello served as a Director of the Hamilton Funds of the Bank of New York (2006-2007). |
Robert W. Selander (61) |
| Year of Election or Appointment: 2011 Previously, Mr. Selander served as a Member of the Advisory Board of Fidelity's Equity and High Income Funds (2011), Executive Vice Chairman (2010), Chief Executive Officer (2009-2010), and President and Chief Executive Officer (1997-2009) of Mastercard, Inc. |
Cornelia M. Small (67) |
| Year of Election or Appointment: 2005 Ms. Small is a member of the Board of Directors of the Teagle Foundation (2009-present). Ms. Small is also a member of the Investment Committee, and Chair (2008-present) and a member of the Board of Trustees of Smith College. In addition, Ms. Small serves on the Investment Committee of the Berkshire Taconic Community Foundation (2008-present). Previously, Ms. Small served as Chairperson of the Investment Committee (2002-2008) of Smith College. In addition, Ms. Small served as Chief Investment Officer, Director of Global Equity Investments, and a member of the Board of Directors of Scudder, Stevens & Clark and Scudder Kemper Investments. |
William S. Stavropoulos (72) |
| Year of Election or Appointment: 2002 Mr. Stavropoulos is Vice Chairman of the Independent Trustees of the Equity and High Income Funds (2006-present). Mr. Stavropoulos serves as President and Founder of the Michigan Baseball Foundation, the Great Lakes Loons (2007-present). Mr. Stavropoulos is Chairman Emeritus of the Board of Directors of The Dow Chemical Company, where he previously served in numerous senior management positions, including President, CEO (1995-2000; 2002-2004), Chairman of the Executive Committee (2000-2006), and as a member of the Board of Directors (1990-2006). Currently, Mr. Stavropoulos is Chairman of Univar (global distributor of commodity and specialty chemicals, 2010-present), a Director of Teradata Corporation (data warehousing and technology solutions, 2008-present), Chemical Financial Corporation, Maersk Inc. (industrial conglomerate), Tyco International, Inc. (multinational manufacturing and services, 2007-present), and a member of the Advisory Board for Metalmark Capital (private equity investment, 2005-present). Mr. Stavropoulos is a special advisor to Clayton, Dubilier & Rice, LLC (private equity investment). In addition, Mr. Stavropoulos is a member of the University of Notre Dame Advisory Council for the College of Science. |
David M. Thomas (62) |
| Year of Election or Appointment: 2008 Previously, Mr. Thomas served as Executive Chairman (2005-2006) and Chairman and Chief Executive Officer (2000-2005) of IMS Health, Inc. (pharmaceutical and healthcare information solutions). In addition, Mr. Thomas serves as a member of the Board of Directors of Fortune Brands, Inc. (consumer products), and Interpublic Group of Companies, Inc. (marketing communication, 2004-present). |
Michael E. Wiley (61) |
| Year of Election or Appointment: 2008 Mr. Wiley also serves as a Director of Asia Pacific Exploration Consolidated (international oil and gas exploration and production, 2008-present). Mr. Wiley serves as a Director of Tesoro Corporation (independent oil refiner and marketer, 2005-present), and a Director of Bill Barrett Corporation (exploration and production, 2005-present). In addition, Mr. Wiley also serves as a Director of Post Oak Bank (privately-held bank, 2004-present). Previously, Mr. Wiley served as a member of the Board of Trustees of the University of Tulsa (2000-2006; 2007-2010), as a Senior Energy Advisor of Katzenbach Partners, LLC (consulting, 2006-2007), as an Advisory Director of Riverstone Holdings (private investment), Chairman, President, and CEO of Baker Hughes, Inc. (oilfield services, 2000-2004), and as Director of Spinnaker Exploration Company (exploration and production, 2001-2005). |
+ The information above includes each Trustee's principal occupation during the last five years and other information relating to the experience, attributes, and skills relevant to each Trustee's qualifications to serve as a Trustee, which led to the conclusion that each Trustee should serve as a Trustee for the fund.
Advisory Board Members and Executive Officers:
Correspondence intended for each executive officer, Edward C. Johnson 3d, and Peter S. Lynch may be sent to Fidelity Investments, 82 Devonshire Street, Boston, Massachusetts 02109.
Name, Age; Principal Occupation |
Edward C. Johnson 3d (81) |
| Year of Election or Appointment: 2011 Member of the Advisory Board of Fidelity's Equity and High Income Funds. Mr. Johnson serves as Chief Executive Officer, Chairman, and a Director of FMR LLC, and also serves as Chairman and Director of FIL Limited. Previously, Mr. Johnson served as a Trustee and Chairman of the Board of certain Fidelity Trusts, Chairman and a Director of FMR, Chairman and a Director of FMR Co., Inc., and President of FMR LLC (2006-2007). |
Peter S. Lynch (67) |
| Year of Election or Appointment: 2003 Member of the Advisory Board of Fidelity's Equity and High Income Funds. Mr. Lynch is Vice Chairman and a Director of FMR and FMR Co., Inc. In addition, Mr. Lynch serves as a Trustee of Boston College and as the Chairman of the Inner-City Scholarship Fund. Previously, Mr. Lynch served on the Special Olympics International Board of Directors (1997-2006). |
Kenneth B. Robins (42) |
| Year of Election or Appointment: 2008 President and Treasurer of Fidelity's Equity and High Income Funds. Mr. Robins also serves as President and Treasurer (2010-present) and Assistant Treasurer (2009-present) of other Fidelity funds and is an employee of Fidelity Investments (2004-present). Previously, Mr. Robins served as Deputy Treasurer of the Fidelity funds (2005-2008) and Treasurer and Chief Financial Officer of The North Carolina Capital Management Trust: Cash and Term Portfolios (2006-2008). |
Bruce T. Herring (46) |
| Year of Election or Appointment: 2006 Vice President of certain Equity Funds. Mr. Herring also serves as President of Fidelity Research & Analysis Company (2010-present), Chief Investment Officer and Director of Fidelity Management & Research (U.K.) Inc. (2010-present) and Group Chief Investment Officer of FMR. Previously, Mr. Herring served as Vice President (2005-2006) and Senior Vice President (2006-2007) of Fidelity Management & Research Company, Vice President of FMR Co., Inc. (2001-2007) and as a portfolio manager for Fidelity U.S. Equity Funds. |
Brian B. Hogan (47) |
| Year of Election or Appointment: 2009 Vice President of Equity and High Income Funds. Mr. Hogan also serves as President of FMR's Equity Division (2009-present). Previously, Mr. Hogan served as Senior Vice President, Equity Research of FMR (2006-2009) and as a portfolio manager. |
Scott C. Goebel (43) |
| Year of Election or Appointment: 2008 Secretary and Chief Legal Officer (CLO) of the Fidelity funds. Mr. Goebel also serves as Secretary of Fidelity Investments Money Management, Inc. (FIMM) (2010-present) and Fidelity Research and Analysis Company (FRAC) (2010-present); Secretary and CLO of The North Carolina Capital Management Trust: Cash and Term Portfolios (2008-present); General Counsel, Secretary, and Senior Vice President of FMR (2008-present) and FMR Co., Inc. (2008-present); employed by FMR LLC or an affiliate (2001-present); Chief Legal Officer of Fidelity Management & Research (Hong Kong) Limited (2008-present) and Assistant Secretary of Fidelity Management & Research (Japan) Inc. (2008-present), and Fidelity Management & Research (U.K.) Inc. (2008-present). Previously, Mr. Goebel served as Assistant Secretary of FIMM (2008-2010), FRAC (2008-2010), and the Funds (2007-2008) and as Vice President and Secretary of Fidelity Distributors Corporation (FDC) (2005-2007). |
William C. Coffey (42) |
| Year of Election or Appointment: 2009 Assistant Secretary of Fidelity's Equity and High Income Funds. Mr. Coffey also serves as Senior Vice President and Deputy General Counsel of FMR LLC (2010-present), and is an employee of Fidelity Investments. Previously, Mr. Coffey served as Vice President and Associate General Counsel of FMR LLC (2005-2009). |
Holly C. Laurent (57) |
| Year of Election or Appointment: 2008 Anti-Money Laundering (AML) Officer of the Fidelity funds. Ms. Laurent also serves as AML Officer of The North Carolina Capital Management Trust: Cash and Term Portfolios (2008-present) and is an employee of Fidelity Investments. Previously, Ms. Laurent was Senior Vice President and Head of Legal for Fidelity Business Services India Pvt. Ltd. (2006-2008), and Senior Vice President, Deputy General Counsel and Group Head for FMR LLC (2005-2006). |
Christine Reynolds (53) |
| Year of Election or Appointment: 2008 Chief Financial Officer of the Fidelity funds. Ms. Reynolds became President of Fidelity Pricing and Cash Management Services (FPCMS) in August 2008. Ms. Reynolds served as Chief Operating Officer of FPCMS (2007-2008). Previously, Ms. Reynolds served as President, Treasurer, and Anti-Money Laundering officer of the Fidelity funds (2004-2007). |
Kenneth A. Rathgeber (64) |
| Year of Election or Appointment: 2004 Chief Compliance Officer of Fidelity's Equity and High Income Funds. Mr. Rathgeber is Chief Compliance Officer of Fidelity Management & Research (Hong Kong) Limited (2008-present), Fidelity Management & Research (Japan) Inc. (2008-present), FMR (2005-present), FMR Co., Inc. (2005-present), Fidelity Management & Research (U.K.) Inc. (2005-present), Fidelity Research & Analysis Company (2005-present), Fidelity Investments Money Management, Inc. (2005-present), Pyramis Global Advisors, LLC (2005-present), and Strategic Advisers, Inc. (2005-present). |
Jeffrey S. Christian (50) |
| Year of Election or Appointment: 2009 Deputy Treasurer of the Fidelity funds. Mr. Christian is an employee of Fidelity Investments. Previously, Mr. Christian served as Chief Financial Officer (2008-2009) of certain Fidelity funds and Senior Vice President of Fidelity Pricing and Cash Management Services (FPCMS) (2004-2009). |
Joseph F. Zambello (54) |
| Year of Election or Appointment: 2011 Deputy Treasurer of the Fidelity funds. Mr. Zambello is an employee of Fidelity Investments. Previously, Mr. Zambello served as Vice President of FMR's Program Management Group (2009-2011) and Vice President of the Transfer Agent Oversight Group (2005-2009). |
Adrien E. Deberghes (44) |
| Year of Election or Appointment: 2008 Deputy Treasurer of Fidelity's Equity and High Income Funds. Mr. Deberghes also serves as Vice President and Assistant Treasurer of Fidelity Rutland Square Trust II and Fidelity Commonwealth Trust II (2011-present), Assistant Treasurer of other Fidelity funds (2010-present), and is an employee of Fidelity Investments (2008-present). Previously, Mr. Deberghes served as Senior Vice President of Mutual Fund Administration at State Street Corporation (2007-2008), Senior Director of Mutual Fund Administration at Investors Bank & Trust (2005-2007), and Director of Finance for Dunkin' Brands (2000-2005). |
Stephanie J. Dorsey (42) |
| Year of Election or Appointment: 2010 Assistant Treasurer of Fidelity's Equity and High Income Funds. Ms. Dorsey also serves as Deputy Treasurer of other Fidelity funds (2008-present) and is an employee of Fidelity Investments (2008-present). Previously, Ms. Dorsey served as Treasurer (2004-2008) of the JPMorgan Mutual Funds and Vice President (2004-2008) of JPMorgan Chase Bank. |
John R. Hebble (53) |
| Year of Election or Appointment: 2009 Assistant Treasurer of Fidelity's Equity and High Income Funds. Mr. Hebble also serves as President (2011-present), Treasurer, and Chief Financial Officer of The North Carolina Capital Management Trust: Cash and Term Portfolios (2008-present), President and Treasurer of other Fidelity funds (2008-present) and is an employee of Fidelity Investments. |
Gary W. Ryan (53) |
| Year of Election or Appointment: 2005 Assistant Treasurer of the Fidelity funds. Mr. Ryan is an employee of Fidelity Investments. Previously, Mr. Ryan served as Vice President of Fund Reporting in Fidelity Pricing and Cash Management Services (FPCMS) (1999-2005). |
Jonathan Davis (43) |
| Year of Election or Appointment: 2010 Assistant Treasurer of the Fidelity funds. Mr. Davis is also Assistant Treasurer of Fidelity Rutland Square Trust II and Fidelity Commonwealth Trust II. Mr. Davis is an employee of Fidelity Investments. Previously, Mr. Davis served as Vice President and Associate General Counsel of FMR LLC (2003-2010). |
Annual Report
Initial Class designates 91%, Service Class designates 97%, Service Class 2 designates 100%, and Investor Class designates 95%, of the dividends distributed in December 2011, as qualifying for the dividends-received deduction for corporate shareholders.
Annual Report
Board Approval of Investment Advisory Contracts and Management Fees
VIP Growth & Income Portfolio
Each year, the Board of Trustees, including the Independent Trustees (together, the Board), votes on the renewal of the management contract and sub-advisory agreements (together, the Advisory Contracts) for the fund. The Board, assisted by the advice of fund counsel and Independent Trustees' counsel, requests and considers a broad range of information relevant to the renewal of the Advisory Contracts throughout the year.
The Board meets regularly and considers at each of its meetings factors that are relevant to its annual consideration of the renewal of the fund's Advisory Contracts, including the services and support provided to the fund and its shareholders. The Board has established various standing committees, each composed of Independent Trustees with varying backgrounds, to which the Board has assigned specific subject matter responsibilities in order to enhance effective decision-making by the Board. The Board, acting directly and through its Committees, requests and receives information concerning the annual consideration of the renewal of the fund's Advisory Contracts. The Board also meets as needed to consider matters specifically related to the Board's annual consideration of the renewal of Advisory Contracts. Members of the Board may also meet with trustees of other Fidelity funds through ad hoc joint committees to discuss certain matters relevant to the Fidelity funds.
At its July 2011 meeting, the Board of Trustees, including the Independent Trustees, unanimously determined to renew the fund's Advisory Contracts. In reaching its determination, the Board considered all factors it believed relevant, including (i) the nature, extent, and quality of the services to be provided to the fund and its shareholders (including the investment performance of the fund); (ii) the competitiveness of the fund's management fee and total expense ratio; (iii) the total costs of the services to be provided by and the profits to be realized by Fidelity from its relationship with the fund; (iv) the extent to which economies of scale would be realized as the fund grows; and (v) whether fee levels reflect these economies of scale, if any, for the benefit of fund shareholders.
In considering whether to renew the Advisory Contracts for the fund, the Board reached a determination, with the assistance of fund counsel and Independent Trustees' counsel and through the exercise of its business judgment, that the renewal of the Advisory Contracts is in the best interests of the fund and its shareholders and that the compensation payable under the Advisory Contracts is fair and reasonable. The Board's decision to renew the Advisory Contracts was not based on any single factor, but rather was based on a comprehensive consideration of all the information provided to the Board at its meetings throughout the year. The Board, in reaching its determination to renew the Advisory Contracts, is aware that shareholders in the fund have a broad range of investment choices available to them, including a wide choice among mutual funds offered by Fidelity's competitors, and that the fund's shareholders, who have the opportunity to review and weigh the disclosure provided by the fund in its prospectus and other public disclosures, have chosen to invest in this fund, managed by Fidelity.
Nature, Extent, and Quality of Services Provided. The Board considered the staffing within the investment adviser, FMR, and the sub-advisers (together, the Investment Advisers), including the backgrounds of the fund's investment personnel and the fund's investment objective and discipline. The Independent Trustees also had discussions with senior management of Fidelity's investment operations and investment groups. The Board considered the structure of the portfolio manager compensation program and whether this structure provides appropriate incentives to act in the best interests of the fund.
Resources Dedicated to Investment Management and Support Services. The Board and the Fund Oversight and Research Committees reviewed the general qualifications and capabilities of the Investment Advisers' investment staff, including its size, education, experience, and resources, as well as the Investment Advisers' approach to recruiting, training, managing, and compensating investment personnel. The Board also noted that FMR has devoted increased resources to non-U.S. offices. The Board noted that Fidelity's analysts have extensive resources, tools and capabilities which allow them to conduct sophisticated quantitative and fundamental analysis, as well as credit analysis of issuers, counterparties and enhancers. The Board also believes that Fidelity's investment professionals have sufficient access to global information and data so as to provide competitive investment results over time, and that those professionals also have access to sophisticated tools which permit them to assess portfolio construction and risk and performance attribution characteristics continuously, as well as to transmit new information and research conclusions rapidly around the world. Additionally, in their deliberations, the Board considered the Investment Advisers' trading capabilities and resources which are an integral part of the investment management process.
Shareholder and Administrative Services. The Board considered (i) the nature, extent, quality, and cost of advisory, administrative, and shareholder services performed by the Investment Advisers and their affiliates under the Advisory Contracts and under separate agreements covering transfer agency, pricing and bookkeeping, and securities lending services for the fund; (ii) the nature and extent of the investment adviser's supervision of third party service providers, principally custodians and subcustodians; and (iii) the resources devoted to, and the record of compliance with, the fund's compliance policies and procedures. The Board also reviewed the allocation of fund brokerage, including allocations to brokers affiliated with the Investment Advisers, the use of brokerage commissions to pay fund expenses, and the use of "soft" commission dollars to pay for research services.
The Board noted that the growth of fund assets over time across the complex allows Fidelity to reinvest in the development of services designed to enhance the value or convenience of the Fidelity funds as investment vehicles. These services include 24-hour access to account information and market information through telephone representatives and over the Internet, investor education materials and asset allocation tools, and the expanded availability of Fidelity Investor Centers, with 35 new branches opening since 2010.
Annual Report
Board Approval of Investment Advisory Contracts and Management Fees - continued
Investment in a Large Fund Family. The Board considered the benefits to shareholders of investing in a Fidelity fund, including the benefits of investing in a fund that is part of a large family of funds offering a variety of investment disciplines and providing a large variety of mutual fund investor services. The Board noted that Fidelity had taken, or had made recommendations that resulted in the Fidelity funds taking, a number of actions over the previous year that benefited particular funds, including (i) continuing to dedicate additional resources to investment research and support of the senior management team that oversees asset management; (ii) rationalizing product lines through the mergers of six funds into other funds; (iii) continuing to migrate the Freedom Funds to dedicated lower cost underlying funds; (iv) obtaining shareholder approval to broaden the investment strategies for Fidelity Consumer Finance Portfolio, Fidelity Emerging Asia Fund, and Fidelity Environment and Alternative Energy Portfolio; (v) contractually agreeing to reduce the management fees and impose other expense limitations on Spartan 500 Index Fund and U.S. Bond Index Fund in connection with launching new institutional classes of these funds; (vi) changing the name, primary and supplemental benchmarks, and investment policies of Fidelity Global Strategies Fund to support the fund's flexible investment mandate and global orientation; and (vii) reducing the transfer agency account fee rates on certain accounts.
Investment Performance. The Board considered whether the fund has operated in accordance with its investment objective, as well as its record of compliance with its investment restrictions. It also reviewed the fund's absolute investment performance for each class, as well as the fund's relative investment performance for each class measured over multiple periods against (i) a broad-based securities market index, and (ii) a peer group of mutual funds deemed appropriate by Fidelity and reviewed by the Board. The following charts considered by the Board show, over the one-, three-, and five-year periods ended December 31, 2010, the cumulative total returns of Initial Class and Service Class 2 of the fund, the cumulative total returns of a broad-based securities market index ("benchmark"), and a range of cumulative total returns of a peer group of mutual funds identified by Morningstar, Inc. as having an investment style similar to that of the fund based on underlying portfolio holdings. The returns of Initial Class and Service Class 2 show the performance of the highest and lowest performing classes, respectively (based on five-year performance). The box within each chart shows the 25th percentile return (bottom of box) and the 75th percentile return (top of box) of the peer group. Returns shown above the box are in the first quartile and returns shown below the box are in the fourth quartile. The percentage beaten numbers noted below each chart correspond to the percentile box and represent the percentage of funds in the peer group whose performance was equal to or lower than that of the class indicated.
VIP Growth & Income Portfolio
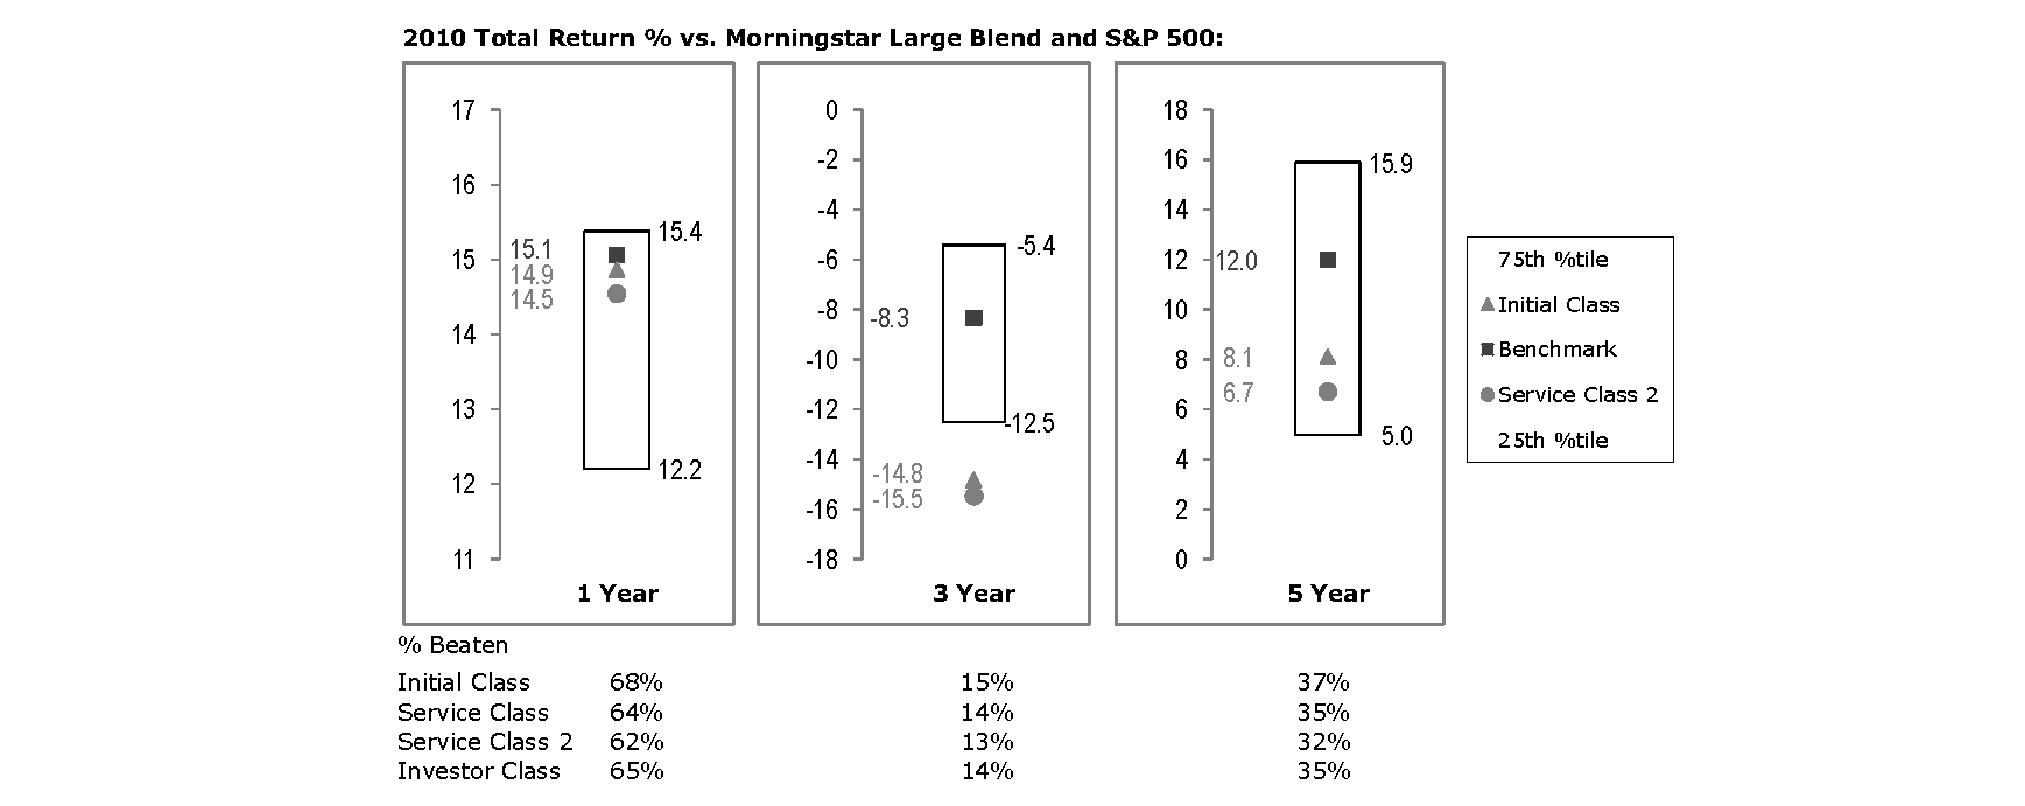
The Board reviewed the fund's relative investment performance against its peer group and noted that the performance of Initial Class of the fund was in the second quartile for the one-year period, the fourth quartile for the three-year period, and the third quartile for the five-year period. The Board also noted that the investment performance of the fund was lower than its benchmark for all the periods shown. The Board considered that the variations in performance among the fund's classes reflect the variations in class expenses, which result in lower performance for higher expense classes. The Board also reviewed the fund's performance since inception as well as performance in the current year.
Based on its review, the Board concluded that the nature, extent, and quality of services provided to the fund under the Advisory Contracts should benefit the fund's shareholders.
Annual Report
Competitiveness of Management Fee and Total Expense Ratio. The Board considered the fund's management fee and total expense ratio compared to "mapped groups" of competitive funds and classes. Fidelity creates "mapped groups" by combining similar Lipper investment objective categories that have comparable management fee characteristics. Combining Lipper investment objective categories aids the Board's management fee and total expense ratio comparisons by broadening the competitive group used for comparison and by reducing the number of universes to which various Fidelity funds are compared.
Management Fee. The Board considered two proprietary management fee comparisons for the 12-month periods shown in the chart below. The group of Lipper funds used by the Board for management fee comparisons is referred to below as the "Total Mapped Group." The Total Mapped Group comparison focuses on a fund's standing relative to the total universe of comparable funds available to investors in terms of gross management fees before expense reimbursements or caps. "TMG %" represents the percentage of funds in the Total Mapped Group that had management fees that were lower than the fund's. For example, a TMG % of 12% means that 88% of the funds in the Total Mapped Group had higher management fees than the fund. The "Asset-Size Peer Group" (ASPG) comparison focuses on a fund's standing relative to non-Fidelity funds similar in size to the fund within the Total Mapped Group. The ASPG represents at least 15% of the funds in the Total Mapped Group with comparable asset size and management fee characteristics, subject to a minimum of 50 funds (or all funds in the Total Mapped Group if fewer than 50). Additional information, such as the ASPG quartile in which the fund's management fee ranked, is also included in the chart and considered by the Board.
VIP Growth & Income Portfolio
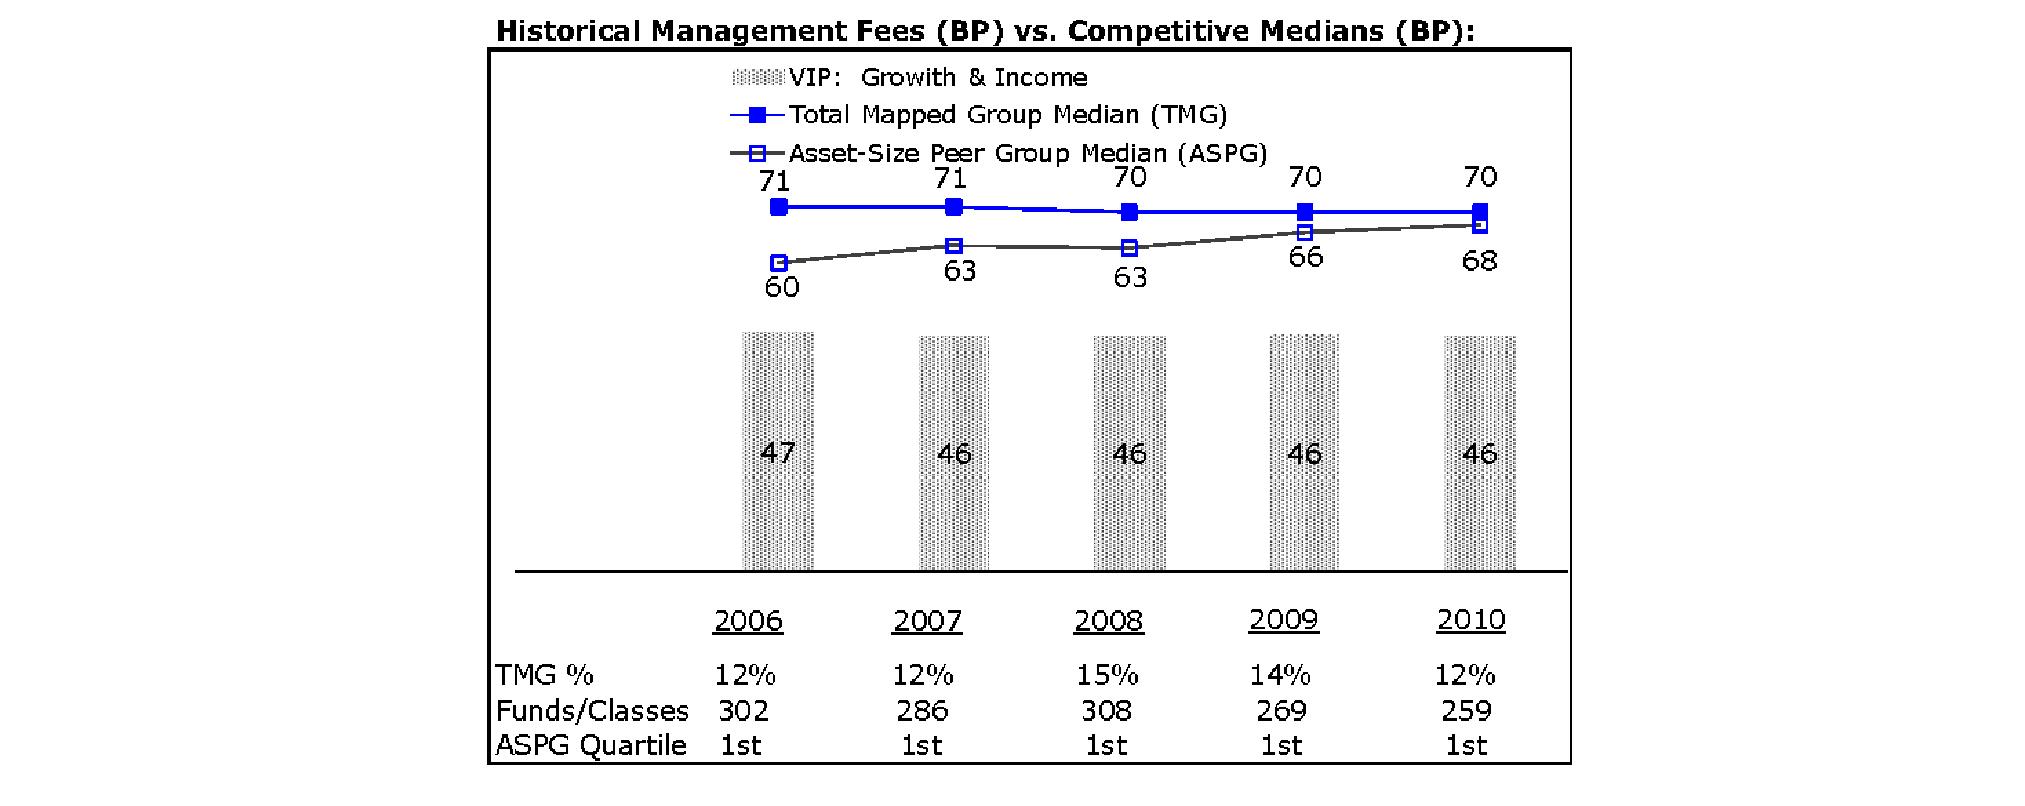
The Board noted that the fund's management fee ranked below the median of its Total Mapped Group and below the median of its ASPG for 2010.
Based on its review, the Board concluded that the fund's management fee is fair and reasonable in light of the services that the fund receives and the other factors considered.
Total Expense Ratio. In its review of each class's total expense ratio, the Board considered the fund's management fee as well as other fund or class expenses, as applicable, such as transfer agent fees, pricing and bookkeeping fees, fund-paid 12b-1 fees, and custodial, legal, and audit fees. The Board also noted the effects of any waivers and reimbursements on fees and expenses. As part of its review, the Board also considered the current and historical total expense ratios of each class of the fund compared to competitive fund median expenses. Each class of the fund is compared to those funds and classes in the Total Mapped Group (used by the Board for management fee comparisons) that have a similar sales load structure.
The Board noted that the total expense ratio of each class ranked below its competitive median for 2010. The Board considered that various factors, including 12b-1 fees, positive or negative performance adjustments, and relatively higher other expenses in the case of small fund size, can affect total expense ratios. The Board also noted that Investor Class has higher transfer agent fees than traditional variable annuity classes because it is designed for lower cost annuity products, where the majority of servicing costs are incorporated into the funds' total expense ratios rather than being paid at the annuity level.
Fees Charged to Other Fidelity Clients. The Board also considered Fidelity fee structures and other information with respect to clients of FMR and its affiliates, such as other mutual funds advised or subadvised by FMR or its affiliates, pension plan clients, and other institutional clients. In March 2010, the Board created an ad hoc joint committee with the board of other Fidelity funds (the Committee) to review and compare Fidelity's institutional investment advisory business with its business of providing services to the Fidelity funds, including the differences in services provided, fees charged, and costs incurred, as well as competition in their respective marketplaces.
Annual Report
Board Approval of Investment Advisory Contracts and Management Fees - continued
Based on its review of total expense ratios and fees charged to other Fidelity clients, the Board concluded that the total expense ratio of each class of the fund was reasonable in light of the services that the fund and its shareholders receive and the other factors considered, including the findings of the Committee.
Costs of the Services and Profitability. The Board considered the revenues earned and the expenses incurred by Fidelity in conducting the business of developing, marketing, distributing, managing, administering and servicing the fund and its shareholders. The Board also considered the level of Fidelity's profits in respect of all the Fidelity funds.
On an annual basis, FMR presents to the Board Fidelity's profitability for the fund. Fidelity calculates the profitability for each fund, as well as aggregate profitability for groups of Fidelity funds and all Fidelity funds, using a series of detailed revenue and cost allocation methodologies which originate with the books and records of Fidelity on which Fidelity's audited financial statements are based. The Audit Committee of the Board reviews any significant changes from the prior year's methodologies.
PricewaterhouseCoopers LLP (PwC), independent registered public accounting firm and auditor to Fidelity and certain Fidelity funds, has been engaged annually by the Board as part of the Board's assessment of Fidelity's profitability analysis. PwC's engagement includes the review and assessment of Fidelity's methodologies used in determining the revenues and expenses attributable to Fidelity's mutual fund business, and completion of agreed-upon procedures surrounding the mathematical accuracy of fund profitability and its conformity to allocation methodologies. After considering PwC's reports issued under the engagement and information provided by Fidelity, the Board concluded that while other allocation methods may also be reasonable, Fidelity's profitability methodologies are reasonable in all material respects.
The Board also reviewed Fidelity's non-fund businesses and fall-out benefits related to the mutual fund business as well as cases where Fidelity's affiliates may benefit from or be related to the fund's business.
The Board considered the costs of the services provided by and the profits realized by Fidelity in connection with the operation of the fund and was satisfied that the profitability was not excessive in the circumstances.
Economies of Scale. The Board considered whether there have been economies of scale in respect of the management of the Fidelity funds, whether the Fidelity funds (including the fund) have appropriately benefited from any such economies of scale, and whether there is potential for realization of any further economies of scale. The Board considered the extent to which the fund will benefit from economies of scale through increased services to the fund, through waivers or reimbursements, or through fee or expense reductions. The Board also noted that in 2009, it and the board of other Fidelity funds created an ad hoc committee (the Economies of Scale Committee) to analyze whether FMR attains economies of scale in respect of the management and servicing of the Fidelity funds, whether the Fidelity funds have appropriately benefited from such economies of scale, and whether there is potential for realization of any further economies of scale.
The Board recognized that the fund's management contract incorporates a "group fee" structure, which provides for lower group fee rates as total fund assets under FMR's management increase, and for higher group fee rates as total fund assets under FMR's management decrease. FMR calculates the group fee rates based on a tiered asset "breakpoint" schedule that varies based on asset class. The Board considered that the group fee is designed to deliver the benefits of economies of scale to fund shareholders when total Fidelity fund assets increase, even if assets of any particular fund are unchanged or have declined, because some portion of Fidelity's costs are attributable to services provided to all Fidelity funds, and all funds benefit if those costs can be allocated among more assets. The Board concluded that, given the group fee structure, fund shareholders will benefit from lower management fees as assets under FMR's management increase at the fund complex level, regardless of whether Fidelity achieves any such economies of scale.
The Board concluded, taking into account the analysis of the Economies of Scale Committee, that any potential economies of scale are being appropriately shared between fund shareholders and Fidelity.
Additional Information Requested by the Board. In order to develop fully the factual basis for consideration of the Fidelity funds' Advisory Contracts, the Board requested and received additional information on certain topics, including (i) fund performance trends, actions to be taken by FMR to improve certain funds' overall performance, and Fidelity's long-term strategies for certain funds; (ii) portfolio manager changes that have occurred during the past year and length of portfolio manager tenure for different categories of funds over time; (iii) Fidelity's compensation structure for portfolio managers and other key personnel and strategies for attracting and retaining non-investment personnel; (iv) the amount of the investment that each portfolio manager has made in the Fidelity fund(s) that he or she manages; (v) historical trends in Fidelity's realization of fall-out benefits; (vi) Fidelity's group fee structures and the rationale for the individual fee rates of certain funds; (vii) fund profitability methodology and the impact of certain factors on fund profitability results; (viii) trends regarding industry use of performance fee structures and Fidelity's compliance practices with respect to performance adjustment calculations; (ix) the fee structures in place for certain other Fidelity clients; and (x) explanations regarding the relative total expense ratios of certain funds and classes, total expense competitive trends, and actions that might be taken by FMR to reduce total expense ratios for certain funds and classes.
Based on its evaluation of all of the conclusions noted above, and after considering all factors it believed relevant, the Board ultimately concluded that the advisory fee structures are fair and reasonable, and that the fund's Advisory Contracts should be renewed.
Annual Report
Investment Adviser
Fidelity Management & Research Company
Boston, MA
Investment Sub-Advisers
FMR Co., Inc.
Fidelity Management & Research (U.K.) Inc.
Fidelity Management & Research (Hong Kong) Limited
Fidelity Management & Research (Japan) Inc.
General Distributor
Fidelity Distributors Corporation
Boston, MA
Transfer and Service Agents
Fidelity Investments Institutional Operations Company, Inc.
Boston, MA
Fidelity Service Company, Inc.
Boston, MA
Custodian
JPMorgan Chase Bank
New York, NY
VIPGI-ANN-0212
1.540026.114
Fidelity® Variable Insurance Products:
Balanced Portfolio
Annual Report
December 31, 2011
Contents
Performance | (Click Here) | How the fund has done over time. |
Management's Discussion of Fund Performance | (Click Here) | The Portfolio Manager's review of fund performance and strategy. |
Shareholder Expense Example | (Click Here) | An example of shareholder expenses. |
Investment Changes | (Click Here) | A summary of major shifts in the fund's investments over the past six months. |
Investments | (Click Here) | A complete list of the fund's investments with their market values. |
Financial Statements | (Click Here) | Statements of assets and liabilities, operations, and changes in net assets, as well as financial highlights. |
Notes | (Click Here) | Notes to the financial statements. |
Report of Independent Registered Public Accounting Firm | (Click Here) | |
Trustees and Officers | (Click Here) | |
Distributions | (Click Here) | |
Board Approval of Investment Advisory Contracts and Management Fees | (Click Here) | |
To view a fund's proxy voting guidelines and proxy voting record for the 12-month period ended June 30, visit http://www.fidelity.com/proxyvotingresults or visit the Securities and Exchange Commission's (SEC) web site at http://www.sec.gov. You may also call 1-877-208-0098 to request a free copy of the proxy voting guidelines.
Fidelity® Variable Insurance Products are separate account options which are purchased through a variable insurance contract.
Standard & Poor's, S&P and S&P 500 are registered service marks of The McGraw-Hill Companies, Inc. and have been licensed for use by Fidelity Distributors Corporation.
Other third party marks appearing herein are the property of their respective owners.
All other marks appearing herein are registered or unregistered trademarks or service marks of FMR LLC or an affiliated company.
This report and the financial statements contained herein are submitted for the general information of the shareholders of the fund. This report is not authorized for distribution to prospective investors in the fund unless preceded or accompanied by an effective prospectus.
A fund files its complete schedule of portfolio holdings with the SEC for the first and third quarters of each fiscal year on Form N-Q. Forms N-Q are available on the SEC's web site at http://www.sec.gov. A fund's Forms N-Q may be reviewed and copied at the SEC's Public Reference Room in Washington, DC. Information regarding the operation of the SEC's Public Reference Room may be obtained by calling 1-800-SEC-0330. For a complete list of a fund's portfolio holdings, view the most recent holdings listing, semiannual report, or annual report on Fidelity's web site at http://www.fidelity.com, http://www.advisor.fidelity.com, or http://www.401k.com, as applicable.
NOT FDIC INSURED • MAY LOSE VALUE • NO BANK GUARANTEE
Neither the fund nor Fidelity Distributors Corporation is a bank.
Annual Report
Average annual total return reflects the change in the value of an investment, assuming reinvestment of the class' distributions from dividend income and capital gains (the profits earned upon the sale of securities that have grown in value, if any) and assuming a constant rate of performance each year. During periods of reimbursement by Fidelity, a fund's total return will be greater than it would be had the reimbursement not occurred. Performance numbers are net of all underlying fund operating expenses, but do not include any insurance charges imposed by your insurance company's separate account. If performance information included the effect of these additional charges, the total returns would have been lower. How a fund did yesterday is no guarantee of how it will do tomorrow.
Average Annual Total Returns
Periods ended December 31, 2011 | Past 1
year | Past 5
years | Past 10
years |
VIP Balanced Portfolio - Initial Class | -3.61% | 2.57% | 4.28% |
VIP Balanced Portfolio - Service Class | -3.78% | 2.45% | 4.17% |
VIP Balanced Portfolio - Service Class 2 | -3.83% | 2.32% | 4.02% |
VIP Balanced Portfolio - Investor Class A | -3.71% | 2.49% | 4.21% |
A The initial offering of Investor Class shares took place on July 21, 2005. Returns prior to July 21, 2005 are those of Initial Class. Had Investor Class's transfer agent fee been reflected, returns prior to July 21, 2005 would have been lower.
$10,000 Over 10 Years
Let's say hypothetically that $10,000 was invested in VIP Balanced Portfolio - Initial Class on December 31, 2001. The chart shows how the value of your investment would have changed, and also shows how the S&P 500® Index performed over the same period.
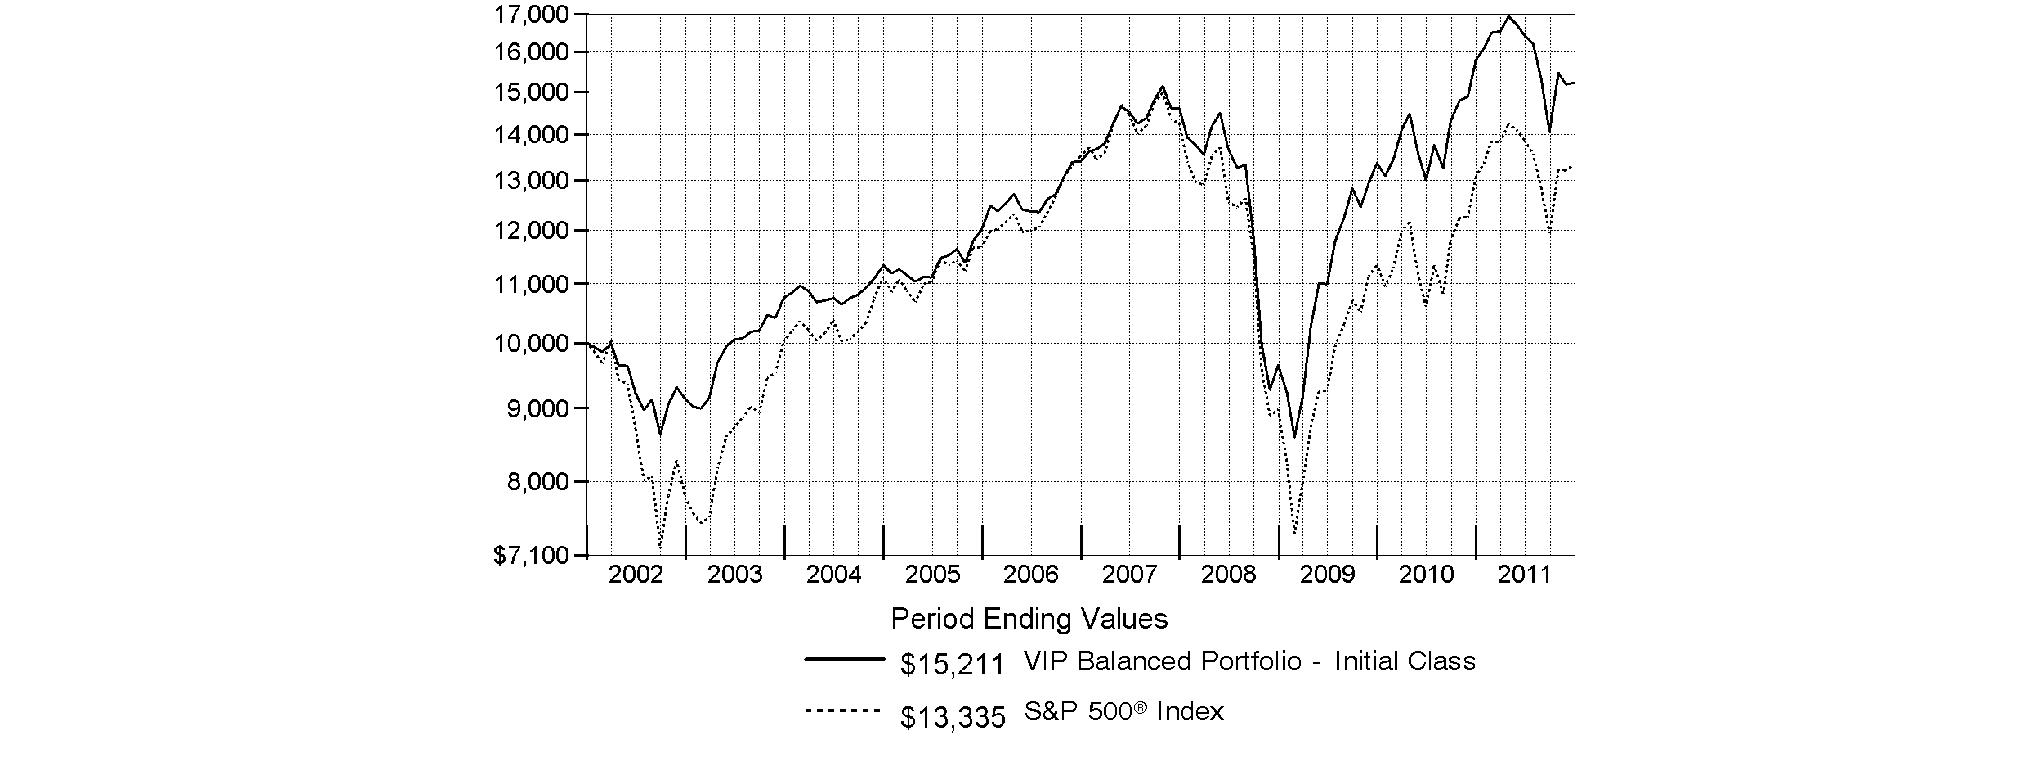
Annual Report
Market Recap: Extreme market volatility took center stage during the 12 months ending December 31, 2011, stealing the spotlight from signs of progress in the global economy. Early in the year, aggressive monetary stimulus by the U.S. federal government, improving credit-market conditions and solid corporate earnings buoyed most major asset classes. As the period progressed, however, fresh worries about sovereign debt in Europe, inflation in China, gridlock over raising the debt ceiling in the U.S. - along with Standard & Poor's early-August downgrade of the nation's long-term sovereign credit rating - and a dimmed outlook for global growth punctured investor confidence and ignited market instability. Domestic equities, as measured by the broad-based S&P 500® Index, gained 2.11%, easily outpacing the 13.61% decline of MSCI® ACWI® (All Country World Index) ex USA Index, a proxy for foreign stocks. Within the MSCI index, emerging markets declined the most (-18%), with investments here generally held back by a stronger U.S. dollar. The U.K. (-3%) fared better than the rest of Europe (-15%), which was the second-worst-performing index component. Bolstered by periodic flights to quality, U.S. investment-grade bonds posted a 7.84% advance, as reflected by the Barclays Capital® U.S. Aggregate Bond Index, outperforming the 4.37% gain of high-yield securities, as represented by The BofA Merrill LynchSM US High Yield Constrained Index. Hampered by financial woes in Europe, the sovereign debt of major developed markets outside the U.S. rose 4.86%, according to the Citigroup® Non-USD Group-of-Seven (G7) Equal Weighted Index, while the JPMorgan Emerging Markets Bond Index Global (EMBI Global) advanced 8.46%, despite the currency head wind.
Comments from Lawrence Rakers, Lead Portfolio Manager of VIP Balanced Portfolio: During the year, the fund's share classes significantly trailed the 4.69% return of the Fidelity Balanced 60/40 Composite Index. (For specific portfolio performance results, please refer to the performance section of this report.) The fund's shortfall was primarily due to a weak showing by the stock subportfolio, which significantly underperformed the S&P 500®. In broad terms, the equity subportfolio struggled because I had too much risk in it during the period's second half, when investors took shelter in defensive stocks and market sectors. From a sector standpoint, stock picking in energy, consumer discretionary, health care and industrials had the most negative impact. Secondarily, the fund was hurt by my decision to underweight bonds and overweight stocks. A number of the biggest stock detractors were defensive index components in which the equity subportfolio either had no exposure or was significantly underweighted. For example, a lighter-than-index weighting in energy major Exxon Mobil and having no stake in technology services giant International Business Machines - both strong performers during the period - hampered performance. A negligible position in pharmaceuticals maker Pfizer also hurt. Exxon Mobil and Pfizer were sold from the fund by period end. Among stocks I overweighted, commercial bank Citigroup detracted. On the positive side, underweighting and ultimately selling index component Bank of America was timely, given the stock's extremely poor showing. Not owning automaker Ford Motor also helped. A small out-of-index position in ARIAD Pharmaceuticals paid off nicely, bolstered by positive test results for the company's medication to treat a form of leukemia. Turning to bonds, the investment-grade bond subportfolio - represented by VIP Investment Grade Central Fund, which I also manage - slightly outpaced the Barclays Capital index. Positioning among U.S. Treasury securities, an overweighting in corporate bonds and a significant underweighting in U.S. government agency securities bolstered relative performance, more than offsetting some disadvantageous sector weightings elsewhere and security selection among corporates. Although the fund gave up some ground due to an underweighting in Treasuries overall, yield-curve positioning within the sector was a plus. Specifically, overweighting 10- to 30-year bonds proved beneficial, as they significantly outpaced the index during the period. A corresponding underweighting in shorter-term Treasury issues also was advantageous, as this group showed more-subdued gains. An out-of-benchmark stake in Treasury Inflation-Protected Securities (TIPS), with a focus on intermediate- and long-maturity bonds, further contributed. Conversely, an emphasis on lagging financials curbed our upside within corporates, while overweightings in asset-backed and commercial-backed mortgage securities also detracted.
The views expressed above reflect those of the portfolio manager(s) only through the end of the period as stated on the cover of this report and do not necessarily represent the views of Fidelity or any other person in the Fidelity organization. Any such views are subject to change at any time based upon market or other conditions and Fidelity disclaims any responsibility to update such views. These views may not be relied on as investment advice and, because investment decisions for a Fidelity fund are based on numerous factors, may not be relied on as an indication of trading intent on behalf of any Fidelity fund.
Annual Report
As a shareholder of the Fund, you incur two types of costs: (1) transaction costs, and (2) ongoing costs, including management fees, distribution and/or service (12b-1) fees and other Fund expenses. This Example is intended to help you understand your ongoing costs (in dollars) of investing in the Fund and to compare these costs with the ongoing costs of investing in other mutual funds.
The Example is based on an investment of $1,000 invested at the beginning of the period and held for the entire period (July 1, 2011 to December 31, 2011).
Actual Expenses
The first line of the accompanying table for each class of the Fund provides information about actual account values and actual expenses. You may use the information in this line, together with the amount you invested, to estimate the expenses that you paid over the period. Simply divide your account value by $1,000.00 (for example, an $8,600 account value divided by $1,000.00 = 8.6), then multiply the result by the number in the first line for a class of the Fund under the heading entitled "Expenses Paid During Period" to estimate the expenses you paid on your account during this period. The estimate of expenses does not include any fees or other expenses of any variable annuity or variable life insurance product. If they were, the estimate of expenses you paid during the period would be higher, and your ending account value would be lower. In addition, the Fund, as a shareholder in the underlying Fidelity Central Funds, will indirectly bear its pro-rata share of the fees and expenses incurred by the underlying Fidelity Central Funds. These fees and expenses are not included in the Fund's annualized expense ratio used to calculate the expense estimate in the table below.
Hypothetical Example for Comparison Purposes
The second line of the accompanying table for each class of the Fund provides information about hypothetical account values and hypothetical expenses based on a Class' actual expense ratio and an assumed rate of return of 5% per year before expenses, which is not the Class' actual return. The hypothetical account values and expenses may not be used to estimate the actual ending account balance or expenses you paid for the period. You may use this information to compare the ongoing costs of investing in the Fund and other funds. To do so, compare this 5% hypothetical example with the 5% hypothetical examples that appear in the shareholder reports of the other funds. The estimate of expenses does not include any fees or other expenses of any variable annuity or variable life insurance product. If they were, the estimate of expenses you paid during the period would be higher, and your ending account value would be lower. In addition, the Fund, as a shareholder in the underlying Fidelity Central Funds, will indirectly bear its pro-rata share of the fees and expenses incurred by the underlying Fidelity Central Funds. These fees and expenses are not included in the Fund's annualized expense ratio used to calculate the expense estimate in the table below.
Please note that the expenses shown in the table are meant to highlight your ongoing costs only and do not reflect any transaction costs. Therefore, the second line of the table is useful in comparing ongoing costs only, and will not help you determine the relative total costs of owning different funds.
| Annualized
Expense Ratio | Beginning
Account Value
July 1, 2011 | Ending
Account Value
December 31, 2011 | Expenses Paid
During Period*
July 1, 2011 to
December 31, 2011 |
Initial Class | .53% | | | |
Actual | | $ 1,000.00 | $ 927.60 | $ 2.58 |
HypotheticalA | | $ 1,000.00 | $ 1,022.53 | $ 2.70 |
Service Class | .67% | | | |
Actual | | $ 1,000.00 | $ 926.50 | $ 3.25 |
HypotheticalA | | $ 1,000.00 | $ 1,021.83 | $ 3.41 |
Service Class 2 | .78% | | | |
Actual | | $ 1,000.00 | $ 926.30 | $ 3.79 |
HypotheticalA | | $ 1,000.00 | $ 1,021.27 | $ 3.97 |
Investor Class | .62% | | | |
Actual | | $ 1,000.00 | $ 927.10 | $ 3.01 |
HypotheticalA | | $ 1,000.00 | $ 1,022.08 | $ 3.16 |
A 5% return per year before expenses
* Expenses are equal to each Class' annualized expense ratio, multiplied by the average account value over the period, multiplied by 184/365 (to reflect the one-half year period). The fees and expenses of the underlying Fidelity Central Funds in which the Fund invests are not included in the Fund's annualized expense ratio.
Annual Report
Investment Changes (Unaudited)
The information in the following tables is based on the combined investments of the Fund and its pro-rata share of its investments in each Fidelity Central Fund.
Top Five Stocks as of December 31, 2011 |
| % of fund's
net assets | % of fund's net assets
6 months ago |
Apple, Inc. | 2.6 | 1.8 |
Wells Fargo & Co. | 1.2 | 1.1 |
General Electric Co. | 1.1 | 0.9 |
Procter & Gamble Co. | 1.1 | 0.8 |
Citigroup, Inc. | 1.0 | 1.1 |
| 7.0 | |
Top Five Bond Issuers as of December 31, 2011 |
(with maturities greater than one year) | % of fund's
net assets | % of fund's net assets
6 months ago |
U.S. Treasury Obligations | 7.0 | 6.5 |
Fannie Mae | 6.3 | 5.7 |
Freddie Mac | 2.0 | 1.2 |
Ginnie Mae | 1.7 | 1.8 |
Citigroup, Inc. | 0.2 | 0.3 |
| 17.2 | |
Top Five Market Sectors as of December 31, 2011 |
| % of fund's
net assets | % of fund's net assets
6 months ago |
Financials | 13.0 | 13.3 |
Information Technology | 12.9 | 11.7 |
Industrials | 10.5 | 10.8 |
Energy | 10.1 | 9.9 |
Consumer Discretionary | 9.5 | 8.6 |
Asset Allocation (% of fund's net assets) |
As of December 31, 2011* | As of June 30, 2011** |
 | Stocks 68.5% | | | Stocks 67.9% | |
 | Bonds 31.0% | | | Bonds 27.8% | |
 | Short-Term
Investments and
Net Other Assets 0.5% | | | Short-Term
Investments and
Net Other Assets 4.3% | |
* Foreign investments | 15.5% | | ** Foreign investments | 15.4% | |

Percentages are adjusted for the effect of futures and swap contracts, if applicable.
A holdings listing for the Fund, which presents direct holdings as well as the pro-rata share of any securities and other investments held indirectly through its investment in underlying non-money market Fidelity Central Funds, is available at advisor.fidelity.com.
Annual Report
Investments December 31, 2011
Showing Percentage of Net Assets
Common Stocks - 67.9% |
| Shares | | Value |
CONSUMER DISCRETIONARY - 8.0% |
Auto Components - 0.5% |
Autoliv, Inc. | 29,705 | | $ 1,588,920 |
Modine Manufacturing Co. (a) | 129,511 | | 1,225,174 |
Nokian Tyres PLC | 40,792 | | 1,313,693 |
Stoneridge, Inc. (a) | 91,211 | | 768,909 |
Tenneco, Inc. (a) | 80,750 | | 2,404,735 |
TRW Automotive Holdings Corp. (a) | 35,803 | | 1,167,178 |
| | 8,468,609 |
Automobiles - 0.1% |
Honda Motor Co. Ltd. | 21,000 | | 639,721 |
Winnebago Industries, Inc. (a) | 252,372 | | 1,862,505 |
| | 2,502,226 |
Distributors - 0.1% |
Silver Base Group Holdings Ltd. | 1,357,000 | | 1,100,752 |
Diversified Consumer Services - 0.4% |
Anhanguera Educacional Participacoes SA | 109,300 | | 1,179,117 |
Carriage Services, Inc. | 24,247 | | 135,783 |
DeVry, Inc. | 33,751 | | 1,298,063 |
Service Corp. International | 132,300 | | 1,408,995 |
Stewart Enterprises, Inc. Class A | 241,047 | | 1,388,431 |
Weight Watchers International, Inc. | 22,400 | | 1,232,224 |
| | 6,642,613 |
Hotels, Restaurants & Leisure - 1.3% |
Accor SA | 51,697 | | 1,310,562 |
Bravo Brio Restaurant Group, Inc. (a) | 47,833 | | 820,336 |
Brinker International, Inc. | 155,420 | | 4,159,039 |
Club Mediterranee SA (a) | 82,329 | | 1,402,417 |
Darden Restaurants, Inc. | 12,132 | | 552,977 |
Denny's Corp. (a) | 521,241 | | 1,959,866 |
DineEquity, Inc. (a) | 55,380 | | 2,337,590 |
O'Charleys, Inc. (a) | 235,966 | | 1,295,453 |
Sands China Ltd. (a) | 420,400 | | 1,188,136 |
Spur Corp. Ltd. | 275,715 | | 536,225 |
Starbucks Corp. | 48,986 | | 2,253,846 |
Texas Roadhouse, Inc. Class A | 98,057 | | 1,461,049 |
WMS Industries, Inc. (a) | 114,413 | | 2,347,755 |
Wyndham Worldwide Corp. | 12,050 | | 455,852 |
| | 22,081,103 |
Household Durables - 0.4% |
Garmin Ltd. | 34,135 | | 1,358,914 |
Lennar Corp. Class A | 13,800 | | 271,170 |
Newell Rubbermaid, Inc. | 104,352 | | 1,685,285 |
PulteGroup, Inc. (a) | 137,596 | | 868,231 |
Standard Pacific Corp. (a) | 494,661 | | 1,573,022 |
Techtronic Industries Co. Ltd. | 1,065,500 | | 1,096,148 |
| | 6,852,770 |
|
| Shares | | Value |
Internet & Catalog Retail - 0.3% |
Amazon.com, Inc. (a) | 24,100 | | $ 4,171,710 |
Liberty Media Corp. Interactive Series A (a) | 78,993 | | 1,280,871 |
| | 5,452,581 |
Leisure Equipment & Products - 0.1% |
Hasbro, Inc. | 50,541 | | 1,611,752 |
Summer Infant, Inc. (a) | 65,975 | | 464,464 |
| | 2,076,216 |
Media - 1.7% |
Aegis Group PLC | 256,300 | | 574,816 |
Antena 3 Television SA (d) | 210,102 | | 1,264,596 |
Comcast Corp. Class A | 293,622 | | 6,961,778 |
DISH Network Corp. Class A | 71,783 | | 2,044,380 |
Lions Gate Entertainment Corp. (a) | 56,000 | | 465,920 |
MDC Partners, Inc. Class A (sub. vtg.) | 140,061 | | 1,893,625 |
Mood Media Corp. (a)(d) | 160,600 | | 380,053 |
Mood Media Corp. (g) | 254,200 | | 601,553 |
The Walt Disney Co. | 215,397 | | 8,077,388 |
Time Warner, Inc. | 190,383 | | 6,880,442 |
Valassis Communications, Inc. (a) | 29,709 | | 571,304 |
| | 29,715,855 |
Multiline Retail - 0.6% |
Dollar General Corp. (a) | 14,400 | | 592,416 |
Maoye International Holdings Ltd. (a) | 1,781,000 | | 362,318 |
Marisa Lojas SA | 111,400 | | 1,022,402 |
PPR SA | 12,300 | | 1,761,672 |
Target Corp. | 129,176 | | 6,616,395 |
| | 10,355,203 |
Specialty Retail - 2.1% |
Advance Auto Parts, Inc. | 60,800 | | 4,233,504 |
American Eagle Outfitters, Inc. | 105,361 | | 1,610,970 |
Ascena Retail Group, Inc. (a) | 28,678 | | 852,310 |
Best Buy Co., Inc. | 74,237 | | 1,734,919 |
Big 5 Sporting Goods Corp. | 57,300 | | 598,212 |
Carphone Warehouse Group PLC | 170,257 | | 817,101 |
Casual Male Retail Group, Inc. (a) | 176,441 | | 603,428 |
Charming Shoppes, Inc. (a) | 17,500 | | 85,750 |
Cia.Hering SA | 7,900 | | 137,631 |
Citi Trends, Inc. (a) | 46,493 | | 408,209 |
Collective Brands, Inc. (a) | 105,900 | | 1,521,783 |
Destination Maternity Corp. | 27,279 | | 456,105 |
Express, Inc. | 82,265 | | 1,640,364 |
Fast Retailing Co. Ltd. | 5,100 | | 927,694 |
Foot Locker, Inc. | 76,497 | | 1,823,688 |
Foschini Ltd. | 83,196 | | 1,082,024 |
GameStop Corp. Class A (a) | 19,402 | | 468,170 |
GOME Electrical Appliances Holdings Ltd. | 697,000 | | 161,538 |
Guess?, Inc. | 39,776 | | 1,186,120 |
Hengdeli Holdings Ltd. | 2,516,000 | | 822,836 |
Home Depot, Inc. | 18,900 | | 794,556 |
Common Stocks - continued |
| Shares | | Value |
CONSUMER DISCRETIONARY - continued |
Specialty Retail - continued |
Limited Brands, Inc. | 29,532 | | $ 1,191,616 |
Lowe's Companies, Inc. | 276,814 | | 7,025,539 |
Lumber Liquidators Holdings, Inc. (a) | 51,316 | | 906,241 |
MarineMax, Inc. (a) | 107,895 | | 703,475 |
OfficeMax, Inc. (a) | 194,150 | | 881,441 |
rue21, Inc. (a) | 41,923 | | 905,537 |
SuperGroup PLC (a)(d) | 242,324 | | 1,910,055 |
Urban Outfitters, Inc. (a) | 12,049 | | 332,070 |
| | 35,822,886 |
Textiles, Apparel & Luxury Goods - 0.4% |
Bosideng International Holdings Ltd. | 3,028,000 | | 857,724 |
G-III Apparel Group Ltd. (a) | 88,890 | | 2,214,250 |
Peak Sport Products Co. Ltd. | 104,000 | | 27,317 |
PVH Corp. | 41,683 | | 2,938,235 |
VF Corp. | 10,964 | | 1,392,318 |
| | 7,429,844 |
TOTAL CONSUMER DISCRETIONARY | | 138,500,658 |
CONSUMER STAPLES - 6.0% |
Beverages - 1.4% |
Carlsberg A/S Series B | 40,500 | | 2,856,235 |
Dr Pepper Snapple Group, Inc. | 55,725 | | 2,200,023 |
Grupo Modelo SAB de CV Series C | 381,000 | | 2,416,010 |
The Coca-Cola Co. | 238,225 | | 16,668,603 |
| | 24,140,871 |
Food & Staples Retailing - 1.0% |
CVS Caremark Corp. | 279,170 | | 11,384,553 |
Drogasil SA | 127,160 | | 885,179 |
Eurocash SA | 75,163 | | 621,711 |
The Pantry, Inc. (a) | 87,317 | | 1,045,184 |
Walgreen Co. | 96,628 | | 3,194,522 |
| | 17,131,149 |
Food Products - 1.0% |
Biostime International Holdings Ltd. | 190,000 | | 335,153 |
Calavo Growers, Inc. | 47,663 | | 1,223,986 |
Calbee, Inc. | 7,400 | | 361,996 |
Danone | 27,300 | | 1,716,324 |
Flowers Foods, Inc. | 35,540 | | 674,549 |
Green Mountain Coffee Roasters, Inc. (a) | 43,200 | | 1,937,520 |
Kraft Foods, Inc. Class A | 186,572 | | 6,970,330 |
Orion Corp. | 266 | | 155,198 |
Ralcorp Holdings, Inc. (a) | 6,160 | | 526,680 |
Sara Lee Corp. | 119,646 | | 2,263,702 |
Shenguan Holdings Group Ltd. | 2,396,000 | | 1,388,252 |
| | 17,553,690 |
Household Products - 1.3% |
Procter & Gamble Co. | 270,718 | | 18,059,598 |
|
| Shares | | Value |
Spectrum Brands Holdings, Inc. (a) | 55,569 | | $ 1,522,591 |
Unicharm Corp. | 43,700 | | 2,154,765 |
| | 21,736,954 |
Personal Products - 0.1% |
Estee Lauder Companies, Inc. Class A | 5,456 | | 612,818 |
Hengan International Group Co. Ltd. | 114,500 | | 1,071,051 |
| | 1,683,869 |
Tobacco - 1.2% |
British American Tobacco PLC (United Kingdom) | 44,400 | | 2,106,557 |
Imperial Tobacco Group PLC | 52,543 | | 1,987,134 |
Japan Tobacco, Inc. | 547 | | 2,572,780 |
Philip Morris International, Inc. | 183,317 | | 14,386,718 |
Swedish Match Co. | 11,000 | | 390,545 |
| | 21,443,734 |
TOTAL CONSUMER STAPLES | | 103,690,267 |
ENERGY - 8.8% |
Energy Equipment & Services - 3.2% |
Aker Solutions ASA | 239,572 | | 2,521,937 |
Baker Hughes, Inc. | 104,099 | | 5,063,375 |
BW Offshore Ltd. | 36,262 | | 57,304 |
Cal Dive International, Inc. (a) | 238,901 | | 537,527 |
Cameron International Corp. (a) | 56,445 | | 2,776,530 |
Cathedral Energy Services Ltd. | 191,700 | | 1,360,950 |
Ensco International Ltd. ADR | 22,360 | | 1,049,131 |
Essential Energy Services Ltd. (a) | 685,600 | | 1,386,819 |
Exterran Holdings, Inc. (a) | 11,444 | | 104,140 |
Halliburton Co. | 136,131 | | 4,697,881 |
Hornbeck Offshore Services, Inc. (a) | 115,348 | | 3,578,095 |
ION Geophysical Corp. (a) | 311,105 | | 1,907,074 |
McDermott International, Inc. (a) | 119,585 | | 1,376,423 |
Nabors Industries Ltd. (a) | 24,700 | | 428,298 |
National Oilwell Varco, Inc. | 139,489 | | 9,483,857 |
Noble Corp. | 46,613 | | 1,408,645 |
Saipem SpA | 51,196 | | 2,176,907 |
Schlumberger Ltd. | 143,365 | | 9,793,263 |
Transocean Ltd. (United States) | 65,609 | | 2,518,730 |
Trinidad Drilling Ltd. | 31,500 | | 240,333 |
Tuscany International Drilling, Inc. (a) | 116,600 | | 68,696 |
Unit Corp. (a) | 26,900 | | 1,248,160 |
Vantage Drilling Co. (a) | 840,350 | | 974,806 |
Xtreme Coil Drilling Corp. (a) | 257,000 | | 946,337 |
| | 55,705,218 |
Oil, Gas & Consumable Fuels - 5.6% |
Alpha Natural Resources, Inc. (a) | 66,359 | | 1,355,714 |
Americas Petrogas, Inc. (a) | 361,400 | | 1,057,514 |
Americas Petrogas, Inc. (e) | 284,000 | | 831,029 |
Amyris, Inc. (a) | 48,436 | | 558,951 |
Anadarko Petroleum Corp. | 69,883 | | 5,334,169 |
Apache Corp. | 33,565 | | 3,040,318 |
Bonavista Energy Corp. | 2,300 | | 58,878 |
Common Stocks - continued |
| Shares | | Value |
ENERGY - continued |
Oil, Gas & Consumable Fuels - continued |
Bonavista Energy Corp. (e) | 21,700 | | $ 555,498 |
BPZ Energy, Inc. (a)(d) | 335,072 | | 951,604 |
C&C Energia Ltd. (a) | 5,700 | | 42,369 |
Cabot Oil & Gas Corp. | 9,100 | | 690,690 |
Chesapeake Energy Corp. | 82,981 | | 1,849,646 |
Chevron Corp. | 98,189 | | 10,447,310 |
Crown Point Ventures Ltd. (a) | 140,000 | | 133,346 |
Crown Point Ventures Ltd. (e) | 565,806 | | 538,916 |
CVR Energy, Inc. (a) | 181,108 | | 3,392,153 |
Denbury Resources, Inc. (a) | 88,989 | | 1,343,734 |
Double Eagle Petroleum Co. (a) | 144,237 | | 992,351 |
EOG Resources, Inc. | 18,440 | | 1,816,524 |
EV Energy Partners LP | 21,410 | | 1,410,919 |
EXCO Resources, Inc. | 33,207 | | 347,013 |
Gran Tierra Energy, Inc. (Canada) (a) | 84,900 | | 410,161 |
Gulfport Energy Corp. (a) | 56,691 | | 1,669,550 |
Hess Corp. | 22,501 | | 1,278,057 |
HollyFrontier Corp. | 140,632 | | 3,290,789 |
Inergy Midstream LP | 56,800 | | 1,076,360 |
InterOil Corp. (a)(d) | 48,598 | | 2,484,816 |
Kodiak Oil & Gas Corp. (a)(d) | 69,300 | | 658,350 |
Kosmos Energy Ltd. | 73,500 | | 901,110 |
Marathon Oil Corp. | 84,106 | | 2,461,783 |
Marathon Petroleum Corp. | 81,482 | | 2,712,536 |
Niko Resources Ltd. | 23,300 | | 1,103,455 |
Northern Oil & Gas, Inc. (a)(d) | 269,993 | | 6,474,432 |
Occidental Petroleum Corp. | 95,723 | | 8,969,245 |
Painted Pony Petroleum Ltd. (a)(e) | 24,500 | | 269,442 |
Painted Pony Petroleum Ltd. Class A (a) | 11,200 | | 123,174 |
Paladin Energy Ltd. (Australia) (a) | 1,006,086 | | 1,409,557 |
Pan Orient Energy Corp. (a) | 122,000 | | 233,602 |
Petroleum Development Corp. (a) | 28,959 | | 1,016,750 |
Resolute Energy Corp. (a)(d) | 185,196 | | 2,000,117 |
Royal Dutch Shell PLC Class A sponsored ADR | 27,002 | | 1,973,576 |
Southwestern Energy Co. (a) | 39,518 | | 1,262,205 |
Suncor Energy, Inc. | 36,680 | | 1,058,188 |
TAG Oil Ltd. (a) | 161,900 | | 1,119,183 |
Talisman Energy, Inc. | 51,100 | | 651,294 |
Targa Resources Corp. | 22,700 | | 923,663 |
Tesoro Corp. (a) | 123,509 | | 2,885,170 |
Valero Energy Corp. | 149,382 | | 3,144,491 |
Voyager Oil & Gas, Inc. (a)(d) | 490,084 | | 1,259,516 |
Voyager Oil & Gas, Inc. warrants 2/4/16 (a) | 152,192 | | 165,961 |
Whiting Petroleum Corp. (a) | 81,840 | | 3,821,110 |
Williams Companies, Inc. | 98,461 | | 3,251,182 |
| | 96,807,471 |
TOTAL ENERGY | | 152,512,689 |
|
| Shares | | Value |
FINANCIALS - 9.0% |
Capital Markets - 1.4% |
American Capital Ltd. (a) | 59,598 | | $ 401,095 |
Ashmore Group PLC | 193,000 | | 1,001,192 |
BlackRock, Inc. Class A | 10,569 | | 1,883,819 |
Goldman Sachs Group, Inc. | 40,989 | | 3,706,635 |
GP Investments Ltd. (depositary receipt) (a) | 471,866 | | 1,005,425 |
ICAP PLC | 200,200 | | 1,078,653 |
ICG Group, Inc. (a) | 70,706 | | 545,850 |
Invesco Ltd. | 96,581 | | 1,940,312 |
Knight Capital Group, Inc. Class A (a) | 171,973 | | 2,032,721 |
Morgan Stanley | 346,618 | | 5,244,330 |
State Street Corp. | 87,719 | | 3,535,953 |
TD Ameritrade Holding Corp. | 70,029 | | 1,095,954 |
UBS AG (NY Shares) (a) | 133,400 | | 1,578,122 |
| | 25,050,061 |
Commercial Banks - 2.2% |
Banco Pine SA | 141,300 | | 1,004,844 |
Bank of Ireland (a) | 34,535,003 | | 3,710,275 |
CapitalSource, Inc. | 495,388 | | 3,319,100 |
CIT Group, Inc. (a) | 84,492 | | 2,946,236 |
Comerica, Inc. | 22,600 | | 583,080 |
Commercial Bank of Qatar GDR (Reg. S) | 142,633 | | 658,053 |
Guaranty Trust Bank PLC GDR (Reg. S) | 114,938 | | 522,968 |
Huntington Bancshares, Inc. | 120,281 | | 660,343 |
Itau Unibanco Banco Multiplo SA sponsored ADR | 37,700 | | 699,712 |
KeyCorp | 132,604 | | 1,019,725 |
Regions Financial Corp. | 431,181 | | 1,854,078 |
SunTrust Banks, Inc. | 40,650 | | 719,505 |
Susquehanna Bancshares, Inc. | 101,857 | | 853,562 |
Wells Fargo & Co. | 717,466 | | 19,773,363 |
| | 38,324,844 |
Consumer Finance - 0.6% |
American Express Co. | 72,908 | | 3,439,070 |
Capital One Financial Corp. | 40,007 | | 1,691,896 |
Discover Financial Services | 122,108 | | 2,930,592 |
Imperial Holdings, Inc. (a) | 8,400 | | 15,792 |
SLM Corp. | 108,272 | | 1,450,845 |
| | 9,528,195 |
Diversified Financial Services - 2.2% |
Citigroup, Inc. | 633,713 | | 16,672,989 |
CME Group, Inc. | 9,480 | | 2,309,992 |
JPMorgan Chase & Co. | 436,896 | | 14,526,792 |
PICO Holdings, Inc. (a) | 230,646 | | 4,746,695 |
| | 38,256,468 |
Insurance - 1.2% |
AEGON NV (a) | 255,973 | | 1,023,165 |
AFLAC, Inc. | 71,796 | | 3,105,895 |
Common Stocks - continued |
| Shares | | Value |
FINANCIALS - continued |
Insurance - continued |
Allied World Assurance Co. Holdings Ltd. | 2,300 | | $ 144,739 |
Assured Guaranty Ltd. | 315,254 | | 4,142,438 |
Berkshire Hathaway, Inc. Class B (a) | 15,572 | | 1,188,144 |
Genworth Financial, Inc. Class A (a) | 451,117 | | 2,954,816 |
Hartford Financial Services Group, Inc. | 49,700 | | 807,625 |
MetLife, Inc. | 157,482 | | 4,910,289 |
Prudential Financial, Inc. | 44,120 | | 2,211,294 |
| | 20,488,405 |
Real Estate Investment Trusts - 1.0% |
Beni Stabili SpA SIIQ | 1,535,974 | | 687,507 |
Campus Crest Communities, Inc. | 42,885 | | 431,423 |
CBL & Associates Properties, Inc. | 216,571 | | 3,400,165 |
Douglas Emmett, Inc. | 79,600 | | 1,451,904 |
Education Realty Trust, Inc. | 142,500 | | 1,457,775 |
Excel Trust, Inc. | 18,300 | | 219,600 |
Franklin Street Properties Corp. | 77,600 | | 772,120 |
Klepierre SA | 17,500 | | 499,250 |
Prologis, Inc. | 118,291 | | 3,381,940 |
SL Green Realty Corp. | 36,410 | | 2,426,362 |
Weyerhaeuser Co. | 154,118 | | 2,877,383 |
| | 17,605,429 |
Real Estate Management & Development - 0.4% |
CBRE Group, Inc. (a) | 288,137 | | 4,385,445 |
Forest City Enterprises, Inc. Class A (a) | 72,330 | | 854,941 |
Iguatemi Empresa de Shopping Centers SA | 49,700 | | 924,540 |
Kenedix, Inc. (a) | 1,918 | | 249,453 |
| | 6,414,379 |
Thrifts & Mortgage Finance - 0.0% |
Washington Mutual, Inc. (a)(g) | 101,600 | | 5,476 |
TOTAL FINANCIALS | | 155,673,257 |
HEALTH CARE - 7.4% |
Biotechnology - 2.7% |
Acorda Therapeutics, Inc. (a) | 28,900 | | 688,976 |
Alexion Pharmaceuticals, Inc. (a) | 32,700 | | 2,338,050 |
Alnylam Pharmaceuticals, Inc. (a) | 71,600 | | 583,540 |
Amgen, Inc. | 95,200 | | 6,112,792 |
Amylin Pharmaceuticals, Inc. (a) | 81,525 | | 927,755 |
Ardea Biosciences, Inc. (a) | 94,745 | | 1,592,663 |
ARIAD Pharmaceuticals, Inc. (a) | 370,032 | | 4,532,892 |
ArQule, Inc. (a) | 176,646 | | 996,283 |
AVEO Pharmaceuticals, Inc. (a) | 145,863 | | 2,508,843 |
Biogen Idec, Inc. (a) | 25,669 | | 2,824,873 |
Dynavax Technologies Corp. (a) | 505,192 | | 1,677,237 |
Gilead Sciences, Inc. (a) | 50,673 | | 2,074,046 |
Horizon Pharma, Inc. | 58,600 | | 234,400 |
|
| Shares | | Value |
Human Genome Sciences, Inc. (a) | 89,500 | | $ 661,405 |
Infinity Pharmaceuticals, Inc. (a) | 22,472 | | 198,652 |
InterMune, Inc. (a) | 37,256 | | 469,426 |
Isis Pharmaceuticals, Inc. (a) | 44,500 | | 320,845 |
Micromet, Inc. (a)(d) | 145,500 | | 1,046,145 |
NPS Pharmaceuticals, Inc. (a) | 69,590 | | 458,598 |
PDL BioPharma, Inc. | 133,200 | | 825,840 |
Pharmasset, Inc. (a) | 47,900 | | 6,140,780 |
SIGA Technologies, Inc. (a)(d) | 232,093 | | 584,874 |
Synageva BioPharma Corp. (a) | 6,176 | | 164,467 |
Theravance, Inc. (a) | 175,365 | | 3,875,567 |
Thrombogenics NV (a)(d) | 52,949 | | 1,295,353 |
United Therapeutics Corp. (a) | 29,918 | | 1,413,626 |
Vertex Pharmaceuticals, Inc. (a) | 7,000 | | 232,470 |
ZIOPHARM Oncology, Inc. (a)(d) | 285,970 | | 1,261,128 |
| | 46,041,526 |
Health Care Equipment & Supplies - 1.1% |
Baxter International, Inc. | 73,606 | | 3,642,025 |
Boston Scientific Corp. (a) | 251,700 | | 1,344,078 |
Conceptus, Inc. (a) | 80,100 | | 1,012,464 |
Covidien PLC | 100,999 | | 4,545,965 |
DENTSPLY International, Inc. | 13,766 | | 481,672 |
Genmark Diagnostics, Inc. (a) | 69,019 | | 284,358 |
GN Store Nordic A/S | 113,700 | | 957,878 |
Hologic, Inc. (a) | 6,400 | | 112,064 |
Integra LifeSciences Holdings Corp. (a) | 39,100 | | 1,205,453 |
Inverness Medical Innovations, Inc. (a) | 2,771 | | 63,982 |
Nakanishi, Inc. | 3,700 | | 342,285 |
Opto Circuits India Ltd. | 65,969 | | 247,998 |
Orthofix International NV (a) | 60,081 | | 2,116,654 |
Sirona Dental Systems, Inc. (a) | 40,600 | | 1,788,024 |
| | 18,144,900 |
Health Care Providers & Services - 2.2% |
Apollo Hospitals Enterprise Ltd. | 2,910 | | 31,024 |
Brookdale Senior Living, Inc. (a) | 344,144 | | 5,984,664 |
Catalyst Health Solutions, Inc. (a) | 44,827 | | 2,331,004 |
CIGNA Corp. | 105,820 | | 4,444,440 |
Community Health Systems, Inc. (a) | 99,200 | | 1,731,040 |
DaVita, Inc. (a) | 25,129 | | 1,905,029 |
Emeritus Corp. (a) | 82,872 | | 1,451,089 |
Express Scripts, Inc. (a) | 132,600 | | 5,925,894 |
McKesson Corp. | 46,114 | | 3,592,742 |
Medco Health Solutions, Inc. (a) | 72,589 | | 4,057,725 |
Sunrise Senior Living, Inc. (a) | 12,194 | | 79,017 |
UnitedHealth Group, Inc. | 36,082 | | 1,828,636 |
Universal Health Services, Inc. Class B | 46,475 | | 1,806,019 |
WellPoint, Inc. | 40,938 | | 2,712,143 |
| | 37,880,466 |
Life Sciences Tools & Services - 0.3% |
Agilent Technologies, Inc. (a) | 105,493 | | 3,684,870 |
Thermo Fisher Scientific, Inc. (a) | 40,843 | | 1,836,710 |
| | 5,521,580 |
Common Stocks - continued |
| Shares | | Value |
HEALTH CARE - continued |
Pharmaceuticals - 1.1% |
AVANIR Pharmaceuticals Class A (a) | 122,400 | | $ 250,920 |
Cadence Pharmaceuticals, Inc. (a)(d) | 628,546 | | 2,482,757 |
Cardiome Pharma Corp. (a) | 91,329 | | 240,195 |
Columbia Laboratories, Inc. (a) | 100,200 | | 250,500 |
Elan Corp. PLC sponsored ADR (a) | 72,203 | | 992,069 |
Merck & Co., Inc. | 104,513 | | 3,940,140 |
Novo Nordisk A/S Series B | 26,682 | | 3,065,634 |
Sanofi-aventis | 27,602 | | 2,017,876 |
Teva Pharmaceutical Industries Ltd. sponsored ADR | 46,100 | | 1,860,596 |
Valeant Pharmaceuticals International, Inc. (Canada) | 85,500 | | 4,001,306 |
Watson Pharmaceuticals, Inc. (a) | 12,499 | | 754,190 |
| | 19,856,183 |
TOTAL HEALTH CARE | | 127,444,655 |
INDUSTRIALS - 9.7% |
Aerospace & Defense - 2.1% |
DigitalGlobe, Inc. (a) | 99,512 | | 1,702,650 |
Esterline Technologies Corp. (a) | 21,111 | | 1,181,583 |
GeoEye, Inc. (a) | 204,660 | | 4,547,545 |
Honeywell International, Inc. | 80,953 | | 4,399,796 |
Meggitt PLC | 540,324 | | 2,960,713 |
Precision Castparts Corp. | 20,285 | | 3,342,765 |
Raytheon Co. | 69,162 | | 3,346,058 |
Rockwell Collins, Inc. | 23,000 | | 1,273,510 |
Safran SA | 21,600 | | 648,790 |
Textron, Inc. | 218,604 | | 4,041,988 |
Ultra Electronics Holdings PLC | 31,053 | | 712,839 |
United Technologies Corp. | 116,557 | | 8,519,151 |
| | 36,677,388 |
Air Freight & Logistics - 0.1% |
United Parcel Service, Inc. Class B | 17,500 | | 1,280,825 |
Airlines - 0.1% |
Copa Holdings SA Class A | 37,095 | | 2,176,364 |
Building Products - 0.5% |
Armstrong World Industries, Inc. | 55,500 | | 2,434,785 |
Lennox International, Inc. | 18,169 | | 613,204 |
Masco Corp. | 73,083 | | 765,910 |
Owens Corning (a) | 142,018 | | 4,078,757 |
| | 7,892,656 |
Commercial Services & Supplies - 0.5% |
Knoll, Inc. | 76,525 | | 1,136,396 |
Multiplus SA | 71,000 | | 1,228,934 |
Pitney Bowes, Inc. (d) | 25,924 | | 480,631 |
Quad/Graphics, Inc. (d) | 4,032 | | 57,819 |
Republic Services, Inc. | 101,645 | | 2,800,320 |
Schawk, Inc. Class A | 15,950 | | 178,800 |
Steelcase, Inc. Class A | 196,408 | | 1,465,204 |
|
| Shares | | Value |
Swisher Hygiene, Inc. | 261,817 | | $ 979,196 |
Swisher Hygiene, Inc. (Canada) (a) | 216,900 | | 811,207 |
| | 9,138,507 |
Construction & Engineering - 0.8% |
AECOM Technology Corp. (a) | 49,294 | | 1,013,978 |
Fluor Corp. | 57,225 | | 2,875,556 |
Foster Wheeler AG (a) | 216,468 | | 4,143,198 |
Great Lakes Dredge & Dock Corp. | 88,311 | | 491,009 |
Jacobs Engineering Group, Inc. (a) | 15,459 | | 627,326 |
Shaw Group, Inc. (a) | 189,498 | | 5,097,496 |
| | 14,248,563 |
Electrical Equipment - 1.1% |
Alstom SA | 45,938 | | 1,393,198 |
AMETEK, Inc. | 36,150 | | 1,521,915 |
Cooper Industries PLC Class A | 25,441 | | 1,377,630 |
Emerson Electric Co. | 98,171 | | 4,573,787 |
Fushi Copperweld, Inc. (a) | 73,346 | | 551,562 |
GrafTech International Ltd. (a) | 191,437 | | 2,613,115 |
Hubbell, Inc. Class B | 10,369 | | 693,271 |
Prysmian SpA | 111,000 | | 1,378,594 |
Regal-Beloit Corp. | 50,529 | | 2,575,463 |
Roper Industries, Inc. | 12,500 | | 1,085,875 |
Zumtobel AG | 45,160 | | 624,893 |
| | 18,389,303 |
Industrial Conglomerates - 1.5% |
Carlisle Companies, Inc. | 30,105 | | 1,333,652 |
Cookson Group PLC | 141,302 | | 1,117,068 |
General Electric Co. | 1,119,349 | | 20,047,541 |
Koninklijke Philips Electronics NV | 78,400 | | 1,645,156 |
Rheinmetall AG | 27,400 | | 1,214,198 |
Siemens AG sponsored ADR | 5,799 | | 554,442 |
| | 25,912,057 |
Machinery - 1.4% |
Actuant Corp. Class A | 87,125 | | 1,976,866 |
Charter International PLC | 81,465 | | 1,195,684 |
Cummins, Inc. | 28,426 | | 2,502,057 |
Dover Corp. | 26,799 | | 1,555,682 |
Fiat Industrial SpA (a) | 291,500 | | 2,499,729 |
Haitian International Holdings Ltd. | 316,000 | | 271,789 |
Ingersoll-Rand PLC | 206,394 | | 6,288,825 |
Jain Irrigation Systems Ltd. | 52,098 | | 85,053 |
Navistar International Corp. (a) | 99,693 | | 3,776,371 |
Pall Corp. | 28,996 | | 1,657,121 |
Stanley Black & Decker, Inc. | 39,945 | | 2,700,282 |
| | 24,509,459 |
Professional Services - 0.2% |
CBIZ, Inc. (a) | 74,763 | | 456,802 |
Michael Page International PLC | 66,159 | | 358,409 |
Common Stocks - continued |
| Shares | | Value |
INDUSTRIALS - continued |
Professional Services - continued |
Robert Half International, Inc. | 68,230 | | $ 1,941,826 |
SR Teleperformance SA | 55,753 | | 1,239,463 |
| | 3,996,500 |
Road & Rail - 1.0% |
Arkansas Best Corp. | 10,203 | | 196,612 |
Con-way, Inc. | 75,426 | | 2,199,422 |
CSX Corp. | 213,692 | | 4,500,354 |
Saia, Inc. (a) | 127,045 | | 1,585,522 |
Tegma Gestao Logistica | 14,500 | | 199,616 |
Union Pacific Corp. | 70,802 | | 7,500,764 |
Universal Truckload Services, Inc. | 72,108 | | 1,308,760 |
| | 17,491,050 |
Trading Companies & Distributors - 0.4% |
Barloworld Ltd. | 74,200 | | 690,564 |
Beacon Roofing Supply, Inc. (a) | 71,807 | | 1,452,656 |
Mills Estruturas e Servicos de Engenharia SA | 37,000 | | 351,492 |
Rush Enterprises, Inc. Class A (a) | 69,412 | | 1,452,099 |
Watsco, Inc. | 29,515 | | 1,937,955 |
| | 5,884,766 |
TOTAL INDUSTRIALS | | 167,597,438 |
INFORMATION TECHNOLOGY - 12.4% |
Communications Equipment - 1.6% |
Brocade Communications Systems, Inc. (a) | 488,947 | | 2,537,635 |
Calix Networks, Inc. (a) | 306,772 | | 1,984,815 |
Cisco Systems, Inc. | 565,361 | | 10,221,727 |
Comverse Technology, Inc. (a) | 804,975 | | 5,522,129 |
Juniper Networks, Inc. (a) | 60,890 | | 1,242,765 |
Polycom, Inc. (a) | 106,281 | | 1,732,380 |
QUALCOMM, Inc. | 51,808 | | 2,833,898 |
ViaSat, Inc. (a) | 52,362 | | 2,414,935 |
| | 28,490,284 |
Computers & Peripherals - 2.9% |
Apple, Inc. (a) | 110,663 | | 44,818,504 |
Hewlett-Packard Co. | 226,978 | | 5,846,953 |
| | 50,665,457 |
Electronic Equipment & Components - 1.1% |
Arrow Electronics, Inc. (a) | 72,057 | | 2,695,652 |
Avnet, Inc. (a) | 133,671 | | 4,155,831 |
Corning, Inc. | 377,548 | | 4,900,573 |
Ingram Micro, Inc. Class A (a) | 51,725 | | 940,878 |
Jabil Circuit, Inc. | 45,019 | | 885,074 |
Molex, Inc. (d) | 87,425 | | 2,085,961 |
TE Connectivity Ltd. | 81,617 | | 2,514,620 |
| | 18,178,589 |
|
| Shares | | Value |
Internet Software & Services - 0.5% |
DeNA Co. Ltd. | 11,800 | | $ 354,008 |
eAccess Ltd. | 2,691 | | 638,791 |
eBay, Inc. (a) | 68,308 | | 2,071,782 |
Facebook, Inc. Class B (g) | 61,519 | | 1,537,975 |
Google, Inc. Class A (a) | 5,688 | | 3,673,879 |
| | 8,276,435 |
IT Services - 1.5% |
Acxiom Corp. (a) | 36,060 | | 440,293 |
Alliance Data Systems Corp. (a) | 24,874 | | 2,582,916 |
Amdocs Ltd. (a) | 33,664 | | 960,434 |
Cognizant Technology Solutions Corp. Class A (a) | 52,800 | | 3,395,568 |
Fidelity National Information Services, Inc. | 89,260 | | 2,373,423 |
Fiserv, Inc. (a) | 22,578 | | 1,326,232 |
Heartland Payment Systems, Inc. | 52,818 | | 1,286,646 |
MasterCard, Inc. Class A | 25,548 | | 9,524,805 |
ServiceSource International, Inc. | 19,800 | | 310,662 |
Unisys Corp. (a) | 157,064 | | 3,095,731 |
Virtusa Corp. (a) | 46,081 | | 667,253 |
| | 25,963,963 |
Office Electronics - 0.2% |
Xerox Corp. | 501,139 | | 3,989,066 |
Semiconductors & Semiconductor Equipment - 3.3% |
Analog Devices, Inc. | 79,060 | | 2,828,767 |
Applied Micro Circuits Corp. (a) | 56,990 | | 382,973 |
ASAT Holdings Ltd. (a) | 1,762 | | 0 |
ASML Holding NV | 183,349 | | 7,662,155 |
Avago Technologies Ltd. | 65,628 | | 1,894,024 |
Cymer, Inc. (a) | 148,817 | | 7,405,134 |
Entropic Communications, Inc. (a) | 320,085 | | 1,635,634 |
Fairchild Semiconductor International, Inc. (a) | 55,689 | | 670,496 |
Freescale Semiconductor Holdings I Ltd. | 264,746 | | 3,349,037 |
Himax Technologies, Inc. sponsored ADR | 200,665 | | 201,668 |
Intersil Corp. Class A | 187,848 | | 1,961,133 |
KLA-Tencor Corp. | 26,515 | | 1,279,349 |
LTX-Credence Corp. (a) | 497,519 | | 2,661,727 |
Marvell Technology Group Ltd. (a) | 490,582 | | 6,794,561 |
Maxim Integrated Products, Inc. | 115,557 | | 3,009,104 |
Micron Technology, Inc. (a) | 469,678 | | 2,954,275 |
Monolithic Power Systems, Inc. (a) | 4,000 | | 60,280 |
NVIDIA Corp. (a) | 104,038 | | 1,441,967 |
NXP Semiconductors NV (a) | 159,680 | | 2,454,282 |
ON Semiconductor Corp. (a) | 414,218 | | 3,197,763 |
RF Micro Devices, Inc. (a) | 572,623 | | 3,092,164 |
Skyworks Solutions, Inc. (a) | 74,583 | | 1,209,736 |
Spansion, Inc. Class A (a) | 62,857 | | 520,456 |
| | 56,666,685 |
Software - 1.3% |
Autodesk, Inc. (a) | 27,200 | | 824,976 |
Citrix Systems, Inc. (a) | 81,330 | | 4,938,358 |
Common Stocks - continued |
| Shares | | Value |
INFORMATION TECHNOLOGY - continued |
Software - continued |
Informatica Corp. (a) | 20,269 | | $ 748,534 |
JDA Software Group, Inc. (a) | 59,564 | | 1,929,278 |
Micro Focus International PLC | 271,436 | | 1,628,145 |
Oracle Corp. | 414,677 | | 10,636,465 |
Synopsys, Inc. (a) | 5,169 | | 140,597 |
Take-Two Interactive Software, Inc. (a) | 52,400 | | 710,020 |
Taleo Corp. Class A (a) | 38,024 | | 1,471,149 |
Temenos Group AG (a) | 11,291 | | 185,148 |
| | 23,212,670 |
TOTAL INFORMATION TECHNOLOGY | | 215,443,149 |
MATERIALS - 4.0% |
Chemicals - 1.7% |
Air Products & Chemicals, Inc. | 7,700 | | 655,963 |
Ashland, Inc. | 31,494 | | 1,800,197 |
CF Industries Holdings, Inc. | 5,311 | | 769,989 |
Clariant AG (Reg.) (a) | 446,882 | | 4,411,006 |
CVR Partners LP | 27,177 | | 674,533 |
Ecolab, Inc. | 30,304 | | 1,751,874 |
Ferro Corp. (a) | 106,545 | | 521,005 |
Huabao International Holdings Ltd. | 1,171,000 | | 598,572 |
Israel Chemicals Ltd. | 66,100 | | 685,100 |
Kraton Performance Polymers, Inc. (a) | 47,500 | | 964,250 |
Lanxess AG | 12,949 | | 670,447 |
LyondellBasell Industries NV Class A | 77,966 | | 2,533,115 |
Rentech Nitrogen Partners LP | 22,700 | | 371,145 |
Solutia, Inc. | 8,688 | | 150,129 |
Spartech Corp. (a) | 219,133 | | 1,036,499 |
The Mosaic Co. | 62,898 | | 3,171,946 |
W.R. Grace & Co. (a) | 162,649 | | 7,468,842 |
Yara International ASA | 33,100 | | 1,328,439 |
| | 29,563,051 |
Construction Materials - 0.1% |
HeidelbergCement Finance AG | 35,890 | | 1,523,293 |
Containers & Packaging - 0.1% |
Rock-Tenn Co. Class A | 37,415 | | 2,158,846 |
Youyuan International Holdings Ltd. (a) | 1,015,000 | | 254,841 |
| | 2,413,687 |
Metals & Mining - 2.1% |
Anglo American PLC (United Kingdom) | 31,300 | | 1,156,517 |
AngloGold Ashanti Ltd. sponsored ADR | 23,800 | | 1,010,310 |
Avion Gold Corp. (a) | 470,900 | | 749,075 |
Avion Gold Corp. (e) | 39,600 | | 62,993 |
Commercial Metals Co. | 215,400 | | 2,978,982 |
Copper Mountain Mining Corp. (a) | 20,000 | | 110,566 |
Eldorado Gold Corp. | 90,209 | | 1,241,880 |
First Quantum Minerals Ltd. | 51,600 | | 1,015,888 |
|
| Shares | | Value |
Freeport-McMoRan Copper & Gold, Inc. | 104,356 | | $ 3,839,257 |
Goldcorp, Inc. | 111,000 | | 4,927,641 |
Ivanhoe Mines Ltd. (a) | 285,270 | | 5,067,296 |
Kinross Gold Corp. | 113,504 | | 1,296,201 |
Mirabela Nickel Ltd. (a) | 329,657 | | 377,579 |
Newcrest Mining Ltd. | 103,256 | | 3,125,605 |
Pan American Silver Corp. | 32,800 | | 715,368 |
Randgold Resources Ltd. sponsored ADR | 50,258 | | 5,131,342 |
Reliance Steel & Aluminum Co. | 23,067 | | 1,123,132 |
Ternium SA sponsored ADR | 18,604 | | 342,128 |
Yamana Gold, Inc. | 91,800 | | 1,353,924 |
| | 35,625,684 |
TOTAL MATERIALS | | 69,125,715 |
TELECOMMUNICATION SERVICES - 0.8% |
Diversified Telecommunication Services - 0.3% |
CenturyLink, Inc. | 62,951 | | 2,341,777 |
China Telecom Corp. Ltd. (H Shares) | 1,002,000 | | 569,925 |
China Unicom Ltd. | 694,000 | | 1,463,062 |
Koninklijke KPN NV | 100,095 | | 1,197,810 |
| | 5,572,574 |
Wireless Telecommunication Services - 0.5% |
American Tower Corp. Class A | 36,189 | | 2,171,702 |
NII Holdings, Inc. (a) | 54,090 | | 1,152,117 |
SBA Communications Corp. Class A (a) | 52,858 | | 2,270,780 |
TIM Participacoes SA | 262,381 | | 1,301,202 |
Turkcell Iletisim Hizmet A/S | 229,000 | | 1,084,236 |
| | 7,980,037 |
TOTAL TELECOMMUNICATION SERVICES | | 13,552,611 |
UTILITIES - 1.8% |
Electric Utilities - 0.8% |
American Electric Power Co., Inc. | 33,506 | | 1,384,133 |
Centrais Eletricas Brasileiras SA (Electrobras) (PN-B) sponsored ADR (d) | 67,800 | | 983,100 |
Ceske Energeticke Zavody A/S | 15,000 | | 596,751 |
Edison International | 90,369 | | 3,741,277 |
El Paso Electric Co. | 30,800 | | 1,066,912 |
Fortum Corp. | 16,014 | | 341,813 |
NextEra Energy, Inc. | 59,713 | | 3,635,327 |
NV Energy, Inc. | 61,797 | | 1,010,381 |
PPL Corp. | 38,047 | | 1,119,343 |
| | 13,879,037 |
Gas Utilities - 0.1% |
Aygaz A/S | 10,140 | | 47,553 |
China Gas Holdings Ltd. | 1,442,000 | | 662,831 |
ONEOK, Inc. | 19,588 | | 1,698,084 |
| | 2,408,468 |
Common Stocks - continued |
| Shares | | Value |
UTILITIES - continued |
Independent Power Producers & Energy Traders - 0.6% |
The AES Corp. (a) | 801,999 | | $ 9,495,668 |
Multi-Utilities - 0.3% |
CenterPoint Energy, Inc. | 81,973 | | 1,646,838 |
CMS Energy Corp. | 19,683 | | 434,601 |
National Grid PLC | 177,542 | | 1,716,249 |
Sempra Energy | 28,207 | | 1,551,385 |
| | 5,349,073 |
TOTAL UTILITIES | | 31,132,246 |
TOTAL COMMON STOCKS (Cost $1,146,611,073) |
1,174,672,685
|
Preferred Stocks - 0.4% |
| | | |
Convertible Preferred Stocks - 0.3% |
FINANCIALS - 0.1% |
Diversified Financial Services - 0.1% |
Citigroup, Inc. 7.50% | 21,500 | | 1,746,875 |
INFORMATION TECHNOLOGY - 0.1% |
IT Services - 0.1% |
Unisys Corp. Series A, 6.25% | 13,700 | | 830,220 |
Semiconductors & Semiconductor Equipment - 0.0% |
ASAT Holdings Ltd. 13.00% (a) | 48 | | 0 |
TOTAL INFORMATION TECHNOLOGY | | 830,220 |
UTILITIES - 0.1% |
Electric Utilities - 0.1% |
PPL Corp. 9.50% | 24,500 | | 1,367,835 |
TOTAL CONVERTIBLE PREFERRED STOCKS | | 3,944,930 |
Nonconvertible Preferred Stocks - 0.1% |
CONSUMER DISCRETIONARY - 0.1% |
Automobiles - 0.1% |
Volkswagen AG | 14,700 | | 2,202,454 |
TOTAL PREFERRED STOCKS (Cost $6,045,317) |
6,147,384
|
Investment Companies - 0.1% |
| | | |
Ares Capital Corp.
(Cost $1,932,389) | 143,420 | |
2,215,839
|
Convertible Bonds - 0.3% |
| Principal Amount | | Value |
FINANCIALS - 0.1% |
Thrifts & Mortgage Finance - 0.1% |
MGIC Investment Corp. 9% 4/1/63 (e) | | $ 2,396,000 | | $ 1,129,115 |
INDUSTRIALS - 0.0% |
Building Products - 0.0% |
Aspen Aerogels, Inc. 8% 6/1/14 (g) | | 516,700 | | 516,700 |
MATERIALS - 0.2% |
Metals & Mining - 0.2% |
Ivanplats Ltd. 8% 11/10/14 pay-in-kind (g) | | 2,830,000 | | 2,830,000 |
TELECOMMUNICATION SERVICES - 0.0% |
Diversified Telecommunication Services - 0.0% |
Clearwire Communications LLC/Clearwire Finance, Inc. 8.25% 12/1/40 (e) | | 540,000 | | 342,900 |
TOTAL CONVERTIBLE BONDS (Cost $5,039,430) |
4,818,715
|
Fixed-Income Funds - 30.5% |
| Shares | | |
Fidelity High Income Central Fund 2 (f) | 808,322 | | 86,450,004 |
Fidelity VIP Investment Grade Central Fund (f) | 4,100,796 | | 441,409,699 |
TOTAL FIXED-INCOME FUNDS (Cost $494,228,152) |
527,859,703
|
Money Market Funds - 1.6% |
| | | |
Fidelity Cash Central Fund, 0.11% (b) | 12,613,334 | | 12,613,334 |
Fidelity Securities Lending Cash Central Fund, 0.13% (b)(c) | 15,992,964 | | 15,992,964 |
TOTAL MONEY MARKET FUNDS (Cost $28,606,298) |
28,606,298
|
TOTAL INVESTMENT PORTFOLIO - 100.8% (Cost $1,682,462,659) | | 1,744,320,624 |
NET OTHER ASSETS (LIABILITIES) - (0.8)% | | (13,192,215) |
NET ASSETS - 100% | $ 1,731,128,409 |
Legend |
(a) Non-income producing |
(b) Affiliated fund that is available only to investment companies and other accounts managed by Fidelity Investments. The rate quoted is the annualized seven-day yield of the fund at period end. A complete unaudited listing of the fund's holdings as of its most recent quarter end is available upon request. In addition, each Fidelity Central Fund's financial statements, which are not covered by the Fund's Report of Independent Registered Public Accounting Firm, are available on the SEC's website or upon request. |
(c) Investment made with cash collateral received from securities on loan. |
(d) Security or a portion of the security is on loan at period end. |
(e) Security exempt from registration under Rule 144A of the Securities Act of 1933. These securities may be resold in transactions exempt from registration, normally to qualified institutional buyers. At the end of the period, the value of these securities amounted to $3,729,893 or 0.2% of net assets. |
(f) Affiliated fund that is available only to investment companies and other accounts managed by Fidelity Investments. A complete unaudited schedule of portfolio holdings for each Fidelity Central Fund is filed with the SEC for the first and third quarters of each fiscal year on Form N-Q and is available upon request or at the SEC's web site at www.sec.gov. An unaudited holdings listing for the Fund, which presents direct holdings as well as the pro rata share of securities and other investments held indirectly through its investment in underlying non-money market Fidelity Central Funds, is available at advisor.fidelity.com. In addition, each Fidelity Central Fund's financial statements, which are not covered by the Fund's Report of Independent Registered Public Accounting Firm, are available on the SEC's web site or upon request. |
(g) Restricted securities - Investment in securities not registered under the Securities Act of 1933 (excluding 144A issues). At the end of the period, the value of restricted securities (excluding 144A issues) amounted to $5,491,704 or 0.3% of net assets. |
Additional information on each restricted holding is as follows: |
Security | Acquisition Date | Acquisition Cost |
Aspen Aerogels, Inc. 8% 6/1/14 | 6/1/11 | $ 516,700 |
Facebook, Inc. Class B | 3/31/11 - 5/19/11 | $ 1,538,390 |
Ivanplats Ltd. 8% 11/10/14 pay-in-kind | 11/10/11 | $ 2,830,000 |
Mood Media Corp. | 2/2/11 | $ 514,497 |
Washington Mutual, Inc. | 4/8/08 | $ 889,000 |
Affiliated Central Funds |
Information regarding fiscal year to date income earned by the Fund from investments in Fidelity Central Funds is as follows: |
Fund | Income earned |
Fidelity Cash Central Fund | $ 72,201 |
Fidelity High Income Central Fund 2 | 5,945,756 |
Fidelity Securities Lending Cash Central Fund | 333,591 |
Fidelity VIP Investment Grade Central Fund | 15,790,031 |
Total | $ 22,141,579 |
Additional information regarding the Fund's fiscal year to date purchases and sales, including the ownership percentage, of the non Money Market Central Funds is as follows: |
Fund | Value,
beginning of period | Purchases | Sales
Proceeds | Value,
end of
period | % ownership, end of
period |
Fidelity High Income Central Fund 2 | $ 82,855,310 | $ 5,945,757 | $ - | $ 86,450,004 | 13.0% |
Fidelity VIP Investment Grade Central Fund | 407,380,000 | 48,483,991 | 25,181,135 | 441,409,699 | 11.6% |
Total | $ 490,235,310 | $ 54,429,748 | $ 25,181,135 | $ 527,859,703 | |
Other Information |
The following is a summary of the inputs used, as of December 31, 2011, involving the Fund's assets and liabilities carried at fair value. The inputs or methodology used for valuing securities may not be an indication of the risk associated with investing in those securities. For more information on valuation inputs, and their aggregation into the levels used in the tables below, please refer to the Security Valuation section in the accompanying Notes to Financial Statements. |
Valuation Inputs at Reporting Date: |
Description | Total | Level 1 | Level 2 | Level 3 |
Investments in Securities: | | | | |
Equities: | | | | |
Consumer Discretionary | $ 140,703,112 | $ 140,063,391 | $ 639,721 | $ - |
Consumer Staples | 103,690,267 | 101,583,710 | 2,106,557 | - |
Energy | 152,512,689 | 152,346,728 | 165,961 | - |
Financials | 157,420,132 | 152,686,692 | 4,733,440 | - |
Health Care | 127,444,655 | 122,361,145 | 5,083,510 | - |
Industrials | 167,597,438 | 165,327,389 | 2,270,049 | - |
Information Technology | 216,273,369 | 214,735,394 | - | 1,537,975 |
Materials | 69,125,715 | 69,125,715 | - | - |
Telecommunication Services | 13,552,611 | 10,435,388 | 3,117,223 | - |
Utilities | 32,500,081 | 30,783,832 | 1,716,249 | - |
Investment Companies | 2,215,839 | 2,215,839 | - | - |
Corporate Bonds | 4,818,715 | - | 1,472,015 | 3,346,700 |
Fixed-Income Funds | 527,859,703 | 527,859,703 | - | - |
Money Market Funds | 28,606,298 | 28,606,298 | - | - |
Total Investments in Securities: | $ 1,744,320,624 | $ 1,718,131,224 | $ 21,304,725 | $ 4,884,675 |
The following is a reconciliation of Investments in Securities for which Level 3 inputs were used in determining value: |
Investments in Securities: | |
Beginning Balance | $ 600,666 |
Total Realized Gain (Loss) | 19,972 |
Total Unrealized Gain (Loss) | (20,997) |
Cost of Purchases | 4,885,090 |
Proceeds of Sales | (19,972) |
Amortization/Accretion | - |
Transfers in to Level 3 | - |
Transfers out of Level 3 | (580,084) |
Ending Balance | $ 4,884,675 |
The change in unrealized gain (loss) for the period attributable to Level 3 securities held at December 31, 2011 | $ (415) |
The information used in the above reconciliation represents fiscal year to date activity for any Investments in Securities identified as using Level 3 inputs at either the beginning or the end of the current fiscal period. Transfers in or out of Level 3 represent the beginning value of any Security or Instrument where a change in the pricing level occurred from the beginning to the end of the period. The cost of purchases and the proceeds of sales may include securities received or delivered through corporate actions or exchanges. Realized and unrealized gains (losses) disclosed in the reconciliation are included in Net Gain (Loss) on the Fund's Statement of Operations. |
The information in the following tables is based on the combined investments of the Fund and its pro-rata share of its investments in each Fidelity Central Fund. |
The composition of credit quality ratings as a percentage of net assets is as follows (Unaudited): |
U.S. Government and U.S. Government Agency Obligations | 17.1% |
AAA,AA,A | 4.7% |
BBB | 3.4% |
BB | 2.1% |
B | 2.3% |
CCC,CC,C | 1.1% |
D | 0.0%* |
Not Rated | 0.3% |
Equities | 68.5% |
Short-Term Investments and Net Other Assets | 0.5% |
| 100.0% |
* Amount represents less than 0.1% | |
We have used ratings from Moody's Investors Service, Inc. Where Moody's® ratings are not available, we have used S&P® ratings. All ratings are as of the date indicated and do not reflect subsequent changes. |
Distribution of investments by country of issue, as a percentage of total net assets, is as follows: (Unaudited) |
United States of America | 84.5% |
Canada | 2.6% |
United Kingdom | 1.3% |
Netherlands | 1.1% |
Ireland | 1.1% |
Bermuda | 1.0% |
Switzerland | 1.0% |
Others (Individually Less Than 1%) | 7.4% |
| 100.0% |
See accompanying notes which are an integral part of the financial statements.
Annual Report
Statement of Assets and Liabilities
| December 31, 2011 |
| | |
Assets | | |
Investment in securities, at value (including securities loaned of $15,701,692) - See accompanying schedule: Unaffiliated issuers (cost $1,159,628,209) | $ 1,187,854,623 | |
Fidelity Central Funds (cost $522,834,450) | 556,466,001 | |
Total Investments (cost $1,682,462,659) | | $ 1,744,320,624 |
Foreign currency held at value (cost $78,408) | | 78,408 |
Receivable for investments sold | | 2,426,152 |
Receivable for fund shares sold | | 1,197,215 |
Dividends receivable | | 1,437,336 |
Interest receivable | | 112,342 |
Distributions receivable from Fidelity Central Funds | | 81,376 |
Prepaid expenses | | 5,153 |
Other receivables | | 14,218 |
Total assets | | 1,749,672,824 |
| | |
Liabilities | | |
Payable to custodian bank | $ 6,036 | |
Payable for investments purchased | 1,557,301 | |
Payable for fund shares redeemed | 35,105 | |
Accrued management fee | 587,135 | |
Distribution and service plan fees payable | 60,916 | |
Other affiliated payables | 238,964 | |
Other payables and accrued expenses | 65,994 | |
Collateral on securities loaned, at value | 15,992,964 | |
Total liabilities | | 18,544,415 |
| | |
Net Assets | | $ 1,731,128,409 |
Net Assets consist of: | | |
Paid in capital | | $ 1,624,991,180 |
Distributions in excess of net investment income | | (566,637) |
Accumulated undistributed net realized gain (loss) on investments and foreign currency transactions | | 44,850,333 |
Net unrealized appreciation (depreciation) on investments and assets and liabilities in foreign currencies | | 61,853,533 |
Net Assets | | $ 1,731,128,409 |
Statement of Assets and Liabilities - continued
| December 31, 2011 |
| | |
Initial Class:
Net Asset Value, offering price and redemption price per share ($171,959,012 ÷ 11,753,533 shares) | | $ 14.63 |
| | |
Service Class:
Net Asset Value, offering price and redemption price per share ($3,929,796 ÷ 269,487 shares) | | $ 14.58 |
| | |
Service Class 2:
Net Asset Value, offering price and redemption price per share ($290,719,111 ÷ 20,149,797 shares) | | $ 14.43 |
| | |
Investor Class:
Net Asset Value, offering price and redemption price per share ($1,264,520,490 ÷ 86,847,107 shares) | | $ 14.56 |
See accompanying notes which are an integral part of the financial statements.
Annual Report
Statement of Operations
| Year ended December 31, 2011 |
| | |
Investment Income | | |
Dividends | | $ 17,825,091 |
Interest | | 360,188 |
Income from Fidelity Central Funds | | 22,141,579 |
Total income | | 40,326,858 |
| | |
Expenses | | |
Management fee | $ 7,448,561 | |
Transfer agent fees | 2,466,243 | |
Distribution and service plan fees | 720,336 | |
Accounting and security lending fees | 716,938 | |
Custodian fees and expenses | 194,544 | |
Independent trustees' compensation | 10,381 | |
Audit | 82,607 | |
Legal | 11,818 | |
Miscellaneous | 18,849 | |
Total expenses before reductions | 11,670,277 | |
Expense reductions | (104,348) | 11,565,929 |
Net investment income (loss) | | 28,760,929 |
Realized and Unrealized Gain (Loss) Net realized gain (loss) on: | | |
Investment securities: | | |
Unaffiliated issuers | 111,414,301 | |
Fidelity Central Funds | 938,436 | |
Foreign currency transactions | (302,264) | |
Capital gain distributions from Fidelity Central Funds | 7,640,255 | |
Total net realized gain (loss) | | 119,690,728 |
Change in net unrealized appreciation (depreciation) on: Investment securities | (217,848,984) | |
Assets and liabilities in foreign currencies | (7,544) | |
Total change in net unrealized appreciation (depreciation) | | (217,856,528) |
Net gain (loss) | | (98,165,800) |
Net increase (decrease) in net assets resulting from operations | | $ (69,404,871) |
Statement of Changes in Net Assets
| Year ended
December 31,
2011 | Year ended
December 31,
2010 |
Increase (Decrease) in Net Assets | | |
Operations | | |
Net investment income (loss) | $ 28,760,929 | $ 27,042,741 |
Net realized gain (loss) | 119,690,728 | 108,497,973 |
Change in net unrealized appreciation (depreciation) | (217,856,528) | 140,437,002 |
Net increase (decrease) in net assets resulting from operations | (69,404,871) | 275,977,716 |
Distributions to shareholders from net investment income | (28,810,861) | (26,927,487) |
Distributions to shareholders from net realized gain | (4,909,022) | (9,254,462) |
Total distributions | (33,719,883) | (36,181,949) |
Share transactions - net increase (decrease) | 16,583,734 | 11,695,583 |
Total increase (decrease) in net assets | (86,541,020) | 251,491,350 |
| | |
Net Assets | | |
Beginning of period | 1,817,669,429 | 1,566,178,079 |
End of period (including distributions in excess of net investment income of $566,637 and undistributed net investment income of $267,289, respectively) | $ 1,731,128,409 | $ 1,817,669,429 |
See accompanying notes which are an integral part of the financial statements.
Annual Report
Financial Highlights - Initial Class
Years ended December 31, | 2011 | 2010 | 2009 | 2008 | 2007 |
Selected Per-Share Data | | | | | |
Net asset value, beginning of period | $ 15.50 | $ 13.41 | $ 9.87 | $ 15.83 | $ 15.64 |
Income from Investment Operations | | | | | |
Net investment income (loss) C | .26 | .25 | .23 | .31 | .36 |
Net realized and unrealized gain (loss) | (.83) | 2.17 | 3.57 | (5.54) | .99 |
Total from investment operations | (.57) | 2.42 | 3.80 | (5.23) | 1.35 |
Distributions from net investment income | (.26) | (.25) | (.22) | (.24) | (.54) |
Distributions from net realized gain | (.04) | (.08) | (.04) | (.49) | (.62) |
Total distributions | (.30) | (.33) | (.26) G | (.73) | (1.16) |
Net asset value, end of period | $ 14.63 | $ 15.50 | $ 13.41 | $ 9.87 | $ 15.83 |
Total Return A, B | (3.61)% | 18.07% | 38.60% | (33.96)% | 8.98% |
Ratios to Average Net Assets D, F | | | | | |
Expenses before reductions | .54% | .55% | .56% | .55% | .57% |
Expenses net of fee waivers, if any | .54% | .54% | .56% | .55% | .57% |
Expenses net of all reductions | .53% | .54% | .55% | .55% | .57% |
Net investment income (loss) | 1.67% | 1.75% | 2.03% | 2.34% | 2.25% |
Supplemental Data | | | | | |
Net assets, end of period (000 omitted) | $ 171,959 | $ 202,766 | $ 185,849 | $ 149,711 | $ 274,561 |
Portfolio turnover rate E | 47% | 62% | 63% | 64% | 41% |
A Total returns do not reflect charges attributable to your insurance company's separate account. Inclusion of these charges would reduce the total returns shown.
B Total returns would have been lower if certain expenses had not been reduced during the applicable periods shown.
C Calculated based on average shares outstanding during the period.
D Fees and expenses of any underlying Fidelity Central Funds are not included in the Fund's expense ratio. The Fund indirectly bears its proportionate share of the expenses of any underlying Fidelity Central Funds.
E Amount does not include the portfolio activity of any underlying Fidelity Central Funds.
F Expense ratios reflect operating expenses of the class. Expenses before reductions do not reflect amounts reimbursed by the investment adviser or reductions from brokerage service arrangements or reductions from other expense offset arrangements and do not represent the amount paid by the class during periods when reimbursements or reductions occur. Expenses net of fee waivers reflect expenses after reimbursement by the investment adviser but prior to reductions from brokerage service arrangements or other expense offset arrangements. Expenses net of all reductions represent the net expenses paid by the class.
G Total distributions of $.26 per share is comprised of distributions from net investment income of $.224 and distributions from net realized gain of $.035 per share.
Financial Highlights - Service Class
Years ended December 31, | 2011 | 2010 | 2009 | 2008 | 2007 |
Selected Per-Share Data | | | | | |
Net asset value, beginning of period | $ 15.45 | $ 13.36 | $ 9.84 | $ 15.77 | $ 15.55 |
Income from Investment Operations | | | | | |
Net investment income (loss) C | .24 | .23 | .22 | .30 | .34 |
Net realized and unrealized gain (loss) | (.83) | 2.17 | 3.54 | (5.52) | .99 |
Total from investment operations | (.59) | 2.40 | 3.76 | (5.22) | 1.33 |
Distributions from net investment income | (.24) | (.23) | (.21) | (.22) | (.49) |
Distributions from net realized gain | (.04) | (.08) | (.04) | (.49) | (.62) |
Total distributions | (.28) | (.31) | (.24) G | (.71) | (1.11) |
Net asset value, end of period | $ 14.58 | $ 15.45 | $ 13.36 | $ 9.84 | $ 15.77 |
Total Return A, B | (3.78)% | 17.99% | 38.36% | (34.02)% | 8.90% |
Ratios to Average Net Assets D, F | | | | | |
Expenses before reductions | .67% | .68% | .69% | .68% | .68% |
Expenses net of fee waivers, if any | .67% | .67% | .69% | .68% | .68% |
Expenses net of all reductions | .67% | .67% | .69% | .68% | .68% |
Net investment income (loss) | 1.54% | 1.62% | 1.90% | 2.22% | 2.14% |
Supplemental Data | | | | | |
Net assets, end of period (000 omitted) | $ 3,930 | $ 5,126 | $ 6,221 | $ 4,983 | $ 9,376 |
Portfolio turnover rate E | 47% | 62% | 63% | 64% | 41% |
A Total returns do not reflect charges attributable to your insurance company's separate account. Inclusion of these charges would reduce the total returns shown.
B Total returns would have been lower if certain expenses had not been reduced during the applicable periods shown.
C Calculated based on average shares outstanding during the period.
D Fees and expenses of any underlying Fidelity Central Funds are not included in the Fund's expense ratio. The Fund indirectly bears its proportionate share of the expenses of any underlying Fidelity Central Funds.
E Amount does not include the portfolio activity of any underlying Fidelity Central Funds.
F Expense ratios reflect operating expenses of the class. Expenses before reductions do not reflect amounts reimbursed by the investment adviser or reductions from brokerage service arrangements or reductions from other expense offset arrangements and do not represent the amount paid by the class during periods when reimbursements or reductions occur. Expenses net of fee waivers reflect expenses after reimbursement by the investment adviser but prior to reductions from brokerage service arrangements or other expense offset arrangements. Expenses net of all reductions represent the net expenses paid by the class.
G Total distributions of $.24 per share is comprised of distributions from net investment income of $.209 and distributions from net realized gain of $.035 per share.
See accompanying notes which are an integral part of the financial statements.
Annual Report
Financial Highlights - Service Class 2
Years ended December 31, | 2011 | 2010 | 2009 | 2008 | 2007 |
Selected Per-Share Data | | | | | |
Net asset value, beginning of period | $ 15.29 | $ 13.24 | $ 9.75 | $ 15.65 | $ 15.46 |
Income from Investment Operations | | | | | |
Net investment income (loss) C | .22 | .21 | .20 | .27 | .31 |
Net realized and unrealized gain (loss) | (.81) | 2.13 | 3.53 | (5.47) | .98 |
Total from investment operations | (.59) | 2.34 | 3.73 | (5.20) | 1.29 |
Distributions from net investment income | (.23) | (.21) | (.20) | (.21) | (.48) |
Distributions from net realized gain | (.04) | (.08) | (.04) | (.49) | (.62) |
Total distributions | (.27) | (.29) | (.24) G | (.70) | (1.10) |
Net asset value, end of period | $ 14.43 | $ 15.29 | $ 13.24 | $ 9.75 | $ 15.65 |
Total Return A, B | (3.83)% | 17.76% | 38.32% | (34.15)% | 8.72% |
Ratios to Average Net Assets D, F | | | | | |
Expenses before reductions | .79% | .80% | .81% | .81% | .82% |
Expenses net of fee waivers, if any | .79% | .79% | .81% | .81% | .82% |
Expenses net of all reductions | .78% | .79% | .80% | .80% | .82% |
Net investment income (loss) | 1.43% | 1.50% | 1.78% | 2.09% | 2.00% |
Supplemental Data | | | | | |
Net assets, end of period (000 omitted) | $ 290,719 | $ 260,051 | $ 195,356 | $ 102,009 | $ 120,116 |
Portfolio turnover rate E | 47% | 62% | 63% | 64% | 41% |
A Total returns do not reflect charges attributable to your insurance company's separate account. Inclusion of these charges would reduce the total returns shown.
B Total returns would have been lower if certain expenses had not been reduced during the applicable periods shown.
C Calculated based on average shares outstanding during the period.
D Fees and expenses of any underlying Fidelity Central Funds are not included in the Fund's expense ratio. The Fund indirectly bears its proportionate share of the expenses of any underlying Fidelity Central Funds.
E Amount does not include the portfolio activity of any underlying Fidelity Central Funds.
F Expense ratios reflect operating expenses of the class. Expenses before reductions do not reflect amounts reimbursed by the investment adviser or reductions from brokerage service arrangements or reductions from other expense offset arrangements and do not represent the amount paid by the class during periods when reimbursements or reductions occur. Expenses net of fee waivers reflect expenses after reimbursement by the investment adviser but prior to reductions from brokerage service arrangements or other expense offset arrangements. Expenses net of all reductions represent the net expenses paid by the class.
G Total distributions of $.24 per share is comprised of distributions from net investment income of $.201 and distributions from net realized gain of $.035 per share.
Financial Highlights - Investor Class
Years ended December 31, | 2011 | 2010 | 2009 | 2008 | 2007 |
Selected Per-Share Data | | | | | |
Net asset value, beginning of period | $ 15.43 | $ 13.35 | $ 9.83 | $ 15.77 | $ 15.59 |
Income from Investment Operations | | | | | |
Net investment income (loss) C | .24 | .23 | .22 | .29 | .34 |
Net realized and unrealized gain (loss) | (.82) | 2.17 | 3.55 | (5.50) | .99 |
Total from investment operations | (.58) | 2.40 | 3.77 | (5.21) | 1.33 |
Distributions from net investment income | (.25) | (.24) | (.21) | (.24) | (.53) |
Distributions from net realized gain | (.04) | (.08) | (.04) | (.49) | (.62) |
Total distributions | (.29) | (.32) | (.25) G | (.73) | (1.15) |
Net asset value, end of period | $ 14.56 | $ 15.43 | $ 13.35 | $ 9.83 | $ 15.77 |
Total Return A, B | (3.71)% | 17.99% | 38.45% | (33.99)% | 8.89% |
Ratios to Average Net Assets D, F | | | | | |
Expenses before reductions | .62% | .63% | .65% | .64% | .68% |
Expenses net of fee waivers, if any | .62% | .62% | .65% | .64% | .68% |
Expenses net of all reductions | .62% | .62% | .65% | .64% | .68% |
Net investment income (loss) | 1.59% | 1.67% | 1.93% | 2.25% | 2.14% |
Supplemental Data | | | | | |
Net assets, end of period (000 omitted) | $ 1,264,520 | $ 1,349,726 | $ 1,178,752 | $ 766,380 | $ 396,524 |
Portfolio turnover rate E | 47% | 62% | 63% | 64% | 41% |
A Total returns do not reflect charges attributable to your insurance company's separate account. Inclusion of these charges would reduce the total returns shown.
B Total returns would have been lower if certain expenses had not been reduced during the applicable periods shown.
C Calculated based on average shares outstanding during the period.
D Fees and expenses of any underlying Fidelity Central Funds are not included in the Fund's expense ratio. The Fund indirectly bears its proportionate share of the expenses of any underlying Fidelity Central Funds.
E Amount does not include the portfolio activity of any underlying Fidelity Central Funds.
F Expense ratios reflect operating expenses of the class. Expenses before reductions do not reflect amounts reimbursed by the investment adviser or reductions from brokerage service arrangements or reductions from other expense offset arrangements and do not represent the amount paid by the class during periods when reimbursements or reductions occur. Expenses net of fee waivers reflect expenses after reimbursement by the investment adviser but prior to reductions from brokerage service arrangements or other expense offset arrangements. Expenses net of all reductions represent the net expenses paid by the class.
G Total distributions of $.25 per share is comprised of distributions from net investment income of $.214 and distributions from net realized gain of $.035 per share.
See accompanying notes which are an integral part of the financial statements.
Annual Report
Notes to Financial Statements
For the period ended December 31, 2011
1. Organization.
VIP Balanced Portfolio (the Fund) is a fund of Variable Insurance Products Fund III (the Trust) and is authorized to issue an unlimited number of shares. The Trust is registered under the Investment Company Act of 1940, as amended (the 1940 Act), as an open-end management investment company organized as a Massachusetts business trust. Shares of the Fund may only be purchased by insurance companies for the purpose of funding variable annuity or variable life insurance contracts. The Fund offers the following classes of shares: Initial Class shares, Service Class shares, Service Class 2 shares, and Investor Class shares. All classes have equal rights and voting privileges, except for matters affecting a single class. Investment income, realized and unrealized capital gains and losses, the common expenses of the Fund, and certain fund-level expense reductions, if any, are allocated on a pro-rata basis to each class based on the relative net assets of each class to the total net assets of the Fund. Each class differs with respect to transfer agent and distribution and service plan fees incurred. Certain expense reductions may also differ by class.
2. Investments in Fidelity Central Funds.
The Fund invests in Fidelity Central Funds, which are open-end investment companies available only to other investment companies and accounts managed by Fidelity Management & Research Company (FMR) and its affiliates. The Fund's Schedule of Investments lists each of the Fidelity Central Funds held as of period end, if any, as an investment of the Fund, but do not include the underlying holdings of each Fidelity Central Fund. As an Investing Fund, the Fund indirectly bears its proportionate share of the expenses of the underlying Fidelity Central Funds.
Based on their investment objective, each Fidelity Central Fund may invest or participate in various investment vehicles or strategies that are similar to those of the Fund. These strategies are consistent with the investment objectives of the Fund and may involve certain economic risks which may cause a decline in value of each of the Fidelity Central Funds and thus a decline in the value of the Fund. The Money Market Central Funds seek preservation of capital and current income and are managed by Fidelity Investments Money Management, Inc. (FIMM), an affiliate of FMR. The following summarizes the Fund's investment in each Fidelity Central Fund.
Fidelity Central Fund | Investment Manager | Investment Objective | Investment Practices |
Fidelity High Income Central Fund 2 | FMR Co., Inc. (FMRC) | Seeks a high level of income and may also seek capital appreciation by investing primarily in debt securities, preferred stocks, and convertible securities, with an emphasis on lower-quality debt securities. | Loans & Direct Debt Instruments Repurchase Agreements Restricted Securities |
VIP Investment Grade Central Fund | FIMM | Seeks a high level of current income by normally investing in investment-grade debt securities and repurchase agreements. | Delayed Delivery & When Issued Securities Repurchase Agreements Restricted Securities Swap Agreements |
An unaudited holdings listing for the Fund, which presents direct holdings as well as the pro-rata share of any securities and other investments held indirectly through its investment in underlying non-money market Fidelity Central Funds, is available at advisor.fidelity.com. A complete unaudited list of holdings for each Fidelity Central Fund is available upon request or at the Securities and Exchange Commission (the SEC) web site at www.sec.gov. In addition, the financial statements of the Fidelity Central Funds which contain the significant accounting policies (including security valuation policies) of those funds, which are not covered by the Fund's Report of Independent Registered Public Accounting Firm, are available on the SEC web site or upon request.
3. Significant Accounting Policies.
The financial statements have been prepared in conformity with accounting principles generally accepted in the United States of America (GAAP), which require management to make certain estimates and assumptions at the date of the financial statements. Actual results could differ from those estimates. Subsequent events, if any, through the date that the financial statements were issued have been evaluated in the preparation of the financial statements. The following summarizes the significant accounting policies of the Fund:
Security Valuation. Investments are valued as of 4:00 p.m. Eastern time on the last calendar day of the period. The Fund uses independent pricing services approved by the Board of Trustees to value its investments. When current market prices or quotations are not readily available or reliable, valuations may be determined in good faith in accordance with procedures adopted by the Board of Trustees. Factors used in determining value may include market or security specific events, changes in interest rates and credit quality. The frequency with which these procedures are used cannot be predicted and they may be utilized to a significant extent. The value used for net asset value (NAV) calculation under these procedures may differ from published prices for the same securities.
Annual Report
3. Significant Accounting Policies - continued
Security Valuation - continued
The Fund categorizes the inputs to valuation techniques used to value its investments into a disclosure hierarchy consisting of three levels as shown below:
Level 1 - quoted prices in active markets for identical investments
Level 2 - other significant observable inputs (including quoted prices for similar investments, interest rates, prepayment speeds, etc.)
Level 3 - unobservable inputs (including the Fund's own assumptions based on the best information available)
Changes in valuation techniques may result in transfers in or out of an assigned level within the disclosure hierarchy. The aggregate value of investments by input level, as of December 31, 2011, as well as a roll forward of Level 3 securities, is included at the end of the Fund's Schedule of Investments. Valuation techniques used to value the Fund's investments by major category are as follows:
Equity securities, including restricted securities, for which market quotations are readily available, are valued at the last reported sale price or official closing price as reported by an independent pricing service on the primary market or exchange on which they are traded and are categorized as Level 1 in the hierarchy. In the event there were no sales during the day or closing prices are not available, securities are valued at the last quoted bid price or may be valued using the last available price and are generally categorized as Level 2 in the hierarchy. For foreign equity securities, when significant market or security specific events arise, comparisons to the valuation of American Depositary Receipts (ADRs), futures contracts, Exchange-traded funds (ETFs) and certain indexes as well as quoted prices for similar securities are used and are categorized as Level 2 in the hierarchy in these circumstances. Utilizing these techniques may result in transfers between Level 1 and Level 2. For restricted equity securities and private placements where observable inputs are limited, assumptions about market activity and risk are used and are categorized as Level 3 in the hierarchy.
Debt securities, including restricted securities, are valued based on evaluated prices received from independent pricing services or from dealers who make markets in such securities. For corporate bonds, pricing services utilize matrix pricing which considers yield or price of bonds of comparable quality, coupon, maturity and type as well as dealer supplied prices and are generally categorized as Level 2 in the hierarchy. When independent prices are unavailable or unreliable, debt securities may be valued utilizing pricing matrices which consider similar factors that would be used by independent pricing services. These are generally categorized as Level 2 in the hierarchy but may be Level 3 depending on the circumstances.
Investments in open-end mutual funds, including the Fidelity Central Funds, are valued at their closing net asset value each business day and are categorized as Level 1 in the hierarchy.
New Accounting Pronouncements. In May 2011, the Financial Accounting Standards Board issued Accounting Standard Update No. 2011-04, Fair Value Measurement (Topic 820) - Amendments to Achieve Common Fair Value Measurement and Disclosure Requirements in U.S. GAAP and IFRSs. The update is effective during interim and annual periods beginning after December 15, 2011 and will result in additional disclosure for transfers between levels as well as expanded disclosure for securities categorized as Level 3 under the fair value hierarchy.
In December 2011, the Financial Accounting Standards Board issued Accounting Standard Update No. 2011-11, Disclosures about Offsetting Assets and Liabilities. The update creates new disclosure requirements requiring entities to disclose both gross and net information for derivatives and other financial instruments that are either offset in the Statement of Assets and Liabilities or subject to an enforceable master netting arrangement or similar agreement. The disclosure requirements are effective for annual reporting periods beginning on or after January 1, 2013. Management is currently evaluating the impact of the update's adoption on the Fund's financial statement disclosures.
Foreign Currency. The Fund may use foreign currency contracts to facilitate transactions in foreign-denominated securities. Gains and losses from these transactions may arise from changes in the value of the foreign currency or if the counterparties do not perform under the contracts' terms.
Foreign-denominated assets, including investment securities, and liabilities are translated into U.S. dollars at the exchange rate at period end. Purchases and sales of investment securities, income and dividends received and expenses denominated in foreign currencies are translated into U.S. dollars at the exchange rate in effect on the transaction date.
The effects of exchange rate fluctuations on investments are included with the net realized and unrealized gain (loss) on investment securities. Other foreign currency transactions resulting in realized and unrealized gain (loss) are disclosed separately.
Investment Transactions and Income. For financial reporting purposes, the Fund's investment holdings and NAV include trades executed through the end of the last business day of the period. The NAV per share for processing shareholder transactions is calculated as of the close of business of the New York Stock Exchange (NYSE), normally 4:00 p.m. Eastern time and includes trades executed through the end of the prior business day. Gains and losses on securities sold are determined on the basis of identified cost and may include proceeds received from litigation. Dividend income is recorded on the ex-dividend date, except for certain dividends from foreign securities where the ex-dividend date may have passed, which are recorded as soon as the Fund is informed of the ex-dividend date. Non-cash dividends included in dividend income, if any, are recorded at the fair market value of the
Annual Report
Notes to Financial Statements - continued
3. Significant Accounting Policies - continued
Investment Transactions and Income - continued
securities received. Distributions received on securities that represent a return of capital or capital gain are recorded as a reduction of cost of investments and/or as a realized gain. The Fund estimates the components of distributions received that may be considered return of capital distributions or capital gain distributions. Interest income and distributions from the Fidelity Central Funds are accrued as earned. Interest income includes coupon interest and amortization of premium and accretion of discount on debt securities. Investment income is recorded net of foreign taxes withheld where recovery of such taxes is uncertain.
Expenses. Expenses directly attributable to a fund are charged to that fund. Expenses attributable to more than one fund are allocated among the respective funds on the basis of relative net assets or other appropriate methods. Expense estimates are accrued in the period to which they relate and adjustments are made when actual amounts are known.
Income Tax Information and Distributions to Shareholders. Each year, the Fund intends to qualify as a regulated investment company, including distributing substantially all of its taxable income and realized gains under Subchapter M of the Internal Revenue Code. As a result, no provision for income taxes is required. As of December 31, 2011, the Fund did not have any unrecognized tax benefits in the financial statements; nor is the Fund aware of any tax positions for which it is reasonably possible that the total amounts of unrecognized tax benefits will significantly change in the next twelve months. The Fund files a U.S. federal tax return, in addition to state and local tax returns as required. A fund's tax returns are subject to examination by the Internal Revenue Service (IRS) for a period of three fiscal years. State and local tax returns may be subject to examination for an additional fiscal year depending on the jurisdiction. Foreign taxes are provided for based on the Fund's understanding of the tax rules and rates that exist in the foreign markets in which it invests.
Distributions are declared and recorded on the ex-dividend date. Income dividends and capital gain distributions are declared separately for each class. Income and capital gain distributions are determined in accordance with income tax regulations, which may differ from GAAP.
Capital accounts within the financial statements are adjusted for permanent book-tax differences. These adjustments have no impact on net assets or the results of operations. Temporary book-tax differences will reverse in a subsequent period.
Book-tax differences are primarily due to the short-term gain distributions from the Fidelity Central Funds, in-kind transactions, foreign currency transactions, passive foreign investment companies (PFIC), market discount, contingent interest, equity-debt classifications, partnerships (including allocations from Fidelity Central Funds), deferred trustees compensation, capital loss carryforwards, and losses deferred due to wash sales and excise tax regulations.
The federal tax cost of investment securities and unrealized appreciation (depreciation) as of period end were as follows:
Gross unrealized appreciation | $ 195,100,449 |
Gross unrealized depreciation | (148,603,738) |
Net unrealized appreciation (depreciation) on securities and other investments | $ 46,496,711 |
| |
Tax Cost | $ 1,697,823,913 |
The tax-based components of distributable earnings as of period end were as follows:
Undistributed long-term capital gain | $ 63,909,597 |
Net unrealized appreciation (depreciation) | $ 46,492,279 |
The tax character of distributions paid was as follows:
| December 31, 2011 | December 31, 2010 |
Ordinary Income | $ 33,719,883 | $ 36,181,949 |
4. Operating Policies.
Restricted Securities. The Fund may invest in securities that are subject to legal or contractual restrictions on resale. These securities generally may be resold in transactions exempt from registration or to the public if the securities are registered. Disposal of these securities may involve time-consuming negotiations and expense, and prompt sale at an acceptable price may be difficult. Information regarding restricted securities is included at the end of the Fund's Schedule of Investments.
Annual Report
5. Purchases and Sales of Investments.
Purchases and sales of securities (including the Fixed-Income Central Funds), other than short-term securities, aggregated $899,147,219 and $833,218,067, respectively.
6. Fees and Other Transactions with Affiliates.
Management Fee. FMR and its affiliates provide the Fund with investment management related services for which the Fund pays a monthly management fee. The management fee is the sum of an individual fund fee rate that is based on an annual rate of .15% of the Fund's average net assets and an annualized group fee rate that averaged .26% during the period. The group fee rate is based upon the average net assets of all the mutual funds advised by FMR. The group fee rate decreases as assets under management increase and increases as assets under management decrease. For the period, the total annual management fee rate was .41% of the Fund's average net assets.
Distribution and Service Plan Fees. In accordance with Rule 12b-1 of the 1940 Act, the Fund has adopted separate 12b-1 Plans for each Service Class of shares. Each Service Class pays Fidelity Distributors Corporation (FDC), an affiliate of FMR, a service fee. For the period, the service fee is based on an annual rate of .10% of Service Class' average net assets and .25% of Service Class 2's average net assets.
For the period, total fees, all of which were re-allowed to insurance companies for the distribution of shares and providing shareholder support services were as follows:
Service Class | $ 4,555 |
Service Class 2 | 715,781 |
| $ 720,336 |
Transfer Agent Fees. Fidelity Investments Institutional Operations Company, Inc. (FIIOC), an affiliate of FMR, is the Fund's transfer, dividend disbursing, and shareholder servicing agent. FIIOC receives an asset-based fee with respect to each class. Each class (with the exception of Investor Class) pays a transfer agent fee, excluding out of pocket expenses, equal to an annual rate of .07% of average net assets. Investor Class pays a monthly asset-based transfer agent fee of .15% of average net assets. In addition, FIIOC receives an asset-based fee of .0045% of average net assets for typesetting, printing and mailing of shareholder reports, except proxy statements. FIIOC voluntarily agreed to waive this fee for the period August 1, 2011 through December 31, 2011 (see Expense Reductions note). For the period, transfer agent fees for each class, including printing and out of pocket expenses, were as follows:
Initial Class | $ 145,332 |
Service Class | 4,928 |
Service Class 2 | 210,493 |
Investor Class | 2,105,490 |
| $ 2,466,243 |
Accounting and Security Lending Fees. Fidelity Service Company, Inc. (FSC), an affiliate of FMR, maintains the Fund's accounting records. The accounting fee is based on the level of average net assets for the month. Under a separate contract, FSC administers the security lending program. The security lending fee is based on the number and duration of lending transactions.
Brokerage Commissions. The Fund placed a portion of its portfolio transactions with brokerage firms which are affiliates of the investment adviser. The commissions paid to these affiliated firms were $21,172 for the period.
7. Committed Line of Credit.
The Fund participates with other funds managed by FMR or an affiliate in a $4.0 billion credit facility (the "line of credit") to be utilized for temporary or emergency purposes to fund shareholder redemptions or for other short-term liquidity purposes. The Fund has agreed to pay commitment fees on its pro-rata portion of the line of credit, which amounted to $5,580 and is reflected in Miscellaneous expenses on the Statement of Operations. During the period, there were no borrowings on this line of credit.
8. Security Lending.
The Fund lends portfolio securities through a lending agent from time to time in order to earn additional income. For equity securities, a lending agent is used and may loan securities to certain qualified borrowers, including Fidelity Capital Markets (FCM), a broker-dealer affiliated with the Fund. On the settlement date of the loan, the Fund receives collateral (in the form of U.S. Treasury obligations, letters of credit and/or cash) against the loaned securities and maintains collateral in an amount not less than 100% of the market value of the loaned securities during the period of the loan. The market value of the loaned securities is determined at the close of business of the Fund and any additional required collateral is delivered to the Fund on the next business day. If the borrower defaults on its obligation to return the securities loaned because of insolvency or other reasons, a fund could
Annual Report
Notes to Financial Statements - continued
8. Security Lending - continued
experience delays and costs in recovering the securities loaned or in gaining access to the collateral. Any cash collateral received is invested in the Fidelity Securities Lending Cash Central Fund. The value of loaned securities and cash collateral at period end are disclosed on the Fund's Statement of Assets and Liabilities. At period end, there were no security loans outstanding with FCM. Security lending income represents the income earned on investing cash collateral, less rebates paid to borrowers and any lending agent fees associated with the loan, plus any premium payments received for lending certain types of securities. Security lending income is presented in the Statement of Operations as a component of income from Fidelity Central Funds. Total security lending income during the period amounted to $333,591, including $1,051 from securities loaned to FCM.
9. Expense Reductions.
FMR or its affiliates agreed to waive certain fees during the period as noted in the table below.
Initial Class | $ 3,414 |
Service Class | 80 |
Service Class 2 | 5,044 |
Investor Class | 23,645 |
| $ 32,183 |
Many of the brokers with whom FMR places trades on behalf of the Fund provided services to the Fund in addition to trade execution. These services included payments of certain expenses on behalf of the Fund totaling $72,146 for the period. In addition, through arrangements with the Fund's custodian, credits realized as a result of uninvested cash balances were used to reduce the Fund's expenses. During the period, these credits reduced the Fund's custody expenses by $19.
10. Distributions to Shareholders.
Distributions to shareholders of each class were as follows:
Years ended December 31, | 2011 | 2010 |
From net investment income | | |
Initial Class | $ 3,011,463 | $ 3,131,983 |
Service Class | 63,506 | 76,758 |
Service Class 2 | 4,503,832 | 3,575,559 |
Investor Class | 21,232,060 | 20,143,187 |
Total | $ 28,810,861 | $ 26,927,487 |
From net realized gain | | |
Initial Class | $ 483,347 | $ 1,027,378 |
Service Class | 11,156 | 27,742 |
Service Class 2 | 835,390 | 1,323,303 |
Investor Class | 3,579,129 | 6,876,039 |
Total | $ 4,909,022 | $ 9,254,462 |
11. Share Transactions.
Transactions for each class of shares were as follows:
| Shares | Dollars |
Years ended December 31, | 2011 | 2010 | 2011 | 2010 |
Initial Class | | | | |
Shares sold | 985,703 | 1,539,676 | $ 15,409,590 | $ 22,328,669 |
Reinvestment of distributions | 244,082 | 274,193 | 3,494,810 | 4,159,361 |
Shares redeemed | (2,557,912) | (2,593,958) | (39,287,840) | (36,301,836) |
Net increase (decrease) | (1,328,127) | (780,089) | $ (20,383,440) | $ (9,813,806) |
Service Class | | | | |
Shares sold | 4,264 | 8,201 | $ 66,591 | $ 118,482 |
Reinvestment of distributions | 5,231 | 6,926 | 74,662 | 104,500 |
Shares redeemed | (71,853) | (148,869) | (1,113,007) | (2,088,290) |
Net increase (decrease) | (62,358) | (133,742) | $ (971,754) | $ (1,865,308) |
Annual Report
11. Share Transactions - continued
| Shares | Dollars |
Years ended December 31, | 2011 | 2010 | 2011 | 2010 |
Service Class 2 | | | | |
Shares sold | 6,074,928 | 4,510,552 | $ 92,544,086 | $ 62,556,939 |
Reinvestment of distributions | 378,277 | 327,233 | 5,339,222 | 4,898,862 |
Shares redeemed | (3,309,474) | (2,590,812) | (49,863,501) | (36,226,695) |
Net increase (decrease) | 3,143,731 | 2,246,973 | $ 48,019,807 | $ 31,229,106 |
Investor Class | | | | |
Shares sold | 3,144,734 | 2,531,204 | $ 49,528,174 | $ 36,157,218 |
Reinvestment of distributions | 1,741,565 | 1,790,200 | 24,811,189 | 27,019,226 |
Shares redeemed | (5,529,690) | (5,146,100) | (84,420,242) | (71,030,853) |
Net increase (decrease) | (643,391) | (824,696) | $ (10,080,879) | $ (7,854,409) |
12. Other.
The Fund's organizational documents provide former and current trustees and officers with a limited indemnification against liabilities arising in connection with the performance of their duties to the Fund. In the normal course of business, the Fund may also enter into contracts that provide general indemnifications. The Fund's maximum exposure under these arrangements is unknown as this would be dependent on future claims that may be made against the Fund. The risk of material loss from such claims is considered remote.
At the end of the period, FMR or its affiliates were the owners of record of 81% of the total outstanding shares of the Fund.
Annual Report
Report of Independent Registered Public Accounting Firm
To the Trustees of Variable Insurance Products Fund III and Shareholders of VIP Balanced Portfolio:
We have audited the accompanying statement of assets and liabilities of VIP Balanced Portfolio (the Fund), a fund of Variable Insurance Products Fund III, including the schedule of investments, as of December 31, 2011, and the related statement of operations for the year then ended, the statement of changes in net assets for each of the two years in the period then ended, and the financial highlights for each of the five years in the period then ended. These financial statements and financial highlights are the responsibility of the Fund's management. Our responsibility is to express an opinion on these financial statements and financial highlights based on our audits.
We conducted our audits in accordance with the standards of the Public Company Accounting Oversight Board (United States). Those standards require that we plan and perform the audit to obtain reasonable assurance about whether the financial statements and financial highlights are free of material misstatement. The Fund is not required to have, nor were we engaged to perform, an audit of its internal control over financial reporting. Our audits included consideration of internal control over financial reporting as a basis for designing audit procedures that are appropriate in the circumstances, but not for the purpose of expressing an opinion on the effectiveness of the Fund's internal control over financial reporting. Accordingly, we express no such opinion. An audit also includes examining, on a test basis, evidence supporting the amounts and disclosures in the financial statements, assessing the accounting principles used and significant estimates made by management, as well as evaluating the overall financial statement presentation. Our procedures included confirmation of securities owned as of December 31, 2011, by correspondence with the custodians and brokers; where replies were not received from brokers, we performed other auditing procedures. We believe that our audits provide a reasonable basis for our opinion.
In our opinion, the financial statements and financial highlights referred to above present fairly, in all material respects, the financial position of VIP Balanced Portfolio as of December 31, 2011, the results of its operations for the year then ended, the changes in its net assets for each of the two years in the period then ended, and the financial highlights for each of the five years in the period then ended, in conformity with accounting principles generally accepted in the United States of America.
DELOITTE & TOUCHE LLP
Boston, Massachusetts
February 14, 2012
Annual Report
The Trustees, Members of the Advisory Board, and executive officers of the trust and fund, as applicable, are listed below. The Board of Trustees governs the fund and is responsible for protecting the interests of shareholders. The Trustees are experienced executives who meet periodically throughout the year to oversee the fund's activities, review contractual arrangements with companies that provide services to the fund, oversee management of the risks associated with such activities and contractual arrangements, and review the fund's performance. Except for James C. Curvey, each of the Trustees oversees 226 funds advised by FMR or an affiliate. Mr. Curvey oversees 429 funds advised by FMR or an affiliate.
The Trustees hold office without limit in time except that (a) any Trustee may resign; (b) any Trustee may be removed by written instrument, signed by at least two-thirds of the number of Trustees prior to such removal; (c) any Trustee who requests to be retired or who has become incapacitated by illness or injury may be retired by written instrument signed by a majority of the other Trustees; and (d) any Trustee may be removed at any special meeting of shareholders by a two-thirds vote of the outstanding voting securities of the trust. Each Trustee who is not an interested person (as defined in the 1940 Act) (Independent Trustee), shall retire not later than the last day of the calendar year in which his or her 75th birthday occurs. The Independent Trustees may waive this mandatory retirement age policy with respect to individual Trustees. The executive officers and Advisory Board Members hold office without limit in time, except that any officer and Advisory Board Member may resign or may be removed by a vote of a majority of the Trustees at any regular meeting or any special meeting of the Trustees. Except as indicated, each individual has held the office shown or other offices in the same company for the past five years.
Experience, Skills, Attributes, and Qualifications of the Fund's Trustees. The Governance and Nominating Committee has adopted a statement of policy that describes the experience, qualifications, attributes, and skills that are necessary and desirable for potential Independent Trustee candidates (Statement of Policy). The Board believes that each Trustee satisfied at the time he or she was initially elected or appointed a Trustee, and continues to satisfy, the standards contemplated by the Statement of Policy. The Governance and Nominating Committee also engages professional search firms to help identify potential Independent Trustee candidates who have the experience, qualifications, attributes, and skills consistent with the Statement of Policy. From time to time, additional criteria based on the composition and skills of the current Independent Trustees, as well as experience or skills that may be appropriate in light of future changes to board composition, business conditions, and regulatory or other developments, have also been considered by the professional search firms and the Governance and Nominating Committee. In addition, the Board takes into account the Trustees' commitment and participation in Board and committee meetings, as well as their leadership of standing and ad hoc committees throughout their tenure.
In determining that a particular Trustee was and continues to be qualified to serve as a Trustee, the Board has considered a variety of criteria, none of which, in isolation, was controlling. The Board believes that, collectively, the Trustees have balanced and diverse experience, qualifications, attributes, and skills, which allow the Board to operate effectively in governing the fund and protecting the interests of shareholders. Information about the specific experience, skills, attributes, and qualifications of each Trustee, which in each case led to the Board's conclusion that the Trustee should serve (or continue to serve) as a trustee of the fund, is provided below.
Board Structure and Oversight Function. James C. Curvey is an interested person (as defined in the 1940 Act) and currently serves as Acting Chairman. The Trustees have determined that an interested Chairman is appropriate and benefits shareholders because an interested Chairman has a personal and professional stake in the quality and continuity of services provided to the fund. Independent Trustees exercise their informed business judgment to appoint an individual of their choosing to serve as Chairman, regardless of whether the Trustee happens to be independent or a member of management. The Independent Trustees have determined that they can act independently and effectively without having an Independent Trustee serve as Chairman and that a key structural component for assuring that they are in a position to do so is for the Independent Trustees to constitute a substantial majority for the Board. The Independent Trustees also regularly meet in executive session. Ned C. Lautenbach serves as Chairman of the Independent Trustees and as such (i) acts as a liaison between the Independent Trustees and management with respect to matters important to the Independent Trustees and (ii) with management prepares agendas for Board meetings.
Fidelity funds are overseen by different Boards of Trustees. The fund's Board oversees Fidelity's equity and high income funds and another Board oversees Fidelity's investment-grade bond, money market, and asset allocation funds. The asset allocation funds may invest in Fidelity funds overseen by the fund's Board. The use of separate Boards, each with its own committee structure, allows the Trustees of each group of Fidelity funds to focus on the unique issues of the funds they oversee, including common research, investment, and operational issues. On occasion, the separate Boards establish joint committees to address issues of overlapping consequences for the Fidelity funds overseen by each Board.
The Trustees operate using a system of committees to facilitate the timely and efficient consideration of all matters of importance to the Trustees, the fund, and fund shareholders and to facilitate compliance with legal and regulatory requirements and oversight of the fund's activities and associated risks. The Board, acting through its committees, has charged FMR and its affiliates with (i) identifying events or circumstances the occurrence of which could have demonstrably adverse effects on the fund's business and/or reputation; (ii) implementing processes and controls to lessen the possibility that such events or circumstances occur or to mitigate the effects of such events or circumstances if they do occur; and (iii) creating and maintaining a system designed to evaluate continuously business and market conditions in order to facilitate the identification and implementation processes described in (i) and (ii) above. Because the day-to-day operations and activities of the fund are carried out by or through FMR, its affiliates and other service providers, the fund's exposure to risks is mitigated but not eliminated by the processes overseen by the Trustees. While each of the Board's committees has responsibility for overseeing different aspects of the fund's activities, oversight is exercised primarily through the Operations, Audit, and Compliance Committees. In addition, the Independent Trustees have worked with FMR to enhance the Board's oversight of investment and financial risks, legal and regulatory risks, technology risks, and operational risks, including the development of additional risk reporting to the Board. For example, a working group comprised of Independent Trustees and FMR has worked and continues to work to review the Fidelity funds' valuation-related activities, reporting and risk management. Appropriate personnel, including but not limited to the fund's Chief Compliance Officer (CCO), FMR's internal auditor, the independent accountants, the fund's Treasurer and portfolio management personnel, make periodic reports to the Board's committees, as appropriate, including an annual review of FMR's risk management program for the Fidelity funds. The responsibilities of each standing committee, including their oversight responsibilities, are described further under "Standing Committees of the Fund's Trustees."
Annual Report
Trustees and Officers - continued
The fund's Statement of Additional Information (SAI) includes more information about the Trustees. To request a free copy, call Fidelity at 1-877-208-0098.
Interested Trustees*:
Correspondence intended for each Trustee who is an interested person may be sent to Fidelity Investments, 82 Devonshire Street, Boston, Massachusetts 02109.
Name, Age; Principal Occupations and Other Relevant Experience+ |
James C. Curvey (76) |
| Year of Election or Appointment: 2007 Mr. Curvey is Trustee and Acting Chairman of the Board of Trustees of certain Trusts. Mr. Curvey also serves as Trustee (2007-present) of other investment companies advised by FMR. Mr. Curvey is a Director of Fidelity Investments Money Management, Inc. (2009-present), Director of Fidelity Research & Analysis Co. (2009-present) and Director of FMR and FMR Co., Inc. (2007-present). Mr. Curvey is also Vice Chairman (2007-present) and Director of FMR LLC. In addition, Mr. Curvey serves as an Overseer for the Boston Symphony Orchestra and a member of the Trustees of Villanova University. Previously, Mr. Curvey was the Vice Chairman (2006-2007) and Director (2000-2007) of FMR Corp. |
Ronald P. O'Hanley (54) |
| Year of Election or Appointment: 2011 Mr. O'Hanley is Director of FMR Co., Inc. (2010-present), Director of Fidelity Investments Money Management, Inc. (2010-present), Director of Fidelity Research & Analysis Company (2010-present), President of Fidelity Asset Management and Corporate Services and a member of Fidelity's Executive Committee (2010-present). Previously, Mr. O'Hanley served as President and Chief Executive Officer of BNY Mellon Asset Management (2007-2010). Mr. O'Hanley also served as Vice Chairman of Bank New York Mellon Corp. and a member of that firm's Executive Committee. Prior to the 2007 merger of The Bank of New York and Mellon Financial Corporation, he was Vice Chairman of Mellon Financial Corporation and President and Chief Executive Officer of Mellon Asset Management. He joined Mellon in February 1997. Mr. O'Hanley currently serves as Chairman of the Boston Public Library Foundation Board of Directors and sits on the Board of Directors of Beth Israel Deaconess Medical Center, the Board of Trustees of the Marine Biological Laboratory and the Advisory Board of the Maxwell School of Citizenship and Public Administration at Syracuse University. Mr. O'Hanley also chairs the Council on Asset Management for the Financial Services Roundtable and is a member of the Board of Directors of Institutional Investor's U.S. Institute. |
* Trustees have been determined to be "Interested Trustees" by virtue of, among other things, their affiliation with the trust or various entities under common control with FMR.
+ The information above includes each Trustee's principal occupation during the last five years and other information relating to the experience, attributes, and skills relevant to each Trustee's qualifications to serve as a Trustee, which led to the conclusion that each Trustee should serve as a Trustee for the fund.
Independent Trustees:
Correspondence intended for each Independent Trustee (that is, the Trustees other than the Interested Trustees) may be sent to Fidelity Investments, P.O. Box 55235, Boston, Massachusetts 02205-5235.
Name, Age; Principal Occupations and Other Relevant Experience+ |
Dennis J. Dirks (63) |
| Year of Election or Appointment: 2005 Prior to his retirement in May 2003, Mr. Dirks was Chief Operating Officer and a member of the Board of The Depository Trust & Clearing Corporation (DTCC). He also served as President, Chief Operating Officer, and Board member of The Depository Trust Company (DTC) and President and Board member of the National Securities Clearing Corporation (NSCC). In addition, Mr. Dirks served as Chief Executive Officer and Board member of the Government Securities Clearing Corporation, Chief Executive Officer and Board member of the Mortgage-Backed Securities Clearing Corporation, as a Trustee and a member of the Finance Committee of Manhattan College (2005-2008), and as a Trustee and a member of the Finance Committee of AHRC of Nassau County (2006-2008). Mr. Dirks is a member of the Independent Directors Council (IDC) Governing Council (2010-present) and Board of Directors for The Brookville Center for Children's Services, Inc. (2009-present). |
Alan J. Lacy (58) |
| Year of Election or Appointment: 2008 Mr. Lacy serves as Senior Adviser (2007-present) of Oak Hill Capital Partners, L.P. (private equity). Mr. Lacy also served as Chief Executive Officer (2000-2005) and Vice Chairman (2005-2006) of Sears Holdings Corporation and Sears, Roebuck and Co. (retail). In addition, Mr. Lacy serves as a member of the Board of Directors of Dave & Buster's, Inc. (restaurant and entertainment complexes, 2010-present), The Hillman Companies, Inc. (hardware wholesalers, 2010-present), and Bristol-Myers Squibb Company (global pharmaceuticals, 2007-present). Mr. Lacy is a member of the Board of Trustees of The National Parks Conservation Association (2006-present). Previously, Mr. Lacy served as Chairman of the Board of Trustees of the National Parks Conservation Association (2008-2011) and as a member of the Board of Directors for the Western Union Company (global money transfer, 2006-2011). |
Ned C. Lautenbach (67) |
| Year of Election or Appointment: 2000 Mr. Lautenbach is Chairman of the Independent Trustees of the Equity and High Income Funds (2006-present). Mr. Lautenbach currently serves as the Lead Director of the Eaton Corporation Board of Directors (diversified industrial, 1997-present). Mr. Lautenbach is also a member of the Board of Directors of the Philharmonic Center for the Arts in Naples, Florida (1999-present); a member of the Board of Trustees of Fairfield University (2005-present); and a member of the Council on Foreign Relations (1994-present). Previously, Mr. Lautenbach was a Partner/Advisory Partner at Clayton, Dubilier & Rice, LLC (private equity investment, 1998-2010), as well as a Director of Sony Corporation (2006-2007). |
Joseph Mauriello (67) |
| Year of Election or Appointment: 2008 Prior to his retirement in January 2006, Mr. Mauriello served in numerous senior management positions including Deputy Chairman and Chief Operating Officer (2004-2005), and Vice Chairman of Financial Services (2002-2004) of KPMG LLP US (professional services, 1965-2005). Mr. Mauriello currently serves as a member of the Board of Directors of XL Group plc. (global insurance and re-insurance, 2006-present) and of Arcadia Resources Inc. (health care services and products, 2007-present). Previously, Mr. Mauriello served as a Director of the Hamilton Funds of the Bank of New York (2006-2007). |
Robert W. Selander (61) |
| Year of Election or Appointment: 2011 Previously, Mr. Selander served as a Member of the Advisory Board of Fidelity's Equity and High Income Funds (2011), Executive Vice Chairman (2010), Chief Executive Officer (2009-2010), and President and Chief Executive Officer (1997-2009) of Mastercard, Inc. |
Cornelia M. Small (67) |
| Year of Election or Appointment: 2005 Ms. Small is a member of the Board of Directors of the Teagle Foundation (2009-present). Ms. Small is also a member of the Investment Committee, and Chair (2008-present) and a member of the Board of Trustees of Smith College. In addition, Ms. Small serves on the Investment Committee of the Berkshire Taconic Community Foundation (2008-present). Previously, Ms. Small served as Chairperson of the Investment Committee (2002-2008) of Smith College. In addition, Ms. Small served as Chief Investment Officer, Director of Global Equity Investments, and a member of the Board of Directors of Scudder, Stevens & Clark and Scudder Kemper Investments. |
William S. Stavropoulos (72) |
| Year of Election or Appointment: 2002 Mr. Stavropoulos is Vice Chairman of the Independent Trustees of the Equity and High Income Funds (2006-present). Mr. Stavropoulos serves as President and Founder of the Michigan Baseball Foundation, the Great Lakes Loons (2007-present). Mr. Stavropoulos is Chairman Emeritus of the Board of Directors of The Dow Chemical Company, where he previously served in numerous senior management positions, including President, CEO (1995-2000; 2002-2004), Chairman of the Executive Committee (2000-2006), and as a member of the Board of Directors (1990-2006). Currently, Mr. Stavropoulos is Chairman of Univar (global distributor of commodity and specialty chemicals, 2010-present), a Director of Teradata Corporation (data warehousing and technology solutions, 2008-present), Chemical Financial Corporation, Maersk Inc. (industrial conglomerate), Tyco International, Inc. (multinational manufacturing and services, 2007-present), and a member of the Advisory Board for Metalmark Capital (private equity investment, 2005-present). Mr. Stavropoulos is a special advisor to Clayton, Dubilier & Rice, LLC (private equity investment). In addition, Mr. Stavropoulos is a member of the University of Notre Dame Advisory Council for the College of Science. |
David M. Thomas (62) |
| Year of Election or Appointment: 2008 Previously, Mr. Thomas served as Executive Chairman (2005-2006) and Chairman and Chief Executive Officer (2000-2005) of IMS Health, Inc. (pharmaceutical and healthcare information solutions). In addition, Mr. Thomas serves as a member of the Board of Directors of Fortune Brands, Inc. (consumer products), and Interpublic Group of Companies, Inc. (marketing communication, 2004-present). |
Michael E. Wiley (61) |
| Year of Election or Appointment: 2008 Mr. Wiley also serves as a Director of Asia Pacific Exploration Consolidated (international oil and gas exploration and production, 2008-present). Mr. Wiley serves as a Director of Tesoro Corporation (independent oil refiner and marketer, 2005-present), and a Director of Bill Barrett Corporation (exploration and production, 2005-present). In addition, Mr. Wiley also serves as a Director of Post Oak Bank (privately-held bank, 2004-present). Previously, Mr. Wiley served as a member of the Board of Trustees of the University of Tulsa (2000-2006; 2007-2010), as a Senior Energy Advisor of Katzenbach Partners, LLC (consulting, 2006-2007), as an Advisory Director of Riverstone Holdings (private investment), Chairman, President, and CEO of Baker Hughes, Inc. (oilfield services, 2000-2004), and as Director of Spinnaker Exploration Company (exploration and production, 2001-2005). |
+ The information above includes each Trustee's principal occupation during the last five years and other information relating to the experience, attributes, and skills relevant to each Trustee's qualifications to serve as a Trustee, which led to the conclusion that each Trustee should serve as a Trustee for the fund.
Advisory Board Members and Executive Officers:
Correspondence intended for each executive officer, Edward C. Johnson 3d, and Peter S. Lynch may be sent to Fidelity Investments, 82 Devonshire Street, Boston, Massachusetts 02109.
Name, Age; Principal Occupation |
Edward C. Johnson 3d (81) |
| Year of Election or Appointment: 2011 Member of the Advisory Board of Fidelity's Equity and High Income Funds. Mr. Johnson serves as Chief Executive Officer, Chairman, and a Director of FMR LLC, and also serves as Chairman and Director of FIL Limited. Previously, Mr. Johnson served as a Trustee and Chairman of the Board of certain Fidelity Trusts, Chairman and a Director of FMR, Chairman and a Director of FMR Co., Inc., and President of FMR LLC (2006-2007). |
Peter S. Lynch (67) |
| Year of Election or Appointment: 2003 Member of the Advisory Board of Fidelity's Equity and High Income Funds. Mr. Lynch is Vice Chairman and a Director of FMR and FMR Co., Inc. In addition, Mr. Lynch serves as a Trustee of Boston College and as the Chairman of the Inner-City Scholarship Fund. Previously, Mr. Lynch served on the Special Olympics International Board of Directors (1997-2006). |
Kenneth B. Robins (42) |
| Year of Election or Appointment: 2008 President and Treasurer of Fidelity's Equity and High Income Funds. Mr. Robins also serves as President and Treasurer (2010-present) and Assistant Treasurer (2009-present) of other Fidelity funds and is an employee of Fidelity Investments (2004-present). Previously, Mr. Robins served as Deputy Treasurer of the Fidelity funds (2005-2008) and Treasurer and Chief Financial Officer of The North Carolina Capital Management Trust: Cash and Term Portfolios (2006-2008). |
Brian B. Hogan (47) |
| Year of Election or Appointment: 2009 Vice President of Equity and High Income Funds. Mr. Hogan also serves as President of FMR's Equity Division (2009-present). Previously, Mr. Hogan served as Senior Vice President, Equity Research of FMR (2006-2009) and as a portfolio manager. |
Thomas C. Hense (47) |
| Year of Election or Appointment: 2008 or 2010 Vice President of Fidelity's High Income (2008), Small Cap (2008), and Value (2010) Funds. Previously, Mr. Hense served as a portfolio manager for Fidelity's Institutional Money Management Group (Pyramis) (2003-2008). |
Scott C. Goebel (43) |
| Year of Election or Appointment: 2008 Secretary and Chief Legal Officer (CLO) of the Fidelity funds. Mr. Goebel also serves as Secretary of Fidelity Investments Money Management, Inc. (FIMM) (2010-present) and Fidelity Research and Analysis Company (FRAC) (2010-present); Secretary and CLO of The North Carolina Capital Management Trust: Cash and Term Portfolios (2008-present); General Counsel, Secretary, and Senior Vice President of FMR (2008-present) and FMR Co., Inc. (2008-present); employed by FMR LLC or an affiliate (2001-present); Chief Legal Officer of Fidelity Management & Research (Hong Kong) Limited (2008-present) and Assistant Secretary of Fidelity Management & Research (Japan) Inc. (2008-present), and Fidelity Management & Research (U.K.) Inc. (2008-present). Previously, Mr. Goebel served as Assistant Secretary of FIMM (2008-2010), FRAC (2008-2010), and the Funds (2007-2008) and as Vice President and Secretary of Fidelity Distributors Corporation (FDC) (2005-2007). |
William C. Coffey (42) |
| Year of Election or Appointment: 2009 Assistant Secretary of Fidelity's Equity and High Income Funds. Mr. Coffey also serves as Senior Vice President and Deputy General Counsel of FMR LLC (2010-present), and is an employee of Fidelity Investments. Previously, Mr. Coffey served as Vice President and Associate General Counsel of FMR LLC (2005-2009). |
Holly C. Laurent (57) |
| Year of Election or Appointment: 2008 Anti-Money Laundering (AML) Officer of the Fidelity funds. Ms. Laurent also serves as AML Officer of The North Carolina Capital Management Trust: Cash and Term Portfolios (2008-present) and is an employee of Fidelity Investments. Previously, Ms. Laurent was Senior Vice President and Head of Legal for Fidelity Business Services India Pvt. Ltd. (2006-2008), and Senior Vice President, Deputy General Counsel and Group Head for FMR LLC (2005-2006). |
Christine Reynolds (53) |
| Year of Election or Appointment: 2008 Chief Financial Officer of the Fidelity funds. Ms. Reynolds became President of Fidelity Pricing and Cash Management Services (FPCMS) in August 2008. Ms. Reynolds served as Chief Operating Officer of FPCMS (2007-2008). Previously, Ms. Reynolds served as President, Treasurer, and Anti-Money Laundering officer of the Fidelity funds (2004-2007). |
Kenneth A. Rathgeber (64) |
| Year of Election or Appointment: 2004 Chief Compliance Officer of Fidelity's Equity and High Income Funds. Mr. Rathgeber is Chief Compliance Officer of Fidelity Management & Research (Hong Kong) Limited (2008-present), Fidelity Management & Research (Japan) Inc. (2008-present), FMR (2005-present), FMR Co., Inc. (2005-present), Fidelity Management & Research (U.K.) Inc. (2005-present), Fidelity Research & Analysis Company (2005-present), Fidelity Investments Money Management, Inc. (2005-present), Pyramis Global Advisors, LLC (2005-present), and Strategic Advisers, Inc. (2005-present). |
Jeffrey S. Christian (50) |
| Year of Election or Appointment: 2009 Deputy Treasurer of the Fidelity funds. Mr. Christian is an employee of Fidelity Investments. Previously, Mr. Christian served as Chief Financial Officer (2008-2009) of certain Fidelity funds and Senior Vice President of Fidelity Pricing and Cash Management Services (FPCMS) (2004-2009). |
Joseph F. Zambello (54) |
| Year of Election or Appointment: 2011 Deputy Treasurer of the Fidelity funds. Mr. Zambello is an employee of Fidelity Investments. Previously, Mr. Zambello served as Vice President of FMR's Program Management Group (2009-2011) and Vice President of the Transfer Agent Oversight Group (2005-2009). |
Adrien E. Deberghes (44) |
| Year of Election or Appointment: 2008 Deputy Treasurer of Fidelity's Equity and High Income Funds. Mr. Deberghes also serves as Vice President and Assistant Treasurer of Fidelity Rutland Square Trust II and Fidelity Commonwealth Trust II (2011-present), Assistant Treasurer of other Fidelity funds (2010-present), and is an employee of Fidelity Investments (2008-present). Previously, Mr. Deberghes served as Senior Vice President of Mutual Fund Administration at State Street Corporation (2007-2008), Senior Director of Mutual Fund Administration at Investors Bank & Trust (2005-2007), and Director of Finance for Dunkin' Brands (2000-2005). |
Stephanie J. Dorsey (42) |
| Year of Election or Appointment: 2010 Assistant Treasurer of Fidelity's Equity and High Income Funds. Ms. Dorsey also serves as Deputy Treasurer of other Fidelity funds (2008-present) and is an employee of Fidelity Investments (2008-present). Previously, Ms. Dorsey served as Treasurer (2004-2008) of the JPMorgan Mutual Funds and Vice President (2004-2008) of JPMorgan Chase Bank. |
John R. Hebble (53) |
| Year of Election or Appointment: 2009 Assistant Treasurer of Fidelity's Equity and High Income Funds. Mr. Hebble also serves as President (2011-present), Treasurer, and Chief Financial Officer of The North Carolina Capital Management Trust: Cash and Term Portfolios (2008-present), President and Treasurer of other Fidelity funds (2008-present) and is an employee of Fidelity Investments. |
Gary W. Ryan (53) |
| Year of Election or Appointment: 2005 Assistant Treasurer of the Fidelity funds. Mr. Ryan is an employee of Fidelity Investments. Previously, Mr. Ryan served as Vice President of Fund Reporting in Fidelity Pricing and Cash Management Services (FPCMS) (1999-2005). |
Jonathan Davis (43) |
| Year of Election or Appointment: 2010 Assistant Treasurer of the Fidelity funds. Mr. Davis is also Assistant Treasurer of Fidelity Rutland Square Trust II and Fidelity Commonwealth Trust II. Mr. Davis is an employee of Fidelity Investments. Previously, Mr. Davis served as Vice President and Associate General Counsel of FMR LLC (2003-2010). |
Annual Report
The Board of Trustees of VIP Balanced Portfolio voted to pay to shareholders of record at the opening of business on record date, the following distributions per share derived from capital gains realized from sales of portfolio securities:
| Pay Date | Record Date | Capital Gains |
Initial Class | 02/03/2012 | 02/03/2012 | $0.539 |
Service Class | 02/03/2012 | 02/03/2012 | $0.539 |
Service Class 2 | 02/03/2012 | 02/03/2012 | $0.539 |
Investor Class | 02/03/2012 | 02/03/2012 | $0.539 |
The fund hereby designates as a capital gain dividend with respect to the taxable year ended December 31, 2011, $64,058,262, or, if subsequently determined to be different, the net capital gain of such year.
Initial Class designates 32% and 35%; Service Class designates 32% and 38%; Service Class 2 designates 32% and 39%; and Investor Class designates 32% and 36%; of the dividends distributed in February 2011 and December 2011, respectively, during the fiscal year as qualifying for the dividends-received deduction for corporate shareholders.
A total of 5.31% of the dividends distributed during the fiscal year was derived from interest on U.S. Government securities which is generally exempt from state income tax.
Annual Report
Board Approval of Investment Advisory Contracts and Management Fees
VIP Balanced Portfolio
Each year, the Board of Trustees, including the Independent Trustees (together, the Board), votes on the renewal of the management contract and sub-advisory agreements (together, the Advisory Contracts) for the fund. The Board, assisted by the advice of fund counsel and Independent Trustees' counsel, requests and considers a broad range of information relevant to the renewal of the Advisory Contracts throughout the year.
The Board meets regularly and considers at each of its meetings factors that are relevant to its annual consideration of the renewal of the fund's Advisory Contracts, including the services and support provided to the fund and its shareholders. The Board has established various standing committees, each composed of Independent Trustees with varying backgrounds, to which the Board has assigned specific subject matter responsibilities in order to enhance effective decision-making by the Board. The Board, acting directly and through its Committees, requests and receives information concerning the annual consideration of the renewal of the fund's Advisory Contracts. The Board also meets as needed to consider matters specifically related to the Board's annual consideration of the renewal of Advisory Contracts. Members of the Board may also meet with trustees of other Fidelity funds through ad hoc joint committees to discuss certain matters relevant to the Fidelity funds.
At its July 2011 meeting, the Board of Trustees, including the Independent Trustees, unanimously determined to renew the fund's Advisory Contracts. In reaching its determination, the Board considered all factors it believed relevant, including (i) the nature, extent, and quality of the services to be provided to the fund and its shareholders (including the investment performance of the fund); (ii) the competitiveness of the fund's management fee and total expense ratio; (iii) the total costs of the services to be provided by and the profits to be realized by Fidelity from its relationship with the fund; (iv) the extent to which economies of scale would be realized as the fund grows; and (v) whether fee levels reflect these economies of scale, if any, for the benefit of fund shareholders.
In considering whether to renew the Advisory Contracts for the fund, the Board reached a determination, with the assistance of fund counsel and Independent Trustees' counsel and through the exercise of its business judgment, that the renewal of the Advisory Contracts is in the best interests of the fund and its shareholders and that the compensation payable under the Advisory Contracts is fair and reasonable. The Board's decision to renew the Advisory Contracts was not based on any single factor, but rather was based on a comprehensive consideration of all the information provided to the Board at its meetings throughout the year. The Board, in reaching its determination to renew the Advisory Contracts, is aware that shareholders in the fund have a broad range of investment choices available to them, including a wide choice among mutual funds offered by Fidelity's competitors, and that the fund's shareholders, who have the opportunity to review and weigh the disclosure provided by the fund in its prospectus and other public disclosures, have chosen to invest in this fund, managed by Fidelity.
Nature, Extent, and Quality of Services Provided. The Board considered the staffing within the investment adviser, FMR, and the sub-advisers (together, the Investment Advisers), including the backgrounds of the fund's investment personnel and the fund's investment objective and discipline. The Independent Trustees also had discussions with senior management of Fidelity's investment operations and investment groups. The Board considered the structure of the portfolio manager compensation program and whether this structure provides appropriate incentives to act in the best interests of the fund.
Resources Dedicated to Investment Management and Support Services. The Board and the Fund Oversight Research Committees reviewed the general qualifications and capabilities of the Investment Advisers' investment staff, including its size, education, experience, and resources, as well as the Investment Advisers' approach to recruiting, training, managing, and compensating investment personnel. The Board also noted that FMR has devoted increased resources to non-U.S. offices. The Board noted that Fidelity's analysts have extensive resources, tools and capabilities which allow them to conduct sophisticated quantitative and fundamental analysis, as well as credit analysis of issuers, counterparties and enhancers. The Board also believes that Fidelity's investment professionals have sufficient access to global information and data so as to provide competitive investment results over time, and that those professionals also have access to sophisticated tools which permit them to assess portfolio construction and risk and performance attribution characteristics continuously, as well as to transmit new information and research conclusions rapidly around the world. Additionally, in their deliberations, the Board considered the Investment Advisers' trading capabilities and resources which are an integral part of the investment management process.
Shareholder and Administrative Services. The Board considered (i) the nature, extent, quality, and cost of advisory, administrative, and shareholder services performed by the Investment Advisers and their affiliates under the Advisory Contracts and under separate agreements covering transfer agency, pricing and bookkeeping, and securities lending services for the fund; (ii) the nature and extent of the investment adviser's supervision of third party service providers, principally custodians and subcustodians; and (iii) the resources devoted to, and the record of compliance with, the fund's compliance policies and procedures. The Board also reviewed the allocation of fund brokerage, including allocations to brokers affiliated with the Investment Advisers, the use of brokerage commissions to pay fund expenses, and the use of "soft" commission dollars to pay for research services.
The Board noted that the growth of fund assets over time across the complex allows Fidelity to reinvest in the development of services designed to enhance the value or convenience of the Fidelity funds as investment vehicles. These services include 24-hour access to account information and market information through telephone representatives and over the Internet, investor education materials and asset allocation tools, and the expanded availability of Fidelity Investor Centers, with 35 new branches opening since 2010.
Annual Report
Investment in a Large Fund Family. The Board considered the benefits to shareholders of investing in a Fidelity fund, including the benefits of investing in a fund that is part of a large family of funds offering a variety of investment disciplines and providing a large variety of mutual fund investor services. The Board noted that Fidelity had taken, or had made recommendations that resulted in the Fidelity funds taking, a number of actions over the previous year that benefited particular funds, including (i) continuing to dedicate additional resources to investment research and support of the senior management team that oversees asset management; (ii) rationalizing product lines through the mergers of six funds into other funds; (iii) continuing to migrate the Freedom Funds to dedicated lower cost underlying funds; (iv) obtaining shareholder approval to broaden the investment strategies for Fidelity Consumer Finance Portfolio, Fidelity Emerging Asia Fund, and Fidelity Environment and Alternative Energy Portfolio; (v) contractually agreeing to reduce the management fees and impose other expense limitations on Spartan 500 Index Fund and U.S. Bond Index Fund in connection with launching new institutional classes of these funds; (vi) changing the name, primary and supplemental benchmarks, and investment policies of Fidelity Global Strategies Fund to support the fund's flexible investment mandate and global orientation; and (vii) reducing the transfer agency account fee rates on certain accounts.
Investment Performance. The Board considered whether the fund has operated in accordance with its investment objective, as well as its record of compliance with its investment restrictions. It also reviewed the fund's absolute investment performance for each class, as well as the fund's relative investment performance for each class measured over multiple periods against (i) a proprietary custom index, and (ii) a peer group of mutual funds deemed appropriate by Fidelity and reviewed by the Board. The following charts considered by the Board show, over the one-, three-, and five-year periods ended December 31, 2010, the cumulative total returns of Initial Class and Service Class 2 of the fund, the cumulative total returns of a proprietary custom index ("benchmark"), and a range of cumulative total returns of a peer group of mutual funds identified by Lipper Inc. as having an investment objective similar to that of the fund. The returns of Initial Class and Service Class 2 show the performance of the highest and lowest performing classes, respectively (based on five-year performance). The box within each chart shows the 25th percentile return (bottom of box) and the 75th percentile return (top of box) of the peer group. Returns shown above the box are in the first quartile and returns shown below the box are in the fourth quartile. The percentage beaten numbers noted below each chart correspond to the percentile box and represent the percentage of funds in the peer group whose performance was equal to or lower than that of the class indicated. The fund's proprietary custom index is an index developed by FMR that represents the performance of the fund's general investment categories in both equity and bond securities.
VIP Balanced Portfolio
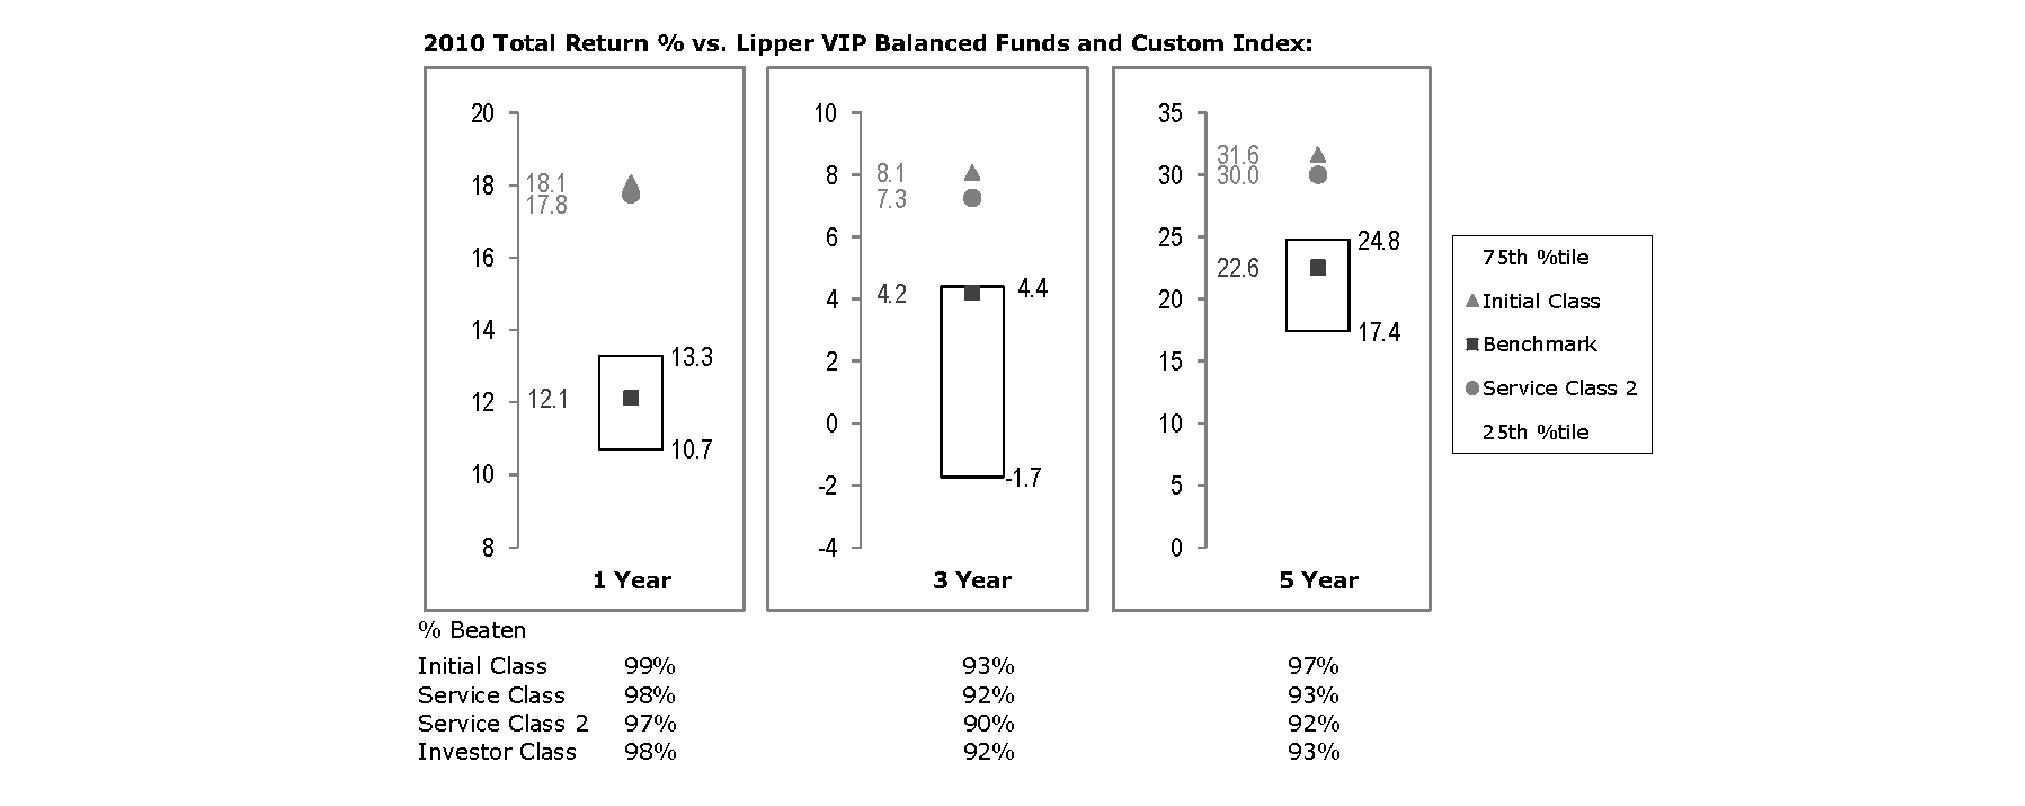
The Board reviewed the fund's relative investment performance against its peer group and noted that the performance of Initial Class of the fund was in the first quartile for all the periods shown. The Board also noted that the investment performance of Initial Class of the fund compared favorably to its benchmark for all the periods shown. The Board considered that the variations in performance among the fund's classes reflect the variations in class expenses, which result in lower performance for higher expense classes. The Board also reviewed the fund's performance since inception as well as performance in the current year.
Based on its review, the Board concluded that the nature, extent, and quality of services provided to the fund under the Advisory Contracts should benefit the fund's shareholders.
Competitiveness of Management Fee and Total Expense Ratio. The Board considered the fund's management fee and total expense ratio compared to "mapped groups" of competitive funds and classes. Fidelity creates "mapped groups" by combining similar Lipper investment objective categories that have comparable management fee characteristics. Combining Lipper investment objective categories aids the Board's management fee and total expense ratio comparisons by broadening the competitive group used for comparison and by reducing the number of universes to which various Fidelity funds are compared.
Annual Report
Board Approval of Investment Advisory Contracts and Management Fees - continued
Management Fee. The Board considered two proprietary management fee comparisons for the 12-month periods shown in the chart below. The group of Lipper funds used by the Board for management fee comparisons is referred to below as the "Total Mapped Group." The Total Mapped Group is broader than the Lipper peer group used by the Board for performance comparisons because the Total Mapped Group combines several Lipper investment objective categories while the Lipper peer group does not. The Total Mapped Group comparison focuses on a fund's standing relative to the total universe of comparable funds available to investors in terms of gross management fees before expense reimbursements or caps. "TMG %" represents the percentage of funds in the Total Mapped Group that had management fees that were lower than the fund's. For example, a TMG % of 7% means that 93% of the funds in the Total Mapped Group had higher management fees than the fund. The "Asset-Size Peer Group" (ASPG) comparison focuses on a fund's standing relative to non-Fidelity funds similar in size to the fund within the Total Mapped Group. The ASPG represents at least 15% of the funds in the Total Mapped Group with comparable asset size and management fee characteristics, subject to a minimum of 50 funds (or all funds in the Total Mapped Group if fewer than 50). Additional information, such as the ASPG quartile in which the fund's management fee ranked, is also included in the chart and considered by the Board.
VIP Balanced Portfolio
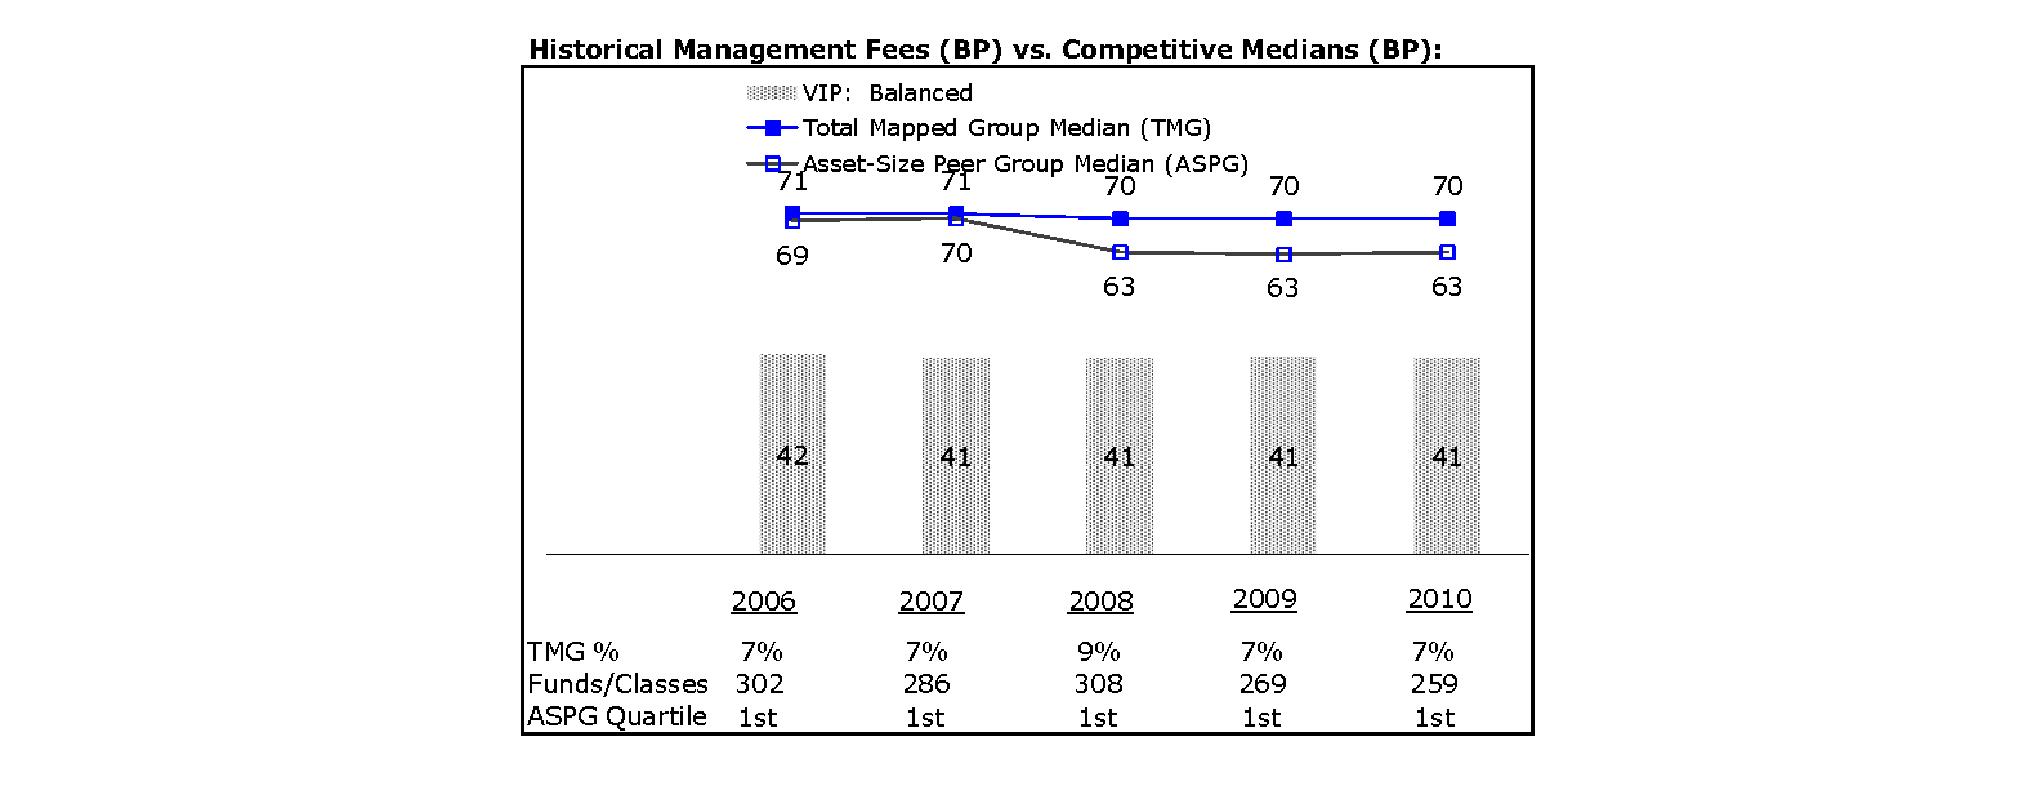
The Board noted that the fund's management fee ranked below the median of its Total Mapped Group and below the median of its ASPG for 2010.
Based on its review, the Board concluded that the fund's management fee is fair and reasonable in light of the services that the fund receives and the other factors considered.
Total Expense Ratio. In its review of each class's total expense ratio, the Board considered the fund's management fee as well as other fund or class expenses, as applicable, such as transfer agent fees, pricing and bookkeeping fees, fund-paid 12b-1 fees, and custodial, legal, and audit fees. The Board also noted the effects of any waivers and reimbursements on fees and expenses. As part of its review, the Board also considered the current and historical total expense ratios of each class of the fund compared to competitive fund median expenses. Each class of the fund is compared to those funds and classes in the Total Mapped Group (used by the Board for management fee comparisons) that have a similar sales load structure.
Fidelity® Variable Insurance Products:
Mid Cap Portfolio
Annual Report
December 31, 2011
Contents
Performance | (Click Here) | How the fund has done over time. |
Management's Discussion of Fund Performance | (Click Here) | The Portfolio Manager's review of fundperformance and strategy. |
Shareholder Expense Example | (Click Here) | An example of shareholder expenses. |
Investment Changes | (Click Here) | A summary of major shifts in the fund's investments over the past six months. |
Investments | (Click Here) | A complete list of the fund's investments with their market values. |
Financial Statements | (Click Here) | Statements of assets and liabilities, operations, and changes in net assets, as well as financial highlights. |
Notes | (Click Here) | Notes to the financial statements. |
Report of Independent Registered Public Accounting Firm | (Click Here) | |
Trustees and Officers | (Click Here) | |
Distributions | (Click Here) | |
Board Approval of Investment Advisory Contracts and Management Fees | (Click Here) | |
To view a fund's proxy voting guidelines and proxy voting record for the 12-month period ended June 30, visit http://www.fidelity.com/proxyvotingresults or visit the Securities and Exchange Commission's (SEC) web site at http://www.sec.gov. You may also call 1-877-208-0098 to request a free copy of the proxy voting guidelines.
Fidelity Variable Insurance Products are separate account options which are purchased through a variable insurance contract.
Standard & Poor's, S&P and S&P 500 are registered service marks of The McGraw-Hill Companies, Inc. and have been licensed for use by Fidelity Distributors Corporation.
Other third party marks appearing herein are the property of their respective owners.
All other marks appearing herein are registered or unregistered trademarks or service marks of FMR LLC or an affiliated company.
This report and the financial statements contained herein are submitted for the general information of the shareholders of the fund. This report is not authorized for distribution to prospective investors in the fund unless preceded or accompanied by an effective prospectus.
A fund files its complete schedule of portfolio holdings with the SEC for the first and third quarters of each fiscal year on Form N-Q. Forms N-Q are available on the SEC's web site at http://www.sec.gov. A fund's Forms N-Q may be reviewed and copied at the SEC's Public Reference Room in Washington, DC. Information regarding the operation of the SEC's Public Reference Room may be obtained by calling 1-800-SEC-0330. For a complete list of a fund's portfolio holdings, view the most recent holdings listing, semiannual report, or annual report on Fidelity's web site at http://www.fidelity.com, http://www.advisor.fidelity.com, or http://www.401k.com, as applicable.
NOT FDIC INSURED • MAY LOSE VALUE • NO BANK GUARANTEE
Neither the fund nor Fidelity Distributors Corporation is a bank.
Annual Report
Average annual total return reflects the change in the value of an investment, assuming reinvestment of the class' distributions from dividend income and capital gains (the profits earned upon the sale of securities that have grown in value, if any) and assuming a constant rate of performance each year. During periods of reimbursement by Fidelity, a fund's total return will be greater than it would be had the reimbursement not occurred. Performance numbers are net of all underlying fund operating expenses, but do not include any insurance charges imposed by your insurance company's separate account. If performance information included the effect of these additional charges, the total returns would have been lower. How a fund did yesterday is no guarantee of how it will do tomorrow.
Average Annual Total Returns
Periods ended December 31, 2011 | Past 1
year | Past 5
years | Past 10
years |
VIP Mid Cap Portfolio - Initial Class | -10.61% | 2.47% | 8.93% |
VIP Mid Cap Portfolio - Service Class | -10.72% | 2.37% | 8.82% |
VIP Mid Cap Portfolio - Service Class 2 | -10.85% | 2.22% | 8.66% |
VIP Mid Cap Portfolio - Investor Class A | -10.70% | 2.37% | 8.86% |
A The initial offering of Investor Class shares took place on July 21, 2005. Returns prior to July 21, 2005 are those of Initial Class. Had Investor Class's transfer agent fee been reflected, returns prior to July 21, 2005 would have been lower.
$10,000 Over 10 Years
Let's say hypothetically that $10,000 was invested in VIP Mid Cap Portfolio - Initial Class on December 31, 2001. The chart shows how the value of your investment would have changed, and also shows how the S&P MidCap 400® Index performed over the same period.
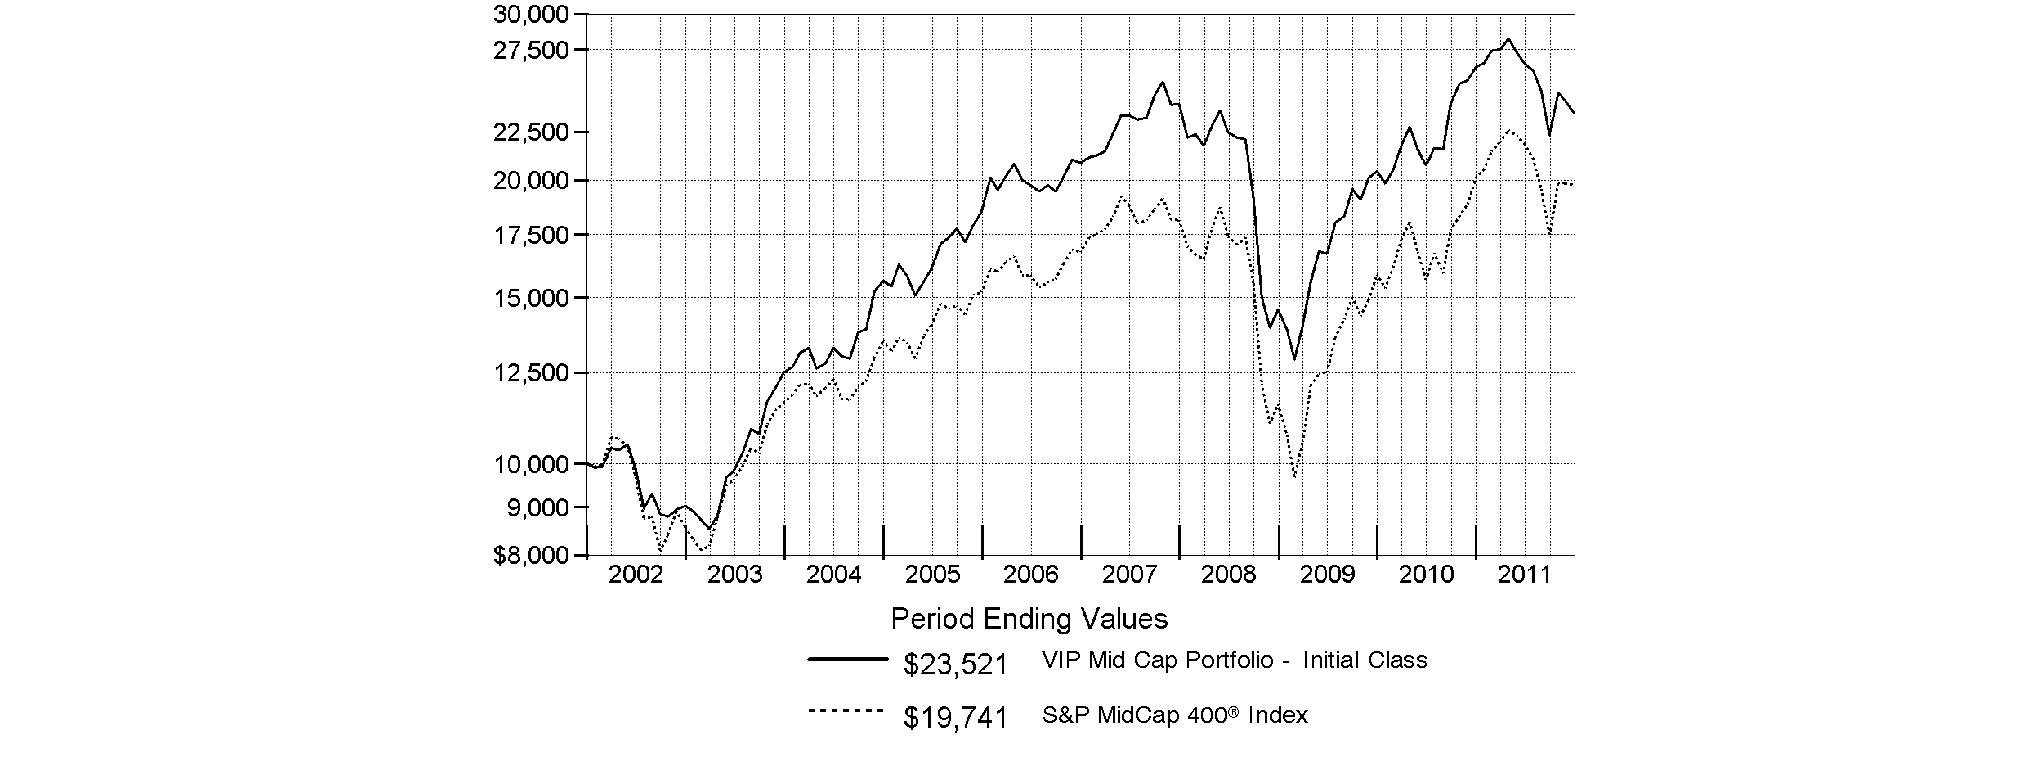
Annual Report
Market Recap: Extreme market volatility took center stage during the 12 months ending December 31, 2011, stealing the spotlight from signs of progress in the global economy. Early in the year, aggressive monetary stimulus by the U.S. federal government, improving credit-market conditions and solid corporate earnings buoyed most major asset classes. As the period progressed, however, fresh worries about sovereign debt in Europe, inflation in China, gridlock over raising the debt ceiling in the U.S. - along with Standard & Poor's early-August downgrade of the nation's long-term sovereign credit rating - and a dimmed outlook for global growth punctured investor confidence and ignited market instability. Domestic equities, as measured by the broad-based S&P 500® Index, gained 2.11%, easily outpacing the 13.61% decline of MSCI® ACWI® (All Country World Index) ex USA Index, a proxy for foreign stocks. Within the MSCI index, emerging markets declined the most (-18%), with investments here generally held back by a stronger U.S. dollar. The U.K. (-3%) fared better than the rest of Europe (-15%), which was the second-worst-performing index component. Bolstered by periodic flights to quality, U.S. investment-grade bonds posted a 7.84% advance, as reflected by the Barclays Capital® U.S. Aggregate Bond Index, outperforming the 4.37% gain of high-yield securities, as represented by The BofA Merrill LynchSM US High Yield Constrained Index. Hampered by financial woes in Europe, the sovereign debt of major developed markets outside the U.S. rose 4.86%, according to the Citigroup® Non-USD Group-of-Seven (G7) Equal Weighted Index, while the JPMorgan Emerging Markets Bond Index Global (EMBI Global) advanced 8.46%, despite the currency head wind.
Comments from Thomas Allen, Portfolio Manager of VIP Mid Cap Portfolio: For the year, the fund's share classes finished well behind the -1.73% return of the S&P MidCap 400® Index. (For specific portfolio results, please refer to the performance section of this report.) Versus the index, information technology detracted the most from performance - particularly China-based Longtop Financial Technologies, which allegedly issued fraudulent financial statements, causing the stock to stop trading in May for several months. I sold Longtop during the period. Elsewhere, the fund suffered from unfavorable stock picking in financials, materials and industrials as well as from a negligible average allocation to utilities, the benchmark's second-best-performing sector. Other notable detractors were toy maker Hasbro and Corning, a supplier of glass substrates. Conversely, relative performance was aided the most by stock picking in health care, positioning in the retail segment of consumer discretionary and a sizable average allocation to cash. The largest individual contributor was Netflix, a provider of mail-order DVDs and streaming Internet entertainment. I sold the stock for a healthy profit during the period. Also lifting fund performance were Cerner, one of the key enablers of digitizing health care records, and Ross Stores, an off-price retailer of apparel and home furnishings. All of the stocks I've highlighted were out-of-index positions.
The views expressed above reflect those of the portfolio manager(s) only through the end of the period as stated on the cover of this report and do not necessarily represent the views of Fidelity or any other person in the Fidelity organization. Any such views are subject to change at any time based upon market or other conditions and Fidelity disclaims any responsibility to update such views. These views may not be relied on as investment advice and, because investment decisions for a Fidelity fund are based on numerous factors, may not be relied on as an indication of trading intent on behalf of any Fidelity fund.
Annual Report
As a shareholder of the Fund, you incur two types of costs: (1) transaction costs, and (2) ongoing costs, including management fees, distribution and/or service (12b-1) fees and other Fund expenses. This Example is intended to help you understand your ongoing costs (in dollars) of investing in the Fund and to compare these costs with the ongoing costs of investing in other mutual funds.
The Example is based on an investment of $1,000 invested at the beginning of the period and held for the entire period (July 1, 2011 to December 31, 2011).
Actual Expenses
The first line of the accompanying table for each class of the Fund provides information about actual account values and actual expenses. You may use the information in this line, together with the amount you invested, to estimate the expenses that you paid over the period. Simply divide your account value by $1,000.00 (for example, an $8,600 account value divided by $1,000.00 = 8.6), then multiply the result by the number in the first line for a class of the Fund under the heading entitled "Expenses Paid During Period" to estimate the expenses you paid on your account during this period. The estimate of expenses does not include any fees or other expenses of any variable annuity or variable life insurance product. If they were, the estimate of expenses you paid during the period would be higher, and your ending account value would be lower. In addition, the Fund, as a shareholder in the underlying Fidelity Central Funds, will indirectly bear its pro-rata share of the fees and expenses incurred by the underlying Fidelity Central Funds. These fees and expenses are not included in the Fund's annualized expense ratio used to calculate the expense estimate in the table below.
Hypothetical Example for Comparison Purposes
The second line of the accompanying table for each class of the Fund provides information about hypothetical account values and hypothetical expenses based on a Class' actual expense ratio and an assumed rate of return of 5% per year before expenses, which is not the Class' actual return. The hypothetical account values and expenses may not be used to estimate the actual ending account balance or expenses you paid for the period. You may use this information to compare the ongoing costs of investing in the Fund and other funds. To do so, compare this 5% hypothetical example with the 5% hypothetical examples that appear in the shareholder reports of the other funds. The estimate of expenses does not include any fees or other expenses of any variable annuity or variable life insurance product. If they were, the estimate of expenses you paid during the period would be higher, and your ending account value would be lower. In addition, the Fund, as a shareholder in the underlying Fidelity Central Funds, will indirectly bear its pro-rata share of the fees and expenses incurred by the underlying Fidelity Central Funds. These fees and expenses are not included in the Fund's annualized expense ratio used to calculate the expense estimate in the table below.
Please note that the expenses shown in the table are meant to highlight your ongoing costs only and do not reflect any transaction costs. Therefore, the second line of the table is useful in comparing ongoing costs only, and will not help you determine the relative total costs of owning different funds.
| Annualized
Expense Ratio | Beginning
Account Value
July 1, 2011 | Ending
Account Value
December 31, 2011 | Expenses Paid
During Period*
July 1, 2011 to
December 31, 2011 |
Initial Class | .66% | | | |
Actual | | $ 1,000.00 | $ 885.50 | $ 3.14 |
HypotheticalA | | $ 1,000.00 | $ 1,021.88 | $ 3.36 |
Service Class | .76% | | | |
Actual | | $ 1,000.00 | $ 884.90 | $ 3.61 |
HypotheticalA | | $ 1,000.00 | $ 1,021.37 | $ 3.87 |
Service Class 2 | .91% | | | |
Actual | | $ 1,000.00 | $ 884.30 | $ 4.32 |
HypotheticalA | | $ 1,000.00 | $ 1,020.62 | $ 4.63 |
Investor Class | .74% | | | |
Actual | | $ 1,000.00 | $ 885.20 | $ 3.52 |
HypotheticalA | | $ 1,000.00 | $ 1,021.48 | $ 3.77 |
A 5% return per year before expenses
* Expenses are equal to each Class' annualized expense ratio, multiplied by the average account value over the period, multiplied by 184/365 (to reflect the one-half year period).
Annual Report
Investment Changes (Unaudited)
Top Ten Stocks as of December 31, 2011 |
| % of fund's
net assets | % of fund's net assets
6 months ago |
Advance Auto Parts, Inc. | 6.5 | 4.7 |
Allscripts-Misys Healthcare Solutions, Inc. | 3.0 | 2.3 |
Reinsurance Group of America, Inc. | 2.4 | 2.5 |
Applied Materials, Inc. | 2.2 | 2.2 |
Intuit, Inc. | 2.2 | 1.6 |
MasterCard, Inc. Class A | 2.1 | 1.1 |
Hasbro, Inc. | 1.9 | 2.2 |
Vertex Pharmaceuticals, Inc. | 1.7 | 2.1 |
Ross Stores, Inc. | 1.7 | 1.2 |
eBay, Inc. | 1.7 | 1.8 |
| 25.4 | |
Top Five Market Sectors as of December 31, 2011 |
| % of fund's
net assets | % of fund's net assets
6 months ago |
Information Technology | 24.9 | 22.4 |
Consumer Discretionary | 19.3 | 16.9 |
Health Care | 17.2 | 16.2 |
Financials | 10.3 | 9.8 |
Industrials | 7.7 | 3.7 |
Asset Allocation (% of fund's net assets) |
As of December 31, 2011 * | As of June 30, 2011 ** |
 | Stocks 95.7% | | | Stocks 86.6% | |
 | Short-Term
Investments and
Net Other Assets 4.3% | | | Short-Term
Investments and
Net Other Assets 13.4% | |
 | Other Investments 0.0%† | | | Other Investments 0.0%† | |
* Foreign investments | 21.6% | | ** Foreign investments | 25.0% | |
† Amount represents less than 0.1% | | | |

Annual Report
Investments December 31, 2011
Showing Percentage of Net Assets
Common Stocks - 95.7% |
| Shares | | Value |
CONSUMER DISCRETIONARY - 19.3% |
Auto Components - 0.9% |
Autoliv, Inc. | 155,000 | | $ 8,290,950 |
BorgWarner, Inc. (a) | 145,500 | | 9,274,170 |
Exide Industries Ltd. | 7,881,315 | | 15,616,941 |
Fuel Systems Solutions, Inc. (a)(d) | 223,135 | | 3,679,496 |
Gentex Corp. | 680,255 | | 20,128,745 |
New Focus Auto Tech Holdings Ltd. (a) | 5,687,675 | | 1,208,336 |
TRW Automotive Holdings Corp. (a) | 118,300 | | 3,856,580 |
| | 62,055,218 |
Automobiles - 0.1% |
Bajaj Auto Ltd. | 120,000 | | 3,602,150 |
Distributors - 0.0% |
LKQ Corp. (a) | 100 | | 3,008 |
Diversified Consumer Services - 0.9% |
American Public Education, Inc. (a) | 10,900 | | 471,752 |
Anhanguera Educacional Participacoes SA | 180,000 | | 1,941,821 |
DeVry, Inc. | 112,459 | | 4,325,173 |
Grand Canyon Education, Inc. (a) | 1,852,619 | | 29,567,799 |
K12, Inc. (a)(d) | 187,456 | | 3,362,961 |
MegaStudy Co. Ltd. | 113,705 | | 10,763,347 |
Weight Watchers International, Inc. | 241,910 | | 13,307,469 |
| | 63,740,322 |
Hotels, Restaurants & Leisure - 1.2% |
Jubilant Foodworks Ltd. (a) | 1,853,751 | | 26,378,756 |
Papa John's International, Inc. (a) | 400 | | 15,072 |
Starbucks Corp. | 1,064,987 | | 49,000,052 |
Starwood Hotels & Resorts Worldwide, Inc. | 82,792 | | 3,971,532 |
WMS Industries, Inc. (a) | 152,400 | | 3,127,248 |
| | 82,492,660 |
Household Durables - 0.0% |
La-Z-Boy, Inc. (a) | 100 | | 1,190 |
Woongjin Coway Co. Ltd. | 79,480 | | 2,503,307 |
| | 2,504,497 |
Internet & Catalog Retail - 0.3% |
ASOS PLC (a) | 265,765 | | 5,101,873 |
Blue Nile, Inc. (a) | 100 | | 4,088 |
Start Today Co. Ltd. | 674,600 | | 15,785,807 |
| | 20,891,768 |
Leisure Equipment & Products - 2.1% |
Hasbro, Inc. | 4,131,266 | | 131,746,073 |
Polaris Industries, Inc. | 155,445 | | 8,701,811 |
| | 140,447,884 |
Media - 3.1% |
AMC Networks, Inc. Class A | 189,027 | | 7,103,635 |
Arbitron, Inc. | 148,767 | | 5,119,072 |
CyberAgent, Inc. | 3,975 | | 12,916,878 |
Discovery Communications, Inc. (a) | 1,185,898 | | 48,586,241 |
Dish TV India Ltd. (a) | 100 | | 111 |
|
| Shares | | Value |
E.W. Scripps Co. Class A (a) | 33 | | $ 264 |
Ipsos SA | 40,110 | | 1,139,609 |
Pandora Media, Inc. | 3,100 | | 31,031 |
Pearson PLC | 100 | | 1,877 |
Pearson PLC sponsored ADR | 100 | | 1,887 |
Proto Corp. | 24,100 | | 772,177 |
Sun TV Ltd. | 11,699,864 | | 60,524,148 |
Time Warner, Inc. | 2,144,948 | | 77,518,421 |
Value Line, Inc. (d) | 44,392 | | 456,350 |
| | 214,171,701 |
Multiline Retail - 0.0% |
Marisa Lojas SA | 1,700 | | 15,602 |
Mothercare PLC (d) | 572,009 | | 1,476,991 |
| | 1,492,593 |
Specialty Retail - 10.4% |
Advance Auto Parts, Inc. (e) | 6,420,552 | | 447,063,034 |
AutoZone, Inc. (a) | 39,800 | | 12,933,806 |
Luk Fook Holdings International Ltd. | 1,487,000 | | 5,188,590 |
Lumber Liquidators Holdings, Inc. (a) | 100 | | 1,766 |
O'Reilly Automotive, Inc. (a) | 323,272 | | 25,845,596 |
Ross Stores, Inc. | 2,431,756 | | 115,581,363 |
rue21, Inc. (a)(d) | 670,093 | | 14,474,009 |
Sally Beauty Holdings, Inc. (a) | 2,994,576 | | 63,275,391 |
TJX Companies, Inc. | 426,327 | | 27,519,408 |
Tsutsumi Jewelry Co. Ltd. | 97,500 | | 2,305,593 |
| | 714,188,556 |
Textiles, Apparel & Luxury Goods - 0.3% |
Daphne International Holdings Ltd. | 13,918,000 | | 15,501,082 |
Shenzhou International Group Holdings Ltd. | 3,000 | | 4,071 |
Warnaco Group, Inc. (a) | 82,358 | | 4,121,194 |
| | 19,626,347 |
TOTAL CONSUMER DISCRETIONARY | | 1,325,216,704 |
CONSUMER STAPLES - 2.8% |
Beverages - 0.7% |
Carlsberg A/S Series B | 147,200 | | 10,381,180 |
Molson Coors Brewing Co. Class B | 785,727 | | 34,210,554 |
| | 44,591,734 |
Food & Staples Retailing - 0.3% |
Breadtalk Group Ltd. | 1,200 | | 500 |
Circle K Sunkus Co. Ltd. | 305,800 | | 5,065,874 |
Drogasil SA | 1,094,800 | | 7,621,058 |
Heng Tai Consumables Group Ltd. | 13,180,821 | | 678,846 |
Safeway, Inc. | 461,492 | | 9,709,792 |
| | 23,076,070 |
Food Products - 1.5% |
Biostime International Holdings Ltd. | 200,000 | | 352,793 |
Britannia Industries Ltd. | 208,920 | | 1,767,830 |
Corn Products International, Inc. | 606,822 | | 31,912,769 |
Common Stocks - continued |
| Shares | | Value |
CONSUMER STAPLES - continued |
Food Products - continued |
Orion Corp. | 2,799 | | $ 1,633,081 |
Rocky Mountain Chocolate Factory, Inc. | 105 | | 897 |
Smart Balance, Inc. (a) | 100 | | 536 |
SunOpta, Inc. (a) | 1,678,431 | | 8,090,041 |
Want Want China Holdings Ltd. | 60,757,600 | | 60,627,739 |
| | 104,385,686 |
Household Products - 0.1% |
Jyothy Laboratories Ltd. | 326,230 | | 992,566 |
Unicharm Corp. | 171,100 | | 8,436,621 |
| | 9,429,187 |
Personal Products - 0.2% |
Concern Kalina OJSC: | | | |
GDR (f) | 21,643 | | 2,728,561 |
sponsored ADR | 76,800 | | 9,682,276 |
| | 12,410,837 |
TOTAL CONSUMER STAPLES | | 193,893,514 |
ENERGY - 6.8% |
Energy Equipment & Services - 5.4% |
Atwood Oceanics, Inc. (a) | 1,302,353 | | 51,820,626 |
Carbo Ceramics, Inc. (d) | 72,300 | | 8,916,759 |
Dresser-Rand Group, Inc. (a) | 808,204 | | 40,337,462 |
Ensco International Ltd. ADR | 1,122,803 | | 52,681,917 |
FMC Technologies, Inc. (a) | 255,700 | | 13,355,211 |
Helix Energy Solutions Group, Inc. (a) | 3,753,770 | | 59,309,566 |
McDermott International, Inc. (a) | 178,800 | | 2,057,988 |
Nabors Industries Ltd. (a) | 3,272,246 | | 56,740,746 |
Oceaneering International, Inc. | 441,454 | | 20,364,273 |
Parker Drilling Co. (a) | 2,751,413 | | 19,727,631 |
Patterson-UTI Energy, Inc. | 1,163,827 | | 23,253,263 |
Unit Corp. (a) | 515,537 | | 23,920,917 |
| | 372,486,359 |
Oil, Gas & Consumable Fuels - 1.4% |
Apache Corp. | 229,415 | | 20,780,411 |
Peabody Energy Corp. | 226,975 | | 7,515,142 |
Peyto Exploration & Development Corp. (d) | 201,600 | | 4,828,185 |
Pioneer Natural Resources Co. | 183,778 | | 16,444,455 |
Plains Exploration & Production Co. (a) | 4,800 | | 176,256 |
QEP Resources, Inc. | 1,141,520 | | 33,446,536 |
Talisman Energy, Inc. | 996,100 | | 12,695,776 |
Voyager Oil & Gas, Inc. warrants 2/4/16 (a) | 908,661 | | 990,870 |
| | 96,877,631 |
TOTAL ENERGY | | 469,363,990 |
|
| Shares | | Value |
FINANCIALS - 10.3% |
Capital Markets - 3.6% |
Charles Schwab Corp. | 621,704 | | $ 7,000,387 |
Invesco Ltd. | 3,997,726 | | 80,314,315 |
Marusan Securities Co. Ltd. | 2,600,900 | | 7,975,215 |
SEI Investments Co. | 1,388,018 | | 24,082,112 |
State Street Corp. | 945,700 | | 38,121,167 |
TD Ameritrade Holding Corp. | 5,025,300 | | 78,645,945 |
Waddell & Reed Financial, Inc. Class A | 340,320 | | 8,429,726 |
| | 244,568,867 |
Commercial Banks - 0.4% |
Bank of Baroda | 525,785 | | 6,669,105 |
Union Bank of India | 7,576,295 | | 24,273,011 |
| | 30,942,116 |
Consumer Finance - 0.5% |
Discover Financial Services | 1,312,070 | | 31,489,680 |
Diversified Financial Services - 0.8% |
CME Group, Inc. | 176,687 | | 43,053,321 |
CRISIL Ltd. | 823,245 | | 13,756,724 |
| | 56,810,045 |
Insurance - 4.3% |
Admiral Group PLC | 98,375 | | 1,301,780 |
AFLAC, Inc. | 84,600 | | 3,659,796 |
Brasil Insurance Participacoes e Administracao SA | 660,000 | | 6,021,898 |
Lincoln National Corp. | 445,300 | | 8,647,726 |
Old Republic International Corp. | 3,201,274 | | 29,675,810 |
Progressive Corp. | 1,580,738 | | 30,840,198 |
Protective Life Corp. | 2,007,169 | | 45,281,733 |
Reinsurance Group of America, Inc. | 3,195,111 | | 166,944,550 |
| | 292,373,491 |
Real Estate Management & Development - 0.7% |
CBRE Group, Inc. (a) | 441,242 | | 6,715,703 |
Goldcrest Co. Ltd. | 1,005,370 | | 16,001,796 |
Iguatemi Empresa de Shopping Centers SA | 456,700 | | 8,495,718 |
Kenedix, Inc. (a) | 45,449 | | 5,911,057 |
Sobha Developers Ltd. | 115,149 | | 415,505 |
Wharf Holdings Ltd. | 2,228,000 | | 10,069,116 |
| | 47,608,895 |
TOTAL FINANCIALS | | 703,793,094 |
HEALTH CARE - 17.2% |
Biotechnology - 3.5% |
3SBio, Inc. sponsored ADR (a) | 470,862 | | 4,812,210 |
Abcam PLC | 748,700 | | 4,244,378 |
Alexion Pharmaceuticals, Inc. (a) | 995,182 | | 71,155,513 |
Ardea Biosciences, Inc. (a) | 100,866 | | 1,695,557 |
Genomic Health, Inc. (a) | 1,326,302 | | 33,674,808 |
Halozyme Therapeutics, Inc. (a) | 100 | | 951 |
ImmunoGen, Inc. (a) | 247,750 | | 2,868,945 |
Common Stocks - continued |
| Shares | | Value |
HEALTH CARE - continued |
Biotechnology - continued |
Nanosphere, Inc. (a) | 669,053 | | $ 983,508 |
Pharmacyclics, Inc. (a) | 100 | | 1,482 |
United Therapeutics Corp. (a) | 158,400 | | 7,484,400 |
Vertex Pharmaceuticals, Inc. (a) | 3,503,912 | | 116,364,918 |
| | 243,286,670 |
Health Care Equipment & Supplies - 1.8% |
C. R. Bard, Inc. | 209,771 | | 17,935,421 |
Cyberonics, Inc. (a) | 101,470 | | 3,399,245 |
Edwards Lifesciences Corp. (a) | 846,500 | | 59,847,550 |
Genmark Diagnostics, Inc. (a) | 263,700 | | 1,086,444 |
HeartWare International, Inc. CDI (a) | 100 | | 189 |
Hill-Rom Holdings, Inc. | 293,100 | | 9,874,539 |
NxStage Medical, Inc. (a) | 718,825 | | 12,780,709 |
Opto Circuits India Ltd. | 1,862,958 | | 7,003,443 |
Quidel Corp. (a)(d) | 684,919 | | 10,362,824 |
| | 122,290,364 |
Health Care Providers & Services - 3.9% |
Apollo Hospitals Enterprise Ltd. | 217,138 | | 2,314,937 |
Brookdale Senior Living, Inc. (a) | 901,350 | | 15,674,477 |
Community Health Systems, Inc. (a) | 957,468 | | 16,707,817 |
HCA Holdings, Inc. | 698,652 | | 15,391,304 |
Health Management Associates, Inc. Class A (a) | 2,186,333 | | 16,113,274 |
HMS Holdings Corp. (a) | 300 | | 9,594 |
IPC The Hospitalist Co., Inc. (a) | 199,990 | | 9,143,543 |
Laboratory Corp. of America Holdings (a) | 156,225 | | 13,430,663 |
LifePoint Hospitals, Inc. (a) | 93,874 | | 3,487,419 |
McKesson Corp. | 1,295,598 | | 100,940,040 |
Medco Health Solutions, Inc. (a) | 239,600 | | 13,393,640 |
Omnicare, Inc. | 455,908 | | 15,706,031 |
Tenet Healthcare Corp. (a) | 1,477,100 | | 7,577,523 |
Universal Health Services, Inc. Class B | 876,905 | | 34,076,528 |
| | 263,966,790 |
Health Care Technology - 5.4% |
Allscripts-Misys Healthcare Solutions, Inc. (a)(e) | 10,982,342 | | 208,005,557 |
athenahealth, Inc. (a)(d) | 1,445,604 | | 71,008,068 |
Cerner Corp. (a) | 1,317,766 | | 80,713,168 |
Computer Programs & Systems, Inc. | 122,722 | | 6,272,321 |
So-net M3, Inc. | 832 | | 3,751,108 |
| | 369,750,222 |
Life Sciences Tools & Services - 1.4% |
Agilent Technologies, Inc. (a) | 1,125,200 | | 39,303,236 |
QIAGEN NV (a)(d) | 232,312 | | 3,208,229 |
Thermo Fisher Scientific, Inc. (a) | 1,155,605 | | 51,967,557 |
| | 94,479,022 |
Pharmaceuticals - 1.2% |
Cadila Healthcare Ltd. | 336,410 | | 4,469,497 |
Cipla Ltd. | 1,638,056 | | 9,884,261 |
|
| Shares | | Value |
Genomma Lab Internacional SA de CV (a) | 500,000 | | $ 966,341 |
Hikma Pharmaceuticals PLC | 100 | | 963 |
Impax Laboratories, Inc. (a) | 1,141,748 | | 23,029,057 |
Pharmstandard OJSC unit (a) | 1,262,174 | | 17,796,653 |
Piramal Healthcare Ltd. | 674,373 | | 4,810,862 |
Questcor Pharmaceuticals, Inc. (a) | 257,801 | | 10,719,366 |
Salix Pharmaceuticals Ltd. (a) | 260,935 | | 12,485,740 |
Unichem Laboratories Ltd. | 648,295 | | 1,447,245 |
| | 85,609,985 |
TOTAL HEALTH CARE | | 1,179,383,053 |
INDUSTRIALS - 7.7% |
Air Freight & Logistics - 0.3% |
Expeditors International of Washington, Inc. | 560,807 | | 22,970,655 |
Airlines - 0.2% |
Copa Holdings SA Class A | 248,000 | | 14,550,160 |
Building Products - 0.1% |
Blue Star Ltd. | 805,293 | | 2,595,196 |
Lennox International, Inc. | 112,150 | | 3,785,063 |
| | 6,380,259 |
Commercial Services & Supplies - 1.1% |
Copart, Inc. (a) | 41 | | 1,963 |
Edenred | 991,100 | | 24,400,375 |
EnerNOC, Inc. (a)(d) | 374,610 | | 4,072,011 |
Mine Safety Appliances Co. | 152,502 | | 5,050,866 |
Republic Services, Inc. | 1,508,599 | | 41,561,902 |
The Brink's Co. | 97,600 | | 2,623,488 |
| | 77,710,605 |
Construction & Engineering - 0.4% |
AECOM Technology Corp. (a) | 794,552 | | 16,343,935 |
Fluor Corp. | 197,835 | | 9,941,209 |
| | 26,285,144 |
Electrical Equipment - 1.1% |
Acuity Brands, Inc. | 422,613 | | 22,398,489 |
AstroPower, Inc. (a) | 100 | | 0 |
Regal-Beloit Corp. | 507,400 | | 25,862,178 |
Roper Industries, Inc. | 328,700 | | 28,554,169 |
| | 76,814,836 |
Industrial Conglomerates - 0.4% |
Carlisle Companies, Inc. | 432,507 | | 19,160,060 |
Max India Ltd. (a) | 3,846,619 | | 10,604,232 |
| | 29,764,292 |
Machinery - 1.8% |
AGCO Corp. (a) | 542,319 | | 23,303,447 |
CIRCOR International, Inc. | 192,396 | | 6,793,503 |
Eaton Corp. | 135,900 | | 5,915,727 |
Fanuc Corp. | 24,600 | | 3,765,192 |
Graco, Inc. | 89,910 | | 3,676,420 |
Common Stocks - continued |
| Shares | | Value |
INDUSTRIALS - continued |
Machinery - continued |
Harsco Corp. | 435,439 | | $ 8,961,335 |
Ingersoll-Rand PLC | 242,150 | | 7,378,311 |
Kennametal, Inc. | 385,726 | | 14,086,714 |
Kitz Corp. | 575,700 | | 2,318,807 |
Nippon Thompson Co. Ltd. | 1,253,000 | | 7,277,217 |
Parker Hannifin Corp. | 359,400 | | 27,404,250 |
Snap-On, Inc. | 215,843 | | 10,925,973 |
Spirax-Sarco Engineering PLC | 100 | | 2,909 |
Uzel Makina Sanayi A/S (a) | 456,690 | | 2 |
| | 121,809,807 |
Professional Services - 1.4% |
Advisory Board Co. (a) | 100 | | 7,421 |
Corporate Executive Board Co. | 353,347 | | 13,462,521 |
Dun & Bradstreet Corp. | 23,356 | | 1,747,729 |
eClerx | 724,959 | | 9,436,159 |
en-japan, Inc. | 1,285 | | 1,302,280 |
Equifax, Inc. | 1,004,031 | | 38,896,161 |
JobStreet Corp. Bhd | 2,486,000 | | 1,748,826 |
Manpower, Inc. | 118,800 | | 4,247,100 |
Michael Page International PLC | 558,600 | | 3,026,152 |
Randstad Holding NV | 607,077 | | 17,963,399 |
| | 91,837,748 |
Road & Rail - 0.9% |
Con-way, Inc. | 560,995 | | 16,358,614 |
J.B. Hunt Transport Services, Inc. | 753,221 | | 33,947,670 |
Kansas City Southern (a) | 113,626 | | 7,727,704 |
Old Dominion Freight Lines, Inc. (a) | 150 | | 6,080 |
| | 58,040,068 |
Trading Companies & Distributors - 0.0% |
MSC Industrial Direct Co., Inc. Class A | 21,300 | | 1,524,015 |
TOTAL INDUSTRIALS | | 527,687,589 |
INFORMATION TECHNOLOGY - 24.9% |
Communications Equipment - 0.4% |
HTC Corp. | 235,250 | | 3,860,632 |
Juniper Networks, Inc. (a) | 522,900 | | 10,672,389 |
Polycom, Inc. (a) | 654,571 | | 10,669,507 |
| | 25,202,528 |
Computers & Peripherals - 0.8% |
Gemalto NV | 1,013,388 | | 49,294,792 |
Toshiba Corp. | 983,000 | | 4,023,192 |
| | 53,317,984 |
Electronic Equipment & Components - 2.7% |
Arrow Electronics, Inc. (a) | 446,700 | | 16,711,047 |
Cognex Corp. | 476,398 | | 17,050,284 |
Corning, Inc. | 936,300 | | 12,153,174 |
Digital China Holdings Ltd. (H Shares) | 20,188,300 | | 31,296,466 |
DTS, Inc. (a) | 91,512 | | 2,492,787 |
|
| Shares | | Value |
E Ink Holdings, Inc. | 1,000,000 | | $ 1,304,276 |
FEI Co. (a) | 169,654 | | 6,918,490 |
Ingenico SA | 1,343,180 | | 48,507,280 |
Itron, Inc. (a) | 1,179,966 | | 42,207,384 |
Plexus Corp. (a) | 62,278 | | 1,705,172 |
SYNNEX Corp. (a) | 100 | | 3,046 |
Vishay Intertechnology, Inc. (a) | 497,242 | | 4,470,206 |
| | 184,819,612 |
Internet Software & Services - 3.7% |
comScore, Inc. (a) | 100 | | 2,120 |
DeNA Co. Ltd. | 205,900 | | 6,177,134 |
eBay, Inc. (a) | 3,772,929 | | 114,432,937 |
Google, Inc. Class A (a) | 14,800 | | 9,559,320 |
INFO Edge India Ltd. | 70,574 | | 755,261 |
Kakaku.com, Inc. | 1,151,300 | | 42,213,586 |
TelecityGroup PLC (a) | 1,296,100 | | 13,024,354 |
ValueClick, Inc. (a) | 470,870 | | 7,670,472 |
VeriSign, Inc. | 613,997 | | 21,931,973 |
VistaPrint Ltd. (a)(d) | 755,480 | | 23,117,688 |
WebMD Health Corp. (a) | 257,010 | | 9,650,726 |
Yandex NV | 316,200 | | 6,229,140 |
| | 254,764,711 |
IT Services - 4.4% |
Cognizant Technology Solutions Corp. Class A (a) | 293,822 | | 18,895,693 |
Computer Task Group, Inc. (a) | 28,485 | | 401,069 |
Fiserv, Inc. (a) | 1,893,630 | | 111,231,826 |
Genpact Ltd. (a) | 274,000 | | 4,096,300 |
Global Payments, Inc. | 83,006 | | 3,932,824 |
MasterCard, Inc. Class A | 395,134 | | 147,313,858 |
NeuStar, Inc. Class A (a) | 537,553 | | 18,368,186 |
| | 304,239,756 |
Office Electronics - 0.7% |
Xerox Corp. | 6,247,936 | | 49,733,571 |
Semiconductors & Semiconductor Equipment - 6.7% |
Analog Devices, Inc. | 1,174,069 | | 42,008,189 |
Applied Materials, Inc. | 13,983,389 | | 149,762,096 |
Entegris, Inc. (a) | 4,085,943 | | 35,649,853 |
Epistar Corp. | 4,314,000 | | 9,159,326 |
International Rectifier Corp. (a) | 24,118 | | 468,372 |
KLA-Tencor Corp. | 861,000 | | 41,543,250 |
Kontron AG | 2,672,016 | | 17,511,183 |
Linear Technology Corp. | 231,827 | | 6,961,765 |
Marvell Technology Group Ltd. (a) | 4,839,381 | | 67,025,427 |
MIC Electronics Ltd. (a) | 1,633,475 | | 184,869 |
NVIDIA Corp. (a) | 100 | | 1,386 |
NXP Semiconductors NV (a) | 1,539,050 | | 23,655,199 |
PMC-Sierra, Inc. (a) | 6,136,058 | | 33,809,680 |
RF Micro Devices, Inc. (a) | 1,764,832 | | 9,530,093 |
Siliconware Precision Industries Co. Ltd. sponsored ADR | 4,285,673 | | 18,685,534 |
| | 455,956,222 |
Common Stocks - continued |
| Shares | | Value |
INFORMATION TECHNOLOGY - continued |
Software - 5.5% |
ACI Worldwide, Inc. (a) | 46,626 | | $ 1,335,369 |
Autodesk, Inc. (a) | 1,026,203 | | 31,124,737 |
Citrix Systems, Inc. (a) | 100 | | 6,072 |
Compuware Corp. (a) | 822,987 | | 6,847,252 |
Concur Technologies, Inc. (a) | 100 | | 5,079 |
Electronic Arts, Inc. (a) | 3,040,752 | | 62,639,491 |
Intuit, Inc. | 2,813,856 | | 147,980,687 |
Kingdee International Software Group Co. Ltd. | 9,800,800 | | 2,637,405 |
Mentor Graphics Corp. (a) | 530,723 | | 7,196,604 |
PROS Holdings, Inc. (a) | 100 | | 1,488 |
Rovi Corp. (a) | 1,480,596 | | 36,393,050 |
Royalblue Group PLC | 20,200 | | 474,683 |
Solera Holdings, Inc. | 619,636 | | 27,598,587 |
Synopsys, Inc. (a) | 669,998 | | 18,223,946 |
Take-Two Interactive Software, Inc. (a) | 109,600 | | 1,485,080 |
Temenos Group AG (a) | 65,158 | | 1,068,448 |
Ubisoft Entertainment SA (a)(e) | 4,938,303 | | 33,053,753 |
| | 378,071,731 |
TOTAL INFORMATION TECHNOLOGY | | 1,706,106,115 |
MATERIALS - 6.1% |
Chemicals - 0.6% |
Albemarle Corp. | 425,321 | | 21,908,285 |
ShengdaTech, Inc. (a) | 100 | | 3 |
Zoltek Companies, Inc. (a)(d)(e) | 2,057,286 | | 15,676,519 |
| | 37,584,807 |
Containers & Packaging - 0.2% |
Aptargroup, Inc. | 100 | | 5,217 |
Ball Corp. | 404,651 | | 14,450,087 |
| | 14,455,304 |
Metals & Mining - 5.3% |
Barrick Gold Corp. | 441,200 | | 19,993,500 |
Centerra Gold, Inc. | 294,700 | | 5,208,759 |
Goldcorp, Inc. | 626,800 | | 27,825,636 |
Harmony Gold Mining Co. Ltd. sponsored ADR | 350,000 | | 4,074,000 |
IAMGOLD Corp. | 3,602,100 | | 57,228,965 |
Kinross Gold Corp. | 5,803,261 | | 66,272,511 |
Kinross Gold Corp. warrants 9/17/14 (a) | 85,492 | | 121,724 |
Newcrest Mining Ltd. | 3,104,898 | | 93,986,629 |
Newmont Mining Corp. | 1,091,108 | | 65,477,391 |
Osisko Mining Corp. (a) | 591,100 | | 5,711,335 |
|
| Shares | | Value |
Steel Dynamics, Inc. | 463,900 | | $ 6,100,285 |
Yamana Gold, Inc. | 825,154 | | 12,169,887 |
| | 364,170,622 |
TOTAL MATERIALS | | 416,210,733 |
TELECOMMUNICATION SERVICES - 0.6% |
Wireless Telecommunication Services - 0.6% |
NII Holdings, Inc. (a) | 1,797,939 | | 38,296,101 |
UTILITIES - 0.0% |
Gas Utilities - 0.0% |
China Natural Gas, Inc. (a) | 100 | | 192 |
TOTAL COMMON STOCKS (Cost $6,079,803,427) |
6,559,951,085
|
Nonconvertible Bonds - 0.0% |
| Principal
Amount | | |
CONSUMER STAPLES - 0.0% |
Food Products - 0.0% |
Britannia Industries Ltd. 8.25% 3/22/13 (g) (Cost $135,901) | INR | 41,784 | |
136,398
|
Money Market Funds - 5.1% |
| Shares | | |
Fidelity Cash Central Fund, 0.11% (b) | 285,125,611 | | 285,125,611 |
Fidelity Securities Lending Cash Central Fund, 0.13% (b)(c) | 62,885,777 | | 62,885,777 |
TOTAL MONEY MARKET FUNDS (Cost $348,011,388) |
348,011,388
|
TOTAL INVESTMENT PORTFOLIO - 100.8% (Cost $6,427,950,716) | | 6,908,098,871 |
NET OTHER ASSETS (LIABILITIES) - (0.8)% | | (52,859,647) |
NET ASSETS - 100% | $ 6,855,239,224 |
Currency Abbreviations |
INR | - | Indian rupee |
Legend |
(a) Non-income producing |
(b) Affiliated fund that is available only to investment companies and other accounts managed by Fidelity Investments. The rate quoted is the annualized seven-day yield of the fund at period end. A complete unaudited listing of the fund's holdings as of its most recent quarter end is available upon request. In addition, each Fidelity Central Fund's financial statements, which are not covered by the Fund's Report of Independent Registered Public Accounting Firm, are available on the SEC's website or upon request. |
(c) Investment made with cash collateral received from securities on loan. |
(d) Security or a portion of the security is on loan at period end. |
(e) Affiliated company |
(f) Security exempt from registration under Rule 144A of the Securities Act of 1933. These securities may be resold in transactions exempt from registration, normally to qualified institutional buyers. At the end of the period, the value of these securities amounted to $2,728,561 or 0.0% of net assets. |
(g) Principal amount shown represents units. |
Affiliated Central Funds |
Information regarding fiscal year to date income earned by the Fund from investments in Fidelity Central Funds is as follows: |
Fund | Income earned |
Fidelity Cash Central Fund | $ 1,028,281 |
Fidelity Securities Lending Cash Central Fund | 1,220,976 |
Total | $ 2,249,257 |
Other Affiliated Issuers |
An affiliated company is a company in which the Fund has ownership of at least 5% of the voting securities. Fiscal year to date transactions with companies which are or were affiliates are as follows: |
Affiliate | Value,
beginning of
period | Purchases | Sales
Proceeds | Dividend
Income | Value,
end of
period |
Advance Auto Parts, Inc. | $ 430,593,635 | $ - | $ 5,327,739 | $ 1,556,916 | $ 447,063,034 |
Allscripts-Misys Healthcare Solutions, Inc. | 210,229,437 | 25,864,307 | 31,771,315 | - | 208,005,557 |
athenahealth, Inc. | 104,807,702 | - | 57,562,932 | - | - |
Fuel Systems Solutions, Inc. | 39,522,475 | 2,142,172 | 23,721,686 | - | - |
Parker Drilling Co. | 29,028,608 | - | 20,748,113 | - | - |
Patterson-UTI Energy, Inc. | 173,000,599 | - | 180,559,884 | 509,941 | - |
PMC-Sierra, Inc. | 116,328,477 | 2,166,091 | 51,529,462 | - | - |
Ubisoft Entertainment SA | 54,477,231 | - | 1,026,764 | - | 33,053,753 |
Zoltek Companies, Inc. | 22,136,973 | 9,710,802 | 5,102,111 | - | 15,676,519 |
Total | $ 1,180,125,137 | $ 39,883,372 | $ 377,350,006 | $ 2,066,857 | $ 703,798,863 |
Other Information |
The following is a summary of the inputs used, as of December 31, 2011, involving the Fund's assets and liabilities carried at fair value. The inputs or methodology used for valuing securities may not be an indication of the risk associated with investing in those securities. For more information on valuation inputs, and their aggregation into the levels used in the tables below, please refer to the Security Valuation section in the accompanying Notes to Financial Statements. |
Valuation Inputs at Reporting Date: |
Description | Total | Level 1 | Level 2 | Level 3 |
Investments in Securities: | | | | |
Equities: | | | | |
Consumer Discretionary | $ 1,325,216,704 | $ 1,325,214,827 | $ 1,877 | $ - |
Consumer Staples | 193,893,514 | 193,893,514 | - | - |
Energy | 469,363,990 | 468,373,120 | 990,870 | - |
Financials | 703,793,094 | 697,123,989 | 6,669,105 | - |
Health Care | 1,179,383,053 | 1,179,383,053 | - | - |
Industrials | 527,687,589 | 527,687,587 | - | 2 |
Information Technology | 1,706,106,115 | 1,706,106,115 | - | - |
Materials | 416,210,733 | 416,210,733 | - | - |
Telecommunication Services | 38,296,101 | 38,296,101 | - | - |
Utilities | 192 | - | - | 192 |
Corporate Bonds | 136,398 | - | 136,398 | - |
Money Market Funds | 348,011,388 | 348,011,388 | - | - |
Total Investments in Securities: | $ 6,908,098,871 | $ 6,900,300,427 | $ 7,798,250 | $ 194 |
The following is a reconciliation of Investments in Securities for which Level 3 inputs were used in determining value: |
Investments in Securities: | |
Beginning Balance | $ 3 |
Total Realized Gain (Loss) | - |
Total Unrealized Gain (Loss) | (360) |
Cost of Purchases | - |
Proceeds of Sales | - |
Amortization/Accretion | - |
Transfers in to Level 3 | 551 |
Transfers out of Level 3 | - |
Ending Balance | $ 194 |
The change in unrealized gain (loss) for the period attributable to Level 3 securities held at December 31, 2011 | $ (360) |
The information used in the above reconciliation represents fiscal year to date activity for any Investments in Securities identified as using Level 3 inputs at either the beginning or the end of the current fiscal period. Transfers in or out of Level 3 represent the beginning value of any Security or Instrument where a change in the pricing level occurred from the beginning to the end of the period. The cost of purchases and the proceeds of sales may include securities received or delivered through corporate actions or exchanges. Realized and unrealized gains (losses) disclosed in the reconciliation are included in Net Gain (Loss) on the Fund's Statement of Operations. |
Distribution of investments by country of issue, as a percentage of total net assets, is as follows: (Unaudited) |
United States of America | 78.4% |
Bermuda | 4.0% |
Canada | 3.3% |
India | 2.8% |
Japan | 2.1% |
France | 1.5% |
Netherlands | 1.5% |
Australia | 1.4% |
United Kingdom | 1.3% |
Cayman Islands | 1.2% |
Others (Individually Less Than 1%) | 2.5% |
| 100.0% |
See accompanying notes which are an integral part of the financial statements.
Annual Report
Statement of Assets and Liabilities
| December 31, 2011 |
| | |
Assets | | |
Investment in securities, at value (including securities loaned of $60,714,065) - See accompanying schedule: Unaffiliated issuers (cost $5,583,573,090) | $ 5,856,288,620 | |
Fidelity Central Funds (cost $348,011,388) | 348,011,388 | |
Other affiliated issuers (cost $496,366,238) | 703,798,863 | |
Total Investments (cost $6,427,950,716) | | $ 6,908,098,871 |
Cash | | 114,257 |
Foreign currency held at value (cost $563,523) | | 563,498 |
Receivable for investments sold | | 16,695,923 |
Receivable for fund shares sold | | 2,615,583 |
Dividends receivable | | 3,163,417 |
Interest receivable | | 8,571 |
Distributions receivable from Fidelity Central Funds | | 47,847 |
Prepaid expenses | | 21,974 |
Other receivables | | 271,963 |
Total assets | | 6,931,601,904 |
| | |
Liabilities | | |
Payable for investments purchased | $ 721,990 | |
Payable for fund shares redeemed | 7,832,648 | |
Accrued management fee | 3,216,068 | |
Distribution and service plan fees payable | 1,071,676 | |
Other affiliated payables | 498,255 | |
Other payables and accrued expenses | 136,266 | |
Collateral on securities loaned, at value | 62,885,777 | |
Total liabilities | | 76,362,680 |
| | |
Net Assets | | $ 6,855,239,224 |
Net Assets consist of: | | |
Paid in capital | | $ 6,440,333,657 |
Distributions in excess of net investment income | | (20,203,672) |
Accumulated undistributed net realized gain (loss) on investments and foreign currency transactions | | (45,014,823) |
Net unrealized appreciation (depreciation) on investments and assets and liabilities in foreign currencies | | 480,124,062 |
Net Assets | | $ 6,855,239,224 |
Statement of Assets and Liabilities - continued
| December 31, 2011 |
| | |
Initial Class:
Net Asset Value, offering price and redemption price per share ($1,085,842,908 ÷ 37,336,364 shares) | | $ 29.08 |
| | |
Service Class:
Net Asset Value, offering price and redemption price per share ($566,559,740 ÷ 19,581,699 shares) | | $ 28.93 |
| | |
Service Class 2:
Net Asset Value, offering price and redemption price per share ($4,888,474,637 ÷ 171,040,357 shares) | | $ 28.58 |
| | |
Investor Class:
Net Asset Value, offering price and redemption price per share ($314,361,939 ÷ 10,841,275 shares) | | $ 29.00 |
See accompanying notes which are an integral part of the financial statements.
Annual Report
Financial Statements - continued
Statement of Operations
| Year ended December 31, 2011 |
| | |
Investment Income | | |
Dividends (including $2,066,857 earned from other affiliated issuers) | | $ 66,623,174 |
Interest | | 68,287 |
Income from Fidelity Central Funds | | 2,249,257 |
Total income | | 68,940,718 |
| | |
Expenses | | |
Management fee | $ 42,857,053 | |
Transfer agent fees | 5,852,731 | |
Distribution and service plan fees | 14,110,847 | |
Accounting and security lending fees | 1,246,812 | |
Custodian fees and expenses | 602,529 | |
Independent trustees' compensation | 43,775 | |
Audit | 89,261 | |
Legal | 28,777 | |
Interest | 302 | |
Miscellaneous | 79,253 | |
Total expenses before reductions | 64,911,340 | |
Expense reductions | (860,658) | 64,050,682 |
Net investment income (loss) | | 4,890,036 |
Realized and Unrealized Gain (Loss) Net realized gain (loss) on: | | |
Investment securities: | | |
Unaffiliated issuers | 813,874,158 | |
Other affiliated issuers | 106,313,531 | |
Investment not meeting investment restrictions | 1,200,407 | |
Foreign currency transactions | (450,867) | |
Total net realized gain (loss) | | 920,937,229 |
Change in net unrealized appreciation (depreciation) on: Investment securities | (1,779,591,933) | |
Assets and liabilities in foreign currencies | (11,570) | |
Total change in net unrealized appreciation (depreciation) | | (1,779,603,503) |
Net gain (loss) | | (858,666,274) |
Net increase (decrease) in net assets resulting from operations | | $ (853,776,238) |
Statement of Changes in Net Assets
| Year ended
December 31,
2011 | Year ended
December 31,
2010 |
Increase (Decrease) in Net Assets | | |
Operations | | |
Net investment income (loss) | $ 4,890,036 | $ 15,112,664 |
Net realized gain (loss) | 920,937,229 | 619,912,988 |
Change in net unrealized appreciation (depreciation) | (1,779,603,503) | 1,148,351,385 |
Net increase (decrease) in net assets resulting from operations | (853,776,238) | 1,783,377,037 |
Distributions to shareholders from net investment income | (5,847,043) | (13,169,709) |
Distributions to shareholders from net realized gain | (13,136,802) | (23,446,281) |
Total distributions | (18,983,845) | (36,615,990) |
Share transactions - net increase (decrease) | (256,795,573) | (578,316,054) |
Total increase (decrease) in net assets | (1,129,555,656) | 1,168,444,993 |
| | |
Net Assets | | |
Beginning of period | 7,984,794,880 | 6,816,349,887 |
End of period (including distributions in excess of net investment income of $20,203,672 and undistributed net investment income of $0, respectively) | $ 6,855,239,224 | $ 7,984,794,880 |
See accompanying notes which are an integral part of the financial statements.
Annual Report
Financial Highlights - Initial Class
Years ended December 31, | 2011 | 2010 | 2009 | 2008 | 2007 |
Selected Per-Share Data | | | | | |
Net asset value, beginning of period | $ 32.69 | $ 25.54 | $ 18.43 | $ 36.16 | $ 34.77 |
Income from Investment Operations | | | | | |
Net investment income (loss) C | .08 | .11 | .12 | .14 | .21 |
Net realized and unrealized gain (loss) | (3.55) | 7.24 | 7.26 | (12.75) | 4.80 |
Total from investment operations | (3.47) | 7.35 | 7.38 | (12.61) | 5.01 |
Distributions from net investment income | (.08) | (.11) | (.15) | (.13) | (.33) |
Distributions from net realized gain | (.06) | (.09) | (.12) | (4.99) | (3.29) |
Total distributions | (.14) | (.20) | (.27) G | (5.12) | (3.62) |
Net asset value, end of period | $ 29.08 | $ 32.69 | $ 25.54 | $ 18.43 | $ 36.16 |
Total Return A, B | (10.61)% | 28.83% | 40.09% | (39.44)% | 15.63% |
Ratios to Average Net Assets D, F | | | | | |
Expenses before reductions | .66% | .66% | .68% | .68% | .67% |
Expenses net of fee waivers, if any | .66% | .66% | .68% | .68% | .67% |
Expenses net of all reductions | .65% | .66% | .68% | .67% | .66% |
Net investment income (loss) | .25% | .40% | .54% | .55% | .59% |
Supplemental Data | | | | | |
Net assets, end of period (000 omitted) | $ 1,085,843 | $ 1,372,063 | $ 1,053,796 | $ 809,243 | $ 1,532,407 |
Portfolio turnover rate E | 84% | 25% | 57% | 145% | 113% |
A Total returns do not reflect charges attributable to your insurance company's separate account. Inclusion of these charges would reduce the total returns shown.
B Total returns would have been lower if certain expenses had not been reduced during the applicable periods shown.
C Calculated based on average shares outstanding during the period.
D Fees and expenses of any underlying Fidelity Central Funds are not included in the Fund's expense ratio. The Fund indirectly bears its proportionate share of the expenses of any underlying Fidelity Central Funds.
E Amount does not include the portfolio activity of any underlying Fidelity Central Funds.
F Expense ratios reflect operating expenses of the class. Expenses before reductions do not reflect amounts reimbursed by the investment adviser or reductions from brokerage service arrangements or reductions from other expense offset arrangements and do not represent the amount paid by the class during periods when reimbursements or reductions occur. Expenses net of fee waivers reflect expenses after reimbursement by the investment adviser but prior to reductions from brokerage service arrangements or other expense offset arrangements. Expenses net of all reductions represent the net expenses paid by the class.
G Total distributions of $.27 per share is comprised of distributions from net investment income of $.153 and distributions from net realized gain of $.115 per share.
Financial Highlights - Service Class
Years ended December 31, | 2011 | 2010 | 2009 | 2008 | 2007 |
Selected Per-Share Data | | | | | |
Net asset value, beginning of period | $ 32.52 | $ 25.40 | $ 18.33 | $ 35.98 | $ 34.59 |
Income from Investment Operations | | | | | |
Net investment income (loss) C | .05 | .08 | .09 | .12 | .17 |
Net realized and unrealized gain (loss) | (3.54) | 7.21 | 7.23 | (12.68) | 4.77 |
Total from investment operations | (3.49) | 7.29 | 7.32 | (12.56) | 4.94 |
Distributions from net investment income | (.05) | (.08) | (.13) | (.10) | (.26) |
Distributions from net realized gain | (.06) | (.09) | (.12) | (4.99) | (3.29) |
Total distributions | (.10) H | (.17) | (.25) G | (5.09) | (3.55) |
Net asset value, end of period | $ 28.93 | $ 32.52 | $ 25.40 | $ 18.33 | $ 35.98 |
Total Return A, B | (10.72)% | 28.75% | 39.96% | (39.51)% | 15.49% |
Ratios to Average Net Assets D, F | | | | | |
Expenses before reductions | .76% | .76% | .78% | .78% | .76% |
Expenses net of fee waivers, if any | .76% | .76% | .78% | .78% | .76% |
Expenses net of all reductions | .75% | .75% | .78% | .77% | .75% |
Net investment income (loss) | .15% | .30% | .44% | .45% | .49% |
Supplemental Data | | | | | |
Net assets, end of period (000 omitted) | $ 566,560 | $ 749,636 | $ 688,509 | $ 573,499 | $ 1,138,873 |
Portfolio turnover rate E | 84% | 25% | 57% | 145% | 113% |
A Total returns do not reflect charges attributable to your insurance company's separate account. Inclusion of these charges would reduce the total returns shown.
B Total returns would have been lower if certain expenses had not been reduced during the applicable periods shown.
C Calculated based on average shares outstanding during the period.
D Fees and expenses of any underlying Fidelity Central Funds are not included in the Fund's expense ratio. The Fund indirectly bears its proportionate share of the expenses of any underlying Fidelity Central Funds.
E Amount does not include the portfolio activity of any underlying Fidelity Central Funds.
F Expense ratios reflect operating expenses of the class. Expenses before reductions do not reflect amounts reimbursed by the investment adviser or reductions from brokerage service arrangements or reductions from other expense offset arrangements and do not represent the amount paid by the class during periods when reimbursements or reductions occur. Expenses net of fee waivers reflect expenses after reimbursement by the investment adviser but prior to reductions from brokerage service arrangements or other expense offset arrangements. Expenses net of all reductions represent the net expenses paid by the class.
G Total distributions of $.25 per share is comprised of distributions from net investment income of $.130 and distributions from net realized gain of $.115 per share.
H Total distributions of $.10 per share is comprised of distributions from net investment income of $.048 and distributions from net realized gain of $.055 per share.
See accompanying notes which are an integral part of the financial statements.
Annual Report
Financial Highlights - Service Class 2
Years ended December 31, | 2011 | 2010 | 2009 | 2008 | 2007 |
Selected Per-Share Data | | | | | |
Net asset value, beginning of period | $ 32.13 | $ 25.10 | $ 18.12 | $ 35.63 | $ 34.25 |
Income from Investment Operations | | | | | |
Net investment income (loss) C | - I | .04 | .06 | .08 | .12 |
Net realized and unrealized gain (loss) | (3.49) | 7.12 | 7.13 | (12.53) | 4.73 |
Total from investment operations | (3.49) | 7.16 | 7.19 | (12.45) | 4.85 |
Distributions from net investment income | (.01) | (.04) | (.10) | (.07) | (.18) |
Distributions from net realized gain | (.06) | (.09) | (.12) | (4.99) | (3.29) |
Total distributions | (.06) H | (.13) | (.21) G | (5.06) | (3.47) |
Net asset value, end of period | $ 28.58 | $ 32.13 | $ 25.10 | $ 18.12 | $ 35.63 |
Total Return A, B | (10.85)% | 28.57% | 39.75% | (39.61)% | 15.34% |
Ratios to Average Net Assets D, F | | | | | |
Expenses before reductions | .91% | .91% | .93% | .93% | .91% |
Expenses net of fee waivers, if any | .91% | .91% | .93% | .93% | .91% |
Expenses net of all reductions | .90% | .90% | .93% | .92% | .90% |
Net investment income (loss) | -% J | .15% | .29% | .30% | .34% |
Supplemental Data | | | | | |
Net assets, end of period (000 omitted) | $ 4,888,475 | $ 5,507,254 | $ 4,840,547 | $ 3,721,868 | $ 5,939,927 |
Portfolio turnover rate E | 84% | 25% | 57% | 145% | 113% |
A Total returns do not reflect charges attributable to your insurance company's separate account. Inclusion of these charges would reduce the total returns shown.
B Total returns would have been lower if certain expenses had not been reduced during the applicable periods shown.
C Calculated based on average shares outstanding during the period.
D Fees and expenses of any underlying Fidelity Central Funds are not included in the Fund's expense ratio. The Fund indirectly bears its proportionate share of the expenses of any underlying Fidelity Central Funds.
E Amount does not include the portfolio activity of any underlying Fidelity Central Funds.
F Expense ratios reflect operating expenses of the class. Expenses before reductions do not reflect amounts reimbursed by the investment adviser or reductions from brokerage service arrangements or reductions from other expense offset arrangements and do not represent the amount paid by the class during periods when reimbursements or reductions occur. Expenses net of fee waivers reflect expenses after reimbursement by the investment adviser but prior to reductions from brokerage service arrangements or other expense offset arrangements. Expenses net of all reductions represent the net expenses paid by the class.
G Total distributions of $.21 per share is comprised of distributions from net investment income of $.099 and distributions from net realized gain of $.115 per share.
H Total distributions of $.06 per share is comprised of distributions from net investment income of $.007 and distributions from net realized gain of $.055 per share.
I Amount represents less than $.01 per share.
J Amount represents less than .01%.
Financial Highlights - Investor Class
Years ended December 31, | 2011 | 2010 | 2009 | 2008 | 2007 |
Selected Per-Share Data | | | | | |
Net asset value, beginning of period | $ 32.60 | $ 25.47 | $ 18.38 | $ 36.07 | $ 34.69 |
Income from Investment Operations | | | | | |
Net investment income (loss) C | .05 | .09 | .10 | .12 | .17 |
Net realized and unrealized gain (loss) | (3.54) | 7.22 | 7.24 | (12.71) | 4.78 |
Total from investment operations | (3.49) | 7.31 | 7.34 | (12.59) | 4.95 |
Distributions from net investment income | (.06) | (.09) | (.13) | (.11) | (.28) |
Distributions from net realized gain | (.06) | (.09) | (.12) | (4.99) | (3.29) |
Total distributions | (.11) H | (.18) | (.25) G | (5.10) | (3.57) |
Net asset value, end of period | $ 29.00 | $ 32.60 | $ 25.47 | $ 18.38 | $ 36.07 |
Total Return A, B | (10.70)% | 28.76% | 39.98% | (39.50)% | 15.46% |
Ratios to Average Net Assets D, F | | | | | |
Expenses before reductions | .74% | .75% | .78% | .77% | .78% |
Expenses net of fee waivers, if any | .74% | .74% | .78% | .77% | .78% |
Expenses net of all reductions | .73% | .74% | .78% | .76% | .77% |
Net investment income (loss) | .17% | .32% | .44% | .46% | .47% |
Supplemental Data | | | | | |
Net assets, end of period (000 omitted) | $ 314,362 | $ 355,842 | $ 233,498 | $ 163,319 | $ 255,371 |
Portfolio turnover rate E | 84% | 25% | 57% | 145% | 113% |
A Total returns do not reflect charges attributable to your insurance company's separate account. Inclusion of these charges would reduce the total returns shown.
B Total returns would have been lower if certain expenses had not been reduced during the applicable periods shown.
C Calculated based on average shares outstanding during the period.
D Fees and expenses of any underlying Fidelity Central Funds are not included in the Fund's expense ratio. The Fund indirectly bears its proportionate share of the expenses of any underlying Fidelity Central Funds.
E Amount does not include the portfolio activity of any underlying Fidelity Central Funds.
F Expense ratios reflect operating expenses of the class. Expenses before reductions do not reflect amounts reimbursed by the investment adviser or reductions from brokerage service arrangements or reductions from other expense offset arrangements and do not represent the amount paid by the class during periods when reimbursements or reductions occur. Expenses net of fee waivers reflect expenses after reimbursement by the investment adviser but prior to reductions from brokerage service arrangements or other expense offset arrangements. Expenses net of all reductions represent the net expenses paid by the class.
G Total distributions of $.25 per share is comprised of distributions from net investment income of $.133 and distributions from net realized gain of $.115 per share.
H Total distributions of $.11 per share is comprised of distributions from net investment income of $.056 and distributions from net realized gain of $.055 per share.
See accompanying notes which are an integral part of the financial statements.
Annual Report
Notes to Financial Statements
For the period ended December 31, 2011
1. Organization.
VIP Mid Cap Portfolio (the Fund) is a fund of Variable Insurance Products Fund III (the Trust) and is authorized to issue an unlimited number of shares. The Trust is registered under the Investment Company Act of 1940, as amended (the 1940 Act), as an open-end management investment company organized as a Massachusetts business trust. Shares of the Fund may only be purchased by insurance companies for the purpose of funding variable annuity or variable life insurance contracts. The Fund offers the following classes of shares: Initial Class shares, Service Class shares, Service Class 2 shares and Investor Class shares. All classes have equal rights and voting privileges, except for matters affecting a single class. Investment income, realized and unrealized capital gains and losses, the common expenses of the Fund, and certain fund-level expense reductions, if any, are allocated on a pro-rata basis to each class based on the relative net assets of each class to the total net assets of the Fund. Each class differs with respect to transfer agent and distribution and service plan fees incurred. Certain expense reductions may also differ by class. The Fund's investments in emerging markets can be subject to social, economic, regulatory, and political uncertainties and can be extremely volatile.
2. Investments in Fidelity Central Funds.
The Fund invests in Fidelity Central Funds, which are open-end investment companies available only to other investment companies and accounts managed by Fidelity Management & Research Company (FMR) and its affiliates. The Fund's Schedule of Investments lists each of the Fidelity Central Funds held as of period end, if any, as an investment of the Fund, but do not include the underlying holdings of each Fidelity Central Fund. As an Investing Fund, the Fund indirectly bears its proportionate share of the expenses of the underlying Fidelity Central Funds.
The Money Market Central Funds seek preservation of capital and current income and are managed by Fidelity Investments Money Management, Inc. (FIMM), an affiliate of FMR.
A complete unaudited list of holdings for each Fidelity Central Fund is available upon request or at the Securities and Exchange Commission (the SEC) web site at www.sec.gov. In addition, the financial statements of the Fidelity Central Funds, which are not covered by the Fund's Report of Independent Registered Public Accounting Firm are available on the SEC web site or upon request.
3. Significant Accounting Policies.
The financial statements have been prepared in conformity with accounting principles generally accepted in the United States of America (GAAP), which require management to make certain estimates and assumptions at the date of the financial statements. Actual results could differ from those estimates. Subsequent events, if any, through the date that the financial statements were issued have been evaluated in the preparation of the financial statements. The following summarizes the significant accounting policies of the Fund:
Security Valuation. Investments are valued as of 4:00 p.m. Eastern time on the last calendar day of the period. The Fund uses independent pricing services approved by the Board of Trustees to value its investments. When current market prices or quotations are not readily available or reliable, valuations may be determined in good faith in accordance with procedures adopted by the Board of Trustees. Factors used in determining value may include market or security specific events, changes in interest rates and credit quality. The frequency with which these procedures are used cannot be predicted and they may be utilized to a significant extent. The value used for net asset value (NAV) calculation under these procedures may differ from published prices for the same securities.
The Fund categorizes the inputs to valuation techniques used to value its investments into a disclosure hierarchy consisting of three levels as shown below:
Level 1 - quoted prices in active markets for identical investments
Level 2 - other significant observable inputs (including quoted prices for similar investments, interest rates, prepayment speeds, etc.)
Level 3 - unobservable inputs (including the Fund's own assumptions based on the best information available)
Changes in valuation techniques may result in transfers in or out of an assigned level within the disclosure hierarchy. The aggregate value of investments by input level, as of December 31, 2011, as well as a roll forward of Level 3 securities, is included at the end of the Fund's Schedule of Investments. Valuation techniques used to value the Fund's investments by major category are as follows:
Equity securities, including restricted securities, for which market quotations are readily available, are valued at the last reported sale price or official closing price as reported by an independent pricing service on the primary market or exchange on which they are traded and are categorized as Level 1 in the hierarchy. In the event there were no sales during the day or closing prices are not available, securities are valued at the last quoted bid price or may be valued using the last available price and are generally categorized as Level 2 in the hierarchy. For foreign equity securities, when significant market or security specific events arise, comparisons to the valuation of American Depositary Receipts (ADRs), futures contracts, Exchange-traded funds (ETFs) and certain indexes as well as quoted prices for similar securities are used and are categorized as Level 2 in the hierarchy in these
Annual Report
Notes to Financial Statements - continued
3. Significant Accounting Policies - continued
Security Valuation - continued
circumstances. Utilizing these techniques may result in transfers between Level 1 and Level 2. For restricted equity securities and private placements where observable inputs are limited, assumptions about market activity and risk are used and are categorized as Level 3 in the hierarchy.
Debt securities, including restricted securities, are valued based on evaluated prices received from independent pricing services or from dealers who make markets in such securities. For corporate bonds, pricing services utilize matrix pricing which considers yield or price of bonds of comparable quality, coupon, maturity and type as well as dealer supplied prices and are generally categorized as Level 2 in the hierarchy. When independent prices are unavailable or unreliable, debt securities may be valued utilizing pricing matrices which consider similar factors that would be used by independent pricing services. These are generally categorized as Level 2 in the hierarchy but may be Level 3 depending on the circumstances.
Investments in open-end mutual funds, including the Fidelity Central Funds, are valued at their closing net asset value each business day and are categorized as Level 1 in the hierarchy.
New Accounting Pronouncements. In May 2011, the Financial Accounting Standards Board issued Accounting Standard Update No. 2011-04, Fair Value Measurement (Topic 820) - Amendments to Achieve Common Fair Value Measurement and Disclosure Requirements in U.S. GAAP and IFRSs. The update is effective during interim and annual periods beginning after December 15, 2011 and will result in additional disclosure for transfers between levels as well as expanded disclosure for securities categorized as Level 3 under the fair value hierarchy.
In December 2011, the Financial Accounting Standards Board issued Accounting Standard Update No. 2011-11, Disclosures about Offsetting Assets and Liabilities. The update creates new disclosure requirements requiring entities to disclose both gross and net information for derivatives and other financial instruments that are either offset in the Statement of Assets and Liabilities or subject to an enforceable master netting arrangement or similar agreement. The disclosure requirements are effective for annual reporting periods beginning on or after January 1, 2013. Management is currently evaluating the impact of the update's adoption on the Fund's financial statement disclosures.
Foreign Currency. The Fund may use foreign currency contracts to facilitate transactions in foreign-denominated securities. Gains and losses from these transactions may arise from changes in the value of the foreign currency or if the counterparties do not perform under the contracts' terms.
Foreign-denominated assets, including investment securities, and liabilities are translated into U.S. dollars at the exchange rate at period end. Purchases and sales of investment securities, income and dividends received and expenses denominated in foreign currencies are translated into U.S. dollars at the exchange rate in effect on the transaction date.
The effects of exchange rate fluctuations on investments are included with the net realized and unrealized gain (loss) on investment securities. Other foreign currency transactions resulting in realized and unrealized gain (loss) are disclosed separately.
Investment Transactions and Income. For financial reporting purposes, the Fund's investment holdings and NAV include trades executed through the end of the last business day of the period. The NAV per share for processing shareholder transactions is calculated as of the close of business of the New York Stock Exchange (NYSE), normally 4:00 p.m. Eastern time and includes trades executed through the end of the prior business day. Gains and losses on securities sold are determined on the basis of identified cost and may include proceeds received from litigation. Dividend income is recorded on the ex-dividend date, except for certain dividends from foreign securities where the ex-dividend date may have passed, which are recorded as soon as the Fund is informed of the ex-dividend date. Non-cash dividends included in dividend income, if any, are recorded at the fair market value of the securities received. Distributions received on securities that represent a return of capital or capital gain are recorded as a reduction of cost of investments and/or as a realized gain. The Fund estimates the components of distributions received that may be considered return of capital distributions or capital gain distributions. Interest income and distributions from the Fidelity Central Funds are accrued as earned. Interest income includes coupon interest and amortization of premium and accretion of discount on debt securities. Investment income is recorded net of foreign taxes withheld where recovery of such taxes is uncertain.
Expenses. Expenses directly attributable to a fund are charged to that fund. Expenses attributable to more than one fund are allocated among the respective funds on the basis of relative net assets or other appropriate methods. Expense estimates are accrued in the period to which they relate and adjustments are made when actual amounts are known.
Income Tax Information and Distributions to Shareholders. Each year, the Fund intends to qualify as a regulated investment company, including distributing substantially all of its taxable income and realized gains under Subchapter M of the Internal Revenue Code. As a result, no provision for income taxes is required. As of December 31, 2011, the Fund did not have any unrecognized tax benefits in the financial statements; nor is the Fund aware of any tax positions for which it is reasonably possible that the total amounts of unrecognized tax benefits will significantly change in the next twelve months. The Fund files a U.S. federal tax return, in addition to state and local tax returns as required. A fund's tax returns are subject to examination by the Internal Revenue Service (IRS) for a period of three fiscal years. State and local tax returns may be subject to examination for an
Annual Report
3. Significant Accounting Policies - continued
Income Tax Information and Distributions to Shareholders - continued
additional fiscal year depending on the jurisdiction. Foreign taxes are provided for based on the Fund's understanding of the tax rules and rates that exist in the foreign markets in which it invests.
Distributions are declared and recorded on the ex-dividend date. Income dividends and capital gain distributions are declared separately for each class. Income and capital gain distributions are determined in accordance with income tax regulations, which may differ from GAAP.
Capital accounts within the financial statements are adjusted for permanent book-tax differences. These adjustments have no impact on net assets or the results of operations. Temporary book-tax differences will reverse in a subsequent period.
Book-tax differences are primarily due to foreign currency transactions, certain foreign taxes, passive foreign investment companies (PFIC), market discount, capital loss carryforwards and losses deferred due to wash sales and excise tax regulations.
The federal tax cost of investment securities and unrealized appreciation (depreciation) as of period end were as follows:
Gross unrealized appreciation | $ 1,183,457,155 |
Gross unrealized depreciation | (749,487,409) |
Net unrealized appreciation (depreciation) on securities and other investments | $ 433,969,746 |
| |
Tax Cost | $ 6,474,129,125 |
The tax-based components of distributable earnings as of period end were as follows:
Undistributed long-term capital gain | $ 1,189,532 |
Net unrealized appreciation (depreciation) | $ 433,945,653 |
The Fund intends to elect to defer to its fiscal year ending December 31, 2012 approximately $20,229,618 of ordinary losses recognized during the period November 1, 2011 to December 31, 2011.
The tax character of distributions paid was as follows:
| December 31, 2011 | December 31, 2010 |
Ordinary Income | $ 18,983,845 | $ 36,615,990 |
4. Operating Policies.
Restricted Securities. The Fund may invest in securities that are subject to legal or contractual restrictions on resale. These securities generally may be resold in transactions exempt from registration or to the public if the securities are registered. Disposal of these securities may involve time-consuming negotiations and expense, and prompt sale at an acceptable price may be difficult. Information regarding restricted securities is included at the end of the Fund's Schedule of Investments.
5. Purchases and Sales of Investments.
Purchases and sales of securities, other than short-term securities, aggregated $6,278,713,728 and $5,953,079,421, respectively.
The fund realized a gain on the sale of an investment not meeting the investment restrictions of the Fund.
6. Fees and Other Transactions with Affiliates.
Management Fee. FMR and its affiliates provide the Fund with investment management related services for which the Fund pays a monthly management fee. The management fee is the sum of an individual fund fee rate that is based on an annual rate of .30% of the Fund's average net assets and an annualized group fee rate that averaged .26% during the period. The group fee rate is based upon the average net assets of all the mutual funds advised by FMR. The group fee rate decreases as assets under management increase and increases as assets under management decrease. For the period, the total annual management fee rate was .56% of the Fund's average net assets.
Annual Report
Notes to Financial Statements - continued
6. Fees and Other Transactions with Affiliates - continued
Distribution and Service Plan Fees. In accordance with Rule 12b-1 of the 1940 Act, the Fund has adopted separate 12b-1 Plans for each Service Class of shares. Each Service Class pays Fidelity Distributors Corporation (FDC), an affiliate of FMR, a service fee. For the period, the service fee is based on an annual rate of .10% of Service Class' average net assets and .25% of Service Class 2's average net assets.
For the period, total fees, all of which were re-allowed to insurance companies for the distribution of shares and providing shareholder support services were as follows:
Service Class | $ 674,792 |
Service Class 2 | 13,436,055 |
| $ 14,110,847 |
Transfer Agent Fees. Fidelity Investments Institutional Operations Company, Inc. (FIIOC), an affiliate of FMR, is the Fund's transfer, dividend disbursing, and shareholder servicing agent. FIIOC receives an asset-based fee with respect to each class. Each class (with the exception of Investor Class) pays a transfer agent fee, excluding out of pocket expenses, equal to an annual rate of .07% of average net assets. Investor Class pays a monthly asset-based transfer agent fee of .15% of average net assets. In addition, FIIOC receives an asset-based fee of .0045% of average net assets for typesetting, printing and mailing of shareholder reports, except proxy statements. FIIOC voluntarily agreed to waive this fee for the period August 1, 2011 through December 31, 2011 (see Expense Reductions note). For the period, transfer agent fees for each class, including printing and out of pocket expenses, were as follows:
Initial Class | $ 931,636 |
Service Class | 488,579 |
Service Class 2 | 3,870,391 |
Investor Class | 562,125 |
| $ 5,852,731 |
Accounting and Security Lending Fees. Fidelity Service Company, Inc. (FSC), an affiliate of FMR, maintains the Fund's accounting records. The accounting fee is based on the level of average net assets for the month. Under a separate contract, FSC administers the security lending program. The security lending fee is based on the number and duration of lending transactions.
Brokerage Commissions. The Fund placed a portion of its portfolio transactions with brokerage firms which are affiliates of the investment adviser. The commissions paid to these affiliated firms were $50,105 for the period.
Interfund Lending Program. Pursuant to an Exemptive Order issued by the SEC, the Fund, along with other registered investment companies having management contracts with FMR, may participate in an interfund lending program. This program provides an alternative credit facility allowing the funds to borrow from, or lend money to, other participating affiliated funds. At period end there were no interfund loans outstanding. The Fund's activity in this program during the period for which loans were outstanding was as follows:
Borrower or Lender | Average
Loan Balance | Weighted Average
Interest Rate | Interest
Expense |
Borrower | $ 11,028,333 | .33% | $ 302 |
7. Committed Line of Credit.
The Fund participates with other funds managed by FMR or an affiliate in a $4.0 billion credit facility (the "line of credit") to be utilized for temporary or emergency purposes to fund shareholder redemptions or for other short-term liquidity purposes. The Fund has agreed to pay commitment fees on its pro-rata portion of the line of credit, which amounted to $24,015 and is reflected in Miscellaneous expenses on the Statement of Operations. During the period, there were no borrowings on this line of credit.
8. Security Lending.
The Fund lends portfolio securities through a lending agent from time to time in order to earn additional income. For equity securities, a lending agent is used and may loan securities to certain qualified borrowers, including Fidelity Capital Markets (FCM), a broker-dealer affiliated with the Fund. On the settlement date of the loan, the Fund receives collateral (in the form of U.S. Treasury obligations, letters of credit and/or cash) against the loaned securities and maintains collateral in an amount not less than 100% of the market value of the loaned securities during the period of the loan. The
Annual Report
8. Security Lending - continued
market value of the loaned securities is determined at the close of business of the Fund and any additional required collateral is delivered to the Fund on the next business day. If the borrower defaults on its obligation to return the securities loaned because of insolvency or other reasons, a fund could experience delays and costs in recovering the securities loaned or in gaining access to the collateral. Any cash collateral received is invested in the Fidelity Securities Lending Cash Central Fund. The value of loaned securities and cash collateral at period end are disclosed on the Fund's Statement of Assets and Liabilities. At period end, there were no security loans outstanding with FCM. Security lending income represents the income earned on investing cash collateral, less rebates paid to borrowers and any lending agent fees associated with the loan, plus any premium payments received for lending certain types of securities. Security lending income is presented in the Statement of Operations as a component of income from Fidelity Central Funds. Total security lending income during the period amounted to $1,220,976, including $11,613 from securities loaned to FCM.
9. Expense Reductions.
FMR or its affiliates agreed to waive certain fees during the period as noted in the table below.
Initial Class | $ 21,973 |
Service Class | 11,576 |
Service Class 2 | 92,254 |
Investor Class | 6,137 |
| $ 131,940 |
Many of the brokers with whom FMR places trades on behalf of the Fund provided services to the Fund in addition to trade execution. These services included payments of certain expenses on behalf of the Fund totaling $728,718 for the period.
10. Distributions to Shareholders.
Distributions to shareholders of each class were as follows:
Years ended December 31, | 2011 | 2010 |
From net investment income | | |
Initial Class | $ 3,113,696 | $ 4,493,911 |
Service Class | 926,547 | 1,775,850 |
Service Class 2 | 1,198,154 | 5,957,281 |
Investor Class | 608,646 | 942,667 |
Total | $ 5,847,043 | $ 13,169,709 |
From net realized gain | | |
Initial Class | $ 2,063,293 | $ 3,766,612 |
Service Class | 1,061,669 | 2,270,560 |
Service Class 2 | 9,414,063 | 16,498,263 |
Investor Class | 597,777 | 910,846 |
Total | $ 13,136,802 | $ 23,446,281 |
11. Share Transactions.
Transactions for each class of shares were as follows:
| Shares | Dollars |
Years ended December 31, | 2011 | 2010 | 2011 | 2010 |
Initial Class | | | | |
Shares sold | 4,346,832 | 6,744,710 | $ 140,275,662 | $ 192,398,751 |
Reinvestment of distributions | 181,585 | 271,401 | 5,176,989 | 8,260,523 |
Shares redeemed | (9,157,982) | (6,311,889) | (290,511,193) | (176,817,594) |
Net increase (decrease) | (4,629,565) | 704,222 | $ (145,058,542) | $ 23,841,680 |
Service Class | | | | |
Shares sold | 1,823,503 | 2,199,123 | $ 57,647,518 | $ 63,020,500 |
Reinvestment of distributions | 70,106 | 136,816 | 1,988,216 | 4,046,410 |
Shares redeemed | (5,363,617) | (6,385,739) | (170,062,031) | (176,865,437) |
Net increase (decrease) | (3,470,008) | (4,049,800) | $ (110,426,297) | $ (109,798,527) |
Annual Report
Notes to Financial Statements - continued
11. Share Transactions - continued
| Shares | Dollars |
Years ended December 31, | 2011 | 2010 | 2011 | 2010 |
Service Class 2 | | | | |
Shares sold | 26,064,003 | 22,168,814 | $ 819,239,712 | $ 625,591,582 |
Reinvestment of distributions | 378,737 | 789,024 | 10,612,217 | 22,455,544 |
Shares redeemed | (26,827,045) | (44,352,123) | (831,178,626) | (1,193,744,942) |
Net increase (decrease) | (384,305) | (21,394,285) | $ (1,326,697) | $ (545,697,816) |
Investor Class | | | | |
Shares sold | 1,466,088 | 2,390,287 | $ 48,132,383 | $ 70,748,930 |
Reinvestment of distributions | 42,450 | 61,106 | 1,206,423 | 1,853,513 |
Shares redeemed | (1,584,274) | (702,570) | (49,322,843) | (19,263,834) |
Net increase (decrease) | (75,736) | 1,748,823 | $ 15,963 | $ 53,338,609 |
12. Other.
The Fund's organizational documents provide former and current trustees and officers with a limited indemnification against liabilities arising in connection with the performance of their duties to the Fund. In the normal course of business, the Fund may also enter into contracts that provide general indemnifications. The Fund's maximum exposure under these arrangements is unknown as this would be dependent on future claims that may be made against the Fund. The risk of material loss from such claims is considered remote.
At the end of the period, one otherwise unaffiliated shareholder was the owner of record of 13% of the total outstanding shares of the Fund.
Annual Report
Report of Independent Registered Public Accounting Firm
To the Trustees of Variable Insurance Products Fund III and the Shareholders of VIP Mid Cap Portfolio:
In our opinion, the accompanying statement of assets and liabilities, including the schedule of investments, and the related statements of operations and of changes in net assets and the financial highlights present fairly, in all material respects, the financial position of VIP Mid Cap Portfolio (a fund of Variable Insurance Products Fund III) at December 31, 2011, the results of its operations for the year then ended, the changes in its net assets for each of the two years in the period then ended and the financial highlights for each of the five years in the period then ended, in conformity with accounting principles generally accepted in the United States of America. These financial statements and financial highlights (hereafter referred to as "financial statements") are the responsibility of the VIP Mid Cap Portfolio's management. Our responsibility is to express an opinion on these financial statements based on our audits. We conducted our audits of these financial statements in accordance with the standards of the Public Company Accounting Oversight Board (United States). Those standards require that we plan and perform the audit to obtain reasonable assurance about whether the financial statements are free of material misstatement. An audit includes examining, on a test basis, evidence supporting the amounts and disclosures in the financial statements, assessing the accounting principles used and significant estimates made by management, and evaluating the overall financial statement presentation. We believe that our audits, which included confirmation of securities at December 31, 2011 by correspondence with the custodian and brokers, provide a reasonable basis for our opinion.
PricewaterhouseCoopers LLP
Boston, Massachusetts
February 10, 2012
Annual Report
The Trustees, Members of the Advisory Board, and executive officers of the trust and fund, as applicable, are listed below. The Board of Trustees governs the fund and is responsible for protecting the interests of shareholders. The Trustees are experienced executives who meet periodically throughout the year to oversee the fund's activities, review contractual arrangements with companies that provide services to the fund, oversee management of the risks associated with such activities and contractual arrangements, and review the fund's performance. Except for James C. Curvey, each of the Trustees oversees 226 funds advised by FMR or an affiliate. Mr. Curvey oversees 429 funds advised by FMR or an affiliate.
The Trustees hold office without limit in time except that (a) any Trustee may resign; (b) any Trustee may be removed by written instrument, signed by at least two-thirds of the number of Trustees prior to such removal; (c) any Trustee who requests to be retired or who has become incapacitated by illness or injury may be retired by written instrument signed by a majority of the other Trustees; and (d) any Trustee may be removed at any special meeting of shareholders by a two-thirds vote of the outstanding voting securities of the trust. Each Trustee who is not an interested person (as defined in the 1940 Act) (Independent Trustee), shall retire not later than the last day of the calendar year in which his or her 75th birthday occurs. The Independent Trustees may waive this mandatory retirement age policy with respect to individual Trustees. The executive officers and Advisory Board Members hold office without limit in time, except that any officer and Advisory Board Member may resign or may be removed by a vote of a majority of the Trustees at any regular meeting or any special meeting of the Trustees. Except as indicated, each individual has held the office shown or other offices in the same company for the past five years.
Experience, Skills, Attributes, and Qualifications of the Fund's Trustees. The Governance and Nominating Committee has adopted a statement of policy that describes the experience, qualifications, attributes, and skills that are necessary and desirable for potential Independent Trustee candidates (Statement of Policy). The Board believes that each Trustee satisfied at the time he or she was initially elected or appointed a Trustee, and continues to satisfy, the standards contemplated by the Statement of Policy. The Governance and Nominating Committee also engages professional search firms to help identify potential Independent Trustee candidates who have the experience, qualifications, attributes, and skills consistent with the Statement of Policy. From time to time, additional criteria based on the composition and skills of the current Independent Trustees, as well as experience or skills that may be appropriate in light of future changes to board composition, business conditions, and regulatory or other developments, have also been considered by the professional search firms and the Governance and Nominating Committee. In addition, the Board takes into account the Trustees' commitment and participation in Board and committee meetings, as well as their leadership of standing and ad hoc committees throughout their tenure.
In determining that a particular Trustee was and continues to be qualified to serve as a Trustee, the Board has considered a variety of criteria, none of which, in isolation, was controlling. The Board believes that, collectively, the Trustees have balanced and diverse experience, qualifications, attributes, and skills, which allow the Board to operate effectively in governing the fund and protecting the interests of shareholders. Information about the specific experience, skills, attributes, and qualifications of each Trustee, which in each case led to the Board's conclusion that the Trustee should serve (or continue to serve) as a trustee of the fund, is provided below.
Board Structure and Oversight Function. James C. Curvey is an interested person (as defined in the 1940 Act) and currently serves as Acting Chairman. The Trustees have determined that an interested Chairman is appropriate and benefits shareholders because an interested Chairman has a personal and professional stake in the quality and continuity of services provided to the fund. Independent Trustees exercise their informed business judgment to appoint an individual of their choosing to serve as Chairman, regardless of whether the Trustee happens to be independent or a member of management. The Independent Trustees have determined that they can act independently and effectively without having an Independent Trustee serve as Chairman and that a key structural component for assuring that they are in a position to do so is for the Independent Trustees to constitute a substantial majority for the Board. The Independent Trustees also regularly meet in executive session. Ned C. Lautenbach serves as Chairman of the Independent Trustees and as such (i) acts as a liaison between the Independent Trustees and management with respect to matters important to the Independent Trustees and (ii) with management prepares agendas for Board meetings.
Fidelity funds are overseen by different Boards of Trustees. The fund's Board oversees Fidelity's equity and high income funds and another Board oversees Fidelity's investment-grade bond, money market, and asset allocation funds. The asset allocation funds may invest in Fidelity funds overseen by the fund's Board. The use of separate Boards, each with its own committee structure, allows the Trustees of each group of Fidelity funds to focus on the unique issues of the funds they oversee, including common research, investment, and operational issues. On occasion, the separate Boards establish joint committees to address issues of overlapping consequences for the Fidelity funds overseen by each Board.
The Trustees operate using a system of committees to facilitate the timely and efficient consideration of all matters of importance to the Trustees, the fund, and fund shareholders and to facilitate compliance with legal and regulatory requirements and oversight of the fund's activities and associated risks. The Board, acting through its committees, has charged FMR and its affiliates with (i) identifying events or circumstances the occurrence of which could have demonstrably adverse effects on the fund's business and/or reputation; (ii) implementing processes and controls to lessen the possibility that such events or circumstances occur or to mitigate the effects of such events or circumstances if they do occur; and (iii) creating and maintaining a system designed to evaluate continuously business and market conditions in order to facilitate the identification and implementation processes described in (i) and (ii) above. Because the day-to-day operations and activities of the fund are carried out by or through FMR, its affiliates and other service providers, the fund's exposure to risks is mitigated but not eliminated by the processes overseen by the Trustees. While each of the Board's committees has responsibility for overseeing different aspects of the fund's activities, oversight is exercised primarily through the Operations, Audit, and Compliance Committees. In addition, the Independent Trustees have worked with FMR to enhance the Board's oversight of investment and financial risks, legal and regulatory risks, technology risks, and operational risks, including the development of additional risk reporting to the Board. For example, a working group comprised of Independent Trustees and FMR has worked and continues to work to review the Fidelity funds' valuation-related activities, reporting and risk management. Appropriate personnel, including but not limited to the fund's Chief Compliance Officer (CCO), FMR's internal auditor, the independent accountants, the fund's Treasurer and portfolio management personnel, make periodic reports to the Board's committees, as appropriate, including an annual review of FMR's risk management program for the Fidelity funds. The responsibilities of each standing committee, including their oversight responsibilities, are described further under "Standing Committees of the Fund's Trustees."
Annual Report
Trustees and Officers - continued
The fund's Statement of Additional Information (SAI) includes more information about the Trustees. To request a free copy, call Fidelity at 1-877-208-0098.
Interested Trustees*:
Correspondence intended for each Trustee who is an interested person may be sent to Fidelity Investments, 82 Devonshire Street, Boston, Massachusetts 02109.
Name, Age; Principal Occupations and Other Relevant Experience+ |
James C. Curvey (76) |
| Year of Election or Appointment: 2007 Mr. Curvey is Trustee and Acting Chairman of the Board of Trustees of certain Trusts. Mr. Curvey also serves as Trustee (2007-present) of other investment companies advised by FMR. Mr. Curvey is a Director of Fidelity Investments Money Management, Inc. (2009-present), Director of Fidelity Research & Analysis Co. (2009-present) and Director of FMR and FMR Co., Inc. (2007-present). Mr. Curvey is also Vice Chairman (2007-present) and Director of FMR LLC. In addition, Mr. Curvey serves as an Overseer for the Boston Symphony Orchestra and a member of the Trustees of Villanova University. Previously, Mr. Curvey was the Vice Chairman (2006-2007) and Director (2000-2007) of FMR Corp. |
Ronald P. O'Hanley (54) |
| Year of Election or Appointment: 2011 Mr. O'Hanley is Director of FMR Co., Inc. (2010-present), Director of Fidelity Investments Money Management, Inc. (2010-present), Director of Fidelity Research & Analysis Company (2010-present), President of Fidelity Asset Management and Corporate Services and a member of Fidelity's Executive Committee (2010-present). Previously, Mr. O'Hanley served as President and Chief Executive Officer of BNY Mellon Asset Management (2007-2010). Mr. O'Hanley also served as Vice Chairman of Bank New York Mellon Corp. and a member of that firm's Executive Committee. Prior to the 2007 merger of The Bank of New York and Mellon Financial Corporation, he was Vice Chairman of Mellon Financial Corporation and President and Chief Executive Officer of Mellon Asset Management. He joined Mellon in February 1997. Mr. O'Hanley currently serves as Chairman of the Boston Public Library Foundation Board of Directors and sits on the Board of Directors of Beth Israel Deaconess Medical Center, the Board of Trustees of the Marine Biological Laboratory and the Advisory Board of the Maxwell School of Citizenship and Public Administration at Syracuse University. Mr. O'Hanley also chairs the Council on Asset Management for the Financial Services Roundtable and is a member of the Board of Directors of Institutional Investor's U.S. Institute. |
* Trustees have been determined to be "Interested Trustees" by virtue of, among other things, their affiliation with the trust or various entities under common control with FMR.
+ The information above includes each Trustee's principal occupation during the last five years and other information relating to the experience, attributes, and skills relevant to each Trustee's qualifications to serve as a Trustee, which led to the conclusion that each Trustee should serve as a Trustee for the fund.
Independent Trustees:
Correspondence intended for each Independent Trustee (that is, the Trustees other than the Interested Trustees) may be sent to Fidelity Investments, P.O. Box 55235, Boston, Massachusetts 02205-5235.
Name, Age; Principal Occupations and Other Relevant Experience+ |
Dennis J. Dirks (63) |
| Year of Election or Appointment: 2005 Prior to his retirement in May 2003, Mr. Dirks was Chief Operating Officer and a member of the Board of The Depository Trust & Clearing Corporation (DTCC). He also served as President, Chief Operating Officer, and Board member of The Depository Trust Company (DTC) and President and Board member of the National Securities Clearing Corporation (NSCC). In addition, Mr. Dirks served as Chief Executive Officer and Board member of the Government Securities Clearing Corporation, Chief Executive Officer and Board member of the Mortgage-Backed Securities Clearing Corporation, as a Trustee and a member of the Finance Committee of Manhattan College (2005-2008), and as a Trustee and a member of the Finance Committee of AHRC of Nassau County (2006-2008). Mr. Dirks is a member of the Independent Directors Council (IDC) Governing Council (2010-present) and Board of Directors for The Brookville Center for Children's Services, Inc. (2009-present). |
Alan J. Lacy (58) |
| Year of Election or Appointment: 2008 Mr. Lacy serves as Senior Adviser (2007-present) of Oak Hill Capital Partners, L.P. (private equity). Mr. Lacy also served as Chief Executive Officer (2000-2005) and Vice Chairman (2005-2006) of Sears Holdings Corporation and Sears, Roebuck and Co. (retail). In addition, Mr. Lacy serves as a member of the Board of Directors of Dave & Buster's, Inc. (restaurant and entertainment complexes, 2010-present), The Hillman Companies, Inc. (hardware wholesalers, 2010-present), and Bristol-Myers Squibb Company (global pharmaceuticals, 2007-present). Mr. Lacy is a member of the Board of Trustees of The National Parks Conservation Association (2006-present). Previously, Mr. Lacy served as Chairman of the Board of Trustees of the National Parks Conservation Association (2008-2011) and as a member of the Board of Directors for the Western Union Company (global money transfer, 2006-2011). |
Ned C. Lautenbach (67) |
| Year of Election or Appointment: 2000 Mr. Lautenbach is Chairman of the Independent Trustees of the Equity and High Income Funds (2006-present). Mr. Lautenbach currently serves as the Lead Director of the Eaton Corporation Board of Directors (diversified industrial, 1997-present). Mr. Lautenbach is also a member of the Board of Directors of the Philharmonic Center for the Arts in Naples, Florida (1999-present); a member of the Board of Trustees of Fairfield University (2005-present); and a member of the Council on Foreign Relations (1994-present). Previously, Mr. Lautenbach was a Partner/Advisory Partner at Clayton, Dubilier & Rice, LLC (private equity investment, 1998-2010), as well as a Director of Sony Corporation (2006-2007). |
Joseph Mauriello (67) |
| Year of Election or Appointment: 2008 Prior to his retirement in January 2006, Mr. Mauriello served in numerous senior management positions including Deputy Chairman and Chief Operating Officer (2004-2005), and Vice Chairman of Financial Services (2002-2004) of KPMG LLP US (professional services, 1965-2005). Mr. Mauriello currently serves as a member of the Board of Directors of XL Group plc. (global insurance and re-insurance, 2006-present) and of Arcadia Resources Inc. (health care services and products, 2007-present). Previously, Mr. Mauriello served as a Director of the Hamilton Funds of the Bank of New York (2006-2007). |
Robert W. Selander (61) |
| Year of Election or Appointment: 2011 Previously, Mr. Selander served as a Member of the Advisory Board of Fidelity's Equity and High Income Funds (2011), Executive Vice Chairman (2010), Chief Executive Officer (2009-2010), and President and Chief Executive Officer (1997-2009) of Mastercard, Inc. |
Cornelia M. Small (67) |
| Year of Election or Appointment: 2005 Ms. Small is a member of the Board of Directors of the Teagle Foundation (2009-present). Ms. Small is also a member of the Investment Committee, and Chair (2008-present) and a member of the Board of Trustees of Smith College. In addition, Ms. Small serves on the Investment Committee of the Berkshire Taconic Community Foundation (2008-present). Previously, Ms. Small served as Chairperson of the Investment Committee (2002-2008) of Smith College. In addition, Ms. Small served as Chief Investment Officer, Director of Global Equity Investments, and a member of the Board of Directors of Scudder, Stevens & Clark and Scudder Kemper Investments. |
William S. Stavropoulos (72) |
| Year of Election or Appointment: 2002 Mr. Stavropoulos is Vice Chairman of the Independent Trustees of the Equity and High Income Funds (2006-present). Mr. Stavropoulos serves as President and Founder of the Michigan Baseball Foundation, the Great Lakes Loons (2007-present). Mr. Stavropoulos is Chairman Emeritus of the Board of Directors of The Dow Chemical Company, where he previously served in numerous senior management positions, including President, CEO (1995-2000; 2002-2004), Chairman of the Executive Committee (2000-2006), and as a member of the Board of Directors (1990-2006). Currently, Mr. Stavropoulos is Chairman of Univar (global distributor of commodity and specialty chemicals, 2010-present), a Director of Teradata Corporation (data warehousing and technology solutions, 2008-present), Chemical Financial Corporation, Maersk Inc. (industrial conglomerate), Tyco International, Inc. (multinational manufacturing and services, 2007-present), and a member of the Advisory Board for Metalmark Capital (private equity investment, 2005-present). Mr. Stavropoulos is a special advisor to Clayton, Dubilier & Rice, LLC (private equity investment). In addition, Mr. Stavropoulos is a member of the University of Notre Dame Advisory Council for the College of Science. |
David M. Thomas (62) |
| Year of Election or Appointment: 2008 Previously, Mr. Thomas served as Executive Chairman (2005-2006) and Chairman and Chief Executive Officer (2000-2005) of IMS Health, Inc. (pharmaceutical and healthcare information solutions). In addition, Mr. Thomas serves as a member of the Board of Directors of Fortune Brands, Inc. (consumer products), and Interpublic Group of Companies, Inc. (marketing communication, 2004-present). |
Michael E. Wiley (61) |
| Year of Election or Appointment: 2008 Mr. Wiley also serves as a Director of Asia Pacific Exploration Consolidated (international oil and gas exploration and production, 2008-present). Mr. Wiley serves as a Director of Tesoro Corporation (independent oil refiner and marketer, 2005-present), and a Director of Bill Barrett Corporation (exploration and production, 2005-present). In addition, Mr. Wiley also serves as a Director of Post Oak Bank (privately-held bank, 2004-present). Previously, Mr. Wiley served as a member of the Board of Trustees of the University of Tulsa (2000-2006; 2007-2010), as a Senior Energy Advisor of Katzenbach Partners, LLC (consulting, 2006-2007), as an Advisory Director of Riverstone Holdings (private investment), Chairman, President, and CEO of Baker Hughes, Inc. (oilfield services, 2000-2004), and as Director of Spinnaker Exploration Company (exploration and production, 2001-2005). |
+ The information above includes each Trustee's principal occupation during the last five years and other information relating to the experience, attributes, and skills relevant to each Trustee's qualifications to serve as a Trustee, which led to the conclusion that each Trustee should serve as a Trustee for the fund.
Advisory Board Members and Executive Officers:
Correspondence intended for each executive officer, Edward C. Johnson 3d, and Peter S. Lynch may be sent to Fidelity Investments, 82 Devonshire Street, Boston, Massachusetts 02109.
Name, Age; Principal Occupation |
Edward C. Johnson 3d (81) |
| Year of Election or Appointment: 2011 Member of the Advisory Board of Fidelity's Equity and High Income Funds. Mr. Johnson serves as Chief Executive Officer, Chairman, and a Director of FMR LLC, and also serves as Chairman and Director of FIL Limited. Previously, Mr. Johnson served as a Trustee and Chairman of the Board of certain Fidelity Trusts, Chairman and a Director of FMR, Chairman and a Director of FMR Co., Inc., and President of FMR LLC (2006-2007). |
Peter S. Lynch (67) |
| Year of Election or Appointment: 2003 Member of the Advisory Board of Fidelity's Equity and High Income Funds. Mr. Lynch is Vice Chairman and a Director of FMR and FMR Co., Inc. In addition, Mr. Lynch serves as a Trustee of Boston College and as the Chairman of the Inner-City Scholarship Fund. Previously, Mr. Lynch served on the Special Olympics International Board of Directors (1997-2006). |
Kenneth B. Robins (42) |
| Year of Election or Appointment: 2008 President and Treasurer of Fidelity's Equity and High Income Funds. Mr. Robins also serves as President and Treasurer (2010-present) and Assistant Treasurer (2009-present) of other Fidelity funds and is an employee of Fidelity Investments (2004-present). Previously, Mr. Robins served as Deputy Treasurer of the Fidelity funds (2005-2008) and Treasurer and Chief Financial Officer of The North Carolina Capital Management Trust: Cash and Term Portfolios (2006-2008). |
Bruce T. Herring (46) |
| Year of Election or Appointment: 2006 Vice President of certain Equity Funds. Mr. Herring also serves as President of Fidelity Research & Analysis Company (2010-present), Chief Investment Officer and Director of Fidelity Management & Research (U.K.) Inc. (2010-present) and Group Chief Investment Officer of FMR. Previously, Mr. Herring served as Vice President (2005-2006) and Senior Vice President (2006-2007) of Fidelity Management & Research Company, Vice President of FMR Co., Inc. (2001-2007) and as a portfolio manager for Fidelity U.S. Equity Funds. |
Brian B. Hogan (47) |
| Year of Election or Appointment: 2009 Vice President of Equity and High Income Funds. Mr. Hogan also serves as President of FMR's Equity Division (2009-present). Previously, Mr. Hogan served as Senior Vice President, Equity Research of FMR (2006-2009) and as a portfolio manager. |
Scott C. Goebel (43) |
| Year of Election or Appointment: 2008 Secretary and Chief Legal Officer (CLO) of the Fidelity funds. Mr. Goebel also serves as Secretary of Fidelity Investments Money Management, Inc. (FIMM) (2010-present) and Fidelity Research and Analysis Company (FRAC) (2010-present); Secretary and CLO of The North Carolina Capital Management Trust: Cash and Term Portfolios (2008-present); General Counsel, Secretary, and Senior Vice President of FMR (2008-present) and FMR Co., Inc. (2008-present); employed by FMR LLC or an affiliate (2001-present); Chief Legal Officer of Fidelity Management & Research (Hong Kong) Limited (2008-present) and Assistant Secretary of Fidelity Management & Research (Japan) Inc. (2008-present), and Fidelity Management & Research (U.K.) Inc. (2008-present). Previously, Mr. Goebel served as Assistant Secretary of FIMM (2008-2010), FRAC (2008-2010), and the Funds (2007-2008) and as Vice President and Secretary of Fidelity Distributors Corporation (FDC) (2005-2007). |
William C. Coffey (42) |
| Year of Election or Appointment: 2009 Assistant Secretary of Fidelity's Equity and High Income Funds. Mr. Coffey also serves as Senior Vice President and Deputy General Counsel of FMR LLC (2010-present), and is an employee of Fidelity Investments. Previously, Mr. Coffey served as Vice President and Associate General Counsel of FMR LLC (2005-2009). |
Holly C. Laurent (57) |
| Year of Election or Appointment: 2008 Anti-Money Laundering (AML) Officer of the Fidelity funds. Ms. Laurent also serves as AML Officer of The North Carolina Capital Management Trust: Cash and Term Portfolios (2008-present) and is an employee of Fidelity Investments. Previously, Ms. Laurent was Senior Vice President and Head of Legal for Fidelity Business Services India Pvt. Ltd. (2006-2008), and Senior Vice President, Deputy General Counsel and Group Head for FMR LLC (2005-2006). |
Christine Reynolds (53) |
| Year of Election or Appointment: 2008 Chief Financial Officer of the Fidelity funds. Ms. Reynolds became President of Fidelity Pricing and Cash Management Services (FPCMS) in August 2008. Ms. Reynolds served as Chief Operating Officer of FPCMS (2007-2008). Previously, Ms. Reynolds served as President, Treasurer, and Anti-Money Laundering officer of the Fidelity funds (2004-2007). |
Kenneth A. Rathgeber (64) |
| Year of Election or Appointment: 2004 Chief Compliance Officer of Fidelity's Equity and High Income Funds. Mr. Rathgeber is Chief Compliance Officer of Fidelity Management & Research (Hong Kong) Limited (2008-present), Fidelity Management & Research (Japan) Inc. (2008-present), FMR (2005-present), FMR Co., Inc. (2005-present), Fidelity Management & Research (U.K.) Inc. (2005-present), Fidelity Research & Analysis Company (2005-present), Fidelity Investments Money Management, Inc. (2005-present), Pyramis Global Advisors, LLC (2005-present), and Strategic Advisers, Inc. (2005-present). |
Jeffrey S. Christian (50) |
| Year of Election or Appointment: 2009 Deputy Treasurer of the Fidelity funds. Mr. Christian is an employee of Fidelity Investments. Previously, Mr. Christian served as Chief Financial Officer (2008-2009) of certain Fidelity funds and Senior Vice President of Fidelity Pricing and Cash Management Services (FPCMS) (2004-2009). |
Joseph F. Zambello (54) |
| Year of Election or Appointment: 2011 Deputy Treasurer of the Fidelity funds. Mr. Zambello is an employee of Fidelity Investments. Previously, Mr. Zambello served as Vice President of FMR's Program Management Group (2009-2011) and Vice President of the Transfer Agent Oversight Group (2005-2009). |
Adrien E. Deberghes (44) |
| Year of Election or Appointment: 2008 Deputy Treasurer of Fidelity's Equity and High Income Funds. Mr. Deberghes also serves as Vice President and Assistant Treasurer of Fidelity Rutland Square Trust II and Fidelity Commonwealth Trust II (2011-present), Assistant Treasurer of other Fidelity funds (2010-present), and is an employee of Fidelity Investments (2008-present). Previously, Mr. Deberghes served as Senior Vice President of Mutual Fund Administration at State Street Corporation (2007-2008), Senior Director of Mutual Fund Administration at Investors Bank & Trust (2005-2007), and Director of Finance for Dunkin' Brands (2000-2005). |
Stephanie J. Dorsey (42) |
| Year of Election or Appointment: 2010 Assistant Treasurer of Fidelity's Equity and High Income Funds. Ms. Dorsey also serves as Deputy Treasurer of other Fidelity funds (2008-present) and is an employee of Fidelity Investments (2008-present). Previously, Ms. Dorsey served as Treasurer (2004-2008) of the JPMorgan Mutual Funds and Vice President (2004-2008) of JPMorgan Chase Bank. |
John R. Hebble (53) |
| Year of Election or Appointment: 2009 Assistant Treasurer of Fidelity's Equity and High Income Funds. Mr. Hebble also serves as President (2011-present), Treasurer, and Chief Financial Officer of The North Carolina Capital Management Trust: Cash and Term Portfolios (2008-present), President and Treasurer of other Fidelity funds (2008-present) and is an employee of Fidelity Investments. |
Gary W. Ryan (53) |
| Year of Election or Appointment: 2005 Assistant Treasurer of the Fidelity funds. Mr. Ryan is an employee of Fidelity Investments. Previously, Mr. Ryan served as Vice President of Fund Reporting in Fidelity Pricing and Cash Management Services (FPCMS) (1999-2005). |
Jonathan Davis (43) |
| Year of Election or Appointment: 2010 Assistant Treasurer of the Fidelity funds. Mr. Davis is also Assistant Treasurer of Fidelity Rutland Square Trust II and Fidelity Commonwealth Trust II. Mr. Davis is an employee of Fidelity Investments. Previously, Mr. Davis served as Vice President and Associate General Counsel of FMR LLC (2003-2010). |
Annual Report
The Board of Trustees of VIP Mid Cap Portfolio voted to pay to shareholders of record at the opening of business on record date, the following distributions per share derived from capital gains realized from sales of portfolio securities.
| Pay Date | Record Date | Capital Gains |
Initial Class | 02/03/12 | 02/03/12 | $0.006 |
Service Class | 02/03/12 | 02/03/12 | $0.006 |
Service Class 2 | 02/03/12 | 02/03/12 | $0.006 |
Investor Class | 02/03/12 | 02/03/12 | $0.006 |
The fund hereby designates as a capital gain dividend with respect to the taxable year ended December 31, 2011 $1,236,976, or, if subsequently determined to be different, the net capital gain of such year.
Initial Class, Service Class, Service Class 2, and Investor Class designates 100% of each, of the dividends distributed in December 2011, as qualifying for the dividends-received deduction for corporate shareholders.
Annual Report
Board Approval of Investment Advisory Contracts and Management Fees
VIP Mid Cap Portfolio
Each year, the Board of Trustees, including the Independent Trustees (together, the Board), votes on the renewal of the management contract and sub-advisory agreements (together, the Advisory Contracts) for the fund. The Board, assisted by the advice of fund counsel and Independent Trustees' counsel, requests and considers a broad range of information relevant to the renewal of the Advisory Contracts throughout the year.
The Board meets regularly and considers at each of its meetings factors that are relevant to its annual consideration of the renewal of the fund's Advisory Contracts, including the services and support provided to the fund and its shareholders. The Board has established various standing committees, each composed of Independent Trustees with varying backgrounds, to which the Board has assigned specific subject matter responsibilities in order to enhance effective decision-making by the Board. The Board, acting directly and through its Committees, requests and receives information concerning the annual consideration of the renewal of the fund's Advisory Contracts. The Board also meets as needed to consider matters specifically related to the Board's annual consideration of the renewal of Advisory Contracts. Members of the Board may also meet with trustees of other Fidelity funds through ad hoc joint committees to discuss certain matters relevant to the Fidelity funds.
At its July 2011 meeting, the Board of Trustees, including the Independent Trustees, unanimously determined to renew the fund's Advisory Contracts. In reaching its determination, the Board considered all factors it believed relevant, including (i) the nature, extent, and quality of the services to be provided to the fund and its shareholders (including the investment performance of the fund); (ii) the competitiveness of the fund's management fee and total expense ratio; (iii) the total costs of the services to be provided by and the profits to be realized by Fidelity from its relationship with the fund; (iv) the extent to which economies of scale would be realized as the fund grows; and (v) whether fee levels reflect these economies of scale, if any, for the benefit of fund shareholders.
In considering whether to renew the Advisory Contracts for the fund, the Board reached a determination, with the assistance of fund counsel and Independent Trustees' counsel and through the exercise of its business judgment, that the renewal of the Advisory Contracts is in the best interests of the fund and its shareholders and that the compensation payable under the Advisory Contracts is fair and reasonable. The Board's decision to renew the Advisory Contracts was not based on any single factor, but rather was based on a comprehensive consideration of all the information provided to the Board at its meetings throughout the year. The Board, in reaching its determination to renew the Advisory Contracts, is aware that shareholders in the fund have a broad range of investment choices available to them, including a wide choice among mutual funds offered by Fidelity's competitors, and that the fund's shareholders, who have the opportunity to review and weigh the disclosure provided by the fund in its prospectus and other public disclosures, have chosen to invest in this fund, managed by Fidelity.
Nature, Extent, and Quality of Services Provided. The Board considered the staffing within the investment adviser, FMR, and the sub-advisers (together, the Investment Advisers), including the backgrounds of the fund's investment personnel and the fund's investment objective and discipline. The Independent Trustees also had discussions with senior management of Fidelity's investment operations and investment groups. The Board considered the structure of the portfolio manager compensation program and whether this structure provides appropriate incentives to act in the best interests of the fund.
Resources Dedicated to Investment Management and Support Services. The Board and the Fund Oversight and Research Committees reviewed the general qualifications and capabilities of the Investment Advisers' investment staff, including its size, education, experience, and resources, as well as the Investment Advisers' approach to recruiting, training, managing, and compensating investment personnel. The Board also noted that FMR has devoted increased resources to non-U.S. offices. The Board noted that Fidelity's analysts have extensive resources, tools and capabilities which allow them to conduct sophisticated quantitative and fundamental analysis, as well as credit analysis of issuers, counterparties and enhancers. The Board also believes that Fidelity's investment professionals have sufficient access to global information and data so as to provide competitive investment results over time, and that those professionals also have access to sophisticated tools which permit them to assess portfolio construction and risk and performance attribution characteristics continuously, as well as to transmit new information and research conclusions rapidly around the world. Additionally, in their deliberations, the Board considered the Investment Advisers' trading capabilities and resources which are an integral part of the investment management process.
Shareholder and Administrative Services. The Board considered (i) the nature, extent, quality, and cost of advisory, administrative, and shareholder services performed by the Investment Advisers and their affiliates under the Advisory Contracts and under separate agreements covering transfer agency, pricing and bookkeeping, and securities lending services for the fund; (ii) the nature and extent of the investment adviser's supervision of third party service providers, principally custodians and subcustodians; and (iii) the resources devoted to, and the record of compliance with, the fund's compliance policies and procedures. The Board also reviewed the allocation of fund brokerage, including allocations to brokers affiliated with the Investment Advisers, the use of brokerage commissions to pay fund expenses, and the use of "soft" commission dollars to pay for research services.
The Board noted that the growth of fund assets over time across the complex allows Fidelity to reinvest in the development of services designed to enhance the value or convenience of the Fidelity funds as investment vehicles. These services include 24-hour access to account information and market information through telephone representatives and over the Internet, investor education materials and asset allocation tools, and the expanded availability of Fidelity Investor Centers, with 35 new branches opening since 2010.
Annual Report
Investment in a Large Fund Family. The Board considered the benefits to shareholders of investing in a Fidelity fund, including the benefits of investing in a fund that is part of a large family of funds offering a variety of investment disciplines and providing a large variety of mutual fund investor services. The Board noted that Fidelity had taken, or had made recommendations that resulted in the Fidelity funds taking, a number of actions over the previous year that benefited particular funds, including (i) continuing to dedicate additional resources to investment research and support of the senior management team that oversees asset management; (ii) rationalizing product lines through the mergers of six funds into other funds; (iii) continuing to migrate the Freedom Funds to dedicated lower cost underlying funds; (iv) obtaining shareholder approval to broaden the investment strategies for Fidelity Consumer Finance Portfolio, Fidelity Emerging Asia Fund, and Fidelity Environment and Alternative Energy Portfolio; (v) contractually agreeing to reduce the management fees and impose other expense limitations on Spartan 500 Index Fund and U.S. Bond Index Fund in connection with launching new institutional classes of these funds; (vi) changing the name, primary and supplemental benchmarks, and investment policies of Fidelity Global Strategies Fund to support the fund's flexible investment mandate and global orientation; and (vii) reducing the transfer agency account fee rates on certain accounts.
Investment Performance. The Board considered whether the fund has operated in accordance with its investment objective, as well as its record of compliance with its investment restrictions. It also reviewed the fund's absolute investment performance for each class, as well as the fund's relative investment performance for each class measured over multiple periods against (i) a broad-based securities market index, and (ii) a peer group of mutual funds deemed appropriate by Fidelity and reviewed by the Board. The following charts considered by the Board show, over the one-, three-, and five-year periods ended December 31, 2010, the cumulative total returns of Initial Class and Service Class 2 of the fund, the cumulative total returns of a broad-based securities market index ("benchmark"), and a range of cumulative total returns of a peer group of mutual funds identified by Morningstar, Inc. as having an investment style similar to that of the fund based on underlying portfolio holdings. The returns of Initial Class and Service Class 2 show the performance of the highest and lowest performing classes, respectively (based on five-year performance). The box within each chart shows the 25th percentile return (bottom of box) and the 75th percentile return (top of box) of the peer group. Returns shown above the box are in the first quartile and returns shown below the box are in the fourth quartile. The percentage beaten numbers noted below each chart correspond to the percentile box and represent the percentage of funds in the peer group whose performance was equal to or lower than that of the class indicated.
VIP Mid Cap Portfolio
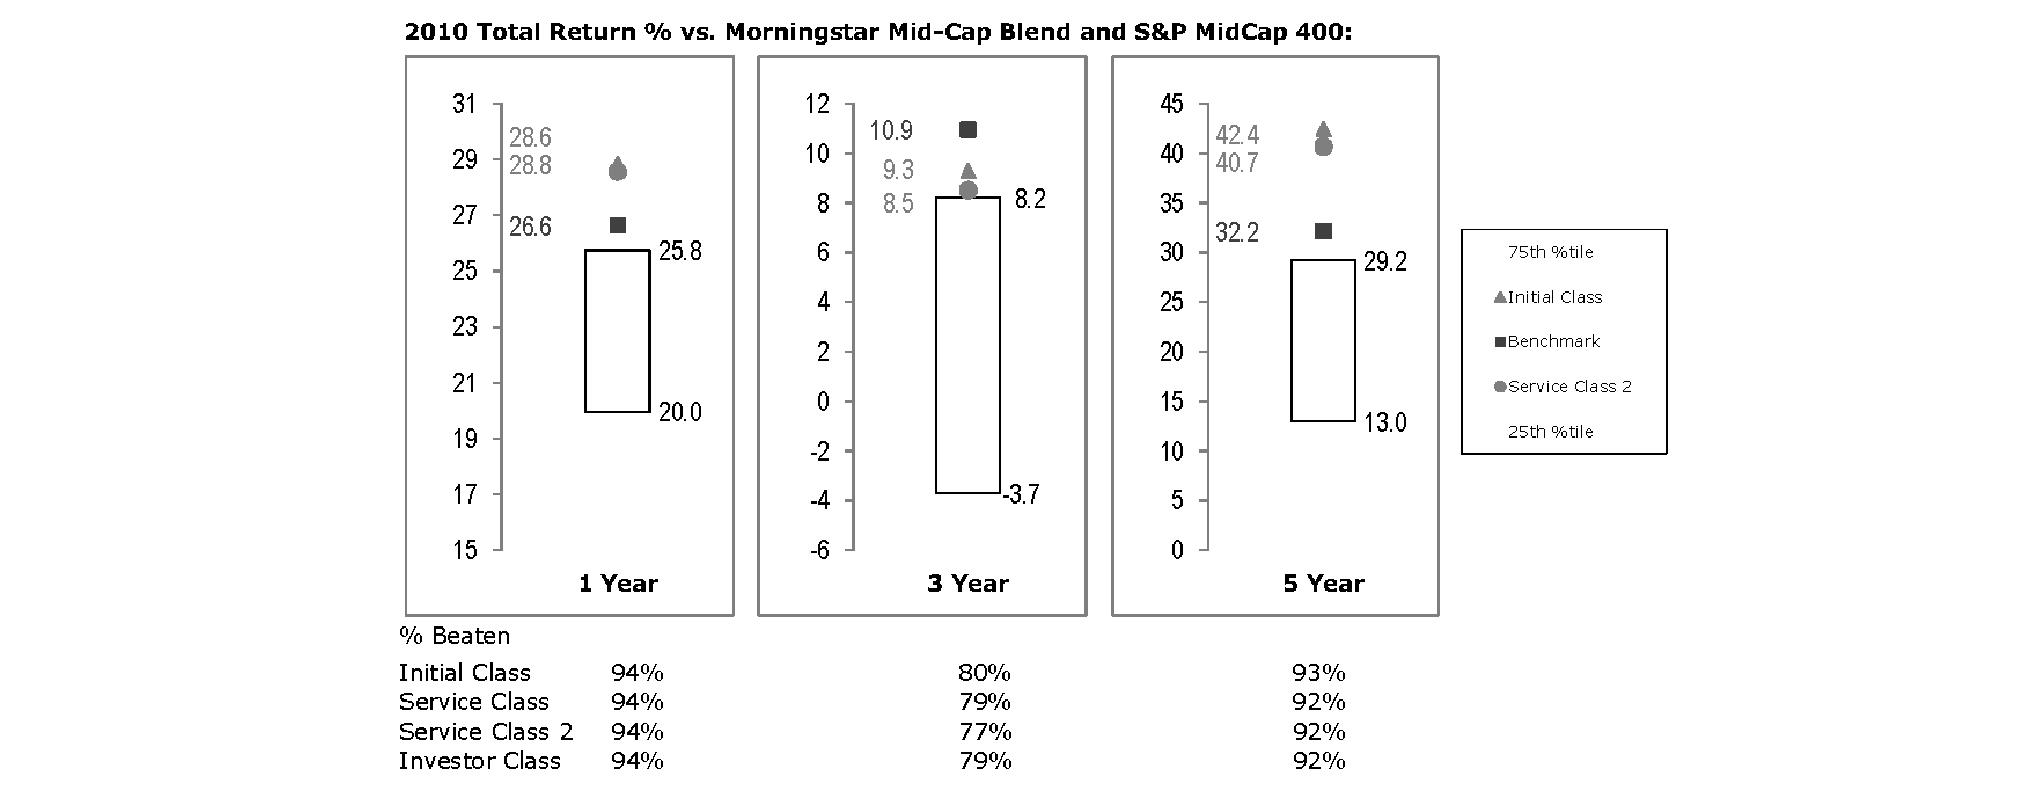
The Board reviewed the fund's relative investment performance against its peer group and noted that the performance of Initial Class of the fund was in the first quartile for all the periods shown. The Board also noted that the investment performance of Initial Class of the fund compared favorably to its benchmark for the one- and five-year periods, although the fund's three-year cumulative total return was lower than its benchmark. The Board considered that the variations in performance among the fund's classes reflect the variations in class expenses, which result in lower performance for higher expense classes. The Board also reviewed the fund's performance since inception as well as performance in the current year.
Based on its review, the Board concluded that the nature, extent, and quality of services provided to the fund under the Advisory Contracts should benefit the fund's shareholders.
Competitiveness of Management Fee and Total Expense Ratio. The Board considered the fund's management fee and total expense ratio compared to "mapped groups" of competitive funds and classes. Fidelity creates "mapped groups" by combining similar Lipper investment objective categories that have comparable management fee characteristics. Combining Lipper investment objective categories aids the Board's management fee and total expense ratio comparisons by broadening the competitive group used for comparison and by reducing the number of universes to which various Fidelity funds are compared.
Annual Report
Board Approval of Investment Advisory Contracts and Management Fees - continued
Management Fee. The Board considered two proprietary management fee comparisons for the 12-month periods shown in the chart below. The group of Lipper funds used by the Board for management fee comparisons is referred to below as the "Total Mapped Group." The Total Mapped Group comparison focuses on a fund's standing relative to the total universe of comparable funds available to investors in terms of gross management fees before expense reimbursements or caps. "TMG %" represents the percentage of funds in the Total Mapped Group that had management fees that were lower than the fund's. For example, a TMG % of 10% means that 90% of the funds in the Total Mapped Group had higher management fees than the fund. The "Asset-Size Peer Group" (ASPG) comparison focuses on a fund's standing relative to non-Fidelity funds similar in size to the fund within the Total Mapped Group. The ASPG represents at least 15% of the funds in the Total Mapped Group with comparable asset size and management fee characteristics, subject to a minimum of 50 funds (or all funds in the Total Mapped Group if fewer than 50). Additional information, such as the ASPG quartile in which the fund's management fee ranked, is also included in the chart and considered by the Board.
VIP Mid Cap Portfolio
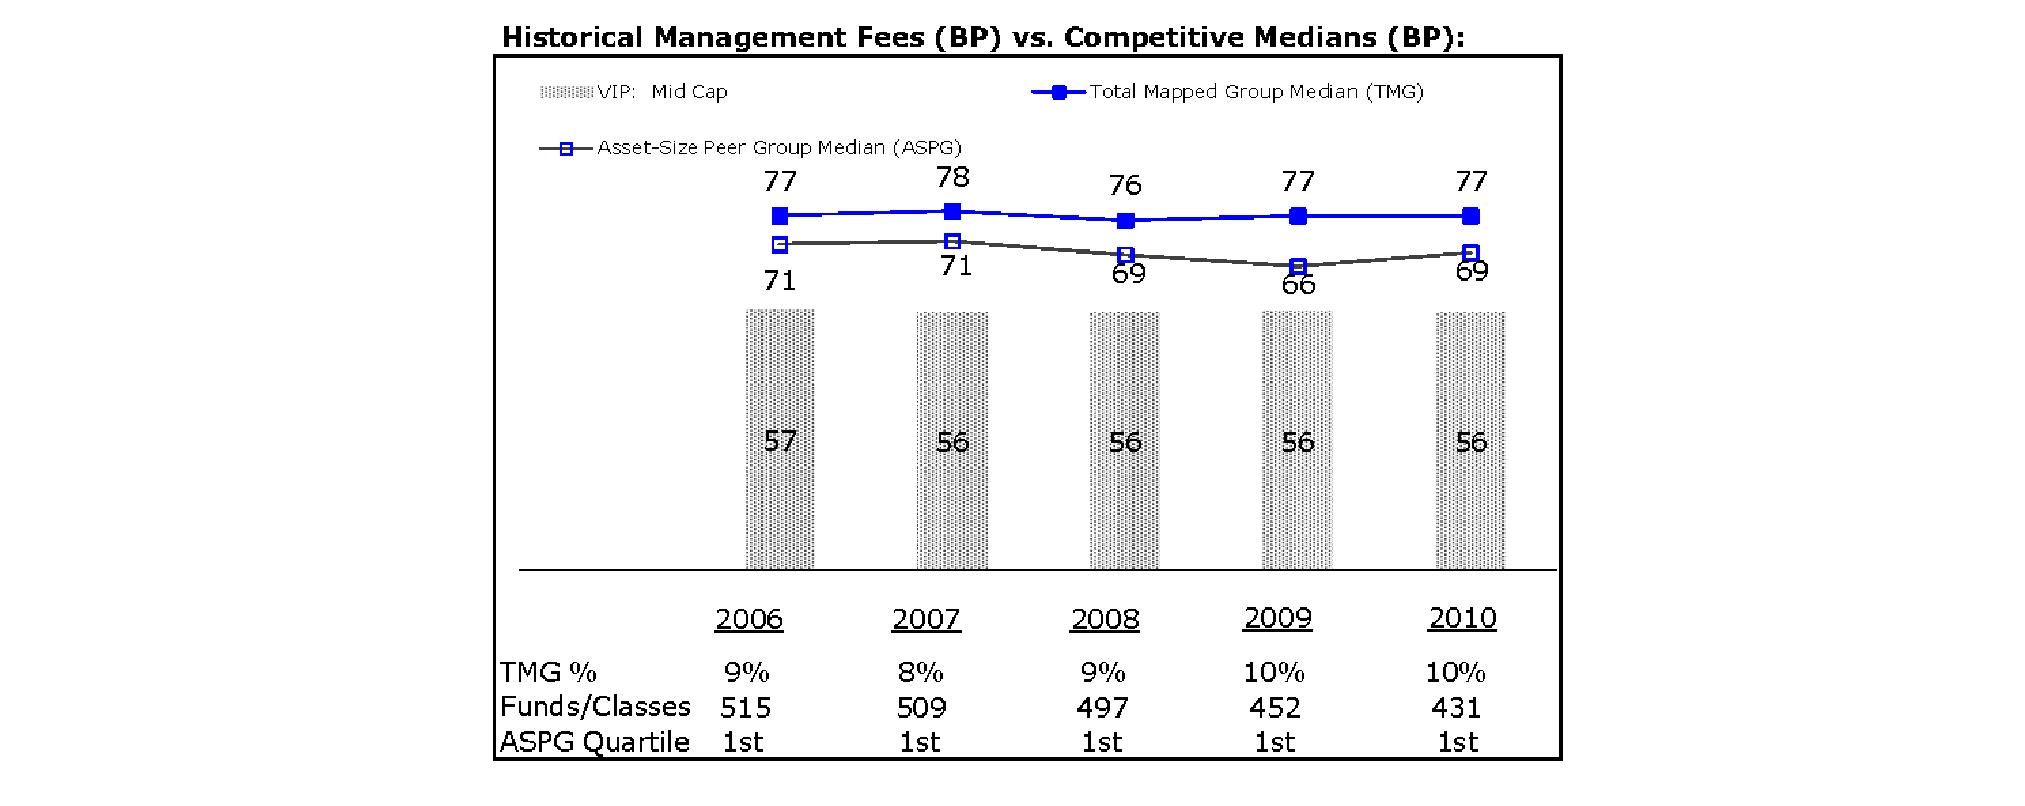
The Board noted that the fund's management fee ranked below the median of its Total Mapped Group and below the median of its ASPG for 2010.
Based on its review, the Board concluded that the fund's management fee is fair and reasonable in light of the services that the fund receives and the other factors considered.
Total Expense Ratio. In its review of each class's total expense ratio, the Board considered the fund's management fee as well as other fund or class expenses, as applicable, such as transfer agent fees, pricing and bookkeeping fees, fund-paid 12b-1 fees, and custodial, legal, and audit fees. The Board also noted the effects of any waivers and reimbursements on fees and expenses. As part of its review, the Board also considered the current and historical total expense ratios of each class of the fund compared to competitive fund median expenses. Each class of the fund is compared to those funds and classes in the Total Mapped Group (used by the Board for management fee comparisons) that have a similar sales load structure.
The Board noted that the total expense ratio of each class ranked below its competitive median for 2010. The Board considered that various factors, including 12b-1 fees, positive or negative performance adjustments, and relatively higher other expenses in the case of small fund size, can affect total expense ratios. The Board also noted that Investor Class has higher transfer agent fees than traditional variable annuity classes because it is designed for lower cost annuity products, where the majority of servicing costs are incorporated into the funds' total expense ratios rather than being paid at the annuity level.
Fees Charged to Other Fidelity Clients. The Board also considered Fidelity fee structures and other information with respect to clients of FMR and its affiliates, such as other mutual funds advised or subadvised by FMR or its affiliates, pension plan clients, and other institutional clients. In March 2010, the Board created an ad hoc joint committee with the board of other Fidelity funds (the Committee) to review and compare Fidelity's institutional investment advisory business with its business of providing services to the Fidelity funds, including the differences in services provided, fees charged, and costs incurred, as well as competition in their respective marketplaces.
Annual Report
Based on its review of total expense ratios and fees charged to other Fidelity clients, the Board concluded that the total expense ratio of each class of the fund was reasonable in light of the services that the fund and its shareholders receive and the other factors considered, including the findings of the Committee.
Costs of the Services and Profitability. The Board considered the revenues earned and the expenses incurred by Fidelity in conducting the business of developing, marketing, distributing, managing, administering and servicing the fund and its shareholders. The Board also considered the level of Fidelity's profits in respect of all the Fidelity funds.
On an annual basis, FMR presents to the Board Fidelity's profitability for the fund. Fidelity calculates the profitability for each fund, as well as aggregate profitability for groups of Fidelity funds and all Fidelity funds, using a series of detailed revenue and cost allocation methodologies which originate with the books and records of Fidelity on which Fidelity's audited financial statements are based. The Audit Committee of the Board reviews any significant changes from the prior year's methodologies.
PricewaterhouseCoopers LLP (PwC), independent registered public accounting firm and auditor to Fidelity and certain Fidelity funds, has been engaged annually by the Board as part of the Board's assessment of Fidelity's profitability analysis. PwC's engagement includes the review and assessment of Fidelity's methodologies used in determining the revenues and expenses attributable to Fidelity's mutual fund business, and completion of agreed-upon procedures surrounding the mathematical accuracy of fund profitability and its conformity to allocation methodologies. After considering PwC's reports issued under the engagement and information provided by Fidelity, the Board concluded that while other allocation methods may also be reasonable, Fidelity's profitability methodologies are reasonable in all material respects.
The Board also reviewed Fidelity's non-fund businesses and fall-out benefits related to the mutual fund business as well as cases where Fidelity's affiliates may benefit from or be related to the fund's business.
The Board considered the costs of the services provided by and the profits realized by Fidelity in connection with the operation of the fund and was satisfied that the profitability was not excessive in the circumstances.
Economies of Scale. The Board considered whether there have been economies of scale in respect of the management of the Fidelity funds, whether the Fidelity funds (including the fund) have appropriately benefited from any such economies of scale, and whether there is potential for realization of any further economies of scale. The Board considered the extent to which the fund will benefit from economies of scale through increased services to the fund, through waivers or reimbursements, or through fee or expense reductions. The Board also noted that in 2009, it and the board of other Fidelity funds created an ad hoc committee (the Economies of Scale Committee) to analyze whether FMR attains economies of scale in respect of the management and servicing of the Fidelity funds, whether the Fidelity funds have appropriately benefited from such economies of scale, and whether there is potential for realization of any further economies of scale.
The Board recognized that the fund's management contract incorporates a "group fee" structure, which provides for lower group fee rates as total fund assets under FMR's management increase, and for higher group fee rates as total fund assets under FMR's management decrease. FMR calculates the group fee rates based on a tiered asset "breakpoint" schedule that varies based on asset class. The Board considered that the group fee is designed to deliver the benefits of economies of scale to fund shareholders when total Fidelity fund assets increase, even if assets of any particular fund are unchanged or have declined, because some portion of Fidelity's costs are attributable to services provided to all Fidelity funds, and all funds benefit if those costs can be allocated among more assets. The Board concluded that, given the group fee structure, fund shareholders will benefit from lower management fees as assets under FMR's management increase at the fund complex level, regardless of whether Fidelity achieves any such economies of scale.
The Board concluded, taking into account the analysis of the Economies of Scale Committee, that any potential economies of scale are being appropriately shared between fund shareholders and Fidelity.
Additional Information Requested by the Board. In order to develop fully the factual basis for consideration of the Fidelity funds' Advisory Contracts, the Board requested and received additional information on certain topics, including (i) fund performance trends, actions to be taken by FMR to improve certain funds' overall performance, and Fidelity's long-term strategies for certain funds; (ii) portfolio manager changes that have occurred during the past year and length of portfolio manager tenure for different categories of funds over time; (iii) Fidelity's compensation structure for portfolio managers and other key personnel and strategies for attracting and retaining non-investment personnel; (iv) the amount of the investment that each portfolio manager has made in the Fidelity fund(s) that he or she manages; (v) historical trends in Fidelity's realization of fall-out benefits; (vi) Fidelity's group fee structures and the rationale for the individual fee rates of certain funds; (vii) fund profitability methodology and the impact of certain factors on fund profitability results; (viii) trends regarding industry use of performance fee structures and Fidelity's compliance practices with respect to performance adjustment calculations; (ix) the fee structures in place for certain other Fidelity clients; and (x) explanations regarding the relative total expense ratios of certain funds and classes, total expense competitive trends, and actions that might be taken by FMR to reduce total expense ratios for certain funds and classes.
Based on its evaluation of all of the conclusions noted above, and after considering all factors it believed relevant, the Board ultimately concluded that the advisory fee structures are fair and reasonable, and that the fund's Advisory Contracts should be renewed.
Annual Report
Investment Adviser
Fidelity Management & Research Company
Boston, MA
Investment Sub-Advisers
FMR Co., Inc.
Fidelity Management & Research (Hong Kong) Limited
Fidelity Management & Research (Japan) Inc.
Fidelity Management & Research (U.K.) Inc.
General Distributor
Fidelity Distributors Corporation
Boston, MA
Transfer and Service Agents
Fidelity Investments Institutional Operations Company, Inc.
Boston, MA
Fidelity Service Company, Inc.
Boston, MA
Custodian
Brown Brothers Harriman & Co.
Boston, MA
VIPMID-ANN-0212
1.735273.112
Fidelity® Variable Insurance Products:
Growth Opportunities Portfolio
Annual Report
December 31, 2011
Contents
Performance | (Click Here) | How the fund has done over time. |
Management's Discussion of Fund Performance | (Click Here) | The Portfolio Manager's review of fund performance and strategy. |
Shareholder Expense Example | (Click Here) | An example of shareholder expenses. |
Investment Changes | (Click Here) | A summary of major shifts in the fund's investments over the past six months. |
Investments | (Click Here) | A complete list of the fund's investments with their market values. |
Financial Statements | (Click Here) | Statements of assets and liabilities, operations, and changes in net assets, as well as financial highlights. |
Notes | (Click Here) | Notes to the financial statements. |
Report of Independent Registered Public Accounting Firm | (Click Here) | |
Trustees and Officers | (Click Here) | |
Distributions | (Click Here) | |
Board Approval of Investment Advisory Contracts and Management Fees | (Click Here) | |
To view a fund's proxy voting guidelines and proxy voting record for the 12-month period ended June 30, visit http://www.fidelity.com/proxyvotingresults or visit the Securities and Exchange Commission's (SEC) web site at http://www.sec.gov. You may also call 1-877-208-0098 to request a free copy of the proxy voting guidelines.
Fidelity® Variable Insurance Products are separate account options which are purchased through a variable insurance contract.
Standard & Poor's, S&P and S&P 500 are registered service marks of The McGraw-Hill Companies, Inc. and have been licensed for use by Fidelity Distributors Corporation.
Other third party marks appearing herein are the property of their respective owners.
All other marks appearing herein are registered or unregistered trademarks or service marks of FMR LLC or an affiliated company.
This report and the financial statements contained herein are submitted for the general information of the shareholders of the fund. This report is not authorized for distribution to prospective investors in the fund unless preceded or accompanied by an effective prospectus.
A fund files its complete schedule of portfolio holdings with the SEC for the first and third quarters of each fiscal year on Form N-Q. Forms N-Q are available on the SEC's web site at http://www.sec.gov. A fund's Forms N-Q may be reviewed and copied at the SEC's Public Reference Room in Washington, DC. Information regarding the operation of the SEC's Public Reference Room may be obtained by calling 1-800-SEC-0330. For a complete list of a fund's portfolio holdings, view the most recent holdings listing, semiannual report, or annual report on Fidelity's web site at http://www.fidelity.com, http://www.advisor.fidelity.com, or http://www.401k.com, as applicable.
NOT FDIC INSURED • MAY LOSE VALUE • NO BANK GUARANTEE
Neither the fund nor Fidelity Distributors Corporation is a bank.
Annual Report
Average annual total return reflects the change in the value of an investment, assuming reinvestment of the class' distributions from dividend income and capital gains (the profits earned upon the sale of securities that have grown in value, if any) and assuming a constant rate of performance each year. During periods of reimbursement by Fidelity, a fund's total return will be greater than it would be had the reimbursement not occurred. Performance numbers are net of all underlying fund operating expenses, but do not include any insurance charges imposed by your insurance company's separate account. If performance information included the effect of these additional charges, the total returns would have been lower. How a fund did yesterday is no guarantee of how it will do tomorrow.
Average Annual Total Returns
Periods ended December 31, 2011 | Past 1
year | Past 5
years | Past 10
years |
VIP Growth Opportunities Portfolio - Initial Class A | 2.30% | 0.46% | 2.48% |
VIP Growth Opportunities Portfolio - Service Class A | 2.18% | 0.36% | 2.38% |
VIP Growth Opportunities Portfolio - Service Class 2 A | 1.97% | 0.20% | 2.21% |
VIP Growth Opportunities Portfolio - Investor Class A,B | 2.18% | 0.35% | 2.41% |
A Prior to February 1, 2007, VIP Growth Opportunities Portfolio operated under certain different investment policies. The fund's historical performance may not represent its current investment policies.
B The initial offering of Investor Class took place on July 21, 2005. Returns prior to July 21, 2005 are those of Initial Class. Had Investor Class's transfer agent fee been reflected, returns prior to July 21, 2005 would have been lower.
$10,000 Over 10 Years
Let's say hypothetically that $10,000 was invested in VIP Growth Opportunities Portfolio - Initial Class on December 31, 2001. The chart shows how the value of your investment would have changed, and also shows how the Russell 1000® Growth Index performed over the same period.
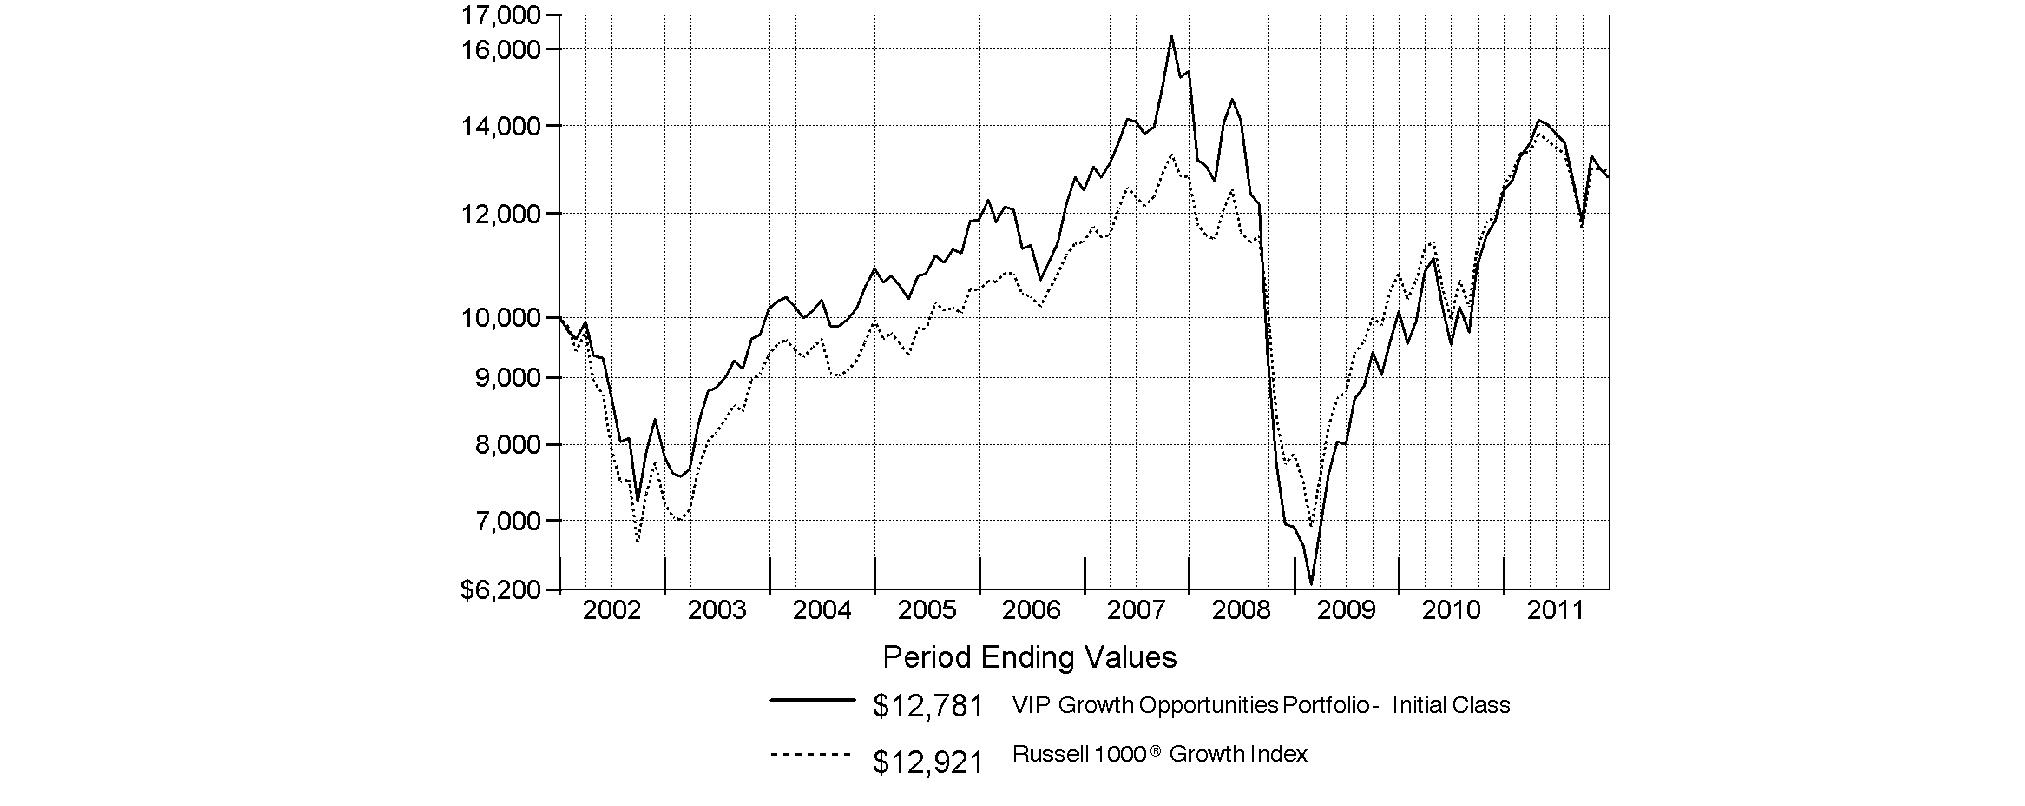
Annual Report
Market Recap: Extreme market volatility took center stage during the 12 months ending December 31, 2011, stealing the spotlight from signs of progress in the global economy. Early in the year, aggressive monetary stimulus by the U.S. federal government, improving credit-market conditions and solid corporate earnings buoyed most major asset classes. As the period progressed, however, fresh worries about sovereign debt in Europe, inflation in China, gridlock over raising the debt ceiling in the U.S. - along with Standard & Poor's early-August downgrade of the nation's long-term sovereign credit rating - and a dimmed outlook for global growth punctured investor confidence and ignited market instability. Domestic equities, as measured by the broad-based S&P 500® Index, gained 2.11%, easily outpacing the 13.61% decline of MSCI® ACWI® (All Country World Index) ex USA Index, a proxy for foreign stocks. Within the MSCI index, emerging markets declined the most (-18%), with investments here generally held back by a stronger U.S. dollar. The U.K. (-3%) fared better than the rest of Europe (-15%), which was the second-worst-performing index component. Bolstered by periodic flights to quality, U.S. investment-grade bonds posted a 7.84% advance, as reflected by the Barclays Capital® U.S. Aggregate Bond Index, outperforming the 4.37% gain of high-yield securities, as represented by The BofA Merrill LynchSM US High Yield Constrained Index. Hampered by financial woes in Europe, the sovereign debt of major developed markets outside the U.S. rose 4.86%, according to the Citigroup® Non-USD Group-of-Seven (G7) Equal Weighted Index, while the JPMorgan Emerging Markets Bond Index Global (EMBI Global) advanced 8.46%, despite the currency head wind.
Comments from Steven Wymer, Portfolio Manager of VIP Growth Opportunities Portfolio: For the 12 months ending December 31, 2011, the fund's share classes lagged the 2.64% gain of the Russell 1000® Growth Index. (For specific portfolio results, please refer to the performance section of this report.) An overweighting and poor stock picking in information technology proved to be the biggest drag on performance, with particularly weak results in the semiconductor and software/services areas. In the former group, shares of Rambus - the fund's biggest individual detractor - plummeted in November when the firm lost an antitrust lawsuit. A stake in video graphics processor manufacturer NVIDIA also hurt here. Within software/services, shares of cloud-computing platform provider salesforce.com struggled, while an underweighting in industry giant International Business Machines hurt when the company's stock performed well. We also had disappointing results from shares of Riverbed Technology in the hardware/equipment space. A few pharmaceutical/biotechnology stocks lost ground and partially offset the fund's overall strong gains in health care, including Human Genome Sciences and drug discovery firm Exelixis. Unfavorable positioning in energy also was costly. On the positive side, strong stock picking and an overweighting in health care helped relative to the index, particularly in the pharmaceuticals/biotechnology/life science area, which accounted for four of the fund's top-six relative contributors. Pharmasset, Regeneron Pharmaceuticals, Ireland-based Elan and Cepheid all were instrumental here. Pharmasset's shares soared in November when Gilead Sciences announced that it would acquire the company. Regeneron, Elan and Cepheid all benefited from positive business fundamentals during the period. Consumer durables/apparel also helped, including a stake in upscale yoga apparel manufacturer and retailer lululemon athletica. Within tech, despite disappointing results overall, a stake in cloud-computing-based software provider SuccessFactors contributed as its stock price got a big boost in early December, when Germany's SAP announced that it would acquire the firm. Positioning in industrials also helped versus the index. A number of these stocks were not found in the index.
The views expressed above reflect those of the portfolio manager(s) only through the end of the period as stated on the cover of this report and do not necessarily represent the views of Fidelity or any other person in the Fidelity organization. Any such views are subject to change at any time based upon market or other conditions and Fidelity disclaims any responsibility to update such views. These views may not be relied on as investment advice and, because investment decisions for a Fidelity fund are based on numerous factors, may not be relied on as an indication of trading intent on behalf of any Fidelity fund.
Annual Report
As a shareholder of the Fund, you incur two types of costs: (1) transaction costs, and (2) ongoing costs, including management fees, distribution and/or service (12b-1) fees and other Fund expenses. This Example is intended to help you understand your ongoing costs (in dollars) of investing in the Fund and to compare these costs with the ongoing costs of investing in other mutual funds.
The Example is based on an investment of $1,000 invested at the beginning of the period and held for the entire period (July 1, 2011 to December 31, 2011).
Actual Expenses
The first line of the accompanying table for each class of the Fund provides information about actual account values and actual expenses. You may use the information in this line, together with the amount you invested, to estimate the expenses that you paid over the period. Simply divide your account value by $1,000.00 (for example, an $8,600 account value divided by $1,000.00 = 8.6), then multiply the result by the number in the first line for a class of the Fund under the heading entitled "Expenses Paid During Period" to estimate the expenses you paid on your account during this period. The estimate of expenses does not include any fees or other expenses of any variable annuity or variable life insurance product. If they were, the estimate of expenses you paid during the period would be higher, and your ending account value would be lower. In addition, the Fund, as a shareholder in the underlying Fidelity Central Funds, will indirectly bear its pro-rata share of the fees and expenses incurred by the underlying Fidelity Central Funds. These fees and expenses are not included in the Fund's annualized expense ratio used to calculate the expense estimate in the table below.
Hypothetical Example for Comparison Purposes
The second line of the accompanying table for each class of the Fund provides information about hypothetical account values and hypothetical expenses based on a Class' actual expense ratio and an assumed rate of return of 5% per year before expenses, which is not the Class' actual return. The hypothetical account values and expenses may not be used to estimate the actual ending account balance or expenses you paid for the period. You may use this information to compare the ongoing costs of investing in the Fund and other funds. To do so, compare this 5% hypothetical example with the 5% hypothetical examples that appear in the shareholder reports of the other funds. The estimate of expenses does not include any fees or other expenses of any variable annuity or variable life insurance product. If they were, the estimate of expenses you paid during the period would be higher, and your ending account value would be lower. In addition, the Fund, as a shareholder in the underlying Fidelity Central Funds, will indirectly bear its pro-rata share of the fees and expenses incurred by the underlying Fidelity Central Funds. These fees and expenses are not included in the Fund's annualized expense ratio used to calculate the expense estimate in the table below.
Please note that the expenses shown in the table are meant to highlight your ongoing costs only and do not reflect any transaction costs. Therefore, the second line of the table is useful in comparing ongoing costs only, and will not help you determine the relative total costs of owning different funds.
| Annualized
Expense Ratio | Beginning
Account Value
July 1, 2011 | Ending
Account Value
December 31, 2011 | Expenses Paid
During Period*
July 1, 2011 to
December 31, 2011 |
Initial Class | .70% | | | |
Actual | | $ 1,000.00 | $ 927.50 | $ 3.40 |
Hypothetical A | | $ 1,000.00 | $ 1,021.68 | $ 3.57 |
Service Class | .80% | | | |
Actual | | $ 1,000.00 | $ 927.20 | $ 3.89 |
Hypothetical A | | $ 1,000.00 | $ 1,021.17 | $ 4.08 |
Service Class 2 | .95% | | | |
Actual | | $ 1,000.00 | $ 925.90 | $ 4.61 |
Hypothetical A | | $ 1,000.00 | $ 1,020.42 | $ 4.84 |
Investor Class | .78% | | | |
Actual | | $ 1,000.00 | $ 927.10 | $ 3.79 |
Hypothetical A | | $ 1,000.00 | $ 1,021.27 | $ 3.97 |
A 5% return per year before expenses
* Expenses are equal to each Class' annualized expense ratio, multiplied by the average account value over the period, multiplied by 184/365 (to reflect the one-half year period).
Annual Report
Investment Changes (Unaudited)
Top Ten Stocks as of December 31, 2011 |
| % of fund's
net assets | % of fund's net assets
6 months ago |
Apple, Inc. | 7.1 | 5.4 |
Google, Inc. Class A | 3.7 | 2.2 |
Exxon Mobil Corp. | 3.4 | 3.0 |
salesforce.com, Inc. | 2.6 | 3.0 |
Regeneron Pharmaceuticals, Inc. | 2.0 | 2.1 |
lululemon athletica, Inc. | 1.9 | 2.0 |
Silicon Laboratories, Inc. | 1.8 | 1.5 |
Philip Morris International, Inc. | 1.7 | 1.4 |
Cypress Semiconductor Corp. | 1.7 | 1.9 |
NVIDIA Corp. | 1.7 | 1.2 |
| 27.6 | |
Top Five Market Sectors as of December 31, 2011 |
| % of fund's
net assets | % of fund's net assets
6 months ago |
Information Technology | 35.4 | 35.1 |
Consumer Discretionary | 17.2 | 15.8 |
Health Care | 15.7 | 19.7 |
Energy | 9.9 | 9.3 |
Consumer Staples | 7.9 | 7.0 |
Asset Allocation (% of fund's net assets) |
As of December 31, 2011* | As of June 30, 2011** |
 | Stocks 98.6% | | | Stocks 99.4% | |
 | Short-Term
Investments and
Net Other Assets 1.4% | | | Short-Term
Investments and
Net Other Assets 0.6% | |
* Foreign investments | 7.1% | | ** Foreign investments | 6.2% | |

Annual Report
Investments December 31, 2011
Showing Percentage of Net Assets
Common Stocks - 98.6% |
| Shares | | Value |
CONSUMER DISCRETIONARY - 17.2% |
Auto Components - 0.5% |
Johnson Controls, Inc. | 9,900 | | $ 309,474 |
Tenneco, Inc. (a) | 39,900 | | 1,188,222 |
| | 1,497,696 |
Automobiles - 0.2% |
Ford Motor Co. | 47,900 | | 515,404 |
Diversified Consumer Services - 0.1% |
Weight Watchers International, Inc. | 7,900 | | 434,579 |
Hotels, Restaurants & Leisure - 5.0% |
Arcos Dorados Holdings, Inc. | 32,000 | | 656,960 |
BJ's Restaurants, Inc. (a) | 65,600 | | 2,972,992 |
Buffalo Wild Wings, Inc. (a) | 9,300 | | 627,843 |
Chipotle Mexican Grill, Inc. (a) | 4,700 | | 1,587,378 |
Dunkin' Brands Group, Inc. (a) | 44,500 | | 1,111,610 |
Hyatt Hotels Corp. Class A (a) | 29,300 | | 1,102,852 |
Las Vegas Sands Corp. warrants 11/16/13 (a) | 2,600 | | 1,595,530 |
McDonald's Corp. | 35,700 | | 3,581,781 |
Starbucks Corp. | 40,900 | | 1,881,809 |
Starwood Hotels & Resorts Worldwide, Inc. | 19,800 | | 949,806 |
The Cheesecake Factory, Inc. (a)(d) | 18,400 | | 540,040 |
| | 16,608,601 |
Household Durables - 1.9% |
iRobot Corp. (a) | 10,600 | | 316,410 |
Lennar Corp. Class A | 143,400 | | 2,817,810 |
SodaStream International Ltd. (a) | 16,400 | | 536,116 |
Tempur-Pedic International, Inc. (a) | 17,100 | | 898,263 |
Toll Brothers, Inc. (a) | 58,500 | | 1,194,570 |
Tupperware Brands Corp. | 12,100 | | 677,237 |
| | 6,440,406 |
Internet & Catalog Retail - 1.4% |
Amazon.com, Inc. (a) | 23,500 | | 4,067,850 |
Groupon, Inc. Class A (a)(d) | 37,000 | | 763,310 |
| | 4,831,160 |
Media - 1.1% |
Comcast Corp. Class A | 13,800 | | 327,198 |
DIRECTV (a) | 29,200 | | 1,248,592 |
DreamWorks Animation SKG, Inc.
Class A (a) | 8,300 | | 137,739 |
Lions Gate Entertainment Corp. (a) | 28,600 | | 237,952 |
Pandora Media, Inc. (d) | 98,900 | | 989,989 |
The Walt Disney Co. | 20,900 | | 783,750 |
| | 3,725,220 |
Multiline Retail - 0.6% |
JCPenney Co., Inc. | 31,450 | | 1,105,468 |
Target Corp. | 18,400 | | 942,448 |
| | 2,047,916 |
|
| Shares | | Value |
Specialty Retail - 2.0% |
Abercrombie & Fitch Co. Class A | 9,300 | | $ 454,212 |
Bed Bath & Beyond, Inc. (a) | 10,300 | | 597,091 |
DSW, Inc. Class A | 35,200 | | 1,556,192 |
Francescas Holdings Corp. (a) | 8,700 | | 150,510 |
Home Depot, Inc. | 28,100 | | 1,181,324 |
Jos. A. Bank Clothiers, Inc. (a) | 7,700 | | 375,452 |
Lumber Liquidators Holdings, Inc. (a)(d) | 59,100 | | 1,043,706 |
Staples, Inc. | 22,800 | | 316,692 |
Teavana Holdings, Inc. (a)(d) | 500 | | 9,390 |
Ulta Salon, Cosmetics & Fragrance, Inc. (a) | 16,900 | | 1,097,148 |
| | 6,781,717 |
Textiles, Apparel & Luxury Goods - 4.4% |
Coach, Inc. | 30,600 | | 1,867,824 |
Fossil, Inc. (a) | 29,200 | | 2,317,312 |
lululemon athletica, Inc. (a)(d) | 135,672 | | 6,330,456 |
Michael Kors Holdings Ltd. | 40,900 | | 1,114,525 |
NIKE, Inc. Class B | 14,200 | | 1,368,454 |
Steven Madden Ltd. (a) | 38,150 | | 1,316,175 |
Vera Bradley, Inc. (a)(d) | 18,800 | | 606,300 |
| | 14,921,046 |
TOTAL CONSUMER DISCRETIONARY | | 57,803,745 |
CONSUMER STAPLES - 7.9% |
Beverages - 1.7% |
PepsiCo, Inc. | 30,800 | | 2,043,580 |
The Coca-Cola Co. | 53,900 | | 3,771,383 |
| | 5,814,963 |
Food & Staples Retailing - 1.8% |
Costco Wholesale Corp. | 13,000 | | 1,083,160 |
Drogasil SA | 4,581 | | 31,889 |
Fresh Market, Inc. (a) | 11,200 | | 446,880 |
Wal-Mart Stores, Inc. | 40,300 | | 2,408,328 |
Walgreen Co. | 20,000 | | 661,200 |
Whole Foods Market, Inc. | 17,500 | | 1,217,650 |
| | 5,849,107 |
Food Products - 0.4% |
Green Mountain Coffee Roasters, Inc. (a) | 32,700 | | 1,466,595 |
Household Products - 0.3% |
Church & Dwight Co., Inc. | 13,800 | | 631,488 |
Procter & Gamble Co. | 7,000 | | 466,970 |
| | 1,098,458 |
Personal Products - 1.5% |
Avon Products, Inc. | 11,758 | | 205,412 |
Herbalife Ltd. | 91,800 | | 4,743,306 |
| | 4,948,718 |
Common Stocks - continued |
| Shares | | Value |
CONSUMER STAPLES - continued |
Tobacco - 2.2% |
Altria Group, Inc. | 53,500 | | $ 1,586,275 |
Philip Morris International, Inc. | 73,900 | | 5,799,672 |
| | 7,385,947 |
TOTAL CONSUMER STAPLES | | 26,563,788 |
ENERGY - 9.9% |
Energy Equipment & Services - 2.7% |
Carbo Ceramics, Inc. | 2,900 | | 357,657 |
FMC Technologies, Inc. (a) | 13,860 | | 723,908 |
Halliburton Co. | 43,500 | | 1,501,185 |
National Oilwell Varco, Inc. | 16,103 | | 1,094,843 |
Schlumberger Ltd. | 76,600 | | 5,232,546 |
| | 8,910,139 |
Oil, Gas & Consumable Fuels - 7.2% |
Anadarko Petroleum Corp. | 14,400 | | 1,099,152 |
Chesapeake Energy Corp. | 84,236 | | 1,877,620 |
Chevron Corp. | 16,900 | | 1,798,160 |
Concho Resources, Inc. (a) | 9,800 | | 918,750 |
EOG Resources, Inc. | 3,400 | | 334,934 |
Exxon Mobil Corp. | 134,200 | | 11,374,792 |
Hess Corp. | 19,800 | | 1,124,640 |
Noble Energy, Inc. | 6,100 | | 575,779 |
Occidental Petroleum Corp. | 25,600 | | 2,398,720 |
Peabody Energy Corp. | 9,700 | | 321,167 |
Range Resources Corp. | 6,700 | | 414,998 |
Solazyme, Inc. | 4,600 | | 54,740 |
Southwestern Energy Co. (a) | 39,507 | | 1,261,854 |
Valero Energy Corp. | 31,400 | | 660,970 |
| | 24,216,276 |
TOTAL ENERGY | | 33,126,415 |
FINANCIALS - 3.0% |
Capital Markets - 0.4% |
Charles Schwab Corp. | 44,200 | | 497,692 |
Goldman Sachs Group, Inc. | 4,509 | | 407,749 |
Morgan Stanley | 9,000 | | 136,170 |
T. Rowe Price Group, Inc. | 5,500 | | 313,225 |
| | 1,354,836 |
Commercial Banks - 0.3% |
Signature Bank, New York (a) | 9,100 | | 545,909 |
Wells Fargo & Co. | 18,600 | | 512,616 |
| | 1,058,525 |
Consumer Finance - 1.3% |
Discover Financial Services | 176,800 | | 4,243,200 |
Diversified Financial Services - 0.8% |
BM&F Bovespa SA | 119,429 | | 628,169 |
|
| Shares | | Value |
CME Group, Inc. | 900 | | $ 219,303 |
JPMorgan Chase & Co. | 52,900 | | 1,758,925 |
| | 2,606,397 |
Real Estate Investment Trusts - 0.1% |
Simon Property Group, Inc. | 4,087 | | 526,978 |
Real Estate Management & Development - 0.1% |
The St. Joe Co. (a) | 25,000 | | 366,500 |
TOTAL FINANCIALS | | 10,156,436 |
HEALTH CARE - 15.7% |
Biotechnology - 12.1% |
Alexion Pharmaceuticals, Inc. (a) | 15,100 | | 1,079,650 |
Alkermes PLC (a) | 172,700 | | 2,998,072 |
Amarin Corp. PLC ADR (a) | 42,200 | | 316,078 |
Amylin Pharmaceuticals, Inc. (a) | 55,600 | | 632,728 |
Celgene Corp. (a) | 11,965 | | 808,834 |
Cepheid, Inc. (a) | 71,700 | | 2,467,197 |
Exelixis, Inc. (a) | 403,328 | | 1,909,758 |
Human Genome Sciences, Inc. (a) | 188,300 | | 1,391,537 |
ImmunoGen, Inc. (a)(d) | 267,763 | | 3,100,696 |
Immunomedics, Inc. (a)(d) | 284,700 | | 948,051 |
InterMune, Inc. (a) | 57,700 | | 727,020 |
Isis Pharmaceuticals, Inc. (a)(d) | 200,200 | | 1,443,442 |
Lexicon Pharmaceuticals, Inc. (a)(d) | 1,504,263 | | 1,940,499 |
Metabolix, Inc. (a)(d) | 153,605 | | 698,903 |
Micromet, Inc. (a)(d) | 182,255 | | 1,310,413 |
NPS Pharmaceuticals, Inc. (a) | 55,000 | | 362,450 |
Pharmasset, Inc. (a) | 35,320 | | 4,528,024 |
Regeneron Pharmaceuticals, Inc. (a)(d) | 118,100 | | 6,546,283 |
Rigel Pharmaceuticals, Inc. (a) | 162,400 | | 1,281,336 |
Seattle Genetics, Inc. (a)(d) | 317,438 | | 5,305,976 |
Transition Therapeutics, Inc. (a) | 148,408 | | 203,319 |
Transition Therapeutics, Inc. (f) | 23,906 | | 29,476 |
Vertex Pharmaceuticals, Inc. (a) | 17,000 | | 564,570 |
| | 40,594,312 |
Health Care Equipment & Supplies - 0.1% |
Baxter International, Inc. | 8,900 | | 440,372 |
Health Care Providers & Services - 0.7% |
Express Scripts, Inc. (a) | 17,700 | | 791,013 |
McKesson Corp. | 8,800 | | 685,608 |
Medco Health Solutions, Inc. (a) | 12,800 | | 715,520 |
| | 2,192,141 |
Health Care Technology - 0.1% |
athenahealth, Inc. (a) | 6,200 | | 304,544 |
Life Sciences Tools & Services - 0.0% |
Illumina, Inc. (a) | 3,200 | | 97,536 |
Pharmaceuticals - 2.7% |
Abbott Laboratories | 33,100 | | 1,861,213 |
Allergan, Inc. | 16,800 | | 1,474,032 |
Elan Corp. PLC sponsored ADR (a) | 219,900 | | 3,021,426 |
Endocyte, Inc. | 36,100 | | 135,736 |
Common Stocks - continued |
| Shares | | Value |
HEALTH CARE - continued |
Pharmaceuticals - continued |
GlaxoSmithKline PLC sponsored ADR | 14,600 | | $ 666,198 |
Johnson & Johnson | 10,700 | | 701,706 |
MAP Pharmaceuticals, Inc. (a) | 76,416 | | 1,006,399 |
| | 8,866,710 |
TOTAL HEALTH CARE | | 52,495,615 |
INDUSTRIALS - 6.6% |
Aerospace & Defense - 1.3% |
Exelis, Inc. | 10,300 | | 93,215 |
Honeywell International, Inc. | 22,900 | | 1,244,615 |
The Boeing Co. | 40,600 | | 2,978,010 |
| | 4,315,840 |
Air Freight & Logistics - 0.8% |
United Parcel Service, Inc. Class B | 39,100 | | 2,861,729 |
Airlines - 0.2% |
JetBlue Airways Corp. (a) | 115,700 | | 601,640 |
United Continental Holdings, Inc. (a) | 14,500 | | 273,615 |
| | 875,255 |
Construction & Engineering - 0.4% |
Fluor Corp. | 5,400 | | 271,350 |
Orascom Construction Industries SAE GDR | 18,000 | | 610,200 |
Quanta Services, Inc. (a) | 15,841 | | 341,215 |
| | 1,222,765 |
Electrical Equipment - 0.2% |
Roper Industries, Inc. | 6,500 | | 564,655 |
Industrial Conglomerates - 1.2% |
3M Co. | 11,900 | | 972,587 |
Danaher Corp. | 47,500 | | 2,234,400 |
General Electric Co. | 40,900 | | 732,519 |
| | 3,939,506 |
Machinery - 1.3% |
Caterpillar, Inc. | 29,700 | | 2,690,820 |
Cummins, Inc. | 6,200 | | 545,724 |
Deere & Co. | 9,600 | | 742,560 |
ITT Corp. | 5,150 | | 99,550 |
Xylem, Inc. | 10,300 | | 264,607 |
| | 4,343,261 |
Road & Rail - 1.2% |
CSX Corp. | 54,400 | | 1,145,664 |
Union Pacific Corp. | 27,900 | | 2,955,726 |
| | 4,101,390 |
TOTAL INDUSTRIALS | | 22,224,401 |
INFORMATION TECHNOLOGY - 35.4% |
Communications Equipment - 3.4% |
Acme Packet, Inc. (a) | 3,600 | | 111,276 |
|
| Shares | | Value |
F5 Networks, Inc. (a) | 4,000 | | $ 424,480 |
Infinera Corp. (a)(d) | 225,900 | | 1,418,652 |
Juniper Networks, Inc. (a) | 15,600 | | 318,396 |
QUALCOMM, Inc. | 100,295 | | 5,486,137 |
Riverbed Technology, Inc. (a) | 150,900 | | 3,546,150 |
| | 11,305,091 |
Computers & Peripherals - 8.3% |
Apple, Inc. (a) | 59,042 | | 23,912,008 |
Fusion-io, Inc. (d) | 99,400 | | 2,405,480 |
NetApp, Inc. (a) | 11,800 | | 427,986 |
SanDisk Corp. (a) | 18,000 | | 885,780 |
Silicon Graphics International Corp. (a)(d) | 39,079 | | 447,845 |
| | 28,079,099 |
Electronic Equipment & Components - 0.1% |
Corning, Inc. | 23,000 | | 298,540 |
Internet Software & Services - 5.4% |
Angie's List, Inc. (d) | 1,300 | | 20,930 |
Baidu.com, Inc. sponsored ADR (a) | 15,700 | | 1,828,579 |
Cornerstone OnDemand, Inc. (d) | 23,400 | | 426,816 |
eBay, Inc. (a) | 54,100 | | 1,640,853 |
Facebook, Inc. Class B (f) | 16,196 | | 404,900 |
Google, Inc. Class A (a) | 19,430 | | 12,549,837 |
Mail.ru Group Ltd. GDR (a)(e) | 700 | | 18,200 |
OpenTable, Inc. (a)(d) | 2,300 | | 89,999 |
Rackspace Hosting, Inc. (a) | 31,600 | | 1,359,116 |
| | 18,339,230 |
IT Services - 3.5% |
Cognizant Technology Solutions Corp. Class A (a) | 34,232 | | 2,201,460 |
International Business Machines Corp. | 21,600 | | 3,971,808 |
MasterCard, Inc. Class A | 6,000 | | 2,236,920 |
VeriFone Systems, Inc. (a) | 11,900 | | 422,688 |
Visa, Inc. Class A | 28,300 | | 2,873,299 |
| | 11,706,175 |
Semiconductors & Semiconductor Equipment - 7.1% |
Advanced Micro Devices, Inc. (a) | 43,800 | | 236,520 |
Analog Devices, Inc. | 4,900 | | 175,322 |
Applied Materials, Inc. | 33,000 | | 353,430 |
Applied Micro Circuits Corp. (a) | 28,000 | | 188,160 |
Atmel Corp. (a) | 25,100 | | 203,310 |
Broadcom Corp. Class A | 20,000 | | 587,200 |
Cree, Inc. (a) | 63,400 | | 1,397,336 |
Cypress Semiconductor Corp. | 342,900 | | 5,791,581 |
Intel Corp. | 13,900 | | 337,075 |
NVIDIA Corp. (a) | 415,600 | | 5,760,216 |
Rambus, Inc. (a)(d) | 284,500 | | 2,147,975 |
Silicon Image, Inc. (a) | 60,200 | | 282,940 |
Silicon Laboratories, Inc. (a) | 137,200 | | 5,957,224 |
Xilinx, Inc. | 11,400 | | 365,484 |
| | 23,783,773 |
Common Stocks - continued |
| Shares | | Value |
INFORMATION TECHNOLOGY - continued |
Software - 7.6% |
Citrix Systems, Inc. (a) | 15,200 | | $ 922,944 |
Jive Software, Inc. | 8,800 | | 140,800 |
Microsoft Corp. | 153,500 | | 3,984,860 |
NetSuite, Inc. (a) | 15,100 | | 612,305 |
Oracle Corp. | 88,600 | | 2,272,590 |
QLIK Technologies, Inc. (a) | 44,200 | | 1,069,640 |
RealPage, Inc. (a) | 15,700 | | 396,739 |
Red Hat, Inc. (a) | 111,900 | | 4,620,351 |
salesforce.com, Inc. (a) | 87,524 | | 8,880,185 |
Solera Holdings, Inc. | 14,200 | | 632,468 |
TiVo, Inc. (a) | 115,500 | | 1,036,035 |
VMware, Inc. Class A (a) | 6,400 | | 532,416 |
Zynga, Inc. | 35,300 | | 332,173 |
| | 25,433,506 |
TOTAL INFORMATION TECHNOLOGY | | 118,945,414 |
MATERIALS - 2.9% |
Chemicals - 1.9% |
Dow Chemical Co. | 30,200 | | 868,552 |
E.I. du Pont de Nemours & Co. | 20,800 | | 952,224 |
Monsanto Co. | 55,800 | | 3,909,906 |
The Mosaic Co. | 12,600 | | 635,418 |
| | 6,366,100 |
Metals & Mining - 1.0% |
Barrick Gold Corp. | 19,800 | | 897,260 |
Freeport-McMoRan Copper & Gold, Inc. | 35,500 | | 1,306,045 |
Molycorp, Inc. (a)(d) | 17,500 | | 419,650 |
Mongolian Mining Corp. (a) | 306,000 | | 230,093 |
Nucor Corp. | 13,800 | | 546,066 |
| | 3,399,114 |
TOTAL MATERIALS | | 9,765,214 |
TOTAL COMMON STOCKS (Cost $250,783,554) |
331,081,028
|
Money Market Funds - 8.2% |
| Shares | | Value |
Fidelity Cash Central Fund, 0.11% (b) | 4,038,558 | | $ 4,038,558 |
Fidelity Securities Lending Cash Central Fund, 0.13% (b)(c) | 23,671,106 | | 23,671,106 |
TOTAL MONEY MARKET FUNDS (Cost $27,709,664) |
27,709,664
|
TOTAL INVESTMENT PORTFOLIO - 106.8% (Cost $278,493,218) | | 358,790,692 |
NET OTHER ASSETS (LIABILITIES) - (6.8)% | | (22,895,573) |
NET ASSETS - 100% | $ 335,895,119 |
Legend |
(a) Non-income producing |
(b) Affiliated fund that is available only to investment companies and other accounts managed by Fidelity Investments. The rate quoted is the annualized seven-day yield of the fund at period end. A complete unaudited listing of the fund's holdings as of its most recent quarter end is available upon request. In addition, each Fidelity Central Fund's financial statements, which are not covered by the Fund's Report of Independent Registered Public Accounting Firm, are available on the SEC's website or upon request. |
(c) Investment made with cash collateral received from securities on loan. |
(d) Security or a portion of the security is on loan at period end. |
(e) Security exempt from registration under Rule 144A of the Securities Act of 1933. These securities may be resold in transactions exempt from registration, normally to qualified institutional buyers. At the end of the period, the value of these securities amounted to $18,200 or 0.0% of net assets. |
(f) Restricted securities - Investment in securities not registered under the Securities Act of 1933 (excluding 144A issues). At the end of the period, the value of restricted securities (excluding 144A issues) amounted to $434,376 or 0.1% of net assets. |
Additional information on each restricted holding is as follows: |
Security | Acquisition Date | Acquisition Cost |
Facebook, Inc. Class B | 3/31/11 - 5/19/11 | $ 405,011 |
Transition Therapeutics, Inc. | 11/21/11 | $ 32,273 |
Affiliated Central Funds |
Information regarding fiscal year to date income earned by the Fund from investments in Fidelity Central Funds is as follows: |
Fund | Income earned |
Fidelity Cash Central Fund | $ 3,030 |
Fidelity Securities Lending Cash Central Fund | 266,385 |
Total | $ 269,415 |
Other Information |
The following is a summary of the inputs used, as of December 31, 2011, involving the Fund's assets and liabilities carried at fair value. The inputs or methodology used for valuing securities may not be an indication of the risk associated with investing in those securities. For more information on valuation inputs, and their aggregation into the levels used in the tables below, please refer to the Security Valuation section in the accompanying Notes to Financial Statements. |
Valuation Inputs at Reporting Date: |
Description | Total | Level 1 | Level 2 | Level 3 |
Investments in Securities: | | | | |
Equities: | | | | |
Consumer Discretionary | $ 57,803,745 | $ 56,208,215 | $ 1,595,530 | $ - |
Consumer Staples | 26,563,788 | 26,563,788 | - | - |
Energy | 33,126,415 | 33,126,415 | - | - |
Financials | 10,156,436 | 10,156,436 | - | - |
Health Care | 52,495,615 | 52,466,139 | 29,476 | - |
Industrials | 22,224,401 | 22,224,401 | - | - |
Information Technology | 118,945,414 | 118,540,514 | - | 404,900 |
Materials | 9,765,214 | 9,765,214 | - | - |
Money Market Funds | 27,709,664 | 27,709,664 | - | - |
Total Investments in Securities: | $ 358,790,692 | $ 356,760,786 | $ 1,625,006 | $ 404,900 |
The following is a reconciliation of Investments in Securities for which Level 3 inputs were used in determining value: |
Investments in Securities: | |
Beginning Balance | $ - |
Total Realized Gain (Loss) | - |
Total Unrealized Gain (Loss) | (111) |
Cost of Purchases | 405,011 |
Proceeds of Sales | - |
Amortization/Accretion | - |
Transfers in to Level 3 | - |
Transfers out of Level 3 | - |
Ending Balance | $ 404,900 |
The change in unrealized gain (loss) for the period attributable to Level 3 securities held at December 31, 2011 | $ (111) |
The information used in the above reconciliation represents fiscal year to date activity for any Investments in Securities identified as using Level 3 inputs at either the beginning or the end of the current fiscal period. Transfers in or out of Level 3 represent the beginning value of any Security or Instrument where a change in the pricing level occurred from the beginning to the end of the period. The cost of purchases and the proceeds of sales may include securities received or delivered through corporate actions or exchanges. Realized and unrealized gains (losses) disclosed in the reconciliation are included in Net Gain (Loss) on the Fund's Statement of Operations. |
See accompanying notes which are an integral part of the financial statements.
Annual Report
Statement of Assets and Liabilities
| December 31, 2011 |
Assets | | |
Investment in securities, at value (including securities loaned of $22,900,048) - See accompanying schedule: Unaffiliated issuers (cost $250,783,554) | $ 331,081,028 | |
Fidelity Central Funds (cost $27,709,664) | 27,709,664 | |
Total Investments (cost $278,493,218) | | $ 358,790,692 |
Cash | | 1,910 |
Receivable for investments sold | | 794,555 |
Receivable for fund shares sold | | 136,436 |
Dividends receivable | | 252,767 |
Distributions receivable from Fidelity Central Funds | | 81,348 |
Prepaid expenses | | 897 |
Other receivables | | 6,789 |
Total assets | | 360,065,394 |
| | |
Liabilities | | |
Payable for investments purchased | $ 104,052 | |
Payable for fund shares redeemed | 144,020 | |
Accrued management fee | 157,141 | |
Distribution and service plan fees payable | 18,202 | |
Other affiliated payables | 33,280 | |
Other payables and accrued expenses | 42,474 | |
Collateral on securities loaned, at value | 23,671,106 | |
Total liabilities | | 24,170,275 |
| | |
Net Assets | | $ 335,895,119 |
Net Assets consist of: | | |
Paid in capital | | $ 348,189,358 |
Undistributed net investment income | | 43,615 |
Accumulated undistributed net realized gain (loss) on investments and foreign currency transactions | | (92,634,930) |
Net unrealized appreciation (depreciation) on investments and assets and liabilities in foreign currencies | | 80,297,076 |
Net Assets | | $ 335,895,119 |
Statement of Assets and Liabilities - continued
| December 31, 2011 |
Initial Class:
Net Asset Value, offering price and redemption price per share ($111,237,546 ÷ 6,077,957 shares) | | $ 18.30 |
| | |
Service Class:
Net Asset Value, offering price and redemption price per share ($138,842,047 ÷ 7,599,305 shares) | | $ 18.27 |
| | |
Service Class 2:
Net Asset Value, offering price and redemption price per share ($31,441,242 ÷ 1,733,754 shares) | | $ 18.13 |
| | |
Investor Class:
Net Asset Value, offering price and redemption price per share ($54,374,284 ÷ 2,982,001 shares) | | $ 18.23 |
See accompanying notes which are an integral part of the financial statements.
Annual Report
Statement of Operations
| Year ended December 31, 2011 |
Investment Income | | |
Dividends | | $ 2,785,550 |
Income from Fidelity Central Funds (including $266,385 from security lending) | | 269,415 |
Total income | | 3,054,965 |
| | |
Expenses | | |
Management fee | $ 1,973,084 | |
Transfer agent fees | 305,416 | |
Distribution and service plan fees | 241,612 | |
Accounting and security lending fees | 145,004 | |
Custodian fees and expenses | 27,189 | |
Independent trustees' compensation | 2,094 | |
Audit | 54,237 | |
Legal | 1,684 | |
Interest | 453 | |
Miscellaneous | 4,217 | |
Total expenses before reductions | 2,754,990 | |
Expense reductions | (23,600) | 2,731,390 |
Net investment income (loss) | | 323,575 |
Realized and Unrealized Gain (Loss) Net realized gain (loss) on: | | |
Investment securities: | | |
Unaffiliated issuers | 47,489,789 | |
Foreign currency transactions | (1,357) | |
Total net realized gain (loss) | | 47,488,432 |
Change in net unrealized appreciation (depreciation) on: Investment securities | (40,426,020) | |
Assets and liabilities in foreign currencies | (453) | |
Total change in net unrealized appreciation (depreciation) | | (40,426,473) |
Net gain (loss) | | 7,061,959 |
Net increase (decrease) in net assets resulting from operations | | $ 7,385,534 |
Statement of Changes in Net Assets
| Year ended
December 31, 2011 | Year ended
December 31, 2010 |
Increase (Decrease) in Net Assets | | |
Operations | | |
Net investment income (loss) | $ 323,575 | $ 480,107 |
Net realized gain (loss) | 47,488,432 | 54,580,423 |
Change in net unrealized appreciation (depreciation) | (40,426,473) | 31,826,220 |
Net increase (decrease) in net assets resulting from operations | 7,385,534 | 86,886,750 |
Distributions to shareholders from net investment income | (331,249) | (419,463) |
Share transactions - net increase (decrease) | (23,326,336) | (143,876,084) |
Total increase (decrease) in net assets | (16,272,051) | (57,408,797) |
| | |
Net Assets | | |
Beginning of period | 352,167,170 | 409,575,967 |
End of period (including undistributed net investment income of $43,615 and undistributed net investment income of $58,532, respectively) | $ 335,895,119 | $ 352,167,170 |
See accompanying notes which are an integral part of the financial statements.
Annual Report
Financial Highlights - Initial Class
Years ended December 31, | 2011 | 2010 | 2009 | 2008 | 2007 |
Selected Per-Share Data | | | | | |
Net asset value, beginning of period | $ 17.92 | $ 14.51 | $ 9.99 | $ 22.37 | $ 18.16 |
Income from Investment Operations | | | | | |
Net investment income (loss) C | .03 | .03 | .06 | .07 | (.01) |
Net realized and unrealized gain (loss) | .38 | 3.41 | 4.52 | (12.38) | 4.22 |
Total from investment operations | .41 | 3.44 | 4.58 | (12.31) | 4.21 |
Distributions from net investment income | (.03) | (.03) | (.06) | (.07) | - |
Net asset value, end of period | $ 18.30 | $ 17.92 | $ 14.51 | $ 9.99 | $ 22.37 |
Total Return A,B | 2.30% | 23.74% | 45.85% | (55.02)% | 23.18% |
Ratios to Average Net Assets D,F | | | | | |
Expenses before reductions | .70% | .70% | .72% | .71% | .68% |
Expenses net of fee waivers, if any | .70% | .69% | .72% | .71% | .68% |
Expenses net of all reductions | .69% | .69% | .72% | .71% | .68% |
Net investment income (loss) | .17% | .19% | .50% | .42% | (.05)% |
Supplemental Data | | | | | |
Net assets, end of period (000 omitted) | $ 111,238 | $ 123,894 | $ 157,864 | $ 115,057 | $ 321,507 |
Portfolio turnover rate E | 34% | 33% | 88% | 148% | 100% |
A Total returns do not reflect charges attributable to your insurance company's separate account. Inclusion of these charges would reduce the total returns shown.
B Total returns would have been lower if certain expenses had not been reduced during the applicable periods shown.
C Calculated based on average shares outstanding during the period.
D Fees and expenses of any underlying Fidelity Central Funds are not included in the Fund's expense ratio. The Fund indirectly bears its proportionate share of the expenses of any underlying Fidelity Central Funds.
E Amount does not include the portfolio activity of any underlying Fidelity Central Funds.
F Expense ratios reflect operating expenses of the class. Expenses before reductions do not reflect amounts reimbursed by the investment adviser or reductions from brokerage service arrangements or reductions from other expense offset arrangements and do not represent the amount paid by the class during periods when reimbursements or reductions occur. Expenses net of fee waivers reflect expenses after reimbursement by the investment adviser but prior to reductions from brokerage service arrangements or other expense offset arrangements. Expenses net of all reductions represent the net expenses paid by the class.
Financial Highlights - Service Class
Years ended December 31, | 2011 | 2010 | 2009 | 2008 | 2007 |
Selected Per-Share Data | | | | | |
Net asset value, beginning of period | $ 17.89 | $ 14.48 | $ 9.97 | $ 22.32 | $ 18.14 |
Income from Investment Operations | | | | | |
Net investment income (loss) C | .01 | .01 | .05 | .05 | (.03) |
Net realized and unrealized gain (loss) | .38 | 3.42 | 4.51 | (12.34) | 4.21 |
Total from investment operations | .39 | 3.43 | 4.56 | (12.29) | 4.18 |
Distributions from net investment income | (.01) | (.02) | (.05) | (.06) | - |
Net asset value, end of period | $ 18.27 | $ 17.89 | $ 14.48 | $ 9.97 | $ 22.32 |
Total Return A,B | 2.18% | 23.65% | 45.72% | (55.06)% | 23.04% |
Ratios to Average Net Assets D,F | | | | | |
Expenses before reductions | .80% | .80% | .82% | .81% | .78% |
Expenses net of fee waivers, if any | .80% | .79% | .82% | .81% | .78% |
Expenses net of all reductions | .79% | .79% | .82% | .81% | .78% |
Net investment income (loss) | .07% | .09% | .40% | .32% | (.15)% |
Supplemental Data | | | | | |
Net assets, end of period (000 omitted) | $ 138,842 | $ 159,157 | $ 187,696 | $ 126,076 | $ 231,249 |
Portfolio turnover rate E | 34% | 33% | 88% | 148% | 100% |
A Total returns do not reflect charges attributable to your insurance company's separate account. Inclusion of these charges would reduce the total returns shown.
B Total returns would have been lower if certain expenses had not been reduced during the applicable periods shown.
C Calculated based on average shares outstanding during the period.
D Fees and expenses of any underlying Fidelity Central Funds are not included in the Fund's expense ratio. The Fund indirectly bears its proportionate share of the expenses of any underlying Fidelity Central Funds.
E Amount does not include the portfolio activity of any underlying Fidelity Central Funds.
F Expense ratios reflect operating expenses of the class. Expenses before reductions do not reflect amounts reimbursed by the investment adviser or reductions from brokerage service arrangements or reductions from other expense offset arrangements and do not represent the amount paid by the class during periods when reimbursements or reductions occur. Expenses net of fee waivers reflect expenses after reimbursement by the investment adviser but prior to reductions from brokerage service arrangements or other expense offset arrangements. Expenses net of all reductions represent the net expenses paid by the class.
See accompanying notes which are an integral part of the financial statements.
Annual Report
Financial Highlights - Service Class 2
Years ended December 31, | 2011 | 2010 | 2009 | 2008 | 2007 |
Selected Per-Share Data | | | | | |
Net asset value, beginning of period | $ 17.78 | $ 14.40 | $ 9.92 | $ 22.15 | $ 18.03 |
Income from Investment Operations | | | | | |
Net investment income (loss) C | (.02) | (.01) | .03 | .03 | (.06) |
Net realized and unrealized gain (loss) | .37 | 3.39 | 4.48 | (12.24) | 4.18 |
Total from investment operations | .35 | 3.38 | 4.51 | (12.21) | 4.12 |
Distributions from net investment income | - | - | (.03) | (.02) | - |
Net asset value, end of period | $ 18.13 | $ 17.78 | $ 14.40 | $ 9.92 | $ 22.15 |
Total Return A,B | 1.97% | 23.47% | 45.46% | (55.12)% | 22.85% |
Ratios to Average Net Assets D,F | | | | | |
Expenses before reductions | .96% | .96% | .98% | .97% | .94% |
Expenses net of fee waivers, if any | .95% | .95% | .98% | .97% | .94% |
Expenses net of all reductions | .95% | .95% | .98% | .97% | .94% |
Net investment income (loss) | (.08)% | (.07)% | .24% | .16% | (.31)% |
Supplemental Data | | | | | |
Net assets, end of period (000 omitted) | $ 31,441 | $ 32,600 | $ 36,247 | $ 24,622 | $ 88,013 |
Portfolio turnover rate E | 34% | 33% | 88% | 148% | 100% |
A Total returns do not reflect charges attributable to your insurance company's separate account. Inclusion of these charges would reduce the total returns shown.
B Total returns would have been lower if certain expenses had not been reduced during the applicable periods shown.
C Calculated based on average shares outstanding during the period.
D Fees and expenses of any underlying Fidelity Central Funds are not included in the Fund's expense ratio. The Fund indirectly bears its proportionate share of the expenses of any underlying Fidelity Central Funds.
E Amount does not include the portfolio activity of any underlying Fidelity Central Funds.
F Expense ratios reflect operating expenses of the class. Expenses before reductions do not reflect amounts reimbursed by the investment adviser or reductions from brokerage service arrangements or reductions from other expense offset arrangements and do not represent the amount paid by the class during periods when reimbursements or reductions occur. Expenses net of fee waivers reflect expenses after reimbursement by the investment adviser but prior to reductions from brokerage service arrangements or other expense offset arrangements. Expenses net of all reductions represent the net expenses paid by the class.
Financial Highlights - Investor Class
Years ended December 31, | 2011 | 2010 | 2009 | 2008 | 2007 |
Selected Per-Share Data | | | | | |
Net asset value, beginning of period | $ 17.86 | $ 14.46 | $ 9.97 | $ 22.28 | $ 18.11 |
Income from Investment Operations | | | | | |
Net investment income (loss) C | .02 | .02 | .05 | .05 | (.04) |
Net realized and unrealized gain (loss) | .37 | 3.41 | 4.49 | (12.31) | 4.21 |
Total from investment operations | .39 | 3.43 | 4.54 | (12.26) | 4.17 |
Distributions from net investment income | (.02) | (.03) | (.05) | (.05) | - |
Net asset value, end of period | $ 18.23 | $ 17.86 | $ 14.46 | $ 9.97 | $ 22.28 |
Total Return A,B | 2.18% | 23.69% | 45.57% | (55.05)% | 23.03% |
Ratios to Average Net Assets D,F | | | | | |
Expenses before reductions | .78% | .79% | .82% | .82% | .80% |
Expenses net of fee waivers, if any | .78% | .78% | .82% | .82% | .80% |
Expenses net of all reductions | .78% | .78% | .82% | .81% | .80% |
Net investment income (loss) | .09% | .10% | .40% | .31% | (.17)% |
Supplemental Data | | | | | |
Net assets, end of period (000 omitted) | $ 54,374 | $ 36,516 | $ 27,769 | $ 7,065 | $ 33,366 |
Portfolio turnover rate E | 34% | 33% | 88% | 148% | 100% |
A Total returns do not reflect charges attributable to your insurance company's separate account. Inclusion of these charges would reduce the total returns shown.
B Total returns would have been lower if certain expenses had not been reduced during the applicable periods shown.
C Calculated based on average shares outstanding during the period.
D Fees and expenses of any underlying Fidelity Central Funds are not included in the Fund's expense ratio. The Fund indirectly bears its proportionate share of the expenses of any underlying Fidelity Central Funds.
E Amount does not include the portfolio activity of any underlying Fidelity Central Funds.
F Expense ratios reflect operating expenses of the class. Expenses before reductions do not reflect amounts reimbursed by the investment adviser or reductions from brokerage service arrangements or reductions from other expense offset arrangements and do not represent the amount paid by the class during periods when reimbursements or reductions occur. Expenses net of fee waivers reflect expenses after reimbursement by the investment adviser but prior to reductions from brokerage service arrangements or other expense offset arrangements. Expenses net of all reductions represent the net expenses paid by the class.
See accompanying notes which are an integral part of the financial statements.
Annual Report
Notes to Financial Statements
For the period ended December 31, 2011
1. Organization.
VIP Growth Opportunities Portfolio (the Fund) is a fund of Variable Insurance Products Fund III (the Trust) and is authorized to issue an unlimited number of shares. The Trust is registered under the Investment Company Act of 1940, as amended (the 1940 Act), as an open-end management investment company organized as a Massachusetts business trust. Shares of the Fund may only be purchased by insurance companies for the purpose of funding variable annuity or variable life insurance contracts. The Fund offers the following classes of shares: Initial Class shares, Service Class shares, Service Class 2 shares and Investor Class shares. All classes have equal rights and voting privileges, except for matters affecting a single class. Investment income, realized and unrealized capital gains and losses, the common expenses of the Fund, and certain fund-level expense reductions, if any, are allocated on a pro-rata basis to each class based on the relative net assets of each class to the total net assets of the Fund. Each class differs with respect to transfer agent and distribution and service plan fees incurred. Certain expense reductions may also differ by class.
2. Investments in Fidelity Central Funds.
The Fund invests in Fidelity Central Funds, which are open-end investment companies available only to other investment companies and accounts managed by Fidelity Management & Research Company (FMR) and its affiliates. The Fund's Schedule of Investments lists each of the Fidelity Central Funds held as of period end, if any, as an investment of the Fund, but do not include the underlying holdings of each Fidelity Central Fund. As an Investing Fund, the Fund indirectly bears its proportionate share of the expenses of the underlying Fidelity Central Funds.
The Money Market Central Funds seek preservation of capital and current income and are managed by Fidelity Investments Money Management, Inc. (FIMM), an affiliate of FMR.
A complete unaudited list of holdings for each Fidelity Central Fund is available upon request or at the Securities and Exchange Commission (the SEC) web site at www.sec.gov. In addition, the financial statements of the Fidelity Central Funds, which are not covered by the Fund's Report of Independent Registered Public Accounting Firm, are available on the SEC web site or upon request.
3. Significant Accounting Policies.
The financial statements have been prepared in conformity with accounting principles generally accepted in the United States of America (GAAP), which require management to make certain estimates and assumptions at the date of the financial statements. Actual results could differ from those estimates. Subsequent events, if any, through the date that the financial statements were issued have been evaluated in the preparation of the financial statements. The following summarizes the significant accounting policies of the Fund:
Security Valuation. Investments are valued as of 4:00 p.m. Eastern time on the last calendar day of the period. The Fund uses independent pricing services approved by the Board of Trustees to value its investments. When current market prices or quotations are not readily available or reliable, valuations may be determined in good faith in accordance with procedures adopted by the Board of Trustees. Factors used in determining value may include market or security specific events. The frequency with which these procedures are used cannot be predicted and they may be utilized to a significant extent. The value used for net asset value (NAV) calculation under these procedures may differ from published prices for the same securities.
The Fund categorizes the inputs to valuation techniques used to value its investments into a disclosure hierarchy consisting of three levels as shown below:
Level 1 - quoted prices in active markets for identical investments
Level 2 - other significant observable inputs (including quoted prices for similar investments, interest rates, prepayment speeds, etc.)
Level 3 - unobservable inputs (including the Fund's own assumptions based on the best information available)
Changes in valuation techniques may result in transfers in or out of an assigned level within the disclosure hierarchy. The aggregate value of investments by input level, as of December 31, 2011, as well as a roll forward of Level 3 securities, is included at the end of the Fund's Schedule of Investments. Valuation techniques used to value the Fund's investments by major category are as follows:
Equity securities, including restricted securities, for which market quotations are readily available, are valued at the last reported sale price or official closing price as reported by an independent pricing service on the primary market or exchange on which they are traded and are categorized as Level 1 in the hierarchy. In the event there were no sales during the day or closing prices are not available, securities are valued at the last quoted bid price or may be valued using the last available price and are generally categorized as Level 2 in the hierarchy. For foreign equity securities, when significant market or security specific events arise, comparisons to the valuation of American Depositary Receipts (ADRs), futures contracts, Exchange-traded funds (ETFs) and certain indexes as well as quoted prices for similar securities are used and are categorized as Level 2 in the hierarchy in these circumstances. Utilizing these techniques may result in transfers between Level 1 and Level 2. For restricted equity securities and private placements where observable inputs are limited, assumptions about market activity and risk are used and are categorized as Level 3 in the hierarchy.
Annual Report
3. Significant Accounting Policies - continued
Security Valuation - continued
Investments in open-end mutual funds, including the Fidelity Central Funds, are valued at their closing net asset value each business day and are categorized as Level 1 in the hierarchy.
New Accounting Pronouncements. In May 2011, the Financial Accounting Standards Board issued Accounting Standard Update No. 2011-04, Fair Value Measurement (Topic 820) - Amendments to Achieve Common Fair Value Measurement and Disclosure Requirements in U.S. GAAP and IFRSs. The update is effective during interim and annual periods beginning after December 15, 2011 and will result in additional disclosure for transfers between levels as well as expanded disclosure for securities categorized as Level 3 under the fair value hierarchy.
In December 2011, the Financial Accounting Standards Board issued Accounting Standard Update No. 2011-11, Disclosures about Offsetting Assets and Liabilities. The update creates new disclosure requirements requiring entities to disclose both gross and net information for derivatives and other financial instruments that are either offset in the Statement of Assets and Liabilities or subject to an enforceable master netting arrangement or similar agreement. The disclosure requirements are effective for annual reporting periods beginning on or after January 1, 2013. Management is currently evaluating the impact of the update's adoption on the Fund's financial statement disclosures.
Foreign Currency. The Fund may use foreign currency contracts to facilitate transactions in foreign-denominated securities. Gains and losses from these transactions may arise from changes in the value of the foreign currency or if the counterparties do not perform under the contracts' terms.
Foreign-denominated assets, including investment securities, and liabilities are translated into U.S. dollars at the exchange rate at period end. Purchases and sales of investment securities, income and dividends received and expenses denominated in foreign currencies are translated into U.S. dollars at the exchange rate in effect on the transaction date.
The effects of exchange rate fluctuations on investments are included with the net realized and unrealized gain (loss) on investment securities. Other foreign currency transactions resulting in realized and unrealized gain (loss) are disclosed separately.
Investment Transactions and Income. For financial reporting purposes, the Fund's investment holdings and NAV include trades executed through the end of the last business day of the period. The NAV per share for processing shareholder transactions is calculated as of the close of business of the New York Stock Exchange (NYSE), normally 4:00 p.m. Eastern time and includes trades executed through the end of the prior business day. Gains and losses on securities sold are determined on the basis of identified cost and may include proceeds received from litigation. Dividend income is recorded on the ex-dividend date, except for certain dividends from foreign securities where the ex-dividend date may have passed, which are recorded as soon as the Fund is informed of the ex-dividend date. Non-cash dividends included in dividend income, if any, are recorded at the fair market value of the securities received. Distributions received on securities that represent a return of capital or capital gain are recorded as a reduction of cost of investments and/or as a realized gain. The Fund estimates the components of distributions received that may be considered return of capital distributions or capital gain distributions. Interest income and distributions from the Fidelity Central Funds are accrued as earned. Interest income includes coupon interest and amortization of premium and accretion of discount on debt securities. Investment income is recorded net of foreign taxes withheld where recovery of such taxes is uncertain.
Expenses. Expenses directly attributable to a fund are charged to that fund. Expenses attributable to more than one fund are allocated among the respective funds on the basis of relative net assets or other appropriate methods. Expense estimates are accrued in the period to which they relate and adjustments are made when actual amounts are known.
Income Tax Information and Distributions to Shareholders. Each year, the Fund intends to qualify as a regulated investment company, including distributing substantially all of its taxable income and realized gains under Subchapter M of the Internal Revenue Code. As a result, no provision for income taxes is required. As of December 31, 2011, the Fund did not have any unrecognized tax benefits in the financial statements; nor is the Fund aware of any tax positions for which it is reasonably possible that the total amounts of unrecognized tax benefits will significantly change in the next twelve months. The Fund files a U.S. federal tax return, in addition to state and local tax returns as required. A fund's tax returns are subject to examination by the Internal Revenue Service (IRS) for a period of three fiscal years. State and local tax returns may be subject to examination for an additional fiscal year depending on the jurisdiction. Foreign taxes are provided for based on the Fund's understanding of the tax rules and rates that exist in the foreign markets in which it invests.
Distributions are declared and recorded on the ex-dividend date. Income dividends and capital gain distributions are declared separately for each class. Income and capital gain distributions are determined in accordance with income tax regulations, which may differ from GAAP.
Capital accounts within the financial statements are adjusted for permanent book-tax differences. These adjustments have no impact on net assets or the results of operations. Temporary book-tax differences will reverse in a subsequent period.
Book-tax differences are primarily due to foreign currency transactions, deferred trustees compensation, capital loss carryforwards and losses deferred due to wash sales.
Annual Report
Notes to Financial Statements - continued
3. Significant Accounting Policies - continued
Income Tax Information and Distributions to Shareholders - continued
The federal tax cost of investment securities and unrealized appreciation (depreciation) as of period end were as follows:
Gross unrealized appreciation | $ 108,060,757 |
Gross unrealized depreciation | (28,618,076) |
Net unrealized appreciation (depreciation) on securities and other investments | $ 79,442,681 |
| |
Tax Cost | $ 279,348,011 |
The tax-based components of distributable earnings as of period end were as follows:
Undistributed ordinary income | $ 43,630 |
Capital loss carryforward | $ (91,780,138) |
Net unrealized appreciation (depreciation) | $ 79,442,283 |
Capital loss carryforwards are only available to offset future capital gains of the Fund to the extent provided by regulations and may be limited. Under the Regulated Investment Company Modernization Act of 2010 (the Act), the Fund is permitted to carry forward capital losses incurred in taxable years beginning after December 22, 2010 for an unlimited period and such capital losses are required to be used prior to any losses that expire. Capital loss carryforwards were as follows:
Fiscal year of expiration | |
2016 | $ (13,439,190) |
2017 | (78,340,948) |
Total capital loss carryforward | $ (91,780,138) |
The tax character of distributions paid was as follows:
| December 31, 2011 | December 31, 2010 |
Ordinary Income | $ 331,249 | $ 419,463 |
4. Operating Policies.
Restricted Securities. The Fund may invest in securities that are subject to legal or contractual restrictions on resale. These securities generally may be resold in transactions exempt from registration or to the public if the securities are registered. Disposal of these securities may involve time-consuming negotiations and expense, and prompt sale at an acceptable price may be difficult. Information regarding restricted securities is included at the end of the Fund's Schedule of Investments.
5. Purchases and Sales of Investments.
Purchases and sales of securities, other than short-term securities, aggregated $119,519,343 and $145,950,178, respectively.
6. Fees and Other Transactions with Affiliates.
Management Fee. FMR and its affiliates provide the Fund with investment management related services for which the Fund pays a monthly management fee. The management fee is the sum of an individual fund fee rate that is based on an annual rate of .30% of the Fund's average net assets and an annualized group fee rate that averaged .26% during the period. The group fee rate is based upon the average net assets of all the mutual funds advised by FMR. The group fee rate decreases as assets under management increase and increases as assets under management decrease. For the period, the total annual management fee rate was .56% of the Fund's average net assets.
Distribution and Service Plan Fees. In accordance with Rule 12b-1 of the 1940 Act, the Fund has adopted separate 12b-1 Plans for each Service Class of shares. Each Service Class pays Fidelity Distributors Corporation (FDC), an affiliate of FMR, a service fee. For the period, the service fee is based on an annual rate of .10% of Service Class' average net assets and .25% of Service Class 2's average net assets.
Annual Report
6. Fees and Other Transactions with Affiliates - continued
Distribution and Service Plan Fees - continued
For the period, total fees, all of which were re-allowed to insurance companies for the distribution of shares and providing shareholder support services were as follows:
Service Class | $ 154,379 |
Service Class 2 | 87,233 |
| $ 241,612 |
Transfer Agent Fees. Fidelity Investments Institutional Operations Company, Inc. (FIIOC), an affiliate of FMR, is the Fund's transfer, dividend disbursing, and shareholder servicing agent. FIIOC receives an asset-based fee with respect to each class. Each class (with the exception of Investor Class) pays a transfer agent fee, excluding out of pocket expenses, equal to an annual rate of .07% of average net assets. Investor Class pays a monthly asset-based transfer agent fee of .15% of average net assets. In addition, FIIOC receives an asset-based fee of .0045% of average net assets for typesetting, printing and mailing of shareholder reports, except proxy statements. FIIOC voluntarily agreed to waive this fee for the period August 1, 2011 through December 31, 2011 (see Expense Reductions note). For the period, transfer agent fees for each class, including printing and out of pocket expenses, were as follows:
Initial Class | $ 89,241 |
Service Class | 112,867 |
Service Class 2 | 28,019 |
Investor Class | 75,289 |
| $ 305,416 |
Accounting and Security Lending Fees. Fidelity Service Company, Inc. (FSC), an affiliate of FMR, maintains the Fund's accounting records. The accounting fee is based on the level of average net assets for the month. Under a separate contract, FSC administers the security lending program. The security lending fee is based on the number and duration of lending transactions.
Brokerage Commissions. The Fund placed a portion of its portfolio transactions with brokerage firms which are affiliates of the investment adviser. The commissions paid to these affiliated firms were $4,485 for the period.
Interfund Lending Program. Pursuant to an Exemptive Order issued by the SEC, the Fund, along with other registered investment companies having management contracts with FMR, may participate in an interfund lending program. This program provides an alternative credit facility allowing the funds to borrow from, or lend money to, other participating affiliated funds. At period end, there were no interfund loans outstanding. The Fund's activity in this program during the period for which loans were outstanding was as follows:
Borrower or Lender | Average Loan
Balance | Weighted Average Interest Rate | Interest
Expense |
Borrower | $ 8,143,600 | .40% | $ 453 |
7. Committed Line of Credit.
The Fund participates with other funds managed by FMR or an affiliate in a $4.0 billion credit facility (the "line of credit") to be utilized for temporary or emergency purposes to fund shareholder redemptions or for other short-term liquidity purposes. The Fund has agreed to pay commitment fees on its pro-rata portion of the line of credit, which amounted to $1,138 and is reflected in Miscellaneous expenses on the Statement of Operations. During the period, there were no borrowings on this line of credit.
8. Security Lending.
The Fund lends portfolio securities through a lending agent from time to time in order to earn additional income. For equity securities, a lending agent is used and may loan securities to certain qualified borrowers, including Fidelity Capital Markets (FCM), a broker-dealer affiliated with the Fund. On the settlement date of the loan, the Fund receives collateral (in the form of U.S. Treasury obligations, letters of credit and/or cash) against the loaned securities and maintains collateral in an amount not less than 100% of the market value of the loaned securities during the period of the loan. The market value of the loaned securities is determined at the close of business of the Fund and any additional required collateral is delivered to the Fund on the next business day. If the borrower defaults on its obligation to return the securities loaned because of insolvency or other reasons, a fund could experience delays and costs in recovering the securities loaned or in gaining access to the collateral. Any cash collateral received is maintained at the Fund's custodian and/or invested in the Fidelity Securities Lending Cash Central Fund. The value of loaned securities and cash collateral at period end are disclosed on the Fund's Statement of Assets and Liabilities. At period end, there were no security loans outstanding with FCM. Security lending income represents the income earned on investing cash collateral, less rebates paid to borrowers and any lending agent fees associated with the loan, plus any premium payments received for lending certain types of securities. Security lending income is presented in the Statement of Operations as a component of income from Fidelity Central Funds and includes $7,078 from securities loaned to FCM.
Annual Report
Notes to Financial Statements - continued
9. Expense Reductions.
FMR or its affiliates agreed to waive certain fees during the period as noted in the table below.
Initial Class | $ 2,066 |
Service Class | 2,711 |
Service Class 2 | 613 |
Investor Class | 826 |
| $ 6,216 |
Many of the brokers with whom FMR places trades on behalf of the Fund provided services to the Fund in addition to trade execution. These services included payments of certain expenses on behalf of the Fund totaling $17,384 for the period.
10. Distributions to Shareholders.
Distributions to shareholders of each class were as follows:
Years ended December 31, | 2011 | 2010 |
From net investment income | | |
Initial Class | $ 193,183 | $ 234,004 |
Service Class | 82,425 | 134,452 |
Investor Class | 55,641 | 51,007 |
Total | $ 331,249 | $ 419,463 |
11. Share Transactions.
Transactions for each class of shares were as follows:
| Shares | Dollars |
Years ended December 31, | 2011 | 2010 | 2011 | 2010 |
Initial Class | | | | |
Shares sold | 1,066,053 | 1,405,820 | $ 20,174,338 | $ 21,866,378 |
Reinvestment of distributions | 10,721 | 13,051 | 193,183 | 234,004 |
Shares redeemed | (1,910,892) | (5,388,382) | (35,914,517) | (90,213,998) |
Net increase (decrease) | (834,118) | (3,969,511) | $ (15,546,996) | $ (68,113,616) |
Service Class | | | | |
Shares sold | 403,454 | 437,769 | $ 7,595,912 | $ 6,566,092 |
Reinvestment of distributions | 4,504 | 7,511 | 82,425 | 134,452 |
Shares redeemed | (1,705,088) | (4,512,647) | (32,048,593) | (75,039,223) |
Net increase (decrease) | (1,297,130) | (4,067,367) | $ (24,370,256) | $ (68,338,679) |
Service Class 2 | | | | |
Shares sold | 962,463 | 709,091 | $ 17,895,915 | $ 11,010,892 |
Shares redeemed | (1,062,706) | (1,392,788) | (19,476,673) | (21,449,132) |
Net increase (decrease) | (100,243) | (683,697) | $ (1,580,758) | $ (10,438,240) |
Investor Class | | | | |
Shares sold | 1,576,055 | 795,392 | $ 29,817,704 | $ 12,922,808 |
Reinvestment of distributions | 3,097 | 2,854 | 55,641 | 51,007 |
Shares redeemed | (641,452) | (673,827) | (11,701,671) | (9,959,364) |
Net increase (decrease) | 937,700 | 124,419 | $ 18,171,674 | $ 3,014,451 |
12. Other.
The Fund's organizational documents provide former and current trustees and officers with a limited indemnification against liabilities arising in connection with the performance of their duties to the Fund. In the normal course of business, the Fund may also enter into contracts that provide general indemnifications. The Fund's maximum exposure under these arrangements is unknown as this would be dependent on future claims that may be made against the Fund. The risk of material loss from such claims is considered remote.
At the end of the period, FMR or its affiliates were the owners of record of 36% of the total outstanding shares of the Fund and one otherwise unaffiliated shareholder was the owner of record of 37% of the total outstanding shares of the Fund.
Annual Report
Report of Independent Registered Public Accounting Firm
To the Trustees of Variable Insurance Products Fund III and Shareholders of VIP Growth Opportunities Portfolio:
We have audited the accompanying statement of assets and liabilities of VIP Growth Opportunities Portfolio (the Fund), a fund of Variable Insurance Products Fund III, including the schedule of investments, as of December 31, 2011, and the related statement of operations for the year then ended, the statement of changes in net assets for each of the two years in the period then ended, and the financial highlights for each of the five years in the period then ended. These financial statements and financial highlights are the responsibility of the Fund's management. Our responsibility is to express an opinion on these financial statements and financial highlights based on our audits.
We conducted our audits in accordance with the standards of the Public Company Accounting Oversight Board (United States). Those standards require that we plan and perform the audit to obtain reasonable assurance about whether the financial statements and financial highlights are free of material misstatement. The Fund is not required to have, nor were we engaged to perform, an audit of its internal control over financial reporting. Our audits included consideration of internal control over financial reporting as a basis for designing audit procedures that are appropriate in the circumstances, but not for the purpose of expressing an opinion on the effectiveness of the Fund's internal control over financial reporting. Accordingly, we express no such opinion. An audit also includes examining, on a test basis, evidence supporting the amounts and disclosures in the financial statements, assessing the accounting principles used and significant estimates made by management, as well as evaluating the overall financial statement presentation. Our procedures included confirmation of securities owned as of December 31, 2011, by correspondence with the custodians and brokers; where replies were not received from brokers, we performed other auditing procedures. We believe that our audits provide a reasonable basis for our opinion.
In our opinion, the financial statements and financial highlights referred to above present fairly, in all material respects, the financial position of VIP Growth Opportunities Portfolio as of December 31, 2011, the results of its operations for the year then ended, the changes in its net assets for each of the two years in the period then ended, and the financial highlights for each of the five years in the period then ended, in conformity with accounting principles generally accepted in the United States of America.
DELOITTE & TOUCHE LLP
Boston, Massachusetts
February 10, 2012
Annual Report
The Trustees, Members of the Advisory Board, and executive officers of the trust and fund, as applicable, are listed below. The Board of Trustees governs the fund and is responsible for protecting the interests of shareholders. The Trustees are experienced executives who meet periodically throughout the year to oversee the fund's activities, review contractual arrangements with companies that provide services to the fund, oversee management of the risks associated with such activities and contractual arrangements, and review the fund's performance. Except for James C. Curvey, each of the Trustees oversees 226 funds advised by FMR or an affiliate. Mr. Curvey oversees 429 funds advised by FMR or an affiliate.
The Trustees hold office without limit in time except that (a) any Trustee may resign; (b) any Trustee may be removed by written instrument, signed by at least two-thirds of the number of Trustees prior to such removal; (c) any Trustee who requests to be retired or who has become incapacitated by illness or injury may be retired by written instrument signed by a majority of the other Trustees; and (d) any Trustee may be removed at any special meeting of shareholders by a two-thirds vote of the outstanding voting securities of the trust. Each Trustee who is not an interested person (as defined in the 1940 Act) (Independent Trustee), shall retire not later than the last day of the calendar year in which his or her 75th birthday occurs. The Independent Trustees may waive this mandatory retirement age policy with respect to individual Trustees. The executive officers and Advisory Board Members hold office without limit in time, except that any officer and Advisory Board Member may resign or may be removed by a vote of a majority of the Trustees at any regular meeting or any special meeting of the Trustees. Except as indicated, each individual has held the office shown or other offices in the same company for the past five years.
Experience, Skills, Attributes, and Qualifications of the Fund's Trustees. The Governance and Nominating Committee has adopted a statement of policy that describes the experience, qualifications, attributes, and skills that are necessary and desirable for potential Independent Trustee candidates (Statement of Policy). The Board believes that each Trustee satisfied at the time he or she was initially elected or appointed a Trustee, and continues to satisfy, the standards contemplated by the Statement of Policy. The Governance and Nominating Committee also engages professional search firms to help identify potential Independent Trustee candidates who have the experience, qualifications, attributes, and skills consistent with the Statement of Policy. From time to time, additional criteria based on the composition and skills of the current Independent Trustees, as well as experience or skills that may be appropriate in light of future changes to board composition, business conditions, and regulatory or other developments, have also been considered by the professional search firms and the Governance and Nominating Committee. In addition, the Board takes into account the Trustees' commitment and participation in Board and committee meetings, as well as their leadership of standing and ad hoc committees throughout their tenure.
In determining that a particular Trustee was and continues to be qualified to serve as a Trustee, the Board has considered a variety of criteria, none of which, in isolation, was controlling. The Board believes that, collectively, the Trustees have balanced and diverse experience, qualifications, attributes, and skills, which allow the Board to operate effectively in governing the fund and protecting the interests of shareholders. Information about the specific experience, skills, attributes, and qualifications of each Trustee, which in each case led to the Board's conclusion that the Trustee should serve (or continue to serve) as a trustee of the fund, is provided below.
Board Structure and Oversight Function. James C. Curvey is an interested person (as defined in the 1940 Act) and currently serves as Acting Chairman. The Trustees have determined that an interested Chairman is appropriate and benefits shareholders because an interested Chairman has a personal and professional stake in the quality and continuity of services provided to the fund. Independent Trustees exercise their informed business judgment to appoint an individual of their choosing to serve as Chairman, regardless of whether the Trustee happens to be independent or a member of management. The Independent Trustees have determined that they can act independently and effectively without having an Independent Trustee serve as Chairman and that a key structural component for assuring that they are in a position to do so is for the Independent Trustees to constitute a substantial majority for the Board. The Independent Trustees also regularly meet in executive session. Ned C. Lautenbach serves as Chairman of the Independent Trustees and as such (i) acts as a liaison between the Independent Trustees and management with respect to matters important to the Independent Trustees and (ii) with management prepares agendas for Board meetings.
Fidelity funds are overseen by different Boards of Trustees. The fund's Board oversees Fidelity's equity and high income funds and another Board oversees Fidelity's investment-grade bond, money market, and asset allocation funds. The asset allocation funds may invest in Fidelity funds overseen by the fund's Board. The use of separate Boards, each with its own committee structure, allows the Trustees of each group of Fidelity funds to focus on the unique issues of the funds they oversee, including common research, investment, and operational issues. On occasion, the separate Boards establish joint committees to address issues of overlapping consequences for the Fidelity funds overseen by each Board.
The Trustees operate using a system of committees to facilitate the timely and efficient consideration of all matters of importance to the Trustees, the fund, and fund shareholders and to facilitate compliance with legal and regulatory requirements and oversight of the fund's activities and associated risks. The Board, acting through its committees, has charged FMR and its affiliates with (i) identifying events or circumstances the occurrence of which could have demonstrably adverse effects on the fund's business and/or reputation; (ii) implementing processes and controls to lessen the possibility that such events or circumstances occur or to mitigate the effects of such events or circumstances if they do occur; and (iii) creating and maintaining a system designed to evaluate continuously business and market conditions in order to facilitate the identification and implementation processes described in (i) and (ii) above. Because the day-to-day operations and activities of the fund are carried out by or through FMR, its affiliates and other service providers, the fund's exposure to risks is mitigated but not eliminated by the processes overseen by the Trustees. While each of the Board's committees has responsibility for overseeing different aspects of the fund's activities, oversight is exercised primarily through the Operations, Audit, and Compliance Committees. In addition, the Independent Trustees have worked with FMR to enhance the Board's oversight of investment and financial risks, legal and regulatory risks, technology risks, and operational risks, including the development of additional risk reporting to the Board. For example, a working group comprised of Independent Trustees and FMR has worked and continues to work to review the Fidelity funds' valuation-related activities, reporting and risk management. Appropriate personnel, including but not limited to the fund's Chief Compliance Officer (CCO), FMR's internal auditor, the independent accountants, the fund's Treasurer and portfolio management personnel, make periodic reports to the Board's committees, as appropriate, including an annual review of FMR's risk management program for the Fidelity funds. The responsibilities of each standing committee, including their oversight responsibilities, are described further under "Standing Committees of the Fund's Trustees."
Annual Report
The fund's Statement of Additional Information (SAI) includes more information about the Trustees. To request a free copy, call Fidelity at 1-877-208-0098.
Interested Trustees*:
Correspondence intended for the Trustee who is an interested person may be sent to Fidelity Investments, 82 Devonshire Street, Boston, Massachusetts 02109.
Name, Age; Principal Occupations and Other Relevant Experience+ |
James C. Curvey (76) |
| Year of Election or Appointment: 2007 Mr. Curvey is Trustee and Acting Chairman of the Board of Trustees of certain Trusts. Mr. Curvey also serves as Trustee (2007-present) of other investment companies advised by FMR. Mr. Curvey is a Director of Fidelity Investments Money Management, Inc. (2009-present), Director of Fidelity Research & Analysis Co. (2009-present) and Director of FMR and FMR Co., Inc. (2007-present). Mr. Curvey is also Vice Chairman (2007-present) and Director of FMR LLC. In addition, Mr. Curvey serves as an Overseer for the Boston Symphony Orchestra and a member of the Trustees of Villanova University. Previously, Mr. Curvey was the Vice Chairman (2006-2007) and Director (2000-2007) of FMR Corp. |
Ronald P. O'Hanley (54) |
| Year of Election or Appointment: 2011 Mr. O'Hanley is Director of FMR Co., Inc. (2010-present), Director of Fidelity Investments Money Management, Inc. (2010-present), Director of Fidelity Research & Analysis Company (2010-present), President of Fidelity Asset Management and Corporate Services and a member of Fidelity's Executive Committee (2010-present). Previously, Mr. O'Hanley served as President and Chief Executive Officer of BNY Mellon Asset Management (2007-2010). Mr. O'Hanley also served as Vice Chairman of Bank New York Mellon Corp. and a member of that firm's Executive Committee. Prior to the 2007 merger of The Bank of New York and Mellon Financial Corporation, he was Vice Chairman of Mellon Financial Corporation and President and Chief Executive Officer of Mellon Asset Management. He joined Mellon in February 1997. Mr. O'Hanley currently serves as Chairman of the Boston Public Library Foundation Board of Directors and sits on the Board of Directors of Beth Israel Deaconess Medical Center, the Board of Trustees of the Marine Biological Laboratory and the Advisory Board of the Maxwell School of Citizenship and Public Administration at Syracuse University. Mr. O'Hanley also chairs the Council on Asset Management for the Financial Services Roundtable and is a member of the Board of Directors of Institutional Investor's U.S. Institute. |
* Trustees have been determined to be "Interested Trustees" by virtue of, among other things, their affiliation with the trust or various entities under common control with FMR.
+ The information above includes each Trustee's principal occupation during the last five years and other information relating to the experience, attributes, and skills relevant to each Trustee's qualifications to serve as a Trustee, which led to the conclusion that each Trustee should serve as a Trustee for each fund.
Independent Trustees:
Correspondence intended for each Independent Trustee (that is, the Trustees other than the Interested Trustees) may be sent to Fidelity Investments, P.O. Box 55235, Boston, Massachusetts 02205-5235.
Name, Age; Principal Occupations and Other Relevant Experience+ |
Dennis J. Dirks (63) |
| Year of Election or Appointment: 2005 Prior to his retirement in May 2003, Mr. Dirks was Chief Operating Officer and a member of the Board of The Depository Trust & Clearing Corporation (DTCC). He also served as President, Chief Operating Officer, and Board member of The Depository Trust Company (DTC) and President and Board member of the National Securities Clearing Corporation (NSCC). In addition, Mr. Dirks served as Chief Executive Officer and Board member of the Government Securities Clearing Corporation, Chief Executive Officer and Board member of the Mortgage-Backed Securities Clearing Corporation, as a Trustee and a member of the Finance Committee of Manhattan College (2005-2008), and as a Trustee and a member of the Finance Committee of AHRC of Nassau County (2006-2008). Mr. Dirks is a member of the Independent Directors Council (IDC) Governing Council (2010-present) and Board of Directors for The Brookville Center for Children's Services, Inc. (2009-present). |
Alan J. Lacy (58) |
| Year of Election or Appointment: 2008 Mr. Lacy serves as Senior Adviser (2007-present) of Oak Hill Capital Partners, L.P. (private equity). Mr. Lacy also served as Chief Executive Officer (2000-2005) and Vice Chairman (2005-2006) of Sears Holdings Corporation and Sears, Roebuck and Co. (retail). In addition, Mr. Lacy serves as a member of the Board of Directors of Dave & Buster's, Inc. (restaurant and entertainment complexes, 2010-present), The Hillman Companies, Inc. (hardware wholesalers, 2010-present), and Bristol-Myers Squibb Company (global pharmaceuticals, 2007-present). Mr. Lacy is a member of the Board of Trustees of The National Parks Conservation Association (2006-present). Previously, Mr. Lacy served as Chairman of the Board of Trustees of the National Parks Conservation Association (2008-2011) and as a member of the Board of Directors for the Western Union Company (global money transfer, 2006-2011). |
Ned C. Lautenbach (67) |
| Year of Election or Appointment: 2000 Mr. Lautenbach is Chairman of the Independent Trustees of the Equity and High Income Funds (2006-present). Mr. Lautenbach currently serves as the Lead Director of the Eaton Corporation Board of Directors (diversified industrial, 1997-present). Mr. Lautenbach is also a member of the Board of Directors of the Philharmonic Center for the Arts in Naples, Florida (1999-present); a member of the Board of Trustees of Fairfield University (2005-present); and a member of the Council on Foreign Relations (1994-present). Previously, Mr. Lautenbach was a Partner/Advisory Partner at Clayton, Dubilier & Rice, LLC (private equity investment, 1998-2010), as well as a Director of Sony Corporation (2006-2007). |
Joseph Mauriello (67) |
| Year of Election or Appointment: 2008 Prior to his retirement in January 2006, Mr. Mauriello served in numerous senior management positions including Deputy Chairman and Chief Operating Officer (2004-2005), and Vice Chairman of Financial Services (2002-2004) of KPMG LLP US (professional services, 1965-2005). Mr. Mauriello currently serves as a member of the Board of Directors of XL Group plc. (global insurance and re-insurance, 2006-present) and of Arcadia Resources Inc. (health care services and products, 2007-present). Previously, Mr. Mauriello served as a Director of the Hamilton Funds of the Bank of New York (2006-2007). |
Robert W. Selander (61) |
| Year of Election or Appointment: 2011 Previously, Mr. Selander served as a Member of the Advisory Board of Fidelity's Equity and High Income Funds (2011), Executive Vice Chairman (2010), Chief Executive Officer (2009-2010), and President and Chief Executive Officer (1997-2009) of Mastercard, Inc. |
Cornelia M. Small (67) |
| Year of Election or Appointment: 2005 Ms. Small is a member of the Board of Directors of the Teagle Foundation (2009-present). Ms. Small is also a member of the Investment Committee, and Chair (2008-present) and a member of the Board of Trustees of Smith College. In addition, Ms. Small serves on the Investment Committee of the Berkshire Taconic Community Foundation (2008-present). Previously, Ms. Small served as Chairperson of the Investment Committee (2002-2008) of Smith College. In addition, Ms. Small served as Chief Investment Officer, Director of Global Equity Investments, and a member of the Board of Directors of Scudder, Stevens & Clark and Scudder Kemper Investments. |
William S. Stavropoulos (72) |
| Year of Election or Appointment: 2002 Mr. Stavropoulos is Vice Chairman of the Independent Trustees of the Equity and High Income Funds (2006-present). Mr. Stavropoulos serves as President and Founder of the Michigan Baseball Foundation, the Great Lakes Loons (2007-present). Mr. Stavropoulos is Chairman Emeritus of the Board of Directors of The Dow Chemical Company, where he previously served in numerous senior management positions, including President, CEO (1995-2000; 2002-2004), Chairman of the Executive Committee (2000-2006), and as a member of the Board of Directors (1990-2006). Currently, Mr. Stavropoulos is Chairman of Univar (global distributor of commodity and specialty chemicals, 2010-present), a Director of Teradata Corporation (data warehousing and technology solutions, 2008-present), Chemical Financial Corporation, Maersk Inc. (industrial conglomerate), Tyco International, Inc. (multinational manufacturing and services, 2007-present), and a member of the Advisory Board for Metalmark Capital (private equity investment, 2005-present). Mr. Stavropoulos is a special advisor to Clayton, Dubilier & Rice, LLC (private equity investment). In addition, Mr. Stavropoulos is a member of the University of Notre Dame Advisory Council for the College of Science. |
David M. Thomas (62) |
| Year of Election or Appointment: 2008 Previously, Mr. Thomas served as Executive Chairman (2005-2006) and Chairman and Chief Executive Officer (2000-2005) of IMS Health, Inc. (pharmaceutical and healthcare information solutions). In addition, Mr. Thomas serves as a member of the Board of Directors of Fortune Brands, Inc. (consumer products), and Interpublic Group of Companies, Inc. (marketing communication, 2004-present). |
Michael E. Wiley (61) |
| Year of Election or Appointment: 2008 Mr. Wiley also serves as a Director of Asia Pacific Exploration Consolidated (international oil and gas exploration and production, 2008-present). Mr. Wiley serves as a Director of Tesoro Corporation (independent oil refiner and marketer, 2005-present), and a Director of Bill Barrett Corporation (exploration and production, 2005-present). In addition, Mr. Wiley also serves as a Director of Post Oak Bank (privately-held bank, 2004-present). Previously, Mr. Wiley served as a member of the Board of Trustees of the University of Tulsa (2000-2006; 2007-2010), as a Senior Energy Advisor of Katzenbach Partners, LLC (consulting, 2006-2007), as an Advisory Director of Riverstone Holdings (private investment), Chairman, President, and CEO of Baker Hughes, Inc. (oilfield services, 2000-2004), and as Director of Spinnaker Exploration Company (exploration and production, 2001-2005). |
+ The information above includes each Trustee's principal occupation during the last five years and other information relating to the experience, attributes, and skills relevant to each Trustee's qualifications to serve as a Trustee, which led to the conclusion that each Trustee should serve as a Trustee for the fund.
Advisory Board Members and Executive Officers:
Correspondence intended for each executive officer, Edward C. Johnson 3d, and Peter S. Lynch may be sent to Fidelity Investments, 82 Devonshire Street, Boston, Massachusetts 02109.
Name, Age; Principal Occupation |
Edward C. Johnson 3d (81) |
| Year of Election or Appointment: 2011 Member of the Advisory Board of Fidelity's Equity and High Income Funds. Mr. Johnson serves as Chief Executive Officer, Chairman, and a Director of FMR LLC, and also serves as Chairman and Director of FIL Limited. Previously, Mr. Johnson served as a Trustee and Chairman of the Board of certain Fidelity Trusts, Chairman and a Director of FMR, Chairman and a Director of FMR Co., Inc., and President of FMR LLC (2006-2007). |
Peter S. Lynch (67) |
| Year of Election or Appointment: 2003 Member of the Advisory Board of Fidelity's Equity and High Income Funds. Mr. Lynch is Vice Chairman and a Director of FMR and FMR Co., Inc. In addition, Mr. Lynch serves as a Trustee of Boston College and as the Chairman of the Inner-City Scholarship Fund. Previously, Mr. Lynch served on the Special Olympics International Board of Directors (1997-2006). |
Kenneth B. Robins (42) |
| Year of Election or Appointment: 2008 President and Treasurer of Fidelity's Equity and High Income Funds. Mr. Robins also serves as President and Treasurer (2010-present) and Assistant Treasurer (2009-present) of other Fidelity funds and is an employee of Fidelity Investments (2004-present). Previously, Mr. Robins served as Deputy Treasurer of the Fidelity funds (2005-2008) and Treasurer and Chief Financial Officer of The North Carolina Capital Management Trust: Cash and Term Portfolios (2006-2008). |
Bruce T. Herring (46) |
| Year of Election or Appointment: 2006 Vice President of certain Equity Funds. Mr. Herring also serves as President of Fidelity Research & Analysis Company (2010-present), Chief Investment Officer and Director of Fidelity Management & Research (U.K.) Inc. (2010-present) and Group Chief Investment Officer of FMR. Previously, Mr. Herring served as Vice President (2005-2006) and Senior Vice President (2006-2007) of Fidelity Management & Research Company, Vice President of FMR Co., Inc. (2001-2007) and as a portfolio manager for Fidelity U.S. Equity Funds. |
Brian B. Hogan (47) |
| Year of Election or Appointment: 2009 Vice President of Equity and High Income Funds. Mr. Hogan also serves as President of FMR's Equity Division (2009-present). Previously, Mr. Hogan served as Senior Vice President, Equity Research of FMR (2006-2009) and as a portfolio manager. |
Scott C. Goebel (43) |
| Year of Election or Appointment: 2008 Secretary and Chief Legal Officer (CLO) of the Fidelity funds. Mr. Goebel also serves as Secretary of Fidelity Investments Money Management, Inc. (FIMM) (2010-present) and Fidelity Research and Analysis Company (FRAC) (2010-present); Secretary and CLO of The North Carolina Capital Management Trust: Cash and Term Portfolios (2008-present); General Counsel, Secretary, and Senior Vice President of FMR (2008-present) and FMR Co., Inc. (2008-present); employed by FMR LLC or an affiliate (2001-present); Chief Legal Officer of Fidelity Management & Research (Hong Kong) Limited (2008-present) and Assistant Secretary of Fidelity Management & Research (Japan) Inc. (2008-present), and Fidelity Management & Research (U.K.) Inc. (2008-present). Previously, Mr. Goebel served as Assistant Secretary of FIMM (2008-2010), FRAC (2008-2010), and the Funds (2007-2008) and as Vice President and Secretary of Fidelity Distributors Corporation (FDC) (2005-2007). |
William C. Coffey (42) |
| Year of Election or Appointment: 2009 Assistant Secretary of Fidelity's Equity and High Income Funds. Mr. Coffey also serves as Senior Vice President and Deputy General Counsel of FMR LLC (2010-present), and is an employee of Fidelity Investments. Previously, Mr. Coffey served as Vice President and Associate General Counsel of FMR LLC (2005-2009). |
Holly C. Laurent (57) |
| Year of Election or Appointment: 2008 Anti-Money Laundering (AML) Officer of the Fidelity funds. Ms. Laurent also serves as AML Officer of The North Carolina Capital Management Trust: Cash and Term Portfolios (2008-present) and is an employee of Fidelity Investments. Previously, Ms. Laurent was Senior Vice President and Head of Legal for Fidelity Business Services India Pvt. Ltd. (2006-2008), and Senior Vice President, Deputy General Counsel and Group Head for FMR LLC (2005-2006). |
Christine Reynolds (53) |
| Year of Election or Appointment: 2008 Chief Financial Officer of the Fidelity funds. Ms. Reynolds became President of Fidelity Pricing and Cash Management Services (FPCMS) in August 2008. Ms. Reynolds served as Chief Operating Officer of FPCMS (2007-2008). Previously, Ms. Reynolds served as President, Treasurer, and Anti-Money Laundering officer of the Fidelity funds (2004-2007). |
Kenneth A. Rathgeber (64) |
| Year of Election or Appointment: 2004 Chief Compliance Officer of Fidelity's Equity and High Income Funds. Mr. Rathgeber is Chief Compliance Officer of Fidelity Management & Research (Hong Kong) Limited (2008-present), Fidelity Management & Research (Japan) Inc. (2008-present), FMR (2005-present), FMR Co., Inc. (2005-present), Fidelity Management & Research (U.K.) Inc. (2005-present), Fidelity Research & Analysis Company (2005-present), Fidelity Investments Money Management, Inc. (2005-present), Pyramis Global Advisors, LLC (2005-present), and Strategic Advisers, Inc. (2005-present). |
Jeffrey S. Christian (50) |
| Year of Election or Appointment: 2009 Deputy Treasurer of the Fidelity funds. Mr. Christian is an employee of Fidelity Investments. Previously, Mr. Christian served as Chief Financial Officer (2008-2009) of certain Fidelity funds and Senior Vice President of Fidelity Pricing and Cash Management Services (FPCMS) (2004-2009). |
Joseph F. Zambello (54) |
| Year of Election or Appointment: 2011 Deputy Treasurer of the Fidelity funds. Mr. Zambello is an employee of Fidelity Investments. Previously, Mr. Zambello served as Vice President of FMR's Program Management Group (2009-2011) and Vice President of the Transfer Agent Oversight Group (2005-2009). |
Adrien E. Deberghes (44) |
| Year of Election or Appointment: 2008 Deputy Treasurer of Fidelity's Equity and High Income Funds. Mr. Deberghes also serves as Vice President and Assistant Treasurer of Fidelity Rutland Square Trust II and Fidelity Commonwealth Trust II (2011-present), Assistant Treasurer of other Fidelity funds (2010-present), and is an employee of Fidelity Investments (2008-present). Previously, Mr. Deberghes served as Senior Vice President of Mutual Fund Administration at State Street Corporation (2007-2008), Senior Director of Mutual Fund Administration at Investors Bank & Trust (2005-2007), and Director of Finance for Dunkin' Brands (2000-2005). |
Stephanie J. Dorsey (42) |
| Year of Election or Appointment: 2010 Assistant Treasurer of Fidelity's Equity and High Income Funds. Ms. Dorsey also serves as Deputy Treasurer of other Fidelity funds (2008-present) and is an employee of Fidelity Investments (2008-present). Previously, Ms. Dorsey served as Treasurer (2004-2008) of the JPMorgan Mutual Funds and Vice President (2004-2008) of JPMorgan Chase Bank. |
John R. Hebble (53) |
| Year of Election or Appointment: 2009 Assistant Treasurer of Fidelity's Equity and High Income Funds. Mr. Hebble also serves as President (2011-present), Treasurer, and Chief Financial Officer of The North Carolina Capital Management Trust: Cash and Term Portfolios (2008-present), President and Treasurer of other Fidelity funds (2008-present) and is an employee of Fidelity Investments. |
Gary W. Ryan (53) |
| Year of Election or Appointment: 2005 Assistant Treasurer of the Fidelity funds. Mr. Ryan is an employee of Fidelity Investments. Previously, Mr. Ryan served as Vice President of Fund Reporting in Fidelity Pricing and Cash Management Services (FPCMS) (1999-2005). |
Jonathan Davis (43) |
| Year of Election or Appointment: 2010 Assistant Treasurer of the Fidelity funds. Mr. Davis is also Assistant Treasurer of Fidelity Rutland Square Trust II and Fidelity Commonwealth Trust II. Mr. Davis is an employee of Fidelity Investments. Previously, Mr. Davis served as Vice President and Associate General Counsel of FMR LLC (2003-2010). |
Annual Report
Initial Class, Service Class, and Investor Class designates 100% dividends distributed during the fiscal year as qualifying for the dividends-received deduction for corporate shareholders.
Annual Report
Board Approval of Investment Advisory Contracts and Management Fees
VIP Growth Opportunities Portfolio
Each year, the Board of Trustees, including the Independent Trustees (together, the Board), votes on the renewal of the management contract and sub-advisory agreements (together, the Advisory Contracts) for the fund. The Board, assisted by the advice of fund counsel and Independent Trustees' counsel, requests and considers a broad range of information relevant to the renewal of the Advisory Contracts throughout the year.
The Board meets regularly and considers at each of its meetings factors that are relevant to its annual consideration of the renewal of the fund's Advisory Contracts, including the services and support provided to the fund and its shareholders. The Board has established various standing committees, each composed of Independent Trustees with varying backgrounds, to which the Board has assigned specific subject matter responsibilities in order to enhance effective decision-making by the Board. The Board, acting directly and through its Committees, requests and receives information concerning the annual consideration of the renewal of the fund's Advisory Contracts. The Board also meets as needed to consider matters specifically related to the Board's annual consideration of the renewal of Advisory Contracts. Members of the Board may also meet with trustees of other Fidelity funds through ad hoc joint committees to discuss certain matters relevant to the Fidelity funds.
At its July 2011 meeting, the Board of Trustees, including the Independent Trustees, unanimously determined to renew the fund's Advisory Contracts. In reaching its determination, the Board considered all factors it believed relevant, including (i) the nature, extent, and quality of the services to be provided to the fund and its shareholders (including the investment performance of the fund); (ii) the competitiveness of the fund's management fee and total expense ratio; (iii) the total costs of the services to be provided by and the profits to be realized by Fidelity from its relationship with the fund; (iv) the extent to which economies of scale would be realized as the fund grows; and (v) whether fee levels reflect these economies of scale, if any, for the benefit of fund shareholders.
In considering whether to renew the Advisory Contracts for the fund, the Board reached a determination, with the assistance of fund counsel and Independent Trustees' counsel and through the exercise of its business judgment, that the renewal of the Advisory Contracts is in the best interests of the fund and its shareholders and that the compensation payable under the Advisory Contracts is fair and reasonable. The Board's decision to renew the Advisory Contracts was not based on any single factor, but rather was based on a comprehensive consideration of all the information provided to the Board at its meetings throughout the year. The Board, in reaching its determination to renew the Advisory Contracts, is aware that shareholders in the fund have a broad range of investment choices available to them, including a wide choice among mutual funds offered by Fidelity's competitors, and that the fund's shareholders, who have the opportunity to review and weigh the disclosure provided by the fund in its prospectus and other public disclosures, have chosen to invest in this fund, managed by Fidelity.
Nature, Extent, and Quality of Services Provided. The Board considered the staffing within the investment adviser, FMR, and the sub-advisers (together, the Investment Advisers), including the backgrounds of the fund's investment personnel and the fund's investment objective and discipline. The Independent Trustees also had discussions with senior management of Fidelity's investment operations and investment groups. The Board considered the structure of the portfolio manager compensation program and whether this structure provides appropriate incentives to act in the best interests of the fund.
Resources Dedicated to Investment Management and Support Services. The Board and the Fund Oversight and Research Committees reviewed the general qualifications and capabilities of the Investment Advisers' investment staff, including its size, education, experience, and resources, as well as the Investment Advisers' approach to recruiting, training, managing, and compensating investment personnel. The Board also noted that FMR has devoted increased resources to non-U.S. offices. The Board noted that Fidelity's analysts have extensive resources, tools and capabilities which allow them to conduct sophisticated quantitative and fundamental analysis, as well as credit analysis of issuers, counterparties and enhancers. The Board also believes that Fidelity's investment professionals have sufficient access to global information and data so as to provide competitive investment results over time, and that those professionals also have access to sophisticated tools which permit them to assess portfolio construction and risk and performance attribution characteristics continuously, as well as to transmit new information and research conclusions rapidly around the world. Additionally, in their deliberations, the Board considered the Investment Advisers' trading capabilities and resources which are an integral part of the investment management process.
Shareholder and Administrative Services. The Board considered (i) the nature, extent, quality, and cost of advisory, administrative, and shareholder services performed by the Investment Advisers and their affiliates under the Advisory Contracts and under separate agreements covering transfer agency, pricing and bookkeeping, and securities lending services for the fund; (ii) the nature and extent of the investment adviser's supervision of third party service providers, principally custodians and subcustodians; and (iii) the resources devoted to, and the record of compliance with, the fund's compliance policies and procedures. The Board also reviewed the allocation of fund brokerage, including allocations to brokers affiliated with the Investment Advisers, the use of brokerage commissions to pay fund expenses, and the use of "soft" commission dollars to pay for research services.
The Board noted that the growth of fund assets over time across the complex allows Fidelity to reinvest in the development of services designed to enhance the value or convenience of the Fidelity funds as investment vehicles. These services include 24-hour access to account information and market information through telephone representatives and over the Internet, investor education materials and asset allocation tools, and the expanded availability of Fidelity Investor Centers, with 35 new branches opening since 2010.
Annual Report
Board Approval of Investment Advisory Contracts and Management Fees - continued
Investment in a Large Fund Family. The Board considered the benefits to shareholders of investing in a Fidelity fund, including the benefits of investing in a fund that is part of a large family of funds offering a variety of investment disciplines and providing a large variety of mutual fund investor services. The Board noted that Fidelity had taken, or had made recommendations that resulted in the Fidelity funds taking, a number of actions over the previous year that benefited particular funds, including (i) continuing to dedicate additional resources to investment research and support of the senior management team that oversees asset management; (ii) rationalizing product lines through the mergers of six funds into other funds; (iii) continuing to migrate the Freedom Funds to dedicated lower cost underlying funds; (iv) obtaining shareholder approval to broaden the investment strategies for Fidelity Consumer Finance Portfolio, Fidelity Emerging Asia Fund, and Fidelity Environment and Alternative Energy Portfolio; (v) contractually agreeing to reduce the management fees and impose other expense limitations on Spartan 500 Index Fund and U.S. Bond Index Fund in connection with launching new institutional classes of these funds; (vi) changing the name, primary and supplemental benchmarks, and investment policies of Fidelity Global Strategies Fund to support the fund's flexible investment mandate and global orientation; and (vii) reducing the transfer agency account fee rates on certain accounts.
Investment Performance. The Board considered whether the fund has operated in accordance with its investment objective, as well as its record of compliance with its investment restrictions. It also reviewed the fund's absolute investment performance for each class, as well as the fund's relative investment performance for each class measured over multiple periods against (i) a broad-based securities market index, and (ii) a peer group of mutual funds deemed appropriate by Fidelity and reviewed by the Board. The following charts considered by the Board show, over the one-, three-, and five-year periods ended December 31, 2010, the cumulative total returns of Initial Class and Service Class 2 of the fund, the cumulative total returns of a broad-based securities market index ("benchmark"), and a range of cumulative total returns of a peer group of mutual funds identified by Morningstar, Inc. as having an investment style similar to that of the fund based on underlying portfolio holdings. The returns of Initial Class and Service Class 2 show the performance of the highest and lowest performing classes, respectively (based on five-year performance). The box within each chart shows the 25th percentile return (bottom of box) and the 75th percentile return (top of box) of the peer group. Returns shown above the box are in the first quartile and returns shown below the box are in the fourth quartile. The percentage beaten numbers noted below each chart correspond to the percentile box and represent the percentage of funds in the peer group whose performance was equal to or lower than that of the class indicated.
VIP Growth Opportunities Portfolio
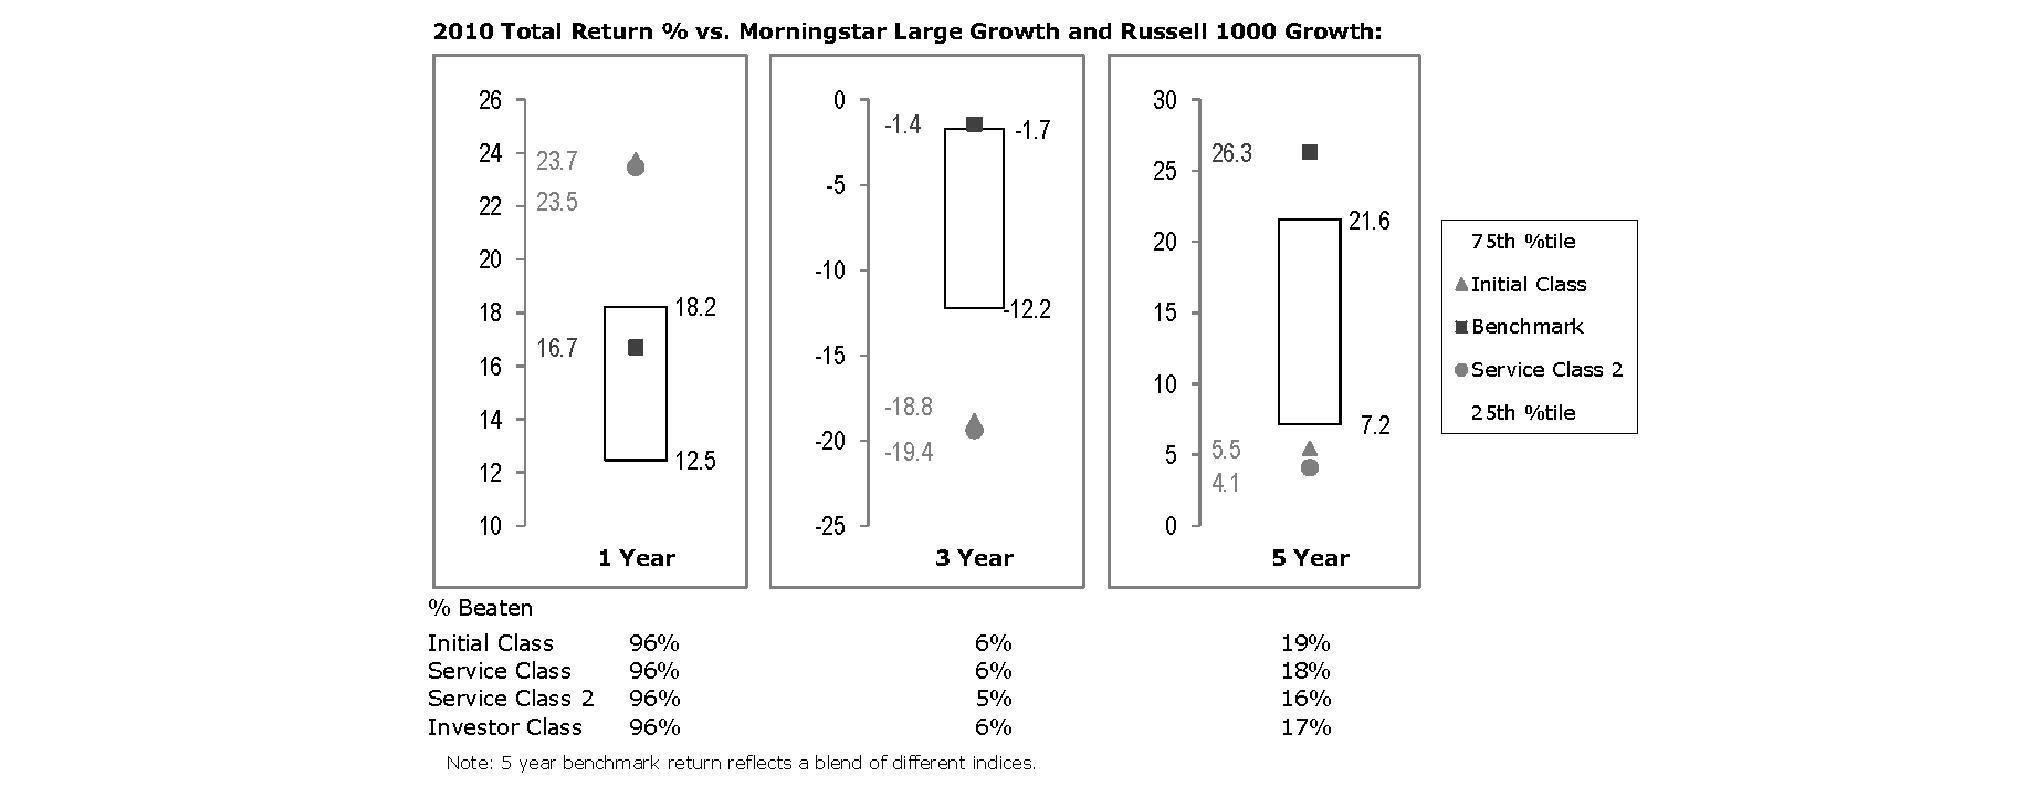
The Board reviewed the fund's relative investment performance against its peer group and noted that the performance of Initial Class of the fund was in the first quartile for the one-year period and the fourth quartile for the three- and five-year periods. The Board also noted that the investment performance of the fund was lower than its benchmark for the three- and five-year periods, although the one-year total return of Initial Class compared favorably to its benchmark. The Board considered that the variations in performance among the fund's classes reflect the variations in class expenses, which result in lower performance for higher expense classes. The Board also reviewed the fund's performance since inception as well as performance in the current year.
Based on its review, the Board concluded that the nature, extent, and quality of services provided to the fund under the Advisory Contracts should benefit the fund's shareholders.
Competitiveness of Management Fee and Total Expense Ratio. The Board considered the fund's management fee and total expense ratio compared to "mapped groups" of competitive funds and classes. Fidelity creates "mapped groups" by combining similar Lipper investment objective categories that have comparable management fee characteristics. Combining Lipper investment objective categories aids the Board's management fee and total expense ratio comparisons by broadening the competitive group used for comparison and by reducing the number of universes to which various Fidelity funds are compared.
Annual Report
Management Fee. The Board considered two proprietary management fee comparisons for the 12-month periods shown in the chart below. The group of Lipper funds used by the Board for management fee comparisons is referred to below as the "Total Mapped Group." The Total Mapped Group comparison focuses on a fund's standing relative to the total universe of comparable funds available to investors in terms of gross management fees before expense reimbursements or caps. "TMG %" represents the percentage of funds in the Total Mapped Group that had management fees that were lower than the fund's. For example, a TMG % of 10% means that 90% of the funds in the Total Mapped Group had higher management fees than the fund. The "Asset-Size Peer Group" (ASPG) comparison focuses on a fund's standing relative to non-Fidelity funds similar in size to the fund within the Total Mapped Group. The ASPG represents at least 15% of the funds in the Total Mapped Group with comparable asset size and management fee characteristics, subject to a minimum of 50 funds (or all funds in the Total Mapped Group if fewer than 50). Additional information, such as the ASPG quartile in which the fund's management fee ranked, is also included in the chart and considered by the Board.
VIP Growth Opportunities Portfolio
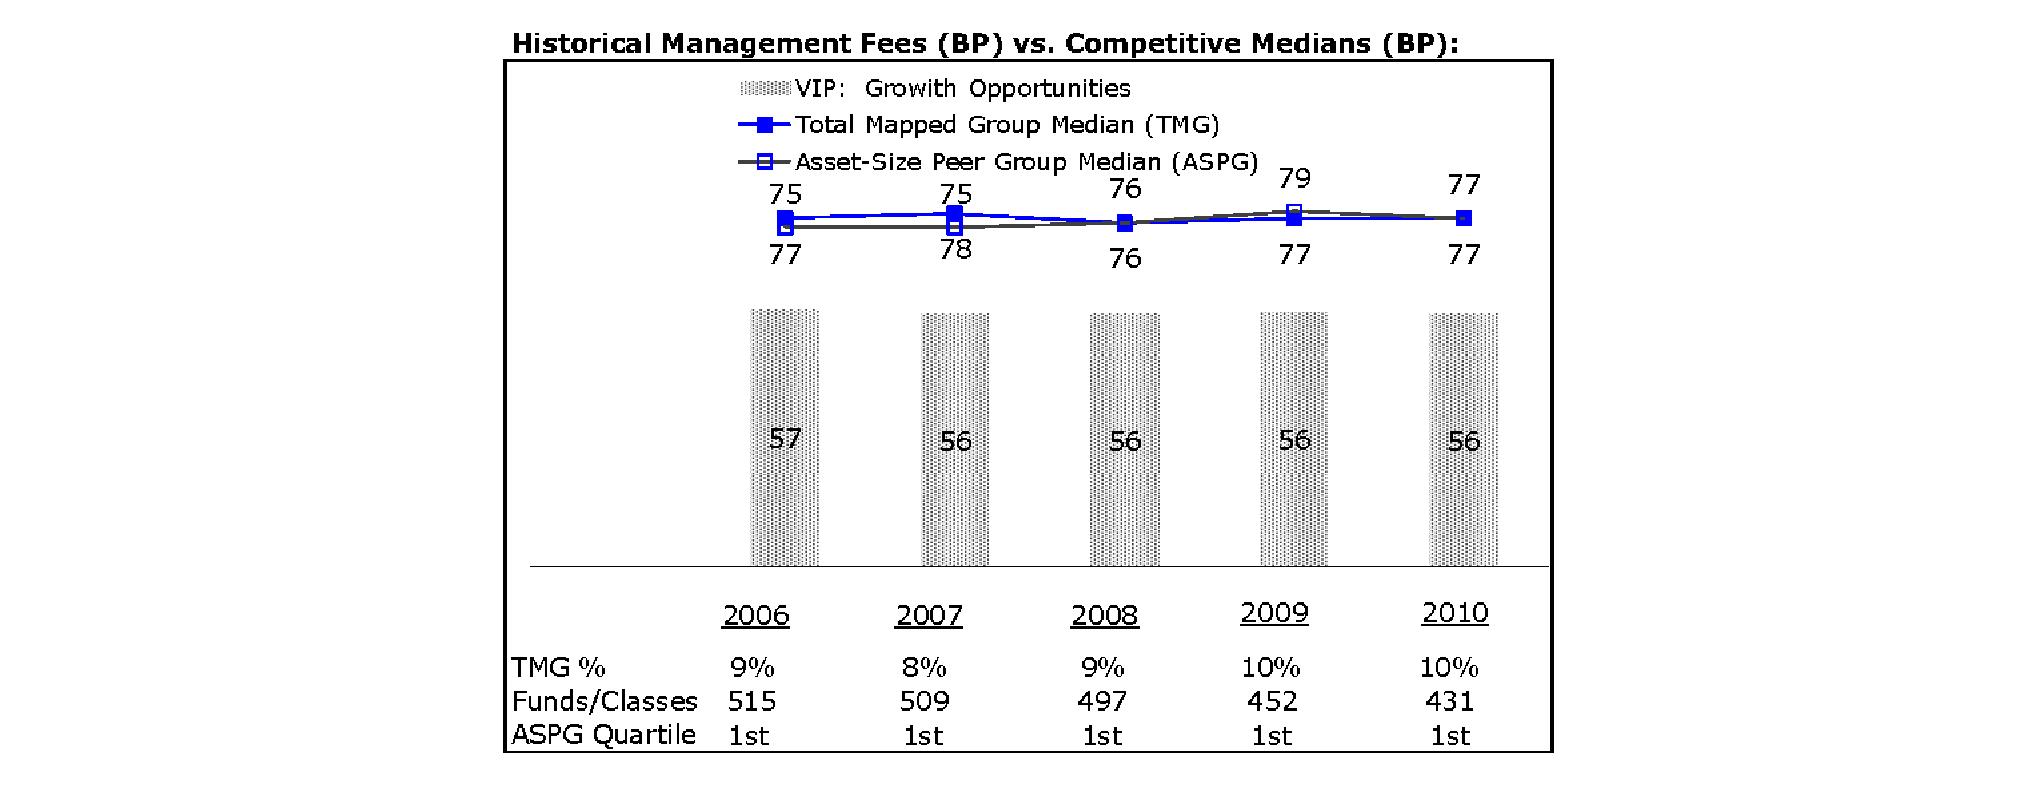
The Board noted that the fund's management fee ranked below the median of its Total Mapped Group and below the median of its ASPG for 2010.
Based on its review, the Board concluded that the fund's management fee is fair and reasonable in light of the services that the fund receives and the other factors considered.
Total Expense Ratio. In its review of each class's total expense ratio, the Board considered the fund's management fee as well as other fund or class expenses, as applicable, such as transfer agent fees, pricing and bookkeeping fees, fund-paid 12b-1 fees, and custodial, legal, and audit fees. The Board also noted the effects of any waivers and reimbursements on fees and expenses. As part of its review, the Board also considered the current and historical total expense ratios of each class of the fund compared to competitive fund median expenses. Each class of the fund is compared to those funds and classes in the Total Mapped Group (used by the Board for management fee comparisons) that have a similar sales load structure.
The Board noted that the total expense ratio of each of Initial Class, Investor Class, and Service Class ranked below its competitive median for 2010 and the total expense ratio of Service Class 2 ranked above its competitive median for 2010. The Board considered that various factors, including 12b-1 fees, positive or negative performance adjustments, and relatively higher other expenses in the case of small fund size, can affect total expense ratios. The Board also noted that Investor Class has higher transfer agent fees than traditional variable annuity classes because it is designed for lower cost annuity products, where the majority of servicing costs are incorporated into the funds' total expense ratios rather than being paid at the annuity level. The Board noted that the fund offers multiple classes, each of which has a different 12b-1 fee structure, and that the multiple structures are intended to offer a range of pricing options for the intermediary market. The Board also noted that the total expense ratios of the classes vary primarily by the level of their 12b-1 fees, although differences in transfer agent fees may also cause expenses to vary from class to class.
Fees Charged to Other Fidelity Clients. The Board also considered Fidelity fee structures and other information with respect to clients of FMR and its affiliates, such as other mutual funds advised or subadvised by FMR or its affiliates, pension plan clients, and other institutional clients. In March 2010, the Board created an ad hoc joint committee with the board of other Fidelity funds (the Committee) to review and compare Fidelity's institutional investment advisory business with its business of providing services to the Fidelity funds, including the differences in services provided, fees charged, and costs incurred, as well as competition in their respective marketplaces.
Annual Report
Board Approval of Investment Advisory Contracts and Management Fees - continued
Based on its review of total expense ratios and fees charged to other Fidelity clients, the Board concluded that the total expense ratio of each class of the fund was reasonable, although Service Class 2 was above the median of the universe presented for comparison, in light of the services that the fund and its shareholders receive and the other factors considered, including the findings of the Committee.
Costs of the Services and Profitability. The Board considered the revenues earned and the expenses incurred by Fidelity in conducting the business of developing, marketing, distributing, managing, administering and servicing the fund and its shareholders. The Board also considered the level of Fidelity's profits in respect of all the Fidelity funds.
On an annual basis, FMR presents to the Board Fidelity's profitability for the fund. Fidelity calculates the profitability for each fund, as well as aggregate profitability for groups of Fidelity funds and all Fidelity funds, using a series of detailed revenue and cost allocation methodologies which originate with the books and records of Fidelity on which Fidelity's audited financial statements are based. The Audit Committee of the Board reviews any significant changes from the prior year's methodologies.
PricewaterhouseCoopers LLP (PwC), independent registered public accounting firm and auditor to Fidelity and certain Fidelity funds, has been engaged annually by the Board as part of the Board's assessment of Fidelity's profitability analysis. PwC's engagement includes the review and assessment of Fidelity's methodologies used in determining the revenues and expenses attributable to Fidelity's mutual fund business, and completion of agreed-upon procedures surrounding the mathematical accuracy of fund profitability and its conformity to allocation methodologies. After considering PwC's reports issued under the engagement and information provided by Fidelity, the Board concluded that while other allocation methods may also be reasonable, Fidelity's profitability methodologies are reasonable in all material respects.
The Board also reviewed Fidelity's non-fund businesses and fall-out benefits related to the mutual fund business as well as cases where Fidelity's affiliates may benefit from or be related to the fund's business.
The Board considered the costs of the services provided by and the profits realized by Fidelity in connection with the operation of the fund and was satisfied that the profitability was not excessive in the circumstances.
Economies of Scale. The Board considered whether there have been economies of scale in respect of the management of the Fidelity funds, whether the Fidelity funds (including the fund) have appropriately benefited from any such economies of scale, and whether there is potential for realization of any further economies of scale. The Board considered the extent to which the fund will benefit from economies of scale through increased services to the fund, through waivers or reimbursements, or through fee or expense reductions. The Board also noted that in 2009, it and the board of other Fidelity funds created an ad hoc committee (the Economies of Scale Committee) to analyze whether FMR attains economies of scale in respect of the management and servicing of the Fidelity funds, whether the Fidelity funds have appropriately benefited from such economies of scale, and whether there is potential for realization of any further economies of scale.
The Board recognized that the fund's management contract incorporates a "group fee" structure, which provides for lower group fee rates as total fund assets under FMR's management increase, and for higher group fee rates as total fund assets under FMR's management decrease. FMR calculates the group fee rates based on a tiered asset "breakpoint" schedule that varies based on asset class. The Board considered that the group fee is designed to deliver the benefits of economies of scale to fund shareholders when total Fidelity fund assets increase, even if assets of any particular fund are unchanged or have declined, because some portion of Fidelity's costs are attributable to services provided to all Fidelity funds, and all funds benefit if those costs can be allocated among more assets. The Board concluded that, given the group fee structure, fund shareholders will benefit from lower management fees as assets under FMR's management increase at the fund complex level, regardless of whether Fidelity achieves any such economies of scale.
The Board concluded, taking into account the analysis of the Economies of Scale Committee, that any potential economies of scale are being appropriately shared between fund shareholders and Fidelity.
Additional Information Requested by the Board. In order to develop fully the factual basis for consideration of the Fidelity funds' Advisory Contracts, the Board requested and received additional information on certain topics, including (i) fund performance trends, actions to be taken by FMR to improve certain funds' overall performance, and Fidelity's long-term strategies for certain funds; (ii) portfolio manager changes that have occurred during the past year and length of portfolio manager tenure for different categories of funds over time; (iii) Fidelity's compensation structure for portfolio managers and other key personnel and strategies for attracting and retaining non-investment personnel; (iv) the amount of the investment that each portfolio manager has made in the Fidelity fund(s) that he or she manages; (v) historical trends in Fidelity's realization of fall-out benefits; (vi) Fidelity's group fee structures and the rationale for the individual fee rates of certain funds; (vii) fund profitability methodology and the impact of certain factors on fund profitability results; (viii) trends regarding industry use of performance fee structures and Fidelity's compliance practices with respect to performance adjustment calculations; (ix) the fee structures in place for certain other Fidelity clients; and (x) explanations regarding the relative total expense ratios of certain funds and classes, total expense competitive trends, and actions that might be taken by FMR to reduce total expense ratios for certain funds and classes.
Based on its evaluation of all of the conclusions noted above, and after considering all factors it believed relevant, the Board ultimately concluded that the advisory fee structures are fair and reasonable, and that the fund's Advisory Contracts should be renewed.
Annual Report
Investment Adviser
Fidelity Management & Research Company
Boston, MA
Investment Sub-Advisers
Fidelity Management & Research (Hong Kong) Limited
Fidelity Management & Research (Japan) Inc.
FMR Co., Inc.
Fidelity Management & Research (U.K.) Inc.
General Distributor
Fidelity Distributors Corporation
Boston, MA
Transfer and Service Agents
Fidelity Investments Institutional Operations Company, Inc.
Boston, MA
Fidelity Service Company, Inc.
Boston, MA
Custodian
The Bank of New York Mellon
New York, NY
VIPGRO-ANN-0212
1.540209.114
Fidelity® Variable Insurance Products:
Growth Strategies Portfolio
Annual Report
December 31, 2011
Contents
Performance | (Click Here) | How the fund has done over time. |
Management's Discussion of Fund Performance | (Click Here) | The Portfolio Manager's review of fund performance and strategy. |
Shareholder Expense Example | (Click Here) | An example of shareholder expenses. |
Investment Changes | (Click Here) | A summary of major shifts in the fund's investments over the past six months. |
Investments | (Click Here) | A complete list of the fund's investments with their market values. |
Financial Statements | (Click Here) | Statements of assets and liabilities, operations, and changes in net assets, as well as financial highlights. |
Notes | (Click Here) | Notes to the financial statements. |
Report of Independent Registered Public Accounting Firm | (Click Here) | |
Trustees and Officers | (Click Here) | |
Board Approval of Investment Advisory Contracts and Management Fees | (Click Here) | |
To view a fund's proxy voting guidelines and proxy voting record for the 12-month period ended June 30, visit http://www.fidelity.com/proxyvotingresults or visit the Securities and Exchange Commission's (SEC) web site at http://www.sec.gov. You may also call 1-877-208-0098 to request a free copy of the proxy voting guidelines.
Fidelity Variable Insurance Products are separate account options which are purchased through a variable insurance contract.
Standard & Poor's, S&P and S&P 500 are registered service marks of The McGraw-Hill Companies, Inc. and have been licensed for use by Fidelity Distributors Corporation.
Other third party marks appearing herein are the property of their respective owners.
All other marks appearing herein are registered or unregistered trademarks or service marks of FMR LLC or an affiliated company.
This report and the financial statements contained herein are submitted for the general information of the shareholders of the fund. This report is not authorized for distribution to prospective investors in the fund unless preceded or accompanied by an effective prospectus.
A fund files its complete schedule of portfolio holdings with the SEC for the first and third quarters of each fiscal year on Form N-Q. Forms N-Q are available on the SEC's web site at http://www.sec.gov. A fund's Forms N-Q may be reviewed and copied at the SEC's Public Reference Room in Washington, DC. Information regarding the operation of the SEC's Public Reference Room may be obtained by calling 1-800-SEC-0330. For a complete list of a fund's portfolio holdings, view the most recent holdings listing, semiannual report, or annual report on Fidelity's web site at http://www.fidelity.com, http://www.advisor.fidelity.com, or http://www.401k.com, as applicable.
NOT FDIC INSURED • MAY LOSE VALUE • NO BANK GUARANTEE
Neither the fund nor Fidelity Distributors Corporation is a bank.
Annual Report
Average annual total return reflects the change in the value of an investment, assuming reinvestment of the class' distributions from dividend income and capital gains (the profits earned upon the sale of securities that have grown in value, if any) and assuming a constant rate of performance each year. During periods of reimbursement by Fidelity, a fund's total return will be greater than it would be had the reimbursement not occurred. Performance numbers are net of all underlying fund operating expenses, but do not include any insurance charges imposed by your insurance company's separate account. If performance information included the effect of these additional charges, the total returns would have been lower. How a fund did yesterday is no guarantee of how it will do tomorrow.
Average Annual Total Returns
Periods ended December 31, 2011 | Past 1
year | Past 5
years | Past 10
years |
VIP Growth Strategies Portfolio - Initial Class | -8.99% | -0.88% | 1.75% |
VIP Growth Strategies Portfolio - Service Class | -9.01% | -0.97% | 1.67% |
VIP Growth Strategies Portfolio - Service Class 2 | -9.22% | -1.12% | 1.48% |
VIP Growth Strategies Portfolio - Investor Class A | -9.05% | -0.97% | 1.68% |
A The initial offering of Investor Class shares took place on July 21, 2005. Returns prior to July 21, 2005 are those of Initial Class. If Investor Class's transfer agent fee had been reflected, returns prior to July 21, 2005, would have been lower.
$10,000 Over 10 Years
Let's say hypothetically that $10,000 was invested in VIP Growth Strategies Portfolio - Initial Class on December 31, 2001, when the fund started. The chart shows how the value of your investment would have changed, and also shows how the Russell Midcap® Growth Index performed over the same period.
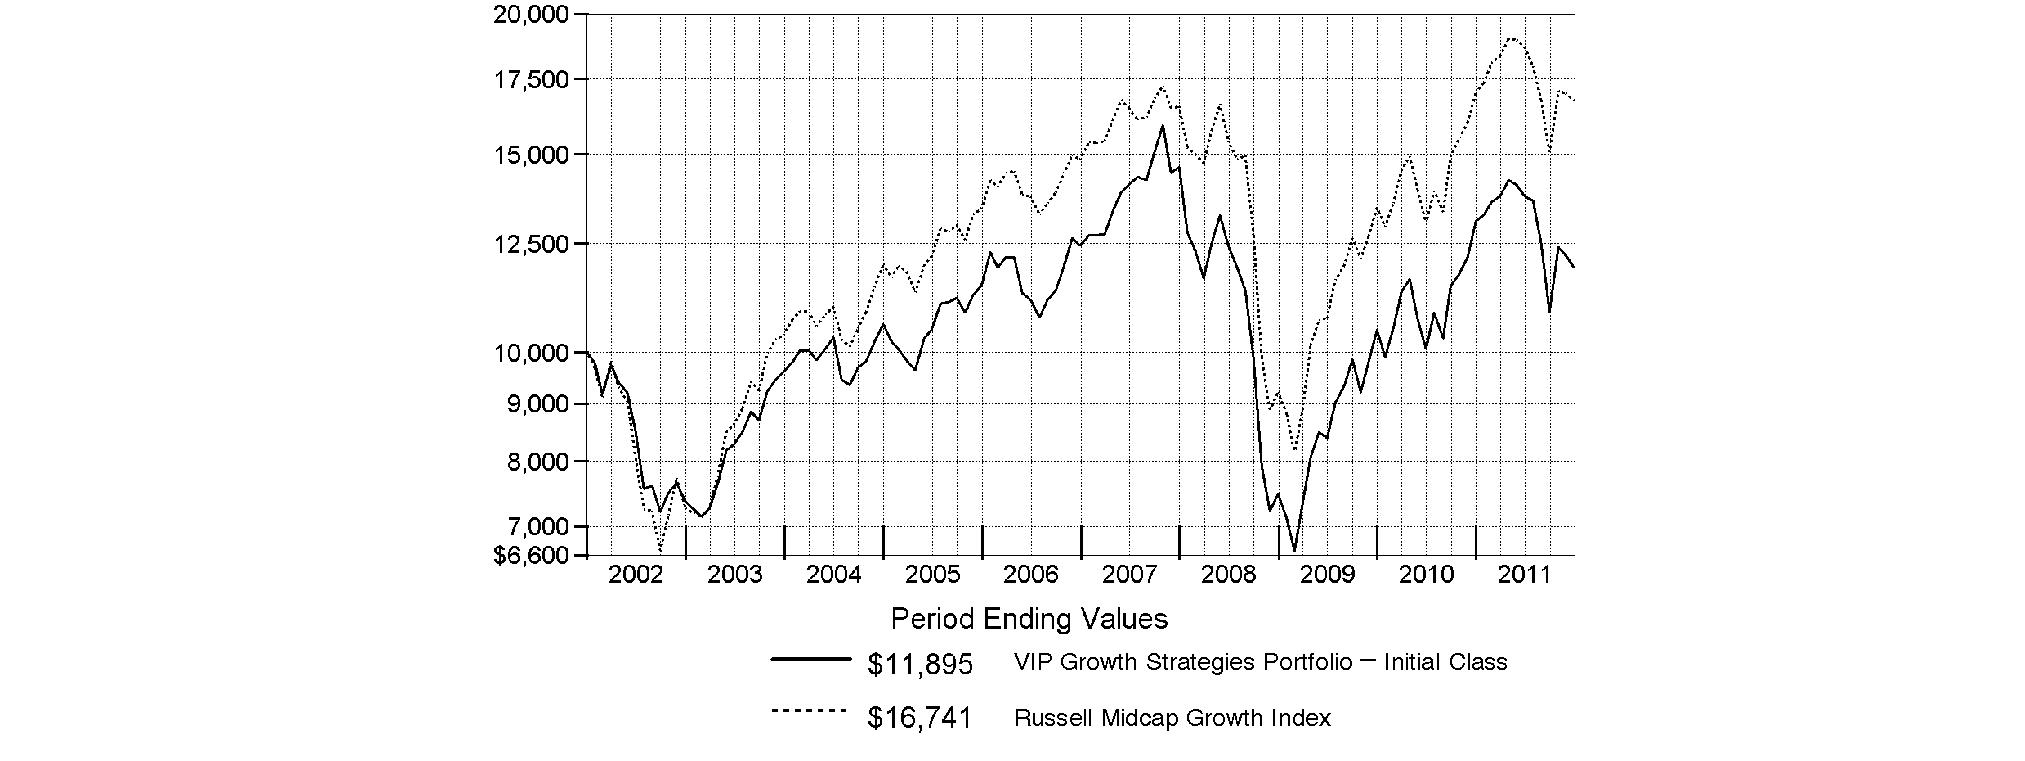
Annual Report
Market Recap: Extreme market volatility took center stage during the 12 months ending December 31, 2011, stealing the spotlight from signs of progress in the global economy. Early in the year, aggressive monetary stimulus by the U.S. federal government, improving credit-market conditions and solid corporate earnings buoyed most major asset classes. As the period progressed, however, fresh worries about sovereign debt in Europe, inflation in China, gridlock over raising the debt ceiling in the U.S. - along with Standard & Poor's early-August downgrade of the nation's long-term sovereign credit rating - and a dimmed outlook for global growth punctured investor confidence and ignited market instability. Domestic equities, as measured by the broad-based S&P 500® Index, gained 2.11%, easily outpacing the 13.61% decline of MSCI® ACWI® (All Country World Index) ex USA Index, a proxy for foreign stocks. Within the MSCI index, emerging markets declined the most (-18%), with investments here generally held back by a stronger U.S. dollar. The U.K. (-3%) fared better than the rest of Europe (-15%), which was the second-worst-performing index component. Bolstered by periodic flights to quality, U.S. investment-grade bonds posted a 7.84% advance, as reflected by the Barclays Capital® U.S. Aggregate Bond Index, outperforming the 4.37% gain of high-yield securities, as represented by The BofA Merrill LynchSM US High Yield Constrained Index. Hampered by financial woes in Europe, the sovereign debt of major developed markets outside the U.S. rose 4.86%, according to the Citigroup® Non-USD Group-of-Seven (G7) Equal Weighted Index, while the JPMorgan Emerging Markets Bond Index Global (EMBI Global) advanced 8.46%, despite the currency head wind.
Comments from Steven Calhoun, Portfolio Manager of VIP Growth Strategies Portfolio: For the year, the fund's share classes significantly lagged the -1.65% return of the Russell Midcap® Growth Index. (For specific portfolio results, please refer to the performance section of this report.) Versus its benchmark, the fund's performance was hampered by weak stock picking and an underweighting in the strong-performing consumer discretionary sector, especially the retailing group. Security selection in industrials, energy and financials also meaningfully detracted. China-based seed supplier Origin Agritech was the largest individual detractor, as the government there tightened credit, which hurt Chinese stocks in general and particularly small-caps. Additionally, allegations of fraud at some other Chinese companies made investors more reluctant to hold China-based stocks. Other notable detractors included biotechnology firm Human Genome Sciences; high-definition videoconferencing equipment provider Polycom; NuVasive, a maker of minimally invasive surgical products for the spine; and metallurgical coal producer Walter Energy. Origin Agritech and NuVasive were out-of-index holdings. Conversely, positioning in information technology, health care and utilities bolstered relative performance the most. U.K.-based Autonomy took top honors as the largest individual contributor. The company, which provides cloud computing software that organizes data in e-mails, phone calls and other unstructured forms of communication, saw its stock surge in August, when it was announced the company would be bought by Hewlett-Packard on favorable terms. I sold the stock to lock in profits before the deal closed in October. Also aiding the fund's results was Heckmann, a provider of transportation and remediation services for wastewater created by "fracking," the hydraulic fracturing process widely used to extract natural gas from shale beds. Another top contributor was CVR Partners, which had its initial public offering in April and saw its stock run up sharply from there. The company uses a petroleum coke gasification process to produce nitrogen fertilizer. Biopharmaceutical firm Inhibitex was a contributor as well. All four contributors I've highlighted were out-of-index positions.
The views expressed above reflect those of the portfolio manager(s) only through the end of the period as stated on the cover of this report and do not necessarily represent the views of Fidelity or any other person in the Fidelity organization. Any such views are subject to change at any time based upon market or other conditions and Fidelity disclaims any responsibility to update such views. These views may not be relied on as investment advice and, because investment decisions for a Fidelity fund are based on numerous factors, may not be relied on as an indication of trading intent on behalf of any Fidelity fund.
Annual Report
As a shareholder of the Fund, you incur two types of costs: (1) transaction costs, and (2) ongoing costs, including management fees, distribution and/or service (12b-1) fees and other Fund expenses. This Example is intended to help you understand your ongoing costs (in dollars) of investing in the Fund and to compare these costs with the ongoing costs of investing in other mutual funds.
The Example is based on an investment of $1,000 invested at the beginning of the period and held for the entire period (July 1, 2011 to December 31, 2011).
Actual Expenses
The first line of the accompanying table for each class of the Fund provides information about actual account values and actual expenses. You may use the information in this line, together with the amount you invested, to estimate the expenses that you paid over the period. Simply divide your account value by $1,000.00 (for example, an $8,600 account value divided by $1,000.00 = 8.6), then multiply the result by the number in the first line for a class of the Fund under the heading entitled "Expenses Paid During Period" to estimate the expenses you paid on your account during this period. The estimate of expenses does not include any fees or other expenses of any variable annuity or variable life insurance product. If they were, the estimate of expenses you paid during the period would be higher, and your ending account value would be lower. In addition, the Fund, as a shareholder in the underlying Fidelity Central Funds, will indirectly bear its pro-rata share of the fees and expenses incurred by the underlying Fidelity Central Funds. These fees and expenses are not included in the Fund's annualized expense ratio used to calculate the expense estimate in the table below.
Hypothetical Example for Comparison Purposes
The second line of the accompanying table for each class of the Fund provides information about hypothetical account values and hypothetical expenses based on a Class' actual expense ratio and an assumed rate of return of 5% per year before expenses, which is not the Class' actual return. The hypothetical account values and expenses may not be used to estimate the actual ending account balance or expenses you paid for the period. You may use this information to compare the ongoing costs of investing in the Fund and other funds. To do so, compare this 5% hypothetical example with the 5% hypothetical examples that appear in the shareholder reports of the other funds. The estimate of expenses does not include any fees or other expenses of any variable annuity or variable life insurance product. If they were, the estimate of expenses you paid during the period would be higher, and your ending account value would be lower. In addition, the Fund, as a shareholder in the underlying Fidelity Central Funds, will indirectly bear its pro-rata share of the fees and expenses incurred by the underlying Fidelity Central Funds. These fees and expenses are not included in the Fund's annualized expense ratio used to calculate the expense estimate in the table below.
Please note that the expenses shown in the table are meant to highlight your ongoing costs only and do not reflect any transaction costs. Therefore, the second line of the table is useful in comparing ongoing costs only, and will not help you determine the relative total costs of owning different funds.
| Annualized
Expense Ratio | Beginning
Account Value
July 1, 2011 | Ending
Account Value
December 31, 2011 | Expenses Paid
During Period*
July 1, 2011 to
December 31, 2011 |
Initial Class | .90% | | | |
Actual | | $ 1,000.00 | $ 865.00 | $ 4.23 |
HypotheticalA | | $ 1,000.00 | $ 1,020.67 | $ 4.58 |
Service Class | 1.00% | | | |
Actual | | $ 1,000.00 | $ 864.70 | $ 4.70 |
HypotheticalA | | $ 1,000.00 | $ 1,020.16 | $ 5.09 |
Service Class 2 | 1.15% | | | |
Actual | | $ 1,000.00 | $ 863.60 | $ 5.40 |
HypotheticalA | | $ 1,000.00 | $ 1,019.41 | $ 5.85 |
Investor Class | .98% | | | |
Actual | | $ 1,000.00 | $ 865.00 | $ 4.61 |
HypotheticalA | | $ 1,000.00 | $ 1,020.27 | $ 4.99 |
A 5% return per year before expenses
* Expenses are equal to each Class' annualized expense ratio, multiplied by the average account value over the period, multiplied by 184/365 (to reflect the one-half year period).
Annual Report
Investment Changes (Unaudited)
Top Ten Stocks as of December 31, 2011 |
| % of fund's
net assets | % of fund's net assets
6 months ago |
Cyberonics, Inc. | 2.4 | 1.3 |
Heckmann Corp. | 2.4 | 1.2 |
CF Industries Holdings, Inc. | 2.2 | 3.4 |
ArthroCare Corp. | 2.2 | 1.1 |
Walter Energy, Inc. | 1.9 | 0.0 |
Alpha Natural Resources, Inc. | 1.7 | 0.0 |
CVR Partners LP | 1.7 | 1.6 |
Zoll Medical Corp. | 1.6 | 0.9 |
Citrix Systems, Inc. | 1.6 | 0.0 |
Potash Corp. of Saskatchewan, Inc. | 1.6 | 0.0 |
| 19.3 | |
Top Five Market Sectors as of December 31, 2011 |
| % of fund's
net assets | % of fund's net assets
6 months ago |
Information Technology | 20.4 | 20.5 |
Consumer Discretionary | 17.8 | 17.7 |
Health Care | 15.6 | 13.5 |
Energy | 13.4 | 13.4 |
Materials | 12.0 | 12.3 |
Asset Allocation (% of fund's net assets) |
As of December 31, 2011* | As of June 30, 2011** |
 | Stocks 98.6% | | | Stocks 99.9% | |
 | Short-Term
Investments and
Net Other Assets 1.4% | | | Short-Term
Investments and
Net Other Assets 0.1% | |
* Foreign investments | 13.3% | | ** Foreign investments | 19.7% | |

Annual Report
Investments December 31, 2011
Showing Percentage of Net Assets
Common Stocks - 98.6% |
| Shares | | Value |
CONSUMER DISCRETIONARY - 17.8% |
Automobiles - 0.8% |
Tesla Motors, Inc. (a) | 5,064 | | $ 144,628 |
Diversified Consumer Services - 0.9% |
Weight Watchers International, Inc. | 2,942 | | 161,839 |
Hotels, Restaurants & Leisure - 2.3% |
BJ's Restaurants, Inc. (a) | 2,011 | | 91,139 |
Buffalo Wild Wings, Inc. (a) | 1,400 | | 94,514 |
Panera Bread Co. Class A (a) | 812 | | 114,857 |
Texas Roadhouse, Inc. Class A | 6,609 | | 98,474 |
| | 398,984 |
Media - 1.1% |
Discovery Communications, Inc. (a) | 4,545 | | 186,209 |
Multiline Retail - 1.1% |
Dollar Tree, Inc. (a) | 2,433 | | 202,207 |
Specialty Retail - 5.4% |
Abercrombie & Fitch Co. Class A | 2,839 | | 138,657 |
Body Central Corp. (a) | 4,685 | | 116,938 |
Limited Brands, Inc. | 5,415 | | 218,495 |
Tiffany & Co., Inc. | 2,864 | | 189,769 |
Tractor Supply Co. | 2,465 | | 172,920 |
Ulta Salon, Cosmetics & Fragrance, Inc. (a) | 1,590 | | 103,223 |
| | 940,002 |
Textiles, Apparel & Luxury Goods - 6.2% |
Liz Claiborne, Inc. (a) | 24,668 | | 212,885 |
Michael Kors Holdings Ltd. | 2,224 | | 60,604 |
PVH Corp. | 3,021 | | 212,950 |
Ralph Lauren Corp. | 1,764 | | 243,573 |
Under Armour, Inc. Class A (sub. vtg.) (a) | 2,576 | | 184,931 |
Warnaco Group, Inc. (a) | 3,600 | | 180,144 |
| | 1,095,087 |
TOTAL CONSUMER DISCRETIONARY | | 3,128,956 |
CONSUMER STAPLES - 4.0% |
Beverages - 0.6% |
Hansen Natural Corp. (a) | 1,073 | | 98,866 |
Food & Staples Retailing - 1.2% |
Whole Foods Market, Inc. | 2,900 | | 201,782 |
Food Products - 1.7% |
Green Mountain Coffee Roasters, Inc. (a) | 3,318 | | 148,812 |
Mead Johnson Nutrition Co. Class A | 1,335 | | 91,755 |
Origin Agritech Ltd. (a) | 25,735 | | 60,735 |
| | 301,302 |
Tobacco - 0.5% |
Lorillard, Inc. | 800 | | 91,200 |
TOTAL CONSUMER STAPLES | | 693,150 |
|
| Shares | | Value |
ENERGY - 13.4% |
Energy Equipment & Services - 3.8% |
Cameron International Corp. (a) | 5,700 | | $ 280,383 |
Dresser-Rand Group, Inc. (a) | 4,100 | | 204,631 |
Rowan Companies, Inc. (a) | 5,800 | | 175,914 |
| | 660,928 |
Oil, Gas & Consumable Fuels - 9.6% |
Alpha Natural Resources, Inc. (a) | 15,106 | | 308,616 |
Amyris, Inc. (a) | 5,700 | | 65,778 |
Bumi PLC | 12,392 | | 169,370 |
Cabot Oil & Gas Corp. | 2,700 | | 204,930 |
EV Energy Partners LP | 2,700 | | 177,930 |
EXCO Resources, Inc. | 17,899 | | 187,045 |
Oasis Petroleum, Inc. (a) | 6,134 | | 178,438 |
QEP Resources, Inc. | 5,400 | | 158,220 |
Range Resources Corp. | 2,700 | | 167,238 |
Solazyme, Inc. | 5,900 | | 70,210 |
| | 1,687,775 |
TOTAL ENERGY | | 2,348,703 |
FINANCIALS - 1.1% |
Real Estate Investment Trusts - 0.5% |
SL Green Realty Corp. | 1,400 | | 93,296 |
Real Estate Management & Development - 0.6% |
Altisource Portfolio Solutions SA (a) | 2,000 | | 100,360 |
TOTAL FINANCIALS | | 193,656 |
HEALTH CARE - 15.6% |
Biotechnology - 6.6% |
Alexion Pharmaceuticals, Inc. (a) | 2,600 | | 185,900 |
Human Genome Sciences, Inc. (a) | 17,218 | | 127,241 |
Idenix Pharmaceuticals, Inc. (a) | 27,952 | | 208,103 |
Inhibitex, Inc. (a) | 14,304 | | 156,486 |
Theravance, Inc. (a) | 4,859 | | 107,384 |
United Therapeutics Corp. (a) | 4,372 | | 206,577 |
Vertex Pharmaceuticals, Inc. (a) | 5,065 | | 168,209 |
| | 1,159,900 |
Health Care Equipment & Supplies - 8.2% |
ArthroCare Corp. (a) | 12,098 | | 383,265 |
Cyberonics, Inc. (a) | 12,679 | | 424,743 |
Insulet Corp. (a) | 5,458 | | 102,774 |
NuVasive, Inc. (a) | 16,739 | | 210,744 |
Zeltiq Aesthetics, Inc. | 2,932 | | 33,308 |
Zoll Medical Corp. (a) | 4,617 | | 291,702 |
| | 1,446,536 |
Health Care Technology - 0.8% |
Merge Healthcare, Inc. (a) | 27,562 | | 133,676 |
TOTAL HEALTH CARE | | 2,740,112 |
Common Stocks - continued |
| Shares | | Value |
INDUSTRIALS - 11.9% |
Aerospace & Defense - 1.2% |
BE Aerospace, Inc. (a) | 5,200 | | $ 201,292 |
Building Products - 2.6% |
Lennox International, Inc. | 6,917 | | 233,449 |
Owens Corning (a) | 7,900 | | 226,888 |
| | 460,337 |
Electrical Equipment - 2.6% |
Cooper Industries PLC Class A | 4,200 | | 227,430 |
Roper Industries, Inc. | 2,650 | | 230,206 |
| | 457,636 |
Machinery - 5.1% |
CNH Global NV (a) | 7,925 | | 285,221 |
IDEX Corp. | 3,400 | | 126,174 |
Ingersoll-Rand PLC | 9,200 | | 280,324 |
WABCO Holdings, Inc. (a) | 2,287 | | 99,256 |
Westport Innovations, Inc. (a) | 3,195 | | 106,202 |
| | 897,177 |
Marine - 0.4% |
Ultrapetrol (Bahamas) Ltd. (a) | 23,849 | | 71,070 |
TOTAL INDUSTRIALS | | 2,087,512 |
INFORMATION TECHNOLOGY - 20.4% |
Communications Equipment - 1.5% |
Polycom, Inc. (a) | 11,196 | | 182,495 |
Riverbed Technology, Inc. (a) | 3,204 | | 75,294 |
| | 257,789 |
Computers & Peripherals - 0.9% |
SanDisk Corp. (a) | 3,318 | | 163,279 |
Electronic Equipment & Components - 1.2% |
Aeroflex Holding Corp. (a) | 2,100 | | 21,504 |
Maxwell Technologies, Inc. (a) | 11,368 | | 184,616 |
| | 206,120 |
Internet Software & Services - 2.9% |
Blinkx PLC (a) | 41,456 | | 49,256 |
Rackspace Hosting, Inc. (a) | 4,398 | | 189,158 |
Velti PLC (a) | 7,300 | | 49,640 |
VeriSign, Inc. | 6,100 | | 217,892 |
| | 505,946 |
IT Services - 1.1% |
Cognizant Technology Solutions Corp. Class A (a) | 2,989 | | 192,223 |
Semiconductors & Semiconductor Equipment - 5.3% |
ASML Holding NV | 4,800 | | 200,592 |
Ceva, Inc. (a) | 6,038 | | 182,710 |
Freescale Semiconductor Holdings I Ltd. | 7,200 | | 91,080 |
|
| Shares | | Value |
KLA-Tencor Corp. | 3,956 | | $ 190,877 |
NVIDIA Corp. (a) | 13,300 | | 184,338 |
NXP Semiconductors NV (a) | 5,600 | | 86,072 |
| | 935,669 |
Software - 7.5% |
ANSYS, Inc. (a) | 3,883 | | 222,418 |
Ariba, Inc. (a) | 3,700 | | 103,896 |
Autodesk, Inc. (a) | 6,301 | | 191,109 |
Citrix Systems, Inc. (a) | 4,700 | | 285,384 |
Informatica Corp. (a) | 4,486 | | 165,668 |
Intuit, Inc. | 4,700 | | 247,173 |
Nuance Communications, Inc. (a) | 3,964 | | 99,734 |
| | 1,315,382 |
TOTAL INFORMATION TECHNOLOGY | | 3,576,408 |
MATERIALS - 12.0% |
Chemicals - 8.5% |
CF Industries Holdings, Inc. | 2,682 | | 388,836 |
CVR Partners LP | 11,915 | | 295,730 |
Monsanto Co. | 2,400 | | 168,168 |
Potash Corp. of Saskatchewan, Inc. | 6,900 | | 285,309 |
Rentech Nitrogen Partners LP | 4,900 | | 80,115 |
The Mosaic Co. | 5,600 | | 282,408 |
| | 1,500,566 |
Metals & Mining - 3.5% |
First Quantum Minerals Ltd. | 6,700 | | 131,908 |
Genel Energy PLC | 3,300 | | 39,722 |
Ivanhoe Mines Ltd. (a) | 6,100 | | 108,355 |
Walter Energy, Inc. | 5,438 | | 329,325 |
| | 609,310 |
TOTAL MATERIALS | | 2,109,876 |
UTILITIES - 2.4% |
Water Utilities - 2.4% |
Heckmann Corp. (a) | 62,757 | | 417,334 |
TOTAL COMMON STOCKS (Cost $18,350,853) |
17,295,707
|
Money Market Funds - 2.2% |
| | | |
Fidelity Cash Central Fund, 0.11% (b)
(Cost $382,171) | 382,171 | |
382,171
|
TOTAL INVESTMENT PORTFOLIO - 100.8% (Cost $18,733,024) | | 17,677,878 |
NET OTHER ASSETS (LIABILITIES) - (0.8)% | | (136,800) |
NET ASSETS - 100% | $ 17,541,078 |
Legend |
(a) Non-income producing |
(b) Affiliated fund that is available only to investment companies and other accounts managed by Fidelity Investments. The rate quoted is the annualized seven-day yield of the fund at period end. A complete unaudited listing of the fund's holdings as of its most recent quarter end is available upon request. In addition, each Fidelity Central Fund's financial statements, which are not covered by the Fund's Report of Independent Registered Public Accounting Firm, are available on the SEC's website or upon request. |
Affiliated Central Funds |
Information regarding fiscal year to date income earned by the Fund from investments in Fidelity Central Funds is as follows: |
Fund | Income earned |
Fidelity Cash Central Fund | $ 479 |
Other Information |
All investments are categorized as Level 1 under the Fair Value Hierarchy. The inputs or methodology used for valuing securities may not be an indication of the risk associated with investing in those securities. For more information on valuation inputs, please refer to the Security Valuation section in the accompanying Notes to Financial Statements. |
Distribution of investments by country of issue, as a percentage of total net assets, is as follows: (Unaudited) |
United States of America | 86.7% |
Canada | 3.6% |
Netherlands | 3.2% |
Ireland | 2.9% |
United Kingdom | 1.5% |
Others (Individually Less Than 1%) | 2.1% |
| 100.0% |
See accompanying notes which are an integral part of the financial statements.
Annual Report
Statement of Assets and Liabilities
| December 31, 2011 |
| | |
Assets | | |
Investment in securities, at value - See accompanying schedule: Unaffiliated issuers (cost $18,350,853) | $ 17,295,707 | |
Fidelity Central Funds (cost $382,171) | 382,171 | |
Total Investments (cost $18,733,024) | | $ 17,677,878 |
Receivable for fund shares sold | | 659 |
Dividends receivable | | 6,247 |
Distributions receivable from Fidelity Central Funds | | 38 |
Prepaid expenses | | 63 |
Receivable from investment adviser for expense reductions | | 9,168 |
Other receivables | | 11,820 |
Total assets | | 17,705,873 |
| | |
Liabilities | | |
Payable for investments purchased | $ 4,703 | |
Payable for fund shares redeemed | 119,668 | |
Accrued management fee | 9,129 | |
Distribution and service plan fees payable | 1,051 | |
Other affiliated payables | 2,099 | |
Other payables and accrued
expenses | 28,145 | |
Total liabilities | | 164,795 |
| | |
Net Assets | | $ 17,541,078 |
Net Assets consist of: | | |
Paid in capital | | $ 25,115,874 |
Accumulated undistributed net realized gain (loss) on investments and foreign currency transactions | | (6,518,914) |
Net unrealized appreciation (depreciation) on investments and assets and liabilities in foreign
currencies | | (1,055,882) |
Net Assets | | $ 17,541,078 |
Statement of Assets and Liabilities - continued
| December 31, 2011 |
| | |
Initial Class:
Net Asset Value, offering price and redemption price per share ($5,209,914 ÷ 635,400 shares) | | $ 8.20 |
| | |
Service Class:
Net Asset Value, offering price and redemption price per share ($159,777 ÷ 19,537 shares) | | $ 8.18 |
| | |
Service Class 2:
Net Asset Value, offering price and redemption price per share ($4,828,262 ÷ 605,015 shares) | | $ 7.98 |
| | |
Investor Class:
Net Asset Value, offering price and redemption price per share ($7,343,125 ÷ 902,235 shares) | | $ 8.14 |
See accompanying notes which are an integral part of the financial statements.
Annual Report
Financial Statements - continued
Statement of Operations
| Year ended December 31, 2011 |
| | |
Investment Income | | |
Dividends | | $ 128,070 |
Interest | | 220 |
Income from Fidelity Central Funds | | 479 |
Total income | | 128,769 |
| | |
Expenses | | |
Management fee | $ 131,439 | |
Transfer agent fees | 29,385 | |
Distribution and service plan fees | 14,509 | |
Accounting fees and expenses | 8,419 | |
Custodian fees and expenses | 19,849 | |
Independent trustees' compensation | 122 | |
Audit | 51,307 | |
Legal | 97 | |
Miscellaneous | 193 | |
Total expenses before reductions | 255,320 | |
Expense reductions | (42,612) | 212,708 |
Net investment income (loss) | | (83,939) |
Realized and Unrealized Gain (Loss) Net realized gain (loss) on: | | |
Investment securities: | | |
Unaffiliated issuers | 2,164,333 | |
Foreign currency transactions | 2,583 | |
Total net realized gain (loss) | | 2,166,916 |
Change in net unrealized appreciation (depreciation) on: Investment securities | (4,059,297) | |
Assets and liabilities in foreign currencies | (154) | |
Total change in net unrealized appreciation (depreciation) | | (4,059,451) |
Net gain (loss) | | (1,892,535) |
Net increase (decrease) in net assets resulting from operations | | $ (1,976,474) |
Statement of Changes in Net Assets
| Year ended
December 31, 2011 | Year ended
December 31, 2010 |
Increase (Decrease) in Net Assets | | |
Operations | | |
Net investment income (loss) | $ (83,939) | $ (94,615) |
Net realized gain (loss) | 2,166,916 | 1,975,162 |
Change in net unrealized appreciation (depreciation) | (4,059,451) | 1,939,765 |
Net increase (decrease) in net assets resulting from operations | (1,976,474) | 3,820,312 |
Share transactions - net increase (decrease) | (3,845,163) | 3,205,767 |
Total increase (decrease) in net assets | (5,821,637) | 7,026,079 |
| | |
Net Assets | | |
Beginning of period | 23,362,715 | 16,336,636 |
End of period | $ 17,541,078 | $ 23,362,715 |
See accompanying notes which are an integral part of the financial statements.
Annual Report
Financial Highlights - Initial Class
Years ended December 31, | 2011 | 2010 | 2009 | 2008 | 2007 |
Selected Per-Share Data | | | | | |
Net asset value, beginning of period | $ 9.01 | $ 7.21 | $ 5.16 | $ 10.09 | $ 9.44 |
Income from Investment Operations | | | | | |
Net investment income (loss)C | (.03) | (.03) | (.02)F | (.02) | (.05) |
Net realized and unrealized gain (loss) | (.78) | 1.83 | 2.07 | (4.89) | 1.70 |
Total from investment operations | (.81) | 1.80 | 2.05 | (4.91) | 1.65 |
Distributions from net realized gain | - | - | - | (.02) | (1.00) |
Net asset value, end of period | $ 8.20 | $ 9.01 | $ 7.21 | $ 5.16 | $ 10.09 |
Total ReturnA,B | (8.99)% | 24.97% | 39.73% | (48.77)% | 17.52% |
Ratios to Average Net AssetsD,G | | | | | |
Expenses before reductions | 1.10% | 1.11% | 1.33% | 1.14% | 1.07% |
Expenses net of fee waivers, if any | .90% | .90% | .90% | .90% | .90% |
Expenses net of all reductions | .89% | .89% | .88% | .89% | .89% |
Net investment income (loss) | (.29)% | (.41)% | (.27)%F | (.30)% | (.46)% |
Supplemental Data | | | | | |
Net assets, end of period (000 omitted) | $ 5,210 | $ 7,769 | $ 5,202 | $ 4,734 | $ 16,005 |
Portfolio turnover rateE | 190% | 149% | 280% | 292% | 190% |
A Total returns do not reflect charges attributable to your insurance company's separate account. Inclusion of these charges would reduce the total returns shown.
B Total returns would have been lower if certain expenses had not been reduced during the applicable periods shown.
C Calculated based on average shares outstanding during the period.
D Fees and expenses of any underlying Fidelity Central Funds are not included in the Fund's expense ratio. The Fund indirectly bears its proportionate share of the expenses of any underlying Fidelity Central Funds.
E Amount does not include the portfolio activity of any underlying Fidelity Central Funds.
F Investment income per share reflects a special dividend which amounted to $.005 per share. Excluding the special dividend, the ratio of net investment income (loss) to average net assets would have been (.36)%.
G Expense ratios reflect operating expenses of the class. Expenses before reductions do not reflect amounts reimbursed by the investment adviser or reductions from brokerage service arrangements or reductions from other expense offset arrangements and do not represent the amount paid by the class during periods when reimbursements or reductions occur. Expenses net of fee waivers reflect expenses after reimbursement by the investment adviser but prior to reductions from brokerage service arrangements or other expense offset arrangements. Expenses net of all reductions represent the net expenses paid by the class.
Financial Highlights - Service Class
Years ended December 31, | 2011 | 2010 | 2009 | 2008 | 2007 |
Selected Per-Share Data | | | | | |
Net asset value, beginning of period | $ 8.99 | $ 7.21 | $ 5.16 | $ 10.11 | $ 9.45 |
Income from Investment Operations | | | | | |
Net investment income (loss)C | (.03) | (.04) | (.02)F | (.03) | (.06) |
Net realized and unrealized gain (loss) | (.78) | 1.82 | 2.07 | (4.90) | 1.71 |
Total from investment operations | (.81) | 1.78 | 2.05 | (4.93) | 1.65 |
Distributions from net realized gain | - | - | - | (.02) | (.99) |
Net asset value, end of period | $ 8.18 | $ 8.99 | $ 7.21 | $ 5.16 | $ 10.11 |
Total ReturnA,B | (9.01)% | 24.69% | 39.73% | (48.87)% | 17.51% |
Ratios to Average Net AssetsD,G | | | | | |
Expenses before reductions | 1.18% | 1.18% | 1.38% | 1.21% | 1.14% |
Expenses net of fee waivers, if any | 1.00% | 1.00% | 1.00% | 1.00% | 1.00% |
Expenses net of all reductions | .99% | .99% | .97% | .99% | .99% |
Net investment income (loss) | (.39)% | (.50)% | (.37)%F | (.40)% | (.56)% |
Supplemental Data | | | | | |
Net assets, end of period (000 omitted) | $ 160 | $ 258 | $ 361 | $ 446 | $ 1,297 |
Portfolio turnover rateE | 190% | 149% | 280% | 292% | 190% |
A Total returns do not reflect charges attributable to your insurance company's separate account. Inclusion of these charges would reduce the total returns shown.
B Total returns would have been lower if certain expenses had not been reduced during the applicable periods shown.
C Calculated based on average shares outstanding during the period.
D Fees and expenses of any underlying Fidelity Central Funds are not included in the Fund's expense ratio. The Fund indirectly bears its proportionate share of the expenses of any underlying Fidelity Central Funds.
E Amount does not include the portfolio activity of any underlying Fidelity Central Funds.
F Investment income per share reflects a special dividend which amounted to $.005 per share. Excluding the special dividend, the ratio of net investment income (loss) to average net assets would have been (.46)%.
G Expense ratios reflect operating expenses of the class. Expenses before reductions do not reflect amounts reimbursed by the investment adviser or reductions from brokerage service arrangements or reductions from other expense offset arrangements and do not represent the amount paid by the class during periods when reimbursements or reductions occur. Expenses net of fee waivers reflect expenses after reimbursement by the investment adviser but prior to reductions from brokerage service arrangements or other expense offset arrangements. Expenses net of all reductions represent the net expenses paid by the class.
See accompanying notes which are an integral part of the financial statements.
Annual Report
Financial Highlights - Service Class 2
Years ended December 31, | 2011 | 2010 | 2009 | 2008 | 2007 |
Selected Per-Share Data | | | | | |
Net asset value, beginning of period | $ 8.79 | $ 7.05 | $ 5.06 | $ 9.92 | $ 9.29 |
Income from Investment Operations | | | | | |
Net investment income (loss)C | (.05) | (.05) | (.03)F | (.04) | (.07) |
Net realized and unrealized gain (loss) | (.76) | 1.79 | 2.02 | (4.80) | 1.67 |
Total from investment operations | (.81) | 1.74 | 1.99 | (4.84) | 1.60 |
Distributions from net realized gain | - | - | - | (.02) | (.97) |
Net asset value, end of period | $ 7.98 | $ 8.79 | $ 7.05 | $ 5.06 | $ 9.92 |
Total ReturnA,B | (9.22)% | 24.68% | 39.33% | (48.90)% | 17.32% |
Ratios to Average Net AssetsD,G | | | | | |
Expenses before reductions | 1.31% | 1.31% | 1.51% | 1.35% | 1.30% |
Expenses net of fee waivers, if any | 1.15% | 1.15% | 1.15% | 1.15% | 1.15% |
Expenses net of all reductions | 1.14% | 1.14% | 1.12% | 1.14% | 1.14% |
Net investment income (loss) | (.54)% | (.65)% | (.52)%F | (.55)% | (.72)% |
Supplemental Data | | | | | |
Net assets, end of period (000 omitted) | $ 4,828 | $ 6,053 | $ 5,760 | $ 4,469 | $ 13,622 |
Portfolio turnover rateE | 190% | 149% | 280% | 292% | 190% |
A Total returns do not reflect charges attributable to your insurance company's separate account. Inclusion of these charges would reduce the total returns shown.
B Total returns would have been lower if certain expenses had not been reduced during the applicable periods shown.
C Calculated based on average shares outstanding during the period.
D Fees and expenses of any underlying Fidelity Central Funds are not included in the Fund's expense ratio. The Fund indirectly bears its proportionate share of the expenses of any underlying Fidelity Central Funds.
E Amount does not include the portfolio activity of any underlying Fidelity Central Funds.
F Investment income per share reflects a special dividend which amounted to $.005 per share. Excluding the special dividend, the ratio of net investment income (loss) to average net assets would have been (.61)%.
G Expense ratios reflect operating expenses of the class. Expenses before reductions do not reflect amounts reimbursed by the investment adviser or reductions from brokerage service arrangements or reductions from other expense offset arrangements and do not represent the amount paid by the class during periods when reimbursements or reductions occur. Expenses net of fee waivers reflect expenses after reimbursement by the investment adviser but prior to reductions from brokerage service arrangements or other expense offset arrangements. Expenses net of all reductions represent the net expenses paid by the class.
Financial Highlights - Investor Class
Years ended December 31, | 2011 | 2010 | 2009 | 2008 | 2007 |
Selected Per-Share Data | | | | | |
Net asset value, beginning of period | $ 8.95 | $ 7.17 | $ 5.13 | $ 10.05 | $ 9.41 |
Income from Investment Operations | | | | | |
Net investment income (loss)C | (.03) | (.04) | (.02)F | (.03) | (.07) |
Net realized and unrealized gain (loss) | (.78) | 1.82 | 2.06 | (4.87) | 1.70 |
Total from investment operations | (.81) | 1.78 | 2.04 | (4.90) | 1.63 |
Distributions from net realized gain | - | - | - | (.02) | (.99) |
Net asset value, end of period | $ 8.14 | $ 8.95 | $ 7.17 | $ 5.13 | $ 10.05 |
Total ReturnA,B | (9.05)% | 24.83% | 39.77% | (48.87)% | 17.40% |
Ratios to Average Net AssetsD,G | | | | | |
Expenses before reductions | 1.16% | 1.19% | 1.42% | 1.27% | 1.17% |
Expenses net of fee waivers, if any | .98% | .98% | .98% | .99% | 1.05% |
Expenses net of all reductions | .97% | .97% | .95% | .97% | 1.04% |
Net investment income (loss) | (.37)% | (.49)% | (.35)%F | (.39)% | (.61)% |
Supplemental Data | | | | | |
Net assets, end of period (000 omitted) | $ 7,343 | $ 9,283 | $ 5,013 | $ 4,305 | $ 10,073 |
Portfolio turnover rateE | 190% | 149% | 280% | 292% | 190% |
A Total returns do not reflect charges attributable to your insurance company's separate account. Inclusion of these charges would reduce the total returns shown.
B Total returns would have been lower if certain expenses had not been reduced during the applicable periods shown.
C Calculated based on average shares outstanding during the period.
D Fees and expenses of any underlying Fidelity Central Funds are not included in the Fund's expense ratio. The Fund indirectly bears its proportionate share of the expenses of any underlying Fidelity Central Funds.
E Amount does not include the portfolio activity of any underlying Fidelity Central Funds.
F Investment income per share reflects a special dividend which amounted to $.005 per share. Excluding the special dividend, the ratio of net investment income (loss) to average net assets would have been (.44)%.
G Expense ratios reflect operating expenses of the class. Expenses before reductions do not reflect amounts reimbursed by the investment adviser or reductions from brokerage service arrangements or reductions from other expense offset arrangements and do not represent the amount paid by the class during periods when reimbursements or reductions occur. Expenses net of fee waivers reflect expenses after reimbursement by the investment adviser but prior to reductions from brokerage service arrangements or other expense offset arrangements. Expenses net of all reductions represent the net expenses paid by the class.
See accompanying notes which are an integral part of the financial statements.
Annual Report
Notes to Financial Statements
For the period ended December 31, 2011
1. Organization.
VIP Growth Strategies Portfolio (the Fund) is a fund of Variable Insurance Products Fund III (the Trust) and is authorized to issue an unlimited number of shares. The Trust is registered under the Investment Company Act of 1940, as amended (the 1940 Act), as an open-end management investment company organized as a Massachusetts business trust. Shares of the Fund may only be purchased by insurance companies for the purpose of funding variable annuity or variable life insurance contracts. The Fund offers the following classes of shares: Initial Class shares, Service Class shares, Service Class 2 shares and Investor Class shares. All classes have equal rights and voting privileges, except for matters affecting a single class. Investment income, realized and unrealized capital gains and losses, the common expenses of the Fund, and certain fund-level expense reductions, if any, are allocated on a pro-rata basis to each class based on the relative net assets of each class to the total net assets of the Fund. Each class differs with respect to transfer agent and distribution and service plan fees incurred. Certain expense reductions may also differ by class.
2. Investments in Fidelity Central Funds.
The Fund invests in Fidelity Central Funds, which are open-end investment companies available only to other investment companies and accounts managed by Fidelity Management & Research Company (FMR) and its affiliates. The Fund's Schedule of Investments lists each of the Fidelity Central Funds held as of period end, if any, as an investment of the Fund, but do not include the underlying holdings of each Fidelity Central Fund. As an Investing Fund, the Fund indirectly bears its proportionate share of the expenses of the underlying Fidelity Central Funds.
The Money Market Central Funds seek preservation of capital and current income and are managed by Fidelity Investments Money Management, Inc. (FIMM), an affiliate of FMR.
A complete unaudited list of holdings for each Fidelity Central Fund is available upon request or at the Securities and Exchange Commission (the SEC) web site at www.sec.gov. In addition, the financial statements of the Fidelity Central Funds, which are not covered by the Fund's Report of Independent Registered Public Accounting Firm, are available on the SEC web site or upon request.
3. Significant Accounting Policies.
The financial statements have been prepared in conformity with accounting principles generally accepted in the United States of America (GAAP), which require management to make certain estimates and assumptions at the date of the financial statements. Actual results could differ from those estimates. Subsequent events, if any, through the date that the financial statements were issued have been evaluated in the preparation of the financial statements. The following summarizes the significant accounting policies of the Fund:
Security Valuation. Investments are valued as of 4:00 p.m. Eastern time on the last calendar day of the period. The Fund uses independent pricing services approved by the Board of Trustees to value its investments. When current market prices or quotations are not readily available or reliable, valuations may be determined in good faith in accordance with procedures adopted by the Board of Trustees. Factors used in determining value may include market or security specific events. The frequency with which these procedures are used cannot be predicted and they may be utilized to a significant extent. The value used for net asset value (NAV) calculation under these procedures may differ from published prices for the same securities.
The Fund categorizes the inputs to valuation techniques used to value its investments into a disclosure hierarchy consisting of three levels as shown below:
Level 1 - quoted prices in active markets for identical investments
Level 2 - other significant observable inputs (including quoted prices for similar investments, interest rates, prepayment speeds, etc.)
Level 3 - unobservable inputs (including the Fund's own assumptions based on the best information available)
Changes in valuation techniques may result in transfers in or out of an assigned level within the disclosure hierarchy. Valuation techniques used to value the Fund's investments by major category are as follows:
Equity securities, including restricted securities, for which market quotations are readily available, are valued at the last reported sale price or official closing price as reported by an independent pricing service on the primary market or exchange on which they are traded and are categorized as Level 1 in the hierarchy. In the event there were no sales during the day or closing prices are not available, securities are valued at the last quoted bid price or may be valued using the last available price and are generally categorized as Level 2 in the hierarchy. For foreign equity securities, when significant market or security specific events arise, comparisons to the valuation of American Depositary Receipts (ADRs), futures contracts, Exchange-traded funds (ETFs) and certain indexes as well as quoted prices for similar securities are used and are categorized as Level 2 in the hierarchy in these circumstances. Utilizing these techniques may result in transfers between Level 1 and Level 2. For restricted equity securities and private placements where observable inputs are limited, assumptions about market activity and risk are used and are categorized as Level 3 in the hierarchy.
Annual Report
Notes to Financial Statements - continued
3. Significant Accounting Policies - continued
Security Valuation - continued
Investments in open-end mutual funds, including the Fidelity Central Funds, are valued at their closing net asset value each business day and are categorized as Level 1 in the hierarchy.
New Accounting Pronouncements. In May 2011, the Financial Accounting Standards Board issued Accounting Standard Update No. 2011-04, Fair Value Measurement (Topic 820) - Amendments to Achieve Common Fair Value Measurement and Disclosure Requirements in U.S. GAAP and IFRSs. The update is effective during interim and annual periods beginning after December 15, 2011 and will result in additional disclosure for transfers between levels as well as expanded disclosure for securities categorized as Level 3 under the fair value hierarchy.
In December 2011, the Financial Accounting Standards Board issued Accounting Standard Update No. 2011-11, Disclosures about Offsetting Assets and Liabilities. The update creates new disclosure requirements requiring entities to disclose both gross and net information for derivatives and other financial instruments that are either offset in the Statement of Assets and Liabilities or subject to an enforceable master netting arrangement or similar agreement. The disclosure requirements are effective for annual reporting periods beginning on or after January 1, 2013. Management is currently evaluating the impact of the update's adoption on the Fund's financial statement disclosures.
Foreign Currency. The Fund may use foreign currency contracts to facilitate transactions in foreign-denominated securities. Gains and losses from these transactions may arise from changes in the value of the foreign currency or if the counterparties do not perform under the contracts' terms.
Foreign-denominated assets, including investment securities, and liabilities are translated into U.S. dollars at the exchange rate at period end. Purchases and sales of investment securities, income and dividends received and expenses denominated in foreign currencies are translated into U.S. dollars at the exchange rate in effect on the transaction date.
The effects of exchange rate fluctuations on investments are included with the net realized and unrealized gain (loss) on investment securities. Other foreign currency transactions resulting in realized and unrealized gain (loss) are disclosed separately.
Investment Transactions and Income. For financial reporting purposes, the Fund's investment holdings and NAV include trades executed through the end of the last business day of the period. The NAV per share for processing shareholder transactions is calculated as of the close of business of the New York Stock Exchange (NYSE), normally 4:00 p.m. Eastern time and includes trades executed through the end of the prior business day. Gains and losses on securities sold are determined on the basis of identified cost and may include proceeds received from litigation. Dividend income is recorded on the ex-dividend date, except for certain dividends from foreign securities where the ex-dividend date may have passed, which are recorded as soon as the Fund is informed of the ex-dividend date. Non-cash dividends included in dividend income, if any, are recorded at the fair market value of the securities received. Distributions received on securities that represent a return of capital or capital gain are recorded as a reduction of cost of investments and/or as a realized gain. The Fund estimates the components of distributions received that may be considered return of capital distributions or capital gain distributions. Interest income and distributions from the Fidelity Central Funds are accrued as earned. Interest income includes coupon interest and amortization of premium and accretion of discount on debt securities. Investment income is recorded net of foreign taxes withheld where recovery of such taxes is uncertain.
Expenses. Expenses directly attributable to a fund are charged to that fund. Expenses attributable to more than one fund are allocated among the respective funds on the basis of relative net assets or other appropriate methods. Expense estimates are accrued in the period to which they relate and adjustments are made when actual amounts are known.
Income Tax Information and Distributions to Shareholders. Each year, the Fund intends to qualify as a regulated investment company, including distributing substantially all of its taxable income and realized gains under Subchapter M of the Internal Revenue Code. As a result, no provision for income taxes is required. As of December 31, 2011, the Fund did not have any unrecognized tax benefits in the financial statements; nor is the Fund aware of any tax positions for which it is reasonably possible that the total amounts of unrecognized tax benefits will significantly change in the next twelve months. The Fund files a U.S. federal tax return, in addition to state and local tax returns as required. A fund's tax returns are subject to examination by the Internal Revenue Service (IRS) for a period of three fiscal years. State and local tax returns may be subject to examination for an additional fiscal year depending on the jurisdiction. Foreign taxes are provided for based on the Fund's understanding of the tax rules and rates that exist in the foreign markets in which it invests.
Distributions are declared and recorded on the ex-dividend date. Income dividends and capital gain distributions are declared separately for each class. Income and capital gain distributions are determined in accordance with income tax regulations, which may differ from GAAP.
Capital accounts within the financial statements are adjusted for permanent book-tax differences. These adjustments have no impact on net assets or the results of operations. Temporary book-tax differences will reverse in a subsequent period.
Book-tax differences are primarily due to foreign currency transactions, passive foreign investment companies (PFIC), partnerships, net operating losses, capital loss carryforwards and losses deferred due to wash sales and excise tax regulations.
Annual Report
3. Significant Accounting Policies - continued
Income Tax Information and Distributions to Shareholders - continued
The federal tax cost of investment securities and unrealized appreciation (depreciation) as of period end were as follows:
Gross unrealized appreciation | $ 1,522,826 |
Gross unrealized depreciation | (2,743,678) |
Net unrealized appreciation (depreciation) on securities and other investments | $ (1,220,852) |
| |
Tax Cost | $ 18,898,730 |
The tax-based components of distributable earnings as of period end were as follows:
Capital loss carryforward | $ (6,353,208) |
Net unrealized appreciation (depreciation) | $ (1,221,588) |
Capital loss carryforwards are only available to offset future capital gains of the Fund to the extent provided by regulations and may be limited. Under the Regulated Investment Company Modernization Act of 2010 (the Act), the Fund is permitted to carry forward capital losses incurred in taxable years beginning after December 22, 2010 for an unlimited period and such capital losses are required to be used prior to any losses that expire. Capital loss carryforwards were as follows:
Fiscal year of expiration | |
2016 | $ (5,081,123) |
2017 | (1,272,085) |
Total with expiration | $ (6,353,208) |
4. Purchases and Sales of Investments.
Purchases and sales of securities, other than short-term securities, aggregated $40,735,806 and $44,442,691, respectively.
5. Fees and Other Transactions with Affiliates.
Management Fee. FMR and its affiliates provide the Fund with investment management related services for which the Fund pays a monthly management fee. The management fee is the sum of an individual fund fee rate that is based on an annual rate of. 35% of the Fund's average net assets and an annualized group fee rate that averaged .26% during the period. The group fee rate is based upon the average net assets of all the mutual funds advised by FMR. The group fee rate decreases as assets under management increase and increases as assets under management decrease. For the period, the total annual management fee rate was .61% of the Fund's average net assets.
Distribution and Service Plan Fees. In accordance with Rule 12b-1 of the 1940 Act, the Fund has adopted separate 12b-1 Plans for each Service Class of shares. Each Service Class pays Fidelity Distributors Corporation (FDC), an affiliate of FMR, a service fee. For the period, the service fee is based on an annual rate of .10% of Service Class' average net assets and .25% of Service Class 2's average net assets.
For the period, total fees, all of which were re-allowed to insurance companies for the distribution of shares and providing shareholder support services were as follows:
Service Class | $ 224 |
Service Class 2 | 14,285 |
| $ 14,509 |
Transfer Agent Fees. Fidelity Investments Institutional Operations Company, Inc. (FIIOC), an affiliate of FMR, is the Fund's transfer, dividend disbursing, and shareholder servicing agent. FIIOC receives an asset-based fee with respect to each class. Each class (with the exception of Investor Class) pays a transfer agent fee, excluding out of pocket expenses, equal to an annual rate of .07% of average net assets. Investor Class pays a monthly asset-based transfer agent fee of .15% of average net assets. In addition, FIIOC receives an asset-based fee of .0045% of average net assets for typesetting, printing and mailing of shareholder reports, except proxy statements. FIIOC voluntarily agreed to waive this fee for the period August 1, 2011 through December 31, 2011 (see Expense Reductions note). For the period, transfer agent fees for each class, including printing and out of pocket expenses, were as follows:
Annual Report
Notes to Financial Statements - continued
5. Fees and Other Transactions with Affiliates - continued
Transfer Agent Fees - continued
Initial Class | $ 8,296 |
Service Class | 214 |
Service Class 2 | 4,486 |
Investor Class | 16,389 |
| $ 29,385 |
Accounting Fees. Fidelity Service Company, Inc.(FSC),an affiliate of FMR, maintains the Fund's accounting records. The fee is based on the level of average net assets for the month.
Brokerage Commissions. The Fund placed a portion of its portfolio transactions with brokerage firms which are affiliates of the investment adviser. The commissions paid to these affiliated firms were $1,206 for the period.
6. Committed Line of Credit.
The Fund participates with other funds managed by FMR or an affiliate in a $4.0 billion credit facility (the "line of credit") to be utilized for temporary or emergency purposes to fund shareholder redemptions or for other short-term liquidity purposes. The Fund has agreed to pay commitment fees on its pro-rata portion of the line of credit, which amounted to $67 and is reflected in Miscellaneous expenses on the Statement of Operations. During the period, there were no borrowings on this line of credit.
7. Expense Reductions.
In addition to FIIOC waiving a portion of its transfer agent fees, FMR voluntarily agreed to reimburse each class to the extent annual operating expenses exceeded certain levels of average net assets as noted in the table below. Some expenses, for example interest expense, including commitment fees, are excluded from this reimbursement.
Expenses were reimbursed and/or waived for the following classes during the period:
| Expense
Limitations | Reimbursement/ Waiver |
Initial Class | .90% | $ 13,673 |
Service Class | 1.00% | 387 |
Service Class 2 | 1.15% | 8,990 |
Investor Class | .98% | 16,325 |
| | $ 39,375 |
Many of the brokers with whom FMR places trades on behalf of the Fund provided services to the Fund in addition to trade execution. These services included payments of certain expenses on behalf of the Fund totaling $3,237 for the period.
8. Share Transactions.
Transactions for each class of shares were as follows:
| Shares | Dollars |
Years ended December 31, | 2011 | 2010 | 2011 | 2010 |
Initial Class | | | | |
Shares sold | 289,291 | 425,011 | $ 2,658,282 | $ 3,446,070 |
Shares redeemed | (516,560) | (283,807) | (4,648,535) | (2,107,621) |
Net increase (decrease) | (227,269) | 141,204 | $ (1,990,253) | $ 1,338,449 |
Service Class | | | | |
Shares sold | 317 | 314 | $ 2,724 | $ 2,538 |
Shares redeemed | (9,509) | (21,735) | (82,269) | (166,475) |
Net increase (decrease) | (9,192) | (21,421) | $ (79,545) | $ (163,937) |
Annual Report
8. Share Transactions - continued
| Shares | Dollars |
Years ended December 31, | 2011 | 2010 | 2011 | 2010 |
Service Class 2 | | | | |
Shares sold | 142,539 | 130,933 | $ 1,251,254 | $ 986,024 |
Shares redeemed | (226,366) | (258,663) | (1,925,948) | (1,986,135) |
Net increase (decrease) | (83,827) | (127,730) | $ (674,694) | $ (1,000,111) |
Investor Class | | | | |
Shares sold | 598,683 | 764,031 | $ 5,369,282 | $ 6,226,812 |
Shares redeemed | (734,073) | (425,677) | (6,469,953) | (3,195,446) |
Net increase (decrease) | (135,390) | 338,354 | $ (1,100,671) | $ 3,031,366 |
9. Other.
The Fund's organizational documents provide former and current trustees and officers with a limited indemnification against liabilities arising in connection with the performance of their duties to the Fund. In the normal course of business, the Fund may also enter into contracts that provide general indemnifications. The Fund's maximum exposure under these arrangements is unknown as this would be dependent on future claims that may be made against the Fund. The risk of material loss from such claims is considered remote.
At the end of the period, FMR or its affiliates were the owners of record of 71% of the total outstanding shares of the Fund and one otherwise unaffiliated shareholder was the owner of 25% of the total outstanding shares of the fund.
Annual Report
Report of Independent Registered Public Accounting Firm
To the Trustees of Variable Insurance Products Fund III and Shareholders of VIP Growth Strategies Portfolio:
We have audited the accompanying statement of assets and liabilities of VIP Growth Strategies Portfolio (the Fund), a fund of Variable Insurance Products Fund III, including the schedule of investments, as of December 31, 2011, and the related statement of operations for the year then ended, the statement of changes in net assets for each of the two years in the period then ended, and the financial highlights for each of the five years in the period then ended. These financial statements and financial highlights are the responsibility of the Fund's management. Our responsibility is to express an opinion on these financial statements and financial highlights based on our audits.
We conducted our audits in accordance with the standards of the Public Company Accounting Oversight Board (United States). Those standards require that we plan and perform the audit to obtain reasonable assurance about whether the financial statements and financial highlights are free of material misstatement. The Fund is not required to have, nor were we engaged to perform, an audit of its internal control over financial reporting. Our audits included consideration of internal control over financial reporting as a basis for designing audit procedures that are appropriate in the circumstances, but not for the purpose of expressing an opinion on the effectiveness of the Fund's internal control over financial reporting. Accordingly, we express no such opinion. An audit also includes examining, on a test basis, evidence supporting the amounts and disclosures in the financial statements, assessing the accounting principles used and significant estimates made by management, as well as evaluating the overall financial statement presentation. Our procedures included confirmation of securities owned as of December 31, 2011, by correspondence with the custodians and brokers; where replies were not received from brokers, we performed other auditing procedures. We believe that our audits provide a reasonable basis for our opinion.
In our opinion, the financial statements and financial highlights referred to above present fairly, in all material respects, the financial position of VIP Growth Strategies Portfolio as of December 31, 2011, the results of its operations for the year then ended, the changes in its net assets for each of the two years in the period then ended, and the financial highlights for each of the five years in the period then ended, in conformity with accounting principles generally accepted in the United States of America.
DELOITTE & TOUCHE LLP
Boston, Massachusetts
February 10, 2012
Annual Report
The Trustees, Members of the Advisory Board, and executive officers of the trust and fund, as applicable, are listed below. The Board of Trustees governs the fund and is responsible for protecting the interests of shareholders. The Trustees are experienced executives who meet periodically throughout the year to oversee the fund's activities, review contractual arrangements with companies that provide services to the fund, oversee management of the risks associated with such activities and contractual arrangements, and review the fund's performance. Except for James C. Curvey, each of the Trustees oversees 226 funds advised by FMR or an affiliate. Mr. Curvey oversees 429 funds advised by FMR or an affiliate.
The Trustees hold office without limit in time except that (a) any Trustee may resign; (b) any Trustee may be removed by written instrument, signed by at least two-thirds of the number of Trustees prior to such removal; (c) any Trustee who requests to be retired or who has become incapacitated by illness or injury may be retired by written instrument signed by a majority of the other Trustees; and (d) any Trustee may be removed at any special meeting of shareholders by a two-thirds vote of the outstanding voting securities of the trust. Each Trustee who is not an interested person (as defined in the 1940 Act) (Independent Trustee), shall retire not later than the last day of the calendar year in which his or her 75th birthday occurs. The Independent Trustees may waive this mandatory retirement age policy with respect to individual Trustees. The executive officers and Advisory Board Members hold office without limit in time, except that any officer and Advisory Board Member may resign or may be removed by a vote of a majority of the Trustees at any regular meeting or any special meeting of the Trustees. Except as indicated, each individual has held the office shown or other offices in the same company for the past five years.
Experience, Skills, Attributes, and Qualifications of the Fund's Trustees. The Governance and Nominating Committee has adopted a statement of policy that describes the experience, qualifications, attributes, and skills that are necessary and desirable for potential Independent Trustee candidates (Statement of Policy). The Board believes that each Trustee satisfied at the time he or she was initially elected or appointed a Trustee, and continues to satisfy, the standards contemplated by the Statement of Policy. The Governance and Nominating Committee also engages professional search firms to help identify potential Independent Trustee candidates who have the experience, qualifications, attributes, and skills consistent with the Statement of Policy. From time to time, additional criteria based on the composition and skills of the current Independent Trustees, as well as experience or skills that may be appropriate in light of future changes to board composition, business conditions, and regulatory or other developments, have also been considered by the professional search firms and the Governance and Nominating Committee. In addition, the Board takes into account the Trustees' commitment and participation in Board and committee meetings, as well as their leadership of standing and ad hoc committees throughout their tenure.
In determining that a particular Trustee was and continues to be qualified to serve as a Trustee, the Board has considered a variety of criteria, none of which, in isolation, was controlling. The Board believes that, collectively, the Trustees have balanced and diverse experience, qualifications, attributes, and skills, which allow the Board to operate effectively in governing the fund and protecting the interests of shareholders. Information about the specific experience, skills, attributes, and qualifications of each Trustee, which in each case led to the Board's conclusion that the Trustee should serve (or continue to serve) as a trustee of the fund, is provided below.
Board Structure and Oversight Function. James C. Curvey is an interested person (as defined in the 1940 Act) and currently serves as Acting Chairman. The Trustees have determined that an interested Chairman is appropriate and benefits shareholders because an interested Chairman has a personal and professional stake in the quality and continuity of services provided to the fund. Independent Trustees exercise their informed business judgment to appoint an individual of their choosing to serve as Chairman, regardless of whether the Trustee happens to be independent or a member of management. The Independent Trustees have determined that they can act independently and effectively without having an Independent Trustee serve as Chairman and that a key structural component for assuring that they are in a position to do so is for the Independent Trustees to constitute a substantial majority for the Board. The Independent Trustees also regularly meet in executive session. Ned C. Lautenbach serves as Chairman of the Independent Trustees and as such (i) acts as a liaison between the Independent Trustees and management with respect to matters important to the Independent Trustees and (ii) with management prepares agendas for Board meetings.
Fidelity funds are overseen by different Boards of Trustees. The fund's Board oversees Fidelity's equity and high income funds and another Board oversees Fidelity's investment-grade bond, money market, and asset allocation funds. The asset allocation funds may invest in Fidelity funds overseen by the fund's Board. The use of separate Boards, each with its own committee structure, allows the Trustees of each group of Fidelity funds to focus on the unique issues of the funds they oversee, including common research, investment, and operational issues. On occasion, the separate Boards establish joint committees to address issues of overlapping consequences for the Fidelity funds overseen by each Board.
The Trustees operate using a system of committees to facilitate the timely and efficient consideration of all matters of importance to the Trustees, the fund, and fund shareholders and to facilitate compliance with legal and regulatory requirements and oversight of the fund's activities and associated risks. The Board, acting through its committees, has charged FMR and its affiliates with (i) identifying events or circumstances the occurrence of which could have demonstrably adverse effects on the fund's business and/or reputation; (ii) implementing processes and controls to lessen the possibility that such events or circumstances occur or to mitigate the effects of such events or circumstances if they do occur; and (iii) creating and maintaining a system designed to evaluate continuously business and market conditions in order to facilitate the identification and implementation processes described in (i) and (ii) above. Because the day-to-day operations and activities of the fund are carried out by or through FMR, its affiliates and other service providers, the fund's exposure to risks is mitigated but not eliminated by the processes overseen by the Trustees. While each of the Board's committees has responsibility for overseeing different aspects of the fund's activities, oversight is exercised primarily through the Operations, Audit, and Compliance Committees. In addition, the Independent Trustees have worked with FMR to enhance the Board's oversight of investment and financial risks, legal and regulatory risks, technology risks, and operational risks, including the development of additional risk reporting to the Board. For example, a working group comprised of Independent Trustees and FMR has worked and continues to work to review the Fidelity funds' valuation-related activities, reporting and risk management. Appropriate personnel, including but not limited to the fund's Chief Compliance Officer (CCO), FMR's internal auditor, the independent accountants, the fund's Treasurer and portfolio management personnel, make periodic reports to the Board's committees, as appropriate, including an annual review of FMR's risk management program for the Fidelity funds. The responsibilities of each standing committee, including their oversight responsibilities, are described further under "Standing Committees of the Fund's Trustees."
Annual Report
The fund's Statement of Additional Information (SAI) includes more information about the Trustees. To request a free copy, call Fidelity at 1-800-208-0098.
Interested Trustees*:
Correspondence intended for each Trustee who is an interested person may be sent to Fidelity Investments, 82 Devonshire Street, Boston, Massachusetts 02109.
Name, Age; Principal Occupations and Other Relevant Experience+ |
James C. Curvey (76) |
| Year of Election or Appointment: 2007 Mr. Curvey is Trustee and Acting Chairman of the Board of Trustees of certain Trusts. Mr. Curvey also serves as Trustee (2007-present) of other investment companies advised by FMR. Mr. Curvey is a Director of Fidelity Investments Money Management, Inc. (2009-present), Director of Fidelity Research & Analysis Co. (2009-present) and Director of FMR and FMR Co., Inc. (2007-present). Mr. Curvey is also Vice Chairman (2007-present) and Director of FMR LLC. In addition, Mr. Curvey serves as an Overseer for the Boston Symphony Orchestra and a member of the Trustees of Villanova University. Previously, Mr. Curvey was the Vice Chairman (2006-2007) and Director (2000-2007) of FMR Corp. |
Ronald P. O'Hanley (54) |
| Year of Election or Appointment: 2011 Mr. O'Hanley is Director of FMR Co., Inc. (2010-present), Director of Fidelity Investments Money Management, Inc. (2010-present), Director of Fidelity Research & Analysis Company (2010-present), President of Fidelity Asset Management and Corporate Services and a member of Fidelity's Executive Committee (2010-present). Previously, Mr. O'Hanley served as President and Chief Executive Officer of BNY Mellon Asset Management (2007-2010). Mr. O'Hanley also served as Vice Chairman of Bank New York Mellon Corp. and a member of that firm's Executive Committee. Prior to the 2007 merger of The Bank of New York and Mellon Financial Corporation, he was Vice Chairman of Mellon Financial Corporation and President and Chief Executive Officer of Mellon Asset Management. He joined Mellon in February 1997. Mr. O'Hanley currently serves as Chairman of the Boston Public Library Foundation Board of Directors and sits on the Board of Directors of Beth Israel Deaconess Medical Center, the Board of Trustees of the Marine Biological Laboratory and the Advisory Board of the Maxwell School of Citizenship and Public Administration at Syracuse University. Mr. O'Hanley also chairs the Council on Asset Management for the Financial Services Roundtable and is a member of the Board of Directors of Institutional Investor's U.S. Institute. |
* Trustees have been determined to be "Interested Trustees" by virtue of, among other things, their affiliation with the trust or various entities under common control with FMR.
+ The information above includes each Trustee's principal occupation during the last five years and other information relating to the experience, attributes, and skills relevant to each Trustee's qualifications to serve as a Trustee, which led to the conclusion that each Trustee should serve as a Trustee for the fund.
Independent Trustees:
Correspondence intended for each Independent Trustee (that is, the Trustees other than the Interested Trustees) may be sent to Fidelity Investments, P.O. Box 55235, Boston, Massachusetts 02205-5235.
Name, Age; Principal Occupations and Other Relevant Experience+ |
Dennis J. Dirks (63) |
| Year of Election or Appointment: 2005 Prior to his retirement in May 2003, Mr. Dirks was Chief Operating Officer and a member of the Board of The Depository Trust & Clearing Corporation (DTCC). He also served as President, Chief Operating Officer, and Board member of The Depository Trust Company (DTC) and President and Board member of the National Securities Clearing Corporation (NSCC). In addition, Mr. Dirks served as Chief Executive Officer and Board member of the Government Securities Clearing Corporation, Chief Executive Officer and Board member of the Mortgage-Backed Securities Clearing Corporation, as a Trustee and a member of the Finance Committee of Manhattan College (2005-2008), and as a Trustee and a member of the Finance Committee of AHRC of Nassau County (2006-2008). Mr. Dirks is a member of the Independent Directors Council (IDC) Governing Council (2010-present) and Board of Directors for The Brookville Center for Children's Services, Inc. (2009-present). |
Alan J. Lacy (58) |
| Year of Election or Appointment: 2008 Mr. Lacy serves as Senior Adviser (2007-present) of Oak Hill Capital Partners, L.P. (private equity). Mr. Lacy also served as Chief Executive Officer (2000-2005) and Vice Chairman (2005-2006) of Sears Holdings Corporation and Sears, Roebuck and Co. (retail). In addition, Mr. Lacy serves as a member of the Board of Directors of Dave & Buster's, Inc. (restaurant and entertainment complexes, 2010-present), The Hillman Companies, Inc. (hardware wholesalers, 2010-present), and Bristol-Myers Squibb Company (global pharmaceuticals, 2007-present). Mr. Lacy is a member of the Board of Trustees of The National Parks Conservation Association (2006-present). Previously, Mr. Lacy served as Chairman of the Board of Trustees of the National Parks Conservation Association (2008-2011) and as a member of the Board of Directors for the Western Union Company (global money transfer, 2006-2011). |
Ned C. Lautenbach (67) |
| Year of Election or Appointment: 2000 Mr. Lautenbach is Chairman of the Independent Trustees of the Equity and High Income Funds (2006-present). Mr. Lautenbach currently serves as the Lead Director of the Eaton Corporation Board of Directors (diversified industrial, 1997-present). Mr. Lautenbach is also a member of the Board of Directors of the Philharmonic Center for the Arts in Naples, Florida (1999-present); a member of the Board of Trustees of Fairfield University (2005-present); and a member of the Council on Foreign Relations (1994-present). Previously, Mr. Lautenbach was a Partner/Advisory Partner at Clayton, Dubilier & Rice, LLC (private equity investment, 1998-2010), as well as a Director of Sony Corporation (2006-2007). |
Joseph Mauriello (67) |
| Year of Election or Appointment: 2008 Prior to his retirement in January 2006, Mr. Mauriello served in numerous senior management positions including Deputy Chairman and Chief Operating Officer (2004-2005), and Vice Chairman of Financial Services (2002-2004) of KPMG LLP US (professional services, 1965-2005). Mr. Mauriello currently serves as a member of the Board of Directors of XL Group plc. (global insurance and re-insurance, 2006-present) and of Arcadia Resources Inc. (health care services and products, 2007-present). Previously, Mr. Mauriello served as a Director of the Hamilton Funds of the Bank of New York (2006-2007). |
Robert W. Selander (61) |
| Year of Election or Appointment: 2011 Previously, Mr. Selander served as a Member of the Advisory Board of Fidelity's Equity and High Income Funds (2011), Executive Vice Chairman (2010), Chief Executive Officer (2009-2010), and President and Chief Executive Officer (1997-2009) of Mastercard, Inc. |
Cornelia M. Small (67) |
| Year of Election or Appointment: 2005 Ms. Small is a member of the Board of Directors of the Teagle Foundation (2009-present). Ms. Small is also a member of the Investment Committee, and Chair (2008-present) and a member of the Board of Trustees of Smith College. In addition, Ms. Small serves on the Investment Committee of the Berkshire Taconic Community Foundation (2008-present). Previously, Ms. Small served as Chairperson of the Investment Committee (2002-2008) of Smith College. In addition, Ms. Small served as Chief Investment Officer, Director of Global Equity Investments, and a member of the Board of Directors of Scudder, Stevens & Clark and Scudder Kemper Investments. |
William S. Stavropoulos (72) |
| Year of Election or Appointment: 2002 Mr. Stavropoulos is Vice Chairman of the Independent Trustees of the Equity and High Income Funds (2006-present). Mr. Stavropoulos serves as President and Founder of the Michigan Baseball Foundation, the Great Lakes Loons (2007-present). Mr. Stavropoulos is Chairman Emeritus of the Board of Directors of The Dow Chemical Company, where he previously served in numerous senior management positions, including President, CEO (1995-2000; 2002-2004), Chairman of the Executive Committee (2000-2006), and as a member of the Board of Directors (1990-2006). Currently, Mr. Stavropoulos is Chairman of Univar (global distributor of commodity and specialty chemicals, 2010-present), a Director of Teradata Corporation (data warehousing and technology solutions, 2008-present), Chemical Financial Corporation, Maersk Inc. (industrial conglomerate), Tyco International, Inc. (multinational manufacturing and services, 2007-present), and a member of the Advisory Board for Metalmark Capital (private equity investment, 2005-present). Mr. Stavropoulos is a special advisor to Clayton, Dubilier & Rice, LLC (private equity investment). In addition, Mr. Stavropoulos is a member of the University of Notre Dame Advisory Council for the College of Science. |
David M. Thomas (62) |
| Year of Election or Appointment: 2008/ Previously, Mr. Thomas served as Executive Chairman (2005-2006) and Chairman and Chief Executive Officer (2000-2005) of IMS Health, Inc. (pharmaceutical and healthcare information solutions). In addition, Mr. Thomas serves as a member of the Board of Directors of Fortune Brands, Inc. (consumer products), and Interpublic Group of Companies, Inc. (marketing communication, 2004-present). |
Michael E. Wiley (61) |
| Year of Election or Appointment: 2008 Mr. Wiley also serves as a Director of Asia Pacific Exploration Consolidated (international oil and gas exploration and production, 2008-present). Mr. Wiley serves as a Director of Tesoro Corporation (independent oil refiner and marketer, 2005-present), and a Director of Bill Barrett Corporation (exploration and production, 2005-present). In addition, Mr. Wiley also serves as a Director of Post Oak Bank (privately-held bank, 2004-present). Previously, Mr. Wiley served as a member of the Board of Trustees of the University of Tulsa (2000-2006; 2007-2010), as a Senior Energy Advisor of Katzenbach Partners, LLC (consulting, 2006-2007), as an Advisory Director of Riverstone Holdings (private investment), Chairman, President, and CEO of Baker Hughes, Inc. (oilfield services, 2000-2004), and as Director of Spinnaker Exploration Company (exploration and production, 2001-2005). |
+ The information above includes each Trustee's principal occupation during the last five years and other information relating to the experience, attributes, and skills relevant to each Trustee's qualifications to serve as a Trustee, which led to the conclusion that each Trustee should serve as a Trustee for the fund.
Advisory Board Members and Executive Officers:
Correspondence intended for each executive officer, Edward C. Johnson 3d, and Peter S. Lynch may be sent to Fidelity Investments, 82 Devonshire Street, Boston, Massachusetts 02109.
Name, Age; Principal Occupation |
Edward C. Johnson 3d (81) |
| Year of Election or Appointment: 2011 Member of the Advisory Board of Fidelity's Equity and High Income Funds. Mr. Johnson serves as Chief Executive Officer, Chairman, and a Director of FMR LLC, and also serves as Chairman and Director of FIL Limited. Previously, Mr. Johnson served as a Trustee and Chairman of the Board of certain Fidelity Trusts, Chairman and a Director of FMR, Chairman and a Director of FMR Co., Inc., and President of FMR LLC (2006-2007). |
Peter S. Lynch (67) |
| Year of Election or Appointment: 2003 Member of the Advisory Board of Fidelity's Equity and High Income Funds. Mr. Lynch is Vice Chairman and a Director of FMR and FMR Co., Inc. In addition, Mr. Lynch serves as a Trustee of Boston College and as the Chairman of the Inner-City Scholarship Fund. Previously, Mr. Lynch served on the Special Olympics International Board of Directors (1997-2006). |
Kenneth B. Robins (42) |
| Year of Election or Appointment: 2008 President and Treasurer of Fidelity's Equity and High Income Funds. Mr. Robins also serves as President and Treasurer (2010-present) and Assistant Treasurer (2009-present) of other Fidelity funds and is an employee of Fidelity Investments (2004-present). Previously, Mr. Robins served as Deputy Treasurer of the Fidelity funds (2005-2008) and Treasurer and Chief Financial Officer of The North Carolina Capital Management Trust: Cash and Term Portfolios (2006-2008). |
Brian B. Hogan (47) |
| Year of Election or Appointment: 2009 Vice President of Equity and High Income Funds. Mr. Hogan also serves as President of FMR's Equity Division (2009-present). Previously, Mr. Hogan served as Senior Vice President, Equity Research of FMR (2006-2009) and as a portfolio manager. |
Thomas C. Hense (47) |
| Year of Election or Appointment: 2008 or 2010 Vice President of Fidelity's High Income (2008), Small Cap (2008), and Value (2010) Funds. Previously, Mr. Hense served as a portfolio manager for Fidelity's Institutional Money Management Group (Pyramis) (2003-2008). |
Scott C. Goebel (43) |
| Year of Election or Appointment: 2008 Secretary and Chief Legal Officer (CLO) of the Fidelity funds. Mr. Goebel also serves as Secretary of Fidelity Investments Money Management, Inc. (FIMM) (2010-present) and Fidelity Research and Analysis Company (FRAC) (2010-present); Secretary and CLO of The North Carolina Capital Management Trust: Cash and Term Portfolios (2008-present); General Counsel, Secretary, and Senior Vice President of FMR (2008-present) and FMR Co., Inc. (2008-present); employed by FMR LLC or an affiliate (2001-present); Chief Legal Officer of Fidelity Management & Research (Hong Kong) Limited (2008-present) and Assistant Secretary of Fidelity Management & Research (Japan) Inc. (2008-present), and Fidelity Management & Research (U.K.) Inc. (2008-present). Previously, Mr. Goebel served as Assistant Secretary of FIMM (2008-2010), FRAC (2008-2010), and the Funds (2007-2008) and as Vice President and Secretary of Fidelity Distributors Corporation (FDC) (2005-2007). |
William C. Coffey (42) |
| Year of Election or Appointment: 2009 Assistant Secretary of Fidelity's Equity and High Income Funds. Mr. Coffey also serves as Senior Vice President and Deputy General Counsel of FMR LLC (2010-present), and is an employee of Fidelity Investments. Previously, Mr. Coffey served as Vice President and Associate General Counsel of FMR LLC (2005-2009). |
Holly C. Laurent (57) |
| Year of Election or Appointment: 2008 Anti-Money Laundering (AML) Officer of the Fidelity funds. Ms. Laurent also serves as AML Officer of The North Carolina Capital Management Trust: Cash and Term Portfolios (2008-present) and is an employee of Fidelity Investments. Previously, Ms. Laurent was Senior Vice President and Head of Legal for Fidelity Business Services India Pvt. Ltd. (2006-2008), and Senior Vice President, Deputy General Counsel and Group Head for FMR LLC (2005-2006). |
Christine Reynolds (53) |
| Year of Election or Appointment: 2008 Chief Financial Officer of the Fidelity funds. Ms. Reynolds became President of Fidelity Pricing and Cash Management Services (FPCMS) in August 2008. Ms. Reynolds served as Chief Operating Officer of FPCMS (2007-2008). Previously, Ms. Reynolds served as President, Treasurer, and Anti-Money Laundering officer of the Fidelity funds (2004-2007). |
Kenneth A. Rathgeber (64) |
| Year of Election or Appointment: 2004 Chief Compliance Officer of Fidelity's Equity and High Income Funds. Mr. Rathgeber is Chief Compliance Officer of Fidelity Management & Research (Hong Kong) Limited (2008-present), Fidelity Management & Research (Japan) Inc. (2008-present), FMR (2005-present), FMR Co., Inc. (2005-present), Fidelity Management & Research (U.K.) Inc. (2005-present), Fidelity Research & Analysis Company (2005-present), Fidelity Investments Money Management, Inc. (2005-present), Pyramis Global Advisors, LLC (2005-present), and Strategic Advisers, Inc. (2005-present). |
Jeffrey S. Christian (50) |
| Year of Election or Appointment: 2009 Deputy Treasurer of the Fidelity funds. Mr. Christian is an employee of Fidelity Investments. Previously, Mr. Christian served as Chief Financial Officer (2008-2009) of certain Fidelity funds and Senior Vice President of Fidelity Pricing and Cash Management Services (FPCMS) (2004-2009). |
Joseph F. Zambello (54) |
| Year of Election or Appointment: 2011 Deputy Treasurer of the Fidelity funds. Mr. Zambello is an employee of Fidelity Investments. Previously, Mr. Zambello served as Vice President of FMR's Program Management Group (2009-2011) and Vice President of the Transfer Agent Oversight Group (2005-2009). |
Adrien E. Deberghes (44) |
| Year of Election or Appointment: 2008 Deputy Treasurer of Fidelity's Equity and High Income Funds. Mr. Deberghes also serves as Vice President and Assistant Treasurer of Fidelity Rutland Square Trust II and Fidelity Commonwealth Trust II (2011-present), Assistant Treasurer of other Fidelity funds (2010-present), and is an employee of Fidelity Investments (2008-present). Previously, Mr. Deberghes served as Senior Vice President of Mutual Fund Administration at State Street Corporation (2007-2008), Senior Director of Mutual Fund Administration at Investors Bank & Trust (2005-2007), and Director of Finance for Dunkin' Brands (2000-2005). |
Stephanie J. Dorsey (42) |
| Year of Election or Appointment: 2010 Assistant Treasurer of Fidelity's Equity and High Income Funds. Ms. Dorsey also serves as Deputy Treasurer of other Fidelity funds (2008-present) and is an employee of Fidelity Investments (2008-present). Previously, Ms. Dorsey served as Treasurer (2004-2008) of the JPMorgan Mutual Funds and Vice President (2004-2008) of JPMorgan Chase Bank. |
John R. Hebble (53) |
| Year of Election or Appointment: 2009 Assistant Treasurer of Fidelity's Equity and High Income Funds. Mr. Hebble also serves as President (2011-present), Treasurer, and Chief Financial Officer of The North Carolina Capital Management Trust: Cash and Term Portfolios (2008-present), President and Treasurer of other Fidelity funds (2008-present) and is an employee of Fidelity Investments. |
Gary W. Ryan (53) |
| Year of Election or Appointment: 2005 Assistant Treasurer of the Fidelity funds. Mr. Ryan is an employee of Fidelity Investments. Previously, Mr. Ryan served as Vice President of Fund Reporting in Fidelity Pricing and Cash Management Services (FPCMS) (1999-2005). |
Jonathan Davis (43) |
| Year of Election or Appointment: 2010 Assistant Treasurer of the Fidelity funds. Mr. Davis is also Assistant Treasurer of Fidelity Rutland Square Trust II and Fidelity Commonwealth Trust II. Mr. Davis is an employee of Fidelity Investments. Previously, Mr. Davis served as Vice President and Associate General Counsel of FMR LLC (2003-2010). |
Annual Report
Board Approval of Investment Advisory Contracts and Management Fees
VIP Growth Strategies Portfolio
Each year, the Board of Trustees, including the Independent Trustees (together, the Board), votes on the renewal of the management contract and sub-advisory agreements (together, the Advisory Contracts) for the fund. The Board, assisted by the advice of fund counsel and Independent Trustees' counsel, requests and considers a broad range of information relevant to the renewal of the Advisory Contracts throughout the year.
The Board meets regularly and considers at each of its meetings factors that are relevant to its annual consideration of the renewal of the fund's Advisory Contracts, including the services and support provided to the fund and its shareholders. The Board has established various standing committees, each composed of Independent Trustees with varying backgrounds, to which the Board has assigned specific subject matter responsibilities in order to enhance effective decision-making by the Board. The Board, acting directly and through its Committees, requests and receives information concerning the annual consideration of the renewal of the fund's Advisory Contracts. The Board also meets as needed to consider matters specifically related to the Board's annual consideration of the renewal of Advisory Contracts. Members of the Board may also meet with trustees of other Fidelity funds through ad hoc joint committees to discuss certain matters relevant to the Fidelity funds.
At its July 2011 meeting, the Board of Trustees, including the Independent Trustees, unanimously determined to renew the fund's Advisory Contracts. In reaching its determination, the Board considered all factors it believed relevant, including (i) the nature, extent, and quality of the services to be provided to the fund and its shareholders (including the investment performance of the fund); (ii) the competitiveness of the fund's management fee and total expense ratio; (iii) the total costs of the services to be provided by and the profits to be realized by Fidelity from its relationship with the fund; (iv) the extent to which economies of scale would be realized as the fund grows; and (v) whether fee levels reflect these economies of scale, if any, for the benefit of fund shareholders.
In considering whether to renew the Advisory Contracts for the fund, the Board reached a determination, with the assistance of fund counsel and Independent Trustees' counsel and through the exercise of its business judgment, that the renewal of the Advisory Contracts is in the best interests of the fund and its shareholders and that the compensation payable under the Advisory Contracts is fair and reasonable. The Board's decision to renew the Advisory Contracts was not based on any single factor, but rather was based on a comprehensive consideration of all the information provided to the Board at its meetings throughout the year. The Board, in reaching its determination to renew the Advisory Contracts, is aware that shareholders in the fund have a broad range of investment choices available to them, including a wide choice among mutual funds offered by Fidelity's competitors, and that the fund's shareholders, who have the opportunity to review and weigh the disclosure provided by the fund in its prospectus and other public disclosures, have chosen to invest in this fund, managed by Fidelity.
Nature, Extent, and Quality of Services Provided. The Board considered the staffing within the investment adviser, FMR, and the sub-advisers (together, the Investment Advisers), including the backgrounds of the fund's investment personnel and the fund's investment objective and discipline. The Independent Trustees also had discussions with senior management of Fidelity's investment operations and investment groups. The Board considered the structure of the portfolio manager compensation program and whether this structure provides appropriate incentives to act in the best interests of the fund.
Resources Dedicated to Investment Management and Support Services. The Board and the Fund Oversight and Research Committees reviewed the general qualifications and capabilities of the Investment Advisers' investment staff, including its size, education, experience, and resources, as well as the Investment Advisers' approach to recruiting, training, managing, and compensating investment personnel. The Board also noted that FMR has devoted increased resources to non-U.S. offices. The Board noted that Fidelity's analysts have extensive resources, tools and capabilities which allow them to conduct sophisticated quantitative and fundamental analysis, as well as credit analysis of issuers, counterparties and enhancers. The Board also believes that Fidelity's investment professionals have sufficient access to global information and data so as to provide competitive investment results over time, and that those professionals also have access to sophisticated tools which permit them to assess portfolio construction and risk and performance attribution characteristics continuously, as well as to transmit new information and research conclusions rapidly around the world. Additionally, in their deliberations, the Board considered the Investment Advisers' trading capabilities and resources which are an integral part of the investment management process.
Shareholder and Administrative Services. The Board considered (i) the nature, extent, quality, and cost of advisory, administrative, and shareholder services performed by the Investment Advisers and their affiliates under the Advisory Contracts and under separate agreements covering transfer agency, pricing and bookkeeping, and securities lending services for the fund; (ii) the nature and extent of the investment adviser's supervision of third party service providers, principally custodians and subcustodians; and (iii) the resources devoted to, and the record of compliance with, the fund's compliance policies and procedures. The Board also reviewed the allocation of fund brokerage, including allocations to brokers affiliated with the Investment Advisers, the use of brokerage commissions to pay fund expenses, and the use of "soft" commission dollars to pay for research services.
The Board noted that the growth of fund assets over time across the complex allows Fidelity to reinvest in the development of services designed to enhance the value or convenience of the Fidelity funds as investment vehicles. These services include 24-hour access to account information and market information through telephone representatives and over the Internet, investor education materials and asset allocation tools, and the expanded availability of Fidelity Investor Centers, with 35 new branches opening since 2010.
Annual Report
Investment in a Large Fund Family. The Board considered the benefits to shareholders of investing in a Fidelity fund, including the benefits of investing in a fund that is part of a large family of funds offering a variety of investment disciplines and providing a large variety of mutual fund investor services. The Board noted that Fidelity had taken, or had made recommendations that resulted in the Fidelity funds taking, a number of actions over the previous year that benefited particular funds, including (i) continuing to dedicate additional resources to investment research and support of the senior management team that oversees asset management; (ii) rationalizing product lines through the mergers of six funds into other funds; (iii) continuing to migrate the Freedom Funds to dedicated lower cost underlying funds; (iv) obtaining shareholder approval to broaden the investment strategies for Fidelity Consumer Finance Portfolio, Fidelity Emerging Asia Fund, and Fidelity Environment and Alternative Energy Portfolio; (v) contractually agreeing to reduce the management fees and impose other expense limitations on Spartan 500 Index Fund and U.S. Bond Index Fund in connection with launching new institutional classes of these funds; (vi) changing the name, primary and supplemental benchmarks, and investment policies of Fidelity Global Strategies Fund to support the fund's flexible investment mandate and global orientation; and (vii) reducing the transfer agency account fee rates on certain accounts.
Investment Performance. The Board considered whether the fund has operated in accordance with its investment objective, as well as its record of compliance with its investment restrictions. It also reviewed the fund's absolute investment performance for each class, as well as the fund's relative investment performance for each class measured over multiple periods against (i) a broad-based securities market index, and (ii) a peer group of mutual funds deemed appropriate by Fidelity and reviewed by the Board. The following charts considered by the Board show, over the one-, three-, and five-year periods ended December 31, 2010, the cumulative total returns of Initial Class and Service Class 2 of the fund, the cumulative total returns of a broad-based securities market index ("benchmark"), and a range of cumulative total returns of a peer group of mutual funds identified by Morningstar, Inc. as having an investment style similar to that of the fund based on underlying portfolio holdings. The returns of Initial Class and Service Class 2 show the performance of the highest and lowest performing classes, respectively (based on five-year performance). The box within each chart shows the 25th percentile return (bottom of box) and the 75th percentile return (top of box) of the peer group. Returns shown above the box are in the first quartile and returns shown below the box are in the fourth quartile. The percentage beaten numbers noted below each chart correspond to the percentile box and represent the percentage of funds in the peer group whose performance was equal to or lower than that of the class indicated.
VIP Growth Strategies Portfolio
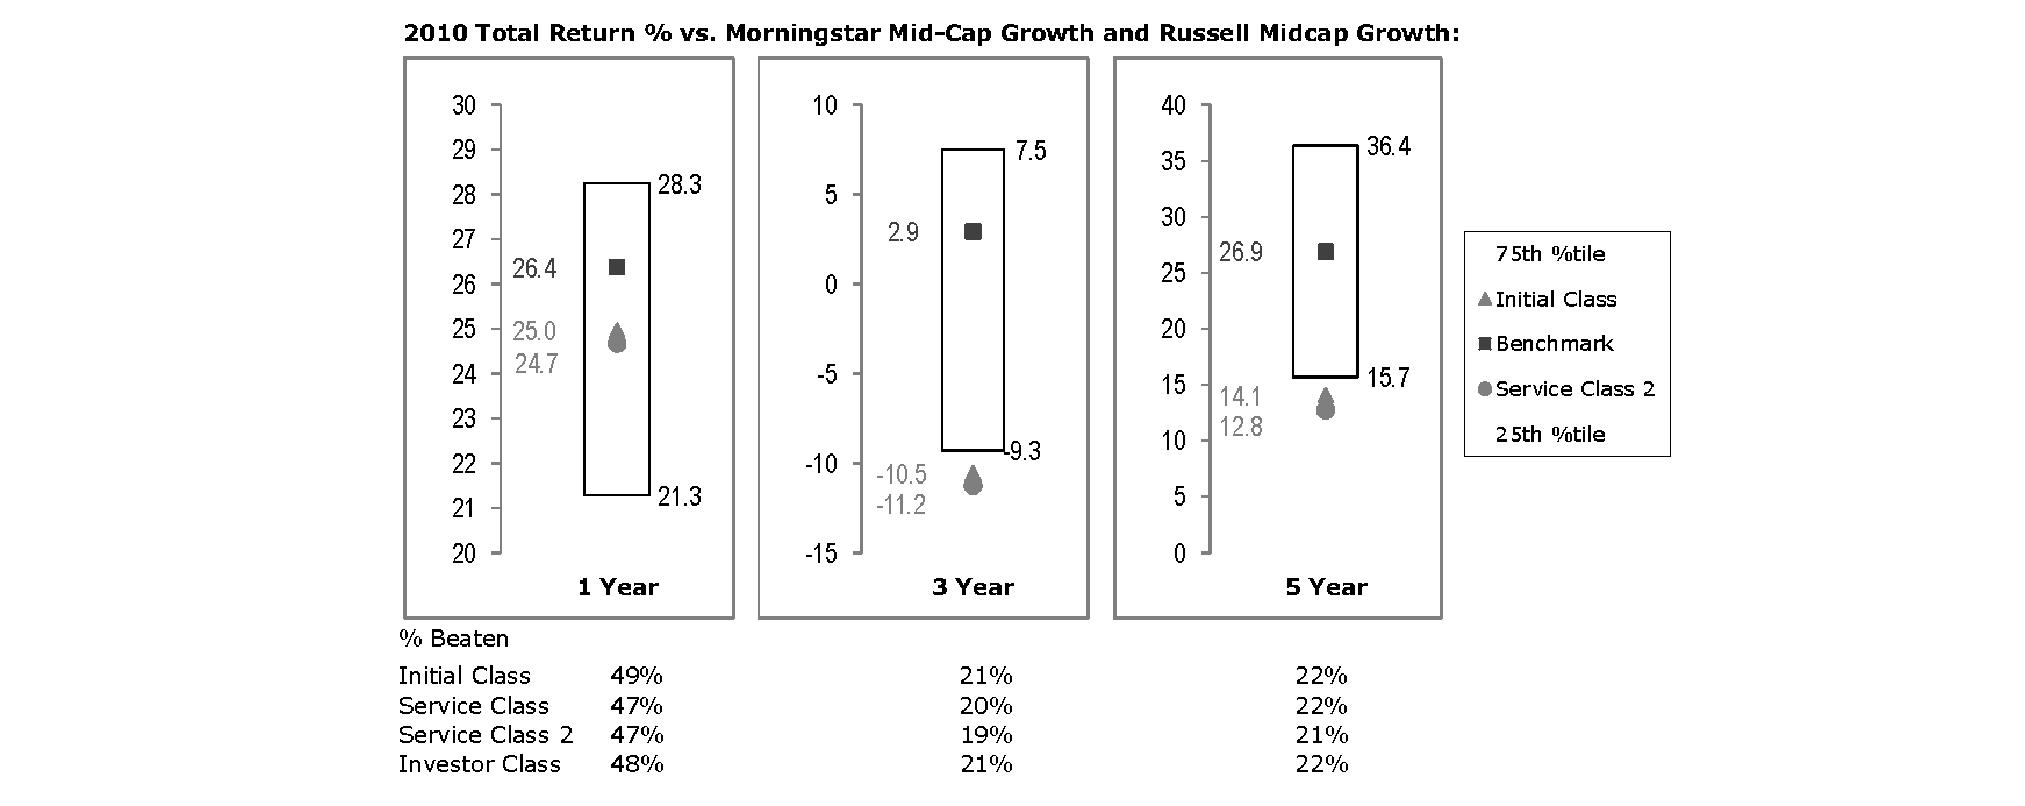
The Board reviewed the fund's relative investment performance against its peer group and noted that the performance of Initial Class of the fund was in the third quartile for the one-year period and the fourth quartile for the three- and five-year periods. The Board also noted that the investment performance of the fund was lower than its benchmark for all the periods shown. The Board considered that the variations in performance among the fund's classes reflect the variations in class expenses, which result in lower performance for higher expense classes. The Board discussed with FMR actions that have been taken by FMR to improve the fund's disappointing performance relative to its peer group and benchmark. The Board noted that this fund had underperformed in 2009 and discussed with FMR its disappointment with the continued underperformance of the fund. The Board also reviewed the fund's performance since inception as well as performance in the current year. The Board will continue to closely monitor the performance of the fund in the coming year and discuss with FMR other appropriate actions to address the performance of the fund.
Based on its review, the Board concluded that the nature, extent, and quality of services provided to the fund under the Advisory Contracts should benefit the fund's shareholders.
Annual Report
Board Approval of Investment Advisory Contracts and Management Fees - continued
Competitiveness of Management Fee and Total Expense Ratio. The Board considered the fund's management fee and total expense ratio compared to "mapped groups" of competitive funds and classes. Fidelity creates "mapped groups" by combining similar Lipper investment objective categories that have comparable management fee characteristics. Combining Lipper investment objective categories aids the Board's management fee and total expense ratio comparisons by broadening the competitive group used for comparison and by reducing the number of universes to which various Fidelity funds are compared.
Management Fee. The Board considered two proprietary management fee comparisons for the 12-month periods shown in the chart below. The group of Lipper funds used by the Board for management fee comparisons is referred to below as the "Total Mapped Group." The Total Mapped Group comparison focuses on a fund's standing relative to the total universe of comparable funds available to investors in terms of gross management fees before expense reimbursements or caps. "TMG %" represents the percentage of funds in the Total Mapped Group that had management fees that were lower than the fund's. For example, a TMG % of 14% means that 86% of the funds in the Total Mapped Group had higher management fees than the fund. The "Asset-Size Peer Group" (ASPG) comparison focuses on a fund's standing relative to non-Fidelity funds similar in size to the fund within the Total Mapped Group. The ASPG represents at least 15% of the funds in the Total Mapped Group with comparable asset size and management fee characteristics, subject to a minimum of 50 funds (or all funds in the Total Mapped Group if fewer than 50). Additional information, such as the ASPG quartile in which the fund's management fee ranked, is also included in the chart and considered by the Board.
VIP Growth Strategies Portfolio
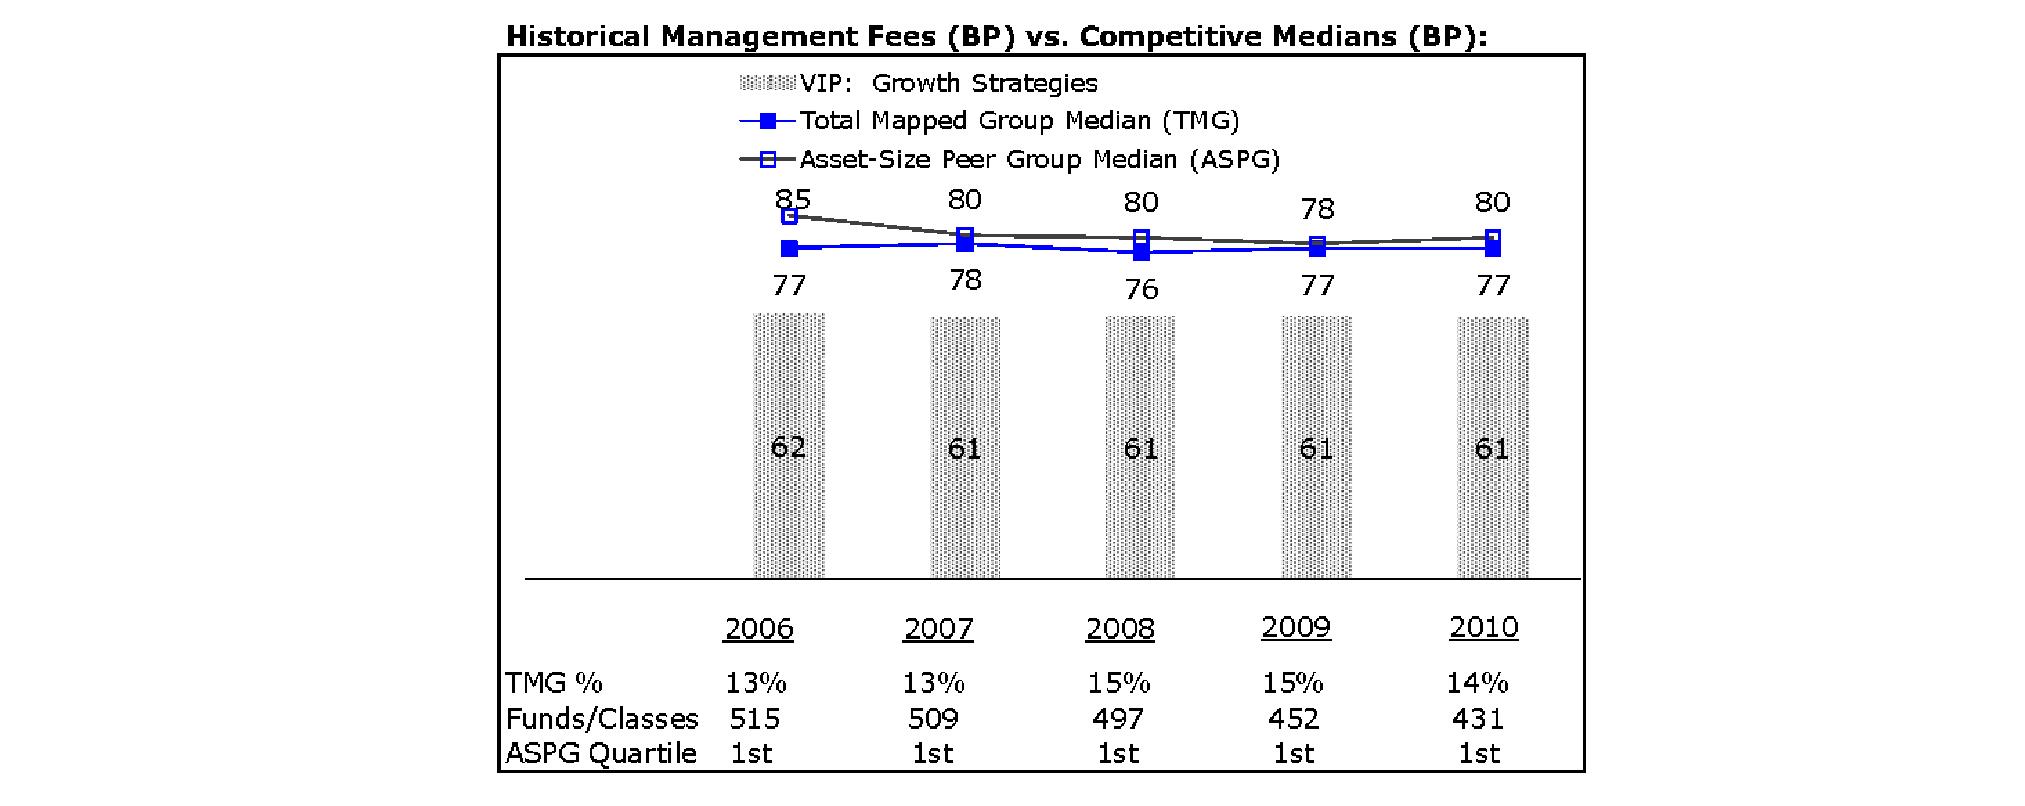
The Board noted that the fund's management fee ranked below the median of its Total Mapped Group and below the median of its ASPG for 2010.
Based on its review, the Board concluded that the fund's management fee is fair and reasonable in light of the services that the fund receives and the other factors considered.
Total Expense Ratio. In its review of each class's total expense ratio, the Board considered the fund's management fee as well as other fund or class expenses, as applicable, such as transfer agent fees, pricing and bookkeeping fees, fund-paid 12b-1 fees, and custodial, legal, and audit fees. The Board also noted the effects of any waivers and reimbursements on fees and expenses. As part of its review, the Board also considered the current and historical total expense ratios of each class of the fund compared to competitive fund median expenses. Each class of the fund is compared to those funds and classes in the Total Mapped Group (used by the Board for management fee comparisons) that have a similar sales load structure.
The Board noted that the total expense ratio of Initial Class ranked below its competitive median for 2010 and the total expense ratio of each of Investor Class, Service Class, and Service Class 2 ranked above its competitive median for 2010. The Board considered that various factors, including 12b-1 fees, positive or negative performance adjustments, and relatively higher other expenses in the case of small fund size, can affect total expense ratios. The Board also noted that Investor Class has higher transfer agent fees than traditional variable annuity classes because it is designed for lower cost annuity products, where the majority of servicing costs are incorporated into the funds' total expense ratios rather than being paid at the annuity level. The Board noted that the fund offers multiple classes, each of which has a different 12b-1 fee structure, and that the multiple structures are intended to offer a range of pricing options for the intermediary market. The Board also noted that the total expense ratios of the classes vary primarily by the level of their 12b-1 fees, although differences in transfer agent fees may also cause expenses to vary from class to class.
Fees Charged to Other Fidelity Clients. The Board also considered Fidelity fee structures and other information with respect to clients of FMR and its affiliates, such as other mutual funds advised or subadvised by FMR or its affiliates, pension plan clients, and other institutional clients. In March 2010, the Board created an ad hoc joint committee with the board of other Fidelity funds (the Committee) to review and compare Fidelity's institutional investment advisory business with its business of providing services to the Fidelity funds, including the differences in services provided, fees charged, and costs incurred, as well as competition in their respective marketplaces.
Annual Report
Based on its review of total expense ratios and fees charged to other Fidelity clients, the Board concluded that the total expense ratio of each class of the fund was reasonable, although in some cases above the median of the universe presented for comparison, in light of the services that the fund and its shareholders receive and the other factors considered, including the findings of the Committee.
Costs of the Services and Profitability. The Board considered the revenues earned and the expenses incurred by Fidelity in conducting the business of developing, marketing, distributing, managing, administering and servicing the fund and its shareholders. The Board also considered the level of Fidelity's profits in respect of all the Fidelity funds.
On an annual basis, FMR presents to the Board Fidelity's profitability for the fund. Fidelity calculates the profitability for each fund, as well as aggregate profitability for groups of Fidelity funds and all Fidelity funds, using a series of detailed revenue and cost allocation methodologies which originate with the books and records of Fidelity on which Fidelity's audited financial statements are based. The Audit Committee of the Board reviews any significant changes from the prior year's methodologies.
PricewaterhouseCoopers LLP (PwC), independent registered public accounting firm and auditor to Fidelity and certain Fidelity funds, has been engaged annually by the Board as part of the Board's assessment of Fidelity's profitability analysis. PwC's engagement includes the review and assessment of Fidelity's methodologies used in determining the revenues and expenses attributable to Fidelity's mutual fund business, and completion of agreed-upon procedures surrounding the mathematical accuracy of fund profitability and its conformity to allocation methodologies. After considering PwC's reports issued under the engagement and information provided by Fidelity, the Board concluded that while other allocation methods may also be reasonable, Fidelity's profitability methodologies are reasonable in all material respects.
The Board also reviewed Fidelity's non-fund businesses and fall-out benefits related to the mutual fund business as well as cases where Fidelity's affiliates may benefit from or be related to the fund's business.
The Board considered the costs of the services provided by and the profits realized by Fidelity in connection with the operation of the fund and was satisfied that the profitability was not excessive in the circumstances.
Economies of Scale. The Board considered whether there have been economies of scale in respect of the management of the Fidelity funds, whether the Fidelity funds (including the fund) have appropriately benefited from any such economies of scale, and whether there is potential for realization of any further economies of scale. The Board considered the extent to which the fund will benefit from economies of scale through increased services to the fund, through waivers or reimbursements, or through fee or expense reductions. The Board also noted that in 2009, it and the board of other Fidelity funds created an ad hoc committee (the Economies of Scale Committee) to analyze whether FMR attains economies of scale in respect of the management and servicing of the Fidelity funds, whether the Fidelity funds have appropriately benefited from such economies of scale, and whether there is potential for realization of any further economies of scale.
The Board recognized that the fund's management contract incorporates a "group fee" structure, which provides for lower group fee rates as total fund assets under FMR's management increase, and for higher group fee rates as total fund assets under FMR's management decrease. FMR calculates the group fee rates based on a tiered asset "breakpoint" schedule that varies based on asset class. The Board considered that the group fee is designed to deliver the benefits of economies of scale to fund shareholders when total Fidelity fund assets increase, even if assets of any particular fund are unchanged or have declined, because some portion of Fidelity's costs are attributable to services provided to all Fidelity funds, and all funds benefit if those costs can be allocated among more assets. The Board concluded that, given the group fee structure, fund shareholders will benefit from lower management fees as assets under FMR's management increase at the fund complex level, regardless of whether Fidelity achieves any such economies of scale.
The Board concluded, taking into account the analysis of the Economies of Scale Committee, that any potential economies of scale are being appropriately shared between fund shareholders and Fidelity.
Additional Information Requested by the Board. In order to develop fully the factual basis for consideration of the Fidelity funds' Advisory Contracts, the Board requested and received additional information on certain topics, including (i) fund performance trends, actions to be taken by FMR to improve certain funds' overall performance, and Fidelity's long-term strategies for certain funds; (ii) portfolio manager changes that have occurred during the past year and length of portfolio manager tenure for different categories of funds over time; (iii) Fidelity's compensation structure for portfolio managers and other key personnel and strategies for attracting and retaining non-investment personnel; (iv) the amount of the investment that each portfolio manager has made in the Fidelity fund(s) that he or she manages; (v) historical trends in Fidelity's realization of fall-out benefits; (vi) Fidelity's group fee structures and the rationale for the individual fee rates of certain funds; (vii) fund profitability methodology and the impact of certain factors on fund profitability results; (viii) trends regarding industry use of performance fee structures and Fidelity's compliance practices with respect to performance adjustment calculations; (ix) the fee structures in place for certain other Fidelity clients; and (x) explanations regarding the relative total expense ratios of certain funds and classes, total expense competitive trends, and actions that might be taken by FMR to reduce total expense ratios for certain funds and classes.
Annual Report
Board Approval of Investment Advisory Contracts and Management Fees - continued
Based on its evaluation of all of the conclusions noted above, and after considering all factors it believed relevant, the Board ultimately concluded that the advisory fee structures are fair and reasonable, and that the fund's Advisory Contracts should be renewed.
Annual Report
Investment Adviser
Fidelity Management & Research Company
Boston, MA
Investment Sub-Advisers
FMR Co., Inc.
Fidelity Management & Research (U.K.) Inc.
Fidelity Management & Research (Japan) Inc.
Fidelity Management & Research (Hong Kong) Limited
General Distributor
Fidelity Distributors Corporation
Boston, MA
Transfer and Service Agents
Fidelity Investments Institutional Operations Company, Inc.
Boston, MA
Fidelity Service Company, Inc.
Boston, MA
Custodian
JPMorgan Chase Bank
New York, NY
VIPAG-ANN-0212
1.751800.111
Item 2. Code of Ethics
As of the end of the period, December 31, 2011, Variable Insurance Products Fund III (the trust) has adopted a code of ethics, as defined in Item 2 of Form N-CSR, that applies to its President and Treasurer and its Chief Financial Officer. A copy of the code of ethics is filed as an exhibit to this Form N-CSR.
Item 3. Audit Committee Financial Expert
The Board of Trustees of the trust has determined that Joseph Mauriello is an audit committee financial expert, as defined in Item 3 of Form N-CSR. Mr. Mauriello is independent for purposes of Item 3 of Form N-CSR.
Item 4. Principal Accountant Fees and Services
Fees and Services
The following table presents fees billed by Deloitte & Touche LLP, the member firms of Deloitte Touche Tohmatsu, and their respective affiliates (collectively, "Deloitte Entities") in each of the last two fiscal years for services rendered to Balanced Portfolio, Dynamic Capital Appreciation Portfolio, Growth & Income Portfolio, Growth Opportunities Portfolio, Growth Strategies and Value Strategies Portfolio (the "Funds"):
Services Billed by Deloitte Entities
December 31, 2011 FeesA
| Audit Fees | Audit-Related Fees | Tax Fees | All Other Fees |
Balanced Portfolio | $52,000 | $- | $5,800 | $500 |
Dynamic Capital Appreciation Portfolio | $34,000 | $- | $5,700 | $300 |
Growth & Income Portfolio | $44,000 | $- | $5,700 | $400 |
Growth Opportunities Portfolio | $43,000 | $- | $4,600 | $300 |
Growth Strategies Portfolio | $29,000 | $- | $5,700 | $300 |
Value Strategies Portfolio | $42,000 | $- | $6,500 | $300 |
December 31, 2010 FeesA
| Audit Fees | Audit-Related Fees | Tax Fees | All Other Fees |
Balanced Portfolio | $52,000 | $- | $5,900 | $- |
Dynamic Capital Appreciation Portfolio | $33,000 | $- | $5,600 | $- |
Growth & Income Portfolio | $44,000 | $- | $5,600 | $- |
Growth Opportunities Portfolio | $42,000 | $- | $4,500 | $- |
Growth Strategies Portfolio | $28,000 | $- | $5,700 | $- |
Value Strategies Portfolio | $41,000 | $- | $6,400 | $- |
A Amounts may reflect rounding.
The following table presents fees billed by PricewaterhouseCoopers LLP ("PwC") in each of the last two fiscal years for services rendered to Mid Cap Portfolio (the "Fund"):
Services Billed by PwC
December 31, 2011 FeesA
| Audit Fees | Audit-Related Fees | Tax Fees | All Other Fees |
Mid Cap Portfolio | $56,000 | $- | $3,100 | $4,900 |
December 31, 2010 FeesA
| Audit Fees | Audit-Related Fees | Tax Fees | All Other Fees |
Mid Cap Portfolio | $57,000 | $- | $3,000 | $5,900 |
A Amounts may reflect rounding.
The following table presents fees billed by PwC and Deloitte Entities that were required to be approved by the Audit Committee for services that relate directly to the operations and financial reporting of the Funds and that are rendered on behalf of Fidelity Management & Research Company ("FMR") and entities controlling, controlled by, or under common control with FMR (not including any sub-adviser whose role is primarily portfolio management and is subcontracted with or overseen by another investment adviser) that provide ongoing services to the Funds ("Fund Service Providers"):
Services Billed by Deloitte Entities
| December 31, 2011A | December 31, 2010A |
Audit-Related Fees | $610,000 | $645,000 |
Tax Fees | $- | $- |
All Other Fees | $430,000 | $840,000 |
A Amounts may reflect rounding.
Services Billed by PwC
| December 31, 2011A | December 31, 2010A |
Audit-Related Fees | $3,845,000 | $2,505,000 |
Tax Fees | $- | $- |
All Other Fees | $- | $510,000 |
A Amounts may reflect rounding.
"Audit-Related Fees" represent fees billed for assurance and related services that are reasonably related to the performance of the fund audit or the review of the fund's financial statements and that are not reported under Audit Fees.
"Tax Fees" represent fees billed for tax compliance, tax advice or tax planning that relate directly to the operations and financial reporting of the fund.
"All Other Fees" represent fees billed for services provided to the fund or Fund Service Provider, a significant portion of which are assurance related, that relate directly to the operations and financial reporting of the fund, excluding those services that are reported under Audit Fees, Audit-Related Fees or Tax Fees.
Assurance services must be performed by an independent public accountant.
* * *
The aggregate non-audit fees billed by PwC and Deloitte Entities for services rendered to the Funds, FMR (not including any sub-adviser whose role is primarily portfolio management and is subcontracted with or overseen by another investment adviser), and any Fund Service Provider for each of the last two fiscal years of the Funds are as follows:
Billed By | December 31, 2011 A | December 31, 2010 A |
PwC | $5,060,000 | $5,020,000 |
Deloitte Entities | $1,170,000 | $1,615,000 |
A Amounts may reflect rounding.
The trust's Audit Committee has considered non-audit services that were not pre-approved that were provided by PwC and Deloitte Entities to Fund Service Providers to be compatible with maintaining the independence of PwC and Deloitte Entities in their audits of the Funds, taking into account representations from PwC and Deloitte Entities, in accordance with Public Company Accounting Oversight Board rules, regarding their independence from the Funds and their related entities and FMR's review of the appropriateness and permissibility under applicable law of such non-audit services prior to their provision to the Fund Service Providers.
Audit Committee Pre-Approval Policies and Procedures
The trust's Audit Committee must pre-approve all audit and non-audit services provided by a fund's independent registered public accounting firm relating to the operations or financial reporting of the fund. Prior to the commencement of any audit or non-audit services to a fund, the Audit Committee reviews the services to determine whether they are appropriate and permissible under applicable law.
The Audit Committee has adopted policies and procedures to, among other purposes, provide a framework for the Committee's consideration of non-audit services by the audit firms that audit the Fidelity funds. The policies and procedures require that any non-audit service provided by a fund audit firm to a Fidelity fund and any non-audit service provided by a fund auditor to a Fund Service Provider that relates directly to the operations and financial reporting of a Fidelity fund ("Covered Service") are subject to approval by the Audit Committee before such service is provided.
All Covered Services must be approved in advance of provision of the service either: (i) by formal resolution of the Audit Committee, or (ii) by oral or written approval of the service by the Chair of the Audit Committee (or if the Chair is unavailable, such other member of the Audit Committee as may be designated by the Chair to act in the Chair's absence). The approval contemplated by (ii) above is permitted where the Treasurer determines that action on such an engagement is necessary before the next meeting of the Audit Committee.
Non-audit services provided by a fund audit firm to a Fund Service Provider that do not relate directly to the operations and financial reporting of a Fidelity fund are reported to the Audit Committee on a periodic basis.
Non-Audit Services Approved Pursuant to Rule 2-01(c)(7)(i)(C) and (ii) of Regulation S-X ("De Minimis Exception")
There were no non-audit services approved or required to be approved by the Audit Committee pursuant to the De Minimis Exception during the Funds' last two fiscal years relating to services provided to (i) the Funds or (ii) any Fund Service Provider that relate directly to the operations and financial reporting of the Funds.
Item 5. Audit Committee of Listed Registrants
Not applicable.
Item 6. Investments
(a) Not applicable.
(b) Not applicable
Item 7. Disclosure of Proxy Voting Policies and Procedures for Closed-End Management Investment Companies
Not applicable.
Item 8. Portfolio Managers of Closed-End Management Investment Companies
Not applicable.
Item 9. Purchase of Equity Securities by Closed-End Management Investment Company and Affiliated Purchasers
Not applicable.
Item 10. Submission of Matters to a Vote of Security Holders
There were no material changes to the procedures by which shareholders may recommend nominees to the trust's Board of Trustees.
Item 11. Controls and Procedures
(a)(i) The President and Treasurer and the Chief Financial Officer have concluded that the trust's disclosure controls and procedures (as defined in Rule 30a-3(c) under the Investment Company Act) provide reasonable assurances that material information relating to the trust is made known to them by the appropriate persons, based on their evaluation of these controls and procedures as of a date within 90 days of the filing date of this report.
(a)(ii) There was no change in the trust's internal control over financial reporting (as defined in Rule 30a-3(d) under the Investment Company Act) that occurred during the second fiscal quarter of the period covered by this report that has materially affected, or is reasonably likely to materially affect, the trust's internal control over financial reporting.
Item 12. Exhibits
(a) | (1) | Code of Ethics pursuant to Item 2 of Form N-CSR is filed and attached hereto as EX-99.CODE ETH. |
(a) | (2) | Certification pursuant to Rule 30a-2(a) under the Investment Company Act of 1940 (17 CFR 270.30a-2(a)) is filed and attached hereto as Exhibit 99.CERT. |
(a) | (3) | Not applicable. |
(b) | | Certification pursuant to Rule 30a-2(b) under the Investment Company Act of 1940 (17 CFR 270.30a-2(b)) is furnished and attached hereto as Exhibit 99.906CERT. |
SIGNATURES
Pursuant to the requirements of the Securities Exchange Act of 1934 and the Investment Company Act of 1940, the registrant has duly caused this report to be signed on its behalf by the undersigned, thereunto duly authorized.
Variable Insurance Products Fund III
By: | /s/Kenneth B. Robins |
| Kenneth B. Robins |
| President and Treasurer |
| |
Date: | February 23, 2012 |
Pursuant to the requirements of the Securities Exchange Act of 1934 and the Investment Company Act of 1940, this report has been signed below by the following persons on behalf of the registrant and in the capacities and on the dates indicated.
By: | /s/Kenneth B. Robins |
| Kenneth B. Robins |
| President and Treasurer |
| |
Date: | February 23, 3012 |
By: | /s/Christine Reynolds |
| Christine Reynolds |
| Chief Financial Officer |
| |
Date: | February 23, 2012 |