0000927384fmr:C000021048_2_AdditionalIndexMember_AsOf_2018Member2018-12-31
UNITED STATES
SECURITIES AND EXCHANGE COMMISSION
Washington, D.C. 20549
FORM N-CSR
CERTIFIED SHAREHOLDER REPORT OF REGISTERED
MANAGEMENT INVESTMENT COMPANIES
Investment Company Act file number 811-07205
Variable Insurance Products Fund III
(Exact name of registrant as specified in charter)
245 Summer St., Boston, Massachusetts 02210
(Address of principal executive offices) (Zip code)
Nicole Macarchuk, Secretary
245 Summer St.
Boston, Massachusetts 02210
(Name and address of agent for service)
Registrant's telephone number, including area code:
617-563-7000
| |
Date of fiscal year end: | December 31 |
|
|
Date of reporting period: | December 31, 2024 |
Item 1.
Reports to Stockholders
| |
| | ANNUAL SHAREHOLDER REPORT | AS OF DECEMBER 31, 2024 | This report describes changes to the Fund that occurred during the reporting period. |
| | VIP Balanced Portfolio VIP Balanced Portfolio Initial Class true |
| | | |
This annual shareholder report contains information about VIP Balanced Portfolio for the period January 1, 2024 to December 31, 2024. You can find additional information about the Fund at fundresearch.fidelity.com/prospectus/sec. You can also request this information by contacting us at 1-877-208-0098 or by sending an e-mail to funddocuments@fmr.com.
What were your Fund costs for the last year?(based on hypothetical $10,000 investment)
FUND COST (PREVIOUS YEAR)
| | Costs of a $10,000 investment | Costs paid as a percentage of a $10,000 investment | |
| Initial Class | $ 45 | 0.42% | |
What affected the Fund's performance this period?
•U.S. equities posted a strong gain for the 12 months ending December 31, 2024, driven by a sturdy economy, the Federal Reserve's long-anticipated pivot to cutting interest rates and the potential for artificial intelligence to drive transformative change. On the other hand, U.S. taxable investment-grade bonds finished the year with a low single-digit gain, as the bond market reflected both three interest-rate reductions by the Fed and meaningful increases in U.S. Treasury yields.
•Against this backdrop, asset allocation - overweighting stocks and underweighting investment-grade bonds - meaningfully contributed to the fund's performance versus the Fidelity Balanced 60/40 Composite Index for the year. Investment choices in the bond subportfolio also helped the fund's relative result.
•Among stocks, picks in the health care and industrials sectors stood out as relative contributors. The top individual contributor was an overweight in Nvidia (+169%). We trimmed exposure to Nvidia, making it the fund's No. 2 holding as of December 31.
•Elsewhere, avoiding weak-performing index component Intel (-60%) boosted the fund's relative result. A non-Composite stake in UCB (+119%) - a new position in the equity subportfolio this period - further contributed.
•Conversely, security selection and an underweight in the information technology sector notably detracted from relative performance for the 12 months. Investment choices in consumer discretionary and communication services also hurt.
•Mostly avoiding Broadcom (+110%), where we established a position this period, detracted the most on a relative basis, followed by an overweight in Adobe (-25%) and SolarEdge Technologies (-85%). We trimmed our positions in both Adobe and SolarEdge this period.
•In fixed income, the fund notably benefited from exposure to asset-backed securities, including collateralized loan obligations, while the fund's yield-curve positioning modestly detracted for the year.
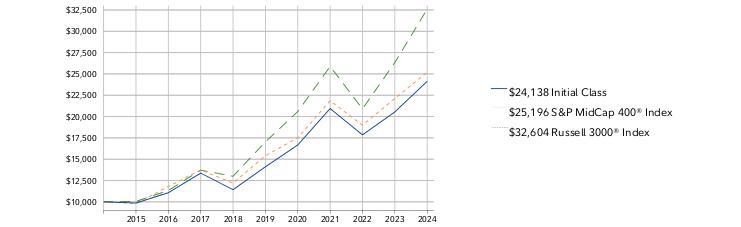
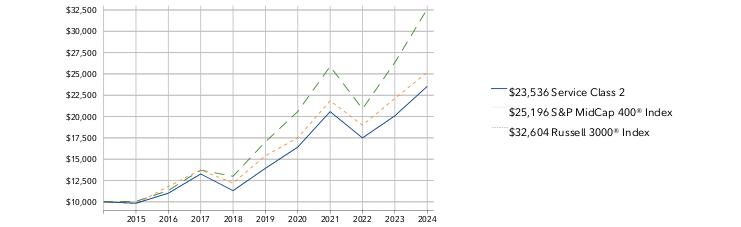
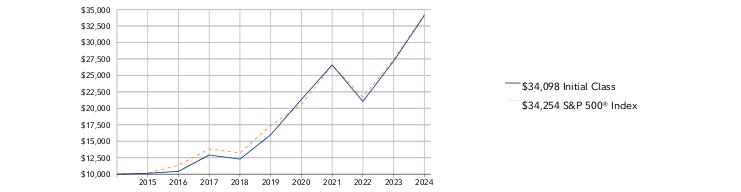
How did the Fund perform over the past 10 years?
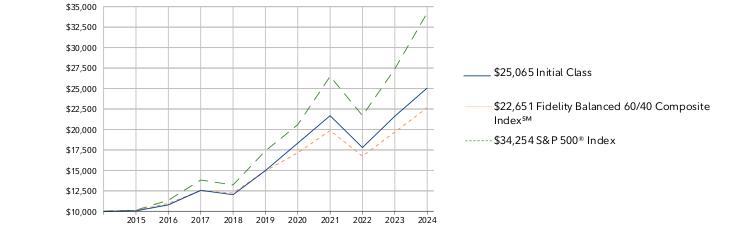
CUMULATIVE PERFORMANCE
December 31, 2014 through December 31, 2024.
Initial investment of $10,000.
Initial Class | $10,000 | $10,059 | $10,790 | $12,562 | $12,032 | $14,980 | $18,334 | $21,682 | $17,792 | $21,622 | $25,065 |
Fidelity Balanced 60/40 Composite Index℠ | $10,000 | $10,128 | $10,970 | $12,529 | $12,235 | $14,948 | $17,150 | $19,869 | $16,732 | $19,689 | $22,651 |
S&P 500® Index | $10,000 | $10,138 | $11,351 | $13,829 | $13,223 | $17,386 | $20,585 | $26,494 | $21,696 | $27,399 | $34,254 |
| | 2014 | 2015 | 2016 | 2017 | 2018 | 2019 | 2020 | 2021 | 2022 | 2023 | 2024 |
AVERAGE ANNUAL TOTAL RETURNS:| | 1 Year | 5 Year | 10 Year |
| Initial Class | 15.92% | 10.84% | 9.62% |
| Fidelity Balanced 60/40 Composite Index℠ | 15.04% | 8.67% | 8.52% |
| S&P 500® Index | 25.02% | 14.53% | 13.10% |
Visit institutional.fidelity.com for more recent performance information. |
The Fund's past performance is not a good predictor of the Fund's future performance. The graph and table do not reflect the deduction of taxes that a shareholder would pay on fund distributions or redemption of fund shares. |
Key Fund Statistics(as of December 31, 2024)
KEY FACTS | | |
| Fund Size | $7,634,971,647 | |
| Number of Holdings | 332 | |
| Total Advisory Fee | $32,367,968 | |
| Portfolio Turnover | 33% | |
What did the Fund invest in?
(as of December 31, 2024)
The information in the following tables is based on the combined Investments of the Fund and it's pro-rata share of investments in Fidelity's Central Funds, other than the Commodity Strategy and Money Market Central Funds as applicable.
| U.S. Government and U.S. Government Agency Obligations | 22.3 |
| AAA | 2.4 |
| AA | 0.2 |
| A | 2.7 |
| BBB | 5.5 |
| BB | 0.6 |
| B | 0.3 |
| Not Rated | 0.4 |
| Equities | 65.4 |
| Short-Term Investments and Net Other Assets (Liabilities) | 0.2 |
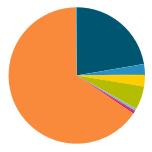
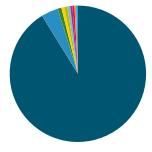
QUALITY DIVERSIFICATION (% of Fund's net assets) |
| |
| | U.S. Government and U.S. Government Agency Obligations - 22.3 |
| | AAA - 2.4 |
| | AA - 0.2 |
| | A - 2.7 |
| | BBB - 5.5 |
| | BB - 0.6 |
| | B - 0.3 |
| | Not Rated - 0.4 |
| | Equities - 65.4 |
| | Short-Term Investments and Net Other Assets (Liabilities) - 0.2 |
| |
| We have used ratings from Moody's Investors Service, Inc. Where Moody's® ratings are not available, we have used S&P® ratings. All ratings are as of the date indicated and do not reflect subsequent changes. |
MARKET SECTORS (% of Fund's net assets) | | |
| Information Technology | 21.2 | |
| Financials | 13.3 | |
| Consumer Discretionary | 7.4 | |
| Communication Services | 7.3 | |
| Health Care | 7.1 | |
| Industrials | 5.6 | |
| Consumer Staples | 3.6 | |
| Energy | 3.0 | |
| Real Estate | 2.2 | |
| Utilities | 1.9 | |
| Materials | 1.1 | |
| |
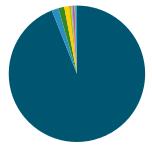
| Common Stocks | 65.2 |
| Bonds | 34.4 |
| Preferred Stocks | 0.2 |
| Short-Term Investments and Net Other Assets (Liabilities) | 0.2 |
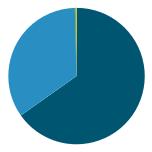
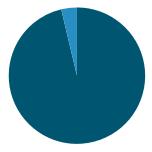
ASSET ALLOCATION (% of Fund's net assets) |
|
| | Common Stocks - 65.2 |
| | Bonds - 34.4 |
| | Preferred Stocks - 0.2 |
| | Short-Term Investments and Net Other Assets (Liabilities) - 0.2 |
| |
TOP HOLDINGS(% of Fund's net assets) | | |
| US Treasury Notes | 12.5 | |
| Apple Inc | 5.3 | |
| NVIDIA Corp | 4.9 | |
| Microsoft Corp | 4.7 | |
| US Treasury Bonds | 3.8 | |
| Alphabet Inc Class A | 3.3 | |
| Amazon.com Inc | 3.1 | |
| Fannie Mae Mortgage pass-thru certificates | 2.2 | |
| Meta Platforms Inc Class A | 1.8 | |
| Ginnie Mae II Pool | 1.7 | |
| | 43.3 | |
How has the Fund changed?
This is a summary of certain changes to the Fund since January 1, 2024. For more complete information, you may review the Fund's next prospectus, which we expect to be available by April 30, 2025 at fundresearch.fidelity.com/prospectus/sec or upon request at 1-877-208-0098 or by sending an e-mail to funddocuments@fmr.com.
The fees associated with this class changed during the reporting year. The variations in class fees are primarily the result of the following changes: The fund's transfer agent and pricing & bookkeeping fees were changed to a fixed rate effective December 1, 2023. Effective March 1, 2024, the fund's management contract was amended to incorporate administrative services previously covered under separate services agreements (transfer agent and pricing & bookkeeping). The amended contract incorporates a management fee rate that may vary by class. The Adviser or an affiliate pays certain expenses of managing and operating the fund out of each class's management fee. | |
| Fidelity, the Fidelity Investments Logo and all other Fidelity trademarks or service marks used herein are trademarks or service marks of FMR LLC. Any third-party marks that are used herein are trademarks or service marks of their respective owners. © 2025 FMR LLC. All rights reserved. |
| | For additional information about the Fund; including its prospectus, financial information, holdings and proxy information, scan the QR code or visit fundresearch.fidelity.com/prospectus/sec 1.9914219.100 616-TSRA-0325 |
| |
| | ANNUAL SHAREHOLDER REPORT | AS OF DECEMBER 31, 2024 | This report describes changes to the Fund that occurred during the reporting period. |
| | VIP Dynamic Capital Appreciation Portfolio VIP Dynamic Capital Appreciation Portfolio Service Class true |
| | | |
This annual shareholder report contains information about VIP Dynamic Capital Appreciation Portfolio for the period January 1, 2024 to December 31, 2024. You can find additional information about the Fund at fundresearch.fidelity.com/prospectus/sec. You can also request this information by contacting us at 1-877-208-0098 or by sending an e-mail to funddocuments@fmr.com.
What were your Fund costs for the last year?(based on hypothetical $10,000 investment)
FUND COST (PREVIOUS YEAR)
| | Costs of a $10,000 investment | Costs paid as a percentage of a $10,000 investment | |
| Service Class | $ 81 | 0.72% | |
What affected the Fund's performance this period?
•U.S. equities gained in 2024, driven by a sturdy economy, the Federal Reserve's long-anticipated pivot to cutting interest rates and the potential for artificial intelligence to drive transformative change.
•Against this backdrop, security selection was the primary contributor to the fund's performance versus the S&P 500® index for the fiscal year, led by health care. Security selection in industrials, primarily within the capital goods industry, and information technology also boosted the fund's relative result.
•The top individual relative contributor was an overweight in Nvidia (+174%). The stock was the fund's biggest holding at period end. A second notable relative contributor was an overweight in GE Vernova (+137%). This was an investment we established this period. The company was one of the fund's largest holdings at period end. An overweight in Boston Scientific (+54%) also helped. The company was among the fund's largest holdings.
•In contrast, the biggest detractor from performance versus the benchmark was stock picking in consumer discretionary. An overweight in health care also hampered the fund's result, as did our picks and an underweight in communication services, primarily within the media & entertainment industry.
•Not owning Broadcom, a benchmark component that gained about 110%, was the biggest individual relative detractor. A non-benchmark stake in MongoDB returned approximately -39% and was the second-largest relative detractor. The stock was not held at period end. Not owning Tesla, a benchmark component that gained about 63%, also hurt.
•Notable changes in positioning include higher allocations to the consumer discretionary and financials sectors.
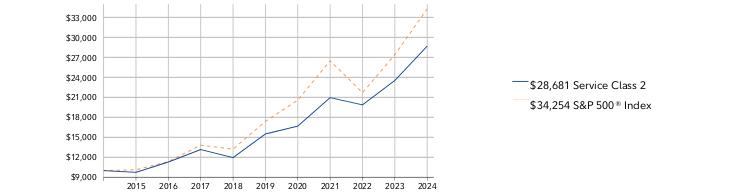
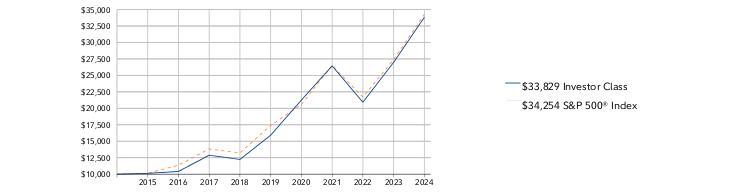
How did the Fund perform over the past 10 years?
CUMULATIVE PERFORMANCE
December 31, 2014 through December 31, 2024.
Initial investment of $10,000.
Service Class | $10,000 | $10,116 | $10,395 | $12,864 | $12,225 | $15,887 | $21,205 | $26,395 | $20,868 | $26,906 | $33,727 |
S&P 500® Index | $10,000 | $10,138 | $11,351 | $13,829 | $13,223 | $17,386 | $20,585 | $26,494 | $21,696 | $27,399 | $34,254 |
| | 2014 | 2015 | 2016 | 2017 | 2018 | 2019 | 2020 | 2021 | 2022 | 2023 | 2024 |
AVERAGE ANNUAL TOTAL RETURNS:| | 1 Year | 5 Year | 10 Year |
| Service Class | 25.35% | 16.25% | 12.93% |
| S&P 500® Index | 25.02% | 14.53% | 13.10% |
Visit institutional.fidelity.com for more recent performance information. |
The Fund's past performance is not a good predictor of the Fund's future performance. The graph and table do not reflect the deduction of taxes that a shareholder would pay on fund distributions or redemption of fund shares. |
Key Fund Statistics(as of December 31, 2024)
KEY FACTS | | |
| Fund Size | $279,787,748 | |
| Number of Holdings | 146 | |
| Total Advisory Fee | $1,666,387 | |
| Portfolio Turnover | 61% | |
What did the Fund invest in?
(as of December 31, 2024)
MARKET SECTORS (% of Fund's net assets) | | |
| Information Technology | 28.5 | |
| Health Care | 17.2 | |
| Financials | 13.2 | |
| Consumer Discretionary | 12.7 | |
| Industrials | 12.2 | |
| Communication Services | 7.5 | |
| Energy | 2.8 | |
| Materials | 2.6 | |
| Consumer Staples | 2.4 | |
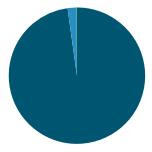
| Real Estate | 0.8 | |
| |
| Common Stocks | 99.6 |
| Preferred Stocks | 0.3 |
| Preferred Securities | 0.0 |
| Bonds | 0.0 |
| Short-Term Investments and Net Other Assets (Liabilities) | 0.1 |
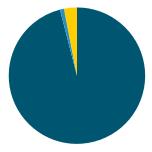
ASSET ALLOCATION (% of Fund's net assets) |
|
| | Common Stocks - 99.6 |
| | Preferred Stocks - 0.3 |
| | Preferred Securities - 0.0 |
| | Bonds - 0.0 |
| | Short-Term Investments and Net Other Assets (Liabilities) - 0.1 |
| |
| United States | 89.8 |
| China | 2.5 |
| Taiwan | 2.1 |
| Canada | 1.5 |
| Brazil | 0.9 |
| Israel | 0.8 |
| Belgium | 0.7 |
| Netherlands | 0.7 |
| Germany | 0.4 |
| Others | 0.6 |
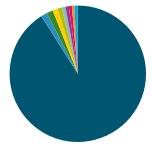
GEOGRAPHIC DIVERSIFICATION (% of Fund's net assets) |
|
| | United States - 89.8 |
| | China - 2.5 |
| | Taiwan - 2.1 |
| | Canada - 1.5 |
| | Brazil - 0.9 |
| | Israel - 0.8 |
| | Belgium - 0.7 |
| | Netherlands - 0.7 |
| | Germany - 0.4 |
| | Others - 0.6 |
| |
TOP HOLDINGS(% of Fund's net assets) | | |
| NVIDIA Corp | 8.7 | |
| Apple Inc | 7.2 | |
| Amazon.com Inc | 5.2 | |
| Microsoft Corp | 4.5 | |
| Boston Scientific Corp | 3.1 | |
| Alphabet Inc Class A | 3.0 | |
| Mastercard Inc Class A | 2.8 | |
| Taiwan Semiconductor Manufacturing Co Ltd ADR | 2.0 | |
| Alphabet Inc Class C | 1.7 | |
| GE Vernova Inc | 1.6 | |
| | 39.8 | |
How has the Fund changed?
This is a summary of certain changes to the Fund since January 1, 2024. For more complete information, you may review the Fund's next prospectus, which we expect to be available by April 30, 2025 at fundresearch.fidelity.com/prospectus/sec or upon request at 1-877-208-0098 or by sending an e-mail to funddocuments@fmr.com.
The fund's transfer agent and pricing & bookkeeping fees were changed to a fixed rate effective December 1, 2023. Effective March 1, 2024, the fund's management contract was amended to incorporate administrative services previously covered under separate services agreements (transfer agent and pricing & bookkeeping). The amended contract incorporates a management fee rate that may vary by class. The Adviser or an affiliate pays certain expenses of managing and operating the fund out of each class's management fee. | |
| Fidelity, the Fidelity Investments Logo and all other Fidelity trademarks or service marks used herein are trademarks or service marks of FMR LLC. Any third-party marks that are used herein are trademarks or service marks of their respective owners. © 2025 FMR LLC. All rights reserved. |
| | For additional information about the Fund; including its prospectus, financial information, holdings and proxy information, scan the QR code or visit fundresearch.fidelity.com/prospectus/sec 1.9914207.100 853-TSRA-0325 |
| |
| | ANNUAL SHAREHOLDER REPORT | AS OF DECEMBER 31, 2024 | This report describes changes to the Fund that occurred during the reporting period. |
| | VIP Value Strategies Portfolio VIP Value Strategies Portfolio Initial Class true |
| | | |
This annual shareholder report contains information about VIP Value Strategies Portfolio for the period January 1, 2024 to December 31, 2024. You can find additional information about the Fund at fundresearch.fidelity.com/prospectus/sec. You can also request this information by contacting us at 1-877-208-0098 or by sending an e-mail to funddocuments@fmr.com.
What were your Fund costs for the last year?(based on hypothetical $10,000 investment)
FUND COST (PREVIOUS YEAR)
| | Costs of a $10,000 investment | Costs paid as a percentage of a $10,000 investment | |
| Initial Class | $ 63 | 0.60% | |
What affected the Fund's performance this period?
•U.S. equities gained in 2024, driven by a sturdy economy, the Federal Reserve's long-anticipated pivot to cutting interest rates and the potential for artificial intelligence to drive transformative change.
•Against this backdrop, security selection was the primary detractor from the fund's performance versus the Russell Midcap Value Index for the fiscal year, especially within the consumer discretionary sector. Stock picking and an overweight in industrials also hampered the fund's result. Investment choices in communication services hurt as well.
•The biggest individual relative detractor was our non-benchmark stake in CVS Health (-41%). An overweight in Chemours (-44%) and position in Centene (-20%) also hurt. The latter stock was not held at period end but was among the fund's biggest holdings in 2024.
•In contrast, the biggest contributor to performance versus the benchmark was stock selection in information technology, primarily within the technology hardware & equipment industry. Picks in utilities also boosted relative performance. An overweight in financials, primarily within the financial services industry, helped as well.
•The top individual relative contributor was an overweight in Constellation Energy (+88%). This period we decreased our stake in Constellation Energy although it was among our largest holdings this period. A non-benchmark stake in Apollo Global Management gained approximately 80% and further bolstered relative performance. The stock was one of our largest holdings. A non-benchmark stake in Targa Resources (+111%) also helped.
•Notable changes in positioning include decreased exposure to the utilities and real estate sectors.
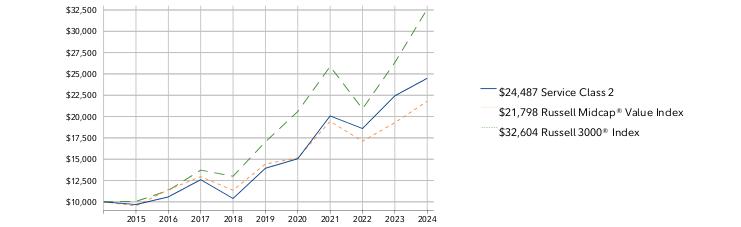
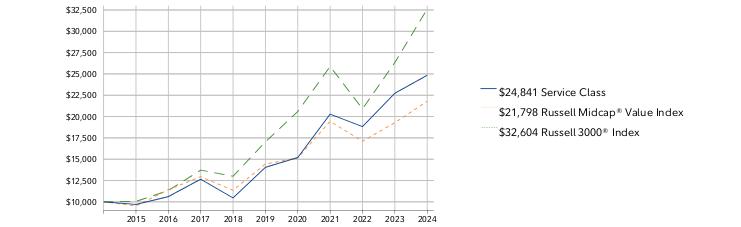
How did the Fund perform over the past 10 years?
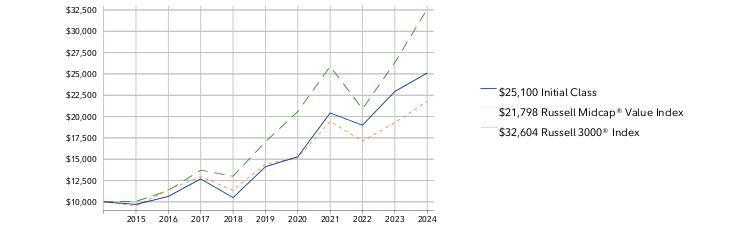
CUMULATIVE PERFORMANCE
December 31, 2014 through December 31, 2024.
Initial investment of $10,000.
Initial Class | $10,000 | $9,701 | $10,635 | $12,693 | $10,495 | $14,119 | $15,284 | $20,420 | $18,985 | $22,943 | $25,100 |
Russell Midcap® Value Index | $10,000 | $9,522 | $11,426 | $12,951 | $11,359 | $14,433 | $15,150 | $19,443 | $17,104 | $19,278 | $21,798 |
Russell 3000® Index | $10,000 | $10,048 | $11,327 | $13,721 | $13,002 | $17,035 | $20,593 | $25,877 | $20,907 | $26,334 | $32,604 |
| | 2014 | 2015 | 2016 | 2017 | 2018 | 2019 | 2020 | 2021 | 2022 | 2023 | 2024 |
AVERAGE ANNUAL TOTAL RETURNS:| | 1 Year | 5 Year | 10 Year |
| Initial Class | 9.40% | 12.20% | 9.64% |
| Russell Midcap® Value Index | 13.07% | 8.59% | 8.10% |
| Russell 3000® Index | 23.81% | 13.86% | 12.55% |
Visit institutional.fidelity.com for more recent performance information. |
The Fund's past performance is not a good predictor of the Fund's future performance. The graph and table do not reflect the deduction of taxes that a shareholder would pay on fund distributions or redemption of fund shares. |
Key Fund Statistics(as of December 31, 2024)
KEY FACTS | | |
| Fund Size | $938,382,301 | |
| Number of Holdings | 116 | |
| Total Advisory Fee | $4,291,907 | |
| Portfolio Turnover | 66% | |
What did the Fund invest in?
(as of December 31, 2024)
MARKET SECTORS (% of Fund's net assets) | | |
| Financials | 21.4 | |
| Industrials | 18.7 | |
| Consumer Discretionary | 9.4 | |
| Materials | 7.9 | |
| Energy | 6.9 | |
| Information Technology | 6.9 | |
| Real Estate | 6.3 | |
| Health Care | 5.9 | |
| Consumer Staples | 5.3 | |
| Utilities | 5.2 | |
| Communication Services | 2.4 | |
| |
| Common Stocks | 96.3 |
| Short-Term Investments and Net Other Assets (Liabilities) | 3.7 |
ASSET ALLOCATION (% of Fund's net assets) |
|
| | Common Stocks - 96.3 |
| | Short-Term Investments and Net Other Assets (Liabilities) - 3.7 |
| |
| United States | 91.2 |
| Canada | 4.0 |
| Bailiwick Of Jersey | 0.9 |
| Spain | 0.7 |
| Puerto Rico | 0.7 |
| India | 0.7 |
| Portugal | 0.5 |
| Sweden | 0.5 |
| United Kingdom | 0.4 |
| Others | 0.4 |
GEOGRAPHIC DIVERSIFICATION (% of Fund's net assets) |
|
| | United States - 91.2 |
| | Canada - 4.0 |
| | Bailiwick Of Jersey - 0.9 |
| | Spain - 0.7 |
| | Puerto Rico - 0.7 |
| | India - 0.7 |
| | Portugal - 0.5 |
| | Sweden - 0.5 |
| | United Kingdom - 0.4 |
| | Others - 0.4 |
| |
TOP HOLDINGS(% of Fund's net assets) | | |
| Global Payments Inc | 1.9 | |
| Apollo Global Management Inc | 1.9 | |
| East West Bancorp Inc | 1.9 | |
| First Citizens BancShares Inc/NC Class A | 1.8 | |
| Canadian Natural Resources Ltd | 1.6 | |
| PG&E Corp | 1.5 | |
| Ventas Inc | 1.5 | |
| Ameriprise Financial Inc | 1.5 | |
| Jabil Inc | 1.5 | |
| ON Semiconductor Corp | 1.3 | |
| | 16.4 | |
How has the Fund changed?
This is a summary of certain changes to the Fund since January 1, 2024. For more complete information, you may review the Fund's next prospectus, which we expect to be available by April 30, 2025 at fundresearch.fidelity.com/prospectus/sec or upon request at 1-877-208-0098 or by sending an e-mail to funddocuments@fmr.com.
The fund's transfer agent and pricing & bookkeeping fees were changed to a fixed rate effective December 1, 2023. Effective March 1, 2024, the fund's management contract was amended to incorporate administrative services previously covered under separate services agreements (transfer agent and pricing & bookkeeping). The amended contract incorporates a management fee rate that may vary by class. The Adviser or an affiliate pays certain expenses of managing and operating the fund out of each class's management fee. | |
| Fidelity, the Fidelity Investments Logo and all other Fidelity trademarks or service marks used herein are trademarks or service marks of FMR LLC. Any third-party marks that are used herein are trademarks or service marks of their respective owners. © 2025 FMR LLC. All rights reserved. |
| | For additional information about the Fund; including its prospectus, financial information, holdings and proxy information, scan the QR code or visit fundresearch.fidelity.com/prospectus/sec 1.9914242.100 1024-TSRA-0325 |
| |
| | ANNUAL SHAREHOLDER REPORT | AS OF DECEMBER 31, 2024 | This report describes changes to the Fund that occurred during the reporting period. |
| | VIP Growth & Income Portfolio VIP Growth & Income Portfolio Service Class true |
| | | |
This annual shareholder report contains information about VIP Growth & Income Portfolio for the period January 1, 2024 to December 31, 2024. You can find additional information about the Fund at fundresearch.fidelity.com/prospectus/sec. You can also request this information by contacting us at 1-877-208-0098 or by sending an e-mail to funddocuments@fmr.com.
What were your Fund costs for the last year?(based on hypothetical $10,000 investment)
FUND COST (PREVIOUS YEAR)
| | Costs of a $10,000 investment | Costs paid as a percentage of a $10,000 investment | |
| Service Class | $ 65 | 0.59% | |
What affected the Fund's performance this period?
•U.S. equities gained in 2024, driven by a sturdy economy, the Federal Reserve's long-anticipated pivot to cutting interest rates and the potential for artificial intelligence to drive transformative change.
•Against this backdrop, market selection was the primary detractor from the fund's performance versus the S&P 500® index for the fiscal year, especially an overweight in energy. Security selection and an underweight in communication services, primarily within the media & entertainment industry, also hampered the fund's result. Also hurting our result was an underweight in information technology, primarily within the semiconductors & semiconductor equipment industry.
•The largest individual relative detractor was an underweight in Nvidia (+171%), which was among the largest holdings. A second notable relative detractor was an overweight in Boeing (-33%). The company was one of the fund's biggest holdings this period. An underweight in Meta Platforms (+66%) also detracted. This was an investment we established this period.
•In contrast, the biggest contributor to performance versus the benchmark was security selection in industrials, primarily within the capital goods industry. Stock picking in health care also boosted relative performance. Also lifting the fund's relative result were stock picks and an overweight in financials, primarily within the banks industry.
•The top individual relative contributor was an overweight in GE Aerospace (+66%). The company was one of the fund's biggest holdings. A second notable relative contributor was an overweight in GE Vernova (+127%). This was an investment we established this period. The company also was among our biggest holdings at period end. An overweight in Wells Fargo (+43%) also helped. The company, too, was a sizable holding.
•Notable changes in positioning include a higher allocation to information technology.
How did the Fund perform over the past 10 years?
CUMULATIVE PERFORMANCE
December 31, 2014 through December 31, 2024.
Initial investment of $10,000.
Service Class | $10,000 | $9,765 | $11,322 | $13,221 | $12,021 | $15,620 | $16,829 | $21,164 | $20,101 | $23,845 | $29,112 |
S&P 500® Index | $10,000 | $10,138 | $11,351 | $13,829 | $13,223 | $17,386 | $20,585 | $26,494 | $21,696 | $27,399 | $34,254 |
| | 2014 | 2015 | 2016 | 2017 | 2018 | 2019 | 2020 | 2021 | 2022 | 2023 | 2024 |
AVERAGE ANNUAL TOTAL RETURNS:| | 1 Year | 5 Year | 10 Year |
| Service Class | 22.09% | 13.26% | 11.28% |
| S&P 500® Index | 25.02% | 14.53% | 13.10% |
Visit institutional.fidelity.com for more recent performance information. |
The Fund's past performance is not a good predictor of the Fund's future performance. The graph and table do not reflect the deduction of taxes that a shareholder would pay on fund distributions or redemption of fund shares. |
Key Fund Statistics(as of December 31, 2024)
KEY FACTS | | |
| Fund Size | $2,444,208,883 | |
| Number of Holdings | 177 | |
| Total Advisory Fee | $11,224,574 | |
| Portfolio Turnover | 14% | |
What did the Fund invest in?
(as of December 31, 2024)
MARKET SECTORS (% of Fund's net assets) | | |
| Information Technology | 23.4 | |
| Financials | 20.2 | |
| Industrials | 16.4 | |
| Health Care | 11.0 | |
| Energy | 8.9 | |
| Consumer Staples | 5.9 | |
| Communication Services | 4.5 | |
| Utilities | 2.4 | |
| Consumer Discretionary | 2.0 | |
| Real Estate | 1.2 | |
| Materials | 1.1 | |
| |
| Common Stocks | 96.0 |
| Preferred Stocks | 0.9 |
| Bonds | 0.1 |
| Short-Term Investments and Net Other Assets (Liabilities) | 3.0 |
ASSET ALLOCATION (% of Fund's net assets) |
|
| | Common Stocks - 96.0 |
| | Preferred Stocks - 0.9 |
| | Bonds - 0.1 |
| | Short-Term Investments and Net Other Assets (Liabilities) - 3.0 |
| |
| United States | 91.0 |
| Canada | 1.5 |
| Germany | 1.5 |
| United Kingdom | 1.2 |
| Netherlands | 1.0 |
| Belgium | 0.9 |
| France | 0.8 |
| Zambia | 0.7 |
| Taiwan | 0.6 |
| Others | 0.8 |
GEOGRAPHIC DIVERSIFICATION (% of Fund's net assets) |
|
| | United States - 91.0 |
| | Canada - 1.5 |
| | Germany - 1.5 |
| | United Kingdom - 1.2 |
| | Netherlands - 1.0 |
| | Belgium - 0.9 |
| | France - 0.8 |
| | Zambia - 0.7 |
| | Taiwan - 0.6 |
| | Others - 0.8 |
| |
TOP HOLDINGS(% of Fund's net assets) | | |
| Microsoft Corp | 7.5 | |
| Wells Fargo & Co | 6.5 | |
| Exxon Mobil Corp | 5.8 | |
| GE Aerospace | 4.6 | |
| NVIDIA Corp | 4.1 | |
| Apple Inc | 3.2 | |
| Bank of America Corp | 2.9 | |
| Visa Inc Class A | 2.3 | |
| GE Vernova Inc | 2.2 | |
| UnitedHealth Group Inc | 1.8 | |
| | 40.9 | |
How has the Fund changed?
This is a summary of certain changes to the Fund since January 1, 2024. For more complete information, you may review the Fund's next prospectus, which we expect to be available by April 30, 2025 at fundresearch.fidelity.com/prospectus/sec or upon request at 1-877-208-0098 or by sending an e-mail to funddocuments@fmr.com.
The fund's transfer agent and pricing & bookkeeping fees were changed to a fixed rate effective December 1, 2023. Effective March 1, 2024, the fund's management contract was amended to incorporate administrative services previously covered under separate services agreements (transfer agent and pricing & bookkeeping). The amended contract incorporates a management fee rate that may vary by class. The Adviser or an affiliate pays certain expenses of managing and operating the fund out of each class's management fee. | |
| Fidelity, the Fidelity Investments Logo and all other Fidelity trademarks or service marks used herein are trademarks or service marks of FMR LLC. Any third-party marks that are used herein are trademarks or service marks of their respective owners. © 2025 FMR LLC. All rights reserved. |
| | For additional information about the Fund; including its prospectus, financial information, holdings and proxy information, scan the QR code or visit fundresearch.fidelity.com/prospectus/sec 1.9914149.100 473-TSRA-0325 |
| |
| | ANNUAL SHAREHOLDER REPORT | AS OF DECEMBER 31, 2024 | This report describes changes to the Fund that occurred during the reporting period. |
| | VIP Mid Cap Portfolio VIP Mid Cap Portfolio Investor Class true |
| | | |
This annual shareholder report contains information about VIP Mid Cap Portfolio for the period January 1, 2024 to December 31, 2024. You can find additional information about the Fund at fundresearch.fidelity.com/prospectus/sec. You can also request this information by contacting us at 1-877-208-0098 or by sending an e-mail to funddocuments@fmr.com.
What were your Fund costs for the last year?(based on hypothetical $10,000 investment)
FUND COST (PREVIOUS YEAR)
| | Costs of a $10,000 investment | Costs paid as a percentage of a $10,000 investment | |
| Investor Class | $ 70 | 0.65% | |
What affected the Fund's performance this period?
•U.S. equities gained in 2024, driven by a sturdy economy, the Federal Reserve's long-anticipated pivot to cutting interest rates and the potential for artificial intelligence to drive transformative change.
•Against this backdrop, security selection was the primary contributor to the fund's performance versus the S&P MidCap 400 Index for the year, led by the consumer discretionary sector. Picks in consumer staples and financials, primarily banks, also boosted the fund's relative performance.
•The fund's non-benchmark stake in Vertiv Holdings gained 141% and was the top individual relative contributor. This period we decreased our position in the stock. An overweight in Deckers Outdoor (+83%) helped as well. This period we decreased our position in Deckers Outdoor. Another notable relative contributor was our non-benchmark stake in Howmet Aerospace (+110%). The stock was not held at period end.
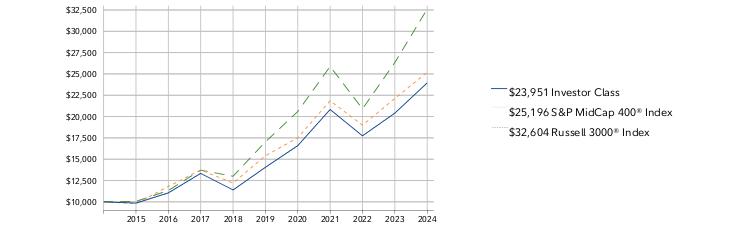
•In contrast, the biggest detractor from performance versus the benchmark was stock picking in information technology. Also hurting our result was security selection in energy and utilities. Lastly, the fund's position in cash further detracted.
•Not owning Texas Pacific Land, a benchmark component that gained 117%, was the biggest individual relative detractor. Our stake in Super Micro Computer (+276%) also hurt. The stock was not held at period end. A holding in Emcor (+111%) detracted as well. This was an investment we established in 2024.
•Notable changes in positioning include increased exposure to the health care and financials sectors.
How did the Fund perform over the past 10 years?
CUMULATIVE PERFORMANCE
December 31, 2014 through December 31, 2024.
Initial investment of $10,000.
Investor Class | $10,000 | $9,853 | $11,048 | $13,338 | $11,391 | $14,050 | $16,590 | $20,827 | $17,739 | $20,400 | $23,951 |
S&P MidCap 400® Index | $10,000 | $9,782 | $11,811 | $13,730 | $12,208 | $15,407 | $17,511 | $21,847 | $18,993 | $22,115 | $25,196 |
Russell 3000® Index | $10,000 | $10,048 | $11,327 | $13,721 | $13,002 | $17,035 | $20,593 | $25,877 | $20,907 | $26,334 | $32,604 |
| | 2014 | 2015 | 2016 | 2017 | 2018 | 2019 | 2020 | 2021 | 2022 | 2023 | 2024 |
AVERAGE ANNUAL TOTAL RETURNS:| | 1 Year | 5 Year | 10 Year |
| Investor Class | 17.40% | 11.26% | 9.13% |
| S&P MidCap 400® Index | 13.93% | 10.34% | 9.68% |
| Russell 3000® Index | 23.81% | 13.86% | 12.55% |
Visit institutional.fidelity.com for more recent performance information. |
The Fund's past performance is not a good predictor of the Fund's future performance. The graph and table do not reflect the deduction of taxes that a shareholder would pay on fund distributions or redemption of fund shares. |
Key Fund Statistics(as of December 31, 2024)
KEY FACTS | | |
| Fund Size | $7,489,948,736 | |
| Number of Holdings | 180 | |
| Total Advisory Fee | $40,873,181 | |
| Portfolio Turnover | 52% | |
What did the Fund invest in?
(as of December 31, 2024)
MARKET SECTORS (% of Fund's net assets) | | |
| Financials | 20.1 | |
| Industrials | 18.1 | |
| Consumer Discretionary | 12.3 | |
| Health Care | 11.7 | |
| Information Technology | 9.7 | |
| Real Estate | 6.5 | |
| Energy | 6.0 | |
| Materials | 5.2 | |
| Consumer Staples | 4.9 | |
| Utilities | 3.4 | |
| Communication Services | 1.8 | |
| |
| Common Stocks | 99.7 |
| Short-Term Investments and Net Other Assets (Liabilities) | 0.3 |
ASSET ALLOCATION (% of Fund's net assets) |
|
| | Common Stocks - 99.7 |
| | Short-Term Investments and Net Other Assets (Liabilities) - 0.3 |
| |
| United States | 91.1 |
| Canada | 2.2 |
| Israel | 1.6 |
| United Kingdom | 1.6 |
| Belgium | 0.9 |
| Puerto Rico | 0.8 |
| Brazil | 0.4 |
| Italy | 0.4 |
| France | 0.3 |
| Others | 0.7 |
GEOGRAPHIC DIVERSIFICATION (% of Fund's net assets) |
|
| | United States - 91.1 |
| | Canada - 2.2 |
| | Israel - 1.6 |
| | United Kingdom - 1.6 |
| | Belgium - 0.9 |
| | Puerto Rico - 0.8 |
| | Brazil - 0.4 |
| | Italy - 0.4 |
| | France - 0.3 |
| | Others - 0.7 |
| |
TOP HOLDINGS(% of Fund's net assets) | | |
| Reinsurance Group of America Inc | 1.5 | |
| US Foods Holding Corp | 1.4 | |
| ITT Inc | 1.4 | |
| Williams-Sonoma Inc | 1.3 | |
| East West Bancorp Inc | 1.3 | |
| Wintrust Financial Corp | 1.3 | |
| Primerica Inc | 1.2 | |
| Performance Food Group Co | 1.2 | |
| AptarGroup Inc | 1.2 | |
| Wix.com Ltd | 1.2 | |
| | 13.0 | |
How has the Fund changed?
This is a summary of certain changes to the Fund since January 1, 2024. For more complete information, you may review the Fund's next prospectus, which we expect to be available by April 30, 2025 at fundresearch.fidelity.com/prospectus/sec or upon request at 1-877-208-0098 or by sending an e-mail to funddocuments@fmr.com.
The fund's transfer agent and pricing & bookkeeping fees were changed to a fixed rate effective December 1, 2023. Effective March 1, 2024, the fund's management contract was amended to incorporate administrative services previously covered under separate services agreements (transfer agent and pricing & bookkeeping). The amended contract incorporates a management fee rate that may vary by class. The Adviser or an affiliate pays certain expenses of managing and operating the fund out of each class's management fee. | |
| Fidelity, the Fidelity Investments Logo and all other Fidelity trademarks or service marks used herein are trademarks or service marks of FMR LLC. Any third-party marks that are used herein are trademarks or service marks of their respective owners. © 2025 FMR LLC. All rights reserved. |
| | For additional information about the Fund; including its prospectus, financial information, holdings and proxy information, scan the QR code or visit fundresearch.fidelity.com/prospectus/sec 1.9914238.100 1466-TSRA-0325 |
| |
| | ANNUAL SHAREHOLDER REPORT | AS OF DECEMBER 31, 2024 | This report describes changes to the Fund that occurred during the reporting period. |
| | VIP Growth Opportunities Portfolio VIP Growth Opportunities Portfolio Service Class true |
| | | |
This annual shareholder report contains information about VIP Growth Opportunities Portfolio for the period January 1, 2024 to December 31, 2024. You can find additional information about the Fund at fundresearch.fidelity.com/prospectus/sec. You can also request this information by contacting us at 1-877-208-0098 or by sending an e-mail to funddocuments@fmr.com.
What were your Fund costs for the last year?(based on hypothetical $10,000 investment)
FUND COST (PREVIOUS YEAR)
| | Costs of a $10,000 investment | Costs paid as a percentage of a $10,000 investment | |
| Service Class | $ 81 | 0.67% | |
What affected the Fund's performance this period?
•U.S. equities gained in 2024, driven by a sturdy economy, the Federal Reserve's long-anticipated pivot to cutting interest rates and the potential for artificial intelligence to drive transformative change.
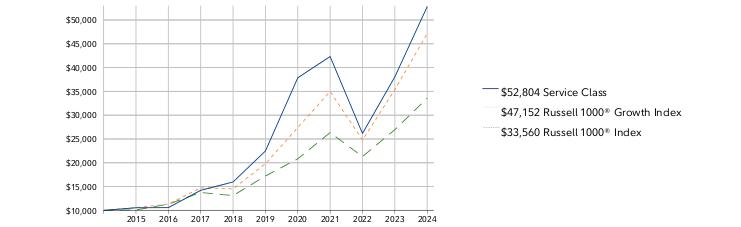
•Against this backdrop, security selection and sector/industry selection contributed in roughly equal measure to the fund's performance versus the Russell 1000 Growth Index for the year, led by information technology. An overweight in communication services, primarily within the media & entertainment industry, also boosted relative performance. Also contributing were security selection and an underweight in consumer discretionary, primarily within the consumer discretionary distribution & retail industry.
•The top individual relative contributor was an overweight in Nvidia (+171%). The stock was the fund's biggest holding. A second notable relative contributor was a non-benchmark stake in Sea (+160%). This period we decreased our investment in Sea. Another notable relative contributor was an overweight in Carvana (+283%).
•In contrast, the biggest detractor from performance versus the benchmark was stock picking in communication services, primarily within the media & entertainment industry. Also hurting our result were stock picks in financials, primarily within the financial services industry, and utilities.
•The biggest individual relative detractor was an overweight in Roku (-19%). This period we increased our position in Roku, which was one of the fund's largest holdings. A second notable relative detractor was a non-benchmark stake in ON Semiconductor (-24%). An overweight in Builders FirstSource (-14%) also detracted. This period we increased our position in Builders FirstSource.
•Notable changes in positioning include decreased exposure to the health care sector and a higher allocation to consumer discretionary.
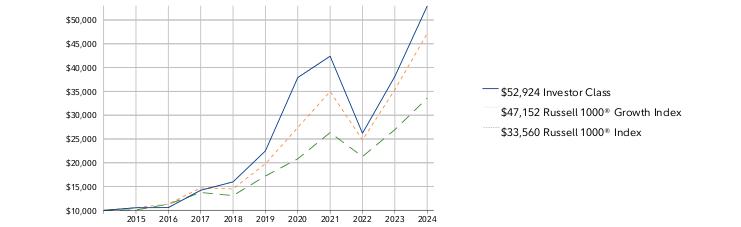
How did the Fund perform over the past 10 years?
CUMULATIVE PERFORMANCE
December 31, 2014 through December 31, 2024.
Initial investment of $10,000.
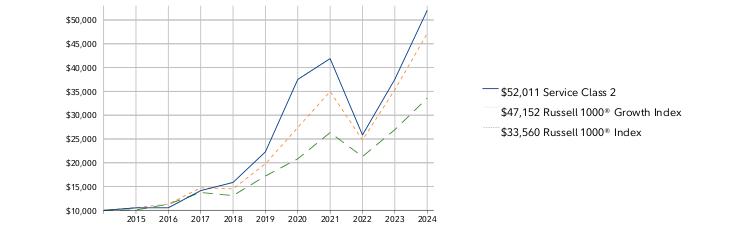
Service Class | $10,000 | $10,548 | $10,578 | $14,212 | $15,966 | $22,464 | $37,850 | $42,327 | $26,153 | $38,055 | $52,804 |
Russell 1000® Growth Index | $10,000 | $10,567 | $11,314 | $14,733 | $14,510 | $19,790 | $27,408 | $34,971 | $24,782 | $35,358 | $47,152 |
Russell 1000® Index | $10,000 | $10,092 | $11,308 | $13,761 | $13,102 | $17,220 | $20,830 | $26,340 | $21,302 | $26,953 | $33,560 |
| | 2014 | 2015 | 2016 | 2017 | 2018 | 2019 | 2020 | 2021 | 2022 | 2023 | 2024 |
AVERAGE ANNUAL TOTAL RETURNS:| | 1 Year | 5 Year | 10 Year |
| Service Class | 38.76% | 18.64% | 18.10% |
| Russell 1000® Growth Index | 33.36% | 18.96% | 16.78% |
| Russell 1000® Index | 24.51% | 14.28% | 12.87% |
Visit institutional.fidelity.com for more recent performance information. |
The Fund's past performance is not a good predictor of the Fund's future performance. The graph and table do not reflect the deduction of taxes that a shareholder would pay on fund distributions or redemption of fund shares. |
Key Fund Statistics(as of December 31, 2024)
KEY FACTS | | |
| Fund Size | $3,885,385,455 | |
| Number of Holdings | 196 | |
| Total Advisory Fee | $19,748,951 | |
| Portfolio Turnover | 58% | |
What did the Fund invest in?
(as of December 31, 2024)
MARKET SECTORS (% of Fund's net assets) | | |
| Information Technology | 47.7 | |
| Communication Services | 21.0 | |
| Consumer Discretionary | 12.5 | |
| Financials | 7.0 | |
| Health Care | 4.8 | |
| Industrials | 4.6 | |
| Consumer Staples | 1.2 | |
| Utilities | 1.0 | |
| Materials | 0.3 | |
| |
| Common Stocks | 97.9 |
| Preferred Stocks | 2.1 |
| Bonds | 0.1 |
| Preferred Securities | 0.0 |
ASSET ALLOCATION (% of Fund's net assets) |
|
| | Common Stocks - 97.9 |
| | Preferred Stocks - 2.1 |
| | Bonds - 0.1 |
| | Preferred Securities - 0.0 |
| Short-Term Investments and Net Other Assets (Liabilities) - (0.1)% |
| |
| United States | 94.0 |
| Taiwan | 1.6 |
| Singapore | 1.4 |
| China | 1.1 |
| Canada | 0.5 |
| Germany | 0.4 |
| India | 0.2 |
| Netherlands | 0.2 |
| United Kingdom | 0.2 |
| Others | 0.4 |
GEOGRAPHIC DIVERSIFICATION (% of Fund's net assets) |
|
| | United States - 94.0 |
| | Taiwan - 1.6 |
| | Singapore - 1.4 |
| | China - 1.1 |
| | Canada - 0.5 |
| | Germany - 0.4 |
| | India - 0.2 |
| | Netherlands - 0.2 |
| | United Kingdom - 0.2 |
| | Others - 0.4 |
| |
TOP HOLDINGS(% of Fund's net assets) | | |
| NVIDIA Corp | 12.8 | |
| Microsoft Corp | 8.2 | |
| Meta Platforms Inc Class A | 6.2 | |
| Amazon.com Inc | 5.6 | |
| Apple Inc | 5.5 | |
| Broadcom Inc | 4.8 | |
| Alphabet Inc Class C | 4.4 | |
| Roku Inc Class A | 3.2 | |
| Tesla Inc | 2.4 | |
| Visa Inc Class A | 2.2 | |
| | 55.3 | |
How has the Fund changed?
This is a summary of certain changes to the Fund since January 1, 2024. For more complete information, you may review the Fund's next prospectus, which we expect to be available by April 30, 2025 at fundresearch.fidelity.com/prospectus/sec or upon request at 1-877-208-0098 or by sending an e-mail to funddocuments@fmr.com.
The fees associated with this class changed during the reporting year. The variations in class fees are primarily the result of the following changes: The fund's transfer agent and pricing & bookkeeping fees were changed to a fixed rate effective December 1, 2023. Effective March 1, 2024, the fund's management contract was amended to incorporate administrative services previously covered under separate services agreements (transfer agent and pricing & bookkeeping). The amended contract incorporates a management fee rate that may vary by class. The Adviser or an affiliate pays certain expenses of managing and operating the fund out of each class's management fee. | |
| Fidelity, the Fidelity Investments Logo and all other Fidelity trademarks or service marks used herein are trademarks or service marks of FMR LLC. Any third-party marks that are used herein are trademarks or service marks of their respective owners. © 2025 FMR LLC. All rights reserved. |
| | For additional information about the Fund; including its prospectus, financial information, holdings and proxy information, scan the QR code or visit fundresearch.fidelity.com/prospectus/sec 1.9914222.100 491-TSRA-0325 |
| |
| | ANNUAL SHAREHOLDER REPORT | AS OF DECEMBER 31, 2024 | This report describes changes to the Fund that occurred during the reporting period. |
| | VIP Growth & Income Portfolio VIP Growth & Income Portfolio Investor Class true |
| | | |
This annual shareholder report contains information about VIP Growth & Income Portfolio for the period January 1, 2024 to December 31, 2024. You can find additional information about the Fund at fundresearch.fidelity.com/prospectus/sec. You can also request this information by contacting us at 1-877-208-0098 or by sending an e-mail to funddocuments@fmr.com.
What were your Fund costs for the last year?(based on hypothetical $10,000 investment)
FUND COST (PREVIOUS YEAR)
| | Costs of a $10,000 investment | Costs paid as a percentage of a $10,000 investment | |
| Investor Class | $ 63 | 0.57% | |
What affected the Fund's performance this period?
•U.S. equities gained in 2024, driven by a sturdy economy, the Federal Reserve's long-anticipated pivot to cutting interest rates and the potential for artificial intelligence to drive transformative change.
•Against this backdrop, market selection was the primary detractor from the fund's performance versus the S&P 500® index for the fiscal year, especially an overweight in energy. Security selection and an underweight in communication services, primarily within the media & entertainment industry, also hampered the fund's result. Also hurting our result was an underweight in information technology, primarily within the semiconductors & semiconductor equipment industry.
•The largest individual relative detractor was an underweight in Nvidia (+171%), which was among the largest holdings. A second notable relative detractor was an overweight in Boeing (-33%). The company was one of the fund's biggest holdings this period. An underweight in Meta Platforms (+66%) also detracted. This was an investment we established this period.
•In contrast, the biggest contributor to performance versus the benchmark was security selection in industrials, primarily within the capital goods industry. Stock picking in health care also boosted relative performance. Also lifting the fund's relative result were stock picks and an overweight in financials, primarily within the banks industry.
•The top individual relative contributor was an overweight in GE Aerospace (+66%). The company was one of the fund's biggest holdings. A second notable relative contributor was an overweight in GE Vernova (+127%). This was an investment we established this period. The company also was among our biggest holdings at period end. An overweight in Wells Fargo (+43%) also helped. The company, too, was a sizable holding.
•Notable changes in positioning include a higher allocation to information technology.
How did the Fund perform over the past 10 years?
CUMULATIVE PERFORMANCE
December 31, 2014 through December 31, 2024.
Initial investment of $10,000.
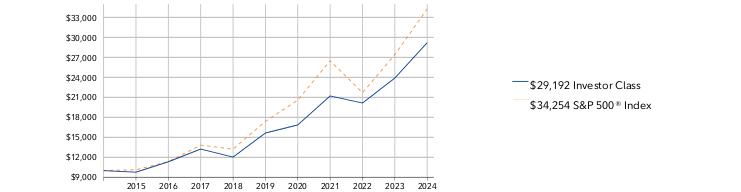
Investor Class | $10,000 | $9,768 | $11,327 | $13,233 | $12,035 | $15,642 | $16,856 | $21,204 | $20,143 | $23,893 | $29,192 |
S&P 500® Index | $10,000 | $10,138 | $11,351 | $13,829 | $13,223 | $17,386 | $20,585 | $26,494 | $21,696 | $27,399 | $34,254 |
| | 2014 | 2015 | 2016 | 2017 | 2018 | 2019 | 2020 | 2021 | 2022 | 2023 | 2024 |
AVERAGE ANNUAL TOTAL RETURNS:| | 1 Year | 5 Year | 10 Year |
| Investor Class | 22.18% | 13.29% | 11.31% |
| S&P 500® Index | 25.02% | 14.53% | 13.10% |
Visit institutional.fidelity.com for more recent performance information. |
The Fund's past performance is not a good predictor of the Fund's future performance. The graph and table do not reflect the deduction of taxes that a shareholder would pay on fund distributions or redemption of fund shares. |
Key Fund Statistics(as of December 31, 2024)
KEY FACTS | | |
| Fund Size | $2,444,208,883 | |
| Number of Holdings | 177 | |
| Total Advisory Fee | $11,224,574 | |
| Portfolio Turnover | 14% | |
What did the Fund invest in?
(as of December 31, 2024)
MARKET SECTORS (% of Fund's net assets) | | |
| Information Technology | 23.4 | |
| Financials | 20.2 | |
| Industrials | 16.4 | |
| Health Care | 11.0 | |
| Energy | 8.9 | |
| Consumer Staples | 5.9 | |
| Communication Services | 4.5 | |
| Utilities | 2.4 | |
| Consumer Discretionary | 2.0 | |
| Real Estate | 1.2 | |
| Materials | 1.1 | |
| |
| Common Stocks | 96.0 |
| Preferred Stocks | 0.9 |
| Bonds | 0.1 |
| Short-Term Investments and Net Other Assets (Liabilities) | 3.0 |
ASSET ALLOCATION (% of Fund's net assets) |
|
| | Common Stocks - 96.0 |
| | Preferred Stocks - 0.9 |
| | Bonds - 0.1 |
| | Short-Term Investments and Net Other Assets (Liabilities) - 3.0 |
| |
| United States | 91.0 |
| Canada | 1.5 |
| Germany | 1.5 |
| United Kingdom | 1.2 |
| Netherlands | 1.0 |
| Belgium | 0.9 |
| France | 0.8 |
| Zambia | 0.7 |
| Taiwan | 0.6 |
| Others | 0.8 |
GEOGRAPHIC DIVERSIFICATION (% of Fund's net assets) |
|
| | United States - 91.0 |
| | Canada - 1.5 |
| | Germany - 1.5 |
| | United Kingdom - 1.2 |
| | Netherlands - 1.0 |
| | Belgium - 0.9 |
| | France - 0.8 |
| | Zambia - 0.7 |
| | Taiwan - 0.6 |
| | Others - 0.8 |
| |
TOP HOLDINGS(% of Fund's net assets) | | |
| Microsoft Corp | 7.5 | |
| Wells Fargo & Co | 6.5 | |
| Exxon Mobil Corp | 5.8 | |
| GE Aerospace | 4.6 | |
| NVIDIA Corp | 4.1 | |
| Apple Inc | 3.2 | |
| Bank of America Corp | 2.9 | |
| Visa Inc Class A | 2.3 | |
| GE Vernova Inc | 2.2 | |
| UnitedHealth Group Inc | 1.8 | |
| | 40.9 | |
How has the Fund changed?
This is a summary of certain changes to the Fund since January 1, 2024. For more complete information, you may review the Fund's next prospectus, which we expect to be available by April 30, 2025 at fundresearch.fidelity.com/prospectus/sec or upon request at 1-877-208-0098 or by sending an e-mail to funddocuments@fmr.com.
The fund's transfer agent and pricing & bookkeeping fees were changed to a fixed rate effective December 1, 2023. Effective March 1, 2024, the fund's management contract was amended to incorporate administrative services previously covered under separate services agreements (transfer agent and pricing & bookkeeping). The amended contract incorporates a management fee rate that may vary by class. The Adviser or an affiliate pays certain expenses of managing and operating the fund out of each class's management fee. | |
| Fidelity, the Fidelity Investments Logo and all other Fidelity trademarks or service marks used herein are trademarks or service marks of FMR LLC. Any third-party marks that are used herein are trademarks or service marks of their respective owners. © 2025 FMR LLC. All rights reserved. |
| | For additional information about the Fund; including its prospectus, financial information, holdings and proxy information, scan the QR code or visit fundresearch.fidelity.com/prospectus/sec 1.9914146.100 1464-TSRA-0325 |
| |
| | ANNUAL SHAREHOLDER REPORT | AS OF DECEMBER 31, 2024 | This report describes changes to the Fund that occurred during the reporting period. |
| | VIP Dynamic Capital Appreciation Portfolio VIP Dynamic Capital Appreciation Portfolio Service Class 2 true |
| | | |
This annual shareholder report contains information about VIP Dynamic Capital Appreciation Portfolio for the period January 1, 2024 to December 31, 2024. You can find additional information about the Fund at fundresearch.fidelity.com/prospectus/sec. You can also request this information by contacting us at 1-877-208-0098 or by sending an e-mail to funddocuments@fmr.com.
What were your Fund costs for the last year?(based on hypothetical $10,000 investment)
FUND COST (PREVIOUS YEAR)
| | Costs of a $10,000 investment | Costs paid as a percentage of a $10,000 investment | |
| Service Class 2 | $ 98 | 0.87% | |
What affected the Fund's performance this period?
•U.S. equities gained in 2024, driven by a sturdy economy, the Federal Reserve's long-anticipated pivot to cutting interest rates and the potential for artificial intelligence to drive transformative change.
•Against this backdrop, security selection was the primary contributor to the fund's performance versus the S&P 500® index for the fiscal year, led by health care. Security selection in industrials, primarily within the capital goods industry, and information technology also boosted the fund's relative result.
•The top individual relative contributor was an overweight in Nvidia (+174%). The stock was the fund's biggest holding at period end. A second notable relative contributor was an overweight in GE Vernova (+137%). This was an investment we established this period. The company was one of the fund's largest holdings at period end. An overweight in Boston Scientific (+54%) also helped. The company was among the fund's largest holdings.
•In contrast, the biggest detractor from performance versus the benchmark was stock picking in consumer discretionary. An overweight in health care also hampered the fund's result, as did our picks and an underweight in communication services, primarily within the media & entertainment industry.
•Not owning Broadcom, a benchmark component that gained about 110%, was the biggest individual relative detractor. A non-benchmark stake in MongoDB returned approximately -39% and was the second-largest relative detractor. The stock was not held at period end. Not owning Tesla, a benchmark component that gained about 63%, also hurt.
•Notable changes in positioning include higher allocations to the consumer discretionary and financials sectors.
How did the Fund perform over the past 10 years?
CUMULATIVE PERFORMANCE
December 31, 2014 through December 31, 2024.
Initial investment of $10,000.
Service Class 2 | $10,000 | $10,102 | $10,371 | $12,808 | $12,147 | $15,769 | $21,026 | $26,129 | $20,629 | $26,555 | $33,245 |
S&P 500® Index | $10,000 | $10,138 | $11,351 | $13,829 | $13,223 | $17,386 | $20,585 | $26,494 | $21,696 | $27,399 | $34,254 |
| | 2014 | 2015 | 2016 | 2017 | 2018 | 2019 | 2020 | 2021 | 2022 | 2023 | 2024 |
AVERAGE ANNUAL TOTAL RETURNS:| | 1 Year | 5 Year | 10 Year |
| Service Class 2 | 25.19% | 16.09% | 12.76% |
| S&P 500® Index | 25.02% | 14.53% | 13.10% |
Visit institutional.fidelity.com for more recent performance information. |
The Fund's past performance is not a good predictor of the Fund's future performance. The graph and table do not reflect the deduction of taxes that a shareholder would pay on fund distributions or redemption of fund shares. |
Key Fund Statistics(as of December 31, 2024)
KEY FACTS | | |
| Fund Size | $279,787,748 | |
| Number of Holdings | 146 | |
| Total Advisory Fee | $1,666,387 | |
| Portfolio Turnover | 61% | |
What did the Fund invest in?
(as of December 31, 2024)
MARKET SECTORS (% of Fund's net assets) | | |
| Information Technology | 28.5 | |
| Health Care | 17.2 | |
| Financials | 13.2 | |
| Consumer Discretionary | 12.7 | |
| Industrials | 12.2 | |
| Communication Services | 7.5 | |
| Energy | 2.8 | |
| Materials | 2.6 | |
| Consumer Staples | 2.4 | |
| Real Estate | 0.8 | |
| |
| Common Stocks | 99.6 |
| Preferred Stocks | 0.3 |
| Preferred Securities | 0.0 |
| Bonds | 0.0 |
| Short-Term Investments and Net Other Assets (Liabilities) | 0.1 |
ASSET ALLOCATION (% of Fund's net assets) |
|
| | Common Stocks - 99.6 |
| | Preferred Stocks - 0.3 |
| | Preferred Securities - 0.0 |
| | Bonds - 0.0 |
| | Short-Term Investments and Net Other Assets (Liabilities) - 0.1 |
| |
| United States | 89.8 |
| China | 2.5 |
| Taiwan | 2.1 |
| Canada | 1.5 |
| Brazil | 0.9 |
| Israel | 0.8 |
| Belgium | 0.7 |
| Netherlands | 0.7 |
| Germany | 0.4 |
| Others | 0.6 |
GEOGRAPHIC DIVERSIFICATION (% of Fund's net assets) |
|
| | United States - 89.8 |
| | China - 2.5 |
| | Taiwan - 2.1 |
| | Canada - 1.5 |
| | Brazil - 0.9 |
| | Israel - 0.8 |
| | Belgium - 0.7 |
| | Netherlands - 0.7 |
| | Germany - 0.4 |
| | Others - 0.6 |
| |
TOP HOLDINGS(% of Fund's net assets) | | |
| NVIDIA Corp | 8.7 | |
| Apple Inc | 7.2 | |
| Amazon.com Inc | 5.2 | |
| Microsoft Corp | 4.5 | |
| Boston Scientific Corp | 3.1 | |
| Alphabet Inc Class A | 3.0 | |
| Mastercard Inc Class A | 2.8 | |
| Taiwan Semiconductor Manufacturing Co Ltd ADR | 2.0 | |
| Alphabet Inc Class C | 1.7 | |
| GE Vernova Inc | 1.6 | |
| | 39.8 | |
How has the Fund changed?
This is a summary of certain changes to the Fund since January 1, 2024. For more complete information, you may review the Fund's next prospectus, which we expect to be available by April 30, 2025 at fundresearch.fidelity.com/prospectus/sec or upon request at 1-877-208-0098 or by sending an e-mail to funddocuments@fmr.com.
The fund's transfer agent and pricing & bookkeeping fees were changed to a fixed rate effective December 1, 2023. Effective March 1, 2024, the fund's management contract was amended to incorporate administrative services previously covered under separate services agreements (transfer agent and pricing & bookkeeping). The amended contract incorporates a management fee rate that may vary by class. The Adviser or an affiliate pays certain expenses of managing and operating the fund out of each class's management fee. | |
| Fidelity, the Fidelity Investments Logo and all other Fidelity trademarks or service marks used herein are trademarks or service marks of FMR LLC. Any third-party marks that are used herein are trademarks or service marks of their respective owners. © 2025 FMR LLC. All rights reserved. |
| | For additional information about the Fund; including its prospectus, financial information, holdings and proxy information, scan the QR code or visit fundresearch.fidelity.com/prospectus/sec 1.9914208.100 971-TSRA-0325 |
| |
| | ANNUAL SHAREHOLDER REPORT | AS OF DECEMBER 31, 2024 | This report describes changes to the Fund that occurred during the reporting period. |
| | VIP Balanced Portfolio VIP Balanced Portfolio Service Class true |
| | | |
This annual shareholder report contains information about VIP Balanced Portfolio for the period January 1, 2024 to December 31, 2024. You can find additional information about the Fund at fundresearch.fidelity.com/prospectus/sec. You can also request this information by contacting us at 1-877-208-0098 or by sending an e-mail to funddocuments@fmr.com.
What were your Fund costs for the last year?(based on hypothetical $10,000 investment)
FUND COST (PREVIOUS YEAR)
| | Costs of a $10,000 investment | Costs paid as a percentage of a $10,000 investment | |
| Service Class | $ 57 | 0.52% | |
What affected the Fund's performance this period?
•U.S. equities posted a strong gain for the 12 months ending December 31, 2024, driven by a sturdy economy, the Federal Reserve's long-anticipated pivot to cutting interest rates and the potential for artificial intelligence to drive transformative change. On the other hand, U.S. taxable investment-grade bonds finished the year with a low single-digit gain, as the bond market reflected both three interest-rate reductions by the Fed and meaningful increases in U.S. Treasury yields.
•Against this backdrop, asset allocation - overweighting stocks and underweighting investment-grade bonds - meaningfully contributed to the fund's performance versus the Fidelity Balanced 60/40 Composite Index for the year. Investment choices in the bond subportfolio also helped the fund's relative result.
•Among stocks, picks in the health care and industrials sectors stood out as relative contributors. The top individual contributor was an overweight in Nvidia (+169%). We trimmed exposure to Nvidia, making it the fund's No. 2 holding as of December 31.
•Elsewhere, avoiding weak-performing index component Intel (-60%) boosted the fund's relative result. A non-Composite stake in UCB (+119%) - a new position in the equity subportfolio this period - further contributed.
•Conversely, security selection and an underweight in the information technology sector notably detracted from relative performance for the 12 months. Investment choices in consumer discretionary and communication services also hurt.
•Mostly avoiding Broadcom (+110%), where we established a position this period, detracted the most on a relative basis, followed by an overweight in Adobe (-25%) and SolarEdge Technologies (-85%). We trimmed our positions in both Adobe and SolarEdge this period.
•In fixed income, the fund notably benefited from exposure to asset-backed securities, including collateralized loan obligations, while the fund's yield-curve positioning modestly detracted for the year.
How did the Fund perform over the past 10 years?
CUMULATIVE PERFORMANCE
December 31, 2014 through December 31, 2024.
Initial investment of $10,000.
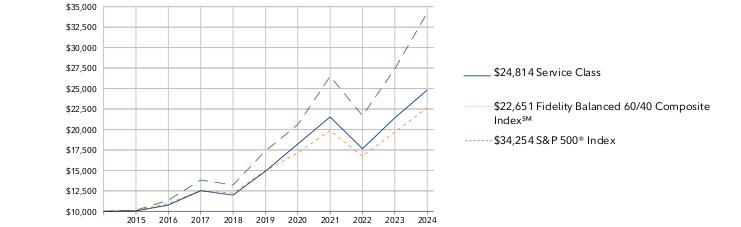
Service Class | $10,000 | $10,051 | $10,770 | $12,520 | $11,985 | $14,898 | $18,224 | $21,527 | $17,647 | $21,423 | $24,814 |
Fidelity Balanced 60/40 Composite Index℠ | $10,000 | $10,128 | $10,970 | $12,529 | $12,235 | $14,948 | $17,150 | $19,869 | $16,732 | $19,689 | $22,651 |
S&P 500® Index | $10,000 | $10,138 | $11,351 | $13,829 | $13,223 | $17,386 | $20,585 | $26,494 | $21,696 | $27,399 | $34,254 |
| | 2014 | 2015 | 2016 | 2017 | 2018 | 2019 | 2020 | 2021 | 2022 | 2023 | 2024 |
AVERAGE ANNUAL TOTAL RETURNS:| | 1 Year | 5 Year | 10 Year |
| Service Class | 15.83% | 10.74% | 9.51% |
| Fidelity Balanced 60/40 Composite Index℠ | 15.04% | 8.67% | 8.52% |
| S&P 500® Index | 25.02% | 14.53% | 13.10% |
Visit institutional.fidelity.com for more recent performance information. |
The Fund's past performance is not a good predictor of the Fund's future performance. The graph and table do not reflect the deduction of taxes that a shareholder would pay on fund distributions or redemption of fund shares. |
Key Fund Statistics(as of December 31, 2024)
KEY FACTS | | |
| Fund Size | $7,634,971,647 | |
| Number of Holdings | 332 | |
| Total Advisory Fee | $32,367,968 | |
| Portfolio Turnover | 33% | |
What did the Fund invest in?
(as of December 31, 2024)
The information in the following tables is based on the combined Investments of the Fund and it's pro-rata share of investments in Fidelity's Central Funds, other than the Commodity Strategy and Money Market Central Funds as applicable.
| U.S. Government and U.S. Government Agency Obligations | 22.3 |
| AAA | 2.4 |
| AA | 0.2 |
| A | 2.7 |
| BBB | 5.5 |
| BB | 0.6 |
| B | 0.3 |
| Not Rated | 0.4 |
| Equities | 65.4 |
| Short-Term Investments and Net Other Assets (Liabilities) | 0.2 |
QUALITY DIVERSIFICATION (% of Fund's net assets) |
| |
| | U.S. Government and U.S. Government Agency Obligations - 22.3 |
| | AAA - 2.4 |
| | AA - 0.2 |
| | A - 2.7 |
| | BBB - 5.5 |
| | BB - 0.6 |
| | B - 0.3 |
| | Not Rated - 0.4 |
| | Equities - 65.4 |
| | Short-Term Investments and Net Other Assets (Liabilities) - 0.2 |
| |
| We have used ratings from Moody's Investors Service, Inc. Where Moody's® ratings are not available, we have used S&P® ratings. All ratings are as of the date indicated and do not reflect subsequent changes. |
MARKET SECTORS (% of Fund's net assets) | | |
| Information Technology | 21.2 | |
| Financials | 13.3 | |
| Consumer Discretionary | 7.4 | |
| Communication Services | 7.3 | |
| Health Care | 7.1 | |
| Industrials | 5.6 | |
| Consumer Staples | 3.6 | |
| Energy | 3.0 | |
| Real Estate | 2.2 | |
| Utilities | 1.9 | |
| Materials | 1.1 | |
| |
| Common Stocks | 65.2 |
| Bonds | 34.4 |
| Preferred Stocks | 0.2 |
| Short-Term Investments and Net Other Assets (Liabilities) | 0.2 |
ASSET ALLOCATION (% of Fund's net assets) |
|
| | Common Stocks - 65.2 |
| | Bonds - 34.4 |
| | Preferred Stocks - 0.2 |
| | Short-Term Investments and Net Other Assets (Liabilities) - 0.2 |
| |
TOP HOLDINGS(% of Fund's net assets) | | |
| US Treasury Notes | 12.5 | |
| Apple Inc | 5.3 | |
| NVIDIA Corp | 4.9 | |
| Microsoft Corp | 4.7 | |
| US Treasury Bonds | 3.8 | |
| Alphabet Inc Class A | 3.3 | |
| Amazon.com Inc | 3.1 | |
| Fannie Mae Mortgage pass-thru certificates | 2.2 | |
| Meta Platforms Inc Class A | 1.8 | |
| Ginnie Mae II Pool | 1.7 | |
| | 43.3 | |
How has the Fund changed?
This is a summary of certain changes to the Fund since January 1, 2024. For more complete information, you may review the Fund's next prospectus, which we expect to be available by April 30, 2025 at fundresearch.fidelity.com/prospectus/sec or upon request at 1-877-208-0098 or by sending an e-mail to funddocuments@fmr.com.
The fees associated with this class changed during the reporting year. The variations in class fees are primarily the result of the following changes: The fund's transfer agent and pricing & bookkeeping fees were changed to a fixed rate effective December 1, 2023. Effective March 1, 2024, the fund's management contract was amended to incorporate administrative services previously covered under separate services agreements (transfer agent and pricing & bookkeeping). The amended contract incorporates a management fee rate that may vary by class. The Adviser or an affiliate pays certain expenses of managing and operating the fund out of each class's management fee. | |
| Fidelity, the Fidelity Investments Logo and all other Fidelity trademarks or service marks used herein are trademarks or service marks of FMR LLC. Any third-party marks that are used herein are trademarks or service marks of their respective owners. © 2025 FMR LLC. All rights reserved. |
| | For additional information about the Fund; including its prospectus, financial information, holdings and proxy information, scan the QR code or visit fundresearch.fidelity.com/prospectus/sec 1.9914218.100 469-TSRA-0325 |
| |
| | ANNUAL SHAREHOLDER REPORT | AS OF DECEMBER 31, 2024 | This report describes changes to the Fund that occurred during the reporting period. |
| | VIP Balanced Portfolio VIP Balanced Portfolio Service Class 2 true |
| | | |
This annual shareholder report contains information about VIP Balanced Portfolio for the period January 1, 2024 to December 31, 2024. You can find additional information about the Fund at fundresearch.fidelity.com/prospectus/sec. You can also request this information by contacting us at 1-877-208-0098 or by sending an e-mail to funddocuments@fmr.com.
What were your Fund costs for the last year?(based on hypothetical $10,000 investment)
FUND COST (PREVIOUS YEAR)
| | Costs of a $10,000 investment | Costs paid as a percentage of a $10,000 investment | |
| Service Class 2 | $ 73 | 0.67% | |
What affected the Fund's performance this period?
•U.S. equities posted a strong gain for the 12 months ending December 31, 2024, driven by a sturdy economy, the Federal Reserve's long-anticipated pivot to cutting interest rates and the potential for artificial intelligence to drive transformative change. On the other hand, U.S. taxable investment-grade bonds finished the year with a low single-digit gain, as the bond market reflected both three interest-rate reductions by the Fed and meaningful increases in U.S. Treasury yields.
•Against this backdrop, asset allocation - overweighting stocks and underweighting investment-grade bonds - meaningfully contributed to the fund's performance versus the Fidelity Balanced 60/40 Composite Index for the year. Investment choices in the bond subportfolio also helped the fund's relative result.
•Among stocks, picks in the health care and industrials sectors stood out as relative contributors. The top individual contributor was an overweight in Nvidia (+169%). We trimmed exposure to Nvidia, making it the fund's No. 2 holding as of December 31.
•Elsewhere, avoiding weak-performing index component Intel (-60%) boosted the fund's relative result. A non-Composite stake in UCB (+119%) - a new position in the equity subportfolio this period - further contributed.
•Conversely, security selection and an underweight in the information technology sector notably detracted from relative performance for the 12 months. Investment choices in consumer discretionary and communication services also hurt.
•Mostly avoiding Broadcom (+110%), where we established a position this period, detracted the most on a relative basis, followed by an overweight in Adobe (-25%) and SolarEdge Technologies (-85%). We trimmed our positions in both Adobe and SolarEdge this period.
•In fixed income, the fund notably benefited from exposure to asset-backed securities, including collateralized loan obligations, while the fund's yield-curve positioning modestly detracted for the year.
How did the Fund perform over the past 10 years?
CUMULATIVE PERFORMANCE
December 31, 2014 through December 31, 2024.
Initial investment of $10,000.
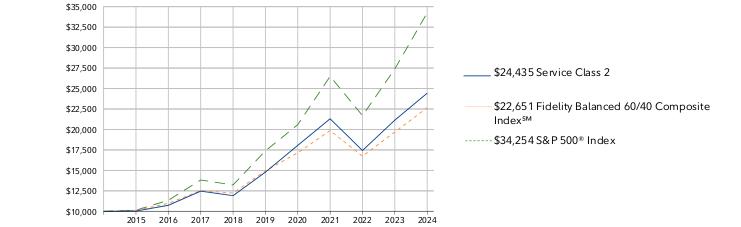
Service Class 2 | $10,000 | $10,036 | $10,736 | $12,467 | $11,913 | $14,786 | $18,057 | $21,306 | $17,431 | $21,142 | $24,435 |
Fidelity Balanced 60/40 Composite Index℠ | $10,000 | $10,128 | $10,970 | $12,529 | $12,235 | $14,948 | $17,150 | $19,869 | $16,732 | $19,689 | $22,651 |
S&P 500® Index | $10,000 | $10,138 | $11,351 | $13,829 | $13,223 | $17,386 | $20,585 | $26,494 | $21,696 | $27,399 | $34,254 |
| | 2014 | 2015 | 2016 | 2017 | 2018 | 2019 | 2020 | 2021 | 2022 | 2023 | 2024 |
AVERAGE ANNUAL TOTAL RETURNS:| | 1 Year | 5 Year | 10 Year |
| Service Class 2 | 15.58% | 10.57% | 9.35% |
| Fidelity Balanced 60/40 Composite Index℠ | 15.04% | 8.67% | 8.52% |
| S&P 500® Index | 25.02% | 14.53% | 13.10% |
Visit institutional.fidelity.com for more recent performance information. |
The Fund's past performance is not a good predictor of the Fund's future performance. The graph and table do not reflect the deduction of taxes that a shareholder would pay on fund distributions or redemption of fund shares. |
Key Fund Statistics(as of December 31, 2024)
KEY FACTS | | |
| Fund Size | $7,634,971,647 | |
| Number of Holdings | 332 | |
| Total Advisory Fee | $32,367,968 | |
| Portfolio Turnover | 33% | |
What did the Fund invest in?
(as of December 31, 2024)
The information in the following tables is based on the combined Investments of the Fund and it's pro-rata share of investments in Fidelity's Central Funds, other than the Commodity Strategy and Money Market Central Funds as applicable.
| U.S. Government and U.S. Government Agency Obligations | 22.3 |
| AAA | 2.4 |
| AA | 0.2 |
| A | 2.7 |
| BBB | 5.5 |
| BB | 0.6 |
| B | 0.3 |
| Not Rated | 0.4 |
| Equities | 65.4 |
| Short-Term Investments and Net Other Assets (Liabilities) | 0.2 |
QUALITY DIVERSIFICATION (% of Fund's net assets) |
| |
| | U.S. Government and U.S. Government Agency Obligations - 22.3 |
| | AAA - 2.4 |
| | AA - 0.2 |
| | A - 2.7 |
| | BBB - 5.5 |
| | BB - 0.6 |
| | B - 0.3 |
| | Not Rated - 0.4 |
| | Equities - 65.4 |
| | Short-Term Investments and Net Other Assets (Liabilities) - 0.2 |
| |
| We have used ratings from Moody's Investors Service, Inc. Where Moody's® ratings are not available, we have used S&P® ratings. All ratings are as of the date indicated and do not reflect subsequent changes. |
MARKET SECTORS (% of Fund's net assets) | | |
| Information Technology | 21.2 | |
| Financials | 13.3 | |
| Consumer Discretionary | 7.4 | |
| Communication Services | 7.3 | |
| Health Care | 7.1 | |
| Industrials | 5.6 | |
| Consumer Staples | 3.6 | |
| Energy | 3.0 | |
| Real Estate | 2.2 | |
| Utilities | 1.9 | |
| Materials | 1.1 | |
| |
| Common Stocks | 65.2 |
| Bonds | 34.4 |
| Preferred Stocks | 0.2 |
| Short-Term Investments and Net Other Assets (Liabilities) | 0.2 |
ASSET ALLOCATION (% of Fund's net assets) |
|
| | Common Stocks - 65.2 |
| | Bonds - 34.4 |
| | Preferred Stocks - 0.2 |
| | Short-Term Investments and Net Other Assets (Liabilities) - 0.2 |
| |
TOP HOLDINGS(% of Fund's net assets) | | |
| US Treasury Notes | 12.5 | |
| Apple Inc | 5.3 | |
| NVIDIA Corp | 4.9 | |
| Microsoft Corp | 4.7 | |
| US Treasury Bonds | 3.8 | |
| Alphabet Inc Class A | 3.3 | |
| Amazon.com Inc | 3.1 | |
| Fannie Mae Mortgage pass-thru certificates | 2.2 | |
| Meta Platforms Inc Class A | 1.8 | |
| Ginnie Mae II Pool | 1.7 | |
| | 43.3 | |
How has the Fund changed?
This is a summary of certain changes to the Fund since January 1, 2024. For more complete information, you may review the Fund's next prospectus, which we expect to be available by April 30, 2025 at fundresearch.fidelity.com/prospectus/sec or upon request at 1-877-208-0098 or by sending an e-mail to funddocuments@fmr.com.
The fees associated with this class changed during the reporting year. The variations in class fees are primarily the result of the following changes: The fund's transfer agent and pricing & bookkeeping fees were changed to a fixed rate effective December 1, 2023. Effective March 1, 2024, the fund's management contract was amended to incorporate administrative services previously covered under separate services agreements (transfer agent and pricing & bookkeeping). The amended contract incorporates a management fee rate that may vary by class. The Adviser or an affiliate pays certain expenses of managing and operating the fund out of each class's management fee. | |
| Fidelity, the Fidelity Investments Logo and all other Fidelity trademarks or service marks used herein are trademarks or service marks of FMR LLC. Any third-party marks that are used herein are trademarks or service marks of their respective owners. © 2025 FMR LLC. All rights reserved. |
| | For additional information about the Fund; including its prospectus, financial information, holdings and proxy information, scan the QR code or visit fundresearch.fidelity.com/prospectus/sec 1.9914217.100 380-TSRA-0325 |
| |
| | ANNUAL SHAREHOLDER REPORT | AS OF DECEMBER 31, 2024 | This report describes changes to the Fund that occurred during the reporting period. |
| | VIP Growth Opportunities Portfolio VIP Growth Opportunities Portfolio Service Class 2 true |
| | | |
This annual shareholder report contains information about VIP Growth Opportunities Portfolio for the period January 1, 2024 to December 31, 2024. You can find additional information about the Fund at fundresearch.fidelity.com/prospectus/sec. You can also request this information by contacting us at 1-877-208-0098 or by sending an e-mail to funddocuments@fmr.com.
What were your Fund costs for the last year?(based on hypothetical $10,000 investment)
FUND COST (PREVIOUS YEAR)
| | Costs of a $10,000 investment | Costs paid as a percentage of a $10,000 investment | |
| Service Class 2 | $ 98 | 0.82% | |
What affected the Fund's performance this period?
•U.S. equities gained in 2024, driven by a sturdy economy, the Federal Reserve's long-anticipated pivot to cutting interest rates and the potential for artificial intelligence to drive transformative change.
•Against this backdrop, security selection and sector/industry selection contributed in roughly equal measure to the fund's performance versus the Russell 1000 Growth Index for the year, led by information technology. An overweight in communication services, primarily within the media & entertainment industry, also boosted relative performance. Also contributing were security selection and an underweight in consumer discretionary, primarily within the consumer discretionary distribution & retail industry.
•The top individual relative contributor was an overweight in Nvidia (+171%). The stock was the fund's biggest holding. A second notable relative contributor was a non-benchmark stake in Sea (+160%). This period we decreased our investment in Sea. Another notable relative contributor was an overweight in Carvana (+283%).
•In contrast, the biggest detractor from performance versus the benchmark was stock picking in communication services, primarily within the media & entertainment industry. Also hurting our result were stock picks in financials, primarily within the financial services industry, and utilities.
•The biggest individual relative detractor was an overweight in Roku (-19%). This period we increased our position in Roku, which was one of the fund's largest holdings. A second notable relative detractor was a non-benchmark stake in ON Semiconductor (-24%). An overweight in Builders FirstSource (-14%) also detracted. This period we increased our position in Builders FirstSource.
•Notable changes in positioning include decreased exposure to the health care sector and a higher allocation to consumer discretionary.
How did the Fund perform over the past 10 years?
CUMULATIVE PERFORMANCE
December 31, 2014 through December 31, 2024.
Initial investment of $10,000.
Service Class 2 | $10,000 | $10,534 | $10,544 | $14,147 | $15,870 | $22,297 | $37,505 | $41,887 | $25,837 | $37,542 | $52,011 |
Russell 1000® Growth Index | $10,000 | $10,567 | $11,314 | $14,733 | $14,510 | $19,790 | $27,408 | $34,971 | $24,782 | $35,358 | $47,152 |
Russell 1000® Index | $10,000 | $10,092 | $11,308 | $13,761 | $13,102 | $17,220 | $20,830 | $26,340 | $21,302 | $26,953 | $33,560 |
| | 2014 | 2015 | 2016 | 2017 | 2018 | 2019 | 2020 | 2021 | 2022 | 2023 | 2024 |
AVERAGE ANNUAL TOTAL RETURNS:| | 1 Year | 5 Year | 10 Year |
| Service Class 2 | 38.54% | 18.46% | 17.93% |
| Russell 1000® Growth Index | 33.36% | 18.96% | 16.78% |
| Russell 1000® Index | 24.51% | 14.28% | 12.87% |
Visit institutional.fidelity.com for more recent performance information. |
The Fund's past performance is not a good predictor of the Fund's future performance. The graph and table do not reflect the deduction of taxes that a shareholder would pay on fund distributions or redemption of fund shares. |
Key Fund Statistics(as of December 31, 2024)
KEY FACTS | | |
| Fund Size | $3,885,385,455 | |
| Number of Holdings | 196 | |
| Total Advisory Fee | $19,748,951 | |
| Portfolio Turnover | 58% | |
What did the Fund invest in?
(as of December 31, 2024)
MARKET SECTORS (% of Fund's net assets) | | |
| Information Technology | 47.7 | |
| Communication Services | 21.0 | |
| Consumer Discretionary | 12.5 | |
| Financials | 7.0 | |
| Health Care | 4.8 | |
| Industrials | 4.6 | |
| Consumer Staples | 1.2 | |
| Utilities | 1.0 | |
| Materials | 0.3 | |
| |
| Common Stocks | 97.9 |
| Preferred Stocks | 2.1 |
| Bonds | 0.1 |
| Preferred Securities | 0.0 |
ASSET ALLOCATION (% of Fund's net assets) |
|
| | Common Stocks - 97.9 |
| | Preferred Stocks - 2.1 |
| | Bonds - 0.1 |
| | Preferred Securities - 0.0 |
| Short-Term Investments and Net Other Assets (Liabilities) - (0.1)% |
| |
| United States | 94.0 |
| Taiwan | 1.6 |
| Singapore | 1.4 |
| China | 1.1 |
| Canada | 0.5 |
| Germany | 0.4 |
| India | 0.2 |
| Netherlands | 0.2 |
| United Kingdom | 0.2 |
| Others | 0.4 |
GEOGRAPHIC DIVERSIFICATION (% of Fund's net assets) |
|
| | United States - 94.0 |
| | Taiwan - 1.6 |
| | Singapore - 1.4 |
| | China - 1.1 |
| | Canada - 0.5 |
| | Germany - 0.4 |
| | India - 0.2 |
| | Netherlands - 0.2 |
| | United Kingdom - 0.2 |
| | Others - 0.4 |
| |
TOP HOLDINGS(% of Fund's net assets) | | |
| NVIDIA Corp | 12.8 | |
| Microsoft Corp | 8.2 | |
| Meta Platforms Inc Class A | 6.2 | |
| Amazon.com Inc | 5.6 | |
| Apple Inc | 5.5 | |
| Broadcom Inc | 4.8 | |
| Alphabet Inc Class C | 4.4 | |
| Roku Inc Class A | 3.2 | |
| Tesla Inc | 2.4 | |
| Visa Inc Class A | 2.2 | |
| | 55.3 | |
How has the Fund changed?
This is a summary of certain changes to the Fund since January 1, 2024. For more complete information, you may review the Fund's next prospectus, which we expect to be available by April 30, 2025 at fundresearch.fidelity.com/prospectus/sec or upon request at 1-877-208-0098 or by sending an e-mail to funddocuments@fmr.com.
The fund's transfer agent and pricing & bookkeeping fees were changed to a fixed rate effective December 1, 2023. Effective March 1, 2024, the fund's management contract was amended to incorporate administrative services previously covered under separate services agreements (transfer agent and pricing & bookkeeping). The amended contract incorporates a management fee rate that may vary by class. The Adviser or an affiliate pays certain expenses of managing and operating the fund out of each class's management fee. | |
| Fidelity, the Fidelity Investments Logo and all other Fidelity trademarks or service marks used herein are trademarks or service marks of FMR LLC. Any third-party marks that are used herein are trademarks or service marks of their respective owners. © 2025 FMR LLC. All rights reserved. |
| | For additional information about the Fund; including its prospectus, financial information, holdings and proxy information, scan the QR code or visit fundresearch.fidelity.com/prospectus/sec 1.9914221.100 385-TSRA-0325 |
| |
| | ANNUAL SHAREHOLDER REPORT | AS OF DECEMBER 31, 2024 | This report describes changes to the Fund that occurred during the reporting period. |
| | VIP Mid Cap Portfolio VIP Mid Cap Portfolio Initial Class true |
| | | |
This annual shareholder report contains information about VIP Mid Cap Portfolio for the period January 1, 2024 to December 31, 2024. You can find additional information about the Fund at fundresearch.fidelity.com/prospectus/sec. You can also request this information by contacting us at 1-877-208-0098 or by sending an e-mail to funddocuments@fmr.com.
What were your Fund costs for the last year?(based on hypothetical $10,000 investment)
FUND COST (PREVIOUS YEAR)
| | Costs of a $10,000 investment | Costs paid as a percentage of a $10,000 investment | |
| Initial Class | $ 62 | 0.57% | |
What affected the Fund's performance this period?
•U.S. equities gained in 2024, driven by a sturdy economy, the Federal Reserve's long-anticipated pivot to cutting interest rates and the potential for artificial intelligence to drive transformative change.
•Against this backdrop, security selection was the primary contributor to the fund's performance versus the S&P MidCap 400 Index for the year, led by the consumer discretionary sector. Picks in consumer staples and financials, primarily banks, also boosted the fund's relative performance.
•The fund's non-benchmark stake in Vertiv Holdings gained 141% and was the top individual relative contributor. This period we decreased our position in the stock. An overweight in Deckers Outdoor (+83%) helped as well. This period we decreased our position in Deckers Outdoor. Another notable relative contributor was our non-benchmark stake in Howmet Aerospace (+110%). The stock was not held at period end.
•In contrast, the biggest detractor from performance versus the benchmark was stock picking in information technology. Also hurting our result was security selection in energy and utilities. Lastly, the fund's position in cash further detracted.
•Not owning Texas Pacific Land, a benchmark component that gained 117%, was the biggest individual relative detractor. Our stake in Super Micro Computer (+276%) also hurt. The stock was not held at period end. A holding in Emcor (+111%) detracted as well. This was an investment we established in 2024.
•Notable changes in positioning include increased exposure to the health care and financials sectors.
How did the Fund perform over the past 10 years?
CUMULATIVE PERFORMANCE
December 31, 2014 through December 31, 2024.
Initial investment of $10,000.
Initial Class | $10,000 | $9,861 | $11,068 | $13,371 | $11,427 | $14,106 | $16,672 | $20,940 | $17,853 | $20,544 | $24,138 |
S&P MidCap 400® Index | $10,000 | $9,782 | $11,811 | $13,730 | $12,208 | $15,407 | $17,511 | $21,847 | $18,993 | $22,115 | $25,196 |
Russell 3000® Index | $10,000 | $10,048 | $11,327 | $13,721 | $13,002 | $17,035 | $20,593 | $25,877 | $20,907 | $26,334 | $32,604 |
| | 2014 | 2015 | 2016 | 2017 | 2018 | 2019 | 2020 | 2021 | 2022 | 2023 | 2024 |
AVERAGE ANNUAL TOTAL RETURNS:| | 1 Year | 5 Year | 10 Year |
| Initial Class | 17.49% | 11.34% | 9.21% |
| S&P MidCap 400® Index | 13.93% | 10.34% | 9.68% |
| Russell 3000® Index | 23.81% | 13.86% | 12.55% |
Visit institutional.fidelity.com for more recent performance information. |
The Fund's past performance is not a good predictor of the Fund's future performance. The graph and table do not reflect the deduction of taxes that a shareholder would pay on fund distributions or redemption of fund shares. |
Key Fund Statistics(as of December 31, 2024)
KEY FACTS | | |
| Fund Size | $7,489,948,736 | |
| Number of Holdings | 180 | |
| Total Advisory Fee | $40,873,181 | |
| Portfolio Turnover | 52% | |
What did the Fund invest in?
(as of December 31, 2024)
MARKET SECTORS (% of Fund's net assets) | | |
| Financials | 20.1 | |
| Industrials | 18.1 | |
| Consumer Discretionary | 12.3 | |
| Health Care | 11.7 | |
| Information Technology | 9.7 | |
| Real Estate | 6.5 | |
| Energy | 6.0 | |
| Materials | 5.2 | |
| Consumer Staples | 4.9 | |
| Utilities | 3.4 | |
| Communication Services | 1.8 | |
| |
| Common Stocks | 99.7 |
| Short-Term Investments and Net Other Assets (Liabilities) | 0.3 |
ASSET ALLOCATION (% of Fund's net assets) |
|
| | Common Stocks - 99.7 |
| | Short-Term Investments and Net Other Assets (Liabilities) - 0.3 |
| |
| United States | 91.1 |
| Canada | 2.2 |
| Israel | 1.6 |
| United Kingdom | 1.6 |
| Belgium | 0.9 |
| Puerto Rico | 0.8 |
| Brazil | 0.4 |
| Italy | 0.4 |
| France | 0.3 |
| Others | 0.7 |
GEOGRAPHIC DIVERSIFICATION (% of Fund's net assets) |
|
| | United States - 91.1 |
| | Canada - 2.2 |
| | Israel - 1.6 |
| | United Kingdom - 1.6 |
| | Belgium - 0.9 |
| | Puerto Rico - 0.8 |
| | Brazil - 0.4 |
| | Italy - 0.4 |
| | France - 0.3 |
| | Others - 0.7 |
| |
TOP HOLDINGS(% of Fund's net assets) | | |
| Reinsurance Group of America Inc | 1.5 | |
| US Foods Holding Corp | 1.4 | |
| ITT Inc | 1.4 | |
| Williams-Sonoma Inc | 1.3 | |
| East West Bancorp Inc | 1.3 | |
| Wintrust Financial Corp | 1.3 | |
| Primerica Inc | 1.2 | |
| Performance Food Group Co | 1.2 | |
| AptarGroup Inc | 1.2 | |
| Wix.com Ltd | 1.2 | |
| | 13.0 | |
How has the Fund changed?
This is a summary of certain changes to the Fund since January 1, 2024. For more complete information, you may review the Fund's next prospectus, which we expect to be available by April 30, 2025 at fundresearch.fidelity.com/prospectus/sec or upon request at 1-877-208-0098 or by sending an e-mail to funddocuments@fmr.com.
The fees associated with this class changed during the reporting year. The variations in class fees are primarily the result of the following changes:- Management fee
- Operating expenses
The fund's transfer agent and pricing & bookkeeping fees were changed to a fixed rate effective December 1, 2023. Effective March 1, 2024, the fund's management contract was amended to incorporate administrative services previously covered under separate services agreements (transfer agent and pricing & bookkeeping). The amended contract incorporates a management fee rate that may vary by class. The Adviser or an affiliate pays certain expenses of managing and operating the fund out of each class's management fee. | |
| Fidelity, the Fidelity Investments Logo and all other Fidelity trademarks or service marks used herein are trademarks or service marks of FMR LLC. Any third-party marks that are used herein are trademarks or service marks of their respective owners. © 2025 FMR LLC. All rights reserved. |
| | For additional information about the Fund; including its prospectus, financial information, holdings and proxy information, scan the QR code or visit fundresearch.fidelity.com/prospectus/sec 1.9914240.100 772-TSRA-0325 |
| |
| | ANNUAL SHAREHOLDER REPORT | AS OF DECEMBER 31, 2024 | This report describes changes to the Fund that occurred during the reporting period. |
| | VIP Growth Opportunities Portfolio VIP Growth Opportunities Portfolio Initial Class true |
| | | |
This annual shareholder report contains information about VIP Growth Opportunities Portfolio for the period January 1, 2024 to December 31, 2024. You can find additional information about the Fund at fundresearch.fidelity.com/prospectus/sec. You can also request this information by contacting us at 1-877-208-0098 or by sending an e-mail to funddocuments@fmr.com.
What were your Fund costs for the last year?(based on hypothetical $10,000 investment)
FUND COST (PREVIOUS YEAR)
| | Costs of a $10,000 investment | Costs paid as a percentage of a $10,000 investment | |
| Initial Class | $ 69 | 0.58% | |
What affected the Fund's performance this period?
•U.S. equities gained in 2024, driven by a sturdy economy, the Federal Reserve's long-anticipated pivot to cutting interest rates and the potential for artificial intelligence to drive transformative change.
•Against this backdrop, security selection and sector/industry selection contributed in roughly equal measure to the fund's performance versus the Russell 1000 Growth Index for the year, led by information technology. An overweight in communication services, primarily within the media & entertainment industry, also boosted relative performance. Also contributing were security selection and an underweight in consumer discretionary, primarily within the consumer discretionary distribution & retail industry.
•The top individual relative contributor was an overweight in Nvidia (+171%). The stock was the fund's biggest holding. A second notable relative contributor was a non-benchmark stake in Sea (+160%). This period we decreased our investment in Sea. Another notable relative contributor was an overweight in Carvana (+283%).
•In contrast, the biggest detractor from performance versus the benchmark was stock picking in communication services, primarily within the media & entertainment industry. Also hurting our result were stock picks in financials, primarily within the financial services industry, and utilities.
•The biggest individual relative detractor was an overweight in Roku (-19%). This period we increased our position in Roku, which was one of the fund's largest holdings. A second notable relative detractor was a non-benchmark stake in ON Semiconductor (-24%). An overweight in Builders FirstSource (-14%) also detracted. This period we increased our position in Builders FirstSource.
•Notable changes in positioning include decreased exposure to the health care sector and a higher allocation to consumer discretionary.
How did the Fund perform over the past 10 years?
CUMULATIVE PERFORMANCE
December 31, 2014 through December 31, 2024.
Initial investment of $10,000.
Initial Class | $10,000 | $10,561 | $10,600 | $14,253 | $16,029 | $22,576 | $38,075 | $42,622 | $26,362 | $38,396 | $53,327 |
Russell 1000® Growth Index | $10,000 | $10,567 | $11,314 | $14,733 | $14,510 | $19,790 | $27,408 | $34,971 | $24,782 | $35,358 | $47,152 |
Russell 1000® Index | $10,000 | $10,092 | $11,308 | $13,761 | $13,102 | $17,220 | $20,830 | $26,340 | $21,302 | $26,953 | $33,560 |
| | 2014 | 2015 | 2016 | 2017 | 2018 | 2019 | 2020 | 2021 | 2022 | 2023 | 2024 |
AVERAGE ANNUAL TOTAL RETURNS:| | 1 Year | 5 Year | 10 Year |
| Initial Class | 38.89% | 18.76% | 18.22% |
| Russell 1000® Growth Index | 33.36% | 18.96% | 16.78% |
| Russell 1000® Index | 24.51% | 14.28% | 12.87% |
Visit institutional.fidelity.com for more recent performance information. |
The Fund's past performance is not a good predictor of the Fund's future performance. The graph and table do not reflect the deduction of taxes that a shareholder would pay on fund distributions or redemption of fund shares. |
Key Fund Statistics(as of December 31, 2024)
KEY FACTS | | |
| Fund Size | $3,885,385,455 | |
| Number of Holdings | 196 | |
| Total Advisory Fee | $19,748,951 | |
| Portfolio Turnover | 58% | |
What did the Fund invest in?
(as of December 31, 2024)
MARKET SECTORS (% of Fund's net assets) | | |
| Information Technology | 47.7 | |
| Communication Services | 21.0 | |
| Consumer Discretionary | 12.5 | |
| Financials | 7.0 | |
| Health Care | 4.8 | |
| Industrials | 4.6 | |
| Consumer Staples | 1.2 | |
| Utilities | 1.0 | |
| Materials | 0.3 | |
| |
| Common Stocks | 97.9 |
| Preferred Stocks | 2.1 |
| Bonds | 0.1 |
| Preferred Securities | 0.0 |
ASSET ALLOCATION (% of Fund's net assets) |
|
| | Common Stocks - 97.9 |
| | Preferred Stocks - 2.1 |
| | Bonds - 0.1 |
| | Preferred Securities - 0.0 |
| Short-Term Investments and Net Other Assets (Liabilities) - (0.1)% |
| |
| United States | 94.0 |
| Taiwan | 1.6 |
| Singapore | 1.4 |
| China | 1.1 |
| Canada | 0.5 |
| Germany | 0.4 |
| India | 0.2 |
| Netherlands | 0.2 |
| United Kingdom | 0.2 |
| Others | 0.4 |
GEOGRAPHIC DIVERSIFICATION (% of Fund's net assets) |
|
| | United States - 94.0 |
| | Taiwan - 1.6 |
| | Singapore - 1.4 |
| | China - 1.1 |
| | Canada - 0.5 |
| | Germany - 0.4 |
| | India - 0.2 |
| | Netherlands - 0.2 |
| | United Kingdom - 0.2 |
| | Others - 0.4 |
| |
TOP HOLDINGS(% of Fund's net assets) | | |
| NVIDIA Corp | 12.8 | |
| Microsoft Corp | 8.2 | |
| Meta Platforms Inc Class A | 6.2 | |
| Amazon.com Inc | 5.6 | |
| Apple Inc | 5.5 | |
| Broadcom Inc | 4.8 | |
| Alphabet Inc Class C | 4.4 | |
| Roku Inc Class A | 3.2 | |
| Tesla Inc | 2.4 | |
| Visa Inc Class A | 2.2 | |
| | 55.3 | |
How has the Fund changed?
This is a summary of certain changes to the Fund since January 1, 2024. For more complete information, you may review the Fund's next prospectus, which we expect to be available by April 30, 2025 at fundresearch.fidelity.com/prospectus/sec or upon request at 1-877-208-0098 or by sending an e-mail to funddocuments@fmr.com.
The fund's transfer agent and pricing & bookkeeping fees were changed to a fixed rate effective December 1, 2023. Effective March 1, 2024, the fund's management contract was amended to incorporate administrative services previously covered under separate services agreements (transfer agent and pricing & bookkeeping). The amended contract incorporates a management fee rate that may vary by class. The Adviser or an affiliate pays certain expenses of managing and operating the fund out of each class's management fee. | |
| Fidelity, the Fidelity Investments Logo and all other Fidelity trademarks or service marks used herein are trademarks or service marks of FMR LLC. Any third-party marks that are used herein are trademarks or service marks of their respective owners. © 2025 FMR LLC. All rights reserved. |
| | For additional information about the Fund; including its prospectus, financial information, holdings and proxy information, scan the QR code or visit fundresearch.fidelity.com/prospectus/sec 1.9914223.100 617-TSRA-0325 |
| |
| | ANNUAL SHAREHOLDER REPORT | AS OF DECEMBER 31, 2024 | This report describes changes to the Fund that occurred during the reporting period. |
| | VIP Growth & Income Portfolio VIP Growth & Income Portfolio Service Class 2 true |
| | | |
This annual shareholder report contains information about VIP Growth & Income Portfolio for the period January 1, 2024 to December 31, 2024. You can find additional information about the Fund at fundresearch.fidelity.com/prospectus/sec. You can also request this information by contacting us at 1-877-208-0098 or by sending an e-mail to funddocuments@fmr.com.
What were your Fund costs for the last year?(based on hypothetical $10,000 investment)
FUND COST (PREVIOUS YEAR)
| | Costs of a $10,000 investment | Costs paid as a percentage of a $10,000 investment | |
| Service Class 2 | $ 82 | 0.74% | |
What affected the Fund's performance this period?
•U.S. equities gained in 2024, driven by a sturdy economy, the Federal Reserve's long-anticipated pivot to cutting interest rates and the potential for artificial intelligence to drive transformative change.
•Against this backdrop, market selection was the primary detractor from the fund's performance versus the S&P 500® index for the fiscal year, especially an overweight in energy. Security selection and an underweight in communication services, primarily within the media & entertainment industry, also hampered the fund's result. Also hurting our result was an underweight in information technology, primarily within the semiconductors & semiconductor equipment industry.
•The largest individual relative detractor was an underweight in Nvidia (+171%), which was among the largest holdings. A second notable relative detractor was an overweight in Boeing (-33%). The company was one of the fund's biggest holdings this period. An underweight in Meta Platforms (+66%) also detracted. This was an investment we established this period.
•In contrast, the biggest contributor to performance versus the benchmark was security selection in industrials, primarily within the capital goods industry. Stock picking in health care also boosted relative performance. Also lifting the fund's relative result were stock picks and an overweight in financials, primarily within the banks industry.
•The top individual relative contributor was an overweight in GE Aerospace (+66%). The company was one of the fund's biggest holdings. A second notable relative contributor was an overweight in GE Vernova (+127%). This was an investment we established this period. The company also was among our biggest holdings at period end. An overweight in Wells Fargo (+43%) also helped. The company, too, was a sizable holding.
•Notable changes in positioning include a higher allocation to information technology.
How did the Fund perform over the past 10 years?
CUMULATIVE PERFORMANCE
December 31, 2014 through December 31, 2024.
Initial investment of $10,000.
Service Class 2 | $10,000 | $9,746 | $11,287 | $13,162 | $11,952 | $15,499 | $16,676 | $20,952 | $19,868 | $23,526 | $28,681 |
S&P 500® Index | $10,000 | $10,138 | $11,351 | $13,829 | $13,223 | $17,386 | $20,585 | $26,494 | $21,696 | $27,399 | $34,254 |
| | 2014 | 2015 | 2016 | 2017 | 2018 | 2019 | 2020 | 2021 | 2022 | 2023 | 2024 |
AVERAGE ANNUAL TOTAL RETURNS:| | 1 Year | 5 Year | 10 Year |
| Service Class 2 | 21.91% | 13.10% | 11.11% |
| S&P 500® Index | 25.02% | 14.53% | 13.10% |
Visit institutional.fidelity.com for more recent performance information. |
The Fund's past performance is not a good predictor of the Fund's future performance. The graph and table do not reflect the deduction of taxes that a shareholder would pay on fund distributions or redemption of fund shares. |
Key Fund Statistics(as of December 31, 2024)
KEY FACTS | | |
| Fund Size | $2,444,208,883 | |
| Number of Holdings | 177 | |
| Total Advisory Fee | $11,224,574 | |
| Portfolio Turnover | 14% | |
What did the Fund invest in?
(as of December 31, 2024)
MARKET SECTORS (% of Fund's net assets) | | |
| Information Technology | 23.4 | |
| Financials | 20.2 | |
| Industrials | 16.4 | |
| Health Care | 11.0 | |
| Energy | 8.9 | |
| Consumer Staples | 5.9 | |
| Communication Services | 4.5 | |
| Utilities | 2.4 | |
| Consumer Discretionary | 2.0 | |
| Real Estate | 1.2 | |
| Materials | 1.1 | |
| |
| Common Stocks | 96.0 |
| Preferred Stocks | 0.9 |
| Bonds | 0.1 |
| Short-Term Investments and Net Other Assets (Liabilities) | 3.0 |
ASSET ALLOCATION (% of Fund's net assets) |
|
| | Common Stocks - 96.0 |
| | Preferred Stocks - 0.9 |
| | Bonds - 0.1 |
| | Short-Term Investments and Net Other Assets (Liabilities) - 3.0 |
| |
| United States | 91.0 |
| Canada | 1.5 |
| Germany | 1.5 |
| United Kingdom | 1.2 |
| Netherlands | 1.0 |
| Belgium | 0.9 |
| France | 0.8 |
| Zambia | 0.7 |
| Taiwan | 0.6 |
| Others | 0.8 |
GEOGRAPHIC DIVERSIFICATION (% of Fund's net assets) |
|
| | United States - 91.0 |
| | Canada - 1.5 |
| | Germany - 1.5 |
| | United Kingdom - 1.2 |
| | Netherlands - 1.0 |
| | Belgium - 0.9 |
| | France - 0.8 |
| | Zambia - 0.7 |
| | Taiwan - 0.6 |
| | Others - 0.8 |
| |
TOP HOLDINGS(% of Fund's net assets) | | |
| Microsoft Corp | 7.5 | |
| Wells Fargo & Co | 6.5 | |
| Exxon Mobil Corp | 5.8 | |
| GE Aerospace | 4.6 | |
| NVIDIA Corp | 4.1 | |
| Apple Inc | 3.2 | |
| Bank of America Corp | 2.9 | |
| Visa Inc Class A | 2.3 | |
| GE Vernova Inc | 2.2 | |
| UnitedHealth Group Inc | 1.8 | |
| | 40.9 | |
How has the Fund changed?
This is a summary of certain changes to the Fund since January 1, 2024. For more complete information, you may review the Fund's next prospectus, which we expect to be available by April 30, 2025 at fundresearch.fidelity.com/prospectus/sec or upon request at 1-877-208-0098 or by sending an e-mail to funddocuments@fmr.com.
The fund's transfer agent and pricing & bookkeeping fees were changed to a fixed rate effective December 1, 2023. Effective March 1, 2024, the fund's management contract was amended to incorporate administrative services previously covered under separate services agreements (transfer agent and pricing & bookkeeping). The amended contract incorporates a management fee rate that may vary by class. The Adviser or an affiliate pays certain expenses of managing and operating the fund out of each class's management fee. | |
| Fidelity, the Fidelity Investments Logo and all other Fidelity trademarks or service marks used herein are trademarks or service marks of FMR LLC. Any third-party marks that are used herein are trademarks or service marks of their respective owners. © 2025 FMR LLC. All rights reserved. |
| | For additional information about the Fund; including its prospectus, financial information, holdings and proxy information, scan the QR code or visit fundresearch.fidelity.com/prospectus/sec 1.9914148.100 382-TSRA-0325 |
| |
| | ANNUAL SHAREHOLDER REPORT | AS OF DECEMBER 31, 2024 | This report describes changes to the Fund that occurred during the reporting period. |
| | VIP Growth Opportunities Portfolio VIP Growth Opportunities Portfolio Investor Class true |
| | | |
This annual shareholder report contains information about VIP Growth Opportunities Portfolio for the period January 1, 2024 to December 31, 2024. You can find additional information about the Fund at fundresearch.fidelity.com/prospectus/sec. You can also request this information by contacting us at 1-877-208-0098 or by sending an e-mail to funddocuments@fmr.com.
What were your Fund costs for the last year?(based on hypothetical $10,000 investment)
FUND COST (PREVIOUS YEAR)
| | Costs of a $10,000 investment | Costs paid as a percentage of a $10,000 investment | |
| Investor Class | $ 77 | 0.65% | |
What affected the Fund's performance this period?
•U.S. equities gained in 2024, driven by a sturdy economy, the Federal Reserve's long-anticipated pivot to cutting interest rates and the potential for artificial intelligence to drive transformative change.
•Against this backdrop, security selection and sector/industry selection contributed in roughly equal measure to the fund's performance versus the Russell 1000 Growth Index for the year, led by information technology. An overweight in communication services, primarily within the media & entertainment industry, also boosted relative performance. Also contributing were security selection and an underweight in consumer discretionary, primarily within the consumer discretionary distribution & retail industry.
•The top individual relative contributor was an overweight in Nvidia (+171%). The stock was the fund's biggest holding. A second notable relative contributor was a non-benchmark stake in Sea (+160%). This period we decreased our investment in Sea. Another notable relative contributor was an overweight in Carvana (+283%).
•In contrast, the biggest detractor from performance versus the benchmark was stock picking in communication services, primarily within the media & entertainment industry. Also hurting our result were stock picks in financials, primarily within the financial services industry, and utilities.
•The biggest individual relative detractor was an overweight in Roku (-19%). This period we increased our position in Roku, which was one of the fund's largest holdings. A second notable relative detractor was a non-benchmark stake in ON Semiconductor (-24%). An overweight in Builders FirstSource (-14%) also detracted. This period we increased our position in Builders FirstSource.
•Notable changes in positioning include decreased exposure to the health care sector and a higher allocation to consumer discretionary.
How did the Fund perform over the past 10 years?
CUMULATIVE PERFORMANCE
December 31, 2014 through December 31, 2024.
Initial investment of $10,000.
Investor Class | $10,000 | $10,554 | $10,584 | $14,223 | $15,982 | $22,489 | $37,899 | $42,396 | $26,200 | $38,139 | $52,924 |
Russell 1000® Growth Index | $10,000 | $10,567 | $11,314 | $14,733 | $14,510 | $19,790 | $27,408 | $34,971 | $24,782 | $35,358 | $47,152 |
Russell 1000® Index | $10,000 | $10,092 | $11,308 | $13,761 | $13,102 | $17,220 | $20,830 | $26,340 | $21,302 | $26,953 | $33,560 |
| | 2014 | 2015 | 2016 | 2017 | 2018 | 2019 | 2020 | 2021 | 2022 | 2023 | 2024 |
AVERAGE ANNUAL TOTAL RETURNS:| | 1 Year | 5 Year | 10 Year |
| Investor Class | 38.77% | 18.67% | 18.13% |
| Russell 1000® Growth Index | 33.36% | 18.96% | 16.78% |
| Russell 1000® Index | 24.51% | 14.28% | 12.87% |
Visit institutional.fidelity.com for more recent performance information. |
The Fund's past performance is not a good predictor of the Fund's future performance. The graph and table do not reflect the deduction of taxes that a shareholder would pay on fund distributions or redemption of fund shares. |
Key Fund Statistics(as of December 31, 2024)
KEY FACTS | | |
| Fund Size | $3,885,385,455 | |
| Number of Holdings | 196 | |
| Total Advisory Fee | $19,748,951 | |
| Portfolio Turnover | 58% | |
What did the Fund invest in?
(as of December 31, 2024)
MARKET SECTORS (% of Fund's net assets) | | |
| Information Technology | 47.7 | |
| Communication Services | 21.0 | |
| Consumer Discretionary | 12.5 | |
| Financials | 7.0 | |
| Health Care | 4.8 | |
| Industrials | 4.6 | |
| Consumer Staples | 1.2 | |
| Utilities | 1.0 | |
| Materials | 0.3 | |
| |
| Common Stocks | 97.9 |
| Preferred Stocks | 2.1 |
| Bonds | 0.1 |
| Preferred Securities | 0.0 |
ASSET ALLOCATION (% of Fund's net assets) |
|
| | Common Stocks - 97.9 |
| | Preferred Stocks - 2.1 |
| | Bonds - 0.1 |
| | Preferred Securities - 0.0 |
| Short-Term Investments and Net Other Assets (Liabilities) - (0.1)% |
| |
| United States | 94.0 |
| Taiwan | 1.6 |
| Singapore | 1.4 |
| China | 1.1 |
| Canada | 0.5 |
| Germany | 0.4 |
| India | 0.2 |
| Netherlands | 0.2 |
| United Kingdom | 0.2 |
| Others | 0.4 |
GEOGRAPHIC DIVERSIFICATION (% of Fund's net assets) |
|
| | United States - 94.0 |
| | Taiwan - 1.6 |
| | Singapore - 1.4 |
| | China - 1.1 |
| | Canada - 0.5 |
| | Germany - 0.4 |
| | India - 0.2 |
| | Netherlands - 0.2 |
| | United Kingdom - 0.2 |
| | Others - 0.4 |
| |
TOP HOLDINGS(% of Fund's net assets) | | |
| NVIDIA Corp | 12.8 | |
| Microsoft Corp | 8.2 | |
| Meta Platforms Inc Class A | 6.2 | |
| Amazon.com Inc | 5.6 | |
| Apple Inc | 5.5 | |
| Broadcom Inc | 4.8 | |
| Alphabet Inc Class C | 4.4 | |
| Roku Inc Class A | 3.2 | |
| Tesla Inc | 2.4 | |
| Visa Inc Class A | 2.2 | |
| | 55.3 | |
How has the Fund changed?
This is a summary of certain changes to the Fund since January 1, 2024. For more complete information, you may review the Fund's next prospectus, which we expect to be available by April 30, 2025 at fundresearch.fidelity.com/prospectus/sec or upon request at 1-877-208-0098 or by sending an e-mail to funddocuments@fmr.com.
The fees associated with this class changed during the reporting year. The variations in class fees are primarily the result of the following changes: The fund's transfer agent and pricing & bookkeeping fees were changed to a fixed rate effective December 1, 2023. Effective March 1, 2024, the fund's management contract was amended to incorporate administrative services previously covered under separate services agreements (transfer agent and pricing & bookkeeping). The amended contract incorporates a management fee rate that may vary by class. The Adviser or an affiliate pays certain expenses of managing and operating the fund out of each class's management fee. | |
| Fidelity, the Fidelity Investments Logo and all other Fidelity trademarks or service marks used herein are trademarks or service marks of FMR LLC. Any third-party marks that are used herein are trademarks or service marks of their respective owners. © 2025 FMR LLC. All rights reserved. |
| | For additional information about the Fund; including its prospectus, financial information, holdings and proxy information, scan the QR code or visit fundresearch.fidelity.com/prospectus/sec 1.9914220.100 1465-TSRA-0325 |
| |
| | ANNUAL SHAREHOLDER REPORT | AS OF DECEMBER 31, 2024 | This report describes changes to the Fund that occurred during the reporting period. |
| | VIP Value Strategies Portfolio VIP Value Strategies Portfolio Service Class 2 true |
| | | |
This annual shareholder report contains information about VIP Value Strategies Portfolio for the period January 1, 2024 to December 31, 2024. You can find additional information about the Fund at fundresearch.fidelity.com/prospectus/sec. You can also request this information by contacting us at 1-877-208-0098 or by sending an e-mail to funddocuments@fmr.com.
What were your Fund costs for the last year?(based on hypothetical $10,000 investment)
FUND COST (PREVIOUS YEAR)
| | Costs of a $10,000 investment | Costs paid as a percentage of a $10,000 investment | |
| Service Class 2 | $ 89 | 0.85% | |
What affected the Fund's performance this period?
•U.S. equities gained in 2024, driven by a sturdy economy, the Federal Reserve's long-anticipated pivot to cutting interest rates and the potential for artificial intelligence to drive transformative change.
•Against this backdrop, security selection was the primary detractor from the fund's performance versus the Russell Midcap Value Index for the fiscal year, especially within the consumer discretionary sector. Stock picking and an overweight in industrials also hampered the fund's result. Investment choices in communication services hurt as well.
•The biggest individual relative detractor was our non-benchmark stake in CVS Health (-41%). An overweight in Chemours (-44%) and position in Centene (-20%) also hurt. The latter stock was not held at period end but was among the fund's biggest holdings in 2024.
•In contrast, the biggest contributor to performance versus the benchmark was stock selection in information technology, primarily within the technology hardware & equipment industry. Picks in utilities also boosted relative performance. An overweight in financials, primarily within the financial services industry, helped as well.
•The top individual relative contributor was an overweight in Constellation Energy (+88%). This period we decreased our stake in Constellation Energy although it was among our largest holdings this period. A non-benchmark stake in Apollo Global Management gained approximately 80% and further bolstered relative performance. The stock was one of our largest holdings. A non-benchmark stake in Targa Resources (+111%) also helped.
•Notable changes in positioning include decreased exposure to the utilities and real estate sectors.
How did the Fund perform over the past 10 years?
CUMULATIVE PERFORMANCE
December 31, 2014 through December 31, 2024.
Initial investment of $10,000.
Service Class 2 | $10,000 | $9,681 | $10,579 | $12,597 | $10,393 | $13,937 | $15,055 | $20,074 | $18,599 | $22,432 | $24,487 |
Russell Midcap® Value Index | $10,000 | $9,522 | $11,426 | $12,951 | $11,359 | $14,433 | $15,150 | $19,443 | $17,104 | $19,278 | $21,798 |
Russell 3000® Index | $10,000 | $10,048 | $11,327 | $13,721 | $13,002 | $17,035 | $20,593 | $25,877 | $20,907 | $26,334 | $32,604 |
| | 2014 | 2015 | 2016 | 2017 | 2018 | 2019 | 2020 | 2021 | 2022 | 2023 | 2024 |
AVERAGE ANNUAL TOTAL RETURNS:| | 1 Year | 5 Year | 10 Year |
| Service Class 2 | 9.16% | 11.93% | 9.37% |
| Russell Midcap® Value Index | 13.07% | 8.59% | 8.10% |
| Russell 3000® Index | 23.81% | 13.86% | 12.55% |
Visit institutional.fidelity.com for more recent performance information. |
The Fund's past performance is not a good predictor of the Fund's future performance. The graph and table do not reflect the deduction of taxes that a shareholder would pay on fund distributions or redemption of fund shares. |
Key Fund Statistics(as of December 31, 2024)
KEY FACTS | | |
| Fund Size | $938,382,301 | |
| Number of Holdings | 116 | |
| Total Advisory Fee | $4,291,907 | |
| Portfolio Turnover | 66% | |
What did the Fund invest in?
(as of December 31, 2024)
MARKET SECTORS (% of Fund's net assets) | | |
| Financials | 21.4 | |
| Industrials | 18.7 | |
| Consumer Discretionary | 9.4 | |
| Materials | 7.9 | |
| Energy | 6.9 | |
| Information Technology | 6.9 | |
| Real Estate | 6.3 | |
| Health Care | 5.9 | |
| Consumer Staples | 5.3 | |
| Utilities | 5.2 | |
| Communication Services | 2.4 | |
| |
| Common Stocks | 96.3 |
| Short-Term Investments and Net Other Assets (Liabilities) | 3.7 |
ASSET ALLOCATION (% of Fund's net assets) |
|
| | Common Stocks - 96.3 |
| | Short-Term Investments and Net Other Assets (Liabilities) - 3.7 |
| |
| United States | 91.2 |
| Canada | 4.0 |
| Bailiwick Of Jersey | 0.9 |
| Spain | 0.7 |
| Puerto Rico | 0.7 |
| India | 0.7 |
| Portugal | 0.5 |
| Sweden | 0.5 |
| United Kingdom | 0.4 |
| Others | 0.4 |
GEOGRAPHIC DIVERSIFICATION (% of Fund's net assets) |
|
| | United States - 91.2 |
| | Canada - 4.0 |
| | Bailiwick Of Jersey - 0.9 |
| | Spain - 0.7 |
| | Puerto Rico - 0.7 |
| | India - 0.7 |
| | Portugal - 0.5 |
| | Sweden - 0.5 |
| | United Kingdom - 0.4 |
| | Others - 0.4 |
| |
TOP HOLDINGS(% of Fund's net assets) | | |
| Global Payments Inc | 1.9 | |
| Apollo Global Management Inc | 1.9 | |
| East West Bancorp Inc | 1.9 | |
| First Citizens BancShares Inc/NC Class A | 1.8 | |
| Canadian Natural Resources Ltd | 1.6 | |
| PG&E Corp | 1.5 | |
| Ventas Inc | 1.5 | |
| Ameriprise Financial Inc | 1.5 | |
| Jabil Inc | 1.5 | |
| ON Semiconductor Corp | 1.3 | |
| | 16.4 | |
How has the Fund changed?
This is a summary of certain changes to the Fund since January 1, 2024. For more complete information, you may review the Fund's next prospectus, which we expect to be available by April 30, 2025 at fundresearch.fidelity.com/prospectus/sec or upon request at 1-877-208-0098 or by sending an e-mail to funddocuments@fmr.com.
The fund's transfer agent and pricing & bookkeeping fees were changed to a fixed rate effective December 1, 2023. Effective March 1, 2024, the fund's management contract was amended to incorporate administrative services previously covered under separate services agreements (transfer agent and pricing & bookkeeping). The amended contract incorporates a management fee rate that may vary by class. The Adviser or an affiliate pays certain expenses of managing and operating the fund out of each class's management fee. | |
| Fidelity, the Fidelity Investments Logo and all other Fidelity trademarks or service marks used herein are trademarks or service marks of FMR LLC. Any third-party marks that are used herein are trademarks or service marks of their respective owners. © 2025 FMR LLC. All rights reserved. |
| | For additional information about the Fund; including its prospectus, financial information, holdings and proxy information, scan the QR code or visit fundresearch.fidelity.com/prospectus/sec 1.9914244.100 1026-TSRA-0325 |
| |
| | ANNUAL SHAREHOLDER REPORT | AS OF DECEMBER 31, 2024 | This report describes changes to the Fund that occurred during the reporting period. |
| | VIP Mid Cap Portfolio VIP Mid Cap Portfolio Service Class 2 true |
| | | |
This annual shareholder report contains information about VIP Mid Cap Portfolio for the period January 1, 2024 to December 31, 2024. You can find additional information about the Fund at fundresearch.fidelity.com/prospectus/sec. You can also request this information by contacting us at 1-877-208-0098 or by sending an e-mail to funddocuments@fmr.com.
What were your Fund costs for the last year?(based on hypothetical $10,000 investment)
FUND COST (PREVIOUS YEAR)
| | Costs of a $10,000 investment | Costs paid as a percentage of a $10,000 investment | |
| Service Class 2 | $ 89 | 0.82% | |
What affected the Fund's performance this period?
•U.S. equities gained in 2024, driven by a sturdy economy, the Federal Reserve's long-anticipated pivot to cutting interest rates and the potential for artificial intelligence to drive transformative change.
•Against this backdrop, security selection was the primary contributor to the fund's performance versus the S&P MidCap 400 Index for the year, led by the consumer discretionary sector. Picks in consumer staples and financials, primarily banks, also boosted the fund's relative performance.
•The fund's non-benchmark stake in Vertiv Holdings gained 141% and was the top individual relative contributor. This period we decreased our position in the stock. An overweight in Deckers Outdoor (+83%) helped as well. This period we decreased our position in Deckers Outdoor. Another notable relative contributor was our non-benchmark stake in Howmet Aerospace (+110%). The stock was not held at period end.
•In contrast, the biggest detractor from performance versus the benchmark was stock picking in information technology. Also hurting our result was security selection in energy and utilities. Lastly, the fund's position in cash further detracted.
•Not owning Texas Pacific Land, a benchmark component that gained 117%, was the biggest individual relative detractor. Our stake in Super Micro Computer (+276%) also hurt. The stock was not held at period end. A holding in Emcor (+111%) detracted as well. This was an investment we established in 2024.
•Notable changes in positioning include increased exposure to the health care and financials sectors.
How did the Fund perform over the past 10 years?
CUMULATIVE PERFORMANCE
December 31, 2014 through December 31, 2024.
Initial investment of $10,000.
Service Class 2 | $10,000 | $9,837 | $11,010 | $13,271 | $11,311 | $13,932 | $16,421 | $20,576 | $17,497 | $20,086 | $23,536 |
S&P MidCap 400® Index | $10,000 | $9,782 | $11,811 | $13,730 | $12,208 | $15,407 | $17,511 | $21,847 | $18,993 | $22,115 | $25,196 |
Russell 3000® Index | $10,000 | $10,048 | $11,327 | $13,721 | $13,002 | $17,035 | $20,593 | $25,877 | $20,907 | $26,334 | $32,604 |
| | 2014 | 2015 | 2016 | 2017 | 2018 | 2019 | 2020 | 2021 | 2022 | 2023 | 2024 |
AVERAGE ANNUAL TOTAL RETURNS:| | 1 Year | 5 Year | 10 Year |
| Service Class 2 | 17.18% | 11.06% | 8.94% |
| S&P MidCap 400® Index | 13.93% | 10.34% | 9.68% |
| Russell 3000® Index | 23.81% | 13.86% | 12.55% |
Visit institutional.fidelity.com for more recent performance information. |
The Fund's past performance is not a good predictor of the Fund's future performance. The graph and table do not reflect the deduction of taxes that a shareholder would pay on fund distributions or redemption of fund shares. |
Key Fund Statistics(as of December 31, 2024)
KEY FACTS | | |
| Fund Size | $7,489,948,736 | |
| Number of Holdings | 180 | |
| Total Advisory Fee | $40,873,181 | |
| Portfolio Turnover | 52% | |
What did the Fund invest in?
(as of December 31, 2024)
MARKET SECTORS (% of Fund's net assets) | | |
| Financials | 20.1 | |
| Industrials | 18.1 | |
| Consumer Discretionary | 12.3 | |
| Health Care | 11.7 | |
| Information Technology | 9.7 | |
| Real Estate | 6.5 | |
| Energy | 6.0 | |
| Materials | 5.2 | |
| Consumer Staples | 4.9 | |
| Utilities | 3.4 | |
| Communication Services | 1.8 | |
| |
| Common Stocks | 99.7 |
| Short-Term Investments and Net Other Assets (Liabilities) | 0.3 |
ASSET ALLOCATION (% of Fund's net assets) |
|
| | Common Stocks - 99.7 |
| | Short-Term Investments and Net Other Assets (Liabilities) - 0.3 |
| |
| United States | 91.1 |
| Canada | 2.2 |
| Israel | 1.6 |
| United Kingdom | 1.6 |
| Belgium | 0.9 |
| Puerto Rico | 0.8 |
| Brazil | 0.4 |
| Italy | 0.4 |
| France | 0.3 |
| Others | 0.7 |
GEOGRAPHIC DIVERSIFICATION (% of Fund's net assets) |
|
| | United States - 91.1 |
| | Canada - 2.2 |
| | Israel - 1.6 |
| | United Kingdom - 1.6 |
| | Belgium - 0.9 |
| | Puerto Rico - 0.8 |
| | Brazil - 0.4 |
| | Italy - 0.4 |
| | France - 0.3 |
| | Others - 0.7 |
| |
TOP HOLDINGS(% of Fund's net assets) | | |
| Reinsurance Group of America Inc | 1.5 | |
| US Foods Holding Corp | 1.4 | |
| ITT Inc | 1.4 | |
| Williams-Sonoma Inc | 1.3 | |
| East West Bancorp Inc | 1.3 | |
| Wintrust Financial Corp | 1.3 | |
| Primerica Inc | 1.2 | |
| Performance Food Group Co | 1.2 | |
| AptarGroup Inc | 1.2 | |
| Wix.com Ltd | 1.2 | |
| | 13.0 | |
How has the Fund changed?
This is a summary of certain changes to the Fund since January 1, 2024. For more complete information, you may review the Fund's next prospectus, which we expect to be available by April 30, 2025 at fundresearch.fidelity.com/prospectus/sec or upon request at 1-877-208-0098 or by sending an e-mail to funddocuments@fmr.com.
The fund's transfer agent and pricing & bookkeeping fees were changed to a fixed rate effective December 1, 2023. Effective March 1, 2024, the fund's management contract was amended to incorporate administrative services previously covered under separate services agreements (transfer agent and pricing & bookkeeping). The amended contract incorporates a management fee rate that may vary by class. The Adviser or an affiliate pays certain expenses of managing and operating the fund out of each class's management fee. | |
| Fidelity, the Fidelity Investments Logo and all other Fidelity trademarks or service marks used herein are trademarks or service marks of FMR LLC. Any third-party marks that are used herein are trademarks or service marks of their respective owners. © 2025 FMR LLC. All rights reserved. |
| | For additional information about the Fund; including its prospectus, financial information, holdings and proxy information, scan the QR code or visit fundresearch.fidelity.com/prospectus/sec 1.9914239.100 387-TSRA-0325 |
| |
| | ANNUAL SHAREHOLDER REPORT | AS OF DECEMBER 31, 2024 | This report describes changes to the Fund that occurred during the reporting period. |
| | VIP Dynamic Capital Appreciation Portfolio VIP Dynamic Capital Appreciation Portfolio Initial Class true |
| | | |
This annual shareholder report contains information about VIP Dynamic Capital Appreciation Portfolio for the period January 1, 2024 to December 31, 2024. You can find additional information about the Fund at fundresearch.fidelity.com/prospectus/sec. You can also request this information by contacting us at 1-877-208-0098 or by sending an e-mail to funddocuments@fmr.com.
What were your Fund costs for the last year?(based on hypothetical $10,000 investment)
FUND COST (PREVIOUS YEAR)
| | Costs of a $10,000 investment | Costs paid as a percentage of a $10,000 investment | |
| Initial Class | $ 70 | 0.62% | |
What affected the Fund's performance this period?
•U.S. equities gained in 2024, driven by a sturdy economy, the Federal Reserve's long-anticipated pivot to cutting interest rates and the potential for artificial intelligence to drive transformative change.
•Against this backdrop, security selection was the primary contributor to the fund's performance versus the S&P 500® index for the fiscal year, led by health care. Security selection in industrials, primarily within the capital goods industry, and information technology also boosted the fund's relative result.
•The top individual relative contributor was an overweight in Nvidia (+174%). The stock was the fund's biggest holding at period end. A second notable relative contributor was an overweight in GE Vernova (+137%). This was an investment we established this period. The company was one of the fund's largest holdings at period end. An overweight in Boston Scientific (+54%) also helped. The company was among the fund's largest holdings.
•In contrast, the biggest detractor from performance versus the benchmark was stock picking in consumer discretionary. An overweight in health care also hampered the fund's result, as did our picks and an underweight in communication services, primarily within the media & entertainment industry.
•Not owning Broadcom, a benchmark component that gained about 110%, was the biggest individual relative detractor. A non-benchmark stake in MongoDB returned approximately -39% and was the second-largest relative detractor. The stock was not held at period end. Not owning Tesla, a benchmark component that gained about 63%, also hurt.
•Notable changes in positioning include higher allocations to the consumer discretionary and financials sectors.
How did the Fund perform over the past 10 years?
CUMULATIVE PERFORMANCE
December 31, 2014 through December 31, 2024.
Initial investment of $10,000.
Initial Class | $10,000 | $10,130 | $10,421 | $12,910 | $12,279 | $15,973 | $21,341 | $26,596 | $21,046 | $27,164 | $34,098 |
S&P 500® Index | $10,000 | $10,138 | $11,351 | $13,829 | $13,223 | $17,386 | $20,585 | $26,494 | $21,696 | $27,399 | $34,254 |
| | 2014 | 2015 | 2016 | 2017 | 2018 | 2019 | 2020 | 2021 | 2022 | 2023 | 2024 |
AVERAGE ANNUAL TOTAL RETURNS:| | 1 Year | 5 Year | 10 Year |
| Initial Class | 25.52% | 16.38% | 13.05% |
| S&P 500® Index | 25.02% | 14.53% | 13.10% |
Visit institutional.fidelity.com for more recent performance information. |
The Fund's past performance is not a good predictor of the Fund's future performance. The graph and table do not reflect the deduction of taxes that a shareholder would pay on fund distributions or redemption of fund shares. |
Key Fund Statistics(as of December 31, 2024)
KEY FACTS | | |
| Fund Size | $279,787,748 | �� |
| Number of Holdings | 146 | |
| Total Advisory Fee | $1,666,387 | |
| Portfolio Turnover | 61% | |
What did the Fund invest in?
(as of December 31, 2024)
MARKET SECTORS (% of Fund's net assets) | | |
| Information Technology | 28.5 | |
| Health Care | 17.2 | |
| Financials | 13.2 | |
| Consumer Discretionary | 12.7 | |
| Industrials | 12.2 | |
| Communication Services | 7.5 | |
| Energy | 2.8 | |
| Materials | 2.6 | |
| Consumer Staples | 2.4 | |
| Real Estate | 0.8 | |
| |
| Common Stocks | 99.6 |
| Preferred Stocks | 0.3 |
| Preferred Securities | 0.0 |
| Bonds | 0.0 |
| Short-Term Investments and Net Other Assets (Liabilities) | 0.1 |
ASSET ALLOCATION (% of Fund's net assets) |
|
| | Common Stocks - 99.6 |
| | Preferred Stocks - 0.3 |
| | Preferred Securities - 0.0 |
| | Bonds - 0.0 |
| | Short-Term Investments and Net Other Assets (Liabilities) - 0.1 |
| |
| United States | 89.8 |
| China | 2.5 |
| Taiwan | 2.1 |
| Canada | 1.5 |
| Brazil | 0.9 |
| Israel | 0.8 |
| Belgium | 0.7 |
| Netherlands | 0.7 |
| Germany | 0.4 |
| Others | 0.6 |
GEOGRAPHIC DIVERSIFICATION (% of Fund's net assets) |
|
| | United States - 89.8 |
| | China - 2.5 |
| | Taiwan - 2.1 |
| | Canada - 1.5 |
| | Brazil - 0.9 |
| | Israel - 0.8 |
| | Belgium - 0.7 |
| | Netherlands - 0.7 |
| | Germany - 0.4 |
| | Others - 0.6 |
| |
TOP HOLDINGS(% of Fund's net assets) | | |
| NVIDIA Corp | 8.7 | |
| Apple Inc | 7.2 | |
| Amazon.com Inc | 5.2 | |
| Microsoft Corp | 4.5 | |
| Boston Scientific Corp | 3.1 | |
| Alphabet Inc Class A | 3.0 | |
| Mastercard Inc Class A | 2.8 | |
| Taiwan Semiconductor Manufacturing Co Ltd ADR | 2.0 | |
| Alphabet Inc Class C | 1.7 | |
| GE Vernova Inc | 1.6 | |
| | 39.8 | |
How has the Fund changed?
This is a summary of certain changes to the Fund since January 1, 2024. For more complete information, you may review the Fund's next prospectus, which we expect to be available by April 30, 2025 at fundresearch.fidelity.com/prospectus/sec or upon request at 1-877-208-0098 or by sending an e-mail to funddocuments@fmr.com.
The fund's transfer agent and pricing & bookkeeping fees were changed to a fixed rate effective December 1, 2023. Effective March 1, 2024, the fund's management contract was amended to incorporate administrative services previously covered under separate services agreements (transfer agent and pricing & bookkeeping). The amended contract incorporates a management fee rate that may vary by class. The Adviser or an affiliate pays certain expenses of managing and operating the fund out of each class's management fee. | |
| Fidelity, the Fidelity Investments Logo and all other Fidelity trademarks or service marks used herein are trademarks or service marks of FMR LLC. Any third-party marks that are used herein are trademarks or service marks of their respective owners. © 2025 FMR LLC. All rights reserved. |
| | For additional information about the Fund; including its prospectus, financial information, holdings and proxy information, scan the QR code or visit fundresearch.fidelity.com/prospectus/sec 1.9914206.100 786-TSRA-0325 |
| |
| | ANNUAL SHAREHOLDER REPORT | AS OF DECEMBER 31, 2024 | This report describes changes to the Fund that occurred during the reporting period. |
| | VIP Balanced Portfolio VIP Balanced Portfolio Investor Class true |
| | | |
This annual shareholder report contains information about VIP Balanced Portfolio for the period January 1, 2024 to December 31, 2024. You can find additional information about the Fund at fundresearch.fidelity.com/prospectus/sec. You can also request this information by contacting us at 1-877-208-0098 or by sending an e-mail to funddocuments@fmr.com.
What were your Fund costs for the last year?(based on hypothetical $10,000 investment)
FUND COST (PREVIOUS YEAR)
| | Costs of a $10,000 investment | Costs paid as a percentage of a $10,000 investment | |
| Investor Class | $ 54 | 0.50% | |
What affected the Fund's performance this period?
•U.S. equities posted a strong gain for the 12 months ending December 31, 2024, driven by a sturdy economy, the Federal Reserve's long-anticipated pivot to cutting interest rates and the potential for artificial intelligence to drive transformative change. On the other hand, U.S. taxable investment-grade bonds finished the year with a low single-digit gain, as the bond market reflected both three interest-rate reductions by the Fed and meaningful increases in U.S. Treasury yields.
•Against this backdrop, asset allocation - overweighting stocks and underweighting investment-grade bonds - meaningfully contributed to the fund's performance versus the Fidelity Balanced 60/40 Composite Index for the year. Investment choices in the bond subportfolio also helped the fund's relative result.
•Among stocks, picks in the health care and industrials sectors stood out as relative contributors. The top individual contributor was an overweight in Nvidia (+169%). We trimmed exposure to Nvidia, making it the fund's No. 2 holding as of December 31.
•Elsewhere, avoiding weak-performing index component Intel (-60%) boosted the fund's relative result. A non-Composite stake in UCB (+119%) - a new position in the equity subportfolio this period - further contributed.
•Conversely, security selection and an underweight in the information technology sector notably detracted from relative performance for the 12 months. Investment choices in consumer discretionary and communication services also hurt.
•Mostly avoiding Broadcom (+110%), where we established a position this period, detracted the most on a relative basis, followed by an overweight in Adobe (-25%) and SolarEdge Technologies (-85%). We trimmed our positions in both Adobe and SolarEdge this period.
•In fixed income, the fund notably benefited from exposure to asset-backed securities, including collateralized loan obligations, while the fund's yield-curve positioning modestly detracted for the year.
How did the Fund perform over the past 10 years?
CUMULATIVE PERFORMANCE
December 31, 2014 through December 31, 2024.
Initial investment of $10,000.
Investor Class | $10,000 | $10,052 | $10,774 | $12,528 | $11,992 | $14,916 | $18,250 | $21,566 | $17,678 | $21,464 | $24,863 |
Fidelity Balanced 60/40 Composite Index℠ | $10,000 | $10,128 | $10,970 | $12,529 | $12,235 | $14,948 | $17,150 | $19,869 | $16,732 | $19,689 | $22,651 |
S&P 500® Index | $10,000 | $10,138 | $11,351 | $13,829 | $13,223 | $17,386 | $20,585 | $26,494 | $21,696 | $27,399 | $34,254 |
| | 2014 | 2015 | 2016 | 2017 | 2018 | 2019 | 2020 | 2021 | 2022 | 2023 | 2024 |
AVERAGE ANNUAL TOTAL RETURNS:| | 1 Year | 5 Year | 10 Year |
| Investor Class | 15.83% | 10.76% | 9.54% |
| Fidelity Balanced 60/40 Composite Index℠ | 15.04% | 8.67% | 8.52% |
| S&P 500® Index | 25.02% | 14.53% | 13.10% |
Visit institutional.fidelity.com for more recent performance information. |
The Fund's past performance is not a good predictor of the Fund's future performance. The graph and table do not reflect the deduction of taxes that a shareholder would pay on fund distributions or redemption of fund shares. |
Key Fund Statistics(as of December 31, 2024)
KEY FACTS | | |
| Fund Size | $7,634,971,647 | |
| Number of Holdings | 332 | |
| Total Advisory Fee | $32,367,968 | |
| Portfolio Turnover | 33% | |
What did the Fund invest in?
(as of December 31, 2024)
The information in the following tables is based on the combined Investments of the Fund and it's pro-rata share of investments in Fidelity's Central Funds, other than the Commodity Strategy and Money Market Central Funds as applicable.
| U.S. Government and U.S. Government Agency Obligations | 22.3 |
| AAA | 2.4 |
| AA | 0.2 |
| A | 2.7 |
| BBB | 5.5 |
| BB | 0.6 |
| B | 0.3 |
| Not Rated | 0.4 |
| Equities | 65.4 |
| Short-Term Investments and Net Other Assets (Liabilities) | 0.2 |
QUALITY DIVERSIFICATION (% of Fund's net assets) |
| |
| | U.S. Government and U.S. Government Agency Obligations - 22.3 |
| | AAA - 2.4 |
| | AA - 0.2 |
| | A - 2.7 |
| | BBB - 5.5 |
| | BB - 0.6 |
| | B - 0.3 |
| | Not Rated - 0.4 |
| | Equities - 65.4 |
| | Short-Term Investments and Net Other Assets (Liabilities) - 0.2 |
| |
| We have used ratings from Moody's Investors Service, Inc. Where Moody's® ratings are not available, we have used S&P® ratings. All ratings are as of the date indicated and do not reflect subsequent changes. |
MARKET SECTORS (% of Fund's net assets) | | |
| Information Technology | 21.2 | |
| Financials | 13.3 | |
| Consumer Discretionary | 7.4 | |
| Communication Services | 7.3 | |
| Health Care | 7.1 | |
| Industrials | 5.6 | |
| Consumer Staples | 3.6 | |
| Energy | 3.0 | |
| Real Estate | 2.2 | |
| Utilities | 1.9 | |
| Materials | 1.1 | |
| |
| Common Stocks | 65.2 |
| Bonds | 34.4 |
| Preferred Stocks | 0.2 |
| Short-Term Investments and Net Other Assets (Liabilities) | 0.2 |
ASSET ALLOCATION (% of Fund's net assets) |
|
| | Common Stocks - 65.2 |
| | Bonds - 34.4 |
| | Preferred Stocks - 0.2 |
| | Short-Term Investments and Net Other Assets (Liabilities) - 0.2 |
| |
TOP HOLDINGS(% of Fund's net assets) | | |
| US Treasury Notes | 12.5 | |
| Apple Inc | 5.3 | |
| NVIDIA Corp | 4.9 | |
| Microsoft Corp | 4.7 | |
| US Treasury Bonds | 3.8 | |
| Alphabet Inc Class A | 3.3 | |
| Amazon.com Inc | 3.1 | |
| Fannie Mae Mortgage pass-thru certificates | 2.2 | |
| Meta Platforms Inc Class A | 1.8 | |
| Ginnie Mae II Pool | 1.7 | |
| | 43.3 | |
How has the Fund changed?
This is a summary of certain changes to the Fund since January 1, 2024. For more complete information, you may review the Fund's next prospectus, which we expect to be available by April 30, 2025 at fundresearch.fidelity.com/prospectus/sec or upon request at 1-877-208-0098 or by sending an e-mail to funddocuments@fmr.com.
The fees associated with this class changed during the reporting year. The variations in class fees are primarily the result of the following changes: The fund's transfer agent and pricing & bookkeeping fees were changed to a fixed rate effective December 1, 2023. Effective March 1, 2024, the fund's management contract was amended to incorporate administrative services previously covered under separate services agreements (transfer agent and pricing & bookkeeping). The amended contract incorporates a management fee rate that may vary by class. The Adviser or an affiliate pays certain expenses of managing and operating the fund out of each class's management fee. | |
| Fidelity, the Fidelity Investments Logo and all other Fidelity trademarks or service marks used herein are trademarks or service marks of FMR LLC. Any third-party marks that are used herein are trademarks or service marks of their respective owners. © 2025 FMR LLC. All rights reserved. |
| | For additional information about the Fund; including its prospectus, financial information, holdings and proxy information, scan the QR code or visit fundresearch.fidelity.com/prospectus/sec 1.9914216.100 1462-TSRA-0325 |
| |
| | ANNUAL SHAREHOLDER REPORT | AS OF DECEMBER 31, 2024 | This report describes changes to the Fund that occurred during the reporting period. |
| | VIP Mid Cap Portfolio VIP Mid Cap Portfolio Service Class true |
| | | |
This annual shareholder report contains information about VIP Mid Cap Portfolio for the period January 1, 2024 to December 31, 2024. You can find additional information about the Fund at fundresearch.fidelity.com/prospectus/sec. You can also request this information by contacting us at 1-877-208-0098 or by sending an e-mail to funddocuments@fmr.com.
What were your Fund costs for the last year?(based on hypothetical $10,000 investment)
FUND COST (PREVIOUS YEAR)
| | Costs of a $10,000 investment | Costs paid as a percentage of a $10,000 investment | |
| Service Class | $ 73 | 0.67% | |
What affected the Fund's performance this period?
•U.S. equities gained in 2024, driven by a sturdy economy, the Federal Reserve's long-anticipated pivot to cutting interest rates and the potential for artificial intelligence to drive transformative change.
•Against this backdrop, security selection was the primary contributor to the fund's performance versus the S&P MidCap 400 Index for the year, led by the consumer discretionary sector. Picks in consumer staples and financials, primarily banks, also boosted the fund's relative performance.
•The fund's non-benchmark stake in Vertiv Holdings gained 141% and was the top individual relative contributor. This period we decreased our position in the stock. An overweight in Deckers Outdoor (+83%) helped as well. This period we decreased our position in Deckers Outdoor. Another notable relative contributor was our non-benchmark stake in Howmet Aerospace (+110%). The stock was not held at period end.
•In contrast, the biggest detractor from performance versus the benchmark was stock picking in information technology. Also hurting our result was security selection in energy and utilities. Lastly, the fund's position in cash further detracted.
•Not owning Texas Pacific Land, a benchmark component that gained 117%, was the biggest individual relative detractor. Our stake in Super Micro Computer (+276%) also hurt. The stock was not held at period end. A holding in Emcor (+111%) detracted as well. This was an investment we established in 2024.
•Notable changes in positioning include increased exposure to the health care and financials sectors.
How did the Fund perform over the past 10 years?
CUMULATIVE PERFORMANCE
December 31, 2014 through December 31, 2024.
Initial investment of $10,000.
Service Class | $10,000 | $9,850 | $11,043 | $13,329 | $11,378 | $14,035 | $16,566 | $20,792 | $17,703 | $20,359 | $23,892 |
S&P MidCap 400® Index | $10,000 | $9,782 | $11,811 | $13,730 | $12,208 | $15,407 | $17,511 | $21,847 | $18,993 | $22,115 | $25,196 |
Russell 3000® Index | $10,000 | $10,048 | $11,327 | $13,721 | $13,002 | $17,035 | $20,593 | $25,877 | $20,907 | $26,334 | $32,604 |
| | 2014 | 2015 | 2016 | 2017 | 2018 | 2019 | 2020 | 2021 | 2022 | 2023 | 2024 |
AVERAGE ANNUAL TOTAL RETURNS:| | 1 Year | 5 Year | 10 Year |
| Service Class | 17.35% | 11.23% | 9.10% |
| S&P MidCap 400® Index | 13.93% | 10.34% | 9.68% |
| Russell 3000® Index | 23.81% | 13.86% | 12.55% |
Visit institutional.fidelity.com for more recent performance information. |
The Fund's past performance is not a good predictor of the Fund's future performance. The graph and table do not reflect the deduction of taxes that a shareholder would pay on fund distributions or redemption of fund shares. |
Key Fund Statistics(as of December 31, 2024)
KEY FACTS | | |
| Fund Size | $7,489,948,736 | |
| Number of Holdings | 180 | |
| Total Advisory Fee | $40,873,181 | |
| Portfolio Turnover | 52% | |
What did the Fund invest in?
(as of December 31, 2024)
MARKET SECTORS (% of Fund's net assets) | | |
| Financials | 20.1 | |
| Industrials | 18.1 | |
| Consumer Discretionary | 12.3 | |
| Health Care | 11.7 | |
| Information Technology | 9.7 | |
| Real Estate | 6.5 | |
| Energy | 6.0 | |
| Materials | 5.2 | |
| Consumer Staples | 4.9 | |
| Utilities | 3.4 | |
| Communication Services | 1.8 | |
| |
| Common Stocks | 99.7 |
| Short-Term Investments and Net Other Assets (Liabilities) | 0.3 |
ASSET ALLOCATION (% of Fund's net assets) |
|
| | Common Stocks - 99.7 |
| | Short-Term Investments and Net Other Assets (Liabilities) - 0.3 |
| |
| United States | 91.1 |
| Canada | 2.2 |
| Israel | 1.6 |
| United Kingdom | 1.6 |
| Belgium | 0.9 |
| Puerto Rico | 0.8 |
| Brazil | 0.4 |
| Italy | 0.4 |
| France | 0.3 |
| Others | 0.7 |
GEOGRAPHIC DIVERSIFICATION (% of Fund's net assets) |
|
| | United States - 91.1 |
| | Canada - 2.2 |
| | Israel - 1.6 |
| | United Kingdom - 1.6 |
| | Belgium - 0.9 |
| | Puerto Rico - 0.8 |
| | Brazil - 0.4 |
| | Italy - 0.4 |
| | France - 0.3 |
| | Others - 0.7 |
| |
TOP HOLDINGS(% of Fund's net assets) | | |
| Reinsurance Group of America Inc | 1.5 | |
| US Foods Holding Corp | 1.4 | |
| ITT Inc | 1.4 | |
| Williams-Sonoma Inc | 1.3 | |
| East West Bancorp Inc | 1.3 | |
| Wintrust Financial Corp | 1.3 | |
| Primerica Inc | 1.2 | |
| Performance Food Group Co | 1.2 | |
| AptarGroup Inc | 1.2 | |
| Wix.com Ltd | 1.2 | |
| | 13.0 | |
How has the Fund changed?
This is a summary of certain changes to the Fund since January 1, 2024. For more complete information, you may review the Fund's next prospectus, which we expect to be available by April 30, 2025 at fundresearch.fidelity.com/prospectus/sec or upon request at 1-877-208-0098 or by sending an e-mail to funddocuments@fmr.com.
The fund's transfer agent and pricing & bookkeeping fees were changed to a fixed rate effective December 1, 2023. Effective March 1, 2024, the fund's management contract was amended to incorporate administrative services previously covered under separate services agreements (transfer agent and pricing & bookkeeping). The amended contract incorporates a management fee rate that may vary by class. The Adviser or an affiliate pays certain expenses of managing and operating the fund out of each class's management fee. | |
| Fidelity, the Fidelity Investments Logo and all other Fidelity trademarks or service marks used herein are trademarks or service marks of FMR LLC. Any third-party marks that are used herein are trademarks or service marks of their respective owners. © 2025 FMR LLC. All rights reserved. |
| | For additional information about the Fund; including its prospectus, financial information, holdings and proxy information, scan the QR code or visit fundresearch.fidelity.com/prospectus/sec 1.9914241.100 773-TSRA-0325 |
| |
| | ANNUAL SHAREHOLDER REPORT | AS OF DECEMBER 31, 2024 | This report describes changes to the Fund that occurred during the reporting period. |
| | VIP Growth & Income Portfolio VIP Growth & Income Portfolio Initial Class true |
| | | |
This annual shareholder report contains information about VIP Growth & Income Portfolio for the period January 1, 2024 to December 31, 2024. You can find additional information about the Fund at fundresearch.fidelity.com/prospectus/sec. You can also request this information by contacting us at 1-877-208-0098 or by sending an e-mail to funddocuments@fmr.com.
What were your Fund costs for the last year?(based on hypothetical $10,000 investment)
FUND COST (PREVIOUS YEAR)
| | Costs of a $10,000 investment | Costs paid as a percentage of a $10,000 investment | |
| Initial Class | $ 54 | 0.49% | |
What affected the Fund's performance this period?
•U.S. equities gained in 2024, driven by a sturdy economy, the Federal Reserve's long-anticipated pivot to cutting interest rates and the potential for artificial intelligence to drive transformative change.
•Against this backdrop, market selection was the primary detractor from the fund's performance versus the S&P 500® index for the fiscal year, especially an overweight in energy. Security selection and an underweight in communication services, primarily within the media & entertainment industry, also hampered the fund's result. Also hurting our result was an underweight in information technology, primarily within the semiconductors & semiconductor equipment industry.
•The largest individual relative detractor was an underweight in Nvidia (+171%), which was among the largest holdings. A second notable relative detractor was an overweight in Boeing (-33%). The company was one of the fund's biggest holdings this period. An underweight in Meta Platforms (+66%) also detracted. This was an investment we established this period.
•In contrast, the biggest contributor to performance versus the benchmark was security selection in industrials, primarily within the capital goods industry. Stock picking in health care also boosted relative performance. Also lifting the fund's relative result were stock picks and an overweight in financials, primarily within the banks industry.
•The top individual relative contributor was an overweight in GE Aerospace (+66%). The company was one of the fund's biggest holdings. A second notable relative contributor was an overweight in GE Vernova (+127%). This was an investment we established this period. The company also was among our biggest holdings at period end. An overweight in Wells Fargo (+43%) also helped. The company, too, was a sizable holding.
•Notable changes in positioning include a higher allocation to information technology.
How did the Fund perform over the past 10 years?
CUMULATIVE PERFORMANCE
December 31, 2014 through December 31, 2024.
Initial investment of $10,000.
Initial Class | $10,000 | $9,773 | $11,344 | $13,261 | $12,070 | $15,697 | $16,929 | $21,322 | $20,267 | $24,061 | $29,405 |
S&P 500® Index | $10,000 | $10,138 | $11,351 | $13,829 | $13,223 | $17,386 | $20,585 | $26,494 | $21,696 | $27,399 | $34,254 |
| | 2014 | 2015 | 2016 | 2017 | 2018 | 2019 | 2020 | 2021 | 2022 | 2023 | 2024 |
AVERAGE ANNUAL TOTAL RETURNS:| | 1 Year | 5 Year | 10 Year |
| Initial Class | 22.21% | 13.38% | 11.39% |
| S&P 500® Index | 25.02% | 14.53% | 13.10% |
Visit institutional.fidelity.com for more recent performance information. |
The Fund's past performance is not a good predictor of the Fund's future performance. The graph and table do not reflect the deduction of taxes that a shareholder would pay on fund distributions or redemption of fund shares. |
Key Fund Statistics(as of December 31, 2024)
KEY FACTS | | |
| Fund Size | $2,444,208,883 | |
| Number of Holdings | 177 | |
| Total Advisory Fee | $11,224,574 | |
| Portfolio Turnover | 14% | |
What did the Fund invest in?
(as of December 31, 2024)
MARKET SECTORS (% of Fund's net assets) | | |
| Information Technology | 23.4 | |
| Financials | 20.2 | |
| Industrials | 16.4 | |
| Health Care | 11.0 | |
| Energy | 8.9 | |
| Consumer Staples | 5.9 | |
| Communication Services | 4.5 | |
| Utilities | 2.4 | |
| Consumer Discretionary | 2.0 | |
| Real Estate | 1.2 | |
| Materials | 1.1 | |
| |
| Common Stocks | 96.0 |
| Preferred Stocks | 0.9 |
| Bonds | 0.1 |
| Short-Term Investments and Net Other Assets (Liabilities) | 3.0 |
ASSET ALLOCATION (% of Fund's net assets) |
|
| | Common Stocks - 96.0 |
| | Preferred Stocks - 0.9 |
| | Bonds - 0.1 |
| | Short-Term Investments and Net Other Assets (Liabilities) - 3.0 |
| |
| United States | 91.0 |
| Canada | 1.5 |
| Germany | 1.5 |
| United Kingdom | 1.2 |
| Netherlands | 1.0 |
| Belgium | 0.9 |
| France | 0.8 |
| Zambia | 0.7 |
| Taiwan | 0.6 |
| Others | 0.8 |
GEOGRAPHIC DIVERSIFICATION (% of Fund's net assets) |
|
| | United States - 91.0 |
| | Canada - 1.5 |
| | Germany - 1.5 |
| | United Kingdom - 1.2 |
| | Netherlands - 1.0 |
| | Belgium - 0.9 |
| | France - 0.8 |
| | Zambia - 0.7 |
| | Taiwan - 0.6 |
| | Others - 0.8 |
| |
TOP HOLDINGS(% of Fund's net assets) | | |
| Microsoft Corp | 7.5 | |
| Wells Fargo & Co | 6.5 | |
| Exxon Mobil Corp | 5.8 | |
| GE Aerospace | 4.6 | |
| NVIDIA Corp | 4.1 | |
| Apple Inc | 3.2 | |
| Bank of America Corp | 2.9 | |
| Visa Inc Class A | 2.3 | |
| GE Vernova Inc | 2.2 | |
| UnitedHealth Group Inc | 1.8 | |
| | 40.9 | |
How has the Fund changed?
This is a summary of certain changes to the Fund since January 1, 2024. For more complete information, you may review the Fund's next prospectus, which we expect to be available by April 30, 2025 at fundresearch.fidelity.com/prospectus/sec or upon request at 1-877-208-0098 or by sending an e-mail to funddocuments@fmr.com.
The fees associated with this class changed during the reporting year. The variations in class fees are primarily the result of the following changes: The fund's transfer agent and pricing & bookkeeping fees were changed to a fixed rate effective December 1, 2023. Effective March 1, 2024, the fund's management contract was amended to incorporate administrative services previously covered under separate services agreements (transfer agent and pricing & bookkeeping). The amended contract incorporates a management fee rate that may vary by class. The Adviser or an affiliate pays certain expenses of managing and operating the fund out of each class's management fee. | |
| Fidelity, the Fidelity Investments Logo and all other Fidelity trademarks or service marks used herein are trademarks or service marks of FMR LLC. Any third-party marks that are used herein are trademarks or service marks of their respective owners. © 2025 FMR LLC. All rights reserved. |
| | For additional information about the Fund; including its prospectus, financial information, holdings and proxy information, scan the QR code or visit fundresearch.fidelity.com/prospectus/sec 1.9914147.100 147-TSRA-0325 |
| |
| | ANNUAL SHAREHOLDER REPORT | AS OF DECEMBER 31, 2024 | This report describes changes to the Fund that occurred during the reporting period. |
| | VIP Dynamic Capital Appreciation Portfolio VIP Dynamic Capital Appreciation Portfolio Investor Class true |
| | | |
This annual shareholder report contains information about VIP Dynamic Capital Appreciation Portfolio for the period January 1, 2024 to December 31, 2024. You can find additional information about the Fund at fundresearch.fidelity.com/prospectus/sec. You can also request this information by contacting us at 1-877-208-0098 or by sending an e-mail to funddocuments@fmr.com.
What were your Fund costs for the last year?(based on hypothetical $10,000 investment)
FUND COST (PREVIOUS YEAR)
| | Costs of a $10,000 investment | Costs paid as a percentage of a $10,000 investment | |
| Investor Class | $ 79 | 0.70% | |
What affected the Fund's performance this period?
•U.S. equities gained in 2024, driven by a sturdy economy, the Federal Reserve's long-anticipated pivot to cutting interest rates and the potential for artificial intelligence to drive transformative change.
•Against this backdrop, security selection was the primary contributor to the fund's performance versus the S&P 500® index for the fiscal year, led by health care. Security selection in industrials, primarily within the capital goods industry, and information technology also boosted the fund's relative result.
•The top individual relative contributor was an overweight in Nvidia (+174%). The stock was the fund's biggest holding at period end. A second notable relative contributor was an overweight in GE Vernova (+137%). This was an investment we established this period. The company was one of the fund's largest holdings at period end. An overweight in Boston Scientific (+54%) also helped. The company was among the fund's largest holdings.
•In contrast, the biggest detractor from performance versus the benchmark was stock picking in consumer discretionary. An overweight in health care also hampered the fund's result, as did our picks and an underweight in communication services, primarily within the media & entertainment industry.
•Not owning Broadcom, a benchmark component that gained about 110%, was the biggest individual relative detractor. A non-benchmark stake in MongoDB returned approximately -39% and was the second-largest relative detractor. The stock was not held at period end. Not owning Tesla, a benchmark component that gained about 63%, also hurt.
•Notable changes in positioning include higher allocations to the consumer discretionary and financials sectors.
How did the Fund perform over the past 10 years?
CUMULATIVE PERFORMANCE
December 31, 2014 through December 31, 2024.
Initial investment of $10,000.
Investor Class | $10,000 | $10,122 | $10,406 | $12,876 | $12,233 | $15,911 | $21,247 | $26,444 | $20,921 | $26,972 | $33,829 |
S&P 500® Index | $10,000 | $10,138 | $11,351 | $13,829 | $13,223 | $17,386 | $20,585 | $26,494 | $21,696 | $27,399 | $34,254 |
| | 2014 | 2015 | 2016 | 2017 | 2018 | 2019 | 2020 | 2021 | 2022 | 2023 | 2024 |
AVERAGE ANNUAL TOTAL RETURNS:| | 1 Year | 5 Year | 10 Year |
| Investor Class | 25.42% | 16.28% | 12.96% |
| S&P 500® Index | 25.02% | 14.53% | 13.10% |
Visit institutional.fidelity.com for more recent performance information. |
The Fund's past performance is not a good predictor of the Fund's future performance. The graph and table do not reflect the deduction of taxes that a shareholder would pay on fund distributions or redemption of fund shares. |
Key Fund Statistics(as of December 31, 2024)
KEY FACTS | | |
| Fund Size | $279,787,748 | |
| Number of Holdings | 146 | |
| Total Advisory Fee | $1,666,387 | |
| Portfolio Turnover | 61% | |
What did the Fund invest in?
(as of December 31, 2024)
MARKET SECTORS (% of Fund's net assets) | | |
| Information Technology | 28.5 | |
| Health Care | 17.2 | |
| Financials | 13.2 | |
| Consumer Discretionary | 12.7 | |
| Industrials | 12.2 | |
| Communication Services | 7.5 | |
| Energy | 2.8 | |
| Materials | 2.6 | |
| Consumer Staples | 2.4 | |
| Real Estate | 0.8 | |
| |
| Common Stocks | 99.6 |
| Preferred Stocks | 0.3 |
| Preferred Securities | 0.0 |
| Bonds | 0.0 |
| Short-Term Investments and Net Other Assets (Liabilities) | 0.1 |
ASSET ALLOCATION (% of Fund's net assets) |
|
| | Common Stocks - 99.6 |
| | Preferred Stocks - 0.3 |
| | Preferred Securities - 0.0 |
| | Bonds - 0.0 |
| | Short-Term Investments and Net Other Assets (Liabilities) - 0.1 |
| |
| United States | 89.8 |
| China | 2.5 |
| Taiwan | 2.1 |
| Canada | 1.5 |
| Brazil | 0.9 |
| Israel | 0.8 |
| Belgium | 0.7 |
| Netherlands | 0.7 |
| Germany | 0.4 |
| Others | 0.6 |
GEOGRAPHIC DIVERSIFICATION (% of Fund's net assets) |
|
| | United States - 89.8 |
| | China - 2.5 |
| | Taiwan - 2.1 |
| | Canada - 1.5 |
| | Brazil - 0.9 |
| | Israel - 0.8 |
| | Belgium - 0.7 |
| | Netherlands - 0.7 |
| | Germany - 0.4 |
| | Others - 0.6 |
| |
TOP HOLDINGS(% of Fund's net assets) | | |
| NVIDIA Corp | 8.7 | |
| Apple Inc | 7.2 | |
| Amazon.com Inc | 5.2 | |
| Microsoft Corp | 4.5 | |
| Boston Scientific Corp | 3.1 | |
| Alphabet Inc Class A | 3.0 | |
| Mastercard Inc Class A | 2.8 | |
| Taiwan Semiconductor Manufacturing Co Ltd ADR | 2.0 | |
| Alphabet Inc Class C | 1.7 | |
| GE Vernova Inc | 1.6 | |
| | 39.8 | |
How has the Fund changed?
This is a summary of certain changes to the Fund since January 1, 2024. For more complete information, you may review the Fund's next prospectus, which we expect to be available by April 30, 2025 at fundresearch.fidelity.com/prospectus/sec or upon request at 1-877-208-0098 or by sending an e-mail to funddocuments@fmr.com.
The fund's transfer agent and pricing & bookkeeping fees were changed to a fixed rate effective December 1, 2023. Effective March 1, 2024, the fund's management contract was amended to incorporate administrative services previously covered under separate services agreements (transfer agent and pricing & bookkeeping). The amended contract incorporates a management fee rate that may vary by class. The Adviser or an affiliate pays certain expenses of managing and operating the fund out of each class's management fee. | |
| Fidelity, the Fidelity Investments Logo and all other Fidelity trademarks or service marks used herein are trademarks or service marks of FMR LLC. Any third-party marks that are used herein are trademarks or service marks of their respective owners. © 2025 FMR LLC. All rights reserved. |
| | For additional information about the Fund; including its prospectus, financial information, holdings and proxy information, scan the QR code or visit fundresearch.fidelity.com/prospectus/sec 1.9914205.100 1463-TSRA-0325 |
| |
| | ANNUAL SHAREHOLDER REPORT | AS OF DECEMBER 31, 2024 | This report describes changes to the Fund that occurred during the reporting period. |
| | VIP Value Strategies Portfolio VIP Value Strategies Portfolio Service Class true |
| | | |
This annual shareholder report contains information about VIP Value Strategies Portfolio for the period January 1, 2024 to December 31, 2024. You can find additional information about the Fund at fundresearch.fidelity.com/prospectus/sec. You can also request this information by contacting us at 1-877-208-0098 or by sending an e-mail to funddocuments@fmr.com.
What were your Fund costs for the last year?(based on hypothetical $10,000 investment)
FUND COST (PREVIOUS YEAR)
| | Costs of a $10,000 investment | Costs paid as a percentage of a $10,000 investment | |
| Service Class | $ 73 | 0.70% | |
What affected the Fund's performance this period?
•U.S. equities gained in 2024, driven by a sturdy economy, the Federal Reserve's long-anticipated pivot to cutting interest rates and the potential for artificial intelligence to drive transformative change.
•Against this backdrop, security selection was the primary detractor from the fund's performance versus the Russell Midcap Value Index for the fiscal year, especially within the consumer discretionary sector. Stock picking and an overweight in industrials also hampered the fund's result. Investment choices in communication services hurt as well.
•The biggest individual relative detractor was our non-benchmark stake in CVS Health (-41%). An overweight in Chemours (-44%) and position in Centene (-20%) also hurt. The latter stock was not held at period end but was among the fund's biggest holdings in 2024.
•In contrast, the biggest contributor to performance versus the benchmark was stock selection in information technology, primarily within the technology hardware & equipment industry. Picks in utilities also boosted relative performance. An overweight in financials, primarily within the financial services industry, helped as well.
•The top individual relative contributor was an overweight in Constellation Energy (+88%). This period we decreased our stake in Constellation Energy although it was among our largest holdings this period. A non-benchmark stake in Apollo Global Management gained approximately 80% and further bolstered relative performance. The stock was one of our largest holdings. A non-benchmark stake in Targa Resources (+111%) also helped.
•Notable changes in positioning include decreased exposure to the utilities and real estate sectors.
How did the Fund perform over the past 10 years?
CUMULATIVE PERFORMANCE
December 31, 2014 through December 31, 2024.
Initial investment of $10,000.
Service Class | $10,000 | $9,695 | $10,613 | $12,652 | $10,460 | $14,046 | $15,195 | $20,282 | $18,823 | $22,733 | $24,841 |
Russell Midcap® Value Index | $10,000 | $9,522 | $11,426 | $12,951 | $11,359 | $14,433 | $15,150 | $19,443 | $17,104 | $19,278 | $21,798 |
Russell 3000® Index | $10,000 | $10,048 | $11,327 | $13,721 | $13,002 | $17,035 | $20,593 | $25,877 | $20,907 | $26,334 | $32,604 |
| | 2014 | 2015 | 2016 | 2017 | 2018 | 2019 | 2020 | 2021 | 2022 | 2023 | 2024 |
AVERAGE ANNUAL TOTAL RETURNS:| | 1 Year | 5 Year | 10 Year |
| Service Class | 9.27% | 12.08% | 9.53% |
| Russell Midcap® Value Index | 13.07% | 8.59% | 8.10% |
| Russell 3000® Index | 23.81% | 13.86% | 12.55% |
Visit institutional.fidelity.com for more recent performance information. |
The Fund's past performance is not a good predictor of the Fund's future performance. The graph and table do not reflect the deduction of taxes that a shareholder would pay on fund distributions or redemption of fund shares. |
Key Fund Statistics(as of December 31, 2024)
KEY FACTS | | |
| Fund Size | $938,382,301 | |
| Number of Holdings | 116 | |
| Total Advisory Fee | $4,291,907 | |
| Portfolio Turnover | 66% | |
What did the Fund invest in?
(as of December 31, 2024)
MARKET SECTORS (% of Fund's net assets) | | |
| Financials | 21.4 | |
| Industrials | 18.7 | |
| Consumer Discretionary | 9.4 | |
| Materials | 7.9 | |
| Energy | 6.9 | |
| Information Technology | 6.9 | |
| Real Estate | 6.3 | |
| Health Care | 5.9 | |
| Consumer Staples | 5.3 | |
| Utilities | 5.2 | |
| Communication Services | 2.4 | |
| |
| Common Stocks | 96.3 |
| Short-Term Investments and Net Other Assets (Liabilities) | 3.7 |
ASSET ALLOCATION (% of Fund's net assets) |
|
| | Common Stocks - 96.3 |
| | Short-Term Investments and Net Other Assets (Liabilities) - 3.7 |
| |
| United States | 91.2 |
| Canada | 4.0 |
| Bailiwick Of Jersey | 0.9 |
| Spain | 0.7 |
| Puerto Rico | 0.7 |
| India | 0.7 |
| Portugal | 0.5 |
| Sweden | 0.5 |
| United Kingdom | 0.4 |
| Others | 0.4 |
GEOGRAPHIC DIVERSIFICATION (% of Fund's net assets) |
|
| | United States - 91.2 |
| | Canada - 4.0 |
| | Bailiwick Of Jersey - 0.9 |
| | Spain - 0.7 |
| | Puerto Rico - 0.7 |
| | India - 0.7 |
| | Portugal - 0.5 |
| | Sweden - 0.5 |
| | United Kingdom - 0.4 |
| | Others - 0.4 |
| |
TOP HOLDINGS(% of Fund's net assets) | | |
| Global Payments Inc | 1.9 | |
| Apollo Global Management Inc | 1.9 | |
| East West Bancorp Inc | 1.9 | |
| First Citizens BancShares Inc/NC Class A | 1.8 | |
| Canadian Natural Resources Ltd | 1.6 | |
| PG&E Corp | 1.5 | |
| Ventas Inc | 1.5 | |
| Ameriprise Financial Inc | 1.5 | |
| Jabil Inc | 1.5 | |
| ON Semiconductor Corp | 1.3 | |
| | 16.4 | |
How has the Fund changed?
This is a summary of certain changes to the Fund since January 1, 2024. For more complete information, you may review the Fund's next prospectus, which we expect to be available by April 30, 2025 at fundresearch.fidelity.com/prospectus/sec or upon request at 1-877-208-0098 or by sending an e-mail to funddocuments@fmr.com.
The fund's transfer agent and pricing & bookkeeping fees were changed to a fixed rate effective December 1, 2023. Effective March 1, 2024, the fund's management contract was amended to incorporate administrative services previously covered under separate services agreements (transfer agent and pricing & bookkeeping). The amended contract incorporates a management fee rate that may vary by class. The Adviser or an affiliate pays certain expenses of managing and operating the fund out of each class's management fee. | |
| Fidelity, the Fidelity Investments Logo and all other Fidelity trademarks or service marks used herein are trademarks or service marks of FMR LLC. Any third-party marks that are used herein are trademarks or service marks of their respective owners. © 2025 FMR LLC. All rights reserved. |
| | For additional information about the Fund; including its prospectus, financial information, holdings and proxy information, scan the QR code or visit fundresearch.fidelity.com/prospectus/sec 1.9914243.100 1025-TSRA-0325 |
| |
| | ANNUAL SHAREHOLDER REPORT | AS OF DECEMBER 31, 2024 | This report describes changes to the Fund that occurred during the reporting period. |
| | VIP Value Strategies Portfolio VIP Value Strategies Portfolio Investor Class true |
| | | |
This annual shareholder report contains information about VIP Value Strategies Portfolio for the period January 1, 2024 to December 31, 2024. You can find additional information about the Fund at fundresearch.fidelity.com/prospectus/sec. You can also request this information by contacting us at 1-877-208-0098 or by sending an e-mail to funddocuments@fmr.com.
What were your Fund costs for the last year?(based on hypothetical $10,000 investment)
FUND COST (PREVIOUS YEAR)
| | Costs of a $10,000 investment | Costs paid as a percentage of a $10,000 investment | |
| Investor Class | $ 70 | 0.66% | |
What affected the Fund's performance this period?
•U.S. equities gained in 2024, driven by a sturdy economy, the Federal Reserve's long-anticipated pivot to cutting interest rates and the potential for artificial intelligence to drive transformative change.
•Against this backdrop, security selection was the primary detractor from the fund's performance versus the Russell Midcap Value Index for the fiscal year, especially within the consumer discretionary sector. Stock picking and an overweight in industrials also hampered the fund's result. Investment choices in communication services hurt as well.
•The biggest individual relative detractor was our non-benchmark stake in CVS Health (-41%). An overweight in Chemours (-44%) and position in Centene (-20%) also hurt. The latter stock was not held at period end but was among the fund's biggest holdings in 2024.
•In contrast, the biggest contributor to performance versus the benchmark was stock selection in information technology, primarily within the technology hardware & equipment industry. Picks in utilities also boosted relative performance. An overweight in financials, primarily within the financial services industry, helped as well.
•The top individual relative contributor was an overweight in Constellation Energy (+88%). This period we decreased our stake in Constellation Energy although it was among our largest holdings this period. A non-benchmark stake in Apollo Global Management gained approximately 80% and further bolstered relative performance. The stock was one of our largest holdings. A non-benchmark stake in Targa Resources (+111%) also helped.
•Notable changes in positioning include decreased exposure to the utilities and real estate sectors.
How did the Fund perform over the past 10 years?
CUMULATIVE PERFORMANCE
December 31, 2014 through December 31, 2024.
Initial investment of $10,000.
Investor Class | $10,000 | $9,693 | $10,617 | $12,666 | $10,466 | $14,053 | $15,214 | $20,308 | $18,864 | $22,778 | $24,912 |
Russell Midcap® Value Index | $10,000 | $9,522 | $11,426 | $12,951 | $11,359 | $14,433 | $15,150 | $19,443 | $17,104 | $19,278 | $21,798 |
Russell 3000® Index | $10,000 | $10,048 | $11,327 | $13,721 | $13,002 | $17,035 | $20,593 | $25,877 | $20,907 | $26,334 | $32,604 |
| | 2014 | 2015 | 2016 | 2017 | 2018 | 2019 | 2020 | 2021 | 2022 | 2023 | 2024 |
AVERAGE ANNUAL TOTAL RETURNS:| | 1 Year | 5 Year | 10 Year |
| Investor Class | 9.37% | 12.13% | 9.56% |
| Russell Midcap® Value Index | 13.07% | 8.59% | 8.10% |
| Russell 3000® Index | 23.81% | 13.86% | 12.55% |
Visit institutional.fidelity.com for more recent performance information. |
The Fund's past performance is not a good predictor of the Fund's future performance. The graph and table do not reflect the deduction of taxes that a shareholder would pay on fund distributions or redemption of fund shares. |
Key Fund Statistics(as of December 31, 2024)
KEY FACTS | | |
| Fund Size | $938,382,301 | |
| Number of Holdings | 116 | |
| Total Advisory Fee | $4,291,907 | |
| Portfolio Turnover | 66% | |
What did the Fund invest in?
(as of December 31, 2024)
MARKET SECTORS (% of Fund's net assets) | | |
| Financials | 21.4 | |
| Industrials | 18.7 | |
| Consumer Discretionary | 9.4 | |
| Materials | 7.9 | |
| Energy | 6.9 | |
| Information Technology | 6.9 | |
| Real Estate | 6.3 | |
| Health Care | 5.9 | |
| Consumer Staples | 5.3 | |
| Utilities | 5.2 | |
| Communication Services | 2.4 | |
| |
| Common Stocks | 96.3 |
| Short-Term Investments and Net Other Assets (Liabilities) | 3.7 |
ASSET ALLOCATION (% of Fund's net assets) |
|
| | Common Stocks - 96.3 |
| | Short-Term Investments and Net Other Assets (Liabilities) - 3.7 |
| |
| United States | 91.2 |
| Canada | 4.0 |
| Bailiwick Of Jersey | 0.9 |
| Spain | 0.7 |
| Puerto Rico | 0.7 |
| India | 0.7 |
| Portugal | 0.5 |
| Sweden | 0.5 |
| United Kingdom | 0.4 |
| Others | 0.4 |
GEOGRAPHIC DIVERSIFICATION (% of Fund's net assets) |
|
| | United States - 91.2 |
| | Canada - 4.0 |
| | Bailiwick Of Jersey - 0.9 |
| | Spain - 0.7 |
| | Puerto Rico - 0.7 |
| | India - 0.7 |
| | Portugal - 0.5 |
| | Sweden - 0.5 |
| | United Kingdom - 0.4 |
| | Others - 0.4 |
| |
TOP HOLDINGS(% of Fund's net assets) | | |
| Global Payments Inc | 1.9 | |
| Apollo Global Management Inc | 1.9 | |
| East West Bancorp Inc | 1.9 | |
| First Citizens BancShares Inc/NC Class A | 1.8 | |
| Canadian Natural Resources Ltd | 1.6 | |
| PG&E Corp | 1.5 | |
| Ventas Inc | 1.5 | |
| Ameriprise Financial Inc | 1.5 | |
| Jabil Inc | 1.5 | |
| ON Semiconductor Corp | 1.3 | |
| | 16.4 | |
How has the Fund changed?
This is a summary of certain changes to the Fund since January 1, 2024. For more complete information, you may review the Fund's next prospectus, which we expect to be available by April 30, 2025 at fundresearch.fidelity.com/prospectus/sec or upon request at 1-877-208-0098 or by sending an e-mail to funddocuments@fmr.com.
The fees associated with this class changed during the reporting year. The variations in class fees are primarily the result of the following changes: The fund's transfer agent and pricing & bookkeeping fees were changed to a fixed rate effective December 1, 2023. Effective March 1, 2024, the fund's management contract was amended to incorporate administrative services previously covered under separate services agreements (transfer agent and pricing & bookkeeping). The amended contract incorporates a management fee rate that may vary by class. The Adviser or an affiliate pays certain expenses of managing and operating the fund out of each class's management fee. | |
| Fidelity, the Fidelity Investments Logo and all other Fidelity trademarks or service marks used herein are trademarks or service marks of FMR LLC. Any third-party marks that are used herein are trademarks or service marks of their respective owners. © 2025 FMR LLC. All rights reserved. |
| | For additional information about the Fund; including its prospectus, financial information, holdings and proxy information, scan the QR code or visit fundresearch.fidelity.com/prospectus/sec 1.9914245.100 1467-TSRA-0325 |
Item 2.
Code of Ethics
As of the end of the period, December 31, 2024, Variable Insurance Products Fund III (the trust) has adopted a code of ethics, as defined in Item 2 of Form N-CSR, that applies to its President and Treasurer and its Chief Financial Officer. A copy of the code of ethics is filed as an exhibit to this Form N-CSR.
Item 3.
Audit Committee Financial Expert
The Board of Trustees of the trust has determined that Donald F. Donahue is an audit committee financial expert, as defined in Item 3 of Form N-CSR. Mr. Donahue is independent for purposes of Item 3 of Form N-CSR.
Item 4.
Principal Accountant Fees and Services
Fees and Services
The following table presents fees billed by Deloitte & Touche LLP, the member firms of Deloitte Touche Tohmatsu, and their respective affiliates (collectively, “Deloitte Entities”) in each of the last two fiscal years for services rendered to VIP Balanced Portfolio, VIP Dynamic Capital Appreciation Portfolio, VIP Growth & Income Portfolio, VIP Growth Opportunities Portfolio, and VIP Value Strategies Portfolio (the “Funds”):
Services Billed by Deloitte Entities
December 31, 2024 FeesA
|
| Audit Fees | Audit-Related Fees | Tax Fees | All Other Fees |
VIP Balanced Portfolio | $52,900 | $- | $11,100 | $1,200 |
VIP Dynamic Capital Appreciation Portfolio | $34,800 | $- | $10,000 | $800 |
VIP Growth & Income Portfolio | $43,900 | $- | $9,900 | $1,000 |
VIP Growth Opportunities Portfolio | $46,200 | $- | $8,200 | $1,000 |
VIP Value Strategies Portfolio | $40,800 | $- | $11,200 | $1,000 |
|
| Audit Fees | Audit-Related Fees | Tax Fees | All Other Fees |
VIP Balanced Portfolio | $52,700 | $- | $12,200 | $1,400 |
VIP Dynamic Capital Appreciation Portfolio | $34,900 | $- | $10,300 | $1,000 |
VIP Growth & Income Portfolio | $44,100 | $- | $10,400 | $1,200 |
VIP Growth Opportunities Portfolio | $46,400 | $- | $8,900 | $1,200 |
VIP Value Strategies Portfolio | $41,000 | $- | $11,700 | $1,100 |
A Amounts may reflect rounding.
The following table presents fees billed by PricewaterhouseCoopers LLP (“PwC”) in each of the last two fiscal years for services rendered to VIP Mid Cap Portfolio (the “Fund”):
Services Billed by PwC
December 31, 2024 FeesA
|
| Audit Fees | Audit-Related Fees | Tax Fees | All Other Fees |
VIP Mid Cap Portfolio | $42,800 | $3,900 | $7,900 | $1,400 |
|
| Audit Fees | Audit-Related Fees | Tax Fees | All Other Fees |
VIP Mid Cap Portfolio | $43,100 | $3,800 | $7,700 | $1,300 |
A Amounts may reflect rounding.
The following table(s) present(s) fees billed by Deloitte Entities and PwC that were required to be approved by the Audit Committee for services that relate directly to the operations and financial reporting of the Fund(s) and that are rendered on behalf of Fidelity Management & Research Company LLC ("FMR") and entities controlling, controlled by, or under common control with FMR (not including any sub-adviser whose role is primarily portfolio management and is subcontracted with or overseen by another investment adviser) that provide ongoing services to the Fund(s) (“Fund Service Providers”):
Services Billed by Deloitte Entities
|
| December 31, 2024A | December 31, 2023A |
Audit-Related Fees | $125,000 | $75,000 |
Tax Fees | $- | $- |
All Other Fees | $2,929,500 | $- |
A Amounts may reflect rounding.
Services Billed by PwC
|
| December 31, 2024A | December 31, 2023A |
Audit-Related Fees | $9,701,800 | $8,881,200 |
Tax Fees | $61,000 | $1,000 |
All Other Fees | $35,000 | $- |
A Amounts may reflect rounding.
“Audit-Related Fees” represent fees billed for assurance and related services that are reasonably related to the performance of the fund audit or the review of the fund's financial statements and that are not reported under Audit Fees.
“Tax Fees” represent fees billed for tax compliance, tax advice or tax planning that relate directly to the operations and financial reporting of the fund.
“All Other Fees” represent fees billed for services provided to the fund or Fund Service Provider, a significant portion of which are assurance related, that relate directly to the operations and financial reporting of the fund, excluding those services that are reported under Audit Fees, Audit-Related Fees or Tax Fees.
Assurance services must be performed by an independent public accountant.
* * *
The aggregate non-audit fees billed by Deloitte Entities and PwC for services rendered to the Fund(s), FMR (not including any sub-adviser whose role is primarily portfolio management and is subcontracted with or overseen by another investment adviser), and any Fund Service Provider for each of the last two fiscal years of the Fund(s) are as follows:
|
Billed By | December 31, 2024A | December 31, 2023A |
Deloitte Entities | $3,404,400 | $5,416,500 |
PwC | $15,304,300
| $14,349,100
|
A Amounts may reflect rounding.
The trust's Audit Committee has considered non-audit services that were not pre-approved that were provided by Deloitte Entities and PwC to Fund Service Providers to be compatible with maintaining the independence of Deloitte Entities and PwC in its(their) audit of the Fund(s), taking into account representations from Deloitte Entities and PwC, in accordance with Public Company Accounting Oversight Board rules, regarding its independence from the Fund(s) and its(their) related entities and FMR’s review of the appropriateness and permissibility under applicable law of such non-audit services prior to their provision to the Fund(s) Service Providers.
Audit Committee Pre-Approval Policies and Procedures
The trust’s Audit Committee must pre-approve all audit and non-audit services provided by a fund’s independent registered public accounting firm relating to the operations or financial reporting of the fund. Prior to the commencement of any audit or non-audit services to a fund, the Audit Committee reviews the services to determine whether they are appropriate and permissible under applicable law.
The Audit Committee has adopted policies and procedures to, among other purposes, provide a framework for the Committee’s consideration of non-audit services by the audit firms that audit the Fidelity funds. The policies and procedures require that any non-audit service provided by a fund audit firm to a Fidelity fund and any non-audit service provided by a fund auditor to a Fund Service Provider that relates directly to the operations and financial reporting of a Fidelity fund (“Covered Service”) are subject to approval by the Audit Committee before such service is provided.
All Covered Services must be approved in advance of provision of the service either: (i) by formal resolution of the Audit Committee, or (ii) by oral or written approval of the service by the Chair of the Audit Committee (or if the Chair is unavailable, such other member of the Audit Committee as may be designated by the Chair to act in the Chair’s absence). The approval contemplated by (ii) above is permitted where the Treasurer determines that action on such an engagement is necessary before the next meeting of the Audit Committee.
Non-audit services provided by a fund audit firm to a Fund Service Provider that do not relate directly to the operations and financial reporting of a Fidelity fund are reported to the Audit Committee periodically.
Non-Audit Services Approved Pursuant to Rule 2-01(c)(7)(i)(C) and (ii) of Regulation S-X (“De Minimis Exception”)
There were no non-audit services approved or required to be approved by the Audit Committee pursuant to the De Minimis Exception during the Fund’s(s’) last two fiscal years relating to services provided to (i) the Fund(s) or (ii) any Fund Service Provider that relate directly to the operations and financial reporting of the Fund(s).
The Registrant has not retained, for the preparation of the audit report on the financial statements included in the Form N-CSR, a registered public accounting firm that has a branch or office that is located in a foreign jurisdiction and that the Public Company Accounting Oversight Board (the “PCAOB”) has determined that the PCAOB is unable to inspect or investigate completely because of a position taken by an authority in the foreign jurisdiction.
The Registrant is not a “foreign issuer,” as defined in 17 CFR 240.3b-4.
Item 5.
Audit Committee of Listed Registrants
Not applicable.
Item 6.
Investments
(a)
Not applicable.
(b)
Not applicable.
Item 7.
Financial Statements and Financial Highlights for Open-End Management
Investment Companies
Fidelity® Variable Insurance Products:
VIP Value Strategies Portfolio
Annual Report
December 31, 2024
Contents
To view a fund's proxy voting guidelines and proxy voting record for the 12-month period ended June 30, visit http://www.fidelity.com/proxyvotingresults or visit the Securities and Exchange Commission's (SEC) web site at http://www.sec.gov.
You may also call 1-877-208-0098 to request a free copy of the proxy voting guidelines.
Fidelity® Variable Insurance Products are separate account options which are purchased through a variable insurance contract.
Standard & Poor's, S&P and S&P 500 are registered service marks of The McGraw-Hill Companies, Inc. and have been licensed for use by Fidelity Distributors Corporation.
Other third-party marks appearing herein are the property of their respective owners.
All other marks appearing herein are registered or unregistered trademarks or service marks of FMR LLC or an affiliated company. © 2025 FMR LLC. All rights reserved.
This report and the financial statements contained herein are submitted for the general information of the shareholders of the Fund. This report is not authorized for distribution to prospective investors in the Fund unless preceded or accompanied by an effective prospectus.
A fund files its complete schedule of portfolio holdings with the SEC for the first and third quarters of each fiscal year on Form N-PORT. Forms N-PORT are available on the SEC's web site at http://www.sec.gov. A fund's Forms N-PORT may be reviewed and copied at the SEC's Public Reference Room in Washington, DC. Information regarding the operation of the SEC's Public Reference Room may be obtained by calling 1-800-SEC-0330.
For a complete list of a fund's portfolio holdings, view the most recent holdings listing, semiannual report, or annual report on Fidelity's web site at http://www.fidelity.com, http://www.institutional.fidelity.com, or http://www.401k.com, as applicable.
NOT FDIC INSURED •MAY LOSE VALUE •NO BANK GUARANTEE
Neither the Fund nor Fidelity Distributors Corporation is a bank.
Item 7: Financial Statements and Financial Highlights for Open-End Management Investment Companies (Annual Report)
VIP Value Strategies Portfolio
Schedule of Investments December 31, 2024
Showing Percentage of Net Assets
| Common Stocks - 96.3% |
| | | Shares | Value ($) |
| BAILIWICK OF JERSEY - 0.9% | | | |
| Consumer Discretionary - 0.9% | | | |
| Automobile Components - 0.9% | | | |
| Aptiv PLC | | 138,500 | 8,376,480 |
| CANADA - 4.0% | | | |
| Consumer Discretionary - 1.0% | | | |
| Textiles, Apparel & Luxury Goods - 1.0% | | | |
| Gildan Activewear Inc | | 194,737 | 9,164,811 |
| Energy - 1.6% | | | |
| Oil, Gas & Consumable Fuels - 1.6% | | | |
| Canadian Natural Resources Ltd | | 477,000 | 14,726,954 |
| Industrials - 0.6% | | | |
| Ground Transportation - 0.6% | | | |
| TFI International Inc | | 47,900 | 6,472,640 |
| Materials - 0.8% | | | |
| Chemicals - 0.8% | | | |
| Methanex Corp (United States) (a) | | 148,850 | 7,433,569 |
| TOTAL CANADA | | | 37,797,974 |
| INDIA - 0.7% | | | |
| Industrials - 0.7% | | | |
| Professional Services - 0.7% | | | |
| WNS Holdings Ltd ADR | | 134,400 | 6,369,216 |
| PORTUGAL - 0.5% | | | |
| Energy - 0.5% | | | |
| Oil, Gas & Consumable Fuels - 0.5% | | | |
| Galp Energia SGPS SA | | 282,600 | 4,684,004 |
| PUERTO RICO - 0.7% | | | |
| Financials - 0.7% | | | |
| Banks - 0.7% | | | |
| Popular Inc | | 68,300 | 6,424,298 |
| SPAIN - 0.7% | | | |
| Communication Services - 0.7% | | | |
| Diversified Telecommunication Services - 0.7% | | | |
| Cellnex Telecom SA (b)(c) | | 221,700 | 7,002,737 |
| SWEDEN - 0.5% | | | |
| Consumer Discretionary - 0.5% | | | |
| Automobile Components - 0.5% | | | |
| Autoliv Inc | | 47,800 | 4,483,162 |
| SWITZERLAND - 0.4% | | | |
| Financials - 0.4% | | | |
| Capital Markets - 0.4% | | | |
| UBS Group AG | | 118,950 | 3,634,492 |
| UNITED KINGDOM - 0.4% | | | |
| Communication Services - 0.4% | | | |
| Media - 0.4% | | | |
| WPP PLC | | 386,900 | 3,988,105 |
| UNITED STATES - 87.5% | | | |
| Communication Services - 1.3% | | | |
| Interactive Media & Services - 0.9% | | | |
| ZoomInfo Technologies Inc (d) | | 844,500 | 8,875,695 |
| Media - 0.4% | | | |
| Nexstar Media Group Inc | | 23,900 | 3,775,483 |
TOTAL COMMUNICATION SERVICES | | | 12,651,178 |
| | | | |
| Consumer Discretionary - 7.0% | | | |
| Automobiles - 0.6% | | | |
| Harley-Davidson Inc | | 188,300 | 5,673,479 |
| Distributors - 0.5% | | | |
| LKQ Corp | | 121,200 | 4,454,100 |
| Hotels, Restaurants & Leisure - 0.7% | | | |
| Hilton Grand Vacations Inc (a)(d) | | 176,300 | 6,866,885 |
| Household Durables - 1.0% | | | |
| Tempur Sealy International Inc | | 165,300 | 9,370,857 |
| Leisure Products - 0.7% | | | |
| BRP Inc Subordinate Voting Shares (a) | | 71,700 | 3,651,714 |
| Brunswick Corp/DE | | 8,189 | 529,665 |
| Topgolf Callaway Brands Corp (d) | | 288,000 | 2,263,680 |
| | | | 6,445,059 |
| Specialty Retail - 2.4% | | | |
| Lithia Motors Inc Class A | | 31,800 | 11,366,274 |
| Signet Jewelers Ltd (a) | | 61,200 | 4,939,452 |
| Upbound Group Inc | | 191,800 | 5,594,806 |
| | | | 21,900,532 |
| Textiles, Apparel & Luxury Goods - 1.1% | | | |
| PVH Corp | | 100,800 | 10,659,600 |
TOTAL CONSUMER DISCRETIONARY | | | 65,370,512 |
| | | | |
| Consumer Staples - 5.3% | | | |
| Beverages - 0.8% | | | |
| Keurig Dr Pepper Inc | | 244,000 | 7,837,280 |
| Consumer Staples Distribution & Retail - 0.8% | | | |
| Dollar Tree Inc (d) | | 102,000 | 7,643,880 |
| Food Products - 2.8% | | | |
| Bunge Global SA | | 91,800 | 7,138,368 |
| Darling Ingredients Inc (d) | | 267,663 | 9,017,566 |
| Lamb Weston Holdings Inc | | 154,100 | 10,298,503 |
| | | | 26,454,437 |
| Personal Care Products - 0.9% | | | |
| Kenvue Inc | | 385,400 | 8,228,290 |
TOTAL CONSUMER STAPLES | | | 50,163,887 |
| | | | |
| Energy - 4.8% | | | |
| Energy Equipment & Services - 1.5% | | | |
| Expro Group Holdings NV (a)(d) | | 533,100 | 6,647,757 |
| Tidewater Inc (d) | | 60,000 | 3,282,600 |
| Valaris Ltd (d) | | 103,600 | 4,583,264 |
| | | | 14,513,621 |
| Oil, Gas & Consumable Fuels - 3.3% | | | |
| Antero Resources Corp (d) | | 246,400 | 8,636,320 |
| Cheniere Energy Inc | | 37,300 | 8,014,651 |
| CONSOL Energy Inc | | 33,197 | 3,541,456 |
| Targa Resources Corp | | 60,100 | 10,727,850 |
| | | | 30,920,277 |
TOTAL ENERGY | | | 45,433,898 |
| | | | |
| Financials - 20.3% | | | |
| Banks - 3.7% | | | |
| East West Bancorp Inc | | 182,493 | 17,475,530 |
| First Citizens BancShares Inc/NC Class A | | 8,200 | 17,326,764 |
| | | | 34,802,294 |
| Capital Markets - 3.9% | | | |
| Ameriprise Financial Inc | | 25,700 | 13,683,452 |
| LPL Financial Holdings Inc | | 35,900 | 11,721,709 |
| Raymond James Financial Inc | | 73,000 | 11,339,090 |
| | | | 36,744,251 |
| Consumer Finance - 2.4% | | | |
| OneMain Holdings Inc | | 157,400 | 8,205,262 |
| PROG Holdings Inc | | 130,871 | 5,530,608 |
| SLM Corp | | 304,800 | 8,406,384 |
| | | | 22,142,254 |
| Financial Services - 6.5% | | | |
| Apollo Global Management Inc | | 105,900 | 17,490,444 |
| Global Payments Inc | | 156,700 | 17,559,803 |
| NCR Atleos Corp (d) | | 218,933 | 7,426,207 |
| PennyMac Financial Services Inc | | 55,800 | 5,699,412 |
| WEX Inc (d) | | 67,800 | 11,886,696 |
| | | | 60,062,562 |
| Insurance - 3.8% | | | |
| American Financial Group Inc/OH | | 73,600 | 10,078,048 |
| Assurant Inc | | 43,000 | 9,168,460 |
| Reinsurance Group of America Inc | | 40,805 | 8,717,172 |
| The Travelers Companies, Inc. | | 33,800 | 8,142,082 |
| | | | 36,105,762 |
TOTAL FINANCIALS | | | 189,857,123 |
| | | | |
| Health Care - 5.9% | | | |
| Health Care Equipment & Supplies - 1.1% | | | |
| Zimmer Biomet Holdings Inc | | 101,400 | 10,710,882 |
| Health Care Providers & Services - 3.8% | | | |
| Acadia Healthcare Co Inc (d) | | 249,800 | 9,904,570 |
| AdaptHealth Corp (d) | | 461,409 | 4,392,614 |
| CVS Health Corp | | 245,700 | 11,029,473 |
| Molina Healthcare Inc (d) | | 34,800 | 10,128,540 |
| | | | 35,455,197 |
| Life Sciences Tools & Services - 0.4% | | | |
| Fortrea Holdings Inc (a)(d) | | 199,611 | 3,722,745 |
| Pharmaceuticals - 0.6% | | | |
| Jazz Pharmaceuticals PLC (d) | | 47,000 | 5,788,050 |
TOTAL HEALTH CARE | | | 55,676,874 |
| | | | |
| Industrials - 17.4% | | | |
| Air Freight & Logistics - 0.8% | | | |
| FedEx Corp | | 26,000 | 7,314,579 |
| Building Products - 1.4% | | | |
| AZZ Inc | | 48,100 | 3,940,352 |
| Builders FirstSource Inc (d) | | 66,500 | 9,504,845 |
| | | | 13,445,197 |
| Commercial Services & Supplies - 1.8% | | | |
| Brink's Co/The | | 55,600 | 5,158,012 |
| Driven Brands Holdings Inc (a)(d) | | 257,490 | 4,155,889 |
| Vestis Corp | | 483,800 | 7,373,112 |
| | | | 16,687,013 |
| Construction & Engineering - 1.0% | | | |
| Centuri Holdings Inc (a) | | 215,947 | 4,169,937 |
| Fluor Corp (d) | | 97,000 | 4,784,040 |
| | | | 8,953,977 |
| Electrical Equipment - 1.1% | | | |
| Regal Rexnord Corp | | 63,700 | 9,881,781 |
| Ground Transportation - 2.0% | | | |
| Ryder System Inc | | 40,900 | 6,415,574 |
| U-Haul Holding Co Class N | | 102,000 | 6,533,100 |
| XPO Inc (d) | | 47,900 | 6,282,085 |
| | | | 19,230,759 |
| Machinery - 5.7% | | | |
| Allison Transmission Holdings Inc | | 78,600 | 8,493,516 |
| Chart Industries Inc (d) | | 37,700 | 7,194,668 |
| CNH Industrial NV Class A | | 664,000 | 7,523,120 |
| Gates Industrial Corp PLC (d) | | 575,000 | 11,827,750 |
| Oshkosh Corp | | 61,000 | 5,799,270 |
| Terex Corp | | 95,200 | 4,400,144 |
| Timken Co/The | | 108,400 | 7,736,508 |
| | | | 52,974,976 |
| Professional Services - 0.9% | | | |
| First Advantage Corp (a)(d) | | 271,000 | 5,075,830 |
| ManpowerGroup Inc | | 65,900 | 3,803,748 |
| | | | 8,879,578 |
| Trading Companies & Distributors - 2.7% | | | |
| GMS Inc (d) | | 70,500 | 5,980,515 |
| Herc Holdings Inc (a) | | 47,800 | 9,049,974 |
| Wesco International Inc | | 57,000 | 10,314,720 |
| | | | 25,345,209 |
TOTAL INDUSTRIALS | | | 162,713,069 |
| | | | |
| Information Technology - 6.9% | | | |
| Communications Equipment - 1.2% | | | |
| Lumentum Holdings Inc (d) | | 136,900 | 11,492,755 |
| Electronic Equipment, Instruments & Components - 3.6% | | | |
| Arrow Electronics Inc (d) | | 111,300 | 12,590,256 |
| Flex Ltd (d) | | 174,500 | 6,699,055 |
| Jabil Inc | | 92,100 | 13,253,190 |
| | | | 32,542,501 |
| Semiconductors & Semiconductor Equipment - 1.3% | | | |
| ON Semiconductor Corp (d) | | 200,800 | 12,660,440 |
| Software - 0.8% | | | |
| NCR Voyix Corp (d) | | 548,700 | 7,594,008 |
TOTAL INFORMATION TECHNOLOGY | | | 64,289,704 |
| | | | |
| Materials - 7.1% | | | |
| Chemicals - 2.1% | | | |
| Chemours Co/The | | 371,200 | 6,273,280 |
| Olin Corp | | 166,501 | 5,627,734 |
| Westlake Corp | | 61,900 | 7,096,835 |
| | | | 18,997,849 |
| Containers & Packaging - 3.3% | | | |
| Berry Global Group Inc | | 111,900 | 7,236,573 |
| International Paper Co | | 166,900 | 8,982,558 |
| O-I Glass Inc (d) | | 454,960 | 4,931,766 |
| Smurfit WestRock PLC | | 170,800 | 9,199,288 |
| | | | 30,350,185 |
| Metals & Mining - 1.1% | | | |
| Arch Resources Inc Class A | | 52,171 | 7,367,589 |
| Constellium SE (d) | | 324,600 | 3,333,642 |
| | | | 10,701,231 |
| Paper & Forest Products - 0.6% | | | |
| Louisiana-Pacific Corp | | 55,100 | 5,705,605 |
TOTAL MATERIALS | | | 65,754,870 |
| | | | |
| Real Estate - 6.3% | | | |
| Health Care REITs - 2.6% | | | |
| Ventas Inc | | 239,400 | 14,098,266 |
| Welltower Inc | | 84,100 | 10,599,123 |
| | | | 24,697,389 |
| Industrial REITs - 2.0% | | | |
| EastGroup Properties Inc | | 59,300 | 9,517,057 |
| Prologis Inc | | 84,547 | 8,936,618 |
| | | | 18,453,675 |
| Residential REITs - 1.7% | | | |
| Camden Property Trust | | 53,400 | 6,196,536 |
| Sun Communities Inc | | 83,200 | 10,231,104 |
| | | | 16,427,640 |
TOTAL REAL ESTATE | | | 59,578,704 |
| | | | |
| Utilities - 5.2% | | | |
| Electric Utilities - 3.9% | | | |
| Constellation Energy Corp | | 31,633 | 7,076,618 |
| Edison International | | 113,800 | 9,085,792 |
| Entergy Corp | | 72,000 | 5,459,040 |
| PG&E Corp | | 703,700 | 14,200,666 |
| | | | 35,822,116 |
| Independent Power and Renewable Electricity Producers - 0.8% | | | |
| AES Corp/The | | 616,300 | 7,931,781 |
| Multi-Utilities - 0.5% | | | |
| Sempra | | 54,700 | 4,798,284 |
TOTAL UTILITIES | | | 48,552,181 |
| | | | |
| TOTAL UNITED STATES | | | 820,042,000 |
| TOTAL COMMON STOCKS (Cost $777,320,806) | | | 902,802,468 |
| | | | |
| Money Market Funds - 2.5% |
| | | Yield (%) | Shares | Value ($) |
| Fidelity Cash Central Fund (e) | | 4.36 | 11,248,318 | 11,250,567 |
| Fidelity Securities Lending Cash Central Fund (e)(f) | | 4.35 | 12,654,563 | 12,655,829 |
| TOTAL MONEY MARKET FUNDS (Cost $23,906,396) | | | | 23,906,396 |
| | | | | |
| TOTAL INVESTMENT IN SECURITIES - 98.8% (Cost $801,227,202) | 926,708,864 |
NET OTHER ASSETS (LIABILITIES) - 1.2% | 11,673,437 |
| NET ASSETS - 100.0% | 938,382,301 |
| | |
Legend
| (a) | Security or a portion of the security is on loan at period end. |
| (b) | Security is exempt from registration under Regulation S of the Securities Act of 1933 and may be resold to qualified foreign investors outside of the United States. At the end of the period, the value of securities amounted to $7,002,737 or 0.7% of net assets. |
| (c) | Security exempt from registration under Rule 144A of the Securities Act of 1933. These securities may be resold in transactions exempt from registration, normally to qualified institutional buyers. At the end of the period, the value of these securities amounted to $7,002,737 or 0.7% of net assets. |
| (e) | Affiliated fund that is generally available only to investment companies and other accounts managed by Fidelity Investments. The rate quoted is the annualized seven-day yield of the fund at period end. A complete unaudited listing of the fund's holdings as of its most recent quarter end is available upon request. In addition, each Fidelity Central Fund's financial statements, which are not covered by the Fund's Report of Independent Registered Public Accounting Firm, are available on the SEC's website or upon request. |
| (f) | Investment made with cash collateral received from securities on loan. |
Affiliated Central Funds
Fiscal year to date information regarding the Fund's investments in Fidelity Central Funds, including the ownership percentage, is presented below.
| Affiliate | Value, beginning of period ($) | Purchases ($) | Sales Proceeds ($) | Dividend Income ($) | Realized Gain (loss) ($) | Change in Unrealized appreciation (depreciation) ($) | Value, end of period ($) | Shares, end of period | % ownership, end of period |
| Fidelity Cash Central Fund | 2,784,486 | 172,987,100 | 164,520,753 | 292,124 | (266) | - | 11,250,567 | 11,248,318 | 0.0% |
| Fidelity Securities Lending Cash Central Fund | 16,579,892 | 237,806,277 | 241,730,340 | 175,073 | - | - | 12,655,829 | 12,654,563 | 0.1% |
| Total | 19,364,378 | 410,793,377 | 406,251,093 | 467,197 | (266) | - | 23,906,396 | 23,902,881 | |
| | | | | | | | | | |
Amounts in the dividend income column in the above table include any capital gain distributions from underlying funds, which are presented in the corresponding line item in the Statement of Operations, if applicable.
Amounts in the dividend income column for Fidelity Securities Lending Cash Central Fund represents the income earned on investing cash collateral, less rebates paid to borrowers and any lending agent fees associated with the loan, plus any premium payments received for lending certain types of securities.
Amounts included in the purchases and sales proceeds columns may include in-kind transactions, if applicable.
Investment Valuation
The following is a summary of the inputs used, as of December 31, 2024, involving the Fund's assets and liabilities carried at fair value. The inputs or methodology used for valuing securities may not be an indication of the risk associated with investing in those securities. For more information on valuation inputs, and their aggregation into the levels used below, please refer to the Investment Valuation section in the accompanying Notes to Financial Statements.
| Valuation Inputs at Reporting Date: |
| Description | Total ($) | Level 1 ($) | Level 2 ($) | Level 3 ($) |
Investments in Securities: | | | | |
|
| Common Stocks | | | | |
Communication Services | 23,642,020 | 12,651,178 | 10,990,842 | - |
Consumer Discretionary | 87,394,965 | 87,394,965 | - | - |
Consumer Staples | 50,163,887 | 50,163,887 | - | - |
Energy | 64,844,856 | 60,160,852 | 4,684,004 | - |
Financials | 199,915,913 | 199,915,913 | - | - |
Health Care | 55,676,874 | 55,676,874 | - | - |
Industrials | 175,554,925 | 175,554,925 | - | - |
Information Technology | 64,289,704 | 64,289,704 | - | - |
Materials | 73,188,439 | 73,188,439 | - | - |
Real Estate | 59,578,704 | 59,578,704 | - | - |
Utilities | 48,552,181 | 48,552,181 | - | - |
|
| Money Market Funds | 23,906,396 | 23,906,396 | - | - |
| Total Investments in Securities: | 926,708,864 | 911,034,018 | 15,674,846 | - |
Financial Statements
| Statement of Assets and Liabilities |
As of December 31, 2024 |
| Assets | | | | |
| Investment in securities, at value (including securities loaned of $12,381,733) - See accompanying schedule: | | | | |
Unaffiliated issuers (cost $777,320,806) | $ | 902,802,468 | | |
Fidelity Central Funds (cost $23,906,396) | | 23,906,396 | | |
| | | | | |
| | | | | |
| Total Investment in Securities (cost $801,227,202) | | | $ | 926,708,864 |
| Cash | | | | 8 |
| Receivable for investments sold | | | | 588,984 |
| Receivable for fund shares sold | | | | 208,819,064 |
| Dividends receivable | | | | 630,335 |
| Distributions receivable from Fidelity Central Funds | | | | 52,148 |
| Prepaid expenses | | | | 648 |
Total assets | | | | 1,136,800,051 |
| Liabilities | | | | |
| Payable for investments purchased | $ | 185,017,761 | | |
| Payable for fund shares redeemed | | 222,091 | | |
| Accrued management fee | | 378,404 | | |
| Distribution and service plan fees payable | | 82,339 | | |
| Other payables and accrued expenses | | 61,368 | | |
| Collateral on securities loaned | | 12,655,787 | | |
| Total liabilities | | | | 198,417,750 |
| Net Assets | | | $ | 938,382,301 |
| Net Assets consist of: | | | | |
| Paid in capital | | | $ | 798,164,108 |
| Total accumulated earnings (loss) | | | | 140,218,193 |
| Net Assets | | | $ | 938,382,301 |
| | | | | |
| Net Asset Value and Maximum Offering Price | | | | |
| Initial Class : | | | | |
Net Asset Value, offering price and redemption price per share ($109,983,312 ÷ 7,090,612 shares) | | | $ | 15.51 |
| Service Class : | | | | |
Net Asset Value, offering price and redemption price per share ($32,921,738 ÷ 2,133,037 shares) | | | $ | 15.43 |
| Service Class 2 : | | | | |
Net Asset Value, offering price and redemption price per share ($372,032,921 ÷ 23,655,058 shares) | | | $ | 15.73 |
| Investor Class : | | | | |
Net Asset Value, offering price and redemption price per share ($423,444,330 ÷ 27,624,395 shares) | | | $ | 15.33 |
| Statement of Operations |
| Year ended December 31, 2024 |
| Investment Income | | | | |
| Dividends | | | $ | 11,445,426 |
| Income from Fidelity Central Funds (including $175,073 from security lending) | | | | 467,197 |
| Total income | | | | 11,912,623 |
| Expenses | | | | |
| Management fee | $ | 4,322,833 | | |
| Transfer agent fees | | 101,566 | | |
| Distribution and service plan fees | | 942,101 | | |
| Accounting fees | | 37,649 | | |
| Custodian fees and expenses | | 20,462 | | |
| Independent trustees' fees and expenses | | 3,152 | | |
| Audit fees | | 61,818 | | |
| Legal | | 3,874 | | |
| Interest | | 1,504 | | |
| Miscellaneous | | 18,233 | | |
| Total expenses before reductions | | 5,513,192 | | |
| Expense reductions | | (30,926) | | |
| Total expenses after reductions | | | | 5,482,266 |
| Net Investment income (loss) | | | | 6,430,357 |
| Realized and Unrealized Gain (Loss) | | | | |
| Net realized gain (loss) on: | | | | |
| Investment Securities: | | | | |
| Unaffiliated issuers | | 110,916,949 | | |
| Fidelity Central Funds | | (266) | | |
| Foreign currency transactions | | (10,677) | | |
| Total net realized gain (loss) | | | | 110,906,006 |
| Change in net unrealized appreciation (depreciation) on: | | | | |
| Investment Securities: | | | | |
| Unaffiliated issuers | | (52,163,005) | | |
| Assets and liabilities in foreign currencies | | (3,844) | | |
| Total change in net unrealized appreciation (depreciation) | | | | (52,166,849) |
| Net gain (loss) | | | | 58,739,157 |
| Net increase (decrease) in net assets resulting from operations | | | $ | 65,169,514 |
| Statement of Changes in Net Assets |
| |
| | Year ended December 31, 2024 | | Year ended December 31, 2023 |
| Increase (Decrease) in Net Assets | | | | |
| Operations | | | | |
| Net investment income (loss) | $ | 6,430,357 | $ | 6,366,845 |
| Net realized gain (loss) | | 110,906,006 | | 33,188,883 |
| Change in net unrealized appreciation (depreciation) | | (52,166,849) | | 81,781,351 |
| Net increase (decrease) in net assets resulting from operations | | 65,169,514 | | 121,337,079 |
| Distributions to shareholders | | (110,011,992) | | (31,624,855) |
| | | | | |
| Share transactions - net increase (decrease) | | 282,103,850 | | (35,709,156) |
| Total increase (decrease) in net assets | | 237,261,372 | | 54,003,068 |
| | | | | |
| Net Assets | | | | |
| Beginning of period | | 701,120,929 | | 647,117,861 |
| End of period | $ | 938,382,301 | $ | 701,120,929 |
| | | | | |
| | | | | |
Financial Highlights
VIP Value Strategies Portfolio Initial Class |
| |
| Years ended December 31, | | 2024 | | 2023 | | 2022 | | 2021 | | 2020 |
Selected Per-Share Data | | | | | | | | | | |
| Net asset value, beginning of period | $ | 16.55 | $ | 14.38 | $ | 16.40 | $ | 13.55 | $ | 13.31 |
| Income from Investment Operations | | | | | | | | | | |
Net investment income (loss) A,B | | .18 | | .17 | | .16 | | .24 C | | .14 |
| Net realized and unrealized gain (loss) | | 1.46 | | 2.80 | | (1.29) | | 4.26 | | .88 |
| Total from investment operations | | 1.64 | | 2.97 | | (1.13) | | 4.50 | | 1.02 |
| Distributions from net investment income | | (.18) | | (.19) | | (.16) D | | (.26) | | (.15) |
| Distributions from net realized gain | | (2.50) | | (.61) | | (.73) D | | (1.39) | | (.63) |
| Total distributions | | (2.68) | | (.80) | | (.89) | | (1.65) | | (.78) |
| Net asset value, end of period | $ | 15.51 | $ | 16.55 | $ | 14.38 | $ | 16.40 | $ | 13.55 |
Total Return E,F | | | | 20.85% | | (7.03)% | | 33.60% | | 8.26% |
Ratios to Average Net Assets B,G,H | | | | | | | | | | |
| Expenses before reductions | | .60% | | .64% | | .64% | | .64% | | .66% |
| Expenses net of fee waivers, if any | | | | .63% | | .63% | | .63% | | .66% |
| Expenses net of all reductions | | .60% | | .63% | | .63% | | .63% | | .65% |
| Net investment income (loss) | | 1.03% | | 1.12% | | 1.02% | | 1.47% C | | 1.32% |
| Supplemental Data | | | | | | | | | | |
| Net assets, end of period (000 omitted) | $ | 109,983 | $ | 101,102 | $ | 92,162 | $ | 125,050 | $ | 95,708 |
Portfolio turnover rate I | | | | 57% | | 59% | | 62% | | 85% |
ACalculated based on average shares outstanding during the period.
BNet investment income (loss) is affected by the timing of the declaration of dividends by any underlying mutual funds or exchange-traded funds (ETFs). Net investment income (loss) of any mutual funds or ETFs is not included in the Fund's net investment income (loss) ratio.
CNet investment income per share reflects one or more large, non-recurring dividend(s) which amounted to $.06 per share. Excluding such non-recurring dividend(s), the ratio of net investment income (loss) to average net assets would have been 1.09%.
DThe amount shown reflects reclassifications related to book to tax differences that were made in the year shown.
ETotal returns do not reflect charges attributable to your insurance company's separate account. Inclusion of these charges would reduce the total returns shown.
FTotal returns would have been lower if certain expenses had not been reduced during the applicable periods shown.
GFees and expenses of any underlying mutual funds or exchange-traded funds (ETFs) are not included in the Fund's expense ratio. The Fund indirectly bears its proportionate share of these expenses. For additional expense information related to investments in Fidelity Central Funds, please refer to the "Investments in Fidelity Central Funds" note found in the Notes to Financial Statements section of the most recent Annual or Semi-Annual report.
HExpense ratios reflect operating expenses of the class. Expenses before reductions do not reflect amounts reimbursed, waived, or reduced through arrangements with the investment adviser, brokerage services, or other offset arrangements, if applicable, and do not represent the amount paid by the class during periods when reimbursements, waivers or reductions occur.
IAmount does not include the portfolio activity of any underlying mutual funds or exchange-traded funds (ETFs), derivatives or securities that mature within one year from acquisition.
VIP Value Strategies Portfolio Service Class |
| |
| Years ended December 31, | | 2024 | | 2023 | | 2022 | | 2021 | | 2020 |
Selected Per-Share Data | | | | | | | | | | |
| Net asset value, beginning of period | $ | 16.48 | $ | 14.32 | $ | 16.35 | $ | 13.51 | $ | 13.27 |
| Income from Investment Operations | | | | | | | | | | |
Net investment income (loss) A,B | | .16 | | .16 | | .14 | | .22 C | | .13 |
| Net realized and unrealized gain (loss) | | 1.46 | | 2.79 | | (1.29) | | 4.25 | | .88 |
| Total from investment operations | | 1.62 | | 2.95 | | (1.15) | | 4.47 | | 1.01 |
| Distributions from net investment income | | (.17) | | (.17) | | (.15) D | | (.24) | | (.14) |
| Distributions from net realized gain | | (2.50) | | (.61) | | (.73) D | | (1.39) | | (.63) |
| Total distributions | | (2.67) | | (.79) E | | (.88) | | (1.63) | | (.77) |
| Net asset value, end of period | $ | 15.43 | $ | 16.48 | $ | 14.32 | $ | 16.35 | $ | 13.51 |
Total Return F,G | | | | 20.77% | | (7.19)% | | 33.48% | | 8.18% |
Ratios to Average Net Assets B,H,I | | | | | | | | | | |
| Expenses before reductions | | .70% | | .74% | | .74% | | .73% | | .76% |
| Expenses net of fee waivers, if any | | | | .73% | | .73% | | .73% | | .76% |
| Expenses net of all reductions | | .70% | | .73% | | .73% | | .73% | | .75% |
| Net investment income (loss) | | .93% | | 1.02% | | .92% | | 1.37% C | | 1.22% |
| Supplemental Data | | | | | | | | | | |
| Net assets, end of period (000 omitted) | $ | 32,922 | $ | 31,303 | $ | 24,199 | $ | 27,216 | $ | 19,115 |
Portfolio turnover rate J | | | | 57% | | 59% | | 62% | | 85% |
ACalculated based on average shares outstanding during the period.
BNet investment income (loss) is affected by the timing of the declaration of dividends by any underlying mutual funds or exchange-traded funds (ETFs). Net investment income (loss) of any mutual funds or ETFs is not included in the Fund's net investment income (loss) ratio.
CNet investment income per share reflects one or more large, non-recurring dividend(s) which amounted to $.06 per share. Excluding such non-recurring dividend(s), the ratio of net investment income (loss) to average net assets would have been .99%.
DThe amount shown reflects reclassifications related to book to tax differences that were made in the year shown.
ETotal distributions per share do not sum due to rounding.
FTotal returns do not reflect charges attributable to your insurance company's separate account. Inclusion of these charges would reduce the total returns shown.
GTotal returns would have been lower if certain expenses had not been reduced during the applicable periods shown.
HFees and expenses of any underlying mutual funds or exchange-traded funds (ETFs) are not included in the Fund's expense ratio. The Fund indirectly bears its proportionate share of these expenses. For additional expense information related to investments in Fidelity Central Funds, please refer to the "Investments in Fidelity Central Funds" note found in the Notes to Financial Statements section of the most recent Annual or Semi-Annual report.
IExpense ratios reflect operating expenses of the class. Expenses before reductions do not reflect amounts reimbursed, waived, or reduced through arrangements with the investment adviser, brokerage services, or other offset arrangements, if applicable, and do not represent the amount paid by the class during periods when reimbursements, waivers or reductions occur.
JAmount does not include the portfolio activity of any underlying mutual funds or exchange-traded funds (ETFs), derivatives or securities that mature within one year from acquisition.
VIP Value Strategies Portfolio Service Class 2 |
| |
| Years ended December 31, | | 2024 | | 2023 | | 2022 | | 2021 | | 2020 |
Selected Per-Share Data | | | | | | | | | | |
| Net asset value, beginning of period | $ | 16.75 | $ | 14.54 | $ | 16.59 | $ | 13.68 | $ | 13.43 |
| Income from Investment Operations | | | | | | | | | | |
Net investment income (loss) A,B | | .13 | | .13 | | .12 | | .20 C | | .12 |
| Net realized and unrealized gain (loss) | | 1.49 | | 2.84 | | (1.31) | | 4.31 | | .88 |
| Total from investment operations | | 1.62 | | 2.97 | | (1.19) | | 4.51 | | 1.00 |
| Distributions from net investment income | | (.14) | | (.15) | | (.13) D | | (.21) | | (.12) |
| Distributions from net realized gain | | (2.50) | | (.61) | | (.73) D | | (1.39) | | (.63) |
| Total distributions | | (2.64) | | (.76) | | (.86) | | (1.60) | | (.75) |
| Net asset value, end of period | $ | 15.73 | $ | 16.75 | $ | 14.54 | $ | 16.59 | $ | 13.68 |
Total Return E,F | | | | 20.61% | | (7.35)% | | 33.34% | | 8.02% |
Ratios to Average Net Assets A,G,H | | | | | | | | | | |
| Expenses before reductions | | .85% | | .89% | | .89% | | .88% | | .91% |
| Expenses net of fee waivers, if any | | | | .88% | | .88% | | .88% | | .91% |
| Expenses net of all reductions | | .85% | | .88% | | .88% | | .88% | | .90% |
| Net investment income (loss) | | .78% | | .87% | | .77% | | 1.22% C | | 1.07% |
| Supplemental Data | | | | | | | | | | |
| Net assets, end of period (000 omitted) | $ | 372,033 | $ | 340,221 | $ | 309,683 | $ | 315,104 | $ | 228,031 |
Portfolio turnover rate I | | | | 57% | | 59% | | 62% | | 85% |
ANet investment income (loss) is affected by the timing of the declaration of dividends by any underlying mutual funds or exchange-traded funds (ETFs). Net investment income (loss) of any mutual funds or ETFs is not included in the Fund's net investment income (loss) ratio.
BCalculated based on average shares outstanding during the period.
CNet investment income per share reflects one or more large, non-recurring dividend(s) which amounted to $.06 per share. Excluding such non-recurring dividend(s), the ratio of net investment income (loss) to average net assets would have been .84%.
DThe amount shown reflects reclassifications related to book to tax differences that were made in the year shown.
ETotal returns do not reflect charges attributable to your insurance company's separate account. Inclusion of these charges would reduce the total returns shown.
FTotal returns would have been lower if certain expenses had not been reduced during the applicable periods shown.
GExpense ratios reflect operating expenses of the class. Expenses before reductions do not reflect amounts reimbursed, waived, or reduced through arrangements with the investment adviser, brokerage services, or other offset arrangements, if applicable, and do not represent the amount paid by the class during periods when reimbursements, waivers or reductions occur.
HFees and expenses of any underlying mutual funds or exchange-traded funds (ETFs) are not included in the Fund's expense ratio. The Fund indirectly bears its proportionate share of these expenses. For additional expense information related to investments in Fidelity Central Funds, please refer to the "Investments in Fidelity Central Funds" note found in the Notes to Financial Statements section of the most recent Annual or Semi-Annual report.
IAmount does not include the portfolio activity of any underlying mutual funds or exchange-traded funds (ETFs), derivatives or securities that mature within one year from acquisition.
VIP Value Strategies Portfolio Investor Class |
| |
| Years ended December 31, | | 2024 | | 2023 | | 2022 | | 2021 | | 2020 |
Selected Per-Share Data | | | | | | | | | | |
| Net asset value, beginning of period | $ | 16.38 | $ | 14.24 | $ | 16.25 | $ | 13.44 | $ | 13.20 |
| Income from Investment Operations | | | | | | | | | | |
Net investment income (loss) A,B | | .16 | | .16 | | .14 | | .23 C | | .14 |
| Net realized and unrealized gain (loss) | | 1.46 | | 2.77 | | (1.27) | | 4.22 | | .87 |
| Total from investment operations | | 1.62 | | 2.93 | | (1.13) | | 4.45 | | 1.01 |
| Distributions from net investment income | | (.17) | | (.17) | | (.15) D | | (.24) | | (.14) |
| Distributions from net realized gain | | (2.50) | | (.61) | | (.73) D | | (1.39) | | (.63) |
| Total distributions | | (2.67) | | (.79) E | | (.88) | | (1.64) E | | (.77) |
| Net asset value, end of period | $ | 15.33 | $ | 16.38 | $ | 14.24 | $ | 16.25 | $ | 13.44 |
Total Return F,G | | | | 20.75% | | (7.11)% | | 33.48% | | 8.26% |
Ratios to Average Net Assets B,H,I | | | | | | | | | | |
| Expenses before reductions | | .67% | | .71% | | .71% | | .71% | | .74% |
| Expenses net of fee waivers, if any | | | | .71% | | .71% | | .71% | | .74% |
| Expenses net of all reductions | | .66% | | .71% | | .71% | | .71% | | .73% |
| Net investment income (loss) | | .96% | | 1.05% | | .95% | | 1.39% C | | 1.24% |
| Supplemental Data | | | | | | | | | | |
| Net assets, end of period (000 omitted) | $ | 423,444 | $ | 228,494 | $ | 221,074 | $ | 282,755 | $ | 149,707 |
Portfolio turnover rate J | | | | 57% | | 59% | | 62% | | 85% |
ACalculated based on average shares outstanding during the period.
BNet investment income (loss) is affected by the timing of the declaration of dividends by any underlying mutual funds or exchange-traded funds (ETFs). Net investment income (loss) of any mutual funds or ETFs is not included in the Fund's net investment income (loss) ratio.
CNet investment income per share reflects one or more large, non-recurring dividend(s) which amounted to $.06 per share. Excluding such non-recurring dividend(s), the ratio of net investment income (loss) to average net assets would have been 1.02%.
DThe amount shown reflects reclassifications related to book to tax differences that were made in the year shown.
ETotal distributions per share do not sum due to rounding.
FTotal returns do not reflect charges attributable to your insurance company's separate account. Inclusion of these charges would reduce the total returns shown.
GTotal returns would have been lower if certain expenses had not been reduced during the applicable periods shown.
HFees and expenses of any underlying mutual funds or exchange-traded funds (ETFs) are not included in the Fund's expense ratio. The Fund indirectly bears its proportionate share of these expenses. For additional expense information related to investments in Fidelity Central Funds, please refer to the "Investments in Fidelity Central Funds" note found in the Notes to Financial Statements section of the most recent Annual or Semi-Annual report.
IExpense ratios reflect operating expenses of the class. Expenses before reductions do not reflect amounts reimbursed, waived, or reduced through arrangements with the investment adviser, brokerage services, or other offset arrangements, if applicable, and do not represent the amount paid by the class during periods when reimbursements, waivers or reductions occur.
JAmount does not include the portfolio activity of any underlying mutual funds or exchange-traded funds (ETFs), derivatives or securities that mature within one year from acquisition.
Notes to Financial Statements
For the period ended December 31, 2024
1. Organization.
VIP Value Strategies Portfolio (the Fund) is a fund of Variable Insurance Products Fund III (the Trust) and is authorized to issue an unlimited number of shares. The Trust is registered under the Investment Company Act of 1940, as amended (the 1940 Act), as an open-end management investment company organized as a Massachusetts business trust. Shares of the Fund may only be purchased by insurance companies for the purpose of funding variable annuity or variable life insurance contracts. The Fund offers the following classes of shares: Initial Class shares, Service Class shares, Service Class 2 shares and Investor Class shares. All classes have equal rights and voting privileges, except for matters affecting a single class.
2. Investments in Fidelity Central Funds.
Funds may invest in Fidelity Central Funds, which are open-end investment companies generally available only to other investment companies and accounts managed by the investment adviser and its affiliates. The Schedule of Investments lists any Fidelity Central Funds held as an investment as of period end, but does not include the underlying holdings of each Fidelity Central Fund. An investing fund indirectly bears its proportionate share of the expenses of the underlying Fidelity Central Funds.
Based on its investment objective, each Fidelity Central Fund may invest or participate in various investment vehicles or strategies that are similar to those of the investing fund. These strategies are consistent with the investment objectives of the investing fund and may involve certain economic risks which may cause a decline in value of each of the Fidelity Central Funds and thus a decline in the value of the investing fund.
| Fidelity Central Fund | Investment Manager | Investment Objective | Investment Practices | Expense RatioA |
| Fidelity Money Market Central Funds | Fidelity Management & Research Company LLC (FMR) | Each fund seeks to obtain a high level of current income consistent with the preservation of capital and liquidity. | Short-term Investments | Less than .005% |
A Expenses expressed as a percentage of average net assets and are as of each underlying Central Fund's most recent annual or semi-annual shareholder report.
A complete unaudited list of holdings for each Fidelity Central Fund is available upon request or at the Securities and Exchange Commission website at www.sec.gov. In addition, the financial statements of the Fidelity Central Funds which contain the significant accounting policies (including investment valuation policies) of those funds, and are not covered by the Report of Independent Registered Public Accounting Firm, are available on the Securities and Exchange Commission website or upon request.
3. Significant Accounting Policies.
The Fund is an investment company and applies the accounting and reporting guidance of the Financial Accounting Standards Board (FASB) Accounting Standards Codification Topic 946 Financial Services - Investment Companies. The financial statements have been prepared in conformity with accounting principles generally accepted in the United States of America (GAAP), which require management to make certain estimates and assumptions at the date of the financial statements. Actual results could differ from those estimates. The Fund operates as a single operating segment. The Fund's income, expenses, assets, and performance are regularly monitored and assessed as a whole by the investment adviser and other individuals responsible for oversight functions of the Trust, using the information presented in the financial statements and financial highlights. Subsequent events, if any, through the date that the financial statements were issued have been evaluated in the preparation of the financial statements. The Fund's Schedule of Investments lists any underlying mutual funds or exchange-traded funds (ETFs) but does not include the underlying holdings of these funds. The following summarizes the significant accounting policies of the Fund:
Investment Valuation. Investments are valued as of 4:00 p.m. Eastern time on the last calendar day of the period. The Board of Trustees (the Board) has designated the Fund's investment adviser as the valuation designee responsible for the fair valuation function and performing fair value determinations as needed. The investment adviser has established a Fair Value Committee (the Committee) to carry out the day-to-day fair valuation responsibilities and has adopted policies and procedures to govern the fair valuation process and the activities of the Committee. In accordance with these fair valuation policies and procedures, which have been approved by the Board, the Fund attempts to obtain prices from one or more third party pricing services or brokers to value its investments. When current market prices, quotations or currency exchange rates are not readily available or reliable, investments will be fair valued in good faith by the Committee, in accordance with the policies and procedures. Factors used in determining fair value vary by investment type and may include market or investment specific events, transaction data, estimated cash flows, and market observations of comparable investments. The frequency that the fair valuation procedures are used cannot be predicted and they may be utilized to a significant extent. The Committee manages the Fund's fair valuation practices and maintains the fair valuation policies and procedures. The Fund's investment adviser reports to the Board information regarding the fair valuation process and related material matters.
The Fund categorizes the inputs to valuation techniques used to value its investments into a disclosure hierarchy consisting of three levels as shown below:
Level 1 - unadjusted quoted prices in active markets for identical investments
Level 2 - other significant observable inputs (including quoted prices for similar investments, interest rates, prepayment speeds, etc.)
Level 3 - unobservable inputs (including the Fund's own assumptions based on the best information available)
Valuation techniques used to value the Fund's investments by major category are as follows:
Equity securities, including restricted securities, for which market quotations are readily available, are valued at the last reported sale price or official closing price as reported by a third party pricing service on the primary market or exchange on which they are traded and are categorized as Level 1 in the hierarchy. In the event there were no sales during the day or closing prices are not available, securities are valued at the last quoted bid price or may be valued using the last available price and are generally categorized as Level 2 in the hierarchy. For foreign equity securities, when market or security specific events arise, comparisons to the valuation of American Depositary Receipts (ADRs), futures contracts, Exchange-Traded Funds (ETFs) and certain indexes as well as quoted prices for similar securities may be used and would be categorized as Level 2 in the hierarchy. For equity securities, including restricted securities, where observable inputs are limited, assumptions about market activity and risk are used and these securities may be categorized as Level 3 in the hierarchy.
Investments in open-end mutual funds, including the Fidelity Central Funds, are valued at their closing net asset value (NAV) each business day and are categorized as Level 1 in the hierarchy.
Changes in valuation techniques may result in transfers in or out of an assigned level within the disclosure hierarchy. The aggregate value of investments by input level as of December 31, 2024 is included at the end of the Fund's Schedule of Investments.
Foreign Currency. Certain Funds may use foreign currency contracts to facilitate transactions in foreign-denominated securities. Gains and losses from these transactions may arise from changes in the value of the foreign currency or if the counterparties do not perform under the contracts' terms.
Foreign-denominated assets, including investment securities, and liabilities are translated into U.S. dollars at the exchange rates at period end. Purchases and sales of investment securities, income and dividends received, and expenses denominated in foreign currencies are translated into U.S. dollars at the exchange rate in effect on the transaction date.
The effects of exchange rate fluctuations on investments are included with the net realized and unrealized gain (loss) on investment securities. Other foreign currency transactions resulting in realized and unrealized gain (loss) are disclosed separately.
Investment Transactions and Income. For financial reporting purposes, the Fund's investment holdings and NAV include trades executed through the end of the last business day of the period. The NAV per share for processing shareholder transactions is calculated as of the close of business of the New York Stock Exchange (NYSE), normally 4:00 p.m. Eastern time and includes trades executed through the end of the prior business day. Gains and losses on securities sold are determined on the basis of identified cost and include proceeds received from litigation. Commissions paid to certain brokers with whom the investment adviser, or its affiliates, places trades on behalf of a fund include an amount in addition to trade execution, which may be rebated back to a fund. Any such rebates are included in net realized gain (loss) on investments in the Statement of Operations. Dividend income is recorded on the ex-dividend date, except for certain dividends from foreign securities where the ex-dividend date may have passed, which are recorded as soon as the Fund is informed of the ex-dividend date. Non-cash dividends included in dividend income, if any, are recorded at the fair market value of the securities received. Income and capital gain distributions from Fidelity Central Funds, if any, are recorded on the ex-dividend date. Certain distributions received by the Fund represent a return of capital or capital gain. The Fund determines the components of these distributions subsequent to the ex-dividend date, based upon receipt of tax filings or other correspondence relating to the underlying investment. These distributions are recorded as a reduction of cost of investments and/or as a realized gain. Investment income is recorded net of foreign taxes withheld where recovery of such taxes is uncertain. Funds may file withholding tax reclaims in certain jurisdictions to recover a portion of amounts previously withheld. Any withholding tax reclaims income is included in the Statement of Operations in dividends. Any receivables for withholding tax reclaims are included in the Statement of Assets and Liabilities in dividends receivable.
Class Allocations and Expenses. Investment income, realized and unrealized capital gains and losses, common expenses of a fund, and certain fund-level expense reductions, if any, are allocated daily on a pro-rata basis to each class based on the relative net assets of each class to the total net assets of a fund. Each class differs with respect to transfer agent and distribution and service plan fees incurred, as applicable. Certain expense reductions may also differ by class, if applicable. For the reporting period, the allocated portion of income and expenses to each class as a percent of its average net assets may vary due to the timing of recording these transactions in relation to fluctuating net assets of the classes. Expenses directly attributable to a fund are charged to that fund. Expenses attributable to more than one fund are allocated among the respective funds on the basis of relative net assets or other appropriate methods. Expenses included in the accompanying financial statements reflect the expenses of that fund and do not include any expenses associated with any underlying mutual funds or exchange-traded funds (ETFs). Although not included in a fund's expenses, a fund indirectly bears its proportionate share of these expenses through the net asset value of each underlying mutual fund or exchange-traded fund (ETF). Expense estimates are accrued in the period to which they relate and adjustments are made when actual amounts are known.
Income Tax Information and Distributions to Shareholders. Each year, the Fund intends to qualify as a regulated investment company under Subchapter M of the Internal Revenue Code, including distributing substantially all of its taxable income and realized gains. As a result, no provision for U.S. Federal income taxes is required. As of December 31, 2024, the Fund did not have any unrecognized tax benefits in the financial statements; nor is the Fund aware of any tax positions for which it is reasonably possible that the total amounts of unrecognized tax benefits will significantly change in the next twelve months. The Fund files a U.S. federal tax return, in addition to state and local tax returns as required. The Fund's federal income tax returns are subject to examination by the Internal Revenue Service (IRS) for a period of three fiscal years after they are filed. State and local tax returns may be subject to examination for an additional fiscal year depending on the jurisdiction. Foreign taxes are provided for based on the Fund's understanding of the tax rules and rates that exist in the foreign markets in which it invests.
Distributions are declared and recorded on the ex-dividend date. Income and capital gain distributions are declared separately for each class. Income and capital gain distributions are determined in accordance with income tax regulations, which may differ from GAAP.
Capital accounts within the financial statements are adjusted for permanent book-tax differences. These adjustments have no impact on net assets or the results of operations. Capital accounts are not adjusted for temporary book-tax differences which will reverse in a subsequent period.
Book-tax differences are primarily due to foreign currency transactions and losses deferred due to wash sales.
As of period end, the cost and unrealized appreciation (depreciation) in securities, and derivatives if applicable, for federal income tax purposes were as follows:
| Gross unrealized appreciation | $170,838,096 |
| Gross unrealized depreciation | (47,780,740) |
| Net unrealized appreciation (depreciation) | $123,057,356 |
| Tax Cost | $803,651,508 |
The tax-based components of distributable earnings as of period end were as follows:
| Undistributed ordinary income | $4,606,450 |
| Undistributed long-term capital gain | $12,554,312 |
| Net unrealized appreciation (depreciation) on securities and other investments | $123,057,432 |
The tax character of distributions paid was as follows:
| | December 31, 2024 | December 31, 2023 |
| Ordinary Income | $22,345,900 | $ 6,581,275 |
| Long-term Capital Gains | 87,666,092 | 25,043,580 |
| Total | $110,011,992 | $ 31,624,855 |
Restricted Securities (including Private Placements). Funds may invest in securities that are subject to legal or contractual restrictions on resale. These securities generally may be resold in transactions exempt from registration or to the public if the securities are registered. Disposal of these securities may involve time-consuming negotiations and expense, and prompt sale at an acceptable price may be difficult. Information regarding restricted securities held at period end is included at the end of the Schedule of Investments, if applicable.
New Accounting Pronouncement. FASB Accounting Standards Update (ASU) 2023-07 Segment Reporting (Topic 280): Improvements to Reportable Segment Disclosures became effective in this reporting period. ASU 2023-07 enhances segment information disclosure in the notes to financial statements.
4. Purchases and Sales of Investments.
Purchases and sales of securities, other than short-term securities and in-kind transactions, as applicable, are noted in the table below.
| | Purchases ($) | Sales ($) |
| VIP Value Strategies Portfolio | 644,915,771 | 493,988,403 |
5. Fees and Other Transactions with Affiliates.
Management Fee. Fidelity Management & Research Company LLC (the investment adviser) and its affiliates provide the Fund with investment management related services for which the Fund pays a monthly management fee.
Effective March 1, 2024, the Fund's management contract was amended to incorporate administrative services previously covered under separate services agreements (Transfer Agent and Accounting agreements). The amended contract incorporates a management fee rate that may vary by class. The investment adviser or an affiliate pays certain expenses of managing and operating the Fund out of each class's management fee. Each class of the Fund pays a management fee to the investment adviser. The management fee is calculated and paid to the investment adviser every month. When determining a class's management fee, a mandate rate is calculated based on the monthly average net assets of a group of funds advised by FMR within a designated asset class. A discount rate is subtracted from the mandate rate once the Fund's monthly average net assets reach a certain level. The mandate rate and discount rate may vary by class. The annual management fee rate for a class of shares of the Fund is the lesser of (1) the class's mandate rate reduced by the class's discount rate (if applicable) or (2) the amount set forth in the following table.
| | Maximum Management Fee Rate % |
| Initial Class | .58 |
| Service Class | .58 |
| Service Class 2 | .58 |
| Investor Class | .65 |
One-twelfth of the management fee rate for a class is applied to the average net assets of the class for the month, giving a dollar amount which is the management fee for the class for that month. A different management fee rate may be applicable to each class of the Fund. The difference between classes is the result of separate arrangements for class-level services and/or waivers of certain expenses. It is not the result of any difference in advisory or custodial fees or other expenses related to the management of the Fund's assets, which do not vary by class. For the portion of the reporting period on or after March 1, 2024, the total annualized management fee rates were as follows:
| | Total Management Fee Rate % |
| Initial Class | .58 |
| Service Class | .58 |
| Service Class 2 | .58 |
| Investor Class | .65 |
Prior to March 1, 2024, the management fee was the sum of an individual fund fee rate that was based on an annual rate of .30% of the Fund's average net assets and an annualized group fee rate that averaged .22% during the period. The group fee rate was based upon the monthly average net assets of a group of registered investment companies with which the investment adviser has management contracts. The group fee rate decreased as assets under management increased and increased as assets under management decreased. For the portion of the reporting period prior to March 1, 2024, the total annualized management fee rate was .52%.
Effective March 1, 2024, the Fund's sub-advisory agreements with FMR Investment Management (UK) Limited, Fidelity Management & Research (Hong Kong) Limited, and Fidelity Management & Research (Japan) Limited were amended to provide that the investment adviser pays each sub-adviser monthly fees equal to 110% of the sub-adviser's costs for providing sub-advisory services.
Distribution and Service Plan Fees. In accordance with Rule 12b-1 of the 1940 Act, the Fund has adopted separate 12b-1 Plans for each Service Class of shares. Each Service Class pays Fidelity Distributors Company LLC (FDC), an affiliate of the investment adviser, a service fee. For the period, the service fee is based on an annual rate of .10% of Service Class' average net assets and .25% of Service Class 2's average net assets.
For the period, total fees, all of which were re-allowed to insurance companies for the distribution of shares and providing shareholder support services, were as follows:
| Service Class | $33,265 |
| Service Class 2 | 908,836 |
| | $942,101 |
Transfer Agent Fees. Fidelity Investments Institutional Operations Company LLC (FIIOC), an affiliate of the investment adviser, is the Fund's transfer, dividend disbursing, and shareholder servicing agent. Effective March 1, 2024, the Fund's management contract was amended to incorporate transfer agent services and associated fees previously covered under a separate services agreement.
During the period January 1, 2024 through February 29, 2024, the transfer agent fees for each class were a fixed annual rate of class-level average net assets as follows:
| | Amount ($) | % of Class-Level Average Net Assets |
| Initial Class | 10,537 | .0630 |
| Service Class | 3,233 | .0630 |
| Service Class 2 | 35,515 | .0630 |
| Investor Class | 52,281 | .1390 |
| | 101,566 | |
Accounting Fees. Fidelity Service Company, Inc. (FSC), an affiliate of the investment adviser, maintains the Fund's accounting records. Effective March 1, 2024, the Fund's management contract was amended to incorporate accounting services and associated fees previously covered under a separate services agreement.
During the period January 1, 2024 through February 29, 2024, the accounting fees were a fixed annual rate of average net assets as follows:
| | % of Average Net Assets |
| VIP Value Strategies Portfolio | .0325 |
| | |
Brokerage Commissions. A portion of portfolio transactions were placed with brokerage firms which are affiliates of the investment adviser. Brokerage commissions are included in net realized gain (loss) and change in net unrealized appreciation (depreciation) in the Statement of Operations. The commissions paid to these affiliated firms were as follows:
| | Amount ($) |
| VIP Value Strategies Portfolio | 12,124 |
Interfund Lending Program. Pursuant to an Exemptive Order issued by the Securities and Exchange Commission (the SEC), the Fund, along with other registered investment companies having management contracts with Fidelity Management & Research Company LLC (FMR), or other affiliated entities of FMR, may participate in an interfund lending program. This program provides an alternative credit facility allowing the Fund to borrow from, or lend money to, other participating affiliated funds at rates that are beneficial to both the borrowing and lending fund. Borrowings under the program are generally for temporary or emergency purposes, including meeting fund shareholder redemptions. The interfund loan rate is determined, as specified in the Exemptive Order, by averaging, (1) the higher of the overnight time deposit rate and the current overnight repurchase agreement rate, and (2) a benchmark rate representing the lowest bank loan rate available to the funds. At period end, there were no interfund loans outstanding. Activity in this program during the period for which loans were outstanding was as follows:
| | Borrower or Lender | Average Loan Balance ($) | Weighted Average Interest Rate | Interest Expense ($) |
| VIP Value Strategies Portfolio | Borrower | 4,860,500 | 5.57% | 1,504 |
Interfund Trades. Funds may purchase from or sell securities to other Fidelity Funds under procedures adopted by the Board. The procedures have been designed to ensure these interfund trades are executed in accordance with Rule 17a-7 of the 1940 Act. Any interfund trades are included within the respective purchases and sales amounts shown in the Purchases and Sales of Investments note. Interfund trades during the period are noted in the table below.
| | Purchases ($) | Sales ($) | Realized Gain (Loss) ($) |
| VIP Value Strategies Portfolio | 85,644,306 | 36,390,368 | 8,551,704 |
6. Committed Line of Credit.
Certain Funds participate with other funds managed by the investment adviser or an affiliate in a $4.25 billion credit facility (the "line of credit") to be utilized for temporary or emergency purposes to fund shareholder redemptions or for other short-term liquidity purposes.
Commitment fees are charged based on the unused amount of the line of credit at an annual rate of .10%, and then allocated to each participating fund based on its pro-rata portion of the line of credit. The commitment fees are reflected in Miscellaneous expenses on the Statement of Operations, and are listed below.
Interest is charged to a participating fund based on its borrowings at an annual rate of .75% plus the highest of (i) daily SOFR plus a .10% spread adjustment, (ii) Federal Funds Effective Rate, or (iii) Overnight Bank Funding Rate. During the period, there were no borrowings on this line of credit.
The line of credit agreement will expire in March 2025 unless extended or renewed.| | Amount ($) |
| VIP Value Strategies Portfolio | 1,128 |
7. Security Lending.
Funds lend portfolio securities from time to time in order to earn additional income. Lending agents are used, including National Financial Services (NFS), an affiliate of the investment adviser. Pursuant to a securities lending agreement, NFS will receive a fee, which is capped at 9.9% of a fund's daily lending revenue, for its services as lending agent. A fund may lend securities to certain qualified borrowers, including NFS. On the settlement date of the loan, a fund receives collateral (in the form of U.S. Treasury obligations, letters of credit and/or cash) against the loaned securities and maintains collateral in an amount not less than 100% of the market value of the loaned securities during the period of the loan. The market value of the loaned securities is determined at the close of business of a fund and any additional required collateral is delivered to a fund on the next business day. A fund or borrower may terminate the loan at any time, and if the borrower defaults on its obligation to return the securities loaned because of insolvency or other reasons, a fund may apply collateral received from the borrower against the obligation. A fund may experience delays and costs in recovering the securities loaned. Any cash collateral received is invested in the Fidelity Securities Lending Cash Central Fund. Any loaned securities are identified as such in the Schedule of Investments, and the value of loaned securities and cash collateral at period end, as applicable, are presented in the Statement of Assets and Liabilities. Security lending income represents the income earned on investing cash collateral, less rebates paid to borrowers and any lending agent fees associated with the loan, plus any premium payments received for lending certain types of securities. Security lending income is presented in the Statement of Operations as a component of income from Fidelity Central Funds. Affiliated security lending activity, if any, was as follows:
| | Total Security Lending Fees Paid to NFS ($) | Security Lending Income From Securities Loaned to NFS ($) | Value of Securities Loaned to NFS at Period End ($) |
| VIP Value Strategies Portfolio | 18,789 | 1 | - |
8. Expense Reductions.
During the period the investment adviser or an affiliate reimbursed and/or waived a portion of fund-level operating expenses in the amount of $30,926.
9. Distributions to Shareholders.
Distributions to shareholders of each class were as follows:
| | Year ended December 31, 2024 | Year ended December 31, 2023 |
| VIP Value Strategies Portfolio | | |
| Distributions to shareholders | | |
| Initial Class | $16,131,999 | $4,767,400 |
| Service Class | 4,972,869 | 1,445,393 |
| Service Class 2 | 54,511,797 | 14,914,087 |
| Investor Class | 34,395,327 | 10,497,975 |
Total | $110,011,992 | $31,624,855 |
10. Share Transactions.
Transactions for each class of shares were as follows and may contain in-kind transactions:
| | Shares | Shares | Dollars | Dollars |
| | Year ended December 31, 2024 | Year ended December 31, 2023 | Year ended December 31, 2024 | Year ended December 31, 2023 |
| VIP Value Strategies Portfolio | | | | |
| Initial Class | | | | |
| Shares sold | 1,635,429 | 1,225,741 | $27,661,415 | $18,738,644 |
| Reinvestment of distributions | 993,454 | 298,273 | 16,131,999 | 4,767,400 |
| Shares redeemed | (1,648,291) | (1,825,041) | (28,884,213) | (28,093,787) |
| Net increase (decrease) | 980,592 | (301,027) | $14,909,201 | $(4,587,743) |
| Service Class | | | | |
| Shares sold | 296,815 | 507,339 | $5,051,659 | $7,731,495 |
| Reinvestment of distributions | 307,743 | 90,829 | 4,972,869 | 1,445,393 |
| Shares redeemed | (371,327) | (388,146) | (6,432,574) | (5,919,772) |
| Net increase (decrease) | 233,231 | 210,022 | $3,591,954 | $3,257,116 |
| Service Class 2 | | | | |
| Shares sold | 3,355,920 | 2,807,911 | $57,869,506 | $43,873,428 |
| Reinvestment of distributions | 3,310,610 | 921,584 | 54,511,796 | 14,914,087 |
| Shares redeemed | (3,325,471) | (4,708,667) | (57,689,743) | (72,194,111) |
| Net increase (decrease) | 3,341,059 | (979,172) | $54,691,559 | $(13,406,596) |
| Investor Class | | | | |
| Shares sold | 14,479,492 | 1,863,030 | $223,564,703 | $28,995,461 |
| Reinvestment of distributions | 2,143,011 | 663,432 | 34,395,326 | 10,497,975 |
| Shares redeemed | (2,947,710) | (4,105,078) | (49,048,893) | (60,465,369) |
| Net increase (decrease) | 13,674,793 | (1,578,616) | $208,911,136 | $(20,971,933) |
11. Other.
A fund's organizational documents provide former and current trustees and officers with a limited indemnification against liabilities arising in connection with the performance of their duties to the fund. In the normal course of business, a fund may also enter into contracts that provide general indemnifications. A fund's maximum exposure under these arrangements is unknown as this would be dependent on future claims that may be made against a fund. The risk of material loss from such claims is considered remote.
At the end of the period, the investment adviser or its affiliates were owners of record of more than 10% and certain otherwise unaffiliated shareholders each were owners of record of more than 10% of the outstanding shares as follows:
| Fund | Affiliated % | Number of Unaffiliated Shareholders | Unaffiliated Shareholders % |
| VIP Value Strategies Portfolio | 27 | 1 | 26 |
In addition, at the end of the period, the following mutual funds managed by the investment adviser or its affiliates, were the owners of record of 10% or more of the total outstanding shares.
| | VIP FundsManager 60% Portfolio | | |
| VIP Value Strategies Portfolio | 11% | | |
Mutual funds managed by the investment adviser or its affiliates, in aggregate, were the owners of record of more than 20% of the total outstanding shares.
| Fund | % of shares held |
| VIP Value Strategies Portfolio | 30% |
12. Risk and Uncertainties.
Many factors affect a fund's performance. Developments that disrupt global economies and financial markets, such as pandemics, epidemics, outbreaks of infectious diseases, war, terrorism, and environmental disasters, may significantly affect a fund's investment performance. The effects of these developments to a fund will be impacted by the types of securities in which a fund invests, the financial condition, industry, economic sector, and geographic location of an issuer, and a fund's level of investment in the securities of that issuer. Significant concentrations in security types, issuers, industries, sectors, and geographic locations may magnify the factors that affect a fund's performance.
Report of Independent Registered Public Accounting Firm
To the Board of Trustees of Variable Insurance Products Fund III and the Shareholders of VIP Value Strategies Portfolio:
Opinion on the Financial Statements and Financial Highlights
We have audited the accompanying statement of assets and liabilities of VIP Value Strategies Portfolio (the "Fund"), a fund of Variable Insurance Products Fund III, including the schedule of investments, as of December 31, 2024, the related statement of operations for the year then ended, the statement of changes in net assets for each of the two years in the period then ended, the financial highlights for each of the five years in the period then ended, and the related notes. In our opinion, the financial statements and financial highlights present fairly, in all material respects, the financial position of the Fund as of December 31, 2024, and the results of its operations for the year then ended, the changes in its net assets for each of the two years in the period then ended, and the financial highlights for each of the five years in the period then ended in conformity with accounting principles generally accepted in the United States of America.
Basis for Opinion
These financial statements and financial highlights are the responsibility of the Fund's management. Our responsibility is to express an opinion on the Fund's financial statements and financial highlights based on our audits. We are a public accounting firm registered with the Public Company Accounting Oversight Board (United States) (PCAOB) and are required to be independent with respect to the Fund in accordance with the U.S. federal securities laws and the applicable rules and regulations of the Securities and Exchange Commission and the PCAOB.
We conducted our audits in accordance with the standards of the PCAOB. Those standards require that we plan and perform the audit to obtain reasonable assurance about whether the financial statements and financial highlights are free of material misstatement, whether due to error or fraud. The Fund is not required to have, nor were we engaged to perform, an audit of its internal control over financial reporting. As part of our audits, we are required to obtain an understanding of internal control over financial reporting but not for the purpose of expressing an opinion on the effectiveness of the Fund's internal control over financial reporting. Accordingly, we express no such opinion.
Our audits included performing procedures to assess the risks of material misstatement of the financial statements and financial highlights, whether due to error or fraud, and performing procedures that respond to those risks. Such procedures included examining, on a test basis, evidence regarding the amounts and disclosures in the financial statements and financial highlights. Our audits also included evaluating the accounting principles used and significant estimates made by management, as well as evaluating the overall presentation of the financial statements and financial highlights. Our procedures included confirmation of securities owned as of December 31, 2024, by correspondence with the custodian and brokers; when replies were not received from brokers, we performed other auditing procedures. We believe that our audits provide a reasonable basis for our opinion.
/s/ Deloitte & Touche LLP
Boston, Massachusetts
February 13, 2025
We have served as the auditor of one or more of the Fidelity investment companies since 1999.
Distributions
(Unaudited)The dividend and capital gains distributions for the fund(s) are available on Fidelity.com or Institutional.Fidelity.com.
The fund hereby designates as a capital gain dividend with respect to the taxable year ended December 31, 2024, $90,803,658, or, if subsequently determined to be different, the net capital gain of such year.
The fund designates $242,854 of distributions paid during the fiscal year ended 2024 as qualifying to be taxed as section 163(j) interest dividends.
Initial Class designates 35%; Service Class designates 36%; Service Class 2 designates 38%; and Investor Class designates 36%; of the dividends distributed in December, during the fiscal year as qualifying for the dividends-received deduction for corporate shareholders.
Item 8: Changes in and Disagreements with Accountants for Open-End Management Investment Companies
(Unaudited)
Note: This is not applicable for any fund included in this document.
Item 9: Proxy Disclosures for Open-End Management Investment Companies
(Unaudited)
| A special meeting of shareholders was held on July 16, 2024. The results of votes taken among shareholders on the proposal before them are reported below. Each vote reported represents one dollar of net asset value held on the record date for the meeting. |
| Proposal 1 |
| To elect a Board of Trustees. |
| | # of Votes | % of Votes |
| Bettina Doulton |
| Affirmative | 19,815,631,510.17 | 96.35 |
| Withheld | 749,708,334.02 | 3.65 |
| TOTAL | 20,565,339,844.19 | 100.00 |
| Robert A. Lawrence |
| Affirmative | 19,766,714,617.58 | 96.12 |
| Withheld | 798,625,226.62 | 3.88 |
| TOTAL | 20,565,339,844.19 | 100.00 |
| Vijay C. Advani |
| Affirmative | 19,788,320,252.27 | 96.22 |
| Withheld | 777,019,591.92 | 3.78 |
| TOTAL | 20,565,339,844.19 | 100.00 |
| Thomas P. Bostick |
| Affirmative | 19,780,566,370.66 | 96.18 |
| Withheld | 784,773,473.53 | 3.82 |
| TOTAL | 20,565,339,844.19 | 100.00 |
| Donald F. Donahue |
| Affirmative | 19,723,882,404.02 | 95.91 |
| Withheld | 841,457,440.18 | 4.09 |
| TOTAL | 20,565,339,844.19 | 100.00 |
| Vicki L. Fuller |
| Affirmative | 19,823,019,040.62 | 96.39 |
| Withheld | 742,320,803.57 | 3.61 |
| TOTAL | 20,565,339,844.19 | 100.00 |
| Patricia L. Kampling |
| Affirmative | 19,837,563,936.04 | 96.46 |
| Withheld | 727,775,908.15 | 3.54 |
| TOTAL | 20,565,339,844.19 | 100.00 |
| Thomas A. Kennedy |
| Affirmative | 19,789,564,999.11 | 96.23 |
| Withheld | 775,774,845.08 | 3.77 |
| TOTAL | 20,565,339,844.19 | 100.00 |
| Oscar Munoz |
| Affirmative | 19,772,385,801.51 | 96.14 |
| Withheld | 792,954,042.68 | 3.86 |
| TOTAL | 20,565,339,844.19 | 100.00 |
| Karen B. Peetz |
| Affirmative | 19,804,495,604.67 | 96.30 |
| Withheld | 760,844,239.52 | 3.70 |
| TOTAL | 20,565,339,844.19 | 100.00 |
| David M. Thomas |
| Affirmative | 19,717,117,994.71 | 95.88 |
| Withheld | 848,221,849.48 | 4.12 |
| TOTAL | 20,565,339,844.19 | 100.00 |
| Susan Tomasky |
| Affirmative | 19,783,626,171.89 | 96.20 |
| Withheld | 781,713,672.31 | 3.80 |
| TOTAL | 20,565,339,844.19 | 100.00 |
| Michael E. Wiley |
| Affirmative | 19,728,139,900.50 | 95.93 |
| Withheld | 837,199,943.69 | 4.07 |
| TOTAL | 20,565,339,844.19 | 100.00 |
| | | |
| Proposal 1 reflects trust-wide proposal and voting results. |
Item 10: Remuneration Paid to Directors, Officers, and others of Open-End Management Investment Companies
(Unaudited)
Note: This information is disclosed as part of the financial statements for each Fund as part of Item 7: Financial Statements and Financial Highlights for Open-End Management Investment companies.
Item 11: Statement Regarding Basis for Approval of Investment Advisory Contract
(Unaudited)
Note: This is not applicable for any fund included in this document.
1.781994.122
VIPVS-ANN-0325
Fidelity® Variable Insurance Products:
VIP Mid Cap Portfolio
Annual Report
December 31, 2024
Contents
To view a fund's proxy voting guidelines and proxy voting record for the 12-month period ended June 30, visit http://www.fidelity.com/proxyvotingresults or visit the Securities and Exchange Commission's (SEC) web site at http://www.sec.gov.
You may also call 1-877-208-0098 to request a free copy of the proxy voting guidelines.
Fidelity® Variable Insurance Products are separate account options which are purchased through a variable insurance contract.
Standard & Poor's, S&P and S&P 500 are registered service marks of The McGraw-Hill Companies, Inc. and have been licensed for use by Fidelity Distributors Corporation.
Other third-party marks appearing herein are the property of their respective owners.
All other marks appearing herein are registered or unregistered trademarks or service marks of FMR LLC or an affiliated company. © 2025 FMR LLC. All rights reserved.
This report and the financial statements contained herein are submitted for the general information of the shareholders of the Fund. This report is not authorized for distribution to prospective investors in the Fund unless preceded or accompanied by an effective prospectus.
A fund files its complete schedule of portfolio holdings with the SEC for the first and third quarters of each fiscal year on Form N-PORT. Forms N-PORT are available on the SEC's web site at http://www.sec.gov. A fund's Forms N-PORT may be reviewed and copied at the SEC's Public Reference Room in Washington, DC. Information regarding the operation of the SEC's Public Reference Room may be obtained by calling 1-800-SEC-0330.
For a complete list of a fund's portfolio holdings, view the most recent holdings listing, semiannual report, or annual report on Fidelity's web site at http://www.fidelity.com, http://www.institutional.fidelity.com, or http://www.401k.com, as applicable.
NOT FDIC INSURED •MAY LOSE VALUE •NO BANK GUARANTEE
Neither the Fund nor Fidelity Distributors Corporation is a bank.
Item 7: Financial Statements and Financial Highlights for Open-End Management Investment Companies (Annual Report)
Schedule of Investments December 31, 2024
Showing Percentage of Net Assets
| Common Stocks - 99.7% |
| | | Shares | Value ($) |
| BELGIUM - 0.9% | | | |
| Health Care - 0.9% | | | |
| Pharmaceuticals - 0.9% | | | |
| UCB SA | | 348,100 | 69,303,358 |
| BRAZIL - 0.4% | | | |
| Materials - 0.4% | | | |
| Metals & Mining - 0.4% | | | |
| Wheaton Precious Metals Corp | | 568,200 | 31,982,373 |
| CANADA - 2.2% | | | |
| Consumer Discretionary - 0.4% | | | |
| Specialty Retail - 0.4% | | | |
| Aritzia Inc Subordinate Voting Shares (a) | | 823,500 | 30,615,214 |
| Energy - 0.2% | | | |
| Oil, Gas & Consumable Fuels - 0.2% | | | |
| MEG Energy Corp | | 1,010,100 | 16,583,784 |
| Financials - 0.5% | | | |
| Capital Markets - 0.5% | | | |
| TMX Group Ltd | | 1,146,800 | 35,326,658 |
| Industrials - 0.9% | | | |
| Commercial Services & Supplies - 0.9% | | | |
| RB Global Inc (United States) (b) | | 716,000 | 64,590,360 |
| Materials - 0.2% | | | |
| Metals & Mining - 0.2% | | | |
| Teck Resources Ltd Class B (United States) | | 384,300 | 15,575,679 |
| TOTAL CANADA | | | 162,691,695 |
| FRANCE - 0.3% | | | |
| Health Care - 0.3% | | | |
| Life Sciences Tools & Services - 0.3% | | | |
| Sartorius Stedim Biotech | | 120,000 | 23,455,787 |
| GERMANY - 0.2% | | | |
| Health Care - 0.2% | | | |
| Biotechnology - 0.2% | | | |
| BioNTech SE ADR (a) | | 132,500 | 15,098,375 |
| ISRAEL - 1.6% | | | |
| Information Technology - 1.6% | | | |
| IT Services - 1.2% | | | |
| Wix.com Ltd (a) | | 412,500 | 88,501,875 |
| Semiconductors & Semiconductor Equipment - 0.4% | | | |
| Nova Ltd (a) | | 164,600 | 32,417,970 |
| TOTAL ISRAEL | | | 120,919,845 |
| ITALY - 0.4% | | | |
| Industrials - 0.4% | | | |
| Electrical Equipment - 0.4% | | | |
| Prysmian SpA | | 455,300 | 29,080,244 |
| JAPAN - 0.3% | | | |
| Information Technology - 0.3% | | | |
| Semiconductors & Semiconductor Equipment - 0.3% | | | |
| Allegro MicroSystems Inc (a) | | 1,008,100 | 22,037,066 |
| NETHERLANDS - 0.2% | | | |
| Health Care - 0.2% | | | |
| Biotechnology - 0.2% | | | |
| Argenx SE ADR (a) | | 22,100 | 13,591,500 |
| PUERTO RICO - 0.8% | | | |
| Financials - 0.8% | | | |
| Banks - 0.8% | | | |
| Popular Inc | | 629,227 | 59,185,092 |
| UNITED KINGDOM - 1.6% | | | |
| Energy - 1.0% | | | |
| Energy Equipment & Services - 1.0% | | | |
| TechnipFMC PLC | | 2,473,300 | 71,577,302 |
| Financials - 0.2% | | | |
| Insurance - 0.2% | | | |
| Fidelis Insurance Holdings Ltd (b) | | 1,079,600 | 19,573,148 |
| Information Technology - 0.4% | | | |
| Software - 0.4% | | | |
| Sage Group PLC/The | | 1,747,800 | 27,854,141 |
| TOTAL UNITED KINGDOM | | | 119,004,591 |
| UNITED STATES - 90.8% | | | |
| Communication Services - 1.8% | | | |
| Entertainment - 1.6% | | | |
| Liberty Media Corp-Liberty Formula One Class C (a)(b) | | 400,700 | 37,128,862 |
| Live Nation Entertainment Inc (a) | | 470,394 | 60,916,023 |
| TKO Group Holdings Inc Class A (a) | | 163,500 | 23,234,985 |
| | | | 121,279,870 |
| Interactive Media & Services - 0.2% | | | |
| Pinterest Inc Class A (a) | | 601,600 | 17,446,400 |
TOTAL COMMUNICATION SERVICES | | | 138,726,270 |
| | | | |
| Consumer Discretionary - 11.9% | | | |
| Diversified Consumer Services - 3.1% | | | |
| Duolingo Inc Class A (a) | | 221,800 | 71,914,214 |
| Grand Canyon Education Inc (a) | | 460,100 | 75,364,380 |
| Service Corp International/US (b) | | 1,057,100 | 84,377,722 |
| | | | 231,656,316 |
| Hotels, Restaurants & Leisure - 3.6% | | | |
| Aramark | | 1,666,358 | 62,171,817 |
| Churchill Downs Inc | | 429,504 | 57,355,964 |
| Dutch Bros Inc Class A (a) | | 670,200 | 35,105,076 |
| Light & Wonder Inc Class A (a) | | 603,200 | 52,104,416 |
| Red Rock Resorts Inc Class A | | 363,700 | 16,817,488 |
| Texas Roadhouse Inc | | 233,400 | 42,112,362 |
| | | | 265,667,123 |
| Household Durables - 1.6% | | | |
| Cavco Industries Inc (a) | | 60,900 | 27,175,407 |
| NVR Inc (a) | | 4,058 | 33,189,976 |
| Taylor Morrison Home Corp (a) | | 558,912 | 34,211,004 |
| Toll Brothers Inc | | 172,500 | 21,726,375 |
| | | | 116,302,762 |
| Specialty Retail - 2.4% | | | |
| Dick's Sporting Goods Inc | | 361,336 | 82,688,130 |
| Williams-Sonoma Inc | | 536,546 | 99,357,589 |
| | | | 182,045,719 |
| Textiles, Apparel & Luxury Goods - 1.2% | | | |
| Deckers Outdoor Corp (a) | | 305,734 | 62,091,518 |
| PVH Corp | | 296,300 | 31,333,724 |
| | | | 93,425,242 |
TOTAL CONSUMER DISCRETIONARY | | | 889,097,162 |
| | | | |
| Consumer Staples - 4.9% | | | |
| Consumer Staples Distribution & Retail - 4.5% | | | |
| Albertsons Cos Inc | | 972,500 | 19,099,900 |
| BJ's Wholesale Club Holdings Inc (a) | | 917,799 | 82,005,341 |
| Performance Food Group Co (a) | | 1,095,600 | 92,632,980 |
| Sprouts Farmers Market Inc (a) | | 281,600 | 35,782,912 |
| US Foods Holding Corp (a)(b) | | 1,551,540 | 104,666,888 |
| | | | 334,188,021 |
| Food Products - 0.4% | | | |
| Simply Good Foods Co/The (a) | | 532,100 | 20,741,258 |
| Westrock Coffee Co (a)(b) | | 1,988,842 | 12,768,366 |
| | | | 33,509,624 |
TOTAL CONSUMER STAPLES | | | 367,697,645 |
| | | | |
| Energy - 4.8% | | | |
| Energy Equipment & Services - 1.9% | | | |
| Baker Hughes Co Class A | | 992,548 | 40,714,319 |
| Kodiak Gas Services Inc | | 681,300 | 27,817,479 |
| Valaris Ltd (a)(b) | | 622,061 | 27,519,978 |
| Weatherford International PLC (b) | | 618,700 | 44,317,481 |
| | | | 140,369,257 |
| Oil, Gas & Consumable Fuels - 2.9% | | | |
| Antero Resources Corp (a) | | 2,125,625 | 74,503,156 |
| Ovintiv Inc | | 1,070,000 | 43,335,000 |
| Permian Resources Corp Class A | | 4,400,700 | 63,282,066 |
| Range Resources Corp | | 1,013,168 | 36,453,785 |
| | | | 217,574,007 |
TOTAL ENERGY | | | 357,943,264 |
| | | | |
| Financials - 18.6% | | | |
| Banks - 7.2% | | | |
| Bancorp Inc/The (a) | | 1,122,022 | 59,052,018 |
| BOK Financial Corp | | 344,300 | 36,650,735 |
| Cadence Bank | | 1,118,065 | 38,517,339 |
| East West Bancorp Inc | | 1,034,817 | 99,094,076 |
| First Citizens BancShares Inc/NC Class A | | 29,100 | 61,488,882 |
| First Interstate BancSystem Inc Class A | | 577,900 | 18,764,413 |
| Huntington Bancshares Inc/OH | | 1,096,800 | 17,844,936 |
| KeyCorp | | 4,167,700 | 71,434,378 |
| Pinnacle Financial Partners Inc | | 357,000 | 40,837,230 |
| Wintrust Financial Corp | | 765,341 | 95,445,676 |
| | | | 539,129,683 |
| Capital Markets - 3.9% | | | |
| Blue Owl Capital Inc Class A (b) | | 2,783,600 | 64,746,536 |
| Houlihan Lokey Inc Class A | | 293,400 | 50,951,844 |
| Northern Trust Corp | | 436,155 | 44,705,888 |
| Raymond James Financial Inc | | 424,797 | 65,983,718 |
| Stifel Financial Corp | | 584,600 | 62,014,368 |
| | | | 288,402,354 |
| Financial Services - 1.9% | | | |
| Essent Group Ltd | | 1,057,204 | 57,554,186 |
| PennyMac Financial Services Inc | | 302,700 | 30,917,778 |
| Toast Inc Class A (a) | | 1,640,100 | 59,781,645 |
| | | | 148,253,609 |
| Insurance - 5.6% | | | |
| American Financial Group Inc/OH | | 419,713 | 57,471,301 |
| Arch Capital Group Ltd | | 375,600 | 34,686,660 |
| First American Financial Corp | | 768,900 | 48,010,116 |
| Hartford Financial Services Group Inc/The | | 282,522 | 30,907,907 |
| Old Republic International Corp | | 869,710 | 31,474,805 |
| Primerica Inc | | 341,547 | 92,702,687 |
| Reinsurance Group of America Inc | | 490,578 | 104,802,178 |
| Selective Insurance Group Inc | | 175,700 | 16,431,464 |
| | | | 416,487,118 |
TOTAL FINANCIALS | | | 1,392,272,764 |
| | | | |
| Health Care - 10.1% | | | |
| Biotechnology - 2.1% | | | |
| Arcellx Inc (a) | | 188,800 | 14,479,072 |
| Arrowhead Pharmaceuticals Inc (a) | | 657,540 | 12,361,752 |
| Avidity Biosciences Inc (a) | | 329,500 | 9,581,860 |
| Blueprint Medicines Corp (a) | | 185,400 | 16,170,588 |
| Centessa Pharmaceuticals PLC ADR (a) | | 557,700 | 9,341,475 |
| Crinetics Pharmaceuticals Inc (a) | | 203,800 | 10,420,294 |
| Exact Sciences Corp (a) | | 532,500 | 29,921,175 |
| Krystal Biotech Inc (a) | | 50,884 | 7,971,487 |
| SpringWorks Therapeutics Inc (a) | | 114,100 | 4,122,433 |
| United Therapeutics Corp (a) | | 117,800 | 41,564,552 |
| | | | 155,934,688 |
| Health Care Equipment & Supplies - 2.8% | | | |
| Cooper Cos Inc/The (a) | | 305,756 | 28,108,149 |
| Glaukos Corp (a) | | 129,400 | 19,402,236 |
| Insulet Corp (a) | | 96,500 | 25,193,255 |
| Integer Holdings Corp (a) | | 241,900 | 32,056,588 |
| Lantheus Holdings Inc (a)(b) | | 96,900 | 8,668,674 |
| Masimo Corp (a) | | 398,000 | 65,789,400 |
| TransMedics Group Inc (a)(b) | | 469,000 | 29,242,150 |
| | | | 208,460,452 |
| Health Care Providers & Services - 3.2% | | | |
| Astrana Health Inc (a) | | 325,873 | 10,274,776 |
| BrightSpring Health Services Inc (a) | | 1,768,200 | 30,112,446 |
| Encompass Health Corp (b) | | 824,900 | 76,179,516 |
| Molina Healthcare Inc (a) | | 129,768 | 37,768,976 |
| Tenet Healthcare Corp (a)(b) | | 470,362 | 59,373,795 |
| Universal Health Services Inc Class B | | 146,600 | 26,302,972 |
| | | | 240,012,481 |
| Life Sciences Tools & Services - 1.5% | | | |
| 10X Genomics Inc Class A (a) | | 176,600 | 2,535,976 |
| Avantor Inc (a)(b) | | 2,602,300 | 54,830,461 |
| Bruker Corp | | 589,900 | 34,579,938 |
| Repligen Corp (a)(b) | | 131,300 | 18,899,322 |
| | | | 110,845,697 |
| Pharmaceuticals - 0.5% | | | |
| Elanco Animal Health Inc (a) | | 3,620,600 | 43,845,466 |
TOTAL HEALTH CARE | | | 759,098,784 |
| | | | |
| Industrials - 16.8% | | | |
| Aerospace & Defense - 0.5% | | | |
| Axon Enterprise Inc (a) | | 64,554 | 38,365,733 |
| Air Freight & Logistics - 0.3% | | | |
| GXO Logistics Inc (a)(b) | | 495,232 | 21,542,592 |
| Building Products - 1.1% | | | |
| AZEK Co Inc/The Class A (a) | | 1,368,800 | 64,976,936 |
| Simpson Manufacturing Co Inc | | 120,200 | 19,932,766 |
| | | | 84,909,702 |
| Commercial Services & Supplies - 1.3% | | | |
| ACV Auctions Inc Class A (a)(b) | | 2,183,557 | 47,164,831 |
| CECO Environmental Corp (a)(b) | | 800,700 | 24,205,161 |
| Clean Harbors Inc (a) | | 128,000 | 29,457,920 |
| | | | 100,827,912 |
| Construction & Engineering - 1.9% | | | |
| Comfort Systems USA Inc | | 144,800 | 61,403,888 |
| EMCOR Group Inc | | 119,400 | 54,195,660 |
| Quanta Services Inc | | 90,669 | 28,655,937 |
| | | | 144,255,485 |
| Electrical Equipment - 2.1% | | | |
| Acuity Brands Inc | | 140,223 | 40,963,345 |
| AMETEK Inc | | 276,526 | 49,846,577 |
| nVent Electric PLC | | 440,200 | 30,004,032 |
| Vertiv Holdings Co Class A | | 248,800 | 28,266,168 |
| | | | 149,080,122 |
| Ground Transportation - 1.7% | | | |
| JB Hunt Transport Services Inc | | 164,900 | 28,141,834 |
| Saia Inc (a)(b) | | 122,000 | 55,599,060 |
| XPO Inc (a) | | 351,500 | 46,099,225 |
| | | | 129,840,119 |
| Machinery - 5.2% | | | |
| Allison Transmission Holdings Inc | | 206,700 | 22,336,002 |
| Chart Industries Inc (a)(b) | | 371,700 | 70,935,228 |
| Crane Co | | 525,736 | 79,780,438 |
| Ingersoll Rand Inc | | 533,400 | 48,251,364 |
| ITT Inc | | 704,009 | 100,588,807 |
| Westinghouse Air Brake Technologies Corp | | 301,400 | 57,142,426 |
| | | | 379,034,265 |
| Passenger Airlines - 0.4% | | | |
| Alaska Air Group Inc (a)(b) | | 505,295 | 32,717,851 |
| Professional Services - 1.3% | | | |
| Dayforce Inc (a)(b) | | 599,200 | 43,525,888 |
| Maximus Inc | | 146,400 | 10,928,760 |
| TransUnion | | 452,600 | 41,960,546 |
| | | | 96,415,194 |
| Trading Companies & Distributors - 1.0% | | | |
| DNOW Inc (a) | | 1,477,923 | 19,227,778 |
| Watsco Inc | | 124,500 | 58,999,305 |
| | | | 78,227,083 |
TOTAL INDUSTRIALS | | | 1,255,216,058 |
| | | | |
| Information Technology - 7.4% | | | |
| Communications Equipment - 0.7% | | | |
| Digi International Inc (a)(b) | | 1,624,001 | 49,093,550 |
| Electronic Equipment, Instruments & Components - 3.1% | | | |
| Belden Inc | | 438,600 | 49,390,746 |
| Coherent Corp (a) | | 782,000 | 74,078,860 |
| Flex Ltd (a) | | 1,374,200 | 52,755,538 |
| Jabil Inc | | 197,275 | 28,387,873 |
| OSI Systems Inc (a) | | 151,993 | 25,448,187 |
| | | | 230,061,204 |
| Semiconductors & Semiconductor Equipment - 2.5% | | | |
| First Solar Inc (a) | | 160,500 | 28,286,520 |
| MKS Instruments Inc (b) | | 660,471 | 68,946,568 |
| Semtech Corp (a)(b) | | 387,200 | 23,948,320 |
| Teradyne Inc | | 398,245 | 50,147,010 |
| Universal Display Corp | | 98,500 | 14,400,700 |
| | | | 185,729,118 |
| Software - 0.9% | | | |
| Appfolio Inc Class A (a) | | 9,269 | 2,286,848 |
| Informatica Inc Class A (a)(b) | | 744,800 | 19,312,664 |
| Manhattan Associates Inc (a) | | 89,000 | 24,051,360 |
| Monday.com Ltd (a) | | 100,100 | 23,567,544 |
| | | | 69,218,416 |
| Technology Hardware, Storage & Peripherals - 0.2% | | | |
| Western Digital Corp (a) | | 344,200 | 20,524,646 |
TOTAL INFORMATION TECHNOLOGY | | | 554,626,934 |
| | | | |
| Materials - 4.6% | | | |
| Chemicals - 1.8% | | | |
| Axalta Coating Systems Ltd (a) | | 1,981,200 | 67,796,664 |
| Element Solutions Inc | | 2,726,105 | 69,324,850 |
| | | | 137,121,514 |
| Construction Materials - 0.5% | | | |
| Martin Marietta Materials Inc | | 69,837 | 36,070,810 |
| Containers & Packaging - 2.3% | | | |
| AptarGroup Inc | | 578,000 | 90,803,800 |
| Avery Dennison Corp (b) | | 214,483 | 40,136,204 |
| International Paper Co | | 786,800 | 42,345,576 |
| | | | 173,285,580 |
TOTAL MATERIALS | | | 346,477,904 |
| | | | |
| Real Estate - 6.5% | | | |
| Health Care REITs - 1.2% | | | |
| Omega Healthcare Investors Inc | | 771,000 | 29,182,350 |
| Ventas Inc | | 1,069,637 | 62,990,923 |
| | | | 92,173,273 |
| Industrial REITs - 1.3% | | | |
| EastGroup Properties Inc | | 364,200 | 58,450,458 |
| Terreno Realty Corp | | 660,000 | 39,032,400 |
| | | | 97,482,858 |
| Real Estate Management & Development - 0.4% | | | |
| Jones Lang LaSalle Inc (a) | | 125,400 | 31,743,756 |
| Residential REITs - 0.7% | | | |
| Invitation Homes Inc | | 1,016,872 | 32,509,398 |
| Sun Communities Inc | | 154,100 | 18,949,677 |
| | | | 51,459,075 |
| Retail REITs - 1.5% | | | |
| Acadia Realty Trust | | 2,127,500 | 51,400,400 |
| Agree Realty Corp (b) | | 529,200 | 37,282,140 |
| Macerich Co/The | | 1,087,100 | 21,655,032 |
| | | | 110,337,572 |
| Specialized REITs - 1.4% | | | |
| Four Corners Property Trust Inc | | 1,509,900 | 40,978,686 |
| Lamar Advertising Co Class A | | 507,981 | 61,841,607 |
| | | | 102,820,293 |
TOTAL REAL ESTATE | | | 486,016,827 |
| | | | |
| Utilities - 3.4% | | | |
| Electric Utilities - 0.7% | | | |
| PG&E Corp | | 2,520,500 | 50,863,690 |
| Gas Utilities - 0.2% | | | |
| Southwest Gas Holdings Inc | | 258,200 | 18,257,322 |
| Independent Power and Renewable Electricity Producers - 1.3% | | | |
| AES Corp/The | | 2,628,038 | 33,822,849 |
| Vistra Corp | | 434,000 | 59,835,580 |
| | | | 93,658,429 |
| Multi-Utilities - 0.6% | | | |
| CenterPoint Energy Inc | | 692,500 | 21,973,025 |
| NorthWestern Corp | | 498,800 | 26,665,848 |
| | | | 48,638,873 |
| Water Utilities - 0.6% | | | |
| Essential Utilities Inc (b) | | 1,158,200 | 42,065,824 |
TOTAL UTILITIES | | | 253,484,138 |
| | | | |
| TOTAL UNITED STATES | | | 6,800,657,750 |
| TOTAL COMMON STOCKS (Cost $5,577,890,488) | | | 7,467,007,676 |
| | | | |
| Money Market Funds - 3.0% |
| | | Yield (%) | Shares | Value ($) |
| Fidelity Cash Central Fund (c) | | 4.36 | 22,907,011 | 22,911,592 |
| Fidelity Securities Lending Cash Central Fund (c)(d) | | 4.35 | 199,066,736 | 199,086,643 |
| TOTAL MONEY MARKET FUNDS (Cost $221,998,235) | | | | 221,998,235 |
| | | | | |
| TOTAL INVESTMENT IN SECURITIES - 102.7% (Cost $5,799,888,723) | 7,689,005,911 |
NET OTHER ASSETS (LIABILITIES) - (2.7)% | (199,057,175) |
| NET ASSETS - 100.0% | 7,489,948,736 |
| | |
Legend
| (b) | Security or a portion of the security is on loan at period end. |
| (c) | Affiliated fund that is generally available only to investment companies and other accounts managed by Fidelity Investments. The rate quoted is the annualized seven-day yield of the fund at period end. A complete unaudited listing of the fund's holdings as of its most recent quarter end is available upon request. In addition, each Fidelity Central Fund's financial statements, which are not covered by the Fund's Report of Independent Registered Public Accounting Firm, are available on the SEC's website or upon request. |
| (d) | Investment made with cash collateral received from securities on loan. |
Affiliated Central Funds
Fiscal year to date information regarding the Fund's investments in Fidelity Central Funds, including the ownership percentage, is presented below.
| Affiliate | Value, beginning of period ($) | Purchases ($) | Sales Proceeds ($) | Dividend Income ($) | Realized Gain (loss) ($) | Change in Unrealized appreciation (depreciation) ($) | Value, end of period ($) | Shares, end of period | % ownership, end of period |
| Fidelity Cash Central Fund | 73,051,733 | 1,506,065,569 | 1,556,207,029 | 2,528,610 | 1,319 | - | 22,911,592 | 22,907,011 | 0.0% |
| Fidelity Securities Lending Cash Central Fund | 275,921,013 | 1,527,512,798 | 1,604,347,168 | 1,808,840 | - | - | 199,086,643 | 199,066,736 | 0.8% |
| Total | 348,972,746 | 3,033,578,367 | 3,160,554,197 | 4,337,450 | 1,319 | - | 221,998,235 | 221,973,747 | |
| | | | | | | | | | |
Amounts in the dividend income column in the above table include any capital gain distributions from underlying funds, which are presented in the corresponding line item in the Statement of Operations, if applicable.
Amounts in the dividend income column for Fidelity Securities Lending Cash Central Fund represents the income earned on investing cash collateral, less rebates paid to borrowers and any lending agent fees associated with the loan, plus any premium payments received for lending certain types of securities.
Amounts included in the purchases and sales proceeds columns may include in-kind transactions, if applicable.
Investment Valuation
The following is a summary of the inputs used, as of December 31, 2024, involving the Fund's assets and liabilities carried at fair value. The inputs or methodology used for valuing securities may not be an indication of the risk associated with investing in those securities. For more information on valuation inputs, and their aggregation into the levels used below, please refer to the Investment Valuation section in the accompanying Notes to Financial Statements.
| Valuation Inputs at Reporting Date: |
| Description | Total ($) | Level 1 ($) | Level 2 ($) | Level 3 ($) |
Investments in Securities: | | | | |
|
| Common Stocks | | | | |
Communication Services | 138,726,270 | 138,726,270 | - | - |
Consumer Discretionary | 919,712,376 | 919,712,376 | - | - |
Consumer Staples | 367,697,645 | 367,697,645 | - | - |
Energy | 446,104,350 | 446,104,350 | - | - |
Financials | 1,506,357,662 | 1,506,357,662 | - | - |
Health Care | 880,547,804 | 880,547,804 | - | - |
Industrials | 1,348,886,662 | 1,348,886,662 | - | - |
Information Technology | 725,437,986 | 725,437,986 | - | - |
Materials | 394,035,956 | 394,035,956 | - | - |
Real Estate | 486,016,827 | 486,016,827 | - | - |
Utilities | 253,484,138 | 253,484,138 | - | - |
|
| Money Market Funds | 221,998,235 | 221,998,235 | - | - |
| Total Investments in Securities: | 7,689,005,911 | 7,689,005,911 | - | - |
Financial Statements
| Statement of Assets and Liabilities |
As of December 31, 2024 |
| Assets | | | | |
| Investment in securities, at value (including securities loaned of $195,909,215) - See accompanying schedule: | | | | |
Unaffiliated issuers (cost $5,577,890,488) | $ | 7,467,007,676 | | |
Fidelity Central Funds (cost $221,998,235) | | 221,998,235 | | |
| | | | | |
| | | | | |
| Total Investment in Securities (cost $5,799,888,723) | | | $ | 7,689,005,911 |
| Foreign currency held at value (cost $43,607) | | | | 42,895 |
| Receivable for investments sold | | | | 224,663 |
| Receivable for fund shares sold | | | | 4,191,457 |
| Dividends receivable | | | | 4,915,292 |
| Distributions receivable from Fidelity Central Funds | | | | 197,119 |
| Prepaid expenses | | | | 6,547 |
| Other receivables | | | | 277,322 |
Total assets | | | | 7,698,861,206 |
| Liabilities | | | | |
| Payable to custodian bank | $ | 419 | | |
| Payable for investments purchased | | 529,095 | | |
| Payable for fund shares redeemed | | 4,024,994 | | |
| Accrued management fee | | 3,607,018 | | |
| Distribution and service plan fees payable | | 1,008,307 | | |
| Other payables and accrued expenses | | 671,563 | | |
| Collateral on securities loaned | | 199,071,074 | | |
| Total liabilities | | | | 208,912,470 |
| Net Assets | | | $ | 7,489,948,736 |
| Net Assets consist of: | | | | |
| Paid in capital | | | $ | 5,251,699,140 |
| Total accumulated earnings (loss) | | | | 2,238,249,596 |
| Net Assets | | | $ | 7,489,948,736 |
| | | | | |
| Net Asset Value and Maximum Offering Price | | | | |
| Initial Class : | | | | |
Net Asset Value, offering price and redemption price per share ($1,633,098,968 ÷ 43,481,972 shares) | | | $ | 37.56 |
| Service Class : | | | | |
Net Asset Value, offering price and redemption price per share ($724,658,686 ÷ 19,627,745 shares) | | | $ | 36.92 |
| Service Class 2 : | | | | |
Net Asset Value, offering price and redemption price per share ($4,382,720,480 ÷ 123,520,613 shares) | | | $ | 35.48 |
| Investor Class : | | | | |
Net Asset Value, offering price and redemption price per share ($749,470,602 ÷ 20,175,999 shares) | | | $ | 37.15 |
| Statement of Operations |
| Year ended December 31, 2024 |
| Investment Income | | | | |
| Dividends | | | $ | 78,921,059 |
| Income from Fidelity Central Funds (including $1,808,840 from security lending) | | | | 4,337,450 |
| Total income | | | | 83,258,509 |
| Expenses | | | | |
| Management fee | $ | 41,183,324 | | |
| Transfer agent fees | | 816,172 | | |
| Distribution and service plan fees | | 11,597,360 | | |
| Accounting fees | | 173,332 | | |
| Custodian fees and expenses | | 65,030 | | |
| Independent trustees' fees and expenses | | 31,709 | | |
| Audit fees | | 68,761 | | |
| Legal | | 20,263 | | |
| Miscellaneous | | 711,872 | | |
| Total expenses before reductions | | 54,667,823 | | |
| Expense reductions | | (316,646) | | |
| Total expenses after reductions | | | | 54,351,177 |
| Net Investment income (loss) | | | | 28,907,332 |
| Realized and Unrealized Gain (Loss) | | | | |
| Net realized gain (loss) on: | | | | |
| Investment Securities: | | | | |
| Unaffiliated issuers | | 1,195,471,006 | | |
| Fidelity Central Funds | | 1,319 | | |
| Foreign currency transactions | | (156,782) | | |
| Total net realized gain (loss) | | | | 1,195,315,543 |
| Change in net unrealized appreciation (depreciation) on: | | | | |
| Investment Securities: | | | | |
| Unaffiliated issuers | | (59,978,386) | | |
| Assets and liabilities in foreign currencies | | (29,347) | | |
| Total change in net unrealized appreciation (depreciation) | | | | (60,007,733) |
| Net gain (loss) | | | | 1,135,307,810 |
| Net increase (decrease) in net assets resulting from operations | | | $ | 1,164,215,142 |
| Statement of Changes in Net Assets |
| |
| | Year ended December 31, 2024 | | Year ended December 31, 2023 |
| Increase (Decrease) in Net Assets | | | | |
| Operations | | | | |
| Net investment income (loss) | $ | 28,907,332 | $ | 28,859,775 |
| Net realized gain (loss) | | 1,195,315,543 | | 302,248,608 |
| Change in net unrealized appreciation (depreciation) | | (60,007,733) | | 586,581,086 |
| Net increase (decrease) in net assets resulting from operations | | 1,164,215,142 | | 917,689,469 |
| Distributions to shareholders | | (999,090,709) | | (216,862,984) |
| | | | | |
| Share transactions - net increase (decrease) | | 369,622,565 | | (198,991,880) |
| Total increase (decrease) in net assets | | 534,746,998 | | 501,834,605 |
| | | | | |
| Net Assets | | | | |
| Beginning of period | | 6,955,201,738 | | 6,453,367,133 |
| End of period | $ | 7,489,948,736 | $ | 6,955,201,738 |
| | | | | |
| | | | | |
Financial Highlights
VIP Mid Cap Portfolio Initial Class |
| |
| Years ended December 31, | | 2024 | | 2023 | | 2022 | | 2021 | | 2020 |
Selected Per-Share Data | | | | | | | | | | |
| Net asset value, beginning of period | $ | 36.44 | $ | 32.72 | $ | 41.17 | $ | 38.72 | $ | 32.95 |
| Income from Investment Operations | | | | | | | | | | |
Net investment income (loss) A,B | | .22 | | .21 | | .21 | | .23 | | .15 |
| Net realized and unrealized gain (loss) | | 6.33 | | 4.69 | | (6.16) | | 9.57 | | 5.83 |
| Total from investment operations | | 6.55 | | 4.90 | | (5.95) | | 9.80 | | 5.98 |
| Distributions from net investment income | | (.22) | | (.21) | | (.17) C | | (.28) | | (.21) |
| Distributions from net realized gain | | (5.21) | | (.97) | | (2.33) C | | (7.07) | | - |
| Total distributions | | (5.43) | | (1.18) | | (2.50) | | (7.35) | | (.21) |
| Net asset value, end of period | $ | 37.56 | $ | 36.44 | $ | 32.72 | $ | 41.17 | $ | 38.72 |
Total Return D,E | | | | 15.08% | | (14.74)% | | 25.60% | | 18.19% |
Ratios to Average Net Assets B,F,G | | | | | | | | | | |
| Expenses before reductions | | .57% | | .61% | | .61% | | .61% | | .62% |
| Expenses net of fee waivers, if any | | | | .60% | | .60% | | .60% | | .62% |
| Expenses net of all reductions | | .57% | | .60% | | .60% | | .60% | | .62% |
| Net investment income (loss) | | .55% | | .60% | | .60% | | .52% | | .48% |
| Supplemental Data | | | | | | | | | | |
| Net assets, end of period (000 omitted) | $ | 1,633,099 | $ | 1,544,004 | $ | 1,455,364 | $ | 1,810,651 | $ | 1,579,450 |
Portfolio turnover rate H | | | | 41% | | 31% | | 37% I | | 44% |
ACalculated based on average shares outstanding during the period.
BNet investment income (loss) is affected by the timing of the declaration of dividends by any underlying mutual funds or exchange-traded funds (ETFs). Net investment income (loss) of any mutual funds or ETFs is not included in the Fund's net investment income (loss) ratio.
CThe amount shown reflects reclassifications related to book to tax differences that were made in the year shown.
DTotal returns do not reflect charges attributable to your insurance company's separate account. Inclusion of these charges would reduce the total returns shown.
ETotal returns would have been lower if certain expenses had not been reduced during the applicable periods shown.
FFees and expenses of any underlying mutual funds or exchange-traded funds (ETFs) are not included in the Fund's expense ratio. The Fund indirectly bears its proportionate share of these expenses. For additional expense information related to investments in Fidelity Central Funds, please refer to the "Investments in Fidelity Central Funds" note found in the Notes to Financial Statements section of the most recent Annual or Semi-Annual report.
GExpense ratios reflect operating expenses of the class. Expenses before reductions do not reflect amounts reimbursed, waived, or reduced through arrangements with the investment adviser, brokerage services, or other offset arrangements, if applicable, and do not represent the amount paid by the class during periods when reimbursements, waivers or reductions occur.
HAmount does not include the portfolio activity of any underlying mutual funds or exchange-traded funds (ETFs), derivatives or securities that mature within one year from acquisition.
IPortfolio turnover rate excludes securities received or delivered in-kind.
VIP Mid Cap Portfolio Service Class |
| |
| Years ended December 31, | | 2024 | | 2023 | | 2022 | | 2021 | | 2020 |
Selected Per-Share Data | | | | | | | | | | |
| Net asset value, beginning of period | $ | 35.91 | $ | 32.25 | $ | 40.63 | $ | 38.28 | $ | 32.59 |
| Income from Investment Operations | | | | | | | | | | |
Net investment income (loss) A,B | | .18 | | .17 | | .17 | | .18 | | .12 |
| Net realized and unrealized gain (loss) | | 6.23 | | 4.64 | | (6.09) | | 9.47 | | 5.74 |
| Total from investment operations | | 6.41 | | 4.81 | | (5.92) | | 9.65 | | 5.86 |
| Distributions from net investment income | | (.19) | | (.18) | | (.13) C | | (.23) | | (.17) |
| Distributions from net realized gain | | (5.21) | | (.97) | | (2.33) C | | (7.07) | | - |
| Total distributions | | (5.40) | | (1.15) | | (2.46) | | (7.30) | | (.17) |
| Net asset value, end of period | $ | 36.92 | $ | 35.91 | $ | 32.25 | $ | 40.63 | $ | 38.28 |
Total Return D,E | | | | 15.00% | | (14.85)% | | 25.51% | | 18.04% |
Ratios to Average Net Assets B,F,G | | | | | | | | | | |
| Expenses before reductions | | .68% | | .71% | | .71% | | .71% | | .72% |
| Expenses net of fee waivers, if any | | | | .70% | | .70% | | .70% | | .72% |
| Expenses net of all reductions | | .67% | | .70% | | .70% | | .70% | | .72% |
| Net investment income (loss) | | .45% | | .50% | | .50% | | .42% | | .38% |
| Supplemental Data | | | | | | | | | | |
| Net assets, end of period (000 omitted) | $ | 724,659 | $ | 658,165 | $ | 586,964 | $ | 726,039 | $ | 642,654 |
Portfolio turnover rate H | | | | 41% | | 31% | | 37% I | | 44% |
ACalculated based on average shares outstanding during the period.
BNet investment income (loss) is affected by the timing of the declaration of dividends by any underlying mutual funds or exchange-traded funds (ETFs). Net investment income (loss) of any mutual funds or ETFs is not included in the Fund's net investment income (loss) ratio.
CThe amount shown reflects reclassifications related to book to tax differences that were made in the year shown.
DTotal returns do not reflect charges attributable to your insurance company's separate account. Inclusion of these charges would reduce the total returns shown.
ETotal returns would have been lower if certain expenses had not been reduced during the applicable periods shown.
FFees and expenses of any underlying mutual funds or exchange-traded funds (ETFs) are not included in the Fund's expense ratio. The Fund indirectly bears its proportionate share of these expenses. For additional expense information related to investments in Fidelity Central Funds, please refer to the "Investments in Fidelity Central Funds" note found in the Notes to Financial Statements section of the most recent Annual or Semi-Annual report.
GExpense ratios reflect operating expenses of the class. Expenses before reductions do not reflect amounts reimbursed, waived, or reduced through arrangements with the investment adviser, brokerage services, or other offset arrangements, if applicable, and do not represent the amount paid by the class during periods when reimbursements, waivers or reductions occur.
HAmount does not include the portfolio activity of any underlying mutual funds or exchange-traded funds (ETFs), derivatives or securities that mature within one year from acquisition.
IPortfolio turnover rate excludes securities received or delivered in-kind.
VIP Mid Cap Portfolio Service Class 2 |
| |
| Years ended December 31, | | 2024 | | 2023 | | 2022 | | 2021 | | 2020 |
Selected Per-Share Data | | | | | | | | | | |
| Net asset value, beginning of period | $ | 34.69 | $ | 31.20 | $ | 39.39 | $ | 37.29 | $ | 31.75 |
| Income from Investment Operations | | | | | | | | | | |
Net investment income (loss) A,B | | .12 | | .11 | | .12 | | .11 | | .07 |
| Net realized and unrealized gain (loss) | | 6.01 | | 4.48 | | (5.90) | | 9.22 | | 5.59 |
| Total from investment operations | | 6.13 | | 4.59 | | (5.78) | | 9.33 | | 5.66 |
| Distributions from net investment income | | (.14) | | (.13) | | (.08) C | | (.16) | | (.12) |
| Distributions from net realized gain | | (5.21) | | (.97) | | (2.33) C | | (7.07) | | - |
| Total distributions | | (5.34) D | | (1.10) | | (2.41) | | (7.23) | | (.12) |
| Net asset value, end of period | $ | 35.48 | $ | 34.69 | $ | 31.20 | $ | 39.39 | $ | 37.29 |
Total Return E,F | | | | 14.80% | | (14.97)% | | 25.31% | | 17.87% |
Ratios to Average Net Assets B,G,H | | | | | | | | | | |
| Expenses before reductions | | .82% | | .86% | | .86% | | .86% | | .87% |
| Expenses net of fee waivers, if any | | | | .85% | | .85% | | .85% | | .87% |
| Expenses net of all reductions | | .82% | | .85% | | .85% | | .85% | | .87% |
| Net investment income (loss) | | .30% | | .35% | | .35% | | .27% | | .23% |
| Supplemental Data | | | | | | | | | | |
| Net assets, end of period (000 omitted) | $ | 4,382,720 | $ | 4,101,183 | $ | 3,776,819 | $ | 4,970,428 | $ | 4,807,908 |
Portfolio turnover rate I | | | | 41% | | 31% | | 37% J | | 44% |
ACalculated based on average shares outstanding during the period.
BNet investment income (loss) is affected by the timing of the declaration of dividends by any underlying mutual funds or exchange-traded funds (ETFs). Net investment income (loss) of any mutual funds or ETFs is not included in the Fund's net investment income (loss) ratio.
CThe amount shown reflects reclassifications related to book to tax differences that were made in the year shown.
DTotal distributions per share do not sum due to rounding.
ETotal returns do not reflect charges attributable to your insurance company's separate account. Inclusion of these charges would reduce the total returns shown.
FTotal returns would have been lower if certain expenses had not been reduced during the applicable periods shown.
GFees and expenses of any underlying mutual funds or exchange-traded funds (ETFs) are not included in the Fund's expense ratio. The Fund indirectly bears its proportionate share of these expenses. For additional expense information related to investments in Fidelity Central Funds, please refer to the "Investments in Fidelity Central Funds" note found in the Notes to Financial Statements section of the most recent Annual or Semi-Annual report.
HExpense ratios reflect operating expenses of the class. Expenses before reductions do not reflect amounts reimbursed, waived, or reduced through arrangements with the investment adviser, brokerage services, or other offset arrangements, if applicable, and do not represent the amount paid by the class during periods when reimbursements, waivers or reductions occur.
IAmount does not include the portfolio activity of any underlying mutual funds or exchange-traded funds (ETFs), derivatives or securities that mature within one year from acquisition.
JPortfolio turnover rate excludes securities received or delivered in-kind.
VIP Mid Cap Portfolio Investor Class |
| |
| Years ended December 31, | | 2024 | | 2023 | | 2022 | | 2021 | | 2020 |
Selected Per-Share Data | | | | | | | | | | |
| Net asset value, beginning of period | $ | 36.10 | $ | 32.42 | $ | 40.83 | $ | 38.44 | $ | 32.72 |
| Income from Investment Operations | | | | | | | | | | |
Net investment income (loss) A,B | | .19 | | .18 | | .18 | | .20 | | .12 |
| Net realized and unrealized gain (loss) | | 6.27 | | 4.65 | | (6.12) | | 9.51 | | 5.78 |
| Total from investment operations | | 6.46 | | 4.83 | | (5.94) | | 9.71 | | 5.90 |
| Distributions from net investment income | | (.20) | | (.19) | | (.14) C | | (.24) | | (.18) |
| Distributions from net realized gain | | (5.21) | | (.97) | | (2.33) C | | (7.07) | | - |
| Total distributions | | (5.41) | | (1.15) D | | (2.47) | | (7.32) D | | (.18) |
| Net asset value, end of period | $ | 37.15 | $ | 36.10 | $ | 32.42 | $ | 40.83 | $ | 38.44 |
Total Return E,F | | | | 15.01% | | (14.83)% | | 25.54% | | 18.08% |
Ratios to Average Net Assets B,G,H | | | | | | | | | | |
| Expenses before reductions | | .65% | | .68% | | .68% | | .68% | | .70% |
| Expenses net of fee waivers, if any | | | | .68% | | .68% | | .68% | | .70% |
| Expenses net of all reductions | | .65% | | .68% | | .68% | | .68% | | .69% |
| Net investment income (loss) | | .48% | | .52% | | .52% | | .44% | | .41% |
| Supplemental Data | | | | | | | | | | |
| Net assets, end of period (000 omitted) | $ | 749,471 | $ | 651,850 | $ | 634,220 | $ | 739,633 | $ | 593,584 |
Portfolio turnover rate I | | | | 41% | | 31% | | 37% J | | 44% |
ACalculated based on average shares outstanding during the period.
BNet investment income (loss) is affected by the timing of the declaration of dividends by any underlying mutual funds or exchange-traded funds (ETFs). Net investment income (loss) of any mutual funds or ETFs is not included in the Fund's net investment income (loss) ratio.
CThe amount shown reflects reclassifications related to book to tax differences that were made in the year shown.
DTotal distributions per share do not sum due to rounding.
ETotal returns do not reflect charges attributable to your insurance company's separate account. Inclusion of these charges would reduce the total returns shown.
FTotal returns would have been lower if certain expenses had not been reduced during the applicable periods shown.
GFees and expenses of any underlying mutual funds or exchange-traded funds (ETFs) are not included in the Fund's expense ratio. The Fund indirectly bears its proportionate share of these expenses. For additional expense information related to investments in Fidelity Central Funds, please refer to the "Investments in Fidelity Central Funds" note found in the Notes to Financial Statements section of the most recent Annual or Semi-Annual report.
HExpense ratios reflect operating expenses of the class. Expenses before reductions do not reflect amounts reimbursed, waived, or reduced through arrangements with the investment adviser, brokerage services, or other offset arrangements, if applicable, and do not represent the amount paid by the class during periods when reimbursements, waivers or reductions occur.
IAmount does not include the portfolio activity of any underlying mutual funds or exchange-traded funds (ETFs), derivatives or securities that mature within one year from acquisition.
JPortfolio turnover rate excludes securities received or delivered in-kind.
Notes to Financial Statements
For the period ended December 31, 2024
1. Organization.
VIP Mid Cap Portfolio (the Fund) is a fund of Variable Insurance Products Fund III (the Trust) and is authorized to issue an unlimited number of shares. The Trust is registered under the Investment Company Act of 1940, as amended (the 1940 Act), as an open-end management investment company organized as a Massachusetts business trust. Shares of the Fund may only be purchased by insurance companies for the purpose of funding variable annuity or variable life insurance contracts. The Fund offers the following classes of shares: Initial Class shares, Service Class shares, Service Class 2 shares and Investor Class shares. All classes have equal rights and voting privileges, except for matters affecting a single class.
2. Investments in Fidelity Central Funds.
Funds may invest in Fidelity Central Funds, which are open-end investment companies generally available only to other investment companies and accounts managed by the investment adviser and its affiliates. The Schedule of Investments lists any Fidelity Central Funds held as an investment as of period end, but does not include the underlying holdings of each Fidelity Central Fund. An investing fund indirectly bears its proportionate share of the expenses of the underlying Fidelity Central Funds.
Based on its investment objective, each Fidelity Central Fund may invest or participate in various investment vehicles or strategies that are similar to those of the investing fund. These strategies are consistent with the investment objectives of the investing fund and may involve certain economic risks which may cause a decline in value of each of the Fidelity Central Funds and thus a decline in the value of the investing fund.
| Fidelity Central Fund | Investment Manager | Investment Objective | Investment Practices | Expense RatioA |
| Fidelity Money Market Central Funds | Fidelity Management & Research Company LLC (FMR) | Each fund seeks to obtain a high level of current income consistent with the preservation of capital and liquidity. | Short-term Investments | Less than .005% |
A Expenses expressed as a percentage of average net assets and are as of each underlying Central Fund's most recent annual or semi-annual shareholder report.
A complete unaudited list of holdings for each Fidelity Central Fund is available upon request or at the Securities and Exchange Commission website at www.sec.gov. In addition, the financial statements of the Fidelity Central Funds which contain the significant accounting policies (including investment valuation policies) of those funds, and are not covered by the Report of Independent Registered Public Accounting Firm, are available on the Securities and Exchange Commission website or upon request.
3. Significant Accounting Policies.
The Fund is an investment company and applies the accounting and reporting guidance of the Financial Accounting Standards Board (FASB) Accounting Standards Codification Topic 946 Financial Services - Investment Companies. The financial statements have been prepared in conformity with accounting principles generally accepted in the United States of America (GAAP), which require management to make certain estimates and assumptions at the date of the financial statements. Actual results could differ from those estimates. The Fund operates as a single operating segment. The Fund's income, expenses, assets, and performance are regularly monitored and assessed as a whole by the investment adviser and other individuals responsible for overnight functions of the Trust, using the information presented in the financial statements and financial highlights. Subsequent events, if any, through the date that the financial statements were issued have been evaluated in the preparation of the financial statements. The Fund's Schedule of Investments lists any underlying mutual funds or exchange-traded funds (ETFs) but does not include the underlying holdings of these funds. The following summarizes the significant accounting policies of the Fund:
Investment Valuation. Investments are valued as of 4:00 p.m. Eastern time on the last calendar day of the period. The Board of Trustees (the Board) has designated the Fund's investment adviser as the valuation designee responsible for the fair valuation function and performing fair value determinations as needed. The investment adviser has established a Fair Value Committee (the Committee) to carry out the day-to-day fair valuation responsibilities and has adopted policies and procedures to govern the fair valuation process and the activities of the Committee. In accordance with these fair valuation policies and procedures, which have been approved by the Board, the Fund attempts to obtain prices from one or more third party pricing services or brokers to value its investments. When current market prices, quotations or currency exchange rates are not readily available or reliable, investments will be fair valued in good faith by the Committee, in accordance with the policies and procedures. Factors used in determining fair value vary by investment type and may include market or investment specific events, transaction data, estimated cash flows, and market observations of comparable investments. The frequency that the fair valuation procedures are used cannot be predicted and they may be utilized to a significant extent. The Committee manages the Fund's fair valuation practices and maintains the fair valuation policies and procedures. The Fund's investment adviser reports to the Board information regarding the fair valuation process and related material matters.
The Fund categorizes the inputs to valuation techniques used to value its investments into a disclosure hierarchy consisting of three levels as shown below:
Level 1 - unadjusted quoted prices in active markets for identical investments
Level 2 - other significant observable inputs (including quoted prices for similar investments, interest rates, prepayment speeds, etc.)
Level 3 - unobservable inputs (including the Fund's own assumptions based on the best information available)
Valuation techniques used to value the Fund's investments by major category are as follows:
Equity securities, including restricted securities, for which market quotations are readily available, are valued at the last reported sale price or official closing price as reported by a third party pricing service on the primary market or exchange on which they are traded and are categorized as Level 1 in the hierarchy. In the event there were no sales during the day or closing prices are not available, securities are valued at the last quoted bid price or may be valued using the last available price and are generally categorized as Level 2 in the hierarchy. For foreign equity securities, when market or security specific events arise, comparisons to the valuation of American Depositary Receipts (ADRs), futures contracts, Exchange-Traded Funds (ETFs) and certain indexes as well as quoted prices for similar securities may be used and would be categorized as Level 2 in the hierarchy. For equity securities, including restricted securities, where observable inputs are limited, assumptions about market activity and risk are used and these securities may be categorized as Level 3 in the hierarchy.
Investments in open-end mutual funds, including the Fidelity Central Funds, are valued at their closing net asset value (NAV) each business day and are categorized as Level 1 in the hierarchy.
Changes in valuation techniques may result in transfers in or out of an assigned level within the disclosure hierarchy. The aggregate value of investments by input level as of December 31, 2024 is included at the end of the Fund's Schedule of Investments.
Foreign Currency. Certain Funds may use foreign currency contracts to facilitate transactions in foreign-denominated securities. Gains and losses from these transactions may arise from changes in the value of the foreign currency or if the counterparties do not perform under the contracts' terms.
Foreign-denominated assets, including investment securities, and liabilities are translated into U.S. dollars at the exchange rates at period end. Purchases and sales of investment securities, income and dividends received, and expenses denominated in foreign currencies are translated into U.S. dollars at the exchange rate in effect on the transaction date.
The effects of exchange rate fluctuations on investments are included with the net realized and unrealized gain (loss) on investment securities. Other foreign currency transactions resulting in realized and unrealized gain (loss) are disclosed separately.
Investment Transactions and Income. For financial reporting purposes, the Fund's investment holdings and NAV include trades executed through the end of the last business day of the period. The NAV per share for processing shareholder transactions is calculated as of the close of business of the New York Stock Exchange (NYSE), normally 4:00 p.m. Eastern time and includes trades executed through the end of the prior business day. Gains and losses on securities sold are determined on the basis of identified cost and include proceeds received from litigation. Commissions paid to certain brokers with whom the investment adviser, or its affiliates, places trades on behalf of a fund include an amount in addition to trade execution, which may be rebated back to a fund. Any such rebates are included in net realized gain (loss) on investments in the Statement of Operations. Dividend income is recorded on the ex-dividend date, except for certain dividends from foreign securities where the ex-dividend date may have passed, which are recorded as soon as the Fund is informed of the ex-dividend date. Non-cash dividends included in dividend income, if any, are recorded at the fair market value of the securities received. Income and capital gain distributions from Fidelity Central Funds, if any, are recorded on the ex-dividend date. Certain distributions received by the Fund represent a return of capital or capital gain. The Fund determines the components of these distributions subsequent to the ex-dividend date, based upon receipt of tax filings or other correspondence relating to the underlying investment. These distributions are recorded as a reduction of cost of investments and/or as a realized gain. Investment income is recorded net of foreign taxes withheld where recovery of such taxes is uncertain. Funds may file withholding tax reclaims in certain jurisdictions to recover a portion of amounts previously withheld. Any withholding tax reclaims income is included in the Statement of Operations in dividends. Any receivables for withholding tax reclaims are included in the Statement of Assets and Liabilities in dividends receivable.
Class Allocations and Expenses. Investment income, realized and unrealized capital gains and losses, common expenses of a fund, and certain fund-level expense reductions, if any, are allocated daily on a pro-rata basis to each class based on the relative net assets of each class to the total net assets of a fund. Each class differs with respect to transfer agent and distribution and service plan fees incurred, as applicable. Certain expense reductions may also differ by class, if applicable. For the reporting period, the allocated portion of income and expenses to each class as a percent of its average net assets may vary due to the timing of recording these transactions in relation to fluctuating net assets of the classes. Expenses directly attributable to a fund are charged to that fund. Expenses attributable to more than one fund are allocated among the respective funds on the basis of relative net assets or other appropriate methods. Expenses included in the accompanying financial statements reflect the expenses of that fund and do not include any expenses associated with any underlying mutual funds or exchange-traded funds (ETFs). Although not included in a fund's expenses, a fund indirectly bears its proportionate share of these expenses through the net asset value of each underlying mutual fund or exchange-traded fund (ETF). Expense estimates are accrued in the period to which they relate and adjustments are made when actual amounts are known.
Deferred Trustee Compensation. Under a Deferred Compensation Plan (the Plan) for certain Funds, certain independent Trustees have elected to defer receipt of a portion of their annual compensation. Deferred amounts are invested in affiliated mutual funds, are marked-to-market and remain in a fund until distributed in accordance with the Plan. The investment of deferred amounts and the offsetting payable to the Trustees presented below are included in the accompanying Statement of Assets and Liabilities in other receivables and other payables and accrued expenses, as applicable.
| VIP Mid Cap Portfolio | $94,994 |
Income Tax Information and Distributions to Shareholders. Each year, the Fund intends to qualify as a regulated investment company under Subchapter M of the Internal Revenue Code, including distributing substantially all of its taxable income and realized gains. As a result, no provision for U.S. Federal income taxes is required. As of December 31, 2024, the Fund did not have any unrecognized tax benefits in the financial statements; nor is the Fund aware of any tax positions for which it is reasonably possible that the total amounts of unrecognized tax benefits will significantly change in the next twelve months. The Fund files a U.S. federal tax return, in addition to state and local tax returns as required. The Fund's federal income tax returns are subject to examination by the Internal Revenue Service (IRS) for a period of three fiscal years after they are filed. State and local tax returns may be subject to examination for an additional fiscal year depending on the jurisdiction. Foreign taxes are provided for based on the Fund's understanding of the tax rules and rates that exist in the foreign markets in which it invests.
Distributions are declared and recorded on the ex-dividend date. Income and capital gain distributions are declared separately for each class. Income and capital gain distributions are determined in accordance with income tax regulations, which may differ from GAAP.
Capital accounts within the financial statements are adjusted for permanent book-tax differences. These adjustments have no impact on net assets or the results of operations. Capital accounts are not adjusted for temporary book-tax differences which will reverse in a subsequent period.
Book-tax differences are primarily due to foreign currency transactions and losses deferred due to wash sales.
As of period end, the cost and unrealized appreciation (depreciation) in securities, and derivatives if applicable, for federal income tax purposes were as follows:
| Gross unrealized appreciation | $2,145,787,856 |
| Gross unrealized depreciation | (258,681,756) |
| Net unrealized appreciation (depreciation) | $1,887,106,100 |
| Tax Cost | $5,801,899,811 |
The tax-based components of distributable earnings as of period end were as follows:
| Undistributed ordinary income | $39,548,458 |
| Undistributed long-term capital gain | $315,885,419 |
| Net unrealized appreciation (depreciation) on securities and other investments | $1,887,021,056 |
The tax character of distributions paid was as follows:
| | December 31, 2024 | December 31, 2023 |
| Ordinary Income | $85,295,555 | $ 30,225,937 |
| Long-term Capital Gains | 913,795,154 | 186,637,047 |
| Total | $999,090,709 | $ 216,862,984 |
New Accounting Pronouncement. FASB Accounting Standards Update (ASU) 2023-07 Segment Reporting (Topic 280): Improvements to Reportable Segment Disclosures became effective in this reporting period. ASU 2023-07 enhances segment information disclosure in the notes to financial statements.
4. Purchases and Sales of Investments.
Purchases and sales of securities, other than short-term securities and in-kind transactions, as applicable, are noted in the table below.
| | Purchases ($) | Sales ($) |
| VIP Mid Cap Portfolio | 3,832,691,209 | 4,396,707,455 |
5. Fees and Other Transactions with Affiliates.
Management Fee. Fidelity Management & Research Company LLC (the investment adviser) and its affiliates provide the Fund with investment management related services for which the Fund pays a monthly management fee.
Effective March 1, 2024, the Fund's management contract was amended to incorporate administrative services previously covered under separate services agreements (Transfer Agent and Accounting agreements). The amended contract incorporates a management fee rate that may vary by class. The investment adviser or an affiliate pays certain expenses of managing and operating the Fund out of each class's management fee. Each class of the Fund pays a management fee to the investment adviser. The management fee is calculated and paid to the investment adviser every month. When determining a class's management fee, a mandate rate is calculated based on the monthly average net assets of a group of funds advised by FMR within a designated asset class. A discount rate is subtracted from the mandate rate once the Fund's monthly average net assets reach a certain level. The mandate rate and discount rate may vary by class. The annual management fee rate for a class of shares of the Fund is the lesser of (1) the class's mandate rate reduced by the class's discount rate (if applicable) or (2) the amount set forth in the following table.
| | Maximum Management Fee Rate % |
| Initial Class | .57 |
| Service Class | .57 |
| Service Class 2 | .57 |
| Investor Class | .65 |
One-twelfth of the management fee rate for a class is applied to the average net assets of the class for the month, giving a dollar amount which is the management fee for the class for that month. A different management fee rate may be applicable to each class of the Fund. The difference between classes is the result of separate arrangements for class-level services and/or waivers of certain expenses. It is not the result of any difference in advisory or custodial fees or other expenses related to the management of the Fund's assets, which do not vary by class. For the portion of the reporting period on or after March 1, 2024, the total annualized management fee rates were as follows:
| | Total Management Fee Rate % |
| Initial Class | .56 |
| Service Class | .56 |
| Service Class 2 | .56 |
| Investor Class | .63 |
Prior to March 1, 2024, the management fee was the sum of an individual fund fee rate that was based on an annual rate of .30% of the Fund's average net assets and an annualized group fee rate that averaged .22% during the period. The group fee rate was based upon the monthly average net assets of a group of registered investment companies with which the investment adviser has management contracts. The group fee rate decreased as assets under management increased and increased as assets under management decreased. For the portion of the reporting period prior to March 1, 2024, the total annualized management fee rate was .52%.
Effective March 1, 2024, the Fund's sub-advisory agreements with FMR Investment Management (UK) Limited, Fidelity Management & Research (Hong Kong) Limited, and Fidelity Management & Research (Japan) Limited were amended to provide that the investment adviser pays each sub-adviser monthly fees equal to 110% of the sub-adviser's costs for providing sub-advisory services.
Distribution and Service Plan Fees. In accordance with Rule 12b-1 of the 1940 Act, the Fund has adopted separate 12b-1 Plans for each Service Class of shares. Each Service Class pays Fidelity Distributors Company LLC (FDC), an affiliate of the investment adviser, a service fee. For the period, the service fee is based on an annual rate of .10% of Service Class' average net assets and .25% of Service Class 2's average net assets.
For the period, total fees, all of which were re-allowed to insurance companies for the distribution of shares and providing shareholder support services, were as follows:
| Service Class | $710,069 |
| Service Class 2 | 10,887,291 |
| | $11,597,360 |
Transfer Agent Fees. Fidelity Investments Institutional Operations Company LLC (FIIOC), an affiliate of the investment adviser, is the Fund's transfer, dividend disbursing, and shareholder servicing agent. Effective March 1, 2024, the Fund's management contract was amended to incorporate transfer agent services and associated fees previously covered under a separate services agreement.
During the period January 1, 2024 through February 29, 2024, the transfer agent fees for each class were a fixed annual rate of class-level average net assets as follows:
| | Amount ($) | % of Class-Level Average Net Assets |
| Initial Class | 161,804 | .0630 |
| Service Class | 69,652 | .0630 |
| Service Class 2 | 432,381 | .0630 |
| Investor Class | 152,335 | .1390 |
| | 816,172 | |
Accounting Fees. Fidelity Service Company, Inc. (FSC), an affiliate of the investment adviser, maintains the Fund's accounting records. Effective March 1, 2024, the Fund's management contract was amended to incorporate accounting services and associated fees previously covered under a separate services agreement.
During the period January 1, 2024 through February 29, 2024, the accounting fees were a fixed annual rate of average net assets as follows:
| | % of Average Net Assets |
| VIP Mid Cap Portfolio | .0149 |
Brokerage Commissions. A portion of portfolio transactions were placed with brokerage firms which are affiliates of the investment adviser. Brokerage commissions are included in net realized gain (loss) and change in net unrealized appreciation (depreciation) in the Statement of Operations. The commissions paid to these affiliated firms were as follows:
| | Amount ($) |
| VIP Mid Cap Portfolio | 83,340 |
Interfund Trades. Funds may purchase from or sell securities to other Fidelity Funds under procedures adopted by the Board. The procedures have been designed to ensure these interfund trades are executed in accordance with Rule 17a-7 of the 1940 Act. Any interfund trades are included within the respective purchases and sales amounts shown in the Purchases and Sales of Investments note. Interfund trades during the period are noted in the table below.
| | Purchases ($) | Sales ($) | Realized Gain (Loss) ($) |
| VIP Mid Cap Portfolio | 164,619,849 | 423,057,956 | 136,443,051 |
6. Committed Line of Credit.
Certain Funds participate with other funds managed by the investment adviser or an affiliate in a $4.25 billion credit facility (the "line of credit") to be utilized for temporary or emergency purposes to fund shareholder redemptions or for other short-term liquidity purposes.
Commitment fees are charged based on the unused amount of the line of credit at an annual rate of .10%, and then allocated to each participating fund based on its pro-rata portion of the line of credit. The commitment fees are reflected in Miscellaneous expenses on the Statement of Operations, and are listed below.
Interest is charged to a participating fund based on its borrowings at an annual rate of .75% plus the highest of (i) daily SOFR plus a .10% spread adjustment, (ii) Federal Funds Effective Rate, or (iii) Overnight Bank Funding Rate. During the period, there were no borrowings on this line of credit.
The line of credit agreement will expire in March 2025 unless extended or renewed.
| | Amount ($) |
| VIP Mid Cap Portfolio | 11,335 |
7. Security Lending.
Funds lend portfolio securities from time to time in order to earn additional income. Lending agents are used, including National Financial Services (NFS), an affiliate of the investment adviser. Pursuant to a securities lending agreement, NFS will receive a fee, which is capped at 9.9% of a fund's daily lending revenue, for its services as lending agent. A fund may lend securities to certain qualified borrowers, including NFS. On the settlement date of the loan, a fund receives collateral (in the form of U.S. Treasury obligations, letters of credit and/or cash) against the loaned securities and maintains collateral in an amount not less than 100% of the market value of the loaned securities during the period of the loan. The market value of the loaned securities is determined at the close of business of a fund and any additional required collateral is delivered to a fund on the next business day. A fund or borrower may terminate the loan at any time, and if the borrower defaults on its obligation to return the securities loaned because of insolvency or other reasons, a fund may apply collateral received from the borrower against the obligation. A fund may experience delays and costs in recovering the securities loaned. Any cash collateral received is invested in the Fidelity Securities Lending Cash Central Fund. Any loaned securities are identified as such in the Schedule of Investments, and the value of loaned securities and cash collateral at period end, as applicable, are presented in the Statement of Assets and Liabilities. Security lending income represents the income earned on investing cash collateral, less rebates paid to borrowers and any lending agent fees associated with the loan, plus any premium payments received for lending certain types of securities. Security lending income is presented in the Statement of Operations as a component of income from Fidelity Central Funds. Affiliated security lending activity, if any, was as follows:
| | Total Security Lending Fees Paid to NFS ($) | Security Lending Income From Securities Loaned to NFS ($) | Value of Securities Loaned to NFS at Period End ($) |
| VIP Mid Cap Portfolio | 190,240 | 388 | - |
8. Expense Reductions.
Through arrangements with the Fund's custodian, credits realized as a result of certain uninvested cash balances were used to reduce the Fund's expenses. During the period, custodian credits reduced the Fund's expenses by $6,503.
In addition, during the period the investment adviser or an affiliate reimbursed and/or waived a portion of fund-level operating expenses in the amount of $310,143.
9. Distributions to Shareholders.
Distributions to shareholders of each class were as follows:
| | Year ended December 31, 2024 | Year ended December 31, 2023 |
| VIP Mid Cap Portfolio | | |
| Distributions to shareholders | | |
| Initial Class | $213,376,033 | $48,860,870 |
| Service Class | 95,410,660 | 20,456,663 |
| Service Class 2 | 593,657,915 | 126,967,218 |
| Investor Class | 96,646,101 | 20,578,233 |
Total | $999,090,709 | $216,862,984 |
10. Share Transactions.
Transactions for each class of shares were as follows and may contain in-kind transactions:
| | Shares | Shares | Dollars | Dollars |
| | Year ended December 31, 2024 | Year ended December 31, 2023 | Year ended December 31, 2024 | Year ended December 31, 2023 |
| VIP Mid Cap Portfolio | | | | |
| Initial Class | | | | |
| Shares sold | 1,923,381 | 1,477,610 | $76,887,654 | $50,565,030 |
| Reinvestment of distributions | 5,414,963 | 1,377,490 | 213,376,033 | 48,860,870 |
| Shares redeemed | (6,222,674) | (4,971,724) | (245,813,857) | (171,217,271) |
| Net increase (decrease) | 1,115,670 | (2,116,624) | $44,449,830 | $(71,791,371) |
| Service Class | | | | |
| Shares sold | 650,880 | 937,901 | $25,986,431 | $31,370,215 |
| Reinvestment of distributions | 2,462,389 | 585,134 | 95,410,660 | 20,456,663 |
| Shares redeemed | (1,814,200) | (1,392,010) | (71,188,138) | (47,245,269) |
| Net increase (decrease) | 1,299,069 | 131,025 | $50,208,953 | $4,581,609 |
| Service Class 2 | | | | |
| Shares sold | 6,634,142 | 14,375,353 | $250,567,716 | $470,985,989 |
| Reinvestment of distributions | 15,936,168 | 3,759,252 | 593,657,915 | 126,967,218 |
| Shares redeemed | (17,275,031) | (20,971,087) | (652,188,552) | (678,544,006) |
| Net increase (decrease) | 5,295,279 | (2,836,482) | $192,037,079 | $(80,590,799) |
| Investor Class | | | | |
| Shares sold | 985,983 | 592,143 | $39,003,722 | $20,182,823 |
| Reinvestment of distributions | 2,478,637 | 585,562 | 96,646,101 | 20,578,233 |
| Shares redeemed | (1,344,693) | (2,684,106) | (52,723,120) | (91,952,375) |
| Net increase (decrease) | 2,119,927 | (1,506,401) | $82,926,703 | $(51,191,319) |
11. Other.
A fund's organizational documents provide former and current trustees and officers with a limited indemnification against liabilities arising in connection with the performance of their duties to the fund. In the normal course of business, a fund may also enter into contracts that provide general indemnifications. A fund's maximum exposure under these arrangements is unknown as this would be dependent on future claims that may be made against a fund. The risk of material loss from such claims is considered remote.
At the end of the period, the investment adviser or its affiliates were owners of record of more than 10% and certain otherwise unaffiliated shareholders were owners of record of more than 10% of the outstanding shares as follows:
| Fund | Affiliated % | Number ofUnaffiliated Shareholders | Unaffiliated Shareholders % |
| VIP Mid Cap Portfolio | 13% | 1 | 14% |
12. Risk and Uncertainties.
Many factors affect a fund's performance. Developments that disrupt global economies and financial markets, such as pandemics, epidemics, outbreaks of infectious diseases, war, terrorism, and environmental disasters, may significantly affect a fund's investment performance. The effects of these developments to a fund will be impacted by the types of securities in which a fund invests, the financial condition, industry, economic sector, and geographic location of an issuer, and a fund's level of investment in the securities of that issuer. Significant concentrations in security types, issuers, industries, sectors, and geographic locations may magnify the factors that affect a fund's performance.
Report of Independent Registered Public Accounting Firm
To the Board of Trustees of Variable Insurance Products Fund III and Shareholders of VIP Mid Cap Portfolio
Opinion on the Financial Statements
We have audited the accompanying statement of assets and liabilities, including the schedule of investments, of VIP Mid Cap Portfolio (one of the funds constituting Variable Insurance Products Fund III, referred to hereafter as the "Fund") as of December 31, 2024, the related statement of operations for the year ended December 31, 2024, the statement of changes in net assets for each of the two years in the period ended December 31, 2024, including the related notes, and the financial highlights for each of the five years in the period ended December 31, 2024 (collectively referred to as the "financial statements"). In our opinion, the financial statements present fairly, in all material respects, the financial position of the Fund as of December 31, 2024, the results of its operations for the year then ended, the changes in its net assets for each of the two years in the period ended December 31, 2024 and the financial highlights for each of the five years in the period ended December 31, 2024 in conformity with accounting principles generally accepted in the United States of America.
Basis for Opinion
These financial statements are the responsibility of the Fund's management. Our responsibility is to express an opinion on the Fund's financial statements based on our audits. We are a public accounting firm registered with the Public Company Accounting Oversight Board (United States) (PCAOB) and are required to be independent with respect to the Fund in accordance with the U.S. federal securities laws and the applicable rules and regulations of the Securities and Exchange Commission and the PCAOB.
We conducted our audits of these financial statements in accordance with the standards of the PCAOB. Those standards require that we plan and perform the audit to obtain reasonable assurance about whether the financial statements are free of material misstatement, whether due to error or fraud.
Our audits included performing procedures to assess the risks of material misstatement of the financial statements, whether due to error or fraud, and performing procedures that respond to those risks. Such procedures included examining, on a test basis, evidence regarding the amounts and disclosures in the financial statements. Our audits also included evaluating the accounting principles used and significant estimates made by management, as well as evaluating the overall presentation of the financial statements. Our procedures included confirmation of securities owned as of December 31, 2024 by correspondence with the custodian and brokers; when replies were not received from brokers, we performed other auditing procedures. We believe that our audits provide a reasonable basis for our opinion.
/s/ PricewaterhouseCoopers LLP
Boston, Massachusetts
February 11, 2025
We have served as the auditor of one or more investment companies in the Fidelity group of funds since 1932.
Distributions
(Unaudited)The dividend and capital gains distributions for the fund(s) are available on Fidelity.com or Institutional.Fidelity.com.
The fund hereby designates as a capital gain dividend with respect to the taxable year ended December 31, 2024, $1,100,400,990, or, if subsequently determined to be different, the net capital gain of such year.
The fund designates $1,434,400 of distributions paid during the fiscal year ended 2024 as qualifying to be taxed as section 163(j) interest dividends.
Initial Class designates 53%, Service Class designates 56%, Service Class 2 designates 63% and Investor Class designates 55%, of the dividend distributed in December, during the fiscal year as qualifying for the dividends-received deduction for corporate shareholders.
Item 8: Changes in and Disagreements with Accountants for Open-End Management Investment Companies
(Unaudited)
Note: This is not applicable for any fund included in this document.
Item 9: Proxy Disclosures for Open-End Management Investment Companies
(Unaudited)
| A special meeting of shareholders was held on July 16, 2024. The results of votes taken among shareholders on the proposal before them are reported below. Each vote reported represents one dollar of net asset value held on the record date for the meeting. |
| Proposal 1 |
| To elect a Board of Trustees. |
| | # of Votes | % of Votes |
| Bettina Doulton |
| Affirmative | 19,815,631,510.17 | 96.35 |
| Withheld | 749,708,334.02 | 3.65 |
| TOTAL | 20,565,339,844.19 | 100.00 |
| Robert A. Lawrence |
| Affirmative | 19,766,714,617.58 | 96.12 |
| Withheld | 798,625,226.62 | 3.88 |
| TOTAL | 20,565,339,844.19 | 100.00 |
| Vijay C. Advani |
| Affirmative | 19,788,320,252.27 | 96.22 |
| Withheld | 777,019,591.92 | 3.78 |
| TOTAL | 20,565,339,844.19 | 100.00 |
| Thomas P. Bostick |
| Affirmative | 19,780,566,370.66 | 96.18 |
| Withheld | 784,773,473.53 | 3.82 |
| TOTAL | 20,565,339,844.19 | 100.00 |
| Donald F. Donahue |
| Affirmative | 19,723,882,404.02 | 95.91 |
| Withheld | 841,457,440.18 | 4.09 |
| TOTAL | 20,565,339,844.19 | 100.00 |
| Vicki L. Fuller |
| Affirmative | 19,823,019,040.62 | 96.39 |
| Withheld | 742,320,803.57 | 3.61 |
| TOTAL | 20,565,339,844.19 | 100.00 |
| Patricia L. Kampling |
| Affirmative | 19,837,563,936.04 | 96.46 |
| Withheld | 727,775,908.15 | 3.54 |
| TOTAL | 20,565,339,844.19 | 100.00 |
| Thomas A. Kennedy |
| Affirmative | 19,789,564,999.11 | 96.23 |
| Withheld | 775,774,845.08 | 3.77 |
| TOTAL | 20,565,339,844.19 | 100.00 |
| Oscar Munoz |
| Affirmative | 19,772,385,801.51 | 96.14 |
| Withheld | 792,954,042.68 | 3.86 |
| TOTAL | 20,565,339,844.19 | 100.00 |
| Karen B. Peetz |
| Affirmative | 19,804,495,604.67 | 96.30 |
| Withheld | 760,844,239.52 | 3.70 |
| TOTAL | 20,565,339,844.19 | 100.00 |
| David M. Thomas |
| Affirmative | 19,717,117,994.71 | 95.88 |
| Withheld | 848,221,849.48 | 4.12 |
| TOTAL | 20,565,339,844.19 | 100.00 |
| Susan Tomasky |
| Affirmative | 19,783,626,171.89 | 96.20 |
| Withheld | 781,713,672.31 | 3.80 |
| TOTAL | 20,565,339,844.19 | 100.00 |
| Michael E. Wiley |
| Affirmative | 19,728,139,900.50 | 95.93 |
| Withheld | 837,199,943.69 | 4.07 |
| TOTAL | 20,565,339,844.19 | 100.00 |
| | | |
| Proposal 1 reflects trust-wide proposal and voting results. |
Item 10: Remuneration Paid to Directors, Officers, and others of Open-End Management Investment Companies
(Unaudited)
Note: This information is disclosed as part of the financial statements for each Fund as part of Item 7: Financial Statements and Financial Highlights for Open-End Management Investment companies.
Item 11: Statement Regarding Basis for Approval of Investment Advisory Contract
(Unaudited)
Note: This is not applicable for any fund included in this document.
1.735273.125
VIPMID-ANN-0325
Fidelity® Variable Insurance Products:
VIP Dynamic Capital Appreciation Portfolio
Annual Report
December 31, 2024
Contents
To view a fund's proxy voting guidelines and proxy voting record for the 12-month period ended June 30, visit http://www.fidelity.com/proxyvotingresults or visit the Securities and Exchange Commission's (SEC) web site at http://www.sec.gov.
You may also call 1-877-208-0098 to request a free copy of the proxy voting guidelines.
Fidelity® Variable Insurance Products are separate account options which are purchased through a variable insurance contract.
Standard & Poor's, S&P and S&P 500 are registered service marks of The McGraw-Hill Companies, Inc. and have been licensed for use by Fidelity Distributors Corporation.
Other third-party marks appearing herein are the property of their respective owners.
All other marks appearing herein are registered or unregistered trademarks or service marks of FMR LLC or an affiliated company. © 2025 FMR LLC. All rights reserved.
This report and the financial statements contained herein are submitted for the general information of the shareholders of the Fund. This report is not authorized for distribution to prospective investors in the Fund unless preceded or accompanied by an effective prospectus.
A fund files its complete schedule of portfolio holdings with the SEC for the first and third quarters of each fiscal year on Form N-PORT. Forms N-PORT are available on the SEC's web site at http://www.sec.gov. A fund's Forms N-PORT may be reviewed and copied at the SEC's Public Reference Room in Washington, DC. Information regarding the operation of the SEC's Public Reference Room may be obtained by calling 1-800-SEC-0330.
For a complete list of a fund's portfolio holdings, view the most recent holdings listing, semiannual report, or annual report on Fidelity's web site at http://www.fidelity.com, http://www.institutional.fidelity.com, or http://www.401k.com, as applicable.
NOT FDIC INSURED •MAY LOSE VALUE •NO BANK GUARANTEE
Neither the Fund nor Fidelity Distributors Corporation is a bank.
Item 7: Financial Statements and Financial Highlights for Open-End Management Investment Companies (Annual Report)
VIP Dynamic Capital Appreciation Portfolio
Schedule of Investments December 31, 2024
Showing Percentage of Net Assets
| Common Stocks - 99.6% |
| | | Shares | Value ($) |
| BELGIUM - 0.7% | | | |
| Health Care - 0.7% | | | |
| Biotechnology - 0.1% | | | |
| Galapagos NV ADR (b) | | 13,300 | 365,750 |
| Pharmaceuticals - 0.6% | | | |
| UCB SA | | 8,100 | 1,612,632 |
| TOTAL BELGIUM | | | 1,978,382 |
| BRAZIL - 0.9% | | | |
| Consumer Discretionary - 0.9% | | | |
| Broadline Retail - 0.9% | | | |
| MercadoLibre Inc (b) | | 1,460 | 2,482,642 |
| CANADA - 1.5% | | | |
| Consumer Discretionary - 0.4% | | | |
| Broadline Retail - 0.4% | | | |
| Dollarama Inc | | 11,500 | 1,122,279 |
| Energy - 1.1% | | | |
| Oil, Gas & Consumable Fuels - 1.1% | | | |
| Canadian Natural Resources Ltd (United States) | | 98,000 | 3,025,260 |
| TOTAL CANADA | | | 4,147,539 |
| CHINA - 2.5% | | | |
| Communication Services - 0.5% | | | |
| Interactive Media & Services - 0.5% | | | |
| Tencent Holdings Ltd | | 25,900 | 1,382,356 |
| Consumer Discretionary - 2.0% | | | |
| Automobiles - 0.6% | | | |
| BYD Co Ltd H Shares | | 52,500 | 1,785,689 |
| Broadline Retail - 0.2% | | | |
| PDD Holdings Inc Class A ADR (b) | | 6,900 | 669,231 |
| Hotels, Restaurants & Leisure - 1.2% | | | |
| Meituan B Shares (b)(c)(d) | | 47,700 | 927,449 |
| Trip.com Group Ltd ADR (b) | | 32,300 | 2,217,718 |
| | | | 3,145,167 |
TOTAL CONSUMER DISCRETIONARY | | | 5,600,087 |
| | | | |
| TOTAL CHINA | | | 6,982,443 |
| DENMARK - 0.0% | | | |
| Health Care - 0.0% | | | |
| Life Sciences Tools & Services - 0.0% | | | |
| Chemometec A/S | | 4,300 | 290,402 |
| GERMANY - 0.4% | | | |
| Health Care - 0.4% | | | |
| Biotechnology - 0.4% | | | |
| BioNTech SE ADR (b) | | 9,200 | 1,048,340 |
| INDIA - 0.0% | | | |
| Financials - 0.0% | | | |
| Financial Services - 0.0% | | | |
| One 97 Communications Ltd (b) | | 500 | 5,947 |
| ISRAEL - 0.8% | | | |
| Health Care - 0.8% | | | |
| Biotechnology - 0.0% | | | |
| Gamida Cell Ltd (e) | | 75,514 | 1 |
| Gamida Cell Ltd warrants 4/21/2028 (b)(e) | | 11,600 | 0 |
| | | | 1 |
| Pharmaceuticals - 0.8% | | | |
| Teva Pharmaceutical Industries Ltd ADR (b) | | 97,200 | 2,142,288 |
| TOTAL ISRAEL | | | 2,142,289 |
| JAPAN - 0.3% | | | |
| Health Care - 0.3% | | | |
| Pharmaceuticals - 0.3% | | | |
| Chugai Pharmaceutical Co Ltd | | 19,000 | 837,542 |
| NETHERLANDS - 0.7% | | | |
| Information Technology - 0.7% | | | |
| Semiconductors & Semiconductor Equipment - 0.7% | | | |
| BE Semiconductor Industries NV | | 13,500 | 1,850,080 |
| TAIWAN - 2.1% | | | |
| Information Technology - 2.1% | | | |
| Semiconductors & Semiconductor Equipment - 2.1% | | | |
| eMemory Technology Inc | | 2,000 | 204,257 |
| Taiwan Semiconductor Manufacturing Co Ltd ADR | | 28,100 | 5,549,469 |
| | | | |
| TOTAL TAIWAN | | | 5,753,726 |
| UNITED KINGDOM - 0.3% | | | |
| Health Care - 0.1% | | | |
| Biotechnology - 0.1% | | | |
| Immunocore Holdings PLC ADR (b) | | 5,700 | 168,150 |
| Industrials - 0.2% | | | |
| Professional Services - 0.2% | | | |
| RELX PLC ADR | | 13,700 | 622,254 |
| TOTAL UNITED KINGDOM | | | 790,404 |
| UNITED STATES - 89.4% | | | |
| Communication Services - 7.0% | | | |
| Entertainment - 1.0% | | | |
| Live Nation Entertainment Inc (b) | | 10,400 | 1,346,800 |
| ROBLOX Corp Class A (b) | | 27,600 | 1,596,936 |
| | | | 2,943,736 |
| Interactive Media & Services - 6.0% | | | |
| Alphabet Inc Class A | | 43,880 | 8,306,484 |
| Alphabet Inc Class C | | 25,360 | 4,829,558 |
| Epic Games Inc (b)(e)(f) | | 156 | 105,848 |
| Meta Platforms Inc Class A | | 6,000 | 3,513,060 |
| | | | 16,754,950 |
| Consumer Discretionary - 9.4% | | | |
| Broadline Retail - 5.3% | | | |
| Amazon.com Inc (b) | | 66,360 | 14,558,720 |
| Savers Value Village Inc (b)(g) | | 18,900 | 193,725 |
| | | | 14,752,445 |
| Diversified Consumer Services - 0.5% | | | |
| Duolingo Inc Class A (b) | | 1,500 | 486,345 |
| Service Corp International/US | | 10,000 | 798,200 |
| | | | 1,284,545 |
| Hotels, Restaurants & Leisure - 1.7% | | | |
| Airbnb Inc Class A (b) | | 23,100 | 3,035,571 |
| Kura Sushi USA Inc Class A (b) | | 6,400 | 579,712 |
| Starbucks Corp | | 11,000 | 1,003,750 |
| | | | 4,619,033 |
| Household Durables - 0.3% | | | |
| TopBuild Corp (b) | | 4,000 | 1,245,360 |
| Specialty Retail - 1.6% | | | |
| Floor & Decor Holdings Inc Class A (b) | | 8,900 | 887,330 |
| Lowe's Cos Inc | | 14,300 | 3,529,240 |
| | | | 4,416,570 |
TOTAL CONSUMER DISCRETIONARY | | | 26,317,953 |
| | | | |
| Consumer Staples - 2.4% | | | |
| Beverages - 0.7% | | | |
| Monster Beverage Corp (b) | | 37,048 | 1,947,243 |
| Personal Care Products - 1.7% | | | |
| Estee Lauder Cos Inc/The Class A | | 41,000 | 3,074,180 |
| Kenvue Inc | | 81,200 | 1,733,620 |
| | | | 4,807,800 |
TOTAL CONSUMER STAPLES | | | 6,755,043 |
| | | | |
| Energy - 1.7% | | | |
| Oil, Gas & Consumable Fuels - 1.7% | | | |
| Antero Resources Corp (b) | | 24,400 | 855,220 |
| Cheniere Energy Inc | | 13,100 | 2,814,797 |
| Range Resources Corp | | 31,500 | 1,133,370 |
| | | | 4,803,387 |
| Financials - 13.2% | | | |
| Banks - 2.4% | | | |
| Huntington Bancshares Inc/OH | | 80,100 | 1,303,227 |
| JPMorgan Chase & Co | | 11,000 | 2,636,810 |
| M&T Bank Corp | | 14,800 | 2,782,548 |
| | | | 6,722,585 |
| Capital Markets - 2.3% | | | |
| Intercontinental Exchange Inc | | 19,400 | 2,890,794 |
| Morgan Stanley | | 28,110 | 3,533,989 |
| | | | 6,424,783 |
| Consumer Finance - 1.1% | | | |
| Capital One Financial Corp | | 17,100 | 3,049,272 |
| Financial Services - 6.1% | | | |
| Fiserv Inc (b) | | 12,500 | 2,567,750 |
| Mastercard Inc Class A | | 15,100 | 7,951,208 |
| Rocket Cos Inc Class A (b)(g) | | 62,700 | 706,002 |
| Shift4 Payments Inc Class A (b)(g) | | 4,300 | 446,254 |
| Toast Inc Class A (b) | | 49,800 | 1,815,210 |
| Visa Inc Class A | | 11,100 | 3,508,044 |
| | | | 16,994,468 |
| Insurance - 1.3% | | | |
| Arthur J Gallagher & Co | | 11,557 | 3,280,454 |
| Baldwin Insurance Group Inc/The Class A (b) | | 10,079 | 390,662 |
| | | | 3,671,116 |
TOTAL FINANCIALS | | | 36,862,224 |
| | | | |
| Health Care - 14.9% | | | |
| Biotechnology - 5.0% | | | |
| AbbVie Inc | | 25,100 | 4,460,271 |
| Adamas Pharmaceuticals Inc rights (b)(e) | | 47,000 | 940 |
| Adamas Pharmaceuticals Inc rights (b)(e) | | 47,000 | 940 |
| Alnylam Pharmaceuticals Inc (b) | | 10,379 | 2,442,282 |
| Arcellx Inc (b) | | 2,300 | 176,387 |
| Arrowhead Pharmaceuticals Inc (b) | | 6,316 | 118,741 |
| Beam Therapeutics Inc (b)(g) | | 2,900 | 71,920 |
| Biogen Inc (b) | | 3,600 | 550,512 |
| Blueprint Medicines Corp (b) | | 1,200 | 104,664 |
| Cytokinetics Inc (b) | | 4,600 | 216,384 |
| Exact Sciences Corp (b) | | 47,300 | 2,657,787 |
| Gilead Sciences Inc | | 22,500 | 2,078,325 |
| Hookipa Pharma Inc (b) | | 3,210 | 6,452 |
| Insmed Inc (b) | | 6,300 | 434,952 |
| Krystal Biotech Inc (b) | | 800 | 125,328 |
| Moderna Inc (b) | | 2,700 | 112,266 |
| Seres Therapeutics Inc (b) | | 10,900 | 9,058 |
| Vor BioPharma Inc (b) | | 19,984 | 22,182 |
| XOMA Royalty Corp (b)(g) | | 12,400 | 325,872 |
| | | | 13,915,263 |
| Health Care Equipment & Supplies - 4.8% | | | |
| Align Technology Inc (b) | | 7,600 | 1,584,676 |
| Boston Scientific Corp (b) | | 95,800 | 8,556,856 |
| Ceribell Inc | | 2,700 | 69,876 |
| Hologic Inc (b) | | 29,200 | 2,105,028 |
| Penumbra Inc (b) | | 4,500 | 1,068,660 |
| | | | 13,385,096 |
| Health Care Providers & Services - 2.6% | | | |
| HealthEquity Inc (b) | | 19,100 | 1,832,645 |
| Humana Inc | | 6,100 | 1,547,631 |
| UnitedHealth Group Inc | | 7,800 | 3,945,708 |
| | | | 7,325,984 |
| Life Sciences Tools & Services - 1.7% | | | |
| 10X Genomics Inc Class A (b) | | 18,056 | 259,284 |
| Bio-Techne Corp | | 8,500 | 612,255 |
| Bruker Corp | | 26,500 | 1,553,430 |
| Codexis Inc (b)(g) | | 35,200 | 167,904 |
| Danaher Corp | | 9,200 | 2,111,860 |
| | | | 4,704,733 |
| Pharmaceuticals - 0.8% | | | |
| Eli Lilly & Co | | 1,800 | 1,389,600 |
| Royalty Pharma PLC Class A | | 37,400 | 954,074 |
| Zevra Therapeutics Inc (b)(g) | | 16,800 | 140,112 |
| | | | 2,483,786 |
TOTAL HEALTH CARE | | | 41,814,862 |
| | | | |
| Industrials - 12.0% | | | |
| Aerospace & Defense - 1.3% | | | |
| GE Aerospace | | 21,000 | 3,502,590 |
| Loar Holdings Inc (g) | | 300 | 22,173 |
| | | | 3,524,763 |
| Building Products - 0.4% | | | |
| Simpson Manufacturing Co Inc | | 7,900 | 1,310,057 |
| Electrical Equipment - 1.6% | | | |
| GE Vernova Inc | | 13,575 | 4,465,225 |
| Ground Transportation - 1.2% | | | |
| Uber Technologies Inc (b) | | 53,600 | 3,233,152 |
| Machinery - 3.9% | | | |
| Allison Transmission Holdings Inc | | 24,600 | 2,658,276 |
| Deere & Co | | 5,000 | 2,118,500 |
| Ingersoll Rand Inc | | 38,822 | 3,511,838 |
| Westinghouse Air Brake Technologies Corp | | 14,200 | 2,692,178 |
| | | | 10,980,792 |
| Professional Services - 2.8% | | | |
| Equifax Inc | | 17,400 | 4,434,390 |
| KBR Inc | | 39,785 | 2,304,745 |
| UL Solutions Inc Class A | | 24,600 | 1,227,048 |
| | | | 7,966,183 |
| Trading Companies & Distributors - 0.8% | | | |
| Ferguson Enterprises Inc (United Kingdom) | | 12,077 | 2,101,568 |
TOTAL INDUSTRIALS | | | 33,581,740 |
| | | | |
| Information Technology - 25.5% | | | |
| Communications Equipment - 0.3% | | | |
| Ciena Corp (b) | | 11,100 | 941,391 |
| Electronic Equipment, Instruments & Components - 1.4% | | | |
| Flex Ltd (b) | | 59,100 | 2,268,849 |
| Jabil Inc | | 10,700 | 1,539,730 |
| | | | 3,808,579 |
| Semiconductors & Semiconductor Equipment - 9.7% | | | |
| Astera Labs Inc (b) | | 500 | 66,225 |
| Marvell Technology Inc | | 8,900 | 983,005 |
| NVIDIA Corp | | 180,670 | 24,262,175 |
| SiTime Corp (b) | | 8,600 | 1,844,958 |
| | | | 27,156,363 |
| Software - 6.9% | | | |
| Appfolio Inc Class A (b) | | 600 | 148,032 |
| Asapp Inc warrants 8/28/2028 (b)(e)(f) | | 61,925 | 89,791 |
| DocuSign Inc (b) | | 23,200 | 2,086,608 |
| HubSpot Inc (b) | | 3,500 | 2,438,695 |
| Manhattan Associates Inc (b) | | 4,700 | 1,270,128 |
| Microsoft Corp | | 29,542 | 12,451,953 |
| Nutanix Inc Class A (b) | | 4,700 | 287,546 |
| OpenAI Global LLC rights (b)(e)(f) | | 159,000 | 159,000 |
| Zeta Global Holdings Corp Class A (b) | | 21,800 | 392,182 |
| | | | 19,323,935 |
| Technology Hardware, Storage & Peripherals - 7.2% | | | |
| Apple Inc | | 80,360 | 20,123,751 |
TOTAL INFORMATION TECHNOLOGY | | | 71,354,019 |
| | | | |
| Materials - 2.5% | | | |
| Chemicals - 0.3% | | | |
| Sherwin-Williams Co/The | | 2,200 | 747,846 |
| Construction Materials - 1.0% | | | |
| Eagle Materials Inc | | 1,600 | 394,816 |
| Martin Marietta Materials Inc | | 4,300 | 2,220,950 |
| | | | 2,615,766 |
| Containers & Packaging - 0.8% | | | |
| International Paper Co | | 43,900 | 2,362,698 |
| Metals & Mining - 0.4% | | | |
| Carpenter Technology Corp | | 7,000 | 1,187,970 |
TOTAL MATERIALS | | | 6,914,280 |
| | | | |
| Real Estate - 0.8% | | | |
| Real Estate Management & Development - 0.8% | | | |
| Zillow Group Inc Class A (b) | | 4,600 | 325,910 |
| Zillow Group Inc Class C (b) | | 24,000 | 1,777,200 |
| | | | 2,103,110 |
| TOTAL UNITED STATES | | | 250,205,304 |
| TOTAL COMMON STOCKS (Cost $194,660,162) | | | 278,515,040 |
| | | | |
| Convertible Corporate Bonds - 0.0% |
| | | Principal Amount (a) | Value ($) |
| UNITED STATES - 0.0% | | | |
| Materials - 0.0% | | | |
| Metals & Mining - 0.0% | | | |
Illuminated Holdings Inc 15% (e)(f)(h) (Cost $49,600) | | 49,600 | 48,598 |
| | | | |
| Convertible Preferred Stocks - 0.3% |
| | | Shares | Value ($) |
| AUSTRALIA - 0.0% | | | |
| Information Technology - 0.0% | | | |
| Software - 0.0% | | | |
| Canva Inc Series A (b)(e)(f) | | 85 | 108,808 |
| Canva Inc Series A2 (b)(e)(f) | | 15 | 19,201 |
| | | | |
| TOTAL AUSTRALIA | | | 128,009 |
| UNITED STATES - 0.3% | | | |
| Financials - 0.0% | | | |
| Financial Services - 0.0% | | | |
| Akeana Series C (e)(f) | | 1,600 | 20,240 |
| Health Care - 0.0% | | | |
| Biotechnology - 0.0% | | | |
| ElevateBio LLC Series C (b)(e)(f) | | 5,300 | 15,369 |
| Industrials - 0.0% | | | |
| Aerospace & Defense - 0.0% | | | |
| Anduril Industries Inc (e)(f) | | 5,252 | 131,615 |
| Information Technology - 0.2% | | | |
| Software - 0.2% | | | |
| Asapp Inc Series C (b)(e)(f) | | 17,672 | 37,111 |
| Asapp Inc Series D (b)(e)(f) | | 107,931 | 193,197 |
| xAI Corp Series C (e)(f) | | 9,300 | 201,345 |
| | | | 431,653 |
| Materials - 0.1% | | | |
| Metals & Mining - 0.1% | | | |
| Illuminated Holdings Inc Series C2 (b)(e)(f) | | 3,438 | 47,823 |
| Illuminated Holdings Inc Series C3 (b)(e)(f) | | 4,298 | 59,786 |
| Illuminated Holdings Inc Series C4 (b)(e)(f) | | 1,252 | 17,415 |
| Illuminated Holdings Inc Series C5 (b)(e)(f) | | 2,617 | 36,402 |
| | | | 161,426 |
| TOTAL UNITED STATES | | | 760,303 |
| TOTAL CONVERTIBLE PREFERRED STOCKS (Cost $1,371,198) | | | 888,312 |
| | | | |
| Preferred Securities - 0.0% |
| | | Principal Amount (a) | Value ($) |
| UNITED STATES - 0.0% | | | |
| Materials - 0.0% | | | |
| Metals & Mining - 0.0% | | | |
Illuminated Holdings Inc 15% (e)(f)(h) (Cost $66,000) | | 66,000 | 73,755 |
| | | | |
| Money Market Funds - 0.6% |
| | | Yield (%) | Shares | Value ($) |
| Fidelity Cash Central Fund (i) | | 4.36 | 343,917 | 343,986 |
| Fidelity Securities Lending Cash Central Fund (i)(j) | | 4.35 | 1,309,457 | 1,309,587 |
| TOTAL MONEY MARKET FUNDS (Cost $1,653,573) | | | | 1,653,573 |
| | | | | |
| TOTAL INVESTMENT IN SECURITIES - 100.5% (Cost $197,800,533) | 281,179,278 |
NET OTHER ASSETS (LIABILITIES) - (0.5)% | (1,391,530) |
| NET ASSETS - 100.0% | 279,787,748 |
| | |
Legend
| (a) | Amount is stated in United States dollars unless otherwise noted. |
| (c) | Security exempt from registration under Rule 144A of the Securities Act of 1933. These securities may be resold in transactions exempt from registration, normally to qualified institutional buyers. At the end of the period, the value of these securities amounted to $927,449 or 0.3% of net assets. |
| (d) | Security is exempt from registration under Regulation S of the Securities Act of 1933 and may be resold to qualified foreign investors outside of the United States. At the end of the period, the value of securities amounted to $927,449 or 0.3% of net assets. |
| (f) | Restricted securities (including private placements) - Investment in securities not registered under the Securities Act of 1933 (excluding 144A issues). At the end of the period, the value of restricted securities (excluding 144A issues) amounted to $1,365,304 or 0.5% of net assets. |
| (g) | Security or a portion of the security is on loan at period end. |
| (h) | Security is perpetual in nature with no stated maturity date. |
| (i) | Affiliated fund that is generally available only to investment companies and other accounts managed by Fidelity Investments. The rate quoted is the annualized seven-day yield of the fund at period end. A complete unaudited listing of the fund's holdings as of its most recent quarter end is available upon request. In addition, each Fidelity Central Fund's financial statements, which are not covered by the Fund's Report of Independent Registered Public Accounting Firm, are available on the SEC's website or upon request. |
| (j) | Investment made with cash collateral received from securities on loan. |
| Additional information on each restricted holding is as follows: |
| Security | Acquisition Date | Acquisition Cost ($) |
| Akeana Series C | 1/23/24 | 20,417 |
| | | |
| Anduril Industries Inc | 8/07/24 | 114,161 |
| | | |
| Asapp Inc Series C | 4/30/21 | 116,584 |
| | | |
| Asapp Inc Series D | 8/29/23 | 416,776 |
| | | |
| Asapp Inc warrants 8/28/2028 | 8/29/23 | 0 |
| | | |
| Canva Inc Series A | 9/22/23 | 90,666 |
| | | |
| Canva Inc Series A2 | 9/22/23 | 16,000 |
| | | |
| ElevateBio LLC Series C | 3/09/21 | 22,234 |
| | | |
| Epic Games Inc | 3/29/21 | 138,060 |
| | | |
| Illuminated Holdings Inc 15% | 6/14/23 | 49,600 |
| | | |
| Illuminated Holdings Inc 15% | 9/27/23 | 66,000 |
| | | |
| Illuminated Holdings Inc Series C2 | 7/07/20 | 85,950 |
| | | |
| Illuminated Holdings Inc Series C3 | 7/07/20 | 128,940 |
| | | |
| Illuminated Holdings Inc Series C4 | 1/08/21 | 45,072 |
| | | |
| Illuminated Holdings Inc Series C5 | 6/16/21 | 113,054 |
| | | |
| OpenAI Global LLC rights | 9/30/24 | 159,000 |
| | | |
| xAI Corp Series C | 11/22/24 | 201,345 |
| | | |
Affiliated Central Funds
Fiscal year to date information regarding the Fund's investments in Fidelity Central Funds, including the ownership percentage, is presented below.
| Affiliate | Value, beginning of period ($) | Purchases ($) | Sales Proceeds ($) | Dividend Income ($) | Realized Gain (loss) ($) | Change in Unrealized appreciation (depreciation) ($) | Value, end of period ($) | Shares, end of period | % ownership, end of period |
| Fidelity Cash Central Fund | 2,970,448 | 63,842,490 | 66,468,951 | 129,950 | (1) | - | 343,986 | 343,917 | 0.0% |
| Fidelity Securities Lending Cash Central Fund | 2,033,087 | 25,733,819 | 26,457,319 | 3,814 | - | - | 1,309,587 | 1,309,457 | 0.0% |
| Total | 5,003,535 | 89,576,309 | 92,926,270 | 133,764 | (1) | - | 1,653,573 | 1,653,374 | |
| | | | | | | | | | |
Amounts in the dividend income column in the above table include any capital gain distributions from underlying funds, which are presented in the corresponding line item in the Statement of Operations, if applicable.
Amounts in the dividend income column for Fidelity Securities Lending Cash Central Fund represents the income earned on investing cash collateral, less rebates paid to borrowers and any lending agent fees associated with the loan, plus any premium payments received for lending certain types of securities.
Amounts included in the purchases and sales proceeds columns may include in-kind transactions, if applicable.
Investment Valuation
The following is a summary of the inputs used, as of December 31, 2024, involving the Fund's assets and liabilities carried at fair value. The inputs or methodology used for valuing securities may not be an indication of the risk associated with investing in those securities. For more information on valuation inputs, and their aggregation into the levels used below, please refer to the Investment Valuation section in the accompanying Notes to Financial Statements.
| Valuation Inputs at Reporting Date: |
| Description | Total ($) | Level 1 ($) | Level 2 ($) | Level 3 ($) |
Investments in Securities: | | | | |
|
| Common Stocks | | | | |
Communication Services | 21,081,042 | 19,592,838 | 1,382,356 | 105,848 |
Consumer Discretionary | 35,522,961 | 32,809,823 | 2,713,138 | - |
Consumer Staples | 6,755,043 | 6,755,043 | - | - |
Energy | 7,828,647 | 7,828,647 | - | - |
Financials | 36,868,171 | 36,868,171 | - | - |
Health Care | 48,279,967 | 47,440,544 | 837,542 | 1,881 |
Industrials | 34,203,994 | 34,203,994 | - | - |
Information Technology | 78,957,825 | 78,504,777 | 204,257 | 248,791 |
Materials | 6,914,280 | 6,914,280 | - | - |
Real Estate | 2,103,110 | 2,103,110 | - | - |
|
| Convertible Corporate Bonds | | | | |
Materials | 48,598 | - | - | 48,598 |
|
| Convertible Preferred Stocks | | | | |
Financials | 20,240 | - | - | 20,240 |
Health Care | 15,369 | - | - | 15,369 |
Industrials | 131,615 | - | - | 131,615 |
Information Technology | 559,662 | - | - | 559,662 |
Materials | 161,426 | - | - | 161,426 |
|
| Preferred Securities | | | | |
Materials | 73,755 | - | - | 73,755 |
|
| Money Market Funds | 1,653,573 | 1,653,573 | - | - |
| Total Investments in Securities: | 281,179,278 | 274,674,800 | 5,137,293 | 1,367,185 |
Financial Statements
| Statement of Assets and Liabilities |
As of December 31, 2024 |
| Assets | | | | |
| Investment in securities, at value (including securities loaned of $1,275,800) - See accompanying schedule: | | | | |
Unaffiliated issuers (cost $196,146,960) | $ | 279,525,705 | | |
Fidelity Central Funds (cost $1,653,573) | | 1,653,573 | | |
| | | | | |
| | | | | |
| Total Investment in Securities (cost $197,800,533) | | | $ | 281,179,278 |
| Cash | | | | 5,095 |
| Foreign currency held at value (cost $3,551) | | | | 3,398 |
| Receivable for investments sold | | | | 100,639 |
| Receivable for fund shares sold | | | | 16,281 |
| Dividends receivable | | | | 112,981 |
| Interest receivable | | | | 6,988 |
| Distributions receivable from Fidelity Central Funds | | | | 9,689 |
| Prepaid expenses | | | | 242 |
| Other receivables | | | | 7,116 |
Total assets | | | | 281,441,707 |
| Liabilities | | | | |
| Payable for investments purchased | $ | 78,697 | | |
| Payable for fund shares redeemed | | 63,939 | | |
| Accrued management fee | | 154,930 | | |
| Distribution and service plan fees payable | | 3,683 | | |
| Audit fee payable | | 37,205 | | |
| Other payables and accrued expenses | | 6,105 | | |
| Collateral on securities loaned | | 1,309,400 | | |
| Total liabilities | | | | 1,653,959 |
| Net Assets | | | $ | 279,787,748 |
| Net Assets consist of: | | | | |
| Paid in capital | | | $ | 153,678,618 |
| Total accumulated earnings (loss) | | | | 126,109,130 |
| Net Assets | | | $ | 279,787,748 |
| | | | | |
| Net Asset Value and Maximum Offering Price | | | | |
| Initial Class : | | | | |
Net Asset Value, offering price and redemption price per share ($29,942,297 ÷ 1,488,442 shares) | | | $ | 20.12 |
| Service Class : | | | | |
Net Asset Value, offering price and redemption price per share ($585,852 ÷ 29,688 shares) | | | $ | 19.73 |
| Service Class 2 : | | | | |
Net Asset Value, offering price and redemption price per share ($16,935,965 ÷ 886,291 shares) | | | $ | 19.11 |
| Investor Class : | | | | |
Net Asset Value, offering price and redemption price per share ($232,323,634 ÷ 11,594,404 shares) | | | $ | 20.04 |
| Statement of Operations |
| Year ended December 31, 2024 |
| Investment Income | | | | |
| Dividends | | | $ | 1,814,416 |
| Income from Fidelity Central Funds (including $3,814 from security lending) | | | | 133,764 |
| Total income | | | | 1,948,180 |
| Expenses | | | | |
| Management fee | $ | 1,676,862 | | |
| Transfer agent fees | | 50,156 | | |
| Distribution and service plan fees | | 42,899 | | |
| Accounting fees | | 14,125 | | |
| Custodian fees and expenses | | 26,077 | | |
| Independent trustees' fees and expenses | | 1,131 | | |
| Audit fees | | 57,045 | | |
| Legal | | 11,674 | | |
| Miscellaneous | | 7,149 | | |
| Total expenses before reductions | | 1,887,118 | | |
| Expense reductions | | (10,475) | | |
| Total expenses after reductions | | | | 1,876,643 |
| Net Investment income (loss) | | | | 71,537 |
| Realized and Unrealized Gain (Loss) | | | | |
| Net realized gain (loss) on: | | | | |
| Investment Securities: | | | | |
| Unaffiliated issuers | | 44,853,872 | | |
| Fidelity Central Funds | | (1) | | |
| Foreign currency transactions | | (2,649) | | |
| Total net realized gain (loss) | | | | 44,851,222 |
| Change in net unrealized appreciation (depreciation) on: | | | | |
| Investment Securities: | | | | |
| Unaffiliated issuers | | 13,224,797 | | |
| Assets and liabilities in foreign currencies | | (1,028) | | |
| Total change in net unrealized appreciation (depreciation) | | | | 13,223,769 |
| Net gain (loss) | | | | 58,074,991 |
| Net increase (decrease) in net assets resulting from operations | | | $ | 58,146,528 |
| Statement of Changes in Net Assets |
| |
| | Year ended December 31, 2024 | | Year ended December 31, 2023 |
| Increase (Decrease) in Net Assets | | | | |
| Operations | | | | |
| Net investment income (loss) | $ | 71,537 | $ | 484,565 |
| Net realized gain (loss) | | 44,851,222 | | 9,173,719 |
| Change in net unrealized appreciation (depreciation) | | 13,223,769 | | 41,599,680 |
| Net increase (decrease) in net assets resulting from operations | | 58,146,528 | | 51,257,964 |
| Distributions to shareholders | | (11,390,788) | | (10,260,756) |
| | | | | |
| Share transactions - net increase (decrease) | | 4,391,677 | | 7,951,950 |
| Total increase (decrease) in net assets | | 51,147,417 | | 48,949,158 |
| | | | | |
| Net Assets | | | | |
| Beginning of period | | 228,640,331 | | 179,691,173 |
| End of period | $ | 279,787,748 | $ | 228,640,331 |
| | | | | |
| | | | | |
Financial Highlights
VIP Dynamic Capital Appreciation Portfolio Initial Class |
| |
| Years ended December 31, | | 2024 | | 2023 | | 2022 | | 2021 | | 2020 |
Selected Per-Share Data | | | | | | | | | | |
| Net asset value, beginning of period | $ | 16.77 | $ | 13.72 | $ | 19.62 | $ | 17.36 | $ | 13.20 |
| Income from Investment Operations | | | | | | | | | | |
Net investment income (loss) A,B | | .02 | | .05 | | .07 | | .09 C | | .03 |
| Net realized and unrealized gain (loss) | | 4.16 | | 3.79 | | (3.87) | | 3.96 | | 4.35 |
| Total from investment operations | | 4.18 | | 3.84 | | (3.80) | | 4.05 | | 4.38 |
| Distributions from net investment income | | (.04) | | (.06) | | (.05) | | (.11) D | | (.03) |
| Distributions from net realized gain | | (.79) | | (.73) | | (2.05) | | (1.67) D | | (.19) |
| Total distributions | | (.83) | | (.79) | | (2.10) | | (1.79) E | | (.22) |
| Net asset value, end of period | $ | 20.12 | $ | 16.77 | $ | 13.72 | $ | 19.62 | $ | 17.36 |
Total Return F,G | | | | 29.07% | | (20.87)% | | 24.63% | | 33.61% |
Ratios to Average Net Assets B,H,I | | | | | | | | | | |
| Expenses before reductions | | .62% | | .66% | | .67% | | .66% | | .68% |
| Expenses net of fee waivers, if any | | | | .65% | | .66% | | .66% | | .68% |
| Expenses net of all reductions | | .62% | | .65% | | .66% | | .66% | | .68% |
| Net investment income (loss) | | .11% | | .32% | | .45% | | .51% C | | .19% |
| Supplemental Data | | | | | | | | | | |
| Net assets, end of period (000 omitted) | $ | 29,942 | $ | 25,072 | $ | 20,784 | $ | 30,029 | $ | 26,104 |
Portfolio turnover rate J | | | | 51% | | 55% | | 61% | | 62% |
ACalculated based on average shares outstanding during the period.
BNet investment income (loss) is affected by the timing of the declaration of dividends by any underlying mutual funds or exchange-traded funds (ETFs). Net investment income (loss) of any mutual funds or ETFs is not included in the Fund's net investment income (loss) ratio.
CNet investment income per share reflects one or more large, non-recurring dividend(s) which amounted to $.06 per share. Excluding such non-recurring dividend(s), the ratio of net investment income (loss) to average net assets would have been .18%.
DThe amount shown reflects reclassifications related to book to tax differences that were made in the year shown.
ETotal distributions per share do not sum due to rounding.
FTotal returns do not reflect charges attributable to your insurance company's separate account. Inclusion of these charges would reduce the total returns shown.
GTotal returns would have been lower if certain expenses had not been reduced during the applicable periods shown.
HFees and expenses of any underlying mutual funds or exchange-traded funds (ETFs) are not included in the Fund's expense ratio. The Fund indirectly bears its proportionate share of these expenses. For additional expense information related to investments in Fidelity Central Funds, please refer to the "Investments in Fidelity Central Funds" note found in the Notes to Financial Statements section of the most recent Annual or Semi-Annual report.
IExpense ratios reflect operating expenses of the class. Expenses before reductions do not reflect amounts reimbursed, waived, or reduced through arrangements with the investment adviser, brokerage services, or other offset arrangements, if applicable, and do not represent the amount paid by the class during periods when reimbursements, waivers or reductions occur.
JAmount does not include the portfolio activity of any underlying mutual funds or exchange-traded funds (ETFs), derivatives or securities that mature within one year from acquisition.
VIP Dynamic Capital Appreciation Portfolio Service Class |
| |
| Years ended December 31, | | 2024 | | 2023 | | 2022 | | 2021 | | 2020 |
Selected Per-Share Data | | | | | | | | | | |
| Net asset value, beginning of period | $ | 16.47 | $ | 13.49 | $ | 19.33 | $ | 17.13 | $ | 13.03 |
| Income from Investment Operations | | | | | | | | | | |
Net investment income (loss) A,B | | - C | | .03 | | .05 | | .08 D | | .01 |
| Net realized and unrealized gain (loss) | | 4.08 | | 3.73 | | (3.80) | | 3.89 | | 4.30 |
| Total from investment operations | | 4.08 | | 3.76 | | (3.75) | | 3.97 | | 4.31 |
| Distributions from net investment income | | (.03) | | (.04) | | (.03) | | (.09) E | | (.02) |
| Distributions from net realized gain | | (.79) | | (.73) | | (2.05) | | (1.67) E | | (.19) |
| Total distributions | | (.82) | | (.78) F | | (2.09) F | | (1.77) F | | (.21) |
| Net asset value, end of period | $ | 19.73 | $ | 16.47 | $ | 13.49 | $ | 19.33 | $ | 17.13 |
Total Return G,H | | | | 28.93% | | (20.94)% | | 24.47% | | 33.48% |
Ratios to Average Net Assets B,I,J | | | | | | | | | | |
| Expenses before reductions | | .72% | | .76% | | .77% | | .76% | | .78% |
| Expenses net of fee waivers, if any | | | | .75% | | .76% | | .76% | | .78% |
| Expenses net of all reductions | | .72% | | .75% | | .76% | | .76% | | .78% |
| Net investment income (loss) | | .01% | | .22% | | .35% | | .42% D | | .09% |
| Supplemental Data | | | | | | | | | | |
| Net assets, end of period (000 omitted) | $ | 586 | $ | 479 | $ | 358 | $ | 445 | $ | 327 |
Portfolio turnover rate K | | | | 51% | | 55% | | 61% | | 62% |
ACalculated based on average shares outstanding during the period.
BNet investment income (loss) is affected by the timing of the declaration of dividends by any underlying mutual funds or exchange-traded funds (ETFs). Net investment income (loss) of any mutual funds or ETFs is not included in the Fund's net investment income (loss) ratio.
CAmount represents less than $.005 per share.
DNet investment income per share reflects one or more large, non-recurring dividend(s) which amounted to $.06 per share. Excluding such non-recurring dividend(s), the ratio of net investment income (loss) to average net assets would have been .08%.
EThe amount shown reflects reclassifications related to book to tax differences that were made in the year shown.
FTotal distributions per share do not sum due to rounding.
GTotal returns do not reflect charges attributable to your insurance company's separate account. Inclusion of these charges would reduce the total returns shown.
HTotal returns would have been lower if certain expenses had not been reduced during the applicable periods shown.
IFees and expenses of any underlying mutual funds or exchange-traded funds (ETFs) are not included in the Fund's expense ratio. The Fund indirectly bears its proportionate share of these expenses. For additional expense information related to investments in Fidelity Central Funds, please refer to the "Investments in Fidelity Central Funds" note found in the Notes to Financial Statements section of the most recent Annual or Semi-Annual report.
JExpense ratios reflect operating expenses of the class. Expenses before reductions do not reflect amounts reimbursed, waived, or reduced through arrangements with the investment adviser, brokerage services, or other offset arrangements, if applicable, and do not represent the amount paid by the class during periods when reimbursements, waivers or reductions occur.
KAmount does not include the portfolio activity of any underlying mutual funds or exchange-traded funds (ETFs), derivatives or securities that mature within one year from acquisition.
VIP Dynamic Capital Appreciation Portfolio Service Class 2 |
| |
| Years ended December 31, | | 2024 | | 2023 | | 2022 | | 2021 | | 2020 |
Selected Per-Share Data | | | | | | | | | | |
| Net asset value, beginning of period | $ | 15.98 | $ | 13.11 | $ | 18.85 | $ | 16.74 | $ | 12.74 |
| Income from Investment Operations | | | | | | | | | | |
Net investment income (loss) A,B | | (.02) | | .01 | | .03 | | .05 C | | (.01) |
| Net realized and unrealized gain (loss) | | 3.95 | | 3.61 | | (3.70) | | 3.79 | | 4.21 |
| Total from investment operations | | 3.93 | | 3.62 | | (3.67) | | 3.84 | | 4.20 |
| Distributions from net investment income | | (.01) | | (.02) | | (.02) | | (.05) D | | (.01) |
| Distributions from net realized gain | | (.79) | | (.73) | | (2.05) | | (1.67) D | | (.19) |
| Total distributions | | (.80) | | (.75) | | (2.07) | | (1.73) E | | (.20) |
| Net asset value, end of period | $ | 19.11 | $ | 15.98 | $ | 13.11 | $ | 18.85 | $ | 16.74 |
Total Return F,G | | | | 28.72% | | (21.05)% | | 24.27% | | 33.34% |
Ratios to Average Net Assets B,H,I | | | | | | | | | | |
| Expenses before reductions | | .87% | | .91% | | .92% | | .91% | | .93% |
| Expenses net of fee waivers, if any | | | | .90% | | .91% | | .91% | | .93% |
| Expenses net of all reductions | | .87% | | .90% | | .91% | | .91% | | .93% |
| Net investment income (loss) | | (.14)% | | .07% | | .20% | | .26% C | | (.06)% |
| Supplemental Data | | | | | | | | | | |
| Net assets, end of period (000 omitted) | $ | 16,936 | $ | 15,440 | $ | 13,739 | $ | 19,579 | $ | 18,900 |
Portfolio turnover rate J | | | | 51% | | 55% | | 61% | | 62% |
ACalculated based on average shares outstanding during the period.
BNet investment income (loss) is affected by the timing of the declaration of dividends by any underlying mutual funds or exchange-traded funds (ETFs). Net investment income (loss) of any mutual funds or ETFs is not included in the Fund's net investment income (loss) ratio.
CNet investment income per share reflects one or more large, non-recurring dividend(s) which amounted to $.06 per share. Excluding such non-recurring dividend(s), the ratio of net investment income (loss) to average net assets would have been (.07)%.
DThe amount shown reflects reclassifications related to book to tax differences that were made in the year shown.
ETotal distributions per share do not sum due to rounding.
FTotal returns do not reflect charges attributable to your insurance company's separate account. Inclusion of these charges would reduce the total returns shown.
GTotal returns would have been lower if certain expenses had not been reduced during the applicable periods shown.
HFees and expenses of any underlying mutual funds or exchange-traded funds (ETFs) are not included in the Fund's expense ratio. The Fund indirectly bears its proportionate share of these expenses. For additional expense information related to investments in Fidelity Central Funds, please refer to the "Investments in Fidelity Central Funds" note found in the Notes to Financial Statements section of the most recent Annual or Semi-Annual report.
IExpense ratios reflect operating expenses of the class. Expenses before reductions do not reflect amounts reimbursed, waived, or reduced through arrangements with the investment adviser, brokerage services, or other offset arrangements, if applicable, and do not represent the amount paid by the class during periods when reimbursements, waivers or reductions occur.
JAmount does not include the portfolio activity of any underlying mutual funds or exchange-traded funds (ETFs), derivatives or securities that mature within one year from acquisition.
VIP Dynamic Capital Appreciation Portfolio Investor Class |
| |
| Years ended December 31, | | 2024 | | 2023 | | 2022 | | 2021 | | 2020 |
Selected Per-Share Data | | | | | | | | | | |
| Net asset value, beginning of period | $ | 16.71 | $ | 13.68 | $ | 19.56 | $ | 17.32 | $ | 13.17 |
| Income from Investment Operations | | | | | | | | | | |
Net investment income (loss) A,B | | .01 | | .04 | | .06 | | .08 C | | .02 |
| Net realized and unrealized gain (loss) | | 4.14 | | 3.77 | | (3.85) | | 3.93 | | 4.34 |
| Total from investment operations | | 4.15 | | 3.81 | | (3.79) | | 4.01 | | 4.36 |
| Distributions from net investment income | | (.03) | | (.04) | | (.04) | | (.09) D | | (.02) |
| Distributions from net realized gain | | (.79) | | (.73) | | (2.05) | | (1.67) D | | (.19) |
| Total distributions | | (.82) | | (.78) E | | (2.09) | | (1.77) E | | (.21) |
| Net asset value, end of period | $ | 20.04 | $ | 16.71 | $ | 13.68 | $ | 19.56 | $ | 17.32 |
Total Return F,G | | | | 28.92% | | (20.88)% | | 24.46% | | 33.54% |
Ratios to Average Net Assets B,H,I | | | | | | | | | | |
| Expenses before reductions | | .70% | | .74% | | .74% | | .73% | | .76% |
| Expenses net of fee waivers, if any | | | | .73% | | .74% | | .73% | | .76% |
| Expenses net of all reductions | | .70% | | .73% | | .74% | | .73% | | .75% |
| Net investment income (loss) | | .03% | | .24% | | .38% | | .44% C | | .12% |
| Supplemental Data | | | | | | | | | | |
| Net assets, end of period (000 omitted) | $ | 232,324 | $ | 187,650 | $ | 144,809 | $ | 203,577 | $ | 160,175 |
Portfolio turnover rate J | | | | 51% | | 55% | | 61% | | 62% |
ACalculated based on average shares outstanding during the period.
BNet investment income (loss) is affected by the timing of the declaration of dividends by any underlying mutual funds or exchange-traded funds (ETFs). Net investment income (loss) of any mutual funds or ETFs is not included in the Fund's net investment income (loss) ratio.
CNet investment income per share reflects one or more large, non-recurring dividend(s) which amounted to $.06 per share. Excluding such non-recurring dividend(s), the ratio of net investment income (loss) to average net assets would have been .10%.
DThe amount shown reflects reclassifications related to book to tax differences that were made in the year shown.
ETotal distributions per share do not sum due to rounding.
FTotal returns do not reflect charges attributable to your insurance company's separate account. Inclusion of these charges would reduce the total returns shown.
GTotal returns would have been lower if certain expenses had not been reduced during the applicable periods shown.
HFees and expenses of any underlying mutual funds or exchange-traded funds (ETFs) are not included in the Fund's expense ratio. The Fund indirectly bears its proportionate share of these expenses. For additional expense information related to investments in Fidelity Central Funds, please refer to the "Investments in Fidelity Central Funds" note found in the Notes to Financial Statements section of the most recent Annual or Semi-Annual report.
IExpense ratios reflect operating expenses of the class. Expenses before reductions do not reflect amounts reimbursed, waived, or reduced through arrangements with the investment adviser, brokerage services, or other offset arrangements, if applicable, and do not represent the amount paid by the class during periods when reimbursements, waivers or reductions occur.
JAmount does not include the portfolio activity of any underlying mutual funds or exchange-traded funds (ETFs), derivatives or securities that mature within one year from acquisition.
Notes to Financial Statements
For the period ended December 31, 2024
1. Organization.
VIP Dynamic Capital Appreciation Portfolio (the Fund) is a fund of Variable Insurance Products Fund III (the Trust) and is authorized to issue an unlimited number of shares. The Trust is registered under the Investment Company Act of 1940, as amended (the 1940 Act), as an open-end management investment company organized as a Massachusetts business trust. Shares of the Fund may only be purchased by insurance companies for the purpose of funding variable annuity or variable life insurance contracts. The Fund offers the following classes of shares: Initial Class shares, Service Class shares, Service Class 2 shares and Investor Class shares. All classes have equal rights and voting privileges, except for matters affecting a single class.
2. Investments in Fidelity Central Funds.
Funds may invest in Fidelity Central Funds, which are open-end investment companies generally available only to other investment companies and accounts managed by the investment adviser and its affiliates. The Schedule of Investments lists any Fidelity Central Funds held as an investment as of period end, but does not include the underlying holdings of each Fidelity Central Fund. An investing fund indirectly bears its proportionate share of the expenses of the underlying Fidelity Central Funds.
Based on its investment objective, each Fidelity Central Fund may invest or participate in various investment vehicles or strategies that are similar to those of the investing fund. These strategies are consistent with the investment objectives of the investing fund and may involve certain economic risks which may cause a decline in value of each of the Fidelity Central Funds and thus a decline in the value of the investing fund.
| Fidelity Central Fund | Investment Manager | Investment Objective | Investment Practices | Expense RatioA |
| Fidelity Money Market Central Funds | Fidelity Management & Research Company LLC (FMR) | Each fund seeks to obtain a high level of current income consistent with the preservation of capital and liquidity. | Short-term Investments | Less than .005% |
A Expenses expressed as a percentage of average net assets and are as of each underlying Central Fund's most recent annual or semi-annual shareholder report.
A complete unaudited list of holdings for each Fidelity Central Fund is available upon request or at the Securities and Exchange Commission website at www.sec.gov. In addition, the financial statements of the Fidelity Central Funds which contain the significant accounting policies (including investment valuation policies) of those funds, and are not covered by the Report of Independent Registered Public Accounting Firm, are available on the Securities and Exchange Commission website or upon request.
3. Significant Accounting Policies.
The Fund is an investment company and applies the accounting and reporting guidance of the Financial Accounting Standards Board (FASB) Accounting Standards Codification Topic 946 Financial Services - Investment Companies. The financial statements have been prepared in conformity with accounting principles generally accepted in the United States of America (GAAP), which require management to make certain estimates and assumptions at the date of the financial statements. Actual results could differ from those estimates. The Fund operates as a single operating segment. The Fund's income, expenses, assets, and performance are regularly monitored and assessed as a whole by the investment adviser and other individuals responsible for oversight functions of the Trust, using the information presented in the financial statements and financial highlights. Subsequent events, if any, through the date that the financial statements were issued have been evaluated in the preparation of the financial statements. The Fund's Schedule of Investments lists any underlying mutual funds or exchange-traded funds (ETFs) but does not include the underlying holdings of these funds. The following summarizes the significant accounting policies of the Fund:
Investment Valuation. Investments are valued as of 4:00 p.m. Eastern time on the last calendar day of the period. The Board of Trustees (the Board) has designated the Fund's investment adviser as the valuation designee responsible for the fair valuation function and performing fair value determinations as needed. The investment adviser has established a Fair Value Committee (the Committee) to carry out the day-to-day fair valuation responsibilities and has adopted policies and procedures to govern the fair valuation process and the activities of the Committee. In accordance with these fair valuation policies and procedures, which have been approved by the Board, the Fund attempts to obtain prices from one or more third party pricing services or brokers to value its investments. When current market prices, quotations or currency exchange rates are not readily available or reliable, investments will be fair valued in good faith by the Committee, in accordance with the policies and procedures. Factors used in determining fair value vary by investment type and may include market or investment specific events, transaction data, estimated cash flows, and market observations of comparable investments. The frequency that the fair valuation procedures are used cannot be predicted and they may be utilized to a significant extent. The Committee manages the Fund's fair valuation practices and maintains the fair valuation policies and procedures. The Fund's investment adviser reports to the Board information regarding the fair valuation process and related material matters.
The Fund categorizes the inputs to valuation techniques used to value its investments into a disclosure hierarchy consisting of three levels as shown below:
Level 1 - unadjusted quoted prices in active markets for identical investments
Level 2 - other significant observable inputs (including quoted prices for similar investments, interest rates, prepayment speeds, etc.)
Level 3 - unobservable inputs (including the Fund's own assumptions based on the best information available)
Valuation techniques used to value the Fund's investments by major category are as follows:
Equity securities, including restricted securities, for which market quotations are readily available, are valued at the last reported sale price or official closing price as reported by a third party pricing service on the primary market or exchange on which they are traded and are categorized as Level 1 in the hierarchy. In the event there were no sales during the day or closing prices are not available, securities are valued at the last quoted bid price or may be valued using the last available price and are generally categorized as Level 2 in the hierarchy. For foreign equity securities, when market or security specific events arise, comparisons to the valuation of American Depositary Receipts (ADRs), futures contracts, Exchange-Traded Funds (ETFs) and certain indexes as well as quoted prices for similar securities may be used and would be categorized as Level 2 in the hierarchy. For equity securities, including restricted securities, where observable inputs are limited, assumptions about market activity and risk are used and these securities may be categorized as Level 3 in the hierarchy.
Debt securities, including restricted securities, are valued based on evaluated prices received from third party pricing services or from brokers who make markets in such securities. Corporate bonds and preferred securities are valued by pricing services who utilize matrix pricing which considers yield or price of bonds of comparable quality, coupon, maturity and type or by broker-supplied prices. When independent prices are unavailable or unreliable, debt securities may be valued utilizing pricing methodologies which consider similar factors that would be used by third party pricing services. Debt securities are generally categorized as Level 2 in the hierarchy but may be Level 3 depending on the circumstances.
Investments in open-end mutual funds, including the Fidelity Central Funds, are valued at their closing net asset value (NAV) each business day and are categorized as Level 1 in the hierarchy.
Changes in valuation techniques may result in transfers in or out of an assigned level within the disclosure hierarchy. The aggregate value of investments by input level as of December 31, 2024 is included at the end of the Fund's Schedule of Investments.
Foreign Currency. Certain Funds may use foreign currency contracts to facilitate transactions in foreign-denominated securities. Gains and losses from these transactions may arise from changes in the value of the foreign currency or if the counterparties do not perform under the contracts' terms.
Foreign-denominated assets, including investment securities, and liabilities are translated into U.S. dollars at the exchange rates at period end. Purchases and sales of investment securities, income and dividends received, and expenses denominated in foreign currencies are translated into U.S. dollars at the exchange rate in effect on the transaction date.
The effects of exchange rate fluctuations on investments are included with the net realized and unrealized gain (loss) on investment securities. Other foreign currency transactions resulting in realized and unrealized gain (loss) are disclosed separately.
Investment Transactions and Income. For financial reporting purposes, the Fund's investment holdings and NAV include trades executed through the end of the last business day of the period. The NAV per share for processing shareholder transactions is calculated as of the close of business of the New York Stock Exchange (NYSE), normally 4:00 p.m. Eastern time and includes trades executed through the end of the prior business day. Gains and losses on securities sold are determined on the basis of identified cost and include proceeds received from litigation. Commissions paid to certain brokers with whom the investment adviser, or its affiliates, places trades on behalf of a fund include an amount in addition to trade execution, which may be rebated back to a fund. Any such rebates are included in net realized gain (loss) on investments in the Statement of Operations. Dividend income is recorded on the ex-dividend date, except for certain dividends from foreign securities where the ex-dividend date may have passed, which are recorded as soon as the Fund is informed of the ex-dividend date. Non-cash dividends included in dividend income, if any, are recorded at the fair market value of the securities received. Income and capital gain distributions from Fidelity Central Funds, if any, are recorded on the ex-dividend date. Certain distributions received by the Fund represent a return of capital or capital gain. The Fund determines the components of these distributions subsequent to the ex-dividend date, based upon receipt of tax filings or other correspondence relating to the underlying investment. These distributions are recorded as a reduction of cost of investments and/or as a realized gain. Investment income is recorded net of foreign taxes withheld where recovery of such taxes is uncertain. Funds may file withholding tax reclaims in certain jurisdictions to recover a portion of amounts previously withheld. Any withholding tax reclaims income is included in the Statement of Operations in dividends. Any receivables for withholding tax reclaims are included in the Statement of Assets and Liabilities in dividends receivable.
Class Allocations and Expenses. Investment income, realized and unrealized capital gains and losses, common expenses of a fund, and certain fund-level expense reductions, if any, are allocated daily on a pro-rata basis to each class based on the relative net assets of each class to the total net assets of a fund. Each class differs with respect to transfer agent and distribution and service plan fees incurred, as applicable. Certain expense reductions may also differ by class, if applicable. For the reporting period, the allocated portion of income and expenses to each class as a percent of its average net assets may vary due to the timing of recording these transactions in relation to fluctuating net assets of the classes. Expenses directly attributable to a fund are charged to that fund. Expenses attributable to more than one fund are allocated among the respective funds on the basis of relative net assets or other appropriate methods. Expenses included in the accompanying financial statements reflect the expenses of that fund and do not include any expenses associated with any underlying mutual funds or exchange-traded funds (ETFs). Although not included in a fund's expenses, a fund indirectly bears its proportionate share of these expenses through the net asset value of each underlying mutual fund or exchange-traded fund (ETF). Expense estimates are accrued in the period to which they relate and adjustments are made when actual amounts are known.
Income Tax Information and Distributions to Shareholders. Each year, the Fund intends to qualify as a regulated investment company under Subchapter M of the Internal Revenue Code, including distributing substantially all of its taxable income and realized gains. As a result, no provision for U.S. Federal income taxes is required. As of December 31, 2024, the Fund did not have any unrecognized tax benefits in the financial statements; nor is the Fund aware of any tax positions for which it is reasonably possible that the total amounts of unrecognized tax benefits will significantly change in the next twelve months. The Fund files a U.S. federal tax return, in addition to state and local tax returns as required. The Fund's federal income tax returns are subject to examination by the Internal Revenue Service (IRS) for a period of three fiscal years after they are filed. State and local tax returns may be subject to examination for an additional fiscal year depending on the jurisdiction. Foreign taxes are provided for based on the Fund's understanding of the tax rules and rates that exist in the foreign markets in which it invests.
Distributions are declared and recorded on the ex-dividend date. Income and capital gain distributions are declared separately for each class. Income and capital gain distributions are determined in accordance with income tax regulations, which may differ from GAAP.
Capital accounts within the financial statements are adjusted for permanent book-tax differences. These adjustments have no impact on net assets or the results of operations. Capital accounts are not adjusted for temporary book-tax differences which will reverse in a subsequent period.
Book-tax differences are primarily due to foreign currency transactions, passive foreign investment companies (PFIC),contingent interest, partnerships and losses deferred due to wash sales.
As of period end, the cost and unrealized appreciation (depreciation) in securities, and derivatives if applicable, for federal income tax purposes were as follows:
| Gross unrealized appreciation | $90,172,847 |
| Gross unrealized depreciation | (7,045,557) |
| Net unrealized appreciation (depreciation) | $83,127,290 |
| Tax Cost | $198,051,988 |
The tax-based components of distributable earnings as of period end were as follows:
| Undistributed ordinary income | $664,831 |
| Undistributed long-term capital gain | $42,317,768 |
| Net unrealized appreciation (depreciation) on securities and other investments | $83,126,531 |
The tax character of distributions paid was as follows:
| | December 31, 2024 | December 31, 2023 |
| Ordinary Income | $2,276,399 | $ 580,933 |
| Long-term Capital Gains | 9,114,389 | 9,679,823 |
| Total | $11,390,788 | $ 10,260,756 |
Restricted Securities (including Private Placements). Funds may invest in securities that are subject to legal or contractual restrictions on resale. These securities generally may be resold in transactions exempt from registration or to the public if the securities are registered. Disposal of these securities may involve time-consuming negotiations and expense, and prompt sale at an acceptable price may be difficult. Information regarding restricted securities held at period end is included at the end of the Schedule of Investments, if applicable.
New Accounting Pronouncement. FASB Accounting Standards Update (ASU) 2023-07 Segment Reporting (Topic 280): Improvements to Reportable Segment Disclosures became effective in this reporting period. ASU 2023-07 enhances segment information disclosure in the notes to financial statements.
4. Purchases and Sales of Investments.
Purchases and sales of securities, other than short-term securities and in-kind transactions, as applicable, are noted in the table below.
| | Purchases ($) | Sales ($) |
| VIP Dynamic Capital Appreciation Portfolio | 161,285,561 | 165,679,057 |
5. Fees and Other Transactions with Affiliates.
Management Fee. Fidelity Management & Research Company LLC (the investment adviser) and its affiliates provide the Fund with investment management related services for which the Fund pays a monthly management fee.
Effective March 1, 2024, the Fund's management contract was amended to incorporate administrative services previously covered under separate services agreements (Transfer Agent and Accounting agreements). The amended contract incorporates a management fee rate that may vary by class. The investment adviser or an affiliate pays certain expenses of managing and operating the Fund out of each class's management fee. Each class of the Fund pays a management fee to the investment adviser. The management fee is calculated and paid to the investment adviser every month. When determining a class's management fee, a mandate rate is calculated based on the monthly average net assets of a group of funds advised by FMR within a designated asset class. A discount rate is subtracted from the mandate rate once the Fund's monthly average net assets reach a certain level. The mandate rate and discount rate may vary by class. The annual management fee rate for a class of shares of the Fund is the lesser of (1) the class's mandate rate reduced by the class's discount rate (if applicable) or (2) the amount set forth in the following table.
| | Maximum Management Fee Rate % |
| Initial Class | .58 |
| Service Class | .58 |
| Service Class 2 | .58 |
| Investor Class | .66 |
One-twelfth of the management fee rate for a class is applied to the average net assets of the class for the month, giving a dollar amount which is the management fee for the class for that month. A different management fee rate may be applicable to each class of the Fund. The difference between classes is the result of separate arrangements for class-level services and/or waivers of certain expenses. It is not the result of any difference in advisory or custodial fees or other expenses related to the management of the Fund's assets, which do not vary by class. For the portion of the reporting period on or after March 1, 2024, the total annualized management fee rates were as follows:
| | Total Management Fee Rate % |
| Initial Class | .58 |
| Service Class | .58 |
| Service Class 2 | .58 |
| Investor Class | .66 |
Prior to March 1, 2024, the management fee was the sum of an individual fund fee rate that was based on an annual rate of .30% of the Fund's average net assets and an annualized group fee rate that averaged .22% during the period. The group fee rate was based upon the monthly average net assets of a group of registered investment companies with which the investment adviser has management contracts. The group fee rate decreased as assets under management increased and increased as assets under management decreased. For the portion of the reporting period prior to March 1, 2024, the total annualized management fee rate was .52%.
Effective March 1, 2024, the Fund's sub-advisory agreements with FMR Investment Management (UK) Limited, Fidelity Management & Research (Hong Kong) Limited, and Fidelity Management & Research (Japan) Limited were amended to provide that the investment adviser pays each sub-adviser monthly fees equal to 110% of the sub-adviser's costs for providing sub-advisory services.
Distribution and Service Plan Fees. In accordance with Rule 12b-1 of the 1940 Act, the Fund has adopted separate 12b-1 Plans for each Service Class of shares. Each Service Class pays Fidelity Distributors Company LLC (FDC), an affiliate of the investment adviser, a service fee. For the period, the service fee is based on an annual rate of .10% of Service Class' average net assets and .25% of Service Class 2's average net assets.
For the period, total fees, all of which were re-allowed to insurance companies for the distribution of shares and providing shareholder support services, were as follows:
| Service Class | $554 |
| Service Class 2 | 42,345 |
| | $42,899 |
Transfer Agent Fees. Fidelity Investments Institutional Operations Company LLC (FIIOC), an affiliate of the investment adviser, is the Fund's transfer, dividend disbursing, and shareholder servicing agent. Effective March 1, 2024, the Fund's management contract was amended to incorporate transfer agent services and associated fees previously covered under a separate services agreement.
During the period January 1, 2024 through February 29, 2024, the transfer agent fees for each class were a fixed annual rate of class-level average net assets as follows:
| | Amount ($) | % of Class-Level Average Net Assets |
| Initial Class | 2,797 | .0630 |
| Service Class | 53 | .0630 |
| Service Class 2 | 1,680 | .0630 |
| Investor Class | 45,626 | .1390 |
| | 50,156 | |
Accounting Fees. Fidelity Service Company, Inc. (FSC), an affiliate of the investment adviser, maintains the Fund's accounting records. Effective March 1, 2024, the Fund's management contract was amended to incorporate accounting services and associated fees previously covered under a separate services agreement.
During the period January 1, 2024 through February 29, 2024, the accounting fees were a fixed annual rate of average net assets as follows:
| | % of Average Net Assets |
| VIP Dynamic Capital Appreciation Portfolio | .0353 |
Brokerage Commissions. A portion of portfolio transactions were placed with brokerage firms which are affiliates of the investment adviser. Brokerage commissions are included in net realized gain (loss) and change in net unrealized appreciation (depreciation) in the Statement of Operations. The commissions paid to these affiliated firms were as follows:
| | Amount ($) |
| VIP Dynamic Capital Appreciation Portfolio | 1,618 |
Interfund Trades. Funds may purchase from or sell securities to other Fidelity Funds under procedures adopted by the Board. The procedures have been designed to ensure these interfund trades are executed in accordance with Rule 17a-7 of the 1940 Act. Any interfund trades are included within the respective purchases and sales amounts shown in the Purchases and Sales of Investments note. Interfund trades during the period are noted in the table below.
| | Purchases ($) | Sales ($) | Realized Gain (Loss) ($) |
| VIP Dynamic Capital Appreciation Portfolio | 5,270,694 | 7,839,038 | 2,471,482 |
6. Committed Line of Credit.
Certain Funds participate with other funds managed by the investment adviser or an affiliate in a $4.25 billion credit facility (the "line of credit") to be utilized for temporary or emergency purposes to fund shareholder redemptions or for other short-term liquidity purposes.
Commitment fees are charged based on the unused amount of the line of credit at an annual rate of .10%, and then allocated to each participating fund based on its pro-rata portion of the line of credit. The commitment fees are reflected in Miscellaneous expenses on the Statement of Operations, and are listed below.
Interest is charged to a participating fund based on its borrowings at an annual rate of .75% plus the highest of (i) daily SOFR plus a .10% spread adjustment, (ii) Federal Funds Effective Rate, or (iii) Overnight Bank Funding Rate. During the period, there were no borrowings on this line of credit.
The line of credit agreement will expire in March 2025 unless extended or renewed.| | Amount ($) |
| VIP Dynamic Capital Appreciation Portfolio | 397 |
7. Security Lending.
Funds lend portfolio securities from time to time in order to earn additional income. Lending agents are used, including National Financial Services (NFS), an affiliate of the investment adviser. Pursuant to a securities lending agreement, NFS will receive a fee, which is capped at 9.9% of a fund's daily lending revenue, for its services as lending agent. A fund may lend securities to certain qualified borrowers, including NFS. On the settlement date of the loan, a fund receives collateral (in the form of U.S. Treasury obligations, letters of credit and/or cash) against the loaned securities and maintains collateral in an amount not less than 100% of the market value of the loaned securities during the period of the loan. The market value of the loaned securities is determined at the close of business of a fund and any additional required collateral is delivered to a fund on the next business day. A fund or borrower may terminate the loan at any time, and if the borrower defaults on its obligation to return the securities loaned because of insolvency or other reasons, a fund may apply collateral received from the borrower against the obligation. A fund may experience delays and costs in recovering the securities loaned. Any cash collateral received is invested in the Fidelity Securities Lending Cash Central Fund. Any loaned securities are identified as such in the Schedule of Investments, and the value of loaned securities and cash collateral at period end, as applicable, are presented in the Statement of Assets and Liabilities. Security lending income represents the income earned on investing cash collateral, less rebates paid to borrowers and any lending agent fees associated with the loan, plus any premium payments received for lending certain types of securities. Security lending income is presented in the Statement of Operations as a component of income from Fidelity Central Funds. Affiliated security lending activity, if any, was as follows:
| | Total Security Lending Fees Paid to NFS ($) | Security Lending Income From Securities Loaned to NFS ($) | Value of Securities Loaned to NFS at Period End ($) |
| VIP Dynamic Capital Appreciation Portfolio | 380 | 44 | - |
8. Expense Reductions.
During the period the investment adviser or an affiliate reimbursed and/or waived a portion of fund-level operating expenses in the amount of $10,475.
9. Distributions to Shareholders.
Distributions to shareholders of each class were as follows:
| | Year ended December 31, 2024 | Year ended December 31, 2023 |
| VIP Dynamic Capital Appreciation Portfolio | | |
| Distributions to shareholders | | |
| Initial Class | $1,278,890 | $1,184,304 |
| Service Class | 23,887 | 22,370 |
| Service Class 2 | 757,309 | 780,644 |
| Investor Class | 9,330,702 | 8,273,438 |
Total | $11,390,788 | $10,260,756 |
10. Share Transactions.
Transactions for each class of shares were as follows and may contain in-kind transactions:
| | Shares | Shares | Dollars | Dollars |
| | Year ended December 31, 2024 | Year ended December 31, 2023 | Year ended December 31, 2024 | Year ended December 31, 2023 |
| VIP Dynamic Capital Appreciation Portfolio | | | | |
| Initial Class | | | | |
| Shares sold | 146,502 | 126,656 | $2,672,846 | $1,888,987 |
| Reinvestment of distributions | 70,625 | 83,842 | 1,278,890 | 1,184,304 |
| Shares redeemed | (223,729) | (229,809) | (4,197,172) | (3,314,065) |
| Net increase (decrease) | (6,602) | (19,311) | $(245,436) | $(240,774) |
| Service Class | | | | |
| Shares sold | 367 | 2,586 | $6,816 | $37,591 |
| Reinvestment of distributions | 1,312 | 1,575 | 23,299 | 21,814 |
| Shares redeemed | (1,090) | (1,605) | (20,191) | (23,743) |
| Net increase (decrease) | 589 | 2,556 | $9,924 | $35,662 |
| Service Class 2 | | | | |
| Shares sold | 72,816 | 61,533 | $1,281,455 | $874,564 |
| Reinvestment of distributions | 44,203 | 58,257 | 757,309 | 780,644 |
| Shares redeemed | (196,947) | (201,448) | (3,530,373) | (2,867,656) |
| Net increase (decrease) | (79,928) | (81,658) | $(1,491,609) | $(1,212,448) |
| Investor Class | | | | |
| Shares sold | 1,057,335 | 996,933 | $19,772,771 | $15,051,000 |
| Reinvestment of distributions | 517,330 | 588,430 | 9,330,701 | 8,273,438 |
| Shares redeemed | (1,209,906) | (941,647) | (22,984,674) | (13,954,928) |
| Net increase (decrease) | 364,759 | 643,716 | $6,118,798 | $9,369,510 |
11. Other.
A fund's organizational documents provide former and current trustees and officers with a limited indemnification against liabilities arising in connection with the performance of their duties to the fund. In the normal course of business, a fund may also enter into contracts that provide general indemnifications. A fund's maximum exposure under these arrangements is unknown as this would be dependent on future claims that may be made against a fund. The risk of material loss from such claims is considered remote.
At the end of the period, the investment adviser or its affiliates were owners of record of more than 10% of the outstanding shares as follows:
| Fund | Affiliated % |
VIP Dynamic Capital Appreciation Portfolio | 93 |
12. Risk and Uncertainties.
Many factors affect a fund's performance. Developments that disrupt global economies and financial markets, such as pandemics, epidemics, outbreaks of infectious diseases, war, terrorism, and environmental disasters, may significantly affect a fund's investment performance. The effects of these developments to a fund will be impacted by the types of securities in which a fund invests, the financial condition, industry, economic sector, and geographic location of an issuer, and a fund's level of investment in the securities of that issuer. Significant concentrations in security types, issuers, industries, sectors, and geographic locations may magnify the factors that affect a fund's performance.
Report of Independent Registered Public Accounting Firm
To the Board of Trustees of Variable Insurance Products Fund III and the Shareholders of VIP Dynamic Capital Appreciation Portfolio:
Opinion on the Financial Statements and Financial Highlights
We have audited the accompanying statement of assets and liabilities of VIP Dynamic Capital Appreciation Portfolio (the "Fund"), a fund of Variable Insurance Products Fund III, including the schedule of investments, as of December 31, 2024, the related statement of operations for the year then ended, the statement of changes in net assets for each of the two years in the period then ended, the financial highlights for each of the five years in the period then ended, and the related notes. In our opinion, the financial statements and financial highlights present fairly, in all material respects, the financial position of the Fund as of December 31, 2024, and the results of its operations for the year then ended, the changes in its net assets for each of the two years in the period then ended, and the financial highlights for each of the five years in the period then ended in conformity with accounting principles generally accepted in the United States of America.
Basis for Opinion
These financial statements and financial highlights are the responsibility of the Fund's management. Our responsibility is to express an opinion on the Fund's financial statements and financial highlights based on our audits. We are a public accounting firm registered with the Public Company Accounting Oversight Board (United States) (PCAOB) and are required to be independent with respect to the Fund in accordance with the U.S. federal securities laws and the applicable rules and regulations of the Securities and Exchange Commission and the PCAOB.
We conducted our audits in accordance with the standards of the PCAOB. Those standards require that we plan and perform the audit to obtain reasonable assurance about whether the financial statements and financial highlights are free of material misstatement, whether due to error or fraud. The Fund is not required to have, nor were we engaged to perform, an audit of its internal control over financial reporting. As part of our audits, we are required to obtain an understanding of internal control over financial reporting but not for the purpose of expressing an opinion on the effectiveness of the Fund's internal control over financial reporting. Accordingly, we express no such opinion.
Our audits included performing procedures to assess the risks of material misstatement of the financial statements and financial highlights, whether due to error or fraud, and performing procedures that respond to those risks. Such procedures included examining, on a test basis, evidence regarding the amounts and disclosures in the financial statements and financial highlights. Our audits also included evaluating the accounting principles used and significant estimates made by management, as well as evaluating the overall presentation of the financial statements and financial highlights. Our procedures included confirmation of securities owned as of December 31, 2024, by correspondence with the custodian and brokers; when replies were not received from brokers, we performed other auditing procedures. We believe that our audits provide a reasonable basis for our opinion.
/s/ Deloitte & Touche LLP
Boston, Massachusetts
February 13, 2025
We have served as the auditor of one or more of the Fidelity investment companies since 1999.
Distributions
(Unaudited)The dividend and capital gains distributions for the fund(s) are available on Fidelity.com or Institutional.Fidelity.com.
The fund hereby designates as a capital gain dividend with respect to the taxable year ended December 31, 2024, $42,326,474, or, if subsequently determined to be different, the net capital gain of such year.
The fund designates $47,777 of distributions paid during the fiscal year ended 2024 as qualifying to be taxed as section 163(j) interest dividends.
Initial Class designates 93% and 62%; Service Class designates 100% and 67%; Service Class 2 designates 100% and 75%; and Investor Class designates 100% and 66%; of the dividends distributed in February and December, respectively during the fiscal year as qualifying for the dividends-received deduction for corporate shareholders.
Item 8: Changes in and Disagreements with Accountants for Open-End Management Investment Companies
(Unaudited)
Note: This is not applicable for any fund included in this document.
Item 9: Proxy Disclosures for Open-End Management Investment Companies
(Unaudited)
| A special meeting of shareholders was held on July 16, 2024. The results of votes taken among shareholders on the proposal before them are reported below. Each vote reported represents one dollar of net asset value held on the record date for the meeting. |
| Proposal 1 |
| To elect a Board of Trustees. |
| | # of Votes | % of Votes |
| Bettina Doulton |
| Affirmative | 19,815,631,510.17 | 96.35 |
| Withheld | 749,708,334.02 | 3.65 |
| TOTAL | 20,565,339,844.19 | 100.00 |
| Robert A. Lawrence |
| Affirmative | 19,766,714,617.58 | 96.12 |
| Withheld | 798,625,226.62 | 3.88 |
| TOTAL | 20,565,339,844.19 | 100.00 |
| Vijay C. Advani |
| Affirmative | 19,788,320,252.27 | 96.22 |
| Withheld | 777,019,591.92 | 3.78 |
| TOTAL | 20,565,339,844.19 | 100.00 |
| Thomas P. Bostick |
| Affirmative | 19,780,566,370.66 | 96.18 |
| Withheld | 784,773,473.53 | 3.82 |
| TOTAL | 20,565,339,844.19 | 100.00 |
| Donald F. Donahue |
| Affirmative | 19,723,882,404.02 | 95.91 |
| Withheld | 841,457,440.18 | 4.09 |
| TOTAL | 20,565,339,844.19 | 100.00 |
| Vicki L. Fuller |
| Affirmative | 19,823,019,040.62 | 96.39 |
| Withheld | 742,320,803.57 | 3.61 |
| TOTAL | 20,565,339,844.19 | 100.00 |
| Patricia L. Kampling |
| Affirmative | 19,837,563,936.04 | 96.46 |
| Withheld | 727,775,908.15 | 3.54 |
| TOTAL | 20,565,339,844.19 | 100.00 |
| Thomas A. Kennedy |
| Affirmative | 19,789,564,999.11 | 96.23 |
| Withheld | 775,774,845.08 | 3.77 |
| TOTAL | 20,565,339,844.19 | 100.00 |
| Oscar Munoz |
| Affirmative | 19,772,385,801.51 | 96.14 |
| Withheld | 792,954,042.68 | 3.86 |
| TOTAL | 20,565,339,844.19 | 100.00 |
| Karen B. Peetz |
| Affirmative | 19,804,495,604.67 | 96.30 |
| Withheld | 760,844,239.52 | 3.70 |
| TOTAL | 20,565,339,844.19 | 100.00 |
| David M. Thomas |
| Affirmative | 19,717,117,994.71 | 95.88 |
| Withheld | 848,221,849.48 | 4.12 |
| TOTAL | 20,565,339,844.19 | 100.00 |
| Susan Tomasky |
| Affirmative | 19,783,626,171.89 | 96.20 |
| Withheld | 781,713,672.31 | 3.80 |
| TOTAL | 20,565,339,844.19 | 100.00 |
| Michael E. Wiley |
| Affirmative | 19,728,139,900.50 | 95.93 |
| Withheld | 837,199,943.69 | 4.07 |
| TOTAL | 20,565,339,844.19 | 100.00 |
| | | |
| Proposal 1 reflects trust-wide proposal and voting results. |
Item 10: Remuneration Paid to Directors, Officers, and others of Open-End Management Investment Companies
(Unaudited)
Note: This information is disclosed as part of the financial statements for each Fund as part of Item 7: Financial Statements and Financial Highlights for Open-End Management Investment companies.
Item 11: Statement Regarding Basis for Approval of Investment Advisory Contract
(Unaudited)
Note: This is not applicable for any fund included in this document.
1.751799.124
VIPDCA-ANN-0325
Fidelity® Variable Insurance Products:
VIP Growth Opportunities Portfolio
Annual Report
December 31, 2024
Contents
To view a fund's proxy voting guidelines and proxy voting record for the 12-month period ended June 30, visit http://www.fidelity.com/proxyvotingresults or visit the Securities and Exchange Commission's (SEC) web site at http://www.sec.gov.
You may also call 1-877-208-0098 to request a free copy of the proxy voting guidelines.
Fidelity® Variable Insurance Products are separate account options which are purchased through a variable insurance contract.
Standard & Poor's, S&P and S&P 500 are registered service marks of The McGraw-Hill Companies, Inc. and have been licensed for use by Fidelity Distributors Corporation.
Other third-party marks appearing herein are the property of their respective owners.
All other marks appearing herein are registered or unregistered trademarks or service marks of FMR LLC or an affiliated company. © 2025 FMR LLC. All rights reserved.
This report and the financial statements contained herein are submitted for the general information of the shareholders of the Fund. This report is not authorized for distribution to prospective investors in the Fund unless preceded or accompanied by an effective prospectus.
A fund files its complete schedule of portfolio holdings with the SEC for the first and third quarters of each fiscal year on Form N-PORT. Forms N-PORT are available on the SEC's web site at http://www.sec.gov. A fund's Forms N-PORT may be reviewed and copied at the SEC's Public Reference Room in Washington, DC. Information regarding the operation of the SEC's Public Reference Room may be obtained by calling 1-800-SEC-0330.
For a complete list of a fund's portfolio holdings, view the most recent holdings listing, semiannual report, or annual report on Fidelity's web site at http://www.fidelity.com, http://www.institutional.fidelity.com, or http://www.401k.com, as applicable.
NOT FDIC INSURED •MAY LOSE VALUE •NO BANK GUARANTEE
Neither the Fund nor Fidelity Distributors Corporation is a bank.
Item 7: Consolidated Financial Statements and Consolidated Financial Highlights for Open-End Management Investment Companies (Annual Report)
VIP Growth Opportunities Portfolio
Consolidated Schedule of Investments December 31, 2024
Showing Percentage of Net Assets
| Common Stocks - 97.9% |
| | | Shares | Value ($) |
| AUSTRALIA - 0.0% | | | |
| Information Technology - 0.0% | | | |
| Software - 0.0% | | | |
| Canva Inc Class A (b)(c) | | 496 | 634,925 |
| CANADA - 0.5% | | | |
| Information Technology - 0.5% | | | |
| IT Services - 0.5% | | | |
| Shopify Inc Class A (United States) (d) | | 172,400 | 18,331,292 |
| CHINA - 1.0% | | | |
| Information Technology - 1.0% | | | |
| Semiconductors & Semiconductor Equipment - 1.0% | | | |
| NXP Semiconductors NV | | 177,677 | 36,930,164 |
| DENMARK - 0.2% | | | |
| Health Care - 0.2% | | | |
| Biotechnology - 0.1% | | | |
| Ascendis Pharma A/S ADR (d) | | 16,125 | 2,219,929 |
| Pharmaceuticals - 0.1% | | | |
| Novo Nordisk A/S Series B | | 60,700 | 5,237,307 |
| TOTAL DENMARK | | | 7,457,236 |
| GERMANY - 0.4% | | | |
| Information Technology - 0.4% | | | |
| Software - 0.4% | | | |
| SAP SE | | 68,800 | 16,923,031 |
| INDIA - 0.0% | | | |
| Consumer Discretionary - 0.0% | | | |
| Broadline Retail - 0.0% | | | |
| Lenskart Solutions Pvt Ltd (b)(c)(d) | | 461,230 | 1,393,259 |
| Information Technology - 0.0% | | | |
| Software - 0.0% | | | |
| Pine Labs Pvt Ltd (b)(c)(d) | | 2,299 | 977,948 |
| TOTAL INDIA | | | 2,371,207 |
| IRELAND - 0.2% | | | |
| Financials - 0.2% | | | |
| Financial Services - 0.2% | | | |
| Circle Internet Financial LLC (b) | | 214,805 | 6,506,443 |
| Circle Internet Financial LLC (b) | | 20,489 | 620,612 |
| | | | |
| TOTAL IRELAND | | | 7,127,055 |
| ISRAEL - 0.0% | | | |
| Information Technology - 0.0% | | | |
| Semiconductors & Semiconductor Equipment - 0.0% | | | |
| Xsight Labs Ltd warrants 1/11/2034 (b)(c)(d) | | 8,155 | 22,997 |
| Xsight Labs Ltd warrants 12/30/2031 (b)(c)(d) | | 11,726 | 18,292 |
| | | | |
| TOTAL ISRAEL | | | 41,289 |
| NETHERLANDS - 0.2% | | | |
| Health Care - 0.2% | | | |
| Biotechnology - 0.2% | | | |
| Argenx SE ADR (d) | | 15,331 | 9,428,565 |
| SINGAPORE - 1.4% | | | |
| Communication Services - 1.4% | | | |
| Entertainment - 1.4% | | | |
| Sea Ltd Class A ADR (d) | | 511,988 | 54,321,927 |
| TAIWAN - 1.6% | | | |
| Information Technology - 1.6% | | | |
| Semiconductors & Semiconductor Equipment - 1.6% | | | |
| Taiwan Semiconductor Manufacturing Co Ltd ADR | | 310,000 | 61,221,900 |
| UNITED KINGDOM - 0.2% | | | |
| Financials - 0.1% | | | |
| Banks - 0.1% | | | |
| Starling Bank Ltd Class D (b)(c)(d) | | 1,101,900 | 3,490,056 |
| Industrials - 0.1% | | | |
| Aerospace & Defense - 0.1% | | | |
| Rolls-Royce Holdings PLC ADR (d)(e) | | 582,600 | 4,144,791 |
| TOTAL UNITED KINGDOM | | | 7,634,847 |
| UNITED STATES - 92.2% | | | |
| Communication Services - 19.5% | | | |
| Entertainment - 5.3% | | | |
| Netflix Inc (d) | | 82,000 | 73,088,240 |
| ROBLOX Corp Class A (d) | | 140,200 | 8,111,972 |
| Roku Inc Class A (d) | | 1,653,964 | 122,955,684 |
| | | | 204,155,896 |
| Interactive Media & Services - 12.7% | | | |
| Alphabet Inc Class A | | 350,920 | 66,429,156 |
| Alphabet Inc Class C | | 891,460 | 169,769,642 |
| Epic Games Inc (b)(c)(d) | | 8,216 | 5,574,638 |
| Meta Platforms Inc Class A | | 408,179 | 238,992,887 |
| Reddit Inc Class A | | 62,400 | 10,198,656 |
| | | | 490,964,979 |
| Media - 0.0% | | | |
| Trade Desk Inc (The) Class A (d) | | 11,600 | 1,363,348 |
| Wireless Telecommunication Services - 1.5% | | | |
| T-Mobile US Inc | | 270,888 | 59,793,108 |
| Consumer Discretionary - 12.3% | | | |
| Automobiles - 2.5% | | | |
| General Motors Co | | 60,200 | 3,206,854 |
| Neutron Holdings Inc (b)(c)(d) | | 106,587 | 5,809 |
| Rad Power Bikes Inc (b)(c)(d) | | 56,834 | 11,935 |
| Rad Power Bikes Inc warrants 10/6/2033 (b)(c)(d) | | 69,642 | 36,214 |
| Rivian Automotive Inc Class A (d) | | 3,500 | 46,550 |
| Tesla Inc (d) | | 229,375 | 92,630,800 |
| | | | 95,938,162 |
| Broadline Retail - 5.6% | | | |
| Amazon.com Inc (d) | | 987,260 | 216,594,971 |
| Hotels, Restaurants & Leisure - 1.3% | | | |
| Chipotle Mexican Grill Inc (d) | | 114,500 | 6,904,350 |
| Domino's Pizza Inc | | 8,100 | 3,400,056 |
| Hilton Worldwide Holdings Inc | | 60,300 | 14,903,748 |
| Sonder Holdings Inc Stage 1 rights (b)(d) | | 2,658 | 0 |
| Sonder Holdings Inc Stage 2 rights (b)(d) | | 2,658 | 0 |
| Sonder Holdings Inc Stage 3 rights (b)(d) | | 2,657 | 0 |
| Sonder Holdings Inc Stage 4 rights (b)(d) | | 2,657 | 0 |
| Sonder Holdings Inc Stage 5 rights (b)(d) | | 2,657 | 0 |
| Sonder Holdings Inc Stage 5 rights (b)(d) | | 2,657 | 0 |
| Starbucks Corp | | 275,000 | 25,093,750 |
| | | | 50,301,904 |
| Specialty Retail - 2.9% | | | |
| Carvana Co Class A (d) | | 229,400 | 46,650,784 |
| Floor & Decor Holdings Inc Class A (d)(e) | | 167,100 | 16,659,870 |
| Lowe's Cos Inc | | 144,500 | 35,662,600 |
| Wayfair Inc Class A (d) | | 70,874 | 3,141,136 |
| Williams-Sonoma Inc | | 64,000 | 11,851,520 |
| | | | 113,965,910 |
| Textiles, Apparel & Luxury Goods - 0.0% | | | |
| Bombas LLC (b)(c) | | 745,906 | 1,954,274 |
TOTAL CONSUMER DISCRETIONARY | | | 478,755,221 |
| | | | |
| Consumer Staples - 1.2% | | | |
| Consumer Staples Distribution & Retail - 1.1% | | | |
| BJ's Wholesale Club Holdings Inc (d) | | 337,800 | 30,182,430 |
| Walmart Inc | | 145,100 | 13,109,785 |
| | | | 43,292,215 |
| Food Products - 0.0% | | | |
| Bowery Farming Inc (b)(d) | | 88,303 | 1 |
| Bowery Farming Inc warrants (b)(c)(d) | | 31,026 | 0 |
| | | | 1 |
| Tobacco - 0.1% | | | |
| JUUL Labs Inc Class A (b)(c)(d) | | 2,980,637 | 3,010,443 |
| JUUL Labs Inc Class B (b)(c)(d) | | 560 | 566 |
| | | | 3,011,009 |
TOTAL CONSUMER STAPLES | | | 46,303,225 |
| | | | |
| Financials - 6.7% | | | |
| Capital Markets - 1.8% | | | |
| Blue Owl Capital Inc Class A | | 573,600 | 13,341,936 |
| Coinbase Global Inc Class A (d) | | 130,300 | 32,353,490 |
| LPL Financial Holdings Inc | | 73,200 | 23,900,532 |
| | | | 69,595,958 |
| Financial Services - 4.9% | | | |
| Apollo Global Management Inc | | 231,400 | 38,218,024 |
| Block Inc Class A (d) | | 227,000 | 19,292,730 |
| Fiserv Inc (d) | | 194,400 | 39,933,648 |
| Mastercard Inc Class A | | 15,100 | 7,951,207 |
| Visa Inc Class A | | 269,933 | 85,309,625 |
| | | | 190,705,234 |
| Insurance - 0.0% | | | |
| Progressive Corp/The | | 1,600 | 383,376 |
TOTAL FINANCIALS | | | 260,684,568 |
| | | | |
| Health Care - 4.3% | | | |
| Biotechnology - 0.8% | | | |
| AbbVie Inc | | 1,800 | 319,860 |
| Alnylam Pharmaceuticals Inc (d) | | 21,951 | 5,165,290 |
| Cytokinetics Inc (d) | | 159,900 | 7,521,696 |
| Nuvalent Inc Class A (d) | | 56,384 | 4,413,740 |
| Vaxcyte Inc (d) | | 167,004 | 13,670,947 |
| Viking Therapeutics Inc (d) | | 37,900 | 1,525,096 |
| | | | 32,616,629 |
| Health Care Equipment & Supplies - 1.2% | | | |
| Blink Health LLC Class A1 (b)(c)(d) | | 11,090 | 380,276 |
| Boston Scientific Corp (d) | | 503,592 | 44,980,838 |
| | | | 45,361,114 |
| Pharmaceuticals - 2.3% | | | |
| Eli Lilly & Co | | 102,500 | 79,130,000 |
| Merck & Co Inc | | 65,500 | 6,515,940 |
| Structure Therapeutics Inc ADR (d) | | 40,700 | 1,103,784 |
| | | | 86,749,724 |
TOTAL HEALTH CARE | | | 164,727,467 |
| | | | |
| Industrials - 3.5% | | | |
| Aerospace & Defense - 0.7% | | | |
| Axon Enterprise Inc (d) | | 18,500 | 10,994,920 |
| GE Aerospace | | 32,000 | 5,337,280 |
| Howmet Aerospace Inc | | 7,400 | 809,338 |
| Space Exploration Technologies Corp (b)(c)(d) | | 21,965 | 4,063,525 |
| Space Exploration Technologies Corp Class C (b)(c)(d) | | 2,403 | 444,555 |
| TransDigm Group Inc | | 3,100 | 3,928,568 |
| | | | 25,578,186 |
| Building Products - 2.0% | | | |
| Builders FirstSource Inc (d) | | 545,200 | 77,925,436 |
| Commercial Services & Supplies - 0.2% | | | |
| ACV Auctions Inc Class A (d) | | 496,400 | 10,722,240 |
| Ground Transportation - 0.6% | | | |
| Uber Technologies Inc (d) | | 370,493 | 22,348,138 |
| Machinery - 0.0% | | | |
| Symbotic Inc Class A (d)(e) | | 36,300 | 860,673 |
TOTAL INDUSTRIALS | | | 137,434,673 |
| | | | |
| Information Technology - 43.5% | | | |
| Communications Equipment - 0.7% | | | |
| Arista Networks Inc | | 241,400 | 26,681,942 |
| Electronic Equipment, Instruments & Components - 1.6% | | | |
| Flex Ltd (d) | | 1,626,452 | 62,439,492 |
| IT Services - 0.4% | | | |
| MongoDB Inc Class A (d) | | 73,500 | 17,111,535 |
| Semiconductors & Semiconductor Equipment - 21.7% | | | |
| Advanced Micro Devices Inc (d) | | 306,600 | 37,034,214 |
| Analog Devices Inc | | 1,500 | 318,690 |
| ARM Holdings PLC ADR (d) | | 300 | 37,008 |
| Astera Labs Inc (d) | | 44,000 | 5,827,800 |
| Broadcom Inc | | 800,600 | 185,611,104 |
| Credo Technology Group Holding Ltd (d) | | 6,079 | 408,570 |
| Marvell Technology Inc | | 531,170 | 58,667,727 |
| Micron Technology Inc | | 211,400 | 17,791,424 |
| NVIDIA Corp | | 3,716,620 | 499,104,900 |
| ON Semiconductor Corp (d) | | 598,839 | 37,756,799 |
| | | | 842,558,236 |
| Software - 12.4% | | | |
| AppLovin Corp Class A (d) | | 172,800 | 55,957,824 |
| Cadence Design Systems Inc (d) | | 2,000 | 600,920 |
| Coreweave Inc Class A (b)(c) | | 2,923 | 2,747,182 |
| Datadog Inc Class A (d) | | 132,300 | 18,904,347 |
| HubSpot Inc (d) | | 14,493 | 10,098,288 |
| Informatica Inc Class A (d) | | 79,000 | 2,048,470 |
| Microsoft Corp | | 752,744 | 317,281,596 |
| Monday.com Ltd (d) | | 2,900 | 682,776 |
| OpenAI Global LLC rights (b)(c)(d) | | 632,919 | 632,919 |
| Oracle Corp | | 239,800 | 39,960,272 |
| Palantir Technologies Inc Class A (d) | | 11,000 | 831,930 |
| Samsara Inc Class A (d) | | 88,400 | 3,862,196 |
| Servicenow Inc (d) | | 24,618 | 26,098,034 |
| Stripe Inc Class B (b)(c)(d) | | 10,400 | 286,103 |
| Synopsys Inc (d) | | 2,100 | 1,019,256 |
| Zscaler Inc (d) | | 4,100 | 739,681 |
| | | | 481,751,794 |
| Technology Hardware, Storage & Peripherals - 6.7% | | | |
| Apple Inc | | 856,404 | 214,460,690 |
| Dell Technologies Inc Class C | | 394,500 | 45,462,180 |
| Western Digital Corp (d) | | 4,500 | 268,335 |
| | | | 260,191,205 |
TOTAL INFORMATION TECHNOLOGY | | | 1,690,734,204 |
| | | | |
| Materials - 0.2% | | | |
| Construction Materials - 0.2% | | | |
| Martin Marietta Materials Inc | | 15,600 | 8,057,400 |
| Utilities - 1.0% | | | |
| Electric Utilities - 1.0% | | | |
| Constellation Energy Corp | | 159,100 | 35,592,261 |
| Independent Power and Renewable Electricity Producers - 0.0% | | | |
| Vistra Corp | | 11,600 | 1,599,292 |
TOTAL UTILITIES | | | 37,191,553 |
| | | | |
| TOTAL UNITED STATES | | | 3,580,165,642 |
| TOTAL COMMON STOCKS (Cost $1,803,636,077) | | | 3,802,589,080 |
| | | | |
| Convertible Corporate Bonds - 0.1% |
| | | Principal Amount (a) | Value ($) |
| UNITED STATES - 0.1% | | | |
| Consumer Discretionary - 0.1% | | | |
| Automobiles - 0.1% | | | |
| Neutron Holdings Inc 4% 5/22/2027 (b)(c) | | 130,700 | 314,778 |
| Neutron Holdings Inc 4% 6/12/2027 (b)(c) | | 35,600 | 85,739 |
| Neutron Holdings Inc 7.5% 10/29/2026 (b)(c)(f) | | 1,852,540 | 2,223,604 |
| | | | 2,624,121 |
| Information Technology - 0.0% | | | |
| Electronic Equipment, Instruments & Components - 0.0% | | | |
| Enevate Corp 10% 5/12/2025 (b)(c) | | 18,211 | 18,449 |
| TOTAL UNITED STATES | | | 2,642,570 |
| TOTAL CONVERTIBLE CORPORATE BONDS (Cost $2,037,051) | | | 2,642,570 |
| | | | |
| Convertible Preferred Stocks - 2.1% |
| | | Shares | Value ($) |
| CHINA - 0.1% | | | |
| Communication Services - 0.1% | | | |
| Interactive Media & Services - 0.1% | | | |
| ByteDance Ltd Series E1 (b)(c)(d) | | 17,456 | 4,323,153 |
| FINLAND - 0.0% | | | |
| Health Care - 0.0% | | | |
| Health Care Technology - 0.0% | | | |
| Oura Health Oy (b)(c) | | 49,381 | 1,268,598 |
| INDIA - 0.2% | | | |
| Consumer Discretionary - 0.1% | | | |
| Broadline Retail - 0.1% | | | |
| Meesho Series D2 (b)(c) | | 10,521 | 578,339 |
| Meesho Series E (b)(c) | | 1,752 | 96,307 |
| Meesho Series E1 (b)(c) | | 2,354 | 129,399 |
| Meesho Series F (b)(c)(d) | | 33,827 | 1,891,945 |
| | | | 2,695,990 |
| Information Technology - 0.1% | | | |
| Software - 0.1% | | | |
| Pine Labs Pvt Ltd Series 1 (b)(c)(d) | | 5,494 | 2,337,038 |
| Pine Labs Pvt Ltd Series A (b)(c)(d) | | 1,373 | 584,047 |
| Pine Labs Pvt Ltd Series B (b)(c)(d) | | 1,494 | 635,518 |
| Pine Labs Pvt Ltd Series B2 (b)(c)(d) | | 1,208 | 513,859 |
| Pine Labs Pvt Ltd Series C (b)(c)(d) | | 2,247 | 955,829 |
| Pine Labs Pvt Ltd Series C1 (b)(c)(d) | | 473 | 201,204 |
| Pine Labs Pvt Ltd Series D (b)(c)(d) | | 506 | 215,242 |
| | | | 5,442,737 |
| TOTAL INDIA | | | 8,138,727 |
| ISRAEL - 0.0% | | | |
| Information Technology - 0.0% | | | |
| Semiconductors & Semiconductor Equipment - 0.0% | | | |
| Xsight Labs Ltd Series D (b)(c)(d) | | 74,300 | 468,833 |
| Xsight Labs Ltd Series E (b)(c) | | 58,630 | 450,278 |
| Xsight Labs Ltd Series E1 (b)(c) | | 27,183 | 248,181 |
| | | | |
| TOTAL ISRAEL | | | 1,167,292 |
| UNITED STATES - 1.8% | | | |
| Consumer Discretionary - 0.0% | | | |
| Automobiles - 0.0% | | | |
| Neutron Holdings Inc Series 1C (b)(c)(d) | | 1,673,000 | 91,179 |
| Rad Power Bikes Inc Series A (b)(c)(d) | | 7,410 | 1,555 |
| Rad Power Bikes Inc Series C (b)(c)(d) | | 29,156 | 16,619 |
| Rad Power Bikes Inc Series D (b)(c)(d) | | 54,800 | 52,060 |
| Waymo LLC (b)(c) | | 16,241 | 1,260,789 |
| Waymo LLC Series A2 (b)(c)(d) | | 7,496 | 477,945 |
| | | | 1,900,147 |
| Consumer Staples - 0.0% | | | |
| Consumer Staples Distribution & Retail - 0.0% | | | |
| GoBrands Inc Series G (b)(c)(d) | | 10,300 | 346,801 |
| Tobacco - 0.0% | | | |
| JUUL Labs Inc Series C (b)(c)(d) | | 131,549 | 132,865 |
| JUUL Labs Inc Series D (b)(c)(d) | | 741 | 748 |
| | | | 133,613 |
| Financials - 0.0% | | | |
| Financial Services - 0.0% | | | |
| Tenstorrent Holdings Inc Series C1 (b)(c)(d) | | 9,073 | 673,035 |
| Tenstorrent Holdings Inc Series D1 (b)(c) | | 5,400 | 425,790 |
| | | | 1,098,825 |
| Health Care - 0.1% | | | |
| Health Care Equipment & Supplies - 0.1% | | | |
| Blink Health LLC Series C (b)(c)(d) | | 40,445 | 1,386,860 |
| Blink Health LLC Series D (b)(c) | | 8,446 | 289,613 |
| | | | 1,676,473 |
| Health Care Providers & Services - 0.0% | | | |
| Thriveworks Topco LLC (b)(c)(d)(g) | | 105,185 | 476,487 |
| Health Care Technology - 0.0% | | | |
| Aledade Inc Series E1 (b)(c)(d) | | 19,932 | 741,470 |
TOTAL HEALTH CARE | | | 2,894,430 |
| | | | |
| Industrials - 1.0% | | | |
| Aerospace & Defense - 0.7% | | | |
| Anduril Industries Inc (b)(c) | | 87,824 | 2,200,869 |
| Relativity Space Inc Series E (b)(c)(d) | | 149,903 | 140,909 |
| Space Exploration Technologies Corp Series I (b)(c)(d) | | 3,941 | 7,290,850 |
| Space Exploration Technologies Corp Series N (b)(c)(d) | | 8,100 | 14,985,001 |
| | | | 24,617,629 |
| Air Freight & Logistics - 0.0% | | | |
| Zipline International Inc Series G (b)(c) | | 30,114 | 1,263,282 |
| Construction & Engineering - 0.3% | | | |
| Beta Technologies Inc Series A (b)(c)(d) | | 64,780 | 7,405,002 |
| Beta Technologies Inc Series C, 6% (b)(c) | | 5,300 | 612,574 |
| | | | 8,017,576 |
TOTAL INDUSTRIALS | | | 33,898,487 |
| | | | |
| Information Technology - 0.6% | | | |
| Electronic Equipment, Instruments & Components - 0.1% | | | |
| Cellink Corp Series D (b)(c)(d) | | 49,900 | 279,440 |
| Enevate Corp Series E (b)(c)(d) | | 1,172,546 | 644,900 |
| Vast Data Ltd Series A (b)(c)(d) | | 8,394 | 180,723 |
| Vast Data Ltd Series A1 (b)(c)(d) | | 20,660 | 444,810 |
| Vast Data Ltd Series A2 (b)(c)(d) | | 23,765 | 511,660 |
| Vast Data Ltd Series B (b)(c)(d) | | 18,910 | 407,132 |
| Vast Data Ltd Series C (b)(c)(d) | | 552 | 11,885 |
| Vast Data Ltd Series E (b)(c)(d) | | 18,070 | 389,047 |
| | | | 2,869,597 |
| IT Services - 0.0% | | | |
| Gupshup Inc (b)(c)(d) | | 70,900 | 562,237 |
| Yanka Industries Inc Series E (b)(c)(d) | | 53,172 | 175,468 |
| Yanka Industries Inc Series F (b)(c)(d) | | 55,568 | 297,844 |
| | | | 1,035,549 |
| Semiconductors & Semiconductor Equipment - 0.0% | | | |
| SiMa Technologies Inc Series B (b)(c)(d) | | 171,100 | 1,038,577 |
| SiMa Technologies Inc Series B1 (b)(c)(d) | | 24,426 | 174,157 |
| | | | 1,212,734 |
| Software - 0.5% | | | |
| Anthropic PBC Series D (b)(c) | | 10,536 | 394,468 |
| Coreweave Inc Series C (b)(c) | | 101 | 106,402 |
| Crusoe Energy Systems LLC (b)(c) | | 43,571 | 1,270,966 |
| Databricks Inc (b)(c) | | 3,309 | 306,083 |
| Databricks Inc Series G (b)(c)(d) | | 27,000 | 2,497,500 |
| Databricks Inc Series I (b)(c)(d) | | 382 | 35,335 |
| Lyte Ai Inc (b)(c) | | 45,500 | 601,055 |
| MOLOCO Inc Series A (b)(c)(d) | | 41,187 | 2,689,511 |
| Mountain Digital Inc Series D (b)(c)(d) | | 118,780 | 2,040,640 |
| Runway AI Inc (b)(c) | | 11,673 | 1,336,559 |
| Stripe Inc Series H (b)(c)(d) | | 24,195 | 665,604 |
| xAI Corp Series B (b)(c) | | 161,864 | 3,504,357 |
| xAI Corp Series C (b)(c) | | 88,054 | 1,906,369 |
| | | | 17,354,849 |
TOTAL INFORMATION TECHNOLOGY | | | 22,472,729 |
| | | | |
| Materials - 0.1% | | | |
| Metals & Mining - 0.1% | | | |
| Diamond Foundry Inc Series C (b)(c)(d) | | 99,028 | 2,690,591 |
| TOTAL UNITED STATES | | | 65,435,623 |
| TOTAL CONVERTIBLE PREFERRED STOCKS (Cost $66,366,856) | | | 80,333,393 |
| | | | |
| Preferred Securities - 0.0% |
| | | Principal Amount (a) | Value ($) |
| UNITED STATES - 0.0% | | | |
| Consumer Discretionary - 0.0% | | | |
| Automobiles - 0.0% | | | |
| Rad Power Bikes Inc 8% 12/31/2025 (b)(c) | | 69,642 | 90,875 |
| Information Technology - 0.0% | | | |
| Electronic Equipment, Instruments & Components - 0.0% | | | |
| Enevate Corp 6% (b)(c)(h) | | 65,163 | 57,472 |
| Semiconductors & Semiconductor Equipment - 0.0% | | | |
| SiMa Technologies Inc 10% 12/31/2027 (b)(c) | | 186,349 | 190,987 |
TOTAL INFORMATION TECHNOLOGY | | | 248,459 |
| | | | |
| TOTAL UNITED STATES | | | 339,334 |
| TOTAL PREFERRED SECURITIES (Cost $321,154) | | | 339,334 |
| | | | |
| Money Market Funds - 0.3% |
| | | Yield (%) | Shares | Value ($) |
| Fidelity Cash Central Fund (i) | | 4.36 | 4,817,230 | 4,818,193 |
| Fidelity Securities Lending Cash Central Fund (i)(j) | | 4.35 | 8,474,469 | 8,475,317 |
| TOTAL MONEY MARKET FUNDS (Cost $13,293,510) | | | | 13,293,510 |
| | | | | |
| TOTAL INVESTMENT IN SECURITIES - 100.4% (Cost $1,885,654,648) | 3,899,197,887 |
NET OTHER ASSETS (LIABILITIES) - (0.4)% | (13,812,432) |
| NET ASSETS - 100.0% | 3,885,385,455 |
| | |
Legend
| (a) | Amount is stated in United States dollars unless otherwise noted. |
| (c) | Restricted securities (including private placements) - Investment in securities not registered under the Securities Act of 1933 (excluding 144A issues). At the end of the period, the value of restricted securities (excluding 144A issues) amounted to $109,001,213 or 2.8% of net assets. |
| (e) | Security or a portion of the security is on loan at period end. |
| (f) | Security initially issued at one coupon which converts to a higher coupon at a specified date. The rate shown is the rate at period end. |
| (g) | Investment is owned by a wholly-owned subsidiary (Subsidiary) that is treated as a corporation for U.S. tax purposes. |
| (h) | Security is perpetual in nature with no stated maturity date. |
| (i) | Affiliated fund that is generally available only to investment companies and other accounts managed by Fidelity Investments. The rate quoted is the annualized seven-day yield of the fund at period end. A complete unaudited listing of the fund's holdings as of its most recent quarter end is available upon request. In addition, each Fidelity Central Fund's financial statements, which are not covered by the Fund's Report of Independent Registered Public Accounting Firm, are available on the SEC's website or upon request. |
| (j) | Investment made with cash collateral received from securities on loan. |
| Additional information on each restricted holding is as follows: |
| Security | Acquisition Date | Acquisition Cost ($) |
| Aledade Inc Series E1 | 5/20/22 | 992,901 |
| | | |
| Anduril Industries Inc | 8/07/24 | 1,908,995 |
| | | |
| Anthropic PBC Series D | 5/31/24 | 316,127 |
| | | |
| Beta Technologies Inc Series A | 4/09/21 | 4,746,431 |
| | | |
| Beta Technologies Inc Series C, 6% | 10/24/24 | 606,691 |
| | | |
| Blink Health LLC Class A1 | 12/30/20 - 6/17/24 | 318,415 |
| | | |
| Blink Health LLC Series C | 11/07/19 - 7/14/21 | 1,544,028 |
| | | |
| Blink Health LLC Series D | 6/17/24 - 6/25/24 | 354,732 |
| | | |
| Bombas LLC | 2/16/21 - 11/12/21 | 3,539,531 |
| | | |
| Bowery Farming Inc warrants | 10/25/23 | 0 |
| | | |
| ByteDance Ltd Series E1 | 11/18/20 | 1,912,727 |
| | | |
| Canva Inc Class A | 12/23/24 | 634,925 |
| | | |
| Cellink Corp Series D | 1/20/22 | 1,039,113 |
| | | |
| Coreweave Inc Class A | 11/29/23 - 10/03/24 | 1,753,691 |
| | | |
| Coreweave Inc Series C | 5/17/24 | 78,684 |
| | | |
| Crusoe Energy Systems LLC | 12/10/24 | 1,271,046 |
| | | |
| Databricks Inc | 12/17/24 | 306,083 |
| | | |
| Databricks Inc Series G | 2/01/21 | 1,596,311 |
| | | |
| Databricks Inc Series I | 9/14/23 | 28,077 |
| | | |
| Diamond Foundry Inc Series C | 3/15/21 | 2,376,672 |
| | | |
| Enevate Corp 10% 5/12/2025 | 11/12/24 | 18,211 |
| | | |
| Enevate Corp 6% | 11/02/23 - 10/31/24 | 65,163 |
| | | |
| Enevate Corp Series E | 1/29/21 | 1,299,984 |
| | | |
| Epic Games Inc | 7/13/20 - 3/29/21 | 6,646,200 |
| | | |
| GoBrands Inc Series G | 3/02/21 | 2,572,088 |
| | | |
| Gupshup Inc | 6/08/21 | 1,621,143 |
| | | |
| JUUL Labs Inc Class A | 2/23/24 | 3,025,257 |
| | | |
| JUUL Labs Inc Class B | 11/21/17 | 0 |
| | | |
| JUUL Labs Inc Series C | 5/22/15 | 0 |
| | | |
| JUUL Labs Inc Series D | 6/25/18 | 0 |
| | | |
| Lenskart Solutions Pvt Ltd | 4/30/24 | 1,271,063 |
| | | |
| Lyte Ai Inc | 8/13/24 | 577,218 |
| | | |
| Meesho Series D2 | 7/15/24 | 589,176 |
| | | |
| Meesho Series E | 7/15/24 | 98,112 |
| | | |
| Meesho Series E1 | 4/18/24 | 131,824 |
| | | |
| Meesho Series F | 9/21/21 - 7/15/24 | 2,559,960 |
| | | |
| MOLOCO Inc Series A | 6/26/23 | 2,471,220 |
| | | |
| Mountain Digital Inc Series D | 11/05/21 | 2,727,818 |
| | | |
| Neutron Holdings Inc | 2/04/21 | 1,066 |
| | | |
| Neutron Holdings Inc 4% 5/22/2027 | 6/04/20 | 130,700 |
| | | |
| Neutron Holdings Inc 4% 6/12/2027 | 6/12/20 | 35,600 |
| | | |
| Neutron Holdings Inc 7.5% 10/29/2026 | 10/29/21 - 10/27/24 | 1,852,540 |
| | | |
| Neutron Holdings Inc Series 1C | 7/03/18 | 305,891 |
| | | |
| OpenAI Global LLC rights | 9/30/24 | 632,919 |
| | | |
| Oura Health Oy | 12/18/24 | 1,268,598 |
| | | |
| Pine Labs Pvt Ltd | 6/30/21 | 857,205 |
| | | |
| Pine Labs Pvt Ltd Series 1 | 6/30/21 | 2,048,493 |
| | | |
| Pine Labs Pvt Ltd Series A | 6/30/21 | 511,937 |
| | | |
| Pine Labs Pvt Ltd Series B | 6/30/21 | 557,053 |
| | | |
| Pine Labs Pvt Ltd Series B2 | 6/30/21 | 450,415 |
| | | |
| Pine Labs Pvt Ltd Series C | 6/30/21 | 837,816 |
| | | |
| Pine Labs Pvt Ltd Series C1 | 6/30/21 | 176,363 |
| | | |
| Pine Labs Pvt Ltd Series D | 6/30/21 | 188,667 |
| | | |
| Rad Power Bikes Inc | 1/21/21 | 274,158 |
| | | |
| Rad Power Bikes Inc 8% 12/31/2025 | 10/06/23 | 69,642 |
| | | |
| Rad Power Bikes Inc Series A | 1/21/21 | 35,745 |
| | | |
| Rad Power Bikes Inc Series C | 1/21/21 | 140,644 |
| | | |
| Rad Power Bikes Inc Series D | 9/17/21 | 525,192 |
| | | |
| Rad Power Bikes Inc warrants 10/6/2033 | 10/06/23 | 0 |
| | | |
| Relativity Space Inc Series E | 5/27/21 | 3,423,050 |
| | | |
| Runway AI Inc | 9/06/24 | 1,265,561 |
| | | |
| SiMa Technologies Inc 10% 12/31/2027 | 4/08/24 - 10/05/24 | 186,349 |
| | | |
| SiMa Technologies Inc Series B | 5/10/21 | 877,298 |
| | | |
| SiMa Technologies Inc Series B1 | 4/25/22 - 10/17/22 | 173,202 |
| | | |
| Space Exploration Technologies Corp | 2/16/21 - 8/30/24 | 1,550,067 |
| | | |
| Space Exploration Technologies Corp Class C | 7/01/24 | 269,136 |
| | | |
| Space Exploration Technologies Corp Series I | 4/05/18 | 666,029 |
| | | |
| Space Exploration Technologies Corp Series N | 8/04/20 | 2,187,000 |
| | | |
| Starling Bank Ltd Class D | 6/18/21 - 4/05/22 | 2,084,120 |
| | | |
| Stripe Inc Class B | 5/18/21 | 417,335 |
| | | |
| Stripe Inc Series H | 3/15/21 - 5/25/23 | 970,824 |
| | | |
| Tenstorrent Holdings Inc Series C1 | 4/23/21 | 539,435 |
| | | |
| Tenstorrent Holdings Inc Series D1 | 7/16/24 | 425,663 |
| | | |
| Thriveworks Topco LLC | 7/23/21 - 2/25/22 | 3,019,147 |
| | | |
| Vast Data Ltd Series A | 11/28/23 | 92,334 |
| | | |
| Vast Data Ltd Series A1 | 11/28/23 | 227,260 |
| | | |
| Vast Data Ltd Series A2 | 11/28/23 | 261,415 |
| | | |
| Vast Data Ltd Series B | 11/28/23 | 208,010 |
| | | |
| Vast Data Ltd Series C | 11/28/23 | 6,072 |
| | | |
| Vast Data Ltd Series E | 11/28/23 | 397,540 |
| | | |
| Waymo LLC | 10/18/24 | 1,270,067 |
| | | |
| Waymo LLC Series A2 | 5/08/20 | 643,661 |
| | | |
| xAI Corp Series B | 5/13/24 | 1,937,512 |
| | | |
| xAI Corp Series C | 11/22/24 | 1,906,369 |
| | | |
| Xsight Labs Ltd Series D | 2/16/21 | 594,103 |
| | | |
| Xsight Labs Ltd Series E | 11/04/24 - 12/30/24 | 469,043 |
| | | |
| Xsight Labs Ltd Series E1 | 1/11/24 | 217,355 |
| | | |
| Xsight Labs Ltd warrants 1/11/2034 | 1/11/24 | 0 |
| | | |
| Xsight Labs Ltd warrants 12/30/2031 | 11/04/24 - 12/30/24 | 0 |
| | | |
| Yanka Industries Inc Series E | 5/15/20 | 642,275 |
| | | |
| Yanka Industries Inc Series F | 4/08/21 | 1,771,330 |
| | | |
| Zipline International Inc Series G | 6/07/24 | 1,263,171 |
| | | |
Affiliated Central Funds
Fiscal year to date information regarding the Fund's investments in Fidelity Central Funds, including the ownership percentage, is presented below.
| Affiliate | Value, beginning of period ($) | Purchases ($) | Sales Proceeds ($) | Dividend Income ($) | Realized Gain (loss) ($) | Change in Unrealized appreciation (depreciation) ($) | Value, end of period ($) | Shares, end of period | % ownership, end of period |
| Fidelity Cash Central Fund | 2,444,574 | 558,003,433 | 555,630,217 | 393,231 | 403 | - | 4,818,193 | 4,817,230 | 0.0% |
| Fidelity Securities Lending Cash Central Fund | 42,472,395 | 591,777,134 | 625,774,212 | 49,788 | - | - | 8,475,317 | 8,474,469 | 0.0% |
| Total | 44,916,969 | 1,149,780,567 | 1,181,404,429 | 443,019 | 403 | - | 13,293,510 | 13,291,699 | |
| | | | | | | | | | |
Amounts in the dividend income column in the above table include any capital gain distributions from underlying funds, which are presented in the corresponding line item in the Consolidated Statement of Operations, if applicable.
Amounts in the dividend income column for Fidelity Securities Lending Cash Central Fund represents the income earned on investing cash collateral, less rebates paid to borrowers and any lending agent fees associated with the loan, plus any premium payments received for lending certain types of securities.
Amounts included in the purchases and sales proceeds columns may include in-kind transactions, if applicable.
Investment Valuation
The following is a summary of the inputs used, as of December 31, 2024, involving the Fund's assets and liabilities carried at fair value. The inputs or methodology used for valuing securities may not be an indication of the risk associated with investing in those securities. For more information on valuation inputs, and their aggregation into the levels used below, please refer to the Investment Valuation section in the accompanying Notes to Consolidated Financial Statements.
| Valuation Inputs at Reporting Date: |
| Description | Total ($) | Level 1 ($) | Level 2 ($) | Level 3 ($) |
Investments in Securities: | | | | |
|
| Common Stocks | | | | |
Communication Services | 810,599,258 | 805,024,620 | - | 5,574,638 |
Consumer Discretionary | 480,148,480 | 476,746,989 | - | 3,401,491 |
Consumer Staples | 46,303,225 | 43,292,215 | - | 3,011,010 |
Financials | 271,301,679 | 260,684,568 | - | 10,617,111 |
Health Care | 181,613,268 | 175,995,685 | 5,237,307 | 380,276 |
Industrials | 141,579,464 | 137,071,384 | - | 4,508,080 |
Information Technology | 1,825,794,753 | 1,803,551,356 | 16,923,031 | 5,320,366 |
Materials | 8,057,400 | 8,057,400 | - | - |
Utilities | 37,191,553 | 37,191,553 | - | - |
|
| Convertible Corporate Bonds | | | | |
Consumer Discretionary | 2,624,121 | - | - | 2,624,121 |
Information Technology | 18,449 | - | - | 18,449 |
|
| Convertible Preferred Stocks | | | | |
Communication Services | 4,323,153 | - | - | 4,323,153 |
Consumer Discretionary | 4,596,137 | - | - | 4,596,137 |
Consumer Staples | 480,414 | - | - | 480,414 |
Financials | 1,098,825 | - | - | 1,098,825 |
Health Care | 4,163,028 | - | - | 4,163,028 |
Industrials | 33,898,487 | - | - | 33,898,487 |
Information Technology | 29,082,758 | - | - | 29,082,758 |
Materials | 2,690,591 | - | - | 2,690,591 |
|
| Preferred Securities | | | | |
Consumer Discretionary | 90,875 | - | - | 90,875 |
Information Technology | 248,459 | - | - | 248,459 |
|
| Money Market Funds | 13,293,510 | 13,293,510 | - | - |
| Total Investments in Securities: | 3,899,197,887 | 3,760,909,280 | 22,160,338 | 116,128,269 |
The following is a reconciliation of consolidated Investments in Securities for which Level 3 inputs were used in determining value. Beginning balances have been updated to conform to current period presentation, as applicable.
| |
| Investments in Securities: | |
| Beginning Balance | $ | 77,291,947 | |
| Net Realized Gain (Loss) on Investment Securities | | (2,985,316) | |
| Net Unrealized Gain (Loss) on Investment Securities | | 16,817,728 | |
| Cost of Purchases | | 25,026,262 | |
| Proceeds of Sales | | (22,352) | |
| Amortization/Accretion | | - | |
| Transfers into Level 3 | | - | |
| Transfers out of Level 3 | | - | |
| Ending Balance | $ | 116,128,269 | |
| The change in unrealized gain (loss) for the period attributable to Level 3 securities held at December 31, 2024 | $ | 13,904,531 | |
| The information used in the above reconciliation represents fiscal year to date activity for any Investments in Securities identified as using Level 3 inputs at either the beginning or the end of the current fiscal period. Cost of purchases and proceeds of sales may include securities received and/or delivered through in-kind transactions, corporate actions or exchanges. Transfers into Level 3 were attributable to a lack of observable market data resulting from decreases in market activity, decreases in liquidity, security restructurings or corporate actions. Transfers out of Level 3 were attributable to observable market data becoming available for those securities. Transfers in or out of Level 3 represent the beginning value of any Security or Instrument where a change in the pricing level occurred from the beginning to the end of the period. Realized and unrealized gains (losses) disclosed in the reconciliation are included in Net Gain (Loss) on the Fund's consolidated Statement of Operations. | |
Consolidated Financial Statements
| Consolidated Statement of Assets and Liabilities |
As of December 31, 2024 |
| Assets | | | | |
| Investment in securities, at value (including securities loaned of $8,243,945) - See accompanying schedule: | | | | |
Unaffiliated issuers (cost $1,872,361,138) | $ | 3,885,904,377 | | |
Fidelity Central Funds (cost $13,293,510) | | 13,293,510 | | |
| | | | | |
| | | | | |
| Total Investment in Securities (cost $1,885,654,648) | | | $ | 3,899,197,887 |
| Cash | | | | 2,007 |
| Receivable for fund shares sold | | | | 1,243,885 |
| Dividends receivable | | | | 575,044 |
| Interest receivable | | | | 55,030 |
| Distributions receivable from Fidelity Central Funds | | | | 36,474 |
| Prepaid expenses | | | | 3,138 |
| Other receivables | | | | 35,518 |
Total assets | | | | 3,901,148,983 |
| Liabilities | | | | |
| Payable for fund shares redeemed | $ | 4,821,597 | | |
| Accrued management fee | | 1,950,695 | | |
| Distribution and service plan fees payable | | 382,235 | | |
| Other payables and accrued expenses | | 140,901 | | |
| Collateral on securities loaned | | 8,468,100 | | |
| Total liabilities | | | | 15,763,528 |
| Commitments and contingent liabilities (see Significant Accounting Policies note) | | | | |
| Net Assets | | | $ | 3,885,385,455 |
| Net Assets consist of: | | | | |
| Paid in capital | | | $ | 1,829,604,933 |
| Total accumulated earnings (loss) | | | | 2,055,780,522 |
| Net Assets | | | $ | 3,885,385,455 |
| | | | | |
| Net Asset Value and Maximum Offering Price | | | | |
| Initial Class : | | | | |
Net Asset Value, offering price and redemption price per share ($692,265,746 ÷ 8,340,193 shares) | | | $ | 83.00 |
| Service Class : | | | | |
Net Asset Value, offering price and redemption price per share ($171,526,220 ÷ 2,078,706 shares) | | | $ | 82.52 |
| Service Class 2 : | | | | |
Net Asset Value, offering price and redemption price per share ($1,701,707,422 ÷ 21,180,097 shares) | | | $ | 80.34 |
| Investor Class : | | | | |
Net Asset Value, offering price and redemption price per share ($1,319,886,067 ÷ 16,101,150 shares) | | | $ | 81.97 |
| Consolidated Statement of Operations |
| Year ended December 31, 2024 |
| Investment Income | | | | |
| Dividends | | | $ | 13,325,847 |
| Interest | | | | 112,900 |
| Income from Fidelity Central Funds (including $49,788 from security lending) | | | | 443,019 |
| Total income | | | | 13,881,766 |
| Expenses | | | | |
| Management fee | $ | 19,879,557 | | |
| Transfer agent fees | | 444,489 | | |
| Distribution and service plan fees | | 3,939,023 | | |
| Accounting fees | | 130,121 | | |
| Custodian fees and expenses | | 76,046 | | |
| Independent trustees' fees and expenses | | 14,365 | | |
| Audit fees | | 74,310 | | |
| Legal | | 15,052 | | |
| Interest | | 1,410 | | |
| Miscellaneous | | 62,517 | | |
| Total expenses before reductions | | 24,636,890 | | |
| Expense reductions | | (130,606) | | |
| Total expenses after reductions | | | | 24,506,284 |
| Net Investment income (loss) | | | | (10,624,518) |
| Realized and Unrealized Gain (Loss) | | | | |
| Net realized gain (loss) on: | | | | |
| Investment Securities: | | | | |
| Unaffiliated issuers | | 337,509,009 | | |
| Fidelity Central Funds | | 403 | | |
| Foreign currency transactions | | 55,991 | | |
| Total net realized gain (loss) | | | | 337,565,403 |
| Change in net unrealized appreciation (depreciation) on: | | | | |
| Investment Securities: | | | | |
| Unaffiliated issuers (net of increase in deferred foreign taxes of $36,766) | | 766,916,304 | | |
| Assets and liabilities in foreign currencies | | (11,119) | | |
| Total change in net unrealized appreciation (depreciation) | | | | 766,905,185 |
| Net gain (loss) | | | | 1,104,470,588 |
| Net increase (decrease) in net assets resulting from operations | | | $ | 1,093,846,070 |
| Consolidated Statement of Changes in Net Assets |
| |
| | Year ended December 31, 2024 | | Year ended December 31, 2023 |
| Increase (Decrease) in Net Assets | | | | |
| Operations | | | | |
| Net investment income (loss) | $ | (10,624,518) | $ | (7,269,831) |
| Net realized gain (loss) | | 337,565,403 | | (28,167,594) |
| Change in net unrealized appreciation (depreciation) | | 766,905,185 | | 923,299,983 |
| Net increase (decrease) in net assets resulting from operations | | 1,093,846,070 | | 887,862,558 |
| Share transactions - net increase (decrease) | | (68,752,435) | | 65,811,471 |
| Total increase (decrease) in net assets | | 1,025,093,635 | | 953,674,029 |
| | | | | |
| Net Assets | | | | |
| Beginning of period | | 2,860,291,820 | | 1,906,617,791 |
| End of period | $ | 3,885,385,455 | $ | 2,860,291,820 |
| | | | | |
| | | | | |
Consolidated Financial Highlights
VIP Growth Opportunities Portfolio Initial Class |
| |
| Years ended December 31, | | 2024 | | 2023 | | 2022 | | 2021 | | 2020 |
Selected Per-Share Data | | | | | | | | | | |
| Net asset value, beginning of period | $ | 59.76 | $ | 41.03 | $ | 79.25 | $ | 77.54 | $ | 48.86 |
| Income from Investment Operations | | | | | | | | | | |
Net investment income (loss) A,B | | (.13) | | (.08) | | (.02) | | (.24) | | (.06) |
| Net realized and unrealized gain (loss) | | 23.37 | | 18.81 | | (27.11) | | 9.38 | | 32.11 |
| Total from investment operations | | 23.24 | | 18.73 | | (27.13) | | 9.14 | | 32.05 |
| Distributions from net investment income | | - | | - | | - | | - | | (.01) |
| Distributions from net realized gain | | - | | - | | (11.09) | | (7.43) | | (3.36) |
| Total distributions | | - | | - | | (11.09) | | (7.43) | | (3.37) |
| Net asset value, end of period | $ | 83.00 | $ | 59.76 | $ | 41.03 | $ | 79.25 | $ | 77.54 |
Total Return C,D | | | | 45.65% | | (38.15)% | | 11.94% | | 68.66% |
Ratios to Average Net Assets B,E,F | | | | | | | | | | |
| Expenses before reductions | | .58% | | .62% | | .62% | | .62% | | .64% |
| Expenses net of fee waivers, if any | | | | .61% | | .62% | | .62% | | .64% |
| Expenses net of all reductions | | .58% | | .61% | | .62% | | .62% | | .63% |
| Net investment income (loss) | | (.17)% | | (.16)% | | (.05)% | | (.30)% | | (.10)% |
| Supplemental Data | | | | | | | | | | |
| Net assets, end of period (000 omitted) | $ | 692,266 | $ | 486,947 | $ | 256,757 | $ | 471,980 | $ | 470,897 |
Portfolio turnover rate G | | | | 54% | | 68% | | 82% | | 65% |
ACalculated based on average shares outstanding during the period.
BNet investment income (loss) is affected by the timing of the declaration of dividends by any underlying mutual funds or exchange-traded funds (ETFs). Net investment income (loss) of any mutual funds or ETFs is not included in the Fund's net investment income (loss) ratio.
CTotal returns do not reflect charges attributable to your insurance company's separate account. Inclusion of these charges would reduce the total returns shown.
DTotal returns would have been lower if certain expenses had not been reduced during the applicable periods shown.
EFees and expenses of any underlying mutual funds or exchange-traded funds (ETFs) are not included in the Fund's expense ratio. The Fund indirectly bears its proportionate share of these expenses. For additional expense information related to investments in Fidelity Central Funds, please refer to the "Investments in Fidelity Central Funds" note found in the Notes to Consolidated Financial Statements section of the most recent Annual or Semi-Annual report.
FExpense ratios reflect operating expenses of the class. Expenses before reductions do not reflect amounts reimbursed, waived, or reduced through arrangements with the investment adviser, brokerage services, or other offset arrangements, if applicable, and do not represent the amount paid by the class during periods when reimbursements, waivers or reductions occur.
GAmount does not include the portfolio activity of any underlying mutual funds or exchange-traded funds (ETFs), derivatives or securities that mature within one year from acquisition.
VIP Growth Opportunities Portfolio Service Class |
| |
| Years ended December 31, | | 2024 | | 2023 | | 2022 | | 2021 | | 2020 |
Selected Per-Share Data | | | | | | | | | | |
| Net asset value, beginning of period | $ | 59.47 | $ | 40.87 | $ | 79.06 | $ | 77.37 | $ | 48.77 |
| Income from Investment Operations | | | | | | | | | | |
Net investment income (loss) A,B | | (.20) | | (.13) | | (.07) | | (.32) | | (.12) |
| Net realized and unrealized gain (loss) | | 23.25 | | 18.73 | | (27.03) | | 9.35 | | 32.04 |
| Total from investment operations | | 23.05 | | 18.60 | | (27.10) | | 9.03 | | 31.92 |
| Distributions from net investment income | | - | | - | | - | | - | | - C |
| Distributions from net realized gain | | - | | - | | (11.09) | | (7.34) | | (3.31) |
| Total distributions | | - | | - | | (11.09) | | (7.34) | | (3.32) D |
| Net asset value, end of period | $ | 82.52 | $ | 59.47 | $ | 40.87 | $ | 79.06 | $ | 77.37 |
Total Return E,F | | | | 45.51% | | (38.21)% | | 11.83% | | 68.49% |
Ratios to Average Net Assets B,G,H | | | | | | | | | | |
| Expenses before reductions | | .68% | | .72% | | .72% | | .72% | | .74% |
| Expenses net of fee waivers, if any | | | | .71% | | .72% | | .72% | | .74% |
| Expenses net of all reductions | | .67% | | .71% | | .72% | | .72% | | .73% |
| Net investment income (loss) | | (.27)% | | (.26)% | | (.15)% | | (.40)% | | (.20)% |
| Supplemental Data | | | | | | | | | | |
| Net assets, end of period (000 omitted) | $ | 171,526 | $ | 127,432 | $ | 94,433 | $ | 157,797 | $ | 163,452 |
Portfolio turnover rate I | | | | 54% | | 68% | | 82% | | 65% |
ACalculated based on average shares outstanding during the period.
BNet investment income (loss) is affected by the timing of the declaration of dividends by any underlying mutual funds or exchange-traded funds (ETFs). Net investment income (loss) of any mutual funds or ETFs is not included in the Fund's net investment income (loss) ratio.
CAmount represents less than $.005 per share.
DTotal distributions per share do not sum due to rounding.
ETotal returns do not reflect charges attributable to your insurance company's separate account. Inclusion of these charges would reduce the total returns shown.
FTotal returns would have been lower if certain expenses had not been reduced during the applicable periods shown.
GFees and expenses of any underlying mutual funds or exchange-traded funds (ETFs) are not included in the Fund's expense ratio. The Fund indirectly bears its proportionate share of these expenses. For additional expense information related to investments in Fidelity Central Funds, please refer to the "Investments in Fidelity Central Funds" note found in the Notes to Consolidated Financial Statements section of the most recent Annual or Semi-Annual report.
HExpense ratios reflect operating expenses of the class. Expenses before reductions do not reflect amounts reimbursed, waived, or reduced through arrangements with the investment adviser, brokerage services, or other offset arrangements, if applicable, and do not represent the amount paid by the class during periods when reimbursements, waivers or reductions occur.
IAmount does not include the portfolio activity of any underlying mutual funds or exchange-traded funds (ETFs), derivatives or securities that mature within one year from acquisition.
VIP Growth Opportunities Portfolio Service Class 2 |
| |
| Years ended December 31, | | 2024 | | 2023 | | 2022 | | 2021 | | 2020 |
Selected Per-Share Data | | | | | | | | | | |
| Net asset value, beginning of period | $ | 57.99 | $ | 39.91 | $ | 77.62 | $ | 76.08 | $ | 48.05 |
| Income from Investment Operations | | | | | | | | | | |
Net investment income (loss) A,B | | (.29) | | (.20) | | (.14) | | (.44) | | (.20) |
| Net realized and unrealized gain (loss) | | 22.64 | | 18.28 | | (26.48) | | 9.22 | | 31.50 |
| Total from investment operations | | 22.35 | | 18.08 | | (26.62) | | 8.78 | | 31.30 |
| Distributions from net realized gain | | - | | - | | (11.09) | | (7.24) | | (3.27) |
| Total distributions | | - | | - | | (11.09) | | (7.24) | | (3.27) |
| Net asset value, end of period | $ | 80.34 | $ | 57.99 | $ | 39.91 | $ | 77.62 | $ | 76.08 |
Total Return C,D | | | | 45.30% | | (38.32)% | | 11.68% | | 68.21% |
Ratios to Average Net Assets B,E,F | | | | | | | | | | |
| Expenses before reductions | | .83% | | .87% | | .87% | | .87% | | .88% |
| Expenses net of fee waivers, if any | | | | .86% | | .87% | | .87% | | .88% |
| Expenses net of all reductions | | .82% | | .86% | | .87% | | .87% | | .88% |
| Net investment income (loss) | | (.42)% | | (.41)% | | (.30)% | | (.55)% | | (.35)% |
| Supplemental Data | | | | | | | | | | |
| Net assets, end of period (000 omitted) | $ | 1,701,707 | $ | 1,260,467 | $ | 868,129 | $ | 1,304,134 | $ | 1,079,778 |
Portfolio turnover rate G | | | | 54% | | 68% | | 82% | | 65% |
ACalculated based on average shares outstanding during the period.
BNet investment income (loss) is affected by the timing of the declaration of dividends by any underlying mutual funds or exchange-traded funds (ETFs). Net investment income (loss) of any mutual funds or ETFs is not included in the Fund's net investment income (loss) ratio.
CTotal returns do not reflect charges attributable to your insurance company's separate account. Inclusion of these charges would reduce the total returns shown.
DTotal returns would have been lower if certain expenses had not been reduced during the applicable periods shown.
EFees and expenses of any underlying mutual funds or exchange-traded funds (ETFs) are not included in the Fund's expense ratio. The Fund indirectly bears its proportionate share of these expenses. For additional expense information related to investments in Fidelity Central Funds, please refer to the "Investments in Fidelity Central Funds" note found in the Notes to Consolidated Financial Statements section of the most recent Annual or Semi-Annual report.
FExpense ratios reflect operating expenses of the class. Expenses before reductions do not reflect amounts reimbursed, waived, or reduced through arrangements with the investment adviser, brokerage services, or other offset arrangements, if applicable, and do not represent the amount paid by the class during periods when reimbursements, waivers or reductions occur.
GAmount does not include the portfolio activity of any underlying mutual funds or exchange-traded funds (ETFs), derivatives or securities that mature within one year from acquisition.
VIP Growth Opportunities Portfolio Investor Class |
| |
| Years ended December 31, | | 2024 | | 2023 | | 2022 | | 2021 | | 2020 |
Selected Per-Share Data | | | | | | | | | | |
| Net asset value, beginning of period | $ | 59.07 | $ | 40.58 | $ | 78.58 | $ | 76.94 | $ | 48.52 |
| Income from Investment Operations | | | | | | | | | | |
Net investment income (loss) A,B | | (.17) | | (.12) | | (.06) | | (.30) | | (.10) |
| Net realized and unrealized gain (loss) | | 23.07 | | 18.61 | | (26.85) | | 9.31 | | 31.86 |
| Total from investment operations | | 22.90 | | 18.49 | | (26.91) | | 9.01 | | 31.76 |
| Distributions from net investment income | | - | | - | | - | | - | | (.01) |
| Distributions from net realized gain | | - | | - | | (11.09) | | (7.37) | | (3.33) |
| Total distributions | | - | | - | | (11.09) | | (7.37) | | (3.34) |
| Net asset value, end of period | $ | 81.97 | $ | 59.07 | $ | 40.58 | $ | 78.58 | $ | 76.94 |
Total Return C,D | | | | 45.56% | | (38.20)% | | 11.87% | | 68.52% |
Ratios to Average Net Assets B,E,F | | | | | | | | | | |
| Expenses before reductions | | .65% | | .70% | | .70% | | .70% | | .71% |
| Expenses net of fee waivers, if any | | | | .69% | | .70% | | .70% | | .71% |
| Expenses net of all reductions | | .65% | | .69% | | .70% | | .70% | | .71% |
| Net investment income (loss) | | (.24)% | | (.24)% | | (.12)% | | (.38)% | | (.18)% |
| Supplemental Data | | | | | | | | | | |
| Net assets, end of period (000 omitted) | $ | 1,319,886 | $ | 985,446 | $ | 687,300 | $ | 1,362,435 | $ | 1,251,032 |
Portfolio turnover rate G | | | | 54% | | 68% | | 82% | | 65% |
ACalculated based on average shares outstanding during the period.
BNet investment income (loss) is affected by the timing of the declaration of dividends by any underlying mutual funds or exchange-traded funds (ETFs). Net investment income (loss) of any mutual funds or ETFs is not included in the Fund's net investment income (loss) ratio.
CTotal returns do not reflect charges attributable to your insurance company's separate account. Inclusion of these charges would reduce the total returns shown.
DTotal returns would have been lower if certain expenses had not been reduced during the applicable periods shown.
EFees and expenses of any underlying mutual funds or exchange-traded funds (ETFs) are not included in the Fund's expense ratio. The Fund indirectly bears its proportionate share of these expenses. For additional expense information related to investments in Fidelity Central Funds, please refer to the "Investments in Fidelity Central Funds" note found in the Notes to Consolidated Financial Statements section of the most recent Annual or Semi-Annual report.
FExpense ratios reflect operating expenses of the class. Expenses before reductions do not reflect amounts reimbursed, waived, or reduced through arrangements with the investment adviser, brokerage services, or other offset arrangements, if applicable, and do not represent the amount paid by the class during periods when reimbursements, waivers or reductions occur.
GAmount does not include the portfolio activity of any underlying mutual funds or exchange-traded funds (ETFs), derivatives or securities that mature within one year from acquisition.
Notes to Consolidated Financial Statements
For the period ended December 31, 2024
1. Organization.
VIP Growth Opportunities Portfolio (the Fund) is a fund of Variable Insurance Products Fund III (the Trust) and is authorized to issue an unlimited number of shares. The Trust is registered under the Investment Company Act of 1940, as amended (the 1940 Act), as an open-end management investment company organized as a Massachusetts business trust. Shares of the Fund may only be purchased by insurance companies for the purpose of funding variable annuity or variable life insurance contracts. The Fund offers the following classes of shares: Initial Class shares, Service Class shares, Service Class 2 shares and Investor Class shares. All classes have equal rights and voting privileges, except for matters affecting a single class.
2. Investments in Fidelity Central Funds.
Funds may invest in Fidelity Central Funds, which are open-end investment companies generally available only to other investment companies and accounts managed by the investment adviser and its affiliates. The Consolidated Schedule of Investments lists any Fidelity Central Funds held as an investment as of period end, but does not include the underlying holdings of each Fidelity Central Fund. An investing fund indirectly bears its proportionate share of the expenses of the underlying Fidelity Central Funds.
Based on its investment objective, each Fidelity Central Fund may invest or participate in various investment vehicles or strategies that are similar to those of the investing fund. These strategies are consistent with the investment objectives of the investing fund and may involve certain economic risks which may cause a decline in value of each of the Fidelity Central Funds and thus a decline in the value of the investing fund.
| Fidelity Central Fund | Investment Manager | Investment Objective | Investment Practices | Expense RatioA |
| Fidelity Money Market Central Funds | Fidelity Management & Research Company LLC (FMR) | Each fund seeks to obtain a high level of current income consistent with the preservation of capital and liquidity. | Short-term Investments | Less than .005% |
A Expenses expressed as a percentage of average net assets and are as of each underlying Central Fund's most recent annual or semi-annual shareholder report.
A complete unaudited list of holdings for each Fidelity Central Fund is available upon request or at the Securities and Exchange Commission website at www.sec.gov. In addition, the financial statements of the Fidelity Central Funds which contain the significant accounting policies (including investment valuation policies) of those funds, and are not covered by the Report of Independent Registered Public Accounting Firm, are available on the Securities and Exchange Commission website or upon request.
3. Significant Accounting Policies.
The Fund is an investment company and applies the accounting and reporting guidance of the Financial Accounting Standards Board (FASB) Accounting Standards Codification Topic 946 Financial Services - Investment Companies. The consolidated financial statements have been prepared in conformity with accounting principles generally accepted in the United States of America (GAAP), which require management to make certain estimates and assumptions at the date of the consolidated financial statements. Actual results could differ from those estimates. The Fund operates as a single operating segment. The Fund's income, expenses, assets, and performance are regularly monitored and assessed as a whole by the investment adviser and other individuals responsible for oversight functions of the Trust, using the information presented in the consolidated financial statements and consolidated financial highlights. Subsequent events, if any, through the date that the consolidated financial statements were issued have been evaluated in the preparation of the consolidated financial statements. The Fund's Consolidated Schedule of Investments lists any underlying mutual funds or exchange-traded funds (ETFs) but does not include the underlying holdings of these funds. The following summarizes the significant accounting policies of the Fund:
Investment Valuation. Investments are valued as of 4:00 p.m. Eastern time on the last calendar day of the period. The Board of Trustees (the Board) has designated the Fund's investment adviser as the valuation designee responsible for the fair valuation function and performing fair value determinations as needed. The investment adviser has established a Fair Value Committee (the Committee) to carry out the day-to-day fair valuation responsibilities and has adopted policies and procedures to govern the fair valuation process and the activities of the Committee. In accordance with these fair valuation policies and procedures, which have been approved by the Board, the Fund attempts to obtain prices from one or more third party pricing services or brokers to value its investments. When current market prices, quotations or currency exchange rates are not readily available or reliable, investments will be fair valued in good faith by the Committee, in accordance with the policies and procedures. Factors used in determining fair value vary by investment type and may include market or investment specific events, transaction data, estimated cash flows, and market observations of comparable investments. The frequency that the fair valuation procedures are used cannot be predicted and they may be utilized to a significant extent. The Committee manages the Fund's fair valuation practices and maintains the fair valuation policies and procedures. The Fund's investment adviser reports to the Board information regarding the fair valuation process and related material matters.
The Fund categorizes the inputs to valuation techniques used to value its investments into a disclosure hierarchy consisting of three levels as shown below:
Level 1 - unadjusted quoted prices in active markets for identical investments
Level 2 - other significant observable inputs (including quoted prices for similar investments, interest rates, prepayment speeds, etc.)
Level 3 - unobservable inputs (including the Fund's own assumptions based on the best information available)
Valuation techniques used to value the Fund's investments by major category are as follows:
Equity securities, including restricted securities, for which market quotations are readily available, are valued at the last reported sale price or official closing price as reported by a third party pricing service on the primary market or exchange on which they are traded and are categorized as Level 1 in the hierarchy. In the event there were no sales during the day or closing prices are not available, securities are valued at the last quoted bid price or may be valued using the last available price and are generally categorized as Level 2 in the hierarchy. For foreign equity securities, when market or security specific events arise, comparisons to the valuation of American Depositary Receipts (ADRs), futures contracts, Exchange-Traded Funds (ETFs) and certain indexes as well as quoted prices for similar securities may be used and would be categorized as Level 2 in the hierarchy. For equity securities, including restricted securities, where observable inputs are limited, assumptions about market activity and risk are used and these securities may be categorized as Level 3 in the hierarchy. Securities, including private placements or other restricted securities, for which observable inputs are not available are valued using alternate valuation approaches, including the market approach, the income approach and cost approach, and are categorized as Level 3 in the hierarchy. The market approach considers factors including the price of recent investments in the same or a similar security or financial metrics of comparable securities. The income approach considers factors including expected future cash flows, security specific risks and corresponding discount rates. The cost approach considers factors including the value of the security's underlying assets and liabilities.
Debt securities, including restricted securities, are valued based on evaluated prices received from third party pricing services or from brokers who make markets in such securities. Corporate bonds and preferred securities are valued by pricing services who utilize matrix pricing which considers yield or price of bonds of comparable quality, coupon, maturity and type or by broker-supplied prices. When independent prices are unavailable or unreliable, debt securities may be valued utilizing pricing methodologies which consider similar factors that would be used by third party pricing services. Debt securities are generally categorized as Level 2 in the hierarchy but may be Level 3 depending on the circumstances.
Investments in open-end mutual funds, including the Fidelity Central Funds, are valued at their closing net asset value (NAV) each business day and are categorized as Level 1 in the hierarchy.
The following provides information on Level 3 securities held by the Fund that were valued at period end based on unobservable inputs. These amounts exclude valuations provided by a broker.
| Asset Type | Fair Value | Valuation Technique(s) | Unobservable Input | Amount or Range/Weighted Average | Impact to Valuation from an Increase in InputA |
| Common Stocks | $32,812,972 | Market comparable | Enterprise value/Revenue multiple (EV/R) | 1.5 - 19.1 / 8.0 | Increase |
| | | | Enterprise value/EBITDA multiple (EV/EBITDA) | 21.5 - 33.4 / 26.1 | Increase |
| | | | Enterprise value/Net income multiple (EV/NI) | 14.0 | Increase |
| | | Market approach | Transaction price | $8.00 | Increase |
| | | Recovery value | Recovery value | $0.00 | Increase |
| | | Black scholes | Discount rate | 4.3% - 4.4% / 4.3% | Increase |
| | | | Term | 1.0 - 3.0 / 2.5 | Increase |
| | | | Volatility | 60.0% - 100.0% / 64.6% | Increase |
| Convertible Corporate Bonds | $2,642,570 | Market comparable | Enterprise value/Revenue multiple (EV/R) | 2.8 | Increase |
| | | | Discount rate | 29.2% | Decrease |
| | | | Probability rate | 10.0% - 75.0% / 33.3% | Increase |
| | | Market approach | Transaction price | $100.00 | Increase |
| | | | Discount rate | 21.7% | Decrease |
| | | | Probability rate | 0.0% - 60.0% / 25.0% | Increase |
| | | Black scholes | Discount rate | 4.3% - 5.0% / 4.3% | Increase |
| | | | Term | 0.4 - 1.0 / 1.0 | Increase |
| | | | Volatility | 75.0% - 100.0% / 75.2% | Increase |
| Convertible Preferred Stocks | $80,333,393 | Market comparable | Enterprise value/Revenue multiple (EV/R) | 0.9 - 61.8 / 15.6 | Increase |
| | | | Enterprise value/EBITDA multiple (EV/EBITDA) | 33.4 | Increase |
| | | Market approach | Transaction price | $1.10 - $78.20 / $31.03 | Increase |
| | | | Discount rate | 60.0% | Decrease |
| | | | Premium rate | 20.0% | Increase |
| | | Recovery value | Recovery value | $0.00 | Increase |
| | | Black scholes | Discount rate | 4.3% - 4.4% / 4.3% | Increase |
| | | | Term | 2.0 - 5.0 / 3.0 | Increase |
| | | | Volatility | 50.0% - 100.0% / 72.7% | Increase |
| Preferred Securities | $339,334 | Market comparable | Enterprise value/Revenue multiple (EV/R) | 1.5 | Increase |
| | | Market approach | Transaction price | $100.00 | Increase |
| | | | Discount rate | 35.4% - 37.9% / 37.3% | Decrease |
| | | | Probability rate | 0.0% - 50.0% / 34.6% | Increase |
| | | Recovery value | Recovery value | $0.00 | Increase |
| | | Black scholes | Discount rate | 4.3% - 5.0% / 4.4% | Increase |
| | | | Term | 0.1 - 2.1 / 0.9 | Increase |
| | | | Volatility | 50.0% - 100.0% / 61.1% | Increase |
A Represents the directional change in the fair value of the Level 3 investments that could have resulted from an increase in the corresponding input as of period end. A decrease to the unobservable input would have had the opposite effect. Significant changes in these inputs may have resulted in a significantly higher or lower fair value measurement at period end.
Changes in valuation techniques may result in transfers in or out of an assigned level within the disclosure hierarchy. The aggregate value of investments by input level as of December 31, 2024, as well as a roll forward of Level 3 investments, is included at the end of the Fund's Consolidated Schedule of Investments.
Foreign Currency. Certain Funds may use foreign currency contracts to facilitate transactions in foreign-denominated securities. Gains and losses from these transactions may arise from changes in the value of the foreign currency or if the counterparties do not perform under the contracts' terms.
Foreign-denominated assets, including investment securities, and liabilities are translated into U.S. dollars at the exchange rates at period end. Purchases and sales of investment securities, income and dividends received, and expenses denominated in foreign currencies are translated into U.S. dollars at the exchange rate in effect on the transaction date.
The effects of exchange rate fluctuations on investments are included with the net realized and unrealized gain (loss) on investment securities. Other foreign currency transactions resulting in realized and unrealized gain (loss) are disclosed separately.
Investment Transactions and Income. For financial reporting purposes, the Fund's investment holdings and NAV include trades executed through the end of the last business day of the period. The NAV per share for processing shareholder transactions is calculated as of the close of business of the New York Stock Exchange (NYSE), normally 4:00 p.m. Eastern time and includes trades executed through the end of the prior business day. Gains and losses on securities sold are determined on the basis of identified cost and include proceeds received from litigation. Commissions paid to certain brokers with whom the investment adviser, or its affiliates, places trades on behalf of a fund include an amount in addition to trade execution, which may be rebated back to a fund. Any such rebates are included in net realized gain (loss) on investments in the Consolidated Statement of Operations. Dividend income is recorded on the ex-dividend date, except for certain dividends from foreign securities where the ex-dividend date may have passed, which are recorded as soon as the Fund is informed of the ex-dividend date. Non-cash dividends included in dividend income, if any, are recorded at the fair market value of the securities received. Income and capital gain distributions from Fidelity Central Funds, if any, are recorded on the ex-dividend date. Certain distributions received by the Fund represent a return of capital or capital gain. The Fund determines the components of these distributions subsequent to the ex-dividend date, based upon receipt of tax filings or other correspondence relating to the underlying investment. These distributions are recorded as a reduction of cost of investments and/or as a realized gain. Interest income is accrued as earned and includes coupon interest and amortization of premium and accretion of discount on debt securities as applicable. Investment income is recorded net of foreign taxes withheld where recovery of such taxes is uncertain. Funds may file withholding tax reclaims in certain jurisdictions to recover a portion of amounts previously withheld. Any withholding tax reclaims income is included in the Consolidated Statement of Operations in dividends. Any receivables for withholding tax reclaims are included in the Consolidated Statement of Assets and Liabilities in dividends receivable.
Class Allocations and Expenses. Investment income, realized and unrealized capital gains and losses, common expenses of a fund, and certain fund-level expense reductions, if any, are allocated daily on a pro-rata basis to each class based on the relative net assets of each class to the total net assets of a fund. Each class differs with respect to transfer agent and distribution and service plan fees incurred, as applicable. Certain expense reductions may also differ by class, if applicable. For the reporting period, the allocated portion of income and expenses to each class as a percent of its average net assets may vary due to the timing of recording these transactions in relation to fluctuating net assets of the classes. Expenses directly attributable to a fund are charged to that fund. Expenses attributable to more than one fund are allocated among the respective funds on the basis of relative net assets or other appropriate methods. Expenses included in the accompanying consolidated financial statements reflect the expenses of that fund and do not include any expenses associated with any underlying mutual funds or exchange-traded funds (ETFs). Although not included in a fund's expenses, a fund indirectly bears its proportionate share of these expenses through the net asset value of each underlying mutual fund or exchange-traded fund (ETF). Expense estimates are accrued in the period to which they relate and adjustments are made when actual amounts are known.
Income Tax Information and Distributions to Shareholders. Each year, the Fund intends to qualify as a regulated investment company under Subchapter M of the Internal Revenue Code, including distributing substantially all of its taxable income and realized gains. As a result, no provision for U.S. Federal income taxes is required. During the period, the Fund incurred an excise tax liability on undistributed net investment income which is included in Miscellaneous expense on the Consolidated Statement of Operations. As of December 31, 2024, the Fund did not have any unrecognized tax benefits in the consolidated financial statements; nor is the Fund aware of any tax positions for which it is reasonably possible that the total amounts of unrecognized tax benefits will significantly change in the next twelve months. The Fund files a U.S. federal tax return, in addition to state and local tax returns as required. The Fund's federal income tax returns are subject to examination by the Internal Revenue Service (IRS) for a period of three fiscal years after they are filed. State and local tax returns may be subject to examination for an additional fiscal year depending on the jurisdiction. Foreign taxes are provided for based on the Fund's understanding of the tax rules and rates that exist in the foreign markets in which it invests. The Fund is subject to a tax imposed on capital gains by certain countries in which it invests. An estimated deferred tax liability for net unrealized appreciation on the applicable securities is included in Other payables and accrued expenses on the Consolidated Statement of Assets and Liabilities.
Distributions are declared and recorded on the ex-dividend date. Income and capital gain distributions are declared separately for each class. Income and capital gain distributions are determined in accordance with income tax regulations, which may differ from GAAP.
Capital accounts within the consolidated financial statements are adjusted for permanent book-tax differences. These adjustments have no impact on net assets or the results of operations. Capital accounts are not adjusted for temporary book-tax differences which will reverse in a subsequent period.
Book-tax differences are primarily due to foreign currency transactions, certain foreign taxes, passive foreign investment companies (PFIC), net operating losses, capital loss carryforwards and losses deferred due to wash sales.
As of period end, the cost and unrealized appreciation (depreciation) in securities, and derivatives if applicable, for federal income tax purposes were as follows:
| Gross unrealized appreciation | $2,069,793,739 |
| Gross unrealized depreciation | (62,877,630) |
| Net unrealized appreciation (depreciation) | $2,006,916,109 |
| Tax Cost | $1,892,281,778 |
The tax-based components of distributable earnings as of period end were as follows:
| Undistributed long-term capital gain | $48,907,242 |
| Net unrealized appreciation (depreciation) on securities and other investments | $2,006,910,047 |
The tax character of distributions paid was as follows:
| | December 31, 2024 | December 31, 2023 |
| Total | $- | $- |
Restricted Securities (including Private Placements). Funds may invest in securities that are subject to legal or contractual restrictions on resale. These securities generally may be resold in transactions exempt from registration or to the public if the securities are registered. Disposal of these securities may involve time-consuming negotiations and expense, and prompt sale at an acceptable price may be difficult. Information regarding restricted securities held at period end is included at the end of the Consolidated Schedule of Investments, if applicable.
Commitments. A commitment is an agreement to acquire an investment at a future date (subject to conditions) in connection with a potential public or non-public offering. Commitments outstanding at period end are presented in the table below. Unrealized appreciation (depreciation) on any commitments outstanding at period end is separately presented in the Consolidated Statement of Assets and Liabilities as Unrealized appreciation (depreciation) on unfunded commitments, and any change in unrealized appreciation (depreciation) on unfunded commitments during the period is separately presented in the Consolidated Statement of Operations, as applicable based on contractual conditions of each commitment.
| | Investment to be Acquired | Commitment Amount ($) | Unrealized Appreciation (Depreciation)($) |
| VIP Growth Opportunities Portfolio | Revolute Group Holdings, Ltd. | 3,879,678 | - |
| VIP Growth Opportunities Portfolio | Space Exploration Technologies Corp. Class A | 13,690 | - |
| VIP Growth Opportunities Portfolio | Space Exploration Technologies Corp. Class C | 300,810 | - |
Consolidated Subsidiary. The Funds included in the table below hold certain investments through a wholly-owned subsidiary ("Subsidiary"), which may be subject to federal and state taxes upon disposition.
As of period end, investments in Subsidiaries were as follows:
| | Amount ($) | % of Net Assets |
| VIP Growth Opportunities Portfolio | 476,487 | .01 |
The financial statements have been consolidated to include the Subsidiary accounts where applicable. Accordingly, all inter-company transactions and balances have been eliminated.
At period end, any estimated tax liability for these investments is presented as "Deferred taxes" in the Consolidated Statement of Assets and Liabilities and included in "Change in net unrealized appreciation (depreciation) on investment securities" in the Consolidated Statement of Operations. The tax liability incurred may differ materially depending on conditions when these investments are disposed. Any cash held by a Subsidiary is restricted as to its use and is presented as "Restricted cash" in the Consolidated Statement of Assets and Liabilities, if applicable.
New Accounting Pronouncement. FASB Accounting Standards Update (ASU) 2023-07 Segment Reporting (Topic 280): Improvements to Reportable Segment Disclosures became effective in this reporting period. ASU 2023-07 enhances segment information disclosure in the consolidated notes to financial statements.
4. Purchases and Sales of Investments.
Purchases and sales of securities, other than short-term securities and in-kind transactions, as applicable, are noted in the table below.
| | Purchases ($) | Sales ($) |
| VIP Growth Opportunities Portfolio | 1,967,276,389 | 2,039,982,076 |
5. Fees and Other Transactions with Affiliates.
Management Fee. Fidelity Management & Research Company LLC (the investment adviser) and its affiliates provide the Fund with investment management related services for which the Fund pays a monthly management fee.
Effective March 1, 2024, the Fund's management contract was amended to incorporate administrative services previously covered under separate services agreements (Transfer Agent and Accounting agreements). The amended contract incorporates a management fee rate that may vary by class. The investment adviser or an affiliate pays certain expenses of managing and operating the Fund out of each class's management fee. Each class of the Fund pays a management fee to the investment adviser. The management fee is calculated and paid to the investment adviser every month. When determining a class's management fee, a mandate rate is calculated based on the monthly average net assets of a group of funds advised by FMR within a designated asset class. A discount rate is subtracted from the mandate rate once the Fund's monthly average net assets reach a certain level. The mandate rate and discount rate may vary by class. The annual management fee rate for a class of shares of the Fund is the lesser of (1) the class's mandate rate reduced by the class's discount rate (if applicable) or (2) the amount set forth in the following table.
| | Maximum Management Fee Rate % |
| Initial Class | .58 |
| Service Class | .58 |
| Service Class 2 | .58 |
| Investor Class | .66 |
One-twelfth of the management fee rate for a class is applied to the average net assets of the class for the month, giving a dollar amount which is the management fee for the class for that month. A different management fee rate may be applicable to each class of the Fund. The difference between classes is the result of separate arrangements for class-level services and/or waivers of certain expenses. It is not the result of any difference in advisory or custodial fees or other expenses related to the management of the Fund's assets, which do not vary by class. For the portion of the reporting period on or after March 1, 2024, the total annualized management fee rates were as follows:
| | Total Management Fee Rate % |
| Initial Class | .56 |
| Service Class | .56 |
| Service Class 2 | .56 |
| Investor Class | .64 |
Prior to March 1, 2024, the management fee was the sum of an individual fund fee rate that was based on an annual rate of .30% of the Fund's average net assets and an annualized group fee rate that averaged .22% during the period. The group fee rate was based upon the monthly average net assets of a group of registered investment companies with which the investment adviser has management contracts. The group fee rate decreased as assets under management increased and increased as assets under management decreased. For the portion of the reporting period prior to March 1, 2024, the total annualized management fee rate was .52%.
Effective March 1, 2024, the Fund's sub-advisory agreements with FMR Investment Management (UK) Limited, Fidelity Management & Research (Hong Kong) Limited, and Fidelity Management & Research (Japan) Limited were amended to provide that the investment adviser pays each sub-adviser monthly fees equal to 110% of the sub-adviser's costs for providing sub-advisory services.
Distribution and Service Plan Fees. In accordance with Rule 12b-1 of the 1940 Act, the Fund has adopted separate 12b-1 Plans for each Service Class of shares. Each Service Class pays Fidelity Distributors Company LLC (FDC), an affiliate of the investment adviser, a service fee. For the period, the service fee is based on an annual rate of .10% of Service Class' average net assets and .25% of Service Class 2's average net assets.
For the period, total fees, all of which were re-allowed to insurance companies for the distribution of shares and providing shareholder support services, were as follows:
| Service Class | $155,208 |
| Service Class 2 | 3,783,815 |
| | $3,939,023 |
Transfer Agent Fees. Fidelity Investments Institutional Operations Company LLC (FIIOC), an affiliate of the investment adviser, is the Fund's transfer, dividend disbursing, and shareholder servicing agent. Effective March 1, 2024, the Fund's management contract was amended to incorporate transfer agent services and associated fees previously covered under a separate services agreement.
During the period January 1, 2024 through February 29, 2024, the transfer agent fees for each class were a fixed annual rate of class-level average net assets as follows:
| | Amount ($) | % of Class-Level Average Net Assets |
| Initial Class | 52,752 | .0630 |
| Service Class | 13,896 | .0630 |
| Service Class 2 | 139,339 | .0630 |
| Investor Class | 238,502 | .1390 |
| | 444,489 | |
Accounting Fees. Fidelity Service Company, Inc. (FSC), an affiliate of the investment adviser, maintains the Fund's accounting records. Effective March 1, 2024, the Fund's management contract was amended to incorporate accounting services and associated fees previously covered under a separate services agreement.
During the period January 1, 2024 through February 29, 2024, the accounting fees were a fixed annual rate of average net assets as follows:
| | % of Average Net Assets |
| VIP Growth Opportunities Portfolio | .0261 |
Brokerage Commissions. A portion of portfolio transactions were placed with brokerage firms which are affiliates of the investment adviser. Brokerage commissions are included in net realized gain (loss) and change in net unrealized appreciation (depreciation) in the Consolidated Statement of Operations. The commissions paid to these affiliated firms were as follows:
| | Amount ($) |
| VIP Growth Opportunities Portfolio | 26,840 |
Interfund Lending Program. Pursuant to an Exemptive Order issued by the Securities and Exchange Commission (the SEC), the Fund, along with other registered investment companies having management contracts with Fidelity Management & Research Company LLC (FMR), or other affiliated entities of FMR, may participate in an interfund lending program. This program provides an alternative credit facility allowing the Fund to borrow from, or lend money to, other participating affiliated funds at rates that are beneficial to both the borrowing and lending fund. Borrowings under the program are generally for temporary or emergency purposes, including meeting fund shareholder redemptions. The interfund loan rate is determined, as specified in the Exemptive Order, by averaging, (1) the higher of the overnight time deposit rate and the current overnight repurchase agreement rate, and (2) a benchmark rate representing the lowest bank loan rate available to the funds. At period end, there were no interfund loans outstanding. Activity in this program during the period for which loans were outstanding was as follows:
| | Borrower or Lender | Average Loan Balance ($) | Weighted Average Interest Rate | Interest Expense ($) |
| VIP Growth Opportunities Portfolio | Borrower | 9,110,000 | 5.57% | 1,410 |
Interfund Trades. Funds may purchase from or sell securities to other Fidelity Funds under procedures adopted by the Board. The procedures have been designed to ensure these interfund trades are executed in accordance with Rule 17a-7 of the 1940 Act. Any interfund trades are included within the respective purchases and sales amounts shown in the Purchases and Sales of Investments note. Interfund trades during the period are noted in the table below.
| | Purchases ($) | Sales ($) | Realized Gain (Loss) ($) |
| VIP Growth Opportunities Portfolio | 138,642,571 | 144,906,626 | 11,863,932 |
6. Committed Line of Credit.
Certain Funds participate with other funds managed by the investment adviser or an affiliate in a $4.25 billion credit facility (the "line of credit") to be utilized for temporary or emergency purposes to fund shareholder redemptions or for other short-term liquidity purposes.
Commitment fees are charged based on the unused amount of the line of credit at an annual rate of .10%, and then allocated to each participating fund based on its pro-rata portion of the line of credit. The commitment fees are reflected in Miscellaneous expenses on the Consolidated Statement of Operations, and are listed below.
Interest is charged to a participating fund based on its borrowings at an annual rate of .75% plus the highest of (i) daily SOFR plus a .10% spread adjustment, (ii) Federal Funds Effective Rate, or (iii) Overnight Bank Funding Rate. During the period, there were no borrowings on this line of credit.
The line of credit agreement will expire in March 2025 unless extended or renewed.
| | Amount ($) |
| VIP Growth Opportunities Portfolio | 4,978 |
7. Security Lending.
Funds lend portfolio securities from time to time in order to earn additional income. Lending agents are used, including National Financial Services (NFS), an affiliate of the investment adviser. Pursuant to a securities lending agreement, NFS will receive a fee, which is capped at 9.9% of a fund's daily lending revenue, for its services as lending agent. A fund may lend securities to certain qualified borrowers, including NFS. On the settlement date of the loan, a fund receives collateral (in the form of U.S. Treasury obligations, letters of credit and/or cash) against the loaned securities and maintains collateral in an amount not less than 100% of the market value of the loaned securities during the period of the loan. The market value of the loaned securities is determined at the close of business of a fund and any additional required collateral is delivered to a fund on the next business day. A fund or borrower may terminate the loan at any time, and if the borrower defaults on its obligation to return the securities loaned because of insolvency or other reasons, a fund may apply collateral received from the borrower against the obligation. A fund may experience delays and costs in recovering the securities loaned. Any cash collateral received is invested in the Fidelity Securities Lending Cash Central Fund. Any loaned securities are identified as such in the Consolidated Schedule of Investments, and the value of loaned securities and cash collateral at period end, as applicable, are presented in the Consolidated Statement of Assets and Liabilities. Security lending income represents the income earned on investing cash collateral, less rebates paid to borrowers and any lending agent fees associated with the loan, plus any premium payments received for lending certain types of securities. Security lending income is presented in the Consolidated Statement of Operations as a component of income from Fidelity Central Funds. Affiliated security lending activity, if any, was as follows:
| | Total Security Lending Fees Paid to NFS ($) | Security Lending Income From Securities Loaned to NFS ($) | Value of Securities Loaned to NFS at Period End ($) |
| VIP Growth Opportunities Portfolio | 5,286 | 232 | 68,759 |
8. Expense Reductions.
During the period the investment adviser or an affiliate reimbursed and/or waived a portion of fund-level operating expenses in the amount of $130,606.
9. Share Transactions.
Transactions for each class of shares were as follows and may contain in-kind transactions:
| | Shares | Shares | Dollars | Dollars |
| | Year ended December 31, 2024 | Year ended December 31, 2023 | Year ended December 31, 2024 | Year ended December 31, 2023 |
| VIP Growth Opportunities Portfolio | | | | |
| Initial Class | | | | |
| Shares sold | 1,324,892 | 2,734,097 | $94,401,829 | $130,903,171 |
| Shares redeemed | (1,132,781) | (843,898) | (80,226,869) | (42,949,143) |
| Net increase (decrease) | 192,111 | 1,890,199 | $14,174,960 | $87,954,028 |
| Service Class | | | | |
| Shares sold | 617,996 | 215,317 | $44,848,430 | $10,938,827 |
| Shares redeemed | (682,072) | (383,143) | (49,176,736) | (19,801,069) |
| Net increase (decrease) | (64,076) | (167,826) | $(4,328,306) | $(8,862,242) |
| Service Class 2 | | | | |
| Shares sold | 3,126,487 | 3,293,059 | $218,220,043 | $162,980,099 |
| Shares redeemed | (3,681,358) | (3,307,538) | (260,907,070) | (164,424,617) |
| Net increase (decrease) | (554,871) | (14,479) | $(42,687,027) | $(1,444,518) |
| Investor Class | | | | |
| Shares sold | 1,131,958 | 1,312,111 | $83,865,692 | $66,091,634 |
| Shares redeemed | (1,714,694) | (1,564,824) | (119,777,754) | (77,927,431) |
| Net increase (decrease) | (582,736) | (252,713) | $(35,912,062) | $(11,835,797) |
10. Other.
A fund's organizational documents provide former and current trustees and officers with a limited indemnification against liabilities arising in connection with the performance of their duties to the fund. In the normal course of business, a fund may also enter into contracts that provide general indemnifications. A fund's maximum exposure under these arrangements is unknown as this would be dependent on future claims that may be made against a fund. The risk of material loss from such claims is considered remote.
At the end of the period, the investment adviser or its affiliates were owners of record of more than 10% and certain otherwise unaffiliated shareholders were owners of record of more than 10% of the outstanding shares as follows:
| Fund | Affiliated % | Number of Unaffiliated Shareholders | Unaffiliated Shareholders % |
| VIP Growth Opportunities Portfolio | 40% | 1 | 39% |
11. Risk and Uncertainties.
Many factors affect a fund's performance. Developments that disrupt global economies and financial markets, such as pandemics, epidemics, outbreaks of infectious diseases, war, terrorism, and environmental disasters, may significantly affect a fund's investment performance. The effects of these developments to a fund will be impacted by the types of securities in which a fund invests, the financial condition, industry, economic sector, and geographic location of an issuer, and a fund's level of investment in the securities of that issuer. Significant concentrations in security types, issuers, industries, sectors, and geographic locations may magnify the factors that affect a fund's performance.
Report of Independent Registered Public Accounting Firm
To the Board of Trustees of Variable Insurance Products Fund III and the Shareholders of VIP Growth Opportunities Portfolio:
Opinion on the Financial Statements and Financial Highlights
We have audited the accompanying consolidated statement of assets and liabilities of VIP Growth Opportunities Portfolio (the "Fund"), a fund of Variable Insurance Products Fund III, including the consolidated schedule of investments, as of December 31, 2024, the related consolidated statement of operations for the year then ended, the consolidated statement of changes in net assets for each of the two years in the period then ended, the consolidated financial highlights for each of the five years in the period then ended, and the related notes (collectively referred to as the "financial statements"). In our opinion, the financial statements and financial highlights present fairly, in all material respects, the financial position of the Fund as of December 31, 2024, and the results of its operations for the year then ended, the changes in its net assets for each of the two years in the period then ended, and the financial highlights for each of the five years in the period then ended in conformity with accounting principles generally accepted in the United States of America.
Basis for Opinion
These financial statements and financial highlights are the responsibility of the Fund's management. Our responsibility is to express an opinion on the Fund's financial statements and financial highlights based on our audits. We are a public accounting firm registered with the Public Company Accounting Oversight Board (United States) (PCAOB) and are required to be independent with respect to the Fund in accordance with the U.S. federal securities laws and the applicable rules and regulations of the Securities and Exchange Commission and the PCAOB.
We conducted our audits in accordance with the standards of the PCAOB. Those standards require that we plan and perform the audit to obtain reasonable assurance about whether the financial statements and financial highlights are free of material misstatement, whether due to error or fraud. The Fund is not required to have, nor were we engaged to perform, an audit of its internal control over financial reporting. As part of our audits, we are required to obtain an understanding of internal control over financial reporting but not for the purpose of expressing an opinion on the effectiveness of the Fund's internal control over financial reporting. Accordingly, we express no such opinion.
Our audits included performing procedures to assess the risks of material misstatement of the financial statements and financial highlights, whether due to error or fraud, and performing procedures that respond to those risks. Such procedures included examining, on a test basis, evidence regarding the amounts and disclosures in the financial statements and financial highlights. Our audits also included evaluating the accounting principles used and significant estimates made by management, as well as evaluating the overall presentation of the financial statements and financial highlights. Our procedures included confirmation of securities owned as of December 31, 2024, by correspondence with the custodian and brokers; when replies were not received from brokers, we performed other auditing procedures. We believe that our audits provide a reasonable basis for our opinion.
/s/ Deloitte & Touche LLP
Boston, Massachusetts
February 13, 2025
We have served as the auditor of one or more of the Fidelity investment companies since 1999.
Distributions
(Unaudited)The dividend and capital gains distributions for the fund(s) are available on Fidelity.com or Institutional.Fidelity.com.
The fund hereby designates as a capital gain dividend with respect to the taxable year ended December 31, 2024, $48,907,242, or, if subsequently determined to be different, the net capital gain of such year.
Item 8: Changes in and Disagreements with Accountants for Open-End Management Investment Companies
(Unaudited)
Note: This is not applicable for any fund included in this document.
Item 9: Proxy Disclosures for Open-End Management Investment Companies
(Unaudited)
| A special meeting of shareholders was held on July 16, 2024. The results of votes taken among shareholders on the proposal before them are reported below. Each vote reported represents one dollar of net asset value held on the record date for the meeting. |
| Proposal 1 |
| To elect a Board of Trustees. |
| | # of Votes | % of Votes |
| Bettina Doulton |
| Affirmative | 19,815,631,510.17 | 96.35 |
| Withheld | 749,708,334.02 | 3.65 |
| TOTAL | 20,565,339,844.19 | 100.00 |
| Robert A. Lawrence |
| Affirmative | 19,766,714,617.58 | 96.12 |
| Withheld | 798,625,226.62 | 3.88 |
| TOTAL | 20,565,339,844.19 | 100.00 |
| Vijay C. Advani |
| Affirmative | 19,788,320,252.27 | 96.22 |
| Withheld | 777,019,591.92 | 3.78 |
| TOTAL | 20,565,339,844.19 | 100.00 |
| Thomas P. Bostick |
| Affirmative | 19,780,566,370.66 | 96.18 |
| Withheld | 784,773,473.53 | 3.82 |
| TOTAL | 20,565,339,844.19 | 100.00 |
| Donald F. Donahue |
| Affirmative | 19,723,882,404.02 | 95.91 |
| Withheld | 841,457,440.18 | 4.09 |
| TOTAL | 20,565,339,844.19 | 100.00 |
| Vicki L. Fuller |
| Affirmative | 19,823,019,040.62 | 96.39 |
| Withheld | 742,320,803.57 | 3.61 |
| TOTAL | 20,565,339,844.19 | 100.00 |
| Patricia L. Kampling |
| Affirmative | 19,837,563,936.04 | 96.46 |
| Withheld | 727,775,908.15 | 3.54 |
| TOTAL | 20,565,339,844.19 | 100.00 |
| Thomas A. Kennedy |
| Affirmative | 19,789,564,999.11 | 96.23 |
| Withheld | 775,774,845.08 | 3.77 |
| TOTAL | 20,565,339,844.19 | 100.00 |
| Oscar Munoz |
| Affirmative | 19,772,385,801.51 | 96.14 |
| Withheld | 792,954,042.68 | 3.86 |
| TOTAL | 20,565,339,844.19 | 100.00 |
| Karen B. Peetz |
| Affirmative | 19,804,495,604.67 | 96.30 |
| Withheld | 760,844,239.52 | 3.70 |
| TOTAL | 20,565,339,844.19 | 100.00 |
| David M. Thomas |
| Affirmative | 19,717,117,994.71 | 95.88 |
| Withheld | 848,221,849.48 | 4.12 |
| TOTAL | 20,565,339,844.19 | 100.00 |
| Susan Tomasky |
| Affirmative | 19,783,626,171.89 | 96.20 |
| Withheld | 781,713,672.31 | 3.80 |
| TOTAL | 20,565,339,844.19 | 100.00 |
| Michael E. Wiley |
| Affirmative | 19,728,139,900.50 | 95.93 |
| Withheld | 837,199,943.69 | 4.07 |
| TOTAL | 20,565,339,844.19 | 100.00 |
| | | |
| Proposal 1 reflects trust-wide proposal and voting results. |
Item 10: Remuneration Paid to Directors, Officers, and others of Open-End Management Investment Companies
(Unaudited)
Note: This information is disclosed as part of the consolidated financial statements for each Fund as part of Item 7: Consolidated Financial Statements and Consolidated Financial Highlights for Open-End Management Investment companies.
Item 11: Statement Regarding Basis for Approval of Investment Advisory Contract
(Unaudited)
Note: This is not applicable for any fund included in this document.
1.540209.127
VIPGRO-ANN-0325
Fidelity® Variable Insurance Products:
VIP Growth & Income Portfolio
Annual Report
December 31, 2024
Contents
To view a fund's proxy voting guidelines and proxy voting record for the 12-month period ended June 30, visit http://www.fidelity.com/proxyvotingresults or visit the Securities and Exchange Commission's (SEC) web site at http://www.sec.gov.
You may also call 1-877-208-0098 to request a free copy of the proxy voting guidelines.
Fidelity® Variable Insurance Products are separate account options which are purchased through a variable insurance contract.
Standard & Poor's, S&P and S&P 500 are registered service marks of The McGraw-Hill Companies, Inc. and have been licensed for use by Fidelity Distributors Corporation.
Other third-party marks appearing herein are the property of their respective owners.
All other marks appearing herein are registered or unregistered trademarks or service marks of FMR LLC or an affiliated company. © 2025 FMR LLC. All rights reserved.
This report and the financial statements contained herein are submitted for the general information of the shareholders of the Fund. This report is not authorized for distribution to prospective investors in the Fund unless preceded or accompanied by an effective prospectus.
A fund files its complete schedule of portfolio holdings with the SEC for the first and third quarters of each fiscal year on Form N-PORT. Forms N-PORT are available on the SEC's web site at http://www.sec.gov. A fund's Forms N-PORT may be reviewed and copied at the SEC's Public Reference Room in Washington, DC. Information regarding the operation of the SEC's Public Reference Room may be obtained by calling 1-800-SEC-0330.
For a complete list of a fund's portfolio holdings, view the most recent holdings listing, semiannual report, or annual report on Fidelity's web site at http://www.fidelity.com, http://www.institutional.fidelity.com, or http://www.401k.com, as applicable.
NOT FDIC INSURED •MAY LOSE VALUE •NO BANK GUARANTEE
Neither the Fund nor Fidelity Distributors Corporation is a bank.
Item 7: Financial Statements and Financial Highlights for Open-End Management Investment Companies (Annual Report)
VIP Growth & Income Portfolio
Schedule of Investments December 31, 2024
Showing Percentage of Net Assets
| Common Stocks - 96.0% |
| | | Shares | Value ($) |
| BELGIUM - 0.9% | | | |
| Health Care - 0.9% | | | |
| Pharmaceuticals - 0.9% | | | |
| UCB SA | | 114,700 | 22,835,665 |
| CANADA - 1.5% | | | |
| Energy - 1.2% | | | |
| Oil, Gas & Consumable Fuels - 1.2% | | | |
| Imperial Oil Ltd | | 453,400 | 27,943,029 |
| South Bow Corp | | 74,200 | 1,750,923 |
| | | | 29,693,952 |
| Financials - 0.3% | | | |
| Capital Markets - 0.3% | | | |
| Brookfield Corp Class A (United States) | | 127,145 | 7,304,480 |
| Insurance - 0.0% | | | |
| Brookfield Wealth Solutions Ltd Class A (United States) (b) | | 548 | 31,477 |
TOTAL FINANCIALS | | | 7,335,957 |
| | | | |
| TOTAL CANADA | | | 37,029,909 |
| FRANCE - 0.8% | | | |
| Consumer Staples - 0.3% | | | |
| Beverages - 0.3% | | | |
| Pernod Ricard SA | | 61,000 | 6,887,367 |
| Remy Cointreau SA | | 9,428 | 570,334 |
| | | | 7,457,701 |
| Industrials - 0.4% | | | |
| Aerospace & Defense - 0.4% | | | |
| Airbus SE | | 61,600 | 9,864,070 |
| Information Technology - 0.1% | | | |
| Software - 0.1% | | | |
| Dassault Systemes SE | | 60,400 | 2,090,077 |
| TOTAL FRANCE | | | 19,411,848 |
| GERMANY - 1.5% | | | |
| Consumer Discretionary - 0.1% | | | |
| Textiles, Apparel & Luxury Goods - 0.1% | | | |
| Puma SE | | 51,502 | 2,368,103 |
| Information Technology - 1.4% | | | |
| Software - 1.4% | | | |
| SAP SE ADR | | 138,400 | 34,075,464 |
| TOTAL GERMANY | | | 36,443,567 |
| INDIA - 0.1% | | | |
| Financials - 0.1% | | | |
| Banks - 0.1% | | | |
| HDFC Bank Ltd/Gandhinagar ADR | | 29,500 | 1,883,870 |
| ITALY - 0.1% | | | |
| Consumer Staples - 0.1% | | | |
| Beverages - 0.1% | | | |
| Davide Campari-Milano NV (b) | | 418,000 | 2,616,019 |
| KOREA (SOUTH) - 0.1% | | | |
| Information Technology - 0.1% | | | |
| Technology Hardware, Storage & Peripherals - 0.1% | | | |
| Samsung Electronics Co Ltd | | 73,750 | 2,621,042 |
| NETHERLANDS - 1.0% | | | |
| Communication Services - 0.5% | | | |
| Entertainment - 0.5% | | | |
| Universal Music Group NV | | 436,900 | 11,175,521 |
| Health Care - 0.2% | | | |
| Health Care Equipment & Supplies - 0.2% | | | |
| Koninklijke Philips NV depository receipt | | 242,014 | 6,127,794 |
| Information Technology - 0.3% | | | |
| Semiconductors & Semiconductor Equipment - 0.3% | | | |
| ASML Holding NV depository receipt | | 2,600 | 1,802,008 |
| BE Semiconductor Industries NV | | 36,600 | 5,015,772 |
| | | | 6,817,780 |
| TOTAL NETHERLANDS | | | 24,121,095 |
| PORTUGAL - 0.1% | | | |
| Energy - 0.1% | | | |
| Oil, Gas & Consumable Fuels - 0.1% | | | |
| Galp Energia SGPS SA | | 204,100 | 3,382,892 |
| SPAIN - 0.3% | | | |
| Communication Services - 0.3% | | | |
| Diversified Telecommunication Services - 0.3% | | | |
| Cellnex Telecom SA (c)(d) | | 203,000 | 6,412,069 |
| Industrials - 0.0% | | | |
| Transportation Infrastructure - 0.0% | | | |
| Aena SME SA (c)(d) | | 1,200 | 245,372 |
| TOTAL SPAIN | | | 6,657,441 |
| SWITZERLAND - 0.1% | | | |
| Health Care - 0.1% | | | |
| Health Care Equipment & Supplies - 0.0% | | | |
| Sonova Holding AG | | 690 | 225,273 |
| Pharmaceuticals - 0.1% | | | |
| Galderma Group AG (e) | | 18,810 | 2,085,878 |
| TOTAL SWITZERLAND | | | 2,311,151 |
| TAIWAN - 0.6% | | | |
| Information Technology - 0.6% | | | |
| Semiconductors & Semiconductor Equipment - 0.6% | | | |
| Taiwan Semiconductor Manufacturing Co Ltd ADR | | 76,100 | 15,028,989 |
| UNITED KINGDOM - 1.2% | | | |
| Consumer Staples - 0.5% | | | |
| Beverages - 0.3% | | | |
| Diageo PLC ADR | | 63,000 | 8,009,190 |
| Tobacco - 0.2% | | | |
| British American Tobacco PLC ADR | | 119,500 | 4,340,240 |
TOTAL CONSUMER STAPLES | | | 12,349,430 |
| | | | |
| Financials - 0.2% | | | |
| Capital Markets - 0.2% | | | |
| 3i Group PLC | | 107,200 | 4,771,820 |
| Industrials - 0.4% | | | |
| Professional Services - 0.4% | | | |
| RELX PLC | | 220,320 | 9,982,476 |
| Information Technology - 0.1% | | | |
| Software - 0.1% | | | |
| Sage Group PLC/The | | 209,700 | 3,341,923 |
| TOTAL UNITED KINGDOM | | | 30,445,649 |
| UNITED STATES - 87.0% | | | |
| Communication Services - 3.6% | | | |
| Diversified Telecommunication Services - 0.2% | | | |
| Verizon Communications Inc | | 113,880 | 4,554,061 |
| Entertainment - 0.7% | | | |
| Walt Disney Co/The | | 121,100 | 13,484,485 |
| Warner Music Group Corp Class A | | 98,600 | 3,056,600 |
| | | | 16,541,085 |
| Interactive Media & Services - 1.3% | | | |
| Alphabet Inc Class A | | 64,200 | 12,153,060 |
| Alphabet Inc Class C | | 50,300 | 9,579,132 |
| Meta Platforms Inc Class A | | 17,000 | 9,953,670 |
| | | | 31,685,862 |
| Media - 1.4% | | | |
| Comcast Corp Class A | | 907,662 | 34,064,555 |
TOTAL COMMUNICATION SERVICES | | | 86,845,563 |
| | | | |
| Consumer Discretionary - 1.9% | | | |
| Hotels, Restaurants & Leisure - 0.9% | | | |
| Booking Holdings Inc | | 545 | 2,707,789 |
| Churchill Downs Inc | | 16,400 | 2,190,056 |
| Domino's Pizza Inc | | 6,800 | 2,854,368 |
| Marriott International Inc/MD Class A1 | | 26,800 | 7,475,592 |
| Starbucks Corp | | 69,600 | 6,351,000 |
| | | | 21,578,805 |
| Household Durables - 0.1% | | | |
| Whirlpool Corp | | 20,700 | 2,369,736 |
| Specialty Retail - 0.8% | | | |
| Lowe's Cos Inc | | 77,117 | 19,032,476 |
| Textiles, Apparel & Luxury Goods - 0.1% | | | |
| NIKE Inc Class B | | 38,900 | 2,943,563 |
TOTAL CONSUMER DISCRETIONARY | | | 45,924,580 |
| | | | |
| Consumer Staples - 5.0% | | | |
| Beverages - 1.6% | | | |
| Coca-Cola Co/The | | 351,053 | 21,856,560 |
| Keurig Dr Pepper Inc | | 532,700 | 17,110,324 |
| PepsiCo Inc | | 2,900 | 440,974 |
| | | | 39,407,858 |
| Consumer Staples Distribution & Retail - 1.3% | | | |
| Sysco Corp | | 142,200 | 10,872,612 |
| Target Corp | | 52,400 | 7,083,432 |
| Walmart Inc (i) | | 145,000 | 13,100,750 |
| | | | 31,056,794 |
| Food Products - 0.0% | | | |
| Lamb Weston Holdings Inc | | 14,500 | 969,035 |
| Household Products - 0.2% | | | |
| Colgate-Palmolive Co | | 16,100 | 1,463,651 |
| Procter & Gamble Co/The | | 15,200 | 2,548,280 |
| | | | 4,011,931 |
| Personal Care Products - 1.7% | | | |
| Estee Lauder Cos Inc/The Class A | | 70,600 | 5,293,588 |
| Haleon PLC ADR | | 1,711,794 | 16,330,515 |
| Kenvue Inc | | 927,767 | 19,807,825 |
| | | | 41,431,928 |
| Tobacco - 0.2% | | | |
| Philip Morris International Inc | | 34,900 | 4,200,215 |
TOTAL CONSUMER STAPLES | | | 121,077,761 |
| | | | |
| Energy - 7.6% | | | |
| Oil, Gas & Consumable Fuels - 7.6% | | | |
| Enterprise Products Partners LP | | 40,400 | 1,266,944 |
| Exxon Mobil Corp | | 1,316,503 | 141,616,228 |
| Shell PLC ADR | | 674,500 | 42,257,425 |
| | | | 185,140,597 |
| Financials - 19.6% | | | |
| Banks - 13.5% | | | |
| Bank of America Corp | | 1,589,612 | 69,863,447 |
| Citigroup Inc | | 35,200 | 2,477,728 |
| JPMorgan Chase & Co | | 113,132 | 27,118,872 |
| M&T Bank Corp | | 74,700 | 14,044,347 |
| PNC Financial Services Group Inc/The | | 160,872 | 31,024,165 |
| US Bancorp | | 537,998 | 25,732,444 |
| Wells Fargo & Co | | 2,257,179 | 158,544,254 |
| | | | 328,805,257 |
| Capital Markets - 2.2% | | | |
| Charles Schwab Corp/The | | 14,000 | 1,036,140 |
| Intercontinental Exchange Inc | | 3,200 | 476,831 |
| KKR & Co Inc Class A | | 136,393 | 20,173,889 |
| Moody's Corp | | 5,400 | 2,556,198 |
| Morgan Stanley | | 9,283 | 1,167,059 |
| MSCI Inc | | 1,400 | 840,013 |
| Northern Trust Corp | | 217,545 | 22,298,363 |
| Raymond James Financial Inc | | 33,150 | 5,149,190 |
| | | | 53,697,683 |
| Financial Services - 2.8% | | | |
| Apollo Global Management Inc | | 6,500 | 1,073,540 |
| Global Payments Inc | | 44,500 | 4,986,670 |
| Mastercard Inc Class A | | 16,000 | 8,425,120 |
| Visa Inc Class A | | 167,876 | 53,055,531 |
| | | | 67,540,861 |
| Insurance - 1.1% | | | |
| American Financial Group Inc/OH | | 6,900 | 944,817 |
| Arthur J Gallagher & Co | | 27,600 | 7,834,260 |
| Chubb Ltd | | 26,200 | 7,239,060 |
| Marsh & McLennan Cos Inc | | 40,542 | 8,611,526 |
| The Travelers Companies, Inc. | | 18,600 | 4,480,554 |
| | | | 29,110,217 |
TOTAL FINANCIALS | | | 479,154,018 |
| | | | |
| Health Care - 9.8% | | | |
| Biotechnology - 0.1% | | | |
| Gilead Sciences Inc | | 18,000 | 1,662,660 |
| Health Care Equipment & Supplies - 1.8% | | | |
| Abbott Laboratories | | 38,500 | 4,354,735 |
| Becton Dickinson & Co | | 31,715 | 7,195,182 |
| Boston Scientific Corp (e) | | 359,063 | 32,071,507 |
| | | | 43,621,424 |
| Health Care Providers & Services - 4.3% | | | |
| Cardinal Health Inc | | 86,500 | 10,230,355 |
| Cigna Group/The | | 83,190 | 22,972,087 |
| Humana Inc | | 35,500 | 9,006,705 |
| McKesson Corp | | 32,488 | 18,515,236 |
| UnitedHealth Group Inc | | 89,100 | 45,072,126 |
| | | | 105,796,509 |
| Life Sciences Tools & Services - 0.6% | | | |
| Danaher Corp | | 60,500 | 13,887,775 |
| Thermo Fisher Scientific Inc | | 1,600 | 832,368 |
| | | | 14,720,143 |
| Pharmaceuticals - 3.0% | | | |
| Bristol-Myers Squibb Co | | 367,600 | 20,791,456 |
| Eli Lilly & Co (i) | | 22,000 | 16,984,000 |
| GSK PLC ADR | | 503,335 | 17,022,790 |
| Johnson & Johnson | | 109,156 | 15,786,141 |
| Royalty Pharma PLC Class A | | 98,800 | 2,520,388 |
| Zoetis Inc Class A | | 3,500 | 570,254 |
| | | | 73,675,029 |
TOTAL HEALTH CARE | | | 239,475,765 |
| | | | |
| Industrials - 14.7% | | | |
| Aerospace & Defense - 7.2% | | | |
| Boeing Co (e) | | 236,710 | 41,897,670 |
| GE Aerospace | | 665,331 | 110,970,557 |
| General Dynamics Corp | | 36,700 | 9,670,083 |
| Howmet Aerospace Inc | | 21,200 | 2,318,644 |
| Huntington Ingalls Industries Inc | | 36,400 | 6,878,508 |
| Textron Inc | | 23,200 | 1,774,568 |
| | | | 173,510,030 |
| Air Freight & Logistics - 1.1% | | | |
| Expeditors International of Washington Inc | | 2,095 | 232,063 |
| United Parcel Service Inc Class B | | 217,072 | 27,372,779 |
| | | | 27,604,842 |
| Building Products - 0.0% | | | |
| A O Smith Corp | | 2,600 | 177,345 |
| Commercial Services & Supplies - 0.7% | | | |
| GFL Environmental Inc Subordinate Voting Shares | | 359,300 | 16,017,214 |
| Veralto Corp | | 18,966 | 1,931,687 |
| | | | 17,948,901 |
| Electrical Equipment - 2.5% | | | |
| AMETEK Inc | | 7,300 | 1,315,898 |
| GE Vernova Inc (i) | | 164,107 | 53,979,716 |
| Regal Rexnord Corp | | 35,200 | 5,460,576 |
| Rockwell Automation Inc | | 5,100 | 1,457,529 |
| | | | 62,213,719 |
| Ground Transportation - 0.3% | | | |
| Knight-Swift Transportation Holdings Inc | | 150,038 | 7,958,016 |
| Machinery - 1.7% | | | |
| Allison Transmission Holdings Inc | | 89,400 | 9,660,564 |
| Cummins Inc | | 14,000 | 4,880,400 |
| Deere & Co | | 11,700 | 4,957,290 |
| Donaldson Co Inc (b) | | 185,947 | 12,523,531 |
| Nordson Corp | | 33,300 | 6,967,692 |
| Otis Worldwide Corp | | 22,643 | 2,096,968 |
| Stanley Black & Decker Inc | | 18,900 | 1,517,481 |
| | | | 42,603,926 |
| Professional Services - 0.2% | | | |
| Equifax Inc | | 17,500 | 4,459,875 |
| Trading Companies & Distributors - 1.0% | | | |
| Watsco Inc | | 42,592 | 20,183,923 |
| Wesco International Inc | | 18,800 | 3,402,048 |
| | | | 23,585,971 |
TOTAL INDUSTRIALS | | | 360,062,625 |
| | | | |
| Information Technology - 20.8% | | | |
| Electronic Equipment, Instruments & Components - 0.1% | | | |
| CDW Corp/DE | | 14,400 | 2,506,176 |
| IT Services - 0.6% | | | |
| Amdocs Ltd | | 52,700 | 4,486,878 |
| IBM Corporation | | 43,700 | 9,606,571 |
| | | | 14,093,449 |
| Semiconductors & Semiconductor Equipment - 8.0% | | | |
| Analog Devices Inc | | 41,500 | 8,817,090 |
| Applied Materials Inc | | 40,000 | 6,505,200 |
| Broadcom Inc (i) | | 104,100 | 24,134,544 |
| Lam Research Corp | | 95,000 | 6,861,850 |
| Marvell Technology Inc | | 311,900 | 34,449,355 |
| Microchip Technology Inc | | 13,500 | 774,225 |
| Micron Technology Inc | | 16,500 | 1,388,640 |
| NVIDIA Corp | | 746,650 | 100,267,629 |
| QUALCOMM Inc | | 48,500 | 7,450,570 |
| Teradyne Inc | | 37,900 | 4,772,368 |
| | | | 195,421,471 |
| Software - 8.7% | | | |
| Intuit Inc | | 20,400 | 12,821,400 |
| Microsoft Corp (i) | | 434,718 | 183,233,638 |
| Oracle Corp | | 103,800 | 17,297,232 |
| | | | 213,352,270 |
| Technology Hardware, Storage & Peripherals - 3.4% | | | |
| Apple Inc | | 313,612 | 78,534,717 |
| Dell Technologies Inc Class C | | 38,700 | 4,459,788 |
| | | | 82,994,505 |
TOTAL INFORMATION TECHNOLOGY | | | 508,367,871 |
| | | | |
| Materials - 0.4% | | | |
| Chemicals - 0.3% | | | |
| Air Products and Chemicals Inc | | 16,000 | 4,640,640 |
| International Flavors & Fragrances Inc | | 8,900 | 752,495 |
| PPG Industries Inc | | 14,400 | 1,720,080 |
| Sherwin-Williams Co/The | | 3,600 | 1,223,748 |
| | | | 8,336,963 |
| Metals & Mining - 0.1% | | | |
| Freeport-McMoRan Inc | | 53,800 | 2,048,704 |
TOTAL MATERIALS | | | 10,385,667 |
| | | | |
| Real Estate - 1.2% | | | |
| Industrial REITs - 0.0% | | | |
| Terreno Realty Corp | | 20,200 | 1,194,628 |
| Residential REITs - 0.2% | | | |
| Sun Communities Inc | | 31,100 | 3,824,367 |
| Specialized REITs - 1.0% | | | |
| American Tower Corp | | 71,200 | 13,058,792 |
| Crown Castle Inc | | 128,800 | 11,689,888 |
| Public Storage Operating Co | | 700 | 209,608 |
| | | | 24,958,288 |
TOTAL REAL ESTATE | | | 29,977,283 |
| | | | |
| Utilities - 2.4% | | | |
| Electric Utilities - 2.3% | | | |
| Constellation Energy Corp | | 12,433 | 2,781,386 |
| Duke Energy Corp | | 46,100 | 4,966,814 |
| Edison International | | 48,900 | 3,904,176 |
| Entergy Corp | | 65,800 | 4,988,956 |
| Eversource Energy | | 70,600 | 4,054,558 |
| Exelon Corp | | 37,000 | 1,392,680 |
| FirstEnergy Corp | | 28,700 | 1,141,686 |
| NextEra Energy Inc | | 12,100 | 867,449 |
| Southern Co/The | | 372,900 | 30,697,128 |
| | | | 54,794,833 |
| Multi-Utilities - 0.1% | | | |
| Sempra | | 35,800 | 3,140,376 |
TOTAL UTILITIES | | | 57,935,209 |
| | | | |
| TOTAL UNITED STATES | | | 2,124,346,939 |
| ZAMBIA - 0.7% | | | |
| Materials - 0.7% | | | |
| Metals & Mining - 0.7% | | | |
| First Quantum Minerals Ltd (e) | | 1,322,600 | 17,049,482 |
| TOTAL COMMON STOCKS (Cost $1,248,830,482) | | | 2,346,185,558 |
| | | | |
| Convertible Corporate Bonds - 0.1% |
| | | Principal Amount (a) | Value ($) |
| UNITED STATES - 0.1% | | | |
| Communication Services - 0.1% | | | |
| Interactive Media & Services - 0.1% | | | |
Snap Inc 0.125% 3/1/2028 (Cost $2,233,460) | | 2,807,000 | 2,297,529 |
| | | | |
| Convertible Preferred Stocks - 0.9% |
| | | Shares | Value ($) |
| UNITED STATES - 0.9% | | | |
| Industrials - 0.9% | | | |
| Aerospace & Defense - 0.9% | | | |
Boeing Co 6% (Cost $18,757,994) | | 365,900 | 22,510,168 |
| | | | |
| U.S. Treasury Obligations - 0.1% |
| | | Yield (%) (f) | Principal Amount (a) | Value ($) |
US Treasury Bills 0% 3/6/2025 (i) (Cost $2,894,774) | | 4.33 | 2,917,000 | 2,895,638 |
| | | | | |
| Money Market Funds - 2.9% |
| | | Yield (%) | Shares | Value ($) |
| Fidelity Cash Central Fund (g) | | 4.36 | 68,554,513 | 68,568,224 |
| Fidelity Securities Lending Cash Central Fund (g)(h) | | 4.35 | 2,407,020 | 2,407,261 |
| TOTAL MONEY MARKET FUNDS (Cost $70,975,485) | | | | 70,975,485 |
| | | | | |
| TOTAL INVESTMENT IN SECURITIES - 100.0% (Cost $1,343,692,195) | 2,444,864,378 |
NET OTHER ASSETS (LIABILITIES) - 0.0% | (655,495) |
| NET ASSETS - 100.0% | 2,444,208,883 |
| | |
| Written Options |
| | Counterparty | Number of Contracts | Notional Amount ($) | Exercise Price ($) | Expiration Date | Value ($) |
| Call Options | | | | | | |
| Broadcom Inc | Chicago Board Options Exchange | 199 | 4,613,616 | 270.00 | 03/21/25 | (145,768) |
| Eli Lilly & Co | Chicago Board Options Exchange | 16 | 1,235,200 | 900.00 | 02/21/25 | (12,120) |
| GE Vernova Inc | Chicago Board Options Exchange | 149 | 4,901,057 | 380.00 | 02/21/25 | (128,885) |
| Microsoft Corp | Chicago Board Options Exchange | 216 | 9,104,400 | 475.00 | 02/21/25 | (46,548) |
| Walmart Inc | Chicago Board Options Exchange | 389 | 3,514,615 | 100.00 | 02/21/25 | (28,592) |
| | | | | | | |
| | | | | | | (361,913) |
| Put Options | | | | | | |
| GE Vernova Inc | Chicago Board Options Exchange | 100 | 3,289,300 | 280.00 | 02/21/25 | (56,500) |
| | | | | | | |
| | | | | | | (56,500) |
| TOTAL WRITTEN OPTIONS | | | | | | (418,413) |
Legend
| (a) | Amount is stated in United States dollars unless otherwise noted. |
| (b) | Security or a portion of the security is on loan at period end. |
| (c) | Security is exempt from registration under Regulation S of the Securities Act of 1933 and may be resold to qualified foreign investors outside of the United States. At the end of the period, the value of securities amounted to $6,657,441 or 0.3% of net assets. |
| (d) | Security exempt from registration under Rule 144A of the Securities Act of 1933. These securities may be resold in transactions exempt from registration, normally to qualified institutional buyers. At the end of the period, the value of these securities amounted to $6,657,441 or 0.3% of net assets. |
| (f) | Yield represents either the annualized yield at the date of purchase, or the stated coupon rate, or, for floating and adjustable rate securities, the rate at period end. |
| (g) | Affiliated fund that is generally available only to investment companies and other accounts managed by Fidelity Investments. The rate quoted is the annualized seven-day yield of the fund at period end. A complete unaudited listing of the fund's holdings as of its most recent quarter end is available upon request. In addition, each Fidelity Central Fund's financial statements, which are not covered by the Fund's Report of Independent Registered Public Accounting Firm, are available on the SEC's website or upon request. |
| (h) | Investment made with cash collateral received from securities on loan. |
| (i) | Security or a portion of the security is pledged as collateral for options written. At period end, the value of securities pledged amounted to $26,263,827. |
Affiliated Central Funds
Fiscal year to date information regarding the Fund's investments in Fidelity Central Funds, including the ownership percentage, is presented below.
| Affiliate | Value, beginning of period ($) | Purchases ($) | Sales Proceeds ($) | Dividend Income ($) | Realized Gain (loss) ($) | Change in Unrealized appreciation (depreciation) ($) | Value, end of period ($) | Shares, end of period | % ownership, end of period |
| Fidelity Cash Central Fund | 36,914,512 | 335,066,685 | 303,412,787 | 1,871,990 | (186) | - | 68,568,224 | 68,554,513 | 0.1% |
| Fidelity Securities Lending Cash Central Fund | 20,155,460 | 355,984,952 | 373,733,151 | 62,305 | - | - | 2,407,261 | 2,407,020 | 0.0% |
| Total | 57,069,972 | 691,051,637 | 677,145,938 | 1,934,295 | (186) | - | 70,975,485 | 70,961,533 | |
| | | | | | | | | | |
Amounts in the dividend income column in the above table include any capital gain distributions from underlying funds, which are presented in the corresponding line item in the Statement of Operations, if applicable.
Amounts in the dividend income column for Fidelity Securities Lending Cash Central Fund represents the income earned on investing cash collateral, less rebates paid to borrowers and any lending agent fees associated with the loan, plus any premium payments received for lending certain types of securities.
Amounts included in the purchases and sales proceeds columns may include in-kind transactions, if applicable.
Investment Valuation
The following is a summary of the inputs used, as of December 31, 2024, involving the Fund's assets and liabilities carried at fair value. The inputs or methodology used for valuing securities may not be an indication of the risk associated with investing in those securities. For more information on valuation inputs, and their aggregation into the levels used below, please refer to the Investment Valuation section in the accompanying Notes to Financial Statements.
| Valuation Inputs at Reporting Date: |
| Description | Total ($) | Level 1 ($) | Level 2 ($) | Level 3 ($) |
Investments in Securities: | | | | |
|
| Common Stocks | | | | |
Communication Services | 104,433,153 | 86,845,563 | 17,587,590 | - |
Consumer Discretionary | 48,292,683 | 45,924,580 | 2,368,103 | - |
Consumer Staples | 143,500,911 | 140,884,892 | 2,616,019 | - |
Energy | 218,217,441 | 214,834,549 | 3,382,892 | - |
Financials | 493,145,665 | 488,373,845 | 4,771,820 | - |
Health Care | 270,750,375 | 270,750,375 | - | - |
Industrials | 380,154,543 | 360,307,997 | 19,846,546 | - |
Information Technology | 572,343,146 | 567,632,027 | 4,711,119 | - |
Materials | 27,435,149 | 27,435,149 | - | - |
Real Estate | 29,977,283 | 29,977,283 | - | - |
Utilities | 57,935,209 | 57,935,209 | - | - |
|
| Convertible Corporate Bonds | | | | |
Communication Services | 2,297,529 | - | 2,297,529 | - |
|
| Convertible Preferred Stocks | | | | |
Industrials | 22,510,168 | - | 22,510,168 | - |
|
| U.S. Treasury Obligations | 2,895,638 | - | 2,895,638 | - |
|
| Money Market Funds | 70,975,485 | 70,975,485 | - | - |
| Total Investments in Securities: | 2,444,864,378 | 2,361,876,954 | 82,987,424 | - |
Derivative Instruments: Liabilities | | | | |
Written Options | (418,413) | (418,413) | - | - |
| Total Liabilities | (418,413) | (418,413) | - | - |
| Total Derivative Instruments: | (418,413) | (418,413) | - | - |
Value of Derivative Instruments
The following table is a summary of the Fund's value of derivative instruments by primary risk exposure as of December 31, 2024. For additional information on derivative instruments, please refer to the Derivative Instruments section in the accompanying Notes to Financial Statements.
Primary Risk Exposure / Derivative Type | Value |
| Asset ($) | Liability ($) |
| Equity Risk | | |
Written Options (a) | 0 | (418,413) |
| Total Equity Risk | 0 | (418,413) |
| Total Value of Derivatives | 0 | (418,413) |
(a)Gross value is presented in the Statement of Assets and Liabilities in the written options, at value line-item.
Financial Statements
| Statement of Assets and Liabilities |
As of December 31, 2024 |
| Assets | | | | |
| Investment in securities, at value (including securities loaned of $2,275,218) - See accompanying schedule: | | | | |
Unaffiliated issuers (cost $1,272,716,710) | $ | 2,373,888,893 | | |
Fidelity Central Funds (cost $70,975,485) | | 70,975,485 | | |
| | | | | |
| | | | | |
| Total Investment in Securities (cost $1,343,692,195) | | | $ | 2,444,864,378 |
| Cash | | | | 8,646 |
| Foreign currency held at value (cost $561) | | | | 556 |
| Receivable for investments sold | | | | 987,454 |
| Receivable for fund shares sold | | | | 885,316 |
| Dividends receivable | | | | 2,585,240 |
| Interest receivable | | | | 1,170 |
| Distributions receivable from Fidelity Central Funds | | | | 265,418 |
| Prepaid expenses | | | | 2,111 |
| Other receivables | | | | 4,315 |
Total assets | | | | 2,449,604,604 |
| Liabilities | | | | |
| Payable for investments purchased | $ | 251,036 | | |
| Payable for fund shares redeemed | | 907,847 | | |
| Accrued management fee | | 1,011,728 | | |
| Distribution and service plan fees payable | | 293,096 | | |
| Written options, at value (premium received $760,510) | | 418,413 | | |
| Other payables and accrued expenses | | 106,850 | | |
| Collateral on securities loaned | | 2,406,751 | | |
| Total liabilities | | | | 5,395,721 |
| Net Assets | | | $ | 2,444,208,883 |
| Net Assets consist of: | | | | |
| Paid in capital | | | $ | 1,323,678,300 |
| Total accumulated earnings (loss) | | | | 1,120,530,583 |
| Net Assets | | | $ | 2,444,208,883 |
| | | | | |
| Net Asset Value and Maximum Offering Price | | | | |
| Initial Class : | | | | |
Net Asset Value, offering price and redemption price per share ($471,051,127 ÷ 15,417,899 shares) | | | $ | 30.55 |
| Service Class : | | | | |
Net Asset Value, offering price and redemption price per share ($140,795,612 ÷ 4,672,779 shares) | | | $ | 30.13 |
| Service Class 2 : | | | | |
Net Asset Value, offering price and redemption price per share ($1,322,750,637 ÷ 44,945,860 shares) | | | $ | 29.43 |
| Investor Class : | | | | |
Net Asset Value, offering price and redemption price per share ($509,611,507 ÷ 16,793,575 shares) | | | $ | 30.35 |
| Statement of Operations |
| Year ended December 31, 2024 |
| Investment Income | | | | |
| Dividends | | | $ | 42,430,910 |
| Interest | | | | 761,342 |
| Income from Fidelity Central Funds (including $62,305 from security lending) | | | | 1,934,295 |
| Total income | | | | 45,126,547 |
| Expenses | | | | |
| Management fee | $ | 11,321,538 | | |
| Transfer agent fees | | 284,261 | | |
| Distribution and service plan fees | | 3,362,209 | | |
| Accounting fees | | 97,351 | | |
| Custodian fees and expenses | | 81,939 | | |
| Independent trustees' fees and expenses | | 10,086 | | |
| Audit fees | | 72,540 | | |
| Legal | | 6,458 | | |
| Interest | | 9,164 | | |
| Miscellaneous | | 79,350 | | |
| Total expenses before reductions | | 15,324,896 | | |
| Expense reductions | | (103,736) | | |
| Total expenses after reductions | | | | 15,221,160 |
| Net Investment income (loss) | | | | 29,905,387 |
| Realized and Unrealized Gain (Loss) | | | | |
| Net realized gain (loss) on: | | | | |
| Investment Securities: | | | | |
| Unaffiliated issuers | | 173,269,053 | | |
| Fidelity Central Funds | | (186) | | |
| Foreign currency transactions | | (7,987) | | |
| Written options | | (2,525,492) | | |
| Total net realized gain (loss) | | | | 170,735,388 |
| Change in net unrealized appreciation (depreciation) on: | | | | |
| Investment Securities: | | | | |
| Unaffiliated issuers | | 258,904,527 | | |
| Assets and liabilities in foreign currencies | | (34,452) | | |
| Written options | | 1,550,276 | | |
| Total change in net unrealized appreciation (depreciation) | | | | 260,420,351 |
| Net gain (loss) | | | | 431,155,739 |
| Net increase (decrease) in net assets resulting from operations | | | $ | 461,061,126 |
| Statement of Changes in Net Assets |
| |
| | Year ended December 31, 2024 | | Year ended December 31, 2023 |
| Increase (Decrease) in Net Assets | | | | |
| Operations | | | | |
| Net investment income (loss) | $ | 29,905,387 | $ | 31,461,521 |
| Net realized gain (loss) | | 170,735,388 | | 84,934,185 |
| Change in net unrealized appreciation (depreciation) | | 260,420,351 | | 230,705,425 |
| Net increase (decrease) in net assets resulting from operations | | 461,061,126 | | 347,101,131 |
| Distributions to shareholders | | (190,688,973) | | (109,996,755) |
| | | | | |
| Share transactions - net increase (decrease) | | 9,193,357 | | (5,715,282) |
| Total increase (decrease) in net assets | | 279,565,510 | | 231,389,094 |
| | | | | |
| Net Assets | | | | |
| Beginning of period | | 2,164,643,373 | | 1,933,254,279 |
| End of period | $ | 2,444,208,883 | $ | 2,164,643,373 |
| | | | | |
| | | | | |
Financial Highlights
VIP Growth & Income Portfolio Initial Class |
| |
| Years ended December 31, | | 2024 | | 2023 | | 2022 | | 2021 | | 2020 |
Selected Per-Share Data | | | | | | | | | | |
| Net asset value, beginning of period | $ | 27.04 | $ | 24.02 | $ | 26.22 | $ | 22.36 | $ | 22.17 |
| Income from Investment Operations | | | | | | | | | | |
Net investment income (loss) A,B | | .44 | | .44 | | .42 | | .55 C | | .42 |
| Net realized and unrealized gain (loss) | | 5.61 | | 4.03 | | (1.70) | | 5.07 | | 1.23 |
| Total from investment operations | | 6.05 | | 4.47 | | (1.28) | | 5.62 | | 1.65 |
| Distributions from net investment income | | (.46) | | (.45) | | (.42) | | (.62) | | (.42) |
| Distributions from net realized gain | | (2.08) | | (1.00) | | (.50) | | (1.14) | | (1.03) |
| Total distributions | | (2.54) | | (1.45) | | (.92) | | (1.76) | | (1.46) D |
| Net asset value, end of period | $ | 30.55 | $ | 27.04 | $ | 24.02 | $ | 26.22 | $ | 22.36 |
Total Return E,F | | | | 18.72% | | (4.95)% | | 25.95% | | 7.85% |
Ratios to Average Net Assets B,G,H | | | | | | | | | | |
| Expenses before reductions | | .49% | | .52% | | .52% | | .52% | | .54% |
| Expenses net of fee waivers, if any | | | | .52% | | .52% | | .52% | | .54% |
| Expenses net of all reductions | | .49% | | .52% | | .52% | | .52% | | .53% |
| Net investment income (loss) | | 1.42% | | 1.71% | | 1.68% | | 2.18% C | | 2.18% |
| Supplemental Data | | | | | | | | | | |
| Net assets, end of period (000 omitted) | $ | 471,051 | $ | 406,860 | $ | 367,028 | $ | 439,309 | $ | 377,942 |
Portfolio turnover rate I | | | | 15% | | 10% | | 15% | | 26% |
ACalculated based on average shares outstanding during the period.
BNet investment income (loss) is affected by the timing of the declaration of dividends by any underlying mutual funds or exchange-traded funds (ETFs). Net investment income (loss) of any mutual funds or ETFs is not included in the Fund's net investment income (loss) ratio.
CNet investment income per share reflects one or more large, non-recurring dividend(s) which amounted to $.16 per share. Excluding such non-recurring dividend(s), the ratio of net investment income (loss) to average net assets would have been 1.55%.
DTotal distributions per share do not sum due to rounding.
ETotal returns do not reflect charges attributable to your insurance company's separate account. Inclusion of these charges would reduce the total returns shown.
FTotal returns would have been lower if certain expenses had not been reduced during the applicable periods shown.
GFees and expenses of any underlying mutual funds or exchange-traded funds (ETFs) are not included in the Fund's expense ratio. The Fund indirectly bears its proportionate share of these expenses. For additional expense information related to investments in Fidelity Central Funds, please refer to the "Investments in Fidelity Central Funds" note found in the Notes to Financial Statements section of the most recent Annual or Semi-Annual report.
HExpense ratios reflect operating expenses of the class. Expenses before reductions do not reflect amounts reimbursed, waived, or reduced through arrangements with the investment adviser, brokerage services, or other offset arrangements, if applicable, and do not represent the amount paid by the class during periods when reimbursements, waivers or reductions occur.
IAmount does not include the portfolio activity of any underlying mutual funds or exchange-traded funds (ETFs), derivatives or securities that mature within one year from acquisition.
VIP Growth & Income Portfolio Service Class |
| |
| Years ended December 31, | | 2024 | | 2023 | | 2022 | | 2021 | | 2020 |
Selected Per-Share Data | | | | | | | | | | |
| Net asset value, beginning of period | $ | 26.70 | $ | 23.73 | $ | 25.91 | $ | 22.12 | $ | 21.95 |
| Income from Investment Operations | | | | | | | | | | |
Net investment income (loss) A,B | | .40 | | .41 | | .39 | | .52 C | | .40 |
| Net realized and unrealized gain (loss) | | 5.54 | | 3.98 | | (1.67) | | 5.00 | | 1.21 |
| Total from investment operations | | 5.94 | | 4.39 | | (1.28) | | 5.52 | | 1.61 |
| Distributions from net investment income | | (.43) | | (.42) | | (.40) | | (.59) | | (.40) |
| Distributions from net realized gain | | (2.08) | | (1.00) | | (.50) | | (1.14) | | (1.03) |
| Total distributions | | (2.51) | | (1.42) | | (.90) | | (1.73) | | (1.44) D |
| Net asset value, end of period | $ | 30.13 | $ | 26.70 | $ | 23.73 | $ | 25.91 | $ | 22.12 |
Total Return E,F | | | | 18.62% | | (5.02)% | | 25.76% | | 7.74% |
Ratios to Average Net Assets B,G,H | | | | | | | | | | |
| Expenses before reductions | | .59% | | .62% | | .62% | | .62% | | .64% |
| Expenses net of fee waivers, if any | | | | .62% | | .62% | | .62% | | .64% |
| Expenses net of all reductions | | .59% | | .62% | | .62% | | .62% | | .63% |
| Net investment income (loss) | | 1.33% | | 1.61% | | 1.58% | | 2.08% C | | 2.08% |
| Supplemental Data | | | | | | | | | | |
| Net assets, end of period (000 omitted) | $ | 140,796 | $ | 126,496 | $ | 116,688 | $ | 128,601 | $ | 115,376 |
Portfolio turnover rate I | | | | 15% | | 10% | | 15% | | 26% |
ACalculated based on average shares outstanding during the period.
BNet investment income (loss) is affected by the timing of the declaration of dividends by any underlying mutual funds or exchange-traded funds (ETFs). Net investment income (loss) of any mutual funds or ETFs is not included in the Fund's net investment income (loss) ratio.
CNet investment income per share reflects one or more large, non-recurring dividend(s) which amounted to $.16 per share. Excluding such non-recurring dividend(s), the ratio of net investment income (loss) to average net assets would have been 1.45%.
DTotal distributions per share do not sum due to rounding.
ETotal returns do not reflect charges attributable to your insurance company's separate account. Inclusion of these charges would reduce the total returns shown.
FTotal returns would have been lower if certain expenses had not been reduced during the applicable periods shown.
GFees and expenses of any underlying mutual funds or exchange-traded funds (ETFs) are not included in the Fund's expense ratio. The Fund indirectly bears its proportionate share of these expenses. For additional expense information related to investments in Fidelity Central Funds, please refer to the "Investments in Fidelity Central Funds" note found in the Notes to Financial Statements section of the most recent Annual or Semi-Annual report.
HExpense ratios reflect operating expenses of the class. Expenses before reductions do not reflect amounts reimbursed, waived, or reduced through arrangements with the investment adviser, brokerage services, or other offset arrangements, if applicable, and do not represent the amount paid by the class during periods when reimbursements, waivers or reductions occur.
IAmount does not include the portfolio activity of any underlying mutual funds or exchange-traded funds (ETFs), derivatives or securities that mature within one year from acquisition.
VIP Growth & Income Portfolio Service Class 2 |
| |
| Years ended December 31, | | 2024 | | 2023 | | 2022 | | 2021 | | 2020 |
Selected Per-Share Data | | | | | | | | | | |
| Net asset value, beginning of period | $ | 26.13 | $ | 23.26 | $ | 25.42 | $ | 21.72 | $ | 21.58 |
| Income from Investment Operations | | | | | | | | | | |
Net investment income (loss) A,B | | .35 | | .37 | | .34 | | .48 C | | .37 |
| Net realized and unrealized gain (loss) | | 5.41 | | 3.88 | | (1.64) | | 4.92 | | 1.18 |
| Total from investment operations | | 5.76 | | 4.25 | | (1.30) | | 5.40 | | 1.55 |
| Distributions from net investment income | | (.39) | | (.38) | | (.36) | | (.55) | | (.38) |
| Distributions from net realized gain | | (2.08) | | (1.00) | | (.50) | | (1.14) | | (1.03) |
| Total distributions | | (2.46) D | | (1.38) | | (.86) | | (1.70) D | | (1.41) |
| Net asset value, end of period | $ | 29.43 | $ | 26.13 | $ | 23.26 | $ | 25.42 | $ | 21.72 |
Total Return E,F | | | | 18.41% | | (5.17)% | | 25.64% | | 7.59% |
Ratios to Average Net Assets B,G,H | | | | | | | | | | |
| Expenses before reductions | | .74% | | .77% | | .77% | | .77% | | .79% |
| Expenses net of fee waivers, if any | | | | .77% | | .77% | | .77% | | .79% |
| Expenses net of all reductions | | .74% | | .77% | | .77% | | .77% | | .78% |
| Net investment income (loss) | | 1.18% | | 1.46% | | 1.43% | | 1.94% C | | 1.93% |
| Supplemental Data | | | | | | | | | | |
| Net assets, end of period (000 omitted) | $ | 1,322,751 | $ | 1,206,355 | $ | 1,071,533 | $ | 1,137,635 | $ | 908,013 |
Portfolio turnover rate I | | | | 15% | | 10% | | 15% | | 26% |
ACalculated based on average shares outstanding during the period.
BNet investment income (loss) is affected by the timing of the declaration of dividends by any underlying mutual funds or exchange-traded funds (ETFs). Net investment income (loss) of any mutual funds or ETFs is not included in the Fund's net investment income (loss) ratio.
CNet investment income per share reflects one or more large, non-recurring dividend(s) which amounted to $.16 per share. Excluding such non-recurring dividend(s), the ratio of net investment income (loss) to average net assets would have been 1.30%.
DTotal distributions per share do not sum due to rounding.
ETotal returns do not reflect charges attributable to your insurance company's separate account. Inclusion of these charges would reduce the total returns shown.
FTotal returns would have been lower if certain expenses had not been reduced during the applicable periods shown.
GFees and expenses of any underlying mutual funds or exchange-traded funds (ETFs) are not included in the Fund's expense ratio. The Fund indirectly bears its proportionate share of these expenses. For additional expense information related to investments in Fidelity Central Funds, please refer to the "Investments in Fidelity Central Funds" note found in the Notes to Financial Statements section of the most recent Annual or Semi-Annual report.
HExpense ratios reflect operating expenses of the class. Expenses before reductions do not reflect amounts reimbursed, waived, or reduced through arrangements with the investment adviser, brokerage services, or other offset arrangements, if applicable, and do not represent the amount paid by the class during periods when reimbursements, waivers or reductions occur.
IAmount does not include the portfolio activity of any underlying mutual funds or exchange-traded funds (ETFs), derivatives or securities that mature within one year from acquisition.
VIP Growth & Income Portfolio Investor Class |
| |
| Years ended December 31, | | 2024 | | 2023 | | 2022 | | 2021 | | 2020 |
Selected Per-Share Data | | | | | | | | | | |
| Net asset value, beginning of period | $ | 26.87 | $ | 23.88 | $ | 26.07 | $ | 22.25 | $ | 22.07 |
| Income from Investment Operations | | | | | | | | | | |
Net investment income (loss) A,B | | .41 | | .42 | | .40 | | .53 C | | .41 |
| Net realized and unrealized gain (loss) | | 5.59 | | 4.00 | | (1.68) | | 5.03 | | 1.21 |
| Total from investment operations | | 6.00 | | 4.42 | | (1.28) | | 5.56 | | 1.62 |
| Distributions from net investment income | | (.44) | | (.43) | | (.40) | | (.60) | | (.41) |
| Distributions from net realized gain | | (2.08) | | (1.00) | | (.50) | | (1.14) | | (1.03) |
| Total distributions | | (2.52) | | (1.43) | | (.91) D | | (1.74) | | (1.44) |
| Net asset value, end of period | $ | 30.35 | $ | 26.87 | $ | 23.88 | $ | 26.07 | $ | 22.25 |
Total Return E,F | | | | 18.62% | | (5.01)% | | 25.80% | | 7.76% |
Ratios to Average Net Assets B,G,H | | | | | | | | | | |
| Expenses before reductions | | .57% | | .60% | | .60% | | .60% | | .61% |
| Expenses net of fee waivers, if any | | | | .59% | | .60% | | .60% | | .61% |
| Expenses net of all reductions | | .57% | | .59% | | .60% | | .60% | | .61% |
| Net investment income (loss) | | 1.35% | | 1.63% | | 1.60% | | 2.11% C | | 2.10% |
| Supplemental Data | | | | | | | | | | |
| Net assets, end of period (000 omitted) | $ | 509,612 | $ | 424,932 | $ | 378,005 | $ | 376,272 | $ | 283,497 |
Portfolio turnover rate I | | | | 15% | | 10% | | 15% | | 26% |
ACalculated based on average shares outstanding during the period.
BNet investment income (loss) is affected by the timing of the declaration of dividends by any underlying mutual funds or exchange-traded funds (ETFs). Net investment income (loss) of any mutual funds or ETFs is not included in the Fund's net investment income (loss) ratio.
CNet investment income per share reflects one or more large, non-recurring dividend(s) which amounted to $.16 per share. Excluding such non-recurring dividend(s), the ratio of net investment income (loss) to average net assets would have been 1.48%.
DTotal distributions per share do not sum due to rounding.
ETotal returns do not reflect charges attributable to your insurance company's separate account. Inclusion of these charges would reduce the total returns shown.
FTotal returns would have been lower if certain expenses had not been reduced during the applicable periods shown.
GFees and expenses of any underlying mutual funds or exchange-traded funds (ETFs) are not included in the Fund's expense ratio. The Fund indirectly bears its proportionate share of these expenses. For additional expense information related to investments in Fidelity Central Funds, please refer to the "Investments in Fidelity Central Funds" note found in the Notes to Financial Statements section of the most recent Annual or Semi-Annual report.
HExpense ratios reflect operating expenses of the class. Expenses before reductions do not reflect amounts reimbursed, waived, or reduced through arrangements with the investment adviser, brokerage services, or other offset arrangements, if applicable, and do not represent the amount paid by the class during periods when reimbursements, waivers or reductions occur.
IAmount does not include the portfolio activity of any underlying mutual funds or exchange-traded funds (ETFs), derivatives or securities that mature within one year from acquisition.
Notes to Financial Statements
For the period ended December 31, 2024
1. Organization.
VIP Growth & Income Portfolio (the Fund) is a fund of Variable Insurance Products Fund III (the Trust) and is authorized to issue an unlimited number of shares. The Trust is registered under the Investment Company Act of 1940, as amended (the 1940 Act), as an open-end management investment company organized as a Massachusetts business trust. Shares of the Fund may only be purchased by insurance companies for the purpose of funding variable annuity or variable life insurance contracts. The Fund offers the following classes of shares: Initial Class shares, Service Class shares, Service Class 2 shares and Investor Class shares. All classes have equal rights and voting privileges, except for matters affecting a single class.
2. Investments in Fidelity Central Funds.
Funds may invest in Fidelity Central Funds, which are open-end investment companies generally available only to other investment companies and accounts managed by the investment adviser and its affiliates. The Schedule of Investments lists any Fidelity Central Funds held as an investment as of period end, but does not include the underlying holdings of each Fidelity Central Fund. An investing fund indirectly bears its proportionate share of the expenses of the underlying Fidelity Central Funds.
Based on its investment objective, each Fidelity Central Fund may invest or participate in various investment vehicles or strategies that are similar to those of the investing fund. These strategies are consistent with the investment objectives of the investing fund and may involve certain economic risks which may cause a decline in value of each of the Fidelity Central Funds and thus a decline in the value of the investing fund.
| Fidelity Central Fund | Investment Manager | Investment Objective | Investment Practices | Expense RatioA |
| Fidelity Money Market Central Funds | Fidelity Management & Research Company LLC (FMR) | Each fund seeks to obtain a high level of current income consistent with the preservation of capital and liquidity. | Short-term Investments | Less than .005% |
A Expenses expressed as a percentage of average net assets and are as of each underlying Central Fund's most recent annual or semi-annual shareholder report.
A complete unaudited list of holdings for each Fidelity Central Fund is available upon request or at the Securities and Exchange Commission website at www.sec.gov. In addition, the financial statements of the Fidelity Central Funds which contain the significant accounting policies (including investment valuation policies) of those funds, and are not covered by the Report of Independent Registered Public Accounting Firm, are available on the Securities and Exchange Commission website or upon request.
3. Significant Accounting Policies.
The Fund is an investment company and applies the accounting and reporting guidance of the Financial Accounting Standards Board (FASB) Accounting Standards Codification Topic 946 Financial Services - Investment Companies. The financial statements have been prepared in conformity with accounting principles generally accepted in the United States of America (GAAP), which require management to make certain estimates and assumptions at the date of the financial statements. Actual results could differ from those estimates. The Fund operates as a single operating segment. The Fund's income, expenses, assets, and performance are regularly monitored and assessed as a whole by the investment adviser and other individuals responsible for oversight functions of the Trust, using the information presented in the financial statements and financial highlights. Subsequent events, if any, through the date that the financial statements were issued have been evaluated in the preparation of the financial statements. The Fund's Schedule of Investments lists any underlying mutual funds or exchange-traded funds (ETFs) but does not include the underlying holdings of these funds. The following summarizes the significant accounting policies of the Fund:
Investment Valuation. Investments are valued as of 4:00 p.m. Eastern time on the last calendar day of the period. The Board of Trustees (the Board) has designated the Fund's investment adviser as the valuation designee responsible for the fair valuation function and performing fair value determinations as needed. The investment adviser has established a Fair Value Committee (the Committee) to carry out the day-to-day fair valuation responsibilities and has adopted policies and procedures to govern the fair valuation process and the activities of the Committee. In accordance with these fair valuation policies and procedures, which have been approved by the Board, the Fund attempts to obtain prices from one or more third party pricing services or brokers to value its investments. When current market prices, quotations or currency exchange rates are not readily available or reliable, investments will be fair valued in good faith by the Committee, in accordance with the policies and procedures. Factors used in determining fair value vary by investment type and may include market or investment specific events, transaction data, estimated cash flows, and market observations of comparable investments. The frequency that the fair valuation procedures are used cannot be predicted and they may be utilized to a significant extent. The Committee manages the Fund's fair valuation practices and maintains the fair valuation policies and procedures. The Fund's investment adviser reports to the Board information regarding the fair valuation process and related material matters.
The Fund categorizes the inputs to valuation techniques used to value its investments into a disclosure hierarchy consisting of three levels as shown below:
Level 1 - unadjusted quoted prices in active markets for identical investments
Level 2 - other significant observable inputs (including quoted prices for similar investments, interest rates, prepayment speeds, etc.)
Level 3 - unobservable inputs (including the Fund's own assumptions based on the best information available)
Valuation techniques used to value the Fund's investments by major category are as follows:
Equity securities, including restricted securities, for which market quotations are readily available, are valued at the last reported sale price or official closing price as reported by a third party pricing service on the primary market or exchange on which they are traded and are categorized as Level 1 in the hierarchy. In the event there were no sales during the day or closing prices are not available, securities are valued at the last quoted bid price or may be valued using the last available price and are generally categorized as Level 2 in the hierarchy. For foreign equity securities, when market or security specific events arise, comparisons to the valuation of American Depositary Receipts (ADRs), futures contracts, Exchange-Traded Funds (ETFs) and certain indexes as well as quoted prices for similar securities may be used and would be categorized as Level 2 in the hierarchy. For equity securities, including restricted securities, where observable inputs are limited, assumptions about market activity and risk are used and these securities may be categorized as Level 3 in the hierarchy.
Debt securities, including restricted securities, are valued based on evaluated prices received from third party pricing services or from brokers who make markets in such securities. Corporate bonds and U.S. government and government agency obligations are valued by pricing services who utilize matrix pricing which considers yield or price of bonds of comparable quality, coupon, maturity and type or by broker-supplied prices. When independent prices are unavailable or unreliable, debt securities may be valued utilizing pricing methodologies which consider similar factors that would be used by third party pricing services. Debt securities are generally categorized as Level 2 in the hierarchy but may be Level 3 depending on the circumstances.
Exchange-traded options are valued using the last sale price or, in the absence of a sale, the last offering price and are categorized as Level 1 in the hierarchy. Investments in open-end mutual funds, including the Fidelity Central Funds, are valued at their closing net asset value (NAV) each business day and are categorized as Level 1 in the hierarchy.
Changes in valuation techniques may result in transfers in or out of an assigned level within the disclosure hierarchy. The aggregate value of investments by input level as of December 31, 2024 is included at the end of the Fund's Schedule of Investments.
Foreign Currency. Certain Funds may use foreign currency contracts to facilitate transactions in foreign-denominated securities. Gains and losses from these transactions may arise from changes in the value of the foreign currency or if the counterparties do not perform under the contracts' terms.
Foreign-denominated assets, including investment securities, and liabilities are translated into U.S. dollars at the exchange rates at period end. Purchases and sales of investment securities, income and dividends received, and expenses denominated in foreign currencies are translated into U.S. dollars at the exchange rate in effect on the transaction date.
The effects of exchange rate fluctuations on investments are included with the net realized and unrealized gain (loss) on investment securities. Other foreign currency transactions resulting in realized and unrealized gain (loss) are disclosed separately.
Investment Transactions and Income. For financial reporting purposes, the Fund's investment holdings and NAV include trades executed through the end of the last business day of the period. The NAV per share for processing shareholder transactions is calculated as of the close of business of the New York Stock Exchange (NYSE), normally 4:00 p.m. Eastern time and includes trades executed through the end of the prior business day. Gains and losses on securities sold are determined on the basis of identified cost and include proceeds received from litigation. Commissions paid to certain brokers with whom the investment adviser, or its affiliates, places trades on behalf of a fund include an amount in addition to trade execution, which may be rebated back to a fund. Any such rebates are included in net realized gain (loss) on investments in the Statement of Operations. Dividend income is recorded on the ex-dividend date, except for certain dividends from foreign securities where the ex-dividend date may have passed, which are recorded as soon as the Fund is informed of the ex-dividend date. Non-cash dividends included in dividend income, if any, are recorded at the fair market value of the securities received. Income and capital gain distributions from Fidelity Central Funds, if any, are recorded on the ex-dividend date. Certain distributions received by the Fund represent a return of capital or capital gain. The Fund determines the components of these distributions subsequent to the ex-dividend date, based upon receipt of tax filings or other correspondence relating to the underlying investment. These distributions are recorded as a reduction of cost of investments and/or as a realized gain. Interest income is accrued as earned and includes coupon interest and amortization of premium and accretion of discount on debt securities as applicable. Investment income is recorded net of foreign taxes withheld where recovery of such taxes is uncertain. Funds may file withholding tax reclaims in certain jurisdictions to recover a portion of amounts previously withheld. Any withholding tax reclaims income is included in the Statement of Operations in dividends. Any receivables for withholding tax reclaims are included in the Statement of Assets and Liabilities in dividends receivable.
Class Allocations and Expenses. Investment income, realized and unrealized capital gains and losses, common expenses of a fund, and certain fund-level expense reductions, if any, are allocated daily on a pro-rata basis to each class based on the relative net assets of each class to the total net assets of a fund. Each class differs with respect to transfer agent and distribution and service plan fees incurred, as applicable. Certain expense reductions may also differ by class, if applicable. For the reporting period, the allocated portion of income and expenses to each class as a percent of its average net assets may vary due to the timing of recording these transactions in relation to fluctuating net assets of the classes. Expenses directly attributable to a fund are charged to that fund. Expenses attributable to more than one fund are allocated among the respective funds on the basis of relative net assets or other appropriate methods. Expenses included in the accompanying financial statements reflect the expenses of that fund and do not include any expenses associated with any underlying mutual funds or exchange-traded funds (ETFs). Although not included in a fund's expenses, a fund indirectly bears its proportionate share of these expenses through the net asset value of each underlying mutual fund or exchange-traded fund (ETF). Expense estimates are accrued in the period to which they relate and adjustments are made when actual amounts are known.
Income Tax Information and Distributions to Shareholders. Each year, the Fund intends to qualify as a regulated investment company under Subchapter M of the Internal Revenue Code, including distributing substantially all of its taxable income and realized gains. As a result, no provision for U.S. Federal income taxes is required. As of December 31, 2024, the Fund did not have any unrecognized tax benefits in the financial statements; nor is the Fund aware of any tax positions for which it is reasonably possible that the total amounts of unrecognized tax benefits will significantly change in the next twelve months. The Fund files a U.S. federal tax return, in addition to state and local tax returns as required. The Fund's federal income tax returns are subject to examination by the Internal Revenue Service (IRS) for a period of three fiscal years after they are filed. State and local tax returns may be subject to examination for an additional fiscal year depending on the jurisdiction. Foreign taxes are provided for based on the Fund's understanding of the tax rules and rates that exist in the foreign markets in which it invests.
Distributions are declared and recorded on the ex-dividend date. Income and capital gain distributions are declared separately for each class. Income and capital gain distributions are determined in accordance with income tax regulations, which may differ from GAAP.
Capital accounts within the financial statements are adjusted for permanent book-tax differences. These adjustments have no impact on net assets or the results of operations. Capital accounts are not adjusted for temporary book-tax differences which will reverse in a subsequent period.
Book-tax differences are primarily due to foreign currency transactions, passive foreign investment companies (PFIC), partnerships and losses deferred due to wash sales and options transactions.
As of period end, the cost and unrealized appreciation (depreciation) in securities, and derivatives if applicable, for federal income tax purposes were as follows:
| Gross unrealized appreciation | $1,153,336,117 |
| Gross unrealized depreciation | (57,133,529) |
| Net unrealized appreciation (depreciation) | $1,096,202,588 |
| Tax Cost | $1,348,243,377 |
The tax-based components of distributable earnings as of period end were as follows:
| Undistributed ordinary income | $1,686,403 |
| Undistributed long-term capital gain | $23,013,978 |
| Net unrealized appreciation (depreciation) on securities and other investments | $1,095,830,203 |
The tax character of distributions paid was as follows:
| | December 31, 2024 | December 31, 2023 |
| Ordinary Income | $38,493,656 | $36,516,531 |
| Long-term Capital Gains | 152,195,317 | 73,480,224 |
| Total | $190,688,973 | $109,996,755 |
Restricted Securities (including Private Placements). Funds may invest in securities that are subject to legal or contractual restrictions on resale. These securities generally may be resold in transactions exempt from registration or to the public if the securities are registered. Disposal of these securities may involve time-consuming negotiations and expense, and prompt sale at an acceptable price may be difficult. Information regarding restricted securities held at period end is included at the end of the Schedule of Investments, if applicable.
New Accounting Pronouncement. FASB Accounting Standards Update (ASU) 2023-07 Segment Reporting (Topic 280): Improvements to Reportable Segment Disclosures became effective in this reporting period. ASU 2023-07 enhances segment information disclosure in the notes to financial statements.
4. Derivative Instruments.
Risk Exposures and the Use of Derivative Instruments. The Fund's investment objectives allow for various types of derivative instruments, including options. Derivatives are investments whose value is primarily derived from underlying assets, indices or reference rates and may be transacted on an exchange or over-the-counter (OTC). Derivatives may involve a future commitment to buy or sell a specified asset based on specified terms, to exchange future cash flows at periodic intervals based on a notional principal amount, or for one party to make one or more payments upon the occurrence of specified events in exchange for periodic payments from the other party.
Derivatives were used to increase returns and to manage exposure to certain risks as defined below. The success of any strategy involving derivatives depends on analysis of numerous economic factors, and if the strategies for investment do not work as intended, the objectives may not be achieved.
Derivatives were used to increase or decrease exposure to the following risk(s):
| | |
| Equity Risk | Equity risk relates to the fluctuations in the value of financial instruments as a result of changes in market prices (other than those arising from interest rate risk or foreign exchange risk), whether caused by factors specific to an individual investment, its issuer, or all factors affecting all instruments traded in a market or market segment. |
Funds are also exposed to additional risks from investing in derivatives, such as liquidity risk and counterparty credit risk. Liquidity risk is the risk that a fund will be unable to close out the derivative in the open market in a timely manner. Counterparty credit risk is the risk that the counterparty will not be able to fulfill its obligation to a fund. Counterparty credit risk related to exchange-traded contracts may be mitigated by the protection provided by the exchange on which they trade.
Investing in derivatives may involve greater risks than investing in the underlying assets directly and, to varying degrees, may involve risk of loss in excess of any initial investment and collateral received and amounts recognized in the Statement of Assets and Liabilities. In addition, there may be the risk that the change in value of the derivative contract does not correspond to the change in value of the underlying instrument.
Net Realized Gain (Loss) and Change in Net Unrealized Appreciation (Depreciation) on Derivatives. The table below, which reflects the impacts of derivatives on the financial performance, summarizes the net realized gain (loss) and change in net unrealized appreciation (depreciation) for derivatives during the period as presented in the Statement of Operations.
| Primary Risk Exposure / Derivative Type | Net Realized Gain (Loss)($) | Change in Net Unrealized Appreciation (Depreciation)($) |
| VIP Growth & Income Portfolio | | |
| Equity Risk | | |
| Purchased Options | (248,604) | - |
| Written Options | (2,525,492) | 1,550,276 |
| Total Equity Risk | (2,774,096) | 1,550,276 |
| Totals | (2,774,096) | 1,550,276 |
| | | |
If there are any open positions at period end, a summary of the value of derivatives by primary risk exposure is included at the end of the Schedule of Investments.
Options. Options give the purchaser the right, but not the obligation, to buy (call) or sell (put) an underlying security or financial instrument at an agreed exercise or strike price between or on certain dates. Options obligate the seller (writer) to buy (put) or sell (call) an underlying instrument at the exercise or strike price or cash settle an underlying derivative instrument if the holder exercises the option on or before the expiration date.
Exchange-traded written covered call options were used to manage exposure to the market. When a fund writes a covered call option, a fund holds the underlying instrument which must be delivered to the holder upon the exercise of the option.
Upon entering into a written options contract, a fund will receive a premium. Premiums received are reflected as a liability on the Statement of Assets and Liabilities. Options are valued daily and any unrealized appreciation (depreciation) is reflected in total accumulated earnings (loss) in the Statement of Assets and Liabilities. When a written option is exercised, the premium is added to the proceeds from the sale of the underlying instrument in determining the gain or loss realized on that investment. When an option is closed, a gain or loss is realized depending on whether the proceeds or amount paid for the closing sale transaction are greater or less than the premium received. When an option expires, gains and losses are realized to the extent of premiums received. The net realized gain (loss) on closed and expired written options and the change in net unrealized appreciation (depreciation) on written options are presented in the Statement of Operations.
Writing call options tends to decrease exposure to the underlying instrument and risk of loss is the change in value in excess of the premium received.
Any open options at period end are presented in the Schedule of Investments under the caption "Written Options", and are representative of volume of activity during the period.
5. Purchases and Sales of Investments.
Purchases and sales of securities, other than short-term securities, U.S. government securities and in-kind transactions, as applicable, are noted in the table below.
| | Purchases ($) | Sales ($) |
| VIP Growth & Income Portfolio | 329,812,209 | 519,701,119 |
6. Fees and Other Transactions with Affiliates.
Management Fee. Fidelity Management & Research Company LLC (the investment adviser) and its affiliates provide the Fund with investment management related services for which the Fund pays a monthly management fee.
Effective March 1, 2024, the Fund's management contract was amended to incorporate administrative services previously covered under separate services agreements (Transfer Agent and Accounting agreements). The amended contract incorporates a management fee rate that may vary by class. The investment adviser or an affiliate pays certain expenses of managing and operating the Fund out of each class's management fee. Each class of the Fund pays a management fee to the investment adviser. The management fee is calculated and paid to the investment adviser every month. When determining a class's management fee, a mandate rate is calculated based on the monthly average net assets of a group of funds advised by FMR within a designated asset class. A discount rate is subtracted from the mandate rate once the Fund's monthly average net assets reach a certain level. The mandate rate and discount rate may vary by class. The annual management fee rate for a class of shares of the Fund is the lesser of (1) the class's mandate rate reduced by the class's discount rate (if applicable) or (2) the amount set forth in the following table.
| | Maximum Management Fee Rate % |
| Initial Class | .48 |
| Service Class | .48 |
| Service Class 2 | .48 |
| Investor Class | .56 |
One-twelfth of the management fee rate for a class is applied to the average net assets of the class for the month, giving a dollar amount which is the management fee for the class for that month. A different management fee rate may be applicable to each class of the Fund. The difference between classes is the result of separate arrangements for class-level services and/or waivers of certain expenses. It is not the result of any difference in advisory or custodial fees or other expenses related to the management of the Fund's assets, which do not vary by class. For the portion of the reporting period on or after March 1, 2024, the total annualized management fee rates were as follows:
| | Total Management Fee Rate % |
| Initial Class | .48 |
| Service Class | .48 |
| Service Class 2 | .48 |
| Investor Class | .55 |
Prior to March 1, 2024, the management fee was the sum of an individual fund fee rate that was based on an annual rate of .20% of the Fund's average net assets and an annualized group fee rate that averaged .22% during the period. The group fee rate was based upon the monthly average net assets of a group of registered investment companies with which the investment adviser has management contracts. The group fee rate decreased as assets under management increased and increased as assets under management decreased. For the portion of the reporting period prior to March 1, 2024, the total annualized management fee rate was .42%.
Effective March 1, 2024, the Fund's sub-advisory agreements with FMR Investment Management (UK) Limited, Fidelity Management & Research (Hong Kong) Limited, and Fidelity Management & Research (Japan) Limited were amended to provide that the investment adviser pays each sub-adviser monthly fees equal to 110% of the sub-adviser's costs for providing sub-advisory services.
Distribution and Service Plan Fees. In accordance with Rule 12b-1 of the 1940 Act, the Fund has adopted separate 12b-1 Plans for each Service Class of shares. Each Service Class pays Fidelity Distributors Company LLC (FDC), an affiliate of the investment adviser, a service fee. For the period, the service fee is based on an annual rate of .10% of Service Class' average net assets and .25% of Service Class 2's average net assets.
For the period, total fees, all of which were re-allowed to insurance companies for the distribution of shares and providing shareholder support services, were as follows:
| Service Class | $137,090 |
| Service Class 2 | 3,225,119 |
| | $3,362,209 |
Transfer Agent Fees. Fidelity Investments Institutional Operations Company LLC (FIIOC), an affiliate of the investment adviser, is the Fund's transfer, dividend disbursing, and shareholder servicing agent. Effective March 1, 2024, the Fund's management contract was amended to incorporate transfer agent services and associated fees previously covered under a separate services agreement.
During the period January 1, 2024 through February 29, 2024, the transfer agent fees for each class were a fixed annual rate of class-level average net assets as follows:
| | Amount ($) | % of Class-Level Average Net Assets |
| Initial Class | 43,442 | .0630 |
| Service Class | 13,389 | .0630 |
| Service Class 2 | 127,649 | .0630 |
| Investor Class | 99,781 | .1390 |
| | 284,261 | |
Accounting Fees. Fidelity Service Company, Inc. (FSC), an affiliate of the investment adviser, maintains the Fund's accounting records. Effective March 1, 2024, the Fund's management contract was amended to incorporate accounting services and associated fees previously covered under a separate services agreement.
During the period January 1, 2024 through February 29, 2024, the accounting fees were a fixed annual rate of average net assets as follows:
| | % of Average Net Assets |
| VIP Growth & Income Portfolio | .0267 |
Brokerage Commissions. A portion of portfolio transactions were placed with brokerage firms which are affiliates of the investment adviser. Brokerage commissions are included in net realized gain (loss) and change in net unrealized appreciation (depreciation) in the Statement of Operations. The commissions paid to these affiliated firms were as follows:
| | Amount ($) |
| VIP Growth & Income Portfolio | 5,011 |
Interfund Lending Program. Pursuant to an Exemptive Order issued by the Securities and Exchange Commission (the SEC), the Fund, along with other registered investment companies having management contracts with Fidelity Management & Research Company LLC (FMR), or other affiliated entities of FMR, may participate in an interfund lending program. This program provides an alternative credit facility allowing the Fund to borrow from, or lend money to, other participating affiliated funds at rates that are beneficial to both the borrowing and lending fund. Borrowings under the program are generally for temporary or emergency purposes, including meeting fund shareholder redemptions. The interfund loan rate is determined, as specified in the Exemptive Order, by averaging, (1) the higher of the overnight time deposit rate and the current overnight repurchase agreement rate, and (2) a benchmark rate representing the lowest bank loan rate available to the funds. At period end, there were no interfund loans outstanding. Activity in this program during the period for which loans were outstanding was as follows:
| | Borrower or Lender | Average Loan Balance ($) | Weighted Average Interest Rate | Interest Expense ($) |
| VIP Growth & Income Portfolio | Borrower | 11,846,200 | 5.57% | 9,164 |
Interfund Trades. Funds may purchase from or sell securities to other Fidelity Funds under procedures adopted by the Board. The procedures have been designed to ensure these interfund trades are executed in accordance with Rule 17a-7 of the 1940 Act. Any interfund trades are included within the respective purchases and sales amounts shown in the Purchases and Sales of Investments note. Interfund trades during the period are noted in the table below.
| | Purchases ($) | Sales ($) | Realized Gain (Loss) ($) |
| VIP Growth & Income Portfolio | 19,398,853 | 22,738,485 | 7,566,319 |
7. Committed Line of Credit.
Certain Funds participate with other funds managed by the investment adviser or an affiliate in a $4.25 billion credit facility (the "line of credit") to be utilized for temporary or emergency purposes to fund shareholder redemptions or for other short-term liquidity purposes.
Commitment fees are charged based on the unused amount of the line of credit at an annual rate of .10%, and then allocated to each participating fund based on its pro-rata portion of the line of credit. The commitment fees are reflected in Miscellaneous expenses on the Statement of Operations, and are listed below.
Interest is charged to a participating fund based on its borrowings at an annual rate of .75% plus the highest of (i) daily SOFR plus a .10% spread adjustment, (ii) Federal Funds Effective Rate, or (iii) Overnight Bank Funding Rate. During the period, there were no borrowings on this line of credit.
The line of credit agreement will expire in March 2025 unless extended or renewed.
| | Amount ($) |
| VIP Growth & Income Portfolio | 3,595 |
8. Security Lending.
Funds lend portfolio securities from time to time in order to earn additional income. Lending agents are used, including National Financial Services (NFS), an affiliate of the investment adviser. Pursuant to a securities lending agreement, NFS will receive a fee, which is capped at 9.9% of a fund's daily lending revenue, for its services as lending agent. A fund may lend securities to certain qualified borrowers, including NFS. On the settlement date of the loan, a fund receives collateral (in the form of U.S. Treasury obligations, letters of credit and/or cash) against the loaned securities and maintains collateral in an amount not less than 100% of the market value of the loaned securities during the period of the loan. The market value of the loaned securities is determined at the close of business of a fund and any additional required collateral is delivered to a fund on the next business day. A fund or borrower may terminate the loan at any time, and if the borrower defaults on its obligation to return the securities loaned because of insolvency or other reasons, a fund may apply collateral received from the borrower against the obligation. A fund may experience delays and costs in recovering the securities loaned. Any cash collateral received is invested in the Fidelity Securities Lending Cash Central Fund. Any loaned securities are identified as such in the Schedule of Investments, and the value of loaned securities and cash collateral at period end, as applicable, are presented in the Statement of Assets and Liabilities. Security lending income represents the income earned on investing cash collateral, less rebates paid to borrowers and any lending agent fees associated with the loan, plus any premium payments received for lending certain types of securities. Security lending income is presented in the Statement of Operations as a component of income from Fidelity Central Funds. Affiliated security lending activity, if any, was as follows:
| | Total Security Lending Fees Paid to NFS ($) | Security Lending Income From Securities Loaned to NFS ($) | Value of Securities Loaned to NFS at Period End ($) |
| VIP Growth & Income Portfolio | 6,745 | - | - |
9. Expense Reductions.
Through arrangements with the Fund's custodian, credits realized as a result of certain uninvested cash balances were used to reduce the Fund's expenses. During the period, custodian credits reduced the Fund's expenses by $6,772.
In addition, during the period the investment adviser or an affiliate reimbursed and/or waived a portion of fund-level operating expenses in the amount of $96,964.
10. Distributions to Shareholders.
Distributions to shareholders of each class were as follows:
| | Year ended December 31, 2024 | Year ended December 31, 2023 |
| VIP Growth & Income Portfolio | | |
| Distributions to shareholders | | |
| Initial Class | $36,427,724 | $20,850,294 |
| Service Class | 10,996,704 | 6,452,958 |
| Service Class 2 | 103,690,665 | 60,944,480 |
| Investor Class | 39,573,880 | 21,749,023 |
Total | $190,688,973 | $109,996,755 |
11. Share Transactions.
Transactions for each class of shares were as follows and may contain in-kind transactions:
| | Shares | Shares | Dollars | Dollars |
| | Year ended December 31, 2024 | Year ended December 31, 2023 | Year ended December 31, 2024 | Year ended December 31, 2023 |
| VIP Growth & Income Portfolio | | | | |
| Initial Class | | | | |
| Shares sold | 2,264,750 | 1,948,255 | $69,778,768 | $50,228,928 |
| Reinvestment of distributions | 1,167,818 | 785,282 | 36,427,723 | 20,850,294 |
| Shares redeemed | (3,062,408) | (2,964,562) | (94,377,011) | (76,731,856) |
| Net increase (decrease) | 370,160 | (231,025) | $11,829,480 | $(5,652,634) |
| Service Class | | | | |
| Shares sold | 183,227 | 135,418 | $5,528,758 | $3,447,565 |
| Reinvestment of distributions | 357,551 | 246,201 | 10,996,704 | 6,452,958 |
| Shares redeemed | (606,389) | (559,603) | (18,123,955) | (14,290,045) |
| Net increase (decrease) | (65,611) | (177,984) | $(1,598,493) | $(4,389,522) |
| Service Class 2 | | | | |
| Shares sold | 1,819,641 | 2,408,395 | $53,646,822 | $60,241,356 |
| Reinvestment of distributions | 3,452,140 | 2,375,486 | 103,690,665 | 60,944,480 |
| Shares redeemed | (6,499,644) | (4,681,813) | (189,688,970) | (116,575,812) |
| Net increase (decrease) | (1,227,863) | 102,068 | $(32,351,483) | $4,610,024 |
| Investor Class | | | | |
| Shares sold | 1,503,853 | 1,743,883 | $46,400,139 | $44,618,947 |
| Reinvestment of distributions | 1,277,034 | 824,383 | 39,573,880 | 21,749,023 |
| Shares redeemed | (1,799,222) | (2,582,407) | (54,660,166) | (66,651,120) |
| Net increase (decrease) | 981,665 | (14,141) | $31,313,853 | $(283,150) |
12. Other.
A fund's organizational documents provide former and current trustees and officers with a limited indemnification against liabilities arising in connection with the performance of their duties to the fund. In the normal course of business, a fund may also enter into contracts that provide general indemnifications. A fund's maximum exposure under these arrangements is unknown as this would be dependent on future claims that may be made against a fund. The risk of material loss from such claims is considered remote.
At the end of the period, the investment adviser or its affiliates were owners of record of more than 10% and certain otherwise unaffiliated shareholders each were owners of record of more than 10% of the outstanding shares as follows:
| Fund | Affiliated % | Number ofUnaffiliated Shareholders | Unaffiliated Shareholders % |
| VIP Growth & Income Portfolio | 25% | 2 | 52% |
13. Risk and Uncertainties.
Many factors affect a fund's performance. Developments that disrupt global economies and financial markets, such as pandemics, epidemics, outbreaks of infectious diseases, war, terrorism, and environmental disasters, may significantly affect a fund's investment performance. The effects of these developments to a fund will be impacted by the types of securities in which a fund invests, the financial condition, industry, economic sector, and geographic location of an issuer, and a fund's level of investment in the securities of that issuer. Significant concentrations in security types, issuers, industries, sectors, and geographic locations may magnify the factors that affect a fund's performance.
Report of Independent Registered Public Accounting Firm
To the Board of Trustees of Variable Insurance Products Fund III and the Shareholders of VIP Growth & Income Portfolio:
Opinion on the Financial Statements and Financial Highlights
We have audited the accompanying statement of assets and liabilities of VIP Growth & Income Portfolio (the "Fund"), a fund of Variable Insurance Products Fund III, including the schedule of investments, as of December 31, 2024, the related statement of operations for the year then ended, the statement of changes in net assets for each of the two years in the period then ended, the financial highlights for each of the five years in the period then ended, and the related notes. In our opinion, the financial statements and financial highlights present fairly, in all material respects, the financial position of the Fund as of December 31, 2024, and the results of its operations for the year then ended, the changes in its net assets for each of the two years in the period then ended, and the financial highlights for each of the five years in the period then ended in conformity with accounting principles generally accepted in the United States of America.
Basis for Opinion
These financial statements and financial highlights are the responsibility of the Fund's management. Our responsibility is to express an opinion on the Fund's financial statements and financial highlights based on our audits. We are a public accounting firm registered with the Public Company Accounting Oversight Board (United States) (PCAOB) and are required to be independent with respect to the Fund in accordance with the U.S. federal securities laws and the applicable rules and regulations of the Securities and Exchange Commission and the PCAOB.
We conducted our audits in accordance with the standards of the PCAOB. Those standards require that we plan and perform the audit to obtain reasonable assurance about whether the financial statements and financial highlights are free of material misstatement, whether due to error or fraud. The Fund is not required to have, nor were we engaged to perform, an audit of its internal control over financial reporting. As part of our audits, we are required to obtain an understanding of internal control over financial reporting but not for the purpose of expressing an opinion on the effectiveness of the Fund's internal control over financial reporting. Accordingly, we express no such opinion.
Our audits included performing procedures to assess the risks of material misstatement of the financial statements and financial highlights, whether due to error or fraud, and performing procedures that respond to those risks. Such procedures included examining, on a test basis, evidence regarding the amounts and disclosures in the financial statements and financial highlights. Our audits also included evaluating the accounting principles used and significant estimates made by management, as well as evaluating the overall presentation of the financial statements and financial highlights. Our procedures included confirmation of securities owned as of December 31, 2024, by correspondence with the custodian and brokers; when replies were not received from brokers, we performed other auditing procedures. We believe that our audits provide a reasonable basis for our opinion.
/s/ Deloitte & Touche LLP
Boston, Massachusetts
February 13, 2025
We have served as the auditor of one or more of the Fidelity investment companies since 1999.
Distributions
(Unaudited)The dividend and capital gains distributions for the fund(s) are available on Fidelity.com or Institutional.Fidelity.com.
The fund hereby designates as a capital gain dividend with respect to the taxable year ended December 31, 2024, $162,289,357, or, if subsequently determined to be different, the net capital gain of such year.
The fund designates $1,623,684 of distributions paid during the fiscal year ended 2024 as qualifying to be taxed as section 163(j) interest dividends.
Initial Class designates 24% and 85%; Service Class designates 24% and 90%; Service Class 2 designates 24% and 99%; and Investor Class designates 24% and 88%; of the dividends distributed in February and December, respectively during the fiscal year as qualifying for the dividends-received deduction for corporate shareholders.
Item 8: Changes in and Disagreements with Accountants for Open-End Management Investment Companies
(Unaudited)
Note: This is not applicable for any fund included in this document.
Item 9: Proxy Disclosures for Open-End Management Investment Companies
(Unaudited)
| A special meeting of shareholders was held on July 16, 2024. The results of votes taken among shareholders on the proposal before them are reported below. Each vote reported represents one dollar of net asset value held on the record date for the meeting. |
| Proposal 1 |
| To elect a Board of Trustees. |
| | # of Votes | % of Votes |
| Bettina Doulton |
| Affirmative | 19,815,631,510.17 | 96.35 |
| Withheld | 749,708,334.02 | 3.65 |
| TOTAL | 20,565,339,844.19 | 100.00 |
| Robert A. Lawrence |
| Affirmative | 19,766,714,617.58 | 96.12 |
| Withheld | 798,625,226.62 | 3.88 |
| TOTAL | 20,565,339,844.19 | 100.00 |
| Vijay C. Advani |
| Affirmative | 19,788,320,252.27 | 96.22 |
| Withheld | 777,019,591.92 | 3.78 |
| TOTAL | 20,565,339,844.19 | 100.00 |
| Thomas P. Bostick |
| Affirmative | 19,780,566,370.66 | 96.18 |
| Withheld | 784,773,473.53 | 3.82 |
| TOTAL | 20,565,339,844.19 | 100.00 |
| Donald F. Donahue |
| Affirmative | 19,723,882,404.02 | 95.91 |
| Withheld | 841,457,440.18 | 4.09 |
| TOTAL | 20,565,339,844.19 | 100.00 |
| Vicki L. Fuller |
| Affirmative | 19,823,019,040.62 | 96.39 |
| Withheld | 742,320,803.57 | 3.61 |
| TOTAL | 20,565,339,844.19 | 100.00 |
| Patricia L. Kampling |
| Affirmative | 19,837,563,936.04 | 96.46 |
| Withheld | 727,775,908.15 | 3.54 |
| TOTAL | 20,565,339,844.19 | 100.00 |
| Thomas A. Kennedy |
| Affirmative | 19,789,564,999.11 | 96.23 |
| Withheld | 775,774,845.08 | 3.77 |
| TOTAL | 20,565,339,844.19 | 100.00 |
| Oscar Munoz |
| Affirmative | 19,772,385,801.51 | 96.14 |
| Withheld | 792,954,042.68 | 3.86 |
| TOTAL | 20,565,339,844.19 | 100.00 |
| Karen B. Peetz |
| Affirmative | 19,804,495,604.67 | 96.30 |
| Withheld | 760,844,239.52 | 3.70 |
| TOTAL | 20,565,339,844.19 | 100.00 |
| David M. Thomas |
| Affirmative | 19,717,117,994.71 | 95.88 |
| Withheld | 848,221,849.48 | 4.12 |
| TOTAL | 20,565,339,844.19 | 100.00 |
| Susan Tomasky |
| Affirmative | 19,783,626,171.89 | 96.20 |
| Withheld | 781,713,672.31 | 3.80 |
| TOTAL | 20,565,339,844.19 | 100.00 |
| Michael E. Wiley |
| Affirmative | 19,728,139,900.50 | 95.93 |
| Withheld | 837,199,943.69 | 4.07 |
| TOTAL | 20,565,339,844.19 | 100.00 |
| | | |
| Proposal 1 reflects trust-wide proposal and voting results. |
Item 10: Remuneration Paid to Directors, Officers, and others of Open-End Management Investment Companies
(Unaudited)
Note: This information is disclosed as part of the financial statements for each Fund as part of Item 7: Financial Statements and Financial Highlights for Open-End Management Investment companies.
Item 11: Statement Regarding Basis for Approval of Investment Advisory Contract
(Unaudited)
Note: This is not applicable for any fund included in this document.
1.540026.127
VIPGI-ANN-0325
Fidelity® Variable Insurance Products:
VIP Balanced Portfolio
Annual Report
December 31, 2024
Contents
To view a fund's proxy voting guidelines and proxy voting record for the 12-month period ended June 30, visit http://www.fidelity.com/proxyvotingresults or visit the Securities and Exchange Commission's (SEC) web site at http://www.sec.gov.
You may also call 1-877-208-0098 to request a free copy of the proxy voting guidelines.
Fidelity® Variable Insurance Products are separate account options which are purchased through a variable insurance contract.
Standard & Poor's, S&P and S&P 500 are registered service marks of The McGraw-Hill Companies, Inc. and have been licensed for use by Fidelity Distributors Corporation.
Other third-party marks appearing herein are the property of their respective owners.
All other marks appearing herein are registered or unregistered trademarks or service marks of FMR LLC or an affiliated company. © 2025 FMR LLC. All rights reserved.
This report and the financial statements contained herein are submitted for the general information of the shareholders of the Fund. This report is not authorized for distribution to prospective investors in the Fund unless preceded or accompanied by an effective prospectus.
A fund files its complete schedule of portfolio holdings with the SEC for the first and third quarters of each fiscal year on Form N-PORT. Forms N-PORT are available on the SEC's web site at http://www.sec.gov. A fund's Forms N-PORT may be reviewed and copied at the SEC's Public Reference Room in Washington, DC. Information regarding the operation of the SEC's Public Reference Room may be obtained by calling 1-800-SEC-0330.
For a complete list of a fund's portfolio holdings, view the most recent holdings listing, semiannual report, or annual report on Fidelity's web site at http://www.fidelity.com, http://www.institutional.fidelity.com, or http://www.401k.com, as applicable.
NOT FDIC INSURED •MAY LOSE VALUE •NO BANK GUARANTEE
Neither the Fund nor Fidelity Distributors Corporation is a bank.
Item 7: Financial Statements and Financial Highlights for Open-End Management Investment Companies (Annual Report)
Schedule of Investments December 31, 2024
Showing Percentage of Net Assets
| Common Stocks - 65.2% |
| | | Shares | Value ($) |
| BAILIWICK OF JERSEY - 0.1% | | | |
| Consumer Discretionary - 0.1% | | | |
| Automobile Components - 0.1% | | | |
| Aptiv PLC | | 101,700 | 6,150,816 |
| BELGIUM - 0.4% | | | |
| Health Care - 0.4% | | | |
| Pharmaceuticals - 0.4% | | | |
| UCB SA | | 149,135 | 29,691,342 |
| BRAZIL - 0.0% | | | |
| Materials - 0.0% | | | |
| Metals & Mining - 0.0% | | | |
| Wheaton Precious Metals Corp (United States) | | 51,600 | 2,901,984 |
| CANADA - 0.8% | | | |
| Consumer Discretionary - 0.1% | | | |
| Hotels, Restaurants & Leisure - 0.1% | | | |
| Restaurant Brands International Inc | | 130,600 | 8,512,236 |
| Consumer Staples - 0.0% | | | |
| Consumer Staples Distribution & Retail - 0.0% | | | |
| Alimentation Couche-Tard Inc | | 57,700 | 3,200,003 |
| Energy - 0.5% | | | |
| Oil, Gas & Consumable Fuels - 0.5% | | | |
| Africa Oil Corp | | 2,039,547 | 2,795,163 |
| Athabasca Oil Corp (b) | | 1,597,300 | 5,922,717 |
| Imperial Oil Ltd | | 211,300 | 13,022,413 |
| MEG Energy Corp | | 531,900 | 8,732,714 |
| South Bow Corp | | 97,600 | 2,303,101 |
| | | | 32,776,108 |
| Financials - 0.2% | | | |
| Insurance - 0.2% | | | |
| Fairfax Financial Holdings Ltd Subordinate Voting Shares | | 7,426 | 10,332,185 |
| Materials - 0.0% | | | |
| Metals & Mining - 0.0% | | | |
| Teck Resources Ltd Class B (United States) | | 36,800 | 1,491,504 |
| TOTAL CANADA | | | 56,312,036 |
| CHINA - 0.3% | | | |
| Health Care - 0.0% | | | |
| Biotechnology - 0.0% | | | |
| Beigene Ltd ADR (b) | | 16,446 | 3,037,740 |
| Information Technology - 0.3% | | | |
| Semiconductors & Semiconductor Equipment - 0.3% | | | |
| NXP Semiconductors NV | | 85,422 | 17,754,963 |
| TOTAL CHINA | | | 20,792,703 |
| CONGO DEMOCRATIC REPUBLIC OF - 0.0% | | | |
| Materials - 0.0% | | | |
| Metals & Mining - 0.0% | | | |
| Ivanhoe Mine Ltd Class A (b) | | 174,800 | 2,074,568 |
| FINLAND - 0.0% | | | |
| Consumer Discretionary - 0.0% | | | |
| Textiles, Apparel & Luxury Goods - 0.0% | | | |
| Amer Sports Inc | | 43,200 | 1,207,872 |
| FRANCE - 0.1% | | | |
| Information Technology - 0.1% | | | |
| IT Services - 0.1% | | | |
| Capgemini SE | | 37,215 | 6,078,241 |
| GERMANY - 0.0% | | | |
| Health Care - 0.0% | | | |
| Biotechnology - 0.0% | | | |
| BioNTech SE ADR (b) | | 25,800 | 2,939,910 |
| GREECE - 0.1% | | | |
| Financials - 0.1% | | | |
| Banks - 0.1% | | | |
| Eurobank Ergasias Services and Holdings SA | | 2,482,049 | 5,720,596 |
| Piraeus Financial Holdings SA | | 823,744 | 3,278,783 |
| | | | |
| TOTAL GREECE | | | 8,999,379 |
| HONG KONG - 0.0% | | | |
| Financials - 0.0% | | | |
| Insurance - 0.0% | | | |
| Prudential PLC | | 177,720 | 1,410,391 |
| INDIA - 0.0% | | | |
| Financials - 0.0% | | | |
| Banks - 0.0% | | | |
| HDFC Bank Ltd/Gandhinagar | | 126,255 | 2,611,976 |
| IRELAND - 0.1% | | | |
| Financials - 0.1% | | | |
| Banks - 0.1% | | | |
| AIB Group PLC | | 695,560 | 3,840,243 |
| Financial Services - 0.0% | | | |
| Circle Internet Financial LLC (c) | | 68,071 | 2,061,871 |
| Circle Internet Financial LLC (c) | | 36,875 | 1,116,943 |
| | | | 3,178,814 |
| TOTAL IRELAND | | | 7,019,057 |
| ISRAEL - 0.2% | | | |
| Health Care - 0.2% | | | |
| Pharmaceuticals - 0.2% | | | |
| Teva Pharmaceutical Industries Ltd ADR (b) | | 521,700 | 11,498,268 |
| JAPAN - 0.0% | | | |
| Information Technology - 0.0% | | | |
| Semiconductors & Semiconductor Equipment - 0.0% | | | |
| Renesas Electronics Corp | | 236,700 | 2,995,445 |
| MAURITIUS - 0.0% | | | |
| Financials - 0.0% | | | |
| Financial Services - 0.0% | | | |
| Jumo World Holding Limited (b)(c)(d) | | 176,324 | 313,857 |
| Jumo World Ltd (b)(c) | | 176 | 0 |
| | | | |
| TOTAL MAURITIUS | | | 313,857 |
| NETHERLANDS - 0.2% | | | |
| Health Care - 0.2% | | | |
| Biotechnology - 0.2% | | | |
| Argenx SE ADR (b) | | 28,500 | 17,527,500 |
| PORTUGAL - 0.1% | | | |
| Energy - 0.1% | | | |
| Oil, Gas & Consumable Fuels - 0.1% | | | |
| Galp Energia SGPS SA | | 398,100 | 6,598,380 |
| SPAIN - 0.0% | | | |
| Communication Services - 0.0% | | | |
| Diversified Telecommunication Services - 0.0% | | | |
| Cellnex Telecom SA (e)(f) | | 41,035 | 1,296,154 |
| SWITZERLAND - 0.0% | | | |
| Financials - 0.0% | | | |
| Capital Markets - 0.0% | | | |
| UBS Group AG (United States) | | 119,763 | 3,631,214 |
| TAIWAN - 0.8% | | | |
| Information Technology - 0.8% | | | |
| Semiconductors & Semiconductor Equipment - 0.8% | | | |
| Taiwan Semiconductor Manufacturing Co Ltd | | 1,493,000 | 48,504,085 |
| Taiwan Semiconductor Manufacturing Co Ltd ADR | | 10,800 | 2,132,892 |
| | | | |
| TOTAL TAIWAN | | | 50,636,977 |
| UNITED KINGDOM - 0.2% | | | |
| Consumer Discretionary - 0.0% | | | |
| Specialty Retail - 0.0% | | | |
| Cazoo Group Ltd (b)(d) | | 28 | 0 |
| Cazoo Group Ltd warrants (b) | | 37 | 0 |
| Cazoo Group Ltd warrants (b) | | 33 | 0 |
| Cazoo Group Ltd warrants (b) | | 30 | 0 |
| | | | 0 |
| Consumer Staples - 0.0% | | | |
| Beverages - 0.0% | | | |
| Diageo PLC | | 92,788 | 2,948,602 |
| Financials - 0.2% | | | |
| Banks - 0.0% | | | |
| Starling Bank Ltd Class D (b)(c)(d) | | 756,521 | 2,396,134 |
| Capital Markets - 0.1% | | | |
| London Stock Exchange Group PLC | | 38,108 | 5,379,133 |
| Insurance - 0.1% | | | |
| Direct Line Insurance Group PLC | | 1,459,741 | 4,663,652 |
| TOTAL UNITED KINGDOM | | | 15,387,521 |
| UNITED STATES - 61.8% | | | |
| Communication Services - 6.5% | | | |
| Diversified Telecommunication Services - 0.1% | | | |
| AT&T Inc | | 296,400 | 6,749,028 |
| Entertainment - 1.2% | | | |
| Liberty Media Corp-Liberty Formula One Class C (b) | | 20,400 | 1,890,264 |
| Live Nation Entertainment Inc (b) | | 52,500 | 6,798,750 |
| Netflix Inc (b) | | 48,658 | 43,369,849 |
| ROBLOX Corp Class A (b) | | 41,500 | 2,401,190 |
| Take-Two Interactive Software Inc (b) | | 27,218 | 5,010,289 |
| TKO Group Holdings Inc Class A (b) | | 15,500 | 2,202,705 |
| Walt Disney Co/The | | 209,532 | 23,331,388 |
| Warner Bros Discovery Inc (b) | | 395,700 | 4,182,549 |
| | | | 89,186,984 |
| Interactive Media & Services - 5.1% | | | |
| Alphabet Inc Class A | | 1,319,310 | 249,745,384 |
| Epic Games Inc (b)(c)(d) | | 1,812 | 1,229,460 |
| Meta Platforms Inc Class A | | 234,242 | 137,151,033 |
| Reddit Inc Class A | | 15,000 | 2,451,600 |
| Snap Inc Class A (b) | | 150,800 | 1,624,116 |
| | | | 392,201,593 |
| Media - 0.1% | | | |
| Fox Corp Class A | | 61,300 | 2,977,954 |
| Liberty Broadband Corp Class A (b) | | 18,551 | 1,379,452 |
| Magnite Inc (b) | | 119,016 | 1,894,735 |
| Trade Desk Inc (The) Class A (b) | | 17,200 | 2,021,516 |
| | | | 8,273,657 |
TOTAL COMMUNICATION SERVICES | | | 496,411,262 |
| | | | |
| Consumer Discretionary - 7.1% | | | |
| Automobiles - 1.2% | | | |
| Tesla Inc (b) | | 225,000 | 90,864,000 |
| Broadline Retail - 3.1% | | | |
| Amazon.com Inc (b) | | 1,068,300 | 234,374,337 |
| Etsy Inc (b) | | 38,500 | 2,036,265 |
| | | | 236,410,602 |
| Distributors - 0.1% | | | |
| LKQ Corp | | 126,000 | 4,630,500 |
| Diversified Consumer Services - 0.1% | | | |
| Service Corp International/US | | 60,200 | 4,805,164 |
| Hotels, Restaurants & Leisure - 1.1% | | | |
| Airbnb Inc Class A (b) | | 75,100 | 9,868,891 |
| Booking Holdings Inc | | 1,900 | 9,439,998 |
| Caesars Entertainment Inc (b) | | 80,200 | 2,680,284 |
| Churchill Downs Inc | | 48,500 | 6,476,690 |
| Domino's Pizza Inc | | 21,600 | 9,066,816 |
| DraftKings Inc Class A (b) | | 143,600 | 5,341,920 |
| Dutch Bros Inc Class A (b) | | 42,800 | 2,241,864 |
| Marriott International Inc/MD Class A1 | | 63,900 | 17,824,266 |
| Red Rock Resorts Inc Class A | | 38,300 | 1,770,992 |
| Starbucks Corp | | 65,100 | 5,940,375 |
| Yum! Brands Inc | | 73,400 | 9,847,344 |
| | | | 80,499,440 |
| Household Durables - 0.0% | | | |
| DR Horton Inc | | 4,700 | 657,154 |
| Leisure Products - 0.0% | | | |
| Brunswick Corp/DE | | 23,000 | 1,487,640 |
| Specialty Retail - 1.1% | | | |
| Foot Locker Inc (b) | | 86,000 | 1,871,360 |
| Home Depot Inc/The | | 44,008 | 17,118,672 |
| Lowe's Cos Inc | | 175,100 | 43,214,680 |
| Ross Stores Inc | | 77,700 | 11,753,679 |
| TJX Cos Inc/The | | 113,596 | 13,723,533 |
| | | | 87,681,924 |
| Textiles, Apparel & Luxury Goods - 0.4% | | | |
| NIKE Inc Class B | | 174,230 | 13,183,984 |
| PVH Corp | | 67,800 | 7,169,850 |
| Tapestry Inc | | 131,000 | 8,558,230 |
| | | | 28,912,064 |
TOTAL CONSUMER DISCRETIONARY | | | 535,948,488 |
| | | | |
| Consumer Staples - 3.5% | | | |
| Beverages - 1.1% | | | |
| Brown-Forman Corp Class B | | 38,100 | 1,447,038 |
| Coca-Cola Co/The | | 599,600 | 37,331,096 |
| Constellation Brands Inc Class A | | 48,700 | 10,762,700 |
| Keurig Dr Pepper Inc | | 459,417 | 14,756,474 |
| Molson Coors Beverage Co Class B | | 13,900 | 796,748 |
| Monster Beverage Corp (b) | | 138,552 | 7,282,293 |
| PepsiCo Inc | | 90,300 | 13,731,018 |
| | | | 86,107,367 |
| Consumer Staples Distribution & Retail - 1.2% | | | |
| Costco Wholesale Corp | | 39,940 | 36,595,824 |
| Dollar Tree Inc (b) | | 20,400 | 1,528,776 |
| Target Corp | | 97,700 | 13,207,086 |
| Walmart Inc | | 427,100 | 38,588,485 |
| | | | 89,920,171 |
| Food Products - 0.3% | | | |
| Archer-Daniels-Midland Co | | 67,200 | 3,394,944 |
| Bunge Global SA | | 17,600 | 1,368,576 |
| JM Smucker Co | | 51,100 | 5,627,132 |
| Lamb Weston Holdings Inc | | 34,065 | 2,276,564 |
| Mondelez International Inc | | 147,300 | 8,798,229 |
| | | | 21,465,445 |
| Household Products - 0.6% | | | |
| Procter & Gamble Co/The | | 281,300 | 47,159,945 |
| Personal Care Products - 0.2% | | | |
| Estee Lauder Cos Inc/The Class A | | 82,400 | 6,178,352 |
| Kenvue Inc | | 391,000 | 8,347,850 |
| | | | 14,526,202 |
| Tobacco - 0.1% | | | |
| Philip Morris International Inc | | 85,400 | 10,277,890 |
TOTAL CONSUMER STAPLES | | | 269,457,020 |
| | | | |
| Energy - 1.4% | | | |
| Energy Equipment & Services - 0.0% | | | |
| Weatherford International PLC | | 19,600 | 1,403,948 |
| Oil, Gas & Consumable Fuels - 1.4% | | | |
| DT Midstream Inc | | 16,900 | 1,680,367 |
| Expand Energy Corp | | 34,800 | 3,464,340 |
| Exxon Mobil Corp | | 673,400 | 72,437,638 |
| Marathon Petroleum Corp | | 25,200 | 3,515,400 |
| Shell PLC ADR | | 235,100 | 14,729,015 |
| Targa Resources Corp | | 25,100 | 4,480,350 |
| Valero Energy Corp | | 66,600 | 8,164,494 |
| | | | 108,471,604 |
TOTAL ENERGY | | | 109,875,552 |
| | | | |
| Financials - 8.4% | | | |
| Banks - 2.8% | | | |
| Bank of America Corp | | 931,521 | 40,940,348 |
| Citigroup Inc | | 341,862 | 24,063,666 |
| JPMorgan Chase & Co | | 123,408 | 29,582,132 |
| KeyCorp | | 426,604 | 7,311,993 |
| M&T Bank Corp | | 56,556 | 10,633,094 |
| Pathward Financial Inc | | 52,648 | 3,873,840 |
| Synovus Financial Corp | | 50,000 | 2,561,500 |
| Truist Financial Corp | | 224,100 | 9,721,458 |
| UMB Financial Corp | | 32,685 | 3,688,829 |
| US Bancorp | | 490,358 | 23,453,823 |
| Wells Fargo & Co | | 759,549 | 53,350,722 |
| | | | 209,181,405 |
| Capital Markets - 2.1% | | | |
| Bank of New York Mellon Corp/The | | 156,923 | 12,056,394 |
| Blackrock Inc | | 8,010 | 8,211,131 |
| Cboe Global Markets Inc | | 47,303 | 9,243,006 |
| Charles Schwab Corp/The | | 148,091 | 10,960,215 |
| Coinbase Global Inc Class A (b) | | 10,200 | 2,532,660 |
| DigitalBridge Group Inc Class A | | 68,300 | 770,423 |
| Intercontinental Exchange Inc | | 105,191 | 15,674,511 |
| LPL Financial Holdings Inc | | 35,910 | 11,724,974 |
| MarketAxess Holdings Inc | | 61,441 | 13,888,124 |
| Morgan Stanley | | 225,475 | 28,346,717 |
| Northern Trust Corp | | 88,700 | 9,091,750 |
| State Street Corp | | 108,801 | 10,678,818 |
| StepStone Group Inc Class A | | 80,321 | 4,648,979 |
| StepStone Group Inc rights 12/31/2038 (b)(c) | | 2,750 | 199,293 |
| Tradeweb Markets Inc Class A | | 41,392 | 5,419,041 |
| Virtu Financial Inc Class A | | 207,907 | 7,418,122 |
| | | | 150,864,158 |
| Consumer Finance - 0.2% | | | |
| Discover Financial Services | | 63,148 | 10,939,128 |
| OneMain Holdings Inc | | 95,034 | 4,954,122 |
| | | | 15,893,250 |
| Financial Services - 1.8% | | | |
| Affirm Holdings Inc Class A (b) | | 39,400 | 2,399,460 |
| Apollo Global Management Inc | | 91,612 | 15,130,638 |
| AvidXchange Holdings Inc (b) | | 651,115 | 6,732,529 |
| Berkshire Hathaway Inc Class A (b) | | 13 | 8,851,960 |
| Block Inc Class A (b) | | 88,182 | 7,494,588 |
| Fiserv Inc (b) | | 101,548 | 20,859,990 |
| Mastercard Inc Class A | | 51,300 | 27,013,041 |
| PayPal Holdings Inc (b) | | 58,037 | 4,953,458 |
| UWM Holdings Corp Class A | | 601,954 | 3,533,470 |
| Visa Inc Class A | | 121,248 | 38,319,218 |
| Voya Financial Inc | | 62,583 | 4,307,588 |
| | | | 139,595,940 |
| Insurance - 1.5% | | | |
| Arthur J Gallagher & Co | | 48,961 | 13,897,580 |
| Chubb Ltd | | 88,485 | 24,448,406 |
| Everest Group Ltd | | 13,186 | 4,779,397 |
| Hartford Financial Services Group Inc/The | | 110,769 | 12,118,129 |
| Marsh & McLennan Cos Inc | | 103,634 | 22,012,898 |
| Progressive Corp/The | | 32,531 | 7,794,753 |
| The Travelers Companies, Inc. | | 54,440 | 13,114,052 |
| Unum Group | | 60,867 | 4,445,116 |
| Willis Towers Watson PLC | | 42,400 | 13,281,376 |
| | | | 115,891,707 |
TOTAL FINANCIALS | | | 631,426,460 |
| | | | |
| Health Care - 5.9% | | | |
| Biotechnology - 1.2% | | | |
| AbbVie Inc | | 224,010 | 39,806,577 |
| Alnylam Pharmaceuticals Inc (b) | | 45,300 | 10,659,543 |
| Exact Sciences Corp (b) | | 54,000 | 3,034,260 |
| Gilead Sciences Inc | | 385,804 | 35,636,715 |
| Upstream Bio Inc | | 72,000 | 1,183,680 |
| | | | 90,320,775 |
| Health Care Equipment & Supplies - 1.9% | | | |
| Boston Scientific Corp (b) | | 641,968 | 57,340,583 |
| Ceribell Inc | | 48,100 | 1,244,828 |
| Insulet Corp (b) | | 36,700 | 9,581,269 |
| Intuitive Surgical Inc (b) | | 57,694 | 30,113,960 |
| Masimo Corp (b) | | 33,100 | 5,471,430 |
| PROCEPT BioRobotics Corp (b) | | 4,300 | 346,236 |
| Stryker Corp | | 97,100 | 34,960,855 |
| | | | 139,059,161 |
| Health Care Providers & Services - 1.1% | | | |
| Cencora Inc | | 36,389 | 8,175,881 |
| Tenet Healthcare Corp (b) | | 76,800 | 9,694,464 |
| UnitedHealth Group Inc | | 138,112 | 69,865,336 |
| | | | 87,735,681 |
| Life Sciences Tools & Services - 0.3% | | | |
| Danaher Corp | | 107,000 | 24,561,850 |
| Pharmaceuticals - 1.4% | | | |
| Eli Lilly & Co | | 86,733 | 66,957,876 |
| Merck & Co Inc | | 380,942 | 37,896,110 |
| Royalty Pharma PLC Class A | | 180,367 | 4,601,162 |
| | | | 109,455,148 |
TOTAL HEALTH CARE | | | 451,132,615 |
| | | | |
| Industrials - 5.4% | | | |
| Aerospace & Defense - 1.7% | | | |
| Boeing Co (b) | | 129,947 | 23,000,619 |
| GE Aerospace | | 196,989 | 32,855,796 |
| Howmet Aerospace Inc | | 148,400 | 16,230,508 |
| Lockheed Martin Corp | | 43,370 | 21,075,218 |
| Northrop Grumman Corp | | 19,470 | 9,137,076 |
| RTX Corp | | 52,777 | 6,107,354 |
| Space Exploration Technologies Corp (b)(c)(d) | | 17,000 | 3,145,000 |
| TransDigm Group Inc | | 13,300 | 16,854,824 |
| | | | 128,406,395 |
| Building Products - 0.5% | | | |
| Fortune Brands Innovations Inc | | 27,500 | 1,879,075 |
| Trane Technologies PLC | | 98,394 | 36,341,824 |
| | | | 38,220,899 |
| Construction & Engineering - 0.1% | | | |
| Quanta Services Inc | | 31,900 | 10,081,995 |
| Electrical Equipment - 0.8% | | | |
| AMETEK Inc | | 143,153 | 25,804,760 |
| Eaton Corp PLC | | 61,400 | 20,376,818 |
| GE Vernova Inc | | 50,897 | 16,741,550 |
| | | | 62,923,128 |
| Ground Transportation - 0.6% | | | |
| CSX Corp | | 366,462 | 11,825,729 |
| Old Dominion Freight Line Inc | | 81,500 | 14,376,600 |
| Uber Technologies Inc (b) | | 77,000 | 4,644,640 |
| Union Pacific Corp | | 56,000 | 12,770,240 |
| | | | 43,617,209 |
| Machinery - 1.6% | | | |
| Caterpillar Inc | | 51,425 | 18,654,933 |
| Deere & Co | | 13,900 | 5,889,430 |
| Dover Corp | | 111,000 | 20,823,600 |
| Fortive Corp | | 127,040 | 9,528,000 |
| Ingersoll Rand Inc | | 246,500 | 22,298,390 |
| Parker-Hannifin Corp | | 50,801 | 32,310,960 |
| Westinghouse Air Brake Technologies Corp | | 49,700 | 9,422,623 |
| | | | 118,927,936 |
| Passenger Airlines - 0.0% | | | |
| Delta Air Lines Inc | | 67,800 | 4,101,900 |
| Professional Services - 0.1% | | | |
| Dun & Bradstreet Holdings Inc | | 506,568 | 6,311,837 |
TOTAL INDUSTRIALS | | | 412,591,299 |
| | | | |
| Information Technology - 19.7% | | | |
| Communications Equipment - 0.5% | | | |
| Arista Networks Inc | | 99,604 | 11,009,230 |
| Cisco Systems Inc | | 429,145 | 25,405,384 |
| | | | 36,414,614 |
| Electronic Equipment, Instruments & Components - 0.1% | | | |
| Amphenol Corp Class A | | 108,274 | 7,519,629 |
| IT Services - 0.4% | | | |
| EPAM Systems Inc (b) | | 21,280 | 4,975,690 |
| Gartner Inc (b) | | 15,208 | 7,367,820 |
| MongoDB Inc Class A (b) | | 68,000 | 15,831,080 |
| Twilio Inc Class A (b) | | 686 | 74,142 |
| | | | 28,248,732 |
| Semiconductors & Semiconductor Equipment - 7.1% | | | |
| Advanced Micro Devices Inc (b) | | 12,313 | 1,487,287 |
| Analog Devices Inc | | 58,266 | 12,379,194 |
| Astera Labs Inc (b) | | 86,229 | 11,421,031 |
| Broadcom Inc | | 257,625 | 59,727,781 |
| Lattice Semiconductor Corp (b) | | 42,729 | 2,420,598 |
| Marvell Technology Inc | | 295,172 | 32,601,747 |
| Micron Technology Inc | | 480,700 | 40,455,712 |
| NVIDIA Corp | | 2,722,400 | 365,591,097 |
| ON Semiconductor Corp (b) | | 107,225 | 6,760,536 |
| SolarEdge Technologies Inc (b)(g) | | 37,872 | 515,059 |
| | | | 533,360,042 |
| Software - 6.2% | | | |
| Adobe Inc (b) | | 59,366 | 26,398,873 |
| AppLovin Corp Class A (b) | | 12,900 | 4,177,407 |
| Autodesk Inc (b) | | 34,300 | 10,138,051 |
| Cadence Design Systems Inc (b) | | 31,861 | 9,572,956 |
| Elastic NV (b) | | 46,965 | 4,653,292 |
| Five9 Inc (b) | | 129,388 | 5,258,328 |
| HubSpot Inc (b) | | 23,100 | 16,095,387 |
| Intuit Inc | | 8,115 | 5,100,278 |
| Microsoft Corp | | 835,500 | 352,163,250 |
| OpenAI Global LLC rights (b)(c)(d) | | 434,455 | 434,455 |
| Oracle Corp | | 15,959 | 2,659,408 |
| Palantir Technologies Inc Class A (b) | | 41,972 | 3,174,342 |
| Salesforce Inc | | 32,683 | 10,926,907 |
| Servicenow Inc (b) | | 5,555 | 5,888,967 |
| Stripe Inc Class B (b)(c)(d) | | 19,953 | 548,907 |
| Synopsys Inc (b) | | 17,799 | 8,638,923 |
| Tenable Holdings Inc (b) | | 72,484 | 2,854,420 |
| Workday Inc Class A (b) | | 14,341 | 3,700,408 |
| | | | 472,384,559 |
| Technology Hardware, Storage & Peripherals - 5.4% | | | |
| Apple Inc | | 1,625,288 | 407,004,621 |
| Dell Technologies Inc Class C | | 78,032 | 8,992,408 |
| | | | 415,997,029 |
TOTAL INFORMATION TECHNOLOGY | | | 1,493,924,605 |
| | | | |
| Materials - 1.1% | | | |
| Chemicals - 0.9% | | | |
| Air Products and Chemicals Inc | | 28,203 | 8,179,998 |
| Axalta Coating Systems Ltd (b) | | 89,000 | 3,045,580 |
| Balchem Corp | | 14,600 | 2,379,727 |
| Cabot Corp | | 14,100 | 1,287,471 |
| Chemours Co/The | | 104,200 | 1,760,980 |
| Corteva Inc | | 93,400 | 5,320,064 |
| Dow Inc | | 86,100 | 3,455,193 |
| Ecolab Inc | | 41,800 | 9,794,576 |
| Element Solutions Inc | | 109,400 | 2,782,042 |
| Linde PLC | | 53,270 | 22,302,551 |
| Sherwin-Williams Co/The | | 12,000 | 4,079,160 |
| Tronox Holdings PLC | | 157,200 | 1,583,004 |
| | | | 65,970,346 |
| Construction Materials - 0.0% | | | |
| Martin Marietta Materials Inc | | 9,184 | 4,743,535 |
| Containers & Packaging - 0.1% | | | |
| AptarGroup Inc | | 21,400 | 3,361,940 |
| International Paper Co | | 95,300 | 5,129,046 |
| | | | 8,490,986 |
| Metals & Mining - 0.1% | | | |
| ATI Inc (b) | | 28,500 | 1,568,640 |
| Freeport-McMoRan Inc | | 85,151 | 3,242,550 |
| Nucor Corp | | 31,200 | 3,641,352 |
| | | | 8,452,542 |
TOTAL MATERIALS | | | 87,657,409 |
| | | | |
| Real Estate - 1.3% | | | |
| Health Care REITs - 0.2% | | | |
| Omega Healthcare Investors Inc | | 40,400 | 1,529,140 |
| Ventas Inc | | 77,000 | 4,534,530 |
| Welltower Inc | | 64,200 | 8,091,126 |
| | | | 14,154,796 |
| Industrial REITs - 0.2% | | | |
| Prologis Inc | | 90,400 | 9,555,280 |
| Terreno Realty Corp | | 52,300 | 3,093,022 |
| | | | 12,648,302 |
| Office REITs - 0.0% | | | |
| COPT Defense Properties | | 76,600 | 2,370,770 |
| Real Estate Management & Development - 0.0% | | | |
| CBRE Group Inc Class A (b) | | 57,000 | 7,483,530 |
| Residential REITs - 0.2% | | | |
| Essex Property Trust Inc | | 612 | 174,689 |
| Invitation Homes Inc | | 190,900 | 6,103,073 |
| Mid-America Apartment Communities Inc | | 28,400 | 4,389,788 |
| Sun Communities Inc | | 18,300 | 2,250,351 |
| | | | 12,917,901 |
| Retail REITs - 0.2% | | | |
| Curbline Properties Corp | | 94,750 | 2,200,095 |
| Macerich Co/The | | 180,600 | 3,597,552 |
| NNN REIT Inc | | 64,000 | 2,614,400 |
| Tanger Inc | | 91,800 | 3,133,134 |
| | | | 11,545,181 |
| Specialized REITs - 0.5% | | | |
| American Tower Corp | | 73,400 | 13,462,294 |
| Crown Castle Inc | | 10,900 | 989,284 |
| CubeSmart | | 99,900 | 4,280,715 |
| Digital Realty Trust Inc | | 35,500 | 6,295,215 |
| Equinix Inc | | 12,100 | 11,408,969 |
| Extra Space Storage Inc | | 1,511 | 226,046 |
| Four Corners Property Trust Inc | | 46,200 | 1,253,868 |
| Public Storage Operating Co | | 11,800 | 3,533,392 |
| | | | 41,449,783 |
TOTAL REAL ESTATE | | | 102,570,263 |
| | | | |
| Utilities - 1.5% | | | |
| Electric Utilities - 1.0% | | | |
| Constellation Energy Corp | | 35,878 | 8,026,267 |
| Duke Energy Corp | | 24,000 | 2,585,760 |
| Edison International | | 97,500 | 7,784,400 |
| Entergy Corp | | 122,200 | 9,265,204 |
| Evergy Inc | | 38,900 | 2,394,295 |
| Eversource Energy | | 43,928 | 2,522,785 |
| Exelon Corp | | 92,800 | 3,492,992 |
| FirstEnergy Corp | | 112,500 | 4,475,250 |
| NextEra Energy Inc | | 181,104 | 12,983,346 |
| NRG Energy Inc | | 11,437 | 1,031,846 |
| PG&E Corp | | 567,319 | 11,448,497 |
| Southern Co/The | | 49,346 | 4,062,163 |
| Xcel Energy Inc | | 82,300 | 5,556,896 |
| | | | 75,629,701 |
| Independent Power and Renewable Electricity Producers - 0.1% | | | |
| AES Corp/The | | 235,900 | 3,036,033 |
| Vistra Corp | | 46,300 | 6,383,381 |
| | | | 9,419,414 |
| Multi-Utilities - 0.4% | | | |
| Ameren Corp | | 50,900 | 4,537,226 |
| CenterPoint Energy Inc | | 167,200 | 5,305,256 |
| NiSource Inc | | 133,100 | 4,892,756 |
| Public Service Enterprise Group Inc | | 61,340 | 5,182,617 |
| Sempra | | 147,596 | 12,947,121 |
| | | | 32,864,976 |
TOTAL UTILITIES | | | 117,914,091 |
| | | | |
| TOTAL UNITED STATES | | | 4,708,909,064 |
| ZAMBIA - 0.0% | | | |
| Materials - 0.0% | | | |
| Metals & Mining - 0.0% | | | |
| First Quantum Minerals Ltd (b) | | 196,100 | 2,527,902 |
| TOTAL COMMON STOCKS (Cost $2,772,535,467) | | | 4,969,512,557 |
| | | | |
| Convertible Preferred Stocks - 0.2% |
| | | Shares | Value ($) |
| CHINA - 0.1% | | | |
| Communication Services - 0.1% | | | |
| Interactive Media & Services - 0.1% | | | |
| ByteDance Ltd Series E1 (b)(c)(d) | | 21,701 | 5,374,470 |
| ESTONIA - 0.0% | | | |
| Information Technology - 0.0% | | | |
| Software - 0.0% | | | |
| Bolt Technology OU Series E (b)(c)(d) | | 6,283 | 1,154,888 |
| ISRAEL - 0.0% | | | |
| Information Technology - 0.0% | | | |
| Semiconductors & Semiconductor Equipment - 0.0% | | | |
| Xsight Labs Ltd Series D (b)(c)(d) | | 65,770 | 415,008 |
| UNITED STATES - 0.1% | | | |
| Consumer Discretionary - 0.0% | | | |
| Automobiles - 0.0% | | | |
| Waymo LLC (c)(d) | | 5,806 | 450,719 |
| Industrials - 0.0% | | | |
| Aerospace & Defense - 0.0% | | | |
| ABL Space Systems Co Series A8 (c)(d) | | 20,155 | 7,861 |
| ABL Space Systems Co Series A9 (c)(d) | | 9,157 | 3,571 |
| | | | 11,432 |
| Construction & Engineering - 0.0% | | | |
| Beta Technologies Inc Series A (b)(c)(d) | | 7,264 | 830,348 |
TOTAL INDUSTRIALS | | | 841,780 |
| | | | |
| Information Technology - 0.1% | | | |
| Communications Equipment - 0.0% | | | |
| Astranis Space Technologies Corp Series C (b)(c)(d) | | 60,816 | 791,824 |
| IT Services - 0.0% | | | |
| Gupshup Inc (b)(c)(d) | | 59,838 | 474,515 |
| Software - 0.1% | | | |
| Algolia Inc Series D (b)(c)(d) | | 28,064 | 652,769 |
| Databricks Inc Series G (b)(c)(d) | | 4,461 | 412,643 |
| Databricks Inc Series H (b)(c)(d) | | 18,642 | 1,724,385 |
| Skyryse Inc Series B (b)(c)(d) | | 50,000 | 1,222,000 |
| Stripe Inc Series H (b)(c)(d) | | 19,876 | 546,789 |
| | | | 4,558,586 |
TOTAL INFORMATION TECHNOLOGY | | | 5,824,925 |
| | | | |
| TOTAL UNITED STATES | | | 7,117,424 |
| TOTAL CONVERTIBLE PREFERRED STOCKS (Cost $14,066,302) | | | 14,061,790 |
| | | | |
| Fixed-Income Funds - 33.7% |
| | | Shares | Value ($) |
Fidelity VIP Investment Grade Central Fund (h) (Cost $2,868,931,350) | | 28,127,599 | 2,573,112,775 |
| | | | |
| Non-Convertible Preferred Stocks - 0.0% |
| | | Shares | Value ($) |
| UNITED STATES - 0.0% | | | |
| Industrials - 0.0% | | | |
| Professional Services - 0.0% | | | |
Checkr Inc Series E (b)(c) (Cost $1,571,886) | | 87,327 | 665,432 |
| | | | |
| U.S. Treasury Obligations - 0.0% |
| | | Yield (%) (i) | Principal Amount (a) | Value ($) |
| US Treasury Bills 0% 1/16/2025 | | 4.58 | 50,000 | 49,917 |
| US Treasury Bills 0% 1/30/2025 (j) | | 4.51 | 2,100,000 | 2,093,091 |
| US Treasury Bills 0% 1/9/2025 | | 4.58 | 110,000 | 109,910 |
| US Treasury Bills 0% 2/20/2025 (j) | | 4.46 | 570,000 | 566,760 |
| TOTAL U.S. TREASURY OBLIGATIONS (Cost $2,818,751) | | | | 2,819,678 |
| | | | | |
| Money Market Funds - 0.9% |
| | | Yield (%) | Shares | Value ($) |
| Fidelity Cash Central Fund (k) | | 4.36 | 70,733,880 | 70,748,027 |
| Fidelity Securities Lending Cash Central Fund (k)(l) | | 4.35 | 515,149 | 515,200 |
| TOTAL MONEY MARKET FUNDS (Cost $71,262,719) | | | | 71,263,227 |
| | | | | |
| TOTAL INVESTMENT IN SECURITIES - 100.0% (Cost $5,731,186,475) | 7,631,435,459 |
NET OTHER ASSETS (LIABILITIES) - 0.0% | 3,536,188 |
| NET ASSETS - 100.0% | 7,634,971,647 |
| | |
| Futures Contracts |
| | Number of contracts | Expiration Date | Notional Amount ($) | Value ($) | Unrealized Appreciation/ (Depreciation) ($) |
| Purchased | | | | | |
| | | | | | |
| Equity Contracts | | | | | |
| CME E-mini S&P 500 Index Contracts (United States) | 136 | Mar 2025 | 40,363,100 | (1,310,535) | (1,310,535) |
| | | | | | |
| The notional amount of futures purchased as a percentage of Net Assets is 0.5% |
Legend
| (a) | Amount is stated in United States dollars unless otherwise noted. |
| (d) | Restricted securities (including private placements) - Investment in securities not registered under the Securities Act of 1933 (excluding 144A issues). At the end of the period, the value of restricted securities (excluding 144A issues) amounted to $22,129,603 or 0.3% of net assets. |
| (e) | Security is exempt from registration under Regulation S of the Securities Act of 1933 and may be resold to qualified foreign investors outside of the United States. At the end of the period, the value of securities amounted to $1,296,154 or 0.0% of net assets. |
| (f) | Security exempt from registration under Rule 144A of the Securities Act of 1933. These securities may be resold in transactions exempt from registration, normally to qualified institutional buyers. At the end of the period, the value of these securities amounted to $1,296,154 or 0.0% of net assets. |
| (g) | Security or a portion of the security is on loan at period end. |
| (h) | Affiliated fund that is generally available only to investment companies and other accounts managed by Fidelity Investments. A complete unaudited schedule of portfolio holdings for each Fidelity Central Fund is filed with the SEC for the first and third quarters of each fiscal year on Form N-PORT and is available upon request or at the SEC's website at www.sec.gov. An unaudited holdings listing for the Fund, which presents direct holdings as well as the pro-rata share of securities and other investments held indirectly through its investment in underlying non-money market Fidelity Central Funds, is available at fidelity.com and/or institutional.fidelity.com, as applicable. In addition, each Fidelity Central Fund's financial statements,which are not covered by the Fund's Report of Independent Registered Public Accounting Firm, are available on the SEC's website or upon request. |
| (i) | Yield represents either the annualized yield at the date of purchase, or the stated coupon rate, or, for floating and adjustable rate securities, the rate at period end. |
| (j) | Security or a portion of the security was pledged to cover margin requirements for futures contracts. At period end, the value of securities pledged amounted to $2,096,710. |
| (k) | Affiliated fund that is generally available only to investment companies and other accounts managed by Fidelity Investments. The rate quoted is the annualized seven-day yield of the fund at period end. A complete unaudited listing of the fund's holdings as of its most recent quarter end is available upon request. In addition, each Fidelity Central Fund's financial statements, which are not covered by the Fund's Report of Independent Registered Public Accounting Firm, are available on the SEC's website or upon request. |
| (l) | Investment made with cash collateral received from securities on loan. |
| Additional information on each restricted holding is as follows: |
| Security | Acquisition Date | Acquisition Cost ($) |
| ABL Space Systems Co Series A8 | 3/24/21 | 799,967 |
| | | |
| ABL Space Systems Co Series A9 | 10/22/21 | 556,752 |
| | | |
| Algolia Inc Series D | 7/23/21 | 820,733 |
| | | |
| Astranis Space Technologies Corp Series C | 3/19/21 | 1,333,143 |
| | | |
| Beta Technologies Inc Series A | 4/09/21 | 532,233 |
| | | |
| Bolt Technology OU Series E | 1/03/22 | 1,632,301 |
| | | |
| ByteDance Ltd Series E1 | 11/18/20 | 2,377,869 |
| | | |
| Cazoo Group Ltd | 3/28/21 | 455,871 |
| | | |
| Databricks Inc Series G | 2/01/21 | 263,746 |
| | | |
| Databricks Inc Series H | 8/31/21 | 1,369,891 |
| | | |
| Epic Games Inc | 3/29/21 | 1,603,620 |
| | | |
| Gupshup Inc | 6/08/21 | 1,368,208 |
| | | |
| Jumo World Holding Limited | 9/06/23 | 176,324 |
| | | |
| OpenAI Global LLC rights | 9/30/24 | 434,455 |
| | | |
| Skyryse Inc Series B | 10/21/21 | 1,233,999 |
| | | |
| Space Exploration Technologies Corp | 2/16/21 | 713,983 |
| | | |
| Starling Bank Ltd Class D | 6/18/21 | 1,352,573 |
| | | |
| Stripe Inc Class B | 5/18/21 | 800,682 |
| | | |
| Stripe Inc Series H | 3/15/21 - 5/25/23 | 797,525 |
| | | |
| Waymo LLC | 10/18/24 | 454,037 |
| | | |
| Xsight Labs Ltd Series D | 2/16/21 | 525,897 |
| | | |
Affiliated Central Funds
Fiscal year to date information regarding the Fund's investments in Fidelity Central Funds, including the ownership percentage, is presented below.
| Affiliate | Value, beginning of period ($) | Purchases ($) | Sales Proceeds ($) | Dividend Income ($) | Realized Gain (loss) ($) | Change in Unrealized appreciation (depreciation) ($) | Value, end of period ($) | Shares, end of period | % ownership, end of period |
| Fidelity Cash Central Fund | 90,021,927 | 1,003,679,565 | 1,022,954,492 | 3,990,501 | 1,027 | - | 70,748,027 | 70,733,880 | 0.1% |
| Fidelity Securities Lending Cash Central Fund | 11,121,334 | 84,039,977 | 94,646,111 | 12,674 | - | - | 515,200 | 515,149 | 0.0% |
| Fidelity VIP Investment Grade Central Fund | 2,515,286,664 | 218,196,908 | 102,141,718 | 109,973,993 | (17,784,158) | (40,444,921) | 2,573,112,775 | 28,127,599 | 87.8% |
| Total | 2,616,429,925 | 1,305,916,450 | 1,219,742,321 | 113,977,168 | (17,783,131) | (40,444,921) | 2,644,376,002 | 99,376,628 | |
| | | | | | | | | | |
Amounts in the dividend income column in the above table include any capital gain distributions from underlying funds, which are presented in the corresponding line item in the Statement of Operations, if applicable.
Amounts in the dividend income column for Fidelity Securities Lending Cash Central Fund represents the income earned on investing cash collateral, less rebates paid to borrowers and any lending agent fees associated with the loan, plus any premium payments received for lending certain types of securities.
Amounts included in the purchases and sales proceeds columns may include in-kind transactions, if applicable.
Investment Valuation
The following is a summary of the inputs used, as of December 31, 2024, involving the Fund's assets and liabilities carried at fair value. The inputs or methodology used for valuing securities may not be an indication of the risk associated with investing in those securities. For more information on valuation inputs, and their aggregation into the levels used below, please refer to the Investment Valuation section in the accompanying Notes to Financial Statements.
| Valuation Inputs at Reporting Date: |
| Description | Total ($) | Level 1 ($) | Level 2 ($) | Level 3 ($) |
Investments in Securities: | | | | |
|
| Common Stocks | | | | |
Communication Services | 497,707,416 | 495,181,802 | 1,296,154 | 1,229,460 |
Consumer Discretionary | 551,819,412 | 551,819,412 | - | - |
Consumer Staples | 275,605,625 | 272,657,023 | 2,948,602 | - |
Energy | 149,250,040 | 142,651,660 | 6,598,380 | - |
Financials | 678,183,438 | 653,694,461 | 18,400,879 | 6,088,098 |
Health Care | 515,827,375 | 515,827,375 | - | - |
Industrials | 412,591,299 | 409,446,299 | - | 3,145,000 |
Information Technology | 1,571,390,231 | 1,512,829,098 | 57,577,771 | 983,362 |
Materials | 96,653,367 | 96,653,367 | - | - |
Real Estate | 102,570,263 | 102,570,263 | - | - |
Utilities | 117,914,091 | 117,914,091 | - | - |
|
| Convertible Preferred Stocks | | | | |
Communication Services | 5,374,470 | - | - | 5,374,470 |
Consumer Discretionary | 450,719 | - | - | 450,719 |
Industrials | 841,780 | - | - | 841,780 |
Information Technology | 7,394,821 | - | - | 7,394,821 |
|
| Fixed-Income Funds | 2,573,112,775 | 2,573,112,775 | - | - |
|
| Non-Convertible Preferred Stocks | | | | |
Industrials | 665,432 | - | - | 665,432 |
|
| U.S. Treasury Obligations | 2,819,678 | - | 2,819,678 | - |
|
| Money Market Funds | 71,263,227 | 71,263,227 | - | - |
| Total Investments in Securities: | 7,631,435,459 | 7,515,620,853 | 89,641,464 | 26,173,142 |
Derivative Instruments: Liabilities | | | | |
Futures Contracts | (1,310,535) | (1,310,535) | - | - |
| Total Liabilities | (1,310,535) | (1,310,535) | - | - |
| Total Derivative Instruments: | (1,310,535) | (1,310,535) | - | - |
Value of Derivative Instruments
The following table is a summary of the Fund's value of derivative instruments by primary risk exposure as of December 31, 2024. For additional information on derivative instruments, please refer to the Derivative Instruments section in the accompanying Notes to Financial Statements.
Primary Risk Exposure / Derivative Type | Value |
| Asset ($) | Liability ($) |
| Equity Risk | | |
Futures Contracts (a) | 0 | (1,310,535) |
| Total Equity Risk | 0 | (1,310,535) |
| Total Value of Derivatives | 0 | (1,310,535) |
(a)Reflects gross cumulative appreciation (depreciation) on futures contracts as presented in the Schedule of Investments. In the Statement of Assets and Liabilities, the period end daily variation margin is included in receivable or payable for daily variation margin on futures contracts, and the net cumulative appreciation (depreciation) is included in Total accumulated earnings (loss).
Financial Statements
| Statement of Assets and Liabilities |
As of December 31, 2024 |
| Assets | | | | |
| Investment in securities, at value (including securities loaned of $500,480) - See accompanying schedule: | | | | |
Unaffiliated issuers (cost $2,790,992,406) | $ | 4,987,059,457 | | |
Fidelity Central Funds (cost $2,940,194,069) | | 2,644,376,002 | | |
| | | | | |
| | | | | |
| Total Investment in Securities (cost $5,731,186,475) | | | $ | 7,631,435,459 |
| Cash | | | | 198,339 |
| Receivable for investments sold | | | | 43,254,116 |
| Receivable for fund shares sold | | | | 1,999,949 |
| Dividends receivable | | | | 3,154,252 |
| Distributions receivable from Fidelity Central Funds | | | | 298,482 |
| Prepaid expenses | | | | 6,577 |
| Other receivables | | | | 11,443 |
Total assets | | | | 7,680,358,617 |
| Liabilities | | | | |
| Payable to custodian bank | $ | 3,174 | | |
| Payable for investments purchased | | 39,490,706 | | |
| Payable for fund shares redeemed | | 1,465,300 | | |
| Accrued management fee | | 2,953,017 | | |
| Distribution and service plan fees payable | | 627,003 | | |
| Payable for daily variation margin on futures contracts | | 156,400 | | |
| Other payables and accrued expenses | | 176,170 | | |
| Collateral on securities loaned | | 515,200 | | |
| Total liabilities | | | | 45,386,970 |
| Commitments and contingent liabilities (see Significant Accounting Policies note) | | | | |
| Net Assets | | | $ | 7,634,971,647 |
| Net Assets consist of: | | | | |
| Paid in capital | | | $ | 5,339,856,319 |
| Total accumulated earnings (loss) | | | | 2,295,115,328 |
| Net Assets | | | $ | 7,634,971,647 |
| | | | | |
| Net Asset Value and Maximum Offering Price | | | | |
| Initial Class : | | | | |
Net Asset Value, offering price and redemption price per share ($295,718,414 ÷ 12,017,532 shares) | | | $ | 24.61 |
| Service Class : | | | | |
Net Asset Value, offering price and redemption price per share ($39,994,650 ÷ 1,642,765 shares) | | | $ | 24.35 |
| Service Class 2 : | | | | |
Net Asset Value, offering price and redemption price per share ($2,940,840,096 ÷ 124,119,084 shares) | | | $ | 23.69 |
| Investor Class : | | | | |
Net Asset Value, offering price and redemption price per share ($4,358,418,487 ÷ 179,335,356 shares) | | | $ | 24.30 |
| Statement of Operations |
| Year ended December 31, 2024 |
| Investment Income | | | | |
| Dividends | | | $ | 52,988,872 |
| Interest | | | | 175,089 |
| Income from Fidelity Central Funds (including $12,674 from security lending) | | | | 113,977,168 |
| Total income | | | | 167,141,129 |
| Expenses | | | | |
| Management fee | $ | 32,674,301 | | |
| Transfer agent fees | | 1,230,879 | | |
| Distribution and service plan fees | | 7,000,694 | | |
| Accounting fees | | 238,877 | | |
| Custodian fees and expenses | | 135,402 | | |
| Independent trustees' fees and expenses | | 31,427 | | |
| Audit fees | | 93,338 | | |
| Legal | | 18,812 | | |
| Interest | | 9,829 | | |
| Miscellaneous | | 74,658 | | |
| Total expenses before reductions | | 41,508,217 | | |
| Expense reductions | | (306,333) | | |
| Total expenses after reductions | | | | 41,201,884 |
| Net Investment income (loss) | | | | 125,939,245 |
| Realized and Unrealized Gain (Loss) | | | | |
| Net realized gain (loss) on: | | | | |
| Investment Securities: | | | | |
| Unaffiliated issuers (net of foreign taxes of $75,363) | | 420,954,083 | | |
| Fidelity Central Funds | | (17,783,131) | | |
| Foreign currency transactions | | (5,717) | | |
| Futures contracts | | 11,010,902 | | |
| Total net realized gain (loss) | | | | 414,176,137 |
| Change in net unrealized appreciation (depreciation) on: | | | | |
| Investment Securities: | | | | |
| Unaffiliated issuers (net of decrease in deferred foreign taxes of $15,884) | | 561,167,602 | | |
| Fidelity Central Funds | | (40,444,921) | | |
| Unfunded commitments | | 35,407 | | |
| Assets and liabilities in foreign currencies | | (73,466) | | |
| Futures contracts | | (2,878,345) | | |
| Total change in net unrealized appreciation (depreciation) | | | | 517,806,277 |
| Net gain (loss) | | | | 931,982,414 |
| Net increase (decrease) in net assets resulting from operations | | | $ | 1,057,921,659 |
| Statement of Changes in Net Assets |
| |
| | Year ended December 31, 2024 | | Year ended December 31, 2023 |
| Increase (Decrease) in Net Assets | | | | |
| Operations | | | | |
| Net investment income (loss) | $ | 125,939,245 | $ | 107,182,484 |
| Net realized gain (loss) | | 414,176,137 | | 203,850,891 |
| Change in net unrealized appreciation (depreciation) | | 517,806,277 | | 911,522,053 |
| Net increase (decrease) in net assets resulting from operations | | 1,057,921,659 | | 1,222,555,428 |
| Distributions to shareholders | | (362,420,010) | | (332,107,349) |
| | | | | |
| Share transactions - net increase (decrease) | | 103,542,165 | | 103,039,845 |
| Total increase (decrease) in net assets | | 799,043,814 | | 993,487,924 |
| | | | | |
| Net Assets | | | | |
| Beginning of period | | 6,835,927,833 | | 5,842,439,909 |
| End of period | $ | 7,634,971,647 | $ | 6,835,927,833 |
| | | | | |
| | | | | |
Financial Highlights
VIP Balanced Portfolio Initial Class |
| |
| Years ended December 31, | | 2024 | | 2023 | | 2022 | | 2021 | | 2020 |
Selected Per-Share Data | | | | | | | | | | |
| Net asset value, beginning of period | $ | 22.32 | $ | 19.38 | $ | 25.29 | $ | 23.29 | $ | 19.55 |
| Income from Investment Operations | | | | | | | | | | |
Net investment income (loss) A,B | | .44 | | .38 | | .28 | | .25 | | .29 |
| Net realized and unrealized gain (loss) | | 3.04 | | 3.67 | | (4.62) | | 3.79 | | 4.02 |
| Total from investment operations | | 3.48 | | 4.05 | | (4.34) | | 4.04 | | 4.31 |
| Distributions from net investment income | | (.43) C | | (.36) | | (.27) | | (.23) | | (.30) |
| Distributions from net realized gain | | (.76) C | | (.75) | | (1.30) | | (1.81) | | (.28) |
| Total distributions | | (1.19) | | (1.11) | | (1.57) | | (2.04) | | (.57) D |
| Net asset value, end of period | $ | 24.61 | $ | 22.32 | $ | 19.38 | $ | 25.29 | $ | 23.29 |
Total Return E,F | | | | 21.53% | | (17.94)% | | 18.26% | | 22.39% |
Ratios to Average Net Assets B,G,H | | | | | | | | | | |
| Expenses before reductions | | .43% | | .46% | | .47% | | .46% | | .48% |
| Expenses net of fee waivers, if any | | | | .46% | | .46% | | .46% | | .48% |
| Expenses net of all reductions | | .42% | | .46% | | .46% | | .46% | | .47% |
| Net investment income (loss) | | 1.86% | | 1.83% | | 1.32% | | 1.01% | | 1.45% |
| Supplemental Data | | | | | | | | | | |
| Net assets, end of period (000 omitted) | $ | 295,718 | $ | 301,809 | $ | 266,447 | $ | 332,976 | $ | 271,384 |
Portfolio turnover rate I | | | | 28% | | 37% | | 33% | | 62% |
ACalculated based on average shares outstanding during the period.
BNet investment income (loss) is affected by the timing of the declaration of dividends by any underlying mutual funds or exchange-traded funds (ETFs). Net investment income (loss) of any mutual funds or ETFs is not included in the Fund's net investment income (loss) ratio.
CThe amount shown reflects reclassifications related to book to tax differences that were made in the year shown.
DTotal distributions per share do not sum due to rounding.
ETotal returns do not reflect charges attributable to your insurance company's separate account. Inclusion of these charges would reduce the total returns shown.
FTotal returns would have been lower if certain expenses had not been reduced during the applicable periods shown.
GFees and expenses of any underlying mutual funds or exchange-traded funds (ETFs) are not included in the Fund's expense ratio. The Fund indirectly bears its proportionate share of these expenses. For additional expense information related to investments in Fidelity Central Funds, please refer to the "Investments in Fidelity Central Funds" note found in the Notes to Financial Statements section of the most recent Annual or Semi-Annual report.
HExpense ratios reflect operating expenses of the class. Expenses before reductions do not reflect amounts reimbursed, waived, or reduced through arrangements with the investment adviser, brokerage services, or other offset arrangements, if applicable, and do not represent the amount paid by the class during periods when reimbursements, waivers or reductions occur.
IAmount does not include the portfolio activity of any underlying mutual funds or exchange-traded funds (ETFs), derivatives or securities that mature within one year from acquisition.
VIP Balanced Portfolio Service Class |
| |
| Years ended December 31, | | 2024 | | 2023 | | 2022 | | 2021 | | 2020 |
Selected Per-Share Data | | | | | | | | | | |
| Net asset value, beginning of period | $ | 22.10 | $ | 19.20 | $ | 25.07 | $ | 23.11 | $ | 19.40 |
| Income from Investment Operations | | | | | | | | | | |
Net investment income (loss) A,B | | .41 | | .35 | | .25 | | .22 | | .27 |
| Net realized and unrealized gain (loss) | | 3.02 | | 3.64 | | (4.57) | | 3.76 | | 4.00 |
| Total from investment operations | | 3.43 | | 3.99 | | (4.32) | | 3.98 | | 4.27 |
| Distributions from net investment income | | (.42) C | | (.34) | | (.25) | | (.21) | | (.28) |
| Distributions from net realized gain | | (.76) C | | (.75) | | (1.30) | | (1.81) | | (.28) |
| Total distributions | | (1.18) | | (1.09) | | (1.55) | | (2.02) | | (.56) |
| Net asset value, end of period | $ | 24.35 | $ | 22.10 | $ | 19.20 | $ | 25.07 | $ | 23.11 |
Total Return D,E | | | | 21.40% | | (18.02)% | | 18.13% | | 22.32% |
Ratios to Average Net Assets B,F,G | | | | | | | | | | |
| Expenses before reductions | | .53% | | .56% | | .57% | | .56% | | .58% |
| Expenses net of fee waivers, if any | | | | .56% | | .56% | | .56% | | .58% |
| Expenses net of all reductions | | .52% | | .56% | | .56% | | .56% | | .57% |
| Net investment income (loss) | | 1.75% | | 1.73% | | 1.22% | | .91% | | 1.35% |
| Supplemental Data | | | | | | | | | | |
| Net assets, end of period (000 omitted) | $ | 39,995 | $ | 36,925 | $ | 35,778 | $ | 41,039 | $ | 30,072 |
Portfolio turnover rate H | | | | 28% | | 37% | | 33% | | 62% |
ACalculated based on average shares outstanding during the period.
BNet investment income (loss) is affected by the timing of the declaration of dividends by any underlying mutual funds or exchange-traded funds (ETFs). Net investment income (loss) of any mutual funds or ETFs is not included in the Fund's net investment income (loss) ratio.
CThe amount shown reflects reclassifications related to book to tax differences that were made in the year shown.
DTotal returns do not reflect charges attributable to your insurance company's separate account. Inclusion of these charges would reduce the total returns shown.
ETotal returns would have been lower if certain expenses had not been reduced during the applicable periods shown.
FFees and expenses of any underlying mutual funds or exchange-traded funds (ETFs) are not included in the Fund's expense ratio. The Fund indirectly bears its proportionate share of these expenses. For additional expense information related to investments in Fidelity Central Funds, please refer to the "Investments in Fidelity Central Funds" note found in the Notes to Financial Statements section of the most recent Annual or Semi-Annual report.
GExpense ratios reflect operating expenses of the class. Expenses before reductions do not reflect amounts reimbursed, waived, or reduced through arrangements with the investment adviser, brokerage services, or other offset arrangements, if applicable, and do not represent the amount paid by the class during periods when reimbursements, waivers or reductions occur.
HAmount does not include the portfolio activity of any underlying mutual funds or exchange-traded funds (ETFs), derivatives or securities that mature within one year from acquisition.
VIP Balanced Portfolio Service Class 2 |
| |
| Years ended December 31, | | 2024 | | 2023 | | 2022 | | 2021 | | 2020 |
Selected Per-Share Data | | | | | | | | | | |
| Net asset value, beginning of period | $ | 21.55 | $ | 18.74 | $ | 24.52 | $ | 22.64 | $ | 19.02 |
| Income from Investment Operations | | | | | | | | | | |
Net investment income (loss) A,B | | .37 | | .32 | | .22 | | .18 | | .24 |
| Net realized and unrealized gain (loss) | | 2.92 | | 3.55 | | (4.48) | | 3.68 | | 3.91 |
| Total from investment operations | | 3.29 | | 3.87 | | (4.26) | | 3.86 | | 4.15 |
| Distributions from net investment income | | (.39) C | | (.31) | | (.22) | | (.18) | | (.25) |
| Distributions from net realized gain | | (.76) C | | (.75) B | | (1.30) | | (1.81) | | (.28) |
| Total distributions | | (1.15) | | (1.06) | | (1.52) | | (1.98) D | | (.53) |
| Net asset value, end of period | $ | 23.69 | $ | 21.55 | $ | 18.74 | $ | 24.52 | $ | 22.64 |
Total Return E,F | | | | 21.29% | | (18.19)% | | 17.99% | | 22.13% |
Ratios to Average Net Assets B,G,H | | | | | | | | | | |
| Expenses before reductions | | .68% | | .71% | | .72% | | .71% | | .73% |
| Expenses net of fee waivers, if any | | | | .71% | | .71% | | .71% | | .73% |
| Expenses net of all reductions | | .67% | | .71% | | .71% | | .71% | | .72% |
| Net investment income (loss) | | 1.60% | | 1.58% | | 1.07% | | .76% | | 1.20% |
| Supplemental Data | | | | | | | | | | |
| Net assets, end of period (000 omitted) | $ | 2,940,840 | $ | 2,564,995 | $ | 2,104,753 | $ | 2,562,199 | $ | 1,985,175 |
Portfolio turnover rate I | | | | 28% | | 37% | | 33% | | 62% |
ACalculated based on average shares outstanding during the period.
BNet investment income (loss) is affected by the timing of the declaration of dividends by any underlying mutual funds or exchange-traded funds (ETFs). Net investment income (loss) of any mutual funds or ETFs is not included in the Fund's net investment income (loss) ratio.
CThe amount shown reflects reclassifications related to book to tax differences that were made in the year shown.
DTotal distributions per share do not sum due to rounding.
ETotal returns do not reflect charges attributable to your insurance company's separate account. Inclusion of these charges would reduce the total returns shown.
FTotal returns would have been lower if certain expenses had not been reduced during the applicable periods shown.
GFees and expenses of any underlying mutual funds or exchange-traded funds (ETFs) are not included in the Fund's expense ratio. The Fund indirectly bears its proportionate share of these expenses. For additional expense information related to investments in Fidelity Central Funds, please refer to the "Investments in Fidelity Central Funds" note found in the Notes to Financial Statements section of the most recent Annual or Semi-Annual report.
HExpense ratios reflect operating expenses of the class. Expenses before reductions do not reflect amounts reimbursed, waived, or reduced through arrangements with the investment adviser, brokerage services, or other offset arrangements, if applicable, and do not represent the amount paid by the class during periods when reimbursements, waivers or reductions occur.
IAmount does not include the portfolio activity of any underlying mutual funds or exchange-traded funds (ETFs), derivatives or securities that mature within one year from acquisition.
VIP Balanced Portfolio Investor Class |
| |
| Years ended December 31, | | 2024 | | 2023 | | 2022 | | 2021 | | 2020 |
Selected Per-Share Data | | | | | | | | | | |
| Net asset value, beginning of period | $ | 22.06 | $ | 19.17 | $ | 25.04 | $ | 23.08 | $ | 19.37 |
| Income from Investment Operations | | | | | | | | | | |
Net investment income (loss) A,B | | .42 | | .36 | | .26 | | .22 | | .27 |
| Net realized and unrealized gain (loss) | | 3.00 | | 3.63 | | (4.58) | | 3.76 | | 4.00 |
| Total from investment operations | | 3.42 | | 3.99 | | (4.32) | | 3.98 | | 4.27 |
| Distributions from net investment income | | (.42) C | | (.35) | | (.25) | | (.21) | | (.28) |
| Distributions from net realized gain | | (.76) C | | (.75) | | (1.30) | | (1.81) | | (.28) |
| Total distributions | | (1.18) | | (1.10) | | (1.55) | | (2.02) | | (.56) |
| Net asset value, end of period | $ | 24.30 | $ | 22.06 | $ | 19.17 | $ | 25.04 | $ | 23.08 |
Total Return D,E | | | | 21.42% | | (18.03)% | | 18.17% | | 22.35% |
Ratios to Average Net Assets B,F,G | | | | | | | | | | |
| Expenses before reductions | | .50% | | .54% | | .54% | | .54% | | .56% |
| Expenses net of fee waivers, if any | | | | .53% | | .54% | | .54% | | .55% |
| Expenses net of all reductions | | .50% | | .53% | | .54% | | .54% | | .55% |
| Net investment income (loss) | | 1.78% | | 1.75% | | 1.25% | | .93% | | 1.37% |
| Supplemental Data | | | | | | | | | | |
| Net assets, end of period (000 omitted) | $ | 4,358,418 | $ | 3,932,199 | $ | 3,435,461 | $ | 4,478,013 | $ | 3,696,708 |
Portfolio turnover rate H | | | | 28% | | 37% | | 33% | | 62% |
ACalculated based on average shares outstanding during the period.
BNet investment income (loss) is affected by the timing of the declaration of dividends by any underlying mutual funds or exchange-traded funds (ETFs). Net investment income (loss) of any mutual funds or ETFs is not included in the Fund's net investment income (loss) ratio.
CThe amount shown reflects reclassifications related to book to tax differences that were made in the year shown.
DTotal returns do not reflect charges attributable to your insurance company's separate account. Inclusion of these charges would reduce the total returns shown.
ETotal returns would have been lower if certain expenses had not been reduced during the applicable periods shown.
FFees and expenses of any underlying mutual funds or exchange-traded funds (ETFs) are not included in the Fund's expense ratio. The Fund indirectly bears its proportionate share of these expenses. For additional expense information related to investments in Fidelity Central Funds, please refer to the "Investments in Fidelity Central Funds" note found in the Notes to Financial Statements section of the most recent Annual or Semi-Annual report.
GExpense ratios reflect operating expenses of the class. Expenses before reductions do not reflect amounts reimbursed, waived, or reduced through arrangements with the investment adviser, brokerage services, or other offset arrangements, if applicable, and do not represent the amount paid by the class during periods when reimbursements, waivers or reductions occur.
HAmount does not include the portfolio activity of any underlying mutual funds or exchange-traded funds (ETFs), derivatives or securities that mature within one year from acquisition.
Notes to Financial Statements
For the period ended December 31, 2024
1. Organization.
VIP Balanced Portfolio (the Fund) is a fund of Variable Insurance Products Fund III (the Trust) and is authorized to issue an unlimited number of shares. The Trust is registered under the Investment Company Act of 1940, as amended (the 1940 Act), as an open-end management investment company organized as a Massachusetts business trust. Shares of the Fund may only be purchased by insurance companies for the purpose of funding variable annuity or variable life insurance contracts. The Fund offers the following classes of shares: Initial Class shares, Service Class shares, Service Class 2 shares and Investor Class shares. All classes have equal rights and voting privileges, except for matters affecting a single class.
2. Investments in Fidelity Central Funds.
Funds may invest in Fidelity Central Funds, which are open-end investment companies generally available only to other investment companies and accounts managed by the investment adviser and its affiliates. The Schedule of Investments lists any Fidelity Central Funds held as an investment as of period end, but does not include the underlying holdings of each Fidelity Central Fund. An investing fund indirectly bears its proportionate share of the expenses of the underlying Fidelity Central Funds.
Based on its investment objective, each Fidelity Central Fund may invest or participate in various investment vehicles or strategies that are similar to those of the investing fund. These strategies are consistent with the investment objectives of the investing fund and may involve certain economic risks which may cause a decline in value of each of the Fidelity Central Funds and thus a decline in the value of the investing fund.
| Fidelity Central Fund | Investment Manager | Investment Objective | Investment Practices | Expense RatioA |
| Fidelity VIP Investment Grade Central Fund | Fidelity Management & Research Company LLC (FMR) | Seeks a high level of current income by normally investing in investment-grade debt securities and repurchase agreements. | Delayed Delivery & When Issued Securities Restricted Securities | Less than .005% |
| Fidelity Money Market Central Funds | Fidelity Management & Research Company LLC (FMR) | Each fund seeks to obtain a high level of current income consistent with the preservation of capital and liquidity. | Short-term Investments | Less than .005% |
A Expenses expressed as a percentage of average net assets and are as of each underlying Central Fund's most recent annual or semi-annual shareholder report.
An unaudited holdings listing for the investing fund, which presents direct holdings as well as the pro-rata share of any securities and other investments held indirectly through its investment in underlying non-money market Fidelity Central Funds, is available at fidelity.com and/or institutional.fidelity.com, as applicable. A complete unaudited list of holdings for each Fidelity Central Fund is available upon request or at the Securities and Exchange Commission website at www.sec.gov. In addition, the financial statements of the Fidelity Central Funds which contain the significant accounting policies (including investment valuation policies) of those funds, and are not covered by the Report of Independent Registered Public Accounting Firm, are available on the Securities and Exchange Commission website or upon request.
3. Significant Accounting Policies.
The Fund is an investment company and applies the accounting and reporting guidance of the Financial Accounting Standards Board (FASB) Accounting Standards Codification Topic 946 Financial Services - Investment Companies. The financial statements have been prepared in conformity with accounting principles generally accepted in the United States of America (GAAP), which require management to make certain estimates and assumptions at the date of the financial statements. Actual results could differ from those estimates. The Fund operates as a single operating segment. The Fund's income, expenses, assets, and performance are regularly monitored and assessed as a whole by the investment adviser and other individuals responsible for oversight functions of the Trust, using the information presented in the financial statements and financial highlights. Subsequent events, if any, through the date that the financial statements were issued have been evaluated in the preparation of the financial statements. The Fund's Schedule of Investments lists any underlying mutual funds or exchange-traded funds (ETFs) but does not include the underlying holdings of these funds. The following summarizes the significant accounting policies of the Fund:
Investment Valuation. Investments are valued as of 4:00 p.m. Eastern time on the last calendar day of the period. The Board of Trustees (the Board) has designated the Fund's investment adviser as the valuation designee responsible for the fair valuation function and performing fair value determinations as needed. The investment adviser has established a Fair Value Committee (the Committee) to carry out the day-to-day fair valuation responsibilities and has adopted policies and procedures to govern the fair valuation process and the activities of the Committee. In accordance with these fair valuation policies and procedures, which have been approved by the Board, the Fund attempts to obtain prices from one or more third party pricing services or brokers to value its investments. When current market prices, quotations or currency exchange rates are not readily available or reliable, investments will be fair valued in good faith by the Committee, in accordance with the policies and procedures. Factors used in determining fair value vary by investment type and may include market or investment specific events, transaction data, estimated cash flows, and market observations of comparable investments. The frequency that the fair valuation procedures are used cannot be predicted and they may be utilized to a significant extent. The Committee manages the Fund's fair valuation practices and maintains the fair valuation policies and procedures. The Fund's investment adviser reports to the Board information regarding the fair valuation process and related material matters.
The Fund categorizes the inputs to valuation techniques used to value its investments into a disclosure hierarchy consisting of three levels as shown below:
Level 1 - unadjusted quoted prices in active markets for identical investments
Level 2 - other significant observable inputs (including quoted prices for similar investments, interest rates, prepayment speeds, etc.)
Level 3 - unobservable inputs (including the Fund's own assumptions based on the best information available)
Valuation techniques used to value the Fund's investments by major category are as follows:
Equity securities, including restricted securities, for which market quotations are readily available, are valued at the last reported sale price or official closing price as reported by a third party pricing service on the primary market or exchange on which they are traded and are categorized as Level 1 in the hierarchy. In the event there were no sales during the day or closing prices are not available, securities are valued at the last quoted bid price or may be valued using the last available price and are generally categorized as Level 2 in the hierarchy. For foreign equity securities, when market or security specific events arise, comparisons to the valuation of American Depositary Receipts (ADRs), futures contracts, Exchange-Traded Funds (ETFs) and certain indexes as well as quoted prices for similar securities may be used and would be categorized as Level 2 in the hierarchy. For equity securities, including restricted securities, where observable inputs are limited, assumptions about market activity and risk are used and these securities may be categorized as Level 3 in the hierarchy.
Debt securities, including restricted securities, are valued based on evaluated prices received from third party pricing services or from brokers who make markets in such securities. U.S. government and government agency obligations are valued by pricing services who utilize matrix pricing which considers yield or price of bonds of comparable quality, coupon, maturity and type or by broker-supplied prices. When independent prices are unavailable or unreliable, debt securities may be valued utilizing pricing methodologies which consider similar factors that would be used by third party pricing services. Debt securities are generally categorized as Level 2 in the hierarchy but may be Level 3 depending on the circumstances.
Futures contracts are valued at the settlement price established each day by the board of trade or exchange on which they are traded and are categorized as Level 1 in the hierarchy. Investments in open-end mutual funds, including the Fidelity Central Funds, are valued at their closing net asset value (NAV) each business day and are categorized as Level 1 in the hierarchy.
Changes in valuation techniques may result in transfers in or out of an assigned level within the disclosure hierarchy. The aggregate value of investments by input level as of December 31, 2024 is included at the end of the Fund's Schedule of Investments.
Foreign Currency. Certain Funds may use foreign currency contracts to facilitate transactions in foreign-denominated securities. Gains and losses from these transactions may arise from changes in the value of the foreign currency or if the counterparties do not perform under the contracts' terms.
Foreign-denominated assets, including investment securities, and liabilities are translated into U.S. dollars at the exchange rates at period end. Purchases and sales of investment securities, income and dividends received, and expenses denominated in foreign currencies are translated into U.S. dollars at the exchange rate in effect on the transaction date.
The effects of exchange rate fluctuations on investments are included with the net realized and unrealized gain (loss) on investment securities. Other foreign currency transactions resulting in realized and unrealized gain (loss) are disclosed separately.
Investment Transactions and Income. For financial reporting purposes, the Fund's investment holdings and NAV include trades executed through the end of the last business day of the period. The NAV per share for processing shareholder transactions is calculated as of the close of business of the New York Stock Exchange (NYSE), normally 4:00 p.m. Eastern time and includes trades executed through the end of the prior business day. Gains and losses on securities sold are determined on the basis of identified cost and include proceeds received from litigation. Commissions paid to certain brokers with whom the investment adviser, or its affiliates, places trades on behalf of a fund include an amount in addition to trade execution, which may be rebated back to a fund. Any such rebates are included in net realized gain (loss) on investments in the Statement of Operations. Dividend income is recorded on the ex-dividend date, except for certain dividends from foreign securities where the ex-dividend date may have passed, which are recorded as soon as the Fund is informed of the ex-dividend date. Non-cash dividends included in dividend income, if any, are recorded at the fair market value of the securities received. Income and capital gain distributions from Fidelity Central Funds, if any, are recorded on the ex-dividend date. Certain distributions received by the Fund represent a return of capital or capital gain. The Fund determines the components of these distributions subsequent to the ex-dividend date, based upon receipt of tax filings or other correspondence relating to the underlying investment. These distributions are recorded as a reduction of cost of investments and/or as a realized gain. Interest income is accrued as earned and includes coupon interest and amortization of premium and accretion of discount on debt securities as applicable. Investment income is recorded net of foreign taxes withheld where recovery of such taxes is uncertain. Funds may file withholding tax reclaims in certain jurisdictions to recover a portion of amounts previously withheld. Any withholding tax reclaims income is included in the Statement of Operations in dividends. Any receivables for withholding tax reclaims are included in the Statement of Assets and Liabilities in dividends receivable.
Class Allocations and Expenses. Investment income, realized and unrealized capital gains and losses, common expenses of a fund, and certain fund-level expense reductions, if any, are allocated daily on a pro-rata basis to each class based on the relative net assets of each class to the total net assets of a fund. Each class differs with respect to transfer agent and distribution and service plan fees incurred, as applicable. Certain expense reductions may also differ by class, if applicable. For the reporting period, the allocated portion of income and expenses to each class as a percent of its average net assets may vary due to the timing of recording these transactions in relation to fluctuating net assets of the classes. Expenses directly attributable to a fund are charged to that fund. Expenses attributable to more than one fund are allocated among the respective funds on the basis of relative net assets or other appropriate methods. Expenses included in the accompanying financial statements reflect the expenses of that fund and do not include any expenses associated with any underlying mutual funds or exchange-traded funds (ETFs). Although not included in a fund's expenses, a fund indirectly bears its proportionate share of these expenses through the net asset value of each underlying mutual fund or exchange-traded fund (ETF). Expense estimates are accrued in the period to which they relate and adjustments are made when actual amounts are known.
Income Tax Information and Distributions to Shareholders. Each year, the Fund intends to qualify as a regulated investment company under Subchapter M of the Internal Revenue Code, including distributing substantially all of its taxable income and realized gains. As a result, no provision for U.S. Federal income taxes is required. As of December 31, 2024, the Fund did not have any unrecognized tax benefits in the financial statements; nor is the Fund aware of any tax positions for which it is reasonably possible that the total amounts of unrecognized tax benefits will significantly change in the next twelve months. The Fund files a U.S. federal tax return, in addition to state and local tax returns as required. The Fund's federal income tax returns are subject to examination by the Internal Revenue Service (IRS) for a period of three fiscal years after they are filed. State and local tax returns may be subject to examination for an additional fiscal year depending on the jurisdiction. Foreign taxes are provided for based on the Fund's understanding of the tax rules and rates that exist in the foreign markets in which it invests. The Fund is subject to a tax imposed on capital gains by certain countries in which it invests. An estimated deferred tax liability for net unrealized appreciation on the applicable securities is included in Other payables and accrued expenses on the Statement of Assets and Liabilities.
Distributions are declared and recorded on the ex-dividend date. Income and capital gain distributions are declared separately for each class. Income and capital gain distributions are determined in accordance with income tax regulations, which may differ from GAAP. These differences resulted in distribution reclassifications.
Capital accounts within the financial statements are adjusted for permanent book-tax differences. These adjustments have no impact on net assets or the results of operations. Capital accounts are not adjusted for temporary book-tax differences which will reverse in a subsequent period.
Book-tax differences are primarily due to futures contracts, foreign currency transactions, certain foreign taxes, passive foreign investment companies (PFIC), partnerships and losses deferred due to wash sales.
As of period end, the cost and unrealized appreciation (depreciation) in securities, and derivatives if applicable, for federal income tax purposes were as follows:
| Gross unrealized appreciation | $2,283,424,819 |
| Gross unrealized depreciation | (392,851,818) |
| Net unrealized appreciation (depreciation) | $1,890,573,001 |
| Tax Cost | $5,740,862,458 |
The tax-based components of distributable earnings as of period end were as follows:
| Undistributed ordinary income | $16,528,926 |
| Undistributed long-term capital gain | $391,698,169 |
| Net unrealized appreciation (depreciation) on securities and other investments | $1,890,535,947 |
The tax character of distributions paid was as follows:
| | December 31, 2024 | December 31, 2023 |
| Ordinary Income | $153,576,433 | $ 103,312,607 |
| Long-term Capital Gains | 208,843,577 | 228,794,742 |
| Total | $362,420,010 | $ 332,107,349 |
Restricted Securities (including Private Placements). Funds may invest in securities that are subject to legal or contractual restrictions on resale. These securities generally may be resold in transactions exempt from registration or to the public if the securities are registered. Disposal of these securities may involve time-consuming negotiations and expense, and prompt sale at an acceptable price may be difficult. Information regarding restricted securities held at period end is included at the end of the Schedule of Investments, if applicable.
Commitments. A commitment is an agreement to acquire an investment at a future date (subject to conditions) in connection with a potential public or non-public offering. Commitments outstanding at period end are presented in the table below. Unrealized appreciation (depreciation) on any commitments outstanding at period end is separately presented in the Statement of Assets and Liabilities as Unrealized appreciation (depreciation) on unfunded commitments, and any change in unrealized appreciation (depreciation) on unfunded commitments during the period is separately presented in the Statement of Operations, as applicable based on contractual conditions of each commitment.
| | Investment to be Acquired | Commitment Amount ($) | Unrealized Appreciation (Depreciation)($) |
| VIP Balanced Portfolio | Space Exploration Technologies Corp Class A | 17,760 | - |
| VIP Balanced Portfolio | Space Exploration Technologies Corp Class C | 389,240 | - |
Special Purpose Acquisition Companies. Funds may invest in stock, warrants, and other securities of special purpose acquisition companies (SPACs) or similar special purpose entities. A SPAC is a publicly traded company that raises investment capital via an initial public offering (IPO) for the purpose of acquiring the equity securities of one or more existing companies via reorganization, business combination, acquisition or other similar transactions within a designated time frame.
Private Investment in Public Equity. Funds may acquire equity securities of an issuer through a private investment in a public equity (PIPE) transaction, including through commitments to purchase securities on a when-issued basis. A PIPE typically involves the purchase of securities directly from a publicly traded company in a private placement transaction. Securities purchased through PIPE transactions will be restricted from trading and considered illiquid until a resale registration statement for the shares is filed and declared effective.
At the current and/or prior period end, the Fund had commitments to purchase when-issued securities through PIPE transactions with SPACs. The commitments are contingent upon the SPACs acquiring the securities of target companies. Unrealized appreciation (depreciation) on any commitments outstanding at period end is separately presented in the Statement of Assets and Liabilities as Unrealized appreciation (depreciation) on unfunded commitments, and any change in unrealized appreciation (depreciation) on unfunded commitments during the period is separately presented in the Statement of Operations, as applicable.
New Accounting Pronouncement. FASB Accounting Standards Update (ASU) 2023-07 Segment Reporting (Topic 280): Improvements to Reportable Segment Disclosures became effective in this reporting period. ASU 2023-07 enhances segment information disclosure in the notes to financial statements.
4. Derivative Instruments.
Risk Exposures and the Use of Derivative Instruments. The Fund's investment objectives allow for various types of derivative instruments, including futures contracts. Derivatives are investments whose value is primarily derived from underlying assets, indices or reference rates and may be transacted on an exchange or over-the-counter (OTC). Derivatives may involve a future commitment to buy or sell a specified asset based on specified terms, to exchange future cash flows at periodic intervals based on a notional principal amount, or for one party to make one or more payments upon the occurrence of specified events in exchange for periodic payments from the other party.
Derivatives were used to increase returns and to manage exposure to certain risks as defined below. The success of any strategy involving derivatives depends on analysis of numerous economic factors, and if the strategies for investment do not work as intended, the objectives may not be achieved.
Derivatives were used to increase or decrease exposure to the following risk(s):
| | |
| Equity Risk | Equity risk relates to the fluctuations in the value of financial instruments as a result of changes in market prices (other than those arising from interest rate risk or foreign exchange risk), whether caused by factors specific to an individual investment, its issuer, or all factors affecting all instruments traded in a market or market segment. |
Funds are also exposed to additional risks from investing in derivatives, such as liquidity risk and counterparty credit risk. Liquidity risk is the risk that a fund will be unable to close out the derivative in the open market in a timely manner. Counterparty credit risk is the risk that the counterparty will not be able to fulfill its obligation to a fund. Counterparty credit risk related to exchange-traded contracts may be mitigated by the protection provided by the exchange on which they trade.
Investing in derivatives may involve greater risks than investing in the underlying assets directly and, to varying degrees, may involve risk of loss in excess of any initial investment and collateral received and amounts recognized in the Statement of Assets and Liabilities. In addition, there may be the risk that the change in value of the derivative contract does not correspond to the change in value of the underlying instrument.
Futures Contracts. A futures contract is an agreement between two parties to buy or sell a specified underlying instrument for a fixed price at a specified future date. Futures contracts were used to manage exposure to the stock market.
Upon entering into a futures contract, a fund is required to deposit either cash or securities (initial margin) with a clearing broker in an amount equal to a certain percentage of the face value of the contract. Futures contracts are marked-to-market daily and subsequent daily payments are made or received by a fund depending on the daily fluctuations in the value of the futures contracts and are recorded as unrealized appreciation or (depreciation). This receivable and/or payable, if any, is included in daily variation margin on futures contracts in the Statement of Assets and Liabilities. Realized gain or (loss) is recorded upon the expiration or closing of a futures contract. The net realized gain (loss) and change in net unrealized appreciation (depreciation) on futures contracts during the period is presented in the Statement of Operations.
Any open futures contracts at period end are presented in the Schedule of Investments under the caption "Futures Contracts". The notional amount at value reflects each contract's exposure to the underlying instrument or index at period end, and is representative of volume of activity during the period.
Any securities deposited to meet initial margin requirements are identified in the Schedule of Investments. Any cash deposited to meet initial margin requirements is presented as segregated cash with brokers for derivative instruments in the Statement of Assets and Liabilities.
5. Purchases and Sales of Investments.
Purchases and sales of securities, other than short-term securities, U.S. government securities and in-kind transactions, as applicable, are noted in the table below.
| | Purchases ($) | Sales ($) |
| VIP Balanced Portfolio | 2,400,461,046 | 2,502,352,079 |
6. Fees and Other Transactions with Affiliates.
Management Fee. Fidelity Management & Research Company LLC (the investment adviser) and its affiliates provide the Fund with investment management related services for which the Fund pays a monthly management fee.
Effective March 1, 2024, the Fund's management contract was amended to incorporate administrative services previously covered under separate services agreements (Transfer Agent and Accounting agreements). The amended contract incorporates a management fee rate that may vary by class. The investment adviser or an affiliate pays certain expenses of managing and operating the Fund out of each class's management fee. Each class of the Fund pays a management fee to the investment adviser. The management fee is calculated and paid to the investment adviser every month. When determining a class's management fee, a mandate rate is calculated based on the monthly average net assets of a group of funds advised by FMR within a designated asset class. A discount rate is subtracted from the mandate rate once the Fund's monthly average net assets reach a certain level. The mandate rate and discount rate may vary by class. The annual management fee rate for a class of shares of the Fund is the lesser of (1) the class's mandate rate reduced by the class's discount rate (if applicable) or (2) the amount set forth in the following table.
| | Maximum Management Fee Rate % |
| Initial Class | .43 |
| Service Class | .43 |
| Service Class 2 | .43 |
| Investor Class | .50 |
One-twelfth of the management fee rate for a class is applied to the average net assets of the class for the month, giving a dollar amount which is the management fee for the class for that month. A different management fee rate may be applicable to each class of the Fund. The difference between classes is the result of separate arrangements for class-level services and/or waivers of certain expenses. It is not the result of any difference in advisory or custodial fees or other expenses related to the management of the Fund's assets, which do not vary by class. For the portion of the reporting period on or after March 1, 2024, the total annualized management fee rates were as follows:
| | Total Management Fee Rate % |
| Initial Class | .42 |
| Service Class | .42 |
| Service Class 2 | .42 |
| Investor Class | .49 |
Prior to March 1, 2024, the management fee was the sum of an individual fund fee rate that was based on an annual rate of .15% of the Fund's average net assets and an annualized group fee rate that averaged .22% during the period. The group fee rate was based upon the monthly average net assets of a group of registered investment companies with which the investment adviser has management contracts. The group fee rate decreased as assets under management increased and increased as assets under management decreased. For the portion of the reporting period prior to March 1, 2024, the total annualized management fee rate was .37%.
Effective March 1, 2024, the Fund's sub-advisory agreements with FMR Investment Management (UK) Limited, Fidelity Management & Research (Hong Kong) Limited, and Fidelity Management & Research (Japan) Limited were amended to provide that the investment adviser pays each sub-adviser monthly fees equal to 110% of the sub-adviser's costs for providing sub-advisory services.
Distribution and Service Plan Fees. In accordance with Rule 12b-1 of the 1940 Act, the Fund has adopted separate 12b-1 Plans for each Service Class of shares. Each Service Class pays Fidelity Distributors Company LLC (FDC), an affiliate of the investment adviser, a service fee. For the period, the service fee is based on an annual rate of .10% of Service Class' average net assets and .25% of Service Class 2's average net assets.
For the period, total fees, all of which were re-allowed to insurance companies for the distribution of shares and providing shareholder support services, were as follows:
| Service Class | $38,391 |
| Service Class 2 | 6,962,303 |
| | $7,000,694 |
Transfer Agent Fees. Fidelity Investments Institutional Operations Company LLC (FIIOC), an affiliate of the investment adviser, is the Fund's transfer, dividend disbursing, and shareholder servicing agent. Effective March 1, 2024, the Fund's management contract was amended to incorporate transfer agent services and associated fees previously covered under a separate services agreement.
During the period January 1, 2024 through February 29, 2024, the transfer agent fees for each class were a fixed annual rate of class-level average net assets as follows:
| | Amount ($) | % of Class-Level Average Net Assets |
| Initial Class | 32,151 | .0630 |
| Service Class | 3,761 | .0630 |
| Service Class 2 | 273,430 | .0630 |
| Investor Class | 921,537 | .1390 |
| | 1,230,879 | |
Accounting Fees. Fidelity Service Company, Inc. (FSC), an affiliate of the investment adviser, maintains the Fund's accounting records. Effective March 1, 2024, the Fund's management contract was amended to incorporate accounting services and associated fees previously covered under a separate services agreement.
During the period January 1, 2024 through February 29, 2024, the accounting fees were a fixed annual rate of average net assets as follows:
| | % of Average Net Assets |
| VIP Balanced Portfolio | .0207 |
Brokerage Commissions. A portion of portfolio transactions were placed with brokerage firms which are affiliates of the investment adviser. Brokerage commissions are included in net realized gain (loss) and change in net unrealized appreciation (depreciation) in the Statement of Operations. The commissions paid to these affiliated firms were as follows:
| | Amount ($) |
| VIP Balanced Portfolio | 30,670 |
Interfund Lending Program. Pursuant to an Exemptive Order issued by the Securities and Exchange Commission (the SEC), the Fund, along with other registered investment companies having management contracts with Fidelity Management & Research Company LLC (FMR), or other affiliated entities of FMR, may participate in an interfund lending program. This program provides an alternative credit facility allowing the Fund to borrow from, or lend money to, other participating affiliated funds at rates that are beneficial to both the borrowing and lending fund. Borrowings under the program are generally for temporary or emergency purposes, including meeting fund shareholder redemptions. The interfund loan rate is determined, as specified in the Exemptive Order, by averaging, (1) the higher of the overnight time deposit rate and the current overnight repurchase agreement rate, and (2) a benchmark rate representing the lowest bank loan rate available to the funds. At period end, there were no interfund loans outstanding. Activity in this program during the period for which loans were outstanding was as follows:
| | Borrower or Lender | Average Loan Balance ($) | Weighted Average Interest Rate | Interest Expense ($) |
| VIP Balanced Portfolio | Borrower | 63,585,000 | 5.57% | 9,829 |
Interfund Trades. Funds may purchase from or sell securities to other Fidelity Funds under procedures adopted by the Board. The procedures have been designed to ensure these interfund trades are executed in accordance with Rule 17a-7 of the 1940 Act. Any interfund trades are included within the respective purchases and sales amounts shown in the Purchases and Sales of Investments note. Interfund trades during the period are noted in the table below.
| | Purchases ($) | Sales ($) | Realized Gain (Loss) ($) |
| VIP Balanced Portfolio | 161,976,314 | 147,138,989 | 14,776,072 |
7. Committed Line of Credit.
Certain Funds participate with other funds managed by the investment adviser or an affiliate in a $4.25 billion credit facility (the "line of credit") to be utilized for temporary or emergency purposes to fund shareholder redemptions or for other short-term liquidity purposes.
Commitment fees are charged based on the unused amount of the line of credit at an annual rate of .10%, and then allocated to each participating fund based on its pro-rata portion of the line of credit. The commitment fees are reflected in Miscellaneous expenses on the Statement of Operations, and are listed below.
Interest is charged to a participating fund based on its borrowings at an annual rate of .75% plus the highest of (i) daily SOFR plus a .10% spread adjustment, (ii) Federal Funds Effective Rate, or (iii) Overnight Bank Funding Rate. During the period, there were no borrowings on this line of credit.
The line of credit agreement will expire in March 2025 unless extended or renewed.
| | Amount ($) |
| VIP Balanced Portfolio | 11,247 |
8. Security Lending.
Funds lend portfolio securities from time to time in order to earn additional income. Lending agents are used, including National Financial Services (NFS), an affiliate of the investment adviser. Pursuant to a securities lending agreement, NFS will receive a fee, which is capped at 9.9% of a fund's daily lending revenue, for its services as lending agent. A fund may lend securities to certain qualified borrowers, including NFS. On the settlement date of the loan, a fund receives collateral (in the form of U.S. Treasury obligations, letters of credit and/or cash) against the loaned securities and maintains collateral in an amount not less than 100% of the market value of the loaned securities during the period of the loan. The market value of the loaned securities is determined at the close of business of a fund and any additional required collateral is delivered to a fund on the next business day. A fund or borrower may terminate the loan at any time, and if the borrower defaults on its obligation to return the securities loaned because of insolvency or other reasons, a fund may apply collateral received from the borrower against the obligation. A fund may experience delays and costs in recovering the securities loaned. Any cash collateral received is invested in the Fidelity Securities Lending Cash Central Fund. Any loaned securities are identified as such in the Schedule of Investments, and the value of loaned securities and cash collateral at period end, as applicable, are presented in the Statement of Assets and Liabilities. Security lending income represents the income earned on investing cash collateral, less rebates paid to borrowers and any lending agent fees associated with the loan, plus any premium payments received for lending certain types of securities. Security lending income is presented in the Statement of Operations as a component of income from Fidelity Central Funds. Affiliated security lending activity, if any, was as follows:
| | Total Security Lending Fees Paid to NFS ($) | Security Lending Income From Securities Loaned to NFS ($) | Value of Securities Loaned to NFS at Period End ($) |
| VIP Balanced Portfolio | 1,338 | 70 | - |
9. Expense Reductions.
During the period the investment adviser or an affiliate reimbursed and/or waived a portion of fund-level operating expenses in the amount of $306,333.
10. Distributions to Shareholders.
Distributions to shareholders of each class were as follows:
| | Year ended December 31, 2024 | Year ended December 31, 2023 |
| VIP Balanced Portfolio | | |
| Distributions to shareholders | | |
| Initial Class | $15,306,912 | $15,067,131 |
| Service Class | 1,880,843 | 1,840,121 |
| Service Class 2 | 136,922,667 | 120,613,214 |
| Investor Class | 208,309,588 | 194,586,883 |
Total | $362,420,010 | $332,107,349 |
11. Share Transactions.
Transactions for each class of shares were as follows and may contain in-kind transactions:
| | Shares | Shares | Dollars | Dollars |
| | Year ended December 31, 2024 | Year ended December 31, 2023 | Year ended December 31, 2024 | Year ended December 31, 2023 |
| VIP Balanced Portfolio | | | | |
| Initial Class | | | | |
| Shares sold | 990,913 | 615,588 | $23,463,288 | $12,606,906 |
| Reinvestment of distributions | 656,503 | 740,475 | 15,306,912 | 15,067,131 |
| Shares redeemed | (3,151,878) | (1,584,502) | (75,739,141) | (32,582,137) |
| Net increase (decrease) | (1,504,462) | (228,439) | $(36,968,941) | $(4,908,100) |
| Service Class | | | | |
| Shares sold | 287,124 | 227,623 | $6,680,506 | $4,629,438 |
| Reinvestment of distributions | 81,199 | 91,432 | 1,880,843 | 1,840,120 |
| Shares redeemed | (396,146) | (512,100) | (9,130,385) | (10,397,730) |
| Net increase (decrease) | (27,823) | (193,045) | $(569,036) | $(3,928,172) |
| Service Class 2 | | | | |
| Shares sold | 13,676,011 | 13,135,448 | $314,737,252 | $263,690,569 |
| Reinvestment of distributions | 6,079,799 | 6,143,788 | 136,922,667 | 120,613,214 |
| Shares redeemed | (14,689,256) | (12,520,499) | (335,793,638) | (249,902,941) |
| Net increase (decrease) | 5,066,554 | 6,758,737 | $115,866,281 | $134,400,842 |
| Investor Class | | | | |
| Shares sold | 3,014,741 | 2,578,679 | $71,335,529 | $53,024,655 |
| Reinvestment of distributions | 9,013,735 | 9,678,537 | 208,309,588 | 194,586,883 |
| Shares redeemed | (10,905,887) | (13,270,045) | (254,431,256) | (270,136,263) |
| Net increase (decrease) | 1,122,589 | (1,012,829) | $25,213,861 | $(22,524,725) |
12. Other.
A fund's organizational documents provide former and current trustees and officers with a limited indemnification against liabilities arising in connection with the performance of their duties to the fund. In the normal course of business, a fund may also enter into contracts that provide general indemnifications. A fund's maximum exposure under these arrangements is unknown as this would be dependent on future claims that may be made against a fund. The risk of material loss from such claims is considered remote.
At the end of the period, the investment adviser or its affiliates were owners of record of more than 10% and certain otherwise unaffiliated shareholders were owners of record of more than 10% of the outstanding shares as follows:
| Fund | Affiliated % | Number ofUnaffiliated Shareholders | Unaffiliated Shareholders % |
| VIP Balanced Portfolio | 59% | 1 | 18% |
13. Risk and Uncertainties.
Many factors affect a fund's performance. Developments that disrupt global economies and financial markets, such as pandemics, epidemics, outbreaks of infectious diseases, war, terrorism, and environmental disasters, may significantly affect a fund's investment performance. The effects of these developments to a fund will be impacted by the types of securities in which a fund invests, the financial condition, industry, economic sector, and geographic location of an issuer, and a fund's level of investment in the securities of that issuer. Significant concentrations in security types, issuers, industries, sectors, and geographic locations may magnify the factors that affect a fund's performance.
Report of Independent Registered Public Accounting Firm
To the Board of Trustees of Variable Insurance Products Fund III and the Shareholders of VIP Balanced Portfolio:
Opinion on the Financial Statements and Financial Highlights
We have audited the accompanying statement of assets and liabilities of VIP Balanced Portfolio (the "Fund"), a fund of Variable Insurance Products Fund III, including the schedule of investments, as of December 31, 2024, the related statement of operations for the year then ended, the statement of changes in net assets for each of the two years in the period then ended, the financial highlights for each of the five years in the period then ended, and the related notes. In our opinion, the financial statements and financial highlights present fairly, in all material respects, the financial position of the Fund as of December 31, 2024, and the results of its operations for the year then ended, the changes in its net assets for each of the two years in the period then ended, and the financial highlights for each of the five years in the period then ended in conformity with accounting principles generally accepted in the United States of America.
Basis for Opinion
These financial statements and financial highlights are the responsibility of the Fund's management. Our responsibility is to express an opinion on the Fund's financial statements and financial highlights based on our audits. We are a public accounting firm registered with the Public Company Accounting Oversight Board (United States) (PCAOB) and are required to be independent with respect to the Fund in accordance with the U.S. federal securities laws and the applicable rules and regulations of the Securities and Exchange Commission and the PCAOB.
We conducted our audits in accordance with the standards of the PCAOB. Those standards require that we plan and perform the audit to obtain reasonable assurance about whether the financial statements and financial highlights are free of material misstatement, whether due to error or fraud. The Fund is not required to have, nor were we engaged to perform, an audit of its internal control over financial reporting. As part of our audits, we are required to obtain an understanding of internal control over financial reporting but not for the purpose of expressing an opinion on the effectiveness of the Fund's internal control over financial reporting. Accordingly, we express no such opinion.
Our audits included performing procedures to assess the risks of material misstatement of the financial statements and financial highlights, whether due to error or fraud, and performing procedures that respond to those risks. Such procedures included examining, on a test basis, evidence regarding the amounts and disclosures in the financial statements and financial highlights. Our audits also included evaluating the accounting principles used and significant estimates made by management, as well as evaluating the overall presentation of the financial statements and financial highlights. Our procedures included confirmation of securities owned as of December 31, 2024, by correspondence with the custodian and brokers; when replies were not received from brokers, we performed other auditing procedures. We believe that our audits provide a reasonable basis for our opinion.
/s/ Deloitte & Touche LLP
Boston, Massachusetts
February 13, 2025
We have served as the auditor of one or more of the Fidelity investment companies since 1999.
Distributions
(Unaudited)The dividend and capital gains distributions for the fund(s) are available on Fidelity.com or Institutional.Fidelity.com.
The fund hereby designates as a capital gain dividend with respect to the taxable year ended December 31, 2024, $392,010,610, or, if subsequently determined to be different, the net capital gain of such year.
A total of 23.89% of the dividends distributed during the fiscal year was derived from interest on U.S. Government securities which is generally exempt from state income tax.
The fund designates $81,963,003 of distributions paid during the fiscal year ended 2024 as qualifying to be taxed as section 163(j) interest dividends.
Initial Class designates 32%; Service Class designates 33%; Service Class 2 designates 35%; and Investor Class designates 32%; of the dividends distributed in December 2024, during the fiscal year as qualifying for the dividends-received deduction for corporate shareholders.
Item 8: Changes in and Disagreements with Accountants for Open-End Management Investment Companies
(Unaudited)
Note: This is not applicable for any fund included in this document.
Item 9: Proxy Disclosures for Open-End Management Investment Companies
(Unaudited)
| A special meeting of shareholders was held on July 16, 2024. The results of votes taken among shareholders on the proposal before them are reported below. Each vote reported represents one dollar of net asset value held on the record date for the meeting. |
| Proposal 1 |
| To elect a Board of Trustees. |
| | # of Votes | % of Votes |
| Bettina Doulton |
| Affirmative | 19,815,631,510.17 | 96.35 |
| Withheld | 749,708,334.02 | 3.65 |
| TOTAL | 20,565,339,844.19 | 100.00 |
| Robert A. Lawrence |
| Affirmative | 19,766,714,617.58 | 96.12 |
| Withheld | 798,625,226.62 | 3.88 |
| TOTAL | 20,565,339,844.19 | 100.00 |
| Vijay C. Advani |
| Affirmative | 19,788,320,252.27 | 96.22 |
| Withheld | 777,019,591.92 | 3.78 |
| TOTAL | 20,565,339,844.19 | 100.00 |
| Thomas P. Bostick |
| Affirmative | 19,780,566,370.66 | 96.18 |
| Withheld | 784,773,473.53 | 3.82 |
| TOTAL | 20,565,339,844.19 | 100.00 |
| Donald F. Donahue |
| Affirmative | 19,723,882,404.02 | 95.91 |
| Withheld | 841,457,440.18 | 4.09 |
| TOTAL | 20,565,339,844.19 | 100.00 |
| Vicki L. Fuller |
| Affirmative | 19,823,019,040.62 | 96.39 |
| Withheld | 742,320,803.57 | 3.61 |
| TOTAL | 20,565,339,844.19 | 100.00 |
| Patricia L. Kampling |
| Affirmative | 19,837,563,936.04 | 96.46 |
| Withheld | 727,775,908.15 | 3.54 |
| TOTAL | 20,565,339,844.19 | 100.00 |
| Thomas A. Kennedy |
| Affirmative | 19,789,564,999.11 | 96.23 |
| Withheld | 775,774,845.08 | 3.77 |
| TOTAL | 20,565,339,844.19 | 100.00 |
| Oscar Munoz |
| Affirmative | 19,772,385,801.51 | 96.14 |
| Withheld | 792,954,042.68 | 3.86 |
| TOTAL | 20,565,339,844.19 | 100.00 |
| Karen B. Peetz |
| Affirmative | 19,804,495,604.67 | 96.30 |
| Withheld | 760,844,239.52 | 3.70 |
| TOTAL | 20,565,339,844.19 | 100.00 |
| David M. Thomas |
| Affirmative | 19,717,117,994.71 | 95.88 |
| Withheld | 848,221,849.48 | 4.12 |
| TOTAL | 20,565,339,844.19 | 100.00 |
| Susan Tomasky |
| Affirmative | 19,783,626,171.89 | 96.20 |
| Withheld | 781,713,672.31 | 3.80 |
| TOTAL | 20,565,339,844.19 | 100.00 |
| Michael E. Wiley |
| Affirmative | 19,728,139,900.50 | 95.93 |
| Withheld | 837,199,943.69 | 4.07 |
| TOTAL | 20,565,339,844.19 | 100.00 |
| | | |
| Proposal 1 reflects trust-wide proposal and voting results. |
Item 10: Remuneration Paid to Directors, Officers, and others of Open-End Management Investment Companies
(Unaudited)
Note: This information is disclosed as part of the financial statements for each Fund as part of Item 7: Financial Statements and Financial Highlights for Open-End Management Investment companies.
Item 11: Statement Regarding Basis for Approval of Investment Advisory Contract
(Unaudited)
Note: This is not applicable for any fund included in this document.
1.540208.127
VIPBAL-ANN-0325
Item 8.
Changes in and Disagreements with Accountants for Open-End Management Investment Companies
See Item 7.
Item 9.
Proxy Disclosures for Open-End Management Investment Companies
See Item 7.
Item 10.
Remuneration Paid to Directors, Officers, and Others of Open-End Management Investment Companies
See Item 7.
Item 11.
Statement Regarding Basis for Approval of Investment Advisory Contract
See Item 7.
Item 12.
Disclosure of Proxy Voting Policies and Procedures for Closed-End Management Investment Companies
Not applicable.
Item 13.
Portfolio Managers of Closed-End Management Investment Companies
Not applicable.
Item 14.
Purchase of Equity Securities by Closed-End Management Investment Company and Affiliated Purchasers
Not applicable.
Item 15.
Submission of Matters to a Vote of Security Holders
There were no material changes to the procedures by which shareholders may recommend nominees to the trust’s Board of Trustees.
Item 16.
Controls and Procedures
(a)(i) The President and Treasurer and the Chief Financial Officer have concluded that the trust’s disclosure controls and procedures (as defined in Rule 30a-3(c) under the Investment Company Act) provide reasonable assurances that material information relating to the trust is made known to them by the appropriate persons, based on their evaluation of these controls and procedures as of a date within 90 days of the filing date of this report.
(a)(ii) There was no change in the trust’s internal control over financial reporting (as defined in Rule 30a-3(d) under the Investment Company Act) that occurred during the period covered by this report that has materially affected, or is reasonably likely to materially affect, the trust’s internal control over financial reporting.
Item 17.
Disclosure of Securities Lending Activities for Closed-End Management Investment Companies
Not applicable.
Item 18.
Recovery of Erroneously Awarded Compensation
(a)
Not applicable.
(b)
Not applicable.
Item 19.
Exhibits
SIGNATURES
Pursuant to the requirements of the Securities Exchange Act of 1934 and the Investment Company Act of 1940, the registrant has duly caused this report to be signed on its behalf by the undersigned, thereunto duly authorized.
Variable Insurance Products Fund III
|
By: | /s/Stacie M. Smith |
| Stacie M. Smith |
| President and Treasurer (Principal Executive Officer) |
|
|
Date: | February 21, 2025 |
Pursuant to the requirements of the Securities Exchange Act of 1934 and the Investment Company Act of 1940, this report has been signed below by the following persons on behalf of the registrant and in the capacities and on the dates indicated.
|
By: | /s/Stacie M. Smith |
| Stacie M. Smith |
| President and Treasurer (Principal Executive Officer) |
|
|
Date: | February 21, 2025 |
|
By: | /s/Stephanie Caron |
| Stephanie Caron |
| Chief Financial Officer (Principal Financial Officer) |
|
|
Date: | February 21, 2025 |