UNITED STATES
SECURITIES AND EXCHANGE COMMISSION
Washington, D.C. 20549
FORM N-CSR
CERTIFIED SHAREHOLDER REPORT OF REGISTERED
MANAGEMENT INVESTMENT COMPANIES
Investment Company Act file number 811-7205
Variable Insurance Products Fund III
(Exact name of registrant as specified in charter)
245 Summer St., Boston, Massachusetts 02210
(Address of principal executive offices) (Zip code)
Marc Bryant, Secretary
245 Summer St.
Boston, Massachusetts 02210
(Name and address of agent for service)
Registrant's telephone number, including area code:
617-563-7000
| |
Date of fiscal year end: | December 31 |
| |
Date of reporting period: | December 31, 2015 |
Item 1.
Reports to Stockholders
Fidelity® Variable Insurance Products: Dynamic Capital Appreciation Portfolio
Annual Report December 31, 2015 |
 |
Contents
To view a fund's proxy voting guidelines and proxy voting record for the 12-month period ended June 30, visit http://www.fidelity.com/proxyvotingresults or visit the Securities and Exchange Commission's (SEC) web site at http://www.sec.gov.
You may also call 1-877-208-0098 to request a free copy of the proxy voting guidelines.
Fidelity® Variable Insurance Products are separate account options which are purchased through a variable insurance contract.
Standard & Poor's, S&P and S&P 500 are registered service marks of The McGraw-Hill Companies, Inc. and have been licensed for use by Fidelity Distributors Corporation.
Other third-party marks appearing herein are the property of their respective owners.
All other marks appearing herein are registered or unregistered trademarks or service marks of FMR LLC or an affiliated company. © 2016 FMR LLC. All rights reserved.
This report and the financial statements contained herein are submitted for the general information of the shareholders of the Fund. This report is not authorized for distribution to prospective investors in the Fund unless preceded or accompanied by an effective prospectus.
A fund files its complete schedule of portfolio holdings with the SEC for the first and third quarters of each fiscal year on Form N-Q. Forms N-Q are available on the SEC’s web site at http://www.sec.gov. A fund's Forms N-Q may be reviewed and copied at the SEC’s Public Reference Room in Washington, DC. Information regarding the operation of the SEC's Public Reference Room may be obtained by calling 1-800-SEC-0330.
For a complete list of a fund's portfolio holdings, view the most recent holdings listing, semiannual report, or annual report on Fidelity's web site at http://www.fidelity.com, http://www.advisor.fidelity.com, or http://www.401k.com, as applicable.
NOT FDIC INSURED •MAY LOSE VALUE •NO BANK GUARANTEE
Neither the Fund nor Fidelity Distributors Corporation is a bank.
Performance: The Bottom Line
Average annual total return reflects the change in the value of an investment, assuming reinvestment of distributions from dividend income and capital gains (the profits earned upon the sale of securities that have grown in value, if any) and assuming a constant rate of performance each year. During periods of reimbursement by Fidelity, a fund’s total return will be greater than it would be had the reimbursement not occurred. Performance numbers are net of all underlying fund operating expenses, but do not include any insurance charges imposed by your insurance company’s separate account. If performance information included the effect of these additional charges, the total returns would have been lower. How a fund did yesterday is no guarantee of how it will do tomorrow.
Average Annual Total Returns
| For the periods ended December 31, 2015 | Past 1 year | Past 5 years | Past 10 years |
| Initial Class | 1.30% | 13.20% | 7.95% |
| Service Class | 1.16% | 13.12% | 7.86% |
| Service Class 2 | 1.02% | 12.93% | 7.69% |
| Investor Class | 1.22% | 13.13% | 7.86% |
$10,000 Over 10 Years
Let's say hypothetically that $10,000 was invested in VIP Dynamic Capital Appreciation Portfolio - Initial Class on December 31, 2005.
The chart shows how the value of your investment would have changed, and also shows how the S&P 500® Index performed over the same period.
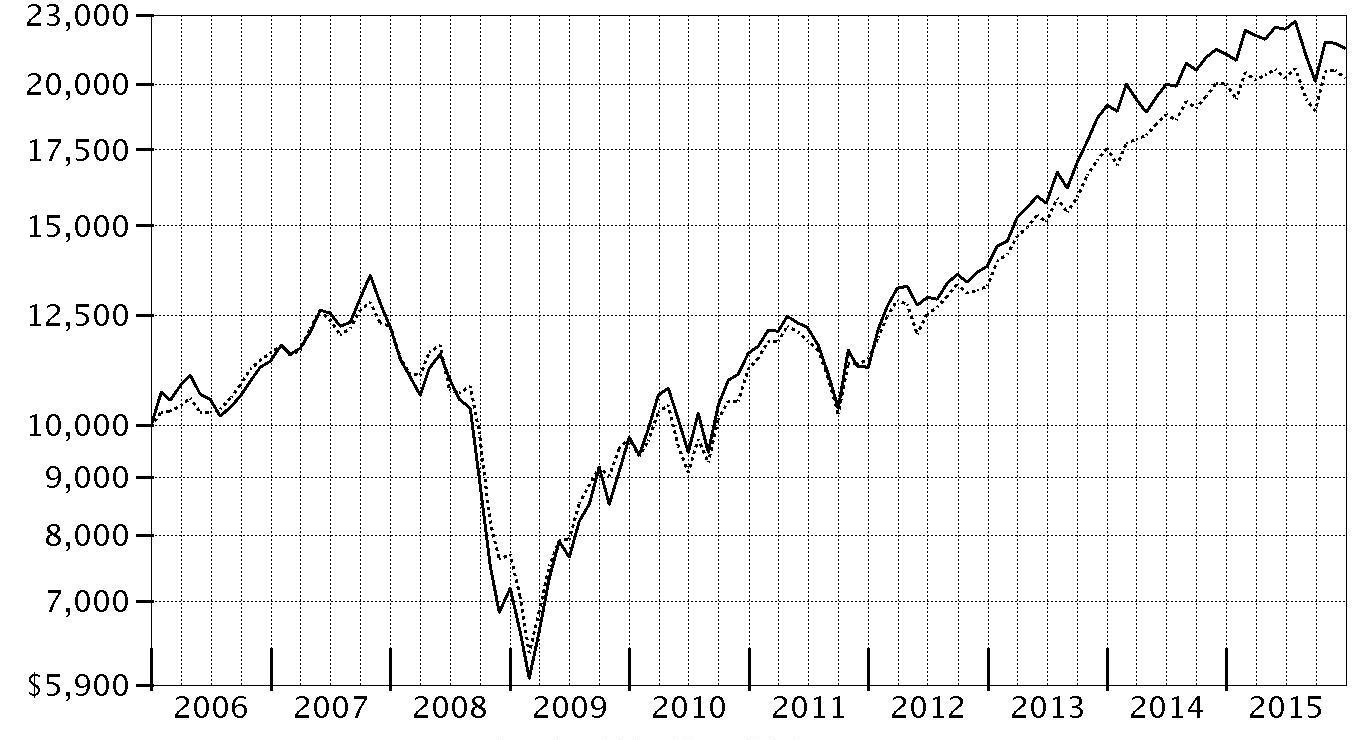
| Period Ending Values |
| $21,494 | VIP Dynamic Capital Appreciation Portfolio - Initial Class |
| $20,242 | S&P 500® Index |
Management's Discussion of Fund Performance
Market Recap: U.S. stocks gained modestly in 2015, rebounding from a steep decline in August and September over worries about China’s slowing economic growth. The S&P 500
® index rose 1.38% for the period, its lowest calendar-year return since 2008. After the late-summer rout, stocks sharply reversed course in October, lifted by the Federal Reserve’s decision to put off raising near-term interest rates until mid-December. Investors also were encouraged by an interest-rate cut in China and economic stimulus in Europe. Overall, growth stocks fared much better than their value counterparts, as investors sought growth in a subpar economic environment. This helped lift the technology-heavy Nasdaq Composite Index
® 6.96% for the year. Sector performance in the broader market was split, with five of 10 sectors in the S&P 500
® gaining ground and five retreating. Consumer discretionary (+10%) led the way, benefiting from rising personal income and low inflation. Health care (+7%), consumer staples (+7%) and information technology (+6%) also outpaced the broad market amid strong fundamentals. Conversely, the energy sector (-21%) was by far the worst performer, stung by deflated commodity prices that also hit materials (-8%). The defensive, but rate-sensitive utilities sector (-5%) lost ground on the cusp of Fed tightening, while industrials (-3%) were dragged down with energy prices and a slower-growing China.
Comments from Portfolio Manager Fergus Shiel: For the year, the fund’s share classes posted low single-digit gains that modestly lagged S&P 500
® index. Stock selection in consumer discretionary had a meaningful negative impact on performance versus the index, offset to a considerable degree by a sizable overweighting in this strong-performing group. Positioning in financials also detracted. The largest relative detractor was off-road vehicle maker Polaris Industries, an out-of-benchmark position that fared poorly. Casino stock Las Vegas Sands – another out-of-benchmark position in the consumer discretionary sector – further detracted. Two positions in financials that weighed on relative results were wealth manager Ameriprise Financial and investment bank Goldman Sachs Group. Conversely, a large overweighting in health care bolstered relative results, as did negligible exposure to the battered energy sector. Within the former group, one noteworthy contributor was medical device maker Boston Scientific. I sold most of this position by period end. Also lifting performance was our sizable overweighting in biotechnology stock Gilead Sciences. Elsewhere, coffee-bar operator Starbucks was our top contributor overall.
The views expressed above reflect those of the portfolio manager(s) only through the end of the period as stated on the cover of this report and do not necessarily represent the views of Fidelity or any other person in the Fidelity organization. Any such views are subject to change at any time based upon market or other conditions and Fidelity disclaims any responsibility to update such views. These views may not be relied on as investment advice and, because investment decisions for a Fidelity fund are based on numerous factors, may not be relied on as an indication of trading intent on behalf of any Fidelity fund.
Investment Summary (Unaudited)
Top Ten Stocks as of December 31, 2015
| | % of fund's net assets | % of fund's net assets 6 months ago |
| Gilead Sciences, Inc. | 7.9 | 7.6 |
| Celgene Corp. | 5.6 | 4.5 |
| Las Vegas Sands Corp. | 4.7 | 2.6 |
| Amgen, Inc. | 3.1 | 3.5 |
| Adobe Systems, Inc. | 3.0 | 1.8 |
| Home Depot, Inc. | 3.0 | 2.7 |
| Medivation, Inc. | 2.9 | 1.7 |
| Facebook, Inc. Class A | 2.7 | 0.0 |
| Microsoft Corp. | 2.5 | 0.0 |
| AutoZone, Inc. | 2.4 | 1.4 |
| | 37.8 | |
Top Five Market Sectors as of December 31, 2015
| | % of fund's net assets | % of fund's net assets 6 months ago |
| Health Care | 30.4 | 31.2 |
| Consumer Discretionary | 29.9 | 26.8 |
| Financials | 13.2 | 18.9 |
| Information Technology | 11.1 | 10.7 |
| Industrials | 6.0 | 4.4 |
Asset Allocation (% of fund's net assets)
| As of December 31, 2015* |
| | Stocks | 98.1% |
| | Short-Term Investments and Net Other Assets (Liabilities) | 1.9% |

* Foreign investments - 11.8%
| As of June 30, 2015* |
| | Stocks | 95.1% |
| | Short-Term Investments and Net Other Assets (Liabilities) | 4.9% |

* Foreign investments - 12.7%
Percentages shown as 0.0% may reflect amounts less than 0.05%.
Investments December 31, 2015
Showing Percentage of Net Assets
| Common Stocks - 98.1% | | | |
| | | Shares | Value |
| CONSUMER DISCRETIONARY - 29.9% | | | |
| Automobiles - 3.4% | | | |
| Ford Motor Co. | | 320,150 | $4,510,914 |
| General Motors Co. | | 61,700 | 2,098,417 |
| Tesla Motors, Inc. (a) | | 4,000 | 960,040 |
| | | | 7,569,371 |
| Hotels, Restaurants & Leisure - 8.5% | | | |
| Dalata Hotel Group PLC (a) | | 143,740 | 859,152 |
| Extended Stay America, Inc. unit | | 9,100 | 144,690 |
| Las Vegas Sands Corp. | | 239,979 | 10,520,679 |
| McDonald's Corp. | | 9,600 | 1,134,144 |
| Starbucks Corp. | | 47,818 | 2,870,515 |
| Whitbread PLC | | 48,260 | 3,131,087 |
| Wyndham Worldwide Corp. | | 5,099 | 370,442 |
| | | | 19,030,709 |
| Household Durables - 0.8% | | | |
| Cairn Homes PLC (a) | | 658,300 | 854,912 |
| Tempur Sealy International, Inc. (a) | | 13,699 | 965,232 |
| | | | 1,820,144 |
| Internet & Catalog Retail - 2.3% | | | |
| Amazon.com, Inc. (a) | | 7,500 | 5,069,175 |
| Leisure Products - 1.3% | | | |
| Polaris Industries, Inc. (b) | | 34,713 | 2,983,582 |
| Media - 3.2% | | | |
| Havas SA | | 103,200 | 869,968 |
| Interpublic Group of Companies, Inc. | | 63,084 | 1,468,596 |
| ITV PLC | | 350,054 | 1,427,393 |
| The Walt Disney Co. | | 33,000 | 3,467,640 |
| | | | 7,233,597 |
| Multiline Retail - 1.5% | | | |
| Dillard's, Inc. Class A | | 16,381 | 1,076,396 |
| JC Penney Corp., Inc. (a)(b) | | 336,100 | 2,238,426 |
| | | | 3,314,822 |
| Specialty Retail - 8.3% | | | |
| AutoZone, Inc. (a) | | 7,257 | 5,384,041 |
| Home Depot, Inc. | | 51,062 | 6,752,950 |
| O'Reilly Automotive, Inc. (a) | | 3,200 | 810,944 |
| TJX Companies, Inc. | | 32,490 | 2,303,866 |
| Ulta Salon, Cosmetics & Fragrance, Inc. (a) | | 13,719 | 2,538,015 |
| Williams-Sonoma, Inc. | | 11,100 | 648,351 |
| | | | 18,438,167 |
| Textiles, Apparel & Luxury Goods - 0.6% | | | |
| NIKE, Inc. Class B | | 21,100 | 1,318,750 |
|
| TOTAL CONSUMER DISCRETIONARY | | | 66,778,317 |
|
| CONSUMER STAPLES - 2.3% | | | |
| Tobacco - 2.3% | | | |
| Imperial Tobacco Group PLC | | 40,957 | 2,165,486 |
| Reynolds American, Inc. | | 63,500 | 2,930,525 |
| | | | 5,096,011 |
| ENERGY - 3.2% | | | |
| Oil, Gas & Consumable Fuels - 3.2% | | | |
| Anadarko Petroleum Corp. | | 20,300 | 986,174 |
| Chevron Corp. | | 13,200 | 1,187,472 |
| Cimarex Energy Co. | | 4,700 | 420,086 |
| Concho Resources, Inc. (a) | | 3,000 | 278,580 |
| ConocoPhillips Co. | | 57,000 | 2,661,330 |
| Continental Resources, Inc. (a) | | 4,600 | 105,708 |
| Devon Energy Corp. | | 11,400 | 364,800 |
| EOG Resources, Inc. | | 2,200 | 155,738 |
| Exxon Mobil Corp. | | 10,000 | 779,500 |
| Pioneer Natural Resources Co. | | 1,300 | 162,994 |
| | | | 7,102,382 |
| FINANCIALS - 13.2% | | | |
| Banks - 1.4% | | | |
| JPMorgan Chase & Co. | | 48,074 | 3,174,326 |
| Capital Markets - 7.7% | | | |
| Ameriprise Financial, Inc. | | 46,192 | 4,915,753 |
| BlackRock, Inc. Class A | | 4,554 | 1,550,728 |
| E*TRADE Financial Corp. (a) | | 150,740 | 4,467,934 |
| Goldman Sachs Group, Inc. | | 20,049 | 3,613,431 |
| Morgan Stanley | | 45,200 | 1,437,812 |
| WisdomTree Investments, Inc. (b) | | 80,000 | 1,254,400 |
| | | | 17,240,058 |
| Diversified Financial Services - 4.1% | | | |
| CME Group, Inc. | | 51,861 | 4,698,607 |
| McGraw Hill Financial, Inc. | | 44,676 | 4,404,160 |
| | | | 9,102,767 |
|
| TOTAL FINANCIALS | | | 29,517,151 |
|
| HEALTH CARE - 30.4% | | | |
| Biotechnology - 22.4% | | | |
| Actelion Ltd. | | 19,191 | 2,666,468 |
| Amgen, Inc. | | 43,101 | 6,996,585 |
| Biogen, Inc. (a) | | 12,440 | 3,810,994 |
| Celgene Corp. (a) | | 104,206 | 12,479,711 |
| Gilead Sciences, Inc. | | 174,284 | 17,635,797 |
| Medivation, Inc. (a) | | 136,439 | 6,595,461 |
| | | | 50,185,016 |
| Health Care Equipment & Supplies - 0.5% | | | |
| Boston Scientific Corp. (a) | | 12,742 | 234,962 |
| Intuitive Surgical, Inc. (a) | | 1,700 | 928,472 |
| | | | 1,163,434 |
| Pharmaceuticals - 7.5% | | | |
| Allergan PLC (a) | | 10,293 | 3,216,563 |
| Cardiome Pharma Corp. (a) | | 15,800 | 128,138 |
| Jazz Pharmaceuticals PLC (a) | | 25,856 | 3,634,319 |
| Johnson & Johnson | | 39,809 | 4,089,180 |
| Pacira Pharmaceuticals, Inc. (a)(b) | | 43,839 | 3,366,397 |
| Teva Pharmaceutical Industries Ltd. sponsored ADR | | 16,919 | 1,110,563 |
| The Medicines Company (a) | | 30,000 | 1,120,200 |
| | | | 16,665,360 |
|
| TOTAL HEALTH CARE | | | 68,013,810 |
|
| INDUSTRIALS - 6.0% | | | |
| Aerospace & Defense - 1.7% | | | |
| Lockheed Martin Corp. | | 7,400 | 1,606,910 |
| Northrop Grumman Corp. | | 7,800 | 1,472,718 |
| Raytheon Co. | | 5,700 | 709,821 |
| | | | 3,789,449 |
| Airlines - 1.1% | | | |
| Ryanair Holdings PLC sponsored ADR | | 27,007 | 2,335,025 |
| Electrical Equipment - 0.3% | | | |
| Eaton Corp. PLC | | 12,900 | 671,316 |
| Industrial Conglomerates - 2.2% | | | |
| 3M Co. | | 4,000 | 602,560 |
| General Electric Co. | | 141,169 | 4,397,414 |
| | | | 4,999,974 |
| Machinery - 0.4% | | | |
| Wabtec Corp. | | 12,136 | 863,112 |
| Marine - 0.3% | | | |
| Irish Continental Group PLC unit | | 125,000 | 735,458 |
|
| TOTAL INDUSTRIALS | | | 13,394,334 |
|
| INFORMATION TECHNOLOGY - 11.1% | | | |
| Internet Software & Services - 4.8% | | | |
| Alphabet, Inc. Class A (a) | | 5,862 | 4,560,695 |
| Facebook, Inc. Class A (a) | | 58,461 | 6,118,528 |
| | | | 10,679,223 |
| IT Services - 0.5% | | | |
| PayPal Holdings, Inc. (a) | | 34,100 | 1,234,420 |
| Software - 5.8% | | | |
| Adobe Systems, Inc. (a) | | 72,166 | 6,779,274 |
| Globant SA (a) | | 20,000 | 750,200 |
| Microsoft Corp. | | 99,026 | 5,493,962 |
| | | | 13,023,436 |
|
| TOTAL INFORMATION TECHNOLOGY | | | 24,937,079 |
|
| MATERIALS - 2.0% | | | |
| Chemicals - 2.0% | | | |
| E.I. du Pont de Nemours & Co. | | 20,584 | 1,370,894 |
| LyondellBasell Industries NV Class A | | 13,100 | 1,138,390 |
| PPG Industries, Inc. | | 10,635 | 1,050,951 |
| Sociedad Quimica y Minera de Chile SA (PN-B) sponsored ADR | | 20,000 | 380,200 |
| The Dow Chemical Co. | | 9,400 | 483,912 |
| | | | 4,424,347 |
| TOTAL COMMON STOCKS | | | |
| (Cost $191,321,189) | | | 219,263,431 |
|
| Money Market Funds - 3.5% | | | |
| Fidelity Cash Central Fund, 0.33% (c) | | 4,653,743 | 4,653,743 |
| Fidelity Securities Lending Cash Central Fund, 0.35% (c)(d) | | 3,171,300 | 3,171,300 |
| TOTAL MONEY MARKET FUNDS | | | |
| (Cost $7,825,043) | | | 7,825,043 |
| TOTAL INVESTMENT PORTFOLIO - 101.6% | | | |
| (Cost $199,146,232) | | | 227,088,474 |
| NET OTHER ASSETS (LIABILITIES) - (1.6)% | | | (3,621,415) |
| NET ASSETS - 100% | | | $223,467,059 |
Legend
(a) Non-income producing
(b) Security or a portion of the security is on loan at period end.
(c) Affiliated fund that is generally available only to investment companies and other accounts managed by Fidelity Investments. The rate quoted is the annualized seven-day yield of the fund at period end. A complete unaudited listing of the fund's holdings as of its most recent quarter end is available upon request. In addition, each Fidelity Central Fund's financial statements, which are not covered by the Fund's Report of Independent Registered Public Accounting Firm, are available on the SEC's website or upon request.
(d) Investment made with cash collateral received from securities on loan.
Affiliated Central Funds
Information regarding fiscal year to date income earned by the Fund from investments in Fidelity Central Funds is as follows:
| Fund | Income earned |
| Fidelity Cash Central Fund | $18,886 |
| Fidelity Securities Lending Cash Central Fund | 32,780 |
| Total | $51,666 |
Investment Valuation
The following is a summary of the inputs used, as of December 31, 2015, involving the Fund's assets and liabilities carried at fair value. The inputs or methodology used for valuing securities may not be an indication of the risk associated with investing in those securities. For more information on valuation inputs, and their aggregation into the levels used below, please refer to the Investment Valuation section in the accompanying Notes to Financial Statements.
| | Valuation Inputs at Reporting Date: |
| Description | Total | Level 1 | Level 2 | Level 3 |
| Investments in Securities: | | | | |
| Equities: | | | | |
| Consumer Discretionary | $66,778,317 | $66,778,317 | $-- | $-- |
| Consumer Staples | 5,096,011 | 5,096,011 | -- | -- |
| Energy | 7,102,382 | 7,102,382 | -- | -- |
| Financials | 29,517,151 | 29,517,151 | -- | -- |
| Health Care | 68,013,810 | 65,347,342 | 2,666,468 | -- |
| Industrials | 13,394,334 | 13,394,334 | -- | -- |
| Information Technology | 24,937,079 | 24,937,079 | -- | -- |
| Materials | 4,424,347 | 4,424,347 | -- | -- |
| Money Market Funds | 7,825,043 | 7,825,043 | -- | -- |
| Total Investments in Securities: | $227,088,474 | $224,422,006 | $2,666,468 | $-- |
Other Information
Distribution of investments by country or territory of incorporation, as a percentage of Total Net Assets, is as follows (Unaudited):
| United States of America | 88.2% |
| Ireland | 5.6% |
| United Kingdom | 3.0% |
| Switzerland | 1.2% |
| Others (Individually Less Than 1%) | 2.0% |
| | 100.0% |
See accompanying notes which are an integral part of the financial statements.
Financial Statements
Statement of Assets and Liabilities
| | | December 31, 2015 |
| Assets | | |
Investment in securities, at value (including securities loaned of $3,027,290) — See accompanying schedule:
Unaffiliated issuers (cost $191,321,189) | $219,263,431 | |
| Fidelity Central Funds (cost $7,825,043) | 7,825,043 | |
| Total Investments (cost $199,146,232) | | $227,088,474 |
| Foreign currency held at value (cost $29,646) | | 29,646 |
| Receivable for investments sold | | 2,358,292 |
| Receivable for fund shares sold | | 6,430 |
| Dividends receivable | | 216,417 |
| Distributions receivable from Fidelity Central Funds | | 4,169 |
| Prepaid expenses | | 476 |
| Other receivables | | 3,727 |
| Total assets | | 229,707,631 |
| Liabilities | | |
| Payable for investments purchased | $2,724,869 | |
| Payable for fund shares redeemed | 160,920 | |
| Accrued management fee | 102,656 | |
| Distribution and service plan fees payable | 4,305 | |
| Other affiliated payables | 30,995 | |
| Other payables and accrued expenses | 45,527 | |
| Collateral on securities loaned, at value | 3,171,300 | |
| Total liabilities | | 6,240,572 |
| Net Assets | | $223,467,059 |
| Net Assets consist of: | | |
| Paid in capital | | $187,832,323 |
| Undistributed net investment income | | 173,464 |
| Accumulated undistributed net realized gain (loss) on investments and foreign currency transactions | | 7,519,495 |
| Net unrealized appreciation (depreciation) on investments and assets and liabilities in foreign currencies | | 27,941,777 |
| Net Assets | | $223,467,059 |
| Initial Class: | | |
| Net Asset Value, offering price and redemption price per share ($37,281,402 ÷ 2,900,280 shares) | | $12.85 |
| Service Class: | | |
| Net Asset Value, offering price and redemption price per share ($641,535 ÷ 50,338 shares) | | $12.74 |
| Service Class 2: | | |
| Net Asset Value, offering price and redemption price per share ($20,128,000 ÷ 1,601,955 shares) | | $12.56 |
| Investor Class: | | |
| Net Asset Value, offering price and redemption price per share ($165,416,122 ÷ 12,888,410 shares) | | $12.83 |
See accompanying notes which are an integral part of the financial statements.
Statement of Operations
| | | Year ended December 31, 2015 |
| Investment Income | | |
| Dividends | | $3,705,805 |
| Interest | | 44 |
| Income from Fidelity Central Funds | | 51,666 |
| Total income | | 3,757,515 |
| Expenses | | |
| Management fee | $1,238,632 | |
| Transfer agent fees | 281,646 | |
| Distribution and service plan fees | 59,431 | |
| Accounting and security lending fees | 88,502 | |
| Custodian fees and expenses | 46,163 | |
| Independent trustees' compensation | 958 | |
| Audit | 46,140 | |
| Legal | 1,125 | |
| Miscellaneous | 1,558 | |
| Total expenses before reductions | 1,764,155 | |
| Expense reductions | (19,787) | 1,744,368 |
| Net investment income (loss) | | 2,013,147 |
| Realized and Unrealized Gain (Loss) | | |
| Net realized gain (loss) on: | | |
| Investment securities: | | |
| Unaffiliated issuers | 7,598,319 | |
| Foreign currency transactions | (3,923) | |
| Total net realized gain (loss) | | 7,594,396 |
Change in net unrealized appreciation (depreciation) on:
Investment securities | (8,327,273) | |
| Assets and liabilities in foreign currencies | 112 | |
| Total change in net unrealized appreciation (depreciation) | | (8,327,161) |
| Net gain (loss) | | (732,765) |
| Net increase (decrease) in net assets resulting from operations | | $1,280,382 |
See accompanying notes which are an integral part of the financial statements.
Statement of Changes in Net Assets
| | Year ended December 31, 2015 | Year ended December 31, 2014 |
| Increase (Decrease) in Net Assets | | |
| Operations | | |
| Net investment income (loss) | $2,013,147 | $703,108 |
| Net realized gain (loss) | 7,594,396 | 14,003,769 |
| Change in net unrealized appreciation (depreciation) | (8,327,161) | 3,558,371 |
| Net increase (decrease) in net assets resulting from operations | 1,280,382 | 18,265,248 |
| Distributions to shareholders from net investment income | (1,813,948) | (746,601) |
| Distributions to shareholders from net realized gain | (11,800,940) | (6,942,325) |
| Total distributions | (13,614,888) | (7,688,926) |
| Share transactions - net increase (decrease) | 29,167,908 | 30,552,422 |
| Total increase (decrease) in net assets | 16,833,402 | 41,128,744 |
| Net Assets | | |
| Beginning of period | 206,633,657 | 165,504,913 |
| End of period (including undistributed net investment income of $173,464 and $0, respectively) | $223,467,059 | $206,633,657 |
See accompanying notes which are an integral part of the financial statements.
Financial Highlights — VIP Dynamic Capital Appreciation Portfolio Initial Class
| | | | | | |
| Years ended December 31, | 2015 | 2014 | 2013 | 2012 | 2011 |
| Selected Per–Share Data | | | | | |
| Net asset value, beginning of period | $13.56 | $12.76 | $10.02 | $8.22 | $8.47 |
| Income from Investment Operations | | | | | |
| Net investment income (loss)A | .13 | .06 | .05 | .07 | .03 |
| Net realized and unrealized gain (loss) | .04 | 1.30 | 3.70 | 1.80 | (.26) |
| Total from investment operations | .17 | 1.36 | 3.75 | 1.87 | (.23) |
| Distributions from net investment income | (.12) | (.06) | (.04) | (.07) | (.02) |
| Distributions from net realized gain | (.77) | (.50) | (.97) | – | – |
| Total distributions | (.88)B | (.56) | (1.01) | (.07) | (.02) |
| Net asset value, end of period | $12.85 | $13.56 | $12.76 | $10.02 | $8.22 |
| Total ReturnC,D | 1.30% | 10.92% | 38.53% | 22.72% | (2.69)% |
| Ratios to Average Net AssetsE,F | | | | | |
| Expenses before reductions | .70% | .72% | .77% | .82% | .87% |
| Expenses net of fee waivers, if any | .70% | .72% | .77% | .82% | .85% |
| Expenses net of all reductions | .69% | .71% | .76% | .80% | .84% |
| Net investment income (loss) | .97% | .47% | .47% | .78% | .30% |
| Supplemental Data | | | | | |
| Net assets, end of period (000 omitted) | $37,281 | $38,705 | $35,050 | $21,049 | $13,817 |
| Portfolio turnover rateG | 129% | 122% | 136% | 168% | 168% |
A Calculated based on average shares outstanding during the period.
B Total distributions of $.88 per share is comprised of distributions from net investment income of $.115 and distributions from net realized gain of $.767 per share.
C Total returns do not reflect charges attributable to your insurance company's separate account. Inclusion of these charges would reduce the total returns shown.
D Total returns would have been lower if certain expenses had not been reduced during the applicable periods shown.
E Fees and expenses of any underlying Fidelity Central Funds are not included in the Fund's expense ratio. The Fund indirectly bears its proportionate share of the expenses of any underlying Fidelity Central Funds.
F Expense ratios reflect operating expenses of the class. Expenses before reductions do not reflect amounts reimbursed by the investment adviser or reductions from brokerage service arrangements or reductions from other expense offset arrangements and do not represent the amount paid by the class during periods when reimbursements or reductions occur. Expenses net of fee waivers reflect expenses after reimbursement by the investment adviser but prior to reductions from brokerage service arrangements or other expense offset arrangements. Expenses net of all reductions represent the net expenses paid by the class.
G Amount does not include the portfolio activity of any underlying Fidelity Central Funds.
See accompanying notes which are an integral part of the financial statements.
Financial Highlights — VIP Dynamic Capital Appreciation Portfolio Service Class
| | | | | | |
| Years ended December 31, | 2015 | 2014 | 2013 | 2012 | 2011 |
| Selected Per–Share Data | | | | | |
| Net asset value, beginning of period | $13.45 | $12.66 | $9.95 | $8.17 | $8.41 |
| Income from Investment Operations | | | | | |
| Net investment income (loss)A | .12 | .05 | .04 | .07 | .02 |
| Net realized and unrealized gain (loss) | .03 | 1.29 | 3.67 | 1.78 | (.25) |
| Total from investment operations | .15 | 1.34 | 3.71 | 1.85 | (.23) |
| Distributions from net investment income | (.10) | (.05) | (.03) | (.07) | (.01) |
| Distributions from net realized gain | (.77) | (.50) | (.97) | – | – |
| Total distributions | (.86)B | (.55) | (1.00) | (.07) | (.01) |
| Net asset value, end of period | $12.74 | $13.45 | $12.66 | $9.95 | $8.17 |
| Total ReturnC,D | 1.16% | 10.88% | 38.39% | 22.61% | (2.68)% |
| Ratios to Average Net AssetsE,F | | | | | |
| Expenses before reductions | .80% | .81% | .86% | .91% | .95% |
| Expenses net of fee waivers, if any | .80% | .81% | .86% | .91% | .95% |
| Expenses net of all reductions | .79% | .80% | .85% | .88% | .94% |
| Net investment income (loss) | .87% | .37% | .38% | .70% | .20% |
| Supplemental Data | | | | | |
| Net assets, end of period (000 omitted) | $642 | $946 | $518 | $347 | $141 |
| Portfolio turnover rateG | 129% | 122% | 136% | 168% | 168% |
A Calculated based on average shares outstanding during the period.
B Total distributions of $.86 per share is comprised of distributions from net investment income of $.096 and distributions from net realized gain of $.767 per share.
C Total returns do not reflect charges attributable to your insurance company's separate account. Inclusion of these charges would reduce the total returns shown.
D Total returns would have been lower if certain expenses had not been reduced during the applicable periods shown.
E Fees and expenses of any underlying Fidelity Central Funds are not included in the Fund's expense ratio. The Fund indirectly bears its proportionate share of the expenses of any underlying Fidelity Central Funds.
F Expense ratios reflect operating expenses of the class. Expenses before reductions do not reflect amounts reimbursed by the investment adviser or reductions from brokerage service arrangements or reductions from other expense offset arrangements and do not represent the amount paid by the class during periods when reimbursements or reductions occur. Expenses net of fee waivers reflect expenses after reimbursement by the investment adviser but prior to reductions from brokerage service arrangements or other expense offset arrangements. Expenses net of all reductions represent the net expenses paid by the class.
G Amount does not include the portfolio activity of any underlying Fidelity Central Funds.
See accompanying notes which are an integral part of the financial statements.
Financial Highlights — VIP Dynamic Capital Appreciation Portfolio Service Class 2
| | | | | | |
| Years ended December 31, | 2015 | 2014 | 2013 | 2012 | 2011 |
| Selected Per–Share Data | | | | | |
| Net asset value, beginning of period | $13.27 | $12.50 | $9.83 | $8.08 | $8.31 |
| Income from Investment Operations | | | | | |
| Net investment income (loss)A | .09 | .03 | .03 | .05 | –B |
| Net realized and unrealized gain (loss) | .05 | 1.27 | 3.62 | 1.75 | (.23) |
| Total from investment operations | .14 | 1.30 | 3.65 | 1.80 | (.23) |
| Distributions from net investment income | (.08) | (.03) | (.01) | (.05) | – |
| Distributions from net realized gain | (.77) | (.50) | (.97) | – | – |
| Total distributions | (.85) | (.53) | (.98) | (.05) | – |
| Net asset value, end of period | $12.56 | $13.27 | $12.50 | $9.83 | $8.08 |
| Total ReturnC,D | 1.02% | 10.66% | 38.25% | 22.25% | (2.77)% |
| Ratios to Average Net AssetsE,F | | | | | |
| Expenses before reductions | .95% | .97% | 1.02% | 1.07% | 1.11% |
| Expenses net of fee waivers, if any | .95% | .97% | 1.01% | 1.07% | 1.10% |
| Expenses net of all reductions | .94% | .96% | 1.00% | 1.05% | 1.09% |
| Net investment income (loss) | .72% | .22% | .22% | .54% | .05% |
| Supplemental Data | | | | | |
| Net assets, end of period (000 omitted) | $20,128 | $24,336 | $24,512 | $18,565 | $12,014 |
| Portfolio turnover rateG | 129% | 122% | 136% | 168% | 168% |
A Calculated based on average shares outstanding during the period.
B Amount represents less than $.005 per share.
C Total returns do not reflect charges attributable to your insurance company's separate account. Inclusion of these charges would reduce the total returns shown.
D Total returns would have been lower if certain expenses had not been reduced during the applicable periods shown.
E Fees and expenses of any underlying Fidelity Central Funds are not included in the Fund's expense ratio. The Fund indirectly bears its proportionate share of the expenses of any underlying Fidelity Central Funds.
F Expense ratios reflect operating expenses of the class. Expenses before reductions do not reflect amounts reimbursed by the investment adviser or reductions from brokerage service arrangements or reductions from other expense offset arrangements and do not represent the amount paid by the class during periods when reimbursements or reductions occur. Expenses net of fee waivers reflect expenses after reimbursement by the investment adviser but prior to reductions from brokerage service arrangements or other expense offset arrangements. Expenses net of all reductions represent the net expenses paid by the class.
G Amount does not include the portfolio activity of any underlying Fidelity Central Funds.
See accompanying notes which are an integral part of the financial statements.
Financial Highlights — VIP Dynamic Capital Appreciation Portfolio Investor Class
| | | | | | |
| Years ended December 31, | 2015 | 2014 | 2013 | 2012 | 2011 |
| Selected Per–Share Data | | | | | |
| Net asset value, beginning of period | $13.54 | $12.75 | $10.01 | $8.22 | $8.46 |
| Income from Investment Operations | | | | | |
| Net investment income (loss)A | .12 | .05 | .05 | .07 | .02 |
| Net realized and unrealized gain (loss) | .04 | 1.29 | 3.69 | 1.78 | (.24) |
| Total from investment operations | .16 | 1.34 | 3.74 | 1.85 | (.22) |
| Distributions from net investment income | (.11) | (.05) | (.04) | (.06) | (.02) |
| Distributions from net realized gain | (.77) | (.50) | (.97) | – | – |
| Total distributions | (.87)B | (.55) | (1.00)C | (.06) | (.02) |
| Net asset value, end of period | $12.83 | $13.54 | $12.75 | $10.01 | $8.22 |
| Total ReturnD,E | 1.22% | 10.79% | 38.52% | 22.52% | (2.64)% |
| Ratios to Average Net AssetsF,G | | | | | |
| Expenses before reductions | .78% | .79% | .84% | .90% | .94% |
| Expenses net of fee waivers, if any | .78% | .79% | .84% | .90% | .93% |
| Expenses net of all reductions | .77% | .79% | .83% | .87% | .92% |
| Net investment income (loss) | .89% | .39% | .40% | .71% | .22% |
| Supplemental Data | | | | | |
| Net assets, end of period (000 omitted) | $165,416 | $142,646 | $105,425 | $37,037 | $22,787 |
| Portfolio turnover rateH | 129% | 122% | 136% | 168% | 168% |
A Calculated based on average shares outstanding during the period.
B Total distributions of $.87 per share is comprised of distributions from net investment income of $.105 and distributions from net realized gain of $.767 per share.
C Total distributions of $1.00 per share is comprised of distributions from net investment income of $.037 and distributions from net realized gain of $.967 per share.
D Total returns do not reflect charges attributable to your insurance company's separate account. Inclusion of these charges would reduce the total returns shown.
E Total returns would have been lower if certain expenses had not been reduced during the applicable periods shown.
F Fees and expenses of any underlying Fidelity Central Funds are not included in the Fund's expense ratio. The Fund indirectly bears its proportionate share of the expenses of any underlying Fidelity Central Funds.
G Expense ratios reflect operating expenses of the class. Expenses before reductions do not reflect amounts reimbursed by the investment adviser or reductions from brokerage service arrangements or reductions from other expense offset arrangements and do not represent the amount paid by the class during periods when reimbursements or reductions occur. Expenses net of fee waivers reflect expenses after reimbursement by the investment adviser but prior to reductions from brokerage service arrangements or other expense offset arrangements. Expenses net of all reductions represent the net expenses paid by the class.
H Amount does not include the portfolio activity of any underlying Fidelity Central Funds.
See accompanying notes which are an integral part of the financial statements.
Notes to Financial Statements
For the period ended December 31, 2015
1. Organization.
VIP Dynamic Capital Appreciation Portfolio (the Fund) is a fund of Variable Insurance Products Fund III (the Trust) and is authorized to issue an unlimited number of shares. The Trust is registered under the Investment Company Act of 1940, as amended (the 1940 Act), as an open-end management investment company organized as a Massachusetts business trust. Shares of the Fund may only be purchased by insurance companies for the purpose of funding variable annuity or variable life insurance contracts. The Fund offers the following classes of shares: Initial Class shares, Service Class shares, Service Class 2 shares and Investor Class shares. All classes have equal rights and voting privileges, except for matters affecting a single class.
2. Investments in Fidelity Central Funds.
The Fund invests in Fidelity Central Funds, which are open-end investment companies generally available only to other investment companies and accounts managed by the investment adviser and its affiliates. The Fund's Schedule of Investments lists each of the Fidelity Central Funds held as of period end, if any, as an investment of the Fund, but does not include the underlying holdings of each Fidelity Central Fund. As an Investing Fund, the Fund indirectly bears its proportionate share of the expenses of the underlying Fidelity Central Funds.
The Money Market Central Funds seek preservation of capital and current income and are managed by Fidelity Investments Money Management, Inc. (FIMM), an affiliate of the investment adviser. Annualized expenses of the Money Market Central Funds as of their most recent shareholder report date are less than .005%.
A complete unaudited list of holdings for each Fidelity Central Fund is available upon request or at the Securities and Exchange Commission (the SEC) website at www.sec.gov. In addition, the financial statements of the Fidelity Central Funds, which are not covered by the Fund's Report of Independent Registered Public Accounting Firm, are available on the SEC website or upon request.
3. Significant Accounting Policies.
The financial statements have been prepared in conformity with accounting principles generally accepted in the United States of America (GAAP), which require management to make certain estimates and assumptions at the date of the financial statements. Actual results could differ from those estimates. Subsequent events, if any, through the date that the financial statements were issued have been evaluated in the preparation of the financial statements. The following summarizes the significant accounting policies of the Fund:
Investment Valuation. Investments are valued as of 4:00 p.m. Eastern time on the last calendar day of the period. The Board of Trustees (the Board) has delegated the day to day responsibility for the valuation of the Fund's investments to the Fidelity Management & Research Company (FMR) Fair Value Committee (the Committee). In accordance with valuation policies and procedures approved by the Board, the Fund attempts to obtain prices from one or more third party pricing vendors or brokers to value its investments. When current market prices, quotations or currency exchange rates are not readily available or reliable, investments will be fair valued in good faith by the Committee, in accordance with procedures adopted by the Board. Factors used in determining fair value vary by investment type and may include market or investment specific events. The frequency with which these procedures are used cannot be predicted and they may be utilized to a significant extent. The Committee oversees the Fund's valuation policies and procedures and reports to the Board on the Committee's activities and fair value determinations. The Board monitors the appropriateness of the procedures used in valuing the Fund's investments and ratifies the fair value determinations of the Committee.
The Fund categorizes the inputs to valuation techniques used to value its investments into a disclosure hierarchy consisting of three levels as shown below:
- Level 1 – quoted prices in active markets for identical investments
- Level 2 – other significant observable inputs (including quoted prices for similar investments, interest rates, prepayment speeds, etc.)
- Level 3 – unobservable inputs (including the Fund's own assumptions based on the best information available)
Valuation techniques used to value the Fund's investments by major category are as follows:
Equity securities, including restricted securities, for which market quotations are readily available, are valued at the last reported sale price or official closing price as reported by a third party pricing vendor on the primary market or exchange on which they are traded and are categorized as Level 1 in the hierarchy. In the event there were no sales during the day or closing prices are not available, securities are valued at the last quoted bid price or may be valued using the last available price and are generally categorized as Level 2 in the hierarchy. For foreign equity securities, when market or security specific events arise, comparisons to the valuation of American Depositary Receipts (ADRs), futures contracts, Exchange-Traded Funds (ETFs) and certain indexes as well as quoted prices for similar securities may be used and would be categorized as Level 2 in the hierarchy. Utilizing these techniques may result in transfers between Level 1 and Level 2. For equity securities, including restricted securities, where observable inputs are limited, assumptions about market activity and risk are used and these securities may be categorized as Level 3 in the hierarchy.
Investments in open-end mutual funds, including the Fidelity Central Funds, are valued at their closing net asset value (NAV) each business day and are categorized as Level 1 in the hierarchy.
Changes in valuation techniques may result in transfers in or out of an assigned level within the disclosure hierarchy. The aggregate value of investments by input level as of December 31, 2015, is included at the end of the Fund's Schedule of Investments.
Foreign Currency. The Fund may use foreign currency contracts to facilitate transactions in foreign-denominated securities. Gains and losses from these transactions may arise from changes in the value of the foreign currency or if the counterparties do not perform under the contracts' terms.
Foreign-denominated assets, including investment securities, and liabilities are translated into U.S. dollars at the exchange rates at period end. Purchases and sales of investment securities, income and dividends received and expenses denominated in foreign currencies are translated into U.S. dollars at the exchange rate in effect on the transaction date.
The effects of exchange rate fluctuations on investments are included with the net realized and unrealized gain (loss) on investment securities. Other foreign currency transactions resulting in realized and unrealized gain (loss) are disclosed separately.
Investment Transactions and Income. For financial reporting purposes, the Fund's investment holdings and NAV include trades executed through the end of the last business day of the period. The NAV per share for processing shareholder transactions is calculated as of the close of business of the New York Stock Exchange (NYSE), normally 4:00 p.m. Eastern time and includes trades executed through the end of the prior business day. Gains and losses on securities sold are determined on the basis of identified cost and may include proceeds received from litigation. Dividend income is recorded on the ex-dividend date, except for certain dividends from foreign securities where the ex-dividend date may have passed, which are recorded as soon as the Fund is informed of the ex-dividend date. Non-cash dividends included in dividend income, if any, are recorded at the fair market value of the securities received. Income and capital gain distributions from Fidelity Central Funds, if any, are recorded on the ex-dividend date. Distributions received on securities that represent a return of capital or capital gain are recorded as a reduction of cost of investments and/or as a realized gain. Subsequent to ex-dividend date the Fund determines the components of these distributions, based upon receipt of tax filings or other correspondence relating to the underlying investment. Interest income is accrued as earned and includes coupon interest and amortization of premium and accretion of discount on debt securities as applicable. Investment income is recorded net of foreign taxes withheld where recovery of such taxes is uncertain.
Class Allocations and Expenses. Investment income, realized and unrealized capital gains and losses, common expenses of the Fund, and certain fund-level expense reductions, if any, are allocated daily on a pro-rata basis to each class based on the relative net assets of each class to the total net assets of the Fund. Each class differs with respect to transfer agent and distribution and service plan fees incurred. Certain expense reductions may also differ by class. For the reporting period, the allocated portion of income and expenses to each class as a percent of its average net assets may vary due to the timing of recording these transactions in relation to fluctuating net assets of the classes. Expenses directly attributable to a fund are charged to that fund. Expenses attributable to more than one fund are allocated among the respective funds on the basis of relative net assets or other appropriate methods. Expense estimates are accrued in the period to which they relate and adjustments are made when actual amounts are known.
Income Tax Information and Distributions to Shareholders. Each year, the Fund intends to qualify as a regulated investment company under Subchapter M of the Internal Revenue Code, including distributing substantially all of its taxable income and realized gains. As a result, no provision for U.S. Federal income taxes is required. As of December 31, 2015, the Fund did not have any unrecognized tax benefits in the financial statements; nor is the Fund aware of any tax positions for which it is reasonably possible that the total amounts of unrecognized tax benefits will significantly change in the next twelve months. The Fund files a U.S. federal tax return, in addition to state and local tax returns as required. The Fund's federal income tax returns are subject to examination by the Internal Revenue Service (IRS) for a period of three fiscal years after they are filed. State and local tax returns may be subject to examination for an additional fiscal year depending on the jurisdiction. Foreign taxes are provided for based on the Fund's understanding of the tax rules and rates that exist in the foreign markets in which it invests.
Distributions are declared and recorded on the ex-dividend date. Income dividends and capital gain distributions are declared separately for each class. Income and capital gain distributions are determined in accordance with income tax regulations, which may differ from GAAP.
Capital accounts within the financial statements are adjusted for permanent book-tax differences. These adjustments have no impact on net assets or the results of operations. Capital accounts are not adjusted for temporary book-tax differences which will reverse in a subsequent period.
Book-tax differences are primarily due to foreign currency transactions, partnerships and losses deferred due to wash sales.
The federal tax cost of investment securities and unrealized appreciation (depreciation) as of period end were as follows:
| Gross unrealized appreciation | $35,138,738 |
| Gross unrealized depreciation | (7,712,841) |
| Net unrealized appreciation (depreciation) on securities | $27,425,897 |
| Tax Cost | $199,662,577 |
The tax-based components of distributable earnings as of period end were as follows:
| Undistributed ordinary income | $173,464 |
| Undistributed long-term capital gain | $8,035,840 |
| Net unrealized appreciation (depreciation) on securities and other investments | $27,425,432 |
The tax character of distributions paid was as follows:
| | December 31, 2015 | December 31, 2014 |
| Ordinary Income | $2,044,736 | $ 6,225,703 |
| Long-term Capital Gains | 11,570,152 | 1,463,223 |
| Total | $13,614,888 | $ 7,688,926 |
4. Purchases and Sales of Investments.
Purchases and sales of securities, other than short-term securities, aggregated $290,814,511 and $275,451,957, respectively.
5. Fees and Other Transactions with Affiliates.
Management Fee. Fidelity Management & Research Company (the investment adviser) and its affiliates provide the Fund with investment management related services for which the Fund pays a monthly management fee. The management fee is the sum of an individual fund fee rate that is based on an annual rate of .30% of the Fund's average net assets and an annualized group fee rate that averaged .25% during the period. The group fee rate is based upon the average net assets of all the mutual funds advised by the investment adviser, including any mutual funds previously advised by the investment adviser that are currently advised by Fidelity SelectCo, LLC, an affiliate of the investment adviser. The group fee rate decreases as assets under management increase and increases as assets under management decrease. For the reporting period, the total annual management fee rate was .55% of the Fund's average net assets.
Distribution and Service Plan Fees. In accordance with Rule 12b-1 of the 1940 Act, the Fund has adopted separate 12b-1 Plans for each Service Class of shares. Each Service Class pays Fidelity Distributors Corporation (FDC), an affiliate of the investment adviser, a service fee. For the period, the service fee is based on an annual rate of .10% of Service Class' average net assets and .25% of Service Class 2's average net assets.
For the period, total fees, all of which were re-allowed to insurance companies for the distribution of shares and providing shareholder support services, were as follows:
| Service Class | $848 |
| Service Class 2 | 58,583 |
| | $59,431 |
Transfer Agent Fees. Fidelity Investments Institutional Operations Company, Inc. (FIIOC), an affiliate of the investment adviser, is the Fund's transfer, dividend disbursing, and shareholder servicing agent. FIIOC receives an asset-based fee with respect to each class. Each class (with the exception of Investor Class) pays a fee for transfer agent services, typesetting, printing and mailing of shareholder reports, excluding mailing of proxy statements and out of pocket expenses, equal to an annual rate of .07% (.15% for Investor Class) of class-level average net assets. For the period, transfer agent fees for each class, including out of pocket expenses, were as follows:
| Initial Class | $26,629 |
| Service Class | 560 |
| Service Class 2 | 15,733 |
| Investor Class | 238,724 |
| | $281,646 |
Accounting and Security Lending Fees. Fidelity Service Company, Inc. (FSC), an affiliate of the investment adviser, maintains the Fund's accounting records. The accounting fee is based on the level of average net assets for each month. Under a separate contract, FSC administers the security lending program. The security lending fee is based on the number and duration of lending transactions.
Brokerage Commissions. The Fund placed a portion of its portfolio transactions with brokerage firms which are affiliates of the investment adviser. Brokerage commissions are included in net realized gain (loss) and change in net unrealized appreciation (depreciation) in the Statement of Operations. The commissions paid to these affiliated firms were $5,232 for the period.
Interfund Trades. The Fund may purchase from or sell securities to other Fidelity Funds under procedures adopted by the Board. The procedures have been designed to ensure these interfund trades are executed in accordance with Rule 17a-7 of the 1940 Act. Interfund trades are included within the respective purchases and sales amounts shown in the Purchases and Sales of Investments note.
6. Committed Line of Credit.
The Fund participates with other funds managed by the investment adviser or an affiliate in a $4.25 billion credit facility (the "line of credit") to be utilized for temporary or emergency purposes to fund shareholder redemptions or for other short-term liquidity purposes. The Fund has agreed to pay commitment fees on its pro-rata portion of the line of credit, which amounted to $313 and is reflected in Miscellaneous expenses on the Statement of Operations. During the period, the Fund did not borrow on this line of credit.
7. Security Lending.
The Fund lends portfolio securities through a lending agent from time to time in order to earn additional income. For equity securities, a lending agent is used and may loan securities to certain qualified borrowers, including Fidelity Capital Markets (FCM), a broker-dealer affiliated with the Fund. On the settlement date of the loan, the Fund receives collateral (in the form of U.S. Treasury obligations, letters of credit and/or cash) against the loaned securities and maintains collateral in an amount not less than 100% of the market value of the loaned securities during the period of the loan. The market value of the loaned securities is determined at the close of business of the Fund and any additional required collateral is delivered to the Fund on the next business day. The Fund or borrower may terminate the loan at any time, and if the borrower defaults on its obligation to return the securities loaned because of insolvency or other reasons, the Fund may apply collateral received from the borrower against the obligation. The Fund may experience delays and costs in recovering the securities loaned. Any cash collateral received is invested in the Fidelity Securities Lending Cash Central Fund. The value of loaned securities and cash collateral at period end are disclosed on the Fund's Statement of Assets and Liabilities. The value of securities loaned to FCM at period end was $720,612. Security lending income represents the income earned on investing cash collateral, less rebates paid to borrowers and any lending agent fees associated with the loan, plus any premium payments received for lending certain types of securities. Security lending income is presented in the Statement of Operations as a component of income from Fidelity Central Funds. Total security lending income during the period amounted to $32,780, including $4,126 from securities loaned to FCM.
8. Expense Reductions.
Commissions paid to certain brokers with whom the investment adviser, or its affiliates, places trades on behalf of the Fund include an amount in addition to trade execution, which may be rebated back to the Fund to offset certain expenses. This amount totaled $16,269 for the period.
In addition, through arrangements with the Fund's custodian, credits realized as a result of certain uninvested cash balances were used to reduce the Fund's expenses. During the period, these credits reduced the Fund's custody expenses by $50.
In addition, during the period the investment adviser reimbursed and/or waived a portion of fund-level operating expenses in the amount of $921 and a portion of class-level operating expenses as follows:
| | Amount |
| Investor Class | $2,547 |
9. Distributions to Shareholders.
Distributions to shareholders of each class were as follows:
| Years ended December 31, | 2015 | 2014 |
| From net investment income | | |
| Initial Class | $333,856 | $165,970 |
| Service Class | 4,800 | 3,677 |
| Service Class 2 | 126,545 | 51,126 |
| Investor Class | 1,348,747 | 525,828 |
| Total | $1,813,948 | $746,601 |
| From net realized gain | | |
| Initial Class | $2,242,173 | $1,367,773 |
| Service Class | 54,559 | 25,451 |
| Service Class 2 | 1,404,834 | 951,024 |
| Investor Class | 8,099,374 | 4,598,077 |
| Total | $11,800,940 | $6,942,325 |
10. Share Transactions.
Transactions for each class of shares were as follows:
| | Shares | Shares | Dollars | Dollars |
| Years ended December 31, | 2015 | 2014 | 2015 | 2014 |
| Initial Class | | | | |
| Shares sold | 537,177 | 739,016 | $7,199,471 | $9,675,950 |
| Reinvestment of distributions | 199,716 | 119,582 | 2,576,029 | 1,533,743 |
| Shares redeemed | (690,307) | (751,259) | (9,122,359) | (9,579,314) |
| Net increase (decrease) | 46,586 | 107,339 | $653,141 | $1,630,379 |
| Service Class | | | | |
| Shares sold | 4,038 | 107,822 | $54,048 | $1,402,592 |
| Reinvestment of distributions | 4,636 | 2,268 | 59,359 | 29,128 |
| Shares redeemed | (28,704) | (80,652) | (382,810) | (988,494) |
| Net increase (decrease) | (20,030) | 29,438 | $(269,403) | $443,226 |
| Service Class 2 | | | | |
| Shares sold | 288,124 | 486,036 | $3,722,995 | $6,296,292 |
| Reinvestment of distributions | 121,322 | 80,304 | 1,531,379 | 1,002,150 |
| Shares redeemed | (641,236) | (693,294) | (8,242,162) | (8,803,974) |
| Net increase (decrease) | (231,790) | (126,954) | $(2,987,788) | $(1,505,532) |
| Investor Class | | | | |
| Shares sold | 3,353,296 | 3,684,607 | $44,883,083 | $47,988,463 |
| Reinvestment of distributions | 733,990 | 399,333 | 9,448,121 | 5,123,905 |
| Shares redeemed | (1,731,332) | (1,822,227) | (22,559,246) | (23,128,019) |
| Net increase (decrease) | 2,355,954 | 2,261,713 | $31,771,958 | $29,984,349 |
11. Other.
The Fund's organizational documents provide former and current trustees and officers with a limited indemnification against liabilities arising in connection with the performance of their duties to the Fund. In the normal course of business, the Fund may also enter into contracts that provide general indemnifications. The Fund's maximum exposure under these arrangements is unknown as this would be dependent on future claims that may be made against the Fund. The risk of material loss from such claims is considered remote.
At the end of the period, the investment adviser or its affiliates were the owners of record of 90% of the total outstanding shares of the Fund.
Report of Independent Registered Public Accounting Firm
To the Trustees of Variable Insurance Products Fund III and Shareholders of VIP Dynamic Capital Appreciation Portfolio:
We have audited the accompanying statement of assets and liabilities of VIP Dynamic Capital Appreciation Portfolio (the Fund), a fund of Variable Insurance Products Fund III, including the schedule of investments, as of December 31, 2015, and the related statement of operations for the year then ended, the statement of changes in net assets for each of the two years in the period then ended, and the financial highlights for each of the five years in the period then ended. These financial statements and financial highlights are the responsibility of the Fund's management. Our responsibility is to express an opinion on these financial statements and financial highlights based on our audits.
We conducted our audits in accordance with the standards of the Public Company Accounting Oversight Board (United States). Those standards require that we plan and perform the audit to obtain reasonable assurance about whether the financial statements and financial highlights are free of material misstatement. The Fund is not required to have, nor were we engaged to perform, an audit of its internal control over financial reporting. Our audits included consideration of internal control over financial reporting as a basis for designing audit procedures that are appropriate in the circumstances, but not for the purpose of expressing an opinion on the effectiveness of the Fund's internal control over financial reporting. Accordingly, we express no such opinion. An audit also includes examining, on a test basis, evidence supporting the amounts and disclosures in the financial statements, assessing the accounting principles used and significant estimates made by management, as well as evaluating the overall financial statement presentation. Our procedures included confirmation of securities owned as of December 31, 2015, by correspondence with the custodians and brokers; when replies were not received from brokers, we performed other auditing procedures. We believe that our audits provide a reasonable basis for our opinion.
In our opinion, such financial statements and financial highlights referred to above present fairly, in all material respects, the financial position of VIP Dynamic Capital Appreciation Portfolio as of December 31, 2015, the results of its operations for the year then ended, the changes in its net assets for each of the two years in the period then ended, and the financial highlights for each of the five years in the period then ended, in conformity with accounting principles generally accepted in the United States of America.
DELOITTE & TOUCHE LLP
Boston, Massachusetts
February 16, 2016
Trustees and Officers
The Trustees, Members of the Advisory Board (if any), and officers of the trust and fund, as applicable, are listed below. The Board of Trustees governs the fund and is responsible for protecting the interests of shareholders. The Trustees are experienced executives who meet periodically throughout the year to oversee the fund's activities, review contractual arrangements with companies that provide services to the fund, oversee management of the risks associated with such activities and contractual arrangements, and review the fund's performance. Each of the Trustees oversees 170 funds.
The Trustees hold office without limit in time except that (a) any Trustee may resign; (b) any Trustee may be removed by written instrument, signed by at least two-thirds of the number of Trustees prior to such removal; (c) any Trustee who requests to be retired or who has become incapacitated by illness or injury may be retired by written instrument signed by a majority of the other Trustees; and (d) any Trustee may be removed at any special meeting of shareholders by a two-thirds vote of the outstanding voting securities of the trust. Each Trustee who is not an interested person (as defined in the 1940 Act) of the trust and the fund is referred to herein as an Independent Trustee. Each Independent Trustee shall retire not later than the last day of the calendar year in which his or her 75th birthday occurs. The Independent Trustees may waive this mandatory retirement age policy with respect to individual Trustees. Officers and Advisory Board Members hold office without limit in time, except that any officer or Advisory Board Member may resign or may be removed by a vote of a majority of the Trustees at any regular meeting or any special meeting of the Trustees. Except as indicated, each individual has held the office shown or other offices in the same company for the past five years.
The fund’s Statement of Additional Information (SAI) includes more information about the Trustees. To request a free copy, call Fidelity at 1-877-208-0098.
Experience, Skills, Attributes, and Qualifications of the Trustees. The Governance and Nominating Committee has adopted a statement of policy that describes the experience, qualifications, attributes, and skills that are necessary and desirable for potential Independent Trustee candidates (Statement of Policy). The Board believes that each Trustee satisfied at the time he or she was initially elected or appointed a Trustee, and continues to satisfy, the standards contemplated by the Statement of Policy. The Governance and Nominating Committee also engages professional search firms to help identify potential Independent Trustee candidates who have the experience, qualifications, attributes, and skills consistent with the Statement of Policy. From time to time, additional criteria based on the composition and skills of the current Independent Trustees, as well as experience or skills that may be appropriate in light of future changes to board composition, business conditions, and regulatory or other developments, have also been considered by the professional search firms and the Governance and Nominating Committee. In addition, the Board takes into account the Trustees' commitment and participation in Board and committee meetings, as well as their leadership of standing and ad hoc committees throughout their tenure.
In determining that a particular Trustee was and continues to be qualified to serve as a Trustee, the Board has considered a variety of criteria, none of which, in isolation, was controlling. The Board believes that, collectively, the Trustees have balanced and diverse experience, qualifications, attributes, and skills, which allow the Board to operate effectively in governing the fund and protecting the interests of shareholders. Information about the specific experience, skills, attributes, and qualifications of each Trustee, which in each case led to the Board's conclusion that the Trustee should serve (or continue to serve) as a trustee of the fund, is provided below.
Board Structure and Oversight Function. James C. Curvey is an interested person and currently serves as Chairman. The Trustees have determined that an interested Chairman is appropriate and benefits shareholders because an interested Chairman has a personal and professional stake in the quality and continuity of services provided to the fund. Independent Trustees exercise their informed business judgment to appoint an individual of their choosing to serve as Chairman, regardless of whether the Trustee happens to be independent or a member of management. The Independent Trustees have determined that they can act independently and effectively without having an Independent Trustee serve as Chairman and that a key structural component for assuring that they are in a position to do so is for the Independent Trustees to constitute a substantial majority for the Board. The Independent Trustees also regularly meet in executive session. Ned C. Lautenbach serves as Chairman of the Independent Trustees and as such (i) acts as a liaison between the Independent Trustees and management with respect to matters important to the Independent Trustees and (ii) with management prepares agendas for Board meetings.
Fidelity® funds are overseen by different Boards of Trustees. The fund's Board oversees Fidelity's high income and certain equity funds, and other Boards oversee Fidelity's investment-grade bond, money market, asset allocation, and sector funds. The asset allocation funds may invest in Fidelity® funds overseen by the fund's Board. The use of separate Boards, each with its own committee structure, allows the Trustees of each group of Fidelity® funds to focus on the unique issues of the funds they oversee, including common research, investment, and operational issues. On occasion, the separate Boards establish joint committees to address issues of overlapping consequences for the Fidelity® funds overseen by each Board.
The Trustees operate using a system of committees to facilitate the timely and efficient consideration of all matters of importance to the Trustees, the fund, and fund shareholders and to facilitate compliance with legal and regulatory requirements and oversight of the fund's activities and associated risks. The Board, acting through its committees, has charged FMR and its affiliates with (i) identifying events or circumstances the occurrence of which could have demonstrably adverse effects on the fund's business and/or reputation; (ii) implementing processes and controls to lessen the possibility that such events or circumstances occur or to mitigate the effects of such events or circumstances if they do occur; and (iii) creating and maintaining a system designed to evaluate continuously business and market conditions in order to facilitate the identification and implementation processes described in (i) and (ii) above. Because the day-to-day operations and activities of the fund are carried out by or through FMR, its affiliates, and other service providers, the fund's exposure to risks is mitigated but not eliminated by the processes overseen by the Trustees. While each of the Board's committees has responsibility for overseeing different aspects of the fund's activities, oversight is exercised primarily through the Operations, Audit, and Compliance Committees. In addition, the Independent Trustees have worked with FMR to enhance the Board's oversight of investment and financial risks, legal and regulatory risks, technology risks, and operational risks, including the development of additional risk reporting to the Board. For example, a working group comprised of Independent Trustees and FMR has worked and continues to work to review the Fidelity® funds' valuation-related activities, reporting and risk management. Appropriate personnel, including but not limited to the fund's Chief Compliance Officer (CCO), FMR's internal auditor, the independent accountants, the fund's Treasurer and portfolio management personnel, make periodic reports to the Board's committees, as appropriate, including an annual review of Fidelity's risk management program for the Fidelity® funds. The responsibilities of each standing committee, including their oversight responsibilities, are described further under "Standing Committees of the Trustees."
Interested Trustees*:
Correspondence intended for a Trustee who is an interested person may be sent to Fidelity Investments, 245 Summer Street, Boston, Massachusetts 02210.
Name, Year of Birth; Principal Occupations and Other Relevant Experience+
James C. Curvey (1935)
Year of Election or Appointment: 2007
Trustee
Chairman of the Board of Trustees
Mr. Curvey also serves as Trustee of other Fidelity® funds. Mr. Curvey is a Director of Fidelity Research & Analysis Co. (investment adviser firm, 2009-present), and Vice Chairman (2007-present) and Director of FMR LLC (diversified financial services company). In addition, Mr. Curvey serves as an Overseer for the Boston Symphony Orchestra and a member of the board of Artis-Naples, Naples, Florida, and as a Trustee for Brewster Academy, Wolfeboro, New Hampshire. Previously, Mr. Curvey served as a Director of Fidelity Investments Money Management, Inc. (investment adviser firm, 2009-2014) and a Director of FMR and FMR Co., Inc. (investment adviser firms, 2007-2014).
Charles S. Morrison (1960)
Year of Election or Appointment: 2014
Trustee
Mr. Morrison also serves as Trustee of other funds. He serves as a Director of Fidelity Investments Money Management, Inc. (FIMM) (investment adviser firm, 2014-present), Director of Fidelity SelectCo, LLC (investment adviser firm, 2014-present), President, Asset Management (2014-present), and is an employee of Fidelity Investments. Previously, Mr. Morrison served as Vice President of Fidelity's Fixed Income and Asset Allocation Funds (2012-2014), President, Fixed Income (2011-2014), Vice President of Fidelity's Money Market Funds (2005-2009), President, Money Market Group Leader of FMR (investment adviser firm, 2009), and Senior Vice President, Money Market Group of FMR (2004-2009). Mr. Morrison also served as Vice President of Fidelity's Bond Funds (2002-2005), certain Balanced Funds (2002-2005), and certain Asset Allocation Funds (2002-2007), and as Senior Vice President (2002-2005) of Fidelity's Bond Division.
* Determined to be an “Interested Trustee” by virtue of, among other things, his or her affiliation with the trust or various entities under common control with FMR.
+ The information includes the Trustee's principal occupation during the last five years and other information relating to the experience, attributes, and skills relevant to the Trustee's qualifications to serve as a Trustee, which led to the conclusion that the Trustee should serve as a Trustee for the fund.
Independent Trustees:
Correspondence intended for an Independent Trustee may be sent to Fidelity Investments, P.O. Box 55235, Boston, Massachusetts 02205-5235.
Name, Year of Birth; Principal Occupations and Other Relevant Experience+
Dennis J. Dirks (1948)
Year of Election or Appointment: 2005
Trustee
Mr. Dirks also serves as Trustee of other Fidelity® funds. Prior to his retirement in May 2003, Mr. Dirks was Chief Operating Officer and a member of the Board of The Depository Trust & Clearing Corporation (DTCC). He also served as President, Chief Operating Officer, and Board member of The Depository Trust Company (DTC) and President and Board member of the National Securities Clearing Corporation (NSCC). In addition, Mr. Dirks served as Chief Executive Officer and Board member of the Government Securities Clearing Corporation, Chief Executive Officer and Board member of the Mortgage-Backed Securities Clearing Corporation, as a Trustee and a member of the Finance Committee of Manhattan College (2005-2008), as a Trustee and a member of the Finance Committee of AHRC of Nassau County (2006-2008), and as a member of the Independent Directors Council (IDC) Governing Council (2010-2015). Mr. Dirks is a member of the Board of Directors for The Brookville Center for Children's Services, Inc. (2009-present).
Alan J. Lacy (1953)
Year of Election or Appointment: 2008
Trustee
Mr. Lacy also serves as Trustee of other Fidelity® funds. Mr. Lacy serves as Chairman (2014-present) and a member (2010-present) of the Board of Directors of Dave & Buster's Entertainment, Inc. (restaurant and entertainment complexes) and a Director of Bristol-Myers Squibb Company (global pharmaceuticals, 2008-present). He is a Trustee of the California Chapter of The Nature Conservancy (2015-present) and a Director of the Center for Advanced Study in the Behavioral Sciences at Stanford University (2015-present). In addition, Mr. Lacy served as Senior Adviser (2007-2014) of Oak Hill Capital Partners, L.P. (private equity) and also served as Chief Executive Officer (2005) and Vice Chairman (2005-2006) of Sears Holdings Corporation (retail) and Chief Executive Officer and Chairman of the Board of Sears, Roebuck and Co. (retail, 2000-2005). Previously, Mr. Lacy served as Chairman (2008-2011) and a member (2006-2015) of the Board of Trustees of the National Parks Conservation Association and as a member of the Board of Directors for The Western Union Company (global money transfer, 2006-2011), The Hillman Companies, Inc. (hardware wholesalers, 2010-2014), and Earth Fare, Inc. (retail grocery, 2010-2014).
Ned C. Lautenbach (1944)
Year of Election or Appointment: 2000
Trustee
Chairman of the Independent Trustees
Mr. Lautenbach also serves as Trustee of other Fidelity® funds. Mr. Lautenbach currently serves as the Lead Director of the Eaton Corporation Board of Directors (diversified industrial, 1997-present). Mr. Lautenbach is Chairman of the Board of Directors of Artis-Naples in Naples, Florida (2012-present), a member of the Council on Foreign Relations (1994-present), and a member of the Board of Governors, State University System of Florida (2013-present). Previously, Mr. Lautenbach was a Partner/Advisory Partner at Clayton, Dubilier & Rice, LLC (private equity investment, 1998-2010), as well as a Director of Sony Corporation (2006-2007).
Joseph Mauriello (1944)
Year of Election or Appointment: 2008
Trustee
Mr. Mauriello also serves as Trustee of other Fidelity® funds. Prior to his retirement in January 2006, Mr. Mauriello served in numerous senior management positions including Deputy Chairman and Chief Operating Officer (2004-2005), and Vice Chairman of Financial Services (2002-2004) of KPMG LLP US (professional services, 1965-2005). Mr. Mauriello currently serves as a member of the Board of Directors of XL Group plc. (global insurance and re-insurance, 2006-present) and the Independent Directors Council (IDC) Governing Council (2015-present). Previously, Mr. Mauriello served as a Director of the Hamilton Funds of the Bank of New York (2006-2007) and of Arcadia Resources Inc. (health care services and products, 2007-2012).
Robert W. Selander (1950)
Year of Election or Appointment: 2011
Trustee
Mr. Selander also serves as Trustee of other Fidelity® funds. Mr. Selander serves as a Director of The Western Union Company (global money transfer, 2014-present) and a non-executive Chairman of Health Equity, Inc. (health savings custodian, 2015-present). Previously, Mr. Selander served as a Member of the Advisory Board of other Fidelity® funds (2011), and Executive Vice Chairman (2010), Chief Executive Officer (2009-2010), and President and Chief Executive Officer (1997-2009) of Mastercard, Inc.
Cornelia M. Small (1944)
Year of Election or Appointment: 2005
Trustee
Ms. Small also serves as Trustee of other Fidelity® funds. Ms. Small is a member of the Board of Directors (2009-present) and Chair of the Investment Committee (2010-present) of the Teagle Foundation. Ms. Small also serves on the Investment Committee of the Berkshire Taconic Community Foundation (2008-present). Previously, Ms. Small served as Chairperson (2002-2008) and a member of the Investment Committee and Chairperson (2008-2012) and a member of the Board of Trustees of Smith College. In addition, Ms. Small served as Chief Investment Officer, Director of Global Equity Investments, and a member of the Board of Directors of Scudder, Stevens & Clark and Scudder Kemper Investments.
William S. Stavropoulos (1939)
Year of Election or Appointment: 2002
Trustee
Vice Chairman of the Independent Trustees
Mr. Stavropoulos also serves as Trustee of other Fidelity® funds. Mr. Stavropoulos serves as President and Founder of the Michigan Baseball Foundation, the Great Lakes Loons (2007-present). Mr. Stavropoulos is Chairman Emeritus of the Board of Directors of The Dow Chemical Company, where he previously served in numerous senior management positions, including President, CEO (1995-2000; 2002-2004), Chairman of the Executive Committee (2000-2006), and as a member of the Board of Directors (1990-2006). Currently, Mr. Stavropoulos is Chairman of the Board of Directors of Univar Inc. (global distributor of commodity and specialty chemicals), a Director of Teradata Corporation (data warehousing and technology solutions), and Maersk Inc. (industrial conglomerate), and a member of the Advisory Board for Metalmark Capital LLC (private equity investment, 2005-present). Mr. Stavropoulos is an operating advisor to Clayton, Dubilier & Rice, LLC (private equity investment). In addition, Mr. Stavropoulos is a member of the University of Notre Dame Advisory Council for the College of Science, a Trustee of the Rollin L. Gerstacker Foundation, and a Director of the Naples Philharmonic Center for the Arts. Previously, Mr. Stavropoulos served as a Director of Chemical Financial Corporation (bank holding company, 1993-2012) and Tyco International, Ltd. (multinational manufacturing and services, 2007-2012).
David M. Thomas (1949)
Year of Election or Appointment: 2008
Trustee
Mr. Thomas also serves as Trustee of other Fidelity® funds. Mr. Thomas serves as Non-Executive Chairman of the Board of Directors of Fortune Brands Home and Security (home and security products, 2011-present), as a member of the Board of Directors (2004-present) and Presiding Director (2013-present) of Interpublic Group of Companies, Inc. (marketing communication), and as a member of the Board of Trustees of the University of Florida (2013-present). Previously, Mr. Thomas served as Executive Chairman (2005-2006) and Chairman and Chief Executive Officer (2000-2005) of IMS Health, Inc. (pharmaceutical and healthcare information solutions), and a Director of Fortune Brands, Inc. (consumer products, 2000-2011).
+ The information includes the Trustee's principal occupation during the last five years and other information relating to the experience, attributes, and skills relevant to the Trustee's qualifications to serve as a Trustee, which led to the conclusion that the Trustee should serve as a Trustee for the fund.
Advisory Board Members and Officers:
Correspondence intended for an officer or Peter S. Lynch may be sent to Fidelity Investments, 245 Summer Street, Boston, Massachusetts 02210. Officers appear below in alphabetical order.
Name, Year of Birth; Principal Occupation
Peter S. Lynch (1944)
Year of Election or Appointment: 2003
Member of the Advisory Board
Mr. Lynch also serves as Member of the Advisory Board of other Fidelity® funds. Mr. Lynch is Vice Chairman and a Director of FMR (investment adviser firm) and FMR Co., Inc. (investment adviser firm). In addition, Mr. Lynch serves as a Trustee of Boston College and as the Chairman of the Inner-City Scholarship Fund. Previously, Mr. Lynch served on the Special Olympics International Board of Directors (1997-2006).
Marc R. Bryant (1966)
Year of Election or Appointment: 2015
Secretary and Chief Legal Officer (CLO)
Mr. Bryant also serves as Secretary and CLO of other funds. Mr. Bryant serves as CLO, Secretary, and Senior Vice President of Fidelity Management & Research Company (investment adviser firm, 2015-present) and FMR Co., Inc. (investment adviser firm, 2015-present); Secretary of Fidelity SelectCo, LLC (investment adviser firm, 2015-present) and Fidelity Investments Money Management, Inc. (investment adviser firm, 2015-present); and CLO of Fidelity Management & Research (Hong Kong) Limited (investment adviser firm, 2015-present). He is Senior Vice President and Deputy General Counsel of FMR LLC (diversified financial services company). Previously, Mr. Bryant served as Secretary and CLO of Fidelity Rutland Square Trust II (2010-2014) and Assistant Secretary of Fidelity's Fixed Income and Asset Allocation Funds (2013-2015). Prior to joining Fidelity Investments, Mr. Bryant served as a Senior Vice President and the Head of Global Retail Legal for AllianceBernstein L.P. (2006-2010), and as the General Counsel for ProFund Advisors LLC (2001-2006).
William C. Coffey (1969)
Year of Election or Appointment: 2009
Assistant Secretary
Mr. Coffey also serves as Assistant Secretary of other funds. He is Senior Vice President and Deputy General Counsel of FMR LLC (diversified financial services company, 2010-present), and is an employee of Fidelity Investments. Previously, Mr. Coffey served as Vice President and Associate General Counsel of FMR LLC (2005-2009).
Jonathan Davis (1968)
Year of Election or Appointment: 2010
Assistant Treasurer
Mr. Davis also serves as Assistant Treasurer of other funds, and is an employee of Fidelity Investments. Previously, Mr. Davis served as Vice President and Associate General Counsel of FMR LLC (diversified financial services company, 2003-2010).
Adrien E. Deberghes (1967)
Year of Election or Appointment: 2008
Deputy Treasurer
Mr. Deberghes also serves as an officer of other funds. He is an employee of Fidelity Investments (2008-present). Prior to joining Fidelity Investments, Mr. Deberghes was Senior Vice President of Mutual Fund Administration at State Street Corporation (2007-2008), Senior Director of Mutual Fund Administration at Investors Bank & Trust (2005-2007), and Director of Finance for Dunkin' Brands (2000-2005).
Stephanie J. Dorsey (1969)
Year of Election or Appointment: 2010
Assistant Treasurer
Ms. Dorsey also serves as an officer of other funds. She is an employee of Fidelity Investments (2008-present) and has served in other fund officer roles. Prior to joining Fidelity Investments, Ms. Dorsey served as Treasurer (2004-2008) of the JPMorgan Mutual Funds and Vice President (2004-2008) of JPMorgan Chase Bank.
Howard J. Galligan III (1966)
Year of Election or Appointment: 2014
Chief Financial Officer
Mr. Galligan also serves as Chief Financial Officer of other funds. Mr. Galligan serves as President of Fidelity Pricing and Cash Management Services (FPCMS) (2014-present) and as a Director of Strategic Advisers, Inc. (investment adviser firm, 2008-present). Previously, Mr. Galligan served as Chief Administrative Officer of Asset Management (2011-2014) and Chief Operating Officer and Senior Vice President of Investment Support for Strategic Advisers, Inc. (2003-2011).
Scott C. Goebel (1968)
Year of Election or Appointment: 2015
Vice President
Mr. Goebel serves as Vice President of other funds and is an employee of Fidelity Investments (2001-present). Previously, Mr. Goebel served as Secretary of Fidelity SelectCo, LLC (investment adviser firm, 2013-2015), Fidelity Investments Money Management, Inc. (FIMM) (investment adviser firm, 2010-2015), and Fidelity Research and Analysis Company (FRAC) (investment adviser firm, 2010-2015); General Counsel, Secretary, and Senior Vice President of Fidelity Management & Research Company (investment adviser firm, 2008-2015) and FMR Co., Inc. (investment adviser firm, 2008-2015); Assistant Secretary of Fidelity Management & Research (Japan) Limited (investment adviser firm, 2008-2015) and FMR Investment Management (U.K.) Limited (investment adviser firm, 2008-2015); Chief Legal Officer (CLO) of Fidelity Management & Research (Hong Kong) Limited (investment adviser firm, 2008-2015); Secretary and CLO of certain Fidelity® funds (2008-2015); Assistant Secretary of FIMM (2008-2010), FRAC (2008-2010), and certain funds (2007-2008); and as Vice President and Secretary of Fidelity Distributors Corporation (FDC) (2005-2007).
Brian B. Hogan (1964)
Year of Election or Appointment: 2009
Vice President
Mr. Hogan also serves as Trustee or Vice President of other funds. Mr. Hogan serves as a Director of Fidelity SelectCo, LLC (investment adviser firm, 2014-present) and President of the Equity Division of FMR (investment adviser firm, 2009-present). Previously, Mr. Hogan served as Senior Vice President, Equity Research of FMR (2006-2009) and as a portfolio manager.
Chris Maher (1972)
Year of Election or Appointment: 2013
Assistant Treasurer
Mr. Maher serves as Assistant Treasurer of other funds. Mr. Maher is Vice President of Valuation Oversight and is an employee of Fidelity Investments. Previously, Mr. Maher served as Vice President of Asset Management Compliance (2013), Vice President of the Program Management Group of FMR (investment adviser firm, 2010-2013), and Vice President of Valuation Oversight (2008-2010).
John F. Papandrea (1972)
Year of Election or Appointment: 2016
Anti-Money Laundering (AML) Officer
Mr. Papandrea also serves as AML Officer of other funds. Mr. Papandrea is Vice President of FMR LLC (diversified financial services company, 2008-present) and is an employee of Fidelity Investments (2005-present).
Melissa M. Reilly (1971)
Year of Election or Appointment: 2014
Vice President of certain Equity Funds
Ms. Reilly also serves as Vice President of other funds. Ms. Reilly is an employee of Fidelity Investments (2004-present).
Kenneth B. Robins (1969)
Year of Election or Appointment: 2008
President and Treasurer
Mr. Robins also serves as an officer of other funds. Mr. Robins serves as Executive Vice President of Fidelity Investments Money Management, Inc. (FIMM) (investment adviser firm, 2013-present) and is an employee of Fidelity Investments (2004-present). Previously, Mr. Robins served in other fund officer roles.
Stacie M. Smith (1974)
Year of Election or Appointment: 2013
Deputy Treasurer
Ms. Smith also serves as an officer of other funds. She is an employee of Fidelity Investments (2009-present) and has served in other fund officer roles. Prior to joining Fidelity Investments, Ms. Smith served as Senior Audit Manager of Ernst & Young LLP (1996-2009).
Renee Stagnone (1975)
Year of Election or Appointment: 2013
Deputy Treasurer
Ms. Stagnone also serves as Deputy Treasurer of other funds. Ms. Stagnone is an employee of Fidelity Investments (1997-present).
Linda J. Wondrack (1964)
Year of Election or Appointment: 2014
Chief Compliance Officer
Ms. Wondrack also serves as Chief Compliance Officer of other funds. Ms. Wondrack is Executive Vice President and head of the Ethics Office and Asset Management Compliance for Fidelity Investments (2012-present). Ms. Wondrack also serves as Chief Compliance Officer of Fidelity SelectCo, LLC (investment adviser firm, 2014-present); Chief Compliance Officer of Impresa Management LLC (2013-present); and Chief Compliance Officer of FMR Co., Inc. (investment adviser firm), Fidelity Investments Money Management, Inc. (investment adviser firm), FMR Investment Management (U.K.) Limited (investment adviser firm), Fidelity Management & Research (Hong Kong) (investment adviser firm), Fidelity Management & Research Company (investment adviser firm), FIAM LLC (investment adviser firm), and Strategic Advisers, Inc. (investment adviser firm), Ballyrock Investment Advisors LLC, and Northern Neck Investors LLC (2012-present). Previously, Ms. Wondrack served as Chief Compliance Officer of Fidelity Management & Research (Japan) Limited (investment adviser firm, 2012-2016); Senior Vice President and Chief Compliance Officer for Columbia Management Investment Advisers, LLC (2005-2012); Chief Compliance Officer for certain funds within the Columbia Family of Funds (2007-2012); and Senior Vice President of Compliance Risk Management at Bank of America (2005-2010).
Joseph F. Zambello (1957)
Year of Election or Appointment: 2011
Deputy Treasurer
Mr. Zambello also serves as Deputy Treasurer of other funds. Mr. Zambello is an employee of Fidelity Investments (1991-present). Previously, Mr. Zambello served as Vice President of the Program Management Group of FMR (investment adviser firm, 2009-2011) and Vice President of the Transfer Agent Oversight Group (2005-2009).
Shareholder Expense Example
As a shareholder of the Fund, you incur two types of costs: (1) transaction costs, and (2) ongoing costs, including management fees, distribution and/or service (12b-1) fees and other Fund expenses. This Example is intended to help you understand your ongoing costs (in dollars) of investing in the Fund and to compare these costs with the ongoing costs of investing in other mutual funds.
The Example is based on an investment of $1,000 invested at the beginning of the period and held for the entire period (July 1, 2015 to December 31, 2015).
Actual Expenses
The first line of the accompanying table for each class of the Fund provides information about actual account values and actual expenses. You may use the information in this line, together with the amount you invested, to estimate the expenses that you paid over the period. Simply divide your account value by $1,000.00 (for example, an $8,600 account value divided by $1,000.00 = 8.6), then multiply the result by the number in the first line for a class of the Fund under the heading entitled "Expenses Paid During Period" to estimate the expenses you paid on your account during this period. The estimate of expenses does not include any fees or other expenses of any variable annuity or variable life insurance product. If they were, the estimate of expenses you paid during the period would be higher, and your ending account value would be lower. In addition, the Fund, as a shareholder in the underlying Fidelity Central Funds, will indirectly bear its pro-rata share of the fees and expenses incurred by the underlying Fidelity Central Funds. These fees and expenses are not included in the Fund's annualized expense ratio used to calculate the expense estimate in the table below.
Hypothetical Example for Comparison Purposes
The second line of the accompanying table for each class of the Fund provides information about hypothetical account values and hypothetical expenses based on a Class' actual expense ratio and an assumed rate of return of 5% per year before expenses, which is not the Class' actual return. The hypothetical account values and expenses may not be used to estimate the actual ending account balance or expenses you paid for the period. You may use this information to compare the ongoing costs of investing in the Fund and other funds. To do so, compare this 5% hypothetical example with the 5% hypothetical examples that appear in the shareholder reports of the other funds. The estimate of expenses does not include any fees or other expenses of any variable annuity or variable life insurance product. If they were, the estimate of expenses you paid during the period would be higher, and your ending account value would be lower. In addition, the Fund, as a shareholder in the underlying Fidelity Central Funds, will indirectly bear its pro-rata share of the fees and expenses incurred by the underlying Fidelity Central Funds. These fees and expenses are not included in the Fund's annualized expense ratio used to calculate the expense estimate in the table below.
Please note that the expenses shown in the table are meant to highlight your ongoing costs only and do not reflect any transaction costs. Therefore, the second line of the table is useful in comparing ongoing costs only, and will not help you determine the relative total costs of owning different funds.
| | Annualized Expense Ratio-A | Beginning
Account Value
July 1, 2015 | Ending
Account Value
December 31, 2015 | Expenses Paid
During Period-B
July 1, 2015
to December 31, 2015 |
| Initial Class | .70% | | | |
| Actual | | $1,000.00 | $961.30 | $3.46 |
| Hypothetical-C | | $1,000.00 | $1,021.68 | $3.57 |
| Service Class | .79% | | | |
| Actual | | $1,000.00 | $961.00 | $3.90 |
| Hypothetical-C | | $1,000.00 | $1,021.22 | $4.02 |
| Service Class 2 | .95% | | | |
| Actual | | $1,000.00 | $960.50 | $4.69 |
| Hypothetical-C | | $1,000.00 | $1,020.42 | $4.84 |
| Investor Class | .78% | | | |
| Actual | | $1,000.00 | $961.20 | $3.86 |
| Hypothetical-C | | $1,000.00 | $1,021.27 | $3.97 |
A Annualized expense ratio reflects expenses net of applicable fee waivers.
B Expenses are equal to each Class' annualized expense ratio, multiplied by the average account value over the period, multiplied by 184/365 (to reflect the one-half year period).
C 5% return per year before expenses
Distributions (Unaudited)
The Board of Trustees of VIP Dynamic Capital Appreciation Portfolio voted to pay to shareholders of record at the opening of business on record date, the following distributions per share derived from capital gains realized from sales of portfolio securities, and dividends derived from net investment income:
| | Pay Date | Record Date | Dividends | Capital Gains |
| Initial Class | 02/05/16 | 02/05/16 | $0.011 | $0.494 |
| Service Class | 02/05/16 | 02/05/16 | $0.011 | $0.494 |
| Service Class 2 | 02/05/16 | 02/05/16 | $0.011 | $0.494 |
| Investor Class | 02/05/16 | 02/05/16 | $0.011 | $0.494 |
The fund hereby designates as a capital gain dividend with respect to the taxable year ended December 31, 2015 $8,061,628, or, if subsequently determined to be different, the net capital gain of such year.
Initial Class designates 94%, Service Class designates 100%, Service Class 2 designates 100%, and Investor Class designates 100%, of the dividends distributed in December 2015 as qualifying for the dividends–received deduction for corporate shareholders.
Board Approval of Investment Advisory Contracts and Management Fees
VIP Dynamic Capital Appreciation Portfolio
Each year, the Board of Trustees, including the Independent Trustees (together, the Board), votes on the renewal of the management contract with Fidelity Management & Research Company (FMR) and the sub-advisory agreements (together, the Advisory Contracts) for the fund. The Board, assisted by the advice of fund counsel and Independent Trustees' counsel, requests and considers a broad range of information relevant to the renewal of the Advisory Contracts throughout the year.
The Board meets regularly and, at each of its meetings, covers an extensive agenda of topics and materials and considers factors that are relevant to its annual consideration of the renewal of the fund's Advisory Contracts, including the services and support provided to the fund and its shareholders. The Board has established various standing committees (Committees), each composed of and chaired by Independent Trustees with varying backgrounds, to which the Board has assigned specific subject matter responsibilities in order to enhance effective decision-making by the Board. The Board, acting directly and through its Committees, requests and receives information concerning the annual consideration of the renewal of the fund's Advisory Contracts. The Board also meets as needed to consider matters specifically related to the Board's annual consideration of the renewal of the Advisory Contracts. Members of the Board may also meet with trustees of other Fidelity funds through ad hoc joint committees to discuss certain matters relevant to all of the Fidelity funds.
At its July 2015 meeting, the Board unanimously determined to renew the fund's Advisory Contracts. In reaching its determination, the Board considered all factors it believed relevant, including (i) the nature, extent, and quality of the services to be provided to the fund and its shareholders (including the investment performance of the fund); (ii) the competitiveness of the fund's management fee and total expense ratio relative to peer funds; (iii) the total costs of the services to be provided by and the profits to be realized by Fidelity from its relationship with the fund; and (iv) the extent to which (if any) economies of scale exist and would be realized as the fund grows, and whether any economies of scale are appropriately shared with fund shareholders.
In considering whether to renew the Advisory Contracts for the fund, the Board reached a determination, with the assistance of fund counsel and Independent Trustees' counsel and through the exercise of its business judgment, that the renewal of the Advisory Contracts was in the best interests of the fund and its shareholders and that the compensation payable under the Advisory Contracts was fair and reasonable. The Board's decision to renew the Advisory Contracts was not based on any single factor, but rather was based on a comprehensive consideration of all the information provided to the Board at its meetings throughout the year. The Board, in reaching its determination to renew the Advisory Contracts, was aware that shareholders of the fund have a broad range of investment choices available to them, including a wide choice among funds offered by Fidelity's competitors, and that the fund's shareholders, who have the opportunity to review and weigh the disclosure provided by the fund in its prospectus and other public disclosures, have chosen to invest in this fund, which is part of the Fidelity family of funds.
Nature, Extent, and Quality of Services Provided. The Board considered Fidelity's staffing as it relates to the fund, including the backgrounds of investment personnel of Fidelity, and also considered the fund's investment objective, strategies, and related investment philosophy. The Independent Trustees also had discussions with senior management of Fidelity's investment operations and investment groups. The Board considered the structure of the portfolio manager compensation program and whether this structure provides appropriate incentives to act in the best interests of the fund. Additionally, the Board considered the portfolio managers' investments, if any, in the funds that they manage.
Resources Dedicated to Investment Management and Support Services. The Board and the Fund Oversight and Research Committees reviewed the general qualifications and capabilities of Fidelity's investment staff, including its size, education, experience, and resources, as well as Fidelity's approach to recruiting, training, managing, and compensating investment personnel. The Board noted that Fidelity has continued to increase the resources devoted to non-U.S. offices, including expansion of Fidelity's global investment organization. The Board also noted that Fidelity's analysts have extensive resources, tools and capabilities that allow them to conduct sophisticated quantitative and fundamental analysis, as well as credit analysis of issuers, counterparties and guarantors. Further, the Board considered that Fidelity's investment professionals have sufficient access to global information and data so as to provide competitive investment results over time, and that those professionals also have access to sophisticated tools that permit them to assess portfolio construction and risk and performance attribution characteristics continuously, as well as to transmit new information and research conclusions rapidly around the world. Additionally, in its deliberations, the Board considered Fidelity's trading, risk management, and compliance capabilities and resources, which are integral parts of the investment management process.
Shareholder and Administrative Services. The Board considered (i) the nature, extent, quality, and cost of advisory, administrative, and shareholder services performed by FMR, the sub-advisers (together with FMR, the Investment Advisers), and their affiliates under the Advisory Contracts and under separate agreements covering transfer agency, pricing and bookkeeping, and securities lending services for the fund; (ii) the nature and extent of the supervision of third party service providers, principally custodians and subcustodians; and (iii) the resources devoted to, and the record of compliance with, the fund's compliance policies and procedures. The Board also reviewed the allocation of fund brokerage, including allocations to brokers affiliated with the Investment Advisers, the use of brokerage commissions to pay fund expenses, and the use of "soft" commission dollars to pay for research services.
The Board noted that the growth of fund assets over time across the complex allows Fidelity to reinvest in the development of services designed to enhance the value or convenience of the Fidelity funds as investment vehicles. These services include 24-hour access to account information and market information through telephone representatives and over the Internet, investor education materials and asset allocation tools, and the expanded availability of Fidelity Investor Centers.
In 2014, the Board formed an ad hoc Committee on Transfer Agency Fees to review the variety of transfer agency fee structures throughout the industry and Fidelity's competitive positioning with respect to industry participants.
Investment in a Large Fund Family. The Board considered the benefits to shareholders of investing in a Fidelity fund, including the benefits of investing in a fund that is part of a large family of funds offering a variety of investment disciplines and providing a large variety of mutual fund investor services. The Board noted that Fidelity had taken, or had made recommendations that resulted in the Fidelity funds taking, a number of actions over the previous year that benefited particular funds, including (i) continuing to dedicate additional resources to investment research and to the support of the senior management team that oversees asset management; (ii) continuing efforts to enhance Fidelity's global research capabilities; (iii) launching new funds and making other enhancements to meet client needs; (iv) reducing management fees and total expenses for certain index funds and diversified international funds; (v) continuing to launch dedicated lower cost underlying funds to meet portfolio construction needs related to expanding underlying fund options for Fidelity funds of funds, specifically for the Freedom Fund product lines; (vi) rationalizing product lines and gaining increased efficiencies through fund mergers; (vii) launching active fixed-income exchange-traded funds; (viii) continuing to develop, acquire and implement systems and technology to improve services to the funds and information security and to increase efficiency; (ix) implementing investment enhancements to further strengthen Fidelity's target date product line to increase investors' probability of success in achieving their goals; (x) modifying the eligibility criteria for certain share classes to accommodate roll-over assets from employer-sponsored retirement plans; (xi) launching a new Class W of the Freedom Index Funds to attract and retain Fidelity record-kept retirement plan assets; and (xii) implementing changes to Fidelity's money market product line in response to recent money market regulatory reforms.
Investment Performance. The Board considered whether the fund has operated in accordance with its investment objective, as well as its record of compliance with its investment restrictions and its performance history.
The Board took into account discussions with representatives of the Investment Advisers about fund investment performance that occur at Board meetings throughout the year. In this regard the Board noted that as part of regularly scheduled fund reviews and other reports to the Board on fund performance, the Board considers annualized return information for the fund, for different time periods, measured against a securities market index ("benchmark index") and a peer group of funds with similar objectives ("peer group"), if any. In its evaluation of fund investment performance, the Board gave particular attention to information indicating changes in performance of certain Fidelity funds for specific time periods and discussed with the Investment Advisers the reasons for any overperformance or underperformance.
In addition to reviewing absolute and relative fund performance, the Independent Trustees periodically consider the appropriateness of fund performance metrics in evaluating the results achieved. In general, the Independent Trustees believe that fund performance should be evaluated based on net performance (after fees and expenses) of both the highest performing and lowest performing fund share classes, where applicable, compared to appropriate benchmark indices, over appropriate time periods that may include full market cycles, and compared to peer groups, as applicable, over the same periods, taking into account relevant factors including the following: general market conditions; issuer-specific information; and fund cash flows and other factors.
The Independent Trustees recognize that shareholders evaluate performance on a net basis over their own holding periods, for which one-, three-, and five-year periods are often used as a proxy. For this reason, the performance information reviewed by the Board also included net cumulative calendar year total return information for the fund and an appropriate benchmark index and peer group for the most recent one-, three-, and five-year periods, as shown below. Returns are shown compared to the 25th percentile (top of box, 75% beaten) and 75th percentile (bottom of box, 25% beaten) of the peer universe.
VIP Dynamic Capital Appreciation Portfolio
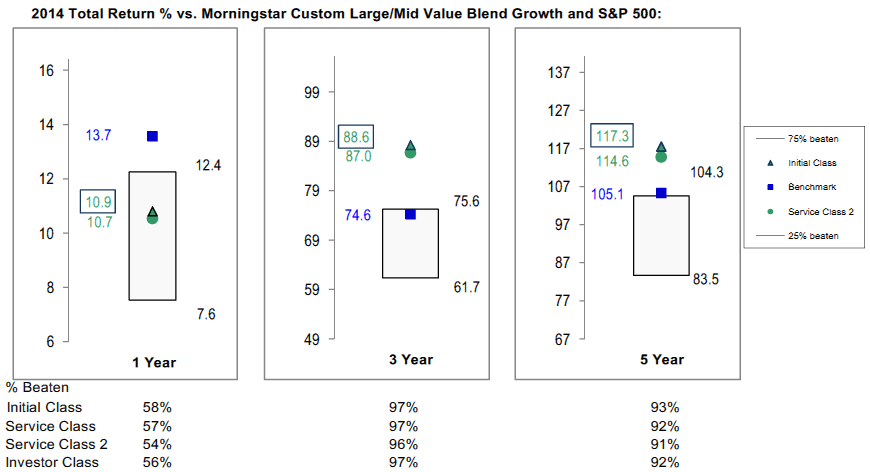
Based on its review, the Board concluded that the nature, extent, and quality of services provided to the fund under the Advisory Contracts should benefit the shareholders of the fund.
Competitiveness of Management Fee and Total Expense Ratio. The Board considered the fund's management fee and total expense ratio compared to "mapped groups" of competitive funds and classes created for the purpose of facilitating the Trustees' competitive analysis of management fees and total expenses. Fidelity creates "mapped groups" by combining similar Lipper investment objective categories that have comparable investment mandates. Combining Lipper investment objective categories aids the Board's management fee and total expense ratio comparisons by broadening the competitive group used for comparison.
Management Fee. The Board considered two proprietary management fee comparisons for the 12-month periods shown in basis points (BP) in the chart below. The group of Lipper funds used by the Board for management fee comparisons is referred to below as the "Total Mapped Group." The Total Mapped Group comparison focuses on a fund's standing in terms of gross management fees before expense reimbursements or caps relative to the total universe of funds with comparable investment mandates, regardless of whether their management fee structures also are comparable. Funds with comparable investment mandates offer exposure to similar types of securities. Funds with comparable management fee structures have similar management fee contractual arrangements (
e.g., flat rate charged for advisory services, all-inclusive fee rate,
etc.). "TMG %" represents the percentage of funds in the Total Mapped Group that had management fees that were lower than the fund's. For example, a hypothetical TMG % of 20% would mean that 80% of the funds in the Total Mapped Group had higher, and 20% had lower, management fees than the fund. The fund's actual TMG %s and the number of funds in the Total Mapped Group are in the chart below. The "Asset-Size Peer Group" (ASPG) comparison focuses on a fund's standing relative to a subset of non-Fidelity funds within the Total Mapped Group that are similar in size and management fee structure without taking into account performance adjustments, if any. For example, if a fund is in the first quartile of the ASPG, the fund's management fee ranks in the least expensive or lowest 25% of funds in the ASPG. The ASPG represents at least 15% of the funds in the Total Mapped Group with comparable asset size and management fee structures, subject to a minimum of 50 funds (or all funds in the Total Mapped Group if fewer than 50). Additional information, such as the ASPG quartile in which the fund's management fee rate ranked, is also included in the chart and considered by the Board.
VIP Dynamic Capital Appreciation Portfolio
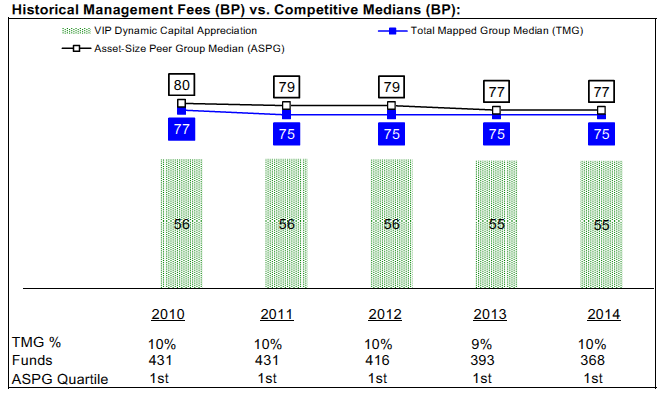
The Board noted that the fund's management fee rate ranked below the median of its Total Mapped Group and below the median of its ASPG for 2014.
The Board noted that, in 2014, the ad hoc Committee on Group Fee was formed by it and other Fidelity fund boards to conduct an in-depth review of the "group fee" component of the management fee of funds with such management fee structures. Committee focus included the mechanics of the group fee, the competitive landscape of group fee structures, Fidelity funds with no group fee component and investment products not included in group fee assets. The Board also considered that, for funds subject to the group fee, FMR agreed to voluntarily waive fees over a specified period of time in amounts designed to account for assets converted from certain funds to certain collective investment trusts.
The Board also noted that, in 2013, the ad hoc Committee on Management Fees was formed to conduct an in-depth review of the management fee rates of Fidelity's active equity mutual funds. The Committee focused on the following areas: (i) standard fee structures; (ii) research consumption and trading evolution; (iii) management fee competitiveness/profitability by category; and (iv) factors that drive institutional pricing.
Based on its review, the Board concluded that the fund's management fee is fair and reasonable in light of the services that the fund receives and the other factors considered.
Total Expense Ratio. In its review of each class's total expense ratio, the Board considered the fund's management fee as well as other fund or class expenses, as applicable, such as transfer agent fees, pricing and bookkeeping fees, fund-paid 12b-1 fees, and custodial, legal, and audit fees. The Board also noted that Fidelity may agree to waive fees and expenses from time to time, and the extent to which, if any, it has done so for the fund. As part of its review, the Board also considered the current and historical total expense ratios of each class of the fund compared to competitive fund median expenses. Each class of the fund is compared to those funds and classes in the Total Mapped Group (used by the Board for management fee comparisons) that have a similar sales load structure.
The Board noted that the total expense ratio of each of Initial Class, Investor Class, and Service Class ranked below its competitive median for 2014 and the total expense ratio of Service Class 2 ranked above its competitive median for 2014. The Board considered that, in general, various factors can affect total expense ratios. The Board noted that the total expense ratio of Service Class 2 was above the competitive median primarily because of higher 12b-1 fees for Service Class 2 as compared to most competitor funds. The Board noted that the fund offers multiple classes, each of which has a different 12b-1 fee structure, and that the multiple structures are intended to offer a range of pricing options for the intermediary market. The Board also noted that the total expense ratios of the classes vary primarily by the level of their 12b-1 fees, although differences in transfer agent fees may also cause expenses to vary from class to class.
Fees Charged to Other Fidelity Clients. The Board also considered Fidelity fee structures and other information with respect to clients of Fidelity, such as other funds advised or subadvised by Fidelity, pension plan clients, and other institutional clients with similar mandates. The Board noted the findings of the 2013 ad hoc joint committee (created with the board of other Fidelity funds), which reviewed and compared Fidelity's institutional investment advisory business with its business of providing services to the Fidelity funds, including the differences in services provided, fees charged, and costs incurred, as well as competition in their respective marketplaces.
Based on its review of total expense ratios and fees charged to other Fidelity clients, the Board concluded that, although Service Class 2 was above the median of the universe presented for comparison, the total expense ratio of each class of the fund was reasonable in light of the services that the fund and its shareholders receive and the other factors considered.
Costs of the Services and Profitability. The Board considered the revenues earned and the expenses incurred by Fidelity in conducting the business of developing, marketing, distributing, managing, administering and servicing the fund and servicing the fund's shareholders. The Board also considered the level of Fidelity's profits in respect of all the Fidelity funds.
On an annual basis, Fidelity presents to the Board information about the profitability of its relationship with the fund. Fidelity calculates profitability information for each fund, as well as aggregate profitability information for groups of Fidelity funds and all Fidelity funds, using a series of detailed revenue and cost allocation methodologies which originate with the books and records of Fidelity on which Fidelity's audited financial statements are based. The Audit Committee of the Board reviews any significant changes from the prior year's methodologies.
PricewaterhouseCoopers LLP (PwC), independent registered public accounting firm and auditor to Fidelity and certain Fidelity funds, has been engaged annually by the Board as part of the Board's assessment of Fidelity's profitability analysis. PwC's engagement includes the review and assessment of the methodologies used by Fidelity in determining the revenues and expenses attributable to Fidelity's mutual fund business, and completion of agreed-upon procedures in respect of the mathematical accuracy of fund profitability and its conformity to established allocation methodologies. After considering PwC's reports issued under the engagement and information provided by Fidelity, the Board concluded that while other allocation methods may also be reasonable, Fidelity's profitability methodologies are reasonable in all material respects.
The Board also reviewed Fidelity's non-fund businesses and fall-out benefits related to the mutual fund business as well as cases where Fidelity's affiliates may benefit from or be related to the fund's business.
The Board considered the costs of the services provided by and the profits realized by Fidelity in connection with the operation of the fund and was satisfied that the profitability was not excessive.
Economies of Scale. The Board considered whether there have been economies of scale in respect of the management of the Fidelity funds, whether the Fidelity funds (including the fund) have appropriately benefited from any such economies of scale, and whether there is potential for realization of any further economies of scale. The Board considered the extent to which the fund will benefit from economies of scale as assets grow through increased services to the fund, through waivers or reimbursements, or through fee or expense ratio reductions. The Board also noted that in 2013, it and the boards of other Fidelity funds created an ad hoc committee (the Economies of Scale Committee) to analyze whether Fidelity attains economies of scale in respect of the management and servicing of the Fidelity funds, whether the Fidelity funds have appropriately benefited from such economies of scale, and whether there is potential for realization of any further economies of scale.
The Board recognized that the fund's management contract incorporates a "group fee" structure, which provides for lower group fee rates as total group assets increase, and for higher group fee rates as total group assets decrease (with "group assets" defined to include fund assets under FMR's management plus sector fund assets previously under FMR's management and currently managed by Fidelity SelectCo, LLC). FMR calculates the group fee rates based on a tiered asset "breakpoint" schedule that varies based on asset class. The Board considered that the group fee is designed to deliver the benefits of economies of scale to fund shareholders when total Fidelity fund assets increase, even if assets of any particular fund are unchanged or have declined, because some portion of Fidelity's costs are attributable to services provided to all Fidelity funds, and all funds benefit if those costs can be allocated among more assets. The Board concluded that, given the group fee structure, fund shareholders will benefit from lower management fees as group assets increase at the fund complex level, regardless of whether Fidelity achieves any such economies of scale.
The Board concluded, taking into account the analysis of the Economies of Scale Committee, that economies of scale, if any, are being appropriately shared between fund shareholders and Fidelity.
Additional Information Requested by the Board. In order to develop fully the factual basis for consideration of the Fidelity funds' Advisory Contracts, the Board requested and received additional information on certain topics, including: (i) fund performance trends and Fidelity's long-term strategies for certain funds; (ii) the various share classes employed by Fidelity and the attributes of each class, together with similar information on the distribution and servicing payments made by Fidelity or the funds to third-party participants in the distribution channels; (iii) fund profitability, and fund performance in relation to fund profitability; (iv) the methodology with respect to evaluating competitive fund data and peer group classifications and fee comparisons; (v) annual fund profitability margins, with particular focus on certain funds with negative margins; (vi) the realization of fall-out benefits in certain Fidelity business units;
(vii) economies of scale and the way in which they are shared with fund shareholders;(viii) Fidelity's group fee structures, including the group fee schedule of breakpoints;(ix) the impact of cost containment measures on the funds; and (x) the transfer agent fee structure.
Based on its evaluation of all of the conclusions noted above, and after considering all factors it believed relevant, the Board concluded that the advisory fee structures are fair and reasonable, and that the fund's Advisory Contracts should be renewed.

VIPDCA-ANN-0216
1.751799.115
Fidelity® Variable Insurance Products: Growth & Income Portfolio
Annual Report December 31, 2015 |
|
Contents
To view a fund's proxy voting guidelines and proxy voting record for the 12-month period ended June 30, visit http://www.fidelity.com/proxyvotingresults or visit the Securities and Exchange Commission's (SEC) web site at http://www.sec.gov.
You may also call 1-877-208-0098 to request a free copy of the proxy voting guidelines.
Fidelity® Variable Insurance Products are separate account options which are purchased through a variable insurance contract.
Standard & Poor's, S&P and S&P 500 are registered service marks of The McGraw-Hill Companies, Inc. and have been licensed for use by Fidelity Distributors Corporation.
Other third-party marks appearing herein are the property of their respective owners.
All other marks appearing herein are registered or unregistered trademarks or service marks of FMR LLC or an affiliated company. © 2016 FMR LLC. All rights reserved.
This report and the financial statements contained herein are submitted for the general information of the shareholders of the Fund. This report is not authorized for distribution to prospective investors in the Fund unless preceded or accompanied by an effective prospectus.
A fund files its complete schedule of portfolio holdings with the SEC for the first and third quarters of each fiscal year on Form N-Q. Forms N-Q are available on the SEC’s web site at http://www.sec.gov. A fund's Forms N-Q may be reviewed and copied at the SEC’s Public Reference Room in Washington, DC. Information regarding the operation of the SEC's Public Reference Room may be obtained by calling 1-800-SEC-0330.
For a complete list of a fund's portfolio holdings, view the most recent holdings listing, semiannual report, or annual report on Fidelity's web site at http://www.fidelity.com, http://www.advisor.fidelity.com, or http://www.401k.com, as applicable.
NOT FDIC INSURED •MAY LOSE VALUE •NO BANK GUARANTEE
Neither the Fund nor Fidelity Distributors Corporation is a bank.
Performance: The Bottom Line
Average annual total return reflects the change in the value of an investment, assuming reinvestment of distributions from dividend income and capital gains (the profits earned upon the sale of securities that have grown in value, if any) and assuming a constant rate of performance each year. During periods of reimbursement by Fidelity, a fund’s total return will be greater than it would be had the reimbursement not occurred. Performance numbers are net of all underlying fund operating expenses, but do not include any insurance charges imposed by your insurance company’s separate account. If performance information included the effect of these additional charges, the total returns would have been lower. How a fund did yesterday is no guarantee of how it will do tomorrow.
Average Annual Total Returns
| For the periods ended December 31, 2015 | Past 1 year | Past 5 years | Past 10 years |
| Initial Class | (2.27)% | 11.70% | 6.50% |
| Service Class | (2.35)% | 11.59% | 6.40% |
| Service Class 2 | (2.54)% | 11.40% | 6.23% |
| Investor Class | (2.32)% | 11.59% | 6.40% |
$10,000 Over 10 Years
Let's say hypothetically that $10,000 was invested in VIP Growth & Income Portfolio - Initial Class on December 31, 2005.
The chart shows how the value of your investment would have changed, and also shows how the S&P 500® Index performed over the same period.
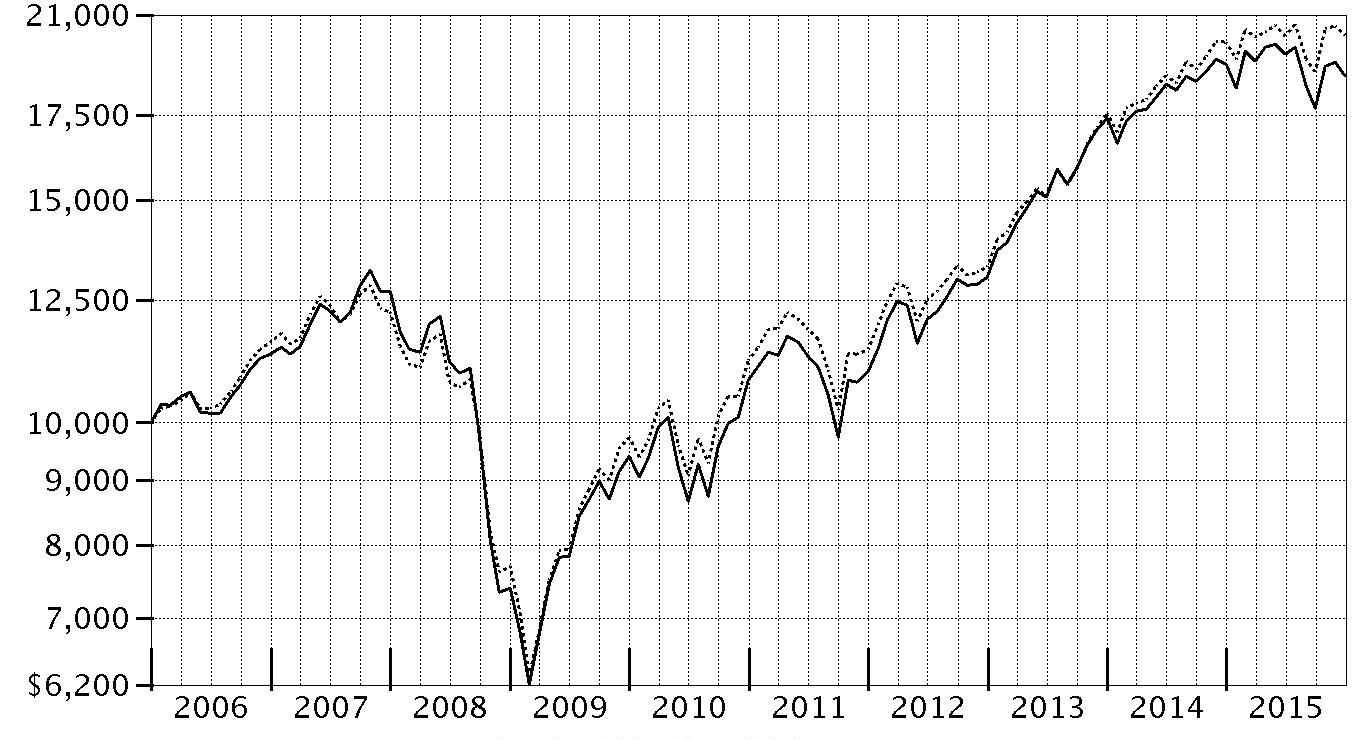
| Period Ending Values |
| $18,779 | VIP Growth & Income Portfolio - Initial Class |
| $20,242 | S&P 500® Index |
Management's Discussion of Fund Performance
Market Recap: U.S. stocks gained modestly in 2015, rebounding from a steep decline in August and September over worries about China’s slowing economic growth. The S&P 500
® index rose 1.38% for the period, its lowest calendar-year return since 2008. After the late-summer rout, stocks sharply reversed course in October, lifted by the U.S. Federal Reserve’s decision to put off raising near-term interest rates until mid-December. Investors also were encouraged by an interest-rate cut in China and economic stimulus in Europe. Overall, growth stocks fared much better than their value counterparts, as investors sought growth in a subpar economic environment. This helped lift the technology-heavy Nasdaq Composite Index
® 6.96% for the year. Sector performance in the broader market was split, with five of 10 sectors in the S&P 500
® gaining ground and five retreating. Consumer discretionary (+10%) led the way, benefiting from rising personal income and low inflation. Health care (+7%), consumer staples (+7%) and information technology (+6%) also outpaced the broad market amid strong fundamentals. Conversely, energy (-21%) was by far the worst performer, stung by deflated commodity prices that also hit materials (-8%). The defensive, but rate-sensitive utilities sector (-5%) lost ground on the cusp of Fed tightening, while industrials (-3%) were dragged down with energy prices and a slower-growing China.
Comments from Portfolio Manager Matthew Fruhan: For the year, the fund’s share classes declined modestly, meaningfully lagging the benchmark S&P 500
®. Some unusual market challenges held back the fund. Most notably, investors favored stocks that offered secure near-term earnings, regardless of valuation. Versus the benchmark, stock picks in consumer discretionary disappointed, especially not owning online retailer and index component Amazon.com. I declined to own Amazon because I thought its stock traded at an extreme valuation and did not fit my investment approach. Other individual relative detractors were social-networking company and benchmark member Facebook, a strong-performing stock that I similarly did not hold, and an overweight position in QUALCOMM, a maker of communications equipment. Positioning in energy and health care hampered results, as did our foreign investments, given a stronger dollar. In contrast, the fund modestly benefited from its stance in information technology, as well as an underweight in the weak-performing utilities group. The fund’s top individual contributor was industrial conglomerate General Electric; its stock performed well as the company decided to exit most of its financial services businesses. Another contributor was financial services giant JPMorgan Chase, which produced solid financial results, benefiting from its dominant competitive position.
The views expressed above reflect those of the portfolio manager(s) only through the end of the period as stated on the cover of this report and do not necessarily represent the views of Fidelity or any other person in the Fidelity organization. Any such views are subject to change at any time based upon market or other conditions and Fidelity disclaims any responsibility to update such views. These views may not be relied on as investment advice and, because investment decisions for a Fidelity fund are based on numerous factors, may not be relied on as an indication of trading intent on behalf of any Fidelity fund.
Investment Summary (Unaudited)
Top Ten Stocks as of December 31, 2015
| | % of fund's net assets | % of fund's net assets 6 months ago |
| JPMorgan Chase & Co. | 4.2 | 4.4 |
| General Electric Co.(a) | 3.8 | 3.4 |
| Microsoft Corp.(a) | 3.3 | 2.9 |
| Apple, Inc. | 3.1 | 3.6 |
| Bank of America Corp. | 2.9 | 2.6 |
| Citigroup, Inc. | 2.6 | 2.7 |
| Procter & Gamble Co. | 2.3 | 2.0 |
| Chevron Corp. | 2.2 | 2.0 |
| Johnson & Johnson | 2.1 | 1.7 |
| Qualcomm Technologies, Inc. | 1.9 | 1.6 |
| | 28.4 | |
(a) Security or a portion of the security is pledged as collateral for call options written.
Top Five Market Sectors as of December 31, 2015
| | % of fund's net assets | % of fund's net assets 6 months ago |
| Financials | 22.1 | 22.7 |
| Information Technology | 21.0 | 21.0 |
| Industrials | 13.0 | 12.9 |
| Health Care | 12.3 | 10.5 |
| Energy | 9.6 | 8.9 |
Asset Allocation (% of fund's net assets)
| As of December 31, 2015 *,** |
| | Stocks | 99.1% |
| | Bonds | 0.3% |
| | Short-Term Investments and Net Other Assets (Liabilities) | 0.6% |

* Foreign investments - 11.9%
** Written options - (0.0)%
| As of June 30, 2015* |
| | Stocks | 99.2% |
| | Bonds | 0.2% |
| | Short-Term Investments and Net Other Assets (Liabilities) | 0.6% |

* Foreign investments - 11.8%
Percentages shown as 0.0% may reflect amounts less than 0.05%.
Investments December 31, 2015
Showing Percentage of Net Assets
| Common Stocks - 98.3% | | | |
| | | Shares | Value |
| CONSUMER DISCRETIONARY - 8.8% | | | |
| Automobiles - 0.1% | | | |
| Harley-Davidson, Inc. | | 18,200 | $826,098 |
| Diversified Consumer Services - 0.2% | | | |
| H&R Block, Inc. | | 18,467 | 615,136 |
| ServiceMaster Global Holdings, Inc. (a) | | 47,400 | 1,859,976 |
| | | | 2,475,112 |
| Hotels, Restaurants & Leisure - 0.9% | | | |
| Cedar Fair LP (depositary unit) | | 900 | 50,256 |
| Dunkin' Brands Group, Inc. | | 20,100 | 856,059 |
| Las Vegas Sands Corp. | | 55,900 | 2,450,656 |
| Yum! Brands, Inc. | | 77,389 | 5,653,266 |
| | | | 9,010,237 |
| Household Durables - 0.2% | | | |
| Tupperware Brands Corp. | | 38,900 | 2,164,785 |
| Leisure Products - 0.2% | | | |
| Mattel, Inc. | | 75,800 | 2,059,486 |
| Polaris Industries, Inc. | | 3,000 | 257,850 |
| | | | 2,317,336 |
| Media - 4.2% | | | |
| Comcast Corp. Class A | | 299,571 | 16,904,792 |
| Scripps Networks Interactive, Inc. Class A | | 97,555 | 5,386,012 |
| Sinclair Broadcast Group, Inc. Class A | | 105,418 | 3,430,302 |
| Time Warner, Inc. | | 176,349 | 11,404,490 |
| Viacom, Inc. Class B (non-vtg.) | | 127,300 | 5,239,668 |
| | | | 42,365,264 |
| Multiline Retail - 1.9% | | | |
| Dillard's, Inc. Class A | | 4,000 | 262,840 |
| Target Corp. | | 255,977 | 18,586,490 |
| | | | 18,849,330 |
| Specialty Retail - 1.1% | | | |
| Lowe's Companies, Inc. (b) | | 143,017 | 10,875,013 |
|
| TOTAL CONSUMER DISCRETIONARY | | | 88,883,175 |
|
| CONSUMER STAPLES - 8.0% | | | |
| Beverages - 2.8% | | | |
| Diageo PLC | | 183,754 | 5,017,910 |
| PepsiCo, Inc. | | 56,243 | 5,619,801 |
| The Coca-Cola Co. | | 420,453 | 18,062,661 |
| | | | 28,700,372 |
| Food & Staples Retailing - 1.1% | | | |
| CVS Health Corp. | | 67,264 | 6,576,401 |
| Wal-Mart Stores, Inc. | | 11,500 | 704,950 |
| Walgreens Boots Alliance, Inc. | | 41,223 | 3,510,345 |
| | | | 10,791,696 |
| Food Products - 0.1% | | | |
| Mead Johnson Nutrition Co. Class A | | 20,200 | 1,594,790 |
| Household Products - 2.3% | | | |
| Procter & Gamble Co. | | 289,350 | 22,977,284 |
| Personal Products - 0.0% | | | |
| Estee Lauder Companies, Inc. Class A | | 1,100 | 96,866 |
| Tobacco - 1.7% | | | |
| British American Tobacco PLC sponsored ADR | | 52,257 | 5,771,786 |
| Imperial Tobacco Group PLC | | 30,510 | 1,613,130 |
| Philip Morris International, Inc. | | 115,038 | 10,112,991 |
| | | | 17,497,907 |
|
| TOTAL CONSUMER STAPLES | | | 81,658,915 |
|
| ENERGY - 9.5% | | | |
| Energy Equipment & Services - 1.4% | | | |
| Baker Hughes, Inc. | | 30,700 | 1,416,805 |
| Ensco PLC Class A | | 159,536 | 2,455,259 |
| Helmerich & Payne, Inc. | | 21,800 | 1,167,390 |
| National Oilwell Varco, Inc. | | 62,900 | 2,106,521 |
| Oceaneering International, Inc. | | 101,500 | 3,808,280 |
| Schlumberger Ltd. | | 49,147 | 3,428,003 |
| | | | 14,382,258 |
| Oil, Gas & Consumable Fuels - 8.1% | | | |
| Apache Corp. | | 178,100 | 7,920,107 |
| Cenovus Energy, Inc. | | 136,500 | 1,726,350 |
| Chevron Corp. | | 250,668 | 22,550,093 |
| ConocoPhillips Co. | | 113,000 | 5,275,970 |
| EQT Midstream Partners LP | | 27,800 | 2,097,788 |
| Golar LNG Ltd. | | 84,000 | 1,326,360 |
| Imperial Oil Ltd. | | 229,800 | 7,486,727 |
| Kinder Morgan, Inc. | | 206,000 | 3,073,520 |
| Legacy Reserves LP | | 164,988 | 288,729 |
| MPLX LP | | 80,346 | 3,160,008 |
| PrairieSky Royalty Ltd. (c) | | 116,409 | 1,844,103 |
| Suncor Energy, Inc. | | 530,760 | 13,701,487 |
| The Williams Companies, Inc. | | 159,090 | 4,088,613 |
| Williams Partners LP | | 258,974 | 7,212,426 |
| | | | 81,752,281 |
|
| TOTAL ENERGY | | | 96,134,539 |
|
| FINANCIALS - 22.1% | | | |
| Banks - 15.2% | | | |
| Bank of America Corp. | | 1,763,632 | 29,681,927 |
| Citigroup, Inc. | | 510,118 | 26,398,607 |
| Comerica, Inc. | | 97,700 | 4,086,791 |
| Commerce Bancshares, Inc. | | 31,825 | 1,353,836 |
| Fifth Third Bancorp | | 132,000 | 2,653,200 |
| JPMorgan Chase & Co. | | 643,632 | 42,499,015 |
| Lloyds Banking Group PLC | | 435,900 | 469,026 |
| M&T Bank Corp. | | 35,700 | 4,326,126 |
| PNC Financial Services Group, Inc. | | 60,872 | 5,801,710 |
| Regions Financial Corp. | | 565,700 | 5,430,720 |
| Standard Chartered PLC (United Kingdom) | | 300,144 | 2,494,216 |
| SunTrust Banks, Inc. | | 249,764 | 10,699,890 |
| U.S. Bancorp | | 291,198 | 12,425,419 |
| UMB Financial Corp. | | 7,400 | 344,470 |
| Wells Fargo & Co. | | 97,169 | 5,282,107 |
| | | | 153,947,060 |
| Capital Markets - 5.3% | | | |
| Ashmore Group PLC | | 111,500 | 421,453 |
| Charles Schwab Corp. (b) | | 214,284 | 7,056,372 |
| Franklin Resources, Inc. | | 37,300 | 1,373,386 |
| Invesco Ltd. | | 79,500 | 2,661,660 |
| KKR & Co. LP | | 381,493 | 5,947,476 |
| Morgan Stanley | | 244,083 | 7,764,280 |
| Northern Trust Corp. | | 119,045 | 8,581,954 |
| Oaktree Capital Group LLC Class A | | 39,800 | 1,899,256 |
| PJT Partners, Inc. (a) | | 150 | 4,244 |
| State Street Corp. | | 237,479 | 15,759,106 |
| T. Rowe Price Group, Inc. | | 1,500 | 107,235 |
| The Blackstone Group LP | | 87,700 | 2,564,348 |
| | | | 54,140,770 |
| Insurance - 1.1% | | | |
| ACE Ltd. | | 7,400 | 864,690 |
| Marsh & McLennan Companies, Inc. | | 52,242 | 2,896,819 |
| MetLife, Inc. | | 92,214 | 4,445,637 |
| Principal Financial Group, Inc. | | 61,600 | 2,770,768 |
| | | | 10,977,914 |
| Real Estate Investment Trusts - 0.3% | | | |
| American Tower Corp. | | 13,800 | 1,337,910 |
| Crown Castle International Corp. | | 11,200 | 968,240 |
| First Potomac Realty Trust | | 9,100 | 103,740 |
| Sabra Health Care REIT, Inc. | | 33,600 | 679,728 |
| | | | 3,089,618 |
| Thrifts & Mortgage Finance - 0.2% | | | |
| Radian Group, Inc. | | 165,850 | 2,220,732 |
|
| TOTAL FINANCIALS | | | 224,376,094 |
|
| HEALTH CARE - 11.6% | | | |
| Biotechnology - 1.8% | | | |
| AbbVie, Inc. | | 80,000 | 4,739,200 |
| Amgen, Inc. | | 43,944 | 7,133,430 |
| Biogen, Inc. (a) | | 19,200 | 5,881,920 |
| Intercept Pharmaceuticals, Inc. (a) | | 6,445 | 962,561 |
| | | | 18,717,111 |
| Health Care Equipment & Supplies - 2.2% | | | |
| Abbott Laboratories | | 104,497 | 4,692,960 |
| Ansell Ltd. | | 63,186 | 979,207 |
| Medtronic PLC | | 133,385 | 10,259,974 |
| St. Jude Medical, Inc. | | 20,700 | 1,278,639 |
| Zimmer Biomet Holdings, Inc. | | 46,100 | 4,729,399 |
| | | | 21,940,179 |
| Health Care Providers & Services - 1.4% | | | |
| Cardinal Health, Inc. | | 17,200 | 1,535,444 |
| Express Scripts Holding Co. (a) | | 16,000 | 1,398,560 |
| McKesson Corp. | | 48,188 | 9,504,119 |
| Patterson Companies, Inc. | | 50,043 | 2,262,444 |
| | | | 14,700,567 |
| Life Sciences Tools & Services - 0.3% | | | |
| Agilent Technologies, Inc. | | 62,400 | 2,608,944 |
| Pharmaceuticals - 5.9% | | | |
| Astellas Pharma, Inc. | | 81,900 | 1,165,909 |
| Bristol-Myers Squibb Co. | | 24,100 | 1,657,839 |
| GlaxoSmithKline PLC sponsored ADR | | 367,694 | 14,836,453 |
| Johnson & Johnson | | 206,559 | 21,217,740 |
| Novartis AG sponsored ADR | | 2,225 | 191,439 |
| Sanofi SA | | 10,826 | 922,611 |
| Shire PLC sponsored ADR | | 17,000 | 3,485,000 |
| Teva Pharmaceutical Industries Ltd. sponsored ADR | | 235,803 | 15,478,109 |
| Theravance, Inc. (c) | | 58,000 | 611,320 |
| | | | 59,566,420 |
|
| TOTAL HEALTH CARE | | | 117,533,221 |
|
| INDUSTRIALS - 12.9% | | | |
| Aerospace & Defense - 2.2% | | | |
| Meggitt PLC | | 75,842 | 418,938 |
| Rolls-Royce Group PLC | | 174,700 | 1,479,783 |
| The Boeing Co. | | 96,517 | 13,955,393 |
| United Technologies Corp. | | 71,387 | 6,858,149 |
| | | | 22,712,263 |
| Air Freight & Logistics - 1.9% | | | |
| C.H. Robinson Worldwide, Inc. | | 45,100 | 2,797,102 |
| PostNL NV (a) | | 689,200 | 2,621,458 |
| United Parcel Service, Inc. Class B | | 143,672 | 13,825,557 |
| | | | 19,244,117 |
| Airlines - 0.2% | | | |
| Copa Holdings SA Class A | | 40,938 | 1,975,668 |
| Building Products - 0.2% | | | |
| Lennox International, Inc. | | 13,700 | 1,711,130 |
| Commercial Services & Supplies - 0.3% | | | |
| ADT Corp. (c) | | 111,907 | 3,690,693 |
| Electrical Equipment - 1.0% | | | |
| Eaton Corp. PLC | | 41,000 | 2,133,640 |
| Emerson Electric Co. | | 95,700 | 4,577,331 |
| Hubbell, Inc. Class B | | 33,879 | 3,423,134 |
| | | | 10,134,105 |
| Industrial Conglomerates - 3.8% | | | |
| General Electric Co. (b) | | 1,227,450 | 38,235,068 |
| Machinery - 0.7% | | | |
| CLARCOR, Inc. | | 2,000 | 99,360 |
| Cummins, Inc. | | 10,000 | 880,100 |
| Deere & Co. | | 32,200 | 2,455,894 |
| Donaldson Co., Inc. | | 49,700 | 1,424,402 |
| IMI PLC | | 44,400 | 563,890 |
| Pentair PLC | | 9,900 | 490,347 |
| Xylem, Inc. | | 32,700 | 1,193,550 |
| | | | 7,107,543 |
| Professional Services - 0.1% | | | |
| Nielsen Holdings PLC | | 17,600 | 820,160 |
| Road & Rail - 2.1% | | | |
| CSX Corp. | | 298,947 | 7,757,675 |
| J.B. Hunt Transport Services, Inc. | | 82,782 | 6,072,888 |
| Kansas City Southern | | 37,500 | 2,800,125 |
| Norfolk Southern Corp. | | 35,093 | 2,968,517 |
| Union Pacific Corp. | | 18,200 | 1,423,240 |
| | | | 21,022,445 |
| Trading Companies & Distributors - 0.4% | | | |
| W.W. Grainger, Inc. (c) | | 3,500 | 709,065 |
| Watsco, Inc. | | 30,992 | 3,630,093 |
| | | | 4,339,158 |
|
| TOTAL INDUSTRIALS | | | 130,992,350 |
|
| INFORMATION TECHNOLOGY - 20.9% | | | |
| Communications Equipment - 3.3% | | | |
| Cisco Systems, Inc. (b) | | 531,004 | 14,419,414 |
| Qualcomm Technologies, Inc. | | 381,761 | 19,082,324 |
| | | | 33,501,738 |
| Internet Software & Services - 3.4% | | | |
| Alphabet, Inc.: | | | |
| Class A (a) | | 23,118 | 17,986,035 |
| Class C | | 19,683 | 14,937,035 |
| Yahoo!, Inc. (a) | | 46,085 | 1,532,787 |
| | | | 34,455,857 |
| IT Services - 5.4% | | | |
| First Data Corp. | | 233,831 | 3,371,375 |
| First Data Corp. Class A (a) | | 47,500 | 760,950 |
| IBM Corp. | | 75,658 | 10,412,054 |
| MasterCard, Inc. Class A | | 111,710 | 10,876,086 |
| Paychex, Inc. (b) | | 240,531 | 12,721,685 |
| The Western Union Co. | | 29,999 | 537,282 |
| Unisys Corp. (a) | | 151,500 | 1,674,075 |
| Visa, Inc. Class A | | 193,776 | 15,027,329 |
| | | | 55,380,836 |
| Semiconductors & Semiconductor Equipment - 0.4% | | | |
| Marvell Technology Group Ltd. | | 53,000 | 467,460 |
| Maxim Integrated Products, Inc. | | 88,300 | 3,355,400 |
| Xilinx, Inc. | | 11,800 | 554,246 |
| | | | 4,377,106 |
| Software - 4.0% | | | |
| Microsoft Corp. (b) | | 610,413 | 33,865,713 |
| Oracle Corp. | | 183,091 | 6,688,314 |
| | | | 40,554,027 |
| Technology Hardware, Storage & Peripherals - 4.4% | | | |
| Apple, Inc. | | 295,258 | 31,078,857 |
| EMC Corp. | | 414,205 | 10,636,784 |
| HP, Inc. | | 99,700 | 1,180,448 |
| Western Digital Corp. | | 25,300 | 1,519,265 |
| | | | 44,415,354 |
|
| TOTAL INFORMATION TECHNOLOGY | | | 212,684,918 |
|
| MATERIALS - 3.1% | | | |
| Chemicals - 2.7% | | | |
| CF Industries Holdings, Inc. | | 45,500 | 1,856,855 |
| E.I. du Pont de Nemours & Co. | | 52,852 | 3,519,943 |
| LyondellBasell Industries NV Class A | | 25,900 | 2,250,710 |
| Monsanto Co. | | 118,519 | 11,676,492 |
| Potash Corp. of Saskatchewan, Inc. | | 174,300 | 2,985,409 |
| Syngenta AG (Switzerland) | | 14,181 | 5,550,487 |
| | | | 27,839,896 |
| Containers & Packaging - 0.3% | | | |
| Ball Corp. | | 3,000 | 218,190 |
| Packaging Corp. of America | | 14,500 | 914,225 |
| WestRock Co. | | 40,000 | 1,824,800 |
| | | | 2,957,215 |
| Metals & Mining - 0.1% | | | |
| Freeport-McMoRan, Inc. | | 112,400 | 760,948 |
| Paper & Forest Products - 0.0% | | | |
| International Paper Co. | | 8,100 | 305,370 |
|
| TOTAL MATERIALS | | | 31,863,429 |
|
| TELECOMMUNICATION SERVICES - 0.9% | | | |
| Diversified Telecommunication Services - 0.9% | | | |
| Verizon Communications, Inc. (b) | | 195,880 | 9,053,574 |
| UTILITIES - 0.5% | | | |
| Electric Utilities - 0.5% | | | |
| Exelon Corp. | | 141,500 | 3,929,455 |
| PPL Corp. | | 16,500 | 563,145 |
| | | | 4,492,600 |
| TOTAL COMMON STOCKS | | | |
| (Cost $802,832,142) | | | 997,672,815 |
|
| Preferred Stocks - 0.8% | | | |
| Convertible Preferred Stocks - 0.8% | | | |
| CONSUMER DISCRETIONARY - 0.0% | | | |
| Leisure Products - 0.0% | | | |
| NJOY, Inc. (a)(d) | | 9,742 | 12,178 |
| HEALTH CARE - 0.7% | | | |
| Health Care Equipment & Supplies - 0.7% | | | |
| Alere, Inc. 3.00% (a) | | 27,229 | 7,506,763 |
| INDUSTRIALS - 0.1% | | | |
| Commercial Services & Supplies - 0.1% | | | |
| Stericycle, Inc. 2.25% (a) | | 8,300 | 755,798 |
|
| TOTAL CONVERTIBLE PREFERRED STOCKS | | | 8,274,739 |
|
| Nonconvertible Preferred Stocks - 0.0% | | | |
| INDUSTRIALS - 0.0% | | | |
| Aerospace & Defense - 0.0% | | | |
| Rolls-Royce Group PLC | | 5,293,170 | 7,803 |
| TOTAL PREFERRED STOCKS | | | |
| (Cost $7,604,650) | | | 8,282,542 |
| | | Principal Amount | Value |
|
| Convertible Bonds - 0.3% | | | |
| CONSUMER DISCRETIONARY - 0.1% | | | |
| Automobiles - 0.1% | | | |
| Tesla Motors, Inc. 1.25% 3/1/21 | | 520,000 | 476,450 |
| ENERGY - 0.1% | | | |
| Oil, Gas & Consumable Fuels - 0.1% | | | |
| Amyris, Inc.: | | | |
| 5% 10/15/18 (d) | | 519,423 | 439,234 |
| 9.5% 4/15/19 (e) | | 716,000 | 760,750 |
| Peabody Energy Corp. 4.75% 12/15/41 | | 1,050,000 | 52,500 |
| | | | 1,252,484 |
| INFORMATION TECHNOLOGY - 0.1% | | | |
| Internet Software & Services - 0.1% | | | |
| Twitter, Inc. 0.25% 9/15/19 | | 1,550,000 | 1,316,531 |
| TOTAL CONVERTIBLE BONDS | | | |
| (Cost $3,877,706) | | | 3,045,465 |
| | | Shares | Value |
|
| Money Market Funds - 0.5% | | | |
| Fidelity Cash Central Fund, 0.33% (f) | | 1,514,146 | 1,514,146 |
| Fidelity Securities Lending Cash Central Fund, 0.35% (f)(g) | | 3,782,700 | 3,782,700 |
| TOTAL MONEY MARKET FUNDS | | | |
| (Cost $5,296,846) | | | 5,296,846 |
| TOTAL INVESTMENT PORTFOLIO - 99.9% | | | |
| (Cost $819,611,344) | | | 1,014,297,668 |
| NET OTHER ASSETS (LIABILITIES) - 0.1% | | | 1,308,248 |
| NET ASSETS - 100% | | | $1,015,605,916 |
| Written Options | | | | |
| | Expiration Date/Exercise Price | Number of Contracts | Premium | Value |
| Call Options | | | | |
| Charles Schwab Corp. | 1/15/16 - $36.00 | 338 | $10,816 | $(1,690) |
| Cisco Systems, Inc. | 3/18/16 - $29.00 | 618 | 25,338 | (21,012) |
| General Electric Co. | 3/18/16 - $33.00 | 1,887 | 39,796 | (53,780) |
| Lowe's Companies, Inc. | 4/15/16 - $85.00 | 1,351 | 115,008 | (74,980) |
| Microsoft Corp. | 3/18/16 - $60.00 | 926 | 75,209 | (66,672) |
| Paychex, Inc. | 1/15/16 - $55.00 | 367 | 18,900 | (4,588) |
Verizon Comm-
unications, Inc. | 3/18/16 - $48.00 | 367 | 17,249 | (13,946) |
| TOTAL WRITTEN OPTIONS | | | $302,316 | $(236,668) |
Legend
(a) Non-income producing
(b) Security or a portion of the security is pledged as collateral for call options written. At period end, the value of securities pledged amounted to $27,717,316.
(c) Security or a portion of the security is on loan at period end.
(d) Restricted securities - Investment in securities not registered under the Securities Act of 1933 (excluding 144A issues). At the end of the period, the value of restricted securities (excluding 144A issues) amounted to $451,412 or 0.0% of net assets.
(e) Security exempt from registration under Rule 144A of the Securities Act of 1933. These securities may be resold in transactions exempt from registration, normally to qualified institutional buyers. At the end of the period, the value of these securities amounted to $760,750 or 0.1% of net assets.
(f) Affiliated fund that is generally available only to investment companies and other accounts managed by Fidelity Investments. The rate quoted is the annualized seven-day yield of the fund at period end. A complete unaudited listing of the fund's holdings as of its most recent quarter end is available upon request. In addition, each Fidelity Central Fund's financial statements, which are not covered by the Fund's Report of Independent Registered Public Accounting Firm, are available on the SEC's website or upon request.
(g) Investment made with cash collateral received from securities on loan.
Additional information on each restricted holding is as follows:
| Security | Acquisition Date | Acquisition Cost |
| Amyris, Inc. 5% 10/15/18 | 10/16/13 - 10/15/15 | $519,423 |
| NJOY, Inc. | 2/14/14 | $164,894 |
Affiliated Central Funds
Information regarding fiscal year to date income earned by the Fund from investments in Fidelity Central Funds is as follows:
| Fund | Income earned |
| Fidelity Cash Central Fund | $3,219 |
| Fidelity Securities Lending Cash Central Fund | 90,786 |
| Total | $94,005 |
Investment Valuation
The following is a summary of the inputs used, as of December 31, 2015, involving the Fund's assets and liabilities carried at fair value. The inputs or methodology used for valuing securities may not be an indication of the risk associated with investing in those securities. For more information on valuation inputs, and their aggregation into the levels used below, please refer to the Investment Valuation section in the accompanying Notes to Financial Statements.
| | Valuation Inputs at Reporting Date: |
| Description | Total | Level 1 | Level 2 | Level 3 |
| Investments in Securities: | | | | |
| Equities: | | | | |
| Consumer Discretionary | $88,895,353 | $88,883,175 | $-- | $12,178 |
| Consumer Staples | 81,658,915 | 76,641,005 | 5,017,910 | -- |
| Energy | 96,134,539 | 96,134,539 | -- | -- |
| Financials | 224,376,094 | 223,907,068 | 469,026 | -- |
| Health Care | 125,039,984 | 121,972,257 | 3,067,727 | -- |
| Industrials | 131,755,951 | 129,520,370 | 2,235,581 | -- |
| Information Technology | 212,684,918 | 209,313,543 | 3,371,375 | -- |
| Materials | 31,863,429 | 26,312,942 | 5,550,487 | -- |
| Telecommunication Services | 9,053,574 | 9,053,574 | -- | -- |
| Utilities | 4,492,600 | 4,492,600 | -- | -- |
| Corporate Bonds | 3,045,465 | -- | 3,045,465 | -- |
| Money Market Funds | 5,296,846 | 5,296,846 | -- | -- |
| Total Investments in Securities: | $1,014,297,668 | $991,527,919 | $22,757,571 | $12,178 |
| Derivative Instruments: | | | | |
| Liabilities | | | | |
| Written Options | $(236,668) | $(236,668) | $-- | $-- |
| Total Liabilities | $(236,668) | $(236,668) | $-- | $-- |
| Total Derivative Instruments: | $(236,668) | $(236,668) | $-- | $-- |
Value of Derivative Instruments
The following table is a summary of the Fund's value of derivative instruments by primary risk exposure as of December 31, 2015. For additional information on derivative instruments, please refer to the Derivative Instruments section in the accompanying Notes to Financial Statements.
| Primary Risk Exposure / Derivative Type | Value |
| | Asset | Liability |
| Equity Risk | | |
| Written Options(a) | $0 | $(236,668) |
| Total Value of Derivatives | $0 | $(236,668) |
(a) Gross value is presented in the Statement of Assets and Liabilities in the written options, at value line-item.
Other Information
Distribution of investments by country or territory of incorporation, as a percentage of Total Net Assets, is as follows (Unaudited):
| United States of America | 88.1% |
| United Kingdom | 3.7% |
| Canada | 2.9% |
| Israel | 1.5% |
| Ireland | 1.3% |
| Others (Individually Less Than 1%) | 2.5% |
| | 100.0% |
See accompanying notes which are an integral part of the financial statements.
Financial Statements
Statement of Assets and Liabilities
| | | December 31, 2015 |
| Assets | | |
Investment in securities, at value (including securities loaned of $3,613,613) — See accompanying schedule:
Unaffiliated issuers (cost $814,314,498) | $1,009,000,822 | |
| Fidelity Central Funds (cost $5,296,846) | 5,296,846 | |
| Total Investments (cost $819,611,344) | | $1,014,297,668 |
| Receivable for investments sold | | 6,746,295 |
| Receivable for fund shares sold | | 78,093 |
| Dividends receivable | | 1,544,206 |
| Interest receivable | | 24,566 |
| Distributions receivable from Fidelity Central Funds | | 8,213 |
| Prepaid expenses | | 2,284 |
| Other receivables | | 31,064 |
| Total assets | | 1,022,732,389 |
| Liabilities | | |
| Payable to custodian bank | $5,583 | |
| Payable for investments purchased | 1,710,149 | |
| Payable for fund shares redeemed | 770,047 | |
| Accrued management fee | 382,499 | |
| Distribution and service plan fees payable | 70,787 | |
| Written options, at value (premium received $302,316) | 236,668 | |
| Other affiliated payables | 100,964 | |
| Other payables and accrued expenses | 67,076 | |
| Collateral on securities loaned, at value | 3,782,700 | |
| Total liabilities | | 7,126,473 |
| Net Assets | | $1,015,605,916 |
| Net Assets consist of: | | |
| Paid in capital | | $768,021,758 |
| Distributions in excess of net investment income | | (1,915,883) |
| Accumulated undistributed net realized gain (loss) on investments and foreign currency transactions | | 54,756,031 |
| Net unrealized appreciation (depreciation) on investments and assets and liabilities in foreign currencies | | 194,744,010 |
| Net Assets | | $1,015,605,916 |
| Initial Class: | | |
| Net Asset Value, offering price and redemption price per share ($370,703,987 ÷ 19,634,890 shares) | | $18.88 |
| Service Class: | | |
| Net Asset Value, offering price and redemption price per share ($116,034,608 ÷ 6,190,124 shares) | | $18.75 |
| Service Class 2: | | |
| Net Asset Value, offering price and redemption price per share ($290,102,115 ÷ 15,644,360 shares) | | $18.54 |
| Investor Class: | | |
| Net Asset Value, offering price and redemption price per share ($238,765,206 ÷ 12,686,547 shares) | | $18.82 |
See accompanying notes which are an integral part of the financial statements.
Statement of Operations
| | | Year ended December 31, 2015 |
| Investment Income | | |
| Dividends | | $27,848,237 |
| Interest | | 161,369 |
| Income from Fidelity Central Funds | | 94,005 |
| Total income | | 28,103,611 |
| Expenses | | |
| Management fee | $4,942,770 | |
| Transfer agent fees | 944,536 | |
| Distribution and service plan fees | 914,360 | |
| Accounting and security lending fees | 362,896 | |
| Custodian fees and expenses | 58,330 | |
| Independent trustees' compensation | 4,743 | |
| Audit | 63,468 | |
| Legal | 4,617 | |
| Interest | 368 | |
| Miscellaneous | 7,859 | |
| Total expenses before reductions | 7,303,947 | |
| Expense reductions | (27,127) | 7,276,820 |
| Net investment income (loss) | | 20,826,791 |
| Realized and Unrealized Gain (Loss) | | |
| Net realized gain (loss) on: | | |
| Investment securities: | | |
| Unaffiliated issuers | 58,300,827 | |
| Foreign currency transactions | (17,691) | |
| Total net realized gain (loss) | | 58,283,136 |
Change in net unrealized appreciation (depreciation) on:
Investment securities | (104,936,007) | |
| Assets and liabilities in foreign currencies | 2,040 | |
| Written options | 65,648 | |
| Total change in net unrealized appreciation (depreciation) | | (104,868,319) |
| Net gain (loss) | | (46,585,183) |
| Net increase (decrease) in net assets resulting from operations | | $(25,758,392) |
See accompanying notes which are an integral part of the financial statements.
Statement of Changes in Net Assets
| | Year ended December 31, 2015 | Year ended December 31, 2014 |
| Increase (Decrease) in Net Assets | | |
| Operations | | |
| Net investment income (loss) | $20,826,791 | $19,521,111 |
| Net realized gain (loss) | 58,283,136 | 86,725,680 |
| Change in net unrealized appreciation (depreciation) | (104,868,319) | 1,650,297 |
| Net increase (decrease) in net assets resulting from operations | (25,758,392) | 107,897,088 |
| Distributions to shareholders from net investment income | (21,240,388) | (18,546,906) |
| Distributions to shareholders from net realized gain | (55,691,244) | (279,591) |
| Total distributions | (76,931,632) | (18,826,497) |
| Share transactions - net increase (decrease) | (13,978,089) | (15,853,447) |
| Total increase (decrease) in net assets | (116,668,113) | 73,217,144 |
| Net Assets | | |
| Beginning of period | 1,132,274,029 | 1,059,056,885 |
| End of period (including distributions in excess of net investment income of $1,915,883 and distributions in excess of net investment income of $562,690, respectively) | $1,015,605,916 | $1,132,274,029 |
See accompanying notes which are an integral part of the financial statements.
Financial Highlights — VIP Growth & Income Portfolio Initial Class
| | | | | | |
| Years ended December 31, | 2015 | 2014 | 2013 | 2012 | 2011 |
| Selected Per–Share Data | | | | | |
| Net asset value, beginning of period | $20.78 | $19.14 | $14.59 | $12.59 | $12.62 |
| Income from Investment Operations | | | | | |
| Net investment income (loss)A | .40 | .38 | .33 | .32 | .22 |
| Net realized and unrealized gain (loss) | (.86) | 1.63 | 4.55 | 2.01 | (.01) |
| Total from investment operations | (.46) | 2.01 | 4.88 | 2.33 | .21 |
| Distributions from net investment income | (.42)B | (.36) | (.33) | (.33) | (.24) |
| Distributions from net realized gain | (1.01)B | (.01) | – | (.01) | – |
| Total distributions | (1.44)C | (.37) | (.33) | (.33)D | (.24) |
| Net asset value, end of period | $18.88 | $20.78 | $19.14 | $14.59 | $12.59 |
| Total ReturnE,F | (2.27)% | 10.47% | 33.56% | 18.56% | 1.69% |
| Ratios to Average Net AssetsG,H | | | | | |
| Expenses before reductions | .56% | .57% | .57% | .59% | .59% |
| Expenses net of fee waivers, if any | .56% | .57% | .57% | .59% | .59% |
| Expenses net of all reductions | .56% | .57% | .57% | .58% | .58% |
| Net investment income (loss) | 1.99% | 1.90% | 1.92% | 2.29% | 1.76% |
| Supplemental Data | | | | | |
| Net assets, end of period (000 omitted) | $370,704 | $406,311 | $385,028 | $300,330 | $262,594 |
| Portfolio turnover rateI | 35% | 45% | 48% | 54% | 126% |
A Calculated based on average shares outstanding during the period.
B The amounts shown reflect certain reclassifications related to book to tax differences that were made in the year shown.
C Total distributions of $1.44 per share is comprised of distributions from net investment income of $.422 and distributions from net realized gain of $1.013 per share.
D Total distributions of $.33 per share is comprised of distributions from net investment income of $.327 and distributions from net realized gain of $.007 per share.
E Total returns do not reflect charges attributable to your insurance company's separate account. Inclusion of these charges would reduce the total returns shown.
F Total returns would have been lower if certain expenses had not been reduced during the applicable periods shown.
G Fees and expenses of any underlying Fidelity Central Funds are not included in the Fund's expense ratio. The Fund indirectly bears its proportionate share of the expenses of any underlying Fidelity Central Funds.
H Expense ratios reflect operating expenses of the class. Expenses before reductions do not reflect amounts reimbursed by the investment adviser or reductions from brokerage service arrangements or reductions from other expense offset arrangements and do not represent the amount paid by the class during periods when reimbursements or reductions occur. Expenses net of fee waivers reflect expenses after reimbursement by the investment adviser but prior to reductions from brokerage service arrangements or other expense offset arrangements. Expenses net of all reductions represent the net expenses paid by the class.
I Amount does not include the portfolio activity of any underlying Fidelity Central Funds.
See accompanying notes which are an integral part of the financial statements.
Financial Highlights — VIP Growth & Income Portfolio Service Class
| | | | | | |
| Years ended December 31, | 2015 | 2014 | 2013 | 2012 | 2011 |
| Selected Per–Share Data | | | | | |
| Net asset value, beginning of period | $20.64 | $19.01 | $14.49 | $12.51 | $12.54 |
| Income from Investment Operations | | | | | |
| Net investment income (loss)A | .37 | .36 | .31 | .31 | .21 |
| Net realized and unrealized gain (loss) | (.85) | 1.62 | 4.53 | 1.99 | (.02) |
| Total from investment operations | (.48) | 1.98 | 4.84 | 2.30 | .19 |
| Distributions from net investment income | (.40)B | (.34) | (.32) | (.31) | (.22) |
| Distributions from net realized gain | (1.01)B | (.01) | – | (.01) | – |
| Total distributions | (1.41) | (.35) | (.32) | (.32) | (.22) |
| Net asset value, end of period | $18.75 | $20.64 | $19.01 | $14.49 | $12.51 |
| Total ReturnC,D | (2.35)% | 10.39% | 33.46% | 18.40% | 1.57% |
| Ratios to Average Net AssetsE,F | | | | | |
| Expenses before reductions | .66% | .66% | .67% | .68% | .69% |
| Expenses net of fee waivers, if any | .66% | .66% | .67% | .68% | .69% |
| Expenses net of all reductions | .66% | .66% | .67% | .67% | .68% |
| Net investment income (loss) | 1.89% | 1.80% | 1.82% | 2.19% | 1.66% |
| Supplemental Data | | | | | |
| Net assets, end of period (000 omitted) | $116,035 | $135,893 | $139,248 | $118,185 | $121,871 |
| Portfolio turnover rateG | 35% | 45% | 48% | 54% | 126% |
A Calculated based on average shares outstanding during the period.
B The amounts shown reflect certain reclassifications related to book to tax differences that were made in the year shown.
C Total returns do not reflect charges attributable to your insurance company's separate account. Inclusion of these charges would reduce the total returns shown.
D Total returns would have been lower if certain expenses had not been reduced during the applicable periods shown.
E Fees and expenses of any underlying Fidelity Central Funds are not included in the Fund's expense ratio. The Fund indirectly bears its proportionate share of the expenses of any underlying Fidelity Central Funds.
F Expense ratios reflect operating expenses of the class. Expenses before reductions do not reflect amounts reimbursed by the investment adviser or reductions from brokerage service arrangements or reductions from other expense offset arrangements and do not represent the amount paid by the class during periods when reimbursements or reductions occur. Expenses net of fee waivers reflect expenses after reimbursement by the investment adviser but prior to reductions from brokerage service arrangements or other expense offset arrangements. Expenses net of all reductions represent the net expenses paid by the class.
G Amount does not include the portfolio activity of any underlying Fidelity Central Funds.
See accompanying notes which are an integral part of the financial statements.
Financial Highlights — VIP Growth & Income Portfolio Service Class 2
| | | | | | |
| Years ended December 31, | 2015 | 2014 | 2013 | 2012 | 2011 |
| Selected Per–Share Data | | | | | |
| Net asset value, beginning of period | $20.43 | $18.82 | $14.35 | $12.39 | $12.43 |
| Income from Investment Operations | | | | | |
| Net investment income (loss)A | .34 | .32 | .28 | .28 | .19 |
| Net realized and unrealized gain (loss) | (.85) | 1.61 | 4.48 | 1.98 | (.03) |
| Total from investment operations | (.51) | 1.93 | 4.76 | 2.26 | .16 |
| Distributions from net investment income | (.37)B | (.31) | (.29) | (.29) | (.20) |
| Distributions from net realized gain | (1.01)B | (.01) | – | (.01) | – |
| Total distributions | (1.38) | (.32) | (.29) | (.30) | (.20) |
| Net asset value, end of period | $18.54 | $20.43 | $18.82 | $14.35 | $12.39 |
| Total ReturnC,D | (2.54)% | 10.23% | 33.25% | 18.25% | 1.36% |
| Ratios to Average Net AssetsE,F | | | | | |
| Expenses before reductions | .81% | .81% | .82% | .83% | .84% |
| Expenses net of fee waivers, if any | .81% | .81% | .82% | .83% | .84% |
| Expenses net of all reductions | .81% | .81% | .82% | .82% | .83% |
| Net investment income (loss) | 1.74% | 1.65% | 1.67% | 2.04% | 1.51% |
| Supplemental Data | | | | | |
| Net assets, end of period (000 omitted) | $290,102 | $330,608 | $342,586 | $285,693 | $273,491 |
| Portfolio turnover rateG | 35% | 45% | 48% | 54% | 126% |
A Calculated based on average shares outstanding during the period.
B The amounts shown reflect certain reclassifications related to book to tax differences that were made in the year shown.
C Total returns do not reflect charges attributable to your insurance company's separate account. Inclusion of these charges would reduce the total returns shown.
D Total returns would have been lower if certain expenses had not been reduced during the applicable periods shown.
E Fees and expenses of any underlying Fidelity Central Funds are not included in the Fund's expense ratio. The Fund indirectly bears its proportionate share of the expenses of any underlying Fidelity Central Funds.
F Expense ratios reflect operating expenses of the class. Expenses before reductions do not reflect amounts reimbursed by the investment adviser or reductions from brokerage service arrangements or reductions from other expense offset arrangements and do not represent the amount paid by the class during periods when reimbursements or reductions occur. Expenses net of fee waivers reflect expenses after reimbursement by the investment adviser but prior to reductions from brokerage service arrangements or other expense offset arrangements. Expenses net of all reductions represent the net expenses paid by the class.
G Amount does not include the portfolio activity of any underlying Fidelity Central Funds.
See accompanying notes which are an integral part of the financial statements.
Financial Highlights — VIP Growth & Income Portfolio Investor Class
| | | | | | |
| Years ended December 31, | 2015 | 2014 | 2013 | 2012 | 2011 |
| Selected Per–Share Data | | | | | |
| Net asset value, beginning of period | $20.71 | $19.09 | $14.55 | $12.56 | $12.60 |
| Income from Investment Operations | | | | | |
| Net investment income (loss)A | .38 | .36 | .32 | .31 | .21 |
| Net realized and unrealized gain (loss) | (.85) | 1.62 | 4.54 | 2.01 | (.02) |
| Total from investment operations | (.47) | 1.98 | 4.86 | 2.32 | .19 |
| Distributions from net investment income | (.40)B | (.35) | (.32) | (.32) | (.23) |
| Distributions from net realized gain | (1.01)B | (.01) | – | (.01) | – |
| Total distributions | (1.42)C | (.36) | (.32) | (.33) | (.23) |
| Net asset value, end of period | $18.82 | $20.71 | $19.09 | $14.55 | $12.56 |
| Total ReturnD,E | (2.32)% | 10.33% | 33.52% | 18.46% | 1.53% |
| Ratios to Average Net AssetsF,G | | | | | |
| Expenses before reductions | .64% | .65% | .65% | .67% | .68% |
| Expenses net of fee waivers, if any | .64% | .65% | .65% | .67% | .68% |
| Expenses net of all reductions | .64% | .64% | .65% | .66% | .67% |
| Net investment income (loss) | 1.91% | 1.82% | 1.84% | 2.20% | 1.67% |
| Supplemental Data | | | | | |
| Net assets, end of period (000 omitted) | $238,765 | $259,462 | $192,195 | $95,689 | $66,364 |
| Portfolio turnover rateH | 35% | 45% | 48% | 54% | 126% |
A Calculated based on average shares outstanding during the period.
B The amounts shown reflect certain reclassifications related to book to tax differences that were made in the year shown.
C Total distributions of $1.42 per share is comprised of distributions from net investment income of $.404 and distributions from net realized gain of $1.013 per share.
D Total returns do not reflect charges attributable to your insurance company's separate account. Inclusion of these charges would reduce the total returns shown.
E Total returns would have been lower if certain expenses had not been reduced during the applicable periods shown.
F Fees and expenses of any underlying Fidelity Central Funds are not included in the Fund's expense ratio. The Fund indirectly bears its proportionate share of the expenses of any underlying Fidelity Central Funds.
G Expense ratios reflect operating expenses of the class. Expenses before reductions do not reflect amounts reimbursed by the investment adviser or reductions from brokerage service arrangements or reductions from other expense offset arrangements and do not represent the amount paid by the class during periods when reimbursements or reductions occur. Expenses net of fee waivers reflect expenses after reimbursement by the investment adviser but prior to reductions from brokerage service arrangements or other expense offset arrangements. Expenses net of all reductions represent the net expenses paid by the class.
H Amount does not include the portfolio activity of any underlying Fidelity Central Funds.
See accompanying notes which are an integral part of the financial statements.
Notes to Financial Statements
For the period ended December 31, 2015
1. Organization.
VIP Growth & Income Portfolio (the Fund) is a fund of Variable Insurance Products Fund III (the Trust) and is authorized to issue an unlimited number of shares. The Trust is registered under the Investment Company Act of 1940, as amended (the 1940 Act), as an open-end management investment company organized as a Massachusetts business trust. Shares of the Fund may only be purchased by insurance companies for the purpose of funding variable annuity or variable life insurance contracts. The Fund offers the following classes of shares: Initial Class shares, Service Class shares, Service Class 2 shares and Investor Class shares. All classes have equal rights and voting privileges, except for matters affecting a single class.
2. Investments in Fidelity Central Funds.
The Fund invests in Fidelity Central Funds, which are open-end investment companies generally available only to other investment companies and accounts managed by the investment adviser and its affiliates. The Fund's Schedule of Investments lists each of the Fidelity Central Funds held as of period end, if any, as an investment of the Fund, but does not include the underlying holdings of each Fidelity Central Fund. As an Investing Fund, the Fund indirectly bears its proportionate share of the expenses of the underlying Fidelity Central Funds.
The Money Market Central Funds seek preservation of capital and current income and are managed by Fidelity Investments Money Management, Inc. (FIMM), an affiliate of the investment adviser. Annualized expenses of the Money Market Central Funds as of their most recent shareholder report date are less than .005%.
A complete unaudited list of holdings for each Fidelity Central Fund is available upon request or at the Securities and Exchange Commission (the SEC) website at www.sec.gov. In addition, the financial statements of the Fidelity Central Funds, which are not covered by the Fund's Report of Independent Registered Public Accounting Firm, are available on the SEC website or upon request.
3. Significant Accounting Policies.
The financial statements have been prepared in conformity with accounting principles generally accepted in the United States of America (GAAP), which require management to make certain estimates and assumptions at the date of the financial statements. Actual results could differ from those estimates. Subsequent events, if any, through the date that the financial statements were issued have been evaluated in the preparation of the financial statements. The following summarizes the significant accounting policies of the Fund:
Investment Valuation. Investments are valued as of 4:00 p.m. Eastern time on the last calendar day of the period. The Board of Trustees (the Board) has delegated the day to day responsibility for the valuation of the Fund's investments to the Fidelity Management & Research Company (FMR) Fair Value Committee (the Committee). In accordance with valuation policies and procedures approved by the Board, the Fund attempts to obtain prices from one or more third party pricing vendors or brokers to value its investments. When current market prices, quotations or currency exchange rates are not readily available or reliable, investments will be fair valued in good faith by the Committee, in accordance with procedures adopted by the Board. Factors used in determining fair value vary by investment type and may include market or investment specific events, changes in interest rates and credit quality. The frequency with which these procedures are used cannot be predicted and they may be utilized to a significant extent. The Committee oversees the Fund's valuation policies and procedures and reports to the Board on the Committee's activities and fair value determinations. The Board monitors the appropriateness of the procedures used in valuing the Fund's investments and ratifies the fair value determinations of the Committee.
The Fund categorizes the inputs to valuation techniques used to value its investments into a disclosure hierarchy consisting of three levels as shown below:
- Level 1 – quoted prices in active markets for identical investments
- Level 2 – other significant observable inputs (including quoted prices for similar investments, interest rates, prepayment speeds, etc.)
- Level 3 – unobservable inputs (including the Fund's own assumptions based on the best information available)
Valuation techniques used to value the Fund's investments by major category are as follows:
Equity securities, including restricted securities, for which market quotations are readily available, are valued at the last reported sale price or official closing price as reported by a third party pricing vendor on the primary market or exchange on which they are traded and are categorized as Level 1 in the hierarchy. In the event there were no sales during the day or closing prices are not available, securities are valued at the last quoted bid price or may be valued using the last available price and are generally categorized as Level 2 in the hierarchy. For foreign equity securities, when market or security specific events arise, comparisons to the valuation of American Depositary Receipts (ADRs), futures contracts, Exchange-Traded Funds (ETFs) and certain indexes as well as quoted prices for similar securities may be used and would be categorized as Level 2 in the hierarchy. Utilizing these techniques may result in transfers between Level 1 and Level 2. For equity securities, including restricted securities, where observable inputs are limited, assumptions about market activity and risk are used and these securities may be categorized as Level 3 in the hierarchy.
Debt securities, including restricted securities, are valued based on evaluated prices received from third party pricing vendors or from brokers who make markets in such securities. Corporate bonds are valued by pricing vendors who utilize matrix pricing which considers prepayment speed assumptions, attributes of the collateral, yield or price of bonds of comparable quality, coupon, maturity and type or by broker-supplied prices. When independent prices are unavailable or unreliable, debt securities may be valued utilizing pricing methodologies which consider similar factors that would be used by third party pricing vendors. Debt securities are generally categorized as Level 2 in the hierarchy but may be Level 3 depending on the circumstances.
Exchange-traded options are valued using the last sale price or, in the absence of a sale, the last offering price and are categorized as Level 1 in the hierarchy.
Investments in open-end mutual funds, including the Fidelity Central Funds, are valued at their closing net asset value (NAV) each business day and are categorized as Level 1 in the hierarchy.
Changes in valuation techniques may result in transfers in or out of an assigned level within the disclosure hierarchy. The aggregate value of investments by input level as of December 31, 2015, is included at the end of the Fund's Schedule of Investments.
Foreign Currency. The Fund may use foreign currency contracts to facilitate transactions in foreign-denominated securities. Gains and losses from these transactions may arise from changes in the value of the foreign currency or if the counterparties do not perform under the contracts' terms.
Foreign-denominated assets, including investment securities, and liabilities are translated into U.S. dollars at the exchange rates at period end. Purchases and sales of investment securities, income and dividends received and expenses denominated in foreign currencies are translated into U.S. dollars at the exchange rate in effect on the transaction date.
The effects of exchange rate fluctuations on investments are included with the net realized and unrealized gain (loss) on investment securities. Other foreign currency transactions resulting in realized and unrealized gain (loss) are disclosed separately.
Investment Transactions and Income. For financial reporting purposes, the Fund's investment holdings and NAV include trades executed through the end of the last business day of the period. The NAV per share for processing shareholder transactions is calculated as of the close of business of the New York Stock Exchange (NYSE), normally 4:00 p.m. Eastern time and includes trades executed through the end of the prior business day. Gains and losses on securities sold are determined on the basis of identified cost and may include proceeds received from litigation. Dividend income is recorded on the ex-dividend date, except for certain dividends from foreign securities where the ex-dividend date may have passed, which are recorded as soon as the Fund is informed of the ex-dividend date. Non-cash dividends included in dividend income, if any, are recorded at the fair market value of the securities received. Income and capital gain distributions from Fidelity Central Funds, if any, are recorded on the ex-dividend date. Distributions received on securities that represent a return of capital or capital gain are recorded as a reduction of cost of investments and/or as a realized gain. Subsequent to ex-dividend date the Fund determines the components of these distributions, based upon receipt of tax filings or other correspondence relating to the underlying investment. Interest income is accrued as earned and includes coupon interest and amortization of premium and accretion of discount on debt securities as applicable. Investment income is recorded net of foreign taxes withheld where recovery of such taxes is uncertain. Debt obligations may be placed on non-accrual status and related interest income may be reduced by ceasing current accruals and writing off interest receivables when the collection of all or a portion of interest has become doubtful based on consistently applied procedures. A debt obligation is removed from non-accrual status when the issuer resumes interest payments or when collectability of interest is reasonably assured.
Class Allocations and Expenses. Investment income, realized and unrealized capital gains and losses, common expenses of the Fund, and certain fund-level expense reductions, if any, are allocated daily on a pro-rata basis to each class based on the relative net assets of each class to the total net assets of the Fund. Each class differs with respect to transfer agent and distribution and service plan fees incurred. Certain expense reductions may also differ by class. For the reporting period, the allocated portion of income and expenses to each class as a percent of its average net assets may vary due to the timing of recording these transactions in relation to fluctuating net assets of the classes. Expenses directly attributable to a fund are charged to that fund. Expenses attributable to more than one fund are allocated among the respective funds on the basis of relative net assets or other appropriate methods. Expense estimates are accrued in the period to which they relate and adjustments are made when actual amounts are known.
Income Tax Information and Distributions to Shareholders. Each year, the Fund intends to qualify as a regulated investment company under Subchapter M of the Internal Revenue Code, including distributing substantially all of its taxable income and realized gains. As a result, no provision for U.S. Federal income taxes is required. As of December 31, 2015, the Fund did not have any unrecognized tax benefits in the financial statements; nor is the Fund aware of any tax positions for which it is reasonably possible that the total amounts of unrecognized tax benefits will significantly change in the next twelve months. The Fund files a U.S. federal tax return, in addition to state and local tax returns as required. The Fund's federal income tax returns are subject to examination by the Internal Revenue Service (IRS) for a period of three fiscal years after they are filed. State and local tax returns may be subject to examination for an additional fiscal year depending on the jurisdiction. Foreign taxes are provided for based on the Fund's understanding of the tax rules and rates that exist in the foreign markets in which it invests.
Distributions are declared and recorded on the ex-dividend date. Income dividends and capital gain distributions are declared separately for each class. Income and capital gain distributions are determined in accordance with income tax regulations, which may differ from GAAP. These differences resulted in distribution reclassifications.
Capital accounts within the financial statements are adjusted for permanent book-tax differences. These adjustments have no impact on net assets or the results of operations. Capital accounts are not adjusted for temporary book-tax differences which will reverse in a subsequent period.
Book-tax differences are primarily due to foreign currency transactions, market discount, certain conversion ratio adjustments, partnerships and losses deferred due to wash sales and excise tax regulations.
The federal tax cost of investment securities and unrealized appreciation (depreciation) as of period end were as follows:
| Gross unrealized appreciation | $262,782,937 |
| Gross unrealized depreciation | (71,836,970) |
| Net unrealized appreciation (depreciation) on securities | $190,945,967 |
| Tax Cost | $823,351,701 |
The tax-based components of distributable earnings as of period end were as follows:
| Undistributed long-term capital gain | $60,864,749 |
| Net unrealized appreciation (depreciation) on securities and other investments | $191,003,653 |
The Fund intends to elect to defer to its next fiscal year $129,223 of currency losses recognized during the period November 1 2015 to December 31, 2015. The Fund intends to elect to defer to its next fiscal year $2,324,318 of capital losses recognized during the period November 1, 2015 to December 31, 2015.
The tax character of distributions paid was as follows:
| | December 31, 2015 | December 31, 2014 |
| Ordinary Income | $23,175,989 | $ 18,826,497 |
| Long-term Capital Gains | 53,755,643 | – |
| Total | $76,931,632 | $ 18,826,497 |
Restricted Securities. The Fund may invest in securities that are subject to legal or contractual restrictions on resale. These securities generally may be resold in transactions exempt from registration or to the public if the securities are registered. Disposal of these securities may involve time-consuming negotiations and expense, and prompt sale at an acceptable price may be difficult. Information regarding restricted securities is included at the end of the Fund's Schedule of Investments.
4. Derivative Instruments.
Risk Exposures and the Use of Derivative Instruments. The Fund's investment objective allows the Fund to enter into various types of derivative contracts, including options. Derivatives are investments whose value is primarily derived from underlying assets, indices or reference rates and may be transacted on an exchange or over-the-counter (OTC). Derivatives may involve a future commitment to buy or sell a specified asset based on specified terms, to exchange future cash flows at periodic intervals based on a notional principal amount, or for one party to make one or more payments upon the occurrence of specified events in exchange for periodic payments from the other party.
The Fund used derivatives to increase returns and to manage exposure to certain risks as defined below. The success of any strategy involving derivatives depends on analysis of numerous economic factors, and if the strategies for investment do not work as intended, the Fund may not achieve its objectives.
The Fund's use of derivatives increased or decreased its exposure to the following risk:
| Equity Risk | Equity risk relates to the fluctuations in the value of financial instruments as a result of changes in market prices (other than those arising from interest rate risk or foreign exchange risk), whether caused by factors specific to an individual investment, its issuer, or all factors affecting all instruments traded in a market or market segment.
|
The Fund is also exposed to additional risks from investing in derivatives, such as liquidity risk and counterparty credit risk. Liquidity risk is the risk that the Fund will be unable to close out the derivative in the open market in a timely manner. Counterparty credit risk is the risk that the counterparty will not be able to fulfill its obligation to the Fund. Counterparty credit risk related to exchange-traded options may be mitigated by the protection provided by the exchange on which they trade.
Investing in derivatives may involve greater risks than investing in the underlying assets directly and, to varying degrees, may involve risk of loss in excess of any initial investment and collateral received and amounts recognized in the Statement of Assets and Liabilities. In addition, there may be the risk that the change in value of the derivative contract does not correspond to the change in value of the underlying instrument.
Options. Options give the purchaser the right, but not the obligation, to buy (call) or sell (put) an underlying security or financial instrument at an agreed exercise or strike price between or on certain dates. Options obligate the seller (writer) to buy (put) or sell (call) an underlying instrument at the exercise or strike price or cash settle an underlying derivative instrument if the holder exercises the option on or before the expiration date.
The Fund used exchange-traded written covered call options to manage its exposure to the market. When the Fund writes a covered call option, the Fund holds the underlying instrument which must be delivered to the holder upon the exercise of the option.
Upon entering into a written options contract, the Fund will receive a premium. Premiums received are reflected as a liability on the Statement of Assets and Liabilities. Options are valued daily and any unrealized appreciation (depreciation) is reflected on the Statement of Assets and Liabilities. When a written option is exercised, the premium is added to the proceeds from the sale of the underlying instrument in determining the gain or loss realized on that investment. When an option is closed the Fund will realize a gain or loss depending on whether the proceeds or amount paid for the closing sale transaction are greater or less than the premium received. When an option expires, gains and losses are realized to the extent of premiums received. The net realized gain (loss) on closed and expired written options and the change in net unrealized appreciation (depreciation) on written options are reflected separately on the Statement of Operations.
Writing call options tends to decrease exposure to the underlying instrument and risk of loss is the change in value in excess of the premium received.
Any open options at period end are presented in the Schedule of Investments under the caption "Written Options."
During the period, the Fund recognized a change in net unrealized appreciation (depreciation) of $65,648 related to its investment in written options. This amount is included in the Statement of Operations.
The following is a summary of the Fund written options activity:
| Written Options | Number of Contracts | Amount of Premiums |
| Outstanding at beginning of period | - | $- |
| Options Opened | 5,854 | 302,316 |
| Options Exercised | - | - |
| Options Closed | - | - |
| Options Expired | - | - |
| Outstanding at end of period | 5,854 | $ 302,316 |
5. Purchases and Sales of Investments.
Purchases and sales of securities, other than short-term securities, aggregated $378,441,422 and $451,399,437, respectively.
6. Fees and Other Transactions with Affiliates.
Management Fee. Fidelity Management & Research Company (the investment adviser) and its affiliates provide the Fund with investment management related services for which the Fund pays a monthly management fee. The management fee is the sum of an individual fund fee rate that is based on an annual rate of .20% of the Fund's average net assets and an annualized group fee rate that averaged .25% during the period. The group fee rate is based upon the average net assets of all the mutual funds advised by the investment adviser, including any mutual funds previously advised by the investment adviser that are currently advised by Fidelity SelectCo, LLC, an affiliate of the investment adviser. The group fee rate decreases as assets under management increase and increases as assets under management decrease. For the reporting period, the total annual management fee rate was .45% of the Fund's average net assets.
Distribution and Service Plan Fees. In accordance with Rule 12b-1 of the 1940 Act, the Fund has adopted separate 12b-1 Plans for each Service Class of shares. Each Service Class pays Fidelity Distributors Corporation (FDC), an affiliate of the investment adviser, a service fee. For the period, the service fee is based on an annual rate of .10% of Service Class' average net assets and .25% of Service Class 2's average net assets.
For the period, total fees, all of which were re-allowed to insurance companies for the distribution of shares and providing shareholder support services, were as follows:
| Service Class | $128,242 |
| Service Class 2 | 786,118 |
| | $914,360 |
Transfer Agent Fees. Fidelity Investments Institutional Operations Company, Inc. (FIIOC), an affiliate of the investment adviser, is the Fund's transfer, dividend disbursing, and shareholder servicing agent. FIIOC receives an asset-based fee with respect to each class. Each class (with the exception of Investor Class) pays a fee for transfer agent services, typesetting, printing and mailing of shareholder reports, excluding mailing of proxy statements and out of pocket expenses, equal to an annual rate of .07% (.15% for Investor Class) of class-level average net assets. For the period, transfer agent fees for each class, including out of pocket expenses, were as follows:
| Initial Class | $266,191 |
| Service Class | 84,993 |
| Service Class 2 | 208,419 |
| Investor Class | 384,933 |
| | $944,536 |
Accounting and Security Lending Fees. Fidelity Service Company, Inc. (FSC), an affiliate of the investment adviser, maintains the Fund's accounting records. The accounting fee is based on the level of average net assets for each month. Under a separate contract, FSC administers the security lending program. The security lending fee is based on the number and duration of lending transactions.
Brokerage Commissions. The Fund placed a portion of its portfolio transactions with brokerage firms which are affiliates of the investment adviser. Brokerage commissions are included in net realized gain (loss) and change in net unrealized appreciation (depreciation) in the Statement of Operations. The commissions paid to these affiliated firms were $6,837 for the period.
Interfund Lending Program. Pursuant to an Exemptive Order issued by the SEC, the Fund, along with other registered investment companies having management contracts with Fidelity Management & Research Company (FMR) or other affiliated entities of FMR, may participate in an interfund lending program. This program provides an alternative credit facility allowing the funds to borrow from, or lend money to, other participating affiliated funds. At period end, there were no interfund loans outstanding. The Fund's activity in this program during the period for which loans were outstanding was as follows:
| Borrower or Lender | Average Loan Balance | Weighted Average Interest Rate | Interest Expense |
| Borrower | $7,884,200 | .34% | $368 |
Interfund Trades. The Fund may purchase from or sell securities to other Fidelity Funds under procedures adopted by the Board. The procedures have been designed to ensure these interfund trades are executed in accordance with Rule 17a-7 of the 1940 Act. Interfund trades are included within the respective purchases and sales amounts shown in the Purchases and Sales of Investments note.
Other. During the period, the investment adviser reimbursed the Fund for certain losses in the amount of $9,676.
7. Committed Line of Credit.
The Fund participates with other funds managed by the investment adviser or an affiliate in a $4.25 billion credit facility (the "line of credit") to be utilized for temporary or emergency purposes to fund shareholder redemptions or for other short-term liquidity purposes. The Fund has agreed to pay commitment fees on its pro-rata portion of the line of credit, which amounted to $1,616 and is reflected in Miscellaneous expenses on the Statement of Operations. During the period, the Fund did not borrow on this line of credit.
8. Security Lending.
The Fund lends portfolio securities through a lending agent from time to time in order to earn additional income. For equity securities, a lending agent is used and may loan securities to certain qualified borrowers, including Fidelity Capital Markets (FCM), a broker-dealer affiliated with the Fund. On the settlement date of the loan, the Fund receives collateral (in the form of U.S. Treasury obligations, letters of credit and/or cash) against the loaned securities and maintains collateral in an amount not less than 100% of the market value of the loaned securities during the period of the loan. The market value of the loaned securities is determined at the close of business of the Fund and any additional required collateral is delivered to the Fund on the next business day. The Fund or borrower may terminate the loan at any time, and if the borrower defaults on its obligation to return the securities loaned because of insolvency or other reasons, the Fund may apply collateral received from the borrower against the obligation. The Fund may experience delays and costs in recovering the securities loaned. Any cash collateral received is invested in the Fidelity Securities Lending Cash Central Fund. The value of loaned securities and cash collateral at period end are disclosed on the Fund's Statement of Assets and Liabilities. Security lending income represents the income earned on investing cash collateral, less rebates paid to borrowers and any lending agent fees associated with the loan, plus any premium payments received for lending certain types of securities. Security lending income is presented in the Statement of Operations as a component of income from Fidelity Central Funds. Total security lending income during the period amounted to $90,786. During the period, there were no securities loaned to FCM.
9. Expense Reductions.
Commissions paid to certain brokers with whom the investment adviser, or its affiliates, places trades on behalf of the Fund include an amount in addition to trade execution, which may be rebated back to the Fund to offset certain expenses. This amount totaled $17,847 for the period.
In addition, during the period the investment adviser reimbursed and/or waived a portion of fund-level operating expenses in the amount of $4,529 and a portion of class-level operating expenses as follows:
| | Amount |
| Investor Class | $4,751 |
10. Distributions to Shareholders.
Distributions to shareholders of each class were as follows:
| Years ended December 31, | 2015 | 2014 |
| From net investment income | | |
| Initial Class | $8,108,227 | $7,006,062 |
| Service Class | 2,442,137 | 2,225,654 |
| Service Class 2 | 5,676,695 | 4,998,465 |
| Investor Class | 5,013,329 | 4,316,725 |
| Total | $21,240,388 | $18,546,906 |
| From net realized gain | | |
| Initial Class | $20,144,244 | $100,836 |
| Service Class | 6,583,614 | 36,213 |
| Service Class 2 | 16,214,130 | 89,771 |
| Investor Class | 12,749,256 | 52,771 |
| Total | $55,691,244 | $279,591 |
11. Share Transactions.
Transactions for each class of shares were as follows:
| | Shares | Shares | Dollars | Dollars |
| Years ended December 31, | 2015 | 2014 | 2015 | 2014 |
| Initial Class | | | | |
| Shares sold | 2,224,516 | 1,921,159 | $44,215,071 | $38,003,861 |
| Reinvestment of distributions | 1,463,958 | 338,450 | 28,252,471 | 7,106,898 |
| Shares redeemed | (3,609,006) | (2,820,948) | (71,552,420) | (56,569,620) |
| Net increase (decrease) | 79,468 | (561,339) | $915,122 | $(11,458,861) |
| Service Class | | | | |
| Shares sold | 95,204 | 188,864 | $1,878,780 | $3,738,321 |
| Reinvestment of distributions | 470,573 | 108,466 | 9,025,751 | 2,261,867 |
| Shares redeemed | (960,795) | (1,036,119) | (18,920,023) | (20,453,726) |
| Net increase (decrease) | (395,018) | (738,789) | $(8,015,492) | $(14,453,538) |
| Service Class 2 | | | | |
| Shares sold | 972,488 | 926,498 | $18,999,506 | $18,185,010 |
| Reinvestment of distributions | 1,153,123 | 246,534 | 21,890,825 | 5,088,236 |
| Shares redeemed | (2,666,199) | (3,187,223) | (52,033,114) | (62,282,116) |
| Net increase (decrease) | (540,588) | (2,014,191) | $(11,142,783) | $(39,008,870) |
| Investor Class | | | | |
| Shares sold | 1,948,446 | 3,392,487 | $38,591,195 | $67,277,360 |
| Reinvestment of distributions | 923,421 | 208,620 | 17,762,585 | 4,369,496 |
| Shares redeemed | (2,711,566) | (1,144,651) | (52,088,716) | (22,579,034) |
| Net increase (decrease) | 160,301 | 2,456,456 | $4,265,064 | $49,067,822 |
12. Other.
The Fund's organizational documents provide former and current trustees and officers with a limited indemnification against liabilities arising in connection with the performance of their duties to the Fund. In the normal course of business, the Fund may also enter into contracts that provide general indemnifications. The Fund's maximum exposure under these arrangements is unknown as this would be dependent on future claims that may be made against the Fund. The risk of material loss from such claims is considered remote.
At the end of the period, the investment adviser or its affiliates were the owners of record of 29% of the total outstanding shares of the Fund and one otherwise unaffiliated shareholder was the owner of record of 26% of the total outstanding of the Fund.
Mutual funds managed by the investment adviser or its affiliates were the owners of record, in the aggregate of approximately 22% of the total outstanding shares of the Fund.
Report of Independent Registered Public Accounting Firm
To the Trustees of Variable Insurance Products Fund III and Shareholders of VIP Growth & Income Portfolio:
We have audited the accompanying statement of assets and liabilities of VIP Growth & Income Portfolio (the Fund), a fund of Variable Insurance Products Fund III, including the schedule of investments, as of December 31, 2015, and the related statement of operations for the year then ended, the statement of changes in net assets for each of the two years in the period then ended, and the financial highlights for each of the five years in the period then ended. These financial statements and financial highlights are the responsibility of the Fund's management. Our responsibility is to express an opinion on these financial statements and financial highlights based on our audits.
We conducted our audits in accordance with the standards of the Public Company Accounting Oversight Board (United States). Those standards require that we plan and perform the audit to obtain reasonable assurance about whether the financial statements and financial highlights are free of material misstatement. The Fund is not required to have, nor were we engaged to perform, an audit of its internal control over financial reporting. Our audits included consideration of internal control over financial reporting as a basis for designing audit procedures that are appropriate in the circumstances, but not for the purpose of expressing an opinion on the effectiveness of the Fund's internal control over financial reporting. Accordingly, we express no such opinion. An audit also includes examining, on a test basis, evidence supporting the amounts and disclosures in the financial statements, assessing the accounting principles used and significant estimates made by management, as well as evaluating the overall financial statement presentation. Our procedures included confirmation of securities owned as of December 31, 2015, by correspondence with the custodians and brokers; when replies were not received from brokers, we performed other auditing procedures. We believe that our audits provide a reasonable basis for our opinion.
In our opinion, such financial statements and financial highlights referred to above present fairly, in all material respects, the financial position of VIP Growth & Income Portfolio as of December 31, 2015, the results of its operations for the year then ended, the changes in its net assets for each of the two years in the period then ended, and the financial highlights for each of the five years in the period then ended, in conformity with accounting principles generally accepted in the United States of America.
DELOITTE & TOUCHE LLP
Boston, Massachusetts
February 16, 2016
Trustees and Officers
The Trustees, Members of the Advisory Board (if any), and officers of the trust and fund, as applicable, are listed below. The Board of Trustees governs the fund and is responsible for protecting the interests of shareholders. The Trustees are experienced executives who meet periodically throughout the year to oversee the fund's activities, review contractual arrangements with companies that provide services to the fund, oversee management of the risks associated with such activities and contractual arrangements, and review the fund's performance. Each of the Trustees oversees 170 funds.
The Trustees hold office without limit in time except that (a) any Trustee may resign; (b) any Trustee may be removed by written instrument, signed by at least two-thirds of the number of Trustees prior to such removal; (c) any Trustee who requests to be retired or who has become incapacitated by illness or injury may be retired by written instrument signed by a majority of the other Trustees; and (d) any Trustee may be removed at any special meeting of shareholders by a two-thirds vote of the outstanding voting securities of the trust. Each Trustee who is not an interested person (as defined in the 1940 Act) of the trust and the fund is referred to herein as an Independent Trustee. Each Independent Trustee shall retire not later than the last day of the calendar year in which his or her 75th birthday occurs. The Independent Trustees may waive this mandatory retirement age policy with respect to individual Trustees. Officers and Advisory Board Members hold office without limit in time, except that any officer or Advisory Board Member may resign or may be removed by a vote of a majority of the Trustees at any regular meeting or any special meeting of the Trustees. Except as indicated, each individual has held the office shown or other offices in the same company for the past five years.
The fund’s Statement of Additional Information (SAI) includes more information about the Trustees. To request a free copy, call Fidelity at 1-877-208-0098.
Experience, Skills, Attributes, and Qualifications of the Trustees. The Governance and Nominating Committee has adopted a statement of policy that describes the experience, qualifications, attributes, and skills that are necessary and desirable for potential Independent Trustee candidates (Statement of Policy). The Board believes that each Trustee satisfied at the time he or she was initially elected or appointed a Trustee, and continues to satisfy, the standards contemplated by the Statement of Policy. The Governance and Nominating Committee also engages professional search firms to help identify potential Independent Trustee candidates who have the experience, qualifications, attributes, and skills consistent with the Statement of Policy. From time to time, additional criteria based on the composition and skills of the current Independent Trustees, as well as experience or skills that may be appropriate in light of future changes to board composition, business conditions, and regulatory or other developments, have also been considered by the professional search firms and the Governance and Nominating Committee. In addition, the Board takes into account the Trustees' commitment and participation in Board and committee meetings, as well as their leadership of standing and ad hoc committees throughout their tenure.
In determining that a particular Trustee was and continues to be qualified to serve as a Trustee, the Board has considered a variety of criteria, none of which, in isolation, was controlling. The Board believes that, collectively, the Trustees have balanced and diverse experience, qualifications, attributes, and skills, which allow the Board to operate effectively in governing the fund and protecting the interests of shareholders. Information about the specific experience, skills, attributes, and qualifications of each Trustee, which in each case led to the Board's conclusion that the Trustee should serve (or continue to serve) as a trustee of the fund, is provided below.
Board Structure and Oversight Function. James C. Curvey is an interested person and currently serves as Chairman. The Trustees have determined that an interested Chairman is appropriate and benefits shareholders because an interested Chairman has a personal and professional stake in the quality and continuity of services provided to the fund. Independent Trustees exercise their informed business judgment to appoint an individual of their choosing to serve as Chairman, regardless of whether the Trustee happens to be independent or a member of management. The Independent Trustees have determined that they can act independently and effectively without having an Independent Trustee serve as Chairman and that a key structural component for assuring that they are in a position to do so is for the Independent Trustees to constitute a substantial majority for the Board. The Independent Trustees also regularly meet in executive session. Ned C. Lautenbach serves as Chairman of the Independent Trustees and as such (i) acts as a liaison between the Independent Trustees and management with respect to matters important to the Independent Trustees and (ii) with management prepares agendas for Board meetings.
Fidelity® funds are overseen by different Boards of Trustees. The fund's Board oversees Fidelity's high income and certain equity funds, and other Boards oversee Fidelity's investment-grade bond, money market, asset allocation, and sector funds. The asset allocation funds may invest in Fidelity® funds overseen by the fund's Board. The use of separate Boards, each with its own committee structure, allows the Trustees of each group of Fidelity® funds to focus on the unique issues of the funds they oversee, including common research, investment, and operational issues. On occasion, the separate Boards establish joint committees to address issues of overlapping consequences for the Fidelity® funds overseen by each Board.
The Trustees operate using a system of committees to facilitate the timely and efficient consideration of all matters of importance to the Trustees, the fund, and fund shareholders and to facilitate compliance with legal and regulatory requirements and oversight of the fund's activities and associated risks. The Board, acting through its committees, has charged FMR and its affiliates with (i) identifying events or circumstances the occurrence of which could have demonstrably adverse effects on the fund's business and/or reputation; (ii) implementing processes and controls to lessen the possibility that such events or circumstances occur or to mitigate the effects of such events or circumstances if they do occur; and (iii) creating and maintaining a system designed to evaluate continuously business and market conditions in order to facilitate the identification and implementation processes described in (i) and (ii) above. Because the day-to-day operations and activities of the fund are carried out by or through FMR, its affiliates, and other service providers, the fund's exposure to risks is mitigated but not eliminated by the processes overseen by the Trustees. While each of the Board's committees has responsibility for overseeing different aspects of the fund's activities, oversight is exercised primarily through the Operations, Audit, and Compliance Committees. In addition, the Independent Trustees have worked with FMR to enhance the Board's oversight of investment and financial risks, legal and regulatory risks, technology risks, and operational risks, including the development of additional risk reporting to the Board. For example, a working group comprised of Independent Trustees and FMR has worked and continues to work to review the Fidelity® funds' valuation-related activities, reporting and risk management. Appropriate personnel, including but not limited to the fund's Chief Compliance Officer (CCO), FMR's internal auditor, the independent accountants, the fund's Treasurer and portfolio management personnel, make periodic reports to the Board's committees, as appropriate, including an annual review of Fidelity's risk management program for the Fidelity® funds. The responsibilities of each standing committee, including their oversight responsibilities, are described further under "Standing Committees of the Trustees."
Interested Trustees*:
Correspondence intended for a Trustee who is an interested person may be sent to Fidelity Investments, 245 Summer Street, Boston, Massachusetts 02210.
Name, Year of Birth; Principal Occupations and Other Relevant Experience+
James C. Curvey (1935)
Year of Election or Appointment: 2007
Trustee
Chairman of the Board of Trustees
Mr. Curvey also serves as Trustee of other Fidelity® funds. Mr. Curvey is a Director of Fidelity Research & Analysis Co. (investment adviser firm, 2009-present), and Vice Chairman (2007-present) and Director of FMR LLC (diversified financial services company). In addition, Mr. Curvey serves as an Overseer for the Boston Symphony Orchestra and a member of the board of Artis-Naples, Naples, Florida, and as a Trustee for Brewster Academy, Wolfeboro, New Hampshire. Previously, Mr. Curvey served as a Director of Fidelity Investments Money Management, Inc. (investment adviser firm, 2009-2014) and a Director of FMR and FMR Co., Inc. (investment adviser firms, 2007-2014).
Charles S. Morrison (1960)
Year of Election or Appointment: 2014
Trustee
Mr. Morrison also serves as Trustee of other funds. He serves as a Director of Fidelity Investments Money Management, Inc. (FIMM) (investment adviser firm, 2014-present), Director of Fidelity SelectCo, LLC (investment adviser firm, 2014-present), President, Asset Management (2014-present), and is an employee of Fidelity Investments. Previously, Mr. Morrison served as Vice President of Fidelity's Fixed Income and Asset Allocation Funds (2012-2014), President, Fixed Income (2011-2014), Vice President of Fidelity's Money Market Funds (2005-2009), President, Money Market Group Leader of FMR (investment adviser firm, 2009), and Senior Vice President, Money Market Group of FMR (2004-2009). Mr. Morrison also served as Vice President of Fidelity's Bond Funds (2002-2005), certain Balanced Funds (2002-2005), and certain Asset Allocation Funds (2002-2007), and as Senior Vice President (2002-2005) of Fidelity's Bond Division.
* Determined to be an “Interested Trustee” by virtue of, among other things, his or her affiliation with the trust or various entities under common control with FMR.
+ The information includes the Trustee's principal occupation during the last five years and other information relating to the experience, attributes, and skills relevant to the Trustee's qualifications to serve as a Trustee, which led to the conclusion that the Trustee should serve as a Trustee for the fund.
Independent Trustees:
Correspondence intended for an Independent Trustee may be sent to Fidelity Investments, P.O. Box 55235, Boston, Massachusetts 02205-5235.
Name, Year of Birth; Principal Occupations and Other Relevant Experience+
Dennis J. Dirks (1948)
Year of Election or Appointment: 2005
Trustee
Mr. Dirks also serves as Trustee of other Fidelity® funds. Prior to his retirement in May 2003, Mr. Dirks was Chief Operating Officer and a member of the Board of The Depository Trust & Clearing Corporation (DTCC). He also served as President, Chief Operating Officer, and Board member of The Depository Trust Company (DTC) and President and Board member of the National Securities Clearing Corporation (NSCC). In addition, Mr. Dirks served as Chief Executive Officer and Board member of the Government Securities Clearing Corporation, Chief Executive Officer and Board member of the Mortgage-Backed Securities Clearing Corporation, as a Trustee and a member of the Finance Committee of Manhattan College (2005-2008), as a Trustee and a member of the Finance Committee of AHRC of Nassau County (2006-2008), and as a member of the Independent Directors Council (IDC) Governing Council (2010-2015). Mr. Dirks is a member of the Board of Directors for The Brookville Center for Children's Services, Inc. (2009-present).
Alan J. Lacy (1953)
Year of Election or Appointment: 2008
Trustee
Mr. Lacy also serves as Trustee of other Fidelity® funds. Mr. Lacy serves as Chairman (2014-present) and a member (2010-present) of the Board of Directors of Dave & Buster's Entertainment, Inc. (restaurant and entertainment complexes) and a Director of Bristol-Myers Squibb Company (global pharmaceuticals, 2008-present). He is a Trustee of the California Chapter of The Nature Conservancy (2015-present) and a Director of the Center for Advanced Study in the Behavioral Sciences at Stanford University (2015-present). In addition, Mr. Lacy served as Senior Adviser (2007-2014) of Oak Hill Capital Partners, L.P. (private equity) and also served as Chief Executive Officer (2005) and Vice Chairman (2005-2006) of Sears Holdings Corporation (retail) and Chief Executive Officer and Chairman of the Board of Sears, Roebuck and Co. (retail, 2000-2005). Previously, Mr. Lacy served as Chairman (2008-2011) and a member (2006-2015) of the Board of Trustees of the National Parks Conservation Association and as a member of the Board of Directors for The Western Union Company (global money transfer, 2006-2011), The Hillman Companies, Inc. (hardware wholesalers, 2010-2014), and Earth Fare, Inc. (retail grocery, 2010-2014).
Ned C. Lautenbach (1944)
Year of Election or Appointment: 2000
Trustee
Chairman of the Independent Trustees
Mr. Lautenbach also serves as Trustee of other Fidelity® funds. Mr. Lautenbach currently serves as the Lead Director of the Eaton Corporation Board of Directors (diversified industrial, 1997-present). Mr. Lautenbach is Chairman of the Board of Directors of Artis-Naples in Naples, Florida (2012-present), a member of the Council on Foreign Relations (1994-present), and a member of the Board of Governors, State University System of Florida (2013-present). Previously, Mr. Lautenbach was a Partner/Advisory Partner at Clayton, Dubilier & Rice, LLC (private equity investment, 1998-2010), as well as a Director of Sony Corporation (2006-2007).
Joseph Mauriello (1944)
Year of Election or Appointment: 2008
Trustee
Mr. Mauriello also serves as Trustee of other Fidelity® funds. Prior to his retirement in January 2006, Mr. Mauriello served in numerous senior management positions including Deputy Chairman and Chief Operating Officer (2004-2005), and Vice Chairman of Financial Services (2002-2004) of KPMG LLP US (professional services, 1965-2005). Mr. Mauriello currently serves as a member of the Board of Directors of XL Group plc. (global insurance and re-insurance, 2006-present) and the Independent Directors Council (IDC) Governing Council (2015-present). Previously, Mr. Mauriello served as a Director of the Hamilton Funds of the Bank of New York (2006-2007) and of Arcadia Resources Inc. (health care services and products, 2007-2012).
Robert W. Selander (1950)
Year of Election or Appointment: 2011
Trustee
Mr. Selander also serves as Trustee of other Fidelity® funds. Mr. Selander serves as a Director of The Western Union Company (global money transfer, 2014-present) and a non-executive Chairman of Health Equity, Inc. (health savings custodian, 2015-present). Previously, Mr. Selander served as a Member of the Advisory Board of other Fidelity® funds (2011), and Executive Vice Chairman (2010), Chief Executive Officer (2009-2010), and President and Chief Executive Officer (1997-2009) of Mastercard, Inc.
Cornelia M. Small (1944)
Year of Election or Appointment: 2005
Trustee
Ms. Small also serves as Trustee of other Fidelity® funds. Ms. Small is a member of the Board of Directors (2009-present) and Chair of the Investment Committee (2010-present) of the Teagle Foundation. Ms. Small also serves on the Investment Committee of the Berkshire Taconic Community Foundation (2008-present). Previously, Ms. Small served as Chairperson (2002-2008) and a member of the Investment Committee and Chairperson (2008-2012) and a member of the Board of Trustees of Smith College. In addition, Ms. Small served as Chief Investment Officer, Director of Global Equity Investments, and a member of the Board of Directors of Scudder, Stevens & Clark and Scudder Kemper Investments.
William S. Stavropoulos (1939)
Year of Election or Appointment: 2002
Trustee
Vice Chairman of the Independent Trustees
Mr. Stavropoulos also serves as Trustee of other Fidelity® funds. Mr. Stavropoulos serves as President and Founder of the Michigan Baseball Foundation, the Great Lakes Loons (2007-present). Mr. Stavropoulos is Chairman Emeritus of the Board of Directors of The Dow Chemical Company, where he previously served in numerous senior management positions, including President, CEO (1995-2000; 2002-2004), Chairman of the Executive Committee (2000-2006), and as a member of the Board of Directors (1990-2006). Currently, Mr. Stavropoulos is Chairman of the Board of Directors of Univar Inc. (global distributor of commodity and specialty chemicals), a Director of Teradata Corporation (data warehousing and technology solutions), and Maersk Inc. (industrial conglomerate), and a member of the Advisory Board for Metalmark Capital LLC (private equity investment, 2005-present). Mr. Stavropoulos is an operating advisor to Clayton, Dubilier & Rice, LLC (private equity investment). In addition, Mr. Stavropoulos is a member of the University of Notre Dame Advisory Council for the College of Science, a Trustee of the Rollin L. Gerstacker Foundation, and a Director of the Naples Philharmonic Center for the Arts. Previously, Mr. Stavropoulos served as a Director of Chemical Financial Corporation (bank holding company, 1993-2012) and Tyco International, Ltd. (multinational manufacturing and services, 2007-2012).
David M. Thomas (1949)
Year of Election or Appointment: 2008
Trustee
Mr. Thomas also serves as Trustee of other Fidelity® funds. Mr. Thomas serves as Non-Executive Chairman of the Board of Directors of Fortune Brands Home and Security (home and security products, 2011-present), as a member of the Board of Directors (2004-present) and Presiding Director (2013-present) of Interpublic Group of Companies, Inc. (marketing communication), and as a member of the Board of Trustees of the University of Florida (2013-present). Previously, Mr. Thomas served as Executive Chairman (2005-2006) and Chairman and Chief Executive Officer (2000-2005) of IMS Health, Inc. (pharmaceutical and healthcare information solutions), and a Director of Fortune Brands, Inc. (consumer products, 2000-2011).
+ The information includes the Trustee's principal occupation during the last five years and other information relating to the experience, attributes, and skills relevant to the Trustee's qualifications to serve as a Trustee, which led to the conclusion that the Trustee should serve as a Trustee for the fund.
Advisory Board Members and Officers:
Correspondence intended for an officer or Peter S. Lynch may be sent to Fidelity Investments, 245 Summer Street, Boston, Massachusetts 02210. Officers appear below in alphabetical order.
Name, Year of Birth; Principal Occupation
Peter S. Lynch (1944)
Year of Election or Appointment: 2003
Member of the Advisory Board
Mr. Lynch also serves as Member of the Advisory Board of other Fidelity® funds. Mr. Lynch is Vice Chairman and a Director of FMR (investment adviser firm) and FMR Co., Inc. (investment adviser firm). In addition, Mr. Lynch serves as a Trustee of Boston College and as the Chairman of the Inner-City Scholarship Fund. Previously, Mr. Lynch served on the Special Olympics International Board of Directors (1997-2006).
Marc R. Bryant (1966)
Year of Election or Appointment: 2015
Secretary and Chief Legal Officer (CLO)
Mr. Bryant also serves as Secretary and CLO of other funds. Mr. Bryant serves as CLO, Secretary, and Senior Vice President of Fidelity Management & Research Company (investment adviser firm, 2015-present) and FMR Co., Inc. (investment adviser firm, 2015-present); Secretary of Fidelity SelectCo, LLC (investment adviser firm, 2015-present) and Fidelity Investments Money Management, Inc. (investment adviser firm, 2015-present); and CLO of Fidelity Management & Research (Hong Kong) Limited (investment adviser firm, 2015-present). He is Senior Vice President and Deputy General Counsel of FMR LLC (diversified financial services company). Previously, Mr. Bryant served as Secretary and CLO of Fidelity Rutland Square Trust II (2010-2014) and Assistant Secretary of Fidelity's Fixed Income and Asset Allocation Funds (2013-2015). Prior to joining Fidelity Investments, Mr. Bryant served as a Senior Vice President and the Head of Global Retail Legal for AllianceBernstein L.P. (2006-2010), and as the General Counsel for ProFund Advisors LLC (2001-2006).
William C. Coffey (1969)
Year of Election or Appointment: 2009
Assistant Secretary
Mr. Coffey also serves as Assistant Secretary of other funds. He is Senior Vice President and Deputy General Counsel of FMR LLC (diversified financial services company, 2010-present), and is an employee of Fidelity Investments. Previously, Mr. Coffey served as Vice President and Associate General Counsel of FMR LLC (2005-2009).
Jonathan Davis (1968)
Year of Election or Appointment: 2010
Assistant Treasurer
Mr. Davis also serves as Assistant Treasurer of other funds, and is an employee of Fidelity Investments. Previously, Mr. Davis served as Vice President and Associate General Counsel of FMR LLC (diversified financial services company, 2003-2010).
Adrien E. Deberghes (1967)
Year of Election or Appointment: 2008
Deputy Treasurer
Mr. Deberghes also serves as an officer of other funds. He is an employee of Fidelity Investments (2008-present). Prior to joining Fidelity Investments, Mr. Deberghes was Senior Vice President of Mutual Fund Administration at State Street Corporation (2007-2008), Senior Director of Mutual Fund Administration at Investors Bank & Trust (2005-2007), and Director of Finance for Dunkin' Brands (2000-2005).
Stephanie J. Dorsey (1969)
Year of Election or Appointment: 2010
Assistant Treasurer
Ms. Dorsey also serves as an officer of other funds. She is an employee of Fidelity Investments (2008-present) and has served in other fund officer roles. Prior to joining Fidelity Investments, Ms. Dorsey served as Treasurer (2004-2008) of the JPMorgan Mutual Funds and Vice President (2004-2008) of JPMorgan Chase Bank.
Howard J. Galligan III (1966)
Year of Election or Appointment: 2014
Chief Financial Officer
Mr. Galligan also serves as Chief Financial Officer of other funds. Mr. Galligan serves as President of Fidelity Pricing and Cash Management Services (FPCMS) (2014-present) and as a Director of Strategic Advisers, Inc. (investment adviser firm, 2008-present). Previously, Mr. Galligan served as Chief Administrative Officer of Asset Management (2011-2014) and Chief Operating Officer and Senior Vice President of Investment Support for Strategic Advisers, Inc. (2003-2011).
Scott C. Goebel (1968)
Year of Election or Appointment: 2015
Vice President
Mr. Goebel serves as Vice President of other funds and is an employee of Fidelity Investments (2001-present). Previously, Mr. Goebel served as Secretary of Fidelity SelectCo, LLC (investment adviser firm, 2013-2015), Fidelity Investments Money Management, Inc. (FIMM) (investment adviser firm, 2010-2015), and Fidelity Research and Analysis Company (FRAC) (investment adviser firm, 2010-2015); General Counsel, Secretary, and Senior Vice President of Fidelity Management & Research Company (investment adviser firm, 2008-2015) and FMR Co., Inc. (investment adviser firm, 2008-2015); Assistant Secretary of Fidelity Management & Research (Japan) Limited (investment adviser firm, 2008-2015) and FMR Investment Management (U.K.) Limited (investment adviser firm, 2008-2015); Chief Legal Officer (CLO) of Fidelity Management & Research (Hong Kong) Limited (investment adviser firm, 2008-2015); Secretary and CLO of certain Fidelity® funds (2008-2015); Assistant Secretary of FIMM (2008-2010), FRAC (2008-2010), and certain funds (2007-2008); and as Vice President and Secretary of Fidelity Distributors Corporation (FDC) (2005-2007).
Thomas C. Hense (1964)
Year of Election or Appointment: 2008, 2010, or 2015
Vice President
Mr. Hense serves as Vice President of Fidelity Advisor® Multi-Asset Income Fund (2015) and other funds (High Income (2008), Small Cap (2008), and Value (2010) funds), and is an employee of Fidelity Investments (1993-present). Previously, Mr. Hense served as a portfolio manager for Fidelity's Institutional Money Management Group (Pyramis) (2003-2008).
Brian B. Hogan (1964)
Year of Election or Appointment: 2009
Vice President
Mr. Hogan also serves as Trustee or Vice President of other funds. Mr. Hogan serves as a Director of Fidelity SelectCo, LLC (investment adviser firm, 2014-present) and President of the Equity Division of FMR (investment adviser firm, 2009-present). Previously, Mr. Hogan served as Senior Vice President, Equity Research of FMR (2006-2009) and as a portfolio manager.
Chris Maher (1972)
Year of Election or Appointment: 2013
Assistant Treasurer
Mr. Maher serves as Assistant Treasurer of other funds. Mr. Maher is Vice President of Valuation Oversight and is an employee of Fidelity Investments. Previously, Mr. Maher served as Vice President of Asset Management Compliance (2013), Vice President of the Program Management Group of FMR (investment adviser firm, 2010-2013), and Vice President of Valuation Oversight (2008-2010).
John F. Papandrea (1972)
Year of Election or Appointment: 2016
Anti-Money Laundering (AML) Officer
Mr. Papandrea also serves as AML Officer of other funds. Mr. Papandrea is Vice President of FMR LLC (diversified financial services company, 2008-present) and is an employee of Fidelity Investments (2005-present).
Kenneth B. Robins (1969)
Year of Election or Appointment: 2008
President and Treasurer
Mr. Robins also serves as an officer of other funds. Mr. Robins serves as Executive Vice President of Fidelity Investments Money Management, Inc. (FIMM) (investment adviser firm, 2013-present) and is an employee of Fidelity Investments (2004-present). Previously, Mr. Robins served in other fund officer roles.
Stacie M. Smith (1974)
Year of Election or Appointment: 2013
Deputy Treasurer
Ms. Smith also serves as an officer of other funds. She is an employee of Fidelity Investments (2009-present) and has served in other fund officer roles. Prior to joining Fidelity Investments, Ms. Smith served as Senior Audit Manager of Ernst & Young LLP (1996-2009).
Renee Stagnone (1975)
Year of Election or Appointment: 2013
Deputy Treasurer
Ms. Stagnone also serves as Deputy Treasurer of other funds. Ms. Stagnone is an employee of Fidelity Investments (1997-present).
Linda J. Wondrack (1964)
Year of Election or Appointment: 2014
Chief Compliance Officer
Ms. Wondrack also serves as Chief Compliance Officer of other funds. Ms. Wondrack is Executive Vice President and head of the Ethics Office and Asset Management Compliance for Fidelity Investments (2012-present). Ms. Wondrack also serves as Chief Compliance Officer of Fidelity SelectCo, LLC (investment adviser firm, 2014-present); Chief Compliance Officer of Impresa Management LLC (2013-present); and Chief Compliance Officer of FMR Co., Inc. (investment adviser firm), Fidelity Investments Money Management, Inc. (investment adviser firm), FMR Investment Management (U.K.) Limited (investment adviser firm), Fidelity Management & Research (Hong Kong) (investment adviser firm), Fidelity Management & Research Company (investment adviser firm), FIAM LLC (investment adviser firm), and Strategic Advisers, Inc. (investment adviser firm), Ballyrock Investment Advisors LLC, and Northern Neck Investors LLC (2012-present). Previously, Ms. Wondrack served as Chief Compliance Officer of Fidelity Management & Research (Japan) Limited (investment adviser firm, 2012-2016); Senior Vice President and Chief Compliance Officer for Columbia Management Investment Advisers, LLC (2005-2012); Chief Compliance Officer for certain funds within the Columbia Family of Funds (2007-2012); and Senior Vice President of Compliance Risk Management at Bank of America (2005-2010).
Joseph F. Zambello (1957)
Year of Election or Appointment: 2011
Deputy Treasurer
Mr. Zambello also serves as Deputy Treasurer of other funds. Mr. Zambello is an employee of Fidelity Investments (1991-present). Previously, Mr. Zambello served as Vice President of the Program Management Group of FMR (investment adviser firm, 2009-2011) and Vice President of the Transfer Agent Oversight Group (2005-2009).
Shareholder Expense Example
As a shareholder of the Fund, you incur two types of costs: (1) transaction costs and (2) ongoing costs, including management fees, distribution and/or service (12b-1) fees and other Fund expenses. This Example is intended to help you understand your ongoing costs (in dollars) of investing in the Fund and to compare these costs with the ongoing costs of investing in other mutual funds.
The Example is based on an investment of $1,000 invested at the beginning of the period and held for the entire period (July 1, 2015 to December 31, 2015).
Actual Expenses
The first line of the accompanying table for each class of the Fund provides information about actual account values and actual expenses. You may use the information in this line, together with the amount you invested, to estimate the expenses that you paid over the period. Simply divide your account value by $1,000.00 (for example, an $8,600 account value divided by $1,000.00 = 8.6), then multiply the result by the number in the first line for a class of the Fund under the heading entitled "Expenses Paid During Period" to estimate the expenses you paid on your account during this period. The estimate of expenses does not include any fees or other expenses of any variable annuity or variable life insurance product. If they were, the estimate of expenses you paid during the period would be higher, and your ending account value would be lower. In addition, the Fund, as a shareholder in the underlying Fidelity Central Funds, will indirectly bear its pro-rata share of the fees and expenses incurred by the underlying Fidelity Central Funds. These fees and expenses are not included in the Fund's annualized expense ratio used to calculate the expense estimate in the table below.
Hypothetical Example for Comparison Purposes
The second line of the accompanying table for each class of the Fund provides information about hypothetical account values and hypothetical expenses based on a Class' actual expense ratio and an assumed rate of return of 5% per year before expenses, which is not the Class' actual return. The hypothetical account values and expenses may not be used to estimate the actual ending account balance or expenses you paid for the period. You may use this information to compare the ongoing costs of investing in the Fund and other funds. To do so, compare this 5% hypothetical example with the 5% hypothetical examples that appear in the shareholder reports of the other funds. The estimate of expenses does not include any fees or other expenses of any variable annuity or variable life insurance product. If they were, the estimate of expenses you paid during the period would be higher, and your ending account value would be lower. In addition, the Fund, as a shareholder in the underlying Fidelity Central Funds, will indirectly bear its pro-rata share of the fees and expenses incurred by the underlying Fidelity Central Funds. These fees and expenses are not included in the Fund's annualized expense ratio used to calculate the expense estimate in the table below.
Please note that the expenses shown in the table are meant to highlight your ongoing costs only and do not reflect any transaction costs. Therefore, the second line of the table is useful in comparing ongoing costs only, and will not help you determine the relative total costs of owning different funds.
| | Annualized Expense Ratio-A | Beginning
Account Value
July 1, 2015 | Ending
Account Value
December 31, 2015 | Expenses Paid
During Period-B
July 1, 2015
to December 31, 2015 |
| Initial Class | .56% | | | |
| Actual | | $1,000.00 | $960.90 | $2.77 |
| Hypothetical-C | | $1,000.00 | $1,022.38 | $2.85 |
| Service Class | .66% | | | |
| Actual | | $1,000.00 | $961.00 | $3.26 |
| Hypothetical-C | | $1,000.00 | $1,021.88 | $3.36 |
| Service Class 2 | .81% | | | |
| Actual | | $1,000.00 | $959.50 | $4.00 |
| Hypothetical-C | | $1,000.00 | $1,021.12 | $4.13 |
| Investor Class | .64% | | | |
| Actual | | $1,000.00 | $960.90 | $3.16 |
| Hypothetical-C | | $1,000.00 | $1,021.98 | $3.26 |
A Annualized expense ratio reflects expenses net of applicable fee waivers.
B Expenses are equal to each Class' annualized expense ratio, multiplied by the average account value over the period, multiplied by 184/365 (to reflect the one-half year period).
C 5% return per year before expenses
Distributions (Unaudited)
The Board of Trustees of VIP Growth & Income Portfolio voted to pay to shareholders of record at the opening of business on record date, the following distributions per share derived from capital gains realized from sales of portfolio securities:
| | Pay Date | Record Date | Capital Gains |
| Initial Class | 02/05/2016 | 02/05/2016 | $ 1.135 |
| Service Class | 02/05/2016 | 02/05/2016 | $ 1.135 |
| Service Class 2 | 02/05/2016 | 02/05/2016 | $ 1.135 |
| Investor Class | 02/05/2016 | 02/05/2016 | $ 1.135 |
The fund hereby designates as a capital gain dividend with respect to the taxable year ended December 31 2015, $61,184,082, or, if subsequently determined to be different, the net capital gain of such year.
Initial Class designates 100% and 89%; Service Class designates 100% and 93%; Service Class 2 designates 100% and 100%; and Investor Class designates 100% and 93% of the dividends distributed in February 2015 and December 2015, respectively, during the fiscal year as qualifying for the dividends-received deduction for corporate shareholders.
Board Approval of Investment Advisory Contracts and Management Fees
VIP Growth & Income Portfolio
Each year, the Board of Trustees, including the Independent Trustees (together, the Board), votes on the renewal of the management contract with Fidelity Management & Research Company (FMR) and the sub-advisory agreements (together, the Advisory Contracts) for the fund. The Board, assisted by the advice of fund counsel and Independent Trustees' counsel, requests and considers a broad range of information relevant to the renewal of the Advisory Contracts throughout the year.
The Board meets regularly and, at each of its meetings, covers an extensive agenda of topics and materials and considers factors that are relevant to its annual consideration of the renewal of the fund's Advisory Contracts, including the services and support provided to the fund and its shareholders. The Board has established various standing committees (Committees), each composed of and chaired by Independent Trustees with varying backgrounds, to which the Board has assigned specific subject matter responsibilities in order to enhance effective decision-making by the Board. The Board, acting directly and through its Committees, requests and receives information concerning the annual consideration of the renewal of the fund's Advisory Contracts. The Board also meets as needed to consider matters specifically related to the Board's annual consideration of the renewal of the Advisory Contracts. Members of the Board may also meet with trustees of other Fidelity funds through ad hoc joint committees to discuss certain matters relevant to all of the Fidelity funds.
At its July 2015 meeting, the Board unanimously determined to renew the fund's Advisory Contracts. In reaching its determination, the Board considered all factors it believed relevant, including (i) the nature, extent, and quality of the services to be provided to the fund and its shareholders (including the investment performance of the fund); (ii) the competitiveness of the fund's management fee and total expense ratio relative to peer funds; (iii) the total costs of the services to be provided by and the profits to be realized by Fidelity from its relationship with the fund; and (iv) the extent to which (if any) economies of scale exist and would be realized as the fund grows, and whether any economies of scale are appropriately shared with fund shareholders.
In considering whether to renew the Advisory Contracts for the fund, the Board reached a determination, with the assistance of fund counsel and Independent Trustees' counsel and through the exercise of its business judgment, that the renewal of the Advisory Contracts was in the best interests of the fund and its shareholders and that the compensation payable under the Advisory Contracts was fair and reasonable. The Board's decision to renew the Advisory Contracts was not based on any single factor, but rather was based on a comprehensive consideration of all the information provided to the Board at its meetings throughout the year. The Board, in reaching its determination to renew the Advisory Contracts, was aware that shareholders of the fund have a broad range of investment choices available to them, including a wide choice among funds offered by Fidelity's competitors, and that the fund's shareholders, who have the opportunity to review and weigh the disclosure provided by the fund in its prospectus and other public disclosures, have chosen to invest in this fund, which is part of the Fidelity family of funds.
Nature, Extent, and Quality of Services Provided. The Board considered Fidelity's staffing as it relates to the fund, including the backgrounds of investment personnel of Fidelity, and also considered the fund's investment objective, strategies, and related investment philosophy. The Independent Trustees also had discussions with senior management of Fidelity's investment operations and investment groups. The Board considered the structure of the portfolio manager compensation program and whether this structure provides appropriate incentives to act in the best interests of the fund. Additionally, the Board considered the portfolio managers' investments, if any, in the funds that they manage.
Resources Dedicated to Investment Management and Support Services. The Board and the Fund Oversight and Research Committees reviewed the general qualifications and capabilities of Fidelity's investment staff, including its size, education, experience, and resources, as well as Fidelity's approach to recruiting, training, managing, and compensating investment personnel. The Board noted that Fidelity has continued to increase the resources devoted to non-U.S. offices, including expansion of Fidelity's global investment organization. The Board also noted that Fidelity's analysts have extensive resources, tools and capabilities that allow them to conduct sophisticated quantitative and fundamental analysis, as well as credit analysis of issuers, counterparties and guarantors. Further, the Board considered that Fidelity's investment professionals have sufficient access to global information and data so as to provide competitive investment results over time, and that those professionals also have access to sophisticated tools that permit them to assess portfolio construction and risk and performance attribution characteristics continuously, as well as to transmit new information and research conclusions rapidly around the world. Additionally, in its deliberations, the Board considered Fidelity's trading, risk management, and compliance capabilities and resources, which are integral parts of the investment management process.
Shareholder and Administrative Services. The Board considered (i) the nature, extent, quality, and cost of advisory, administrative, and shareholder services performed by FMR, the sub-advisers (together with FMR, the Investment Advisers), and their affiliates under the Advisory Contracts and under separate agreements covering transfer agency, pricing and bookkeeping, and securities lending services for the fund; (ii) the nature and extent of the supervision of third party service providers, principally custodians and subcustodians; and (iii) the resources devoted to, and the record of compliance with, the fund's compliance policies and procedures. The Board also reviewed the allocation of fund brokerage, including allocations to brokers affiliated with the Investment Advisers, the use of brokerage commissions to pay fund expenses, and the use of "soft" commission dollars to pay for research services.
The Board noted that the growth of fund assets over time across the complex allows Fidelity to reinvest in the development of services designed to enhance the value or convenience of the Fidelity funds as investment vehicles. These services include 24-hour access to account information and market information through telephone representatives and over the Internet, investor education materials and asset allocation tools, and the expanded availability of Fidelity Investor Centers.
In 2014, the Board formed an ad hoc Committee on Transfer Agency Fees to review the variety of transfer agency fee structures throughout the industry and Fidelity's competitive positioning with respect to industry participants.
Investment in a Large Fund Family. The Board considered the benefits to shareholders of investing in a Fidelity fund, including the benefits of investing in a fund that is part of a large family of funds offering a variety of investment disciplines and providing a large variety of mutual fund investor services. The Board noted that Fidelity had taken, or had made recommendations that resulted in the Fidelity funds taking, a number of actions over the previous year that benefited particular funds, including (i) continuing to dedicate additional resources to investment research and to the support of the senior management team that oversees asset management; (ii) continuing efforts to enhance Fidelity's global research capabilities; (iii) launching new funds and making other enhancements to meet client needs; (iv) reducing management fees and total expenses for certain index funds and diversified international funds; (v) continuing to launch dedicated lower cost underlying funds to meet portfolio construction needs related to expanding underlying fund options for Fidelity funds of funds, specifically for the Freedom Fund product lines; (vi) rationalizing product lines and gaining increased efficiencies through fund mergers; (vii) launching active fixed-income exchange-traded funds; (viii) continuing to develop, acquire and implement systems and technology to improve services to the funds and information security and to increase efficiency; (ix) implementing investment enhancements to further strengthen Fidelity's target date product line to increase investors' probability of success in achieving their goals; (x) modifying the eligibility criteria for certain share classes to accommodate roll-over assets from employer-sponsored retirement plans; (xi) launching a new Class W of the Freedom Index Funds to attract and retain Fidelity record-kept retirement plan assets; and (xii) implementing changes to Fidelity's money market product line in response to recent money market regulatory reforms.
Investment Performance. The Board considered whether the fund has operated in accordance with its investment objective, as well as its record of compliance with its investment restrictions and its performance history.
The Board took into account discussions with representatives of the Investment Advisers about fund investment performance that occur at Board meetings throughout the year. In this regard the Board noted that as part of regularly scheduled fund reviews and other reports to the Board on fund performance, the Board considers annualized return information for the fund, for different time periods, measured against a securities market index ("benchmark index") and a peer group of funds with similar objectives ("peer group"), if any. In its evaluation of fund investment performance, the Board gave particular attention to information indicating changes in performance of certain Fidelity funds for specific time periods and discussed with the Investment Advisers the reasons for any overperformance or underperformance.
In addition to reviewing absolute and relative fund performance, the Independent Trustees periodically consider the appropriateness of fund performance metrics in evaluating the results achieved. In general, the Independent Trustees believe that fund performance should be evaluated based on net performance (after fees and expenses) of both the highest performing and lowest performing fund share classes, where applicable, compared to appropriate benchmark indices, over appropriate time periods that may include full market cycles, and compared to peer groups, as applicable, over the same periods, taking into account relevant factors including the following: general market conditions; issuer-specific information; and fund cash flows and other factors.
The Independent Trustees recognize that shareholders evaluate performance on a net basis over their own holding periods, for which one-, three-, and five-year periods are often used as a proxy. For this reason, the performance information reviewed by the Board also included net cumulative calendar year total return information for the fund and an appropriate benchmark index and peer group for the most recent one-, three-, and five-year periods, as shown below. Returns are shown compared to the 25th percentile (top of box, 75% beaten) and 75th percentile (bottom of box, 25% beaten) of the peer universe.
VIP Growth & Income Portfolio
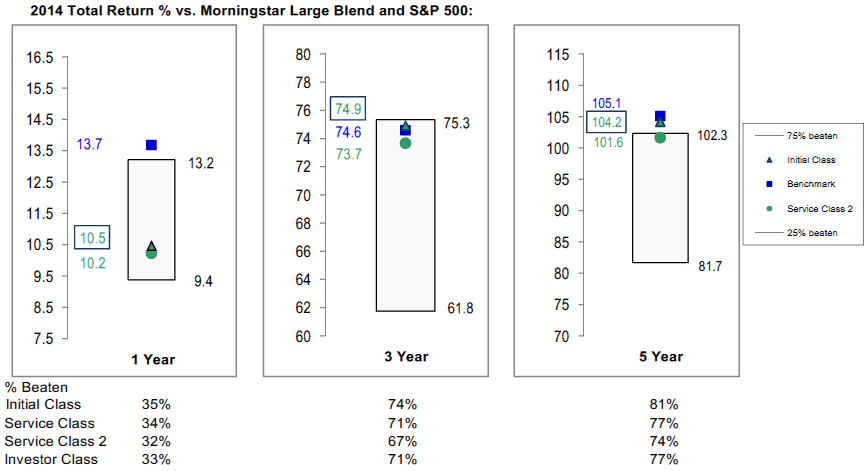
Based on its review, the Board concluded that the nature, extent, and quality of services provided to the fund under the Advisory Contracts should benefit the shareholders of the fund.
Competitiveness of Management Fee and Total Expense Ratio. The Board considered the fund's management fee and total expense ratio compared to "mapped groups" of competitive funds and classes created for the purpose of facilitating the Trustees' competitive analysis of management fees and total expenses. Fidelity creates "mapped groups" by combining similar Lipper investment objective categories that have comparable investment mandates. Combining Lipper investment objective categories aids the Board's management fee and total expense ratio comparisons by broadening the competitive group used for comparison.
Management Fee. The Board considered two proprietary management fee comparisons for the 12-month periods shown in basis points (BP) in the chart below. The group of Lipper funds used by the Board for management fee comparisons is referred to below as the "Total Mapped Group." The Total Mapped Group comparison focuses on a fund's standing in terms of gross management fees before expense reimbursements or caps relative to the total universe of funds with comparable investment mandates, regardless of whether their management fee structures also are comparable. Funds with comparable investment mandates offer exposure to similar types of securities. Funds with comparable management fee structures have similar management fee contractual arrangements (
e.g., flat rate charged for advisory services, all-inclusive fee rate,
etc.). "TMG %" represents the percentage of funds in the Total Mapped Group that had management fees that were lower than the fund's. For example, a hypothetical TMG % of 20% would mean that 80% of the funds in the Total Mapped Group had higher, and 20% had lower, management fees than the fund. The fund's actual TMG %s and the number of funds in the Total Mapped Group are in the chart below. The "Asset-Size Peer Group" (ASPG) comparison focuses on a fund's standing relative to a subset of non-Fidelity funds within the Total Mapped Group that are similar in size and management fee structure without taking into account performance adjustments, if any. For example, if a fund is in the first quartile of the ASPG, the fund's management fee ranks in the least expensive or lowest 25% of funds in the ASPG. The ASPG represents at least 15% of the funds in the Total Mapped Group with comparable asset size and management fee structures, subject to a minimum of 50 funds (or all funds in the Total Mapped Group if fewer than 50). Additional information, such as the ASPG quartile in which the fund's management fee rate ranked, is also included in the chart and considered by the Board.
VIP Growth & Income Portfolio

The Board noted that the fund's management fee rate ranked below the median of its Total Mapped Group and below the median of its ASPG for 2014.
The Board noted that, in 2014, the ad hoc Committee on Group Fee was formed by it and other Fidelity fund boards to conduct an in-depth review of the "group fee" component of the management fee of funds with such management fee structures. Committee focus included the mechanics of the group fee, the competitive landscape of group fee structures, Fidelity funds with no group fee component and investment products not included in group fee assets. The Board also considered that, for funds subject to the group fee, FMR agreed to voluntarily waive fees over a specified period of time in amounts designed to account for assets converted from certain funds to certain collective investment trusts.
The Board also noted that, in 2013, the ad hoc Committee on Management Fees was formed to conduct an in-depth review of the management fee rates of Fidelity's active equity mutual funds. The Committee focused on the following areas: (i) standard fee structures; (ii) research consumption and trading evolution; (iii) management fee competitiveness/profitability by category; and (iv) factors that drive institutional pricing.
Based on its review, the Board concluded that the fund's management fee is fair and reasonable in light of the services that the fund receives and the other factors considered.
Total Expense Ratio. In its review of each class's total expense ratio, the Board considered the fund's management fee as well as other fund or class expenses, as applicable, such as transfer agent fees, pricing and bookkeeping fees, fund-paid 12b-1 fees, and custodial, legal, and audit fees. The Board also noted that Fidelity may agree to waive fees and expenses from time to time, and the extent to which, if any, it has done so for the fund. As part of its review, the Board also considered the current and historical total expense ratios of each class of the fund compared to competitive fund median expenses. Each class of the fund is compared to those funds and classes in the Total Mapped Group (used by the Board for management fee comparisons) that have a similar sales load structure.
The Board noted that the total expense ratio of each class ranked below its competitive median for 2014.
Fees Charged to Other Fidelity Clients. The Board also considered Fidelity fee structures and other information with respect to clients of Fidelity, such as other funds advised or subadvised by Fidelity, pension plan clients, and other institutional clients with similar mandates. The Board noted the findings of the 2013 ad hoc joint committee (created with the board of other Fidelity funds), which reviewed and compared Fidelity's institutional investment advisory business with its business of providing services to the Fidelity funds, including the differences in services provided, fees charged, and costs incurred, as well as competition in their respective marketplaces.
Based on its review of total expense ratios and fees charged to other Fidelity clients, the Board concluded that the total expense ratio of each class of the fund was reasonable in light of the services that the fund and its shareholders receive and the other factors considered.
Costs of the Services and Profitability. The Board considered the revenues earned and the expenses incurred by Fidelity in conducting the business of developing, marketing, distributing, managing, administering and servicing the fund and servicing the fund's shareholders. The Board also considered the level of Fidelity's profits in respect of all the Fidelity funds.
On an annual basis, Fidelity presents to the Board information about the profitability of its relationship with the fund. Fidelity calculates profitability information for each fund, as well as aggregate profitability information for groups of Fidelity funds and all Fidelity funds, using a series of detailed revenue and cost allocation methodologies which originate with the books and records of Fidelity on which Fidelity's audited financial statements are based. The Audit Committee of the Board reviews any significant changes from the prior year's methodologies.
PricewaterhouseCoopers LLP (PwC), independent registered public accounting firm and auditor to Fidelity and certain Fidelity funds, has been engaged annually by the Board as part of the Board's assessment of Fidelity's profitability analysis. PwC's engagement includes the review and assessment of the methodologies used by Fidelity in determining the revenues and expenses attributable to Fidelity's mutual fund business, and completion of agreed-upon procedures in respect of the mathematical accuracy of fund profitability and its conformity to established allocation methodologies. After considering PwC's reports issued under the engagement and information provided by Fidelity, the Board concluded that while other allocation methods may also be reasonable, Fidelity's profitability methodologies are reasonable in all material respects.
The Board also reviewed Fidelity's non-fund businesses and fall-out benefits related to the mutual fund business as well as cases where Fidelity's affiliates may benefit from or be related to the fund's business.
The Board considered the costs of the services provided by and the profits realized by Fidelity in connection with the operation of the fund and was satisfied that the profitability was not excessive.
Economies of Scale. The Board considered whether there have been economies of scale in respect of the management of the Fidelity funds, whether the Fidelity funds (including the fund) have appropriately benefited from any such economies of scale, and whether there is potential for realization of any further economies of scale. The Board considered the extent to which the fund will benefit from economies of scale as assets grow through increased services to the fund, through waivers or reimbursements, or through fee or expense ratio reductions. The Board also noted that in 2013, it and the boards of other Fidelity funds created an ad hoc committee (the Economies of Scale Committee) to analyze whether Fidelity attains economies of scale in respect of the management and servicing of the Fidelity funds, whether the Fidelity funds have appropriately benefited from such economies of scale, and whether there is potential for realization of any further economies of scale.
The Board recognized that the fund's management contract incorporates a "group fee" structure, which provides for lower group fee rates as total group assets increase, and for higher group fee rates as total group assets decrease (with "group assets" defined to include fund assets under FMR's management plus sector fund assets previously under FMR's management and currently managed by Fidelity SelectCo, LLC). FMR calculates the group fee rates based on a tiered asset "breakpoint" schedule that varies based on asset class. The Board considered that the group fee is designed to deliver the benefits of economies of scale to fund shareholders when total Fidelity fund assets increase, even if assets of any particular fund are unchanged or have declined, because some portion of Fidelity's costs are attributable to services provided to all Fidelity funds, and all funds benefit if those costs can be allocated among more assets. The Board concluded that, given the group fee structure, fund shareholders will benefit from lower management fees as group assets increase at the fund complex level, regardless of whether Fidelity achieves any such economies of scale.
The Board concluded, taking into account the analysis of the Economies of Scale Committee, that economies of scale, if any, are being appropriately shared between fund shareholders and Fidelity.
Additional Information Requested by the Board. In order to develop fully the factual basis for consideration of the Fidelity funds' Advisory Contracts, the Board requested and received additional information on certain topics, including: (i) fund performance trends and Fidelity's long-term strategies for certain funds; (ii) the various share classes employed by Fidelity and the attributes of each class, together with similar information on the distribution and servicing payments made by Fidelity or the funds to third-party participants in the distribution channels; (iii) fund profitability, and fund performance in relation to fund profitability; (iv) the methodology with respect to evaluating competitive fund data and peer group classifications and fee comparisons; (v) annual fund profitability margins, with particular focus on certain funds with negative margins; (vi) the realization of fall-out benefits in certain Fidelity business units;
(vii) economies of scale and the way in which they are shared with fund shareholders;(viii) Fidelity's group fee structures, including the group fee schedule of breakpoints;(ix) the impact of cost containment measures on the funds; and (x) the transfer agent fee structure.
Based on its evaluation of all of the conclusions noted above, and after considering all factors it believed relevant, the Board concluded that the advisory fee structures are fair and reasonable, and that the fund's Advisory Contracts should be renewed.
VIPGI-ANN-0216
1.540026.118
Fidelity® Variable Insurance Products: Mid Cap Portfolio
Annual Report December 31, 2015 |
|
Contents
To view a fund's proxy voting guidelines and proxy voting record for the 12-month period ended June 30, visit http://www.fidelity.com/proxyvotingresults or visit the Securities and Exchange Commission's (SEC) web site at http://www.sec.gov.
You may also call 1-877-208-0098 to request a free copy of the proxy voting guidelines.
Fidelity® Variable Insurance Products are separate account options which are purchased through a variable insurance contract.
Standard & Poor's, S&P and S&P 500 are registered service marks of The McGraw-Hill Companies, Inc. and have been licensed for use by Fidelity Distributors Corporation.
Other third-party marks appearing herein are the property of their respective owners.
All other marks appearing herein are registered or unregistered trademarks or service marks of FMR LLC or an affiliated company. © 2016 FMR LLC. All rights reserved.
This report and the financial statements contained herein are submitted for the general information of the shareholders of the Fund. This report is not authorized for distribution to prospective investors in the Fund unless preceded or accompanied by an effective prospectus.
A fund files its complete schedule of portfolio holdings with the SEC for the first and third quarters of each fiscal year on Form N-Q. Forms N-Q are available on the SEC’s web site at http://www.sec.gov. A fund's Forms N-Q may be reviewed and copied at the SEC’s Public Reference Room in Washington, DC. Information regarding the operation of the SEC's Public Reference Room may be obtained by calling 1-800-SEC-0330.
For a complete list of a fund's portfolio holdings, view the most recent holdings listing, semiannual report, or annual report on Fidelity's web site at http://www.fidelity.com, http://www.advisor.fidelity.com, or http://www.401k.com, as applicable.
NOT FDIC INSURED •MAY LOSE VALUE •NO BANK GUARANTEE
Neither the Fund nor Fidelity Distributors Corporation is a bank.
Performance: The Bottom Line
Average annual total return reflects the change in the value of an investment, assuming reinvestment of distributions from dividend income and capital gains (the profits earned upon the sale of securities that have grown in value, if any) and assuming a constant rate of performance each year. During periods of reimbursement by Fidelity, a fund’s total return will be greater than it would be had the reimbursement not occurred. Performance numbers are net of all underlying fund operating expenses, but do not include any insurance charges imposed by your insurance company’s separate account. If performance information included the effect of these additional charges, the total returns would have been lower. How a fund did yesterday is no guarantee of how it will do tomorrow.
Average Annual Total Returns
| For the periods ended December 31, 2015 | Past 1 year | Past 5 years | Past 10 years |
| Initial Class | (1.39)% | 7.94% | 7.64% |
| Service Class | (1.50)% | 7.84% | 7.53% |
| Service Class 2 | (1.63)% | 7.68% | 7.37% |
| Investor Class | (1.47)% | 7.85% | 7.54% |
$10,000 Over 10 Years
Let's say hypothetically that $10,000 was invested in VIP Mid Cap Portfolio - Initial Class on December 31, 2005.
The chart shows how the value of your investment would have changed, and also shows how the S&P MidCap 400® Index performed over the same period.
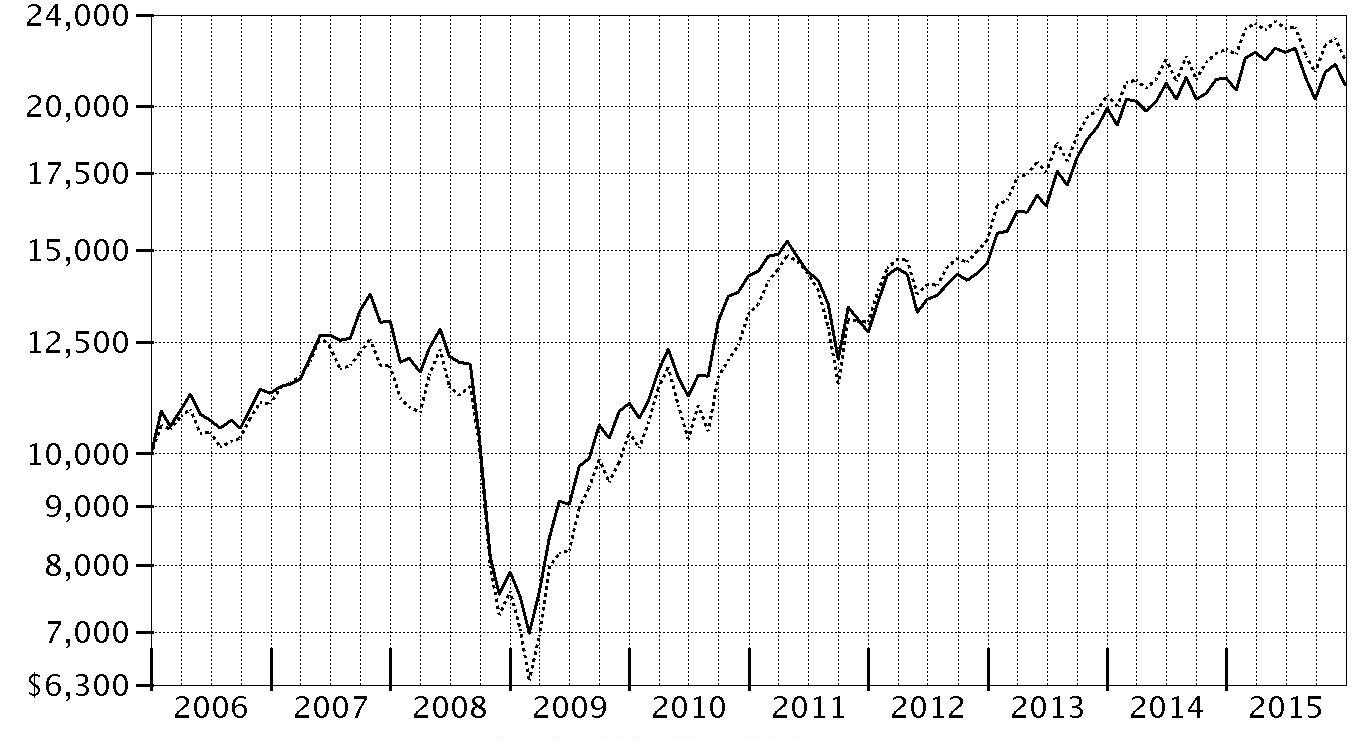
| Period Ending Values |
| $20,873 | VIP Mid Cap Portfolio - Initial Class |
| $21,946 | S&P MidCap 400® Index |
Management's Discussion of Fund Performance
Market Recap: U.S. stocks gained modestly in 2015, rebounding from a steep decline in August and September over worries about China’s slowing economic growth. The S&P 500
® index rose 1.38% for the period, its lowest calendar-year return since 2008. After the late-summer rout, stocks sharply reversed course in October, lifted by the Federal Reserve’s decision to put off raising near-term interest rates until mid-December. Investors also were encouraged by an interest-rate cut in China and economic stimulus in Europe. Overall, growth stocks fared much better than their value counterparts, as investors sought growth in a subpar economic environment. This helped lift the technology-heavy Nasdaq Composite Index
® 6.96% for the year. Sector performance in the broader market was split, with five of 10 sectors in the S&P 500
® gaining ground and five retreating. Consumer discretionary (+10%) led the way, benefiting from rising personal income and low inflation. Health care (+7%), consumer staples (+7%) and information technology (+6%) also outpaced the broad market amid strong fundamentals. Conversely, the energy sector (-21%) was by far the worst performer, stung by deflated commodity prices that also hit materials (-8%). The defensive, but rate-sensitive utilities sector (-5%) lost ground on the cusp of Fed tightening, while industrials (-3%) were dragged down with energy prices and a slower-growing China.
Comments from Portfolio Manager Thomas Allen: For the year, the fund’s share classes recorded small declines and finished modestly ahead of the -2.18% return of the benchmark S&P MidCap 400
® index. Positioning in information technology, energy, materials and health care aided the fund’s performance versus the index. Underweighting the lower end of the benchmark’s market capitalization spectrum also was helpful, as larger-caps tended to perform better this period. At the stock level, Global Payments was the fund’s top contributor. The provider of payment processing services announced strong quarterly results in both July and October, which aided its stock. Electronic Arts, a leading maker of video games, also was helpful, as were Freescale Semiconductor and Netherlands-based NXP Semiconductors. All three were non-index positions. NXP closed a deal to buy Freescale during the period. Conversely, performance was hampered by stock picking in industrials and financials. In the former category, a non-index position in Spirit Airlines was by far our biggest relative detractor. Another detractor from transportation – a group where I reduced the fund’s allocation during the period – was less-than-truckload (LTL) hauler and logistics provider Saia. One detractor from the technology sector was Belden, a manufacturer of networking, connectivity and cable products.
The views expressed above reflect those of the portfolio manager(s) only through the end of the period as stated on the cover of this report and do not necessarily represent the views of Fidelity or any other person in the Fidelity organization. Any such views are subject to change at any time based upon market or other conditions and Fidelity disclaims any responsibility to update such views. These views may not be relied on as investment advice and, because investment decisions for a Fidelity fund are based on numerous factors, may not be relied on as an indication of trading intent on behalf of any Fidelity fund.
Investment Summary (Unaudited)
Top Ten Stocks as of December 31, 2015
| | % of fund's net assets | % of fund's net assets 6 months ago |
| Global Payments, Inc. | 1.6 | 1.4 |
| Jones Lang LaSalle, Inc. | 1.1 | 1.1 |
| CBRE Group, Inc. | 1.1 | 1.1 |
| Electronic Arts, Inc. | 1.1 | 1.1 |
| Total System Services, Inc. | 1.1 | 1.0 |
| Cardinal Health, Inc. | 1.1 | 1.1 |
| McGraw Hill Financial, Inc. | 1.0 | 0.9 |
| Textron, Inc. | 1.0 | 1.2 |
| CDW Corp. | 1.0 | 0.8 |
| Steris PLC | 0.9 | 0.9 |
| | 11.0 | |
Top Five Market Sectors as of December 31, 2015
| | % of fund's net assets | % of fund's net assets 6 months ago |
| Information Technology | 24.4 | 23.9 |
| Financials | 20.5 | 18.2 |
| Consumer Discretionary | 17.8 | 18.5 |
| Industrials | 14.5 | 15.5 |
| Health Care | 13.6 | 13.8 |
Asset Allocation (% of fund's net assets)
| As of December 31, 2015* |
| | Stocks | 99.7% |
| | Short-Term Investments and Net Other Assets (Liabilities) | 0.3% |

* Foreign investments - 11.9%
| As of June 30, 2015* |
| | Stocks | 99.9% |
| | Short-Term Investments and Net Other Assets (Liabilities) | 0.1% |

* Foreign investments - 11.7%
Investments December 31, 2015
Showing Percentage of Net Assets
| Common Stocks - 99.6% | | | |
| | | Shares | Value |
| CONSUMER DISCRETIONARY - 17.8% | | | |
| Auto Components - 1.6% | | | |
| Delphi Automotive PLC | | 483,061 | $41,412,820 |
| Gentex Corp. | | 2,316,292 | 37,083,835 |
| Johnson Controls, Inc. | | 370,200 | 14,619,198 |
| Modine Manufacturing Co. (a) | | 147,000 | 1,330,350 |
| Tenneco, Inc. (a) | | 177,476 | 8,147,923 |
| Visteon Corp. | | 235,822 | 27,001,619 |
| | | | 129,595,745 |
| Diversified Consumer Services - 0.6% | | | |
| Houghton Mifflin Harcourt Co. (a) | | 1,831,364 | 39,887,108 |
| ServiceMaster Global Holdings, Inc. (a) | | 213,200 | 8,365,968 |
| | | | 48,253,076 |
| Hotels, Restaurants & Leisure - 2.8% | | | |
| Brinker International, Inc. | | 79,767 | 3,824,828 |
| Buffalo Wild Wings, Inc. (a) | | 89,100 | 14,224,815 |
| DineEquity, Inc. | | 696,400 | 58,964,188 |
| Interval Leisure Group, Inc. | | 470,600 | 7,346,066 |
| Jubilant Foodworks Ltd. | | 75,070 | 1,675,961 |
| Las Vegas Sands Corp. | | 618,188 | 27,101,362 |
| Panera Bread Co. Class A (a) | | 99,518 | 19,384,116 |
| Texas Roadhouse, Inc. Class A | | 936,500 | 33,498,605 |
| The Restaurant Group PLC | | 166,500 | 1,682,589 |
| Wyndham Worldwide Corp. | | 796,600 | 57,872,990 |
| | | | 225,575,520 |
| Household Durables - 4.1% | | | |
| Ethan Allen Interiors, Inc. | | 100,900 | 2,807,038 |
| Harman International Industries, Inc. | | 198,205 | 18,672,893 |
| iRobot Corp. (a)(b) | | 25,500 | 902,700 |
| Jarden Corp. (a) | | 1,235,350 | 70,563,192 |
| Lennar Corp. Class A (b) | | 1,291,900 | 63,186,829 |
| Mohawk Industries, Inc. (a) | | 37,800 | 7,158,942 |
| NVR, Inc. (a) | | 40,614 | 66,728,802 |
| PulteGroup, Inc. | | 3,463,000 | 61,710,660 |
| Toll Brothers, Inc. (a) | | 1,031,700 | 34,355,610 |
| Whirlpool Corp. | | 50,899 | 7,475,536 |
| | | | 333,562,202 |
| Leisure Products - 0.9% | | | |
| Brunswick Corp. | | 488,200 | 24,658,982 |
| Polaris Industries, Inc. (b) | | 529,819 | 45,537,943 |
| | | | 70,196,925 |
| Media - 1.6% | | | |
| AMC Networks, Inc. Class A (a) | | 410,100 | 30,626,268 |
| Interpublic Group of Companies, Inc. | | 2,228,985 | 51,890,771 |
| John Wiley & Sons, Inc. Class A | | 18,100 | 815,043 |
| Lions Gate Entertainment Corp. (b) | | 376,300 | 12,188,357 |
| MDC Partners, Inc. Class A | | 67,300 | 1,461,756 |
| Naspers Ltd. Class N | | 62,800 | 8,583,776 |
| News Corp. Class A | | 791,100 | 10,569,096 |
| Omnicom Group, Inc. | | 135,800 | 10,274,628 |
| | | | 126,409,695 |
| Multiline Retail - 0.8% | | | |
| Dollar Tree, Inc. (a) | | 874,200 | 67,505,724 |
| Specialty Retail - 3.0% | | | |
| AutoZone, Inc. (a) | | 52,732 | 39,122,398 |
| Dick's Sporting Goods, Inc. | | 510,600 | 18,049,710 |
| Foot Locker, Inc. | | 647,087 | 42,118,893 |
| GNC Holdings, Inc. | | 823,000 | 25,529,460 |
| L Brands, Inc. | | 141,600 | 13,568,112 |
| Party City Holdco, Inc. (b) | | 179,500 | 2,317,345 |
| Select Comfort Corp. (a) | | 71,400 | 1,528,674 |
| Signet Jewelers Ltd. | | 340,743 | 42,146,502 |
| TJX Companies, Inc. | | 536,800 | 38,064,488 |
| Urban Outfitters, Inc. (a) | | 365,800 | 8,321,950 |
| Williams-Sonoma, Inc. | | 183,200 | 10,700,712 |
| | | | 241,468,244 |
| Textiles, Apparel & Luxury Goods - 2.4% | | | |
| Deckers Outdoor Corp. (a) | | 540,500 | 25,511,600 |
| G-III Apparel Group Ltd. (a) | | 1,274,866 | 56,425,569 |
| Hanesbrands, Inc. | | 748,700 | 22,034,241 |
| Kate Spade & Co. (a) | | 368,800 | 6,553,576 |
| Page Industries Ltd. | | 21,178 | 4,270,835 |
| PVH Corp. | | 444,000 | 32,700,600 |
| Ralph Lauren Corp. | | 259,100 | 28,884,468 |
| VF Corp. | | 214,276 | 13,338,681 |
| | | | 189,719,570 |
|
| TOTAL CONSUMER DISCRETIONARY | | | 1,432,286,701 |
|
| CONSUMER STAPLES - 2.2% | | | |
| Beverages - 0.8% | | | |
| C&C Group PLC | | 1,473,293 | 5,944,889 |
| Dr. Pepper Snapple Group, Inc. | | 641,525 | 59,790,130 |
| | | | 65,735,019 |
| Food & Staples Retailing - 0.9% | | | |
| CVS Health Corp. | | 405,447 | 39,640,553 |
| Kroger Co. | | 815,880 | 34,128,260 |
| | | | 73,768,813 |
| Food Products - 0.5% | | | |
| Amplify Snack Brands, Inc. | | 70,500 | 812,160 |
| Archer Daniels Midland Co. | | 127,854 | 4,689,685 |
| Britannia Industries Ltd. | | 15,000 | 669,588 |
| Bunge Ltd. | | 374,988 | 25,604,181 |
| Ingredion, Inc. | | 59,405 | 5,693,375 |
| | | | 37,468,989 |
|
| TOTAL CONSUMER STAPLES | | | 176,972,821 |
|
| ENERGY - 3.1% | | | |
| Energy Equipment & Services - 1.1% | | | |
| Baker Hughes, Inc. | | 264,581 | 12,210,413 |
| Dril-Quip, Inc. (a) | | 478,600 | 28,347,478 |
| Ensco PLC Class A | | 107,000 | 1,646,730 |
| Halliburton Co. | | 839,200 | 28,566,368 |
| Nuverra Environmental Solutions, Inc. (a) | | 470 | 241 |
| Oceaneering International, Inc. | | 569,700 | 21,375,144 |
| | | | 92,146,374 |
| Oil, Gas & Consumable Fuels - 2.0% | | | |
| Apache Corp. | | 379,496 | 16,876,187 |
| Cimarex Energy Co. | | 298,752 | 26,702,454 |
| Columbia Pipeline Group, Inc. | | 67,721 | 1,354,420 |
| Emerald Oil, Inc. warrants 2/4/16 (a) | | 6,490 | 0 |
| Energen Corp. | | 26,603 | 1,090,457 |
| EOG Resources, Inc. | | 50,800 | 3,596,132 |
| Newfield Exploration Co. (a) | | 558,100 | 18,171,736 |
| PDC Energy, Inc. (a) | | 74,800 | 3,992,824 |
| Phillips 66 Co. | | 238,285 | 19,491,713 |
| Rice Energy, Inc. (a) | | 81,100 | 883,990 |
| SM Energy Co. | | 274,500 | 5,396,670 |
| Southwestern Energy Co. (a)(b) | | 1,276,900 | 9,078,759 |
| Suncor Energy, Inc. | | 1,778,800 | 45,919,445 |
| Western Refining, Inc. | | 149,200 | 5,314,504 |
| | | | 157,869,291 |
|
| TOTAL ENERGY | | | 250,015,665 |
|
| FINANCIALS - 20.4% | | | |
| Banks - 6.5% | | | |
| Boston Private Financial Holdings, Inc. | | 1,579,316 | 17,909,443 |
| CIT Group, Inc. | | 528,300 | 20,973,510 |
| Comerica, Inc. | | 787,529 | 32,942,338 |
| Commerce Bancshares, Inc. | | 820,449 | 34,901,900 |
| CVB Financial Corp. | | 1,142,400 | 19,329,408 |
| First Citizen Bancshares, Inc. | | 44,300 | 11,436,931 |
| First Commonwealth Financial Corp. | | 1,170,400 | 10,615,528 |
| First Republic Bank | | 538,200 | 35,553,492 |
| Hilltop Holdings, Inc. (a) | | 389,400 | 7,484,268 |
| Huntington Bancshares, Inc. | | 4,846,716 | 53,604,679 |
| Investors Bancorp, Inc. | | 2,678,600 | 33,321,784 |
| Lakeland Financial Corp. | | 679,346 | 31,671,111 |
| M&T Bank Corp. | | 395,300 | 47,902,454 |
| PacWest Bancorp | | 606,093 | 26,122,608 |
| Prosperity Bancshares, Inc. | | 259,000 | 12,395,740 |
| Regions Financial Corp. | | 3,919,900 | 37,631,040 |
| SunTrust Banks, Inc. | | 1,093,165 | 46,831,189 |
| UMB Financial Corp. | | 786,200 | 36,597,610 |
| Valley National Bancorp | | 266,400 | 2,624,040 |
| | | | 519,849,073 |
| Capital Markets - 3.1% | | | |
| Ameriprise Financial, Inc. | | 280,913 | 29,894,761 |
| E*TRADE Financial Corp. (a) | | 156,600 | 4,641,624 |
| Franklin Resources, Inc. | | 196,800 | 7,246,176 |
| Greenhill & Co., Inc. | | 235,500 | 6,737,655 |
| Invesco Ltd. | | 1,770,100 | 59,262,948 |
| Lazard Ltd. Class A | | 839,745 | 37,796,922 |
| Legg Mason, Inc. | | 240,500 | 9,434,815 |
| PJT Partners, Inc. (a) | | 34,123 | 965,340 |
| Raymond James Financial, Inc. | | 817,795 | 47,407,576 |
| Stifel Financial Corp. (a) | | 590,800 | 25,026,288 |
| The Blackstone Group LP | | 810,935 | 23,711,739 |
| | | | 252,125,844 |
| Consumer Finance - 1.6% | | | |
| American Express Co. | | 63,989 | 4,450,435 |
| Capital One Financial Corp. | | 488,500 | 35,259,930 |
| Discover Financial Services | | 245,600 | 13,169,072 |
| OneMain Holdings, Inc. (a) | | 355,700 | 14,775,778 |
| SLM Corp. (a) | | 8,999,300 | 58,675,436 |
| Synchrony Financial (a) | | 161,100 | 4,899,051 |
| | | | 131,229,702 |
| Diversified Financial Services - 1.2% | | | |
| CRISIL Ltd. | | 84,555 | 2,504,881 |
| McGraw Hill Financial, Inc. | | 814,130 | 80,256,935 |
| Moody's Corp. | | 167,900 | 16,847,086 |
| | | | 99,608,902 |
| Insurance - 4.5% | | | |
| ACE Ltd. | | 32,300 | 3,774,255 |
| AFLAC, Inc. | | 704,500 | 42,199,550 |
| Bajaj Finserv Ltd. | | 58,922 | 1,765,540 |
| Brown & Brown, Inc. | | 56,700 | 1,820,070 |
| First American Financial Corp. | | 1,466,308 | 52,640,457 |
| Hiscox Ltd. | | 1,760,076 | 27,348,181 |
| Marsh & McLennan Companies, Inc. | | 1,165,084 | 64,603,908 |
| Primerica, Inc. | | 550,920 | 26,019,952 |
| Principal Financial Group, Inc. | | 1,107,100 | 49,797,358 |
| Progressive Corp. | | 319,600 | 10,163,280 |
| Reinsurance Group of America, Inc. | | 674,058 | 57,665,662 |
| The Chubb Corp. | | 147,100 | 19,511,344 |
| The Travelers Companies, Inc. | | 9,000 | 1,015,740 |
| | | | 358,325,297 |
| Real Estate Investment Trusts - 0.5% | | | |
| Ladder Capital Corp. Class A | | 1,444,799 | 17,944,404 |
| Mid-America Apartment Communities, Inc. | | 121,300 | 11,015,253 |
| SL Green Realty Corp. | | 8,400 | 949,032 |
| VEREIT, Inc. | | 754,400 | 5,974,848 |
| | | | 35,883,537 |
| Real Estate Management & Development - 2.2% | | | |
| CBRE Group, Inc. (a) | | 2,547,523 | 88,093,345 |
| Colliers International Group, Inc. | | 24,800 | 1,104,840 |
| Jones Lang LaSalle, Inc. | | 566,560 | 90,570,282 |
| Realogy Holdings Corp. (a) | | 21,900 | 803,073 |
| | | | 180,571,540 |
| Thrifts & Mortgage Finance - 0.8% | | | |
| Beneficial Bancorp, Inc. (a) | | 427,862 | 5,699,122 |
| BofI Holding, Inc. (a)(b) | | 106,700 | 2,246,035 |
| Essent Group Ltd. (a) | | 2,413,800 | 52,838,082 |
| Housing Development Finance Corp. Ltd. | | 349,130 | 6,635,357 |
| | | | 67,418,596 |
|
| TOTAL FINANCIALS | | | 1,645,012,491 |
|
| HEALTH CARE - 13.6% | | | |
| Biotechnology - 0.9% | | | |
| Amgen, Inc. | | 32,700 | 5,308,191 |
| Baxalta, Inc. | | 344,000 | 13,426,320 |
| Biogen, Inc. (a) | | 54,800 | 16,787,980 |
| BioMarin Pharmaceutical, Inc. (a) | | 8,500 | 890,460 |
| Medivation, Inc. (a) | | 19,900 | 961,966 |
| United Therapeutics Corp. (a) | | 196,300 | 30,742,543 |
| | | | 68,117,460 |
| Health Care Equipment & Supplies - 4.3% | | | |
| Alere, Inc. (a) | | 37,000 | 1,446,330 |
| Becton, Dickinson & Co. | | 173,300 | 26,703,797 |
| Boston Scientific Corp. (a) | | 3,814,103 | 70,332,059 |
| DENTSPLY International, Inc. | | 783,000 | 47,645,550 |
| Hologic, Inc. (a) | | 1,594,824 | 61,703,741 |
| St. Jude Medical, Inc. | | 62,300 | 3,848,271 |
| Steris PLC (b) | | 966,500 | 72,816,110 |
| Zimmer Biomet Holdings, Inc. | | 635,100 | 65,154,909 |
| | | | 349,650,767 |
| Health Care Providers & Services - 3.8% | | | |
| Cardinal Health, Inc. | | 950,847 | 84,882,112 |
| Cigna Corp. | | 97,500 | 14,267,175 |
| Community Health Systems, Inc. (a) | | 473,900 | 12,572,567 |
| DaVita HealthCare Partners, Inc. (a) | | 728,500 | 50,783,735 |
| HCA Holdings, Inc. (a) | | 638,135 | 43,157,070 |
| Laboratory Corp. of America Holdings (a) | | 340,900 | 42,148,876 |
| McKesson Corp. | | 250,750 | 49,455,423 |
| Molina Healthcare, Inc. (a) | | 32,400 | 1,948,212 |
| Surgery Partners, Inc. (a)(b) | | 181,800 | 3,725,082 |
| Surgical Care Affiliates, Inc. (a) | | 103,100 | 4,104,411 |
| Universal Health Services, Inc. Class B | | 6,200 | 740,838 |
| | | | 307,785,501 |
| Life Sciences Tools & Services - 1.5% | | | |
| Agilent Technologies, Inc. | | 814,606 | 34,058,677 |
| Bruker Corp. (a) | | 616,800 | 14,969,736 |
| Thermo Fisher Scientific, Inc. | | 489,963 | 69,501,252 |
| | | | 118,529,665 |
| Pharmaceuticals - 3.1% | | | |
| Allergan PLC (a) | | 186,745 | 58,357,813 |
| Catalent, Inc. (a) | | 511,500 | 12,802,845 |
| Endo Health Solutions, Inc. (a) | | 870,800 | 53,310,376 |
| Horizon Pharma PLC (a) | | 165,870 | 3,594,403 |
| Jazz Pharmaceuticals PLC (a) | | 405,271 | 56,964,892 |
| Perrigo Co. PLC | | 10,900 | 1,577,230 |
| Teva Pharmaceutical Industries Ltd. sponsored ADR | | 951,656 | 62,466,700 |
| | | | 249,074,259 |
|
| TOTAL HEALTH CARE | | | 1,093,157,652 |
|
| INDUSTRIALS - 14.5% | | | |
| Aerospace & Defense - 2.4% | | | |
| Curtiss-Wright Corp. | | 396,548 | 27,163,538 |
| Esterline Technologies Corp. (a) | | 238,248 | 19,298,088 |
| Huntington Ingalls Industries, Inc. | | 234,800 | 29,784,380 |
| Rockwell Collins, Inc. | | 445,583 | 41,127,311 |
| Textron, Inc. | | 1,879,181 | 78,944,394 |
| | | | 196,317,711 |
| Air Freight & Logistics - 0.9% | | | |
| C.H. Robinson Worldwide, Inc. | | 242,600 | 15,046,052 |
| FedEx Corp. | | 369,011 | 54,978,949 |
| | | | 70,025,001 |
| Airlines - 1.3% | | | |
| Allegiant Travel Co. | | 63,400 | 10,640,422 |
| Copa Holdings SA Class A | | 67,400 | 3,252,724 |
| Southwest Airlines Co. | | 777,600 | 33,483,456 |
| Spirit Airlines, Inc. (a) | | 1,456,013 | 58,022,118 |
| | | | 105,398,720 |
| Building Products - 0.5% | | | |
| A.O. Smith Corp. | | 207,800 | 15,919,558 |
| Lennox International, Inc. | | 210,356 | 26,273,464 |
| | | | 42,193,022 |
| Commercial Services & Supplies - 1.1% | | | |
| Copart, Inc. (a) | | 111,100 | 4,222,911 |
| G&K Services, Inc. Class A | | 203,000 | 12,768,700 |
| Herman Miller, Inc. | | 303,600 | 8,713,320 |
| HNI Corp. | | 231,277 | 8,339,849 |
| KAR Auction Services, Inc. | | 321,282 | 11,897,072 |
| Knoll, Inc. | | 1,026,700 | 19,301,960 |
| Matthews International Corp. Class A | | 104,700 | 5,596,215 |
| Multi-Color Corp. | | 66,100 | 3,953,441 |
| Republic Services, Inc. | | 301,213 | 13,250,360 |
| | | | 88,043,828 |
| Construction & Engineering - 1.0% | | | |
| AECOM (a) | | 31,800 | 954,954 |
| EMCOR Group, Inc. | | 925,707 | 44,470,964 |
| Jacobs Engineering Group, Inc. (a) | | 755,055 | 31,674,557 |
| Quanta Services, Inc. (a) | | 360,371 | 7,297,513 |
| | | | 84,397,988 |
| Electrical Equipment - 0.1% | | | |
| AMETEK, Inc. | | 185,500 | 9,940,945 |
| Rockwell Automation, Inc. | | 15,900 | 1,631,499 |
| | | | 11,572,444 |
| Industrial Conglomerates - 0.6% | | | |
| Roper Technologies, Inc. | | 233,686 | 44,351,266 |
| Machinery - 4.6% | | | |
| AGCO Corp. | | 672,000 | 30,502,080 |
| Caterpillar, Inc. (b) | | 55,265 | 3,755,809 |
| Colfax Corp. (a) | | 783,400 | 18,292,390 |
| Cummins, Inc. | | 203,175 | 17,881,432 |
| Deere & Co. (b) | | 356,600 | 27,197,882 |
| IDEX Corp. | | 17,500 | 1,340,675 |
| Illinois Tool Works, Inc. | | 439,367 | 40,720,534 |
| Ingersoll-Rand PLC | | 627,345 | 34,685,905 |
| Manitowoc Co., Inc. (b) | | 882,579 | 13,547,588 |
| Mueller Industries, Inc. | | 719,904 | 19,509,398 |
| Rexnord Corp. (a) | | 3,617,434 | 65,547,904 |
| Snap-On, Inc. | | 160,600 | 27,531,658 |
| Stanley Black & Decker, Inc. | | 74,400 | 7,940,712 |
| Valmont Industries, Inc. | | 141,881 | 15,042,224 |
| Wabtec Corp. | | 116,660 | 8,296,859 |
| Woodward, Inc. | | 527,107 | 26,176,134 |
| Xylem, Inc. | | 263,600 | 9,621,400 |
| | | | 367,590,584 |
| Professional Services - 0.7% | | | |
| CEB, Inc. | | 224,600 | 13,788,194 |
| Dun & Bradstreet Corp. | | 428,205 | 44,503,346 |
| | | | 58,291,540 |
| Road & Rail - 0.6% | | | |
| ArcBest Corp. | | 30,140 | 644,695 |
| CSX Corp. | | 193,000 | 5,008,350 |
| J.B. Hunt Transport Services, Inc. | | 52,500 | 3,851,400 |
| Old Dominion Freight Lines, Inc. (a) | | 269,300 | 15,907,551 |
| Saia, Inc. (a) | | 741,205 | 16,491,811 |
| Swift Transporation Co. (a) | | 588,178 | 8,128,620 |
| | | | 50,032,427 |
| Trading Companies & Distributors - 0.7% | | | |
| Air Lease Corp. Class A (b) | | 1,018,894 | 34,112,571 |
| HD Supply Holdings, Inc. (a) | | 82,900 | 2,489,487 |
| Misumi Group, Inc. | | 775,200 | 10,708,345 |
| WESCO International, Inc. (a) | | 111,400 | 4,865,952 |
| | | | 52,176,355 |
|
| TOTAL INDUSTRIALS | | | 1,170,390,886 |
|
| INFORMATION TECHNOLOGY - 24.4% | | | |
| Communications Equipment - 1.1% | | | |
| Brocade Communications Systems, Inc. | | 868,403 | 7,971,940 |
| CommScope Holding Co., Inc. (a) | | 1,207,390 | 31,259,327 |
| F5 Networks, Inc. (a) | | 455,554 | 44,170,516 |
| Juniper Networks, Inc. | | 189,962 | 5,242,951 |
| | | | 88,644,734 |
| Electronic Equipment & Components - 4.3% | | | |
| Arrow Electronics, Inc. (a) | | 648,180 | 35,118,392 |
| Avnet, Inc. | | 816,630 | 34,984,429 |
| Belden, Inc. | | 870,300 | 41,495,904 |
| CDW Corp. | | 1,821,220 | 76,564,089 |
| IPG Photonics Corp. (a)(b) | | 315,200 | 28,103,232 |
| Jabil Circuit, Inc. | | 260,900 | 6,076,361 |
| Keysight Technologies, Inc. (a) | | 365,453 | 10,353,283 |
| Littelfuse, Inc. | | 29,500 | 3,156,795 |
| Methode Electronics, Inc. Class A | | 529,000 | 16,838,070 |
| TE Connectivity Ltd. | | 737,266 | 47,634,756 |
| Trimble Navigation Ltd. (a) | | 1,649,600 | 35,383,920 |
| Zebra Technologies Corp. Class A (a) | | 155,100 | 10,802,715 |
| | | | 346,511,946 |
| Internet Software & Services - 0.7% | | | |
| Alphabet, Inc. Class C | | 60,302 | 45,761,982 |
| Tencent Holdings Ltd. | | 549,000 | 10,749,412 |
| | | | 56,511,394 |
| IT Services - 10.4% | | | |
| Alliance Data Systems Corp. (a) | | 226,990 | 62,778,624 |
| Blackhawk Network Holdings, Inc. (a) | | 1,492,994 | 66,005,265 |
| Broadridge Financial Solutions, Inc. | | 311,203 | 16,720,937 |
| Cognizant Technology Solutions Corp. Class A (a) | | 74,400 | 4,465,488 |
| Euronet Worldwide, Inc. (a) | | 983,477 | 71,233,239 |
| EVERTEC, Inc. | | 1,003,693 | 16,801,821 |
| Fidelity National Information Services, Inc. | | 980,777 | 59,435,086 |
| Fiserv, Inc. (a) | | 701,614 | 64,169,616 |
| FleetCor Technologies, Inc. (a) | | 387,240 | 55,348,213 |
| Genpact Ltd. (a) | | 2,744,988 | 68,569,800 |
| Global Payments, Inc. | | 1,965,376 | 126,786,398 |
| Maximus, Inc. | | 440,300 | 24,766,875 |
| The Western Union Co. | | 1,509,648 | 27,037,796 |
| Total System Services, Inc. | | 1,723,410 | 85,825,818 |
| Vantiv, Inc. (a) | | 576,400 | 27,332,888 |
| Visa, Inc. Class A | | 404,100 | 31,337,955 |
| Xerox Corp. | | 2,686,149 | 28,553,764 |
| | | | 837,169,583 |
| Semiconductors & Semiconductor Equipment - 3.0% | | | |
| Atmel Corp. | | 1,777,633 | 15,305,420 |
| Broadcom Corp. Class A | | 733,200 | 42,393,624 |
| Cree, Inc. (a) | | 796,800 | 21,250,656 |
| Intersil Corp. Class A | | 658,608 | 8,403,838 |
| Maxim Integrated Products, Inc. | | 584,300 | 22,203,400 |
| Microchip Technology, Inc. (b) | | 101,875 | 4,741,263 |
| NVIDIA Corp. | | 1,467,033 | 48,353,408 |
| NXP Semiconductors NV (a) | | 799,643 | 67,369,923 |
| Qorvo, Inc. (a) | | 74,800 | 3,807,320 |
| Semtech Corp. (a) | | 325,000 | 6,149,000 |
| | | | 239,977,852 |
| Software - 3.8% | | | |
| Activision Blizzard, Inc. | | 1,350,700 | 52,285,597 |
| Cadence Design Systems, Inc. (a) | | 2,450,100 | 50,986,581 |
| Electronic Arts, Inc. (a) | | 1,251,890 | 86,029,881 |
| Fair Isaac Corp. | | 334,900 | 31,540,882 |
| Intuit, Inc. | | 192,997 | 18,624,211 |
| Parametric Technology Corp. (a) | | 884,741 | 30,638,581 |
| Synopsys, Inc. (a) | | 884,749 | 40,353,402 |
| | | | 310,459,135 |
| Technology Hardware, Storage & Peripherals - 1.1% | | | |
| EMC Corp. | | 1,075,239 | 27,612,138 |
| SanDisk Corp. | | 431,500 | 32,789,685 |
| Western Digital Corp. | | 470,300 | 28,241,515 |
| | | | 88,643,338 |
|
| TOTAL INFORMATION TECHNOLOGY | | | 1,967,917,982 |
|
| MATERIALS - 3.0% | | | |
| Chemicals - 2.1% | | | |
| Albemarle Corp. U.S. | | 776,956 | 43,517,306 |
| Ashland, Inc. | | 86,126 | 8,845,140 |
| Eastman Chemical Co. | | 553,500 | 37,366,785 |
| Ferro Corp. (a) | | 1,648,609 | 18,332,532 |
| PolyOne Corp. | | 928,460 | 29,487,890 |
| PPG Industries, Inc. | | 99,900 | 9,872,118 |
| Praxair, Inc. | | 189,300 | 19,384,320 |
| | | | 166,806,091 |
| Containers & Packaging - 0.4% | | | |
| Aptargroup, Inc. | | 189,630 | 13,776,620 |
| WestRock Co. | | 519,500 | 23,699,590 |
| | | | 37,476,210 |
| Metals & Mining - 0.2% | | | |
| B2Gold Corp. (a) | | 8,111,000 | 8,206,548 |
| New Gold, Inc. (a) | | 2,039,120 | 4,745,224 |
| Randgold Resources Ltd. sponsored ADR | | 41,100 | 2,545,323 |
| | | | 15,497,095 |
| Paper & Forest Products - 0.3% | | | |
| Boise Cascade Co. (a) | | 986,464 | 25,184,426 |
|
| TOTAL MATERIALS | | | 244,963,822 |
|
| UTILITIES - 0.6% | | | |
| Electric Utilities - 0.5% | | | |
| Exelon Corp. | | 1,107,300 | 30,749,721 |
| OGE Energy Corp. | | 295,000 | 7,755,550 |
| | | | 38,505,271 |
| Independent Power and Renewable Electricity Producers - 0.0% | | | |
| Calpine Corp. (a) | | 171,700 | 2,484,499 |
| Dynegy, Inc. (a) | | 254,900 | 3,415,660 |
| | | | 5,900,159 |
| Multi-Utilities - 0.1% | | | |
| CMS Energy Corp. | | 160,519 | 5,791,526 |
| NiSource, Inc. | | 67,721 | 1,321,237 |
| | | | 7,112,763 |
|
| TOTAL UTILITIES | | | 51,518,193 |
|
| TOTAL COMMON STOCKS | | | |
| (Cost $7,196,519,579) | | | 8,032,236,213 |
|
| Nonconvertible Preferred Stocks - 0.1% | | | |
| FINANCIALS - 0.1% | | | |
| Capital Markets - 0.1% | | | |
| GMAC Capital Trust I Series 2, 8.125% | | | |
| (Cost $8,358,700) | | 405,466 | 10,282,618 |
|
| Money Market Funds - 1.3% | | | |
| Fidelity Cash Central Fund, 0.33% (c) | | 30,864,252 | 30,864,252 |
| Fidelity Securities Lending Cash Central Fund, 0.35% (c)(d) | | 72,375,074 | 72,375,074 |
| TOTAL MONEY MARKET FUNDS | | | |
| (Cost $103,239,326) | | | 103,239,326 |
| TOTAL INVESTMENT PORTFOLIO - 101.0% | | | |
| (Cost $7,308,117,605) | | | 8,145,758,157 |
| NET OTHER ASSETS (LIABILITIES) - (1.0)% | | | (82,484,203) |
| NET ASSETS - 100% | | | $8,063,273,954 |
Legend
(a) Non-income producing
(b) Security or a portion of the security is on loan at period end.
(c) Affiliated fund that is generally available only to investment companies and other accounts managed by Fidelity Investments. The rate quoted is the annualized seven-day yield of the fund at period end. A complete unaudited listing of the fund's holdings as of its most recent quarter end is available upon request. In addition, each Fidelity Central Fund's financial statements, which are not covered by the Fund's Report of Independent Registered Public Accounting Firm, are available on the SEC's website or upon request.
(d) Investment made with cash collateral received from securities on loan.
Affiliated Central Funds
Information regarding fiscal year to date income earned by the Fund from investments in Fidelity Central Funds is as follows:
| Fund | Income earned |
| Fidelity Cash Central Fund | $68,209 |
| Fidelity Securities Lending Cash Central Fund | 333,919 |
| Total | $402,128 |
Investment Valuation
The following is a summary of the inputs used, as of December 31, 2015, involving the Fund's assets and liabilities carried at fair value. The inputs or methodology used for valuing securities may not be an indication of the risk associated with investing in those securities. For more information on valuation inputs, and their aggregation into the levels used below, please refer to the Investment Valuation section in the accompanying Notes to Financial Statements.
| | Valuation Inputs at Reporting Date: |
| Description | Total | Level 1 | Level 2 | Level 3 |
| Investments in Securities: | | | | |
| Equities: | | | | |
| Consumer Discretionary | $1,432,286,701 | $1,417,756,129 | $14,530,572 | $-- |
| Consumer Staples | 176,972,821 | 176,303,233 | 669,588 | -- |
| Energy | 250,015,665 | 250,015,665 | -- | -- |
| Financials | 1,655,295,109 | 1,644,389,331 | 10,905,778 | -- |
| Health Care | 1,093,157,652 | 1,093,157,652 | -- | -- |
| Industrials | 1,170,390,886 | 1,159,682,541 | 10,708,345 | -- |
| Information Technology | 1,967,917,982 | 1,957,168,570 | 10,749,412 | -- |
| Materials | 244,963,822 | 244,963,822 | -- | -- |
| Utilities | 51,518,193 | 51,518,193 | -- | -- |
| Money Market Funds | 103,239,326 | 103,239,326 | -- | -- |
| Total Investments in Securities: | $8,145,758,157 | $8,098,194,462 | $47,563,695 | $-- |
Other Information
Distribution of investments by country or territory of incorporation, as a percentage of Total Net Assets, is as follows (Unaudited):
| United States of America | 88.1% |
| Bermuda | 3.8% |
| Ireland | 2.6% |
| Canada | 1.0% |
| Others (Individually Less Than 1%) | 4.5% |
| | 100.0% |
See accompanying notes which are an integral part of the financial statements.
Financial Statements
Statement of Assets and Liabilities
| | | December 31, 2015 |
| Assets | | |
Investment in securities, at value (including securities loaned of $70,372,992) — See accompanying schedule:
Unaffiliated issuers (cost $7,204,878,279) | $8,042,518,831 | |
| Fidelity Central Funds (cost $103,239,326) | 103,239,326 | |
| Total Investments (cost $7,308,117,605) | | $8,145,758,157 |
| Receivable for investments sold | | 2,413,943 |
| Receivable for fund shares sold | | 1,668,407 |
| Dividends receivable | | 8,844,998 |
| Distributions receivable from Fidelity Central Funds | | 57,265 |
| Prepaid expenses | | 18,370 |
| Other receivables | | 118,918 |
| Total assets | | 8,158,880,058 |
| Liabilities | | |
| Payable for investments purchased | $12,379,836 | |
| Payable for fund shares redeemed | 5,154,612 | |
| Accrued management fee | 3,747,681 | |
| Distribution and service plan fees payable | 1,234,422 | |
| Other affiliated payables | 588,392 | |
| Other payables and accrued expenses | 126,087 | |
| Collateral on securities loaned, at value | 72,375,074 | |
| Total liabilities | | 95,606,104 |
| Net Assets | | $8,063,273,954 |
| Net Assets consist of: | | |
| Paid in capital | | $6,760,040,663 |
| Distributions in excess of net investment income | | (115,077) |
| Accumulated undistributed net realized gain (loss) on investments and foreign currency transactions | | 465,748,069 |
| Net unrealized appreciation (depreciation) on investments and assets and liabilities in foreign currencies | | 837,600,299 |
| Net Assets | | $8,063,273,954 |
| Initial Class: | | |
| Net Asset Value, offering price and redemption price per share ($1,382,527,358 ÷ 42,341,816 shares) | | $32.65 |
| Service Class: | | |
| Net Asset Value, offering price and redemption price per share ($566,348,884 ÷ 17,474,295 shares) | | $32.41 |
| Service Class 2: | | |
| Net Asset Value, offering price and redemption price per share ($5,591,029,554 ÷ 175,676,779 shares) | | $31.83 |
| Investor Class: | | |
| Net Asset Value, offering price and redemption price per share ($523,368,158 ÷ 16,102,145 shares) | | $32.50 |
See accompanying notes which are an integral part of the financial statements.
Statement of Operations
| | | Year ended December 31, 2015 |
| Investment Income | | |
| Dividends | | $98,775,296 |
| Income from Fidelity Central Funds | | 402,128 |
| Total income | | 99,177,424 |
| Expenses | | |
| Management fee | $48,488,119 | |
| Transfer agent fees | 6,277,624 | |
| Distribution and service plan fees | 16,125,395 | |
| Accounting and security lending fees | 1,257,908 | |
| Custodian fees and expenses | 129,012 | |
| Independent trustees' compensation | 38,064 | |
| Audit | 74,079 | |
| Legal | 31,695 | |
| Interest | 16,782 | |
| Miscellaneous | 59,847 | |
| Total expenses before reductions | 72,498,525 | |
| Expense reductions | (132,320) | 72,366,205 |
| Net investment income (loss) | | 26,811,219 |
| Realized and Unrealized Gain (Loss) | | |
| Net realized gain (loss) on: | | |
| Investment securities: | | |
| Unaffiliated issuers | 506,895,720 | |
| Foreign currency transactions | 66,493 | |
| Total net realized gain (loss) | | 506,962,213 |
Change in net unrealized appreciation (depreciation) on:
Investment securities | (648,517,058) | |
| Assets and liabilities in foreign currencies | (3,073) | |
| Total change in net unrealized appreciation (depreciation) | | (648,520,131) |
| Net gain (loss) | | (141,557,918) |
| Net increase (decrease) in net assets resulting from operations | | $(114,746,699) |
See accompanying notes which are an integral part of the financial statements.
Statement of Changes in Net Assets
| | Year ended December 31, 2015 | Year ended December 31, 2014 |
| Increase (Decrease) in Net Assets | | |
| Operations | | |
| Net investment income (loss) | $26,811,219 | $14,348,386 |
| Net realized gain (loss) | 506,962,213 | 1,118,713,559 |
| Change in net unrealized appreciation (depreciation) | (648,520,131) | (608,445,007) |
| Net increase (decrease) in net assets resulting from operations | (114,746,699) | 524,616,938 |
| Distributions to shareholders from net investment income | (24,497,724) | (6,886,171) |
| Distributions to shareholders from net realized gain | (1,074,651,414) | (212,967,306) |
| Total distributions | (1,099,149,138) | (219,853,477) |
| Share transactions - net increase (decrease) | 244,251,301 | (445,133,654) |
| Total increase (decrease) in net assets | (969,644,536) | (140,370,193) |
| Net Assets | | |
| Beginning of period | 9,032,918,490 | 9,173,288,683 |
| End of period (including distributions in excess of net investment income of $115,077 and distributions in excess of net investment income of $109,829, respectively) | $8,063,273,954 | $9,032,918,490 |
See accompanying notes which are an integral part of the financial statements.
Financial Highlights — VIP Mid Cap Portfolio Initial Class
| | | | | | |
| Years ended December 31, | 2015 | 2014 | 2013 | 2012 | 2011 |
| Selected Per–Share Data | | | | | |
| Net asset value, beginning of period | $37.68 | $36.39 | $30.55 | $29.08 | $32.69 |
| Income from Investment Operations | | | | | |
| Net investment income (loss)A | .17 | .13 | .18 | .29 | .08 |
| Net realized and unrealized gain (loss) | (.59) | 2.11 | 10.57 | 3.99 | (3.55) |
| Total from investment operations | (.42) | 2.24 | 10.75 | 4.28 | (3.47) |
| Distributions from net investment income | (.16)B | (.10) | (.19) | (.20)B | (.08) |
| Distributions from net realized gain | (4.45)B | (.85) | (4.72) | (2.61)B | (.06) |
| Total distributions | (4.61) | (.95) | (4.91) | (2.81) | (.14) |
| Net asset value, end of period | $32.65 | $37.68 | $36.39 | $30.55 | $29.08 |
| Total ReturnC,D | (1.39)% | 6.29% | 36.23% | 14.83% | (10.61)% |
| Ratios to Average Net AssetsE,F | | | | | |
| Expenses before reductions | .63% | .64% | .64% | .65% | .66% |
| Expenses net of fee waivers, if any | .63% | .64% | .64% | .65% | .66% |
| Expenses net of all reductions | .63% | .63% | .63% | .63% | .65% |
| Net investment income (loss) | .49% | .35% | .52% | .90% | .25% |
| Supplemental Data | | | | | |
| Net assets, end of period (000 omitted) | $1,382,527 | $1,476,171 | $1,489,788 | $1,217,359 | $1,085,843 |
| Portfolio turnover rateG | 26%H | 142% | 132% | 187% | 84% |
A Calculated based on average shares outstanding during the period.
B The amounts shown reflect certain reclassifications related to book to tax differences that were made in the year shown.
C Total returns do not reflect charges attributable to your insurance company's separate account. Inclusion of these charges would reduce the total returns shown.
D Total returns would have been lower if certain expenses had not been reduced during the applicable periods shown.
E Fees and expenses of any underlying Fidelity Central Funds are not included in the Fund's expense ratio. The Fund indirectly bears its proportionate share of the expenses of any underlying Fidelity Central Funds.
F Expense ratios reflect operating expenses of the class. Expenses before reductions do not reflect amounts reimbursed by the investment adviser or reductions from brokerage service arrangements or reductions from other expense offset arrangements and do not represent the amount paid by the class during periods when reimbursements or reductions occur. Expenses net of fee waivers reflect expenses after reimbursement by the investment adviser but prior to reductions from brokerage service arrangements or other expense offset arrangements. Expenses net of all reductions represent the net expenses paid by the class.
G Amount does not include the portfolio activity of any underlying Fidelity Central Funds.
H The portfolio turnover rate does not include the assets acquired in the merger.
See accompanying notes which are an integral part of the financial statements.
Financial Highlights — VIP Mid Cap Portfolio Service Class
| | | | | | |
| Years ended December 31, | 2015 | 2014 | 2013 | 2012 | 2011 |
| Selected Per–Share Data | | | | | |
| Net asset value, beginning of period | $37.44 | $36.16 | $30.39 | $28.93 | $32.52 |
| Income from Investment Operations | | | | | |
| Net investment income (loss)A | .13 | .09 | .15 | .25 | .05 |
| Net realized and unrealized gain (loss) | (.59) | 2.10 | 10.49 | 3.98 | (3.54) |
| Total from investment operations | (.46) | 2.19 | 10.64 | 4.23 | (3.49) |
| Distributions from net investment income | (.13)B | (.06) | (.15) | (.16)B | (.05) |
| Distributions from net realized gain | (4.45)B | (.85) | (4.72) | (2.61)B | (.06) |
| Total distributions | (4.57)C | (.91) | (4.87) | (2.77) | (.10)D |
| Net asset value, end of period | $32.41 | $37.44 | $36.16 | $30.39 | $28.93 |
| Total ReturnE,F | (1.50)% | 6.20% | 36.06% | 14.75% | (10.72)% |
| Ratios to Average Net AssetsG,H | | | | | |
| Expenses before reductions | .73% | .74% | .74% | .75% | .76% |
| Expenses net of fee waivers, if any | .73% | .74% | .74% | .75% | .76% |
| Expenses net of all reductions | .73% | .73% | .73% | .73% | .75% |
| Net investment income (loss) | .39% | .25% | .42% | .80% | .15% |
| Supplemental Data | | | | | |
| Net assets, end of period (000 omitted) | $566,349 | $622,227 | $638,612 | $525,875 | $566,560 |
| Portfolio turnover rateI | 26%J | 142% | 132% | 187% | 84% |
A Calculated based on average shares outstanding during the period.
B The amounts shown reflect certain reclassifications related to book to tax differences that were made in the year shown.
C Total distributions of $4.57 per share is comprised of distributions from net investment income of $.128 and distributions from net realized gain of $4.445 per share.
D Total distributions of $.10 per share is comprised of distributions from net investment income of $.048 and distributions from net realized gain of $.055 per share.
E Total returns do not reflect charges attributable to your insurance company's separate account. Inclusion of these charges would reduce the total returns shown.
F Total returns would have been lower if certain expenses had not been reduced during the applicable periods shown.
G Fees and expenses of any underlying Fidelity Central Funds are not included in the Fund's expense ratio. The Fund indirectly bears its proportionate share of the expenses of any underlying Fidelity Central Funds.
H Expense ratios reflect operating expenses of the class. Expenses before reductions do not reflect amounts reimbursed by the investment adviser or reductions from brokerage service arrangements or reductions from other expense offset arrangements and do not represent the amount paid by the class during periods when reimbursements or reductions occur. Expenses net of fee waivers reflect expenses after reimbursement by the investment adviser but prior to reductions from brokerage service arrangements or other expense offset arrangements. Expenses net of all reductions represent the net expenses paid by the class.
I Amount does not include the portfolio activity of any underlying Fidelity Central Funds.
J The portfolio turnover rate does not include the assets acquired in the merger.
See accompanying notes which are an integral part of the financial statements.
Financial Highlights — VIP Mid Cap Portfolio Service Class 2
| | | | | | |
| Years ended December 31, | 2015 | 2014 | 2013 | 2012 | 2011 |
| Selected Per–Share Data | | | | | |
| Net asset value, beginning of period | $36.84 | $35.60 | $29.98 | $28.58 | $32.13 |
| Income from Investment Operations | | | | | |
| Net investment income (loss)A | .08 | .04 | .09 | .20 | –B |
| Net realized and unrealized gain (loss) | (.57) | 2.06 | 10.35 | 3.93 | (3.49) |
| Total from investment operations | (.49) | 2.10 | 10.44 | 4.13 | (3.49) |
| Distributions from net investment income | (.08)C | (.01) | (.10) | (.12)C | (.01) |
| Distributions from net realized gain | (4.45)C | (.85) | (4.72) | (2.61)C | (.06) |
| Total distributions | (4.52)D | (.86) | (4.82) | (2.73) | (.06)E |
| Net asset value, end of period | $31.83 | $36.84 | $35.60 | $29.98 | $28.58 |
| Total ReturnF,G | (1.63)% | 6.03% | 35.87% | 14.56% | (10.85)% |
| Ratios to Average Net AssetsH,I | | | | | |
| Expenses before reductions | .88% | .88% | .89% | .90% | .91% |
| Expenses net of fee waivers, if any | .88% | .88% | .89% | .90% | .91% |
| Expenses net of all reductions | .88% | .88% | .88% | .88% | .90% |
| Net investment income (loss) | .24% | .10% | .27% | .65% | - %J |
| Supplemental Data | | | | | |
| Net assets, end of period (000 omitted) | $5,591,030 | $6,431,011 | $6,574,623 | $5,335,565 | $4,888,475 |
| Portfolio turnover rateK | 26%L | 142% | 132% | 187% | 84% |
A Calculated based on average shares outstanding during the period.
B Amount represents less than $.005 per share.
C The amounts shown reflect certain reclassifications related to book to tax differences that were made in the year shown.
D Total distributions of $4.52 per share is comprised of distributions from net investment income of $.075 and distributions from net realized gain of $4.446 per share.
E Total distributions of $.06 per share is comprised of distributions from net investment income of $.007 and distributions from net realized gain of $.055 per share.
F Total returns do not reflect charges attributable to your insurance company's separate account. Inclusion of these charges would reduce the total returns shown.
G Total returns would have been lower if certain expenses had not been reduced during the applicable periods shown.
H Fees and expenses of any underlying Fidelity Central Funds are not included in the Fund's expense ratio. The Fund indirectly bears its proportionate share of the expenses of any underlying Fidelity Central Funds.
I Expense ratios reflect operating expenses of the class. Expenses before reductions do not reflect amounts reimbursed by the investment adviser or reductions from brokerage service arrangements or reductions from other expense offset arrangements and do not represent the amount paid by the class during periods when reimbursements or reductions occur. Expenses net of fee waivers reflect expenses after reimbursement by the investment adviser but prior to reductions from brokerage service arrangements or other expense offset arrangements. Expenses net of all reductions represent the net expenses paid by the class.
J Amount represents less than .005%.
K Amount does not include the portfolio activity of any underlying Fidelity Central Funds.
L The portfolio turnover rate does not include the assets acquired in the merger.
See accompanying notes which are an integral part of the financial statements.
Financial Highlights — VIP Mid Cap Portfolio Investor Class
| | | | | | |
| Years ended December 31, | 2015 | 2014 | 2013 | 2012 | 2011 |
| Selected Per–Share Data | | | | | |
| Net asset value, beginning of period | $37.53 | $36.25 | $30.46 | $29.00 | $32.60 |
| Income from Investment Operations | | | | | |
| Net investment income (loss)A | .14 | .10 | .15 | .26 | .05 |
| Net realized and unrealized gain (loss) | (.59) | 2.10 | 10.52 | 3.98 | (3.54) |
| Total from investment operations | (.45) | 2.20 | 10.67 | 4.24 | (3.49) |
| Distributions from net investment income | (.14)B | (.07) | (.16) | (.17)B | (.06) |
| Distributions from net realized gain | (4.45)B | (.85) | (4.72) | (2.61)B | (.06) |
| Total distributions | (4.58)C | (.92) | (4.88) | (2.78) | (.11)D |
| Net asset value, end of period | $32.50 | $37.53 | $36.25 | $30.46 | $29.00 |
| Total ReturnE,F | (1.47)% | 6.20% | 36.08% | 14.74% | (10.70)% |
| Ratios to Average Net AssetsG,H | | | | | |
| Expenses before reductions | .71% | .72% | .73% | .74% | .74% |
| Expenses net of fee waivers, if any | .71% | .72% | .72% | .74% | .74% |
| Expenses net of all reductions | .71% | .71% | .71% | .72% | .73% |
| Net investment income (loss) | .41% | .27% | .44% | .82% | .17% |
| Supplemental Data | | | | | |
| Net assets, end of period (000 omitted) | $523,368 | $503,509 | $470,265 | $312,004 | $314,362 |
| Portfolio turnover rateI | 26%J | 142% | 132% | 187% | 84% |
A Calculated based on average shares outstanding during the period.
B The amounts shown reflect certain reclassifications related to book to tax differences that were made in the year shown.
C Total distributions of $4.58 per share is comprised of distributions from net investment income of $.137 and distributions from net realized gain of $4.446 per share.
D Total distributions of $.11 per share is comprised of distributions from net investment income of $.056 and distributions from net realized gain of $.055 per share.
E Total returns do not reflect charges attributable to your insurance company's separate account. Inclusion of these charges would reduce the total returns shown.
F Total returns would have been lower if certain expenses had not been reduced during the applicable periods shown.
G Fees and expenses of any underlying Fidelity Central Funds are not included in the Fund's expense ratio. The Fund indirectly bears its proportionate share of the expenses of any underlying Fidelity Central Funds.
H Expense ratios reflect operating expenses of the class. Expenses before reductions do not reflect amounts reimbursed by the investment adviser or reductions from brokerage service arrangements or reductions from other expense offset arrangements and do not represent the amount paid by the class during periods when reimbursements or reductions occur. Expenses net of fee waivers reflect expenses after reimbursement by the investment adviser but prior to reductions from brokerage service arrangements or other expense offset arrangements. Expenses net of all reductions represent the net expenses paid by the class.
I Amount does not include the portfolio activity of any underlying Fidelity Central Funds.
J The portfolio turnover rate does not include the assets acquired in the merger.
See accompanying notes which are an integral part of the financial statements.
Notes to Financial Statements
For the period ended December 31, 2015
1. Organization.
VIP Mid Cap Portfolio (the Fund) is a fund of Variable Insurance Products Fund III (the Trust) and is authorized to issue an unlimited number of shares. The Trust is registered under the Investment Company Act of 1940, as amended (the 1940 Act), as an open-end management investment company organized as a Massachusetts business trust. Shares of the Fund may only be purchased by insurance companies for the purpose of funding variable annuity or variable life insurance contracts. The Fund offers the following classes of shares: Initial Class shares, Service Class shares, Service Class 2 shares and Investor Class shares. All classes have equal rights and voting privileges, except for matters affecting a single class.
2. Investments in Fidelity Central Funds.
The Fund invests in Fidelity Central Funds, which are open-end investment companies generally available only to other investment companies and accounts managed by the investment adviser and its affiliates. The Fund's Schedule of Investments lists each of the Fidelity Central Funds held as of period end, if any, as an investment of the Fund, but does not include the underlying holdings of each Fidelity Central Fund. As an Investing Fund, the Fund indirectly bears its proportionate share of the expenses of the underlying Fidelity Central Funds.
The Money Market Central Funds seek preservation of capital and current income and are managed by Fidelity Investments Money Management, Inc. (FIMM), an affiliate of the investment adviser. Annualized expenses of the Money Market Central Funds as of their most recent shareholder report date are less than .005%.
A complete unaudited list of holdings for each Fidelity Central Fund is available upon request or at the Securities and Exchange Commission (the SEC) website at www.sec.gov. In addition, the financial statements of the Fidelity Central Funds, which are not covered by the Fund's Report of Independent Registered Public Accounting Firm, are available on the SEC website or upon request.
3. Significant Accounting Policies.
The financial statements have been prepared in conformity with accounting principles generally accepted in the United States of America (GAAP), which require management to make certain estimates and assumptions at the date of the financial statements. Actual results could differ from those estimates. Subsequent events, if any, through the date that the financial statements were issued have been evaluated in the preparation of the financial statements. The following summarizes the significant accounting policies of the Fund:
Investment Valuation. Investments are valued as of 4:00 p.m. Eastern time on the last calendar day of the period. The Board of Trustees (the Board) has delegated the day to day responsibility for the valuation of the Fund's investments to the Fidelity Management & Research Company (FMR) Fair Value Committee (the Committee). In accordance with valuation policies and procedures approved by the Board, the Fund attempts to obtain prices from one or more third party pricing vendors or brokers to value its investments. When current market prices, quotations or currency exchange rates are not readily available or reliable, investments will be fair valued in good faith by the Committee, in accordance with procedures adopted by the Board. Factors used in determining fair value vary by investment type and may include market or investment specific events. The frequency with which these procedures are used cannot be predicted and they may be utilized to a significant extent. The Committee oversees the Fund's valuation policies and procedures and reports to the Board on the Committee's activities and fair value determinations. The Board monitors the appropriateness of the procedures used in valuing the Fund's investments and ratifies the fair value determinations of the Committee.
The Fund categorizes the inputs to valuation techniques used to value its investments into a disclosure hierarchy consisting of three levels as shown below:
- Level 1 – quoted prices in active markets for identical investments
- Level 2 – other significant observable inputs (including quoted prices for similar investments, interest rates, prepayment speeds, etc.)
- Level 3 – unobservable inputs (including the Fund's own assumptions based on the best information available)
Valuation techniques used to value the Fund's investments by major category are as follows:
Equity securities, including restricted securities, for which market quotations are readily available, are valued at the last reported sale price or official closing price as reported by a third party pricing vendor on the primary market or exchange on which they are traded and are categorized as Level 1 in the hierarchy. In the event there were no sales during the day or closing prices are not available, securities are valued at the last quoted bid price or may be valued using the last available price and are generally categorized as Level 2 in the hierarchy. For foreign equity securities, when market or security specific events arise, comparisons to the valuation of American Depositary Receipts (ADRs), futures contracts, Exchange-Traded Funds (ETFs) and certain indexes as well as quoted prices for similar securities may be used and would be categorized as Level 2 in the hierarchy. Utilizing these techniques may result in transfers between Level 1 and Level 2. For equity securities, including restricted securities, where observable inputs are limited, assumptions about market activity and risk are used and these securities may be categorized as Level 3 in the hierarchy.
Investments in open-end mutual funds, including the Fidelity Central Funds, are valued at their closing net asset value (NAV) each business day and are categorized as Level 1 in the hierarchy.
Changes in valuation techniques may result in transfers in or out of an assigned level within the disclosure hierarchy. The aggregate value of investments by input level, as of December 31, 2015, is included at the end of the Fund's Schedule of Investments.
Foreign Currency. The Fund may use foreign currency contracts to facilitate transactions in foreign-denominated securities. Gains and losses from these transactions may arise from changes in the value of the foreign currency or if the counterparties do not perform under the contracts' terms.
Foreign-denominated assets, including investment securities, and liabilities are translated into U.S. dollars at the exchange rates at period end. Purchases and sales of investment securities, income and dividends received and expenses denominated in foreign currencies are translated into U.S. dollars at the exchange rate in effect on the transaction date.
The effects of exchange rate fluctuations on investments are included with the net realized and unrealized gain (loss) on investment securities. Other foreign currency transactions resulting in realized and unrealized gain (loss) are disclosed separately.
Investment Transactions and Income. For financial reporting purposes, the Fund's investment holdings and NAV include trades executed through the end of the last business day of the period. The NAV per share for processing shareholder transactions is calculated as of the close of business of the New York Stock Exchange (NYSE), normally 4:00 p.m. Eastern time and includes trades executed through the end of the prior business day. Gains and losses on securities sold are determined on the basis of identified cost and may include proceeds received from litigation. Dividend income is recorded on the ex-dividend date, except for certain dividends from foreign securities where the ex-dividend date may have passed, which are recorded as soon as the Fund is informed of the ex-dividend date. Non-cash dividends included in dividend income, if any, are recorded at the fair market value of the securities received. Income and capital gain distributions from Fidelity Central Funds, if any, are recorded on the ex-dividend date. Distributions received on securities that represent a return of capital or capital gain are recorded as a reduction of cost of investments and/or as a realized gain. Subsequent to ex-dividend date the Fund determines the components of these distributions, based upon receipt of tax filings or other correspondence relating to the underlying investment. Investment income is recorded net of foreign taxes withheld where recovery of such taxes is uncertain.
Class Allocations and Expenses. Investment income, realized and unrealized capital gains and losses, common expenses of the Fund, and certain fund-level expense reductions, if any, are allocated daily on a pro-rata basis to each class based on the relative net assets of each class to the total net assets of the Fund. Each class differs with respect to transfer agent and distribution and service plan fees incurred. Certain expense reductions may also differ by class. For the reporting period, the allocated portion of income and expenses to each class as a percent of its average net assets may vary due to the timing of recording these transactions in relation to fluctuating net assets of the classes. Expenses directly attributable to a fund are charged to that fund. Expenses attributable to more than one fund are allocated among the respective funds on the basis of relative net assets or other appropriate methods. Expense estimates are accrued in the period to which they relate and adjustments are made when actual amounts are known.
Income Tax Information and Distributions to Shareholders. Each year, the Fund intends to qualify as a regulated investment company under Subchapter M of the Internal Revenue Code, including distributing substantially all of its taxable income and realized gains. As a result, no provision for U.S. Federal income taxes is required. As of December 31, 2015, the Fund did not have any unrecognized tax benefits in the financial statements; nor is the Fund aware of any tax positions for which it is reasonably possible that the total amounts of unrecognized tax benefits will significantly change in the next twelve months. The Fund files a U.S. federal tax return, in addition to state and local tax returns as required. The Fund's federal income tax returns are subject to examination by the Internal Revenue Service (IRS) for a period of three fiscal years after they are filed. State and local tax returns may be subject to examination for an additional fiscal year depending on the jurisdiction. Foreign taxes are provided for based on the Fund's understanding of the tax rules and rates that exist in the foreign markets in which it invests. The Fund is subject to a tax imposed on capital gains by certain countries in which it invests.
Distributions are declared and recorded on the ex-dividend date. Income dividends and capital gain distributions are declared separately for each class. Income and capital gain distributions are determined in accordance with income tax regulations, which may differ from GAAP. These differences resulted in distribution reclassifications.
Capital accounts within the financial statements are adjusted for permanent book-tax differences. These adjustments have no impact on net assets or the results of operations. Capital accounts are not adjusted for temporary book-tax differences which will reverse in a subsequent period.
Book-tax differences are primarily due to foreign currency transactions, partnerships, certain foreign taxes, equity-debt classifications and losses deferred due to wash sales and excise tax regulations.
The federal tax cost of investment securities and unrealized appreciation (depreciation) as of period end were as follows:
| Gross unrealized appreciation | $1,472,882,706 |
| Gross unrealized depreciation | (654,677,896) |
| Net unrealized appreciation (depreciation) on securities | $818,204,810 |
| Tax Cost | $7,327,553,347 |
The tax-based components of distributable earnings as of period end were as follows:
| Undistributed long-term capital gain | $493,205,790 |
| Net unrealized appreciation (depreciation) on securities and other investments | $818,164,557 |
The Fund intends to elect to defer to its next fiscal year $8,021,978 of capital losses recognized during the period November 1, 2015 to December 31, 2015.
The tax character of distributions paid was as follows:
| | December 31, 2015 | December 31, 2014 |
| Ordinary Income | $30,795,763 | $ 87,283,265 |
| Long-term Capital Gains | 1,068,353,375 | 132,570,212 |
| Total | $1,099,149,138 | $ 219,853,477 |
4. Purchases and Sales of Investments.
Purchases and sales of securities, other than short-term securities and securities acquired in the merger, aggregated $2,296,119,671 and $3,188,329,627, respectively.
5. Fees and Other Transactions with Affiliates.
Management Fee. Fidelity Management & Research Company (the investment adviser) and its affiliates provide the Fund with investment management related services for which the Fund pays a monthly management fee. The management fee is the sum of an individual fund fee rate that is based on an annual rate of .30% of the Fund's average net assets and an annualized group fee rate that averaged .25% during the period. The group fee rate is based upon the average net assets of all the mutual funds advised by the investment adviser, including any mutual funds previously advised by the investment adviser that are currently advised by Fidelity SelectCo, LLC, an affiliate of the investment adviser. The group fee rate decreases as assets under management increase and increases as assets under management decrease. For the reporting period, the total annual management fee rate was .55% of the Fund's average net assets.
Distribution and Service Plan Fees. In accordance with Rule 12b-1 of the 1940 Act, the Fund has adopted separate 12b-1 Plans for each Service Class of shares. Each Service Class pays Fidelity Distributors Corporation (FDC), an affiliate of the investment adviser, a service fee. For the period, the service fee is based on an annual rate of .10% of Service Class' average net assets and .25% of Service Class 2's average net assets.
For the period, total fees, all of which were re-allowed to insurance companies for the distribution of shares and providing shareholder support services, were as follows:
| Service Class | $614,201 |
| Service Class 2 | 15,511,194 |
| | $16,125,395 |
Transfer Agent Fees. Fidelity Investments Institutional Operations Company, Inc. (FIIOC), an affiliate of the investment adviser, is the Fund's transfer, dividend disbursing, and shareholder servicing agent. FIIOC receives an asset-based fee with respect to each class. Each class (with the exception of Investor Class) pays a fee for transfer agent services, typesetting, printing and mailing of shareholder reports, excluding mailing of proxy statements and out of pocket expenses, equal to an annual rate of .07% (.15% for Investor Class) of class-level average net assets. For the period, transfer agent fees for each class, including out of pocket expenses, were as follows:
| Initial Class | $978,036 |
| Service Class | 405,885 |
| Service Class 2 | 4,095,758 |
| Investor Class | 797,945 |
| | $6,277,624 |
Accounting and Security Lending Fees. Fidelity Service Company, Inc. (FSC), an affiliate of the investment adviser, maintains the Fund's accounting records. The accounting fee is based on the level of average net assets for each month. Under a separate contract, FSC administers the security lending program. The security lending fee is based on the number and duration of lending transactions.
Brokerage Commissions. The Fund placed a portion of its portfolio transactions with brokerage firms which are affiliates of the investment adviser. Brokerage commissions are included in net realized gain (loss) and change in net unrealized appreciation (depreciation) in the Statement of Operations. The commissions paid to these affiliated firms were $53,341 for the period.
Interfund Lending Program. Pursuant to an Exemptive Order issued by the SEC, the Fund, along with other registered investment companies having management contracts with Fidelity Management & Research Company (FMR) or other affiliated entities of FMR, may participate in an interfund lending program. This program provides an alternative credit facility allowing the funds to borrow from, or lend money to, other participating affiliated funds. At period end, there were no interfund loans outstanding. The Fund's activity in this program during the period for which loans were outstanding was as follows:
| Borrower or Lender | Average Loan Balance | Weighted Average Interest Rate | Interest Expense |
| Borrower | $9,404,229 | .36% | $9,964 |
Interfund Trades. The Fund may purchase from or sell securities to other Fidelity Funds under procedures adopted by the Board. The procedures have been designed to ensure these interfund trades are executed in accordance with Rule 17a-7 of the 1940 Act. Interfund trades are included within the respective purchases and sales amounts shown in the Purchases and Sales of Investments note.
6. Committed Line of Credit.
The Fund participates with other funds managed by the investment adviser or an affiliate in a $4.25 billion credit facility (the "line of credit") to be utilized for temporary or emergency purposes to fund shareholder redemptions or for other short-term liquidity purposes. The Fund has agreed to pay commitment fees on its pro-rata portion of the line of credit, which amounted to $12,913 and is reflected in Miscellaneous expenses on the Statement of Operations. During the period, the Fund did not borrow on this line of credit.
7. Security Lending.
The Fund lends portfolio securities through a lending agent from time to time in order to earn additional income. For equity securities, a lending agent is used and may loan securities to certain qualified borrowers, including Fidelity Capital Markets (FCM), a broker-dealer affiliated with the Fund. On the settlement date of the loan, the Fund receives collateral (in the form of U.S. Treasury obligations, letters of credit and/or cash) against the loaned securities and maintains collateral in an amount not less than 100% of the market value of the loaned securities during the period of the loan. The market value of the loaned securities is determined at the close of business of the Fund and any additional required collateral is delivered to the Fund on the next business day. The Fund or borrower may terminate the loan at any time, and if the borrower defaults on its obligation to return the securities loaned because of insolvency or other reasons, the Fund may apply collateral received from the borrower against the obligation. The Fund may experience delays and costs in recovering the securities loaned. Any cash collateral received is invested in the Fidelity Securities Lending Cash Central Fund. The value of loaned securities and cash collateral at period end are disclosed on the Fund's Statement of Assets and Liabilities. At period end, there were no security loans outstanding with FCM. Security lending income represents the income earned on investing cash collateral, less rebates paid to borrowers and any lending agent fees associated with the loan, plus any premium payments received for lending certain types of securities. Security lending income is presented in the Statement of Operations as a component of income from Fidelity Central Funds. Total security lending income during the period amounted to $333,919, including $876 from securities loaned to FCM.
8. Bank Borrowings.
The Fund is permitted to have bank borrowings for temporary or emergency purposes to fund shareholder redemptions or for other short-term liquidity requirements. The Fund has established borrowing arrangements with certain banks. The interest rate on the borrowings is the bank's base rate, as revised from time to time. The average loan balance during the period for which loans were outstanding amounted to $11,037,722. The weighted average interest rate was .62%. The interest expense amounted to $6,818 under the bank borrowing program. At period end, there were no bank borrowings outstanding.
9. Expense Reductions.
Commissions paid to certain brokers with whom the investment adviser, or its affiliates, places trades on behalf of the Fund include an amount in addition to trade execution, which may be rebated back to the Fund to offset certain expenses. This amount totaled $84,123 for the period. In addition, through arrangements with the Fund's custodian, credits realized as a result of certain uninvested cash balances were used to reduce the Fund's expenses. During the period, these credits reduced the Fund's custody expenses by $145.
In addition, during the period the investment adviser reimbursed and/or waived a portion of fund-level operating expenses in the amount $36,698 and a portion of class-level operating expenses as follows:
| | Amount |
| Investor Class | $11,354 |
10.��Distributions to Shareholders.
Distributions to shareholders of each class were as follows:
| Years ended December 31, | 2015 | 2014 |
| From net investment income | | |
| Initial Class | $6,856,691 | $3,774,917 |
| Service Class | 2,239,466 | 990,351 |
| Service Class 2 | 13,204,712 | 1,215,921 |
| Investor Class | 2,196,855 | 904,982 |
| Total | $24,497,724 | $6,886,171 |
| From net realized gain | | |
| Initial Class | $173,008,924 | $34,174,917 |
| Service Class | 73,895,308 | 14,603,745 |
| Service Class 2 | 768,328,236 | 153,016,366 |
| Investor Class | 59,418,946 | 11,172,278 |
| Total | $1,074,651,414 | $212,967,306 |
11. Share Transactions.
Transactions for each class of shares were as follows:
| | Shares | Shares | Dollars | Dollars |
| Years ended December 31, | 2015 | 2014 | 2015 | 2014 |
| Initial Class | | | | |
| Shares sold | 4,347457 | 3,868,698 | $150,311,214 | $141,786,603 |
| Issued in exchange for the shares of VIP Growth Strategies Portfolio | 360,771 | – | 12,767,680 | – |
| Reinvestment of distributions | 5,354,795 | 1,054,394 | 179,865,615 | 37,949,834 |
| Shares redeemed | (6,893,278) | (6,692,546) | (237,965,645) | (244,766,127) |
| Net increase (decrease) | 3,169,745 | (1,769,454) | $104,978,864 | $(65,029,690) |
| Service Class | | | | |
| Shares sold | 1,507,053 | 1,246,174 | $51,724,215 | $45,087,196 |
| Issued in exchange for the shares of VIP Growth Strategies Portfolio | 2,365 | – | 83,060 | – |
| Reinvestment of distributions | 2,283,479 | 437,179 | 76,134,774 | 15,594,096 |
| Shares redeemed | (2,939,119) | (2,725,033) | (101,018,159) | (98,952,997) |
| Net increase (decrease) | 853,778 | (1,041,680) | $26,923,890 | $(38,271,705) |
| Service Class 2 | | | | |
| Shares sold | 8,545,475 | 12,121,569 | $287,200,999 | $436,064,579 |
| Issued in exchange for the shares of VIP Growth Strategies Portfolio | 219,579 | – | 7,566,682 | – |
| Reinvestment of distributions | 23,864,809 | 4,408,382 | 781,532,948 | 154,232,287 |
| Shares redeemed | (31,525,458) | (26,657,188) | (1,056,122,491) | (947,962,455) |
| Net increase (decrease) | 1,104,405 | (10,127,237) | $20,178,138 | $(357,665,589) |
| Investor Class | | | | |
| Shares sold | 1,067,585 | 1,116,739 | $36,914,564 | $40,550,127 |
| Issued in exchange for the shares of VIP Growth Strategies Portfolio | 1,289,847 | – | 45,428,423 | – |
| Reinvestment of distributions | 1,843,002 | 336,975 | 61,615,801 | 12,077,260 |
| Shares redeemed | (1,513,170) | (1,012,211) | (51,788,379) | (36,794,057) |
| Net increase (decrease) | 2,687,264 | 441,503 | $92,170,409 | $15,833,330 |
12. Other.
The Fund's organizational documents provide former and current trustees and officers with a limited indemnification against liabilities arising in connection with the performance of their duties to the Fund. In the normal course of business, the Fund may also enter into contracts that provide general indemnifications. The Fund's maximum exposure under these arrangements is unknown as this would be dependent on future claims that may be made against the Fund. The risk of material loss from such claims is considered remote.
At the end of the period, the investment adviser or its affiliates were the owners of record of 11% of the total outstanding shares of the Fund.
13. Merger Information.
On April 24, 2015, the Fund acquired all of the assets and assumed all of the liabilities of VIP Growth Strategies Portfolio ("Target Fund") pursuant to an Agreement and Plan of Reorganization approved by the Board of Trustees ("The Board"). The acquisition was accomplished by an exchange of shares of each class of the Fund for corresponding shares then outstanding of the Target Fund at their respective net asset value on the acquisition date. The reorganization provides shareholders of the Target Fund access to a larger portfolio with a similar investment objective and lower expenses. The reorganization qualified as a tax-free reorganization for federal income tax purposes with no gain or loss recognized to the funds or their shareholders. The Target Fund's net assets of $65,845,845, including securities of $65,918,670 and unrealized appreciation of $3,990,039 were combined with the Fund's net assets of $9,322,211,254 for total net assets after the acquisition of $9,388,057,099.
Pro forma results of operations of the combined entity for the entire period ended December 31, 2015, as though the acquisition had occurred as of the beginning of the year (rather than on the actual acquisition date), are as follows:
| Net Investment income (loss) | $26,894,205 |
| Total net realized gain (loss) | 515,198,842 |
| Total change in net unrealized appreciation (depreciation) | (653,262,046) |
| Net increase (decrease) in net assets resulting from operations | $(111,168,999) |
Because the combined investment portfolios have been managed as a single portfolio since the acquisition was completed, it is not practicable to separate the amounts of revenue and earnings of the acquired fund that have been included in the Fund's accompanying Statement of Operations since April 24, 2015.
Report of Independent Registered Public Accounting Firm
To the Trustees of Variable Insurance Products Fund III and Shareholders of VIP Mid Cap Portfolio:
In our opinion, the accompanying statement of assets and liabilities, including the schedule of investments, and the related statements of operations and of changes in net assets and the financial highlights present fairly, in all material respects, the financial position of VIP Mid Cap Portfolio (a fund of Variable Insurance Products Fund III) at December 31, 2015, the results of its operations for the year then ended, the changes in its net assets for each of the two years in the period then ended and the financial highlights for each of the five years in the period then ended, in conformity with accounting principles generally accepted in the United States of America. These financial statements and financial highlights (hereafter referred to as “financial statements”) are the responsibility of the VIP Mid Cap Portfolio’s management. Our responsibility is to express an opinion on these financial statements based on our audits. We conducted our audits of these financial statements in accordance with the standards of the Public Company Accounting Oversight Board (United States). Those standards require that we plan and perform the audit to obtain reasonable assurance about whether the financial statements are free of material misstatement. An audit includes examining, on a test basis, evidence supporting the amounts and disclosures in the financial statements, assessing the accounting principles used and significant estimates made by management, and evaluating the overall financial statement presentation. We believe that our audits, which included confirmation of securities at December 31, 2015 by correspondence with the custodian and brokers, provide a reasonable basis for our opinion.
PricewaterhouseCoopers LLP
Boston, Massachusetts
February 16, 2016
Trustees and Officers
The Trustees, Members of the Advisory Board (if any), and officers of the trust and fund, as applicable, are listed below. The Board of Trustees governs the fund and is responsible for protecting the interests of shareholders. The Trustees are experienced executives who meet periodically throughout the year to oversee the fund's activities, review contractual arrangements with companies that provide services to the fund, oversee management of the risks associated with such activities and contractual arrangements, and review the fund's performance. Each of the Trustees oversees 170 funds.
The Trustees hold office without limit in time except that (a) any Trustee may resign; (b) any Trustee may be removed by written instrument, signed by at least two-thirds of the number of Trustees prior to such removal; (c) any Trustee who requests to be retired or who has become incapacitated by illness or injury may be retired by written instrument signed by a majority of the other Trustees; and (d) any Trustee may be removed at any special meeting of shareholders by a two-thirds vote of the outstanding voting securities of the trust. Each Trustee who is not an interested person (as defined in the 1940 Act) of the trust and the fund is referred to herein as an Independent Trustee. Each Independent Trustee shall retire not later than the last day of the calendar year in which his or her 75th birthday occurs. The Independent Trustees may waive this mandatory retirement age policy with respect to individual Trustees. Officers and Advisory Board Members hold office without limit in time, except that any officer or Advisory Board Member may resign or may be removed by a vote of a majority of the Trustees at any regular meeting or any special meeting of the Trustees. Except as indicated, each individual has held the office shown or other offices in the same company for the past five years.
The fund’s Statement of Additional Information (SAI) includes more information about the Trustees. To request a free copy, call Fidelity at 1-877-208-0098.
Experience, Skills, Attributes, and Qualifications of the Trustees. The Governance and Nominating Committee has adopted a statement of policy that describes the experience, qualifications, attributes, and skills that are necessary and desirable for potential Independent Trustee candidates (Statement of Policy). The Board believes that each Trustee satisfied at the time he or she was initially elected or appointed a Trustee, and continues to satisfy, the standards contemplated by the Statement of Policy. The Governance and Nominating Committee also engages professional search firms to help identify potential Independent Trustee candidates who have the experience, qualifications, attributes, and skills consistent with the Statement of Policy. From time to time, additional criteria based on the composition and skills of the current Independent Trustees, as well as experience or skills that may be appropriate in light of future changes to board composition, business conditions, and regulatory or other developments, have also been considered by the professional search firms and the Governance and Nominating Committee. In addition, the Board takes into account the Trustees' commitment and participation in Board and committee meetings, as well as their leadership of standing and ad hoc committees throughout their tenure.
In determining that a particular Trustee was and continues to be qualified to serve as a Trustee, the Board has considered a variety of criteria, none of which, in isolation, was controlling. The Board believes that, collectively, the Trustees have balanced and diverse experience, qualifications, attributes, and skills, which allow the Board to operate effectively in governing the fund and protecting the interests of shareholders. Information about the specific experience, skills, attributes, and qualifications of each Trustee, which in each case led to the Board's conclusion that the Trustee should serve (or continue to serve) as a trustee of the fund, is provided below.
Board Structure and Oversight Function. James C. Curvey is an interested person and currently serves as Chairman. The Trustees have determined that an interested Chairman is appropriate and benefits shareholders because an interested Chairman has a personal and professional stake in the quality and continuity of services provided to the fund. Independent Trustees exercise their informed business judgment to appoint an individual of their choosing to serve as Chairman, regardless of whether the Trustee happens to be independent or a member of management. The Independent Trustees have determined that they can act independently and effectively without having an Independent Trustee serve as Chairman and that a key structural component for assuring that they are in a position to do so is for the Independent Trustees to constitute a substantial majority for the Board. The Independent Trustees also regularly meet in executive session. Ned C. Lautenbach serves as Chairman of the Independent Trustees and as such (i) acts as a liaison between the Independent Trustees and management with respect to matters important to the Independent Trustees and (ii) with management prepares agendas for Board meetings.
Fidelity® funds are overseen by different Boards of Trustees. The fund's Board oversees Fidelity's high income and certain equity funds, and other Boards oversee Fidelity's investment-grade bond, money market, asset allocation, and sector funds. The asset allocation funds may invest in Fidelity® funds overseen by the fund's Board. The use of separate Boards, each with its own committee structure, allows the Trustees of each group of Fidelity® funds to focus on the unique issues of the funds they oversee, including common research, investment, and operational issues. On occasion, the separate Boards establish joint committees to address issues of overlapping consequences for the Fidelity® funds overseen by each Board.
The Trustees operate using a system of committees to facilitate the timely and efficient consideration of all matters of importance to the Trustees, the fund, and fund shareholders and to facilitate compliance with legal and regulatory requirements and oversight of the fund's activities and associated risks. The Board, acting through its committees, has charged FMR and its affiliates with (i) identifying events or circumstances the occurrence of which could have demonstrably adverse effects on the fund's business and/or reputation; (ii) implementing processes and controls to lessen the possibility that such events or circumstances occur or to mitigate the effects of such events or circumstances if they do occur; and (iii) creating and maintaining a system designed to evaluate continuously business and market conditions in order to facilitate the identification and implementation processes described in (i) and (ii) above. Because the day-to-day operations and activities of the fund are carried out by or through FMR, its affiliates, and other service providers, the fund's exposure to risks is mitigated but not eliminated by the processes overseen by the Trustees. While each of the Board's committees has responsibility for overseeing different aspects of the fund's activities, oversight is exercised primarily through the Operations, Audit, and Compliance Committees. In addition, the Independent Trustees have worked with FMR to enhance the Board's oversight of investment and financial risks, legal and regulatory risks, technology risks, and operational risks, including the development of additional risk reporting to the Board. For example, a working group comprised of Independent Trustees and FMR has worked and continues to work to review the Fidelity® funds' valuation-related activities, reporting and risk management. Appropriate personnel, including but not limited to the fund's Chief Compliance Officer (CCO), FMR's internal auditor, the independent accountants, the fund's Treasurer and portfolio management personnel, make periodic reports to the Board's committees, as appropriate, including an annual review of Fidelity's risk management program for the Fidelity® funds. The responsibilities of each standing committee, including their oversight responsibilities, are described further under "Standing Committees of the Trustees."
Interested Trustees*:
Correspondence intended for a Trustee who is an interested person may be sent to Fidelity Investments, 245 Summer Street, Boston, Massachusetts 02210.
Name, Year of Birth; Principal Occupations and Other Relevant Experience+
James C. Curvey (1935)
Year of Election or Appointment: 2007
Trustee
Chairman of the Board of Trustees
Mr. Curvey also serves as Trustee of other Fidelity® funds. Mr. Curvey is a Director of Fidelity Research & Analysis Co. (investment adviser firm, 2009-present), and Vice Chairman (2007-present) and Director of FMR LLC (diversified financial services company). In addition, Mr. Curvey serves as an Overseer for the Boston Symphony Orchestra and a member of the board of Artis-Naples, Naples, Florida, and as a Trustee for Brewster Academy, Wolfeboro, New Hampshire. Previously, Mr. Curvey served as a Director of Fidelity Investments Money Management, Inc. (investment adviser firm, 2009-2014) and a Director of FMR and FMR Co., Inc. (investment adviser firms, 2007-2014).
Charles S. Morrison (1960)
Year of Election or Appointment: 2014
Trustee
Mr. Morrison also serves as Trustee of other funds. He serves as a Director of Fidelity Investments Money Management, Inc. (FIMM) (investment adviser firm, 2014-present), Director of Fidelity SelectCo, LLC (investment adviser firm, 2014-present), President, Asset Management (2014-present), and is an employee of Fidelity Investments. Previously, Mr. Morrison served as Vice President of Fidelity's Fixed Income and Asset Allocation Funds (2012-2014), President, Fixed Income (2011-2014), Vice President of Fidelity's Money Market Funds (2005-2009), President, Money Market Group Leader of FMR (investment adviser firm, 2009), and Senior Vice President, Money Market Group of FMR (2004-2009). Mr. Morrison also served as Vice President of Fidelity's Bond Funds (2002-2005), certain Balanced Funds (2002-2005), and certain Asset Allocation Funds (2002-2007), and as Senior Vice President (2002-2005) of Fidelity's Bond Division.
* Determined to be an “Interested Trustee” by virtue of, among other things, his or her affiliation with the trust or various entities under common control with FMR.
+ The information includes the Trustee's principal occupation during the last five years and other information relating to the experience, attributes, and skills relevant to the Trustee's qualifications to serve as a Trustee, which led to the conclusion that the Trustee should serve as a Trustee for the fund.
Independent Trustees:
Correspondence intended for an Independent Trustee may be sent to Fidelity Investments, P.O. Box 55235, Boston, Massachusetts 02205-5235.
Name, Year of Birth; Principal Occupations and Other Relevant Experience+
Dennis J. Dirks (1948)
Year of Election or Appointment: 2005
Trustee
Mr. Dirks also serves as Trustee of other Fidelity® funds. Prior to his retirement in May 2003, Mr. Dirks was Chief Operating Officer and a member of the Board of The Depository Trust & Clearing Corporation (DTCC). He also served as President, Chief Operating Officer, and Board member of The Depository Trust Company (DTC) and President and Board member of the National Securities Clearing Corporation (NSCC). In addition, Mr. Dirks served as Chief Executive Officer and Board member of the Government Securities Clearing Corporation, Chief Executive Officer and Board member of the Mortgage-Backed Securities Clearing Corporation, as a Trustee and a member of the Finance Committee of Manhattan College (2005-2008), as a Trustee and a member of the Finance Committee of AHRC of Nassau County (2006-2008), and as a member of the Independent Directors Council (IDC) Governing Council (2010-2015). Mr. Dirks is a member of the Board of Directors for The Brookville Center for Children's Services, Inc. (2009-present).
Alan J. Lacy (1953)
Year of Election or Appointment: 2008
Trustee
Mr. Lacy also serves as Trustee of other Fidelity® funds. Mr. Lacy serves as Chairman (2014-present) and a member (2010-present) of the Board of Directors of Dave & Buster's Entertainment, Inc. (restaurant and entertainment complexes) and a Director of Bristol-Myers Squibb Company (global pharmaceuticals, 2008-present). He is a Trustee of the California Chapter of The Nature Conservancy (2015-present) and a Director of the Center for Advanced Study in the Behavioral Sciences at Stanford University (2015-present). In addition, Mr. Lacy served as Senior Adviser (2007-2014) of Oak Hill Capital Partners, L.P. (private equity) and also served as Chief Executive Officer (2005) and Vice Chairman (2005-2006) of Sears Holdings Corporation (retail) and Chief Executive Officer and Chairman of the Board of Sears, Roebuck and Co. (retail, 2000-2005). Previously, Mr. Lacy served as Chairman (2008-2011) and a member (2006-2015) of the Board of Trustees of the National Parks Conservation Association and as a member of the Board of Directors for The Western Union Company (global money transfer, 2006-2011), The Hillman Companies, Inc. (hardware wholesalers, 2010-2014), and Earth Fare, Inc. (retail grocery, 2010-2014).
Ned C. Lautenbach (1944)
Year of Election or Appointment: 2000
Trustee
Chairman of the Independent Trustees
Mr. Lautenbach also serves as Trustee of other Fidelity® funds. Mr. Lautenbach currently serves as the Lead Director of the Eaton Corporation Board of Directors (diversified industrial, 1997-present). Mr. Lautenbach is Chairman of the Board of Directors of Artis-Naples in Naples, Florida (2012-present), a member of the Council on Foreign Relations (1994-present), and a member of the Board of Governors, State University System of Florida (2013-present). Previously, Mr. Lautenbach was a Partner/Advisory Partner at Clayton, Dubilier & Rice, LLC (private equity investment, 1998-2010), as well as a Director of Sony Corporation (2006-2007).
Joseph Mauriello (1944)
Year of Election or Appointment: 2008
Trustee
Mr. Mauriello also serves as Trustee of other Fidelity® funds. Prior to his retirement in January 2006, Mr. Mauriello served in numerous senior management positions including Deputy Chairman and Chief Operating Officer (2004-2005), and Vice Chairman of Financial Services (2002-2004) of KPMG LLP US (professional services, 1965-2005). Mr. Mauriello currently serves as a member of the Board of Directors of XL Group plc. (global insurance and re-insurance, 2006-present) and the Independent Directors Council (IDC) Governing Council (2015-present). Previously, Mr. Mauriello served as a Director of the Hamilton Funds of the Bank of New York (2006-2007) and of Arcadia Resources Inc. (health care services and products, 2007-2012).
Robert W. Selander (1950)
Year of Election or Appointment: 2011
Trustee
Mr. Selander also serves as Trustee of other Fidelity® funds. Mr. Selander serves as a Director of The Western Union Company (global money transfer, 2014-present) and a non-executive Chairman of Health Equity, Inc. (health savings custodian, 2015-present). Previously, Mr. Selander served as a Member of the Advisory Board of other Fidelity® funds (2011), and Executive Vice Chairman (2010), Chief Executive Officer (2009-2010), and President and Chief Executive Officer (1997-2009) of Mastercard, Inc.
Cornelia M. Small (1944)
Year of Election or Appointment: 2005
Trustee
Ms. Small also serves as Trustee of other Fidelity® funds. Ms. Small is a member of the Board of Directors (2009-present) and Chair of the Investment Committee (2010-present) of the Teagle Foundation. Ms. Small also serves on the Investment Committee of the Berkshire Taconic Community Foundation (2008-present). Previously, Ms. Small served as Chairperson (2002-2008) and a member of the Investment Committee and Chairperson (2008-2012) and a member of the Board of Trustees of Smith College. In addition, Ms. Small served as Chief Investment Officer, Director of Global Equity Investments, and a member of the Board of Directors of Scudder, Stevens & Clark and Scudder Kemper Investments.
William S. Stavropoulos (1939)
Year of Election or Appointment: 2002
Trustee
Vice Chairman of the Independent Trustees
Mr. Stavropoulos also serves as Trustee of other Fidelity® funds. Mr. Stavropoulos serves as President and Founder of the Michigan Baseball Foundation, the Great Lakes Loons (2007-present). Mr. Stavropoulos is Chairman Emeritus of the Board of Directors of The Dow Chemical Company, where he previously served in numerous senior management positions, including President, CEO (1995-2000; 2002-2004), Chairman of the Executive Committee (2000-2006), and as a member of the Board of Directors (1990-2006). Currently, Mr. Stavropoulos is Chairman of the Board of Directors of Univar Inc. (global distributor of commodity and specialty chemicals), a Director of Teradata Corporation (data warehousing and technology solutions), and Maersk Inc. (industrial conglomerate), and a member of the Advisory Board for Metalmark Capital LLC (private equity investment, 2005-present). Mr. Stavropoulos is an operating advisor to Clayton, Dubilier & Rice, LLC (private equity investment). In addition, Mr. Stavropoulos is a member of the University of Notre Dame Advisory Council for the College of Science, a Trustee of the Rollin L. Gerstacker Foundation, and a Director of the Naples Philharmonic Center for the Arts. Previously, Mr. Stavropoulos served as a Director of Chemical Financial Corporation (bank holding company, 1993-2012) and Tyco International, Ltd. (multinational manufacturing and services, 2007-2012).
David M. Thomas (1949)
Year of Election or Appointment: 2008
Trustee
Mr. Thomas also serves as Trustee of other Fidelity® funds. Mr. Thomas serves as Non-Executive Chairman of the Board of Directors of Fortune Brands Home and Security (home and security products, 2011-present), as a member of the Board of Directors (2004-present) and Presiding Director (2013-present) of Interpublic Group of Companies, Inc. (marketing communication), and as a member of the Board of Trustees of the University of Florida (2013-present). Previously, Mr. Thomas served as Executive Chairman (2005-2006) and Chairman and Chief Executive Officer (2000-2005) of IMS Health, Inc. (pharmaceutical and healthcare information solutions), and a Director of Fortune Brands, Inc. (consumer products, 2000-2011).
+ The information includes the Trustee's principal occupation during the last five years and other information relating to the experience, attributes, and skills relevant to the Trustee's qualifications to serve as a Trustee, which led to the conclusion that the Trustee should serve as a Trustee for the fund.
Advisory Board Members and Officers:
Correspondence intended for an officer or Peter S. Lynch may be sent to Fidelity Investments, 245 Summer Street, Boston, Massachusetts 02210. Officers appear below in alphabetical order.
Name, Year of Birth; Principal Occupation
Peter S. Lynch (1944)
Year of Election or Appointment: 2003
Member of the Advisory Board
Mr. Lynch also serves as Member of the Advisory Board of other Fidelity® funds. Mr. Lynch is Vice Chairman and a Director of FMR (investment adviser firm) and FMR Co., Inc. (investment adviser firm). In addition, Mr. Lynch serves as a Trustee of Boston College and as the Chairman of the Inner-City Scholarship Fund. Previously, Mr. Lynch served on the Special Olympics International Board of Directors (1997-2006).
Marc R. Bryant (1966)
Year of Election or Appointment: 2015
Secretary and Chief Legal Officer (CLO)
Mr. Bryant also serves as Secretary and CLO of other funds. Mr. Bryant serves as CLO, Secretary, and Senior Vice President of Fidelity Management & Research Company (investment adviser firm, 2015-present) and FMR Co., Inc. (investment adviser firm, 2015-present); Secretary of Fidelity SelectCo, LLC (investment adviser firm, 2015-present) and Fidelity Investments Money Management, Inc. (investment adviser firm, 2015-present); and CLO of Fidelity Management & Research (Hong Kong) Limited (investment adviser firm, 2015-present). He is Senior Vice President and Deputy General Counsel of FMR LLC (diversified financial services company). Previously, Mr. Bryant served as Secretary and CLO of Fidelity Rutland Square Trust II (2010-2014) and Assistant Secretary of Fidelity's Fixed Income and Asset Allocation Funds (2013-2015). Prior to joining Fidelity Investments, Mr. Bryant served as a Senior Vice President and the Head of Global Retail Legal for AllianceBernstein L.P. (2006-2010), and as the General Counsel for ProFund Advisors LLC (2001-2006).
William C. Coffey (1969)
Year of Election or Appointment: 2009
Assistant Secretary
Mr. Coffey also serves as Assistant Secretary of other funds. He is Senior Vice President and Deputy General Counsel of FMR LLC (diversified financial services company, 2010-present), and is an employee of Fidelity Investments. Previously, Mr. Coffey served as Vice President and Associate General Counsel of FMR LLC (2005-2009).
Jonathan Davis (1968)
Year of Election or Appointment: 2010
Assistant Treasurer
Mr. Davis also serves as Assistant Treasurer of other funds, and is an employee of Fidelity Investments. Previously, Mr. Davis served as Vice President and Associate General Counsel of FMR LLC (diversified financial services company, 2003-2010).
Adrien E. Deberghes (1967)
Year of Election or Appointment: 2008
Deputy Treasurer
Mr. Deberghes also serves as an officer of other funds. He is an employee of Fidelity Investments (2008-present). Prior to joining Fidelity Investments, Mr. Deberghes was Senior Vice President of Mutual Fund Administration at State Street Corporation (2007-2008), Senior Director of Mutual Fund Administration at Investors Bank & Trust (2005-2007), and Director of Finance for Dunkin' Brands (2000-2005).
Stephanie J. Dorsey (1969)
Year of Election or Appointment: 2010
Assistant Treasurer
Ms. Dorsey also serves as an officer of other funds. She is an employee of Fidelity Investments (2008-present) and has served in other fund officer roles. Prior to joining Fidelity Investments, Ms. Dorsey served as Treasurer (2004-2008) of the JPMorgan Mutual Funds and Vice President (2004-2008) of JPMorgan Chase Bank.
Howard J. Galligan III (1966)
Year of Election or Appointment: 2014
Chief Financial Officer
Mr. Galligan also serves as Chief Financial Officer of other funds. Mr. Galligan serves as President of Fidelity Pricing and Cash Management Services (FPCMS) (2014-present) and as a Director of Strategic Advisers, Inc. (investment adviser firm, 2008-present). Previously, Mr. Galligan served as Chief Administrative Officer of Asset Management (2011-2014) and Chief Operating Officer and Senior Vice President of Investment Support for Strategic Advisers, Inc. (2003-2011).
Scott C. Goebel (1968)
Year of Election or Appointment: 2015
Vice President
Mr. Goebel serves as Vice President of other funds and is an employee of Fidelity Investments (2001-present). Previously, Mr. Goebel served as Secretary of Fidelity SelectCo, LLC (investment adviser firm, 2013-2015), Fidelity Investments Money Management, Inc. (FIMM) (investment adviser firm, 2010-2015), and Fidelity Research and Analysis Company (FRAC) (investment adviser firm, 2010-2015); General Counsel, Secretary, and Senior Vice President of Fidelity Management & Research Company (investment adviser firm, 2008-2015) and FMR Co., Inc. (investment adviser firm, 2008-2015); Assistant Secretary of Fidelity Management & Research (Japan) Limited (investment adviser firm, 2008-2015) and FMR Investment Management (U.K.) Limited (investment adviser firm, 2008-2015); Chief Legal Officer (CLO) of Fidelity Management & Research (Hong Kong) Limited (investment adviser firm, 2008-2015); Secretary and CLO of certain Fidelity® funds (2008-2015); Assistant Secretary of FIMM (2008-2010), FRAC (2008-2010), and certain funds (2007-2008); and as Vice President and Secretary of Fidelity Distributors Corporation (FDC) (2005-2007).
Brian B. Hogan (1964)
Year of Election or Appointment: 2009
Vice President
Mr. Hogan also serves as Trustee or Vice President of other funds. Mr. Hogan serves as a Director of Fidelity SelectCo, LLC (investment adviser firm, 2014-present) and President of the Equity Division of FMR (investment adviser firm, 2009-present). Previously, Mr. Hogan served as Senior Vice President, Equity Research of FMR (2006-2009) and as a portfolio manager.
Chris Maher (1972)
Year of Election or Appointment: 2013
Assistant Treasurer
Mr. Maher serves as Assistant Treasurer of other funds. Mr. Maher is Vice President of Valuation Oversight and is an employee of Fidelity Investments. Previously, Mr. Maher served as Vice President of Asset Management Compliance (2013), Vice President of the Program Management Group of FMR (investment adviser firm, 2010-2013), and Vice President of Valuation Oversight (2008-2010).
John F. Papandrea (1972)
Year of Election or Appointment: 2016
Anti-Money Laundering (AML) Officer
Mr. Papandrea also serves as AML Officer of other funds. Mr. Papandrea is Vice President of FMR LLC (diversified financial services company, 2008-present) and is an employee of Fidelity Investments (2005-present).
Melissa M. Reilly (1971)
Year of Election or Appointment: 2014
Vice President of certain Equity Funds
Ms. Reilly also serves as Vice President of other funds. Ms. Reilly is an employee of Fidelity Investments (2004-present).
Kenneth B. Robins (1969)
Year of Election or Appointment: 2008
President and Treasurer
Mr. Robins also serves as an officer of other funds. Mr. Robins serves as Executive Vice President of Fidelity Investments Money Management, Inc. (FIMM) (investment adviser firm, 2013-present) and is an employee of Fidelity Investments (2004-present). Previously, Mr. Robins served in other fund officer roles.
Stacie M. Smith (1974)
Year of Election or Appointment: 2013
Deputy Treasurer
Ms. Smith also serves as an officer of other funds. She is an employee of Fidelity Investments (2009-present) and has served in other fund officer roles. Prior to joining Fidelity Investments, Ms. Smith served as Senior Audit Manager of Ernst & Young LLP (1996-2009).
Renee Stagnone (1975)
Year of Election or Appointment: 2013
Deputy Treasurer
Ms. Stagnone also serves as Deputy Treasurer of other funds. Ms. Stagnone is an employee of Fidelity Investments (1997-present).
Linda J. Wondrack (1964)
Year of Election or Appointment: 2014
Chief Compliance Officer
Ms. Wondrack also serves as Chief Compliance Officer of other funds. Ms. Wondrack is Executive Vice President and head of the Ethics Office and Asset Management Compliance for Fidelity Investments (2012-present). Ms. Wondrack also serves as Chief Compliance Officer of Fidelity SelectCo, LLC (investment adviser firm, 2014-present); Chief Compliance Officer of Impresa Management LLC (2013-present); and Chief Compliance Officer of FMR Co., Inc. (investment adviser firm), Fidelity Investments Money Management, Inc. (investment adviser firm), FMR Investment Management (U.K.) Limited (investment adviser firm), Fidelity Management & Research (Hong Kong) (investment adviser firm), Fidelity Management & Research Company (investment adviser firm), FIAM LLC (investment adviser firm), and Strategic Advisers, Inc. (investment adviser firm), Ballyrock Investment Advisors LLC, and Northern Neck Investors LLC (2012-present). Previously, Ms. Wondrack served as Chief Compliance Officer of Fidelity Management & Research (Japan) Limited (investment adviser firm, 2012-2016); Senior Vice President and Chief Compliance Officer for Columbia Management Investment Advisers, LLC (2005-2012); Chief Compliance Officer for certain funds within the Columbia Family of Funds (2007-2012); and Senior Vice President of Compliance Risk Management at Bank of America (2005-2010).
Joseph F. Zambello (1957)
Year of Election or Appointment: 2011
Deputy Treasurer
Mr. Zambello also serves as Deputy Treasurer of other funds. Mr. Zambello is an employee of Fidelity Investments (1991-present). Previously, Mr. Zambello served as Vice President of the Program Management Group of FMR (investment adviser firm, 2009-2011) and Vice President of the Transfer Agent Oversight Group (2005-2009).
Shareholder Expense Example
As a shareholder of the Fund, you incur two types of costs: (1) transaction costs and (2) ongoing costs, including management fees, distribution and/or service (12b-1) fees and other Fund expenses. This Example is intended to help you understand your ongoing costs (in dollars) of investing in the Fund and to compare these costs with the ongoing costs of investing in other mutual funds.
The Example is based on an investment of $1,000 invested at the beginning of the period and held for the entire period (July 1, 2015 to December 31, 2015).
Actual Expenses
The first line of the accompanying table for each class of the Fund provides information about actual account values and actual expenses. You may use the information in this line, together with the amount you invested, to estimate the expenses that you paid over the period. Simply divide your account value by $1,000.00 (for example, an $8,600 account value divided by $1,000.00 = 8.6), then multiply the result by the number in the first line for a class of the Fund under the heading entitled "Expenses Paid During Period" to estimate the expenses you paid on your account during this period. The estimate of expenses does not include any fees or other expenses of any variable annuity or variable life insurance product. If they were, the estimate of expenses you paid during the period would be higher, and your ending account value would be lower. In addition, the Fund, as a shareholder in the underlying Fidelity Central Funds, will indirectly bear its pro-rata share of the fees and expenses incurred by the underlying Fidelity Central Funds. These fees and expenses are not included in the Fund's annualized expense ratio used to calculate the expense estimate in the table below.
Hypothetical Example for Comparison Purposes
The second line of the accompanying table for each class of the Fund provides information about hypothetical account values and hypothetical expenses based on a Class' actual expense ratio and an assumed rate of return of 5% per year before expenses, which is not the Class' actual return. The hypothetical account values and expenses may not be used to estimate the actual ending account balance or expenses you paid for the period. You may use this information to compare the ongoing costs of investing in the Fund and other funds. To do so, compare this 5% hypothetical example with the 5% hypothetical examples that appear in the shareholder reports of the other funds. The estimate of expenses does not include any fees or other expenses of any variable annuity or variable life insurance product. If they were, the estimate of expenses you paid during the period would be higher, and your ending account value would be lower. In addition, the Fund, as a shareholder in the underlying Fidelity Central Funds, will indirectly bear its pro-rata share of the fees and expenses incurred by the underlying Fidelity Central Funds. These fees and expenses are not included in the Fund's annualized expense ratio used to calculate the expense estimate in the table below.
Please note that the expenses shown in the table are meant to highlight your ongoing costs only and do not reflect any transaction costs. Therefore, the second line of the table is useful in comparing ongoing costs only, and will not help you determine the relative total costs of owning different funds.
| | Annualized Expense Ratio-A | Beginning
Account Value
July 1, 2015 | Ending
Account Value
December 31, 2015 | Expenses Paid
During Period-B
July 1, 2015
to December 31, 2015 |
| Initial Class | .63% | | | |
| Actual | | $1,000.00 | $936.90 | $3.08 |
| Hypothetical-C | | $1,000.00 | $1,022.03 | $3.21 |
| Service Class | .73% | | | |
| Actual | | $1,000.00 | $936.50 | $3.56 |
| Hypothetical-C | | $1,000.00 | $1,021.53 | $3.72 |
| Service Class 2 | .88% | | | |
| Actual | | $1,000.00 | $936.10 | $4.29 |
| Hypothetical-C | | $1,000.00 | $1,020.77 | $4.48 |
| Investor Class | .71% | | | |
| Actual | | $1,000.00 | $936.70 | $3.47 |
| Hypothetical-C | | $1,000.00 | $1,021.63 | $3.62 |
A Annualized expense ratio reflects expenses net of applicable fee waivers.
B Expenses are equal to each Class' annualized expense ratio, multiplied by the average account value over the period, multiplied by 184/365 (to reflect the one-half year period).
C 5% return per year before expenses
Distributions (Unaudited)
The Board of Trustees of VIP Growth Strategies Portfolio voted to pay to shareholders of record at the opening of business on record date, the following distributions per share derived from capital gains realized from sales of portfolio securities:
| | Pay Date | Record Date | | Capital Gains |
| Initial Class | 04/21/15 | 04/21/15 | | $1.272 |
| Service Class | 04/21/15 | 04/21/15 | | $1.272 |
| Service Class 2 | 04/21/15 | 04/21/15 | | $1.272 |
| Investor Class | 04/21/15 | 04/21/15 | | $1.272 |
The Board of Trustees of VIP Mid Cap Portfolio voted to pay to shareholders of record at the opening of business on record date, the following distributions per share derived from capital gains realized from sales of portfolio securities:
| | Pay Date | Record Date | | Capital Gains |
| Initial Class | 02/05/16 | 02/05/16 | | $1.983 |
| Service Class | 02/05/16 | 02/05/16 | | $1.983 |
| Service Class 2 | 02/05/16 | 02/05/16 | | $1.983 |
| Investor Class | 02/05/16 | 02/05/16 | | $1.983 |
VIP Growth Strategies Portfolio hereby designates as a capital gain dividend with respect to the taxable year ended April 24, 2015 $5,514,443, or, if subsequently determined to be different, the net capital gain of such year.
VIP Mid Cap Portfolio hereby designates as a capital gain dividend with respect to the taxable year ended December 31, 2015 $495,935,518, or, if subsequently determined to be different, the net capital gain of such year.
VIP Mid Cap Portfolio Initial Class, VIP Mid Cap Portfolio Service Class, VIP Mid Cap Portfolio Service Class 2, and VIP Mid Cap Portfolio Investor Class designate 100% of the dividends distributed in December 2015, as qualifying for the dividends-received deduction for corporate shareholders.
Board Approval of Investment Advisory Contracts and Management Fees
VIP Mid Cap Portfolio
Each year, the Board of Trustees, including the Independent Trustees (together, the Board), votes on the renewal of the management contract with Fidelity Management & Research Company (FMR) and the sub-advisory agreements (together, the Advisory Contracts) for the fund. The Board, assisted by the advice of fund counsel and Independent Trustees' counsel, requests and considers a broad range of information relevant to the renewal of the Advisory Contracts throughout the year.
The Board meets regularly and, at each of its meetings, covers an extensive agenda of topics and materials and considers factors that are relevant to its annual consideration of the renewal of the fund's Advisory Contracts, including the services and support provided to the fund and its shareholders. The Board has established various standing committees (Committees), each composed of and chaired by Independent Trustees with varying backgrounds, to which the Board has assigned specific subject matter responsibilities in order to enhance effective decision-making by the Board. The Board, acting directly and through its Committees, requests and receives information concerning the annual consideration of the renewal of the fund's Advisory Contracts. The Board also meets as needed to consider matters specifically related to the Board's annual consideration of the renewal of the Advisory Contracts. Members of the Board may also meet with trustees of other Fidelity funds through ad hoc joint committees to discuss certain matters relevant to all of the Fidelity funds.
At its July 2015 meeting, the Board unanimously determined to renew the fund's Advisory Contracts. In reaching its determination, the Board considered all factors it believed relevant, including (i) the nature, extent, and quality of the services to be provided to the fund and its shareholders (including the investment performance of the fund); (ii) the competitiveness of the fund's management fee and total expense ratio relative to peer funds; (iii) the total costs of the services to be provided by and the profits to be realized by Fidelity from its relationship with the fund; and (iv) the extent to which (if any) economies of scale exist and would be realized as the fund grows, and whether any economies of scale are appropriately shared with fund shareholders.
In considering whether to renew the Advisory Contracts for the fund, the Board reached a determination, with the assistance of fund counsel and Independent Trustees' counsel and through the exercise of its business judgment, that the renewal of the Advisory Contracts was in the best interests of the fund and its shareholders and that the compensation payable under the Advisory Contracts was fair and reasonable. The Board's decision to renew the Advisory Contracts was not based on any single factor, but rather was based on a comprehensive consideration of all the information provided to the Board at its meetings throughout the year. The Board, in reaching its determination to renew the Advisory Contracts, was aware that shareholders of the fund have a broad range of investment choices available to them, including a wide choice among funds offered by Fidelity's competitors, and that the fund's shareholders, who have the opportunity to review and weigh the disclosure provided by the fund in its prospectus and other public disclosures, have chosen to invest in this fund, which is part of the Fidelity family of funds.
Nature, Extent, and Quality of Services Provided. The Board considered Fidelity's staffing as it relates to the fund, including the backgrounds of investment personnel of Fidelity, and also considered the fund's investment objective, strategies, and related investment philosophy. The Independent Trustees also had discussions with senior management of Fidelity's investment operations and investment groups. The Board considered the structure of the portfolio manager compensation program and whether this structure provides appropriate incentives to act in the best interests of the fund. Additionally, the Board considered the portfolio managers' investments, if any, in the funds that they manage.
Resources Dedicated to Investment Management and Support Services. The Board and the Fund Oversight and Research Committees reviewed the general qualifications and capabilities of Fidelity's investment staff, including its size, education, experience, and resources, as well as Fidelity's approach to recruiting, training, managing, and compensating investment personnel. The Board noted that Fidelity has continued to increase the resources devoted to non-U.S. offices, including expansion of Fidelity's global investment organization. The Board also noted that Fidelity's analysts have extensive resources, tools and capabilities that allow them to conduct sophisticated quantitative and fundamental analysis, as well as credit analysis of issuers, counterparties and guarantors. Further, the Board considered that Fidelity's investment professionals have sufficient access to global information and data so as to provide competitive investment results over time, and that those professionals also have access to sophisticated tools that permit them to assess portfolio construction and risk and performance attribution characteristics continuously, as well as to transmit new information and research conclusions rapidly around the world. Additionally, in its deliberations, the Board considered Fidelity's trading, risk management, and compliance capabilities and resources, which are integral parts of the investment management process.
Shareholder and Administrative Services. The Board considered (i) the nature, extent, quality, and cost of advisory, administrative, and shareholder services performed by FMR, the sub-advisers (together with FMR, the Investment Advisers), and their affiliates under the Advisory Contracts and under separate agreements covering transfer agency, pricing and bookkeeping, and securities lending services for the fund; (ii) the nature and extent of the supervision of third party service providers, principally custodians and subcustodians; and (iii) the resources devoted to, and the record of compliance with, the fund's compliance policies and procedures. The Board also reviewed the allocation of fund brokerage, including allocations to brokers affiliated with the Investment Advisers, the use of brokerage commissions to pay fund expenses, and the use of "soft" commission dollars to pay for research services.
The Board noted that the growth of fund assets over time across the complex allows Fidelity to reinvest in the development of services designed to enhance the value or convenience of the Fidelity funds as investment vehicles. These services include 24-hour access to account information and market information through telephone representatives and over the Internet, investor education materials and asset allocation tools, and the expanded availability of Fidelity Investor Centers.
In 2014, the Board formed an ad hoc Committee on Transfer Agency Fees to review the variety of transfer agency fee structures throughout the industry and Fidelity's competitive positioning with respect to industry participants.
Investment in a Large Fund Family. The Board considered the benefits to shareholders of investing in a Fidelity fund, including the benefits of investing in a fund that is part of a large family of funds offering a variety of investment disciplines and providing a large variety of mutual fund investor services. The Board noted that Fidelity had taken, or had made recommendations that resulted in the Fidelity funds taking, a number of actions over the previous year that benefited particular funds, including (i) continuing to dedicate additional resources to investment research and to the support of the senior management team that oversees asset management; (ii) continuing efforts to enhance Fidelity's global research capabilities; (iii) launching new funds and making other enhancements to meet client needs; (iv) reducing management fees and total expenses for certain index funds and diversified international funds; (v) continuing to launch dedicated lower cost underlying funds to meet portfolio construction needs related to expanding underlying fund options for Fidelity funds of funds, specifically for the Freedom Fund product lines; (vi) rationalizing product lines and gaining increased efficiencies through fund mergers; (vii) launching active fixed-income exchange-traded funds; (viii) continuing to develop, acquire and implement systems and technology to improve services to the funds and information security and to increase efficiency; (ix) implementing investment enhancements to further strengthen Fidelity's target date product line to increase investors' probability of success in achieving their goals; (x) modifying the eligibility criteria for certain share classes to accommodate roll-over assets from employer-sponsored retirement plans; (xi) launching a new Class W of the Freedom Index Funds to attract and retain Fidelity record-kept retirement plan assets; and (xii) implementing changes to Fidelity's money market product line in response to recent money market regulatory reforms.
Investment Performance. The Board considered whether the fund has operated in accordance with its investment objective, as well as its record of compliance with its investment restrictions and its performance history.
The Board took into account discussions with representatives of the Investment Advisers about fund investment performance that occur at Board meetings throughout the year. In this regard the Board noted that as part of regularly scheduled fund reviews and other reports to the Board on fund performance, the Board considers annualized return information for the fund, for different time periods, measured against a securities market index ("benchmark index") and a peer group of funds with similar objectives ("peer group"), if any. In its evaluation of fund investment performance, the Board gave particular attention to information indicating changes in performance of certain Fidelity funds for specific time periods and discussed with the Investment Advisers the reasons for any overperformance or underperformance.
In addition to reviewing absolute and relative fund performance, the Independent Trustees periodically consider the appropriateness of fund performance metrics in evaluating the results achieved. In general, the Independent Trustees believe that fund performance should be evaluated based on net performance (after fees and expenses) of both the highest performing and lowest performing fund share classes, where applicable, compared to appropriate benchmark indices, over appropriate time periods that may include full market cycles, and compared to peer groups, as applicable, over the same periods, taking into account relevant factors including the following: general market conditions; issuer-specific information; and fund cash flows and other factors.
The Independent Trustees recognize that shareholders evaluate performance on a net basis over their own holding periods, for which one-, three-, and five-year periods are often used as a proxy. For this reason, the performance information reviewed by the Board also included net cumulative calendar year total return information for the fund and an appropriate benchmark index and peer group for the most recent one-, three-, and five-year periods, as shown below. Returns are shown compared to the 25th percentile (top of box, 75% beaten) and 75th percentile (bottom of box, 25% beaten) of the peer universe.
VIP Mid Cap Portfolio

The Board has discussed with FMR the fund's underperformance (based on the December 31, 2014 data presented herein) and has engaged with FMR to consider what steps might be taken to remediate the fund's underperformance. The Board noted that the fund's performance has improved since the period shown.
Based on its review, the Board concluded that the nature, extent, and quality of services provided to the fund under the Advisory Contracts should benefit the shareholders of the fund.
Competitiveness of Management Fee and Total Expense Ratio. The Board considered the fund's management fee and total expense ratio compared to "mapped groups" of competitive funds and classes created for the purpose of facilitating the Trustees' competitive analysis of management fees and total expenses. Fidelity creates "mapped groups" by combining similar Lipper investment objective categories that have comparable investment mandates. Combining Lipper investment objective categories aids the Board's management fee and total expense ratio comparisons by broadening the competitive group used for comparison.
Management Fee. The Board considered two proprietary management fee comparisons for the 12-month periods shown in basis points (BP) in the chart below. The group of Lipper funds used by the Board for management fee comparisons is referred to below as the "Total Mapped Group." The Total Mapped Group comparison focuses on a fund's standing in terms of gross management fees before expense reimbursements or caps relative to the total universe of funds with comparable investment mandates, regardless of whether their management fee structures also are comparable. Funds with comparable investment mandates offer exposure to similar types of securities. Funds with comparable management fee structures have similar management fee contractual arrangements (
e.g., flat rate charged for advisory services, all-inclusive fee rate,
etc.). "TMG %" represents the percentage of funds in the Total Mapped Group that had management fees that were lower than the fund's. For example, a hypothetical TMG % of 20% would mean that 80% of the funds in the Total Mapped Group had higher, and 20% had lower, management fees than the fund. The fund's actual TMG %s and the number of funds in the Total Mapped Group are in the chart below. The "Asset-Size Peer Group" (ASPG) comparison focuses on a fund's standing relative to a subset of non-Fidelity funds within the Total Mapped Group that are similar in size and management fee structure without taking into account performance adjustments, if any. For example, if a fund is in the first quartile of the ASPG, the fund's management fee ranks in the least expensive or lowest 25% of funds in the ASPG. The ASPG represents at least 15% of the funds in the Total Mapped Group with comparable asset size and management fee structures, subject to a minimum of 50 funds (or all funds in the Total Mapped Group if fewer than 50). Additional information, such as the ASPG quartile in which the fund's management fee rate ranked, is also included in the chart and considered by the Board.
VIP Mid Cap Portfolio

The Board noted that the fund's management fee rate ranked below the median of its Total Mapped Group and below the median of its ASPG for 2014.
The Board noted that, in 2014, the ad hoc Committee on Group Fee was formed by it and other Fidelity fund boards to conduct an in-depth review of the "group fee" component of the management fee of funds with such management fee structures. Committee focus included the mechanics of the group fee, the competitive landscape of group fee structures, Fidelity funds with no group fee component and investment products not included in group fee assets. The Board also considered that, for funds subject to the group fee, FMR agreed to voluntarily waive fees over a specified period of time in amounts designed to account for assets converted from certain funds to certain collective investment trusts.
The Board also noted that, in 2013, the ad hoc Committee on Management Fees was formed to conduct an in-depth review of the management fee rates of Fidelity's active equity mutual funds. The Committee focused on the following areas: (i) standard fee structures; (ii) research consumption and trading evolution; (iii) management fee competitiveness/profitability by category; and (iv) factors that drive institutional pricing.
Based on its review, the Board concluded that the fund's management fee is fair and reasonable in light of the services that the fund receives and the other factors considered.
Total Expense Ratio. In its review of each class's total expense ratio, the Board considered the fund's management fee as well as other fund or class expenses, as applicable, such as transfer agent fees, pricing and bookkeeping fees, fund-paid 12b-1 fees, and custodial, legal, and audit fees. The Board also noted that Fidelity may agree to waive fees and expenses from time to time, and the extent to which, if any, it has done so for the fund. As part of its review, the Board also considered the current and historical total expense ratios of each class of the fund compared to competitive fund median expenses. Each class of the fund is compared to those funds and classes in the Total Mapped Group (used by the Board for management fee comparisons) that have a similar sales load structure.
The Board noted that the total expense ratio of each class ranked below its competitive median for 2014.
Fees Charged to Other Fidelity Clients. The Board also considered Fidelity fee structures and other information with respect to clients of Fidelity, such as other funds advised or subadvised by Fidelity, pension plan clients, and other institutional clients with similar mandates. The Board noted the findings of the 2013 ad hoc joint committee (created with the board of other Fidelity funds), which reviewed and compared Fidelity's institutional investment advisory business with its business of providing services to the Fidelity funds, including the differences in services provided, fees charged, and costs incurred, as well as competition in their respective marketplaces.
Based on its review of total expense ratios and fees charged to other Fidelity clients, the Board concluded that the total expense ratio of each class of the fund was reasonable in light of the services that the fund and its shareholders receive and the other factors considered.
Costs of the Services and Profitability. The Board considered the revenues earned and the expenses incurred by Fidelity in conducting the business of developing, marketing, distributing, managing, administering and servicing the fund and servicing the fund's shareholders. The Board also considered the level of Fidelity's profits in respect of all the Fidelity funds.
On an annual basis, Fidelity presents to the Board information about the profitability of its relationship with the fund. Fidelity calculates profitability information for each fund, as well as aggregate profitability information for groups of Fidelity funds and all Fidelity funds, using a series of detailed revenue and cost allocation methodologies which originate with the books and records of Fidelity on which Fidelity's audited financial statements are based. The Audit Committee of the Board reviews any significant changes from the prior year's methodologies.
PricewaterhouseCoopers LLP (PwC), independent registered public accounting firm and auditor to Fidelity and certain Fidelity funds, has been engaged annually by the Board as part of the Board's assessment of Fidelity's profitability analysis. PwC's engagement includes the review and assessment of the methodologies used by Fidelity in determining the revenues and expenses attributable to Fidelity's mutual fund business, and completion of agreed-upon procedures in respect of the mathematical accuracy of fund profitability and its conformity to established allocation methodologies. After considering PwC's reports issued under the engagement and information provided by Fidelity, the Board concluded that while other allocation methods may also be reasonable, Fidelity's profitability methodologies are reasonable in all material respects.
The Board also reviewed Fidelity's non-fund businesses and fall-out benefits related to the mutual fund business as well as cases where Fidelity's affiliates may benefit from or be related to the fund's business.
The Board considered the costs of the services provided by and the profits realized by Fidelity in connection with the operation of the fund and was satisfied that the profitability was not excessive.
Economies of Scale. The Board considered whether there have been economies of scale in respect of the management of the Fidelity funds, whether the Fidelity funds (including the fund) have appropriately benefited from any such economies of scale, and whether there is potential for realization of any further economies of scale. The Board considered the extent to which the fund will benefit from economies of scale as assets grow through increased services to the fund, through waivers or reimbursements, or through fee or expense ratio reductions. The Board also noted that in 2013, it and the boards of other Fidelity funds created an ad hoc committee (the Economies of Scale Committee) to analyze whether Fidelity attains economies of scale in respect of the management and servicing of the Fidelity funds, whether the Fidelity funds have appropriately benefited from such economies of scale, and whether there is potential for realization of any further economies of scale.
The Board recognized that the fund's management contract incorporates a "group fee" structure, which provides for lower group fee rates as total group assets increase, and for higher group fee rates as total group assets decrease (with "group assets" defined to include fund assets under FMR's management plus sector fund assets previously under FMR's management and currently managed by Fidelity SelectCo, LLC). FMR calculates the group fee rates based on a tiered asset "breakpoint" schedule that varies based on asset class. The Board considered that the group fee is designed to deliver the benefits of economies of scale to fund shareholders when total Fidelity fund assets increase, even if assets of any particular fund are unchanged or have declined, because some portion of Fidelity's costs are attributable to services provided to all Fidelity funds, and all funds benefit if those costs can be allocated among more assets. The Board concluded that, given the group fee structure, fund shareholders will benefit from lower management fees as group assets increase at the fund complex level, regardless of whether Fidelity achieves any such economies of scale.
The Board concluded, taking into account the analysis of the Economies of Scale Committee, that economies of scale, if any, are being appropriately shared between fund shareholders and Fidelity.
Additional Information Requested by the Board. In order to develop fully the factual basis for consideration of the Fidelity funds' Advisory Contracts, the Board requested and received additional information on certain topics, including: (i) fund performance trends and Fidelity's long-term strategies for certain funds; (ii) the various share classes employed by Fidelity and the attributes of each class, together with similar information on the distribution and servicing payments made by Fidelity or the funds to third-party participants in the distribution channels; (iii) fund profitability, and fund performance in relation to fund profitability; (iv) the methodology with respect to evaluating competitive fund data and peer group classifications and fee comparisons; (v) annual fund profitability margins, with particular focus on certain funds with negative margins; (vi) the realization of fall-out benefits in certain Fidelity business units;
(vii) economies of scale and the way in which they are shared with fund shareholders;(viii) Fidelity's group fee structures, including the group fee schedule of breakpoints;(ix) the impact of cost containment measures on the funds; and (x) the transfer agent fee structure.
Based on its evaluation of all of the conclusions noted above, and after considering all factors it believed relevant, the Board concluded that the advisory fee structures are fair and reasonable, and that the fund's Advisory Contracts should be renewed.
VIPMID-ANN-0216
1.735273.116
Fidelity® Variable Insurance Products: Growth Opportunities Portfolio
Annual Report December 31, 2015 |
|
Contents
To view a fund's proxy voting guidelines and proxy voting record for the 12-month period ended June 30, visit http://www.fidelity.com/proxyvotingresults or visit the Securities and Exchange Commission's (SEC) web site at http://www.sec.gov.
You may also call 1-877-208-0098 to request a free copy of the proxy voting guidelines.
Fidelity® Variable Insurance Products are separate account options which are purchased through a variable insurance contract.
Standard & Poor's, S&P and S&P 500 are registered service marks of The McGraw-Hill Companies, Inc. and have been licensed for use by Fidelity Distributors Corporation.
Other third-party marks appearing herein are the property of their respective owners.
All other marks appearing herein are registered or unregistered trademarks or service marks of FMR LLC or an affiliated company. © 2016 FMR LLC. All rights reserved.
This report and the financial statements contained herein are submitted for the general information of the shareholders of the Fund. This report is not authorized for distribution to prospective investors in the Fund unless preceded or accompanied by an effective prospectus.
A fund files its complete schedule of portfolio holdings with the SEC for the first and third quarters of each fiscal year on Form N-Q. Forms N-Q are available on the SEC’s web site at http://www.sec.gov. A fund's Forms N-Q may be reviewed and copied at the SEC’s Public Reference Room in Washington, DC. Information regarding the operation of the SEC's Public Reference Room may be obtained by calling 1-800-SEC-0330.
For a complete list of a fund's portfolio holdings, view the most recent holdings listing, semiannual report, or annual report on Fidelity's web site at http://www.fidelity.com, http://www.advisor.fidelity.com, or http://www.401k.com, as applicable.
NOT FDIC INSURED •MAY LOSE VALUE •NO BANK GUARANTEE
Neither the Fund nor Fidelity Distributors Corporation is a bank.
Performance: The Bottom Line
Average annual total return reflects the change in the value of an investment, assuming reinvestment of distributions from dividend income and capital gains (the profits earned upon the sale of securities that have grown in value, if any) and assuming a constant rate of performance each year. During periods of reimbursement by Fidelity, a fund’s total return will be greater than it would be had the reimbursement not occurred. Performance numbers are net of all underlying fund operating expenses, but do not include any insurance charges imposed by your insurance company’s separate account. If performance information included the effect of these additional charges, the total returns would have been lower. How a fund did yesterday is no guarantee of how it will do tomorrow.
Average Annual Total Returns
| For the periods ended December 31, 2015 | Past 1 year | Past 5 years | Past 10 years |
| Initial Class | 5.61% | 14.86% | 7.74% |
| Service Class | 5.48% | 14.74% | 7.63% |
| Service Class 2 | 5.34% | 14.56% | 7.47% |
| Investor Class | 5.54% | 14.77% | 7.63% |
Prior to February 1, 2007, the fund operated under certain different investment policies and compared its performance to a different index. The fund's historical performance may not represent its current investment policies.
$10,000 Over 10 Years
Let's say hypothetically that $10,000 was invested in VIP Growth Opportunities Portfolio - Initial Class on December 31, 2005.
The chart shows how the value of your investment would have changed, and also shows how the Russell 1000® Growth Index performed over the same period.

| Period Ending Values |
| $21,085 | VIP Growth Opportunities Portfolio - Initial Class |
| $22,681 | Russell 1000® Growth Index |
Management's Discussion of Fund Performance
Market Recap: U.S. stocks gained modestly in 2015, rebounding from a steep decline in August and September over worries about China’s slowing economic growth. The S&P 500
® index rose 1.38% for the period, its lowest calendar-year return since 2008. After the late-summer rout, stocks sharply reversed course in October, lifted by the U.S. Federal Reserve’s decision to put off raising near-term interest rates until mid-December. Investors also were encouraged by an interest-rate cut in China and economic stimulus in Europe. Overall, growth stocks fared much better than their value counterparts, as investors sought growth in a subpar economic environment. This helped lift the technology-heavy Nasdaq Composite Index
® 6.96% for the year. Sector performance in the broader market was split, with five of 10 sectors in the S&P 500 gaining ground and five retreating. Consumer discretionary (+10%) led the way, benefiting from rising personal income and low inflation. Health care (+7%), consumer staples (+7%) and information technology (+6%) also outpaced the broad market amid strong fundamentals. Conversely, energy (-21%) was by far the worst performer, stung by deflated commodity prices that also hit materials (-8%). The defensive, but rate-sensitive utilities sector (-5%) lost ground on the cusp of Fed tightening, while industrials (-3%) were dragged down with energy prices and a slower-growing China.
Comments from Lead Portfolio Manager Kyle Weaver: For the year, the fund’s share classes posted gains in the mid-single digits that lagged the 5.67% return of the benchmark Russell 1000
® Growth Index. Stock selection in the consumer discretionary and consumer staples sectors meaningfully detracted versus the benchmark. A large overweighting in Keurig Green Mountain, an innovator in single-serve beverage products, was the fund's biggest relative detractor, as sales and profitability of the company’s products were pressured by competitors. I liquidated this position in December. Other noteworthy detractors included non-index positions in Lumber Liquidators Holdings, which I sold, and Endurance International Group, a web-hosting company. Conversely, my picks in health care and information technology added value, as did positioning in the capital goods segment of industrials. Regeneron Pharmaceuticals, the fund’s top relative contributor, and Alkermes are two biotechnology stocks that strongly outperformed. Salesforce.com, a provider of cloud-based marketing and customer relationship management solutions, also was a standout performer this period. I reduced our stake in all three contributors noted but maintained overweightings in each case.
Note to shareholders: Kyle Weaver was named Lead Portfolio Manager of the fund, and Steven Wymer Co-Manager, on July 14, 2015, succeeding Gopal Reddy.
The views expressed above reflect those of the portfolio manager(s) only through the end of the period as stated on the cover of this report and do not necessarily represent the views of Fidelity or any other person in the Fidelity organization. Any such views are subject to change at any time based upon market or other conditions and Fidelity disclaims any responsibility to update such views. These views may not be relied on as investment advice and, because investment decisions for a Fidelity fund are based on numerous factors, may not be relied on as an indication of trading intent on behalf of any Fidelity fund.
Investment Summary (Unaudited)
Top Ten Stocks as of December 31, 2015
| | % of fund's net assets | % of fund's net assets 6 months ago |
| Apple, Inc. | 6.2 | 6.5 |
| Alphabet, Inc. Class A | 2.9 | 2.3 |
| Alphabet, Inc. Class C | 2.9 | 2.2 |
| Facebook, Inc. Class A | 2.5 | 2.3 |
| Amazon.com, Inc. | 2.3 | 1.6 |
| Visa, Inc. Class A | 2.1 | 1.8 |
| American Tower Corp. | 2.0 | 0.0 |
| Salesforce.com, Inc. | 1.8 | 4.8 |
| Cognizant Technology Solutions Corp. Class A | 1.7 | 0.2 |
| McKesson Corp. | 1.5 | 0.2 |
| | 25.9 | |
Top Five Market Sectors as of December 31, 2015
| | % of fund's net assets | % of fund's net assets 6 months ago |
| Information Technology | 35.6 | 34.8 |
| Health Care | 18.3 | 23.4 |
| Consumer Discretionary | 16.9 | 16.0 |
| Industrials | 9.0 | 6.5 |
| Consumer Staples | 5.8 | 8.0 |
Asset Allocation (% of fund's net assets)
| As of December 31, 2015* |
| | Stocks and Equity Futures | 97.4% |
| | Short-Term Investments and Net Other Assets (Liabilities) | 2.6% |

* Foreign investments 9.8%
| As of June 30, 2015* |
| | Stocks and Equity Futures | 99.3% |
| | Short-Term Investments and Net Other Assets (Liabilities) | 0.7% |

* Foreign investments 6.5%
Percentages shown as 0.0% may reflect amounts less than 0.05%.
Investments December 31, 2015
Showing Percentage of Net Assets
| Common Stocks - 96.6% | | | |
| | | Shares | Value |
| CONSUMER DISCRETIONARY - 16.9% | | | |
| Auto Components - 0.4% | | | |
| Tenneco, Inc. (a) | | 60,600 | $2,782,146 |
| Automobiles - 0.8% | | | |
| Tesla Motors, Inc. (a)(b) | | 25,500 | 6,120,255 |
| Diversified Consumer Services - 0.1% | | | |
| ServiceMaster Global Holdings, Inc. (a) | | 21,300 | 835,812 |
| Hotels, Restaurants & Leisure - 2.9% | | | |
| Buffalo Wild Wings, Inc. (a) | | 13,500 | 2,155,275 |
| Chipotle Mexican Grill, Inc. (a) | | 12,600 | 6,046,110 |
| Dave & Buster's Entertainment, Inc. (a) | | 4,000 | 166,960 |
| Domino's Pizza, Inc. | | 9,800 | 1,090,250 |
| Dunkin' Brands Group, Inc. (b) | | 35,200 | 1,499,168 |
| Las Vegas Sands Corp. | | 59,504 | 2,608,655 |
| McDonald's Corp. | | 6,200 | 732,468 |
| Starbucks Corp. | | 104,464 | 6,270,974 |
| Starwood Hotels & Resorts Worldwide, Inc. | | 11,600 | 803,648 |
| | | | 21,373,508 |
| Internet & Catalog Retail - 3.4% | | | |
| Amazon.com, Inc. (a) | | 24,773 | 16,743,823 |
| Expedia, Inc. | | 8,500 | 1,056,550 |
| Netflix, Inc. (a) | | 27,700 | 3,168,326 |
| Priceline Group, Inc. (a) | | 3,050 | 3,888,598 |
| | | | 24,857,297 |
| Media - 5.0% | | | |
| Altice NV Class A (a) | | 139,674 | 2,011,227 |
| AMC Networks, Inc. Class A (a) | | 18,100 | 1,351,708 |
| Charter Communications, Inc. Class A (a)(b) | | 60,800 | 11,132,480 |
| Comcast Corp. Class A | | 143,339 | 8,088,620 |
| Liberty Global PLC Class A (a) | | 86,000 | 3,642,960 |
| Lions Gate Entertainment Corp. (b) | | 45,900 | 1,486,701 |
| The Walt Disney Co. | | 75,700 | 7,954,556 |
| Twenty-First Century Fox, Inc. Class A | | 2,100 | 57,036 |
| Zee Entertainment Enterprises Ltd. | | 145,657 | 959,440 |
| | | | 36,684,728 |
| Multiline Retail - 0.2% | | | |
| Dollar General Corp. | | 20,700 | 1,487,709 |
| Specialty Retail - 1.3% | | | |
| CarMax, Inc. (a)(b) | | 49,500 | 2,671,515 |
| Home Depot, Inc. | | 23,210 | 3,069,523 |
| TJX Companies, Inc. | | 57,400 | 4,070,234 |
| | | | 9,811,272 |
| Textiles, Apparel & Luxury Goods - 2.8% | | | |
| lululemon athletica, Inc. (a) | | 105,072 | 5,513,128 |
| Michael Kors Holdings Ltd. (a) | | 18,608 | 745,436 |
| NIKE, Inc. Class B | | 118,818 | 7,426,125 |
| Skechers U.S.A., Inc. Class A (sub. vtg.) (a) | | 93,500 | 2,824,635 |
| Under Armour, Inc. Class A (sub. vtg.) (a) | | 28,900 | 2,329,629 |
| VF Corp. | | 31,600 | 1,967,100 |
| | | | 20,806,053 |
|
| TOTAL CONSUMER DISCRETIONARY | | | 124,758,780 |
|
| CONSUMER STAPLES - 5.6% | | | |
| Beverages - 1.6% | | | |
| Monster Beverage Corp. | | 26,965 | 4,016,706 |
| PepsiCo, Inc. | | 28,900 | 2,887,688 |
| The Coca-Cola Co. | | 118,969 | 5,110,908 |
| | | | 12,015,302 |
| Food & Staples Retailing - 2.8% | | | |
| Costco Wholesale Corp. | | 48,700 | 7,865,050 |
| CVS Health Corp. | | 85,600 | 8,369,112 |
| Walgreens Boots Alliance, Inc. | | 40,100 | 3,414,716 |
| Whole Foods Market, Inc. | | 22,300 | 747,050 |
| | | | 20,395,928 |
| Food Products - 0.4% | | | |
| Mead Johnson Nutrition Co. Class A | | 17,745 | 1,400,968 |
| Mondelez International, Inc. | | 23,600 | 1,058,224 |
| | | | 2,459,192 |
| Household Products - 0.3% | | | |
| Procter & Gamble Co. | | 29,000 | 2,302,890 |
| Personal Products - 0.2% | | | |
| Herbalife Ltd. (a) | | 26,000 | 1,394,120 |
| Tobacco - 0.3% | | | |
| Altria Group, Inc. | | 38,400 | 2,235,264 |
|
| TOTAL CONSUMER STAPLES | | | 40,802,696 |
|
| ENERGY - 1.1% | | | |
| Energy Equipment & Services - 0.3% | | | |
| Dril-Quip, Inc. (a) | | 12,600 | 746,298 |
| Oceaneering International, Inc. | | 39,600 | 1,485,792 |
| | | | 2,232,090 |
| Oil, Gas & Consumable Fuels - 0.8% | | | |
| Cabot Oil & Gas Corp. | | 218,382 | 3,863,178 |
| Golar LNG Ltd. | | 5,600 | 88,424 |
| PDC Energy, Inc. (a) | | 31,700 | 1,692,146 |
| | | | 5,643,748 |
|
| TOTAL ENERGY | | | 7,875,838 |
|
| FINANCIALS - 5.5% | | | |
| Banks - 1.4% | | | |
| HDFC Bank Ltd. sponsored ADR | | 50,800 | 3,129,280 |
| JPMorgan Chase & Co. | | 113,300 | 7,481,199 |
| | | | 10,610,479 |
| Capital Markets - 1.4% | | | |
| BlackRock, Inc. Class A | | 18,100 | 6,163,412 |
| Charles Schwab Corp. | | 96,900 | 3,190,917 |
| Invesco Ltd. | | 23,600 | 790,128 |
| | | | 10,144,457 |
| Consumer Finance - 0.4% | | | |
| American Express Co. | | 11,400 | 792,870 |
| Discover Financial Services | | 39,000 | 2,091,180 |
| | | | 2,884,050 |
| Diversified Financial Services - 0.2% | | | |
| MSCI, Inc. Class A | | 22,000 | 1,586,860 |
| Insurance - 0.1% | | | |
| FNF Group | | 11,100 | 384,837 |
| Real Estate Investment Trusts - 2.0% | | | |
| American Tower Corp. | | 155,700 | 15,095,115 |
|
| TOTAL FINANCIALS | | | 40,705,798 |
|
| HEALTH CARE - 18.3% | | | |
| Biotechnology - 11.8% | | | |
| AbbVie, Inc. | | 122,200 | 7,239,128 |
| ACADIA Pharmaceuticals, Inc. (a) | | 34,018 | 1,212,742 |
| Aduro Biotech, Inc. (b) | | 16,400 | 461,496 |
| Agios Pharmaceuticals, Inc. (a) | | 13,200 | 856,944 |
| Alexion Pharmaceuticals, Inc. (a) | | 27,552 | 5,255,544 |
| Alkermes PLC (a) | | 89,400 | 7,096,572 |
| Alnylam Pharmaceuticals, Inc. (a) | | 35,703 | 3,361,080 |
| Amgen, Inc. | | 45,659 | 7,411,825 |
| Amicus Therapeutics, Inc. (a) | | 133,900 | 1,298,830 |
| Asterias Biotherapeutics, Inc. (a)(b) | | 10,595 | 41,638 |
| aTyr Pharma, Inc. (c) | | 22,036 | 216,614 |
| Avalanche Biotechnologies, Inc. (a) | | 7,900 | 75,208 |
| Baxalta, Inc. | | 6,700 | 261,501 |
| Biogen, Inc. (a) | | 15,300 | 4,687,155 |
| BioMarin Pharmaceutical, Inc. (a) | | 36,100 | 3,781,836 |
| BioTime, Inc. warrants 10/1/18 (a) | | 9,538 | 10,110 |
| bluebird bio, Inc. (a) | | 22,210 | 1,426,326 |
| Celgene Corp. (a) | | 20,930 | 2,506,577 |
| Celldex Therapeutics, Inc. (a) | | 34,900 | 547,232 |
| Edge Therapeutics, Inc. (a) | | 36,100 | 451,250 |
| Esperion Therapeutics, Inc. (a)(b) | | 15,800 | 351,708 |
| Gilead Sciences, Inc. | | 75,286 | 7,618,190 |
| Insmed, Inc. (a) | | 76,442 | 1,387,422 |
| Intercept Pharmaceuticals, Inc. (a) | | 2,500 | 373,375 |
| Ionis Pharmaceuticals, Inc.(a)(b) | | 125,806 | 7,791,166 |
| Lexicon Pharmaceuticals, Inc. (a) | | 28,906 | 384,739 |
| Merrimack Pharmaceuticals, Inc. (a) | | 89,800 | 709,420 |
| Novavax, Inc. (a) | | 185,000 | 1,552,150 |
| Ophthotech Corp. (a) | | 18,900 | 1,484,217 |
| Prothena Corp. PLC (a) | | 22,702 | 1,546,233 |
| Regeneron Pharmaceuticals, Inc. (a) | | 19,000 | 10,314,530 |
| Regulus Therapeutics, Inc. (a) | | 54,400 | 474,368 |
| Rigel Pharmaceuticals, Inc. (a) | | 111,406 | 337,560 |
| Seattle Genetics, Inc. (a) | | 26,638 | 1,195,513 |
| Seres Therapeutics, Inc. | | 4,400 | 154,396 |
| Spark Therapeutics, Inc. | | 500 | 22,655 |
| Transition Therapeutics, Inc. (a) | | 97,414 | 187,035 |
| Vertex Pharmaceuticals, Inc. (a) | | 21,300 | 2,680,179 |
| XOMA Corp. (a)(b) | | 232,224 | 308,858 |
| | | | 87,073,322 |
| Health Care Equipment & Supplies - 0.9% | | | |
| Boston Scientific Corp. (a) | | 101,200 | 1,866,128 |
| Medtronic PLC | | 47,600 | 3,661,392 |
| Penumbra, Inc. (a) | | 900 | 48,429 |
| Stryker Corp. | | 7,500 | 697,050 |
| | | | 6,272,999 |
| Health Care Providers & Services - 2.1% | | | |
| Express Scripts Holding Co. (a) | | 21,526 | 1,881,588 |
| McKesson Corp. | | 57,985 | 11,436,382 |
| UnitedHealth Group, Inc. | | 21,500 | 2,529,260 |
| | | | 15,847,230 |
| Health Care Technology - 0.4% | | | |
| athenahealth, Inc. (a)(b) | | 16,300 | 2,623,811 |
| Castlight Health, Inc. Class B (a) | | 17,500 | 74,725 |
| | | | 2,698,536 |
| Pharmaceuticals - 3.1% | | | |
| AcelRx Pharmaceuticals, Inc. (a) | | 146,119 | 562,558 |
| Allergan PLC (a) | | 12,463 | 3,894,688 |
| Bristol-Myers Squibb Co. | | 57,300 | 3,941,667 |
| Endo Health Solutions, Inc. (a) | | 71,400 | 4,371,108 |
| Intra-Cellular Therapies, Inc. (a) | | 5,200 | 279,708 |
| Mylan N.V. | | 13,900 | 751,573 |
| Teva Pharmaceutical Industries Ltd. sponsored ADR | | 139,100 | 9,130,524 |
| Theravance, Inc. | | 15,500 | 163,370 |
| | | | 23,095,196 |
|
| TOTAL HEALTH CARE | | | 134,987,283 |
|
| INDUSTRIALS - 9.0% | | | |
| Aerospace & Defense - 0.9% | | | |
| Honeywell International, Inc. | | 24,200 | 2,506,394 |
| The Boeing Co. | | 29,198 | 4,221,739 |
| | | | 6,728,133 |
| Air Freight & Logistics - 0.4% | | | |
| C.H. Robinson Worldwide, Inc. | | 5,300 | 328,706 |
| FedEx Corp. | | 7,000 | 1,042,930 |
| United Parcel Service, Inc. Class B | | 17,552 | 1,689,029 |
| | | | 3,060,665 |
| Airlines - 2.9% | | | |
| American Airlines Group, Inc. | | 38,660 | 1,637,251 |
| Controladora Vuela Compania de Aviacion S.A.B. de CV ADR (a) | | 45,200 | 775,632 |
| Delta Air Lines, Inc. | | 85,300 | 4,323,857 |
| JetBlue Airways Corp. (a) | | 48,600 | 1,100,790 |
| Southwest Airlines Co. | | 203,200 | 8,749,792 |
| Spirit Airlines, Inc. (a) | | 50,900 | 2,028,365 |
| United Continental Holdings, Inc. (a) | | 17,900 | 1,025,670 |
| WestJet Airlines Ltd. | | 97,900 | 1,433,442 |
| Wizz Air Holdings PLC | | 1,016 | 27,215 |
| | | | 21,102,014 |
| Building Products - 0.0% | | | |
| Caesarstone Sdot-Yam Ltd. | | 7,145 | 309,664 |
| Electrical Equipment - 1.5% | | | |
| Acuity Brands, Inc. | | 6,900 | 1,613,220 |
| SolarCity Corp. (a)(b) | | 172,600 | 8,806,052 |
| Sunrun, Inc. (a)(b) | | 51,300 | 603,801 |
| | | | 11,023,073 |
| Industrial Conglomerates - 0.9% | | | |
| 3M Co. | | 13,100 | 1,973,384 |
| Danaher Corp. | | 49,100 | 4,560,408 |
| | | | 6,533,792 |
| Professional Services - 0.8% | | | |
| Towers Watson & Co. | | 6,600 | 847,836 |
| TriNet Group, Inc. (a) | | 199,900 | 3,868,065 |
| Verisk Analytics, Inc. (a) | | 10,000 | 768,800 |
| | | | 5,484,701 |
| Road & Rail - 1.3% | | | |
| Genesee & Wyoming, Inc. Class A (a) | | 42,300 | 2,271,087 |
| Hertz Global Holdings, Inc. (a) | | 27,500 | 391,325 |
| J.B. Hunt Transport Services, Inc. | | 45,210 | 3,316,606 |
| TransForce, Inc. (b) | | 68,600 | 1,170,518 |
| Union Pacific Corp. | | 34,700 | 2,713,540 |
| | | | 9,863,076 |
| Trading Companies & Distributors - 0.3% | | | |
| HD Supply Holdings, Inc. (a) | | 82,400 | 2,474,472 |
|
| TOTAL INDUSTRIALS | | | 66,579,590 |
|
| INFORMATION TECHNOLOGY - 35.1% | | | |
| Communications Equipment - 0.5% | | | |
| Infinera Corp. (a) | | 87,973 | 1,594,071 |
| Qualcomm Technologies, Inc. | | 42,312 | 2,114,965 |
| | | | 3,709,036 |
| Electronic Equipment & Components - 0.0% | | | |
| CDW Corp. | | 8,200 | 344,728 |
| Internet Software & Services - 11.7% | | | |
| Alphabet, Inc.: | | | |
| Class A (a) | | 27,602 | 21,474,632 |
| Class C | | 28,263 | 21,448,225 |
| Demandware, Inc. (a)(b) | | 31,600 | 1,705,452 |
| Endurance International Group Holdings, Inc. (a)(b) | | 803,803 | 8,785,567 |
| Facebook, Inc. Class A (a) | | 178,010 | 18,630,527 |
| GoDaddy, Inc. (a)(b) | | 295,200 | 9,464,112 |
| LinkedIn Corp. Class A (a) | | 1,900 | 427,652 |
| Rackspace Hosting, Inc. (a) | | 35,400 | 896,328 |
| Wix.com Ltd. (a) | | 147,807 | 3,362,609 |
| | | | 86,195,104 |
| IT Services - 9.5% | | | |
| Alliance Data Systems Corp. (a) | | 27,200 | 7,522,704 |
| Booz Allen Hamilton Holding Corp. Class A | | 48,800 | 1,505,480 |
| Cognizant Technology Solutions Corp. Class A (a) | | 203,464 | 12,211,909 |
| EPAM Systems, Inc. (a) | | 96,700 | 7,602,554 |
| Gartner, Inc. Class A (a) | | 16,900 | 1,532,830 |
| Global Payments, Inc. | | 34,100 | 2,199,791 |
| MasterCard, Inc. Class A | | 98,400 | 9,580,224 |
| PayPal Holdings, Inc. (a) | | 49,400 | 1,788,280 |
| Sabre Corp. | | 236,000 | 6,600,920 |
| Square, Inc. (a)(b) | | 27,500 | 359,975 |
| Travelport Worldwide Ltd. | | 247,600 | 3,194,040 |
| Visa, Inc. Class A | | 197,800 | 15,339,390 |
| WEX, Inc. (a) | | 6,000 | 530,400 |
| | | | 69,968,497 |
| Semiconductors & Semiconductor Equipment - 2.3% | | | |
| Avago Technologies Ltd. | | 12,500 | 1,814,375 |
| Cypress Semiconductor Corp. (b) | | 159,000 | 1,559,790 |
| Micron Technology, Inc. (a) | | 74,300 | 1,052,088 |
| NVIDIA Corp. | | 75,800 | 2,498,368 |
| NXP Semiconductors NV (a) | | 40,700 | 3,428,975 |
| Qorvo, Inc. (a) | | 75,300 | 3,832,770 |
| SolarEdge Technologies, Inc. (b) | | 93,135 | 2,623,613 |
| SunEdison, Inc. (a)(b) | | 23,100 | 117,579 |
| | | | 16,927,558 |
| Software - 4.5% | | | |
| Adobe Systems, Inc. (a) | | 25,300 | 2,376,682 |
| Atlassian Corp. PLC | | 2,000 | 60,160 |
| Electronic Arts, Inc. (a) | | 25,800 | 1,772,976 |
| Fortinet, Inc. (a) | | 9,700 | 302,349 |
| Microsoft Corp. | | 200,549 | 11,126,459 |
| Oracle Corp. | | 18,870 | 689,321 |
| Red Hat, Inc. (a) | | 9,300 | 770,133 |
| Salesforce.com, Inc. (a) | | 164,577 | 12,902,837 |
| ServiceNow, Inc. (a) | | 26,600 | 2,302,496 |
| Workday, Inc. Class A (a) | | 13,600 | 1,083,648 |
| | | | 33,387,061 |
| Technology Hardware, Storage & Peripherals - 6.6% | | | |
| Apple, Inc. | | 432,343 | 45,508,422 |
| Electronics for Imaging, Inc. (a) | | 39,600 | 1,850,904 |
| Nimble Storage, Inc. (a)(b) | | 102,300 | 941,160 |
| Pure Storage, Inc. Class A (a) | | 6,500 | 101,205 |
| | | | 48,401,691 |
|
| TOTAL INFORMATION TECHNOLOGY | | | 258,933,675 |
|
| MATERIALS - 3.5% | | | |
| Chemicals - 3.1% | | | |
| E.I. du Pont de Nemours & Co. | | 26,500 | 1,764,900 |
| Ecolab, Inc. | | 13,300 | 1,521,254 |
| LyondellBasell Industries NV Class A | | 127,000 | 11,036,300 |
| PPG Industries, Inc. | | 56,000 | 5,533,920 |
| The Chemours Co. LLC | | 3,860 | 20,690 |
| The Dow Chemical Co. | | 50,500 | 2,599,740 |
| | | | 22,476,804 |
| Containers & Packaging - 0.4% | | | |
| Sealed Air Corp. | | 71,300 | 3,179,980 |
|
| TOTAL MATERIALS | | | 25,656,784 |
|
| TELECOMMUNICATION SERVICES - 1.6% | | | |
| Diversified Telecommunication Services - 0.2% | | | |
| Verizon Communications, Inc. | | 30,900 | 1,428,198 |
| Wireless Telecommunication Services - 1.4% | | | |
| SBA Communications Corp. Class A (a) | | 24,800 | 2,605,736 |
| T-Mobile U.S., Inc. (a) | | 191,700 | 7,499,304 |
| | | | 10,105,040 |
|
| TOTAL TELECOMMUNICATION SERVICES | | | 11,533,238 |
|
| TOTAL COMMON STOCKS | | | |
| (Cost $487,354,761) | | | 711,833,682 |
|
| Convertible Preferred Stocks - 0.8% | | | |
| CONSUMER STAPLES - 0.2% | | | |
| Food & Staples Retailing - 0.1% | | | |
| Blue Apron, Inc. Series D (d) | | 45,022 | 646,966 |
| Tobacco - 0.1% | | | |
| PAX Labs, Inc. Series C (d) | | 215,881 | 710,248 |
|
| TOTAL CONSUMER STAPLES | | | 1,357,214 |
|
| FINANCIALS - 0.1% | | | |
| Real Estate Management & Development - 0.1% | | | |
| Redfin Corp. Series G (d) | | 152,148 | 585,770 |
| INFORMATION TECHNOLOGY - 0.5% | | | |
| Internet Software & Services - 0.4% | | | |
| Uber Technologies, Inc. Series D, 8.00% (a)(d) | | 66,008 | 3,219,357 |
| Software - 0.1% | | | |
| Cloudera, Inc. Series F (a)(d) | | 6,366 | 208,996 |
| Cloudflare, Inc. Series D (a)(d) | | 5,997 | 42,245 |
| MongoDB, Inc. Series F, 8.00% (a)(d) | | 82,814 | 667,481 |
| | | | 918,722 |
|
| TOTAL INFORMATION TECHNOLOGY | | | 4,138,079 |
|
| TOTAL CONVERTIBLE PREFERRED STOCKS | | | |
| (Cost $4,471,285) | | | 6,081,063 |
|
| Money Market Funds - 8.3% | | | |
| Fidelity Cash Central Fund, 0.33% (e) | | 19,026,043 | 19,026,043 |
| Fidelity Securities Lending Cash Central Fund, 0.35% (e)(f) | | 42,186,211 | 42,186,211 |
| TOTAL MONEY MARKET FUNDS | | | |
| (Cost $61,212,254) | | | 61,212,254 |
| TOTAL INVESTMENT PORTFOLIO - 105.7% | | | |
| (Cost $553,038,300) | | | 779,126,999 |
| NET OTHER ASSETS (LIABILITIES) - (5.7)% | | | (41,736,678) |
| NET ASSETS - 100% | | | $737,390,321 |
Legend
(a) Non-income producing
(b) Security or a portion of the security is on loan at period end.
(c) Security exempt from registration under Rule 144A of the Securities Act of 1933. These securities may be resold in transactions exempt from registration, normally to qualified institutional buyers. At the end of the period, the value of these securities amounted to $216,614 or 0.0% of net assets.
(d) Restricted securities - Investment in securities not registered under the Securities Act of 1933 (excluding 144A issues). At the end of the period, the value of restricted securities (excluding 144A issues) amounted to $6,081,063 or 0.8% of net assets.
(e) Affiliated fund that is generally available only to investment companies and other accounts managed by Fidelity Investments. The rate quoted is the annualized seven-day yield of the fund at period end. A complete unaudited listing of the fund's holdings as of its most recent quarter end is available upon request. In addition, each Fidelity Central Fund's financial statements, which are not covered by the Fund's Report of Independent Registered Public Accounting Firm, are available on the SEC's website or upon request.
(f) Investment made with cash collateral received from securities on loan.
Additional information on each restricted holding is as follows:
| Security | Acquisition Date | Acquisition Cost |
| Blue Apron, Inc. Series D | 5/18/15 | $600,004 |
| Cloudera, Inc. Series F | 2/5/14 | $92,689 |
| Cloudflare, Inc. Series D | 11/5/14 | $36,735 |
| MongoDB, Inc. Series F, 8.00% | 10/2/13 | $1,384,992 |
| PAX Labs, Inc. Series C | 5/22/15 | $831,142 |
| Redfin Corp. Series G | 12/16/14 | $501,738 |
| Uber Technologies, Inc. Series D, 8.00% | 6/6/14 | $1,023,986 |
Affiliated Central Funds
Information regarding fiscal year to date income earned by the Fund from investments in Fidelity Central Funds is as follows:
| Fund | Income earned |
| Fidelity Cash Central Fund | $23,528 |
| Fidelity Securities Lending Cash Central Fund | 343,336 |
| Total | $366,864 |
Investment Valuation
The following is a summary of the inputs used, as of December 31, 2015, involving the Fund's assets and liabilities carried at fair value. The inputs or methodology used for valuing securities may not be an indication of the risk associated with investing in those securities. For more information on valuation inputs, and their aggregation into the levels used below, please refer to the Investment Valuation section in the accompanying Notes to Financial Statements.
| | Valuation Inputs at Reporting Date: |
| Description | Total | Level 1 | Level 2 | Level 3 |
| Investments in Securities: | | | | |
| Equities: | | | | |
| Consumer Discretionary | $124,758,780 | $123,799,340 | $959,440 | $-- |
| Consumer Staples | 42,159,910 | 40,802,696 | -- | 1,357,214 |
| Energy | 7,875,838 | 7,875,838 | -- | -- |
| Financials | 41,291,568 | 40,705,798 | -- | 585,770 |
| Health Care | 134,987,283 | 134,987,283 | -- | -- |
| Industrials | 66,579,590 | 66,579,590 | -- | -- |
| Information Technology | 263,071,754 | 258,933,675 | -- | 4,138,079 |
| Materials | 25,656,784 | 25,656,784 | -- | -- |
| Telecommunication Services | 11,533,238 | 11,533,238 | -- | -- |
| Money Market Funds | 61,212,254 | 61,212,254 | -- | -- |
| Total Investments in Securities: | $779,126,999 | $772,086,496 | $959,440 | $6,081,063 |
See accompanying notes which are an integral part of the financial statements.
Financial Statements
Statement of Assets and Liabilities
| | | December 31, 2015 |
| Assets | | |
Investment in securities, at value (including securities loaned of $40,757,150) — See accompanying schedule:
Unaffiliated issuers (cost $491,826,046) | $717,914,745 | |
| Fidelity Central Funds (cost $61,212,254) | 61,212,254 | |
| Total Investments (cost $553,038,300) | | $779,126,999 |
| Foreign currency held at value (cost $4,481) | | 4,481 |
| Receivable for investments sold | | 148,915 |
| Receivable for fund shares sold | | 878,062 |
| Dividends receivable | | 345,961 |
| Distributions receivable from Fidelity Central Funds | | 108,588 |
| Prepaid expenses | | 1,436 |
| Other receivables | | 6,942 |
| Total assets | | 780,621,384 |
| Liabilities | | |
| Payable for investments purchased | $148,511 | |
| Payable for fund shares redeemed | 377,536 | |
| Accrued management fee | 335,464 | |
| Distribution and service plan fees payable | 45,964 | |
| Other affiliated payables | 80,309 | |
| Other payables and accrued expenses | 57,068 | |
| Collateral on securities loaned, at value | 42,186,211 | |
| Total liabilities | | 43,231,063 |
| Net Assets | | $737,390,321 |
| Net Assets consist of: | | |
| Paid in capital | | $498,786,494 |
| Undistributed net investment income | | 147,470 |
| Accumulated undistributed net realized gain (loss) on investments and foreign currency transactions | | 12,367,700 |
| Net unrealized appreciation (depreciation) on investments and assets and liabilities in foreign currencies | | 226,088,657 |
| Net Assets | | $737,390,321 |
| Initial Class: | | |
| Net Asset Value, offering price and redemption price per share ($176,055,547 ÷ 5,545,494 shares) | | $31.75 |
| Service Class: | | |
| Net Asset Value, offering price and redemption price per share ($113,812,028 ÷ 3,589,767 shares) | | $31.70 |
| Service Class 2: | | |
| Net Asset Value, offering price and redemption price per share ($177,403,700 ÷ 5,650,388 shares) | | $31.40 |
| Investor Class: | | |
| Net Asset Value, offering price and redemption price per share ($270,119,046 ÷ 8,548,596 shares) | | $31.60 |
See accompanying notes which are an integral part of the financial statements.
Statement of Operations
| | | Year ended December 31, 2015 |
| Investment Income | | |
| Dividends | | $5,968,530 |
| Interest | | 114 |
| Income from Fidelity Central Funds (including $343,336 from security lending) | | 366,864 |
| Total income | | 6,335,508 |
| Expenses | | |
| Management fee | $3,607,493 | |
| Transfer agent fees | 615,775 | |
| Distribution and service plan fees | 468,832 | |
| Accounting and security lending fees | 246,949 | |
| Custodian fees and expenses | 23,721 | |
| Independent trustees' compensation | 2,949 | |
| Audit | 72,070 | |
| Legal | 7,950 | |
| Miscellaneous | (77) | |
| Total expenses before reductions | 5,045,662 | |
| Expense reductions | (28,677) | 5,016,985 |
| Net investment income (loss) | | 1,318,523 |
| Realized and Unrealized Gain (Loss) | | |
| Net realized gain (loss) on: | | |
| Investment securities: | | |
| Unaffiliated issuers | 81,389,960 | |
| Foreign currency transactions | 1,224 | |
| Futures contracts | (818,060) | |
| Total net realized gain (loss) | | 80,573,124 |
Change in net unrealized appreciation (depreciation) on:
Investment securities | (57,087,232) | |
| Assets and liabilities in foreign currencies | (42) | |
| Total change in net unrealized appreciation (depreciation) | | (57,087,274) |
| Net gain (loss) | | 23,485,850 |
| Net increase (decrease) in net assets resulting from operations | | $24,804,373 |
See accompanying notes which are an integral part of the financial statements.
Statement of Changes in Net Assets
| | Year ended December 31, 2015 | Year ended December 31, 2014 |
| Increase (Decrease) in Net Assets | | |
| Operations | | |
| Net investment income (loss) | $1,318,523 | $649,278 |
| Net realized gain (loss) | 80,573,124 | 30,221,097 |
| Change in net unrealized appreciation (depreciation) | (57,087,274) | 26,303,900 |
| Net increase (decrease) in net assets resulting from operations | 24,804,373 | 57,174,275 |
| Distributions to shareholders from net investment income | (741,285) | (706,532) |
| Distributions to shareholders from net realized gain | (71,873,523) | (472,448) |
| Total distributions | (72,614,808) | (1,178,980) |
| Share transactions - net increase (decrease) | 264,249,608 | (63,371,146) |
| Total increase (decrease) in net assets | 216,439,173 | (7,375,851) |
| Net Assets | | |
| Beginning of period | 520,951,148 | 528,326,999 |
| End of period (including undistributed net investment income of $147,470 and distributions in excess of net investment income of $14, respectively) | $737,390,321 | $520,951,148 |
See accompanying notes which are an integral part of the financial statements.
Financial Highlights — VIP Growth Opportunities Portfolio Initial Class
| | | | | | |
| Years ended December 31, | 2015 | 2014 | 2013 | 2012 | 2011 |
| Selected Per–Share Data | | | | | |
| Net asset value, beginning of period | $33.51 | $29.96 | $21.80 | $18.30 | $17.92 |
| Income from Investment Operations | | | | | |
| Net investment income (loss)A | .10 | .07 | .08 | .08 | .03 |
| Net realized and unrealized gain (loss) | 1.70 | 3.58 | 8.18 | 3.51 | .38 |
| Total from investment operations | 1.80 | 3.65 | 8.26 | 3.59 | .41 |
| Distributions from net investment income | (.06) | (.07) | (.08) | (.09) | (.03) |
| Distributions from net realized gain | (3.49) | (.03) | (.01) | – | – |
| Total distributions | (3.56)B | (.10) | (.10)C | (.09) | (.03) |
| Net asset value, end of period | $31.75 | $33.51 | $29.96 | $21.80 | $18.30 |
| Total ReturnD,E | 5.61% | 12.20% | 37.90% | 19.61% | 2.30% |
| Ratios to Average Net AssetsF,G | | | | | |
| Expenses before reductions | .67% | .68% | .68% | .69% | .70% |
| Expenses net of fee waivers, if any | .67% | .68% | .68% | .69% | .70% |
| Expenses net of all reductions | .66% | .68% | .68% | .69% | .69% |
| Net investment income (loss) | .30% | .21% | .31% | .40% | .17% |
| Supplemental Data | | | | | |
| Net assets, end of period (000 omitted) | $176,056 | $158,791 | $163,798 | $121,947 | $111,238 |
| Portfolio turnover rateH | 63%I | 11% | 25% | 36% | 34% |
A Calculated based on average shares outstanding during the period.
B Total distributions of $3.56 per share is comprised of distributions from net investment income of $.064 and distributions from net realized gain of $3.492 per share.
C Total distributions of $.10 per share is comprised of distributions from net investment income of $.082 and distributions from net realized gain of $.014 per share.
D Total returns do not reflect charges attributable to your insurance company's separate account. Inclusion of these charges would reduce the total returns shown.
E Total returns would have been lower if certain expenses had not been reduced during the applicable periods shown.
F Fees and expenses of any underlying Fidelity Central Funds are not included in the Fund's expense ratio. The Fund indirectly bears its proportionate share of the expenses of any underlying Fidelity Central Funds.
G Expense ratios reflect operating expenses of the class. Expenses before reductions do not reflect amounts reimbursed by the investment adviser or reductions from brokerage service arrangements or reductions from other expense offset arrangements and do not represent the amount paid by the class during periods when reimbursements or reductions occur. Expenses net of fee waivers reflect expenses after reimbursement by the investment adviser but prior to reductions from brokerage service arrangements or other expense offset arrangements. Expenses net of all reductions represent the net expenses paid by the class.
H Amount does not include the portfolio activity of any underlying Fidelity Central Funds.
I The portfolio turnover rate does not include the assets acquired in the merger.
See accompanying notes which are an integral part of the financial statements.
Financial Highlights — VIP Growth Opportunities Portfolio Service Class
| | | | | | |
| Years ended December 31, | 2015 | 2014 | 2013 | 2012 | 2011 |
| Selected Per–Share Data | | | | | |
| Net asset value, beginning of period | $33.46 | $29.91 | $21.76 | $18.27 | $17.89 |
| Income from Investment Operations | | | | | |
| Net investment income (loss)A | .07 | .04 | .05 | .06 | .01 |
| Net realized and unrealized gain (loss) | 1.68 | 3.58 | 8.17 | 3.50 | .38 |
| Total from investment operations | 1.75 | 3.62 | 8.22 | 3.56 | .39 |
| Distributions from net investment income | (.02) | (.04) | (.05) | (.07) | (.01) |
| Distributions from net realized gain | (3.49) | (.03) | (.01) | – | – |
| Total distributions | (3.51) | (.07) | (.07)B | (.07) | (.01) |
| Net asset value, end of period | $31.70 | $33.46 | $29.91 | $21.76 | $18.27 |
| Total ReturnC,D | 5.48% | 12.10% | 37.78% | 19.46% | 2.18% |
| Ratios to Average Net AssetsE,F | | | | | |
| Expenses before reductions | .77% | .77% | .78% | .79% | .80% |
| Expenses net of fee waivers, if any | .77% | .77% | .78% | .79% | .80% |
| Expenses net of all reductions | .76% | .77% | .78% | .79% | .79% |
| Net investment income (loss) | .20% | .11% | .21% | .30% | .07% |
| Supplemental Data | | | | | |
| Net assets, end of period (000 omitted) | $113,812 | $141,833 | $160,835 | $143,321 | $138,842 |
| Portfolio turnover rateG | 63%H | 11% | 25% | 36% | 34% |
A Calculated based on average shares outstanding during the period.
B Total distributions of $.07 per share is comprised of distributions from net investment income of $.052 and distributions from net realized gain of $.014 per share.
C Total returns do not reflect charges attributable to your insurance company's separate account. Inclusion of these charges would reduce the total returns shown.
D Total returns would have been lower if certain expenses had not been reduced during the applicable periods shown.
E Fees and expenses of any underlying Fidelity Central Funds are not included in the Fund's expense ratio. The Fund indirectly bears its proportionate share of the expenses of any underlying Fidelity Central Funds.
F Expense ratios reflect operating expenses of the class. Expenses before reductions do not reflect amounts reimbursed by the investment adviser or reductions from brokerage service arrangements or reductions from other expense offset arrangements and do not represent the amount paid by the class during periods when reimbursements or reductions occur. Expenses net of fee waivers reflect expenses after reimbursement by the investment adviser but prior to reductions from brokerage service arrangements or other expense offset arrangements. Expenses net of all reductions represent the net expenses paid by the class.
G Amount does not include the portfolio activity of any underlying Fidelity Central Funds.
H The portfolio turnover rate does not include the assets acquired in the merger.
See accompanying notes which are an integral part of the financial statements.
Financial Highlights — VIP Growth Opportunities Portfolio Service Class 2
| | | | | | |
| Years ended December 31, | 2015 | 2014 | 2013 | 2012 | 2011 |
| Selected Per–Share Data | | | | | |
| Net asset value, beginning of period | $33.20 | $29.68 | $21.60 | $18.13 | $17.78 |
| Income from Investment Operations | | | | | |
| Net investment income (loss)A | .02 | (.01) | .01 | .03 | (.02) |
| Net realized and unrealized gain (loss) | 1.67 | 3.56 | 8.10 | 3.47 | .37 |
| Total from investment operations | 1.69 | 3.55 | 8.11 | 3.50 | .35 |
| Distributions from net investment income | –B | –B | (.01) | (.03) | – |
| Distributions from net realized gain | (3.49) | (.02) | (.01) | – | – |
| Total distributions | (3.49) | (.03)C | (.03)D | (.03) | – |
| Net asset value, end of period | $31.40 | $33.20 | $29.68 | $21.60 | $18.13 |
| Total ReturnE,F | 5.34% | 11.95% | 37.54% | 19.32% | 1.97% |
| Ratios to Average Net AssetsG,H | | | | | |
| Expenses before reductions | .92% | .93% | .94% | .94% | .96% |
| Expenses net of fee waivers, if any | .92% | .93% | .93% | .94% | .95% |
| Expenses net of all reductions | .91% | .93% | .93% | .94% | .95% |
| Net investment income (loss) | .05% | (.04)% | .06% | .15% | (.08)% |
| Supplemental Data | | | | | |
| Net assets, end of period (000 omitted) | $177,404 | $83,545 | $81,360 | $72,525 | $31,441 |
| Portfolio turnover rateI | 63%J | 11% | 25% | 36% | 34% |
A Calculated based on average shares outstanding during the period.
B Amount represents less than $.005 per share.
C Total distributions of $.03 per share is comprised of distributions from net investment income of $.002 and distributions from net realized gain of $.023 per share.
D Total distributions of $.03 per share is comprised of distributions from net investment income of $.012 and distributions from net realized gain of $.014 per share.
E Total returns do not reflect charges attributable to your insurance company's separate account. Inclusion of these charges would reduce the total returns shown.
F Total returns would have been lower if certain expenses had not been reduced during the applicable periods shown.
G Fees and expenses of any underlying Fidelity Central Funds are not included in the Fund's expense ratio. The Fund indirectly bears its proportionate share of the expenses of any underlying Fidelity Central Funds.
H Expense ratios reflect operating expenses of the class. Expenses before reductions do not reflect amounts reimbursed by the investment adviser or reductions from brokerage service arrangements or reductions from other expense offset arrangements and do not represent the amount paid by the class during periods when reimbursements or reductions occur. Expenses net of fee waivers reflect expenses after reimbursement by the investment adviser but prior to reductions from brokerage service arrangements or other expense offset arrangements. Expenses net of all reductions represent the net expenses paid by the class.
I Amount does not include the portfolio activity of any underlying Fidelity Central Funds.
J The portfolio turnover rate does not include the assets acquired in the merger.
See accompanying notes which are an integral part of the financial statements.
Financial Highlights — VIP Growth Opportunities Portfolio Investor Class
| | | | | | |
| Years ended December 31, | 2015 | 2014 | 2013 | 2012 | 2011 |
| Selected Per–Share Data | | | | | |
| Net asset value, beginning of period | $33.37 | $29.84 | $21.72 | $18.23 | $17.86 |
| Income from Investment Operations | | | | | |
| Net investment income (loss)A | .07 | .04 | .06 | .07 | .02 |
| Net realized and unrealized gain (loss) | 1.70 | 3.57 | 8.14 | 3.49 | .37 |
| Total from investment operations | 1.77 | 3.61 | 8.20 | 3.56 | .39 |
| Distributions from net investment income | (.05) | (.05) | (.07) | (.07) | (.02) |
| Distributions from net realized gain | (3.49) | (.03) | (.01) | – | – |
| Total distributions | (3.54) | (.08) | (.08) | (.07) | (.02) |
| Net asset value, end of period | $31.60 | $33.37 | $29.84 | $21.72 | $18.23 |
| Total ReturnB,C | 5.54% | 12.09% | 37.77% | 19.54% | 2.18% |
| Ratios to Average Net AssetsD,E | | | | | |
| Expenses before reductions | .75% | .76% | .77% | .78% | .78% |
| Expenses net of fee waivers, if any | .75% | .76% | .76% | .78% | .78% |
| Expenses net of all reductions | .74% | .76% | .76% | .77% | .78% |
| Net investment income (loss) | .22% | .13% | .23% | .31% | .09% |
| Supplemental Data | | | | | |
| Net assets, end of period (000 omitted) | $270,119 | $136,782 | $122,334 | $77,969 | $54,374 |
| Portfolio turnover rateF | 63%G | 11% | 25% | 36% | 34% |
A Calculated based on average shares outstanding during the period.
B Total returns do not reflect charges attributable to your insurance company's separate account. Inclusion of these charges would reduce the total returns shown.
C Total returns would have been lower if certain expenses had not been reduced during the applicable periods shown.
D Fees and expenses of any underlying Fidelity Central Funds are not included in the Fund's expense ratio. The Fund indirectly bears its proportionate share of the expenses of any underlying Fidelity Central Funds.
E Expense ratios reflect operating expenses of the class. Expenses before reductions do not reflect amounts reimbursed by the investment adviser or reductions from brokerage service arrangements or reductions from other expense offset arrangements and do not represent the amount paid by the class during periods when reimbursements or reductions occur. Expenses net of fee waivers reflect expenses after reimbursement by the investment adviser but prior to reductions from brokerage service arrangements or other expense offset arrangements. Expenses net of all reductions represent the net expenses paid by the class.
F Amount does not include the portfolio activity of any underlying Fidelity Central Funds.
G The portfolio turnover rate does not include the assets acquired in the merger.
See accompanying notes which are an integral part of the financial statements.
Notes to Financial Statements
For the period ended December 31, 2015
1. Organization.
VIP Growth Opportunities Portfolio (the Fund) is a fund of Variable Insurance Products Fund III (the Trust) and is authorized to issue an unlimited number of shares. The Trust is registered under the Investment Company Act of 1940, as amended (the 1940 Act), as an open-end management investment company organized as a Massachusetts business trust. Shares of the Fund may only be purchased by insurance companies for the purpose of funding variable annuity or variable life insurance contracts. The Fund offers the following classes of shares: Initial Class shares, Service Class shares, Service Class 2 shares and Investor Class shares. All classes have equal rights and voting privileges, except for matters affecting a single class.
2. Investments in Fidelity Central Funds.
The Fund invests in Fidelity Central Funds, which are open-end investment companies generally available only to other investment companies and accounts managed by the investment adviser and its affiliates. The Fund's Schedule of Investments lists each of the Fidelity Central Funds held as of period end, if any, as an investment of the Fund, but does not include the underlying holdings of each Fidelity Central Fund. As an Investing Fund, the Fund indirectly bears its proportionate share of the expenses of the underlying Fidelity Central Funds.
The Money Market Central Funds seek preservation of capital and current income and are managed by Fidelity Investments Money Management, Inc. (FIMM), an affiliate of the investment adviser. Annualized expenses of the Money Market Central Funds as of their most recent shareholder report date are less than .005%.
A complete unaudited list of holdings for each Fidelity Central Fund is available upon request or at the Securities and Exchange Commission (the SEC) website at www.sec.gov. In addition, the financial statements of the Fidelity Central Funds, which are not covered by the Fund's Report of Independent Registered Public Accounting Firm, are available on the SEC website or upon request.
3. Significant Accounting Policies.
The financial statements have been prepared in conformity with accounting principles generally accepted in the United States of America (GAAP), which require management to make certain estimates and assumptions at the date of the financial statements. Actual results could differ from those estimates. Subsequent events, if any, through the date that the financial statements were issued have been evaluated in the preparation of the financial statements. The following summarizes the significant accounting policies of the Fund:
Investment Valuation. Investments are valued as of 4:00 p.m. Eastern time on the last calendar day of the period. The Board of Trustees (the Board) has delegated the day to day responsibility for the valuation of the Fund's investments to the Fidelity Management & Research Company (FMR) Fair Value Committee (the Committee). In accordance with valuation policies and procedures approved by the Board, the Fund attempts to obtain prices from one or more third party pricing vendors or brokers to value its investments. When current market prices, quotations or currency exchange rates are not readily available or reliable, investments will be fair valued in good faith by the Committee, in accordance with procedures adopted by the Board. Factors used in determining fair value vary by investment type and may include market or investment specific events. The frequency with which these procedures are used cannot be predicted and they may be utilized to a significant extent. The Committee oversees the Fund's valuation policies and procedures and reports to the Board on the Committee's activities and fair value determinations. The Board monitors the appropriateness of the procedures used in valuing the Fund's investments and ratifies the fair value determinations of the Committee.
The Fund categorizes the inputs to valuation techniques used to value its investments into a disclosure hierarchy consisting of three levels as shown below:
- Level 1 – quoted prices in active markets for identical investments
- Level 2 – other significant observable inputs (including quoted prices for similar investments, interest rates, prepayment speeds, etc.)
- Level 3 – unobservable inputs (including the Fund's own assumptions based on the best information available)
Valuation techniques used to value the Fund's investments by major category are as follows:
Equity securities, including restricted securities, for which market quotations are readily available, are valued at the last reported sale price or official closing price as reported by a third party pricing vendor on the primary market or exchange on which they are traded and are categorized as Level 1 in the hierarchy. In the event there were no sales during the day or closing prices are not available, securities are valued at the last quoted bid price or may be valued using the last available price and are generally categorized as Level 2 in the hierarchy. For foreign equity securities, when market or security specific events arise, comparisons to the valuation of American Depositary Receipts (ADRs), futures contracts, Exchange-Traded Funds (ETFs) and certain indexes as well as quoted prices for similar securities may be used and would be categorized as Level 2 in the hierarchy. Utilizing these techniques may result in transfers between Level 1 and Level 2. For equity securities, including restricted securities, where observable inputs are limited, assumptions about market activity and risk are used and these securities may be categorized as Level 3 in the hierarchy.
Investments in open-end mutual funds, including the Fidelity Central Funds, are valued at their closing net asset value (NAV) each business day and are categorized as Level 1 in the hierarchy.
Changes in valuation techniques may result in transfers in or out of an assigned level within the disclosure hierarchy. The aggregate value of investments by input level as of December 31, 2015 is included at the end of the Fund's Schedule of Investments.
Foreign Currency. The Fund may use foreign currency contracts to facilitate transactions in foreign-denominated securities. Gains and losses from these transactions may arise from changes in the value of the foreign currency or if the counterparties do not perform under the contracts' terms.
Foreign-denominated assets, including investment securities, and liabilities are translated into U.S. dollars at the exchange rates at period end. Purchases and sales of investment securities, income and dividends received and expenses denominated in foreign currencies are translated into U.S. dollars at the exchange rate in effect on the transaction date.
The effects of exchange rate fluctuations on investments are included with the net realized and unrealized gain (loss) on investment securities. Other foreign currency transactions resulting in realized and unrealized gain (loss) are disclosed separately.
Investment Transactions and Income. For financial reporting purposes, the Fund's investment holdings and NAV include trades executed through the end of the last business day of the period. The NAV per share for processing shareholder transactions is calculated as of the close of business of the New York Stock Exchange (NYSE), normally 4:00 p.m. Eastern time and includes trades executed through the end of the prior business day. Gains and losses on securities sold are determined on the basis of identified cost and may include proceeds received from litigation. Dividend income is recorded on the ex-dividend date, except for certain dividends from foreign securities where the ex-dividend date may have passed, which are recorded as soon as the Fund is informed of the ex-dividend date. Non-cash dividends included in dividend income, if any, are recorded at the fair market value of the securities received. Income and capital gain distributions from Fidelity Central Funds, if any, are recorded on the ex-dividend date. Distributions received on securities that represent a return of capital or capital gain are recorded as a reduction of cost of investments and/or as a realized gain. Subsequent to ex-dividend date the Fund determines the components of these distributions, based upon receipt of tax filings or other correspondence relating to the underlying investment. Interest income is accrued as earned and includes coupon interest and amortization of premium and accretion of discount on debt securities as applicable. Investment income is recorded net of foreign taxes withheld where recovery of such taxes is uncertain.
Class Allocations and Expenses. Investment income, realized and unrealized capital gains and losses, common expenses of the Fund, and certain fund-level expense reductions, if any, are allocated daily on a pro-rata basis to each class based on the relative net assets of each class to the total net assets of the Fund. Each class differs with respect to transfer agent and distribution and service plan fees incurred. Certain expense reductions may also differ by class. For the reporting period, the allocated portion of income and expenses to each class as a percent of its average net assets may vary due to the timing of recording these transactions in relation to fluctuating net assets of the classes. Expenses directly attributable to a fund are charged to that fund. Expenses attributable to more than one fund are allocated among the respective funds on the basis of relative net assets or other appropriate methods. Expense estimates are accrued in the period to which they relate and adjustments are made when actual amounts are known.
Income Tax Information and Distributions to Shareholders. Each year, the Fund intends to qualify as a regulated investment company under Subchapter M of the Internal Revenue Code, including distributing substantially all of its taxable income and realized gains. As a result, no provision for U.S. Federal income taxes is required. As of December 31, 2015, the Fund did not have any unrecognized tax benefits in the financial statements; nor is the Fund aware of any tax positions for which it is reasonably possible that the total amounts of unrecognized tax benefits will significantly change in the next twelve months. The Fund files a U.S. federal tax return, in addition to state and local tax returns as required. The Fund's federal income tax returns are subject to examination by the Internal Revenue Service (IRS) for a period of three fiscal years after they are filed. State and local tax returns may be subject to examination for an additional fiscal year depending on the jurisdiction. Foreign taxes are provided for based on the Fund's understanding of the tax rules and rates that exist in the foreign markets in which it invests.
Distributions are declared and recorded on the ex-dividend date. Income dividends and capital gain distributions are declared separately for each class. Income and capital gain distributions are determined in accordance with income tax regulations, which may differ from GAAP.
Capital accounts within the financial statements are adjusted for permanent book-tax differences. These adjustments have no impact on net assets or the results of operations. Capital accounts are not adjusted for temporary book-tax differences which will reverse in a subsequent period.
Book-tax differences are primarily due to foreign currency transactions, passive foreign investment companies (PFIC), deferred trustees compensation, and losses deferred due to wash sales.
The federal tax cost of investment securities and unrealized appreciation (depreciation) as of period end were as follows:
| Gross unrealized appreciation | $251,722,623 |
| Gross unrealized depreciation | (27,088,531) |
| Net unrealized appreciation (depreciation) on securities | $224,634,092 |
| Tax Cost | $554,492,907 |
The tax-based components of distributable earnings as of period end were as follows:
| Undistributed ordinary income | $147,485 |
| Undistributed long-term capital gain | $13,822,307 |
| Net unrealized appreciation (depreciation) on securities and other investments | $224,634,050 |
The tax character of distributions paid was as follows:
| | December 31, 2015 | December 31, 2014 |
| Ordinary Income | $823,400 | $ 1,178,980 |
| Long-term Capital Gains | 71,791,408 | – |
| Total | $72,614,808 | $ 1,178,980 |
Restricted Securities. The Fund may invest in securities that are subject to legal or contractual restrictions on resale. These securities generally may be resold in transactions exempt from registration or to the public if the securities are registered. Disposal of these securities may involve time-consuming negotiations and expense, and prompt sale at an acceptable price may be difficult. Information regarding restricted securities is included at the end of the Fund's Schedule of Investments.
4. Derivative Instruments.
Risk Exposures and the Use of Derivative Instruments. The Fund's investment objective allows the Fund to enter into various types of derivative contracts, including futures contracts. Derivatives are investments whose value is primarily derived from underlying assets, indices or reference rates and may be transacted on an exchange or over-the-counter (OTC). Derivatives may involve a future commitment to buy or sell a specified asset based on specified terms, to exchange future cash flows at periodic intervals based on a notional principal amount, or for one party to make one or more payments upon the occurrence of specified events in exchange for periodic payments from the other party.
The Fund used derivatives to increase returns and to manage exposure to certain risks as defined below. The success of any strategy involving derivatives depends on analysis of numerous economic factors, and if the strategies for investment do not work as intended, the Fund may not achieve its objectives.
The Fund's use of derivatives increased or decreased its exposure to the following risk:
| Equity Risk | Equity risk relates to the fluctuations in the value of financial instruments as a result of changes in market prices (other than those arising from interest rate risk or foreign exchange risk), whether caused by factors specific to an individual investment, its issuer, or all factors affecting all instruments traded in a market or market segment.
|
The Fund is also exposed to additional risks from investing in derivatives, such as liquidity risk and counterparty credit risk. Liquidity risk is the risk that the Fund will be unable to close out the derivative in the open market in a timely manner. Counterparty credit risk is the risk that the counterparty will not be able to fulfill its obligation to the Fund. Counterparty credit risk related to exchange-traded futures contracts may be mitigated by the protection provided by the exchange on which they trade.
Investing in derivatives may involve greater risks than investing in the underlying assets directly and, to varying degrees, may involve risk of loss in excess of any initial investment and collateral received and amounts recognized in the Statement of Assets and Liabilities. In addition, there may be the risk that the change in value of the derivative contract does not correspond to the change in value of the underlying instrument.
Futures Contracts. A futures contract is an agreement between two parties to buy or sell a specified underlying instrument for a fixed price at a specified future date. The Fund used futures contracts to manage its exposure to the stock market.
Upon entering into a futures contract, a fund is required to deposit either cash or securities (initial margin) with a clearing broker in an amount equal to a certain percentage of the face value of the contract. Futures contracts are marked-to-market daily and subsequent daily payments (variation margin) are made or received by a fund depending on the daily fluctuations in the value of the futures contracts and are recorded as unrealized appreciation or (depreciation). This receivable and/or payable, if any, is included in daily variation margin for derivative instruments in the Statement of Assets and Liabilities. Realized gain or (loss) is recorded upon the expiration or closing of a futures contract.
Any open futures contracts at period end are presented in the Schedule of Investments under the caption "Futures Contracts". The underlying face amount at value reflects each contract's exposure to the underlying instrument or index at period end.
During the period the Fund recognized net realized gain (loss) of $(818,060) related to its investment in futures contracts. This amount is included in the Statement of Operations.
5. Purchases and Sales of Investments.
Purchases and sales of securities, other than short-term securities and securities acquired in the merger, aggregated $406,502,999 and $399,556,326, respectively.
6. Fees and Other Transactions with Affiliates.
Management Fee. Fidelity Management & Research Company (the investment adviser) and its affiliates provide the Fund with investment management related services for which the Fund pays a monthly management fee. The management fee is the sum of an individual fund fee rate that is based on an annual rate of .30% of the Fund's average net assets and an annualized group fee rate that averaged .25% during the period. The group fee rate is based upon the average net assets of all the mutual funds advised by the investment adviser, including any mutual funds previously advised by the investment adviser that are currently advised by Fidelity SelectCo, LLC, an affiliate of the investment adviser. The group fee rate decreases as assets under management increase and increases as assets under management decrease. For the reporting period, the total annual management fee rate was .55% of the Fund's average net assets.
Distribution and Service Plan Fees. In accordance with Rule 12b-1 of the 1940 Act, the Fund has adopted separate 12b-1 Plans for each Service Class of shares. Each Service Class pays Fidelity Distributors Corporation (FDC), an affiliate of the investment adviser, a service fee. For the period, the service fee is based on an annual rate of .10% of Service Class' average net assets and .25% of Service Class 2's average net assets.
For the period, total fees, all of which were re-allowed to insurance companies for the distribution of shares and providing shareholder support services, were as follows:
| Service Class | $130,501 |
| Service Class 2 | 338,331 |
| | $468,832 |
Transfer Agent Fees. Fidelity Investments Institutional Operations Company, Inc. (FIIOC), an affiliate of the investment adviser, is the Fund's transfer, dividend disbursing, and shareholder servicing agent. FIIOC receives an asset-based fee with respect to each class. Each class (with the exception of Investor Class) pays a fee for transfer agent services, typesetting, printing and mailing of shareholder reports, excluding mailing of proxy statements and out of pocket expenses, equal to an annual rate of .07% (.15% for Investor Class) of class-level average net assets. For the period, transfer agent fees for each class, including out of pocket expenses, were as follows:
| Initial Class | $113,920 |
| Service Class | 86,368 |
| Service Class 2 | 89,853 |
| Investor Class | 325,634 |
| | $615,775 |
Accounting and Security Lending Fees. Fidelity Service Company, Inc. (FSC), an affiliate of the investment adviser, maintains the Fund's accounting records. The accounting fee is based on the level of average net assets for each month. Under a separate contract, FSC administers the security lending program. The security lending fee is based on the number and duration of lending transactions.
Brokerage Commissions. The Fund placed a portion of its portfolio transactions with brokerage firms which are affiliates of the investment adviser. Brokerage commissions are included in net realized gain (loss) and change in net unrealized appreciation (depreciation) in the Statement of Operations. The commissions paid to these affiliated firms were $9,643 for the period.
Interfund Trades. The Fund may purchase from or sell securities to other Fidelity Funds under procedures adopted by the Board. The procedures have been designed to ensure these interfund trades are executed in accordance with Rule 17a-7 of the 1940 Act. Interfund trades are included within the respective purchases and sales amounts shown in the Purchases and Sales of Investments note.
Other. During the period, the investment adviser reimbursed the Fund for certain losses in the amount of $2,494.
7. Committed Line of Credit.
The Fund participates with other funds managed by the investment adviser or an affiliate in a $4.25 billion credit facility (the "line of credit") to be utilized for temporary or emergency purposes to fund shareholder redemptions or for other short-term liquidity purposes. The Fund has agreed to pay commitment fees on its pro-rata portion of the line of credit, which amounted to $920 and is reflected in Miscellaneous expenses on the Statement of Operations. During the period, the Fund did not borrow on this line of credit.
8. Security Lending.
The Fund lends portfolio securities through a lending agent from time to time in order to earn additional income. For equity securities, a lending agent is used and may loan securities to certain qualified borrowers, including Fidelity Capital Markets (FCM), a broker-dealer affiliated with the Fund. On the settlement date of the loan, the Fund receives collateral (in the form of U.S. Treasury obligations, letters of credit and/or cash) against the loaned securities and maintains collateral in an amount not less than 100% of the market value of the loaned securities during the period of the loan. The market value of the loaned securities is determined at the close of business of the Fund and any additional required collateral is delivered to the Fund on the next business day. The Fund or borrower may terminate the loan at any time, and if the borrower defaults on its obligation to return the securities loaned because of insolvency or other reasons, the Fund may apply collateral received from the borrower against the obligation. The Fund may experience delays and costs in recovering the securities loaned. Any cash collateral received is invested in the Fidelity Securities Lending Cash Central Fund. The value of loaned securities and cash collateral at period end are disclosed on the Fund's Statement of Assets and Liabilities. The value of securities loaned to FCM at period end was $1,442,280. Security lending income represents the income earned on investing cash collateral, less rebates paid to borrowers and any lending agent fees associated with the loan, plus any premium payments received for lending certain types of securities. Security lending income is presented in the Statement of Operations as a component of income from Fidelity Central Funds and includes $20,376 from securities loaned to FCM.
9. Expense Reductions.
Commissions paid to certain brokers with whom the investment adviser, or its affiliates, places trades on behalf of the Fund include an amount in addition to trade execution, which may be rebated back to the Fund to offset certain expenses. This amount totaled $20,918 for the period.
In addition, during the period the investment adviser reimbursed and/or waived a portion of fund-level operating expenses in the amount of $2,871 and a portion of class-level operating expenses as follows:
| | $Amount |
| Investor Class | $4,888 |
10. Distributions to Shareholders.
Distributions to shareholders of each class were as follows:
| Years ended December 31, | 2015 | 2014 |
| From net investment income | | |
| Initial Class | $320,894 | $351,311 |
| Service Class | 69,435 | 160,771 |
| Service Class 2 | 5,026 | 5,386 |
| Investor Class | 345,930 | 189,064 |
| Total | $741,285 | $706,532 |
| From net realized gain | | |
| Initial Class | $17,409,526 | $151,905 |
| Service Class | 11,786,825 | 135,006 |
| Service Class 2 | 16,848,249 | 58,035 |
| Investor Class | 25,828,923 | 127,502 |
| Total | $71,873,523 | $472,448 |
11. Share Transactions.
Transactions for each class of shares were as follows:
| | Shares | Shares | Dollars | Dollars |
| Years ended December 31, | 2015 | 2014 | 2015 | 2014 |
| Initial Class | | | | |
| Shares sold | 645,934 | 512,978 | $22,399,656 | $16,333,011 |
| Issued in exchange for shares of VIP Growth Stock Portfolio | 711,426 | – | 25,262,741 | – |
| Reinvestment of distributions | 567,119 | 15,429 | 17,730,420 | 503,216 |
| Shares redeemed | (1,117,965) | (1,257,525) | (38,432,494) | (39,052,534) |
| Net increase (decrease) | 806,514 | (729,118) | $26,960,323 | $(22,216,307) |
| Service Class | | | | |
| Shares sold | 69,061 | 155,613 | $2,385,381 | $4,880,744 |
| Issued in exchange for shares of VIP Growth Stock Portfolio | 17,544 | – | 621,950 | – |
| Reinvestment of distributions | 379,069 | 9,099 | 11,856,260 | 295,777 |
| Shares redeemed | (1,115,052) | (1,303,177) | (38,332,449) | (40,452,129) |
| Net increase (decrease) | (649,378) | (1,138,465) | $(23,468,858) | $(35,275,608) |
| Service Class 2 | | | | |
| Shares sold | 2,060,374 | 874,275 | $70,488,391 | $27,087,183 |
| Issued in exchange for shares of VIP Growth Stock Portfolio | 1,406,338 | – | 49,432,795 | – |
| Reinvestment of distributions | 546,218 | 1,981 | 16,853,275 | 63,421 |
| Shares redeemed | (879,259) | (1,100,725) | (30,055,817) | (33,708,932) |
| Net increase (decrease) | 3,133,671 | (224,469) | $106,718,644 | $(6,558,328) |
| Investor Class | | | | |
| Shares sold | 1,142,653 | 1,147,410 | $39,385,547 | $35,661,285 |
| Issued in exchange for shares of VIP Growth Stock Portfolio | 3,476,126 | – | 122,915,819 | – |
| Reinvestment of distributions | 842,775 | 9,750 | 26,174,853 | 316,566 |
| Shares redeemed | (1,011,465) | (1,158,845) | (34,436,720) | (35,298,754) |
| Net increase (decrease) | 4,450,089 | (1,685) | $154,039,499 | $679,097 |
12. Other.
The Fund's organizational documents provide former and current trustees and officers with a limited indemnification against liabilities arising in connection with the performance of their duties to the Fund. In the normal course of business, the Fund may also enter into contracts that provide general indemnifications. The Fund's maximum exposure under these arrangements is unknown as this would be dependent on future claims that may be made against the Fund. The risk of material loss from such claims is considered remote.
At the end of the period, the investment adviser or its affiliates were the owners of record of 51% of the total outstanding shares of the Fund and one otherwise unaffiliated shareholder was the owner of record of 11% of the total outstanding shares of the Fund.
13. Merger Information.
On April 24, 2015, the Fund acquired all of the assets and assumed all of the liabilities of VIP Growth Stock Portfolio ("Target Fund") pursuant to an Agreement and Plan of Reorganization approved by the Board of Trustees ("The Board"). The acquisition was accomplished by an exchange of shares of each class of the Fund for corresponding shares then outstanding of the Target Fund at their respective net asset value on the acquisition date. The reorganization provides shareholders of the Target Fund access to a larger portfolio with a similar investment objective and lower expenses. The reorganization qualified as a tax-free reorganization for federal income tax purposes with no gain or loss recognized to the funds or their shareholders. The Target Fund's net assets of $198,233,305, including securities of $195,063,924 and unrealized appreciation of $30,894,612 was combined with VIP Growth Opportunities Portfolio's net assets of $545,944,315 for total net assets after the acquisition of $744,177,620.
Pro forma results of operations of the combined entity for the entire period ended December 31, 2015, as though the acquisition had occurred as of the beginning of the year (rather than on the actual acquisition date), are as follows:
| Net Investment income (loss) | $1,885,674 |
| Total net realized gain (loss) | 100,248,061 |
| Total change in net unrealized appreciation (depreciation) | (64,663,111) |
| Net increase (decrease) in net assets resulting from operations | $37,470,624 |
Because the combined investment portfolios have been managed as a single portfolio since the acquisition was completed, it is not practicable to separate the amounts of revenue and earnings of the acquired fund that have been included in the Fund's accompanying Statement of Operations since April 24, 2015.
Report of Independent Registered Public Accounting Firm
To the Trustees of Variable Insurance Products Fund III and Shareholders of VIP Growth Opportunities Portfolio:
We have audited the accompanying statement of assets and liabilities of VIP Growth Opportunities Portfolio (the Fund), a fund of Variable Insurance Products Fund III, including the schedule of investments, as of December 31, 2015, and the related statement of operations for the year then ended, the statement of changes in net assets for each of the two years in the period then ended, and the financial highlights for each of the five years in the period then ended. These financial statements and financial highlights are the responsibility of the Fund's management. Our responsibility is to express an opinion on these financial statements and financial highlights based on our audits.
We conducted our audits in accordance with the standards of the Public Company Accounting Oversight Board (United States). Those standards require that we plan and perform the audit to obtain reasonable assurance about whether the financial statements and financial highlights are free of material misstatement. The Fund is not required to have, nor were we engaged to perform, an audit of its internal control over financial reporting. Our audits included consideration of internal control over financial reporting as a basis for designing audit procedures that are appropriate in the circumstances, but not for the purpose of expressing an opinion on the effectiveness of the Fund's internal control over financial reporting. Accordingly, we express no such opinion. An audit also includes examining, on a test basis, evidence supporting the amounts and disclosures in the financial statements, assessing the accounting principles used and significant estimates made by management, as well as evaluating the overall financial statement presentation. Our procedures included confirmation of securities owned as of December 31, 2015, by correspondence with the custodians and brokers; when replies were not received from brokers, we performed other auditing procedures. We believe that our audits provide a reasonable basis for our opinion.
In our opinion, such financial statements and financial highlights referred to above present fairly, in all material respects, the financial position of VIP Growth Opportunities Portfolio as of December 31, 2015, the results of its operations for the year then ended, the changes in its net assets for each of the two years in the period then ended, and the financial highlights for each of the five years in the period then ended, in conformity with accounting principles generally accepted in the United States of America.
DELOITTE & TOUCHE LLP
Boston, Massachusetts
February 17, 2016
Trustees and Officers
The Trustees, Members of the Advisory Board (if any), and officers of the trust and fund, as applicable, are listed below. The Board of Trustees governs the fund and is responsible for protecting the interests of shareholders. The Trustees are experienced executives who meet periodically throughout the year to oversee the fund's activities, review contractual arrangements with companies that provide services to the fund, oversee management of the risks associated with such activities and contractual arrangements, and review the fund's performance. Each of the Trustees oversees 170 funds.
The Trustees hold office without limit in time except that (a) any Trustee may resign; (b) any Trustee may be removed by written instrument, signed by at least two-thirds of the number of Trustees prior to such removal; (c) any Trustee who requests to be retired or who has become incapacitated by illness or injury may be retired by written instrument signed by a majority of the other Trustees; and (d) any Trustee may be removed at any special meeting of shareholders by a two-thirds vote of the outstanding voting securities of the trust. Each Trustee who is not an interested person (as defined in the 1940 Act) of the trust and the fund is referred to herein as an Independent Trustee. Each Independent Trustee shall retire not later than the last day of the calendar year in which his or her 75th birthday occurs. The Independent Trustees may waive this mandatory retirement age policy with respect to individual Trustees. Officers and Advisory Board Members hold office without limit in time, except that any officer or Advisory Board Member may resign or may be removed by a vote of a majority of the Trustees at any regular meeting or any special meeting of the Trustees. Except as indicated, each individual has held the office shown or other offices in the same company for the past five years.
The fund’s Statement of Additional Information (SAI) includes more information about the Trustees. To request a free copy, call Fidelity at 1-877-208-0098.
Experience, Skills, Attributes, and Qualifications of the Trustees. The Governance and Nominating Committee has adopted a statement of policy that describes the experience, qualifications, attributes, and skills that are necessary and desirable for potential Independent Trustee candidates (Statement of Policy). The Board believes that each Trustee satisfied at the time he or she was initially elected or appointed a Trustee, and continues to satisfy, the standards contemplated by the Statement of Policy. The Governance and Nominating Committee also engages professional search firms to help identify potential Independent Trustee candidates who have the experience, qualifications, attributes, and skills consistent with the Statement of Policy. From time to time, additional criteria based on the composition and skills of the current Independent Trustees, as well as experience or skills that may be appropriate in light of future changes to board composition, business conditions, and regulatory or other developments, have also been considered by the professional search firms and the Governance and Nominating Committee. In addition, the Board takes into account the Trustees' commitment and participation in Board and committee meetings, as well as their leadership of standing and ad hoc committees throughout their tenure.
In determining that a particular Trustee was and continues to be qualified to serve as a Trustee, the Board has considered a variety of criteria, none of which, in isolation, was controlling. The Board believes that, collectively, the Trustees have balanced and diverse experience, qualifications, attributes, and skills, which allow the Board to operate effectively in governing the fund and protecting the interests of shareholders. Information about the specific experience, skills, attributes, and qualifications of each Trustee, which in each case led to the Board's conclusion that the Trustee should serve (or continue to serve) as a trustee of the fund, is provided below.
Board Structure and Oversight Function. James C. Curvey is an interested person and currently serves as Chairman. The Trustees have determined that an interested Chairman is appropriate and benefits shareholders because an interested Chairman has a personal and professional stake in the quality and continuity of services provided to the fund. Independent Trustees exercise their informed business judgment to appoint an individual of their choosing to serve as Chairman, regardless of whether the Trustee happens to be independent or a member of management. The Independent Trustees have determined that they can act independently and effectively without having an Independent Trustee serve as Chairman and that a key structural component for assuring that they are in a position to do so is for the Independent Trustees to constitute a substantial majority for the Board. The Independent Trustees also regularly meet in executive session. Ned C. Lautenbach serves as Chairman of the Independent Trustees and as such (i) acts as a liaison between the Independent Trustees and management with respect to matters important to the Independent Trustees and (ii) with management prepares agendas for Board meetings.
Fidelity® funds are overseen by different Boards of Trustees. The fund's Board oversees Fidelity's high income and certain equity funds, and other Boards oversee Fidelity's investment-grade bond, money market, asset allocation, and sector funds. The asset allocation funds may invest in Fidelity® funds overseen by the fund's Board. The use of separate Boards, each with its own committee structure, allows the Trustees of each group of Fidelity® funds to focus on the unique issues of the funds they oversee, including common research, investment, and operational issues. On occasion, the separate Boards establish joint committees to address issues of overlapping consequences for the Fidelity® funds overseen by each Board.
The Trustees operate using a system of committees to facilitate the timely and efficient consideration of all matters of importance to the Trustees, the fund, and fund shareholders and to facilitate compliance with legal and regulatory requirements and oversight of the fund's activities and associated risks. The Board, acting through its committees, has charged FMR and its affiliates with (i) identifying events or circumstances the occurrence of which could have demonstrably adverse effects on the fund's business and/or reputation; (ii) implementing processes and controls to lessen the possibility that such events or circumstances occur or to mitigate the effects of such events or circumstances if they do occur; and (iii) creating and maintaining a system designed to evaluate continuously business and market conditions in order to facilitate the identification and implementation processes described in (i) and (ii) above. Because the day-to-day operations and activities of the fund are carried out by or through FMR, its affiliates, and other service providers, the fund's exposure to risks is mitigated but not eliminated by the processes overseen by the Trustees. While each of the Board's committees has responsibility for overseeing different aspects of the fund's activities, oversight is exercised primarily through the Operations, Audit, and Compliance Committees. In addition, the Independent Trustees have worked with FMR to enhance the Board's oversight of investment and financial risks, legal and regulatory risks, technology risks, and operational risks, including the development of additional risk reporting to the Board. For example, a working group comprised of Independent Trustees and FMR has worked and continues to work to review the Fidelity® funds' valuation-related activities, reporting and risk management. Appropriate personnel, including but not limited to the fund's Chief Compliance Officer (CCO), FMR's internal auditor, the independent accountants, the fund's Treasurer and portfolio management personnel, make periodic reports to the Board's committees, as appropriate, including an annual review of Fidelity's risk management program for the Fidelity® funds. The responsibilities of each standing committee, including their oversight responsibilities, are described further under "Standing Committees of the Trustees."
Interested Trustees*:
Correspondence intended for a Trustee who is an interested person may be sent to Fidelity Investments, 245 Summer Street, Boston, Massachusetts 02210.
Name, Year of Birth; Principal Occupations and Other Relevant Experience+
James C. Curvey (1935)
Year of Election or Appointment: 2007
Trustee
Chairman of the Board of Trustees
Mr. Curvey also serves as Trustee of other Fidelity® funds. Mr. Curvey is a Director of Fidelity Research & Analysis Co. (investment adviser firm, 2009-present), and Vice Chairman (2007-present) and Director of FMR LLC (diversified financial services company). In addition, Mr. Curvey serves as an Overseer for the Boston Symphony Orchestra and a member of the board of Artis-Naples, Naples, Florida, and as a Trustee for Brewster Academy, Wolfeboro, New Hampshire. Previously, Mr. Curvey served as a Director of Fidelity Investments Money Management, Inc. (investment adviser firm, 2009-2014) and a Director of FMR and FMR Co., Inc. (investment adviser firms, 2007-2014).
Charles S. Morrison (1960)
Year of Election or Appointment: 2014
Trustee
Mr. Morrison also serves as Trustee of other funds. He serves as a Director of Fidelity Investments Money Management, Inc. (FIMM) (investment adviser firm, 2014-present), Director of Fidelity SelectCo, LLC (investment adviser firm, 2014-present), President, Asset Management (2014-present), and is an employee of Fidelity Investments. Previously, Mr. Morrison served as Vice President of Fidelity's Fixed Income and Asset Allocation Funds (2012-2014), President, Fixed Income (2011-2014), Vice President of Fidelity's Money Market Funds (2005-2009), President, Money Market Group Leader of FMR (investment adviser firm, 2009), and Senior Vice President, Money Market Group of FMR (2004-2009). Mr. Morrison also served as Vice President of Fidelity's Bond Funds (2002-2005), certain Balanced Funds (2002-2005), and certain Asset Allocation Funds (2002-2007), and as Senior Vice President (2002-2005) of Fidelity's Bond Division.
* Determined to be an “Interested Trustee” by virtue of, among other things, his or her affiliation with the trust or various entities under common control with FMR.
+ The information includes the Trustee's principal occupation during the last five years and other information relating to the experience, attributes, and skills relevant to the Trustee's qualifications to serve as a Trustee, which led to the conclusion that the Trustee should serve as a Trustee for the fund.
Independent Trustees:
Correspondence intended for an Independent Trustee may be sent to Fidelity Investments, P.O. Box 55235, Boston, Massachusetts 02205-5235.
Name, Year of Birth; Principal Occupations and Other Relevant Experience+
Dennis J. Dirks (1948)
Year of Election or Appointment: 2005
Trustee
Mr. Dirks also serves as Trustee of other Fidelity® funds. Prior to his retirement in May 2003, Mr. Dirks was Chief Operating Officer and a member of the Board of The Depository Trust & Clearing Corporation (DTCC). He also served as President, Chief Operating Officer, and Board member of The Depository Trust Company (DTC) and President and Board member of the National Securities Clearing Corporation (NSCC). In addition, Mr. Dirks served as Chief Executive Officer and Board member of the Government Securities Clearing Corporation, Chief Executive Officer and Board member of the Mortgage-Backed Securities Clearing Corporation, as a Trustee and a member of the Finance Committee of Manhattan College (2005-2008), as a Trustee and a member of the Finance Committee of AHRC of Nassau County (2006-2008), and as a member of the Independent Directors Council (IDC) Governing Council (2010-2015). Mr. Dirks is a member of the Board of Directors for The Brookville Center for Children's Services, Inc. (2009-present).
Alan J. Lacy (1953)
Year of Election or Appointment: 2008
Trustee
Mr. Lacy also serves as Trustee of other Fidelity® funds. Mr. Lacy serves as Chairman (2014-present) and a member (2010-present) of the Board of Directors of Dave & Buster's Entertainment, Inc. (restaurant and entertainment complexes) and a Director of Bristol-Myers Squibb Company (global pharmaceuticals, 2008-present). He is a Trustee of the California Chapter of The Nature Conservancy (2015-present) and a Director of the Center for Advanced Study in the Behavioral Sciences at Stanford University (2015-present). In addition, Mr. Lacy served as Senior Adviser (2007-2014) of Oak Hill Capital Partners, L.P. (private equity) and also served as Chief Executive Officer (2005) and Vice Chairman (2005-2006) of Sears Holdings Corporation (retail) and Chief Executive Officer and Chairman of the Board of Sears, Roebuck and Co. (retail, 2000-2005). Previously, Mr. Lacy served as Chairman (2008-2011) and a member (2006-2015) of the Board of Trustees of the National Parks Conservation Association and as a member of the Board of Directors for The Western Union Company (global money transfer, 2006-2011), The Hillman Companies, Inc. (hardware wholesalers, 2010-2014), and Earth Fare, Inc. (retail grocery, 2010-2014).
Ned C. Lautenbach (1944)
Year of Election or Appointment: 2000
Trustee
Chairman of the Independent Trustees
Mr. Lautenbach also serves as Trustee of other Fidelity® funds. Mr. Lautenbach currently serves as the Lead Director of the Eaton Corporation Board of Directors (diversified industrial, 1997-present). Mr. Lautenbach is Chairman of the Board of Directors of Artis-Naples in Naples, Florida (2012-present), a member of the Council on Foreign Relations (1994-present), and a member of the Board of Governors, State University System of Florida (2013-present). Previously, Mr. Lautenbach was a Partner/Advisory Partner at Clayton, Dubilier & Rice, LLC (private equity investment, 1998-2010), as well as a Director of Sony Corporation (2006-2007).
Joseph Mauriello (1944)
Year of Election or Appointment: 2008
Trustee
Mr. Mauriello also serves as Trustee of other Fidelity® funds. Prior to his retirement in January 2006, Mr. Mauriello served in numerous senior management positions including Deputy Chairman and Chief Operating Officer (2004-2005), and Vice Chairman of Financial Services (2002-2004) of KPMG LLP US (professional services, 1965-2005). Mr. Mauriello currently serves as a member of the Board of Directors of XL Group plc. (global insurance and re-insurance, 2006-present) and the Independent Directors Council (IDC) Governing Council (2015-present). Previously, Mr. Mauriello served as a Director of the Hamilton Funds of the Bank of New York (2006-2007) and of Arcadia Resources Inc. (health care services and products, 2007-2012).
Robert W. Selander (1950)
Year of Election or Appointment: 2011
Trustee
Mr. Selander also serves as Trustee of other Fidelity® funds. Mr. Selander serves as a Director of The Western Union Company (global money transfer, 2014-present) and a non-executive Chairman of Health Equity, Inc. (health savings custodian, 2015-present). Previously, Mr. Selander served as a Member of the Advisory Board of other Fidelity® funds (2011), and Executive Vice Chairman (2010), Chief Executive Officer (2009-2010), and President and Chief Executive Officer (1997-2009) of Mastercard, Inc.
Cornelia M. Small (1944)
Year of Election or Appointment: 2005
Trustee
Ms. Small also serves as Trustee of other Fidelity® funds. Ms. Small is a member of the Board of Directors (2009-present) and Chair of the Investment Committee (2010-present) of the Teagle Foundation. Ms. Small also serves on the Investment Committee of the Berkshire Taconic Community Foundation (2008-present). Previously, Ms. Small served as Chairperson (2002-2008) and a member of the Investment Committee and Chairperson (2008-2012) and a member of the Board of Trustees of Smith College. In addition, Ms. Small served as Chief Investment Officer, Director of Global Equity Investments, and a member of the Board of Directors of Scudder, Stevens & Clark and Scudder Kemper Investments.
William S. Stavropoulos (1939)
Year of Election or Appointment: 2002
Trustee
Vice Chairman of the Independent Trustees
Mr. Stavropoulos also serves as Trustee of other Fidelity® funds. Mr. Stavropoulos serves as President and Founder of the Michigan Baseball Foundation, the Great Lakes Loons (2007-present). Mr. Stavropoulos is Chairman Emeritus of the Board of Directors of The Dow Chemical Company, where he previously served in numerous senior management positions, including President, CEO (1995-2000; 2002-2004), Chairman of the Executive Committee (2000-2006), and as a member of the Board of Directors (1990-2006). Currently, Mr. Stavropoulos is Chairman of the Board of Directors of Univar Inc. (global distributor of commodity and specialty chemicals), a Director of Teradata Corporation (data warehousing and technology solutions), and Maersk Inc. (industrial conglomerate), and a member of the Advisory Board for Metalmark Capital LLC (private equity investment, 2005-present). Mr. Stavropoulos is an operating advisor to Clayton, Dubilier & Rice, LLC (private equity investment). In addition, Mr. Stavropoulos is a member of the University of Notre Dame Advisory Council for the College of Science, a Trustee of the Rollin L. Gerstacker Foundation, and a Director of the Naples Philharmonic Center for the Arts. Previously, Mr. Stavropoulos served as a Director of Chemical Financial Corporation (bank holding company, 1993-2012) and Tyco International, Ltd. (multinational manufacturing and services, 2007-2012).
David M. Thomas (1949)
Year of Election or Appointment: 2008
Trustee
Mr. Thomas also serves as Trustee of other Fidelity® funds. Mr. Thomas serves as Non-Executive Chairman of the Board of Directors of Fortune Brands Home and Security (home and security products, 2011-present), as a member of the Board of Directors (2004-present) and Presiding Director (2013-present) of Interpublic Group of Companies, Inc. (marketing communication), and as a member of the Board of Trustees of the University of Florida (2013-present). Previously, Mr. Thomas served as Executive Chairman (2005-2006) and Chairman and Chief Executive Officer (2000-2005) of IMS Health, Inc. (pharmaceutical and healthcare information solutions), and a Director of Fortune Brands, Inc. (consumer products, 2000-2011).
+ The information includes the Trustee's principal occupation during the last five years and other information relating to the experience, attributes, and skills relevant to the Trustee's qualifications to serve as a Trustee, which led to the conclusion that the Trustee should serve as a Trustee for the fund.
Advisory Board Members and Officers:
Correspondence intended for an officer or Peter S. Lynch may be sent to Fidelity Investments, 245 Summer Street, Boston, Massachusetts 02210. Officers appear below in alphabetical order.
Name, Year of Birth; Principal Occupation
Peter S. Lynch (1944)
Year of Election or Appointment: 2003
Member of the Advisory Board
Mr. Lynch also serves as Member of the Advisory Board of other Fidelity® funds. Mr. Lynch is Vice Chairman and a Director of FMR (investment adviser firm) and FMR Co., Inc. (investment adviser firm). In addition, Mr. Lynch serves as a Trustee of Boston College and as the Chairman of the Inner-City Scholarship Fund. Previously, Mr. Lynch served on the Special Olympics International Board of Directors (1997-2006).
Marc R. Bryant (1966)
Year of Election or Appointment: 2015
Secretary and Chief Legal Officer (CLO)
Mr. Bryant also serves as Secretary and CLO of other funds. Mr. Bryant serves as CLO, Secretary, and Senior Vice President of Fidelity Management & Research Company (investment adviser firm, 2015-present) and FMR Co., Inc. (investment adviser firm, 2015-present); Secretary of Fidelity SelectCo, LLC (investment adviser firm, 2015-present) and Fidelity Investments Money Management, Inc. (investment adviser firm, 2015-present); and CLO of Fidelity Management & Research (Hong Kong) Limited (investment adviser firm, 2015-present). He is Senior Vice President and Deputy General Counsel of FMR LLC (diversified financial services company). Previously, Mr. Bryant served as Secretary and CLO of Fidelity Rutland Square Trust II (2010-2014) and Assistant Secretary of Fidelity's Fixed Income and Asset Allocation Funds (2013-2015). Prior to joining Fidelity Investments, Mr. Bryant served as a Senior Vice President and the Head of Global Retail Legal for AllianceBernstein L.P. (2006-2010), and as the General Counsel for ProFund Advisors LLC (2001-2006).
William C. Coffey (1969)
Year of Election or Appointment: 2009
Assistant Secretary
Mr. Coffey also serves as Assistant Secretary of other funds. He is Senior Vice President and Deputy General Counsel of FMR LLC (diversified financial services company, 2010-present), and is an employee of Fidelity Investments. Previously, Mr. Coffey served as Vice President and Associate General Counsel of FMR LLC (2005-2009).
Jonathan Davis (1968)
Year of Election or Appointment: 2010
Assistant Treasurer
Mr. Davis also serves as Assistant Treasurer of other funds, and is an employee of Fidelity Investments. Previously, Mr. Davis served as Vice President and Associate General Counsel of FMR LLC (diversified financial services company, 2003-2010).
Adrien E. Deberghes (1967)
Year of Election or Appointment: 2008
Deputy Treasurer
Mr. Deberghes also serves as an officer of other funds. He is an employee of Fidelity Investments (2008-present). Prior to joining Fidelity Investments, Mr. Deberghes was Senior Vice President of Mutual Fund Administration at State Street Corporation (2007-2008), Senior Director of Mutual Fund Administration at Investors Bank & Trust (2005-2007), and Director of Finance for Dunkin' Brands (2000-2005).
Stephanie J. Dorsey (1969)
Year of Election or Appointment: 2010
Assistant Treasurer
Ms. Dorsey also serves as an officer of other funds. She is an employee of Fidelity Investments (2008-present) and has served in other fund officer roles. Prior to joining Fidelity Investments, Ms. Dorsey served as Treasurer (2004-2008) of the JPMorgan Mutual Funds and Vice President (2004-2008) of JPMorgan Chase Bank.
Howard J. Galligan III (1966)
Year of Election or Appointment: 2014
Chief Financial Officer
Mr. Galligan also serves as Chief Financial Officer of other funds. Mr. Galligan serves as President of Fidelity Pricing and Cash Management Services (FPCMS) (2014-present) and as a Director of Strategic Advisers, Inc. (investment adviser firm, 2008-present). Previously, Mr. Galligan served as Chief Administrative Officer of Asset Management (2011-2014) and Chief Operating Officer and Senior Vice President of Investment Support for Strategic Advisers, Inc. (2003-2011).
Scott C. Goebel (1968)
Year of Election or Appointment: 2015
Vice President
Mr. Goebel serves as Vice President of other funds and is an employee of Fidelity Investments (2001-present). Previously, Mr. Goebel served as Secretary of Fidelity SelectCo, LLC (investment adviser firm, 2013-2015), Fidelity Investments Money Management, Inc. (FIMM) (investment adviser firm, 2010-2015), and Fidelity Research and Analysis Company (FRAC) (investment adviser firm, 2010-2015); General Counsel, Secretary, and Senior Vice President of Fidelity Management & Research Company (investment adviser firm, 2008-2015) and FMR Co., Inc. (investment adviser firm, 2008-2015); Assistant Secretary of Fidelity Management & Research (Japan) Limited (investment adviser firm, 2008-2015) and FMR Investment Management (U.K.) Limited (investment adviser firm, 2008-2015); Chief Legal Officer (CLO) of Fidelity Management & Research (Hong Kong) Limited (investment adviser firm, 2008-2015); Secretary and CLO of certain Fidelity® funds (2008-2015); Assistant Secretary of FIMM (2008-2010), FRAC (2008-2010), and certain funds (2007-2008); and as Vice President and Secretary of Fidelity Distributors Corporation (FDC) (2005-2007).
Brian B. Hogan (1964)
Year of Election or Appointment: 2009
Vice President
Mr. Hogan also serves as Trustee or Vice President of other funds. Mr. Hogan serves as a Director of Fidelity SelectCo, LLC (investment adviser firm, 2014-present) and President of the Equity Division of FMR (investment adviser firm, 2009-present). Previously, Mr. Hogan served as Senior Vice President, Equity Research of FMR (2006-2009) and as a portfolio manager.
Chris Maher (1972)
Year of Election or Appointment: 2013
Assistant Treasurer
Mr. Maher serves as Assistant Treasurer of other funds. Mr. Maher is Vice President of Valuation Oversight and is an employee of Fidelity Investments. Previously, Mr. Maher served as Vice President of Asset Management Compliance (2013), Vice President of the Program Management Group of FMR (investment adviser firm, 2010-2013), and Vice President of Valuation Oversight (2008-2010).
John F. Papandrea (1972)
Year of Election or Appointment: 2016
Anti-Money Laundering (AML) Officer
Mr. Papandrea also serves as AML Officer of other funds. Mr. Papandrea is Vice President of FMR LLC (diversified financial services company, 2008-present) and is an employee of Fidelity Investments (2005-present).
Melissa M. Reilly (1971)
Year of Election or Appointment: 2014
Vice President of certain Equity Funds
Ms. Reilly also serves as Vice President of other funds. Ms. Reilly is an employee of Fidelity Investments (2004-present).
Kenneth B. Robins (1969)
Year of Election or Appointment: 2008
President and Treasurer
Mr. Robins also serves as an officer of other funds. Mr. Robins serves as Executive Vice President of Fidelity Investments Money Management, Inc. (FIMM) (investment adviser firm, 2013-present) and is an employee of Fidelity Investments (2004-present). Previously, Mr. Robins served in other fund officer roles.
Stacie M. Smith (1974)
Year of Election or Appointment: 2013
Deputy Treasurer
Ms. Smith also serves as an officer of other funds. She is an employee of Fidelity Investments (2009-present) and has served in other fund officer roles. Prior to joining Fidelity Investments, Ms. Smith served as Senior Audit Manager of Ernst & Young LLP (1996-2009).
Renee Stagnone (1975)
Year of Election or Appointment: 2013
Deputy Treasurer
Ms. Stagnone also serves as Deputy Treasurer of other funds. Ms. Stagnone is an employee of Fidelity Investments (1997-present).
Linda J. Wondrack (1964)
Year of Election or Appointment: 2014
Chief Compliance Officer
Ms. Wondrack also serves as Chief Compliance Officer of other funds. Ms. Wondrack is Executive Vice President and head of the Ethics Office and Asset Management Compliance for Fidelity Investments (2012-present). Ms. Wondrack also serves as Chief Compliance Officer of Fidelity SelectCo, LLC (investment adviser firm, 2014-present); Chief Compliance Officer of Impresa Management LLC (2013-present); and Chief Compliance Officer of FMR Co., Inc. (investment adviser firm), Fidelity Investments Money Management, Inc. (investment adviser firm), FMR Investment Management (U.K.) Limited (investment adviser firm), Fidelity Management & Research (Hong Kong) (investment adviser firm), Fidelity Management & Research Company (investment adviser firm), FIAM LLC (investment adviser firm), and Strategic Advisers, Inc. (investment adviser firm), Ballyrock Investment Advisors LLC, and Northern Neck Investors LLC (2012-present). Previously, Ms. Wondrack served as Chief Compliance Officer of Fidelity Management & Research (Japan) Limited (investment adviser firm, 2012-2016); Senior Vice President and Chief Compliance Officer for Columbia Management Investment Advisers, LLC (2005-2012); Chief Compliance Officer for certain funds within the Columbia Family of Funds (2007-2012); and Senior Vice President of Compliance Risk Management at Bank of America (2005-2010).
Joseph F. Zambello (1957)
Year of Election or Appointment: 2011
Deputy Treasurer
Mr. Zambello also serves as Deputy Treasurer of other funds. Mr. Zambello is an employee of Fidelity Investments (1991-present). Previously, Mr. Zambello served as Vice President of the Program Management Group of FMR (investment adviser firm, 2009-2011) and Vice President of the Transfer Agent Oversight Group (2005-2009).
Shareholder Expense Example
As a shareholder of the Fund, you incur two types of costs: (1) transaction costs, and (2) ongoing costs, including management fees, distribution and/or service (12b-1) fees and other Fund expenses. This Example is intended to help you understand your ongoing costs (in dollars) of investing in the Fund and to compare these costs with the ongoing costs of investing in other mutual funds.
The Example is based on an investment of $1,000 invested at the beginning of the period and held for the entire period (July 1, 2015 to December 31, 2015).
Actual Expenses
The first line of the accompanying table for each class of the Fund provides information about actual account values and actual expenses. You may use the information in this line, together with the amount you invested, to estimate the expenses that you paid over the period. Simply divide your account value by $1,000.00 (for example, an $8,600 account value divided by $1,000.00 = 8.6), then multiply the result by the number in the first line for a class of the Fund under the heading entitled "Expenses Paid During Period" to estimate the expenses you paid on your account during this period. The estimate of expenses does not include any fees or other expenses of any variable annuity or variable life insurance product. If they were, the estimate of expenses you paid during the period would be higher, and your ending account value would be lower. In addition, the Fund, as a shareholder in the underlying Fidelity Central Funds, will indirectly bear its pro-rata share of the fees and expenses incurred by the underlying Fidelity Central Funds. These fees and expenses are not included in the Fund's annualized expense ratio used to calculate the expense estimate in the table below.
Hypothetical Example for Comparison Purposes
The second line of the accompanying table for each class of the Fund provides information about hypothetical account values and hypothetical expenses based on a Class' actual expense ratio and an assumed rate of return of 5% per year before expenses, which is not the Class' actual return. The hypothetical account values and expenses may not be used to estimate the actual ending account balance or expenses you paid for the period. You may use this information to compare the ongoing costs of investing in the Fund and other funds. To do so, compare this 5% hypothetical example with the 5% hypothetical examples that appear in the shareholder reports of the other funds. The estimate of expenses does not include any fees or other expenses of any variable annuity or variable life insurance product. If they were, the estimate of expenses you paid during the period would be higher, and your ending account value would be lower. In addition, the Fund, as a shareholder in the underlying Fidelity Central Funds, will indirectly bear its pro-rata share of the fees and expenses incurred by the underlying Fidelity Central Funds. These fees and expenses are not included in the Fund's annualized expense ratio used to calculate the expense estimate in the table below.
Please note that the expenses shown in the table are meant to highlight your ongoing costs only and do not reflect any transaction costs. Therefore, the second line of the table is useful in comparing ongoing costs only, and will not help you determine the relative total costs of owning different funds.
| | Annualized Expense Ratio-A | Beginning
Account Value
July 1, 2015 | Ending
Account Value
December 31, 2015 | Expenses Paid
During Period-B
July 1, 2015
to December 31, 2015 |
| Initial Class | .67% | | | |
| Actual | | $1,000.00 | $1,008.80 | $3.39 |
| Hypothetical-C | | $1,000.00 | $1,021.83 | $3.41 |
| Service Class | .76% | | | |
| Actual | | $1,000.00 | $1,007.80 | $3.85 |
| Hypothetical-C | | $1,000.00 | $1,021.37 | $3.87 |
| Service Class 2 | .92% | | | |
| Actual | | $1,000.00 | $1,007.30 | $4.65 |
| Hypothetical-C | | $1,000.00 | $1,020.57 | $4.69 |
| Investor Class | .75% | | | |
| Actual | | $1,000.00 | $1,008.30 | $3.80 |
| Hypothetical-C | | $1,000.00 | $1,021.42 | $3.82 |
A Annualized expense ratio reflects expenses net of applicable fee waivers.
B Expenses are equal to each Class' annualized expense ratio, multiplied by the average account value over the period, multiplied by 184/365 (to reflect the one-half year period).
C 5% return per year before expenses
Distributions (Unaudited)
The Board of Trustees of VIP Growth Stock Portfolio voted to pay to shareholders of record at the opening of business on record date, the following distributions per share derived from capital gains realized from sales of portfolio securities, and dividends derived from net investment income:
| | Pay Date | Record Date | Dividends | Capital Gains |
| Initial Class | 04/21/15 | 04/21/15 | $0.052 | $1.942 |
| Service Class | 04/21/15 | 04/21/15 | $0.046 | $1.942 |
| Service Class 2 | 04/21/15 | 04/21/15 | $0.036 | $1.942 |
| Investor Class | 04/21/15 | 04/21/15 | $0.047 | $1.942 |
| | | | | |
The Board of Trustees of VIP Growth Opportunities Portfolio voted to pay to shareholders of record at the opening of business on record date, the following distributions per share derived from capital gains realized from sales of portfolio securities, and dividends derived from net investment income:
| | Pay Date | Record Date | Dividends | Capital Gains |
| Initial Class | 02/05/16 | 02/05/16 | $0.007 | $0.602 |
| Service Class | 02/05/16 | 02/05/16 | $0.007 | $0.602 |
| Service Class 2 | 02/05/16 | 02/05/16 | $0.007 | $0.602 |
| Investor Class | 02/05/16 | 02/05/16 | $0.007 | $0.602 |
| | | | | |
VIP Growth Stock Portfolio hereby designates as a capital gain dividend with respect to the taxable year ended April 24, 2015 $11,122,382, or, if subsequently determined to be different, the net capital gain of such year. The preceding designation includes $191,100 of long-term capital gains that were distributed by VIP Growth Opportunities Portfolio on July 2, 2015 as a deficiency dividend with respect to VIP Growth Stock Portfolio in accordance with Section 860 of the Internal Revenue Code and Treas. Reg. section 1.381(c)(25)-1. On July 2, 2015, VIP Growth Opportunities Portfolio paid a distribution of $82,116 of short-term capital gains and $205,290 of long-term capital gains to its shareholders, which included $69,411 of short-term capital gains and $191,100 of long-term capital gains that were realized, but not distributed, by VIP Growth Stock Portfolio before VIP Growth Stock Portfolio merged into the fund on April 24, 2015.
VIP Growth Opportunities Portfolio hereby designates as a capital gain dividend with respect to the taxable year ended December 31, 2015 $81,339,516, or, if subsequently determined to be different, the net capital gain of such year.
VIP Growth Stock Portfolio Initial Class, VIP Growth Stock Portfolio Service Class, VIP Growth Stock Portfolio Service Class 2, and VIP Growth Stock Portfolio Investor Class designate 6% of the dividends distributed in April 2015 as qualifying for the dividends-received deduction for corporate shareholders.
VIP Growth Opportunities Portfolio Initial Class, VIP Growth Opportunities Portfolio Service Class, VIP Growth Opportunities Portfolio Service Class 2, and VIP Growth Opportunities Portfolio Investor Class designate 100% of the dividends distributed in December 2015, as qualifying for the dividends-received deduction for corporate shareholders.
Board Approval of Investment Advisory Contracts and Management Fees
VIP Growth Opportunities Portfolio
Each year, the Board of Trustees, including the Independent Trustees (together, the Board), votes on the renewal of the management contract with Fidelity Management & Research Company (FMR) and the sub-advisory agreements (together, the Advisory Contracts) for the fund. The Board, assisted by the advice of fund counsel and Independent Trustees' counsel, requests and considers a broad range of information relevant to the renewal of the Advisory Contracts throughout the year.
The Board meets regularly and, at each of its meetings, covers an extensive agenda of topics and materials and considers factors that are relevant to its annual consideration of the renewal of the fund's Advisory Contracts, including the services and support provided to the fund and its shareholders. The Board has established various standing committees (Committees), each composed of and chaired by Independent Trustees with varying backgrounds, to which the Board has assigned specific subject matter responsibilities in order to enhance effective decision-making by the Board. The Board, acting directly and through its Committees, requests and receives information concerning the annual consideration of the renewal of the fund's Advisory Contracts. The Board also meets as needed to consider matters specifically related to the Board's annual consideration of the renewal of the Advisory Contracts. Members of the Board may also meet with trustees of other Fidelity funds through ad hoc joint committees to discuss certain matters relevant to all of the Fidelity funds.
At its July 2015 meeting, the Board unanimously determined to renew the fund's Advisory Contracts. In reaching its determination, the Board considered all factors it believed relevant, including (i) the nature, extent, and quality of the services to be provided to the fund and its shareholders (including the investment performance of the fund); (ii) the competitiveness of the fund's management fee and total expense ratio relative to peer funds; (iii) the total costs of the services to be provided by and the profits to be realized by Fidelity from its relationship with the fund; and (iv) the extent to which (if any) economies of scale exist and would be realized as the fund grows, and whether any economies of scale are appropriately shared with fund shareholders.
In considering whether to renew the Advisory Contracts for the fund, the Board reached a determination, with the assistance of fund counsel and Independent Trustees' counsel and through the exercise of its business judgment, that the renewal of the Advisory Contracts was in the best interests of the fund and its shareholders and that the compensation payable under the Advisory Contracts was fair and reasonable. The Board's decision to renew the Advisory Contracts was not based on any single factor, but rather was based on a comprehensive consideration of all the information provided to the Board at its meetings throughout the year. The Board, in reaching its determination to renew the Advisory Contracts, was aware that shareholders of the fund have a broad range of investment choices available to them, including a wide choice among funds offered by Fidelity's competitors, and that the fund's shareholders, who have the opportunity to review and weigh the disclosure provided by the fund in its prospectus and other public disclosures, have chosen to invest in this fund, which is part of the Fidelity family of funds.
Nature, Extent, and Quality of Services Provided. The Board considered Fidelity's staffing as it relates to the fund, including the backgrounds of investment personnel of Fidelity, and also considered the fund's investment objective, strategies, and related investment philosophy. The Independent Trustees also had discussions with senior management of Fidelity's investment operations and investment groups. The Board considered the structure of the portfolio manager compensation program and whether this structure provides appropriate incentives to act in the best interests of the fund. Additionally, the Board considered the portfolio managers' investments, if any, in the funds that they manage.
Resources Dedicated to Investment Management and Support Services. The Board and the Fund Oversight and Research Committees reviewed the general qualifications and capabilities of Fidelity's investment staff, including its size, education, experience, and resources, as well as Fidelity's approach to recruiting, training, managing, and compensating investment personnel. The Board noted that Fidelity has continued to increase the resources devoted to non-U.S. offices, including expansion of Fidelity's global investment organization. The Board also noted that Fidelity's analysts have extensive resources, tools and capabilities that allow them to conduct sophisticated quantitative and fundamental analysis, as well as credit analysis of issuers, counterparties and guarantors. Further, the Board considered that Fidelity's investment professionals have sufficient access to global information and data so as to provide competitive investment results over time, and that those professionals also have access to sophisticated tools that permit them to assess portfolio construction and risk and performance attribution characteristics continuously, as well as to transmit new information and research conclusions rapidly around the world. Additionally, in its deliberations, the Board considered Fidelity's trading, risk management, and compliance capabilities and resources, which are integral parts of the investment management process.
Shareholder and Administrative Services. The Board considered (i) the nature, extent, quality, and cost of advisory, administrative, and shareholder services performed by FMR, the sub-advisers (together with FMR, the Investment Advisers), and their affiliates under the Advisory Contracts and under separate agreements covering transfer agency, pricing and bookkeeping, and securities lending services for the fund; (ii) the nature and extent of the supervision of third party service providers, principally custodians and subcustodians; and (iii) the resources devoted to, and the record of compliance with, the fund's compliance policies and procedures. The Board also reviewed the allocation of fund brokerage, including allocations to brokers affiliated with the Investment Advisers, the use of brokerage commissions to pay fund expenses, and the use of "soft" commission dollars to pay for research services.
The Board noted that the growth of fund assets over time across the complex allows Fidelity to reinvest in the development of services designed to enhance the value or convenience of the Fidelity funds as investment vehicles. These services include 24-hour access to account information and market information through telephone representatives and over the Internet, investor education materials and asset allocation tools, and the expanded availability of Fidelity Investor Centers.
In 2014, the Board formed an ad hoc Committee on Transfer Agency Fees to review the variety of transfer agency fee structures throughout the industry and Fidelity's competitive positioning with respect to industry participants.
Investment in a Large Fund Family. The Board considered the benefits to shareholders of investing in a Fidelity fund, including the benefits of investing in a fund that is part of a large family of funds offering a variety of investment disciplines and providing a large variety of mutual fund investor services. The Board noted that Fidelity had taken, or had made recommendations that resulted in the Fidelity funds taking, a number of actions over the previous year that benefited particular funds, including (i) continuing to dedicate additional resources to investment research and to the support of the senior management team that oversees asset management; (ii) continuing efforts to enhance Fidelity's global research capabilities; (iii) launching new funds and making other enhancements to meet client needs; (iv) reducing management fees and total expenses for certain index funds and diversified international funds; (v) continuing to launch dedicated lower cost underlying funds to meet portfolio construction needs related to expanding underlying fund options for Fidelity funds of funds, specifically for the Freedom Fund product lines; (vi) rationalizing product lines and gaining increased efficiencies through fund mergers; (vii) launching active fixed-income exchange-traded funds; (viii) continuing to develop, acquire and implement systems and technology to improve services to the funds and information security and to increase efficiency; (ix) implementing investment enhancements to further strengthen Fidelity's target date product line to increase investors' probability of success in achieving their goals; (x) modifying the eligibility criteria for certain share classes to accommodate roll-over assets from employer-sponsored retirement plans; (xi) launching a new Class W of the Freedom Index Funds to attract and retain Fidelity record-kept retirement plan assets; and (xii) implementing changes to Fidelity's money market product line in response to recent money market regulatory reforms.
Investment Performance. The Board considered whether the fund has operated in accordance with its investment objective, as well as its record of compliance with its investment restrictions and its performance history. The Board noted that there were portfolio management changes for the fund in October 2012 and March 2015.
The Board took into account discussions with representatives of the Investment Advisers about fund investment performance that occur at Board meetings throughout the year. In this regard the Board noted that as part of regularly scheduled fund reviews and other reports to the Board on fund performance, the Board considers annualized return information for the fund, for different time periods, measured against a securities market index ("benchmark index") and a peer group of funds with similar objectives ("peer group"), if any. In its evaluation of fund investment performance, the Board gave particular attention to information indicating changes in performance of certain Fidelity funds for specific time periods and discussed with the Investment Advisers the reasons for any overperformance or underperformance.
In addition to reviewing absolute and relative fund performance, the Independent Trustees periodically consider the appropriateness of fund performance metrics in evaluating the results achieved. In general, the Independent Trustees believe that fund performance should be evaluated based on net performance (after fees and expenses) of both the highest performing and lowest performing fund share classes, where applicable, compared to appropriate benchmark indices, over appropriate time periods that may include full market cycles, and compared to peer groups, as applicable, over the same periods, taking into account relevant factors including the following: general market conditions; issuer-specific information; and fund cash flows and other factors.
The Independent Trustees recognize that shareholders evaluate performance on a net basis over their own holding periods, for which one-, three-, and five-year periods are often used as a proxy. For this reason, the performance information reviewed by the Board also included net cumulative calendar year total return information for the fund and an appropriate benchmark index and peer group for the most recent one-, three-, and five-year periods, as shown below. Returns are shown compared to the 25th percentile (top of box, 75% beaten) and 75th percentile (bottom of box, 25% beaten) of the peer universe.
VIP Growth Opportunities Portfolio
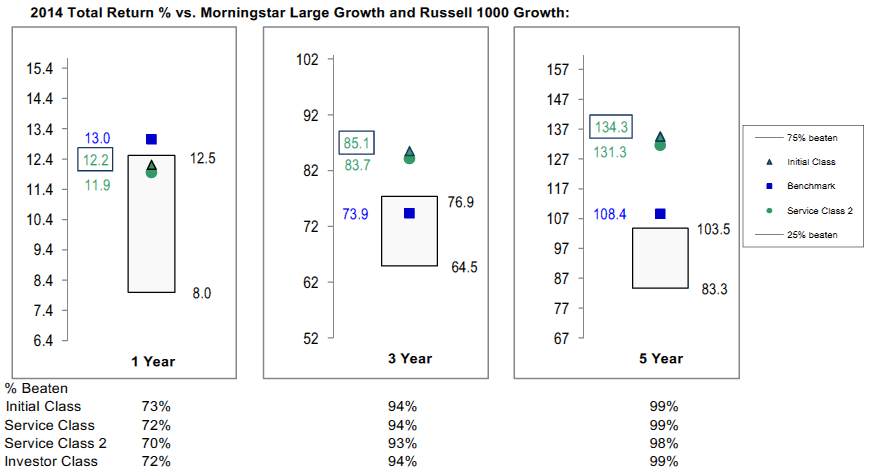
Based on its review, the Board concluded that the nature, extent, and quality of services provided to the fund under the Advisory Contracts should benefit the shareholders of the fund.
Competitiveness of Management Fee and Total Expense Ratio. The Board considered the fund's management fee and total expense ratio compared to "mapped groups" of competitive funds and classes created for the purpose of facilitating the Trustees' competitive analysis of management fees and total expenses. Fidelity creates "mapped groups" by combining similar Lipper investment objective categories that have comparable investment mandates. Combining Lipper investment objective categories aids the Board's management fee and total expense ratio comparisons by broadening the competitive group used for comparison.
Management Fee. The Board considered two proprietary management fee comparisons for the 12-month periods shown in basis points (BP) in the chart below. The group of Lipper funds used by the Board for management fee comparisons is referred to below as the "Total Mapped Group." The Total Mapped Group comparison focuses on a fund's standing in terms of gross management fees before expense reimbursements or caps relative to the total universe of funds with comparable investment mandates, regardless of whether their management fee structures also are comparable. Funds with comparable investment mandates offer exposure to similar types of securities. Funds with comparable management fee structures have similar management fee contractual arrangements (
e.g., flat rate charged for advisory services, all-inclusive fee rate,
etc.). "TMG %" represents the percentage of funds in the Total Mapped Group that had management fees that were lower than the fund's. For example, a hypothetical TMG % of 20% would mean that 80% of the funds in the Total Mapped Group had higher, and 20% had lower, management fees than the fund. The fund's actual TMG %s and the number of funds in the Total Mapped Group are in the chart below. The "Asset-Size Peer Group" (ASPG) comparison focuses on a fund's standing relative to a subset of non-Fidelity funds within the Total Mapped Group that are similar in size and management fee structure without taking into account performance adjustments, if any. For example, if a fund is in the first quartile of the ASPG, the fund's management fee ranks in the least expensive or lowest 25% of funds in the ASPG. The ASPG represents at least 15% of the funds in the Total Mapped Group with comparable asset size and management fee structures, subject to a minimum of 50 funds (or all funds in the Total Mapped Group if fewer than 50). Additional information, such as the ASPG quartile in which the fund's management fee rate ranked, is also included in the chart and considered by the Board.
VIP Growth Opportunities Portfolio
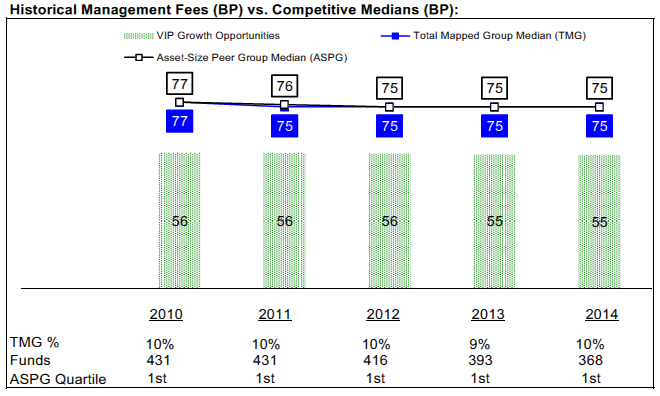
The Board noted that the fund's management fee rate ranked below the median of its Total Mapped Group and below the median of its ASPG for 2014.
The Board noted that, in 2014, the ad hoc Committee on Group Fee was formed by it and other Fidelity fund boards to conduct an in-depth review of the "group fee" component of the management fee of funds with such management fee structures. Committee focus included the mechanics of the group fee, the competitive landscape of group fee structures, Fidelity funds with no group fee component and investment products not included in group fee assets. The Board also considered that, for funds subject to the group fee, FMR agreed to voluntarily waive fees over a specified period of time in amounts designed to account for assets converted from certain funds to certain collective investment trusts.
The Board also noted that, in 2013, the ad hoc Committee on Management Fees was formed to conduct an in-depth review of the management fee rates of Fidelity's active equity mutual funds. The Committee focused on the following areas: (i) standard fee structures; (ii) research consumption and trading evolution; (iii) management fee competitiveness/profitability by category; and (iv) factors that drive institutional pricing.
Based on its review, the Board concluded that the fund's management fee is fair and reasonable in light of the services that the fund receives and the other factors considered.
Total Expense Ratio. In its review of each class's total expense ratio, the Board considered the fund's management fee as well as other fund or class expenses, as applicable, such as transfer agent fees, pricing and bookkeeping fees, fund-paid 12b-1 fees, and custodial, legal, and audit fees. The Board also noted that Fidelity may agree to waive fees and expenses from time to time, and the extent to which, if any, it has done so for the fund. As part of its review, the Board also considered the current and historical total expense ratios of each class of the fund compared to competitive fund median expenses. Each class of the fund is compared to those funds and classes in the Total Mapped Group (used by the Board for management fee comparisons) that have a similar sales load structure.
The Board noted that the total expense ratio of each of Initial Class, Investor Class, and Service Class ranked below its competitive median for 2014 and the total expense ratio of Service Class 2 ranked above its competitive median for 2014. The Board considered that, in general, various factors can affect total expense ratios. The Board noted that the total expense ratio of Service Class 2 was above the competitive median primarily because of higher 12b-1 fees for Service Class 2 as compared to most competitor funds. The Board noted that the fund offers multiple classes, each of which has a different 12b-1 fee structure, and that the multiple structures are intended to offer a range of pricing options for the intermediary market. The Board also noted that the total expense ratios of the classes vary primarily by the level of their 12b-1 fees, although differences in transfer agent fees may also cause expenses to vary from class to class.
Fees Charged to Other Fidelity Clients. The Board also considered Fidelity fee structures and other information with respect to clients of Fidelity, such as other funds advised or subadvised by Fidelity, pension plan clients, and other institutional clients with similar mandates. The Board noted the findings of the 2013 ad hoc joint committee (created with the board of other Fidelity funds), which reviewed and compared Fidelity's institutional investment advisory business with its business of providing services to the Fidelity funds, including the differences in services provided, fees charged, and costs incurred, as well as competition in their respective marketplaces.
Based on its review of total expense ratios and fees charged to other Fidelity clients, the Board concluded that, although Service Class 2 was above the median of the universe presented for comparison, the total expense ratio of each class of the fund was reasonable in light of the services that the fund and its shareholders receive and the other factors considered.
Costs of the Services and Profitability. The Board considered the revenues earned and the expenses incurred by Fidelity in conducting the business of developing, marketing, distributing, managing, administering and servicing the fund and servicing the fund's shareholders. The Board also considered the level of Fidelity's profits in respect of all the Fidelity funds.
On an annual basis, Fidelity presents to the Board information about the profitability of its relationship with the fund. Fidelity calculates profitability information for each fund, as well as aggregate profitability information for groups of Fidelity funds and all Fidelity funds, using a series of detailed revenue and cost allocation methodologies which originate with the books and records of Fidelity on which Fidelity's audited financial statements are based. The Audit Committee of the Board reviews any significant changes from the prior year's methodologies.
PricewaterhouseCoopers LLP (PwC), independent registered public accounting firm and auditor to Fidelity and certain Fidelity funds, has been engaged annually by the Board as part of the Board's assessment of Fidelity's profitability analysis. PwC's engagement includes the review and assessment of the methodologies used by Fidelity in determining the revenues and expenses attributable to Fidelity's mutual fund business, and completion of agreed-upon procedures in respect of the mathematical accuracy of fund profitability and its conformity to established allocation methodologies. After considering PwC's reports issued under the engagement and information provided by Fidelity, the Board concluded that while other allocation methods may also be reasonable, Fidelity's profitability methodologies are reasonable in all material respects.
The Board also reviewed Fidelity's non-fund businesses and fall-out benefits related to the mutual fund business as well as cases where Fidelity's affiliates may benefit from or be related to the fund's business.
The Board considered the costs of the services provided by and the profits realized by Fidelity in connection with the operation of the fund and was satisfied that the profitability was not excessive.
Economies of Scale. The Board considered whether there have been economies of scale in respect of the management of the Fidelity funds, whether the Fidelity funds (including the fund) have appropriately benefited from any such economies of scale, and whether there is potential for realization of any further economies of scale. The Board considered the extent to which the fund will benefit from economies of scale as assets grow through increased services to the fund, through waivers or reimbursements, or through fee or expense ratio reductions. The Board also noted that in 2013, it and the boards of other Fidelity funds created an ad hoc committee (the Economies of Scale Committee) to analyze whether Fidelity attains economies of scale in respect of the management and servicing of the Fidelity funds, whether the Fidelity funds have appropriately benefited from such economies of scale, and whether there is potential for realization of any further economies of scale.
The Board recognized that the fund's management contract incorporates a "group fee" structure, which provides for lower group fee rates as total group assets increase, and for higher group fee rates as total group assets decrease (with "group assets" defined to include fund assets under FMR's management plus sector fund assets previously under FMR's management and currently managed by Fidelity SelectCo, LLC). FMR calculates the group fee rates based on a tiered asset "breakpoint" schedule that varies based on asset class. The Board considered that the group fee is designed to deliver the benefits of economies of scale to fund shareholders when total Fidelity fund assets increase, even if assets of any particular fund are unchanged or have declined, because some portion of Fidelity's costs are attributable to services provided to all Fidelity funds, and all funds benefit if those costs can be allocated among more assets. The Board concluded that, given the group fee structure, fund shareholders will benefit from lower management fees as group assets increase at the fund complex level, regardless of whether Fidelity achieves any such economies of scale.
The Board concluded, taking into account the analysis of the Economies of Scale Committee, that economies of scale, if any, are being appropriately shared between fund shareholders and Fidelity.
Additional Information Requested by the Board. In order to develop fully the factual basis for consideration of the Fidelity funds' Advisory Contracts, the Board requested and received additional information on certain topics, including: (i) fund performance trends and Fidelity's long-term strategies for certain funds; (ii) the various share classes employed by Fidelity and the attributes of each class, together with similar information on the distribution and servicing payments made by Fidelity or the funds to third-party participants in the distribution channels; (iii) fund profitability, and fund performance in relation to fund profitability; (iv) the methodology with respect to evaluating competitive fund data and peer group classifications and fee comparisons; (v) annual fund profitability margins, with particular focus on certain funds with negative margins; (vi) the realization of fall-out benefits in certain Fidelity business units;
(vii) economies of scale and the way in which they are shared with fund shareholders;(viii) Fidelity's group fee structures, including the group fee schedule of breakpoints;(ix) the impact of cost containment measures on the funds; and (x) the transfer agent fee structure.
Based on its evaluation of all of the conclusions noted above, and after considering all factors it believed relevant, the Board concluded that the advisory fee structures are fair and reasonable, and that the fund's Advisory Contracts should be renewed.
VIPGRO-ANN-0216
1.540209.118
Fidelity® Variable Insurance Products: Value Strategies Portfolio
Annual Report December 31, 2015 |
|
Contents
To view a fund's proxy voting guidelines and proxy voting record for the 12-month period ended June 30, visit http://www.fidelity.com/proxyvotingresults or visit the Securities and Exchange Commission's (SEC) web site at http://www.sec.gov.
You may also call 1-877-208-0098 to request a free copy of the proxy voting guidelines.
Fidelity® Variable Insurance Products are separate account options which are purchased through a variable insurance contract.
Standard & Poor's, S&P and S&P 500 are registered service marks of The McGraw-Hill Companies, Inc. and have been licensed for use by Fidelity Distributors Corporation.
Other third-party marks appearing herein are the property of their respective owners.
All other marks appearing herein are registered or unregistered trademarks or service marks of FMR LLC or an affiliated company. © 2016 FMR LLC. All rights reserved.
This report and the financial statements contained herein are submitted for the general information of the shareholders of the Fund. This report is not authorized for distribution to prospective investors in the Fund unless preceded or accompanied by an effective prospectus.
A fund files its complete schedule of portfolio holdings with the SEC for the first and third quarters of each fiscal year on Form N-Q. Forms N-Q are available on the SEC’s web site at http://www.sec.gov. A fund's Forms N-Q may be reviewed and copied at the SEC’s Public Reference Room in Washington, DC. Information regarding the operation of the SEC's Public Reference Room may be obtained by calling 1-800-SEC-0330.
For a complete list of a fund's portfolio holdings, view the most recent holdings listing, semiannual report, or annual report on Fidelity's web site at http://www.fidelity.com, http://www.advisor.fidelity.com, or http://www.401k.com, as applicable.
NOT FDIC INSURED •MAY LOSE VALUE •NO BANK GUARANTEE
Neither the Fund nor Fidelity Distributors Corporation is a bank.
Performance: The Bottom Line
Average annual total return reflects the change in the value of an investment, assuming reinvestment of distributions from dividend income and capital gains (the profits earned upon the sale of securities that have grown in value, if any) and assuming a constant rate of performance each year. During periods of reimbursement by Fidelity, a fund’s total return will be greater than it would be had the reimbursement not occurred. Performance numbers are net of all underlying fund operating expenses, but do not include any insurance charges imposed by your insurance company’s separate account. If performance information included the effect of these additional charges, the total returns would have been lower. How a fund did yesterday is no guarantee of how it will do tomorrow.
Average Annual Total Returns
| For the periods ended December 31, 2015 | Past 1 year | Past 5 years | Past 10 years |
| Initial Class | (2.99)% | 9.43% | 6.52% |
| Service Class | (3.05)% | 9.35% | 6.43% |
| Service Class 2 | (3.19)% | 9.18% | 6.26% |
| Investor Class | (3.07)% | 9.34% | 6.42% |
$10,000 Over 10 Years
Let's say hypothetically that $10,000 was invested in VIP Value Strategies Portfolio - Initial Class on December 31, 2005.
The chart shows how the value of your investment would have changed, and also shows how the Russell Midcap® Value Index performed over the same period.
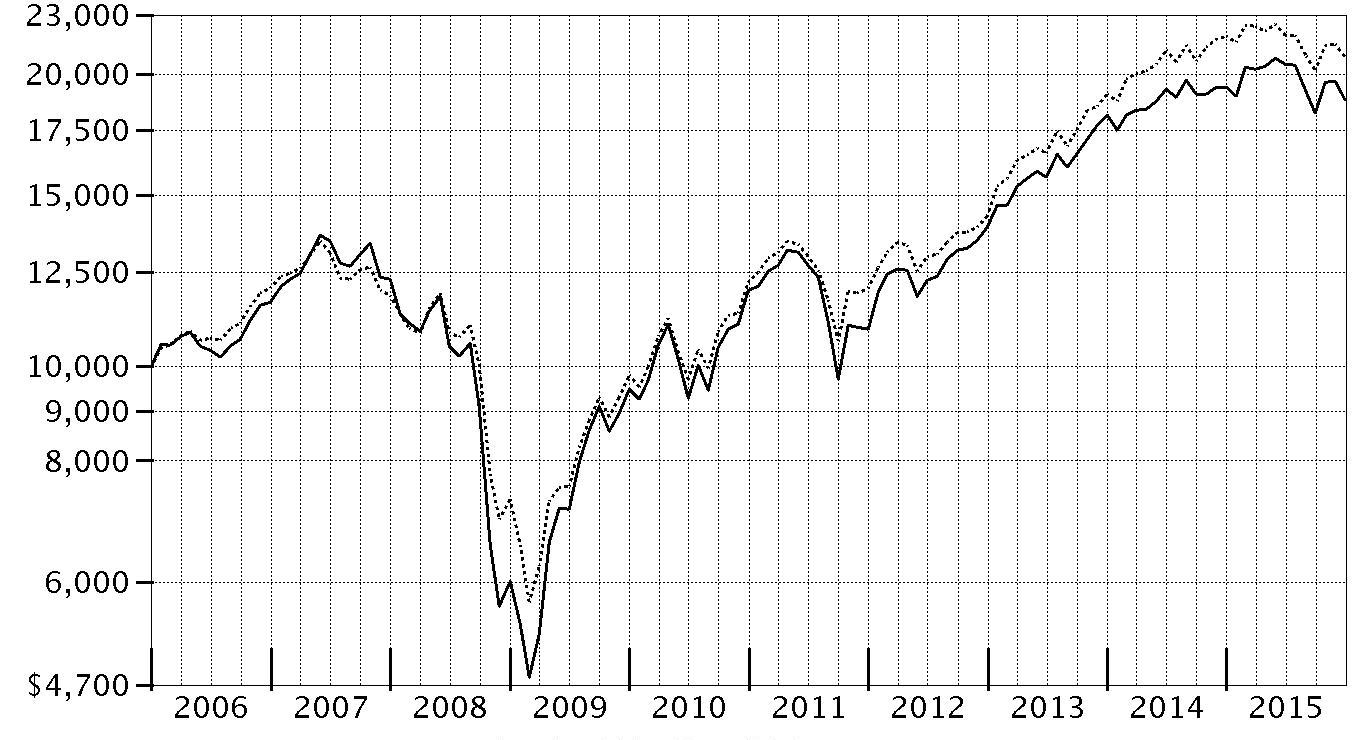
| Period Ending Values |
| $18,812 | VIP Value Strategies Portfolio - Initial Class |
| $20,814 | Russell Midcap® Value Index |
Management's Discussion of Fund Performance
Market Recap: U.S. stocks gained modestly in 2015, rebounding from a steep decline in August and September over worries about China’s slowing economic growth. The S&P 500
® index rose 1.38% for the period, its lowest calendar-year return since 2008. After the late-summer rout, stocks sharply reversed course in October, lifted by the Federal Reserve’s decision to put off raising near-term interest rates until mid-December. Investors also were encouraged by an interest-rate cut in China and economic stimulus in Europe. Overall, growth stocks fared much better than their value counterparts, as investors sought growth in a subpar economic environment. This helped lift the technology-heavy Nasdaq Composite Index
® 6.96% for the year. Sector performance in the broader market was split, with five of 10 sectors in the S&P 500
® gaining ground and five retreating. Consumer discretionary (+10%) led the way, benefiting from rising personal income and low inflation. Health care (+7%), consumer staples (+7%) and information technology (+6%) also outpaced the broad market amid strong fundamentals. Conversely, the energy sector (-21%) was by far the worst performer, stung by deflated commodity prices that also hit materials (-8%). The defensive, but rate-sensitive utilities sector (-5%) lost ground on the cusp of Fed tightening, while industrials (-3%) were dragged down with energy prices and a slower-growing China.
Comments from Portfolio Manager Thomas Soviero: For the year, the fund’s share classes posted modest declines, but beat the -4.78% return of the benchmark Russell Midcap
® Value Index. The fund remained concentrated, with a bias toward higher-quality, undervalued stocks. Versus the index, security selection drove outperformance, with notable contributions from energy (an underweighting), consumer discretionary and materials. Among contributors, Canada-based private-label beverage company Cott worked well. The catalyst was the company's decision last December to use some of its free cash flow to buy a water company, diluting its dependence on carbonated beverages and boosting its earnings-growth outlook. Another standout was top holding LyondellBasell Industries, a Netherlands-based multinational plastics, chemicals and refining company dependent on natural-gas derivatives. Although Lyondell lost its cost advantage as oil prices fell, the quality of its assets, strong free cash flow, and new leadership – coupled with declining gas prices – helped lift the stock. Overall, the fund's foreign investments helped performance, despite the strong U.S. dollar. By contrast, security selection in information technology and an underweighting in the top-performing insurance segment of financials detracted. Individual disappointments included Micron Technology, a semiconductor company hurt by more capacity coming online as industry demand slowed. Cott, Lyondell, and Micron were out-of-index positions.
The views expressed above reflect those of the portfolio manager(s) only through the end of the period as stated on the cover of this report and do not necessarily represent the views of Fidelity or any other person in the Fidelity organization. Any such views are subject to change at any time based upon market or other conditions and Fidelity disclaims any responsibility to update such views. These views may not be relied on as investment advice and, because investment decisions for a Fidelity fund are based on numerous factors, may not be relied on as an indication of trading intent on behalf of any Fidelity fund.
Investment Summary (Unaudited)
Top Ten Stocks as of December 31, 2015
| | % of fund's net assets | % of fund's net assets 6 months ago |
| LyondellBasell Industries NV Class A | 6.6 | 5.5 |
| Bank of America Corp. | 4.4 | 3.8 |
| Citigroup, Inc. | 3.9 | 0.8 |
| General Motors Co. | 3.4 | 2.8 |
| U.S. Bancorp | 3.4 | 2.5 |
| Delphi Automotive PLC | 3.2 | 4.0 |
| WestRock Co. | 3.1 | 0.6 |
| Cott Corp. | 3.0 | 2.3 |
| Universal Health Services, Inc. Class B | 2.6 | 2.6 |
| Boston Scientific Corp. | 2.6 | 2.1 |
| | 36.2 | |
Top Five Market Sectors as of December 31, 2015
| | % of fund's net assets | % of fund's net assets 6 months ago |
| Consumer Discretionary | 20.6 | 22.5 |
| Financials | 18.9 | 13.1 |
| Health Care | 16.3 | 16.4 |
| Materials | 11.8 | 8.7 |
| Industrials | 8.3 | 6.7 |
Asset Allocation (% of fund's net assets)
| As of December 31, 2015* |
| | Stocks | 95.8% |
| | Bonds | 0.5% |
| | Short-Term Investments and Net Other Assets (Liabilities) | 3.7% |

* Foreign investments - 16.9%
| As of June 30, 2015* |
| | Stocks | 96.0% |
| | Bonds | 0.3% |
| | Short-Term Investments and Net Other Assets (Liabilities) | 3.7% |

* Foreign investments - 17.7%
Investments December 31, 2015
Showing Percentage of Net Assets
| Common Stocks - 95.8% | | | |
| | | Shares | Value |
| CONSUMER DISCRETIONARY - 20.6% | | | |
| Auto Components - 3.5% | | | |
| Delphi Automotive PLC | | 161,531 | $13,848,053 |
| Tenneco, Inc. (a) | | 30,776 | 1,412,926 |
| | | | 15,260,979 |
| Automobiles - 3.4% | | | |
| General Motors Co. | | 438,164 | 14,901,958 |
| Diversified Consumer Services - 1.3% | | | |
| Service Corp. International | | 214,700 | 5,586,494 |
| Hotels, Restaurants & Leisure - 2.1% | | | |
| Cedar Fair LP (depositary unit) | | 77,580 | 4,332,067 |
| Wyndham Worldwide Corp. | | 68,133 | 4,949,862 |
| | | | 9,281,929 |
| Household Durables - 4.2% | | | |
| CalAtlantic Group, Inc. | | 175,611 | 6,659,169 |
| Lennar Corp. Class A (b) | | 144,814 | 7,082,853 |
| PulteGroup, Inc. | | 253,911 | 4,524,694 |
| | | | 18,266,716 |
| Leisure Products - 3.4% | | | |
| Hasbro, Inc. | | 91,003 | 6,129,962 |
| Vista Outdoor, Inc. (a) | | 190,200 | 8,465,802 |
| | | | 14,595,764 |
| Media - 1.2% | | | |
| Omnicom Group, Inc. | | 40,988 | 3,101,152 |
| Regal Entertainment Group Class A (b) | | 112,800 | 2,128,536 |
| | | | 5,229,688 |
| Specialty Retail - 1.3% | | | |
| Asbury Automotive Group, Inc. (a) | | 38,059 | 2,566,699 |
| GameStop Corp. Class A (b) | | 106,787 | 2,994,307 |
| | | | 5,561,006 |
| Textiles, Apparel & Luxury Goods - 0.2% | | | |
| PVH Corp. | | 12,400 | 913,260 |
|
| TOTAL CONSUMER DISCRETIONARY | | | 89,597,794 |
|
| CONSUMER STAPLES - 6.6% | | | |
| Beverages - 3.0% | | | |
| Cott Corp. | | 1,197,561 | 13,189,875 |
| Food & Staples Retailing - 1.8% | | | |
| CVS Health Corp. | | 80,900 | 7,909,593 |
| Food Products - 0.9% | | | |
| Calavo Growers, Inc. | | 79,172 | 3,879,428 |
| Household Products - 0.9% | | | |
| Procter & Gamble Co. | | 48,500 | 3,851,385 |
|
| TOTAL CONSUMER STAPLES | | | 28,830,281 |
|
| ENERGY - 3.2% | | | |
| Energy Equipment & Services - 0.5% | | | |
| Halliburton Co. | | 62,600 | 2,130,904 |
| Oil, Gas & Consumable Fuels - 2.7% | | | |
| ConocoPhillips Co. | | 40,000 | 1,867,600 |
| HollyFrontier Corp. | | 25,700 | 1,025,173 |
| Kinder Morgan, Inc. | | 58,100 | 866,852 |
| Valero Energy Corp. | | 111,600 | 7,891,236 |
| | | | 11,650,861 |
|
| TOTAL ENERGY | | | 13,781,765 |
|
| FINANCIALS - 18.9% | | | |
| Banks - 16.8% | | | |
| Bank of America Corp. | | 1,143,187 | 19,239,837 |
| CIT Group, Inc. | | 53,651 | 2,129,945 |
| Citigroup, Inc. | | 326,277 | 16,884,835 |
| JPMorgan Chase & Co. | | 107,000 | 7,065,210 |
| Regions Financial Corp. | | 264,237 | 2,536,675 |
| SunTrust Banks, Inc. | | 76,400 | 3,272,976 |
| U.S. Bancorp | | 346,916 | 14,802,906 |
| Wells Fargo & Co. | | 128,730 | 6,997,763 |
| | | | 72,930,147 |
| Capital Markets - 0.6% | | | |
| The Blackstone Group LP | | 91,200 | 2,666,688 |
| Insurance - 1.5% | | | |
| AFLAC, Inc. | | 54,014 | 3,235,439 |
| Progressive Corp. | | 106,400 | 3,383,520 |
| | | | 6,618,959 |
|
| TOTAL FINANCIALS | | | 82,215,794 |
|
| HEALTH CARE - 16.3% | | | |
| Health Care Equipment & Supplies - 6.0% | | | |
| Alere, Inc. (a) | | 58,717 | 2,295,248 |
| Boston Scientific Corp. (a) | | 608,900 | 11,228,116 |
| St. Jude Medical, Inc. | | 158,000 | 9,759,660 |
| Zimmer Biomet Holdings, Inc. | | 29,200 | 2,995,628 |
| | | | 26,278,652 |
| Health Care Providers & Services - 3.5% | | | |
| DaVita HealthCare Partners, Inc. (a) | | 54,104 | 3,771,590 |
| Universal Health Services, Inc. Class B | | 95,086 | 11,361,826 |
| | | | 15,133,416 |
| Life Sciences Tools & Services - 0.9% | | | |
| PerkinElmer, Inc. | | 70,800 | 3,792,756 |
| Pharmaceuticals - 5.9% | | | |
| Johnson & Johnson | | 64,000 | 6,574,080 |
| Merck & Co., Inc. | | 160,800 | 8,493,456 |
| Sanofi SA sponsored ADR | | 247,856 | 10,571,058 |
| | | | 25,638,594 |
|
| TOTAL HEALTH CARE | | | 70,843,418 |
|
| INDUSTRIALS - 8.3% | | | |
| Aerospace & Defense - 5.0% | | | |
| Esterline Technologies Corp. (a) | | 61,378 | 4,971,618 |
| Honeywell International, Inc. | | 47,600 | 4,929,932 |
| Orbital ATK, Inc. | | 95,150 | 8,500,701 |
| Textron, Inc. | | 76,333 | 3,206,749 |
| | | | 21,609,000 |
| Machinery - 1.9% | | | |
| Deere & Co. (b) | | 56,100 | 4,278,747 |
| Ingersoll-Rand PLC | | 71,000 | 3,925,590 |
| | | | 8,204,337 |
| Road & Rail - 0.6% | | | |
| Hertz Global Holdings, Inc. (a) | | 187,600 | 2,669,548 |
| Trading Companies & Distributors - 0.8% | | | |
| Aircastle Ltd. | | 159,300 | 3,327,777 |
|
| TOTAL INDUSTRIALS | | | 35,810,662 |
|
| INFORMATION TECHNOLOGY - 5.3% | | | |
| IT Services - 0.8% | | | |
| Fidelity National Information Services, Inc. | | 56,540 | 3,426,324 |
| Semiconductors & Semiconductor Equipment - 2.6% | | | |
| Cypress Semiconductor Corp. (b) | | 514,072 | 5,043,046 |
| Micron Technology, Inc. (a) | | 190,742 | 2,700,907 |
| ON Semiconductor Corp. (a) | | 390,891 | 3,830,732 |
| | | | 11,574,685 |
| Software - 1.9% | | | |
| Microsoft Corp. | | 146,376 | 8,120,940 |
|
| TOTAL INFORMATION TECHNOLOGY | | | 23,121,949 |
|
| MATERIALS - 11.8% | | | |
| Chemicals - 8.7% | | | |
| Ashland, Inc. | | 27,700 | 2,844,790 |
| Axiall Corp. | | 94,539 | 1,455,901 |
| LyondellBasell Industries NV Class A | | 328,408 | 28,538,654 |
| PPG Industries, Inc. | | 52,694 | 5,207,221 |
| | | | 38,046,566 |
| Containers & Packaging - 3.1% | | | |
| WestRock Co. | | 293,600 | 13,394,032 |
|
| TOTAL MATERIALS | | | 51,440,598 |
|
| TELECOMMUNICATION SERVICES - 2.4% | | | |
| Diversified Telecommunication Services - 2.4% | | | |
| Level 3 Communications, Inc. (a) | | 190,365 | 10,348,241 |
| UTILITIES - 2.4% | | | |
| Independent Power and Renewable Electricity Producers - 1.1% | | | |
| Calpine Corp. (a) | | 193,737 | 2,803,374 |
| Dynegy, Inc. (a) | | 150,700 | 2,019,380 |
| | | | 4,822,754 |
| Multi-Utilities - 1.3% | | | |
| Sempra Energy | | 61,261 | 5,759,147 |
|
| TOTAL UTILITIES | | | 10,581,901 |
|
| TOTAL COMMON STOCKS | | | |
| (Cost $284,432,158) | | | 416,572,403 |
| | | Principal Amount | Value |
|
| Nonconvertible Bonds - 0.5% | | | |
| ENERGY - 0.5% | | | |
| Oil, Gas & Consumable Fuels - 0.5% | | | |
| Chesapeake Energy Corp. 4.875% 4/15/22 | | 4,780,000 | 1,326,737 |
| Peabody Energy Corp. 6.25% 11/15/21 | | 4,595,000 | 631,813 |
| TOTAL NONCONVERTIBLE BONDS | | | |
| (Cost $6,153,021) | | | 1,958,550 |
| | | Shares | Value |
|
| Money Market Funds - 8.2% | | | |
| Fidelity Cash Central Fund, 0.33% (c) | | 16,041,699 | 16,041,699 |
| Fidelity Securities Lending Cash Central Fund, 0.35% (c)(d) | | 19,788,756 | 19,788,756 |
| TOTAL MONEY MARKET FUNDS | | | |
| (Cost $35,830,455) | | | 35,830,455 |
| TOTAL INVESTMENT PORTFOLIO - 104.5% | | | |
| (Cost $326,415,634) | | | 454,361,408 |
| NET OTHER ASSETS (LIABILITIES) - (4.5)% | | | (19,612,376) |
| NET ASSETS - 100% | | | $434,749,032 |
Legend
(a) Non-income producing
(b) Security or a portion of the security is on loan at period end.
(c) Affiliated fund that is generally available only to investment companies and other accounts managed by Fidelity Investments. The rate quoted is the annualized seven-day yield of the fund at period end. A complete unaudited listing of the fund's holdings as of its most recent quarter end is available upon request. In addition, each Fidelity Central Fund's financial statements, which are not covered by the Fund's Report of Independent Registered Public Accounting Firm, are available on the SEC's website or upon request.
(d) Investment made with cash collateral received from securities on loan.
Affiliated Central Funds
Information regarding fiscal year to date income earned by the Fund from investments in Fidelity Central Funds is as follows:
| Fund | Income earned |
| Fidelity Cash Central Fund | $22,511 |
| Fidelity Securities Lending Cash Central Fund | 182,745 |
| Total | $205,256 |
Investment Valuation
The following is a summary of the inputs used, as of December 31, 2015, involving the Fund's assets and liabilities carried at fair value. The inputs or methodology used for valuing securities may not be an indication of the risk associated with investing in those securities. For more information on valuation inputs, and their aggregation into the levels used below, please refer to the Investment Valuation section in the accompanying Notes to Financial Statements.
| | Valuation Inputs at Reporting Date: |
| Description | Total | Level 1 | Level 2 | Level 3 |
| Investments in Securities: | | | | |
| Equities: | | | | |
| Consumer Discretionary | $89,597,794 | $89,597,794 | $-- | $-- |
| Consumer Staples | 28,830,281 | 28,830,281 | -- | -- |
| Energy | 13,781,765 | 13,781,765 | -- | -- |
| Financials | 82,215,794 | 82,215,794 | -- | -- |
| Health Care | 70,843,418 | 70,843,418 | -- | -- |
| Industrials | 35,810,662 | 35,810,662 | -- | -- |
| Information Technology | 23,121,949 | 23,121,949 | -- | -- |
| Materials | 51,440,598 | 51,440,598 | -- | -- |
| Telecommunication Services | 10,348,241 | 10,348,241 | -- | -- |
| Utilities | 10,581,901 | 10,581,901 | -- | -- |
| Corporate Bonds | 1,958,550 | -- | 1,958,550 | -- |
| Money Market Funds | 35,830,455 | 35,830,455 | -- | -- |
| Total Investments in Securities: | $454,361,408 | $452,402,858 | $1,958,550 | $-- |
Other Information
Distribution of investments by country or territory of incorporation, as a percentage of Total Net Assets, is as follows (Unaudited):
| United States of America | 83.1% |
| Netherlands | 6.6% |
| Bailiwick of Jersey | 3.2% |
| Canada | 3.0% |
| France | 2.4% |
| Others (Individually Less Than 1%) | 1.7% |
| | 100.0% |
See accompanying notes which are an integral part of the financial statements.
Financial Statements
Statement of Assets and Liabilities
| | | December 31, 2015 |
| Assets | | |
Investment in securities, at value (including securities loaned of $19,069,253) — See accompanying schedule:
Unaffiliated issuers (cost $290,585,179) | $418,530,953 | |
| Fidelity Central Funds (cost $35,830,455) | 35,830,455 | |
| Total Investments (cost $326,415,634) | | $454,361,408 |
| Receivable for fund shares sold | | 50,650 |
| Dividends receivable | | 428,040 |
| Interest receivable | | 86,683 |
| Distributions receivable from Fidelity Central Funds | | 19,211 |
| Prepaid expenses | | 962 |
| Other receivables | | 17,695 |
| Total assets | | 454,964,649 |
| Liabilities | | |
| Payable for fund shares redeemed | $92,516 | |
| Accrued management fee | 199,902 | |
| Distribution and service plan fees payable | 41,316 | |
| Other affiliated payables | 46,824 | |
| Other payables and accrued expenses | 46,303 | |
| Collateral on securities loaned, at value | 19,788,756 | |
| Total liabilities | | 20,215,617 |
| Net Assets | | $434,749,032 |
| Net Assets consist of: | | |
| Paid in capital | | $335,196,309 |
| Distributions in excess of net investment income | | (196,500) |
| Accumulated undistributed net realized gain (loss) on investments and foreign currency transactions | | (28,196,350) |
| Net unrealized appreciation (depreciation) on investments and assets and liabilities in foreign currencies | | 127,945,573 |
| Net Assets | | $434,749,032 |
| Initial Class: | | |
| Net Asset Value, offering price and redemption price per share ($98,919,103 ÷ 6,802,124 shares) | | $14.54 |
| Service Class: | | |
| Net Asset Value, offering price and redemption price per share ($22,970,143 ÷ 1,582,316 shares) | | $14.52 |
| Service Class 2: | | |
| Net Asset Value, offering price and redemption price per share ($186,852,748 ÷ 12,765,795 shares) | | $14.64 |
| Investor Class: | | |
| Net Asset Value, offering price and redemption price per share ($126,007,038 ÷ 8,705,768 shares) | | $14.47 |
See accompanying notes which are an integral part of the financial statements.
Statement of Operations
| | | Year ended December 31, 2015 |
| Investment Income | | |
| Dividends | | $7,988,252 |
| Interest | | 414,898 |
| Income from Fidelity Central Funds | | 205,256 |
| Total income | | 8,608,406 |
| Expenses | | |
| Management fee | $2,538,374 | |
| Transfer agent fees | 403,598 | |
| Distribution and service plan fees | 558,166 | |
| Accounting and security lending fees | 182,479 | |
| Custodian fees and expenses | 10,302 | |
| Independent trustees' compensation | 1,985 | |
| Audit | 59,275 | |
| Legal | 2,169 | |
| Miscellaneous | 3,010 | |
| Total expenses before reductions | 3,759,358 | |
| Expense reductions | (19,787) | 3,739,571 |
| Net investment income (loss) | | 4,868,835 |
| Realized and Unrealized Gain (Loss) | | |
| Net realized gain (loss) on: | | |
| Investment securities: | | |
| Unaffiliated issuers | 31,926,993 | |
| Foreign currency transactions | 8,836 | |
| Total net realized gain (loss) | | 31,935,829 |
Change in net unrealized appreciation (depreciation) on:
Investment securities | (50,643,335) | |
| Assets and liabilities in foreign currencies | (357) | |
| Total change in net unrealized appreciation (depreciation) | | (50,643,692) |
| Net gain (loss) | | (18,707,863) |
| Net increase (decrease) in net assets resulting from operations | | $(13,839,028) |
See accompanying notes which are an integral part of the financial statements.
Statement of Changes in Net Assets
| | Year ended December 31, 2015 | Year ended December 31, 2014 |
| Increase (Decrease) in Net Assets | | |
| Operations | | |
| Net investment income (loss) | $4,868,835 | $4,099,515 |
| Net realized gain (loss) | 31,935,829 | 1,390,127 |
| Change in net unrealized appreciation (depreciation) | (50,643,692) | 23,719,540 |
| Net increase (decrease) in net assets resulting from operations | (13,839,028) | 29,209,182 |
| Distributions to shareholders from net investment income | (4,717,088) | (4,203,434) |
| Distributions to shareholders from net realized gain | (361,806) | – |
| Total distributions | (5,078,894) | (4,203,434) |
| Share transactions - net increase (decrease) | (14,433,823) | (37,206,660) |
| Total increase (decrease) in net assets | (33,351,745) | (12,200,912) |
| Net Assets | | |
| Beginning of period | 468,100,777 | 480,301,689 |
| End of period (including distributions in excess of net investment income of $196,500 and undistributed net investment income of $53,426, respectively) | $434,749,032 | $468,100,777 |
See accompanying notes which are an integral part of the financial statements.
Financial Highlights — VIP Value Strategies Portfolio Initial Class
| | | December 31, | | | |
| Years ended December 31, | 2015 | 2014 | 2013 | 2012 | 2011 |
| Selected Per–Share Data | | | | | |
| Net asset value, beginning of period | $15.19 | $14.37 | $11.11 | $8.78 | $9.74 |
| Income from Investment Operations | | | | | |
| Net investment income (loss)A | .18 | .15 | .12 | .07B | .10C |
| Net realized and unrealized gain (loss) | (.64) | .83 | 3.26 | 2.32 | (.96) |
| Total from investment operations | (.46) | .98 | 3.38 | 2.39 | (.86) |
| Distributions from net investment income | (.18) | (.16) | (.12) | (.06) | (.10) |
| Distributions from net realized gain | (.01) | – | – | – | – |
| Total distributions | (.19) | (.16) | (.12) | (.06) | (.10) |
| Net asset value, end of period | $14.54 | $15.19 | $14.37 | $11.11 | $8.78 |
| Total ReturnD,E | (2.99)% | 6.80% | 30.49% | 27.28% | (8.81)% |
| Ratios to Average Net AssetsF,G | | | | | |
| Expenses before reductions | .67% | .68% | .68% | .70% | .70% |
| Expenses net of fee waivers, if any | .67% | .68% | .68% | .70% | .70% |
| Expenses net of all reductions | .67% | .68% | .68% | .68% | .70% |
| Net investment income (loss) | 1.19% | 1.02% | .94% | .72%B | 1.04%C |
| Supplemental Data | | | | | |
| Net assets, end of period (000 omitted) | $98,919 | $107,742 | $115,594 | $93,738 | $77,432 |
| Portfolio turnover rateH | 25% | 9% | 28% | 27% | 42% |
A Calculated based on average shares outstanding during the period.
B Net Investment income per share reflects a large, non-recurring dividend which amounted to $.05 per share. Excluding this non-recurring dividend, the ratio of net investment income (loss) to average net assets would have been .26%.
C Net Investment income per share reflects a large, non-recurring dividend which amounted to $.05 per share. Excluding this non-recurring dividend, the ratio of net investment income (loss) to average net assets would have been .49%.
D Total returns do not reflect charges attributable to your insurance company's separate account. Inclusion of these charges would reduce the total returns shown.
E Total returns would have been lower if certain expenses had not been reduced during the applicable periods shown.
F Fees and expenses of any underlying Fidelity Central Funds are not included in the Fund's expense ratio. The Fund indirectly bears its proportionate share of the expenses of any underlying Fidelity Central Funds.
G Expense ratios reflect operating expenses of the class. Expenses before reductions do not reflect amounts reimbursed by the investment adviser or reductions from brokerage service arrangements or reductions from other expense offset arrangements and do not represent the amount paid by the class during periods when reimbursements or reductions occur. Expenses net of fee waivers reflect expenses after reimbursement by the investment adviser but prior to reductions from brokerage service arrangements or other expense offset arrangements. Expenses net of all reductions represent the net expenses paid by the class.
H Amount does not include the portfolio activity of any underlying Fidelity Central Funds.
See accompanying notes which are an integral part of the financial statements.
Financial Highlights — VIP Value Strategies Portfolio Service Class
| | | December 31, | | | |
| Years ended December 31, | 2015 | 2014 | 2013 | 2012 | 2011 |
| Selected Per–Share Data | | | | | |
| Net asset value, beginning of period | $15.16 | $14.34 | $11.08 | $8.76 | $9.71 |
| Income from Investment Operations | | | | | |
| Net investment income (loss)A | .17 | .14 | .11 | .06B | .09C |
| Net realized and unrealized gain (loss) | (.63) | .82 | 3.26 | 2.31 | (.95) |
| Total from investment operations | (.46) | .96 | 3.37 | 2.37 | (.86) |
| Distributions from net investment income | (.16) | (.14) | (.11) | (.05) | (.09) |
| Distributions from net realized gain | (.01) | – | – | – | – |
| Total distributions | (.18)D | (.14) | (.11) | (.05) | (.09) |
| Net asset value, end of period | $14.52 | $15.16 | $14.34 | $11.08 | $8.76 |
| Total ReturnE,F | (3.05)% | 6.69% | 30.44% | 27.10% | (8.85)% |
| Ratios to Average Net AssetsG,H | | | | | |
| Expenses before reductions | .77% | .77% | .78% | .79% | .80% |
| Expenses net of fee waivers, if any | .77% | .77% | .78% | .79% | .80% |
| Expenses net of all reductions | .77% | .77% | .78% | .78% | .79% |
| Net investment income (loss) | 1.09% | .93% | .84% | .62%B | .94%C |
| Supplemental Data | | | | | |
| Net assets, end of period (000 omitted) | $22,970 | $29,109 | $33,460 | $27,293 | $27,695 |
| Portfolio turnover rateI | 25% | 9% | 28% | 27% | 42% |
A Calculated based on average shares outstanding during the period.
B Net Investment income per share reflects a large, non-recurring dividend which amounted to $.05 per share. Excluding this non-recurring dividend, the ratio of net investment income (loss) to average net assets would have been .16%.
C Net Investment income per share reflects a large, non-recurring dividend which amounted to $.05 per share. Excluding this non-recurring dividend, the ratio of net investment income (loss) to average net assets would have been .40%.
D Total distributions of $.18 per share is comprised of distributions from net investment income of $.163 and distributions from net realized gain of $.012 per share.
E Total returns do not reflect charges attributable to your insurance company's separate account. Inclusion of these charges would reduce the total returns shown.
F Total returns would have been lower if certain expenses had not been reduced during the applicable periods shown.
G Fees and expenses of any underlying Fidelity Central Funds are not included in the Fund's expense ratio. The Fund indirectly bears its proportionate share of the expenses of any underlying Fidelity Central Funds.
H Expense ratios reflect operating expenses of the class. Expenses before reductions do not reflect amounts reimbursed by the investment adviser or reductions from brokerage service arrangements or reductions from other expense offset arrangements and do not represent the amount paid by the class during periods when reimbursements or reductions occur. Expenses net of fee waivers reflect expenses after reimbursement by the investment adviser but prior to reductions from brokerage service arrangements or other expense offset arrangements. Expenses net of all reductions represent the net expenses paid by the class.
I Amount does not include the portfolio activity of any underlying Fidelity Central Funds.
See accompanying notes which are an integral part of the financial statements.
Financial Highlights — VIP Value Strategies Portfolio Service Class 2
| | | December 31, | | | |
| Years ended December 31, | 2015 | 2014 | 2013 | 2012 | 2011 |
| Selected Per–Share Data | | | | | |
| Net asset value, beginning of period | $15.28 | $14.46 | $11.18 | $8.83 | $9.79 |
| Income from Investment Operations | | | | | |
| Net investment income (loss)A | .15 | .12 | .09 | .05B | .08C |
| Net realized and unrealized gain (loss) | (.64) | .82 | 3.28 | 2.34 | (.97) |
| Total from investment operations | (.49) | .94 | 3.37 | 2.39 | (.89) |
| Distributions from net investment income | (.14) | (.12) | (.09) | (.04) | (.07) |
| Distributions from net realized gain | (.01) | – | – | – | – |
| Total distributions | (.15) | (.12) | (.09) | (.04) | (.07) |
| Net asset value, end of period | $14.64 | $15.28 | $14.46 | $11.18 | $8.83 |
| Total ReturnD,E | (3.19)% | 6.51% | 30.18% | 27.06% | (9.04)% |
| Ratios to Average Net AssetsF,G | | | | | |
| Expenses before reductions | .92% | .92% | .93% | .94% | .95% |
| Expenses net of fee waivers, if any | .92% | .92% | .93% | .94% | .95% |
| Expenses net of all reductions | .92% | .92% | .93% | .93% | .94% |
| Net investment income (loss) | .94% | .78% | .69% | .47%B | .79%C |
| Supplemental Data | | | | | |
| Net assets, end of period (000 omitted) | $186,853 | $220,494 | $215,780 | $155,316 | $122,641 |
| Portfolio turnover rateH | 25% | 9% | 28% | 27% | 42% |
A Calculated based on average shares outstanding during the period.
B Net Investment income per share reflects a large, non-recurring dividend which amounted to $.05 per share. Excluding this non-recurring dividend, the ratio of net investment income (loss) to average net assets would have been .01%.
C Net Investment income per share reflects a large, non-recurring dividend which amounted to $.05 per share. Excluding this non-recurring dividend, the ratio of net investment income (loss) to average net assets would have been .25%.
D Total returns do not reflect charges attributable to your insurance company's separate account. Inclusion of these charges would reduce the total returns shown.
E Total returns would have been lower if certain expenses had not been reduced during the applicable periods shown.
F Fees and expenses of any underlying Fidelity Central Funds are not included in the Fund's expense ratio. The Fund indirectly bears its proportionate share of the expenses of any underlying Fidelity Central Funds.
G Expense ratios reflect operating expenses of the class. Expenses before reductions do not reflect amounts reimbursed by the investment adviser or reductions from brokerage service arrangements or reductions from other expense offset arrangements and do not represent the amount paid by the class during periods when reimbursements or reductions occur. Expenses net of fee waivers reflect expenses after reimbursement by the investment adviser but prior to reductions from brokerage service arrangements or other expense offset arrangements. Expenses net of all reductions represent the net expenses paid by the class.
H Amount does not include the portfolio activity of any underlying Fidelity Central Funds.
See accompanying notes which are an integral part of the financial statements.
Financial Highlights — VIP Value Strategies Portfolio Investor Class
| | | December 31, | | | |
| Years ended December 31, | 2015 | 2014 | 2013 | 2012 | 2011 |
| Selected Per–Share Data | | | | | |
| Net asset value, beginning of period | $15.12 | $14.31 | $11.06 | $8.74 | $9.70 |
| Income from Investment Operations | | | | | |
| Net investment income (loss)A | .17 | .14 | .11 | .06B | .09C |
| Net realized and unrealized gain (loss) | (.64) | .82 | 3.25 | 2.32 | (.96) |
| Total from investment operations | (.47) | .96 | 3.36 | 2.38 | (.87) |
| Distributions from net investment income | (.17) | (.15) | (.11) | (.06) | (.09) |
| Distributions from net realized gain | (.01) | – | – | – | – |
| Total distributions | (.18) | (.15) | (.11) | (.06) | (.09) |
| Net asset value, end of period | $14.47 | $15.12 | $14.31 | $11.06 | $8.74 |
| Total ReturnD,E | (3.07)% | 6.67% | 30.45% | 27.21% | (8.92)% |
| Ratios to Average Net AssetsF,G | | | | | |
| Expenses before reductions | .75% | .76% | .76% | .78% | .78% |
| Expenses net of fee waivers, if any | .75% | .76% | .76% | .78% | .78% |
| Expenses net of all reductions | .75% | .75% | .76% | .76% | .78% |
| Net investment income (loss) | 1.11% | .94% | .86% | .64%B | .96%C |
| Supplemental Data | | | | | |
| Net assets, end of period (000 omitted) | $126,007 | $110,755 | $115,468 | $77,935 | $55,809 |
| Portfolio turnover rateH | 25% | 9% | 28% | 27% | 42% |
A Calculated based on average shares outstanding during the period.
B Net Investment income per share reflects a large, non-recurring dividend which amounted to $.05 per share. Excluding this non-recurring dividend, the ratio of net investment income (loss) to average net assets would have been .17%.
C Net Investment income per share reflects a large, non-recurring dividend which amounted to $.05 per share. Excluding this non-recurring dividend, the ratio of net investment income (loss) to average net assets would have been .41%.
D Total returns do not reflect charges attributable to your insurance company's separate account. Inclusion of these charges would reduce the total returns shown.
E Total returns would have been lower if certain expenses had not been reduced during the applicable periods shown.
F Fees and expenses of any underlying Fidelity Central Funds are not included in the Fund's expense ratio. The Fund indirectly bears its proportionate share of the expenses of any underlying Fidelity Central Funds.
G Expense ratios reflect operating expenses of the class. Expenses before reductions do not reflect amounts reimbursed by the investment adviser or reductions from brokerage service arrangements or reductions from other expense offset arrangements and do not represent the amount paid by the class during periods when reimbursements or reductions occur. Expenses net of fee waivers reflect expenses after reimbursement by the investment adviser but prior to reductions from brokerage service arrangements or other expense offset arrangements. Expenses net of all reductions represent the net expenses paid by the class.
H Amount does not include the portfolio activity of any underlying Fidelity Central Funds.
See accompanying notes which are an integral part of the financial statements.
Notes to Financial Statements
For the period ended December 31, 2015
1. Organization.
VIP Value Strategies Portfolio (the Fund) is a fund of Variable Insurance Products Fund III (the Trust) and is authorized to issue an unlimited number of shares. The Trust is registered under the Investment Company Act of 1940, as amended (the 1940 Act), as an open-end management investment company organized as a Massachusetts business trust. Shares of the Fund may only be purchased by insurance companies for the purpose of funding variable annuity or variable life insurance contracts. The Fund offers the following classes of shares: Initial Class shares, Service Class shares, Service Class 2 shares and Investor Class shares. All classes have equal rights and voting privileges, except for matters affecting a single class.
2. Investments in Fidelity Central Funds.
The Fund invests in Fidelity Central Funds, which are open-end investment companies generally available only to other investment companies and accounts managed by the investment adviser and its affiliates. The Fund's Schedule of Investments lists each of the Fidelity Central Funds held as of period end, if any, as an investment of the Fund, but does not include the underlying holdings of each Fidelity Central Fund. As an Investing Fund, the Fund indirectly bears its proportionate share of the expenses of the underlying Fidelity Central Funds.
The Money Market Central Funds seek preservation of capital and current income and are managed by Fidelity Investments Money Management, Inc. (FIMM), an affiliate of the investment adviser. Annualized expenses of the Money Market Central Funds as of their most recent shareholder report date are less than .005%.
A complete unaudited list of holdings for each Fidelity Central Fund is available upon request or at the Securities and Exchange Commission (the SEC) website at www.sec.gov. In addition, the financial statements of the Fidelity Central Funds, which are not covered by the Fund's Report of Independent Registered Public Accounting Firm, are available on the SEC website or upon request.
3. Significant Accounting Policies.
The financial statements have been prepared in conformity with accounting principles generally accepted in the United States of America (GAAP), which require management to make certain estimates and assumptions at the date of the financial statements. Actual results could differ from those estimates. Subsequent events, if any, through the date that the financial statements were issued have been evaluated in the preparation of the financial statements. The following summarizes the significant accounting policies of the Fund:
Investment Valuation. Investments are valued as of 4:00 p.m. Eastern time on the last calendar day of the period. The Board of Trustees (the Board) has delegated the day to day responsibility for the valuation of the Fund's investments to the Fidelity Management & Research Company (FMR) Fair Value Committee (the Committee). In accordance with valuation policies and procedures approved by the Board, the Fund attempts to obtain prices from one or more third party pricing vendors or brokers to value its investments. When current market prices, quotations or currency exchange rates are not readily available or reliable, investments will be fair valued in good faith by the Committee, in accordance with procedures adopted by the Board. Factors used in determining fair value vary by investment type and may include market or investment specific events, changes in interest rates and credit quality. The frequency with which these procedures are used cannot be predicted and they may be utilized to a significant extent. The Committee oversees the Fund's valuation policies and procedures and reports to the Board on the Committee's activities and fair value determinations. The Board monitors the appropriateness of the procedures used in valuing the Fund's investments and ratifies the fair value determinations of the Committee.
The Fund categorizes the inputs to valuation techniques used to value its investments into a disclosure hierarchy consisting of three levels as shown below:
- Level 1 – quoted prices in active markets for identical investments
- Level 2 – other significant observable inputs (including quoted prices for similar investments, interest rates, prepayment speeds, etc.)
- Level 3 – unobservable inputs (including the Fund's own assumptions based on the best information available)
Valuation techniques used to value the Fund's investments by major category are as follows:
Equity securities, including restricted securities, for which market quotations are readily available, are valued at the last reported sale price or official closing price as reported by a third party pricing vendor on the primary market or exchange on which they are traded and are categorized as Level 1 in the hierarchy. In the event there were no sales during the day or closing prices are not available, securities are valued at the last quoted bid price or may be valued using the last available price and are generally categorized as Level 2 in the hierarchy. For foreign equity securities, when market or security specific events arise, comparisons to the valuation of American Depositary Receipts (ADRs), futures contracts, Exchange-Traded Funds (ETFs) and certain indexes as well as quoted prices for similar securities may be used and would be categorized as Level 2 in the hierarchy. Utilizing these techniques may result in transfers between Level 1 and Level 2. For equity securities, including restricted securities, where observable inputs are limited, assumptions about market activity and risk are used and these securities may be categorized as Level 3 in the hierarchy.
Debt securities, including restricted securities, are valued based on evaluated prices received from third party pricing vendors or from brokers who make markets in such securities. Corporate bonds are valued by pricing vendors who utilize matrix pricing which considers yield or price of bonds of comparable quality, coupon, maturity and type or by broker-supplied prices. When independent prices are unavailable or unreliable, debt securities may be valued utilizing pricing methodologies which consider similar factors that would be used by third party pricing vendors. Debt securities are generally categorized as Level 2 in the hierarchy but may be Level 3 depending on the circumstances.
Investments in open-end mutual funds, including the Fidelity Central Funds, are valued at their closing net asset value (NAV) each business day and are categorized as Level 1 in the hierarchy.
Changes in valuation techniques may result in transfers in or out of an assigned level within the disclosure hierarchy. The aggregate value of investments by input level as of December 31, 2015 is included at the end of the Fund's Schedule of Investments.
Foreign Currency. The Fund may use foreign currency contracts to facilitate transactions in foreign-denominated securities. Gains and losses from these transactions may arise from changes in the value of the foreign currency or if the counterparties do not perform under the contracts' terms.
Foreign-denominated assets, including investment securities, and liabilities are translated into U.S. dollars at the exchange rates at period end. Purchases and sales of investment securities, income and dividends received and expenses denominated in foreign currencies are translated into U.S. dollars at the exchange rate in effect on the transaction date.
The effects of exchange rate fluctuations on investments are included with the net realized and unrealized gain (loss) on investment securities. Other foreign currency transactions resulting in realized and unrealized gain (loss) are disclosed separately.
Investment Transactions and Income. For financial reporting purposes, the Fund's investment holdings and NAV include trades executed through the end of the last business day of the period. The NAV per share for processing shareholder transactions is calculated as of the close of business of the New York Stock Exchange (NYSE), normally 4:00 p.m. Eastern time and includes trades executed through the end of the prior business day. Gains and losses on securities sold are determined on the basis of identified cost and may include proceeds received from litigation. Dividend income is recorded on the ex-dividend date, except for certain dividends from foreign securities where the ex-dividend date may have passed, which are recorded as soon as the Fund is informed of the ex-dividend date. Non-cash dividends included in dividend income, if any, are recorded at the fair market value of the securities received. Income and capital gain distributions from Fidelity Central Funds, if any, are recorded on the ex-dividend date. Distributions received on securities that represent a return of capital or capital gain are recorded as a reduction of cost of investments and/or as a realized gain. Subsequent to ex-dividend date the Fund determines the components of these distributions, based upon receipt of tax filings or other correspondence relating to the underlying investment. Interest income is accrued as earned and includes coupon interest and amortization of premium and accretion of discount on debt securities as applicable. Investment income is recorded net of foreign taxes withheld where recovery of such taxes is uncertain.
Class Allocations and Expenses. Investment income, realized and unrealized capital gains and losses, common expenses of the Fund, and certain fund-level expense reductions, if any, are allocated daily on a pro-rata basis to each class based on the relative net assets of each class to the total net assets of the Fund. Each class differs with respect to transfer agent and distribution and service plan fees incurred. Certain expense reductions may also differ by class. For the reporting period, the allocated portion of income and expenses to each class as a percent of its average net assets may vary due to the timing of recording these transactions in relation to fluctuating net assets of the classes. Expenses directly attributable to a fund are charged to that fund. Expenses attributable to more than one fund are allocated among the respective funds on the basis of relative net assets or other appropriate methods. Expense estimates are accrued in the period to which they relate and adjustments are made when actual amounts are known.
Income Tax Information and Distributions to Shareholders. Each year, the Fund intends to qualify as a regulated investment company under Subchapter M of the Internal Revenue Code, including distributing substantially all of its taxable income and realized gains. As a result, no provision for U.S. Federal income taxes is required. As of December 31, 2015, the Fund did not have any unrecognized tax benefits in the financial statements; nor is the Fund aware of any tax positions for which it is reasonably possible that the total amounts of unrecognized tax benefits will significantly change in the next twelve months. The Fund files a U.S. federal tax return, in addition to state and local tax returns as required. The Fund's federal income tax returns are subject to examination by the Internal Revenue Service (IRS) for a period of three fiscal years after they are filed. State and local tax returns may be subject to examination for an additional fiscal year depending on the jurisdiction. Foreign taxes are provided for based on the Fund's understanding of the tax rules and rates that exist in the foreign markets in which it invests.
Distributions are declared and recorded on the ex-dividend date. Income dividends and capital gain distributions are declared separately for each class. Income and capital gain distributions are determined in accordance with income tax regulations, which may differ from GAAP.
Capital accounts within the financial statements are adjusted for permanent book-tax differences. These adjustments have no impact on net assets or the results of operations. Capital accounts are not adjusted for temporary book-tax differences which will reverse in a subsequent period.
Book-tax differences are primarily due to foreign currency transactions, passive foreign investment companies (PFIC), market discount, partnerships, capital loss carryforwards and losses deferred due to wash sales and excise tax regulations.
The federal tax cost of investment securities and unrealized appreciation (depreciation) as of period end were as follows:
| Gross unrealized appreciation | $144,684,616 |
| Gross unrealized depreciation | (16,750,863) |
| Net unrealized appreciation (depreciation) on securities | $127,933,753 |
| Tax Cost | $326,427,655 |
The tax-based components of distributable earnings as of period end were as follows:
| Capital loss carryforward | $(27,939,013) |
| Net unrealized appreciation (depreciation) on securities and other investments | $127,933,552 |
Capital loss carryforwards are only available to offset future capital gains of the Fund to the extent provided by regulations and may be limited. Under the Regulated Investment Company Modernization Act of 2010 (the Act), the Fund is permitted to carry forward capital losses incurred in taxable years beginning after December 22, 2010 for an unlimited period and such capital losses are required to be used prior to any losses that expire. The capital loss carryforward information presented below, including any applicable limitation, is estimated as of fiscal period end and is subject to adjustment.
| Fiscal year of expiration | |
| 2017 | $(27,939,013) |
The Fund intends to elect to defer to its next fiscal year $183,781 of capital losses recognized during the period November 1, 2015 to December 31, 2015. The Fund intends to elect to defer to its next fiscal year $258,034 of ordinary losses recognized during the period November 1, 2015 to December 31, 2015.
The tax character of distributions paid was as follows:
| | December 31, 2015 | December 31, 2014 |
| Ordinary Income | $5,078,894 | $ 4,203,434 |
4. Purchases and Sales of Investments.
Purchases and sales of securities, other than short-term securities, aggregated $112,804,633 and $127,836,725, respectively.
5. Fees and Other Transactions with Affiliates.
Management Fee. Fidelity Management & Research Company (the investment adviser) and its affiliates provide the Fund with investment management related services for which the Fund pays a monthly management fee. The management fee is the sum of an individual fund fee rate that is based on an annual rate of .30% of the Fund's average net assets and an annualized group fee rate that averaged .25% during the period. The group fee rate is based upon the average net assets of all the mutual funds advised by the investment adviser, including any mutual funds previously advised by the investment adviser that are currently advised by Fidelity SelectCo, LLC, an affiliate of the investment adviser. The group fee rate decreases as assets under management increase and increases as assets under management decrease. For the reporting period, the total annual management fee rate was .55% of the Fund's average net assets.
Distribution and Service Plan Fees. In accordance with Rule 12b-1 of the 1940 Act, the Fund has adopted separate 12b-1 Plans for each Service Class of shares. Each Service Class pays Fidelity Distributors Corporation (FDC), an affiliate of the investment adviser, a service fee. For the period, the service fee is based on an annual rate of .10% of Service Class' average net assets and .25% of Service Class 2's average net assets.
For the period, total fees, all of which were re-allowed to insurance companies for the distribution of shares and providing shareholder support services, were as follows:
| Service Class | $27,619 |
| Service Class 2 | 530,547 |
| | $558,166 |
Transfer Agent Fees. Fidelity Investments Institutional Operations Company, Inc. (FIIOC), an affiliate of the investment adviser, is the Fund's transfer, dividend disbursing, and shareholder servicing agent. FIIOC receives an asset-based fee with respect to each class. Each class (with the exception of Investor Class) pays a fee for transfer agent services, typesetting, printing and mailing of shareholder reports, excluding mailing of proxy statements and out of pocket expenses, equal to an annual rate of .07%( .15% for Investor Class) of class-level average net assets. For the period, transfer agent fees for each class, including out of pocket expenses, were as follows:
| Initial Class | $71,087 |
| Service Class | 18,315 |
| Service Class 2 | 140,732 |
| Investor Class | 173,464 |
| | $403,598 |
Accounting and Security Lending Fees. Fidelity Service Company, Inc. (FSC), an affiliate of the investment adviser, maintains the Fund's accounting records. The accounting fee is based on the level of average net assets for each month. Under a separate contract, FSC administers the security lending program. The security lending fee is based on the number and duration of lending transactions.
Brokerage Commissions. The Fund placed a portion of its portfolio transactions with brokerage firms which are affiliates of the investment adviser. Brokerage commissions are included in net realized gain (loss) and change in net unrealized appreciation (depreciation) in the Statement of Operations. The commissions paid to these affiliated firms were $2,241 for the period.
Interfund Trades. The Fund may purchase from or sell securities to other Fidelity Funds under procedures adopted by the Board. The procedures have been designed to ensure these interfund trades are executed in accordance with Rule 17a-7 of the 1940 Act. Interfund trades are included within the respective purchases and sales amounts shown in the Purchases and Sales of Investments note.
Other. During the period, the investment adviser reimbursed the Fund for certain losses in the amount of $11,495.
6. Committed Line of Credit.
The Fund participates with other funds managed by the investment adviser or an affiliate in a $4.25 billion credit facility (the "line of credit") to be utilized for temporary or emergency purposes to fund shareholder redemptions or for other short-term liquidity purposes. The Fund has agreed to pay commitment fees on its pro-rata portion of the line of credit, which amounted to $673 and is reflected in Miscellaneous expenses on the Statement of Operations. During the period, the Fund did not borrow on this line of credit.
7. Security Lending.
The Fund lends portfolio securities through a lending agent from time to time in order to earn additional income. For equity securities, a lending agent is used and may loan securities to certain qualified borrowers, including Fidelity Capital Markets (FCM), a broker-dealer affiliated with the Fund. On the settlement date of the loan, the Fund receives collateral (in the form of U.S. Treasury obligations, letters of credit and/or cash) against the loaned securities and maintains collateral in an amount not less than 100% of the market value of the loaned securities during the period of the loan. The market value of the loaned securities is determined at the close of business of the Fund and any additional required collateral is delivered to the Fund on the next business day. The Fund or borrower may terminate the loan at any time, and if the borrower defaults on its obligation to return the securities loaned because of insolvency or other reasons, the Fund may apply collateral received from the borrower against the obligation. The Fund may experience delays and costs in recovering the securities loaned. Any cash collateral received is invested in the Fidelity Securities Lending Cash Central Fund. The value of loaned securities and cash collateral at period end are disclosed on the Fund's Statement of Assets and Liabilities. At period end, there were no security loans outstanding with FCM. Security lending income represents the income earned on investing cash collateral, less rebates paid to borrowers and any lending agent fees associated with the loan, plus any premium payments received for lending certain types of securities. Security lending income is presented in the Statement of Operations as a component of income from Fidelity Central Funds. Total security lending income during the period amounted to $182,745, including $11,185 from securities loaned to FCM.
8. Expense Reductions.
Commissions paid to certain brokers with whom the investment adviser, or its affiliates, places trades on behalf of the Fund include an amount in addition to trade execution, which may be rebated back to the Fund to offset certain expenses. This amount totaled $15,222 for the period. In addition, through arrangements with the Fund's custodian, credits realized as a result of certain uninvested cash balances were used to reduce the Fund's expenses. During the period, these credits reduced the Fund's custody expenses by $38.
In addition, during the period the investment adviser reimbursed and/or waived a portion of fund-level operating expenses in the amount of $1,922 and a portion of class-level operating expenses as follows:
| | Amount |
| Investor Class | $2,605 |
9. Distributions to Shareholders.
Distributions to shareholders of each class were as follows:
| Years ended December 31, | 2015 | 2014 |
| From net investment income | | |
| Initial Class | $1,221,427 | $1,114,327 |
| Service Class | 257,049 | 268,257 |
| Service Class 2 | 1,762,368 | 1,762,044 |
| Investor Class | 1,476,244 | 1,058,806 |
| Total | $4,717,088 | $4,203,434 |
| From net realized gain | | |
| Initial Class | $83,641 | $– |
| Service Class | 22,055 | – |
| Service Class 2 | 166,383 | – |
| Investor Class | 89,727 | – |
| Total | $361,806 | $– |
10. Share Transactions.
Transactions for each class of shares were as follows:
| | Shares | Shares | Dollars | Dollars |
| Years ended December 31, | 2015 | 2014 | 2015 | 2014 |
| Initial Class | | | | |
| Shares sold | 862,729 | 540,165 | $13,193,445 | $7,945,641 |
| Reinvestment of distributions | 90,714 | 72,642 | 1,305,068 | 1,114,327 |
| Shares redeemed | (1,243,527) | (1,563,863) | (19,223,982) | (22,913,193) |
| Net increase (decrease) | (290,084) | (951,056) | $(4,725,469) | $(13,853,225) |
| Service Class | | | | |
| Shares sold | 95,428 | 279,827 | $1,481,451 | $4,158,734 |
| Reinvestment of distributions | 19,408 | 17,533 | 279,104 | 268,257 |
| Shares redeemed | (452,587) | (710,585) | (6,966,595) | (10,605,942) |
| Net increase (decrease) | (337,751) | (413,225) | $(5,206,040) | $(6,178,951) |
| Service Class 2 | | | | |
| Shares sold | 1,661,203 | 1,957,674 | $25,906,196 | $29,377,490 |
| Reinvestment of distributions | 132,959 | 114,196 | 1,928,751 | 1,762,044 |
| Shares redeemed | (3,456,560) | (2,566,837) | (53,560,879) | (37,877,944) |
| Net increase (decrease) | (1,662,398) | (494,967) | $(25,725,932) | $(6,738,410) |
| Investor Class | | | | |
| Shares sold | 2,524,010 | 836,338 | $38,825,489 | $12,348,208 |
| Reinvestment of distributions | 109,368 | 69,339 | 1,565,967 | 1,058,806 |
| Shares redeemed | (1,251,474) | (1,652,617) | (19,167,838) | (23,843,088) |
| Net increase (decrease) | 1,381,904 | (746,940) | $21,223,618 | $(10,436,074) |
11. Other.
The Fund's organizational documents provide former and current trustees and officers with a limited indemnification against liabilities arising in connection with the performance of their duties to the Fund. In the normal course of business, the Fund may also enter into contracts that provide general indemnifications. The Fund's maximum exposure under these arrangements is unknown as this would be dependent on future claims that may be made against the Fund. The risk of material loss from such claims is considered remote.
At the end of the period, the investment adviser or its affiliates were the owners of record of 35% of the total outstanding shares of the Fund and one otherwise unaffiliated shareholder was the owner of record of 29% of the total outstanding shares of the Fund.
Report of Independent Registered Public Accounting Firm
To the Trustees of Variable Insurance Products Fund III and Shareholders of VIP Value Strategies Portfolio:
We have audited the accompanying statement of assets and liabilities of VIP Value Strategies Portfolio (the Fund), a fund of Variable Insurance Products Fund III, including the schedule of investments, as of December 31, 2015, and the related statement of operations for the year then ended, the statement of changes in net assets for each of the two years in the period then ended, and the financial highlights for each of the five years in the period then ended. These financial statements and financial highlights are the responsibility of the Fund's management. Our responsibility is to express an opinion on these financial statements and financial highlights based on our audits.
We conducted our audits in accordance with the standards of the Public Company Accounting Oversight Board (United States). Those standards require that we plan and perform the audit to obtain reasonable assurance about whether the financial statements and financial highlights are free of material misstatement. The Fund is not required to have, nor were we engaged to perform, an audit of its internal control over financial reporting. Our audits included consideration of internal control over financial reporting as a basis for designing audit procedures that are appropriate in the circumstances, but not for the purpose of expressing an opinion on the effectiveness of the Fund's internal control over financial reporting. Accordingly, we express no such opinion. An audit also includes examining, on a test basis, evidence supporting the amounts and disclosures in the financial statements, assessing the accounting principles used and significant estimates made by management, as well as evaluating the overall financial statement presentation. Our procedures included confirmation of securities owned as of December 31, 2015, by correspondence with the custodians and brokers. We believe that our audits provide a reasonable basis for our opinion.
In our opinion, such financial statements and financial highlights referred to above present fairly, in all material respects, the financial position of VIP Value Strategies Portfolio as of December 31, 2015, the results of its operations for the year then ended, the changes in its net assets for each of the two years in the period then ended, and the financial highlights for the each of the five years in the period then ended, in conformity with accounting principles generally accepted in the United States of America.
DELOITTE & TOUCHE LLP
Boston, Massachusetts
February 12, 2016
Trustees and Officers
The Trustees, Members of the Advisory Board (if any), and officers of the trust and fund, as applicable, are listed below. The Board of Trustees governs the fund and is responsible for protecting the interests of shareholders. The Trustees are experienced executives who meet periodically throughout the year to oversee the fund's activities, review contractual arrangements with companies that provide services to the fund, oversee management of the risks associated with such activities and contractual arrangements, and review the fund's performance. Each of the Trustees oversees 170 funds.
The Trustees hold office without limit in time except that (a) any Trustee may resign; (b) any Trustee may be removed by written instrument, signed by at least two-thirds of the number of Trustees prior to such removal; (c) any Trustee who requests to be retired or who has become incapacitated by illness or injury may be retired by written instrument signed by a majority of the other Trustees; and (d) any Trustee may be removed at any special meeting of shareholders by a two-thirds vote of the outstanding voting securities of the trust. Each Trustee who is not an interested person (as defined in the 1940 Act) of the trust and the fund is referred to herein as an Independent Trustee. Each Independent Trustee shall retire not later than the last day of the calendar year in which his or her 75th birthday occurs. The Independent Trustees may waive this mandatory retirement age policy with respect to individual Trustees. Officers and Advisory Board Members hold office without limit in time, except that any officer or Advisory Board Member may resign or may be removed by a vote of a majority of the Trustees at any regular meeting or any special meeting of the Trustees. Except as indicated, each individual has held the office shown or other offices in the same company for the past five years.
The fund’s Statement of Additional Information (SAI) includes more information about the Trustees. To request a free copy, call Fidelity at 1-877-208-0098.
Experience, Skills, Attributes, and Qualifications of the Trustees. The Governance and Nominating Committee has adopted a statement of policy that describes the experience, qualifications, attributes, and skills that are necessary and desirable for potential Independent Trustee candidates (Statement of Policy). The Board believes that each Trustee satisfied at the time he or she was initially elected or appointed a Trustee, and continues to satisfy, the standards contemplated by the Statement of Policy. The Governance and Nominating Committee also engages professional search firms to help identify potential Independent Trustee candidates who have the experience, qualifications, attributes, and skills consistent with the Statement of Policy. From time to time, additional criteria based on the composition and skills of the current Independent Trustees, as well as experience or skills that may be appropriate in light of future changes to board composition, business conditions, and regulatory or other developments, have also been considered by the professional search firms and the Governance and Nominating Committee. In addition, the Board takes into account the Trustees' commitment and participation in Board and committee meetings, as well as their leadership of standing and ad hoc committees throughout their tenure.
In determining that a particular Trustee was and continues to be qualified to serve as a Trustee, the Board has considered a variety of criteria, none of which, in isolation, was controlling. The Board believes that, collectively, the Trustees have balanced and diverse experience, qualifications, attributes, and skills, which allow the Board to operate effectively in governing the fund and protecting the interests of shareholders. Information about the specific experience, skills, attributes, and qualifications of each Trustee, which in each case led to the Board's conclusion that the Trustee should serve (or continue to serve) as a trustee of the fund, is provided below.
Board Structure and Oversight Function. James C. Curvey is an interested person and currently serves as Chairman. The Trustees have determined that an interested Chairman is appropriate and benefits shareholders because an interested Chairman has a personal and professional stake in the quality and continuity of services provided to the fund. Independent Trustees exercise their informed business judgment to appoint an individual of their choosing to serve as Chairman, regardless of whether the Trustee happens to be independent or a member of management. The Independent Trustees have determined that they can act independently and effectively without having an Independent Trustee serve as Chairman and that a key structural component for assuring that they are in a position to do so is for the Independent Trustees to constitute a substantial majority for the Board. The Independent Trustees also regularly meet in executive session. Ned C. Lautenbach serves as Chairman of the Independent Trustees and as such (i) acts as a liaison between the Independent Trustees and management with respect to matters important to the Independent Trustees and (ii) with management prepares agendas for Board meetings.
Fidelity® funds are overseen by different Boards of Trustees. The fund's Board oversees Fidelity's high income and certain equity funds, and other Boards oversee Fidelity's investment-grade bond, money market, asset allocation, and sector funds. The asset allocation funds may invest in Fidelity® funds overseen by the fund's Board. The use of separate Boards, each with its own committee structure, allows the Trustees of each group of Fidelity® funds to focus on the unique issues of the funds they oversee, including common research, investment, and operational issues. On occasion, the separate Boards establish joint committees to address issues of overlapping consequences for the Fidelity® funds overseen by each Board.
The Trustees operate using a system of committees to facilitate the timely and efficient consideration of all matters of importance to the Trustees, the fund, and fund shareholders and to facilitate compliance with legal and regulatory requirements and oversight of the fund's activities and associated risks. The Board, acting through its committees, has charged FMR and its affiliates with (i) identifying events or circumstances the occurrence of which could have demonstrably adverse effects on the fund's business and/or reputation; (ii) implementing processes and controls to lessen the possibility that such events or circumstances occur or to mitigate the effects of such events or circumstances if they do occur; and (iii) creating and maintaining a system designed to evaluate continuously business and market conditions in order to facilitate the identification and implementation processes described in (i) and (ii) above. Because the day-to-day operations and activities of the fund are carried out by or through FMR, its affiliates, and other service providers, the fund's exposure to risks is mitigated but not eliminated by the processes overseen by the Trustees. While each of the Board's committees has responsibility for overseeing different aspects of the fund's activities, oversight is exercised primarily through the Operations, Audit, and Compliance Committees. In addition, the Independent Trustees have worked with FMR to enhance the Board's oversight of investment and financial risks, legal and regulatory risks, technology risks, and operational risks, including the development of additional risk reporting to the Board. For example, a working group comprised of Independent Trustees and FMR has worked and continues to work to review the Fidelity® funds' valuation-related activities, reporting and risk management. Appropriate personnel, including but not limited to the fund's Chief Compliance Officer (CCO), FMR's internal auditor, the independent accountants, the fund's Treasurer and portfolio management personnel, make periodic reports to the Board's committees, as appropriate, including an annual review of Fidelity's risk management program for the Fidelity® funds. The responsibilities of each standing committee, including their oversight responsibilities, are described further under "Standing Committees of the Trustees."
Interested Trustees*:
Correspondence intended for a Trustee who is an interested person may be sent to Fidelity Investments, 245 Summer Street, Boston, Massachusetts 02210.
Name, Year of Birth; Principal Occupations and Other Relevant Experience+
James C. Curvey (1935)
Year of Election or Appointment: 2007
Trustee
Chairman of the Board of Trustees
Mr. Curvey also serves as Trustee of other Fidelity® funds. Mr. Curvey is a Director of Fidelity Research & Analysis Co. (investment adviser firm, 2009-present), and Vice Chairman (2007-present) and Director of FMR LLC (diversified financial services company). In addition, Mr. Curvey serves as an Overseer for the Boston Symphony Orchestra and a member of the board of Artis-Naples, Naples, Florida, and as a Trustee for Brewster Academy, Wolfeboro, New Hampshire. Previously, Mr. Curvey served as a Director of Fidelity Investments Money Management, Inc. (investment adviser firm, 2009-2014) and a Director of FMR and FMR Co., Inc. (investment adviser firms, 2007-2014).
Charles S. Morrison (1960)
Year of Election or Appointment: 2014
Trustee
Mr. Morrison also serves as Trustee of other funds. He serves as a Director of Fidelity Investments Money Management, Inc. (FIMM) (investment adviser firm, 2014-present), Director of Fidelity SelectCo, LLC (investment adviser firm, 2014-present), President, Asset Management (2014-present), and is an employee of Fidelity Investments. Previously, Mr. Morrison served as Vice President of Fidelity's Fixed Income and Asset Allocation Funds (2012-2014), President, Fixed Income (2011-2014), Vice President of Fidelity's Money Market Funds (2005-2009), President, Money Market Group Leader of FMR (investment adviser firm, 2009), and Senior Vice President, Money Market Group of FMR (2004-2009). Mr. Morrison also served as Vice President of Fidelity's Bond Funds (2002-2005), certain Balanced Funds (2002-2005), and certain Asset Allocation Funds (2002-2007), and as Senior Vice President (2002-2005) of Fidelity's Bond Division.
* Determined to be an “Interested Trustee” by virtue of, among other things, his or her affiliation with the trust or various entities under common control with FMR.
+ The information includes the Trustee's principal occupation during the last five years and other information relating to the experience, attributes, and skills relevant to the Trustee's qualifications to serve as a Trustee, which led to the conclusion that the Trustee should serve as a Trustee for the fund.
Independent Trustees:
Correspondence intended for an Independent Trustee may be sent to Fidelity Investments, P.O. Box 55235, Boston, Massachusetts 02205-5235.
Name, Year of Birth; Principal Occupations and Other Relevant Experience+
Dennis J. Dirks (1948)
Year of Election or Appointment: 2005
Trustee
Mr. Dirks also serves as Trustee of other Fidelity® funds. Prior to his retirement in May 2003, Mr. Dirks was Chief Operating Officer and a member of the Board of The Depository Trust & Clearing Corporation (DTCC). He also served as President, Chief Operating Officer, and Board member of The Depository Trust Company (DTC) and President and Board member of the National Securities Clearing Corporation (NSCC). In addition, Mr. Dirks served as Chief Executive Officer and Board member of the Government Securities Clearing Corporation, Chief Executive Officer and Board member of the Mortgage-Backed Securities Clearing Corporation, as a Trustee and a member of the Finance Committee of Manhattan College (2005-2008), as a Trustee and a member of the Finance Committee of AHRC of Nassau County (2006-2008), and as a member of the Independent Directors Council (IDC) Governing Council (2010-2015). Mr. Dirks is a member of the Board of Directors for The Brookville Center for Children's Services, Inc. (2009-present).
Alan J. Lacy (1953)
Year of Election or Appointment: 2008
Trustee
Mr. Lacy also serves as Trustee of other Fidelity® funds. Mr. Lacy serves as Chairman (2014-present) and a member (2010-present) of the Board of Directors of Dave & Buster's Entertainment, Inc. (restaurant and entertainment complexes) and a Director of Bristol-Myers Squibb Company (global pharmaceuticals, 2008-present). He is a Trustee of the California Chapter of The Nature Conservancy (2015-present) and a Director of the Center for Advanced Study in the Behavioral Sciences at Stanford University (2015-present). In addition, Mr. Lacy served as Senior Adviser (2007-2014) of Oak Hill Capital Partners, L.P. (private equity) and also served as Chief Executive Officer (2005) and Vice Chairman (2005-2006) of Sears Holdings Corporation (retail) and Chief Executive Officer and Chairman of the Board of Sears, Roebuck and Co. (retail, 2000-2005). Previously, Mr. Lacy served as Chairman (2008-2011) and a member (2006-2015) of the Board of Trustees of the National Parks Conservation Association and as a member of the Board of Directors for The Western Union Company (global money transfer, 2006-2011), The Hillman Companies, Inc. (hardware wholesalers, 2010-2014), and Earth Fare, Inc. (retail grocery, 2010-2014).
Ned C. Lautenbach (1944)
Year of Election or Appointment: 2000
Trustee
Chairman of the Independent Trustees
Mr. Lautenbach also serves as Trustee of other Fidelity® funds. Mr. Lautenbach currently serves as the Lead Director of the Eaton Corporation Board of Directors (diversified industrial, 1997-present). Mr. Lautenbach is Chairman of the Board of Directors of Artis-Naples in Naples, Florida (2012-present), a member of the Council on Foreign Relations (1994-present), and a member of the Board of Governors, State University System of Florida (2013-present). Previously, Mr. Lautenbach was a Partner/Advisory Partner at Clayton, Dubilier & Rice, LLC (private equity investment, 1998-2010), as well as a Director of Sony Corporation (2006-2007).
Joseph Mauriello (1944)
Year of Election or Appointment: 2008
Trustee
Mr. Mauriello also serves as Trustee of other Fidelity® funds. Prior to his retirement in January 2006, Mr. Mauriello served in numerous senior management positions including Deputy Chairman and Chief Operating Officer (2004-2005), and Vice Chairman of Financial Services (2002-2004) of KPMG LLP US (professional services, 1965-2005). Mr. Mauriello currently serves as a member of the Board of Directors of XL Group plc. (global insurance and re-insurance, 2006-present) and the Independent Directors Council (IDC) Governing Council (2015-present). Previously, Mr. Mauriello served as a Director of the Hamilton Funds of the Bank of New York (2006-2007) and of Arcadia Resources Inc. (health care services and products, 2007-2012).
Robert W. Selander (1950)
Year of Election or Appointment: 2011
Trustee
Mr. Selander also serves as Trustee of other Fidelity® funds. Mr. Selander serves as a Director of The Western Union Company (global money transfer, 2014-present) and a non-executive Chairman of Health Equity, Inc. (health savings custodian, 2015-present). Previously, Mr. Selander served as a Member of the Advisory Board of other Fidelity® funds (2011), and Executive Vice Chairman (2010), Chief Executive Officer (2009-2010), and President and Chief Executive Officer (1997-2009) of Mastercard, Inc.
Cornelia M. Small (1944)
Year of Election or Appointment: 2005
Trustee
Ms. Small also serves as Trustee of other Fidelity® funds. Ms. Small is a member of the Board of Directors (2009-present) and Chair of the Investment Committee (2010-present) of the Teagle Foundation. Ms. Small also serves on the Investment Committee of the Berkshire Taconic Community Foundation (2008-present). Previously, Ms. Small served as Chairperson (2002-2008) and a member of the Investment Committee and Chairperson (2008-2012) and a member of the Board of Trustees of Smith College. In addition, Ms. Small served as Chief Investment Officer, Director of Global Equity Investments, and a member of the Board of Directors of Scudder, Stevens & Clark and Scudder Kemper Investments.
William S. Stavropoulos (1939)
Year of Election or Appointment: 2002
Trustee
Vice Chairman of the Independent Trustees
Mr. Stavropoulos also serves as Trustee of other Fidelity® funds. Mr. Stavropoulos serves as President and Founder of the Michigan Baseball Foundation, the Great Lakes Loons (2007-present). Mr. Stavropoulos is Chairman Emeritus of the Board of Directors of The Dow Chemical Company, where he previously served in numerous senior management positions, including President, CEO (1995-2000; 2002-2004), Chairman of the Executive Committee (2000-2006), and as a member of the Board of Directors (1990-2006). Currently, Mr. Stavropoulos is Chairman of the Board of Directors of Univar Inc. (global distributor of commodity and specialty chemicals), a Director of Teradata Corporation (data warehousing and technology solutions), and Maersk Inc. (industrial conglomerate), and a member of the Advisory Board for Metalmark Capital LLC (private equity investment, 2005-present). Mr. Stavropoulos is an operating advisor to Clayton, Dubilier & Rice, LLC (private equity investment). In addition, Mr. Stavropoulos is a member of the University of Notre Dame Advisory Council for the College of Science, a Trustee of the Rollin L. Gerstacker Foundation, and a Director of the Naples Philharmonic Center for the Arts. Previously, Mr. Stavropoulos served as a Director of Chemical Financial Corporation (bank holding company, 1993-2012) and Tyco International, Ltd. (multinational manufacturing and services, 2007-2012).
David M. Thomas (1949)
Year of Election or Appointment: 2008
Trustee
Mr. Thomas also serves as Trustee of other Fidelity® funds. Mr. Thomas serves as Non-Executive Chairman of the Board of Directors of Fortune Brands Home and Security (home and security products, 2011-present), as a member of the Board of Directors (2004-present) and Presiding Director (2013-present) of Interpublic Group of Companies, Inc. (marketing communication), and as a member of the Board of Trustees of the University of Florida (2013-present). Previously, Mr. Thomas served as Executive Chairman (2005-2006) and Chairman and Chief Executive Officer (2000-2005) of IMS Health, Inc. (pharmaceutical and healthcare information solutions), and a Director of Fortune Brands, Inc. (consumer products, 2000-2011).
+ The information includes the Trustee's principal occupation during the last five years and other information relating to the experience, attributes, and skills relevant to the Trustee's qualifications to serve as a Trustee, which led to the conclusion that the Trustee should serve as a Trustee for the fund.
Advisory Board Members and Officers:
Correspondence intended for an officer or Peter S. Lynch may be sent to Fidelity Investments, 245 Summer Street, Boston, Massachusetts 02210. Officers appear below in alphabetical order.
Name, Year of Birth; Principal Occupation
Peter S. Lynch (1944)
Year of Election or Appointment: 2003
Member of the Advisory Board
Mr. Lynch also serves as Member of the Advisory Board of other Fidelity® funds. Mr. Lynch is Vice Chairman and a Director of FMR (investment adviser firm) and FMR Co., Inc. (investment adviser firm). In addition, Mr. Lynch serves as a Trustee of Boston College and as the Chairman of the Inner-City Scholarship Fund. Previously, Mr. Lynch served on the Special Olympics International Board of Directors (1997-2006).
Marc R. Bryant (1966)
Year of Election or Appointment: 2015
Secretary and Chief Legal Officer (CLO)
Mr. Bryant also serves as Secretary and CLO of other funds. Mr. Bryant serves as CLO, Secretary, and Senior Vice President of Fidelity Management & Research Company (investment adviser firm, 2015-present) and FMR Co., Inc. (investment adviser firm, 2015-present); Secretary of Fidelity SelectCo, LLC (investment adviser firm, 2015-present) and Fidelity Investments Money Management, Inc. (investment adviser firm, 2015-present); and CLO of Fidelity Management & Research (Hong Kong) Limited (investment adviser firm, 2015-present). He is Senior Vice President and Deputy General Counsel of FMR LLC (diversified financial services company). Previously, Mr. Bryant served as Secretary and CLO of Fidelity Rutland Square Trust II (2010-2014) and Assistant Secretary of Fidelity's Fixed Income and Asset Allocation Funds (2013-2015). Prior to joining Fidelity Investments, Mr. Bryant served as a Senior Vice President and the Head of Global Retail Legal for AllianceBernstein L.P. (2006-2010), and as the General Counsel for ProFund Advisors LLC (2001-2006).
William C. Coffey (1969)
Year of Election or Appointment: 2009
Assistant Secretary
Mr. Coffey also serves as Assistant Secretary of other funds. He is Senior Vice President and Deputy General Counsel of FMR LLC (diversified financial services company, 2010-present), and is an employee of Fidelity Investments. Previously, Mr. Coffey served as Vice President and Associate General Counsel of FMR LLC (2005-2009).
Jonathan Davis (1968)
Year of Election or Appointment: 2010
Assistant Treasurer
Mr. Davis also serves as Assistant Treasurer of other funds, and is an employee of Fidelity Investments. Previously, Mr. Davis served as Vice President and Associate General Counsel of FMR LLC (diversified financial services company, 2003-2010).
Adrien E. Deberghes (1967)
Year of Election or Appointment: 2008
Deputy Treasurer
Mr. Deberghes also serves as an officer of other funds. He is an employee of Fidelity Investments (2008-present). Prior to joining Fidelity Investments, Mr. Deberghes was Senior Vice President of Mutual Fund Administration at State Street Corporation (2007-2008), Senior Director of Mutual Fund Administration at Investors Bank & Trust (2005-2007), and Director of Finance for Dunkin' Brands (2000-2005).
Stephanie J. Dorsey (1969)
Year of Election or Appointment: 2010
Assistant Treasurer
Ms. Dorsey also serves as an officer of other funds. She is an employee of Fidelity Investments (2008-present) and has served in other fund officer roles. Prior to joining Fidelity Investments, Ms. Dorsey served as Treasurer (2004-2008) of the JPMorgan Mutual Funds and Vice President (2004-2008) of JPMorgan Chase Bank.
Howard J. Galligan III (1966)
Year of Election or Appointment: 2014
Chief Financial Officer
Mr. Galligan also serves as Chief Financial Officer of other funds. Mr. Galligan serves as President of Fidelity Pricing and Cash Management Services (FPCMS) (2014-present) and as a Director of Strategic Advisers, Inc. (investment adviser firm, 2008-present). Previously, Mr. Galligan served as Chief Administrative Officer of Asset Management (2011-2014) and Chief Operating Officer and Senior Vice President of Investment Support for Strategic Advisers, Inc. (2003-2011).
Scott C. Goebel (1968)
Year of Election or Appointment: 2015
Vice President
Mr. Goebel serves as Vice President of other funds and is an employee of Fidelity Investments (2001-present). Previously, Mr. Goebel served as Secretary of Fidelity SelectCo, LLC (investment adviser firm, 2013-2015), Fidelity Investments Money Management, Inc. (FIMM) (investment adviser firm, 2010-2015), and Fidelity Research and Analysis Company (FRAC) (investment adviser firm, 2010-2015); General Counsel, Secretary, and Senior Vice President of Fidelity Management & Research Company (investment adviser firm, 2008-2015) and FMR Co., Inc. (investment adviser firm, 2008-2015); Assistant Secretary of Fidelity Management & Research (Japan) Limited (investment adviser firm, 2008-2015) and FMR Investment Management (U.K.) Limited (investment adviser firm, 2008-2015); Chief Legal Officer (CLO) of Fidelity Management & Research (Hong Kong) Limited (investment adviser firm, 2008-2015); Secretary and CLO of certain Fidelity® funds (2008-2015); Assistant Secretary of FIMM (2008-2010), FRAC (2008-2010), and certain funds (2007-2008); and as Vice President and Secretary of Fidelity Distributors Corporation (FDC) (2005-2007).
Thomas C. Hense (1964)
Year of Election or Appointment: 2008, 2010, or 2015
Vice President
Mr. Hense serves as Vice President of Fidelity Advisor® Multi-Asset Income Fund (2015) and other funds (High Income (2008), Small Cap (2008), and Value (2010) funds), and is an employee of Fidelity Investments (1993-present). Previously, Mr. Hense served as a portfolio manager for Fidelity's Institutional Money Management Group (Pyramis) (2003-2008).
Brian B. Hogan (1964)
Year of Election or Appointment: 2009
Vice President
Mr. Hogan also serves as Trustee or Vice President of other funds. Mr. Hogan serves as a Director of Fidelity SelectCo, LLC (investment adviser firm, 2014-present) and President of the Equity Division of FMR (investment adviser firm, 2009-present). Previously, Mr. Hogan served as Senior Vice President, Equity Research of FMR (2006-2009) and as a portfolio manager.
Chris Maher (1972)
Year of Election or Appointment: 2013
Assistant Treasurer
Mr. Maher serves as Assistant Treasurer of other funds. Mr. Maher is Vice President of Valuation Oversight and is an employee of Fidelity Investments. Previously, Mr. Maher served as Vice President of Asset Management Compliance (2013), Vice President of the Program Management Group of FMR (investment adviser firm, 2010-2013), and Vice President of Valuation Oversight (2008-2010).
John F. Papandrea (1972)
Year of Election or Appointment: 2016
Anti-Money Laundering (AML) Officer
Mr. Papandrea also serves as AML Officer of other funds. Mr. Papandrea is Vice President of FMR LLC (diversified financial services company, 2008-present) and is an employee of Fidelity Investments (2005-present).
Kenneth B. Robins (1969)
Year of Election or Appointment: 2008
President and Treasurer
Mr. Robins also serves as an officer of other funds. Mr. Robins serves as Executive Vice President of Fidelity Investments Money Management, Inc. (FIMM) (investment adviser firm, 2013-present) and is an employee of Fidelity Investments (2004-present). Previously, Mr. Robins served in other fund officer roles.
Stacie M. Smith (1974)
Year of Election or Appointment: 2013
Deputy Treasurer
Ms. Smith also serves as an officer of other funds. She is an employee of Fidelity Investments (2009-present) and has served in other fund officer roles. Prior to joining Fidelity Investments, Ms. Smith served as Senior Audit Manager of Ernst & Young LLP (1996-2009).
Renee Stagnone (1975)
Year of Election or Appointment: 2013
Deputy Treasurer
Ms. Stagnone also serves as Deputy Treasurer of other funds. Ms. Stagnone is an employee of Fidelity Investments (1997-present).
Linda J. Wondrack (1964)
Year of Election or Appointment: 2014
Chief Compliance Officer
Ms. Wondrack also serves as Chief Compliance Officer of other funds. Ms. Wondrack is Executive Vice President and head of the Ethics Office and Asset Management Compliance for Fidelity Investments (2012-present). Ms. Wondrack also serves as Chief Compliance Officer of Fidelity SelectCo, LLC (investment adviser firm, 2014-present); Chief Compliance Officer of Impresa Management LLC (2013-present); and Chief Compliance Officer of FMR Co., Inc. (investment adviser firm), Fidelity Investments Money Management, Inc. (investment adviser firm), FMR Investment Management (U.K.) Limited (investment adviser firm), Fidelity Management & Research (Hong Kong) (investment adviser firm), Fidelity Management & Research Company (investment adviser firm), FIAM LLC (investment adviser firm), and Strategic Advisers, Inc. (investment adviser firm), Ballyrock Investment Advisors LLC, and Northern Neck Investors LLC (2012-present). Previously, Ms. Wondrack served as Chief Compliance Officer of Fidelity Management & Research (Japan) Limited (investment adviser firm, 2012-2016); Senior Vice President and Chief Compliance Officer for Columbia Management Investment Advisers, LLC (2005-2012); Chief Compliance Officer for certain funds within the Columbia Family of Funds (2007-2012); and Senior Vice President of Compliance Risk Management at Bank of America (2005-2010).
Joseph F. Zambello (1957)
Year of Election or Appointment: 2011
Deputy Treasurer
Mr. Zambello also serves as Deputy Treasurer of other funds. Mr. Zambello is an employee of Fidelity Investments (1991-present). Previously, Mr. Zambello served as Vice President of the Program Management Group of FMR (investment adviser firm, 2009-2011) and Vice President of the Transfer Agent Oversight Group (2005-2009).
Shareholder Expense Example
As a shareholder of the Fund, you incur two types of costs: (1) transaction costs, and (2) ongoing costs, including management fees, distribution and/or service (12b-1) fees and other Fund expenses. This Example is intended to help you understand your ongoing costs (in dollars) of investing in the Fund and to compare these costs with the ongoing costs of investing in other mutual funds.
The Example is based on an investment of $1,000 invested at the beginning of the period and held for the entire period (July 1, 2015 to December 31, 2015).
Actual Expenses
The first line of the accompanying table for each class of the Fund provides information about actual account values and actual expenses. You may use the information in this line, together with the amount you invested, to estimate the expenses that you paid over the period. Simply divide your account value by $1,000.00 (for example, an $8,600 account value divided by $1,000.00 = 8.6), then multiply the result by the number in the first line for a class of the Fund under the heading entitled "Expenses Paid During Period" to estimate the expenses you paid on your account during this period. The estimate of expenses does not include any fees or other expenses of any variable annuity or variable life insurance product. If they were, the estimate of expenses you paid during the period would be higher, and your ending account value would be lower. In addition, the Fund, as a shareholder in the underlying Fidelity Central Funds, will indirectly bear its pro-rata share of the fees and expenses incurred by the underlying Fidelity Central Funds. These fees and expenses are not included in the Fund's annualized expense ratio used to calculate the expense estimate in the table below.
Hypothetical Example for Comparison Purposes
The second line of the accompanying table for each class of the Fund provides information about hypothetical account values and hypothetical expenses based on a Class' actual expense ratio and an assumed rate of return of 5% per year before expenses, which is not the Class' actual return. The hypothetical account values and expenses may not be used to estimate the actual ending account balance or expenses you paid for the period. You may use this information to compare the ongoing costs of investing in the Fund and other funds. To do so, compare this 5% hypothetical example with the 5% hypothetical examples that appear in the shareholder reports of the other funds. The estimate of expenses does not include any fees or other expenses of any variable annuity or variable life insurance product. If they were, the estimate of expenses you paid during the period would be higher, and your ending account value would be lower. In addition, the Fund, as a shareholder in the underlying Fidelity Central Funds, will indirectly bear its pro-rata share of the fees and expenses incurred by the underlying Fidelity Central Funds. These fees and expenses are not included in the Fund's annualized expense ratio used to calculate the expense estimate in the table below.
Please note that the expenses shown in the table are meant to highlight your ongoing costs only and do not reflect any transaction costs. Therefore, the second line of the table is useful in comparing ongoing costs only, and will not help you determine the relative total costs of owning different funds.
| | Annualized Expense Ratio-A | Beginning
Account Value
July 1, 2015 | Ending
Account Value
December 31, 2015 | Expenses Paid
During Period-B
July 1, 2015
to December 31, 2015 |
| Initial Class | .67% | | | |
| Actual | | $1,000.00 | $918.70 | $3.24 |
| Hypothetical-C | | $1,000.00 | $1,021.83 | $3.41 |
| Service Class | .77% | | | |
| Actual | | $1,000.00 | $918.50 | $3.72 |
| Hypothetical-C | | $1,000.00 | $1,021.32 | $3.92 |
| Service Class 2 | .92% | | | |
| Actual | | $1,000.00 | $918.20 | $4.45 |
| Hypothetical-C | | $1,000.00 | $1,020.57 | $4.69 |
| Investor Class | .75% | | | |
| Actual | | $1,000.00 | $918.30 | $3.63 |
| Hypothetical-C | | $1,000.00 | $1,021.42 | $3.82 |
A Annualized expense ratio reflects expenses net of applicable fee waivers.
B Expenses are equal to each Class' annualized expense ratio, multiplied by the average account value over the period, multiplied by 184/365 (to reflect the one-half year period).
C 5% return per year before expenses
Distributions (Unaudited)
Initial Class, Service Class, Service Class 2, and Investor Class designates 100% of the dividend distributed during the fiscal year as qualifying for the dividends received deduction for corporate shareholders.
Board Approval of Investment Advisory Contracts and Management Fees
VIP Value Strategies Portfolio
Each year, the Board of Trustees, including the Independent Trustees (together, the Board), votes on the renewal of the management contract with Fidelity Management & Research Company (FMR) and the sub-advisory agreements (together, the Advisory Contracts) for the fund. The Board, assisted by the advice of fund counsel and Independent Trustees' counsel, requests and considers a broad range of information relevant to the renewal of the Advisory Contracts throughout the year.
The Board meets regularly and, at each of its meetings, covers an extensive agenda of topics and materials and considers factors that are relevant to its annual consideration of the renewal of the fund's Advisory Contracts, including the services and support provided to the fund and its shareholders. The Board has established various standing committees (Committees), each composed of and chaired by Independent Trustees with varying backgrounds, to which the Board has assigned specific subject matter responsibilities in order to enhance effective decision-making by the Board. The Board, acting directly and through its Committees, requests and receives information concerning the annual consideration of the renewal of the fund's Advisory Contracts. The Board also meets as needed to consider matters specifically related to the Board's annual consideration of the renewal of the Advisory Contracts. Members of the Board may also meet with trustees of other Fidelity funds through ad hoc joint committees to discuss certain matters relevant to all of the Fidelity funds.
At its July 2015 meeting, the Board unanimously determined to renew the fund's Advisory Contracts. In reaching its determination, the Board considered all factors it believed relevant, including (i) the nature, extent, and quality of the services to be provided to the fund and its shareholders (including the investment performance of the fund); (ii) the competitiveness of the fund's management fee and total expense ratio relative to peer funds; (iii) the total costs of the services to be provided by and the profits to be realized by Fidelity from its relationship with the fund; and (iv) the extent to which (if any) economies of scale exist and would be realized as the fund grows, and whether any economies of scale are appropriately shared with fund shareholders.
In considering whether to renew the Advisory Contracts for the fund, the Board reached a determination, with the assistance of fund counsel and Independent Trustees' counsel and through the exercise of its business judgment, that the renewal of the Advisory Contracts was in the best interests of the fund and its shareholders and that the compensation payable under the Advisory Contracts was fair and reasonable. The Board's decision to renew the Advisory Contracts was not based on any single factor, but rather was based on a comprehensive consideration of all the information provided to the Board at its meetings throughout the year. The Board, in reaching its determination to renew the Advisory Contracts, was aware that shareholders of the fund have a broad range of investment choices available to them, including a wide choice among funds offered by Fidelity's competitors, and that the fund's shareholders, who have the opportunity to review and weigh the disclosure provided by the fund in its prospectus and other public disclosures, have chosen to invest in this fund, which is part of the Fidelity family of funds.
Nature, Extent, and Quality of Services Provided. The Board considered Fidelity's staffing as it relates to the fund, including the backgrounds of investment personnel of Fidelity, and also considered the fund's investment objective, strategies, and related investment philosophy. The Independent Trustees also had discussions with senior management of Fidelity's investment operations and investment groups. The Board considered the structure of the portfolio manager compensation program and whether this structure provides appropriate incentives to act in the best interests of the fund. Additionally, the Board considered the portfolio managers' investments, if any, in the funds that they manage.
Resources Dedicated to Investment Management and Support Services. The Board and the Fund Oversight and Research Committees reviewed the general qualifications and capabilities of Fidelity's investment staff, including its size, education, experience, and resources, as well as Fidelity's approach to recruiting, training, managing, and compensating investment personnel. The Board noted that Fidelity has continued to increase the resources devoted to non-U.S. offices, including expansion of Fidelity's global investment organization. The Board also noted that Fidelity's analysts have extensive resources, tools and capabilities that allow them to conduct sophisticated quantitative and fundamental analysis, as well as credit analysis of issuers, counterparties and guarantors. Further, the Board considered that Fidelity's investment professionals have sufficient access to global information and data so as to provide competitive investment results over time, and that those professionals also have access to sophisticated tools that permit them to assess portfolio construction and risk and performance attribution characteristics continuously, as well as to transmit new information and research conclusions rapidly around the world. Additionally, in its deliberations, the Board considered Fidelity's trading, risk management, and compliance capabilities and resources, which are integral parts of the investment management process.
Shareholder and Administrative Services. The Board considered (i) the nature, extent, quality, and cost of advisory, administrative, and shareholder services performed by FMR, the sub-advisers (together with FMR, the Investment Advisers), and their affiliates under the Advisory Contracts and under separate agreements covering transfer agency, pricing and bookkeeping, and securities lending services for the fund; (ii) the nature and extent of the supervision of third party service providers, principally custodians and subcustodians; and (iii) the resources devoted to, and the record of compliance with, the fund's compliance policies and procedures. The Board also reviewed the allocation of fund brokerage, including allocations to brokers affiliated with the Investment Advisers, the use of brokerage commissions to pay fund expenses, and the use of "soft" commission dollars to pay for research services.
The Board noted that the growth of fund assets over time across the complex allows Fidelity to reinvest in the development of services designed to enhance the value or convenience of the Fidelity funds as investment vehicles. These services include 24-hour access to account information and market information through telephone representatives and over the Internet, investor education materials and asset allocation tools, and the expanded availability of Fidelity Investor Centers.
In 2014, the Board formed an ad hoc Committee on Transfer Agency Fees to review the variety of transfer agency fee structures throughout the industry and Fidelity's competitive positioning with respect to industry participants.
Investment in a Large Fund Family. The Board considered the benefits to shareholders of investing in a Fidelity fund, including the benefits of investing in a fund that is part of a large family of funds offering a variety of investment disciplines and providing a large variety of mutual fund investor services. The Board noted that Fidelity had taken, or had made recommendations that resulted in the Fidelity funds taking, a number of actions over the previous year that benefited particular funds, including (i) continuing to dedicate additional resources to investment research and to the support of the senior management team that oversees asset management; (ii) continuing efforts to enhance Fidelity's global research capabilities; (iii) launching new funds and making other enhancements to meet client needs; (iv) reducing management fees and total expenses for certain index funds and diversified international funds; (v) continuing to launch dedicated lower cost underlying funds to meet portfolio construction needs related to expanding underlying fund options for Fidelity funds of funds, specifically for the Freedom Fund product lines; (vi) rationalizing product lines and gaining increased efficiencies through fund mergers; (vii) launching active fixed-income exchange-traded funds; (viii) continuing to develop, acquire and implement systems and technology to improve services to the funds and information security and to increase efficiency; (ix) implementing investment enhancements to further strengthen Fidelity's target date product line to increase investors' probability of success in achieving their goals; (x) modifying the eligibility criteria for certain share classes to accommodate roll-over assets from employer-sponsored retirement plans; (xi) launching a new Class W of the Freedom Index Funds to attract and retain Fidelity record-kept retirement plan assets; and (xii) implementing changes to Fidelity's money market product line in response to recent money market regulatory reforms.
Investment Performance. The Board considered whether the fund has operated in accordance with its investment objective, as well as its record of compliance with its investment restrictions and its performance history.
The Board took into account discussions with representatives of the Investment Advisers about fund investment performance that occur at Board meetings throughout the year. In this regard the Board noted that as part of regularly scheduled fund reviews and other reports to the Board on fund performance, the Board considers annualized return information for the fund, for different time periods, measured against a securities market index ("benchmark index") and a peer group of funds with similar objectives ("peer group"), if any. In its evaluation of fund investment performance, the Board gave particular attention to information indicating changes in performance of certain Fidelity funds for specific time periods and discussed with the Investment Advisers the reasons for any overperformance or underperformance.
In addition to reviewing absolute and relative fund performance, the Independent Trustees periodically consider the appropriateness of fund performance metrics in evaluating the results achieved. In general, the Independent Trustees believe that fund performance should be evaluated based on net performance (after fees and expenses) of both the highest performing and lowest performing fund share classes, where applicable, compared to appropriate benchmark indices, over appropriate time periods that may include full market cycles, and compared to peer groups, as applicable, over the same periods, taking into account relevant factors including the following: general market conditions; issuer-specific information; and fund cash flows and other factors.
The Independent Trustees recognize that shareholders evaluate performance on a net basis over their own holding periods, for which one-, three-, and five-year periods are often used as a proxy. For this reason, the performance information reviewed by the Board also included net cumulative calendar year total return information for the fund and an appropriate benchmark index and peer group for the most recent one-, three-, and five-year periods, as shown below. Returns are shown compared to the 25th percentile (top of box, 75% beaten) and 75th percentile (bottom of box, 25% beaten) of the peer universe.
VIP Value Strategies Portfolio
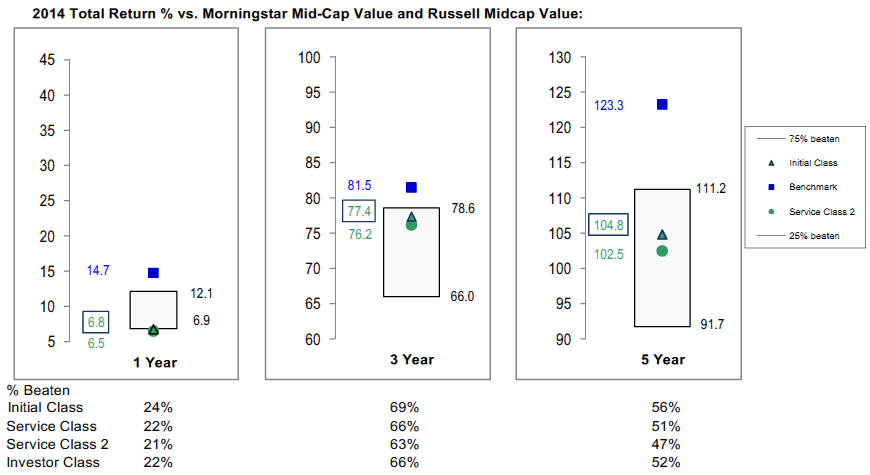
Based on its review, the Board concluded that the nature, extent, and quality of services provided to the fund under the Advisory Contracts should benefit the shareholders of the fund.
Competitiveness of Management Fee and Total Expense Ratio. The Board considered the fund's management fee and total expense ratio compared to "mapped groups" of competitive funds and classes created for the purpose of facilitating the Trustees' competitive analysis of management fees and total expenses. Fidelity creates "mapped groups" by combining similar Lipper investment objective categories that have comparable investment mandates. Combining Lipper investment objective categories aids the Board's management fee and total expense ratio comparisons by broadening the competitive group used for comparison.
Management Fee. The Board considered two proprietary management fee comparisons for the 12-month periods shown in basis points (BP) in the chart below. The group of Lipper funds used by the Board for management fee comparisons is referred to below as the "Total Mapped Group." The Total Mapped Group comparison focuses on a fund's standing in terms of gross management fees before expense reimbursements or caps relative to the total universe of funds with comparable investment mandates, regardless of whether their management fee structures also are comparable. Funds with comparable investment mandates offer exposure to similar types of securities. Funds with comparable management fee structures have similar management fee contractual arrangements (
e.g., flat rate charged for advisory services, all-inclusive fee rate,
etc.). "TMG %" represents the percentage of funds in the Total Mapped Group that had management fees that were lower than the fund's. For example, a hypothetical TMG % of 20% would mean that 80% of the funds in the Total Mapped Group had higher, and 20% had lower, management fees than the fund. The fund's actual TMG %s and the number of funds in the Total Mapped Group are in the chart below. The "Asset-Size Peer Group" (ASPG) comparison focuses on a fund's standing relative to a subset of non-Fidelity funds within the Total Mapped Group that are similar in size and management fee structure without taking into account performance adjustments, if any. For example, if a fund is in the first quartile of the ASPG, the fund's management fee ranks in the least expensive or lowest 25% of funds in the ASPG. The ASPG represents at least 15% of the funds in the Total Mapped Group with comparable asset size and management fee structures, subject to a minimum of 50 funds (or all funds in the Total Mapped Group if fewer than 50). Additional information, such as the ASPG quartile in which the fund's management fee rate ranked, is also included in the chart and considered by the Board.
VIP Value Strategies Portfolio

The Board noted that the fund's management fee rate ranked below the median of its Total Mapped Group and below the median of its ASPG for 2014.
The Board noted that, in 2014, the ad hoc Committee on Group Fee was formed by it and other Fidelity fund boards to conduct an in-depth review of the "group fee" component of the management fee of funds with such management fee structures. Committee focus included the mechanics of the group fee, the competitive landscape of group fee structures, Fidelity funds with no group fee component and investment products not included in group fee assets. The Board also considered that, for funds subject to the group fee, FMR agreed to voluntarily waive fees over a specified period of time in amounts designed to account for assets converted from certain funds to certain collective investment trusts.
The Board also noted that, in 2013, the ad hoc Committee on Management Fees was formed to conduct an in-depth review of the management fee rates of Fidelity's active equity mutual funds. The Committee focused on the following areas: (i) standard fee structures; (ii) research consumption and trading evolution; (iii) management fee competitiveness/profitability by category; and (iv) factors that drive institutional pricing.
Based on its review, the Board concluded that the fund's management fee is fair and reasonable in light of the services that the fund receives and the other factors considered.
Total Expense Ratio. In its review of each class's total expense ratio, the Board considered the fund's management fee as well as other fund or class expenses, as applicable, such as transfer agent fees, pricing and bookkeeping fees, fund-paid 12b-1 fees, and custodial, legal, and audit fees. The Board also noted that Fidelity may agree to waive fees and expenses from time to time, and the extent to which, if any, it has done so for the fund. As part of its review, the Board also considered the current and historical total expense ratios of each class of the fund compared to competitive fund median expenses. Each class of the fund is compared to those funds and classes in the Total Mapped Group (used by the Board for management fee comparisons) that have a similar sales load structure.
The Board noted that the total expense ratio of each of Initial Class, Investor Class, and Service Class ranked below its competitive median for 2014 and the total expense ratio of Service Class 2 ranked above its competitive median for 2014. The Board considered that, in general, various factors can affect total expense ratios. The Board noted that the total expense ratio of Service Class 2 was above the competitive median primarily because of higher 12b-1 fees for Service Class 2 as compared to most competitor funds. The Board noted that the fund offers multiple classes, each of which has a different 12b-1 fee structure, and that the multiple structures are intended to offer a range of pricing options for the intermediary market. The Board also noted that the total expense ratios of the classes vary primarily by the level of their 12b-1 fees, although differences in transfer agent fees may also cause expenses to vary from class to class.
Fees Charged to Other Fidelity Clients. The Board also considered Fidelity fee structures and other information with respect to clients of Fidelity, such as other funds advised or subadvised by Fidelity, pension plan clients, and other institutional clients with similar mandates. The Board noted the findings of the 2013 ad hoc joint committee (created with the board of other Fidelity funds), which reviewed and compared Fidelity's institutional investment advisory business with its business of providing services to the Fidelity funds, including the differences in services provided, fees charged, and costs incurred, as well as competition in their respective marketplaces.
Based on its review of total expense ratios and fees charged to other Fidelity clients, the Board concluded that, although Service Class 2 was above the median of the universe presented for comparison, the total expense ratio of each class of the fund was reasonable in light of the services that the fund and its shareholders receive and the other factors considered.
Costs of the Services and Profitability. The Board considered the revenues earned and the expenses incurred by Fidelity in conducting the business of developing, marketing, distributing, managing, administering and servicing the fund and servicing the fund's shareholders. The Board also considered the level of Fidelity's profits in respect of all the Fidelity funds.
On an annual basis, Fidelity presents to the Board information about the profitability of its relationship with the fund. Fidelity calculates profitability information for each fund, as well as aggregate profitability information for groups of Fidelity funds and all Fidelity funds, using a series of detailed revenue and cost allocation methodologies which originate with the books and records of Fidelity on which Fidelity's audited financial statements are based. The Audit Committee of the Board reviews any significant changes from the prior year's methodologies.
PricewaterhouseCoopers LLP (PwC), independent registered public accounting firm and auditor to Fidelity and certain Fidelity funds, has been engaged annually by the Board as part of the Board's assessment of Fidelity's profitability analysis. PwC's engagement includes the review and assessment of the methodologies used by Fidelity in determining the revenues and expenses attributable to Fidelity's mutual fund business, and completion of agreed-upon procedures in respect of the mathematical accuracy of fund profitability and its conformity to established allocation methodologies. After considering PwC's reports issued under the engagement and information provided by Fidelity, the Board concluded that while other allocation methods may also be reasonable, Fidelity's profitability methodologies are reasonable in all material respects.
The Board also reviewed Fidelity's non-fund businesses and fall-out benefits related to the mutual fund business as well as cases where Fidelity's affiliates may benefit from or be related to the fund's business.
The Board considered the costs of the services provided by and the profits realized by Fidelity in connection with the operation of the fund and was satisfied that the profitability was not excessive.
Economies of Scale. The Board considered whether there have been economies of scale in respect of the management of the Fidelity funds, whether the Fidelity funds (including the fund) have appropriately benefited from any such economies of scale, and whether there is potential for realization of any further economies of scale. The Board considered the extent to which the fund will benefit from economies of scale as assets grow through increased services to the fund, through waivers or reimbursements, or through fee or expense ratio reductions. The Board also noted that in 2013, it and the boards of other Fidelity funds created an ad hoc committee (the Economies of Scale Committee) to analyze whether Fidelity attains economies of scale in respect of the management and servicing of the Fidelity funds, whether the Fidelity funds have appropriately benefited from such economies of scale, and whether there is potential for realization of any further economies of scale.
The Board recognized that the fund's management contract incorporates a "group fee" structure, which provides for lower group fee rates as total group assets increase, and for higher group fee rates as total group assets decrease (with "group assets" defined to include fund assets under FMR's management plus sector fund assets previously under FMR's management and currently managed by Fidelity SelectCo, LLC). FMR calculates the group fee rates based on a tiered asset "breakpoint" schedule that varies based on asset class. The Board considered that the group fee is designed to deliver the benefits of economies of scale to fund shareholders when total Fidelity fund assets increase, even if assets of any particular fund are unchanged or have declined, because some portion of Fidelity's costs are attributable to services provided to all Fidelity funds, and all funds benefit if those costs can be allocated among more assets. The Board concluded that, given the group fee structure, fund shareholders will benefit from lower management fees as group assets increase at the fund complex level, regardless of whether Fidelity achieves any such economies of scale.
The Board concluded, taking into account the analysis of the Economies of Scale Committee, that economies of scale, if any, are being appropriately shared between fund shareholders and Fidelity.
Additional Information Requested by the Board. In order to develop fully the factual basis for consideration of the Fidelity funds' Advisory Contracts, the Board requested and received additional information on certain topics, including: (i) fund performance trends and Fidelity's long-term strategies for certain funds; (ii) the various share classes employed by Fidelity and the attributes of each class, together with similar information on the distribution and servicing payments made by Fidelity or the funds to third-party participants in the distribution channels; (iii) fund profitability, and fund performance in relation to fund profitability; (iv) the methodology with respect to evaluating competitive fund data and peer group classifications and fee comparisons; (v) annual fund profitability margins, with particular focus on certain funds with negative margins; (vi) the realization of fall-out benefits in certain Fidelity business units;
(vii) economies of scale and the way in which they are shared with fund shareholders;(viii) Fidelity's group fee structures, including the group fee schedule of breakpoints;(ix) the impact of cost containment measures on the funds; and (x) the transfer agent fee structure.
Based on its evaluation of all of the conclusions noted above, and after considering all factors it believed relevant, the Board concluded that the advisory fee structures are fair and reasonable, and that the fund's Advisory Contracts should be renewed.
VIPVS-ANN-0216
1.781994.113
Fidelity® Variable Insurance Products: Balanced Portfolio
Annual Report December 31, 2015 |
|
Contents
To view a fund's proxy voting guidelines and proxy voting record for the 12-month period ended June 30, visit http://www.fidelity.com/proxyvotingresults or visit the Securities and Exchange Commission's (SEC) web site at http://www.sec.gov.
You may also call 1-877-208-0098 to request a free copy of the proxy voting guidelines.
Fidelity® Variable Insurance Products are separate account options which are purchased through a variable insurance contract.
Standard & Poor's, S&P and S&P 500 are registered service marks of The McGraw-Hill Companies, Inc. and have been licensed for use by Fidelity Distributors Corporation.
Other third-party marks appearing herein are the property of their respective owners.
All other marks appearing herein are registered or unregistered trademarks or service marks of FMR LLC or an affiliated company. © 2016 FMR LLC. All rights reserved.
This report and the financial statements contained herein are submitted for the general information of the shareholders of the Fund. This report is not authorized for distribution to prospective investors in the Fund unless preceded or accompanied by an effective prospectus.
A fund files its complete schedule of portfolio holdings with the SEC for the first and third quarters of each fiscal year on Form N-Q. Forms N-Q are available on the SEC’s web site at http://www.sec.gov. A fund's Forms N-Q may be reviewed and copied at the SEC’s Public Reference Room in Washington, DC. Information regarding the operation of the SEC's Public Reference Room may be obtained by calling 1-800-SEC-0330.
For a complete list of a fund's portfolio holdings, view the most recent holdings listing, semiannual report, or annual report on Fidelity's web site at http://www.fidelity.com, http://www.advisor.fidelity.com, or http://www.401k.com, as applicable.
NOT FDIC INSURED •MAY LOSE VALUE •NO BANK GUARANTEE
Neither the Fund nor Fidelity Distributors Corporation is a bank.
Performance: The Bottom Line
Average annual total return reflects the change in the value of an investment, assuming reinvestment of distributions from dividend income and capital gains (the profits earned upon the sale of securities that have grown in value, if any) and assuming a constant rate of performance each year. During periods of reimbursement by Fidelity, a fund’s total return will be greater than it would be had the reimbursement not occurred. Performance numbers are net of all underlying fund operating expenses, but do not include any insurance charges imposed by your insurance company’s separate account. If performance information included the effect of these additional charges, the total returns would have been lower. How a fund did yesterday is no guarantee of how it will do tomorrow.
Average Annual Total Returns
| For the periods ended December 31, 2015 | Past 1 year | Past 5 years | Past 10 years |
| Initial Class | 0.59% | 8.04% | 6.84% |
| Service Class | 0.51% | 7.90% | 6.71% |
| Service Class 2 | 0.36% | 7.78% | 6.58% |
| Investor Class | 0.52% | 7.95% | 6.74% |
$10,000 Over 10 Years
Let's say hypothetically that $10,000 was invested in VIP Balanced Portfolio - Initial Class on December 31, 2005.
The chart shows how the value of your investment would have changed, and also shows how the S&P 500® Index performed over the same period.

| Period Ending Values |
| $ 19,378 | VIP Balanced Portfolio - Initial Class |
| $ 20,242 | S&P 500® Index |
Management's Discussion of Fund Performance
Market Recap: U.S. stocks gained modestly in 2015, rebounding from a steep decline in August and September over worries about China’s slowing economic growth. The S&P 500
® index rose 1.38% for the year, its lowest calendar-year return since 2008. After the late-summer rout, stocks sharply reversed course in October, lifted by the U.S. Federal Reserve’s decision to put off raising near-term interest rates until mid-December. Investors also were encouraged by an interest-rate cut in China and economic stimulus in Europe. Overall, growth stocks handily beat their value counterparts, as investors sought growth in a subpar economic environment. Five of 10 sectors in the S&P 500
® gained ground for the period, and five retreated. Consumer discretionary (+10%) led the way, benefiting from rising personal income and low inflation. Conversely, energy (-21%) was stung by deflated commodity prices that also hit materials (-8%). Turning to fixed income, U.S. taxable investment-grade bonds managed only a slight gain for the year, in an environment of rising credit-risk premiums. The Barclays
® U.S. Aggregate Bond Index returned 0.55%, with coupon (stated interest) payments roughly counterbalancing price weakness. U.S. Treasury and agency mortgage-backed securities managed slight gains. Investment-grade credit and government-related securities modestly declined.
Comments from Co-Portfolio Manager Robert Stansky, Head of FMR’s Stock Selector Large Cap Group, which manages VIP Balanced Portfolio: For the year, the fund’s share classes recorded modest gains that lagged the Fidelity Balanced 60/40 Composite Index℠. Versus the index, security selection in both the stock and bond subportfolios, as well as a small out-of-benchmark stake in corporate high-yield bonds, detracted from performance. However, overweighting stocks and underweighting bonds was the right call, as equities outperformed bonds. The equity subportfolio modestly trailed its benchmark, the S&P 500
®. Stock selection in the consumer discretionary sector was the biggest drag on the fund’s relative performance. One index name responsible for a lot of the negative impact here was strong-performing online retailer Amazon.com, the subportfolio’s biggest relative detractor and a stock we didn’t own until August. On the positive side, the subportfolio got a boost from stock picking in industrials. Roper Technologies was the top relative contributor. The maker of pumps and other equipment used in the energy and industrials sectors posted strong third-quarter earnings. Turning to fixed income, this subportfolio also modestly trailed its benchmark, the Barclays U.S. Aggregate Bond Index. Within the investment-grade area, underweighting U.S. government-backed bonds – namely Treasuries and agency mortgage-backed securities – detracted, as did the fund’s overweighting in Treasury Inflation-Protected Securities (TIPS). Conversely, the decision to maintain an overweighting in investment-grade corporate bonds added value. Within investment-grade corporates, an overweighting in strong-performing financials and underweighting in weaker industrial names aiding the fund’s relative results.
Note to shareholders: On November 2, 2015, Peter Dixon was named a Co-Manager and began managing the fund’s consumer discretionary sleeve, succeeding Peter Saperstone. Ford O’Neil was named a Co-Manager of the fund effective July 27, 2015, succeeding Pramod Atluri in overseeing the fund’s fixed-income investments.
The views expressed above reflect those of the portfolio manager(s) only through the end of the period as stated on the cover of this report and do not necessarily represent the views of Fidelity or any other person in the Fidelity organization. Any such views are subject to change at any time based upon market or other conditions and Fidelity disclaims any responsibility to update such views. These views may not be relied on as investment advice and, because investment decisions for a Fidelity fund are based on numerous factors, may not be relied on as an indication of trading intent on behalf of any Fidelity fund.
Investment Summary (Unaudited)
The information in the following tables is based on the combined investments of the Fund and its pro-rata share of the investments of Fidelity's Fixed-Income Central Funds.
Top Five Stocks as of December 31, 2015
| | % of fund's net assets | % of fund's net assets 6 months ago |
| Alphabet, Inc. Class C | 1.9 | 1.2 |
| Apple, Inc. | 1.6 | 2.8 |
| Danaher Corp. | 1.6 | 1.3 |
| Roper Technologies, Inc. | 1.5 | 1.0 |
| AMETEK, Inc. | 1.4 | 1.1 |
| | 8.0 | |
Top Five Bond Issuers as of December 31, 2015
| (with maturities greater than one year) | % of fund's net assets | % of fund's net assets 6 months ago |
| Fannie Mae | 3.9 | 3.8 |
| U.S. Treasury Obligations | 3.7 | 5.5 |
| Freddie Mac | 1.6 | 1.0 |
| Citigroup, Inc. | 1.1 | 1.0 |
| Ginnie Mae | 1.0 | 1.0 |
| | 11.3 | |
Top Five Market Sectors as of December 31, 2015
| | % of fund's net assets | % of fund's net assets 6 months ago |
| Financials | 18.6 | 18.6 |
| Information Technology | 13.4 | 12.5 |
| Health Care | 11.2 | 11.5 |
| Consumer Discretionary | 10.5 | 10.8 |
| Consumer Staples | 7.1 | 6.5 |
Asset Allocation (% of fund's net assets)
| As of December 31, 2015* |
| | Stocks and Equity Futures | 66.3% |
| | Bonds | 30.9% |
| | Short-Term Investments and Net Other Assets (Liabilities) | 2.2% |
| | Other Investments | 0.6% |

* Foreign investments - 13.3%
| As of June 30, 2015* |
| | Stocks and Equity Futures | 67.6% |
| | Bonds | 31.0% |
| | Short-Term Investments and Net Other Assets (Liabilities) | 1.2% |
| | Other Investments | 0.2% |

* Foreign investments - 12.7%
Percentages in the above tables are adjusted for the effect of TBA Sale Commitments.
Percentages are adjusted for the effect of futures contracts and swaps, if applicable.
An unaudited holdings listing for the Fund, which presents direct holdings as well as the pro-rata share of any securities and other investments held indirectly through its investment in underlying non-money market Fidelity Central Funds, is available at advisor.fidelity.com.
Investments December 31, 2015
Showing Percentage of Net Assets
| Common Stocks - 65.3% | | | |
| | | Shares | Value |
| CONSUMER DISCRETIONARY - 9.1% | | | |
| Auto Components - 0.4% | | | |
| Delphi Automotive PLC | | 130,500 | $11,187,765 |
| Automobiles - 0.2% | | | |
| Tesla Motors, Inc. (a) | | 24,500 | 5,880,245 |
| Diversified Consumer Services - 0.2% | | | |
| 2U, Inc. (a) | | 84,900 | 2,375,502 |
| H&R Block, Inc. | | 148,400 | 4,943,204 |
| | | | 7,318,706 |
| Hotels, Restaurants & Leisure - 1.1% | | | |
| Fiesta Restaurant Group, Inc. (a) | | 64,700 | 2,173,920 |
| Hilton Worldwide Holdings, Inc. | | 590,000 | 12,626,000 |
| Las Vegas Sands Corp. | | 108,500 | 4,756,640 |
| Starbucks Corp. | | 213,590 | 12,821,808 |
| Tuniu Corp. Class A sponsored ADR (a) | | 49,962 | 798,393 |
| | | | 33,176,761 |
| Household Durables - 0.2% | | | |
| Lennar Corp. Class A | | 62,744 | 3,068,809 |
| PulteGroup, Inc. | | 223,014 | 3,974,109 |
| | | | 7,042,918 |
| Internet & Catalog Retail - 1.0% | | | |
| Amazon.com, Inc. (a) | | 45,140 | 30,509,675 |
| Media - 2.3% | | | |
| Charter Communications, Inc. Class A (a)(b) | | 79,100 | 14,483,210 |
| Comcast Corp. Class A | | 24,500 | 1,382,535 |
| ITV PLC | | 4,057,000 | 16,542,974 |
| Manchester United PLC | | 130,400 | 2,322,424 |
| MDC Partners, Inc. Class A | | 219,286 | 4,762,892 |
| The Madison Square Garden Co. (a) | | 18,994 | 3,073,229 |
| The Walt Disney Co. | | 237,600 | 24,967,008 |
| | | | 67,534,272 |
| Multiline Retail - 0.2% | | | |
| B&M European Value Retail S.A. | | 1,628,483 | 6,834,820 |
| Specialty Retail - 2.4% | | | |
| AutoZone, Inc. (a) | | 13,590 | 10,082,557 |
| Home Depot, Inc. | | 144,008 | 19,045,058 |
| L Brands, Inc. | | 192,194 | 18,416,029 |
| Ross Stores, Inc. | | 232,843 | 12,529,282 |
| TJX Companies, Inc. | | 146,140 | 10,362,787 |
| | | | 70,435,713 |
| Textiles, Apparel & Luxury Goods - 1.1% | | | |
| NIKE, Inc. Class B | | 325,730 | 20,358,125 |
| VF Corp. | | 206,400 | 12,848,400 |
| | | | 33,206,525 |
|
| TOTAL CONSUMER DISCRETIONARY | | | 273,127,400 |
|
| CONSUMER STAPLES - 6.5% | | | |
| Beverages - 1.4% | | | |
| Anheuser-Busch InBev SA NV | | 4,000 | 497,789 |
| Constellation Brands, Inc. Class A (sub. vtg.) | | 51,100 | 7,278,684 |
| Monster Beverage Corp. | | 42,100 | 6,271,216 |
| The Coca-Cola Co. | | 663,586 | 28,507,655 |
| | | | 42,555,344 |
| Food & Staples Retailing - 1.4% | | | |
| CVS Health Corp. | | 213,576 | 20,881,326 |
| Kroger Co. | | 303,674 | 12,702,683 |
| Sprouts Farmers Market LLC (a) | | 80,300 | 2,135,177 |
| Wal-Mart Stores, Inc. | | 42,400 | 2,599,120 |
| Whole Foods Market, Inc. | | 139,400 | 4,669,900 |
| | | | 42,988,206 |
| Food Products - 0.7% | | | |
| Blue Buffalo Pet Products, Inc. (a)(b) | | 30,450 | 569,720 |
| Keurig Green Mountain, Inc. | | 80,131 | 7,210,187 |
| Mead Johnson Nutrition Co. Class A | | 110,832 | 8,750,186 |
| The Hershey Co. | | 47,700 | 4,258,179 |
| | | | 20,788,272 |
| Household Products - 0.9% | | | |
| Colgate-Palmolive Co. | | 262,600 | 17,494,412 |
| Procter & Gamble Co. | | 130,576 | 10,369,040 |
| | | | 27,863,452 |
| Personal Products - 0.3% | | | |
| Estee Lauder Companies, Inc. Class A | | 73,212 | 6,447,049 |
| Nu Skin Enterprises, Inc. Class A | | 50,316 | 1,906,473 |
| | | | 8,353,522 |
| Tobacco - 1.8% | | | |
| Altria Group, Inc. | | 415,700 | 24,197,897 |
| British American Tobacco PLC sponsored ADR | | 200,119 | 22,103,144 |
| Philip Morris International, Inc. | | 78,600 | 6,909,726 |
| Reynolds American, Inc. | | 9,100 | 419,965 |
| | | | 53,630,732 |
|
| TOTAL CONSUMER STAPLES | | | 196,179,528 |
|
| ENERGY - 4.2% | | | |
| Energy Equipment & Services - 1.0% | | | |
| Aspen Aerogels, Inc. (a) | | 24,037 | 145,905 |
| Baker Hughes, Inc. | | 111,100 | 5,127,265 |
| Dril-Quip, Inc. (a) | | 31,800 | 1,883,514 |
| Halliburton Co. | | 77,000 | 2,621,080 |
| Independence Contract Drilling, Inc. (a) | | 112,473 | 567,989 |
| Oceaneering International, Inc. | | 47,700 | 1,789,704 |
| Schlumberger Ltd. | | 243,900 | 17,012,025 |
| | | | 29,147,482 |
| Oil, Gas & Consumable Fuels - 3.2% | | | |
| Anadarko Petroleum Corp. | | 195,649 | 9,504,628 |
| Apache Corp. | | 107,600 | 4,784,972 |
| Black Stone Minerals LP | | 128,200 | 1,849,926 |
| Cabot Oil & Gas Corp. | | 184,260 | 3,259,559 |
| Chevron Corp. | | 144,400 | 12,990,224 |
| Cimarex Energy Co. | | 27,185 | 2,429,795 |
| Emerald Oil, Inc. warrants 2/4/16 (a) | | 1,087 | 0 |
| Encana Corp. | | 495,300 | 2,516,412 |
| EOG Resources, Inc. | | 86,266 | 6,106,770 |
| Exxon Mobil Corp. | | 173,600 | 13,532,120 |
| Kinder Morgan, Inc. | | 28,900 | 431,188 |
| Memorial Resource Development Corp. (a) | | 161,050 | 2,600,958 |
| Noble Energy, Inc. | | 265,113 | 8,730,171 |
| Parsley Energy, Inc. Class A (a) | | 175,000 | 3,228,750 |
| Phillips 66 Co. | | 107,126 | 8,762,907 |
| Pioneer Natural Resources Co. | | 43,700 | 5,479,106 |
| PrairieSky Royalty Ltd. (b) | | 157,734 | 2,498,756 |
| SM Energy Co. | | 133,000 | 2,614,780 |
| Suncor Energy, Inc. | | 256,180 | 6,613,247 |
| | | | 97,934,269 |
|
| TOTAL ENERGY | | | 127,081,751 |
|
| FINANCIALS - 10.3% | | | |
| Banks - 4.3% | | | |
| Bank of America Corp. | | 1,501,587 | 25,271,709 |
| Citigroup, Inc. | | 411,954 | 21,318,620 |
| Comerica, Inc. | | 120,800 | 5,053,064 |
| Huntington Bancshares, Inc. | | 340,630 | 3,767,368 |
| JPMorgan Chase & Co. | | 536,600 | 35,431,698 |
| M&T Bank Corp. | | 53,500 | 6,483,130 |
| Regions Financial Corp. | | 329,500 | 3,163,200 |
| Synovus Financial Corp. | | 79,942 | 2,588,522 |
| U.S. Bancorp | | 366,847 | 15,653,361 |
| Wells Fargo & Co. | | 129,000 | 7,012,440 |
| Zions Bancorporation | | 105,400 | 2,877,420 |
| | | | 128,620,532 |
| Capital Markets - 1.1% | | | |
| Bank of New York Mellon Corp. | | 103,300 | 4,258,026 |
| BlackRock, Inc. Class A | | 21,472 | 7,311,645 |
| E*TRADE Financial Corp. (a) | | 118,800 | 3,521,232 |
| Goldman Sachs Group, Inc. | | 58,300 | 10,507,409 |
| Invesco Ltd. | | 80,112 | 2,682,150 |
| Northern Trust Corp. | | 64,800 | 4,671,432 |
| Oaktree Capital Group LLC Class A | | 15,191 | 724,915 |
| | | | 33,676,809 |
| Consumer Finance - 1.3% | | | |
| Capital One Financial Corp. | | 415,731 | 30,007,464 |
| Imperial Holdings, Inc. warrants 4/11/19 (a) | | 6,565 | 1,213 |
| Navient Corp. | | 343,152 | 3,929,090 |
| OneMain Holdings, Inc. (a) | | 50,500 | 2,097,770 |
| SLM Corp. (a) | | 554,052 | 3,612,419 |
| | | | 39,647,956 |
| Diversified Financial Services - 0.8% | | | |
| Berkshire Hathaway, Inc.: | | | |
| Class A (a) | | 17 | 3,362,600 |
| Class B (a) | | 80,700 | 10,655,628 |
| IntercontinentalExchange, Inc. | | 30,900 | 7,918,434 |
| KBC Ancora | | 38,000 | 1,607,053 |
| PICO Holdings, Inc. (a) | | 48,568 | 501,222 |
| | | | 24,044,937 |
| Insurance - 1.3% | | | |
| Direct Line Insurance Group PLC | | 495,345 | 2,975,718 |
| Fairfax Financial Holdings Ltd. (sub. vtg.) | | 1,300 | 617,174 |
| Marsh & McLennan Companies, Inc. | | 152,833 | 8,474,590 |
| MetLife, Inc. | | 115,091 | 5,548,537 |
| The Chubb Corp. | | 142,600 | 18,914,464 |
| Unum Group | | 58,600 | 1,950,794 |
| WMI Holdings Corp. (a) | | 57 | 148 |
| | | | 38,481,425 |
| Real Estate Investment Trusts - 1.3% | | | |
| Altisource Residential Corp. Class B | | 183,600 | 2,278,476 |
| American Tower Corp. | | 24,800 | 2,404,360 |
| Boston Properties, Inc. | | 34,700 | 4,425,638 |
| Crown Castle International Corp. | | 16,080 | 1,390,116 |
| Digital Realty Trust, Inc. | | 69,000 | 5,217,780 |
| Duke Realty LP | | 155,100 | 3,260,202 |
| Extra Space Storage, Inc. | | 26,400 | 2,328,744 |
| FelCor Lodging Trust, Inc. | | 132,600 | 967,980 |
| Outfront Media, Inc. | | 55,920 | 1,220,734 |
| Store Capital Corp. | | 231,500 | 5,370,800 |
| Sun Communities, Inc. | | 15,400 | 1,055,362 |
| Ventas, Inc. | | 93,000 | 5,247,990 |
| VEREIT, Inc. | | 358,700 | 2,840,904 |
| | | | 38,009,086 |
| Real Estate Management & Development - 0.2% | | | |
| CBRE Group, Inc. (a) | | 137,606 | 4,758,415 |
| Thrifts & Mortgage Finance - 0.0% | | | |
| Washington Mutual, Inc. (a) | | 101,600 | 1 |
|
| TOTAL FINANCIALS | | | 307,239,161 |
|
| HEALTH CARE - 10.0% | | | |
| Biotechnology - 3.1% | | | |
| AbbVie, Inc. | | 214,129 | 12,685,002 |
| Alexion Pharmaceuticals, Inc. (a) | | 57,050 | 10,882,288 |
| Amgen, Inc. | | 137,309 | 22,289,370 |
| Baxalta, Inc. | | 198,200 | 7,735,746 |
| Biogen, Inc. (a) | | 12,591 | 3,857,253 |
| BioMarin Pharmaceutical, Inc. (a) | | 26,100 | 2,734,236 |
| Celgene Corp. (a) | | 120,100 | 14,383,176 |
| Gilead Sciences, Inc. | | 179,883 | 18,202,361 |
| Vertex Pharmaceuticals, Inc. (a) | | 3,600 | 452,988 |
| | | | 93,222,420 |
| Health Care Equipment & Supplies - 2.2% | | | |
| Abbott Laboratories | | 234,400 | 10,526,904 |
| Boston Scientific Corp. (a) | | 838,180 | 15,456,039 |
| Edwards Lifesciences Corp. (a) | | 90,400 | 7,139,792 |
| Medtronic PLC | | 343,656 | 26,434,020 |
| The Cooper Companies, Inc. | | 19,714 | 2,645,619 |
| Wright Medical Group NV (a) | | 127,300 | 3,078,114 |
| | | | 65,280,488 |
| Health Care Providers & Services - 1.9% | | | |
| Brookdale Senior Living, Inc. (a) | | 43,600 | 804,856 |
| Cigna Corp. | | 92,500 | 13,535,525 |
| HCA Holdings, Inc. (a) | | 70,800 | 4,788,204 |
| Henry Schein, Inc. (a) | | 50,124 | 7,929,116 |
| McKesson Corp. | | 57,028 | 11,247,632 |
| UnitedHealth Group, Inc. | | 154,900 | 18,222,436 |
| | | | 56,527,769 |
| Life Sciences Tools & Services - 0.5% | | | |
| Agilent Technologies, Inc. | | 143,300 | 5,991,373 |
| Thermo Fisher Scientific, Inc. | | 70,617 | 10,017,021 |
| | | | 16,008,394 |
| Pharmaceuticals - 2.3% | | | |
| Allergan PLC (a) | | 79,723 | 24,913,438 |
| Bristol-Myers Squibb Co. | | 349,360 | 24,032,474 |
| Endo Health Solutions, Inc. (a) | | 85,600 | 5,240,432 |
| Horizon Pharma PLC (a) | | 149,800 | 3,246,166 |
| Horizon Pharma PLC warrants 9/25/17 (a) | | 164,400 | 2,827,844 |
| Teva Pharmaceutical Industries Ltd. sponsored ADR | | 142,300 | 9,340,572 |
| | | | 69,600,926 |
|
| TOTAL HEALTH CARE | | | 300,639,997 |
|
| INDUSTRIALS - 6.2% | | | |
| Electrical Equipment - 1.5% | | | |
| AMETEK, Inc. | | 818,681 | 43,873,115 |
| SolarCity Corp. (a) | | 40,100 | 2,045,902 |
| | | | 45,919,017 |
| Industrial Conglomerates - 3.1% | | | |
| Danaher Corp. | | 521,318 | 48,420,016 |
| Roper Technologies, Inc. | | 237,681 | 45,109,477 |
| | | | 93,529,493 |
| Machinery - 0.8% | | | |
| WABCO Holdings, Inc. (a) | | 106,584 | 10,899,280 |
| Wabtec Corp. | | 189,397 | 13,469,915 |
| | | | 24,369,195 |
| Professional Services - 0.3% | | | |
| Verisk Analytics, Inc. (a) | | 100,658 | 7,738,587 |
| WageWorks, Inc. (a) | | 10,086 | 457,602 |
| | | | 8,196,189 |
| Road & Rail - 0.4% | | | |
| J.B. Hunt Transport Services, Inc. | | 147,926 | 10,851,851 |
| Trading Companies & Distributors - 0.1% | | | |
| AerCap Holdings NV (a) | | 33,800 | 1,458,808 |
|
| TOTAL INDUSTRIALS | | | 184,324,553 |
|
| INFORMATION TECHNOLOGY - 13.2% | | | |
| Communications Equipment - 0.4% | | | |
| CommScope Holding Co., Inc. (a) | | 25,600 | 662,784 |
| Qualcomm Technologies, Inc. | | 210,008 | 10,497,250 |
| | | | 11,160,034 |
| Electronic Equipment & Components - 0.1% | | | |
| Fitbit, Inc. | | 61,800 | 1,828,662 |
| Samsung SDI Co. Ltd. | | 23,078 | 2,213,486 |
| | | | 4,042,148 |
| Internet Software & Services - 4.5% | | | |
| 58.com, Inc. ADR (a) | | 40,200 | 2,651,592 |
| Alibaba Group Holding Ltd. sponsored ADR (a) | | 279,000 | 22,674,330 |
| Alphabet, Inc.: | | | |
| Class A (a) | | 2,800 | 2,178,428 |
| Class C | | 75,949 | 57,636,172 |
| Box, Inc. Class A (b) | | 150,000 | 2,094,000 |
| Cvent, Inc. (a) | | 178,878 | 6,244,631 |
| Facebook, Inc. Class A (a) | | 261,804 | 27,400,407 |
| Just Dial Ltd. | | 118,064 | 1,496,242 |
| New Relic, Inc. | | 81,800 | 2,979,974 |
| Opower, Inc. (a)(b) | | 296,063 | 3,126,425 |
| Shopify, Inc. Class A | | 2,000 | 51,600 |
| Tencent Holdings Ltd. | | 144,800 | 2,835,182 |
| Velti PLC (a)(c) | | 284,296 | 896 |
| Yahoo!, Inc. (a) | | 126,100 | 4,194,086 |
| | | | 135,563,965 |
| IT Services - 1.3% | | | |
| Alliance Data Systems Corp. (a) | | 8,900 | 2,461,473 |
| ASAC II LP (a)(c) | | 444,553 | 11,825,645 |
| Blackhawk Network Holdings, Inc. (a) | | 125,191 | 5,534,694 |
| Fidelity National Information Services, Inc. | | 55,100 | 3,339,060 |
| Global Payments, Inc. | | 29,200 | 1,883,692 |
| Sabre Corp. | | 117,942 | 3,298,838 |
| The Western Union Co. | | 21,100 | 377,901 |
| Travelport Worldwide Ltd. | | 624,464 | 8,055,586 |
| Worldline SA (a)(d) | | 37,007 | 959,988 |
| | | | 37,736,877 |
| Semiconductors & Semiconductor Equipment - 1.9% | | | |
| Broadcom Corp. Class A | | 59,300 | 3,428,726 |
| Intersil Corp. Class A | | 143,174 | 1,826,900 |
| Marvell Technology Group Ltd. | | 984,800 | 8,685,936 |
| Maxim Integrated Products, Inc. | | 84,354 | 3,205,452 |
| Micron Technology, Inc. (a) | | 271,700 | 3,847,272 |
| NVIDIA Corp. | | 113,500 | 3,740,960 |
| NXP Semiconductors NV (a) | | 104,300 | 8,787,275 |
| Qorvo, Inc. (a) | | 443,465 | 22,572,369 |
| Semtech Corp. (a) | | 79,100 | 1,496,572 |
| | | | 57,591,462 |
| Software - 2.4% | | | |
| Activision Blizzard, Inc. | | 70,400 | 2,725,184 |
| Adobe Systems, Inc. (a) | | 36,931 | 3,469,298 |
| Autodesk, Inc. (a) | | 233,100 | 14,202,783 |
| Electronic Arts, Inc. (a) | | 190,800 | 13,111,776 |
| Fleetmatics Group PLC (a) | | 31,616 | 1,605,777 |
| HubSpot, Inc. (a) | | 12,710 | 715,700 |
| Imperva, Inc. (a) | | 14,519 | 919,198 |
| Microsoft Corp. | | 293,900 | 16,305,572 |
| Mobileye NV (a) | | 10,800 | 456,624 |
| Salesforce.com, Inc. (a) | | 186,500 | 14,621,600 |
| Varonis Systems, Inc. (a) | | 77,732 | 1,461,362 |
| Zendesk, Inc. (a) | | 122,500 | 3,238,900 |
| | | | 72,833,774 |
| Technology Hardware, Storage & Peripherals - 2.6% | | | |
| Apple, Inc. | | 464,611 | 48,904,954 |
| EMC Corp. | | 291,300 | 7,480,584 |
| HP, Inc. | | 798,400 | 9,453,056 |
| SanDisk Corp. | | 84,100 | 6,390,759 |
| Western Digital Corp. | | 71,000 | 4,263,550 |
| | | | 76,492,903 |
|
| TOTAL INFORMATION TECHNOLOGY | | | 395,421,163 |
|
| MATERIALS - 2.6% | | | |
| Chemicals - 2.2% | | | |
| E.I. du Pont de Nemours & Co. | | 151,300 | 10,076,580 |
| Eastman Chemical Co. | | 85,296 | 5,758,333 |
| Ecolab, Inc. | | 237,197 | 27,130,593 |
| LyondellBasell Industries NV Class A | | 43,012 | 3,737,743 |
| Monsanto Co. | | 78,067 | 7,691,161 |
| PPG Industries, Inc. | | 58,400 | 5,771,088 |
| The Dow Chemical Co. | | 70,700 | 3,639,636 |
| W.R. Grace & Co. (a) | | 33,925 | 3,378,591 |
| | | | 67,183,725 |
| Construction Materials - 0.1% | | | |
| Eagle Materials, Inc. | | 42,700 | 2,580,361 |
| Containers & Packaging - 0.3% | | | |
| Graphic Packaging Holding Co. | | 174,298 | 2,236,243 |
| WestRock Co. | | 119,822 | 5,466,280 |
| | | | 7,702,523 |
|
| TOTAL MATERIALS | | | 77,466,609 |
|
| TELECOMMUNICATION SERVICES - 1.4% | | | |
| Diversified Telecommunication Services - 1.4% | | | |
| AT&T, Inc. | | 636,971 | 21,918,172 |
| CenturyLink, Inc. | | 45,708 | 1,150,013 |
| Cogent Communications Group, Inc. | | 42,000 | 1,456,980 |
| Frontier Communications Corp. | | 56,100 | 261,987 |
| inContact, Inc. (a) | | 169,400 | 1,616,076 |
| Level 3 Communications, Inc. (a) | | 74,604 | 4,055,473 |
| Verizon Communications, Inc. | | 238,596 | 11,027,907 |
| | | | 41,486,608 |
| Wireless Telecommunication Services - 0.0% | | | |
| T-Mobile U.S., Inc. (a) | | 9,200 | 359,904 |
| Telephone & Data Systems, Inc. | | 26,000 | 673,140 |
| | | | 1,033,044 |
|
| TOTAL TELECOMMUNICATION SERVICES | | | 42,519,652 |
|
| UTILITIES - 1.8% | | | |
| Electric Utilities - 1.0% | | | |
| Edison International | | 68,805 | 4,073,944 |
| Exelon Corp. | | 306,800 | 8,519,836 |
| FirstEnergy Corp. | | 16,500 | 523,545 |
| NextEra Energy, Inc. | | 103,251 | 10,726,746 |
| PPL Corp. | | 184,650 | 6,302,105 |
| | | | 30,146,176 |
| Independent Power and Renewable Electricity Producers - 0.1% | | | |
| NRG Energy, Inc. | | 150,970 | 1,776,917 |
| NRG Yield, Inc. Class C | | 54,300 | 801,468 |
| | | | 2,578,385 |
| Multi-Utilities - 0.7% | | | |
| Dominion Resources, Inc. | | 105,700 | 7,149,548 |
| DTE Energy Co. | | 6,700 | 537,273 |
| NiSource, Inc. | | 81,300 | 1,586,163 |
| PG&E Corp. | | 98,350 | 5,231,237 |
| Sempra Energy | | 69,095 | 6,495,621 |
| | | | 20,999,842 |
|
| TOTAL UTILITIES | | | 53,724,403 |
|
| TOTAL COMMON STOCKS | | | |
| (Cost $1,732,921,391) | | | 1,957,724,217 |
|
| Convertible Preferred Stocks - 0.0% | | | |
| ENERGY - 0.0% | | | |
| Oil, Gas & Consumable Fuels - 0.0% | | | |
| Southwestern Energy Co. Series B 6.25% | | | |
| (Cost $2,300,000) | | 46,000 | 853,300 |
| | | Principal Amount | Value |
|
| Convertible Bonds - 0.0% | | | |
| ENERGY - 0.0% | | | |
| Oil, Gas & Consumable Fuels - 0.0% | | | |
Amyris, Inc. 3% 2/27/17
(Cost $1,162,000) | | 1,162,000 | 1,062,207 |
|
| U.S. Treasury Obligations - 0.1% | | | |
| U.S. Treasury Bills, yield at date of purchase 0.1% to 0.21% 1/28/16 to 3/3/16 (e) | | | |
| (Cost $1,509,820) | | 1,510,000 | 1,509,838 |
| | | Shares | Value |
|
| Fixed-Income Funds - 32.3% | | | |
| Fidelity High Income Central Fund 2 (f) | | 524,263 | $53,349,035 |
| Fidelity VIP Investment Grade Central Fund (f) | | 8,826,135 | 915,358,433 |
| TOTAL FIXED-INCOME FUNDS | | | |
| (Cost $965,902,801) | | | 968,707,468 |
|
| Money Market Funds - 2.7% | | | |
| Fidelity Cash Central Fund, 0.33% (g) | | 69,372,654 | 69,372,654 |
| Fidelity Securities Lending Cash Central Fund, 0.35% (g)(h) | | 10,962,025 | 10,962,025 |
| TOTAL MONEY MARKET FUNDS | | | |
| (Cost $80,334,679) | | | 80,334,679 |
| TOTAL INVESTMENT PORTFOLIO - 100.4% | | | |
| (Cost $2,784,130,691) | | | 3,010,191,709 |
| NET OTHER ASSETS (LIABILITIES) - (0.4)% | | | (12,385,955) |
| NET ASSETS - 100% | | | $2,997,805,754 |
| Futures Contracts | | | |
| | Expiration Date | Underlying Face Amount at Value | Unrealized Appreciation/(Depreciation) |
| Purchased | | | |
| Equity Index Contracts | | | |
| 306 CME E-mini S&P 500 Index Contracts (United States) | March 2016 | 31,141,620 | $470,072 |
The face value of futures purchased as a percentage of Net Assets is 1.0%
Legend
(a) Non-income producing
(b) Security or a portion of the security is on loan at period end.
(c) Restricted securities - Investment in securities not registered under the Securities Act of 1933 (excluding 144A issues). At the end of the period, the value of restricted securities (excluding 144A issues) amounted to $11,826,541 or 0.4% of net assets.
(d) Security exempt from registration under Rule 144A of the Securities Act of 1933. These securities may be resold in transactions exempt from registration, normally to qualified institutional buyers. At the end of the period, the value of these securities amounted to $959,988 or 0.0% of net assets.
(e) Security or a portion of the security was pledged to cover margin requirements for futures contracts. At period end, the value of securities pledged amounted to $1,509,838.
(f) Affiliated fund that is generally available only to investment companies and other accounts managed by Fidelity Investments. A complete unaudited schedule of portfolio holdings for each Fidelity Central Fund is filed with the SEC for the first and third quarters of each fiscal year on Form N-Q and is available upon request or at the SEC's website at www.sec.gov. An unaudited holdings listing for the Fund, which presents direct holdings as well as the pro-rata share of securities and other investments held indirectly through its investment in underlying non-money market Fidelity Central Funds is available at advisor.fidelity.com. In addition, each Fidelity Central Fund's financial statements, which are not covered by the Fund's Report of Independent Registered Public Accounting Firm, are available on the SEC's website or upon request.
(g) Affiliated fund that is generally available only to investment companies and other accounts managed by Fidelity Investments. The rate quoted is the annualized seven-day yield of the fund at period end. A complete unaudited listing of the fund's holdings as of its most recent quarter end is available upon request. In addition, each Fidelity Central Fund's financial statements, which are not covered by the Fund's Report of Independent Registered Public Accounting Firm, are available on the SEC's website or upon request.
(h) Investment made with cash collateral received from securities on loan.
Additional information on each restricted holding is as follows:
| Security | Acquisition Date | Acquisition Cost |
| ASAC II LP | 10/10/13 | $4,445,530 |
| Velti PLC | 4/19/13 | $426,444 |
Affiliated Central Funds
Information regarding fiscal year to date income earned by the Fund from investments in Fidelity Central Funds is as follows:
| Fund | Income earned |
| Fidelity Cash Central Fund | $116,909 |
| Fidelity High Income Central Fund 2 | 3,484,555 |
| Fidelity Securities Lending Cash Central Fund | 65,592 |
| Fidelity VIP Investment Grade Central Fund | 26,259,382 |
| Total | $29,926,438 |
Additional information regarding the Fund's fiscal year to date purchases and sales, including the ownership percentage, of the non Money Market Central Funds is as follows:
| Fund | Value, beginning of period | Purchases | Sales Proceeds | Value, end of period | % ownership, end of period |
| Fidelity High Income Central Fund 2 | $55,811,727 | $3,484,739 | $-- | $53,349,035 | 7.2% |
| Fidelity VIP Investment Grade Central Fund | 761,872,397 | 179,469,042 | -- | 915,358,433 | 19.8% |
| Total | $817,684,124 | $182,953,781 | $-- | $968,707,468 | |
Investment Valuation
The following is a summary of the inputs used, as of December 31, 2015, involving the Fund's assets and liabilities carried at fair value. The inputs or methodology used for valuing securities may not be an indication of the risk associated with investing in those securities. For more information on valuation inputs, and their aggregation into the levels used below, please refer to the Investment Valuation section in the accompanying Notes to Financial Statements.
| | Valuation Inputs at Reporting Date: |
| Description | Total | Level 1 | Level 2 | Level 3 |
| Investments in Securities: | | | | |
| Equities: | | | | |
| Consumer Discretionary | $273,127,400 | $273,127,400 | $-- | $-- |
| Consumer Staples | 196,179,528 | 195,681,739 | 497,789 | -- |
| Energy | 127,935,051 | 127,935,051 | -- | -- |
| Financials | 307,239,161 | 307,237,947 | 1,213 | 1 |
| Health Care | 300,639,997 | 297,812,153 | 2,827,844 | -- |
| Industrials | 184,324,553 | 184,324,553 | -- | -- |
| Information Technology | 395,421,163 | 377,049,712 | 6,545,806 | 11,825,645 |
| Materials | 77,466,609 | 77,466,609 | -- | -- |
| Telecommunication Services | 42,519,652 | 42,519,652 | -- | -- |
| Utilities | 53,724,403 | 53,724,403 | -- | -- |
| Corporate Bonds | 1,062,207 | -- | 1,062,207 | -- |
| U.S. Government and Government Agency Obligations | 1,509,838 | -- | 1,509,838 | -- |
| Fixed-Income Funds | 968,707,468 | 968,707,468 | -- | -- |
| Money Market Funds | 80,334,679 | 80,334,679 | -- | -- |
| Total Investments in Securities: | $3,010,191,709 | $2,985,921,366 | $12,444,697 | $11,825,646 |
| Derivative Instruments: | | | | |
| Assets | | | | |
| Futures Contracts | $470,072 | $470,072 | $-- | $-- |
| Total Assets | $470,072 | $470,072 | $-- | $-- |
| Total Derivative Instruments: | $470,072 | $470,072 | $-- | $-- |
Value of Derivative Instruments
The following table is a summary of the Fund's value of derivative instruments by primary risk exposure as of December 31, 2015. For additional information on derivative instruments, please refer to the Derivative Instruments section in the accompanying Notes to Financial Statements.
| Primary Risk Exposure / Derivative Type | Value |
| | Asset | Liability |
| Equity Risk | | |
| Futures Contracts(a) | $470,072 | $0 |
| Total Equity Risk | $470,072 | $0 |
| Total Value of Derivatives | $470,072 | $0 |
(a) Reflects gross cumulative appreciation (depreciation) on futures contracts as presented in the Schedule of Investments. Only the period end receivable or payable for daily variation margin and net unrealized appreciation (depreciation) are presented in the Statement of Assets and Liabilities.
Other Information
The composition of credit quality ratings as a percentage of Total Net Assets is as follows (Unaudited):
The information in the following tables is based on the combined investments of the Fund and its pro-rata share of the investments of Fidelity's Fixed-Income Central Funds.
| U.S. Government and U.S. Government Agency Obligations | 10.3% |
| AAA,AA,A | 6.0% |
| BBB | 11.2% |
| BB | 2.7% |
| B | 0.8% |
| CCC,CC,C | 0.5% |
| D | 0.0% |
| Not Rated | 0.0% |
| Equities | 65.3% |
| Short-Term Investments and Net Other Assets | 3.2% |
We have used ratings from Moody's Investors Service, Inc. Where Moody's® ratings are not available, we have used S&P® ratings. All ratings are as of the date indicated and do not reflect subsequent changes. Percentages are adjusted for the effect of futures contracts, if applicable.
Percentages shown as 0.0% may reflect amounts less than 0.05%.
Distribution of investments by country or territory of incorporation, as a percentage of Total Net Assets, is as follows (Unaudited):
| United States of America | 86.7% |
| United Kingdom | 2.9% |
| Ireland | 2.3% |
| Cayman Islands | 1.3% |
| Netherlands | 1.2% |
| Canada | 1.0% |
| Others (Individually Less Than 1%) | 4.6% |
| | 100.0% |
See accompanying notes which are an integral part of the financial statements.
Financial Statements
Statement of Assets and Liabilities
| | | December 31, 2015 |
| Assets | | |
Investment in securities, at value (including securities loaned of $10,667,499) — See accompanying schedule:
Unaffiliated issuers (cost $1,737,893,211) | $1,961,149,562 | |
| Fidelity Central Funds (cost $1,046,237,480) | 1,049,042,147 | |
| Total Investments (cost $2,784,130,691) | | $3,010,191,709 |
| Cash | | 80,524 |
| Receivable for investments sold | | 1,345,957 |
| Receivable for fund shares sold | | 1,013,989 |
| Dividends receivable | | 2,426,444 |
| Interest receivable | | 64,297 |
| Distributions receivable from Fidelity Central Funds | | 35,310 |
| Prepaid expenses | | 6,072 |
| Other receivables | | 29,344 |
| Total assets | | 3,015,193,646 |
| Liabilities | | |
| Payable for investments purchased | $3,948,446 | |
| Payable for fund shares redeemed | 583,545 | |
| Accrued management fee | 997,909 | |
| Distribution and service plan fees payable | 117,168 | |
| Payable for daily variation margin for derivative instruments | 293,760 | |
| Other affiliated payables | 411,882 | |
| Other payables and accrued expenses | 73,157 | |
| Collateral on securities loaned, at value | 10,962,025 | |
| Total liabilities | | 17,387,892 |
| Net Assets | | $2,997,805,754 |
| Net Assets consist of: | | |
| Paid in capital | | $2,719,421,110 |
| Undistributed net investment income | | 211 |
| Accumulated undistributed net realized gain (loss) on investments and foreign currency transactions | | 51,865,519 |
| Net unrealized appreciation (depreciation) on investments and assets and liabilities in foreign currencies | | 226,518,914 |
| Net Assets | | $2,997,805,754 |
| Initial Class: | | |
| Net Asset Value, offering price and redemption price per share ($212,588,727 ÷ 13,064,918 shares) | | $16.27 |
| Service Class: | | |
| Net Asset Value, offering price and redemption price per share ($4,618,775 ÷ 285,168 shares) | | $16.20 |
| Service Class 2: | | |
| Net Asset Value, offering price and redemption price per share ($555,924,021 ÷ 34,864,030 shares) | | $15.95 |
| Investor Class: | | |
| Net Asset Value, offering price and redemption price per share ($2,224,674,231 ÷ 137,675,811 shares) | | $16.16 |
See accompanying notes which are an integral part of the financial statements.
Statement of Operations
| | | Year ended December 31, 2015 |
| Investment Income | | |
| Dividends | | $30,564,496 |
| Interest | | 35,458 |
| Income from Fidelity Central Funds | | 29,926,438 |
| Total income | | 60,526,392 |
| Expenses | | |
| Management fee | $11,804,712 | |
| Transfer agent fees | 3,735,108 | |
| Distribution and service plan fees | 1,388,216 | |
| Accounting and security lending fees | 1,116,392 | |
| Custodian fees and expenses | 110,465 | |
| Independent trustees' compensation | 12,588 | |
| Audit | 73,775 | |
| Legal | 9,658 | |
| Miscellaneous | 19,301 | |
| Total expenses before reductions | 18,270,215 | |
| Expense reductions | (158,323) | 18,111,892 |
| Net investment income (loss) | | 42,414,500 |
| Realized and Unrealized Gain (Loss) | | |
| Net realized gain (loss) on: | | |
| Investment securities: | | |
| Unaffiliated issuers | 83,159,547 | |
| Foreign currency transactions | (36,038) | |
| Futures contracts | (303,549) | |
| Capital gain distributions from Fidelity Central Funds | 650,697 | |
| Total net realized gain (loss) | | 83,470,657 |
Change in net unrealized appreciation (depreciation) on:
Investment securities | (115,759,010) | |
| Assets and liabilities in foreign currencies | (1,343) | |
| Futures contracts | (135,318) | |
| Total change in net unrealized appreciation (depreciation) | | (115,895,671) |
| Net gain (loss) | | (32,425,014) |
| Net increase (decrease) in net assets resulting from operations | | $9,989,486 |
See accompanying notes which are an integral part of the financial statements.
Statement of Changes in Net Assets
| | Year ended December 31, 2015 | Year ended December 31, 2014 |
| Increase (Decrease) in Net Assets | | |
| Operations | | |
| Net investment income (loss) | $42,414,500 | $39,537,330 |
| Net realized gain (loss) | 83,470,657 | 107,087,350 |
| Change in net unrealized appreciation (depreciation) | (115,895,671) | 104,341,441 |
| Net increase (decrease) in net assets resulting from operations | 9,989,486 | 250,966,121 |
| Distributions to shareholders from net investment income | (44,291,936) | (38,454,695) |
| Distributions to shareholders from net realized gain | (85,979,865) | (312,248,296) |
| Total distributions | (130,271,801) | (350,702,991) |
| Share transactions - net increase (decrease) | 319,786,548 | 467,558,758 |
| Total increase (decrease) in net assets | 199,504,233 | 367,821,888 |
| Net Assets | | |
| Beginning of period | 2,798,301,521 | 2,430,479,633 |
| End of period (including undistributed net investment income of $211 and undistributed net investment income of $1,333,947, respectively) | $2,997,805,754 | $2,798,301,521 |
See accompanying notes which are an integral part of the financial statements.
Financial Highlights — VIP Balanced Portfolio Initial Class
| | | | | | |
| Years ended December 31, | 2015 | 2014 | 2013 | 2012 | 2011 |
| Selected Per–Share Data | | | | | |
| Net asset value, beginning of period | $16.93 | $17.76 | $15.76 | $14.63 | $15.50 |
| Income from Investment Operations | | | | | |
| Net investment income (loss)A | .26 | .27 | .26 | .26 | .26 |
| Net realized and unrealized gain (loss) | (.16) | 1.37 | 2.76 | 1.91 | (.83) |
| Total from investment operations | .10 | 1.64 | 3.02 | 2.17 | (.57) |
| Distributions from net investment income | (.26) | (.25) | (.27) | (.26)B | (.26) |
| Distributions from net realized gain | (.50) | (2.22) | (.76) | (.78)B | (.04) |
| Total distributions | (.76) | (2.47) | (1.02)C | (1.04) | (.30) |
| Net asset value, end of period | $16.27 | $16.93 | $17.76 | $15.76 | $14.63 |
| Total ReturnD,E | .59% | 10.26% | 19.66% | 15.07% | (3.61)% |
| Ratios to Average Net AssetsF,G | | | | | |
| Expenses before reductions | .51% | .51% | .53% | .54% | .54% |
| Expenses net of fee waivers, if any | .51% | .51% | .52% | .54% | .54% |
| Expenses net of all reductions | .51% | .51% | .52% | .53% | .53% |
| Net investment income (loss) | 1.54% | 1.63% | 1.54% | 1.69% | 1.67% |
| Supplemental Data | | | | | |
| Net assets, end of period (000 omitted) | $212,589 | $220,897 | $207,796 | $178,915 | $171,959 |
| Portfolio turnover rateH | 54% | 56% | 95% | 48% | 47% |
A Calculated based on average shares outstanding during the period.
B The amounts shown reflect certain reclassifications related to book to tax differences that were made in the year shown.
C Total distributions of $1.02 per share is comprised of distributions from net investment income of $.268 and distributions from net realized gain of $.755 per share.
D Total returns do not reflect charges attributable to your insurance company's separate account. Inclusion of these charges would reduce the total returns shown.
E Total returns would have been lower if certain expenses had not been reduced during the applicable periods shown.
F Fees and expenses of any underlying Fidelity Central Funds are not included in the Fund's expense ratio. The Fund indirectly bears its proportionate share of the expenses of any underlying Fidelity Central Funds. Based on their most recent shareholder report date, the expenses of any underlying non-money market Fidelity Central Funds were less than .005%.
G Expense ratios reflect operating expenses of the class. Expenses before reductions do not reflect amounts reimbursed by the investment adviser or reductions from brokerage service arrangements or reductions from other expense offset arrangements and do not represent the amount paid by the class during periods when reimbursements or reductions occur. Expenses net of fee waivers reflect expenses after reimbursement by the investment adviser but prior to reductions from brokerage service arrangements or other expense offset arrangements. Expenses net of all reductions represent the net expenses paid by the class.
H Amount does not include the portfolio activity of any underlying Fidelity Central Funds.
See accompanying notes which are an integral part of the financial statements.
Financial Highlights — VIP Balanced Portfolio Service Class
| | | | | | |
| Years ended December 31, | 2015 | 2014 | 2013 | 2012 | 2011 |
| Selected Per–Share Data | | | | | |
| Net asset value, beginning of period | $16.86 | $17.70 | $15.71 | $14.58 | $15.45 |
| Income from Investment Operations | | | | | |
| Net investment income (loss)A | .24 | .25 | .24 | .24 | .24 |
| Net realized and unrealized gain (loss) | (.15) | 1.36 | 2.75 | 1.91 | (.83) |
| Total from investment operations | .09 | 1.61 | 2.99 | 2.15 | (.59) |
| Distributions from net investment income | (.25) | (.23) | (.24) | (.23)B | (.24) |
| Distributions from net realized gain | (.50) | (2.22) | (.76) | (.78)B | (.04) |
| Total distributions | (.75) | (2.45) | (1.00) | (1.02)C | (.28) |
| Net asset value, end of period | $16.20 | $16.86 | $17.70 | $15.71 | $14.58 |
| Total ReturnD,E | .51% | 10.09% | 19.50% | 14.95% | (3.78)% |
| Ratios to Average Net AssetsF,G | | | | | |
| Expenses before reductions | .62% | .65% | .66% | .67% | .67% |
| Expenses net of fee waivers, if any | .61% | .65% | .66% | .67% | .67% |
| Expenses net of all reductions | .61% | .65% | .66% | .67% | .67% |
| Net investment income (loss) | 1.43% | 1.50% | 1.41% | 1.55% | 1.54% |
| Supplemental Data | | | | | |
| Net assets, end of period (000 omitted) | $4,619 | $3,267 | $3,474 | $3,548 | $3,930 |
| Portfolio turnover rateH | 54% | 56% | 95% | 48% | 47% |
A Calculated based on average shares outstanding during the period.
B The amounts shown reflect certain reclassifications related to book to tax differences that were made in the year shown.
C Total distributions of $1.02 per share is comprised of distributions from net investment income of $.232 and distributions from net realized gain of $.784 per share.
D Total returns do not reflect charges attributable to your insurance company's separate account. Inclusion of these charges would reduce the total returns shown.
E Total returns would have been lower if certain expenses had not been reduced during the applicable periods shown.
F Fees and expenses of any underlying Fidelity Central Funds are not included in the Fund's expense ratio. The Fund indirectly bears its proportionate share of the expenses of any underlying Fidelity Central Funds. Based on their most recent shareholder report date, the expenses of any underlying non-money market Fidelity Central Funds were less than .005%.
G Expense ratios reflect operating expenses of the class. Expenses before reductions do not reflect amounts reimbursed by the investment adviser or reductions from brokerage service arrangements or reductions from other expense offset arrangements and do not represent the amount paid by the class during periods when reimbursements or reductions occur. Expenses net of fee waivers reflect expenses after reimbursement by the investment adviser but prior to reductions from brokerage service arrangements or other expense offset arrangements. Expenses net of all reductions represent the net expenses paid by the class.
H Amount does not include the portfolio activity of any underlying Fidelity Central Funds.
See accompanying notes which are an integral part of the financial statements.
Financial Highlights — VIP Balanced Portfolio Service Class 2
| | | | | | |
| Years ended December 31, | 2015 | 2014 | 2013 | 2012 | 2011 |
| Selected Per–Share Data | | | | | |
| Net asset value, beginning of period | $16.61 | $17.47 | $15.53 | $14.43 | $15.29 |
| Income from Investment Operations | | | | | |
| Net investment income (loss)A | .21 | .23 | .21 | .22 | .22 |
| Net realized and unrealized gain (loss) | (.15) | 1.34 | 2.71 | 1.89 | (.81) |
| Total from investment operations | .06 | 1.57 | 2.92 | 2.11 | (.59) |
| Distributions from net investment income | (.22) | (.22) | (.23) | (.22)B | (.23) |
| Distributions from net realized gain | (.50) | (2.22) | (.76) | (.78)B | (.04) |
| Total distributions | (.72) | (2.43)C | (.98)D | (1.01)E | (.27) |
| Net asset value, end of period | $15.95 | $16.61 | $17.47 | $15.53 | $14.43 |
| Total ReturnF,G | .36% | 10.02% | 19.28% | 14.82% | (3.83)% |
| Ratios to Average Net AssetsH,I | | | | | |
| Expenses before reductions | .76% | .76% | .78% | .78% | .79% |
| Expenses net of fee waivers, if any | .76% | .76% | .77% | .78% | .79% |
| Expenses net of all reductions | .76% | .76% | .77% | .78% | .78% |
| Net investment income (loss) | 1.29% | 1.38% | 1.29% | 1.44% | 1.43% |
| Supplemental Data | | | | | |
| Net assets, end of period (000 omitted) | $555,924 | $521,880 | $436,060 | $353,711 | $290,719 |
| Portfolio turnover rateJ | 54% | 56% | 95% | 48% | 47% |
A Calculated based on average shares outstanding during the period.
B The amounts shown reflect certain reclassifications related to book to tax differences that were made in the year shown.
C Total distributions of $2.43 per share is comprised of distributions from net investment income of $.216 and distributions from net realized gain of $2.217 per share.
D Total distributions of $.98 per share is comprised of distributions from net investment income of $.227 and distributions from net realized gain of $.755 per share.
E Total distributions of $1.01 per share is comprised of distributions from net investment income of $.221 and distributions from net realized gain of $.784 per share.
F Total returns do not reflect charges attributable to your insurance company's separate account. Inclusion of these charges would reduce the total returns shown.
G Total returns would have been lower if certain expenses had not been reduced during the applicable periods shown.
H Fees and expenses of any underlying Fidelity Central Funds are not included in the Fund's expense ratio. The Fund indirectly bears its proportionate share of the expenses of any underlying Fidelity Central Funds. Based on their most recent shareholder report date, the expenses of any underlying non-money market Fidelity Central Funds were less than .005%.
I Expense ratios reflect operating expenses of the class. Expenses before reductions do not reflect amounts reimbursed by the investment adviser or reductions from brokerage service arrangements or reductions from other expense offset arrangements and do not represent the amount paid by the class during periods when reimbursements or reductions occur. Expenses net of fee waivers reflect expenses after reimbursement by the investment adviser but prior to reductions from brokerage service arrangements or other expense offset arrangements. Expenses net of all reductions represent the net expenses paid by the class.
J Amount does not include the portfolio activity of any underlying Fidelity Central Funds.
See accompanying notes which are an integral part of the financial statements.
Financial Highlights — VIP Balanced Portfolio Investor Class
| | | | | | |
| Years ended December 31, | 2015 | 2014 | 2013 | 2012 | 2011 |
| Selected Per–Share Data | | | | | |
| Net asset value, beginning of period | $16.82 | $17.66 | $15.68 | $14.56 | $15.43 |
| Income from Investment Operations | | | | | |
| Net investment income (loss)A | .24 | .26 | .25 | .25 | .24 |
| Net realized and unrealized gain (loss) | (.15) | 1.36 | 2.74 | 1.90 | (.82) |
| Total from investment operations | .09 | 1.62 | 2.99 | 2.15 | (.58) |
| Distributions from net investment income | (.25) | (.24) | (.26) | (.24)B | (.25) |
| Distributions from net realized gain | (.50) | (2.22) | (.76) | (.78)B | (.04) |
| Total distributions | (.75) | (2.46) | (1.01)C | (1.03)D | (.29) |
| Net asset value, end of period | $16.16 | $16.82 | $17.66 | $15.68 | $14.56 |
| Total ReturnE,F | .52% | 10.18% | 19.54% | 14.99% | (3.71)% |
| Ratios to Average Net AssetsG,H | | | | | |
| Expenses before reductions | .59% | .59% | .61% | .62% | .62% |
| Expenses net of fee waivers, if any | .59% | .59% | .60% | .62% | .62% |
| Expenses net of all reductions | .59% | .59% | .60% | .61% | .62% |
| Net investment income (loss) | 1.46% | 1.55% | 1.46% | 1.61% | 1.59% |
| Supplemental Data | | | | | |
| Net assets, end of period (000 omitted) | $2,224,674 | $2,052,258 | $1,783,149 | $1,417,431 | $1,264,520 |
| Portfolio turnover rateI | 54% | 56% | 95% | 48% | 47% |
A Calculated based on average shares outstanding during the period.
B The amounts shown reflect certain reclassifications related to book to tax differences that were made in the year shown.
C Total distributions of $1.01 per share is comprised of distributions from net investment income of $.255 and distributions from net realized gain of $.755 per share.
D Total distributions of $1.03 per share is comprised of distributions from net investment income of $.244 and distributions from net realized gain of $.784 per share.
E Total returns do not reflect charges attributable to your insurance company's separate account. Inclusion of these charges would reduce the total returns shown.
F Total returns would have been lower if certain expenses had not been reduced during the applicable periods shown.
G Fees and expenses of any underlying Fidelity Central Funds are not included in the Fund's expense ratio. The Fund indirectly bears its proportionate share of the expenses of any underlying Fidelity Central Funds. Based on their most recent shareholder report date, the expenses of any underlying non-money market Fidelity Central Funds were less than .005%.
H Expense ratios reflect operating expenses of the class. Expenses before reductions do not reflect amounts reimbursed by the investment adviser or reductions from brokerage service arrangements or reductions from other expense offset arrangements and do not represent the amount paid by the class during periods when reimbursements or reductions occur. Expenses net of fee waivers reflect expenses after reimbursement by the investment adviser but prior to reductions from brokerage service arrangements or other expense offset arrangements. Expenses net of all reductions represent the net expenses paid by the class.
I Amount does not include the portfolio activity of any underlying Fidelity Central Funds.
See accompanying notes which are an integral part of the financial statements.
Notes to Financial Statements
For the period ended December 31, 2015
1. Organization.
VIP Balanced Portfolio (the Fund) is a fund of Variable Insurance Products Fund III (the Trust) and is authorized to issue an unlimited number of shares. The Trust is registered under the Investment Company Act of 1940, as amended (the 1940 Act), as an open-end management investment company organized as a Massachusetts business trust. Shares of the Fund may only be purchased by insurance companies for the purpose of funding variable annuity or variable life insurance contracts. The Fund offers the following classes of shares: Initial Class shares, Service Class shares, Service Class 2 shares and Investor Class shares. All classes have equal rights and voting privileges, except for matters affecting a single class.
2. Investments in Fidelity Central Funds.
The Fund invests in Fidelity Central Funds, which are open-end investment companies generally available only to other investment companies and accounts managed by the investment adviser and its affiliates. The Fund's Schedule of Investments lists each of the Fidelity Central Funds held as of period end, if any, as an investment of the Fund, but does not include the underlying holdings of each Fidelity Central Fund. As an Investing Fund, the Fund indirectly bears its proportionate share of the expenses of the underlying Fidelity Central Funds.
Based on its investment objective, each Fidelity Central Fund may invest or participate in various investment vehicles or strategies that are similar to those of the Fund. These strategies are consistent with the investment objectives of the Fund and may involve certain economic risks which may cause a decline in value of each of the Fidelity Central Funds and thus a decline in the value of the Fund. The Money Market Central Funds seek preservation of capital and current income and are managed by Fidelity Investments Money Management, Inc. (FIMM), an affiliate of the investment adviser. Annualized expenses of the Money Market Central Funds as of their most recent shareholder report date are less than .005%.The following summarizes the Fund's investment in each non-money market Fidelity Central Fund.
| Fidelity Central Fund | Investment Manager | Investment Objective | Investment Practices | Expense Ratio(a) |
| Fidelity High Income Central Fund 2 | FMR Co., Inc. (FMRC) | Seeks a high level of income and may also seek capital appreciation by investing primarily in debt securities, preferred stocks, and convertible securities, with an emphasis on lower-quality debt securities. | Loans & Direct Debt Instruments
Restricted Securities
| Less than .005% |
| Fidelity VIP Investment Grade Central Fund | FIMM | Seeks a high level of current income by normally investing in investment-grade debt securities and repurchase agreements. | Delayed Delivery & When Issued Securities
Futures
Repurchase Agreements
Restricted Securities
Swaps | Less than .005% |
(a) Expenses expressed as a percentage of average net assets and are as of each underlying Central Fund's most recent annual or semi-annual shareholder report.
An unaudited holdings listing for the Fund, which presents direct holdings as well as the pro-rata share of any securities and other investments held indirectly through each Fund's investment in underlying non-money market Fidelity Central Funds, is available at advisor.fidelity.com. A complete unaudited list of holdings for each Fidelity Central Fund is available upon request or at the Securities and Exchange Commission (the SEC) website at www.sec.gov. In addition, the financial statements of the Fidelity Central Funds which contain the significant accounting policies (including investment valuation policies) of those funds, which are not covered by the Fund's Report of Independent Registered Public Accounting Firm, are available on the SEC website or upon request.
3. Significant Accounting Policies.
The financial statements have been prepared in conformity with accounting principles generally accepted in the United States of America (GAAP), which require management to make certain estimates and assumptions at the date of the financial statements. Actual results could differ from those estimates. Subsequent events, if any, through the date that the financial statements were issued have been evaluated in the preparation of the financial statements. The following summarizes the significant accounting policies of the Fund:
Investment Valuation. Investments are valued as of 4:00 p.m. Eastern time on the last calendar day of the period. The Board of Trustees (the Board) has delegated the day to day responsibility for the valuation of the Fund's investments to the Fidelity Management & Research Company (FMR) Fair Value Committee (the Committee). In accordance with valuation policies and procedures approved by the Board, the Fund attempts to obtain prices from one or more third party pricing vendors or brokers to value its investments. When current market prices, quotations or currency exchange rates are not readily available or reliable, investments will be fair valued in good faith by the Committee, in accordance with procedures adopted by the Board. Factors used in determining fair value vary by investment type and may include market or investment specific events, changes in interest rates and credit quality. The frequency with which these procedures are used cannot be predicted and they may be utilized to a significant extent. The Committee oversees the Fund's valuation policies and procedures and reports to the Board on the Committee's activities and fair value determinations. The Board monitors the appropriateness of the procedures used in valuing the Fund's investments and ratifies the fair value determinations of the Committee.
The Fund categorizes the inputs to valuation techniques used to value its investments into a disclosure hierarchy consisting of three levels as shown below:
- Level 1 – quoted prices in active markets for identical investments
- Level 2 – other significant observable inputs (including quoted prices for similar investments, interest rates, prepayment speeds, etc.)
- Level 3 – unobservable inputs (including the Fund's own assumptions based on the best information available)
Valuation techniques used to value the Fund's investments by major category are as follows:
Equity securities, including restricted securities, for which market quotations are readily available, are valued at the last reported sale price or official closing price as reported by a third party pricing vendor on the primary market or exchange on which they are traded and are categorized as Level 1 in the hierarchy. In the event there were no sales during the day or closing prices are not available, securities are valued at the last quoted bid price or may be valued using the last available price and are generally categorized as Level 2 in the hierarchy. For foreign equity securities, when market or security specific events arise, comparisons to the valuation of American Depositary Receipts (ADRs), futures contracts, Exchange-Traded Funds (ETFs) and certain indexes as well as quoted prices for similar securities may be used and would be categorized as Level 2 in the hierarchy. Utilizing these techniques may result in transfers between Level 1 and Level 2. For equity securities, including restricted securities, where observable inputs are limited, assumptions about market activity and risk are used and these securities may be categorized as Level 3 in the hierarchy.
Debt securities, including restricted securities, are valued based on evaluated prices received from third party pricing vendors or from brokers who make markets in such securities. Corporate bonds and U.S. government and government agency obligations are valued by pricing vendors who utilize matrix pricing which considers yield or price of bonds of comparable quality, coupon, maturity and type or by broker-supplied prices. When independent prices are unavailable or unreliable, debt securities may be valued utilizing pricing methodologies which consider similar factors that would be used by third party pricing vendors. Debt securities are generally categorized as Level 2 in the hierarchy but may be Level 3 depending on the circumstances.
Futures contracts are valued at the settlement price established each day by the board of trade or exchange on which they are traded and are categorized as Level 1 in the hierarchy. Investments in open-end mutual funds, including the Fidelity Central Funds, are valued at their closing net asset value (NAV) each business day and are categorized as Level 1 in the hierarchy.
Changes in valuation techniques may result in transfers in or out of an assigned level within the disclosure hierarchy. The aggregate value of investments by input level as of December 31, 2015, is included at the end of the Fund's Schedule of Investments.
Foreign Currency. The Fund may use foreign currency contracts to facilitate transactions in foreign-denominated securities. Gains and losses from these transactions may arise from changes in the value of the foreign currency or if the counterparties do not perform under the contracts' terms.
Foreign-denominated assets, including investment securities, and liabilities are translated into U.S. dollars at the exchange rates at period end. Purchases and sales of investment securities, income and dividends received and expenses denominated in foreign currencies are translated into U.S. dollars at the exchange rate in effect on the transaction date.
The effects of exchange rate fluctuations on investments are included with the net realized and unrealized gain (loss) on investment securities. Other foreign currency transactions resulting in realized and unrealized gain (loss) are disclosed separately.
Investment Transactions and Income. For financial reporting purposes, the Fund's investment holdings and NAV include trades executed through the end of the last business day of the period. The NAV per share for processing shareholder transactions is calculated as of the close of business of the New York Stock Exchange (NYSE), normally 4:00 p.m. Eastern time and includes trades executed through the end of the prior business day. Gains and losses on securities sold are determined on the basis of identified cost and may include proceeds received from litigation. Dividend income is recorded on the ex-dividend date, except for certain dividends from foreign securities where the ex-dividend date may have passed, which are recorded as soon as the Fund is informed of the ex-dividend date. Non-cash dividends included in dividend income, if any, are recorded at the fair market value of the securities received. Income and capital gain distributions from Fidelity Central Funds, if any, are recorded on the ex-dividend date. Distributions received on securities that represent a return of capital or capital gain are recorded as a reduction of cost of investments and/or as a realized gain. Subsequent to ex-dividend date the Fund determines the components of these distributions, based upon receipt of tax filings or other correspondence relating to the underlying investment. Interest income is accrued as earned and includes coupon interest and amortization of premium and accretion of discount on debt securities as applicable. Investment income is recorded net of foreign taxes withheld where recovery of such taxes is uncertain. Debt obligations may be placed on non-accrual status and related interest income may be reduced by ceasing current accruals and writing off interest receivables when the collection of all or a portion of interest has become doubtful based on consistently applied procedures. A debt obligation is removed from non-accrual status when the issuer resumes interest payments or when collectability of interest is reasonably assured.
Class Allocations and Expenses. Investment income, realized and unrealized capital gains and losses, common expenses of the Fund, and certain fund-level expense reductions, if any, are allocated daily on a pro-rata basis to each class based on the relative net assets of each class to the total net assets of the Fund. Each class differs with respect to transfer agent and distribution and service plan fees incurred. Certain expense reductions may also differ by class. For the reporting period, the allocated portion of income and expenses to each class as a percent of its average net assets may vary due to the timing of recording these transactions in relation to fluctuating net assets of the classes. Expenses directly attributable to a fund are charged to that fund. Expenses attributable to more than one fund are allocated among the respective funds on the basis of relative net assets or other appropriate methods. Expense estimates are accrued in the period to which they relate and adjustments are made when actual amounts are known.
Income Tax Information and Distributions to Shareholders. Each year, the Fund intends to qualify as a regulated investment company under Subchapter M of the Internal Revenue Code, including distributing substantially all of its taxable income and realized gains. As a result, no provision for U.S. Federal income taxes is required. As of December 31, 2015, the Fund did not have any unrecognized tax benefits in the financial statements; nor is the Fund aware of any tax positions for which it is reasonably possible that the total amounts of unrecognized tax benefits will significantly change in the next twelve months. The Fund files a U.S. federal tax return, in addition to state and local tax returns as required. The Fund's federal income tax returns are subject to examination by the Internal Revenue Service (IRS) for a period of three fiscal years after they are filed. State and local tax returns may be subject to examination for an additional fiscal year depending on the jurisdiction. Foreign taxes are provided for based on the Fund's understanding of the tax rules and rates that exist in the foreign markets in which it invests.
Distributions are declared and recorded on the ex-dividend date. Income dividends and capital gain distributions are declared separately for each class. Income and capital gain distributions are determined in accordance with income tax regulations, which may differ from GAAP.
Capital accounts within the financial statements are adjusted for permanent book-tax differences. These adjustments have no impact on net assets or the results of operations. Capital accounts are not adjusted for temporary book-tax differences which will reverse in a subsequent period.
Book-tax differences are primarily due to short-term gain distributions from the Fidelity Centrals Funds, futures contracts, foreign currency transactions, passive foreign investment companies (PFIC), market discount, partnerships (including allocations from Fidelity Central Funds), in-kind transactions, deferred trustees compensation, and losses deferred due to wash sales.
The federal tax cost of investment securities and unrealized appreciation (depreciation) as of period end were as follows:
| Gross unrealized appreciation | $330,013,799 |
| Gross unrealized depreciation | (120,065,165) |
| Net unrealized appreciation (depreciation) on securities | $209,948,634 |
| Tax Cost | $2,800,243,075 |
The tax-based components of distributable earnings as of period end were as follows:
| Undistributed long-term capital gain | $72,049,533 |
| Net unrealized appreciation (depreciation) on securities and other investments | $209,936,458 |
The tax character of distributions paid was as follows:
| | December 31, 2015 | December 31, 2014 |
| Ordinary Income | $63,324,112 | $ 133,213,729 |
| Long-term Capital Gains | 66,947,689 | 217,489,262 |
| Total | $130,271,801 | $ 350,702,991 |
Restricted Securities. The Fund may invest in securities that are subject to legal or contractual restrictions on resale. These securities generally may be resold in transactions exempt from registration or to the public if the securities are registered. Disposal of these securities may involve time-consuming negotiations and expense, and prompt sale at an acceptable price may be difficult. Information regarding restricted securities is included at the end of the Fund's Schedule of Investments.
4. Derivative Instruments.
Risk Exposures and the Use of Derivative Instruments. The Fund's investment objective allows the Fund to enter into various types of derivative contracts, including futures contracts. Derivatives are investments whose value is primarily derived from underlying assets, indices or reference rates and may be transacted on an exchange or over-the-counter (OTC). Derivatives may involve a future commitment to buy or sell a specified asset based on specified terms, to exchange future cash flows at periodic intervals based on a notional principal amount, or for one party to make one or more payments upon the occurrence of specified events in exchange for periodic payments from the other party.
The Fund used derivatives to increase returns and to manage exposure to certain risks as defined below. The success of any strategy involving derivatives depends on analysis of numerous economic factors, and if the strategies for investment do not work as intended, the Fund may not achieve its objectives.
The Fund's use of derivatives increased or decreased its exposure to the following risk:
| Equity Risk | Equity risk relates to the fluctuations in the value of financial instruments as a result of changes in market prices (other than those arising from interest rate risk or foreign exchange risk), whether caused by factors specific to an individual investment, its issuer, or all factors affecting all instruments traded in a market or market segment.
|
The Fund is also exposed to additional risks from investing in derivatives, such as liquidity risk and counterparty credit risk. Liquidity risk is the risk that the Fund will be unable to close out the derivative in the open market in a timely manner. Counterparty credit risk is the risk that the counterparty will not be able to fulfill its obligation to the Fund. Counterparty credit risk related to exchange-traded futures contracts may be mitigated by the protection provided by the exchange on which they trade.
Investing in derivatives may involve greater risks than investing in the underlying assets directly and, to varying degrees, may involve risk of loss in excess of any initial investment and collateral received and amounts recognized in the Statement of Assets and Liabilities. In addition, there may be the risk that the change in value of the derivative contract does not correspond to the change in value of the underlying instrument.
Futures Contracts. A futures contract is an agreement between two parties to buy or sell a specified underlying instrument for a fixed price at a specified future date. The Fund used futures contracts to manage its exposure to the stock market.
Upon entering into a futures contract, a fund is required to deposit either cash or securities (initial margin) with a clearing broker in an amount equal to a certain percentage of the face value of the contract. Futures contracts are marked-to-market daily and subsequent daily payments (variation margin) are made or received by a fund depending on the daily fluctuations in the value of the futures contracts and are recorded as unrealized appreciation or (depreciation). This receivable and/or payable, if any, is included in daily variation margin for derivative instruments in the Statement of Assets and Liabilities. Realized gain or (loss) is recorded upon the expiration or closing of a futures contract.
Any open futures contracts at period end are presented in the Schedule of Investments under the caption "Futures Contracts". The underlying face amount at value reflects each contract's exposure to the underlying instrument or index at period end and is representative of volume of activity during the period. Securities deposited to meet initial margin requirements are identified in the Schedule of Investments.
During the period the Fund recognized net realized gain (loss) of $(303,549) and a change in net unrealized appreciation (depreciation) of $(135,318) related to its investment in futures contracts. These amounts are included in the Statement of Operations.
5. Purchases and Sales of Investments.
Purchases and sales of securities (including the Fixed-Income Central Funds), other than short-term securities, aggregated $1,811,028,866 and $1,557,302,611, respectively.
6. Fees and Other Transactions with Affiliates.
Management Fee. Fidelity Management & Research Company (the investment adviser) and its affiliates provide the Fund with investment management related services for which the Fund pays a monthly management fee. The management fee is the sum of an individual fund fee rate that is based on an annual rate of .15% of the Fund's average net assets and an annualized group fee rate that averaged .25% during the period. The group fee rate is based upon the average net assets of all the mutual funds advised by the investment adviser, including any mutual funds previously advised by the investment adviser that are currently advised by Fidelity SelectCo, LLC, an affiliate of the investment adviser. The group fee rate decreases as assets under management increase and increases as assets under management decrease. For the reporting period, the total annual management fee rate was .40% of the Fund's average net assets.
Distribution and Service Plan Fees. In accordance with Rule 12b-1 of the 1940 Act, the Fund has adopted separate 12b-1 Plans for each Service Class of shares. Each Service Class pays Fidelity Distributors Corporation (FDC), an affiliate of the investment adviser, a service fee. For the period, the service fee is based on an annual rate of .10% of Service Class' average net assets and .25% of Service Class 2's average net assets.
For the period, total fees, all of which were re-allowed to insurance companies for the distribution of shares and providing shareholder support services, were as follows:
| Service Class | $3,775 |
| Service Class 2 | 1,384,441 |
| | $1,388,216 |
Transfer Agent Fees. Fidelity Investments Institutional Operations Company, Inc. (FIIOC), an affiliate of the investment adviser, is the Fund's transfer, dividend disbursing, and shareholder servicing agent. FIIOC receives an asset-based fee with respect to each class. Each class (with the exception of Investor Class) pays a fee for transfer agent services, typesetting, printing and mailing of shareholder reports, excluding mailing of proxy statements and out of pocket expenses, equal to an annual rate of .07% (.15% for Investor Class) of class-level average net assets. For the period, transfer agent fees for each class, including out of pocket expenses, were as follows:
| Initial Class | $146,384 |
| Service Class | 2,707 |
| Service Class 2 | 366,130 |
| Investor Class | 3,219,887 |
| | $3,735,108 |
Accounting and Security Lending Fees. Fidelity Service Company, Inc. (FSC), an affiliate of the investment adviser, maintains the Fund's accounting records. The accounting fee is based on the level of average net assets for each month. Under a separate contract, FSC administers the security lending program. The security lending fee is based on the number and duration of lending transactions.
Brokerage Commissions. The Fund placed a portion of its portfolio transactions with brokerage firms which are affiliates of the investment adviser. Brokerage commissions are included in net realized gain (loss) and change in net unrealized appreciation (depreciation) in the Statement of Operations. The commissions paid to these affiliated firms were $25,815 for the period.
Interfund Trades. The Fund may purchase from or sell securities to other Fidelity Funds under procedures adopted by the Board. The procedures have been designed to ensure these interfund trades are executed in accordance with Rule 17a-7 of the 1940 Act. Interfund trades are included within the respective purchases and sales amounts shown in the Purchases and Sales of Investments note.
7. Committed Line of Credit.
The Fund participates with other funds managed by the investment adviser or an affiliate in a $4.25 billion credit facility (the "line of credit") to be utilized for temporary or emergency purposes to fund shareholder redemptions or for other short-term liquidity purposes. The Fund has agreed to pay commitment fees on its pro-rata portion of the line of credit, which amounted to $4,146 and is reflected in Miscellaneous expenses on the Statement of Operations. During the period, the Fund did not borrow on this line of credit.
8. Security Lending.
The Fund lends portfolio securities through a lending agent from time to time in order to earn additional income. For equity securities, a lending agent is used and may loan securities to certain qualified borrowers, including Fidelity Capital Markets (FCM), a broker-dealer affiliated with the Fund. On the settlement date of the loan, the Fund receives collateral (in the form of U.S. Treasury obligations, letters of credit and/or cash) against the loaned securities and maintains collateral in an amount not less than 100% of the market value of the loaned securities during the period of the loan. The market value of the loaned securities is determined at the close of business of the Fund and any additional required collateral is delivered to the Fund on the next business day. The Fund or borrower may terminate the loan at any time, and if the borrower defaults on its obligation to return the securities loaned because of insolvency or other reasons, the Fund may apply collateral received from the borrower against the obligation. The Fund may experience delays and costs in recovering the securities loaned. Any cash collateral received is invested in the Fidelity Securities Lending Cash Central Fund. The value of loaned securities and cash collateral at period end are disclosed on the Fund's Statement of Assets and Liabilities. The value of securities loaned to FCM at period end was $196,416. Security lending income represents the income earned on investing cash collateral, less rebates paid to borrowers and any lending agent fees associated with the loan, plus any premium payments received for lending certain types of securities. Security lending income is presented in the Statement of Operations as a component of income from Fidelity Central Funds. Total security lending income during the period amounted to $65,592, including $4,451 from securities loaned to FCM.
9. Expense Reductions.
Commissions paid to certain brokers with whom the investment adviser, or its affiliates, places trades on behalf of the Fund include an amount in addition to trade execution, which may be rebated back to the Fund to offset certain expenses. This amount totaled $102,534 for the period.
In addition, during the period the investment adviser reimbursed and/or waived a portion of fund-level operating expenses in the amount of $11,977 and a portion of class-level operating expenses as follows:
| | Amount |
| Investor Class | $43,812 |
10. Distributions to Shareholders.
Distributions to shareholders of each class were as follows:
| Years ended December 31, | 2015 | 2014 |
| From net investment income | | |
| Initial Class | $3,323,772 | $3,216,228 |
| Service Class | 64,282 | 43,237 |
| Service Class 2 | 7,594,899 | 6,611,402 |
| Investor Class | 33,308,983 | 28,583,828 |
| Total | $44,291,936 | $38,454,695 |
| From net realized gain | | |
| Initial Class | $6,578,470 | $26,023,873 |
| Service Class | 103,935 | 429,168 |
| Service Class 2 | 16,268,035 | 56,876,281 |
| Investor Class | 63,029,425 | 228,918,974 |
| Total | $85,979,865 | $312,248,296 |
11. Share Transactions.
Transactions for each class of shares were as follows:
| | Shares | Shares | Dollars | Dollars |
| Years ended December 31, | 2015 | 2014 | 2015 | 2014 |
| Initial Class | | | | |
| Shares sold | 1,154,477 | 1,042,464 | $19,407,389 | $17,529,184 |
| Reinvestment of distributions | 599,288 | 1,811,184 | 9,902,242 | 29,240,100 |
| Shares redeemed | (1,735,971) | (1,505,613) | (29,100,395) | (25,160,156) |
| Net increase (decrease) | 17,794 | 1,348,035 | $209,236 | $21,609,128 |
| Service Class | | | | |
| Shares sold | 118,581 | 18,022 | $1,959,537 | $304,183 |
| Reinvestment of distributions | 10,253 | 29,442 | 168,217 | 472,405 |
| Shares redeemed | (37,445) | (49,992) | (623,998) | (829,801) |
| Net increase (decrease) | 91,389 | (2,528) | $1,503,756 | $(53,213) |
| Service Class 2 | | | | |
| Shares sold | 6,448,104 | 6,313,441 | $106,308,756 | $104,119,201 |
| Reinvestment of distributions | 1,472,852 | 4,004,647 | 23,862,934 | 63,487,683 |
| Shares redeemed | (4,480,604) | (3,848,181) | (73,117,062) | (63,330,870) |
| Net increase (decrease) | 3,440,352 | 6,469,907 | $57,054,628 | $104,276,014 |
| Investor Class | | | | |
| Shares sold | 13,442,473 | 8,630,570 | $225,190,711 | $144,117,586 |
| Reinvestment of distributions | 5,873,921 | 16,044,130 | 96,338,408 | 257,502,803 |
| Shares redeemed | (3,657,048) | (3,613,897) | (60,510,191) | (59,893,560) |
| Net increase (decrease) | 15,659,346 | 21,060,803 | $261,018,928 | $341,726,829 |
12. Other.
The Fund's organizational documents provide former and current trustees and officers with a limited indemnification against liabilities arising in connection with the performance of their duties to the Fund. In the normal course of business, the Fund may also enter into contracts that provide general indemnifications. The Fund's maximum exposure under these arrangements is unknown as this would be dependent on future claims that may be made against the Fund. The risk of material loss from such claims is considered remote.
At the end of the period, the investment adviser or its affiliates were the owners of record of 80% of the total outstanding shares of the Fund and one otherwise unaffiliated shareholder was the owner of record of 10% of the total outstanding shares of the Fund.
Report of Independent Registered Public Accounting Firm
To the Trustees of Variable Insurance Products Fund III and Shareholders of VIP Balanced Portfolio:
We have audited the accompanying statement of assets and liabilities of VIP Balanced Portfolio (the Fund), a fund of Variable Insurance Products Fund III, including the schedule of investments, as of December 31, 2015, and the related statement of operations for the year then ended, the statement of changes in net assets for each of the two years in the period then ended, and the financial highlights for each of the five years in the period then ended. These financial statements and financial highlights are the responsibility of the Fund's management. Our responsibility is to express an opinion on these financial statements and financial highlights based on our audits.
We conducted our audits in accordance with the standards of the Public Company Accounting Oversight Board (United States). Those standards require that we plan and perform the audit to obtain reasonable assurance about whether the financial statements and financial highlights are free of material misstatement. The Fund is not required to have, nor were we engaged to perform, an audit of its internal control over financial reporting. Our audits included consideration of internal control over financial reporting as a basis for designing audit procedures that are appropriate in the circumstances, but not for the purpose of expressing an opinion on the effectiveness of the Fund's internal control over financial reporting. Accordingly, we express no such opinion. An audit also includes examining, on a test basis, evidence supporting the amounts and disclosures in the financial statements, assessing the accounting principles used and significant estimates made by management, as well as evaluating the overall financial statement presentation. Our procedures included confirmation of securities owned as of December 31, 2015, by correspondence with the custodians and brokers; when replies were not received from brokers, we performed other auditing procedures. We believe that our audits provide a reasonable basis for our opinion.
In our opinion, such financial statements and financial highlights referred to above present fairly, in all material respects, the financial position of VIP Balanced Portfolio as of December 31, 2015, the results of its operations for the year then ended, the changes in its net assets for each of the two years in the period then ended, and the financial highlights for each of the five years in the period then ended, in conformity with accounting principles generally accepted in the United States of America.
DELOITTE & TOUCHE LLP
Boston, Massachusetts
February 17, 2016
Trustees and Officers
The Trustees, Members of the Advisory Board (if any), and officers of the trust and fund, as applicable, are listed below. The Board of Trustees governs the fund and is responsible for protecting the interests of shareholders. The Trustees are experienced executives who meet periodically throughout the year to oversee the fund's activities, review contractual arrangements with companies that provide services to the fund, oversee management of the risks associated with such activities and contractual arrangements, and review the fund's performance. Each of the Trustees oversees 170 funds.
The Trustees hold office without limit in time except that (a) any Trustee may resign; (b) any Trustee may be removed by written instrument, signed by at least two-thirds of the number of Trustees prior to such removal; (c) any Trustee who requests to be retired or who has become incapacitated by illness or injury may be retired by written instrument signed by a majority of the other Trustees; and (d) any Trustee may be removed at any special meeting of shareholders by a two-thirds vote of the outstanding voting securities of the trust. Each Trustee who is not an interested person (as defined in the 1940 Act) of the trust and the fund is referred to herein as an Independent Trustee. Each Independent Trustee shall retire not later than the last day of the calendar year in which his or her 75th birthday occurs. The Independent Trustees may waive this mandatory retirement age policy with respect to individual Trustees. Officers and Advisory Board Members hold office without limit in time, except that any officer or Advisory Board Member may resign or may be removed by a vote of a majority of the Trustees at any regular meeting or any special meeting of the Trustees. Except as indicated, each individual has held the office shown or other offices in the same company for the past five years.
The fund’s Statement of Additional Information (SAI) includes more information about the Trustees. To request a free copy, call Fidelity at 1-877-208-0098.
Experience, Skills, Attributes, and Qualifications of the Trustees. The Governance and Nominating Committee has adopted a statement of policy that describes the experience, qualifications, attributes, and skills that are necessary and desirable for potential Independent Trustee candidates (Statement of Policy). The Board believes that each Trustee satisfied at the time he or she was initially elected or appointed a Trustee, and continues to satisfy, the standards contemplated by the Statement of Policy. The Governance and Nominating Committee also engages professional search firms to help identify potential Independent Trustee candidates who have the experience, qualifications, attributes, and skills consistent with the Statement of Policy. From time to time, additional criteria based on the composition and skills of the current Independent Trustees, as well as experience or skills that may be appropriate in light of future changes to board composition, business conditions, and regulatory or other developments, have also been considered by the professional search firms and the Governance and Nominating Committee. In addition, the Board takes into account the Trustees' commitment and participation in Board and committee meetings, as well as their leadership of standing and ad hoc committees throughout their tenure.
In determining that a particular Trustee was and continues to be qualified to serve as a Trustee, the Board has considered a variety of criteria, none of which, in isolation, was controlling. The Board believes that, collectively, the Trustees have balanced and diverse experience, qualifications, attributes, and skills, which allow the Board to operate effectively in governing the fund and protecting the interests of shareholders. Information about the specific experience, skills, attributes, and qualifications of each Trustee, which in each case led to the Board's conclusion that the Trustee should serve (or continue to serve) as a trustee of the fund, is provided below.
Board Structure and Oversight Function. James C. Curvey is an interested person and currently serves as Chairman. The Trustees have determined that an interested Chairman is appropriate and benefits shareholders because an interested Chairman has a personal and professional stake in the quality and continuity of services provided to the fund. Independent Trustees exercise their informed business judgment to appoint an individual of their choosing to serve as Chairman, regardless of whether the Trustee happens to be independent or a member of management. The Independent Trustees have determined that they can act independently and effectively without having an Independent Trustee serve as Chairman and that a key structural component for assuring that they are in a position to do so is for the Independent Trustees to constitute a substantial majority for the Board. The Independent Trustees also regularly meet in executive session. Ned C. Lautenbach serves as Chairman of the Independent Trustees and as such (i) acts as a liaison between the Independent Trustees and management with respect to matters important to the Independent Trustees and (ii) with management prepares agendas for Board meetings.
Fidelity® funds are overseen by different Boards of Trustees. The fund's Board oversees Fidelity's high income and certain equity funds, and other Boards oversee Fidelity's investment-grade bond, money market, asset allocation, and sector funds. The asset allocation funds may invest in Fidelity® funds overseen by the fund's Board. The use of separate Boards, each with its own committee structure, allows the Trustees of each group of Fidelity® funds to focus on the unique issues of the funds they oversee, including common research, investment, and operational issues. On occasion, the separate Boards establish joint committees to address issues of overlapping consequences for the Fidelity® funds overseen by each Board.
The Trustees operate using a system of committees to facilitate the timely and efficient consideration of all matters of importance to the Trustees, the fund, and fund shareholders and to facilitate compliance with legal and regulatory requirements and oversight of the fund's activities and associated risks. The Board, acting through its committees, has charged FMR and its affiliates with (i) identifying events or circumstances the occurrence of which could have demonstrably adverse effects on the fund's business and/or reputation; (ii) implementing processes and controls to lessen the possibility that such events or circumstances occur or to mitigate the effects of such events or circumstances if they do occur; and (iii) creating and maintaining a system designed to evaluate continuously business and market conditions in order to facilitate the identification and implementation processes described in (i) and (ii) above. Because the day-to-day operations and activities of the fund are carried out by or through FMR, its affiliates, and other service providers, the fund's exposure to risks is mitigated but not eliminated by the processes overseen by the Trustees. While each of the Board's committees has responsibility for overseeing different aspects of the fund's activities, oversight is exercised primarily through the Operations, Audit, and Compliance Committees. In addition, the Independent Trustees have worked with FMR to enhance the Board's oversight of investment and financial risks, legal and regulatory risks, technology risks, and operational risks, including the development of additional risk reporting to the Board. For example, a working group comprised of Independent Trustees and FMR has worked and continues to work to review the Fidelity® funds' valuation-related activities, reporting and risk management. Appropriate personnel, including but not limited to the fund's Chief Compliance Officer (CCO), FMR's internal auditor, the independent accountants, the fund's Treasurer and portfolio management personnel, make periodic reports to the Board's committees, as appropriate, including an annual review of Fidelity's risk management program for the Fidelity® funds. The responsibilities of each standing committee, including their oversight responsibilities, are described further under "Standing Committees of the Trustees."
Interested Trustees*:
Correspondence intended for a Trustee who is an interested person may be sent to Fidelity Investments, 245 Summer Street, Boston, Massachusetts 02210.
Name, Year of Birth; Principal Occupations and Other Relevant Experience+
James C. Curvey (1935)
Year of Election or Appointment: 2007
Trustee
Chairman of the Board of Trustees
Mr. Curvey also serves as Trustee of other Fidelity® funds. Mr. Curvey is a Director of Fidelity Research & Analysis Co. (investment adviser firm, 2009-present), and Vice Chairman (2007-present) and Director of FMR LLC (diversified financial services company). In addition, Mr. Curvey serves as an Overseer for the Boston Symphony Orchestra and a member of the board of Artis-Naples, Naples, Florida, and as a Trustee for Brewster Academy, Wolfeboro, New Hampshire. Previously, Mr. Curvey served as a Director of Fidelity Investments Money Management, Inc. (investment adviser firm, 2009-2014) and a Director of FMR and FMR Co., Inc. (investment adviser firms, 2007-2014).
Charles S. Morrison (1960)
Year of Election or Appointment: 2014
Trustee
Mr. Morrison also serves as Trustee of other funds. He serves as a Director of Fidelity Investments Money Management, Inc. (FIMM) (investment adviser firm, 2014-present), Director of Fidelity SelectCo, LLC (investment adviser firm, 2014-present), President, Asset Management (2014-present), and is an employee of Fidelity Investments. Previously, Mr. Morrison served as Vice President of Fidelity's Fixed Income and Asset Allocation Funds (2012-2014), President, Fixed Income (2011-2014), Vice President of Fidelity's Money Market Funds (2005-2009), President, Money Market Group Leader of FMR (investment adviser firm, 2009), and Senior Vice President, Money Market Group of FMR (2004-2009). Mr. Morrison also served as Vice President of Fidelity's Bond Funds (2002-2005), certain Balanced Funds (2002-2005), and certain Asset Allocation Funds (2002-2007), and as Senior Vice President (2002-2005) of Fidelity's Bond Division.
* Determined to be an “Interested Trustee” by virtue of, among other things, his or her affiliation with the trust or various entities under common control with FMR.
+ The information includes the Trustee's principal occupation during the last five years and other information relating to the experience, attributes, and skills relevant to the Trustee's qualifications to serve as a Trustee, which led to the conclusion that the Trustee should serve as a Trustee for the fund.
Independent Trustees:
Correspondence intended for an Independent Trustee may be sent to Fidelity Investments, P.O. Box 55235, Boston, Massachusetts 02205-5235.
Name, Year of Birth; Principal Occupations and Other Relevant Experience+
Dennis J. Dirks (1948)
Year of Election or Appointment: 2005
Trustee
Mr. Dirks also serves as Trustee of other Fidelity® funds. Prior to his retirement in May 2003, Mr. Dirks was Chief Operating Officer and a member of the Board of The Depository Trust & Clearing Corporation (DTCC). He also served as President, Chief Operating Officer, and Board member of The Depository Trust Company (DTC) and President and Board member of the National Securities Clearing Corporation (NSCC). In addition, Mr. Dirks served as Chief Executive Officer and Board member of the Government Securities Clearing Corporation, Chief Executive Officer and Board member of the Mortgage-Backed Securities Clearing Corporation, as a Trustee and a member of the Finance Committee of Manhattan College (2005-2008), as a Trustee and a member of the Finance Committee of AHRC of Nassau County (2006-2008), and as a member of the Independent Directors Council (IDC) Governing Council (2010-2015). Mr. Dirks is a member of the Board of Directors for The Brookville Center for Children's Services, Inc. (2009-present).
Alan J. Lacy (1953)
Year of Election or Appointment: 2008
Trustee
Mr. Lacy also serves as Trustee of other Fidelity® funds. Mr. Lacy serves as Chairman (2014-present) and a member (2010-present) of the Board of Directors of Dave & Buster's Entertainment, Inc. (restaurant and entertainment complexes) and a Director of Bristol-Myers Squibb Company (global pharmaceuticals, 2008-present). He is a Trustee of the California Chapter of The Nature Conservancy (2015-present) and a Director of the Center for Advanced Study in the Behavioral Sciences at Stanford University (2015-present). In addition, Mr. Lacy served as Senior Adviser (2007-2014) of Oak Hill Capital Partners, L.P. (private equity) and also served as Chief Executive Officer (2005) and Vice Chairman (2005-2006) of Sears Holdings Corporation (retail) and Chief Executive Officer and Chairman of the Board of Sears, Roebuck and Co. (retail, 2000-2005). Previously, Mr. Lacy served as Chairman (2008-2011) and a member (2006-2015) of the Board of Trustees of the National Parks Conservation Association and as a member of the Board of Directors for The Western Union Company (global money transfer, 2006-2011), The Hillman Companies, Inc. (hardware wholesalers, 2010-2014), and Earth Fare, Inc. (retail grocery, 2010-2014).
Ned C. Lautenbach (1944)
Year of Election or Appointment: 2000
Trustee
Chairman of the Independent Trustees
Mr. Lautenbach also serves as Trustee of other Fidelity® funds. Mr. Lautenbach currently serves as the Lead Director of the Eaton Corporation Board of Directors (diversified industrial, 1997-present). Mr. Lautenbach is Chairman of the Board of Directors of Artis-Naples in Naples, Florida (2012-present), a member of the Council on Foreign Relations (1994-present), and a member of the Board of Governors, State University System of Florida (2013-present). Previously, Mr. Lautenbach was a Partner/Advisory Partner at Clayton, Dubilier & Rice, LLC (private equity investment, 1998-2010), as well as a Director of Sony Corporation (2006-2007).
Joseph Mauriello (1944)
Year of Election or Appointment: 2008
Trustee
Mr. Mauriello also serves as Trustee of other Fidelity® funds. Prior to his retirement in January 2006, Mr. Mauriello served in numerous senior management positions including Deputy Chairman and Chief Operating Officer (2004-2005), and Vice Chairman of Financial Services (2002-2004) of KPMG LLP US (professional services, 1965-2005). Mr. Mauriello currently serves as a member of the Board of Directors of XL Group plc. (global insurance and re-insurance, 2006-present) and the Independent Directors Council (IDC) Governing Council (2015-present). Previously, Mr. Mauriello served as a Director of the Hamilton Funds of the Bank of New York (2006-2007) and of Arcadia Resources Inc. (health care services and products, 2007-2012).
Robert W. Selander (1950)
Year of Election or Appointment: 2011
Trustee
Mr. Selander also serves as Trustee of other Fidelity® funds. Mr. Selander serves as a Director of The Western Union Company (global money transfer, 2014-present) and a non-executive Chairman of Health Equity, Inc. (health savings custodian, 2015-present). Previously, Mr. Selander served as a Member of the Advisory Board of other Fidelity® funds (2011), and Executive Vice Chairman (2010), Chief Executive Officer (2009-2010), and President and Chief Executive Officer (1997-2009) of Mastercard, Inc.
Cornelia M. Small (1944)
Year of Election or Appointment: 2005
Trustee
Ms. Small also serves as Trustee of other Fidelity® funds. Ms. Small is a member of the Board of Directors (2009-present) and Chair of the Investment Committee (2010-present) of the Teagle Foundation. Ms. Small also serves on the Investment Committee of the Berkshire Taconic Community Foundation (2008-present). Previously, Ms. Small served as Chairperson (2002-2008) and a member of the Investment Committee and Chairperson (2008-2012) and a member of the Board of Trustees of Smith College. In addition, Ms. Small served as Chief Investment Officer, Director of Global Equity Investments, and a member of the Board of Directors of Scudder, Stevens & Clark and Scudder Kemper Investments.
William S. Stavropoulos (1939)
Year of Election or Appointment: 2002
Trustee
Vice Chairman of the Independent Trustees
Mr. Stavropoulos also serves as Trustee of other Fidelity® funds. Mr. Stavropoulos serves as President and Founder of the Michigan Baseball Foundation, the Great Lakes Loons (2007-present). Mr. Stavropoulos is Chairman Emeritus of the Board of Directors of The Dow Chemical Company, where he previously served in numerous senior management positions, including President, CEO (1995-2000; 2002-2004), Chairman of the Executive Committee (2000-2006), and as a member of the Board of Directors (1990-2006). Currently, Mr. Stavropoulos is Chairman of the Board of Directors of Univar Inc. (global distributor of commodity and specialty chemicals), a Director of Teradata Corporation (data warehousing and technology solutions), and Maersk Inc. (industrial conglomerate), and a member of the Advisory Board for Metalmark Capital LLC (private equity investment, 2005-present). Mr. Stavropoulos is an operating advisor to Clayton, Dubilier & Rice, LLC (private equity investment). In addition, Mr. Stavropoulos is a member of the University of Notre Dame Advisory Council for the College of Science, a Trustee of the Rollin L. Gerstacker Foundation, and a Director of the Naples Philharmonic Center for the Arts. Previously, Mr. Stavropoulos served as a Director of Chemical Financial Corporation (bank holding company, 1993-2012) and Tyco International, Ltd. (multinational manufacturing and services, 2007-2012).
David M. Thomas (1949)
Year of Election or Appointment: 2008
Trustee
Mr. Thomas also serves as Trustee of other Fidelity® funds. Mr. Thomas serves as Non-Executive Chairman of the Board of Directors of Fortune Brands Home and Security (home and security products, 2011-present), as a member of the Board of Directors (2004-present) and Presiding Director (2013-present) of Interpublic Group of Companies, Inc. (marketing communication), and as a member of the Board of Trustees of the University of Florida (2013-present). Previously, Mr. Thomas served as Executive Chairman (2005-2006) and Chairman and Chief Executive Officer (2000-2005) of IMS Health, Inc. (pharmaceutical and healthcare information solutions), and a Director of Fortune Brands, Inc. (consumer products, 2000-2011).
+ The information includes the Trustee's principal occupation during the last five years and other information relating to the experience, attributes, and skills relevant to the Trustee's qualifications to serve as a Trustee, which led to the conclusion that the Trustee should serve as a Trustee for the fund.
Advisory Board Members and Officers:
Correspondence intended for an officer or Peter S. Lynch may be sent to Fidelity Investments, 245 Summer Street, Boston, Massachusetts 02210. Officers appear below in alphabetical order.
Name, Year of Birth; Principal Occupation
Peter S. Lynch (1944)
Year of Election or Appointment: 2003
Member of the Advisory Board
Mr. Lynch also serves as Member of the Advisory Board of other Fidelity® funds. Mr. Lynch is Vice Chairman and a Director of FMR (investment adviser firm) and FMR Co., Inc. (investment adviser firm). In addition, Mr. Lynch serves as a Trustee of Boston College and as the Chairman of the Inner-City Scholarship Fund. Previously, Mr. Lynch served on the Special Olympics International Board of Directors (1997-2006).
Marc R. Bryant (1966)
Year of Election or Appointment: 2015
Secretary and Chief Legal Officer (CLO)
Mr. Bryant also serves as Secretary and CLO of other funds. Mr. Bryant serves as CLO, Secretary, and Senior Vice President of Fidelity Management & Research Company (investment adviser firm, 2015-present) and FMR Co., Inc. (investment adviser firm, 2015-present); Secretary of Fidelity SelectCo, LLC (investment adviser firm, 2015-present) and Fidelity Investments Money Management, Inc. (investment adviser firm, 2015-present); and CLO of Fidelity Management & Research (Hong Kong) Limited (investment adviser firm, 2015-present). He is Senior Vice President and Deputy General Counsel of FMR LLC (diversified financial services company). Previously, Mr. Bryant served as Secretary and CLO of Fidelity Rutland Square Trust II (2010-2014) and Assistant Secretary of Fidelity's Fixed Income and Asset Allocation Funds (2013-2015). Prior to joining Fidelity Investments, Mr. Bryant served as a Senior Vice President and the Head of Global Retail Legal for AllianceBernstein L.P. (2006-2010), and as the General Counsel for ProFund Advisors LLC (2001-2006).
William C. Coffey (1969)
Year of Election or Appointment: 2009
Assistant Secretary
Mr. Coffey also serves as Assistant Secretary of other funds. He is Senior Vice President and Deputy General Counsel of FMR LLC (diversified financial services company, 2010-present), and is an employee of Fidelity Investments. Previously, Mr. Coffey served as Vice President and Associate General Counsel of FMR LLC (2005-2009).
Jonathan Davis (1968)
Year of Election or Appointment: 2010
Assistant Treasurer
Mr. Davis also serves as Assistant Treasurer of other funds, and is an employee of Fidelity Investments. Previously, Mr. Davis served as Vice President and Associate General Counsel of FMR LLC (diversified financial services company, 2003-2010).
Adrien E. Deberghes (1967)
Year of Election or Appointment: 2008
Deputy Treasurer
Mr. Deberghes also serves as an officer of other funds. He is an employee of Fidelity Investments (2008-present). Prior to joining Fidelity Investments, Mr. Deberghes was Senior Vice President of Mutual Fund Administration at State Street Corporation (2007-2008), Senior Director of Mutual Fund Administration at Investors Bank & Trust (2005-2007), and Director of Finance for Dunkin' Brands (2000-2005).
Stephanie J. Dorsey (1969)
Year of Election or Appointment: 2010
Assistant Treasurer
Ms. Dorsey also serves as an officer of other funds. She is an employee of Fidelity Investments (2008-present) and has served in other fund officer roles. Prior to joining Fidelity Investments, Ms. Dorsey served as Treasurer (2004-2008) of the JPMorgan Mutual Funds and Vice President (2004-2008) of JPMorgan Chase Bank.
Howard J. Galligan III (1966)
Year of Election or Appointment: 2014
Chief Financial Officer
Mr. Galligan also serves as Chief Financial Officer of other funds. Mr. Galligan serves as President of Fidelity Pricing and Cash Management Services (FPCMS) (2014-present) and as a Director of Strategic Advisers, Inc. (investment adviser firm, 2008-present). Previously, Mr. Galligan served as Chief Administrative Officer of Asset Management (2011-2014) and Chief Operating Officer and Senior Vice President of Investment Support for Strategic Advisers, Inc. (2003-2011).
Scott C. Goebel (1968)
Year of Election or Appointment: 2015
Vice President
Mr. Goebel serves as Vice President of other funds and is an employee of Fidelity Investments (2001-present). Previously, Mr. Goebel served as Secretary of Fidelity SelectCo, LLC (investment adviser firm, 2013-2015), Fidelity Investments Money Management, Inc. (FIMM) (investment adviser firm, 2010-2015), and Fidelity Research and Analysis Company (FRAC) (investment adviser firm, 2010-2015); General Counsel, Secretary, and Senior Vice President of Fidelity Management & Research Company (investment adviser firm, 2008-2015) and FMR Co., Inc. (investment adviser firm, 2008-2015); Assistant Secretary of Fidelity Management & Research (Japan) Limited (investment adviser firm, 2008-2015) and FMR Investment Management (U.K.) Limited (investment adviser firm, 2008-2015); Chief Legal Officer (CLO) of Fidelity Management & Research (Hong Kong) Limited (investment adviser firm, 2008-2015); Secretary and CLO of certain Fidelity® funds (2008-2015); Assistant Secretary of FIMM (2008-2010), FRAC (2008-2010), and certain funds (2007-2008); and as Vice President and Secretary of Fidelity Distributors Corporation (FDC) (2005-2007).
Brian B. Hogan (1964)
Year of Election or Appointment: 2009
Vice President
Mr. Hogan also serves as Trustee or Vice President of other funds. Mr. Hogan serves as a Director of Fidelity SelectCo, LLC (investment adviser firm, 2014-present) and President of the Equity Division of FMR (investment adviser firm, 2009-present). Previously, Mr. Hogan served as Senior Vice President, Equity Research of FMR (2006-2009) and as a portfolio manager.
Chris Maher (1972)
Year of Election or Appointment: 2013
Assistant Treasurer
Mr. Maher serves as Assistant Treasurer of other funds. Mr. Maher is Vice President of Valuation Oversight and is an employee of Fidelity Investments. Previously, Mr. Maher served as Vice President of Asset Management Compliance (2013), Vice President of the Program Management Group of FMR (investment adviser firm, 2010-2013), and Vice President of Valuation Oversight (2008-2010).
John F. Papandrea (1972)
Year of Election or Appointment: 2016
Anti-Money Laundering (AML) Officer
Mr. Papandrea also serves as AML Officer of other funds. Mr. Papandrea is Vice President of FMR LLC (diversified financial services company, 2008-present) and is an employee of Fidelity Investments (2005-present).
Melissa M. Reilly (1971)
Year of Election or Appointment: 2014
Vice President of certain Equity Funds
Ms. Reilly also serves as Vice President of other funds. Ms. Reilly is an employee of Fidelity Investments (2004-present).
Kenneth B. Robins (1969)
Year of Election or Appointment: 2008
President and Treasurer
Mr. Robins also serves as an officer of other funds. Mr. Robins serves as Executive Vice President of Fidelity Investments Money Management, Inc. (FIMM) (investment adviser firm, 2013-present) and is an employee of Fidelity Investments (2004-present). Previously, Mr. Robins served in other fund officer roles.
Stacie M. Smith (1974)
Year of Election or Appointment: 2013
Deputy Treasurer
Ms. Smith also serves as an officer of other funds. She is an employee of Fidelity Investments (2009-present) and has served in other fund officer roles. Prior to joining Fidelity Investments, Ms. Smith served as Senior Audit Manager of Ernst & Young LLP (1996-2009).
Renee Stagnone (1975)
Year of Election or Appointment: 2013
Deputy Treasurer
Ms. Stagnone also serves as Deputy Treasurer of other funds. Ms. Stagnone is an employee of Fidelity Investments (1997-present).
Linda J. Wondrack (1964)
Year of Election or Appointment: 2014
Chief Compliance Officer
Ms. Wondrack also serves as Chief Compliance Officer of other funds. Ms. Wondrack is Executive Vice President and head of the Ethics Office and Asset Management Compliance for Fidelity Investments (2012-present). Ms. Wondrack also serves as Chief Compliance Officer of Fidelity SelectCo, LLC (investment adviser firm, 2014-present); Chief Compliance Officer of Impresa Management LLC (2013-present); and Chief Compliance Officer of FMR Co., Inc. (investment adviser firm), Fidelity Investments Money Management, Inc. (investment adviser firm), FMR Investment Management (U.K.) Limited (investment adviser firm), Fidelity Management & Research (Hong Kong) (investment adviser firm), Fidelity Management & Research Company (investment adviser firm), FIAM LLC (investment adviser firm), and Strategic Advisers, Inc. (investment adviser firm), Ballyrock Investment Advisors LLC, and Northern Neck Investors LLC (2012-present). Previously, Ms. Wondrack served as Chief Compliance Officer of Fidelity Management & Research (Japan) Limited (investment adviser firm, 2012-2016); Senior Vice President and Chief Compliance Officer for Columbia Management Investment Advisers, LLC (2005-2012); Chief Compliance Officer for certain funds within the Columbia Family of Funds (2007-2012); and Senior Vice President of Compliance Risk Management at Bank of America (2005-2010).
Joseph F. Zambello (1957)
Year of Election or Appointment: 2011
Deputy Treasurer
Mr. Zambello also serves as Deputy Treasurer of other funds. Mr. Zambello is an employee of Fidelity Investments (1991-present). Previously, Mr. Zambello served as Vice President of the Program Management Group of FMR (investment adviser firm, 2009-2011) and Vice President of the Transfer Agent Oversight Group (2005-2009).
Shareholder Expense Example
As a shareholder of the Fund, you incur two types of costs: (1) transaction costs and (2) ongoing costs, including management fees, distribution and/or service (12b-1) fees and other Fund expenses. This Example is intended to help you understand your ongoing costs (in dollars) of investing in the Fund and to compare these costs with the ongoing costs of investing in other mutual funds.
The Example is based on an investment of $1,000 invested at the beginning of the period and held for the entire period (July 1, 2015 to December 31, 2015).
Actual Expenses
The first line of the accompanying table for each class of the Fund provides information about actual account values and actual expenses. You may use the information in this line, together with the amount you invested, to estimate the expenses that you paid over the period. Simply divide your account value by $1,000.00 (for example, an $8,600 account value divided by $1,000.00 = 8.6), then multiply the result by the number in the first line for a class of the Fund under the heading entitled "Expenses Paid During Period" to estimate the expenses you paid on your account during this period. The estimate of expenses does not include any fees or other expenses of any variable annuity or variable life insurance product. If they were, the estimate of expenses you paid during the period would be higher, and your ending account value would be lower. In addition, the Fund, as a shareholder in the underlying Fidelity Central Funds, will indirectly bear its pro-rata share of the fees and expenses incurred by the underlying Fidelity Central Funds. These fees and expenses are not included in the Fund's annualized expense ratio used to calculate the expense estimate in the table below.
Hypothetical Example for Comparison Purposes
The second line of the accompanying table for each class of the Fund provides information about hypothetical account values and hypothetical expenses based on a Class' actual expense ratio and an assumed rate of return of 5% per year before expenses, which is not the Class' actual return. The hypothetical account values and expenses may not be used to estimate the actual ending account balance or expenses you paid for the period. You may use this information to compare the ongoing costs of investing in the Fund and other funds. To do so, compare this 5% hypothetical example with the 5% hypothetical examples that appear in the shareholder reports of the other funds. The estimate of expenses does not include any fees or other expenses of any variable annuity or variable life insurance product. If they were, the estimate of expenses you paid during the period would be higher, and your ending account value would be lower. In addition, the Fund, as a shareholder in the underlying Fidelity Central Funds, will indirectly bear its pro-rata share of the fees and expenses incurred by the underlying Fidelity Central Funds. These fees and expenses are not included in the Fund's annualized expense ratio used to calculate the expense estimate in the table below.
Please note that the expenses shown in the table are meant to highlight your ongoing costs only and do not reflect any transaction costs. Therefore, the second line of the table is useful in comparing ongoing costs only, and will not help you determine the relative total costs of owning different funds.
In addition to the expenses noted below, the Fund also indirectly bears its proportional share of the expenses of the underlying Fidelity Central Funds. Annualized expenses of the underlying non-money market Fidelity Central Funds as of their most recent fiscal half year were less than .005%.
| | Annualized Expense Ratio-A | Beginning
Account Value
July 1, 2015 | Ending
Account Value
December 31, 2015 | Expenses Paid
During Period-B
July 1, 2015
to December 31, 2015 |
| Initial Class | .51% | | | |
| Actual | | $1,000.00 | $982.00 | $2.55 |
| Hypothetical-C | | $1,000.00 | $1,022.63 | $2.60 |
| Service Class | .61% | | | |
| Actual | | $1,000.00 | $981.80 | $3.05 |
| Hypothetical-C | | $1,000.00 | $1,022.13 | $3.11 |
| Service Class 2 | .76% | | | |
| Actual | | $1,000.00 | $981.10 | $3.80 |
| Hypothetical-C | | $1,000.00 | $1,021.37 | $3.87 |
| Investor Class | .59% | | | |
| Actual | | $1,000.00 | $981.80 | $2.95 |
| Hypothetical-C | | $1,000.00 | $1,022.23 | $3.01 |
A Annualized expense ratio reflects expenses net of applicable fee waivers.
B Expenses are equal to each Class' annualized expense ratio, multiplied by the average account value over the period, multiplied by 184/365 (to reflect the one-half year period). The fees and expenses of the underlying Fidelity Central Funds in which the Fund invests are not included in each Class' annualized expense ratio.
C 5% return per year before expenses
Distributions (Unaudited)
The Board of Trustees of VIP Balanced Portfolio voted to pay to shareholders of record at the opening of business on record date, the following distributions per share derived from capital gains realized from sales of portfolio securities:
| | Pay Date | Record Date | | Capital Gains |
| Initial Class | 02/12/2016 | 02/12/2016 | | $0.391 |
| Service Class | 02/12/2016 | 02/12/2016 | | $0.391 |
| Service Class 2 | 02/12/2016 | 02/12/2016 | | $0.391 |
| Investor Class | 02/12/2016 | 02/12/2016 | | $0.391 |
The fund hereby designates as a capital gain dividend with respect to the taxable year ended December 31, 2015 $77,181,342, or, if subsequently determined to be different, the net capital gain of such year.
Initial Class designates 9% and 41%, Service Class designates 9% and 42%, Service Class 2 designates 9% and 46%, and Investor Class designates 9% and 42%, of the dividends distributed in February and December 2015 respectively, during the fiscal year as qualifying for the dividends–received deduction for corporate shareholders.
A total of 2.43% of the dividends distributed during the fiscal year was derived from interest on U.S. Government securities which is generally exempt from state income tax.
Board Approval of Investment Advisory Contracts and Management Fees
VIP Balanced Portfolio
Each year, the Board of Trustees, including the Independent Trustees (together, the Board), votes on the renewal of the management contract with Fidelity Management & Research Company (FMR) and the sub-advisory agreements (together, the Advisory Contracts) for the fund. The Board, assisted by the advice of fund counsel and Independent Trustees' counsel, requests and considers a broad range of information relevant to the renewal of the Advisory Contracts throughout the year.
The Board meets regularly and, at each of its meetings, covers an extensive agenda of topics and materials and considers factors that are relevant to its annual consideration of the renewal of the fund's Advisory Contracts, including the services and support provided to the fund and its shareholders. The Board has established various standing committees (Committees), each composed of and chaired by Independent Trustees with varying backgrounds, to which the Board has assigned specific subject matter responsibilities in order to enhance effective decision-making by the Board. The Board, acting directly and through its Committees, requests and receives information concerning the annual consideration of the renewal of the fund's Advisory Contracts. The Board also meets as needed to consider matters specifically related to the Board's annual consideration of the renewal of the Advisory Contracts. Members of the Board may also meet with trustees of other Fidelity funds through ad hoc joint committees to discuss certain matters relevant to all of the Fidelity funds.
At its July 2015 meeting, the Board unanimously determined to renew the fund's Advisory Contracts. In reaching its determination, the Board considered all factors it believed relevant, including (i) the nature, extent, and quality of the services to be provided to the fund and its shareholders (including the investment performance of the fund); (ii) the competitiveness of the fund's management fee and total expense ratio relative to peer funds; (iii) the total costs of the services to be provided by and the profits to be realized by Fidelity from its relationship with the fund; and (iv) the extent to which (if any) economies of scale exist and would be realized as the fund grows, and whether any economies of scale are appropriately shared with fund shareholders.
In considering whether to renew the Advisory Contracts for the fund, the Board reached a determination, with the assistance of fund counsel and Independent Trustees' counsel and through the exercise of its business judgment, that the renewal of the Advisory Contracts was in the best interests of the fund and its shareholders and that the compensation payable under the Advisory Contracts was fair and reasonable. The Board's decision to renew the Advisory Contracts was not based on any single factor, but rather was based on a comprehensive consideration of all the information provided to the Board at its meetings throughout the year. The Board, in reaching its determination to renew the Advisory Contracts, was aware that shareholders of the fund have a broad range of investment choices available to them, including a wide choice among funds offered by Fidelity's competitors, and that the fund's shareholders, who have the opportunity to review and weigh the disclosure provided by the fund in its prospectus and other public disclosures, have chosen to invest in this fund, which is part of the Fidelity family of funds.
Nature, Extent, and Quality of Services Provided. The Board considered Fidelity's staffing as it relates to the fund, including the backgrounds of investment personnel of Fidelity, and also considered the fund's investment objective, strategies, and related investment philosophy. The Independent Trustees also had discussions with senior management of Fidelity's investment operations and investment groups. The Board considered the structure of the portfolio manager compensation program and whether this structure provides appropriate incentives to act in the best interests of the fund. Additionally, the Board considered the portfolio managers' investments, if any, in the funds that they manage.
Resources Dedicated to Investment Management and Support Services. The Board and the Fund Oversight and Research Committees reviewed the general qualifications and capabilities of Fidelity's investment staff, including its size, education, experience, and resources, as well as Fidelity's approach to recruiting, training, managing, and compensating investment personnel. The Board noted that Fidelity has continued to increase the resources devoted to non-U.S. offices, including expansion of Fidelity's global investment organization. The Board also noted that Fidelity's analysts have extensive resources, tools and capabilities that allow them to conduct sophisticated quantitative and fundamental analysis, as well as credit analysis of issuers, counterparties and guarantors. Further, the Board considered that Fidelity's investment professionals have sufficient access to global information and data so as to provide competitive investment results over time, and that those professionals also have access to sophisticated tools that permit them to assess portfolio construction and risk and performance attribution characteristics continuously, as well as to transmit new information and research conclusions rapidly around the world. Additionally, in its deliberations, the Board considered Fidelity's trading, risk management, and compliance capabilities and resources, which are integral parts of the investment management process.
Shareholder and Administrative Services. The Board considered (i) the nature, extent, quality, and cost of advisory, administrative, and shareholder services performed by FMR, the sub-advisers (together with FMR, the Investment Advisers), and their affiliates under the Advisory Contracts and under separate agreements covering transfer agency, pricing and bookkeeping, and securities lending services for the fund; (ii) the nature and extent of the supervision of third party service providers, principally custodians and subcustodians; and (iii) the resources devoted to, and the record of compliance with, the fund's compliance policies and procedures. The Board also reviewed the allocation of fund brokerage, including allocations to brokers affiliated with the Investment Advisers, the use of brokerage commissions to pay fund expenses, and the use of "soft" commission dollars to pay for research services.
The Board noted that the growth of fund assets over time across the complex allows Fidelity to reinvest in the development of services designed to enhance the value or convenience of the Fidelity funds as investment vehicles. These services include 24-hour access to account information and market information through telephone representatives and over the Internet, investor education materials and asset allocation tools, and the expanded availability of Fidelity Investor Centers.
In 2014, the Board formed an ad hoc Committee on Transfer Agency Fees to review the variety of transfer agency fee structures throughout the industry and Fidelity's competitive positioning with respect to industry participants.
Investment in a Large Fund Family. The Board considered the benefits to shareholders of investing in a Fidelity fund, including the benefits of investing in a fund that is part of a large family of funds offering a variety of investment disciplines and providing a large variety of mutual fund investor services. The Board noted that Fidelity had taken, or had made recommendations that resulted in the Fidelity funds taking, a number of actions over the previous year that benefited particular funds, including (i) continuing to dedicate additional resources to investment research and to the support of the senior management team that oversees asset management; (ii) continuing efforts to enhance Fidelity's global research capabilities; (iii) launching new funds and making other enhancements to meet client needs; (iv) reducing management fees and total expenses for certain index funds and diversified international funds; (v) continuing to launch dedicated lower cost underlying funds to meet portfolio construction needs related to expanding underlying fund options for Fidelity funds of funds, specifically for the Freedom Fund product lines; (vi) rationalizing product lines and gaining increased efficiencies through fund mergers; (vii) launching active fixed-income exchange-traded funds; (viii) continuing to develop, acquire and implement systems and technology to improve services to the funds and information security and to increase efficiency; (ix) implementing investment enhancements to further strengthen Fidelity's target date product line to increase investors' probability of success in achieving their goals; (x) modifying the eligibility criteria for certain share classes to accommodate roll-over assets from employer-sponsored retirement plans; (xi) launching a new Class W of the Freedom Index Funds to attract and retain Fidelity record-kept retirement plan assets; and (xii) implementing changes to Fidelity's money market product line in response to recent money market regulatory reforms.
Investment Performance. The Board considered whether the fund has operated in accordance with its investment objective, as well as its record of compliance with its investment restrictions and its performance history. The Board noted that there were portfolio management changes for the fund in January 2014 and January 2015.
The Board took into account discussions with representatives of the Investment Advisers about fund investment performance that occur at Board meetings throughout the year. In this regard the Board noted that as part of regularly scheduled fund reviews and other reports to the Board on fund performance, the Board considers annualized return information for the fund, for different time periods, measured against a securities market index ("benchmark index") and a peer group of funds with similar objectives ("peer group"), if any. In its evaluation of fund investment performance, the Board gave particular attention to information indicating changes in performance of certain Fidelity funds for specific time periods and discussed with the Investment Advisers the reasons for any overperformance or underperformance.
In addition to reviewing absolute and relative fund performance, the Independent Trustees periodically consider the appropriateness of fund performance metrics in evaluating the results achieved. In general, the Independent Trustees believe that fund performance should be evaluated based on net performance (after fees and expenses) of both the highest performing and lowest performing fund share classes, where applicable, compared to appropriate benchmark indices, over appropriate time periods that may include full market cycles, and compared to peer groups, as applicable, over the same periods, taking into account relevant factors including the following: general market conditions; issuer-specific information; and fund cash flows and other factors.
The Independent Trustees recognize that shareholders evaluate performance on a net basis over their own holding periods, for which one-, three-, and five-year periods are often used as a proxy. For this reason, the performance information reviewed by the Board also included net cumulative calendar year total return information for the fund and an appropriate benchmark index and peer group for the most recent one-, three-, and five-year periods, as shown below. Returns are shown compared to the 25th percentile (top of box, 75% beaten) and 75th percentile (bottom of box, 25% beaten) of the peer universe.
VIP Balanced Portfolio
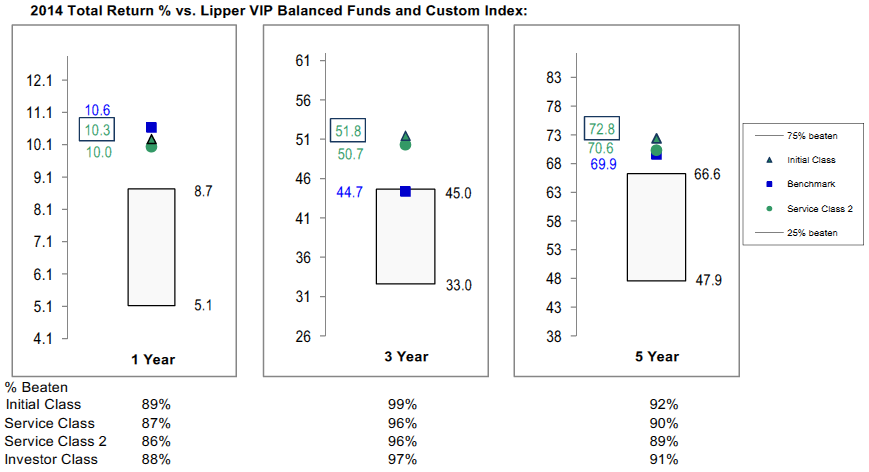
Based on its review, the Board concluded that the nature, extent, and quality of services provided to the fund under the Advisory Contracts should benefit the shareholders of the fund.
Competitiveness of Management Fee and Total Expense Ratio. The Board considered the fund's management fee and total expense ratio compared to "mapped groups" of competitive funds and classes created for the purpose of facilitating the Trustees' competitive analysis of management fees and total expenses. Fidelity creates "mapped groups" by combining similar Lipper investment objective categories that have comparable investment mandates. Combining Lipper investment objective categories aids the Board's management fee and total expense ratio comparisons by broadening the competitive group used for comparison.
Management Fee. The Board considered two proprietary management fee comparisons for the 12-month periods shown in basis points (BP) in the chart below. The group of Lipper funds used by the Board for management fee comparisons is referred to below as the "Total Mapped Group." The Total Mapped Group is broader than the Lipper peer group used by the Board for performance comparisons because the Total Mapped Group combines several Lipper investment objective categories while the Lipper peer group does not. The Total Mapped Group comparison focuses on a fund's standing in terms of gross management fees before expense reimbursements or caps relative to the total universe of funds with comparable investment mandates, regardless of whether their management fee structures also are comparable. Funds with comparable investment mandates offer exposure to similar types of securities. Funds with comparable management fee structures have similar management fee contractual arrangements (
e.g., flat rate charged for advisory services, all-inclusive fee rate,
etc.). "TMG %" represents the percentage of funds in the Total Mapped Group that had management fees that were lower than the fund's. For example, a hypothetical TMG % of 20% would mean that 80% of the funds in the Total Mapped Group had higher, and 20% had lower, management fees than the fund. The fund's actual TMG %s and the number of funds in the Total Mapped Group are in the chart below. The "Asset-Size Peer Group" (ASPG) comparison focuses on a fund's standing relative to a subset of non-Fidelity funds within the Total Mapped Group that are similar in size and management fee structure without taking into account performance adjustments, if any. For example, if a fund is in the first quartile of the ASPG, the fund's management fee ranks in the least expensive or lowest 25% of funds in the ASPG. The ASPG represents at least 15% of the funds in the Total Mapped Group with comparable asset size and management fee structures, subject to a minimum of 50 funds (or all funds in the Total Mapped Group if fewer than 50). Additional information, such as the ASPG quartile in which the fund's management fee rate ranked, is also included in the chart and considered by the Board.
VIP Balanced Portfolio
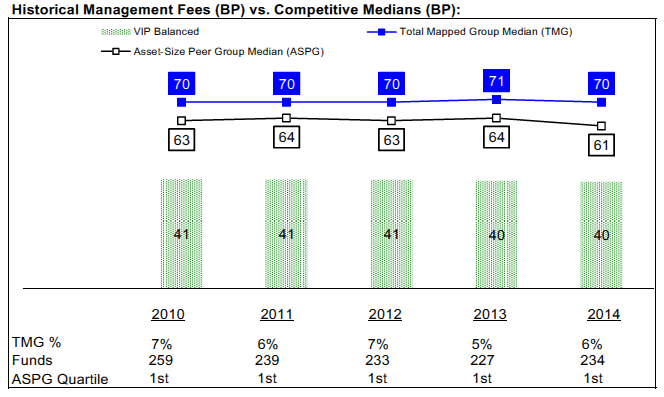
The Board noted that the fund's management fee rate ranked below the median of its Total Mapped Group and below the median of its ASPG for 2014.
The Board noted that, in 2014, the ad hoc Committee on Group Fee was formed by it and other Fidelity fund boards to conduct an in-depth review of the "group fee" component of the management fee of funds with such management fee structures. Committee focus included the mechanics of the group fee, the competitive landscape of group fee structures, Fidelity funds with no group fee component and investment products not included in group fee assets. The Board also considered that, for funds subject to the group fee, FMR agreed to voluntarily waive fees over a specified period of time in amounts designed to account for assets converted from certain funds to certain collective investment trusts.
The Board also noted that, in 2013, the ad hoc Committee on Management Fees was formed to conduct an in-depth review of the management fee rates of Fidelity's active equity mutual funds. The Committee focused on the following areas: (i) standard fee structures; (ii) research consumption and trading evolution; (iii) management fee competitiveness/profitability by category; and (iv) factors that drive institutional pricing.
Based on its review, the Board concluded that the fund's management fee is fair and reasonable in light of the services that the fund receives and the other factors considered.
Total Expense Ratio. In its review of each class's total expense ratio, the Board considered the fund's management fee as well as other fund or class expenses, as applicable, such as transfer agent fees, pricing and bookkeeping fees, fund-paid 12b-1 fees, and custodial, legal, and audit fees. The Board also noted that Fidelity may agree to waive fees and expenses from time to time, and the extent to which, if any, it has done so for the fund. As part of its review, the Board also considered the current and historical total expense ratios of each class of the fund compared to competitive fund median expenses. Each class of the fund is compared to those funds and classes in the Total Mapped Group (used by the Board for management fee comparisons) that have a similar sales load structure.
The Board noted that the total expense ratio of each class ranked below its competitive median for 2014.
Fees Charged to Other Fidelity Clients. The Board also considered Fidelity fee structures and other information with respect to clients of Fidelity, such as other funds advised or subadvised by Fidelity, pension plan clients, and other institutional clients with similar mandates. The Board noted the findings of the 2013 ad hoc joint committee (created with the board of other Fidelity funds), which reviewed and compared Fidelity's institutional investment advisory business with its business of providing services to the Fidelity funds, including the differences in services provided, fees charged, and costs incurred, as well as competition in their respective marketplaces.
Based on its review of total expense ratios and fees charged to other Fidelity clients, the Board concluded that the total expense ratio of each class of the fund was reasonable in light of the services that the fund and its shareholders receive and the other factors considered.
Costs of the Services and Profitability. The Board considered the revenues earned and the expenses incurred by Fidelity in conducting the business of developing, marketing, distributing, managing, administering and servicing the fund and servicing the fund's shareholders. The Board also considered the level of Fidelity's profits in respect of all the Fidelity funds.
On an annual basis, Fidelity presents to the Board information about the profitability of its relationship with the fund. Fidelity calculates profitability information for each fund, as well as aggregate profitability information for groups of Fidelity funds and all Fidelity funds, using a series of detailed revenue and cost allocation methodologies which originate with the books and records of Fidelity on which Fidelity's audited financial statements are based. The Audit Committee of the Board reviews any significant changes from the prior year's methodologies.
PricewaterhouseCoopers LLP (PwC), independent registered public accounting firm and auditor to Fidelity and certain Fidelity funds, has been engaged annually by the Board as part of the Board's assessment of Fidelity's profitability analysis. PwC's engagement includes the review and assessment of the methodologies used by Fidelity in determining the revenues and expenses attributable to Fidelity's mutual fund business, and completion of agreed-upon procedures in respect of the mathematical accuracy of fund profitability and its conformity to established allocation methodologies. After considering PwC's reports issued under the engagement and information provided by Fidelity, the Board concluded that while other allocation methods may also be reasonable, Fidelity's profitability methodologies are reasonable in all material respects.
The Board also reviewed Fidelity's non-fund businesses and fall-out benefits related to the mutual fund business as well as cases where Fidelity's affiliates may benefit from or be related to the fund's business.
The Board considered the costs of the services provided by and the profits realized by Fidelity in connection with the operation of the fund and was satisfied that the profitability was not excessive.
Economies of Scale. The Board considered whether there have been economies of scale in respect of the management of the Fidelity funds, whether the Fidelity funds (including the fund) have appropriately benefited from any such economies of scale, and whether there is potential for realization of any further economies of scale. The Board considered the extent to which the fund will benefit from economies of scale as assets grow through increased services to the fund, through waivers or reimbursements, or through fee or expense ratio reductions. The Board also noted that in 2013, it and the boards of other Fidelity funds created an ad hoc committee (the Economies of Scale Committee) to analyze whether Fidelity attains economies of scale in respect of the management and servicing of the Fidelity funds, whether the Fidelity funds have appropriately benefited from such economies of scale, and whether there is potential for realization of any further economies of scale.
The Board recognized that the fund's management contract incorporates a "group fee" structure, which provides for lower group fee rates as total group assets increase, and for higher group fee rates as total group assets decrease (with "group assets" defined to include fund assets under FMR's management plus sector fund assets previously under FMR's management and currently managed by Fidelity SelectCo, LLC). FMR calculates the group fee rates based on a tiered asset "breakpoint" schedule that varies based on asset class. The Board considered that the group fee is designed to deliver the benefits of economies of scale to fund shareholders when total Fidelity fund assets increase, even if assets of any particular fund are unchanged or have declined, because some portion of Fidelity's costs are attributable to services provided to all Fidelity funds, and all funds benefit if those costs can be allocated among more assets. The Board concluded that, given the group fee structure, fund shareholders will benefit from lower management fees as group assets increase at the fund complex level, regardless of whether Fidelity achieves any such economies of scale.
The Board concluded, taking into account the analysis of the Economies of Scale Committee, that economies of scale, if any, are being appropriately shared between fund shareholders and Fidelity.
Additional Information Requested by the Board. In order to develop fully the factual basis for consideration of the Fidelity funds' Advisory Contracts, the Board requested and received additional information on certain topics, including: (i) fund performance trends and Fidelity's long-term strategies for certain funds; (ii) the various share classes employed by Fidelity and the attributes of each class, together with similar information on the distribution and servicing payments made by Fidelity or the funds to third-party participants in the distribution channels; (iii) fund profitability, and fund performance in relation to fund profitability; (iv) the methodology with respect to evaluating competitive fund data and peer group classifications and fee comparisons; (v) annual fund profitability margins, with particular focus on certain funds with negative margins; (vi) the realization of fall-out benefits in certain Fidelity business units;
(vii) economies of scale and the way in which they are shared with fund shareholders;(viii) Fidelity's group fee structures, including the group fee schedule of breakpoints;(ix) the impact of cost containment measures on the funds; and (x) the transfer agent fee structure.
Based on its evaluation of all of the conclusions noted above, and after considering all factors it believed relevant, the Board concluded that the advisory fee structures are fair and reasonable, and that the fund's Advisory Contracts should be renewed.
VIPBAL-ANN-0216
1.540208.118
Item 2.
Code of Ethics
As of the end of the period, December 31, 2015, Variable Insurance Products Fund III (the trust) has adopted a code of ethics, as defined in Item 2 of Form N-CSR, that applies to its President and Treasurer and its Chief Financial Officer. A copy of the code of ethics is filed as an exhibit to this Form N-CSR.
Item 3.
Audit Committee Financial Expert
The Board of Trustees of the trust has determined that Joseph Mauriello is an audit committee financial expert, as defined in Item 3 of Form N-CSR. Mr. Mauriello is independent for purposes of Item 3 of Form N-CSR.
Item 4.
Principal Accountant Fees and Services
Fees and Services
The following table presents fees billed by Deloitte & Touche LLP, the member firms of Deloitte Touche Tohmatsu, and their respective affiliates (collectively, “Deloitte Entities”) in each of the last two fiscal years for services rendered to VIP Balanced Portfolio, VIP Dynamic Capital Appreciation Portfolio, VIP Growth & Income Portfolio, VIP Growth Opportunities Portfolio and VIP Value Strategies Portfolio (the “Funds”):
Services Billed by Deloitte Entities
December 31, 2015 FeesA
| | | | |
| Audit Fees | Audit-Related Fees | Tax Fees | All Other Fees |
VIP Balanced Portfolio | $56,000 | $- | $6,500 | $1,200 |
VIP Dynamic Capital Appreciation Portfolio | $38,000 | $- | $6,000 | $700 |
VIP Growth & Income Portfolio | $47,000 | $- | $6,600 | $900 |
VIP Growth Opportunities Portfolio | $53,000 | $- | $4,900 | $800 |
VIP Value Strategies Portfolio | $44,000 | $- | $7,100 | $700 |
| | | | |
| Audit Fees | Audit-Related Fees | Tax Fees | All Other Fees |
VIP Balanced Portfolio | $54,000 | $- | $6,600 | $1,200 |
VIP Dynamic Capital Appreciation Portfolio | $36,000 | $- | $6,300 | $700 |
VIP Growth & Income Portfolio | $45,000 | $- | $7,500 | $800 |
VIP Growth Opportunities Portfolio | $44,000 | $- | $4,900 | $700 |
VIP Value Strategies Portfolio | $43,000 | $- | $7,100 | $700 |
A Amounts may reflect rounding.
The following table presents fees billed by PricewaterhouseCoopers LLP (“PwC”) in each of the last two fiscal years for services rendered to VIP Mid Cap Portfolio (the “Fund”):
Services Billed by PwC
December 31, 2015 FeesA
| | | | |
| Audit Fees | Audit-Related Fees | Tax Fees | All Other Fees |
VIP Mid Cap Portfolio | $62,000 | $- | $3,500 | $4,800 |
| | | | |
| Audit Fees | Audit-Related Fees | Tax Fees | All Other Fees |
VIP Mid Cap Portfolio | $55,000 | $- | $3,200 | $4,700 |
A Amounts may reflect rounding.
The following table presents fees billed by PwC and Deloitte Entities that were required to be approved by the Audit Committee for services that relate directly to the operations and financial reporting of the Funds and that are rendered on behalf of Fidelity Management & Research Company (“FMR”) and entities controlling, controlled by, or under common control with FMR (not including any sub-adviser whose role is primarily portfolio management and is subcontracted with or overseen by another investment adviser) that provide ongoing services to the Funds (“Fund Service Providers”):
Services Billed by Deloitte Entities
| | |
| December 31, 2015A | December 31, 2014A |
Audit-Related Fees | $- | $- |
Tax Fees | $10,000 | $- |
All Other Fees | $- | $650,000 |
A Amounts may reflect rounding.
Services Billed by PwC
| | |
| December 31, 2015A | December 31, 2014A |
Audit-Related Fees | $5,290,000 | $5,950,000 |
Tax Fees | $- | $- |
All Other Fees | $- | $- |
A Amounts may reflect rounding.
“Audit-Related Fees” represent fees billed for assurance and related services that are reasonably related to the performance of the fund audit or the review of the fund's financial statements and that are not reported under Audit Fees.
“Tax Fees” represent fees billed for tax compliance, tax advice or tax planning that relate directly to the operations and financial reporting of the fund.
“All Other Fees” represent fees billed for services provided to the fund or Fund Service Provider, a significant portion of which are assurance related, that relate directly to the operations and financial reporting of the fund, excluding those services that are reported under Audit Fees, Audit-Related Fees or Tax Fees.
Assurance services must be performed by an independent public accountant.
* * *
The aggregate non-audit fees billed by PwC and Deloitte Entities for services rendered to the Funds, FMR (not including any sub-adviser whose role is primarily portfolio management and is subcontracted with or overseen by another investment adviser), and any Fund Service Provider for each of the last two fiscal years of the Funds are as follows:
| | |
Billed By | December 31, 2015 A | December 31, 2014 A,B |
PwC | $5,655,000 | $8,110,000 |
Deloitte Entities | $70,000 | $1,840,000 |
A Amounts may reflect rounding.
B Reflects current period presentation.
The trust's Audit Committee has considered non-audit services that were not pre-approved that were provided by PwC and Deloitte Entities to Fund Service Providers to
be compatible with maintaining the independence of PwC and Deloitte Entities in their audits of the Funds, taking into account representations from PwC and Deloitte Entities, in accordance with Public Company Accounting Oversight Board rules, regarding their independence from the Funds and their related entities and FMR’s review of the appropriateness and permissibility under applicable law of such non-audit services prior to their provision to the Fund Service Providers.
Audit Committee Pre-Approval Policies and Procedures
The trust’s Audit Committee must pre-approve all audit and non-audit services provided by a fund’s independent registered public accounting firm relating to the operations or financial reporting of the fund. Prior to the commencement of any audit or non-audit services to a fund, the Audit Committee reviews the services to determine whether they are appropriate and permissible under applicable law.
The Audit Committee has adopted policies and procedures to, among other purposes, provide a framework for the Committee’s consideration of non-audit services by the audit firms that audit the Fidelity funds. The policies and procedures require that any non-audit service provided by a fund audit firm to a Fidelity fund and any non-audit service provided by a fund auditor to a Fund Service Provider that relates directly to the operations and financial reporting of a Fidelity fund (“Covered Service”) are subject to approval by the Audit Committee before such service is provided.
All Covered Services must be approved in advance of provision of the service either: (i) by formal resolution of the Audit Committee, or (ii) by oral or written approval of the service by the Chair of the Audit Committee (or if the Chair is unavailable, such other member of the Audit Committee as may be designated by the Chair to act in the Chair’s absence). The approval contemplated by (ii) above is permitted where the Treasurer determines that action on such an engagement is necessary before the next meeting of the Audit Committee.
Non-audit services provided by a fund audit firm to a Fund Service Provider that do not relate directly to the operations and financial reporting of a Fidelity fund are reported to the Audit Committee on a periodic basis.
Non-Audit Services Approved Pursuant to Rule 2-01(c)(7)(i)(C) and (ii) of Regulation S-X (“De Minimis Exception”)
There were no non-audit services approved or required to be approved by the Audit Committee pursuant to the De Minimis Exception during the Funds’ last two fiscal years relating to services provided to (i) the Funds or (ii) any Fund Service Provider that relate directly to the operations and financial reporting of the Funds.
Item 5.
Audit Committee of Listed Registrants
Not applicable.
Item 6.
Investments
(a)
Not applicable.
(b)
Not applicable
Item 7.
Disclosure of Proxy Voting Policies and Procedures for Closed-End Management Investment Companies
Not applicable.
Item 8.
Portfolio Managers of Closed-End Management Investment Companies
Not applicable.
Item 9.
Purchase of Equity Securities by Closed-End Management Investment Company and Affiliated Purchasers
Not applicable.
Item 10.
Submission of Matters to a Vote of Security Holders
There were no material changes to the procedures by which shareholders may recommend nominees to the trust’s Board of Trustees.
Item 11.
Controls and Procedures
(a)(i) The President and Treasurer and the Chief Financial Officer have concluded that the trust’s disclosure controls and procedures (as defined in Rule 30a-3(c) under the Investment Company Act) provide reasonable assurances that material information relating to the trust is made known to them by the appropriate persons, based on their evaluation of these controls and procedures as of a date within 90 days of the filing date of this report.
(a)(ii) There was no change in the trust’s internal control over financial reporting (as defined in Rule 30a-3(d) under the Investment Company Act) that occurred during the second fiscal quarter of the period covered by this report that has materially affected, or is reasonably likely to materially affect, the trust’s internal control over financial reporting.
Item 12.
Exhibits
| | |
(a) | (1) | Code of Ethics pursuant to Item 2 of Form N-CSR is filed and attached hereto as EX-99.CODE ETH. |
(a) | (2) | Certification pursuant to Rule 30a-2(a) under the Investment Company Act of 1940 (17 CFR 270.30a-2(a)) is filed and attached hereto as Exhibit 99.CERT. |
(a) | (3) | Not applicable. |
(b) | | Certification pursuant to Rule 30a-2(b) under the Investment Company Act of 1940 (17 CFR 270.30a-2(b)) is furnished and attached hereto as Exhibit 99.906CERT. |
SIGNATURES
Pursuant to the requirements of the Securities Exchange Act of 1934 and the Investment Company Act of 1940, the registrant has duly caused this report to be signed on its behalf by the undersigned, thereunto duly authorized.
Variable Insurance Products Fund III
| |
By: | /s/Kenneth B. Robins |
| Kenneth B. Robins |
| President and Treasurer |
| |
Date: | February 24, 2016 |
Pursuant to the requirements of the Securities Exchange Act of 1934 and the Investment Company Act of 1940, this report has been signed below by the following persons on behalf of the registrant and in the capacities and on the dates indicated.
| |
By: | /s/Kenneth B. Robins |
| Kenneth B. Robins |
| President and Treasurer |
| |
Date: | February 24, 2016 |
| |
By: | /s/Howard J. Galligan III |
| Howard J. Galligan III |
| Chief Financial Officer |
| |
Date: | February 24, 2016 |