OMB APPROVAL
OMB Number: 3235-0570
Expires: January 31, 2017
Estimated average burden
hours per response 20.6
UNITED STATES
SECURITIES AND EXCHANGE COMMISSION
Washington, D.C. 20549
FORM N-CSR
CERTIFIED SHAREHOLDER REPORT OF REGISTERED MANAGEMENT
INVESTMENT COMPANIES
Investment Company Act file number 811-01743
The Alger Funds II
(Exact name of registrant as specified in charter)
360 Park Avenue South New York, New York 10010
(Address of principal executive offices) (Zip code)
Mr. Hal Liebes
Fred Alger Management, Inc.
360 Park Avenue South
New York, New York 10010
(Name and address of agent for service)
Registrant's telephone number, including area code: 212-806-8800
Date of fiscal year end: October 31
Date of reporting period: October 31, 2016
ITEM 1. REPORTS TO STOCKHOLDERS.
Table of Contents
The Alger Funds II
|
| Shareholders’ Letter (Unaudited) | 1 |
| Fund Highlights (Unaudited) | 13 |
| Portfolio Summary (Unaudited) | 23 |
| Schedules of Investments | 24 |
| Statements of Assets and Liabilities | 54 |
| Statements of Operations | 60 |
| Statements of Changes in Net Assets | 63 |
| Financial Highlights | 68 |
| Notes to Financial Statements | 89 |
| Report of Independent Registered Public Accounting Firm | 122 |
Additional Information (Unaudited) | 123 |
Go Paperless With Alger Electronic Delivery Service
Alger is pleased to provide you with the ability to access regulatory materials online.
When documents such as prospectuses and annual and semi-annual reports are
available, we’ll send you an e-mail notification with a convenient link that will take you
directly to the fund information on our website. To sign up for this free service, simply
enroll at www.icsdelivery.com/alger.
Shareholders' Letter (Unaudited) October 31, 2016
Dear Shareholders,
Dangers of Bond-Like Equities Materialize
In our last shareholder letter, we discussed the risks of investors stampeding into bond-like
equities, with the trend being particularly strong in the U.S. In that letter, we noted that
bond-like equities had outperformed the overall S&P 500 Index but urged investors to avoid
joining the stampede because the category of equities is highly vulnerable to rising interest
rates and other risks. Due to the strong results of bond-like stocks in the months leading
up to July, U.S. equities as measured by the S&P 500 generated a 4.51% return for the one-
year reporting period ended October 31, 2016, but the inherent risks that we had identified
started to surface in a spectacular fashion.
During the first eight months of the reporting period, the bond-like Telecommunications
sector within the S&P 500 led with a 25.4% return. With a massive reversal, it became the
worst performing sector with a -11.7% return for the last four months of the reporting
period. Utilities and Consumer Staples, which were the second- and third-best performing
sectors during the first eight months of the reporting period with double-digit gains, were
the fourth- and fifth-worst performers with negative returns during the final four months
of the reporting period. Growth sectors, meanwhile, led with Information Technology
generating a 12.8% return during the last four months of the reporting period.
Equities Advance
The strong market leadership of bond-like stocks early in the reporting period created
challenging conditions for firms such as Alger that invest in companies with attractive
fundamentals and strong potential for generating earnings growth. Despite those challenges,
we continued with our more than 50-year tradition of employing extensive bottom-up
research to identify and invest in well managed companies with strong fundamentals,
including the potential for generating earnings growth. Since our founding in 1964, we have
believed that those types of companies offer the greatest potential for creating wealth for
our clients.
Emerging Markets Shine
Looking beyond the U.S., emerging markets were a bright spot during the reporting period
with strengthening commodity prices, attractive valuations, and improving economic
data helping the MSCI Emerging Markets Index rally 9.67%. Within the index, Brazil,
Hungary, Indonesia, Peru, Russia, Egypt, Taiwan, and Chile were among the strongest
performing countries. Mexico, Turkey, Qatar, Poland, and Greece, however, substantially
underperformed the overall return of the benchmark.
Our View of Risks and Bond-Like Equities
The rotation out of bond-like equities in the U.S. was no surprise at Alger. Indeed, in our last
letter, we identified the following risks associated with bond-like equities:
• Bond-like equities are highly interest-rate sensitive so investors who stam-
peded into the category of stocks faced substantial interest rate risk. With
record-low interest rates, the risk of rising rates was considerable.
- 1 -
• Due to the stampede, valuations of sectors with companies that offer stable
earnings and high dividend yields such as Consumer Staples were historically
high, especially relative to growth sectors. At of the start of the 12-month
reporting period, for example, the P/E ratios for Consumer Staples and Util-
ities sectors traded at 20% and 12% premiums respectively, to their 20-year
medians while Information Technology and Health Care traded with P/E
ratios that were 7% and 3%, respectively, below their 20-year medians. The
large disparity in valuations implied that growth stocks were more attractive
than bond-like equities.
• Investors focused on bond-like equities could miss the potentially strong re-
turns that result when leading companies with attractive fundamentals gener-
ate earnings growth. Importantly, massive forms of innovation, such as inter-
net-related technologies and health care advancements, are creating attractive
opportunities for companies to grow their earnings and reward investors.
Global Economy Takes a Toll on Bond-Like Equities
Various developments during the one-year reporting period fueled fears of rising interest
rates and inflation, which in turn sparked the dramatic investor rotation out of bond-like
sectors and into growth sectors. During the past few years, low commodity prices have
tempered inflation expectations, but that trend ended abruptly during the reporting period.
During the first 10 months of 2016, the multi-year decline in commodity prices reversed with
the Bloomberg Commodity Index gaining 8.3%. In the past, expectations that moderating
economic growth in China would limit commodity price increases also helped to temper
investors’ inflation expectations. During the reporting period, however, a more favorable
view of China emerged. Year-over-year industrial production in October of 2015 grew only
5.6% but from November of 2015 through September of this year, production growth
trended above 6%. In the U.S., inflation concerns were also stoked by a strengthening job
market creating wage pressures, with compensation increasing 2.8% during the 12-month
period ended October 31. Inflation expectations as measured by comparing the nominal yield
of a 10-year Treasury to its inflation protected counterpart also grew during the reporting
period with the spread increasing from 1.59% to 1.73%. Finally, anticipation that the Federal
Reserve would continue normalizing monetary policy supported expectations that interest
rates will rise. We believe that investors’ rotation into growth equities in response to those
developments was rational. Leading growth companies have potential for growing their
earnings, which can help offset the adverse impact of inflation and rising interest rates on
corporate fundamentals. Bond-like sectors such as Utilities, however, have less potential for
generating earnings growth, so they are susceptible to interest rate increases.
The Value of a Long-Term Perspective and Fundamental Research
Emotions can easily distort individuals’ views of reality, especially when it comes to
investing. We believe that the incorrect view that bond-like equities are the only way to
generate yield during times of low interest rates is an example of a distorted and potentially
costly perspective. This distorted view caused many investors to overlook growth stocks’
return of capital, which can be measured by total yield. Total yield is dividend yield plus
the share repurchase yield. As an example, at the end of June, the Information Technology
and Consumer Discretionary sectors offered total yields of 6.5% and 6.0%, respectively,
compared to the 4.7% total yield of Telecommunication Services and the 4.3% total yield
of Utilities.
- 2 -
In addition, performance of sectors is driven by three primary factors: dividends, earnings
growth, and changes to P/E ratios. During the reporting period, those three factors pointed
to growth sectors having strong potential for outperforming bond-like sectors. Data as of
the end of June illustrate this point, with consensus expectations having called for the bond-
like Utilities and Consumer Staples sectors to generate earnings growth per share of 4%
and 7%, respectively, over the next three to five years. For this analysis, we reduced earnings
growth expectations by 20% simply to have a conservative outlook. For the Utilities and
Consumer Staples sectors, the dividend yield for the prior 12 months was 4% and 3%.
For both sectors, a reversion to the 20-year P/E median would imply a decline of 5%.
The potential changes in earnings and P/E ratios combined with dividend payments would
result in hypothetical returns of 3% for Utilities and 5% for Consumer Staples.
After factoring in the previously mentioned 20% reduction, growth sectors such as
Information Technology, Health Care, and Consumer Discretionary could potentially have
earnings growth ranging from 8% to 14%. As of June 30, those sectors offered 2% dividend
yields for the trailing 12 months. In the event of a reversion to 20-year medians, the sectors’
P/E ratios would increase 2%, which would result in hypothetical returns ranging from 12%
to 18%.
The U.S. Presidential Election
Emotions also played a role when investors weighed in on the U.S. presidential campaign
and the subsequent victory of Donald Trump. The election was a highly emotional event
for many Americans, but it is important to remember that corporate fundamentals and
economic cycles ultimately drive market performance. With that in mind, we urge investors
to focus on corporate fundamentals and avoid making large bets on the potential policies
of a new president.
As Jason Zweig of the Wall Street Journal points out, investors have a poor track record
of making bets on presidents. Regulations from President Barack Obama were expected to
hurt the performance of Health Care stocks, but the sector has outperformed the overall
market during his presidency. Increased military spending under President George W. Bush,
furthermore, had a counterintuitive impact on defense stocks, with the category of equities
declining in 2001 and 2002.
Reasons for Optimism
Rather than chasing dividend yields or making bets on potential policies of President-elect
Trump, we believe equity investors should assess the ongoing U.S. economic recovery, strong
corporate fundamentals, and the rapid pace of innovation. Those factors, we maintain, are
likely to support growth equities in the foreseeable future. The economy has benefited from
an expanding labor market that has created 15.5 million jobs since February of 2010. With
a strengthening job market, compensation as measured by hourly wages increased 2.8%
during the 12-month reporting period. Personal finances are also encouraging, with the
Household Debt Service Ratio, which is the ratio of total required household debt payments
to total disposable income, having improved substantially. After hitting a high of 13.20% in
the fourth quarter of 2007, the ratio has declined to an attractive level of only 9.98% as of
the second quarter of this year, according to the Federal Reserve.
We believe corporate fundamentals are also encouraging. According to FactSet Research
Systems, S&P 500 companies (ex-financials) held $1.45 trillion in cash at the end of the
- 3 -
second quarter of this year. Despite declining 0.2% from the prior quarter, it was still the
second-largest amount in at least 10 years.
As mentioned earlier, corporations are using their large cash positions to reward shareholders
with dividends and aggressive share repurchase programs. In the second quarter, S&P 500
companies (ex-financials) paid a total of $176.6 billion in dividends and share repurchases,
according to FactSet. It was a 1.7% year-over-year decrease, but the 12-month period ended
June 30 was strong with buybacks and dividends growing 6.1% and 6.6%, respectively,
compared to the 12-month period ended in June of 2015.
We maintain that investors should also assess the attractive valuations of growth sectors
relative to bond-like sectors. As of the end of the reporting period, the Information
Technology sector within the S&P 500 had a P/E ratio that was 2% below its 20-year
median. Health Care and Consumer Discretionary sectors had P/E ratios that were 15%
and 4%, respectively, below their 20-year medians. The P/E ratios for Consumer Staples and
Utilities, however, were at 21% and 20% premiums to their 20-year medians.
We also believe that innovation that can help drive corporate earnings growth is strong
across the globe, thanks in large part to internet related technologies and advancements
in health care. At the same time, the adoption of new technologies by consumers and
corporations is accelerating. The internet, smartphones, ebooks, and social media illustrate
this trend, with each form of technology reaching 50% market penetration in a fraction of
the time that was required by washing machines, landline telephones, and dishwashers. At
the same time, medical innovation in orthopedic, cardiac, and cancer is occurring rapidly.
Our optimism also extends to emerging markets. We believe that the estimated 4.9% 2016
earnings growth rate for MSCI Emerging Markets Index constituents, which is higher than
for both the MSCI Europe, Australasia, and Far East Index (EAFE) and the S&P 500 Index,
is attractive. Emerging markets are also attractive when considering that the asset class is
trading at a P/E discount of 22% to developed markets. We continue to believe that a 10%
to 12% discount is appropriate.
Conclusion
We urge investors to embrace an investment strategy that employs intensive research to
identify companies with strong fundamentals and potential for earnings growth. At the
same time, investors should maintain a long-term perspective and avoid the risky behavior
of focusing on bond-like equities. At Alger, we will continue to focus on our fundamental
research and disciplined investment approach as we seek to generate attractive returns for
our valued clients.
Portfolio Matters
Alger Spectra Fund
The Alger Spectra Fund returned -0.36% for the fiscal year ended October 31, 2016,
compared to the 2.08% return of the Russell 3000 Growth Index.
During the reporting period, the largest portfolio sector weightings were Information
Technology and Consumer Discretionary. The largest sector overweight was Information
Technology and the largest sector underweight was Consumer Staples. The Information
Technology and Consumer Discretionary sectors provided the largest contributions to
- 4 -
relative performance while Health Care and Industrials were among sectors that detracted
from results.
For the reporting period, the Fund’s average portfolio allocation to long positions, which
was increased by leverage, was 99.69% of assets. In aggregate, long positions contributed to
absolute performance. The Fund’s average allocation to short positions was -2.86%. Short
positions detracted from results.
Among the most important contributors to performance were Facebook, Inc., Cl. A;
Microsoft Corp.; Alphabet, Inc., Cl. C; and UnitedHealth Group, Inc. Shares of online
retailer and cloud-services provider Amazon.com, Inc. also contributed to performance.
During the second quarter of 2016, the company’s management announced strong year-
over-year results for the first quarter and provided encouraging guidance, a result of Amazon.
com’s attractive product pricing and the convenience of online shopping. Amazon’s cloud-
computing services have also generated strong results.
Conversely, detracting from overall results were Allergan PLC.; Vertex Pharmaceuticals,
Inc.; LinkedIn Corp., Cl. A; and Signet Jewelers Ltd. Shares of Norwegian Cruise Line
Holdings Ltd. also detracted from performance. During the second quarter of 2016, shares
of Norwegian Cruise Line Holdings underperformed after the company’s management
issued guidance that fell below expectations. Management also said it expects to face higher
costs.
Among short positions, Exxon Mobil Corp. contributed to performance. Exxon Mobil
is a global energy producer and marketer. Persistent shortfalls in unit volume production
throughout the year due to issues ranging from Canadian wildfires to Nigerian production
disruptions resulting from local conflicts caused the price of Exxon Mobil shares to
decline. Additionally, the company appeared to have moved beyond peak profitability in its
downstream and refining operations. Short selling entails selling borrowed stock with the
goal of buying the stock in the future at a lower price and then returning the security to the
lender. As the price of Exxon Mobil shares declined, the portfolio’s cost of purchasing the
stock declined, resulting in the position supporting performance.
A short position on LED lighting company Acuity Brands, Inc., however, detracted from
results. The LED industry has been experiencing weakening revenues, but Acuity has been
outperforming its overall sector. As the price of Acuity Brands stock climbed, the cost of
replacing the security increased and hurt portfolio performance.
Alger Green Fund
The Alger Green Fund returned -1.03% for the fiscal year ended October 31, 2016,
compared to the 2.08% return of the Russell 3000 Growth Index.
The Fund seeks long-term capital appreciation by investing at least 80% of its net assets in
equity securities of companies of any size that, in the opinion of the Fund’s management,
conduct their business in an environmentally sustainable manner while demonstrating
promising growth potential. The Fund’s performance, therefore, can be challenged during
times when investor enthusiasm for environmentally sustainable companies declines, but it
can benefit when investors favor such companies.
- 5 -
During the reporting period, the largest portfolio sector weightings were Information
Technology and Consumer Discretionary. The largest sector overweight was Industrials
and the largest sector underweight was Consumer Staples. The Health Care and Industrials
sectors provided the greatest contributions to relative performance while Consumer
Discretionary and Information Technology were among sectors that detracted from results.
Among the most important contributors to performance were Amazon.com, Inc.; Tetra
Tech, Inc.; Waste Management, Inc.; and Xylem, Inc. Shares of social network operator
Facebook, Inc., Cl. A also contributed to performance. The shares performed strongly
in response to the company continuing to take advertising market share from print and
television media. We believe investors have also been encouraged by the growth of
Instagram, which is the company’s video- and photo-sharing network.
Conversely, detracting from performance were Chipotle Mexican Grill, Inc.; Acuity Brands,
Inc.; NIKE, Inc., Cl. B; and First Solar, Inc. Shares of global pharmaceuticals company
Allergan PLC. also detracted from results. Performance of Allergan shares weakened in
response to concerns that a new U.S. president may support regulations that could block
acquisition activity. An internal investigation at Valeant Pharmaceuticals International, Inc.,
furthermore, cast a shadow over the pharmaceutical industry.
Alger Mid Cap Focus Fund
The Alger Mid Cap Focus Fund returned -9.26% for the fiscal year ended October 31, 2016,
compared to the 0.40% return of the Russell Midcap Growth Index. Prior to December
30, 2015, the Fund followed a different investment strategy under the name “Alger Analyst
Fund” and was managed by a different portfolio manager.
During the reporting period, the largest portfolio sector weightings were Consumer
Discretionary and Information Technology. The largest sector overweight was Information
Technology and the largest sector underweight was Consumer Staples. The Real Estate and
Utilities sectors had neutral impacts on relative performance while Information Technology
and Financials were among sectors that detracted from results.
Among the most important contributors to performance were FEI Company; Jarden Corp.;
Microsemi Corp.; and TransDigm Group, Inc. Shares of social network operator Facebook,
Inc., Cl. A also contributed to performance. The performance of shares of Facebook
benefited from developments identified in the Alger Green Fund discussion.
Conversely, Vertex Pharmaceuticals, Inc.; Weatherford International PLC.; Signet Jewelers
Ltd.; and Pacira Pharmaceuticals, Inc. were the largest detractors from performance. Shares
of Norwegian Cruise Line Holdings Ltd. also detracted from results. Performance of shares
of Norwegian Cruise Line Holdings weakened in response to developments identified in the
Alger Spectra Fund discussion.
Alger Dynamic Opportunities Fund
The Alger Dynamic Opportunities Fund returned -4.22% for the fiscal year ended October
31, 2016, compared to the 4.51% return of the Fund’s benchmark, the S&P 500 Index.
The hedged equity Fund seeks long-term capital appreciation, downside protection, and
lower volatility by primarily investing in long and short exposures in equity securities of U.S.
- 6 -
companies. The Fund seeks to generate market-like equity returns over a full U.S. market
cycle. During shorter-term periods, the Fund may underperform when U.S. equity markets
generate strong gains, perform in line or modestly outperform when markets are flat, and
should outperform when markets decline.
During the reporting period, the Fund’s long exposure was 76.98% of assets. Long positions,
in aggregate, underperformed the Fund’s benchmark and detracted from performance.
The average exposure to short positions was -19.70% of assets. Short positions trailed the
performance of the Fund’s benchmark and detracted from results. Net exposure, which is
the difference between long and short exposure, was 57.28%.
Based on the net exposure of long and short positions, the largest sector weightings were
Information Technology and Health Care. Information Technology was the only sector
overweight and the largest underweight was Financials. Information Technology contributed
to relative performance while other sectors detracted from results.
GrubHub, Inc.; Amazon.com, Inc.; Microsoft Corp.; and Broadcom Ltd. were among
top detractors from performance. Shares of social network operator Facebook, Inc., Cl.
A also contributed to results. The performance of shares of Facebook benefited from
developments identified in the Alger Green Fund discussion.
LendingClub Corp.; Lions Gate Entertainment Corp.; Vertex Pharmaceuticals, Inc.; and
Allergan PLC. were among top detractors from performance. Shares of Norwegian Cruise
Line Holdings Ltd. also detracted from results. Performance of shares of Norwegian Cruise
Line Holdings weakened in response to developments identified in the Alger Spectra Fund
discussion.
Among short positions, Community Health Systems, Inc. contributed to performance. The
company is one of the largest operators of non-urban hospitals in the U.S. It preannounced
disappointing earnings that resulted from rural markets having the industry’s worst unit
volume growth. In addition, issues with the prior acquisition of hospital operator Health
Management Associates hurt results. Short selling entails selling borrowed stock with the
goal of buying the stock in the future at a lower price and then returning the security to
the lender. As the price of Community Health Systems declined, the portfolio’s cost of
purchasing the stock declined, resulting in the position supporting performance.
Short position Acuity Brands, Inc., however, detracted from results. Its performance was
driven by developments identified in the Alger Spectra Fund discussion.
Alger Emerging Markets Fund
The Alger Emerging Markets Fund returned 6.41% for the fiscal year ended October 31,
2016, compared to the 9.67% return of its benchmark, the MSCI Emerging Markets Index.
During the reporting period, the largest portfolio sector weightings were Information
Technology and Financials. The largest sector overweight was Consumer Discretionary and
the largest sector underweight was Financials. The Health Care and Information Technology
sectors provided the greatest contributions to relative performance while Financials and
Industrials were among sectors that detracted from results.
- 7 -
Strong stock selection in Taiwan, India, and Columbia resulted in those countries providing
the greatest contributions to relative performance while Brazil, South Africa, and Russia
were among countries that detracted from results.
Among the most important contributors to performance were Tencent Holdings Ltd.;
Samsung Electronics Co., Ltd.; BB Seguridade Participacoes SA; and Gourmet Master Co.
Ltd. Shares of Alibaba Group Holdings Ltd. also contributed to performance. The Alibaba
Group runs the two largest online marketplaces in China, Taobao, a C2C marketplace,
and T-Mall, a B2C marketplace. It announced that it generated better-than-expected
revenues, margins, and gross merchandise value for the second quarter of 2016. (Gross
merchandise value is the value of all goods sold on Alibaba’s commerce platforms). It also
said sales through mobile devices accounted for 75% of Alibaba’s gross merchandise value.
Management also expressed optimism regarding its cloud services offering, which has
potential to break even in 2017.
Conversely, detracting from performance were Voltas Ltd.; China Life Insurance Co. Ltd.
Cl. H; Vipshop Holdings Ltd.; and Luxoft Holding, Inc., Cl. A. Shares of PAX Global
Technology Limited also detracted from performance. The company is the world’s third-
largest maker of electronic fund transfer point-of-sale terminals and is the market leader in
mainland China. Earlier in 2016, the company provided 2016 guidance that was weaker than
expected and investors have remained concerned about potential weakness in the company’s
domestic market and in other countries. During the first half of the year, expiring tax credits
hurt the company’s earnings, but the company still increased its payout ratio, which is the
relationship of dividends to earnings.
As active, bottom-up, fundamental investors, we will continue to focus on generating
attractive returns for our clients with our disciplined growth equity strategies. I thank you
for putting your trust in Alger.
I thank you for putting your trust in Alger.
Respectfully submitted,

Daniel C. Chung, CFA
Chief Investment Officer
Fred Alger Management, Inc.
_______________________________
FactSet Research Systems represented 0.00% of Alger assets under management as of
October 31, 2016.
Investors cannot invest directly in an index. Index performance does not reflect the
deduction for fees, expenses, or taxes.
This report and the financial statements contained herein are submitted for the general
information of shareholders of the funds. This report is not authorized for distribution to
prospective investors in a fund unless proceeded or accompanied by an effective prospectus
for the fund. Fund performance returns represent the 12-month period return of Class
- 8 -
A shares prior to the deduction of any sales charges and include the reinvestment of any
dividends or distributions.
The performance data quoted represents past performance, which is not an
indication or guarantee of future results.
Standardized performance results can be found on the following pages. The investment
return and principal value of an investment in a fund will fluctuate so that an investor’s
shares, when redeemed, may be worth more or less than their original cost. Current
performance may be lower or higher than the performance quoted. For performance data
current to the most recent month-end, visit us at www.alger.com or call us at (800) 992-3863.
The views and opinions of the funds’ management in this report are as of the date of the
Shareholders’ Letter and are subject to change at any time subsequent to this date. There
is no guarantee that any of the assumptions that formed the basis for the opinions stated
herein are accurate or that they will materialize. Moreover, the information forming the
basis for such assumptions is from sources believed to be reliable; however, there is no
guarantee that such information is accurate. Any securities mentioned, whether owned in a
fund or otherwise, are considered in the context of the construction of an overall portfolio
of securities and therefore reference to them should not be construed as a recommendation
or offer to purchase or sell any such security. Inclusion of such securities in a fund and
transactions in such securities, if any, may be for a variety of reasons, including, without
limitation, in response to cash flows, inclusion in a benchmark, and risk control. The
reference to a specific security should also be understood in such context and not viewed as
a statement that the security is a significant holding in a fund. Please refer to the Schedule
of Investments for each fund which is included in this report for a complete list of fund
holdings as of October 31, 2016. Securities mentioned in the Shareholders’ Letter, if not
found in the Schedule of Investments, may have been held by the funds during the fiscal
period.
A Word about Risk
Growth stocks tend to be more volatile than other stocks as the price of growth stocks
tends to be higher in relation to their companies’ earnings and may be more sensitive
to market, political and economic developments. Investing in the stock market involves
gains and losses and may not be suitable for all investors. Stocks of small- and mid-sized
companies are subject to greater risk than stocks of larger, more established companies
owing to such factors as limited liquidity, inexperienced management, and limited financial
resources. Investing in foreign securities involves additional risk (including currency risk,
risks related to political, social or economic conditions, and risks associated with foreign
markets, such as increased volatility, limited liquidity, less stringent regulatory and legal
system, and lack of industry and country diversification), and may not be suitable for all
investors. Special risks associated with investments in emerging country issuers include
exposure to currency fluctuations, less liquidity, less developed or less efficient trading
markets, lack of comprehensive company information, political instability and different
auditing and legal standards.
Foreign currencies are subject to risks caused by inflation, interest rates, budget deficits and
low savings rates, political factors and government controls. Some of the countries where a
fund can invest may have restrictions that could limit the access to investment opportunities.
The securities of issuers located in emerging markets can be more volatile and less liquid
- 9 -
than those of issuers in more mature economies. Investing in emerging markets involves
higher levels of risk, including increased information, market, and valuation risks, and may
not be suitable for all investors.
Funds that participate in leveraging are subject to the risk that the cost of borrowing
money to leverage will exceed the returns for securities purchased or that the securities
purchased may actually go down in value; thus, the fund’s net asset value can decrease more
quickly than if the fund had not borrowed. The Alger Spectra Fund and the Alger Dynamic
Opportunities Fund may engage in short sales, which presents additional risk. To engage in
a short sale, a fund arranges with a broker to borrow the security being sold short. In order
to close out its short position, a fund will replace the security by purchasing the security at
the price prevailing at the time of replacement. The fund will incur a loss if the price of the
security sold short has increased since the time of the short sale and may experience a gain
if the price has decreased since the short sale.
The Alger Green Fund's environmental focus may limit the investment options available
to the Fund and may result in lower returns than returns of funds not subject to such
investment considerations. For a more detailed discussion of the risks associated with a
fund, please see the prospectus.
Before investing, carefully consider a fund’s investment objective, risks, charges,
and expenses.
For a prospectus or a summary prospectus containing this and other information
about the Alger Funds II call us at (800) 992-3863 or visit us at www.alger.com.
Read it carefully before investing.
Fred Alger & Company, Incorporated, Distributor. Member NYSE Euronext,
SIPC.
NOT FDIC INSURED. NOT BANK GUARANTEED. MAY LOSE VALUE.
Definitions:
• S&P 500 index: An index of large company stocks considered representative
of the U.S. stock market.
• The Bloomberg Commodity Index reflects the performance of 20 commod-
ities, which are weighted to account for economic significance and market
liquidity.
• MSCI Emerging Markets Index: A free float-adjusted market capitalization
index designed to measure equity market performance in the global emerging
markets.
• The EAFE Index measures the performance of major international equity
markets as represented by 21 major MSCI indexes from Europe, Australia
and Southeast Asia.
• Russell 3000 Growth Index: An index of common stocks designed to track
performance of companies with greater than average growth orientation in
general.
• Russell Midcap Growth Index: An index of common stocks designed to
track performance of medium-capitalization companies with greater than
- 10 -
average growth orientation.
• FactSet Research Systems, Inc. is a multinational financial data and software
company.
- 11 -
| | | | | | |
| | FUND PERFORMANCE AS OF 9/30/16 (Unaudited) | | | |
| AVERAGE ANNUAL TOTAL RETURNS |
| | 1 YEAR | | 5 YEARS | | 10 YEARS | |
| Alger Spectra Class A | 4.97 | % | 15.39 | % | 10.85 | % |
| Alger Spectra Class C* | 8.94 | % | 15.76 | % | 10.65 | % |
| Alger Spectra Class I† | 10.73 | % | 16.65 | % | 11.53 | % |
| |
| | 1 YEAR | | 5 YEARS | | Since 12/29/2010 | |
| Alger Spectra Class Z | 11.11 | % | 16.98 | % | 12.66 | % |
* Historical performance prior to September 24, 2008, inception of the class, is that of the Fund's Class A shares, adjusted to
reflect the current maximum sales charge and the higher operating expenses of Class C shares.
† Historical performance prior to September 24, 2008, inception of the class, is that of the Fund's Class A shares, which has
been adjusted to remove the front-end sales charge imposed by Class A shares.
Alger Green Fund’s Class A shares performance figures prior to January 12, 2007, are those of the Alger Green
Institutional Fund and performance prior to October 19, 2006, represents the performance of the Alger Socially
Responsible Growth Institutional Fund Class I, the predecessor fund to the Alger Green Institutional Fund. The
predecessor fund followed different investment strategies and had a different portfolio manager. As of January 12,
2007, the Alger Green Institutional Fund became the Alger Green Fund.
| | | | | | | | |
| FUND PERFORMANCE AS OF 9/30/16 (Unaudited) |
| AVERAGE ANNUAL TOTAL RETURNS |
| | 1 | | 5 | | 10 | | SINCE | |
| | YEAR | | YEARS | | YEARS | | INCEPTION | |
| Alger Green Class A (Inception 12/4/00) | 3.68 | % | 11.89 | % | 5.80 | % | 1.61 | % |
| Alger Green Class C (Inception 9/24/08)* | 7.75 | % | 12.19 | % | n/a | | 6.74 | % |
| Alger Green Class I (Inception 9/24/08)† | 9.43 | % | 13.11 | % | n/a | | 7.55 | % |
| Alger Mid Cap Focus Class A (Inception 3/30/07) | (1.46 | )% | 11.26 | % | n/a | | 4.67 | % |
| Alger Mid Cap Focus Class C (Inception 9/24/08)* | 2.35 | % | 11.78 | % | n/a | | 4.54 | % |
| Alger Mid Cap Focus Class I (Inception 9/24/08)† | 3.95 | % | 12.47 | % | n/a | | 5.25 | % |
| Alger Dynamic Opportunities Class A (Inception 11/2/09) | (3.16 | )% | 5.82 | % | n/a | | 4.40 | % |
| Alger Dynamic Opportunities Class C (Inception | | | | | | | | |
| 12/29/10)‡ | 0.41 | % | 6.16 | % | n/a | | 4.42 | % |
| Alger Dynamic Opportunities Class Z (Inception 12/29/10) | 2.49 | % | 7.26 | % | n/a | | 4.89 | % |
| Alger Emerging Markets Class A (Inception 12/29/10) | 9.40 | % | 3.65 | % | n/a | | (2.09 | )% |
| Alger Emerging Markets Class C (Inception 12/29/10) | 13.64 | % | 3.99 | % | n/a | | (1.98 | )% |
| Alger Emerging Markets Class I (Inception 12/29/10) | 15.48 | % | 4.75 | % | n/a | | (1.26 | )% |
| Alger Emerging Markets Class Y (Inception 5/9/16) | n/a | | n/a | | n/a | | 15.11 | % |
| Alger Emerging Markets Class Y-2 (Inception 5/9/16) | n/a | | n/a | | n/a | | 15.11 | % |
| Alger Emerging Markets Class Z (Inception 2/28/14) | 15.83 | % | n/a | | n/a | | (0.08 | )% |
* Since inception performance is calculated since the inception of the Class A shares. Historical performance prior to September
24, 2008, inception of the class, is that of the Fund's Class A shares, reduced to reflect the current maximum sales charge
and the higher operating expenses of Class C shares.
† Since inception performance is calculated since the inception of the Class A shares. Historical performance prior to September
24, 2008, inception of the class, is that of the Fund's Class A shares, which has been adjusted to remove the front-end sales
charge imposed by Class A shares.
‡ Since inception performance is calculated since the inception of the Class A shares. Historical performance prior to December
29, 2010, inception of the class, is that of the Fund's Class A shares, reduced to reflect the current maximum sales charge
and the higher operating expenses of Class C shares.
- 12 -
ALGER SPECTRA FUND
Fund Highlights Through October 31, 2016 (Unaudited)

The chart above illustrates the change in value of a hypothetical $10,000 investment made in the Alger Spectra Fund
Class A shares, with an initial 5.25% maximum sales charge, and the Russell 3000 Growth Index (an unmanaged
index of common stocks) for the ten years ended October 31, 2016. The figures for the Alger Spectra Fund Class
A and the Russell 3000 Growth Index include reinvestment of dividends. Performance for the Alger Spectra Fund
Class C, Class I and Class Z shares will vary from the results shown above due to the operating expenses and the
current maximum sales charge of each share class. Investors cannot invest directly in any index. Index performance
does not reflect deduction for fees, expenses, or taxes.
| | | | | | | | |
| PERFORMANCE COMPARISON AS OF 10/31/16 |
| AVERAGE ANNUAL TOTAL RETURNS |
| | | | | | | | Since | |
| | 1 YEAR | | 5 YEARS | | 10 YEARS | | 12/31/1974 | |
| Class A (Inception 7/28/69) | (5.58 | )% | 12.21 | % | 9.97 | % | 15.45 | % |
| Class C (Inception 9/24/08)* | (2.03 | )% | 12.58 | % | 9.76 | % | 14.74 | % |
| Class I (Inception 9/24/08)† | (0.35 | )% | 13.45 | % | 10.64 | % | 15.61 | % |
| Russell 3000 Growth Index | 2.08 | % | 13.47 | % | 8.11 | % | n/a | |
| |
| |
| | | | | | | | Since | |
| | 1 YEAR | | 5 YEARS | | 10 YEARS | | 12/29/2010 | |
| Class Z (Inception 12/29/10) | (0.06 | )% | 13.77 | % | n/a | | 11.96 | % |
| Russell 3000 Growth Index | 2.08 | % | 13.47 | % | n/a | | 11.85 | % |
- 13 -
ALGER SPECTRA FUND
Fund Highlights Through October 31, 2016 (Unaudited) (Continued)
The performance data quoted represents past performance, which is not an indication or a guarantee of future results. The Fund’s average
annual total returns include changes in share price and reinvestment of dividends and capital gains. Class A returns reflect the maximum
initial sales charge and Class C returns reflect the applicable contingent deferred sales charge. Class A, C, and I historical performance
is calculated from December 31, 1974, the first full calendar year that Fred Alger Management, Inc. was the Fund's investment advisor.
The Fund operated as a closed-end fund from August 23, 1978 to February 12, 1996, during which time the calculation of total return
assumes dividends were reinvested at market value. Had dividends not been reinvested, performance would have been lower. The chart
and table above do not reflect the deduction of taxes that a shareholder would have paid on Fund distributions or on the redemption of
Fund shares. Investment return and principal will fluctuate and the Fund’s shares, when redeemed, may be worth more or less than their
original cost. Current performance may be higher or lower than the performance quoted. For updated performance, visit us at www.alger.
com or call us at (800) 992-3863.
* Since inception performance is calculated since the inception of the Class A shares. Historical performance prior to September
24, 2008, inception of the class, is that of the Fund's Class A shares, reduced to reflect the current maximum sales charge
and the higher operating expenses of Class C shares.
† Since inception performance is calculated since the inception of the Class A shares. Historical performance prior to September
24, 2008, inception of the class, is that of the Fund's Class A shares, which has been adjusted to remove the front-end sales
charge imposed by Class A shares.
- 14 -
ALGER GREEN FUND
Fund Highlights Through October 31, 2016 (Unaudited)
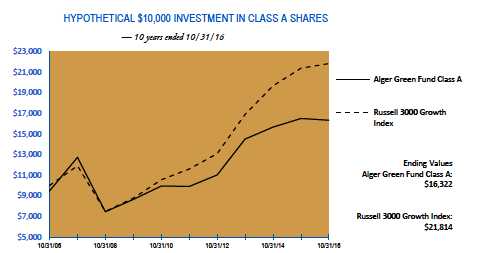
The chart above illustrates the change in value of a hypothetical $10,000 investment made in the Alger Green Fund
Class A shares, with an initial 5.25% maximum sales charge, and the Russell 3000 Growth Index (an unmanaged
index of common stocks) for the ten years ended October 31, 2016. The figures for the Alger Green Fund Class A
and the Russell 3000 Growth Index include reinvestment of dividends. Performance for the Alger Green Fund Class
C and Class I shares will vary from the results shown above due to the operating expenses and the current maximum
sales charge of each share class. Investors cannot invest directly in any index. Index performance does not reflect
deduction for fees, expenses, or taxes.
| | | | | | | | |
| | | | | | | | |
| |
| PERFORMANCE COMPARISON AS OF 10/31/16 |
| AVERAGE ANNUAL TOTAL RETURNS |
| | | | | | | | Since | |
| | 1 YEAR | | 5 YEARS | | 10 YEARS | | 12/4/2000 | |
| Class A (Inception 12/4/00) | (6.23 | )% | 9.32 | % | 5.02 | % | 1.45 | % |
| Russell 3000 Growth Index | 2.08 | % | 13.47 | % | 8.11 | % | 4.18 | % |
| |
| |
| PERFORMANCE COMPARISON AS OF 10/31/16 |
| AVERAGE ANNUAL TOTAL RETURNS |
| | | | | | | | Since | |
| | 1 YEAR | | 5 YEARS | | 10 YEARS | | 9/24/2008 | |
| Class C (Inception 9/24/08)* | (2.74 | )% | 9.58 | % | n/a | | 6.33 | % |
| Class I (Inception 9/24/08)† | (1.03 | )% | 10.47 | % | n/a | | 7.15 | % |
| Russell 3000 Growth Index | 2.08 | % | 13.47 | % | n/a | | 10.96 | % |
- 15 -
ALGER GREEN FUND
Fund Highlights Through October 31, 2016 (Unaudited) (Continued)
| | | | | |
| | | | | Since | |
| | 1 YEAR | 5 YEARS | 10 YEARS | 10/14/2016 | |
| Class Z (Inception 10/14/16) | n/a | n/a | n/a | (0.65 | )% |
| Russell 3000 Growth Index | n/a | n/a | n/a | (0.73 | )% |
The performance data quoted represents past performance, which is not an indication or a guarantee of future results. The Fund’s average
annual total returns include changes in share price and reinvestment of dividends and capital gains. Class A returns reflect the maximum
initial sales charge and Class C returns reflect the applicable contingent deferred sales charge. Performance figures prior to January 12,
2007, are those of the Alger Green Institutional Fund and performance prior to October 19, 2006, represents the performance of the
Alger Socially Responsible Growth Institutional Fund Class I, the predecessor fund to the Alger Green Institutional Fund. The pre-
decessor fund followed different investment strategies and had a different portfolio manager. As of January 12, 2007, the Alger Green
Institutional Fund became the Alger Green Fund. The chart and table above do not reflect the deduction of taxes that a shareholder
would have paid on Fund distributions or on the redemption of Fund shares. Investment return and principal will fluctuate and the
Fund’s shares, when redeemed, may be worth more or less than their original cost. Current performance may be higher or lower than the
performance quoted. For updated performance, visit us at www.alger.com or call us at (800) 992-3863.
- 16 -
ALGER MID CAP FOCUS FUND
Fund Highlights Through October 31, 2016 (Unaudited)

The chart above illustrates the change in value of a hypothetical $10,000 investment made in the Alger Mid Cap
Focus Fund Class A shares, with an initial 5.25% maximum sales charge, and the Russell Midcap Growth Index (an
unmanaged index of common stocks) from March 30, 2007, the inception date of the Alger Mid Cap Focus Fund
Class A, through October 31, 2016. Prior to December 30, 2015, the Fund followed different investment strategies
under the name “Alger Analyst Fund” and was managed by a different portfolio manager. Accordingly, performance
prior to that date does not reflect the Fund’s current investment strategies and investment personnel. The figures for
the Alger Mid Cap Focus Fund Class A and the Russell Midcap Growth Index include reinvestment of dividends.
Performance for the Alger Mid Cap Focus Fund Class C and Class I shares will vary from the results shown above
due to the operating expenses and the current maximum sales charge of each share class. Investors cannot invest
directly in any index. Index performance does not reflect deduction for fees, expenses, or taxes.
| | | | | | | |
| PERFORMANCE COMPARISON AS OF 10/31/16 |
| AVERAGE ANNUAL TOTAL RETURNS |
| | | | | | | Since | |
| | 1 YEAR | | 5 YEARS | | 10 YEARS | 3/30/2007 | |
| Class A (Inception 3/30/07) | (14.03 | )% | 7.40 | % | n/a | 4.13 | % |
| Class C (Inception 9/24/08)* | (10.65 | )% | 7.90 | % | n/a | 4.00 | % |
| Class I (Inception 9/24/08)† | (9.29 | )% | 8.56 | % | n/a | 4.70 | % |
| Russell Midcap Growth Index | 0.40 | % | 12.02 | % | n/a | 7.23 | % |
| |
| |
| | | | | | | Since | |
| | 1 YEAR | | 5 YEARS | | 10 YEARS | 10/14/2016 | |
| Class Z (Inception 10/14/16) | n/a | | n/a | | n/a | (1.07 | )% |
| Russell Midcap Growth Index | n/a | | n/a | | n/a | (1.12 | )% |
The performance data quoted represents past performance, which is not an indication or a guarantee of future results. The Fund’s average
annual total returns include changes in share price and reinvestment of dividends and capital gains. Class A returns reflect the maximum
initial sales charge and Class C returns reflect the applicable contingent deferred sales charge. The chart and table above do not reflect the
deduction of taxes that a shareholder would have paid on Fund distributions or on the redemption of Fund shares. Investment return
and principal will fluctuate and the Fund’s shares, when redeemed, may be worth more or less than their original cost. Current performance
may be higher or lower than the performance quoted. For updated performance, visit us at www.alger.com or call us at (800) 992-3863.
- 17 -
ALGER MID CAP FOCUS FUND
Fund Highlights Through October 31, 2016 (Unaudited) (Continued)
* Since inception performance is calculated since the inception of the Class A shares. Historical performance prior to September
24, 2008, inception of the class, is that of the Fund's Class A shares, reduced to reflect the current maximum sales charge
and the higher operating expenses of Class C shares.
† Since inception performance is calculated since the inception of the Class A shares. Historical performance prior to September
24, 2008, inception of the class, is that of the Fund's Class A shares, which has been adjusted to remove the front-end sales
charge imposed by Class A shares.
- 18 -
ALGER DYNAMIC OPPORTUNITIES FUND
Fund Highlights Through October 31, 2016 (Unaudited)
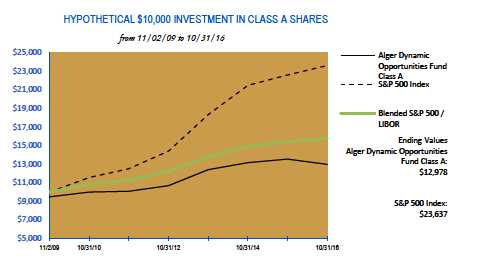
The chart above illustrates the change in value of a hypothetical $10,000 investment made in Alger Dynamic
Opportunities Fund Class A shares, with an initial 5.25% maximum sales charge, and the S&P 500 Index and
the Blended S&P 500/3-Month London Interbank Offered Rate (“LIBOR”) (an unmanaged indices of common
stocks) from November 2, 2009, the inception date of the Alger Dynamic Opportunities Fund Class A, through
October 31, 2016. The figures for the Alger Dynamic Opportunities Fund Class A and the S&P 500 Index and the
Blended S&P 500/LIBOR include reinvestment of dividends. Performance for the Alger Dynamic Opportunities
Fund Class C and Class Z shares will vary from the results shown above due to the operating expenses and the
current maximum sales charge of each share class. Investors cannot invest directly in any index. Index performance
does not reflect deduction for fees, expenses, or taxes.
| | | | | | | |
| PERFORMANCE COMPARISON AS OF 10/31/16 |
| AVERAGE ANNUAL TOTAL RETURNS |
| | | | | | | Since | |
| | 1 YEAR | | 5 YEARS | | 10 YEARS | 11/2/2009 | |
| Class A (Inception 11/2/09) | (9.24 | )% | 4.04 | % | n/a | 3.80 | % |
| Class C (Inception 12/29/10)* | (5.92 | )% | 4.38 | % | n/a | 3.80 | % |
| S&P 500 Index | 4.51 | % | 13.57 | % | n/a | 13.09 | % |
| Blended S&P 500 / LIBOR | 2.62 | % | 6.92 | % | n/a | 6.75 | % |
| | | | | | | |
| | | | | | | Since | |
| | 1 YEAR | | 5 YEARS | | 10 YEARS | 12/29/2010 | |
| Class Z (Inception 12/29/10) | (3.92 | )% | 5.46 | % | n/a | 4.16 | % |
| S&P 500 Index | 4.51 | % | 13.57 | % | n/a | 11.73 | % |
| Blended S&P 500 / LIBOR | 2.62 | % | 6.92 | % | n/a | 6.07 | % |
The performance data quoted represents past performance, which is not an indication or a guarantee of future results. The Fund’s average
annual total returns include changes in share price and reinvestment of dividends and capital gains. Class A returns reflect the maximum
initial sales charge and Class C returns reflect the applicable contingent deferred sales charge. The chart and table above do not reflect the
deduction of taxes that a shareholder would have paid on Fund distributions or on the redemption of Fund shares. Investment return
and principal will fluctuate and the Fund’s shares, when redeemed, may be worth more or less than their original cost. Current performance
may be higher or lower than the performance quoted. For updated performance, visit us at www.alger.com or call us at (800) 992-3863.
- 19 -
ALGER DYNAMIC OPPORTUNITIES FUND
Fund Highlights Through October 31, 2016 (Unaudited) (Continued)
* Since inception performance is calculated since the inception of the Class A shares. Historical performance prior to
December 29, 2010, inception of the class, is that of the Fund's Class A shares, reduced to reflect the current maximum
sales charge and the higher operating expenses of Class C shares.
- 20 -
ALGER EMERGING MARKETS FUND
Fund Highlights Through October 31, 2016 (Unaudited)
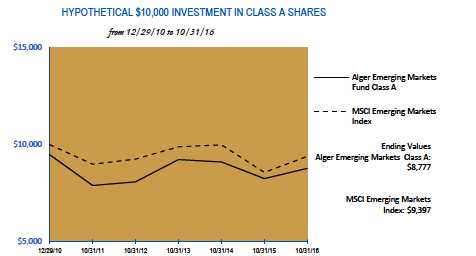
The chart above illustrates the change in value of a hypothetical $10,000 investment made in Alger Emerging
Markets Fund Class A shares, with an initial 5.25% maximum sales charge, and the MSCI Emerging Markets Index
(an unmanaged index of common stocks) from December 29, 2010, the inception date of the Alger Emerging
Markets Fund Class A, through October 31, 2016. The figures for the Alger Emerging Markets Fund Class A and
the MSCI Emerging Markets Index include reinvestment of dividends. Performance for the Alger Emerging Markets
Fund Class C, Class I and Class Z shares will vary from the results shown above due to differences in expense and
sales charges those classes bear. Investors cannot invest directly in any index. Index performance does not reflect
deduction for fees, expenses, or taxes.
| | | | | | | |
| PERFORMANCE COMPARISON AS OF 10/31/16 |
| AVERAGE ANNUAL TOTAL RETURNS |
| | | | | | | Since | |
| | 1 YEAR | | 5 YEARS | | 10 YEARS | 12/29/2010 | |
| Class A (Inception 12/29/10) | 0.87 | % | 1.07 | % | n/a | (2.21 | )% |
| Class C (Inception 12/29/10) | 4.54 | % | 1.40 | % | n/a | (2.12 | )% |
| Class I (Inception 12/29/10) | 6.39 | % | 2.16 | % | n/a | (1.39 | )% |
| MSCI Emerging Markets Index | 9.67 | % | 0.90 | % | n/a | (1.06 | )% |
| |
| | 1 YEAR | | 5 YEARS | | 10 YEARS | Since 5/9/2016 | |
| Class Y (Inception 5/9/16) | n/a | | n/a | | n/a | 14.11 | % |
| Class Y-2 (Inception 5/9/16) | n/a | | n/a | | n/a | 14.11 | % |
| MSCI Emerging Markets Index | n/a | | n/a | | n/a | 14.99 | % |
- 21 -
ALGER EMERGING MARKETS FUND
Fund Highlights Through October 31, 2016 (Unaudited) (Continued)
| | | | | | |
| | | | | | Since | |
| | 1 YEAR | | 5 YEARS | 10 YEARS | 2/28/2014 | |
| Class Z (Inception 2/28/14) | 6.78 | % | n/a | n/a | (0.41 | )% |
| MSCI Emerging Markets Index | 9.67 | % | n/a | n/a | 0.45 | % |
The performance data quoted represents past performance, which is not an indication or a guarantee of future results. The Fund’s average
annual total returns include changes in share price and reinvestment of dividends and capital gains. Class A returns reflect the maximum
initial sales charge and Class C returns reflect the applicable contingent deferred sales charge. The chart and table above do not reflect the
deduction of taxes that a shareholder would have paid on Fund distributions or on the redemption of Fund shares. Investment return
and principal will fluctuate and the Fund’s shares, when redeemed, may be worth more or less than their original cost. Current performance
may be higher or lower than the performance quoted. For updated performance, visit us at www.alger.com or call us at (800) 992-3863.
- 22 -
PORTFOLIO SUMMARY†
October 31, 2016 (Unaudited)
| | | | | | | | | | | | |
| | | | | | | | | | | | |
| | | | | | | | | Alger Mid Cap Focus | | | Alger Dynamic | |
| SECTORS | | Alger Spectra Fund* | | | Alger Green Fund | | | Fund | | | Opportunities Fund* | |
| Consumer Discretionary | | 16.0 | % | | 23.5 | % | | 19.0 | % | | 6.8 | % |
| Consumer Staples | | 7.2 | | | 6.0 | | | 2.8 | | | 4.9 | |
| Energy | | 1.3 | | | 0.0 | | | 0.0 | | | 0.3 | |
| Financials | | 2.9 | | | 2.1 | | | 5.0 | | | 39.5 | |
| Health Care | | 15.3 | | | 10.0 | | | 16.8 | | | 11.9 | |
| Industrials | | 7.1 | | | 17.3 | | | 17.4 | | | 1.1 | |
| Information Technology | | 43.1 | | | 33.5 | | | 20.1 | | | 24.4 | |
| Market Indices | | 0.0 | | | 0.0 | | | 0.0 | | | (1.2 | ) |
| Materials | | 1.9 | | | 1.2 | | | 5.3 | | | (0.3 | ) |
| Real Estate | | 0.8 | | | 0.0 | | | 3.3 | | | 3.5 | |
| Telecommunication Services | 0.4 | | | 1.5 | | | 0.0 | | | 0.0 | |
| Utilities | | 0.0 | | | 1.5 | | | 0.0 | | | (0.3 | ) |
| Short-Term Investments and | | | | | | | | | | | | |
| Net Other Assets | | 4.0 | | | 3.4 | | | 10.3 | | | 9.4 | |
| | | 100.0 | % | | 100.0 | % | | 100.0 | % | | 100.0 | % |
| | | |
| | | Alger Emerging Markets | |
| COUNTRY | | Fund | |
| Bermuda | | 0.7 | % |
| Brazil | | 8.3 | |
| Cayman Islands | | 4.3 | |
| Chile | | 1.0 | |
| China | | 20.8 | |
| Colombia | | 0.9 | |
| Germany | | 0.7 | |
| Hong Kong | | 2.1 | |
| India | | 10.4 | |
| Indonesia | | 3.4 | |
| Luxembourg | | 1.9 | |
| Macau | | 0.4 | |
| Malaysia | | 1.2 | |
| Mexico | | 4.5 | |
| Peru | | 0.6 | |
| Philippines | | 1.2 | |
| Russia | | 2.5 | |
| South Africa | | 4.0 | |
| South Korea | | 14.0 | |
| Switzerland | | 1.4 | |
| Taiwan | | 9.0 | |
| Thailand | | 1.9 | |
| Turkey | | 0.4 | |
| United Kingdom | | 0.8 | |
| United States | | 0.1 | |
| Cash and Net Other Assets | | 3.5 | |
| | | 100.0 | % |
* Includes short sales as a reduction of sector exposure.
† Based on net assets for each Fund
- 23 -
THE ALGER FUNDS II | ALGER SPECTRA FUND
Schedule of Investments October 31, 2016
| | | | | | |
| COMMON STOCKS—96.0% | | SHARES | | | | VALUE |
| ADVERTISING—0.0% | | | | | | |
| Choicestream, Inc.*,@,(a) | | 178,292 | $ | – |
| AEROSPACE & DEFENSE—0.9% | | | | | | |
| Lockheed Martin Corp. | | 167,901 | | | | 41,367,448 |
| TransDigm Group, Inc. | | 21,000 | | | | 5,721,660 |
| | | | | | 47,089,108 |
| AIRLINES—0.4% | | | | | | |
| Southwest Airlines Co. | | 536,775 | | | 21,497,839 |
| ALTERNATIVE CARRIERS—0.4% | | | | | | |
| Level 3 Communications, Inc.* | | 389,641 | | | 21,878,342 |
| APPAREL ACCESSORIES & LUXURY GOODS—1.1% | | | | | | |
| Hanesbrands, Inc. | | 370,236 | | | | 9,515,065 |
| PVH Corp. | | 292,683 | | | | 31,311,227 |
| Under Armour, Inc., Cl. A* | | 502,914 | | | | 15,640,626 |
| | | | | | 56,466,918 |
| APPAREL RETAIL—0.3% | | | | | | |
| The TJX Cos., Inc. | | 181,535 | | | 13,388,206 |
| APPLICATION SOFTWARE—2.3% | | | | | | |
| Adobe Systems, Inc.* | | 475,686 | | | | 51,141,002 |
| salesforce.com, Inc.* | | 903,525 | | | | 67,908,939 |
| | | | | | 119,049,941 |
| AUTO PARTS & EQUIPMENT—1.1% | | | | | | |
| Delphi Automotive PLC. | | 411,445 | | | | 26,772,726 |
| Johnson Controls International PLC. | | 693,431 | | | | 27,959,138 |
| | | | | | 54,731,864 |
| BIOTECHNOLOGY—4.3% | | | | | | |
| ACADIA Pharmaceuticals, Inc.* | | 531,997 | | | | 12,400,850 |
| Biogen, Inc.*+ | | 116,893 | | | | 32,751,081 |
| BioMarin Pharmaceutical, Inc.* | | 467,794 | | | | 37,666,773 |
| Celgene Corp.* | | 722,175 | | | | 73,791,842 |
| Incyte Corp.* | | 391,388 | | | | 34,039,014 |
| Vertex Pharmaceuticals, Inc.*+ | | 437,398 | | | | 33,181,012 |
| | | | | | 223,830,572 |
| BREWERS—1.7% | | | | | | |
| Molson Coors Brewing Co., Cl. B | | 823,257 | | | 85,462,309 |
| BROADCASTING—1.3% | | | | | | |
| CBS Corp., Cl. B | | 1,142,811 | | | 64,705,959 |
| BUILDING PRODUCTS—0.1% | | | | | | |
| Fortune Brands Home & Security, Inc. | | 104,040 | | | | 5,683,705 |
| CABLE & SATELLITE—2.3% | | | | | | |
| Comcast Corporation, Cl. A | | 1,895,366 | | | 117,171,526 |
| CASINOS & GAMING—0.1% | | | | | | |
| Red Rock Resorts, Inc., Cl. A | | 293,848 | | | | 6,435,271 |
| COMMUNICATIONS EQUIPMENT—0.1% | | | | | | |
| Palo Alto Networks, Inc.* | | 37,616 | | | | 5,786,469 |
| DATA PROCESSING & OUTSOURCED SERVICES—3.8% | | | | | | |
| Sabre Corp. | | 400,012 | | | | 10,332,310 |
| Visa, Inc., Cl. A+ | | 2,252,749 | | | 185,874,320 |
| | | | | | 196,206,630 |
- 24 -
THE ALGER FUNDS II | ALGER SPECTRA FUND
Schedule of Investments October 31, 2016 (Continued)
| | | | | | |
| COMMON STOCKS—(CONT.) | | SHARES | | | | VALUE |
| DRUG RETAIL—0.3% | | | | | | |
| CVS Caremark Corp. | | 200,643 | $ | 16,874,076 |
| ELECTRICAL COMPONENTS & EQUIPMENT—0.2% | | | | | | |
| Eaton Corp., PLC. | | 149,777 | | | | 9,551,279 |
| FINANCIAL EXCHANGES & DATA—0.5% | | | | | | |
| IntercontinentalExchange Group, Inc. | | 56,918 | | | | 15,390,058 |
| S&P Global, Inc. | | 79,040 | | | | 9,631,024 |
| | | | | | 25,021,082 |
| FOOD DISTRIBUTORS—0.2% | | | | | | |
| US Foods Holding Corp.* | | 493,600 | | | | 11,155,360 |
| GENERAL MERCHANDISE STORES—0.2% | | | | | | |
| Dollar Tree, Inc.* | | 110,453 | | | | 8,344,724 |
| HEALTH CARE EQUIPMENT—2.7% | | | | | | |
| Boston Scientific Corp.* | | 1,261,610 | | | | 27,755,420 |
| DexCom, Inc.* | | 553,862 | | | | 43,334,163 |
| Edwards Lifesciences Corp.* | | 412,200 | | | | 39,249,684 |
| Medtronic PLC. | | 353,311 | | | | 28,978,568 |
| | | | | | 139,317,835 |
| HEALTH CARE FACILITIES—0.6% | | | | | | |
| Amsurg Corp.* | | 335,952 | | | | 20,073,132 |
| HCA Holdings, Inc.* | | 120,151 | | | | 9,195,156 |
| | | | | | 29,268,288 |
| HOME ENTERTAINMENT SOFTWARE—2.4% | | | | | | |
| Activision Blizzard, Inc. | | 953,830 | | | | 41,176,841 |
| Electronic Arts, Inc.* | | 1,036,794 | | | | 81,409,065 |
| | | | | | 122,585,906 |
| HOME IMPROVEMENT RETAIL—1.6% | | | | | | |
| The Home Depot, Inc. | | 695,719 | | | 84,884,675 |
| HOTELS RESORTS & CRUISE LINES—0.4% | | | | | | |
| Ctrip.com International Ltd.#* | | 376,405 | | | | 16,618,281 |
| Royal Caribbean Cruises Ltd. | | 72,051 | | | | 5,538,560 |
| | | | | | 22,156,841 |
| HOUSEWARES & SPECIALTIES—1.8% | | | | | | |
| Newell Brands, Inc. | | 1,894,132 | | | 90,956,219 |
| HYPERMARKETS & SUPER CENTERS—0.4% | | | | | | |
| Costco Wholesale Corp. | | 142,923 | | | 21,134,024 |
| INDUSTRIAL CONGLOMERATES—4.0% | | | | | | |
| 3M Co. | | 17,500 | | | | 2,892,750 |
| Danaher Corp. | | 217,809 | | | | 17,108,897 |
| Honeywell International, Inc.+ | | 1,727,514 | | | 189,473,736 |
| | | | | | 209,475,383 |
| INDUSTRIAL GASES—0.8% | | | | | | |
| Air Products & Chemicals, Inc. | | 323,154 | | | | 43,115,207 |
| INTERNET RETAIL—5.5% | | | | | | |
| Amazon.com, Inc.*+ | | 358,579 | | | 283,212,866 |
| NetFlix, Inc.* | | 25,280 | | | | 3,156,713 |
| | | | | | 286,369,579 |
| INTERNET SOFTWARE & SERVICES—16.6% | | | | | | |
| Alibaba Group Holding Ltd.#* | | 449,432 | | | | 45,702,740 |
- 25 -
THE ALGER FUNDS II | ALGER SPECTRA FUND
Schedule of Investments October 31, 2016 (Continued)
| | | | | | |
| COMMON STOCKS—(CONT.) | | SHARES | | | | VALUE |
| INTERNET SOFTWARE & SERVICES—(CONT.) | | | | | | |
| Alphabet, Inc., Cl. C*+ | | 548,016 | $ | 429,940,473 |
| comScore, Inc.* | | 218,740 | | | | 6,297,524 |
| eBay, Inc.* | | 640,329 | | | | 18,255,780 |
| Facebook, Inc., Cl. A*+ | | 2,013,718 | | | 263,776,921 |
| GrubHub, Inc.* | | 244,712 | | | | 9,325,974 |
| Palantir Technologies, Inc., Cl. A*,@ | | 348,292 | | | | 2,664,434 |
| Shopify, Inc., Cl. A* | | 154,494 | | | | 6,403,776 |
| Stamps.com, Inc.* | | 247,245 | | | | 24,118,750 |
| Yahoo! Inc.* | | 1,266,262 | | | | 52,613,186 |
| | | | | | 859,099,558 |
| INVESTMENT BANKING & BROKERAGE—1.1% | | | | | | |
| Morgan Stanley | | 1,258,023 | | | | 42,231,832 |
| The Goldman Sachs Group, Inc. | | 86,700 | | | | 15,453,408 |
| | | | | | 57,685,240 |
| IT CONSULTING & OTHER SERVICES—0.3% | | | | | | |
| Cognizant Technology Solutions Corp., Cl. A* | | 284,071 | | | 14,587,046 |
| LIFE SCIENCES TOOLS & SERVICES—1.5% | | | | | | |
| Thermo Fisher Scientific, Inc.+ | | 527,160 | | | 77,508,335 |
| MANAGED HEALTH CARE—3.1% | | | | | | |
| Aetna, Inc. | | 66,726 | | | | 7,163,036 |
| Centene Corp.* | | 460,482 | | | | 28,770,916 |
| Humana, Inc. | | 57,713 | | | | 9,899,511 |
| UnitedHealth Group, Inc. | | 813,555 | | | 114,979,728 |
| | | | | | 160,813,191 |
| METAL & GLASS CONTAINERS—0.3% | | | | | | |
| Ball Corp. | | 182,852 | | | 14,092,404 |
| MOVIES & ENTERTAINMENT—0.4% | | | | | | |
| Time Warner, Inc. | | 246,420 | | | 21,928,916 |
| OIL & GAS EQUIPMENT & SERVICES—0.6% | | | | | | |
| Halliburton Company | | 618,600 | | | 28,455,600 |
| OIL & GAS EXPLORATION & PRODUCTION—1.3% | | | | | | |
| Anadarko Petroleum Corp. | | 635,529 | | | | 37,775,844 |
| EOG Resources, Inc. | | 120,174 | | | | 10,866,133 |
| Pioneer Natural Resources Co. | | 92,170 | | | | 16,500,273 |
| | | | | | 65,142,250 |
| PACKAGED FOODS & MEATS—0.8% | | | | | | |
| Pinnacle Foods, Inc. | | 352,738 | | | | 18,137,788 |
| The Kraft Heinz Co. | | 114,657 | | | | 10,198,740 |
| The WhiteWave Foods Co.* | | 254,800 | | | | 13,884,052 |
| | | | | | 42,220,580 |
| PHARMACEUTICALS—3.1% | | | | | | |
| Allergan PLC.*+ | | 533,388 | | | 111,446,089 |
| Eli Lilly & Co. | | 666,362 | | | | 49,204,170 |
| | | | | | 160,650,259 |
| RAILROADS—0.5% | | | | | | |
| Union Pacific Corp. | | 280,499 | | | 24,734,402 |
| RESEARCH & CONSULTING SERVICES—0.3% | | | | | | |
| Verisk Analytics, Inc., Cl. A* | | 213,500 | | | 17,410,925 |
- 26 -
THE ALGER FUNDS II | ALGER SPECTRA FUND
Schedule of Investments October 31, 2016 (Continued)
| | | | | | |
| COMMON STOCKS—(CONT.) | | SHARES | | | | VALUE |
| RESTAURANTS—0.3% | | | | | | |
| Starbucks Corp.+ | | 242,313 | $ | 12,859,551 |
| SEMICONDUCTOR EQUIPMENT—0.2% | | | | | | |
| ASML Holding NV# | | 101,791 | | | 10,751,165 |
| SEMICONDUCTORS—5.0% | | | | | | |
| Broadcom Ltd. | | 710,499 | | | 120,983,770 |
| Cavium Networks, Inc.* | | 127,348 | | | | 7,188,794 |
| Microsemi Corp.* | | 478,275 | | | | 20,149,726 |
| NXP Semiconductors NV* | | 648,838 | | | | 64,883,800 |
| QUALCOMM, Inc. | | 510,961 | | | | 35,113,240 |
| Skyworks Solutions, Inc. | | 136,286 | | | | 10,485,845 |
| | | | | | 258,805,175 |
| SOFT DRINKS—1.8% | | | | | | |
| PepsiCo, Inc.+ | | 874,069 | | | 93,700,197 |
| SPECIALIZED CONSUMER SERVICES—0.3% | | | | | | |
| ServiceMaster Global Holdings, Inc.* | | 477,073 | | | 17,074,443 |
| SPECIALTY CHEMICALS—0.8% | | | | | | |
| The Sherwin-Williams Co. | | 73,492 | | | | 17,995,251 |
| WR Grace & Co. | | 369,996 | | | | 24,774,932 |
| | | | | | 42,770,183 |
| SPECIALTY STORES—0.1% | | | | | | |
| Dick's Sporting Goods, Inc. | | 121,800 | | | | 6,778,170 |
| SYSTEMS SOFTWARE—6.4% | | | | | | |
| Microsoft Corp.+ | | 4,790,749 | | | 287,061,680 |
| Red Hat, Inc.* | | 73,141 | | | | 5,664,771 |
| ServiceNow, Inc.* | | 427,251 | | | | 37,559,635 |
| TubeMogul, Inc.* | | 368,953 | | | | 2,693,357 |
| | | | | | 332,979,443 |
| TECHNOLOGY HARDWARE STORAGE & PERIPHERALS—6.2% | | | | | | |
| Apple, Inc.+ | | 2,680,243 | | | 304,314,790 |
| Western Digital Corp. | | 297,382 | | | | 17,379,004 |
| | | | | | 321,693,794 |
| TOBACCO—2.0% | | | | | | |
| Altria Group, Inc. | | 600,579 | | | | 39,710,284 |
| Philip Morris International, Inc. | | 666,725 | | | | 64,298,959 |
| | | | | | 104,009,243 |
| TRADING COMPANIES & DISTRIBUTORS—1.0% | | | | | | |
| HD Supply Holdings, Inc.* | | 1,595,287 | | | 52,644,471 |
| TRUCKING—0.2% | | | | | | |
| Old Dominion Freight Line, Inc.* | | 126,500 | | | | 9,447,020 |
| TOTAL COMMON STOCKS | | | | | | |
| (Cost $4,321,258,855) | | | | | 4,967,436,698 |
| PREFERRED STOCKS—0.7% | | SHARES | | | | VALUE |
| ADVERTISING—0.1% | | | | | | |
| Choicestream, Inc., Series A*,@,(a) | | 1,537,428 | | | | – |
| Choicestream, Inc., Series B*,@,(a) | | 3,765,639 | | | | 2,221,727 |
| | | | | | | 2,221,727 |
| BIOTECHNOLOGY—0.2% | | | | | | |
| Prosetta Biosciences, Inc., Series D*,@,(a) | | 2,912,012 | | | | 11,764,528 |
- 27 -
THE ALGER FUNDS II | ALGER SPECTRA FUND
Schedule of Investments October 31, 2016 (Continued)
| | | | | | | |
| PREFERRED STOCKS—(CONT.) | | SHARES | | | | | VALUE |
| INTERNET SOFTWARE & SERVICES—0.2% | | | | | | | |
| Palantir Technologies, Inc., Cl. B*,@ | | 1,420,438 | | | $ | | 10,866,351 |
| Palantir Technologies, Inc., Cl. D*,@ | | 185,062 | | | | | 1,415,724 |
| | | | | | 12,282,075 |
| PHARMACEUTICALS—0.2% | | | | | | | |
| Intarcia Therapeutics, Inc., Series DD*,@ | | 171,099 | | | | | 9,759,487 |
| TOTAL PREFERRED STOCKS | | | | | | | |
| (Cost $32,736,484) | | | | | | | 36,027,817 |
| WARRANTS—0.0% | | SHARES | | | | | VALUE |
| ADVERTISING—0.0% | | | | | | | |
| Choicestream, Inc., 6/22/26@,(a) | | 838,287 | | | | | 821,521 |
| (Cost $837,448) | | | | | | | 821,521 |
| MASTER LIMITED PARTNERSHIP—0.8% | | SHARES | | | | | VALUE |
| ASSET MANAGEMENT & CUSTODY BANKS—0.8% | | | | | | | |
| The Blackstone Group LP. | | 1,619,596 | | | 40,538,488 |
| (Cost $49,808,910) | | | | | | | 40,538,488 |
| REAL ESTATE INVESTMENT TRUST—1.4% | | SHARES | | | | | VALUE |
| MORTGAGE—0.4% | | | | | | | |
| Blackstone Mortgage Trust, Inc., Cl. A | | 649,189 | | | 19,605,508 |
| RESIDENTIAL—0.2% | | | | | | | |
| American Campus Communities, Inc. | | 191,311 | | | | | 9,969,216 |
| SPECIALIZED—0.8% | | | | | | | |
| Crown Castle International Corp. | | 495,925 | | | 45,124,216 |
| TOTAL REAL ESTATE INVESTMENT TRUST | | | | | | | |
| (Cost $68,584,321) | | | | | | | 74,698,940 |
| | | PRINCIPAL | | | | | |
| CORPORATE BONDS—0.0% | | AMOUNT | | | | | VALUE |
| ADVERTISING—0.0% | | | | | | | |
| Choicestream, Inc., 11.00%, 8/05/18@,(a) | | 838,287 | | | | | 838,287 |
| (Cost $101,789) | | | | | | | 838,287 |
| SPECIAL PURPOSE VEHICLE—0.1% | | SHARES | | | | | VALUE |
| CONSUMER FINANCE—0.1% | | | | | | | |
| JS Kred SPV I, LLC.@ | | 2,715,111 | | | | | 2,821,272 |
| (Cost $2,715,111) | | | | | | | 2,821,272 |
| Total Investments | | | | | | | |
| (Cost $4,476,042,918)(b) | | 99.0 | % | | 5,123,183,023 |
| Other Assets in Excess of Liabilities | | 1.0 | % | | 53,176,729 |
| NET ASSETS | | 100.0 | % | $ | 5,176,359,752 |
- 28 -
THE ALGER FUNDS II | ALGER SPECTRA FUND
Schedule of Investments October 31, 2016 (Continued)
# American Depositary Receipts.
(a) Deemed an affiliate of the Alger fund complex during the year for purposes of Section 2(a)(3) of the Investment
Company Act of 1940. See Affiliated Securities Note 11.
(b) At October 31, 2016, the net unrealized appreciation on investments, based on cost for federal income tax purposes
of $4,555,976,392, amounted to $567,206,631 which consisted of aggregate gross unrealized appreciation of
$746,313,463 and aggregate gross unrealized depreciation of $179,106,832.
* Non-income producing security.
@ Restricted security - Investment in security not registered under the Securities Act of 1933. The investment is deemed
to not be liquid and may be sold only to qualified buyers.
| | | | | | | | | |
| | | | | % of net assets | | | | % of net assets | |
| | Acquisition | | Acquisition | (Acquisition | | | Market | as of | |
| Security | Date(s) | | Cost | Date) | | | Value | 10/31/2016 | |
| Choicestream, Inc. | 03/14/14 | $ | 51,705 | 0.00 | % | $ | 0 | 0.00 | % |
| Choicestream, Inc., 11.00%, | | | | | | | | | |
| 8/05/18 | 08/04/16 | | 836 | 0.00 | % | | 838,287 | 0.02 | % |
| Choicestream, Inc., 6/22/26 | 08/04/16 | | 837,448 | 0.02 | % | | 821,521 | 0.02 | % |
| Choicestream, Inc., Cl. A | 12/17/13 | | 1,229,452 | 0.03 | % | | 0 | 0.00 | % |
| Choicestream, Inc., Cl. B | 07/10/14 | | 2,259,383 | 0.05 | % | | 2,221,727 | 0.04 | % |
| Intarcia Therapeutics, Inc., Series | | | | | | | | | |
| DD | 03/27/14 | | 5,541,897 | 0.14 | % | | 9,759,487 | 0.19 | % |
| JS Kred SPV I, LLC. | 06/26/15 | | 2,715,111 | 0.05 | % | | 2,821,272 | 0.05 | % |
| Palantir Technologies, Inc., Cl. A | 10/07/14 | | 2,266,336 | 0.05 | % | | 2,664,434 | 0.05 | % |
| Palantir Technologies, Inc., Cl. B | 10/07/14 | | 9,379,767 | 0.22 | % | | 10,866,351 | 0.21 | % |
| Palantir Technologies, Inc., Cl. D | 10/14/14 | | 1,221,931 | 0.03 | % | | 1,415,724 | 0.03 | % |
| Prosetta Biosciences, Inc., Series D | 02/06/15 | | 13,104,054 | 0.28 | % | | 11,764,528 | 0.23 | % |
| Total | | | | | | $ | 43,173,331 | 0.84 | % |
| | | | | | | | | | |
| + All or a portion of this security is held as collateral for securities sold short. | | | | | | |
Industry classifications are unaudited.
See Notes to Financial Statements.
- 29 -
THE ALGER FUNDS II | ALGER SPECTRA FUND
Schedule of Investments- Securities Sold Short October 31, 2016
| | | | | | | |
| COMMON STOCKS—-3.0% | | SHARES | | | | VALUE | |
| AIRLINES—-0.2% | | | | | | | |
| JetBlue Airways Corp.* | | (474,100 | ) | | $ | (8,287,268 | ) |
| APPLICATION SOFTWARE—-0.2% | | | | | | | |
| Citrix Systems, Inc.* | | (123,900 | ) | | (10,506,720 | ) |
| ASSET MANAGEMENT & CUSTODY BANKS—-0.2% | | | | | | | |
| Ameriprise Financial, Inc. | | (33,900 | ) | | | (2,996,421 | ) |
| T. Rowe Price Group, Inc. | | (43,600 | ) | | | (2,790,836 | ) |
| | | | | | | (5,787,257 | ) |
| AUTO PARTS & EQUIPMENT—-0.3% | | | | | | | |
| Gentex Corp. | | (928,000 | ) | | (15,692,480 | ) |
| BROADCASTING—-0.4% | | | | | | | |
| Scripps Networks Interactive, Inc., Cl. A | | (332,151 | ) | | (21,377,238 | ) |
| CASINOS & GAMING—-0.2% | | | | | | | |
| Wynn Resorts Ltd. | | (112,322 | ) | | (10,620,045 | ) |
| DATA PROCESSING & OUTSOURCED SERVICES—-0.2% | | | | | | | |
| Automatic Data Processing, Inc. | | (139,494 | ) | | (12,144,348 | ) |
| HEALTH CARE SERVICES—-0.4% | | | | | | | |
| Express Scripts, Inc.* | | (276,095 | ) | | (18,608,803 | ) |
| INTEGRATED OIL & GAS—-0.6% | | | | | | | |
| Exxon Mobil Corp. | | (394,205 | ) | | (32,845,161 | ) |
| TRADING COMPANIES & DISTRIBUTORS—-0.3% | | | | | | | |
| WW Grainger, Inc. | | (82,879 | ) | | (17,248,777 | ) |
| TOTAL COMMON STOCKS | | | | | | | |
| (Proceeds $158,466,339) | | | | $ | (153,118,097 | ) |
| Total (Proceeds $158,466,339) | | | | $ | (153,118,097 | ) |
| * Non-income producing security. | | | | | | | |
Industry classifications are unaudited.
See Notes to Financial Statements.
- 30 -
THE ALGER FUNDS II | ALGER GREEN FUND
Schedule of Investments October 31, 2016
| | | | | |
| COMMON STOCKS—96.5% | | SHARES | | | VALUE |
| ADVERTISING—0.0% | | | | | |
| Choicestream, Inc.*,@,(a) | | 3,619 | $ | – |
| AEROSPACE & DEFENSE—1.5% | | | | | |
| Hexcel Corp. | | 21,135 | | | 961,431 |
| AIR FREIGHT & LOGISTICS—1.4% | | | | | |
| United Parcel Service, Inc., Cl. B | | 8,430 | | | 908,417 |
| APPAREL ACCESSORIES & LUXURY GOODS—1.4% | | | | | |
| PVH Corp. | | 8,526 | | | 912,112 |
| APPLICATION SOFTWARE—2.5% | | | | | |
| salesforce.com, Inc.* | | 9,937 | | | 746,865 |
| SAP SE# | | 10,185 | | | 894,650 |
| | | | | | 1,641,515 |
| AUTO PARTS & EQUIPMENT—1.7% | | | | | |
| Delphi Automotive PLC. | | 6,275 | | | 408,314 |
| Johnson Controls International PLC. | | 17,441 | | | 703,221 |
| | | | | | 1,111,535 |
| AUTOMOBILE MANUFACTURERS—1.8% | | | | | |
| Tesla Motors, Inc.* | | 6,011 | | | 1,188,555 |
| BUILDING PRODUCTS—1.0% | | | | | |
| Allegion PLC. | | 10,022 | | | 639,805 |
| COMMUNICATIONS EQUIPMENT—1.3% | | | | | |
| Cisco Systems, Inc. | | 26,965 | | | 827,286 |
| CONSTRUCTION & ENGINEERING—0.6% | | | | | |
| AECOM* | | 14,585 | | | 406,192 |
| CONSUMER ELECTRONICS—1.0% | | | | | |
| Harman International Industries, Inc. | | 7,921 | | | 631,383 |
| DATA PROCESSING & OUTSOURCED SERVICES—3.1% | | | | | |
| Alliance Data Systems Corp. | | 2,650 | | | 541,845 |
| Visa, Inc., Cl. A | | 17,990 | | | 1,484,355 |
| | | | | | 2,026,200 |
| DISTRIBUTORS—1.9% | | | | | |
| LKQ Corp.* | | 37,920 | | | 1,224,058 |
| DRUG RETAIL—1.2% | | | | | |
| CVS Caremark Corp. | | 9,436 | | | 793,568 |
| ELECTRIC UTILITIES—1.5% | | | | | |
| Duke Energy Corp. | | 6,586 | | | 527,012 |
| Fortis, Inc. | | 13,351 | | | 438,580 |
| | | | | | 965,592 |
| ELECTRICAL COMPONENTS & EQUIPMENT—0.5% | | | | | |
| Acuity Brands, Inc. | | 1,340 | | | 299,584 |
| ELECTRONIC EQUIPMENT MANUFACTURERS—1.0% | | | | | |
| Itron, Inc.* | | 12,547 | | | 676,283 |
- 31 -
THE ALGER FUNDS II | ALGER GREEN FUND
Schedule of Investments October 31, 2016 (Continued)
| | | | | |
| COMMON STOCKS—(CONT.) | | SHARES | | | VALUE |
| ENVIRONMENTAL & FACILITIES SERVICES—5.1% | | | | | |
| Clean Harbors, Inc.* | | 9,980 | $ | 472,254 |
| Covanta Holding Corp. | | 32,575 | | | 488,625 |
| Tetra Tech, Inc. | | 28,516 | | | 1,096,440 |
| Waste Management, Inc. | | 20,020 | | | 1,314,513 |
| | | | | | 3,371,832 |
| FOOTWEAR—1.9% | | | | | |
| NIKE, Inc., Cl. B | | 24,769 | | | 1,242,908 |
| HEALTH CARE FACILITIES—1.1% | | | | | |
| Amsurg Corp.* | | 5,725 | | | 342,069 |
| HCA Holdings, Inc.* | | 4,550 | | | 348,211 |
| | | | | | 690,280 |
| HOME ENTERTAINMENT SOFTWARE—0.8% | | | | | |
| Electronic Arts, Inc.* | | 6,660 | | | 522,943 |
| HOME IMPROVEMENT RETAIL—2.1% | | | | | |
| The Home Depot, Inc. | | 11,022 | | | 1,344,794 |
| HOTELS RESORTS & CRUISE LINES—0.8% | | | | | |
| Royal Caribbean Cruises Ltd. | | 6,870 | | | 528,097 |
| HOUSEHOLD PRODUCTS—1.5% | | | | | |
| The Procter & Gamble Co. | | 11,674 | | | 1,013,303 |
| HOUSEWARES & SPECIALTIES—0.9% | | | | | |
| Newell Brands, Inc. | | 12,937 | | | 621,235 |
| HYPERMARKETS & SUPER CENTERS—0.4% | | | | | |
| Wal-Mart Stores, Inc. | | 3,925 | | | 274,829 |
| INDUSTRIAL CONGLOMERATES—4.8% | | | | | |
| 3M Co. | | 3,237 | | | 535,076 |
| General Electric Co. | | 29,717 | | | 864,765 |
| Honeywell International, Inc. | | 15,680 | | | 1,719,782 |
| | | | | | 3,119,623 |
| INDUSTRIAL MACHINERY—2.4% | | | | | |
| Woodward Governor Co. | | 10,925 | | | 644,356 |
| Xylem, Inc. | | 19,905 | | | 962,009 |
| | | | | | 1,606,365 |
| INTEGRATED TELECOMMUNICATION SERVICES—1.5% | | | | | |
| Verizon Communications, Inc. | | 20,915 | | | 1,006,012 |
| INTERNET RETAIL—5.2% | | | | | |
| Amazon.com, Inc.* | | 4,340 | | | 3,427,819 |
| INTERNET SOFTWARE & SERVICES—12.0% | | | | | |
| Alphabet, Inc., Cl. A* | | 2,185 | | | 1,769,631 |
| Alphabet, Inc., Cl. C* | | 3,066 | | | 2,405,400 |
| eBay, Inc.* | | 14,945 | | | 426,082 |
| Facebook, Inc., Cl. A* | | 24,885 | | | 3,259,686 |
| | | | | | 7,860,799 |
| INVESTMENT BANKING & BROKERAGE—1.0% | | | | | |
| Morgan Stanley | | 20,225 | | | 678,953 |
- 32 -
THE ALGER FUNDS II | ALGER GREEN FUND
Schedule of Investments October 31, 2016 (Continued)
| | | | | | |
| COMMON STOCKS—(CONT.) | | SHARES | | | | VALUE |
| LIFE & HEALTH INSURANCE—1.1% | | | | | | |
| Lincoln National Corp. | | 14,780 | $ | | 725,550 |
| MANAGED HEALTH CARE—2.6% | | | | | | |
| Aetna, Inc. | | 10,210 | | | | 1,096,043 |
| Humana, Inc. | | 3,515 | | | | 602,928 |
| | | | | | | 1,698,971 |
| MOVIES & ENTERTAINMENT—2.1% | | | | | | |
| The Walt Disney Co. | | 14,595 | | | | 1,352,811 |
| PACKAGED FOODS & MEATS—0.8% | | | | | | |
| The WhiteWave Foods Co.* | | 9,430 | | | | 513,841 |
| PHARMACEUTICALS—6.3% | | | | | | |
| Allergan PLC.* | | 3,625 | | | | 757,408 |
| Bristol-Myers Squibb Co. | | 19,715 | | | | 1,003,691 |
| Johnson & Johnson | | 14,270 | | | | 1,655,177 |
| Merck & Co., Inc. | | 12,320 | | | | 723,430 |
| | | | | | | 4,139,706 |
| RESTAURANTS—2.6% | | | | | | |
| Chipotle Mexican Grill, Inc.* | | 1,635 | | | | 589,843 |
| Starbucks Corp. | | 21,500 | | | | 1,141,005 |
| | | | | | | 1,730,848 |
| SEMICONDUCTORS—2.4% | | | | | | |
| Broadcom Ltd. | | 4,774 | | | | 812,917 |
| Intel Corp. | | 22,085 | | | | 770,104 |
| | | | | | | 1,583,021 |
| SOFT DRINKS—2.1% | | | | | | |
| The Coca-Cola Co. | | 31,748 | | | | 1,346,115 |
| SPECIALTY CHEMICALS—1.2% | | | | | | |
| Chemtura Corp.* | | 23,550 | | | | 772,440 |
| SYSTEMS SOFTWARE—4.3% | | | | | | |
| Microsoft Corp. | | 46,834 | | | | 2,806,293 |
| TECHNOLOGY HARDWARE STORAGE & PERIPHERALS—6.1% | | | | | | |
| Apple, Inc. | | 34,909 | | | | 3,963,568 |
| TOTAL COMMON STOCKS | | | | | | |
| (Cost $44,345,694) | | | | | | 63,156,472 |
| PREFERRED STOCKS—0.1% | | SHARES | | | | VALUE |
| ADVERTISING—0.1% | | | | | | |
| Choicestream, Inc., Series A*,@,(a) | | 31,215 | | | | – |
| Choicestream, Inc., Series B*,@,(a) | | 69,819 | | | | 41,193 |
| | | | | | | 41,193 |
| TOTAL PREFERRED STOCKS | | | | | | |
| (Cost $66,854) | | | | | | 41,193 |
- 33 -
THE ALGER FUNDS II | ALGER GREEN FUND
Schedule of Investments October 31, 2016 (Continued)
| | | | | | |
| WARRANTS—0.0% | | SHARES | | | | VALUE |
| ADVERTISING—0.0% | | | | | | |
| Choicestream, Inc., 6/22/26@,(a) | | 10,518 | | $ | | 10,308 |
| (Cost $10,508) | | | | | | 10,308 |
| | | PRINCIPAL | | | | |
| CORPORATE BONDS—0.0% | | AMOUNT | | | | VALUE |
| ADVERTISING—0.0% | | | | | | |
| Choicestream, Inc., 11.00%, 8/05/18@,(a) | | 10,518 | | | | 10,518 |
| (Cost $1,277) | | | | | | 10,518 |
| Total Investments | | | | | | |
| (Cost $44,424,333)(b) | | 96.6 | % | | | 63,218,491 |
| Other Assets in Excess of Liabilities | | 3.4 | % | | | 2,243,851 |
| NET ASSETS | | 100.0 | % | $ | | 65,462,342 |
# American Depositary Receipts.
(a) Deemed an affiliate of the Alger fund complex during the year for purposes of Section 2(a)(3) of the Investment
Company Act of 1940. See Affiliated Securities Note 11.
(b) At October 31, 2016, the net unrealized appreciation on investments, based on cost for federal income tax purposes
of $44,435,544, amounted to $18,782,947 which consisted of aggregate gross unrealized appreciation of
$20,242,158 and aggregate gross unrealized depreciation of $1,459,211.
* Non-income producing security.
@ Restricted security - Investment in security not registered under the Securities Act of 1933. The investment is deemed
to not be liquid and may be sold only to qualified buyers.
| | | | | | | | | |
| | | | | % of net assets | | | | % of net assets | |
| | Acquisition | | Acquisition | (Acquisition | | | Market | as of | |
| Security | Date(s) | | Cost | Date) | | | Value | 10/31/2016 | |
| Choicestream, Inc. | 03/14/14 | $ | 1,049 | 0.00 | % | $ | 0 | 0.00 | % |
| Choicestream, Inc., 11.00%, | | | | | | | | | |
| 8/05/18 | 08/04/16 | | 1,277 | 0.00 | % | | 10,518 | 0.02 | % |
| Choicestream, Inc., 6/22/26 | 08/04/16 | | 10,508 | 0.02 | % | | 10,308 | 0.01 | % |
| Choicestream, Inc., Cl. A | 12/17/13 | | 24,962 | 0.03 | % | | 0 | 0.00 | % |
| Choicestream, Inc., Cl. B | 07/10/14 | | 41,892 | 0.05 | % | | 41,193 | 0.06 | % |
| Total | | | | | | $ | 62,019 | 0.09 | % |
| | | | | | | | | | |
Industry classifications are unaudited.
See Notes to Financial Statements.
- 34 -
THE ALGER FUNDS II | ALGER MID CAP FOCUS FUND
Schedule of Investments October 31, 2016
| | | | | |
| COMMON STOCKS—82.9% | | SHARES | | | VALUE |
| AEROSPACE & DEFENSE—3.5% | | | | | |
| Hexcel Corp. | | 3,085 | $ | 140,337 |
| TransDigm Group, Inc. | | 534 | | | 145,493 |
| | | | | | 285,830 |
| AIRLINES—1.5% | | | | | |
| Southwest Airlines Co. | | 3,075 | | | 123,154 |
| APPAREL ACCESSORIES & LUXURY GOODS—6.3% | | | | | |
| Hanesbrands, Inc. | | 6,960 | | | 178,872 |
| lululemon athletica, Inc.* | | 1,537 | | | 87,993 |
| PVH Corp. | | 1,598 | | | 170,954 |
| Under Armour, Inc., Cl. A* | | 2,319 | | | 72,121 |
| | | | | | 509,940 |
| AUTO PARTS & EQUIPMENT—4.8% | | | | | |
| Delphi Automotive PLC. | | 1,545 | | | 100,533 |
| Johnson Controls International PLC. | | 4,985 | | | 200,996 |
| WABCO Holdings, Inc.* | | 872 | | | 85,857 |
| | | | | | 387,386 |
| BIOTECHNOLOGY—1.6% | | | | | |
| Vertex Pharmaceuticals, Inc.* | | 1,685 | | | 127,824 |
| CONSTRUCTION & FARM MACHINERY & HEAVY | | | | | |
| TRUCKS—2.0% | | | | | |
| Wabtec Corp. | | 2,116 | | | 163,588 |
| DATA PROCESSING & OUTSOURCED SERVICES—5.8% | | | | | |
| MAXIMUS, Inc. | | 3,397 | | | 176,848 |
| Sabre Corp. | | 7,851 | | | 202,792 |
| Vantiv, Inc., CL. A* | | 1,548 | | | 90,341 |
| | | | | | 469,981 |
| ELECTRICAL COMPONENTS & EQUIPMENT—1.4% | | | | | |
| Acuity Brands, Inc. | | 174 | | | 38,901 |
| AMETEK, Inc. | | 1,751 | | | 77,219 |
| | | | | | 116,120 |
| ELECTRONIC COMPONENTS—1.4% | | | | | |
| Dolby Laboratories Inc., Cl. A | | 2,348 | | | 111,741 |
| FINANCIAL EXCHANGES & DATA—1.5% | | | | | |
| MarketAxess Holdings, Inc. | | 807 | | | 121,663 |
| FOOD DISTRIBUTORS—1.9% | | | | | |
| Performance Food Group Co.* | | 6,543 | | | 157,032 |
| GENERAL MERCHANDISE STORES—2.0% | | | | | |
| Dollar Tree, Inc.* | | 2,195 | | | 165,832 |
| HEALTH CARE EQUIPMENT—5.5% | | | | | |
| DexCom, Inc.* | | 1,596 | | | 124,871 |
| Edwards Lifesciences Corp.* | | 912 | | | 86,841 |
| STERIS PLC. | | 3,455 | | | 230,863 |
| | | | | | 442,575 |
| HEALTH CARE FACILITIES—5.4% | | | | | |
| Amsurg Corp.* | | 3,585 | | | 214,204 |
- 35 -
THE ALGER FUNDS II | ALGER MID CAP FOCUS FUND
Schedule of Investments October 31, 2016 (Continued)
| | | | | | |
| COMMON STOCKS—(CONT.) | | SHARES | | | | VALUE |
| HEALTH CARE FACILITIES—(CONT.) | | | | | | |
| VCA Antech, Inc.* | | 3,662 | $ | | 225,066 |
| | | | | | | 439,270 |
| HEALTH CARE TECHNOLOGY—2.5% | | | | | | |
| Medidata Solutions, Inc.* | | 4,194 | | | | 201,270 |
| HOUSEWARES & SPECIALTIES—3.2% | | | | | | |
| Newell Brands, Inc. | | 5,465 | | | | 262,429 |
| HUMAN RESOURCE & EMPLOYMENT SERVICES—1.5% | | | | | | |
| WageWorks, Inc.* | | 2,006 | | | | 118,254 |
| INTERNET SOFTWARE & SERVICES—2.3% | | | | | | |
| Facebook, Inc., Cl. A* | | 1,419 | | | | 185,875 |
| LEISURE PRODUCTS—1.9% | | | | | | |
| Coach, Inc. | | 4,236 | | | | 152,030 |
| MANAGED HEALTH CARE—1.8% | | | | | | |
| Centene Corp.* | | 2,376 | | | | 148,453 |
| METAL & GLASS CONTAINERS—1.1% | | | | | | |
| Ball Corp. | | 1,101 | | | | 84,854 |
| PACKAGED FOODS & MEATS—0.9% | | | | | | |
| ConAgra Foods, Inc. | | 1,591 | | | | 76,654 |
| RESEARCH & CONSULTING SERVICES—2.5% | | | | | | |
| Verisk Analytics, Inc., Cl. A* | | 2,442 | | | | 199,145 |
| SEMICONDUCTORS—6.8% | | | | | | |
| Cavium Networks, Inc.* | | 2,017 | | | | 113,860 |
| Microsemi Corp.* | | 5,589 | | | | 235,464 |
| Skyworks Solutions, Inc. | | 2,604 | | | | 200,352 |
| | | | | | | 549,676 |
| SPECIALIZED CONSUMER SERVICES—1.9% | | | | | | |
| ServiceMaster Global Holdings, Inc.* | | 4,311 | | | | 154,291 |
| SPECIALTY CHEMICALS—4.2% | | | | | | |
| Axalta Coating Systems Ltd.* | | 4,957 | | | | 124,520 |
| The Sherwin-Williams Co. | | 354 | | | | 86,680 |
| WR Grace & Co. | | 1,922 | | | | 128,697 |
| | | | | | | 339,897 |
| SYSTEMS SOFTWARE—3.8% | | | | | | |
| ServiceNow, Inc.* | | 2,671 | | | | 234,808 |
| TubeMogul, Inc.* | | 10,424 | | | | 76,095 |
| | | | | | | 310,903 |
| TRADING COMPANIES & DISTRIBUTORS—3.1% | | | | | | |
| HD Supply Holdings, Inc.* | | 7,697 | | | | 254,001 |
| TRUCKING—0.8% | | | | | | |
| Old Dominion Freight Line, Inc.* | | 833 | | | | 62,209 |
| TOTAL COMMON STOCKS | | | | | | |
| (Cost $6,753,261) | | | | | | 6,721,877 |
- 36 -
THE ALGER FUNDS II | ALGER MID CAP FOCUS FUND
Schedule of Investments October 31, 2016 (Continued)
| | | | | | |
| MASTER LIMITED PARTNERSHIP—1.3% | | SHARES | | | | VALUE |
| ASSET MANAGEMENT & CUSTODY BANKS—1.3% | | | | | | |
| The Blackstone Group LP. | | 4,113 | | $ | | 102,948 |
| (Cost $132,024) | | | | | | 102,948 |
| REAL ESTATE INVESTMENT TRUST—5.5% | | SHARES | | | | VALUE |
| MORTGAGE—2.2% | | | | | | |
| Blackstone Mortgage Trust, Inc., Cl. A | | 5,893 | | | | 177,969 |
| SPECIALIZED—3.3% | | | | | | |
| Crown Castle International Corp. | | 2,949 | | | | 268,329 |
| TOTAL REAL ESTATE INVESTMENT TRUST | | | | | | |
| (Cost $415,776) | | | | | | 446,298 |
| Total Investments | | | | | | |
| (Cost $7,301,061)(a) | | 89.7 | % | | | 7,271,123 |
| Other Assets in Excess of Liabilities | | 10.3 | % | | | 836,256 |
| NET ASSETS | | 100.0 | % | $ | | 8,107,379 |
(a) At October 31, 2016, the net unrealized depreciation on investments, based on cost for federal income tax purposes
of $7,321,355, amounted to $50,232 which consisted of aggregate gross unrealized appreciation of $437,717
and aggregate gross unrealized depreciation of $487,949.
* Non-income producing security.
Industry classifications are unaudited.
See Notes to Financial Statements.
- 37 -
THE ALGER FUNDS II | ALGER DYNAMIC OPPORTUNITIES FUND
Schedule of Investments October 31, 2016
| | | | | |
| COMMON STOCKS—69.7% | | SHARES | | | VALUE |
| APPAREL ACCESSORIES & LUXURY GOODS—0.8% | | | | | |
| Ralph Lauren Corp.+ | | 6,935 | $ | 680,323 |
| APPLICATION SOFTWARE—2.1% | | | | | |
| Blackbaud, Inc. | | 7,180 | | | 440,852 |
| Guidewire Software, Inc.* | | 6,498 | | | 373,310 |
| Mobileye NV* | | 10,184 | | | 378,641 |
| salesforce.com, Inc.* | | 6,940 | | | 521,611 |
| | | | | | 1,714,414 |
| ASSET MANAGEMENT & CUSTODY BANKS—1.8% | | | | | |
| Affiliated Managers Group, Inc.*+ | | 4,580 | | | 607,583 |
| WisdomTree Investments, Inc.+ | | 101,719 | | | 872,749 |
| | | | | | 1,480,332 |
| BIOTECHNOLOGY—3.7% | | | | | |
| ACADIA Pharmaceuticals, Inc.* | | 24,499 | | | 571,072 |
| Alexion Pharmaceuticals, Inc.* | | 3,504 | | | 457,272 |
| BioMarin Pharmaceutical, Inc.* | | 8,662 | | | 697,464 |
| Celgene Corp.* | | 5,866 | | | 599,388 |
| Incyte Corp.* | | 4,792 | | | 416,760 |
| Vertex Pharmaceuticals, Inc.*+ | | 4,153 | | | 315,047 |
| | | | | | 3,057,003 |
| BREWERS—1.6% | | | | | |
| Molson Coors Brewing Co., Cl. B+ | | 12,364 | | | 1,283,507 |
| BROADCASTING—1.1% | | | | | |
| CBS Corp., Cl. B+ | | 16,580 | | | 938,760 |
| CABLE & SATELLITE—2.3% | | | | | |
| Comcast Corporation, Cl. A+ | | 30,177 | | | 1,865,542 |
| COMMUNICATIONS EQUIPMENT—0.8% | | | | | |
| Finisar Corp.* | | 19,945 | | | 546,094 |
| Quantenna Communications, Inc.* | | 7,443 | | | 111,496 |
| | | | | | 657,590 |
| CONSUMER FINANCE—1.3% | | | | | |
| LendingClub Corp.*+ | | 210,419 | | | 1,037,366 |
| DATA PROCESSING & OUTSOURCED SERVICES—3.5% | | | | | |
| Euronet Worldwide, Inc.*+ | | 8,035 | | | 639,184 |
| Visa, Inc., Cl. A+ | | 26,925 | | | 2,221,582 |
| | | | | | 2,860,766 |
| ELECTRONIC MANUFACTURING SERVICES—1.0% | | | | | |
| Trimble, Inc.* | | 30,038 | | | 830,250 |
| FINANCIAL EXCHANGES & DATA—0.5% | | | | | |
| CME Group, Inc. | | 4,180 | | | 418,418 |
| GENERAL MERCHANDISE STORES—0.4% | | | | | |
| Dollar Tree, Inc.* | | 4,737 | | | 357,880 |
| HEALTH CARE EQUIPMENT—3.0% | | | | | |
| Abaxis, Inc. | | 8,935 | | | 426,557 |
| Cantel Medical Corp. | | 13,319 | | | 948,712 |
- 38 -
THE ALGER FUNDS II | ALGER DYNAMIC OPPORTUNITIES FUND
Schedule of Investments October 31, 2016 (Continued)
| | | | | |
| COMMON STOCKS—(CONT.) | | SHARES | | | VALUE |
| HEALTH CARE EQUIPMENT—(CONT.) | | | | | |
| DexCom, Inc.* | | 7,807 | $ | 610,820 |
| Edwards Lifesciences Corp.* | | 5,374 | | | 511,712 |
| | | | | | 2,497,801 |
| HEALTH CARE SUPPLIES—1.4% | | | | | |
| Endologix, Inc.* | | 36,095 | | | 377,554 |
| Neogen Corp.* | | 15,135 | | | 797,463 |
| | | | | | 1,175,017 |
| HEALTH CARE TECHNOLOGY—0.9% | | | | | |
| Medidata Solutions, Inc.* | | 15,945 | | | 765,200 |
| HOME ENTERTAINMENT SOFTWARE—1.0% | | | | | |
| Activision Blizzard, Inc. | | 10,663 | | | 460,322 |
| Electronic Arts, Inc.* | | 5,020 | | | 394,170 |
| | | | | | 854,492 |
| HOTELS RESORTS & CRUISE LINES—0.5% | | | | | |
| Norwegian Cruise Line Holdings Ltd.*+ | | 11,141 | | | 433,051 |
| HOUSEWARES & SPECIALTIES—1.1% | | | | | |
| Newell Brands, Inc. | | 17,904 | | | 859,750 |
| HUMAN RESOURCE & EMPLOYMENT SERVICES—0.5% | | | | | |
| On Assignment, Inc.* | | 12,080 | | | 415,673 |
| INDUSTRIAL CONGLOMERATES—1.3% | | | | | |
| Honeywell International, Inc.+ | | 9,355 | | | 1,026,056 |
| INTERNET RETAIL—2.7% | | | | | |
| Amazon.com, Inc.*+ | | 2,791 | | | 2,204,388 |
| INTERNET SOFTWARE & SERVICES—10.7% | | | | | |
| Alibaba Group Holding Ltd.#* | | 8,055 | | | 819,113 |
| Alphabet, Inc., Cl. C*+ | | 3,983 | | | 3,124,823 |
| eBay, Inc.* | | 13,134 | | | 374,450 |
| Facebook, Inc., Cl. A*+ | | 10,317 | | | 1,351,424 |
| GrubHub, Inc.* | | 22,530 | | | 858,618 |
| Match Group, Inc.* | | 30,528 | | | 551,336 |
| Palantir Technologies, Inc., Cl. A*,@ | | 6,606 | | | 50,536 |
| SPS Commerce, Inc.* | | 5,309 | | | 331,175 |
| Tencent Holdings Ltd. | | 13,665 | | | 362,152 |
| Yahoo! Inc.*+ | | 22,174 | | | 921,330 |
| | | | | | 8,744,957 |
| INVESTMENT BANKING & BROKERAGE—0.5% | | | | | |
| Morgan Stanley | | 12,495 | | | 419,457 |
| LIFE SCIENCES TOOLS & SERVICES—3.8% | | | | | |
| Bio-Techne Corp. | | 19,913 | | | 2,070,753 |
| Thermo Fisher Scientific, Inc.+ | | 6,860 | | | 1,008,626 |
| | | | | | 3,079,379 |
| MANAGED HEALTH CARE—1.0% | | | | | |
| UnitedHealth Group, Inc.+ | | 5,865 | | | 828,900 |
- 39 -
THE ALGER FUNDS II | ALGER DYNAMIC OPPORTUNITIES FUND
Schedule of Investments October 31, 2016 (Continued)
| | | | | | |
| COMMON STOCKS—(CONT.) | | SHARES | | | | VALUE |
| MOVIES & ENTERTAINMENT—1.0% | | | | | | |
| Lions Gate Entertainment Corp. | | 39,088 | $ | | 795,832 |
| OIL & GAS EXPLORATION & PRODUCTION—1.2% | | | | | | |
| Anadarko Petroleum Corp. | | 8,275 | | | | 491,866 |
| EOG Resources, Inc. | | 5,319 | | | | 480,944 |
| | | | | | | 972,810 |
| PACKAGED FOODS & MEATS—0.5% | | | | | | |
| Hain Celestial Group, Inc.* | | 11,980 | | | | 435,713 |
| PHARMACEUTICALS—1.2% | | | | | | |
| Allergan PLC.* | | 4,835 | | | | 1,010,225 |
| RESEARCH & CONSULTING SERVICES—0.5% | | | | | | |
| Verisk Analytics, Inc., Cl. A* | | 5,239 | | | | 427,240 |
| RESTAURANTS—1.8% | | | | | | |
| Shake Shack, Inc., Cl. A*+ | | 26,402 | | | | 841,960 |
| Wingstop, Inc.+ | | 23,080 | | | | 617,621 |
| | | | | | | 1,459,581 |
| SEMICONDUCTORS—3.8% | | | | | | |
| Broadcom Ltd.+ | | 6,042 | | | | 1,028,832 |
| Microsemi Corp.*+ | | 11,265 | | | | 474,594 |
| NXP Semiconductors NV*+ | | 7,621 | | | | 762,100 |
| Skyworks Solutions, Inc. | | 11,300 | | | | 869,422 |
| | | | | | | 3,134,948 |
| SOFT DRINKS—2.0% | | | | | | |
| PepsiCo, Inc.+ | | 15,074 | | | | 1,615,933 |
| SYSTEMS SOFTWARE—3.5% | | | | | | |
| Microsoft Corp.+ | | 29,283 | | | | 1,754,637 |
| ServiceNow, Inc.* | | 6,653 | | | | 584,865 |
| TubeMogul, Inc.*+ | | 69,788 | | | | 509,453 |
| | | | | | | 2,848,955 |
| TECHNOLOGY HARDWARE STORAGE & PERIPHERALS—3.1% | | | | | | |
| Apple, Inc.+ | | 22,589 | | | | 2,564,755 |
| TOBACCO—1.0% | | | | | | |
| Philip Morris International, Inc.+ | | 8,344 | | | | 804,695 |
| TRADING COMPANIES & DISTRIBUTORS—0.8% | | | | | | |
| HD Supply Holdings, Inc.*+ | | 19,290 | | | | 636,570 |
| TOTAL COMMON STOCKS | | | | | | |
| (Cost $53,335,498) | | | | | | 57,193,529 |
| PREFERRED STOCKS—0.9% | | SHARES | | | | VALUE |
| BIOTECHNOLOGY—0.4% | | | | | | |
| Prosetta Biosciences, Inc., Series D*,@,(a) | | 41,418 | | | | 167,328 |
| Tolero Pharmaceuticals, Inc., Series B*,@,(a) | | 106,120 | | | | 136,895 |
| | | | | | | 304,223 |
| INTERNET SOFTWARE & SERVICES—0.3% | | | | | | |
| Palantir Technologies, Inc., Cl. B*,@ | | 26,941 | | | | 206,099 |
- 40 -
THE ALGER FUNDS II | ALGER DYNAMIC OPPORTUNITIES FUND
Schedule of Investments October 31, 2016 (Continued)
| | | | | | | |
| PREFERRED STOCKS—(CONT.) | | SHARES | | | | | VALUE |
| INTERNET SOFTWARE & SERVICES—(CONT.) | | | | | | | |
| Palantir Technologies, Inc., Cl. D*,@ | | 3,510 | $ | | 26,851 |
| | | | | | | | 232,950 |
| PHARMACEUTICALS—0.2% | | | | | | | |
| Intarcia Therapeutics, Inc., Series DD*,@ | | 2,964 | | | | | 169,067 |
| TOTAL PREFERRED STOCKS | | | | | | | |
| (Cost $803,533) | | | | | | | 706,240 |
| RIGHTS—0.0% | | SHARES | | | | | VALUE |
| BIOTECHNOLOGY—0.0% | | | | | | | |
| Adolor Corp., CPR, 12/31/2049*,@,(b) | | 49,870 | | | | | – |
| (Cost $–) | | | | | | | – |
| MASTER LIMITED PARTNERSHIP—1.2% | | SHARES | | | | | VALUE |
| ASSET MANAGEMENT & CUSTODY BANKS—1.2% | | | | | | | |
| The Blackstone Group LP.+ | | 41,209 | | | | | 1,031,461 |
| (Cost $1,094,061) | | | | | | | 1,031,461 |
| REAL ESTATE INVESTMENT TRUST—4.1% | | SHARES | | | | | VALUE |
| MORTGAGE—0.6% | | | | | | | |
| Blackstone Mortgage Trust, Inc., Cl. A | | 16,021 | | | | | 483,834 |
| SPECIALIZED—3.5% | | | | | | | |
| Crown Castle International Corp.+ | | 19,399 | | | | | 1,765,115 |
| Lamar Advertising Co., Cl. A | | 17,401 | | | | | 1,104,094 |
| | | | | | | | 2,869,209 |
| TOTAL REAL ESTATE INVESTMENT TRUST | | | | | | | |
| (Cost $3,289,402) | | | | | | | 3,353,043 |
| PURCHASED OPTIONS—0.1% | CONTRACTS | | | | | VALUE |
| CALL OPTIONS—0.0% | | | | | | | |
| Twitter, Inc. /December/ 23* | | 469 | | | | | 13,601 |
| (Cost $90,029) | | | | | | | 13,601 |
| PUT OPTIONS—0.1% | | | | | | | |
| S&P 500/ December/ 2075 | | 20 | | | | | 62,000 |
| (Cost $61,446) | | | | | | | 62,000 |
| TOTAL PURCHASED OPTIONS | | | | | | | |
| (Cost $151,475) | | | | | | | 75,601 |
| U.S. GOVERNMENT AGENCY OBLIGATIONS (EXCLUDING | | PRINCIPAL | | | | | |
| MORTGAGE-BACKED)—36.5% | | AMOUNT | | | | | VALUE |
| | | | | | |
| United States Treasury Bill, 0.00%, 11/17/16 | | 30,000,000 | | | | | 29,996,464 |
| (Cost $29,996,464) | | | | | 29,996,464 |
- 41 -
THE ALGER FUNDS II | ALGER DYNAMIC OPPORTUNITIES FUND
Schedule of Investments October 31, 2016 (Continued)
| | | | | | | |
| SPECIAL PURPOSE VEHICLE—0.2% | | SHARES | | | | VALUE | |
| CONSUMER FINANCE—0.2% | | | | | | | |
| JS Kred SPV I, LLC.@ | | 159,212 | | $ | | 165,437 | |
| (Cost $159,212) | | | | | | 165,437 | |
| Total Investments | | | | | | | |
| (Cost $88,829,645)(c) | | 112.7 | % | | | 92,521,775 | |
| Liabilities in Excess of Other Assets | | (12.7 | )% | | | (10,423,808 | ) |
| NET ASSETS | | 100.0 | % | $ | | 82,097,967 | |
# American Depositary Receipts.
(a) Deemed an affiliate of the Alger fund complex during the year for purposes of Section 2(a)(3) of the Investment
Company Act of 1940. See Affiliated Securities Note 11.
(b) Right - Contingent Payment Right granted December 13, 2011 and may not be sold. Right is deemed to be illiquid
and represents 0.0% of the net assets of the Fund.
(c) At October 31, 2016, the net unrealized appreciation on investments, based on cost for federal income tax
purposes of $91,372,496, amounted to $1,149,279 which consisted of aggregate gross unrealized appreciation of
$7,047,280 and aggregate gross unrealized depreciation of $5,898,001.
* Non-income producing security.
@ Restricted security - Investment in security not registered under the Securities Act of 1933. The investment is deemed
to not be liquid and may be sold only to qualified buyers.
| | | | | | | | | |
| | | | | % of net assets | | | | % of net assets | |
| | Acquisition | | Acquisition | (Acquisition | | | Market | as of | |
| Security | Date(s) | | Cost | Date) | | | Value | 10/31/2016 | |
| Adolor Corp., CPR , | | | | | | | | | |
| 12/31/2049 | 10/24/11 | $ | 0 | 0.00 | % | $ | 0 | 0.00 | % |
| Intarcia Therapeutics, Inc., Series | | | | | | | | | |
| DD | 03/27/14 | | 96,004 | 0.14 | % | | 169,067 | 0.21 | % |
| JS Kred SPV I, LLC. | 06/26/15 | | 159,212 | 0.15 | % | | 165,437 | 0.20 | % |
| Palantir Technologies, Inc., Cl. A | 10/07/14 | | 42,985 | 0.05 | % | | 50,536 | 0.06 | % |
| Palantir Technologies, Inc., Cl. B | 10/07/14 | | 177,903 | 0.22 | % | | 206,099 | 0.25 | % |
| Palantir Technologies, Inc., Cl. D | 10/14/14 | | 23,176 | 0.03 | % | | 26,851 | 0.03 | % |
| Prosetta Biosciences, Inc., Series D | 02/06/15 | | 186,381 | 0.25 | % | | 167,328 | 0.20 | % |
| Tolero Pharmaceuticals, Inc. | 08/01/14 | | 154,147 | 0.20 | % | | 65,929 | 0.08 | % |
| Tolero Pharmaceuticals, Inc. | 10/31/14 | | 165,922 | 0.20 | % | | 70,966 | 0.09 | % |
| Total | | | | | | $ | 922,213 | 1.12 | % |
| | | | | | | | | | |
| + All or a portion of this security is held as collateral for securities sold short. | | | | | | |
Industry classifications are unaudited.
See Notes to Financial Statements.
- 42 -
THE ALGER FUNDS II | ALGER DYNAMIC OPPORTUNITIES FUND
Schedule of Investments- Securities Sold Short October 31, 2016
| | | | | | | |
| COMMON STOCKS—-21.3% | | SHARES | | | | VALUE | |
| AGRICULTURAL & FARM MACHINERY—-0.4% | | | | | | | |
| Deere & Co. | | (3,360 | ) | $ | (296,688 | ) |
| AIR FREIGHT & LOGISTICS—-0.2% | | | | | | | |
| Expeditors International of Washington, Inc. | | (3,304 | ) | | | (170,057 | ) |
| AIRLINES—-0.2% | | | | | | | |
| JetBlue Airways Corp.* | | (10,355 | ) | | | (181,005 | ) |
| APPAREL ACCESSORIES & LUXURY GOODS—-0.2% | | | | | | | |
| Carter's, Inc. | | (1,439 | ) | | | (124,243 | ) |
| APPAREL RETAIL—-0.2% | | | | | | | |
| The Children's Place Retail Stores, Inc. | | (2,239 | ) | | | (170,052 | ) |
| APPLICATION SOFTWARE—-1.0% | | | | | | | |
| Citrix Systems, Inc.* | | (5,620 | ) | | | (476,576 | ) |
| Workday, Inc., Cl. A* | | (4,221 | ) | | | (365,876 | ) |
| | | | | | | (842,452 | ) |
| ASSET MANAGEMENT & CUSTODY BANKS—-0.6% | | | | | | | |
| Ameriprise Financial, Inc. | | (2,570 | ) | | | (227,162 | ) |
| T. Rowe Price Group, Inc. | | (3,930 | ) | | | (251,559 | ) |
| | | | | | | (478,721 | ) |
| AUTO PARTS & EQUIPMENT—-0.4% | | | | | | | |
| Gentex Corp. | | (20,875 | ) | | | (352,996 | ) |
| BIOTECHNOLOGY—-0.8% | | | | | | | |
| Alkermes PLC.* | | (5,090 | ) | | | (256,587 | ) |
| Genomic Health, Inc.* | | (7,605 | ) | | | (226,705 | ) |
| Seattle Genetics, Inc.* | | (2,491 | ) | | | (128,785 | ) |
| | | | | | | (612,077 | ) |
| BROADCASTING—-0.3% | | | | | | | |
| Scripps Networks Interactive, Inc., Cl. A | | (4,314 | ) | | | (277,649 | ) |
| BROADCASTING & CABLE TV—-0.2% | | | | | | | |
| Pandora Media, Inc.* | | (12,842 | ) | | | (145,500 | ) |
| BUILDING PRODUCTS—-0.3% | | | | | | | |
| Lennox International, Inc. | | (1,745 | ) | | | (254,578 | ) |
| CABLE & SATELLITE—-0.3% | | | | | | | |
| AMC Networks, Inc.* | | (4,443 | ) | | | (217,396 | ) |
| CASINOS & GAMING—-0.6% | | | | | | | |
| Wynn Resorts Ltd. | | (5,165 | ) | | | (488,351 | ) |
| COMPUTER & ELECTRONICS RETAIL—-0.5% | | | | | | | |
| Best Buy Co., Inc. | | (10,661 | ) | | | (414,820 | ) |
| CONSUMER FINANCE—-0.3% | | | | | | | |
| Capital One Financial Corp. | | (3,525 | ) | | | (260,991 | ) |
| DATA PROCESSING & OUTSOURCED SERVICES—-0.7% | | | | | | | |
| Automatic Data Processing, Inc. | | (6,400 | ) | | | (557,184 | ) |
| FOOD RETAIL—-0.2% | | | | | | | |
| Whole Foods Market, Inc. | | (6,615 | ) | | | (187,138 | ) |
| GAS UTILITIES—-0.3% | | | | | | | |
| National Fuel Gas Co. | | (5,310 | ) | | | (278,138 | ) |
- 43 -
THE ALGER FUNDS II | ALGER DYNAMIC OPPORTUNITIES FUND
Schedule of Investments- Securities Sold Short October 31, 2016 (Continued)
| | | | | | | |
| COMMON STOCKS—(CONT.) | | SHARES | | | | VALUE | |
| HEALTH CARE DISTRIBUTORS—-0.3% | | | | | | | |
| Patterson Cos., Inc. | | (6,565 | ) | $ | (280,391 | ) |
| HEALTH CARE EQUIPMENT—-0.7% | | | | | | | |
| Abbott Laboratories | | (3,970 | ) | | | (155,783 | ) |
| Globus Medical, Inc., Cl. A* | | (8,000 | ) | | | (177,040 | ) |
| ResMed, Inc. | | (3,920 | ) | | | (234,298 | ) |
| | | | | | | (567,121 | ) |
| HEALTH CARE FACILITIES—-0.4% | | | | | | | |
| Healthsouth Corp. | | (7,220 | ) | | | (289,883 | ) |
| HEALTH CARE SERVICES—-0.5% | | | | | | | |
| Express Scripts, Inc.* | | (5,616 | ) | | | (378,518 | ) |
| HEALTH CARE SUPPLIES—-0.2% | | | | | | | |
| The Cooper Cos., Inc. | | (945 | ) | | | (166,358 | ) |
| HEALTH CARE TECHNOLOGY—-0.3% | | | | | | | |
| Cerner Corp.* | | (3,583 | ) | | | (209,892 | ) |
| HOTELS RESORTS & CRUISE LINES—-0.3% | | | | | | | |
| Hilton Worldwide Holdings, Inc. | | (9,168 | ) | | | (207,197 | ) |
| HOUSEWARES & SPECIALTIES—-0.1% | | | | | | | |
| Tupperware Brands Corp. | | (1,969 | ) | | | (117,195 | ) |
| INSURANCE BROKERS—-0.6% | | | | | | | |
| Aon PLC. | | (4,620 | ) | | | (512,035 | ) |
| INTEGRATED OIL & GAS—-0.5% | | | | | | | |
| Exxon Mobil Corp. | | (3,120 | ) | | | (259,958 | ) |
| Statoil ASA# | | (11,545 | ) | | | (187,491 | ) |
| | | | | | | (447,449 | ) |
| INTERNET SOFTWARE & SERVICES—-0.8% | | | | | | | |
| Cimpress NV* | | (3,135 | ) | | | (260,989 | ) |
| VeriSign, Inc.* | | (2,220 | ) | | | (186,524 | ) |
| WebMD Health Corp.* | | (4,150 | ) | | | (203,890 | ) |
| | | | | | | (651,403 | ) |
| IT CONSULTING & OTHER SERVICES—-0.9% | | | | | | | |
| Accenture PLC., Cl. A | | (3,880 | ) | | | (451,011 | ) |
| Gartner, Inc.* | | (2,975 | ) | | | (255,969 | ) |
| | | | | | | (706,980 | ) |
| LEISURE PRODUCTS—-0.1% | | | | | | | |
| Polaris Industries, Inc. | | (1,435 | ) | | | (109,935 | ) |
| LIFE SCIENCES TOOLS & SERVICES—-0.2% | | | | | | | |
| Quintiles Transnational Holdings, Inc.* | | (1,722 | ) | | | (123,536 | ) |
| MANAGED HEALTH CARE—-0.3% | | | | | | | |
| Anthem, Inc. | | (2,320 | ) | | | (282,715 | ) |
| MARKET INDICES—-1.3% | | | | | | | |
| iShares Russell 2000 Growth | | (3,115 | ) | | | (435,695 | ) |
| Powershares QQQ Trust Series 1 | | (5,535 | ) | | | (647,540 | ) |
| | | | | | | (1,083,235 | ) |
- 44 -
THE ALGER FUNDS II | ALGER DYNAMIC OPPORTUNITIES FUND
Schedule of Investments- Securities Sold Short October 31, 2016 (Continued)
| | | | | | | |
| COMMON STOCKS—(CONT.) | | SHARES | | | | VALUE | |
| MOTORCYCLE MANUFACTURERS—-0.2% | | | | | | | |
| Harley-Davidson, Inc. | | (3,427 | ) | $ | (195,408 | ) |
| OIL & GAS REFINING & MARKETING—-0.4% | | | | | | | |
| Phillips 66 | | (3,505 | ) | | | (284,431 | ) |
| REGIONAL BANKS—-0.8% | | | | | | | |
| Cullen/Frost Bankers, Inc. | | (5,599 | ) | | | (425,468 | ) |
| Hancock Holding Co. | | (7,140 | ) | | | (239,547 | ) |
| | | | | | | (665,015 | ) |
| RESTAURANTS—-1.2% | | | | | | | |
| Brinker International, Inc. | | (3,280 | ) | | | (161,507 | ) |
| Chuy's Holdings, Inc.* | | (6,420 | ) | | | (182,328 | ) |
| Restaurant Brands International, Inc. | | (5,305 | ) | | | (235,913 | ) |
| Texas Roadhouse, Inc. | | (5,455 | ) | | | (221,037 | ) |
| Zoe's Kitchen, Inc.* | | (8,195 | ) | | | (185,781 | ) |
| | | | | | | (986,566 | ) |
| SEMICONDUCTORS—-0.7% | | | | | | | |
| Analog Devices, Inc. | | (2,760 | ) | | | (176,916 | ) |
| Qorvo, Inc.* | | (2,670 | ) | | | (148,586 | ) |
| Taiwan Semiconductor Manufacturing Co., Ltd.# | | (7,465 | ) | | | (232,161 | ) |
| | | | | | | (557,663 | ) |
| SPECIALTY CHEMICALS—-0.3% | | | | | | | |
| The Valspar Corp. | | (2,615 | ) | | | (260,454 | ) |
| SPECIALTY STORES—-0.3% | | | | | | | |
| Sally Beauty Holdings, Inc.* | | (8,870 | ) | | | (230,088 | ) |
| SYSTEMS SOFTWARE—-1.1% | | | | | | | |
| Check Point Software Technologies Ltd.* | | (6,900 | ) | | | (583,464 | ) |
| Oracle Corp. | | (4,705 | ) | | | (180,766 | ) |
| Tableau Software, Inc., Cl. A* | | (3,211 | ) | | | (154,289 | ) |
| | | | | | | (918,519 | ) |
| TECHNOLOGY HARDWARE STORAGE & PERIPHERALS—-0.2% | | | | | | | |
| Electronics For Imaging, Inc.* | | (4,404 | ) | | | (187,302 | ) |
| TRADING COMPANIES & DISTRIBUTORS—-0.5% | | | | | | | |
| WW Grainger, Inc. | | (1,925 | ) | | | (400,631 | ) |
| TRUCKING—-0.4% | | | | | | | |
| Ryder System, Inc. | | (5,080 | ) | | | (352,501 | ) |
| TOTAL COMMON STOCKS | | | | | | | |
| (Proceeds $17,152,655) | | | | $ | (17,482,457 | ) |
| REAL ESTATE INVESTMENT TRUST—-0.8% | | SHARES | | | | VALUE | |
| OFFICE REITS—-0.3% | | | | | | | |
| Boston Properties, Inc. | | (2,040 | ) | | | (245,779 | ) |
| RETAIL REITS—-0.3% | | | | | | | |
| Simon Property Group, Inc. | | (1,255 | ) | | | (233,380 | ) |
| SPECIALIZED REITS—-0.2% | | | | | | | |
| Host Hotels & Resorts, Inc. | | (13,449 | ) | | | (208,190 | ) |
| TOTAL REAL ESTATE INVESTMENT TRUST | | | | | | | |
- 45 -
THE ALGER FUNDS II | ALGER DYNAMIC OPPORTUNITIES FUND
Schedule of Investments- Securities Sold Short October 31, 2016 (Continued)
| | | | |
| REAL ESTATE INVESTMENT TRUST—(CONT.) | SHARES | | VALUE | |
| SPECIALIZED REITS—(CONT.) | | | | |
| (Proceeds $694,544) | | $ | (687,349 | ) |
| Total (Proceeds $17,847,199) | | $ | (18,169,806 | ) |
* Non-income producing security.
# American Depositary Receipts.
Industry classifications are unaudited.
See Notes to Financial Statements.
- 46 -
THE ALGER FUNDS II | ALGER EMERGING MARKETS FUND
Schedule of Investments October 31, 2016
| | | | |
| COMMON STOCKS—95.4% | | SHARES | | VALUE |
| BRAZIL—7.3% | | | | |
| DEPARTMENT STORES—0.9% | | | | |
| Lojas Renner SA* | | 42,154 | $ | 356,426 |
| DIVERSIFIED BANKS—1.0% | | | | |
| Banco Bradesco SA* | | 38,819 | | 406,516 |
| DIVERSIFIED REAL ESTATE ACTIVITIES—1.1% | | | | |
| BR Malls Participacoes SA* | | 113,328 | | 453,561 |
| DRUG RETAIL—0.4% | | | | |
| Raia Drogasil SA | | 7,500 | | 166,429 |
| INDEPENDENT POWER AND RENEWABLE ENERGY—0.9% | | | | |
| AES Tiete Energia SA | | 72,920 | | 377,702 |
| MULTI-LINE INSURANCE—1.1% | | | | |
| BB Seguridade Participacoes SA | | 42,217 | | 424,913 |
| PERSONAL PRODUCTS—0.5% | | | | |
| Hypermarcas SA | | 23,915 | | 200,412 |
| RAILROADS—0.8% | | | | |
| Rumo Logistica Operadora Multimodal SA* | | 144,622 | | 323,370 |
| STEEL—0.6% | | | | |
| Gerdau SA* | | 74,786 | | 258,089 |
| TOTAL BRAZIL | | | | |
| (Cost $2,483,864) | | | | 2,967,418 |
| CHILE—0.5% | | | | |
| SOFT DRINKS—0.5% | | | | |
| Embotelladora Andina SA | | 54,341 | | 220,444 |
| (Cost $185,443) | | | | |
| CHINA—18.5% | | | | |
| APPAREL ACCESSORIES & LUXURY GOODS—1.0% | | | | |
| Li Ning Co., Ltd.* | | 578,500 | | 413,155 |
| COMMODITY CHEMICALS—0.8% | | | | |
| Green Seal Holdings Ltd. | | 64,000 | | 339,825 |
| CONSTRUCTION MATERIALS—0.8% | | | | |
| Anhui Conch Cement Co., Ltd. | | 115,500 | | 319,230 |
| DIVERSIFIED BANKS—1.6% | | | | |
| China Construction Bank Corp. | | 905,700 | | 661,381 |
| ELECTRICAL COMPONENTS & EQUIPMENT—0.7% | | | | |
| Byd Co., Ltd. | | 44,500 | | 292,957 |
| ELECTRONIC MANUFACTURING SERVICES—0.5% | | | | |
| FIH Mobile Ltd. | | 567,000 | | 187,111 |
| HEALTH CARE FACILITIES—0.7% | | | | |
| Phoenix Healthcare Group Co., Ltd. | | 183,413 | | 291,458 |
| INDEPENDENT POWER PRODUCERS & ENERGY TRADERS—0.8% | | | |
| Huaneng Renewables Corp., Ltd. | | 1,002,360 | | 335,870 |
| INTEGRATED OIL & GAS—2.0% | | | | |
| China Petroleum & Chemical Corp. | | 595,023 | | 430,318 |
- 47 -
THE ALGER FUNDS II | ALGER EMERGING MARKETS FUND
Schedule of Investments October 31, 2016 (Continued)
| | | | |
| COMMON STOCKS—(CONT.) | | SHARES | | VALUE |
| CHINA—(CONT.) | | | | |
| INTEGRATED OIL & GAS—(CONT.) | | | | |
| PetroChina Co., Ltd. | | 558,000 | $ | 381,801 |
| | | | | 812,119 |
| INTERNET RETAIL—0.7% | | | | |
| JD.com, Inc.#* | | 11,446 | | 297,024 |
| INTERNET SOFTWARE & SERVICES—7.8% | | | | |
| Alibaba Group Holding Ltd.#* | | 12,469 | | 1,267,973 |
| Tencent Holdings Ltd. | | 70,907 | | 1,879,189 |
| | | | | 3,147,162 |
| LIFE & HEALTH INSURANCE—1.1% | | | | |
| Ping An Insurance Group Co., of China Ltd. | | 80,032 | | 421,247 |
| TOTAL CHINA | | | | |
| (Cost $6,435,273) | | | | 7,518,539 |
| COLOMBIA—0.9% | | | | |
| CONSTRUCTION MATERIALS—0.9% | | | | |
| Cementos Argos SA | | 100,657 | | 366,904 |
| (Cost $399,859) | | | | |
| HONG KONG—6.8% | | | | |
| CONSTRUCTION & ENGINEERING—1.0% | | | | |
| China State Construction International Holdings Ltd. | | 285,368 | | 416,306 |
| INDUSTRIAL CONGLOMERATES—1.0% | | | | |
| China Everbright International Ltd. | | 332,299 | | 397,238 |
| LIFE & HEALTH INSURANCE—1.3% | | | | |
| AIA Group Ltd. | | 81,319 | | 511,575 |
| MOVIES & ENTERTAINMENT—0.4% | | | | |
| IMAX China Holding, Inc.*(a) | | 35,000 | | 165,485 |
| PACKAGED FOODS & MEATS—0.8% | | | | |
| China Mengniu Dairy Co., Ltd. | | 171,000 | | 323,020 |
| REAL ESTATE DEVELOPMENT—0.5% | | | | |
| China Overseas Land & Investment Ltd. | | 67,033 | | 205,783 |
| WIRELESS TELECOMMUNICATION SERVICES—1.8% | | | | |
| China Mobile Ltd. | | 65,230 | | 747,296 |
| TOTAL HONG KONG | | | | |
| (Cost $2,863,122) | | | | 2,766,703 |
| INDIA—9.5% | | | | |
| ALUMINUM—0.5% | | | | |
| Hindalco Industries Ltd. | | 99,125 | | 223,206 |
| AUTOMOBILE MANUFACTURERS—1.2% | | | | |
| Maruti Suzuki India Ltd. | | 5,317 | | 470,599 |
| CONSTRUCTION & FARM MACHINERY & HEAVY TRUCKS—0.9% | | | | |
| Tata Motors Ltd.# | | 9,405 | | 370,651 |
| CONSTRUCTION MATERIALS—1.0% | | | | |
| Shree Cement Ltd. | | 1,557 | | 394,379 |
| DIVERSIFIED BANKS—2.5% | | | | |
| HDFC Bank Ltd. | | 31,809 | | 712,787 |
- 48 -
THE ALGER FUNDS II | ALGER EMERGING MARKETS FUND
Schedule of Investments October 31, 2016 (Continued)
| | | | |
| COMMON STOCKS—(CONT.) | | SHARES | | VALUE |
| INDIA—(CONT.) | | | | |
| DIVERSIFIED BANKS—(CONT.) | | | | |
| Kotak Mahindra Bank Ltd. | | 25,108 | $ | 308,759 |
| | | | | 1,021,546 |
| PHARMACEUTICALS—2.4% | | | | |
| Aurobindo Pharma Ltd. | | 53,760 | | 659,519 |
| Sun Pharmaceutical Industries Ltd. | | 29,019 | | 325,730 |
| | | | | 985,249 |
| TOBACCO—1.0% | | | | |
| ITC Ltd.* | | 111,854 | | 405,500 |
| TOTAL INDIA | | | | |
| (Cost $3,225,066) | | | | 3,871,130 |
| INDONESIA—3.4% | | | | |
| ALTERNATIVE CARRIERS—0.5% | | | | |
| Tower Bersama Infrastructure Tbk PT | | 468,000 | | 214,240 |
| AUTOMOBILE MANUFACTURERS—1.0% | | | | |
| Astra International Tbk PT | | 614,200 | | 387,503 |
| DIVERSIFIED BANKS—0.9% | | | | |
| Bank Rakyat Indonesia Persero Tbk., PT | | 410,069 | | 382,910 |
| HEALTH CARE FACILITIES—1.0% | | | | |
| Mitra Keluarga Karyasehat Tbk PT | | 1,835,100 | | 390,941 |
| TOTAL INDONESIA | | | | |
| (Cost $1,279,447) | | | | 1,375,594 |
| ISRAEL—0.9% | | | | |
| OIL & GAS REFINING & MARKETING—0.9% | | | | |
| Reliance Industries Ltd. | | 22,218 | | 350,092 |
| (Cost $335,667) | | | | |
| LUXEMBOURG—1.9% | | | | |
| APPLICATION SOFTWARE—1.0% | | | | |
| Globant SA* | | 9,205 | | 400,417 |
| PACKAGED FOODS & MEATS—0.9% | | | | |
| Adecoagro SA* | | 32,423 | | 356,653 |
| TOTAL LUXEMBOURG | | | | |
| (Cost $653,177) | | | | 757,070 |
| MACAU—0.4% | | | | |
| CASINOS & GAMING—0.4% | | | | |
| Sands China Ltd. | | 41,045 | | 178,124 |
| (Cost $181,857) | | | | |
| MALAYSIA—1.2% | | | | |
| COMMODITY CHEMICALS—0.6% | | | | |
| Petronas Chemicals Group Bhd | | 145,700 | | 243,053 |
| CONSTRUCTION & ENGINEERING—0.6% | | | | |
| IJM Corp., Bhd | | 327,400 | | 257,638 |
| TOTAL MALAYSIA | | | | |
| (Cost $502,203) | | | | 500,691 |
- 49 -
THE ALGER FUNDS II | ALGER EMERGING MARKETS FUND
Schedule of Investments October 31, 2016 (Continued)
| | | | |
| COMMON STOCKS—(CONT.) | | SHARES | | VALUE |
| MEXICO—4.5% | | | | |
| AIRLINES—0.5% | | | | |
| Controladora Vuela Cia de Aviacion SAB de CV#* | | 11,565 | $ | 221,007 |
| DIVERSIFIED BANKS—2.0% | | | | |
| Banregio Grupo Financiero SAB de CV* | | 65,778 | | 431,165 |
| Grupo Financiero Banorte SAB de CV | | 64,760 | | 382,040 |
| | | | | 813,205 |
| DIVERSIFIED REAL ESTATE ACTIVITIES—1.0% | | | | |
| Corp Inmobiliaria Vesta SAB de CV | | 255,888 | | 386,800 |
| SPECIALIZED FINANCE—1.0% | | | | |
| Unifin Financiera SAB de CV SOFOM ENR | | 135,799 | | 401,998 |
| TOTAL MEXICO | | | | |
| (Cost $1,703,679) | | | | 1,823,010 |
| NETHERLAND—2.5% | | | | |
| FOOD RETAIL—1.7% | | | | |
| X5 Retail Group NV*,(b) | | 22,749 | | 678,067 |
| INTERNET SOFTWARE & SERVICES—0.8% | | | | |
| Yandex NV* | | 16,543 | | 325,731 |
| TOTAL NETHERLAND | | | | |
| (Cost $804,556) | | | | 1,003,798 |
| PERU—0.6% | | | | |
| DIVERSIFIED METALS & MINING—0.6% | | | | |
| Cia de Minas Buenaventura SAA#* | | 16,853 | | 223,976 |
| (Cost $210,943) | | | | |
| PHILIPPINES—1.2% | | | | |
| HOTELS RESORTS & CRUISE LINES—0.6% | | | | |
| Bloomberry Resorts Corp.* | | 1,959,900 | | 239,176 |
| MULTI-SECTOR HOLDINGS—0.6% | | | | |
| Metro Pacific Investments Corp. | | 1,740,500 | | 259,145 |
| TOTAL PHILIPPINES | | | | |
| (Cost $453,876) | | | | 498,321 |
| RUSSIA—0.7% | | | | |
| WIRELESS TELECOMMUNICATION SERVICES—0.7% | | | | |
| VimpelCom Ltd.# | | 84,305 | | 281,579 |
| (Cost $295,493) | | | | |
| SOUTH AFRICA—4.6% | | | | |
| CABLE & SATELLITE—2.2% | | | | |
| Naspers Ltd. | | 5,485 | | 918,544 |
| DIVERSIFIED BANKS—0.8% | | | | |
| Capitec Bank Holdings Ltd.* | | 6,607 | | 335,362 |
| PAPER & FOREST PRODUCTS—0.7% | | | | |
| Sappi Ltd.* | | 49,519 | | 275,511 |
| PHARMACEUTICALS—0.9% | | | | |
| Aspen Pharmacare Holdings Ltd. | | 16,125 | | 351,245 |
| TOTAL SOUTH AFRICA | | | | |
| (Cost $1,574,535) | | | | 1,880,662 |
- 50 -
THE ALGER FUNDS II | ALGER EMERGING MARKETS FUND
Schedule of Investments October 31, 2016 (Continued)
| | | | |
| COMMON STOCKS—(CONT.) | | SHARES | | VALUE |
| SOUTH KOREA—14.0% | | | | |
| AUTO PARTS & EQUIPMENT—1.2% | | | | |
| Mando Corp. | | 2,088 | $ | 488,402 |
| BIOTECHNOLOGY—0.6% | | | | |
| Hugel, Inc.* | | 761 | | 227,972 |
| COMMODITY CHEMICALS—0.9% | | | | |
| LG Chem Ltd. | | 1,686 | | 362,276 |
| DIVERSIFIED BANKS—1.1% | | | | |
| KB Financial Group, Inc. | | 11,687 | | 432,803 |
| DIVERSIFIED METALS & MINING—0.5% | | | | |
| Korea Zinc Co., Ltd.* | | 537 | | 213,318 |
| HOUSEHOLD PRODUCTS—0.6% | | | | |
| LG Household & Health Care Ltd.* | | 334 | | 239,027 |
| INDUSTRIAL MACHINERY—0.8% | | | | |
| Viatron Technologies, Inc. | | 17,515 | | 308,246 |
| PACKAGED FOODS & MEATS—0.6% | | | | |
| CJ CheilJedang Corp. | | 787 | | 240,199 |
| PERSONAL PRODUCTS—0.5% | | | | |
| Amorepacific Corp.* | | 696 | | 218,150 |
| PROPERTY & CASUALTY INSURANCE—1.2% | | | | |
| Hyundai Marine & Fire Insurance Co., Ltd.* | | 15,814 | | 488,348 |
| SEMICONDUCTORS—5.3% | | | | |
| Samsung Electronics Co., Ltd. | | 1,350 | | 1,931,779 |
| SK Hynix, Inc. | | 6,089 | | 217,877 |
| | | | | 2,149,656 |
| TRUCKING—0.7% | | | | |
| CJ Korea Express Corp.* | | 1,698 | | 298,401 |
| TOTAL SOUTH KOREA | | | | |
| (Cost $5,277,692) | | | | 5,666,798 |
| SWITZERLAND—1.5% | | | | |
| IT CONSULTING & OTHER SERVICES—1.5% | | | | |
| Luxoft Holding, Inc.* | | 11,077 | | 587,081 |
| (Cost $500,131) | | | | |
| TAIWAN—10.9% | | | | |
| COMPUTER STORAGE & PERIPHERALS—1.3% | | | | |
| Primax Electronics Ltd. | | 333,000 | | 527,131 |
| DIVERSIFIED BANKS—1.0% | | | | |
| E.Sun Financial Holding Co., Ltd.* | | 732,060 | | 416,123 |
| ELECTRONIC EQUIPMENT MANUFACTURERS—0.9% | | | | |
| Egis Technology, Inc.* | | 51,000 | | 369,668 |
| ENVIRONMENTAL & FACILITIES SERVICES—0.8% | | | | |
| Sunny Friend Environmental Technology Co., Ltd. | | 94,000 | | 336,457 |
| RESTAURANTS—0.9% | | | | |
| Gourmet Master Co., Ltd. | | 39,650 | | 356,146 |
| SEMICONDUCTORS—3.7% | | | | |
| ASPEED Technology, Inc. | | 20,079 | | 289,504 |
- 51 -
THE ALGER FUNDS II | ALGER EMERGING MARKETS FUND
Schedule of Investments October 31, 2016 (Continued)
| | | | | |
| COMMON STOCKS—(CONT.) | | SHARES | | | VALUE |
| TAIWAN—(CONT.) | | | | | |
| SEMICONDUCTORS—(CONT.) | | | | | |
| eMemory Technology, Inc. | | 27,000 | | $ | 286,306 |
| Silergy Corp.* | | 28,000 | | | 408,329 |
| Sitronix Technology Corp.* | | 134,000 | | | 496,306 |
| | | | | | 1,480,445 |
| TECHNOLOGY HARDWARE STORAGE & PERIPHERALS—1.2% | | | | | |
| Ennoconn Corp. | | 31,000 | | | 491,686 |
| TEXTILES—1.1% | | | | | |
| Eclat Textile Co., Ltd.* | | 38,000 | | | 430,975 |
| TOTAL TAIWAN | | | | | |
| (Cost $3,987,129) | | | | | 4,408,631 |
| THAILAND—1.9% | | | | | |
| CONSTRUCTION & ENGINEERING—1.1% | | | | | |
| Sino-Thai Engineering & Construction PCL* | | 627,077 | | | 455,957 |
| OIL & GAS EXPLORATION & PRODUCTION—0.8% | | | | | |
| PTT Exploration & Production PCL | | 131,085 | | | 309,808 |
| TOTAL THAILAND | | | | | |
| (Cost $658,232) | | | | | 765,765 |
| TURKEY—0.4% | | | | | |
| DIVERSIFIED BANKS—0.4% | | | | | |
| Turkiye Garanti Bankasi AS | | 59,828 | | | 162,800 |
| (Cost $175,371) | | | | | |
| UNITED KINGDOM—1.3% | | | | | |
| DIVERSIFIED METALS & MINING—0.5% | | | | | |
| Antofagasta PLC. | | 28,833 | | | 191,778 |
| HEALTH CARE FACILITIES—0.8% | | | | | |
| NMC Health PLC. | | 19,183 | | | 343,057 |
| TOTAL UNITED KINGDOM | | | | | |
| (Cost $499,187) | | | | | 534,835 |
| TOTAL COMMON STOCKS | | | | | |
| (Cost $34,685,802) | | | | | 38,709,965 |
| PREFERRED STOCKS—1.0% | | SHARES | | | VALUE |
| BRAZIL—1.0% | | | | | |
| INTEGRATED OIL & GAS—1.0% | | | | | |
| Petroleo Brasileiro SA* | | 71,548 | | | 396,362 |
| (Cost $311,791) | | | | | |
| SPECIAL PURPOSE VEHICLE—0.1% | | SHARES | | | VALUE |
| UNITED STATES—0.1% | | | | | |
| CONSUMER FINANCE—0.1% | | | | | |
| JS Kred SPV I, LLC.@ | | 43,241 | | | 44,932 |
| (Cost $43,241) | | | | | |
| Total Investments | | | | | |
| (Cost $35,040,834)(c) | | 96.5 | % | | 39,151,259 |
| Other Assets in Excess of Liabilities | | 3.5 | % | | 1,430,569 |
| NET ASSETS | | 100.0 | % | $ | 40,581,828 |
- 52 -
THE ALGER FUNDS II | ALGER EMERGING MARKETS FUND
Schedule of Investments October 31, 2016 (Continued)
# American Depositary Receipts.
(a) Pursuant to Securities and Exchange Commission Rule 144A, these securities may be sold prior to their maturity
only to qualified institutional buyers. These securities are however deemed to be liquid and represent 0.4% of the
net assets of the Portfolio.
(b) Global Depositary Receipts.
(c) At October 31, 2016, the net unrealized appreciation on investments, based on cost for federal income tax
purposes of $35,182,679, amounted to $3,968,580 which consisted of aggregate gross unrealized appreciation of
$4,953,659 and aggregate gross unrealized depreciation of $985,079.
* Non-income producing security.
@ Restricted security - Investment in security not registered under the Securities Act of 1933. The investment is deemed
to not be liquid and may be sold only to qualified buyers.
| | | | | | | | | | |
| | | | | | % of net assets | | | | % of net assets | |
| | | Acquisition | | Acquisition | (Acquisition | | | Market | as of | |
| Security | | Date(s) | | Cost | Date) | | | Value | 10/31/2016 | |
| JS Kred SPV I, LLC. | | 06/26/15 | $ | 43,241 | 0.15 | % | $ | 44,932 | 0.11 | % |
| Total | | | | | | $ | 44,932 | 0.11 | % |
| | | | | | | | | | | |
Industry classifications are unaudited.
See Notes to Financial Statements.
- 53 -
THE ALGER FUNDS II
Statement of Assets and Liabilities October 31, 2016
| | | | | |
| | Alger Spectra Fund | | Alger Green Fund |
| |
| ASSETS: | | | | | |
| Investments in securities, at value (Identified cost below)* | | | | | |
| see accompanying schedules of investments | $ | 5,107,536,960 | | $ | 63,156,472 |
| Investments in affiliated securities, at value (Identified cost | | | | | |
| below)** see accompanying schedules of investments | | 15,646,063 | | | 62,019 |
| Cash and cash equivalents (a) | | 152,679,641 | | | 2,149,409 |
| Receivable for investment securities sold | | 136,793,411 | | | 83,665 |
| Receivable for shares of beneficial interest sold | | 7,720,650 | | | 64,201 |
| Dividends and interest receivable | | 1,676,267 | | | 46,508 |
| Receivable from Investment Manager | | — | | | 1,513 |
| Prepaid expenses | | 523,106 | | | 56,839 |
| Total Assets | | 5,422,576,098 | | | 65,620,626 |
| |
| LIABILITIES: | | | | | |
| Securities sold short, at value ‡ | | 153,118,097 | | | — |
| Payable for investment securities purchased | | 75,616,556 | | | — |
| Payable for shares of beneficial interest redeemed | | 10,561,724 | | | 29,007 |
| Accrued investment advisory fees | | 3,514,136 | | | 40,140 |
| Accrued transfer agent fees | | 1,435,958 | | | 37,790 |
| Accrued distribution fees | | 1,336,658 | | | 17,719 |
| Accrued administrative fees | | 123,591 | | | 1,555 |
| Accrued shareholder administrative fees | | 58,857 | | | 772 |
| Accrued other expenses | | 450,769 | | | 31,301 |
| Total Liabilities | | 246,216,346 | | | 158,284 |
| NET ASSETS | $ | 5,176,359,752 | | $ | 65,462,342 |
| |
| NET ASSETS CONSIST OF: | | | | | |
| Paid in capital (par value of $.001 per share) | | 4,509,343,504 | | | 44,141,752 |
| Undistributed net investment income (accumulated loss) | | (8,808,584 | ) | | 6,127 |
| Undistributed net realized gain | | 23,336,486 | | | 2,520,305 |
| Net unrealized appreciation on investments | | 652,488,346 | | | 18,794,158 |
| NET ASSETS | $ | 5,176,359,752 | | $ | 65,462,342 |
| * Identified cost | $ | 4,458,459,087 | | $ | 44,344,645 |
| ** Identified cost | $ | 17,583,831 | | $ | 79,688 |
| ‡ Proceeds received on short sales | $ | 158,466,339 | | $ | — |
| (a) Includes restricted cash held as collateral for short sales | $ | 85,511,422 | | $ | — |
| See Notes to Financial Statements. | | | | | |
- 54 -
THE ALGER FUNDS II
Statement of Assets and Liabilities October 31, 2016 (Continued)
| | | | |
| | Alger Spectra Fund | Alger Green Fund |
| |
| NET ASSETS BY CLASS: | | | | |
| Class A | $ | 1,635,495,154 | $ | 31,321,165 |
| Class C | $ | 815,694,149 | $ | 5,580,489 |
| Class I | $ | 1,222,782,786 | $ | 28,461,356 |
| Class Z | $ | 1,502,387,663 | $ | 99,332 |
| |
| SHARES OF BENEFICIAL INTEREST OUTSTANDING — NOTE 6: | | | |
| Class A | | 96,736,157 | | 3,425,753 |
| Class C | | 51,639,914 | | 651,653 |
| Class I | | 71,683,875 | | 3,116,438 |
| Class Z | | 87,318,339 | | 10,870 |
| |
| NET ASSET VALUE PER SHARE: | | | | |
| Class A — Net Asset Value Per Share Class A | $ | 16.91 | $ | 9.14 |
| Class A — Offering Price Per Share | | | | |
| (includes a 5.25% sales charge) | $ | 17.84 | $ | 9.65 |
| Class C — Net Asset Value Per Share Class C | $ | 15.80 | $ | 8.56 |
| Class I — Net Asset Value Per Share Class I | $ | 17.06 | $ | 9.13 |
| Class Z — Net Asset Value Per Share Class Z | $ | 17.21 | $ | 9.14 |
| See Notes to Financial Statements. | | | | |
- 55 -
THE ALGER FUNDS II
Statement of Assets and Liabilities October 31, 2016 (Continued)
| | | | | | |
| | Alger Mid Cap Focus | | | Alger Dynamic | |
| | | Fund | | Opportunities Fund | |
| |
| ASSETS: | | | | | | |
| Investments in securities, at value (Identified cost below)* | | | | | | |
| see accompanying schedules of investments | $ | 7,271,123 | | $ | 92,217,552 | |
| Investments in affiliated securities, at value (Identified cost | | | | | | |
| below)** see accompanying schedules of investments | | — | | | 304,223 | |
| Cash and cash equivalents (a) | | 734,722 | | | 8,304,197 | |
| Receivable for investment securities sold | | 160,329 | | | 458,061 | |
| Receivable for shares of beneficial interest sold | | — | | | 47,646 | |
| Dividends and interest receivable | | 12,415 | | | 7,497 | |
| Receivable from Investment Manager | | 10,550 | | | — | |
| Prepaid expenses | | 52,522 | | | 52,995 | |
| Total Assets | | 8,241,661 | | | 101,392,171 | |
| |
| LIABILITIES: | | | | | | |
| Securities sold short, at value ‡ | | — | | | 18,169,806 | |
| Payable for investment securities purchased | | 100,209 | | | 745,641 | |
| Payable for shares of beneficial interest redeemed | | — | | | 210,017 | |
| Accrued investment advisory fees | | 5,223 | | | 86,018 | |
| Accrued transfer agent fees | | 2,908 | | | 20,082 | |
| Accrued distribution fees | | 1,960 | | | 12,983 | |
| Accrued administrative fees | | 192 | | | 1,971 | |
| Accrued shareholder administrative fees | | 106 | | | 928 | |
| Dividends payable | | — | | | 9,268 | |
| Accrued other expenses | | 23,684 | | | 37,490 | |
| Total Liabilities | | 134,282 | | | 19,294,204 | |
| NET ASSETS | $ | 8,107,379 | | $ | 82,097,967 | |
| |
| NET ASSETS CONSIST OF: | | | | | | |
| Paid in capital (par value of $.001 per share) | | 8,276,498 | | | 82,226,298 | |
| Undistributed net investment income (accumulated loss) | | (1,777 | ) | | (1,202,940 | ) |
| Undistributed net realized gain (accumulated realized loss) | | (137,404 | ) | | (2,294,913 | ) |
| Net unrealized appreciation (depreciation) on investments | | (29,938 | ) | | 3,369,522 | |
| NET ASSETS | $ | 8,107,379 | | $ | 82,097,967 | |
| * Identified cost | $ | 7,301,061 | | $ | 88,323,195 | |
| ** Identified cost | $ | — | | $ | 506,450 | |
| ‡ Proceeds received on short sales | $ | — | | $ | 17,847,199 | |
| (a) Includes restricted cash held as collateral for short sales | $ | — | | $ | 6,702,362 | |
| See Notes to Financial Statements. | | | | | | |
- 56 -
THE ALGER FUNDS II
Statement of Assets and Liabilities October 31, 2016 (Continued)
| | | | |
| | Alger Mid Cap Focus | | Alger Dynamic |
| | | Fund | Opportunities Fund |
| |
| NET ASSETS BY CLASS: | | | | |
| Class A | $ | 6,080,555 | $ | 30,030,711 |
| Class C | $ | 352,262 | $ | 7,120,101 |
| Class I | $ | 1,575,623 | $ | — |
| Class Z | $ | 98,939 | $ | 44,947,155 |
| |
| SHARES OF BENEFICIAL INTEREST OUTSTANDING — NOTE 6: | | | |
| Class A | | 544,593 | | 2,582,658 |
| Class C | | 33,592 | | 643,095 |
| Class I | | 141,556 | | — |
| Class Z | | 8,889 | | 3,800,448 |
| |
| NET ASSET VALUE PER SHARE: | | | | |
| Class A — Net Asset Value Per Share Class A | $ | 11.17 | $ | 11.63 |
| Class A — Offering Price Per Share | | | | |
| (includes a 5.25% sales charge) | $ | 11.78 | $ | 12.27 |
| Class C — Net Asset Value Per Share Class C | $ | 10.49 | $ | 11.07 |
| Class I — Net Asset Value Per Share Class I | $ | 11.13 | $ | — |
| Class Z — Net Asset Value Per Share Class Z | $ | 11.13 | $ | 11.83 |
| See Notes to Financial Statements. | | | | |
- 57 -
THE ALGER FUNDS II
Statement of Assets and Liabilities October 31, 2016 (Continued)
| | | | |
| | | | Alger Emerging | |
| | | | Markets Fund | |
| |
| ASSETS: | | | | |
| Investments in securities, at value (Identified cost below)* | | | | |
| see accompanying schedules of investments | | $ | 39,151,259 | |
| Cash and cash equivalents | | | 1,113,130 | |
| Foreign cash † | | | 499,398 | |
| Receivable for investment securities sold | | | 653,990 | |
| Receivable for shares of beneficial interest sold | | | 115,745 | |
| Dividends and interest receivable | | | 7,484 | |
| Receivable from Investment Manager | | | 12,069 | |
| Prepaid expenses | | | 54,583 | |
| Total Assets | | | 41,607,658 | |
| |
| LIABILITIES: | | | | |
| Payable for investment securities purchased | | | 832,880 | |
| Payable for shares of beneficial interest redeemed | | | 95,505 | |
| Foreign capital gain tax payable | | | 3,185 | |
| Accrued investment advisory fees | | | 30,626 | |
| Accrued transfer agent fees | | | 9,134 | |
| Accrued distribution fees | | | 6,632 | |
| Accrued administrative fees | | | 936 | |
| Accrued shareholder administrative fees | | | 389 | |
| Accrued other expenses | | | 46,543 | |
| Total Liabilities | | | 1,025,830 | |
| NET ASSETS | | $ | 40,581,828 | |
| |
| NET ASSETS CONSIST OF: | | | | |
| Paid in capital (par value of $.001 per share) | | | 41,720,961 | |
| Undistributed net investment income (accumulated loss) | | | (75,312 | ) |
| Undistributed net realized gain (accumulated realized loss) | | | (5,171,799 | ) |
| Net unrealized appreciation on investments | | | 4,107,978 | |
| NET ASSETS | | $ | 40,581,828 | |
| * Identified cost | | $ | 35,040,834 | |
| † Cost of foreign cash | | $ | 498,328 | |
| See Notes to Financial Statements. | | | | |
| | | | | |
- 58 -
THE ALGER FUNDS II
Statement of Assets and Liabilities October 31, 2016 (Continued)
| | |
| | | Alger Emerging |
| | | Markets Fund |
| |
| NET ASSETS BY CLASS: | | |
| Class A | $ | 5,930,600 |
| Class C | $ | 2,848,453 |
| Class I | $ | 14,006,205 |
| Class Y | $ | 114,133 |
| Class Y-2 | $ | 114,165 |
| Class Z | $ | 17,568,272 |
| |
| SHARES OF BENEFICIAL INTEREST OUTSTANDING — NOTE 6: | | |
| Class A | | 652,342 |
| Class C | | 325,070 |
| Class I | | 1,549,669 |
| Class Y | | 12,598 |
| Class Y-2 | | 12,598 |
| Class Z | | 1,926,426 |
| |
| NET ASSET VALUE PER SHARE: | | |
| Class A — Net Asset Value Per Share Class A | $ | 9.09 |
| Class A — Offering Price Per Share | | |
| (includes a 5.25% sales charge) | $ | 9.59 |
| Class C — Net Asset Value Per Share Class C | $ | 8.76 |
| Class I — Net Asset Value Per Share Class I | $ | 9.04 |
| Class Y — Net Asset Value Per Share Class Y | $ | 9.06 |
| Class Y-2 — Net Asset Value Per Share Class Y-2 | $ | 9.06 |
| Class Z — Net Asset Value Per Share Class Z | $ | 9.12 |
| See Notes to Financial Statements. | | |
- 59 -
THE ALGER FUNDS II
Statement of Operations For the year ended October 31, 2016
| | | | | | | |
| | | Alger Spectra Fund | | Alger Green Fund | |
| |
| INCOME: | | | | | | | |
| Dividends (net of foreign withholding taxes*) | $ | 67,542,463 | | $ | 1,077,294 | |
| Interest from affiliated securities – Note 11 | | | 7,579 | | | 95 | |
| Interest | | | 223,985 | | | 7,466 | |
| Total Income | | | 67,774,027 | | | 1,084,855 | |
| |
| EXPENSES: | | | | | | | |
| Advisory fees — Note 3(a) | | | 42,164,426 | | | 531,445 | |
| Distribution fees — Note 3(c) | | | | | | | |
| Class A | | | 4,467,485 | | | 80,666 | |
| Class C | | | 8,794,941 | | | 56,992 | |
| Class I | | | 3,122,165 | | | 92,205 | |
| Shareholder administrative fees — Note 3(f) | | | 714,314 | | | 9,952 | |
| Administration fees — Note 3(b) | | | 1,487,726 | | | 20,584 | |
| Dividends on securities sold short | | | 3,214,497 | | | — | |
| Custodian fees | | | 328,020 | | | 25,591 | |
| Interest expenses | | | 21,075 | | | — | |
| Borrowing fees on short sales | | | 2,270,639 | | | — | |
| Transfer agent fees and expenses — Note 3(f) | | | 3,552,205 | | | 78,450 | |
| Printing fees | | | 607,451 | | | 10,629 | |
| Professional fees | | | 282,970 | | | 29,212 | |
| Registration fees | | | 349,865 | | | 58,970 | |
| Trustee fees — Note 3(g) | | | 220,497 | | | 3,121 | |
| Fund accounting fees | | | 712,487 | | | 12,611 | |
| Miscellaneous | | | 261,555 | | | 7,033 | |
| Total Expenses | | | 72,572,318 | | | 1,017,461 | |
| Less, expense reimbursements/waivers — Note 3(a) | | | — | | | (1,513 | ) |
| Net Expenses | | | 72,572,318 | | | 1,015,948 | |
| NET INVESTMENT INCOME (LOSS) | | | (4,798,291 | ) | | 68,907 | |
| |
| REALIZED AND UNREALIZED GAIN (LOSS) ON INVESTMENTS AND FOREIGN CURRENCY: | | |
| Net realized gain on investments | | | 102,832,330 | | | 2,527,326 | |
| Net realized (loss) on foreign currency transactions | | | (29,930 | ) | | — | |
| Net realized gain on short sales | | | 13,391,376 | | | — | |
| Net change in unrealized (depreciation) on investments and | | | | | | | |
| foreign currency | | | (126,993,528 | ) | | (3,803,799 | ) |
| Net change in unrealized (depreciation) on short sales | | | (10,662,241 | ) | | — | |
| Net realized and unrealized (loss) on investments and foreign | | | | | | | |
| currency | | | (21,461,993 | ) | | (1,276,473 | ) |
| NET DECREASE IN NET ASSETS RESULTING FROM | | | | | | | |
| OPERATIONS | $ | (26,260,284 | ) | $ | (1,207,566 | ) |
| * Foreign withholding taxes | $ | 275,849 | | $ | 2,659 | |
| See Notes to Financial Statements. | | | | | | | |
- 60 -
THE ALGER FUNDS II
Statement of Operations For the year ended October 31, 2016 (Continued)
| | | | | | |
| | Alger Mid Cap Focus | | | Alger Dynamic | |
| | | Fund | | Opportunities Fund | |
| |
| INCOME: | | | | | | |
| Dividends (net of foreign withholding taxes*) | $ | 101,428 | | $ | 898,357 | |
| Interest | | 1,047 | | | 64,485 | |
| Total Income | | 102,475 | | | 962,842 | |
| |
| EXPENSES: | | | | | | |
| Advisory fees — Note 3(a) | | 62,241 | | | 1,223,955 | |
| Distribution fees — Note 3(c) | | | | | | |
| Class A | | 15,755 | | | 91,055 | |
| Class C | | 3,261 | | | 94,046 | |
| Class I | | 4,166 | | | — | |
| Shareholder administrative fees — Note 3(f) | | 1,261 | | | 13,179 | |
| Administration fees — Note 3(b) | | 2,282 | | | 28,049 | |
| Dividends on securities sold short | | 94 | | | 360,626 | |
| Custodian fees | | 28,666 | | | 64,296 | |
| Interest expenses | | — | | | 2,348 | |
| Borrowing fees on short sales | | — | | | 235,337 | |
| Transfer agent fees and expenses — Note 3(f) | | 6,597 | | | 61,899 | |
| Printing fees | | 2,629 | | | 15,103 | |
| Professional fees | | 27,116 | | | 35,506 | |
| Registration fees | | 55,926 | | | 70,294 | |
| Trustee fees — Note 3(g) | | 328 | | | 4,086 | |
| Fund accounting fees | | 3,710 | | | 16,300 | |
| Miscellaneous | | 3,701 | | | 9,874 | |
| Total Expenses | | 217,733 | | | 2,325,953 | |
| Less, expense reimbursements/waivers — Note 3(a) | | (108,257 | ) | | — | |
| Net Expenses | | 109,476 | | | 2,325,953 | |
| NET INVESTMENT LOSS | | (7,001 | ) | | (1,363,111 | ) |
| |
| REALIZED AND UNREALIZED GAIN (LOSS) ON INVESTMENTS, OPTIONS AND FOREIGN CURRENCY: | |
| Net realized (loss) on investments and purchased options | | (135,694 | ) | | (1,366,908 | ) |
| Net realized gain (loss) on foreign currency transactions | | (4 | ) | | 938 | |
| Net realized (loss) on short sales | | — | | | (196,378 | ) |
| Net change in unrealized (depreciation) on investments, | | | | | | |
| options and foreign currency | | (687,568 | ) | | (1,154,453 | ) |
| Net change in unrealized (depreciation) on short sales | | — | | | (800,931 | ) |
| Net realized and unrealized (loss) on investments, options, | | | | | | |
| and foreign currency | | (823,266 | ) | | (3,517,732 | ) |
| NET DECREASE IN NET ASSETS RESULTING FROM | | | | | | |
| OPERATIONS | $ | (830,267 | ) | $ | (4,880,843 | ) |
| * Foreign withholding taxes | $ | — | | $ | 1,383 | |
| See Notes to Financial Statements. | | | | | | |
- 61 -
THE ALGER FUNDS II
Statement of Operations For the year ended October 31, 2016 (Continued)
| | | |
| | | Alger Emerging | |
| | | Markets Fund | |
| |
| INCOME: | | | |
| Dividends (net of foreign withholding taxes*) | $ | 459,195 | |
| Interest | | 1,192 | |
| Total Income | | 460,387 | |
| |
| EXPENSES: | | | |
| Advisory fees — Note 3(a) | | 295,804 | |
| Distribution fees — Note 3(c) | | | |
| Class A | | 12,913 | |
| Class C | | 25,038 | |
| Class I | | 29,926 | |
| Shareholder administrative fees — Note 3(f) | | 3,476 | |
| Administration fees — Note 3(b) | | 8,190 | |
| Dividends on securities sold short | | 715 | |
| Custodian fees | | 139,246 | |
| Transfer agent fees and expenses — Note 3(f) | | 31,074 | |
| Printing fees | | 8,869 | |
| Professional fees | | 32,269 | |
| Registration fees | | 77,478 | |
| Trustee fees — Note 3(g) | | 1,216 | |
| Fund accounting fees | | 8,899 | |
| Miscellaneous | | 25,037 | |
| Total Expenses | | 700,150 | |
| Less, expense reimbursements/waivers — Note 3(a) | | (236,914 | ) |
| Net Expenses | | 463,236 | |
| NET INVESTMENT LOSS | | (2,849 | ) |
| |
| REALIZED AND UNREALIZED GAIN (LOSS) ON INVESTMENTS AND FOREIGN CURRENCY: | |
| Net realized (loss) on investments | | (1,253,898 | ) |
| Net realized (loss) on foreign currency transactions | | (9,853 | ) |
| Net change in unrealized appreciation on investments and foreign currency | | 3,303,433 | |
| Net realized and unrealized gain on investments and foreign currency | | 2,039,682 | |
| NET INCREASE IN NET ASSETS RESULTING FROM OPERATIONS | $ | 2,036,833 | |
| * Foreign withholding taxes | $ | 49,180 | |
| See Notes to Financial Statements. | | | |
- 62 -
THE ALGER FUNDS II
Statements of Changes in Net Assets
| | | | | | | |
| | | | Alger Spectra Fund | |
| | | | For the | | | For the | |
| | | | Year Ended | | | Year Ended | |
| | | | October 31, 2016 | | | October 31, 2015 | |
| |
| Net investment loss | $ | (4,798,291 | ) | $ | (15,197,838 | ) |
| Net realized gain on investments and foreign currency | | | 116,193,776 | | | 410,668,377 | |
| Net change in unrealized appreciation (depreciation) on | | | | | | | |
| investments and foreign currency | | | (137,655,769 | ) | | 42,404,519 | |
| Net increase (decrease) in net assets resulting from operations | | | (26,260,284 | ) | | 437,875,058 | |
| |
| Dividends and distributions to shareholders from: | | | | | | | |
| Net realized gains: | | | | | | | |
| Class A | | | (153,383,448 | ) | | (232,068,288 | ) |
| Class C | | | (78,165,865 | ) | | (86,801,799 | ) |
| Class I | | | (103,827,372 | ) | | (129,154,885 | ) |
| Class Z | | | (125,330,338 | ) | | (115,269,367 | ) |
| Total dividends and distributions to shareholders | | | (460,707,023 | ) | | (563,294,339 | ) |
| |
| Increase (decrease) from shares of beneficial interest transactions: | | | | | | |
| Class A | | | (438,733,857 | ) | | 450,724,006 | |
| Class C | | | 4,132,841 | | | 273,947,569 | |
| Class I | | | 80,647,352 | | | 246,206,432 | |
| Class Z | | | 429,073,682 | | | 286,905,857 | |
| Net increase from shares of beneficial interest transactions — | | | | | | | |
| Note 6(a) | | | 75,120,018 | | | 1,257,783,864 | |
| |
| Redemption Fees: | | | | | | | |
| Class A | | | — | | | 15,847 | |
| Class C | | | — | | | 5,723 | |
| Total Redemption Fees — Note 6(b) | | | — | | | 21,570 | |
| Total increase (decrease) | | | (411,847,289 | ) | | 1,132,386,153 | |
| |
| Net Assets: | | | | | | | |
| Beginning of period | | | 5,588,207,041 | | | 4,455,820,888 | |
| END OF PERIOD | $ | 5,176,359,752 | | $ | 5,588,207,041 | |
| Undistributed net investment income (accumulated loss) | $ | (8,808,584 | ) | $ | (19,169,843 | ) |
| See Notes to Financial Statements. | | | | | | | |
- 63 -
THE ALGER FUNDS II
Statements of Changes in Net Assets (Continued)
| | | | | | | |
| | | | Alger Green Fund | |
| | | | For the | | | For the | |
| | | | Year Ended | | | Year Ended | |
| | | | October 31, 2016 | | | October 31, 2015 | |
| |
| Net investment income (loss) | $ | 68,907 | | $ | (94,568 | ) |
| Net realized gain on investments and foreign currency | | | 2,527,326 | | | 1,079,283 | |
| Net change in unrealized appreciation (depreciation) on | | | | | | | |
| investments and foreign currency | | | (3,803,799 | ) | | 3,027,167 | |
| Net increase (decrease) in net assets resulting from operations | | | (1,207,566 | ) | | 4,011,882 | |
| |
| Dividends and distributions to shareholders from: | | | | | | | |
| Net realized gains: | | | | | | | |
| Class A | | | (447,261 | ) | | (887,146 | ) |
| Class C | | | (84,420 | ) | | (153,204 | ) |
| Class I | | | (591,290 | ) | | (1,154,776 | ) |
| Total dividends and distributions to shareholders | | | (1,122,971 | ) | | (2,195,126 | ) |
| |
| Increase (decrease) from shares of beneficial interest transactions: | | | | | | |
| Class A | | | (2,191,339 | ) | | 1,803,130 | |
| Class C | | | (178,579 | ) | | 610,920 | |
| Class I | | | (12,959,514 | ) | | (19,046 | ) |
| Class Z | | | 100,000 | | | — | |
| Net increase (decrease) from shares of beneficial interest | | | | | | | |
| transactions — Note 6(a) | | | (15,229,432 | ) | | 2,395,004 | |
| |
| Redemption Fees: | | | | | | | |
| Class A | | | — | | | 3 | |
| Total Redemption Fees — Note 6(b) | | | — | | | 3 | |
| Total increase (decrease) | | | (17,559,969 | ) | | 4,211,763 | |
| |
| Net Assets: | | | | | | | |
| Beginning of period | | | 83,022,311 | | | 78,810,548 | |
| END OF PERIOD | $ | 65,462,342 | | $ | 83,022,311 | |
| Undistributed net investment income (accumulated loss) | $ | 6,127 | | $ | (30,136 | ) |
| See Notes to Financial Statements. | | | | | | | |
- 64 -
THE ALGER FUNDS II
Statements of Changes in Net Assets (Continued)
| | | | | | | |
| | | | Alger Mid Cap Focus Fund | |
| | | | For the | | | For the | |
| | | | Year Ended | | | Year Ended | |
| | | | October 31, 2016 | | | October 31, 2015 | |
| |
| Net investment loss | $ | (7,001 | ) | $ | (62,383 | ) |
| Net realized gain (loss) on investments and foreign currency | | | (135,698 | ) | | 491,681 | |
| Net change in unrealized depreciation on investments and | | | | | | | |
| foreign currency | | | (687,568 | ) | | (282,575 | ) |
| Net increase (decrease) in net assets resulting from operations | | | (830,267 | ) | | 146,723 | |
| |
| Dividends and distributions to shareholders from: | | | | | | | |
| Net investment income: | | | | | | | |
| Class A | | | — | | | (27,209 | ) |
| Class I | | | — | | | (11,760 | ) |
| Net realized gains: | | | | | | | |
| Class A | | | (338,004 | ) | | (461,447 | ) |
| Class C | | | (17,866 | ) | | (26,114 | ) |
| Class I | | | (96,019 | ) | | (136,646 | ) |
| Total dividends and distributions to shareholders | | | (451,889 | ) | | (663,176 | ) |
| |
| Increase (decrease) from shares of beneficial interest transactions: | | | | | | |
| Class A | | | 341,524 | | | 630,791 | |
| Class C | | | 67,925 | | | (9,637 | ) |
| Class I | | | (131,699 | ) | | 104,867 | |
| Class Z | | | 100,000 | | | — | |
| Net increase from shares of beneficial interest transactions — | | | | | | | |
| Note 6(a) | | | 377,750 | | | 726,021 | |
| Total increase (decrease) | | | (904,406 | ) | | 209,568 | |
| |
| Net Assets: | | | | | | | |
| Beginning of period | | | 9,011,785 | | | 8,802,217 | |
| END OF PERIOD | $ | 8,107,379 | | $ | 9,011,785 | |
| Undistributed net investment income (accumulated loss) | $ | (1,777 | ) | $ | (68,354 | ) |
| See Notes to Financial Statements. | | | | | | | |
- 65 -
THE ALGER FUNDS II
Statements of Changes in Net Assets (Continued)
| | | | | | | |
| | | | Alger Dynamic Opportunities Fund | |
| | | | For the | | | For the | |
| | | | Year Ended | | | Year Ended | |
| | | | October 31, 2016 | | | October 31, 2015 | |
| |
| Net investment loss | $ | (1,363,111 | ) | $ | (1,396,566 | ) |
| Net realized gain (loss) on investments, options and foreign | | | | | | | |
| currency | | | (1,562,348 | ) | | 2,740,694 | |
| Net change in unrealized depreciation on investments, options | | | | | | | |
| and foreign currency | | | (1,955,384 | ) | | (295,072 | ) |
| Net increase (decrease) in net assets resulting from operations | | | (4,880,843 | ) | | 1,049,056 | |
| |
| Dividends and distributions to shareholders from: | | | | | | | |
| Net realized gains: | | | | | | | |
| Class A | | | (1,142,833 | ) | | (2,281,541 | ) |
| Class C | | | (294,452 | ) | | (361,352 | ) |
| Class Z | | | (1,894,964 | ) | | (1,765,215 | ) |
| Total dividends and distributions to shareholders | | | (3,332,249 | ) | | (4,408,108 | ) |
| |
| Increase (decrease) from shares of beneficial interest transactions: | | | | | | |
| Class A | | | (34,404,312 | ) | | 20,842,186 | |
| Class C | | | (2,230,730 | ) | | 4,618,262 | |
| Class Z | | | 2,311,254 | | | 18,433,053 | |
| Net increase (decrease) from shares of beneficial interest | | | | | | | |
| transactions — Note 6(a) | | | (34,323,788 | ) | | 43,893,501 | |
| |
| Redemption Fees: | | | | | | | |
| Class A | | | — | | | 508 | |
| Total Redemption Fees — Note 6(b) | | | — | | | 508 | |
| Total increase (decrease) | | | (42,536,880 | ) | | 40,534,957 | |
| |
| Net Assets: | | | | | | | |
| Beginning of period | | | 124,634,847 | | | 84,099,890 | |
| END OF PERIOD | $ | 82,097,967 | | $ | 124,634,847 | |
| Undistributed net investment income (accumulated loss) | $ | (1,202,940 | ) | $ | (1,238,473 | ) |
| See Notes to Financial Statements. | | | | | | | |
- 66 -
THE ALGER FUNDS II
Statements of Changes in Net Assets (Continued)
| | | | | | | |
| | | | Alger Emerging Markets Fund | |
| | | | For the | | | For the | |
| | | | Year Ended | | | Year Ended | |
| | | | October 31, 2016 | | | October 31, 2015 | |
| |
| Net investment loss | $ | (2,849 | ) | $ | (82,913 | ) |
| Net realized loss on investments and foreign currency | | | (1,263,751 | ) | | (1,769,379 | ) |
| Net change in unrealized appreciation (depreciation) on | | | | | | | |
| investments and foreign currency | | | 3,303,433 | | | (921,805 | ) |
| Net increase (decrease) in net assets resulting from operations | | | 2,036,833 | | | (2,774,097 | ) |
| |
| Dividends and distributions to shareholders from: | | | | | | | |
| Net investment income: | | | | | | | |
| Class A | | | (4,867 | ) | | — | |
| Class I | | | (4,133 | ) | | — | |
| Class Z | | | (15,394 | ) | | — | |
| Total dividends and distributions to shareholders | | | (24,394 | ) | | — | |
| |
| Increase (decrease) from shares of beneficial interest transactions: | | | | | | |
| Class A | | | (2,594,517 | ) | | 2,288,922 | |
| Class C | | | 129,621 | | | 700,257 | |
| Class I | | | 1,467,128 | | | 1,497,814 | |
| Class Y | | | 100,000 | | | — | |
| Class Y-2 | | | 100,000 | | | — | |
| Class Z | | | 12,407,873 | | | 1,046,389 | |
| Net increase from shares of beneficial interest transactions — | | | | | | | |
| Note 6(a) | | | 11,610,105 | | | 5,533,382 | |
| |
| Redemption Fees: | | | | | | | |
| Class A | | | — | | | 10 | |
| Class C | | | — | | | 3 | |
| Total Redemption Fees — Note 6(b) | | | — | | | 13 | |
| Total increase | | | 13,622,544 | | | 2,759,298 | |
| |
| Net Assets: | | | | | | | |
| Beginning of period | | | 26,959,284 | | | 24,199,986 | |
| END OF PERIOD | $ | 40,581,828 | | $ | 26,959,284 | |
| Undistributed net investment income (accumulated loss) | $ | (75,312 | ) | $ | (134,693 | ) |
| See Notes to Financial Statements. | | | | | | | |
- 67 -
THE ALGER FUNDS II
Financial Highlights for a share outstanding throughout the period
| | | | | | | | | | | | | | | | | | | | | | | |
| Alger Spectra Fund | | | | | | | | | | | | | Class A | | | | | | | | | | |
| | | Year ended | | | Year ended | | | Year ended | | | Year ended | | | Year ended | |
| | | 10/31/2016 | | | 10/31/2015 | | | 10/31/2014 | | | 10/31/2013 | | | 10/31/2012 | |
| Net asset value, beginning of period | | $ | 18.45 | | | $ | | 19.13 | | | $ | | 17.37 | | | $ | | 13.82 | | | $ | 12.35 | |
| INCOME FROM INVESTMENT | | | | | | | | | | | | | | | | | | | | | | | |
| OPERATIONS: | | | | | | | | | | | | | | | | | | | | | | | |
| Net investment income (loss)(i) | | | (0.01 | ) | | | | (0.04 | ) | | | | (0.06 | ) | | | | 0.05 | | | | 0.02 | |
| Net realized and unrealized gain (loss) | | | | | | | | | | | | | | | | | | | | | | | |
| on investments | | | (0.03 | ) | | | | 1.74 | | | | | 2.82 | | | | | 3.91 | | | | 1.66 | |
| Total from investment operations | | | (0.04 | ) | | | | 1.70 | | | | | 2.76 | | | | | 3.96 | | | | 1.68 | |
| Dividends from net investment income | – | | | | | – | | | | | – | | | | | (0.09 | ) | | | – | |
| Distributions from net realized gains | | | (1.50 | ) | | | | (2.38 | ) | | | | (1.00 | ) | | | | (0.32 | ) | | | (0.21 | ) |
| Net asset value, end of period | | $ | 16.91 | | | $ | | 18.45 | | | $ | | 19.13 | | | $ | | 17.37 | | | $ | 13.82 | |
| Total return(ii) | | | (0.36 | )% | | | | 9.66 | % | | | | 16.56 | % | | | | 29.29 | % | | | 14.00 | % |
| RATIOS/SUPPLEMENTAL DATA: | | | | | | | | | | | | | | | | | | | | | | | |
| Net assets, end of period (000's | | | | | | | | | | | | | | | | | | | | | | | |
| omitted) | $ | 1,635,495 | | $ | 2,243,901 | | $ | 1,846,479 | | $ | 1,866,317 | | $ | 1,158,220 | |
| Ratio of gross expenses to average | | | | | | | | | | | | | | | | | | | | | | | |
| net assets | | | 1.31%(iii) | | | | | 1.34%(iv) | | | | | 1.52%(v) | | | | | 1.52%(vi) | | | | 1.49%(vii) | |
| Ratio of expense reimbursements to | | | | | | | | | | | | | | | | | | | | | | | |
| average net assets | | | – | | | | | – | | | | | – | | | | | – | | | | – | |
| Ratio of net expenses to average net | | | | | | | | | | | | | | | | | | | | | | | |
| assets | | | 1.31 | % | | | | 1.34 | % | | | | 1.52 | % | | | | 1.52 | % | | | 1.49 | % |
| Ratio of net investment income (loss) to | | | | | | | | | | | | | | | | | | | | | | | |
| average net assets | | | (0.05 | )% | | | | (0.24 | )% | | | | (0.35 | )% | | | | 0.35 | % | | | 0.16 | % |
| Portfolio turnover rate | | | 108.51 | % | | | | 143.64 | % | | | | 149.01 | % | | | | 113.69 | % | | | 139.90 | % |
| See Notes to Financial Statements. | | | | | | | | | | | | | | | | | | | | | |
(i) Amount was computed based on average shares outstanding during the period.
(ii) Does not reflect the effect of sales charges, if applicable.
(iii) Includes 0.10% related to dividend expense on short positions and interest expense for the period ended 10/31/16
(iv) Includes 0.15% related to dividend expense on short positions and interest expense for the period ended 10/31/15
(v) Includes 0.27% related to dividend expense on short positions and interest expense for the period ended 10/31/14
(vi) Includes 0.22% related to dividend expense on short positions and interest expense for the period ended 10/31/13
(vii) Includes 0.12% related to dividend expense on short positions and interest expense for the period ended 10/31/12
- 68 -
THE ALGER FUNDS II
Financial Highlights for a share outstanding throughout the period
| | | | | | | | | | | | | | | | | | | | | | | | |
| Alger Spectra Fund | | | | | | | | | | | | | Class C | | | | | | | | | | | |
| | | Year ended | | | Year ended | | | Year ended | | | Year ended | | | Year ended | |
| | | 10/31/2016 | | | 10/31/2015 | | | 10/31/2014 | | | 10/31/2013 | | | 10/31/2012 | |
| Net asset value, beginning of period | | $ | 17.46 | | | $ | | 18.35 | | | $ | | 16.81 | | | $ | | 13.43 | | | $ | | 12.09 | |
| INCOME FROM INVESTMENT | | | | | | | | | | | | | | | | | | | | | | | | |
| OPERATIONS: | | | | | | | | | | | | | | | | | | | | | | | | |
| Net investment loss(i) | | | (0.13 | ) | | | | (0.18 | ) | | | | (0.19 | ) | | | | (0.07 | ) | | | | (0.07 | ) |
| Net realized and unrealized gain (loss) | | | | | | | | | | | | | | | | | | | | | | | | |
| on investments | | | (0.03 | ) | | | | 1.67 | | | | | 2.73 | | | | | 3.79 | | | | | 1.62 | |
| Total from investment operations | | | (0.16 | ) | | | | 1.49 | | | | | 2.54 | | | | | 3.72 | | | | | 1.55 | |
| Dividends from net investment income | – | | | | | – | | | | | – | | | | | (0.02 | ) | | | | – | |
| Distributions from net realized gains | | | (1.50 | ) | | | | (2.38 | ) | | | | (1.00 | ) | | | | (0.32 | ) | | | | (0.21 | ) |
| Net asset value, end of period | | $ | 15.80 | | | $ | | 17.46 | | | $ | | 18.35 | | | $ | | 16.81 | | | $ | | 13.43 | |
| Total return(ii) | | | (1.12 | )% | | | | 8.84 | % | | | | 15.69 | % | | | | 28.38 | % | | | | 13.12 | % |
| RATIOS/SUPPLEMENTAL DATA: | | | | | | | | | | | | | | | | | | | | | | | | |
| Net assets, end of period (000's | | | | | | | | | | | | | | | | | | | | | | | | |
| omitted) | $ | 815,694 | | $ | 899,108 | | $ | 650,438 | | $ | 458,750 | | $ | 242,972 | |
| Ratio of gross expenses to average | | | | | | | | | | | | | | | | | | | | | | | | |
| net assets | | | 2.07%(iii) | | | | | 2.11%(iv) | | | | | 2.27 | %(v) | | | | 2.28%(vi) | | | | | 2.24%(vii) | |
| Ratio of expense reimbursements to | | | | | | | | | | | | | | | | | | | | | | | | |
| average net assets | | | – | | | | | – | | | | | – | | | | | – | | | | | – | |
| Ratio of net expenses to average net | | | | | | | | | | | | | | | | | | | | | | | | |
| assets | | | 2.07 | % | | | | 2.11 | % | | | | 2.27 | % | | | | 2.28 | % | | | | 2.24 | % |
| Ratio of net investment income (loss) to | | | | | | | | | | | | | | | | | | | | | | | | |
| average net assets | | | (0.82 | )% | | | | (1.01 | )% | | | | (1.12 | )% | | | | (0.46 | )% | | | | (0.57 | )% |
| Portfolio turnover rate | | | 108.51 | % | | | | 143.64 | % | | | | 149.01 | % | | | | 113.69 | % | | | | 139.90 | % |
| See Notes to Financial Statements. | | | | | | | | | | | | | | | | | | | | | | |
(i) Amount was computed based on average shares outstanding during the period.
(ii) Does not reflect the effect of sales charges, if applicable.
(iii) Includes 0.10% related to dividend expense on short positions and interest expense for the period ended 10/31/16
(iv) Includes 0.15% related to dividend expense on short positions and interest expense for the period ended 10/31/15
(v) Includes 0.28% related to dividend expense on short positions and interest expense for the period ended 10/31/14
(vi) Includes 0.22% related to dividend expense on short positions and interest expense for the period ended 10/31/13
(vii) Includes 0.13% related to dividend expense on short positions and interest expense for the period ended 10/31/12
- 69 -
THE ALGER FUNDS II
Financial Highlights for a share outstanding throughout the period
| | | | | | | | | | | | | | | | | | | | | | | |
| Alger Spectra Fund | | | | | | | | | | | | | Class I | | | | | | | | | | |
| | | Year ended | | | Year ended | | | Year ended | | | Year ended | | | Year ended | |
| | | 10/31/2016 | | | 10/31/2015 | | | 10/31/2014 | | | 10/31/2013 | | | 10/31/2012 | |
| Net asset value, beginning of period | | $ | 18.60 | | | $ | | 19.27 | | | $ | | 17.48 | | | $ | | 13.92 | | | $ | 12.42 | |
| INCOME FROM INVESTMENT | | | | | | | | | | | | | | | | | | | | | | | |
| OPERATIONS: | | | | | | | | | | | | | | | | | | | | | | | |
| Net investment income (loss)(i) | | | (0.01 | ) | | | | (0.05 | ) | | | | (0.06 | ) | | | | 0.06 | | | | 0.03 | |
| Net realized and unrealized gain (loss) | | | | | | | | | | | | | | | | | | | | | | | |
| on investments | | | (0.03 | ) | | | | 1.76 | | | | | 2.85 | | | | | 3.91 | | | | 1.68 | |
| Total from investment operations | | | (0.04 | ) | | | | 1.71 | | | | | 2.79 | | | | | 3.97 | | | | 1.71 | |
| Dividends from net investment income | – | | | | | – | | | | | – | | | | | (0.09 | ) | | | – | |
| Distributions from net realized gains | | | (1.50 | ) | | | | (2.38 | ) | | | | (1.00 | ) | | | | (0.32 | ) | | | (0.21 | ) |
| Net asset value, end of period | | $ | 17.06 | | | $ | | 18.60 | | | $ | | 19.27 | | | $ | | 17.48 | | | $ | 13.92 | |
| Total return(ii) | | | (0.35 | )% | | | | 9.65 | % | | | | 16.63 | % | | | | 29.30 | % | | | 14.07 | % |
| RATIOS/SUPPLEMENTAL DATA: | | | | | | | | | | | | | | | | | | | | | | | |
| Net assets, end of period (000's | | | | | | | | | | | | | | | | | | | | | | | |
| omitted) | $ | 1,222,783 | | $ | 1,251,395 | | $ | 1,030,304 | | $ | 736,036 | | $ | 431,557 | |
| Ratio of gross expenses to average | | | | | | | | | | | | | | | | | | | | | | | |
| net assets | | | 1.29%(iii) | | | | | 1.35%(iv) | | | | | 1.50 | %(v) | | | | 1.50%(vi) | | | | 1.43%(vii) | |
| Ratio of expense reimbursements to | | | | | | | | | | | | | | | | | | | | | | | |
| average net assets | | | – | | | | | – | | | | | – | | | | | – | | | | – | |
| Ratio of net expenses to average net | | | | | | | | | | | | | | | | | | | | | | | |
| assets | | | 1.29 | % | | | | 1.35 | % | | | | 1.50 | % | | | | 1.50 | % | | | 1.43 | % |
| Ratio of net investment income (loss) to | | | | | | | | | | | | | | | | | | | | | | | |
| average net assets | | | (0.05 | )% | | | | (0.25 | )% | | | | (0.35 | )% | | | | 0.36 | % | | | 0.25 | % |
| Portfolio turnover rate | | | 108.51 | % | | | | 143.64 | % | | | | 149.01 | % | | | | 113.69 | % | | | 139.90 | % |
| See Notes to Financial Statements. | | | | | | | | | | | | | | | | | | | | | |
(i) Amount was computed based on average shares outstanding during the period.
(ii) Does not reflect the effect of sales charges, if applicable.
(iii) Includes 0.10% related to dividend expense on short positions and interest expense for the period ended 10/31/16
(iv) Includes 0.15% related to dividend expense on short positions and interest expense for the period ended 10/31/15
(v) Includes 0.28% related to dividend expense on short positions and interest expense for the period ended 10/31/14
(vi) Includes 0.22% related to dividend expense on short positions and interest expense for the period ended 10/31/13
(vii) Includes 0.12% related to dividend expense on short positions and interest expense for the period ended 10/31/12
- 70 -
THE ALGER FUNDS II
Financial Highlights for a share outstanding throughout the period
| | | | | | | | | | | | | | | | | | | | | | |
| Alger Spectra Fund | | | | | | | | | | | | Class Z | | | | | | | | | | |
| | | Year ended | | | Year ended | | | Year ended | | | Year ended | | | Year ended | |
| | | 10/31/2016 | | | 10/31/2015 | | | 10/31/2014 | | | 10/31/2013 | | | 10/31/2012 | |
| Net asset value, beginning of period | | $ | 18.70 | | | $ | | 19.30 | | | $ | 17.46 | | | $ | | 13.90 | | | $ | 12.38 | |
| INCOME FROM INVESTMENT | | | | | | | | | | | | | | | | | | | | | | |
| OPERATIONS: | | | | | | | | | | | | | | | | | | | | | | |
| Net investment income (loss)(i) | | | 0.04 | | | | | 0.01 | | | | (0.02 | ) | | | | 0.10 | | | | 0.08 | |
| Net realized and unrealized gain (loss) | | | | | | | | | | | | | | | | | | | | | | |
| on investments | | | (0.03 | ) | | | | 1.77 | | | | 2.86 | | | | | 3.91 | | | | 1.65 | |
| Total from investment operations | | | 0.01 | | | | | 1.78 | | | | 2.84 | | | | | 4.01 | | | | 1.73 | |
| Dividends from net investment income | – | | | | | – | | | | – | | | | | (0.13 | ) | | | – | |
| Distributions from net realized gains | | | (1.50 | ) | | | | (2.38 | ) | | | (1.00 | ) | | | | (0.32 | ) | | | (0.21 | ) |
| Net asset value, end of period | | $ | 17.21 | | | $ | | 18.70 | | | $ | 19.30 | | | $ | | 17.46 | | | $ | 13.90 | |
| Total return(ii) | | | (0.06 | )% | | | | 9.98 | % | | | 17.01 | % | | | | 29.68 | % | | | 14.28 | % |
| RATIOS/SUPPLEMENTAL DATA: | | | | | | | | | | | | | | | | | | | | | | |
| Net assets, end of period (000's | | | | | | | | | | | | | | | | | | | | | | |
| omitted) | $ | 1,502,388 | | $ | 1,193,803 | | $ | 928,600 | | $ | 367,709 | | $ | 215,244 | |
| Ratio of gross expenses to average | | | | | | | | | | | | | | | | | | | | | | |
| net assets | | | 0.99%(iii) | | | | | 1.04%(iv) | | | | 1.23 | %(v) | | | | 1.20%(vi) | | | | 1.20%(vii) | |
| Ratio of expense reimbursements to | | | | | | | | | | | | | | | | | | | | | | |
| average net assets | | | – | | | | | – | | | | – | | | | | – | | | | – | |
| Ratio of net expenses to average net | | | | | | | | | | | | | | | | | | | | | | |
| assets | | | 0.99 | % | | | | 1.04 | % | | | 1.23 | % | | | | 1.20 | % | | | 1.20 | % |
| Ratio of net investment income (loss) to | | | | | | | | | | | | | | | | | | | | | | |
| average net assets | | | 0.26 | % | | | | 0.06 | % | | | (0.11 | )% | | | | 0.65 | % | | | 0.60 | % |
| Portfolio turnover rate | | | 108.51 | % | | | | 143.64 | % | | | 149.01 | % | | | | 113.69 | % | | | 139.90 | % |
| See Notes to Financial Statements. | | | | | | | | | | | | | | | | | | | | |
(i) Amount was computed based on average shares outstanding during the period.
(ii) Does not reflect the effect of sales charges, if applicable.
(iii) Includes 0.10% related to dividend expense on short positions and interest expense for the period ended 10/31/16
(iv) Includes 0.15% related to dividend expense on short positions and interest expense for the period ended 10/31/15
(v) Includes 0.30% related to dividend expense on short positions and interest expense for the period ended 10/31/14
(vi) Includes 0.22% related to dividend expense on short positions and interest expense for the period ended 10/31/13
(vii) Includes 0.17% related to dividend expense on short positions and interest expense for the period ended 10/31/12
- 71 -
THE ALGER FUNDS II
Financial Highlights for a share outstanding throughout the period
| | | | | | | | | | | | | | | | | | | | | | | | |
| Alger Green Fund | | | | | | | | | | | | | Class A | | | | | | | | | | | |
| | | Year ended | | | Year ended | | | Year ended | | | Year ended | | | Year ended | |
| | | 10/31/2016 | | | 10/31/2015 | | | 10/31/2014 | | | 10/31/2013 | | | 10/31/2012 | |
| Net asset value, beginning of period | | $ | 9.36 | | | $ | | 9.14 | | | $ | | 8.78 | | | $ | | 6.68 | | | $ | | 6.01 | |
| INCOME FROM INVESTMENT | | | | | | | | | | | | | | | | | | | | | | | | |
| OPERATIONS: | | | | | | | | | | | | | | | | | | | | | | | | |
| Net investment income (loss)(i) | | | 0.01 | | | | | (0.01 | ) | | | | – | | | | | 0.01 | | | | | 0.01 | |
| Net realized and unrealized gain (loss) | | | | | | | | | | | | | | | | | | | | | | | | |
| on investments | | | (0.10 | ) | | | | 0.49 | | | | | 0.69 | | | | | 2.10 | | | | | 0.66 | |
| Total from investment operations | | | (0.09 | ) | | | | 0.48 | | | | | 0.69 | | | | | 2.11 | | | | | 0.67 | |
| Dividends from net investment income | – | | | | | – | | | | | – | | | | | (0.01 | ) | | | | – | |
| Distributions from net realized gains | | | (0.13 | ) | | | | (0.26 | ) | | | | (0.33 | ) | | | | – | | | | | – | |
| Net asset value, end of period | | $ | 9.14 | | | $ | | 9.36 | | | $ | | 9.14 | | | $ | | 8.78 | | | $ | | 6.68 | |
| Total return(ii) | | | (1.03 | )% | | | | 5.30 | % | | | | 7.99 | % | | | | 31.63 | % | | | | 11.15 | % |
| RATIOS/SUPPLEMENTAL DATA: | | | | | | | | | | | | | | | | | | | | | | | | |
| Net assets, end of period (000's | | | | | | | | | | | | | | | | | | | | | | | | |
| omitted) | $ | 31,321 | | $ | 34,213 | | $ | 31,662 | | $ | 30,586 | | $ | 26,243 | |
| Ratio of gross expenses to average | | | | | | | | | | | | | | | | | | | | | | | | |
| net assets | | | 1.31 | % | | | | 1.29 | % | | | | 1.33 | % | | | | 1.41 | % | | | | 1.49 | % |
| Ratio of expense reimbursements to | | | | | | | | | | | | | | | | | | | | | | | | |
| average net assets | | | – | | | | | – | | | | | – | | | | | (0.06 | )% | | | | (0.17 | )% |
| Ratio of net expenses to average net | | | | | | | | | | | | | | | | | | | | | | | | |
| assets | | | 1.31 | % | | | | 1.29 | % | | | | 1.33 | % | | | | 1.35 | % | | | | 1.32 | % |
| Ratio of net investment income (loss) to | | | | | | | | | | | | | | | | | | | | | | | | |
| average net assets | | | 0.14 | % | | | | (0.07 | )% | | | | (0.05 | )% | | | | 0.18 | % | | | | 0.12 | % |
| Portfolio turnover rate | | | 19.84 | % | | | | 16.85 | % | | | | 24.22 | % | | | | 43.35 | % | | | | 21.25 | % |
| See Notes to Financial Statements. | | | | | | | | | | | | | | | | | | | | | | |
(i) Amount was computed based on average shares outstanding during the period.
(ii) Does not reflect the effect of sales charges, if applicable.
- 72 -
THE ALGER FUNDS II
Financial Highlights for a share outstanding throughout the period
| | | | | | | | | | | | | | | | | | |
| Alger Green Fund | | | | | | | | | Class C | | | | | | | | | |
| | Year ended | | Year ended | | Year ended | | Year ended | | Year ended | |
| | 10/31/2016 | | 10/31/2015 | | 10/31/2014 | | 10/31/2013 | | 10/31/2012 | |
| Net asset value, beginning of period | $ | 8.84 | | $ | 8.71 | | $ | | 8.45 | | $ | | 6.47 | | $ | | 5.88 | |
| INCOME FROM INVESTMENT | | | | | | | | | | | | | | | | | | |
| OPERATIONS: | | | | | | | | | | | | | | | | | | |
| Net investment loss(i) | | (0.05 | ) | | (0.07 | ) | | | (0.07 | ) | | | (0.05 | ) | | | (0.05 | ) |
| Net realized and unrealized gain (loss) | | | | | | | | | | | | | | | | | | |
| on investments | | (0.10 | ) | | 0.46 | | | | 0.66 | | | | 2.03 | | | | 0.64 | |
| Total from investment operations | | (0.15 | ) | | 0.39 | | | | 0.59 | | | | 1.98 | | | | 0.59 | |
| Distributions from net realized gains | | (0.13 | ) | | (0.26 | ) | | | (0.33 | ) | | | – | | | | – | |
| Net asset value, end of period | $ | 8.56 | | $ | 8.84 | | $ | | 8.71 | | $ | | 8.45 | | $ | | 6.47 | |
| Total return(ii) | | (1.77 | )% | | 4.51 | % | | | 7.09 | % | | | 30.45 | % | | | 10.03 | % |
| RATIOS/SUPPLEMENTAL DATA: | | | | | | | | | | | | | | | | | | |
| Net assets, end of period (000's | | | | | | | | | | | | | | | | | | |
| omitted) | $ | 5,581 | | $ | 5,949 | | $ | | 5,261 | | $ | | 4,096 | | $ | | 2,484 | |
| Ratio of gross expenses to average | | | | | | | | | | | | | | | | | | |
| net assets | | 2.09 | % | | 2.07 | % | | | 2.09 | % | | | 2.16 | % | | | 2.31 | % |
| Ratio of expense reimbursements to | | | | | | | | | | | | | | | | | | |
| average net assets | | – | | | – | | | | – | | | | – | | | | (0.10 | )% |
| Ratio of net expenses to average net | | | | | | | | | | | | | | | | | | |
| assets | | 2.09 | % | | 2.07 | % | | | 2.09 | % | | | 2.16 | % | | | 2.21 | % |
| Ratio of net investment income (loss) to | | | | | | | | | | | | | �� | | | | | |
| average net assets | | (0.63 | )% | | (0.85 | )% | | | (0.81 | )% | | | (0.69 | )% | | | (0.77 | )% |
| Portfolio turnover rate | | 19.84 | % | | 16.85 | % | | | 24.22 | % | | | 43.35 | % | | | 21.25 | % |
| See Notes to Financial Statements. | | | | | | | | | | | | | | | | | |
(i) Amount was computed based on average shares outstanding during the period.
(ii) Does not reflect the effect of sales charges, if applicable.
- 73 -
THE ALGER FUNDS II
Financial Highlights for a share outstanding throughout the period
| | | | | | | | | | | | | | | | | | | | | | | |
| Alger Green Fund | | | | | | | | | | | | | Class I | | | | | | | | | | |
| | | Year ended | | | Year ended | | | Year ended | | | Year ended | | | Year ended | |
| | | 10/31/2016 | | | 10/31/2015 | | | 10/31/2014 | | | 10/31/2013 | | | 10/31/2012 | |
| Net asset value, beginning of period | | $ | 9.35 | | | $ | | 9.12 | | | $ | | 8.77 | | | $ | | 6.67 | | | $ | 6.01 | |
| INCOME FROM INVESTMENT | | | | | | | | | | | | | | | | | | | | | | | |
| OPERATIONS: | | | | | | | | | | | | | | | | | | | | | | | |
| Net investment income (loss)(i) | | | 0.01 | | | | | (0.01 | ) | | | | – | | | | | 0.01 | | | | 0.01 | |
| Net realized and unrealized gain (loss) | | | | | | | | | | | | | | | | | | | | | | | |
| on investments | | | (0.10 | ) | | | | 0.50 | | | | | 0.68 | | | | | 2.10 | | | | 0.65 | |
| Total from investment operations | | | (0.09 | ) | | | | 0.49 | | | | | 0.68 | | | | | 2.11 | | | | 0.66 | |
| Dividends from net investment income | – | | | | | – | | | | | –(ii) | | | | | (0.01 | ) | | | – | |
| Distributions from net realized gains | | | (0.13 | ) | | | | (0.26 | ) | | | | (0.33 | ) | | | | – | | | | – | |
| Net asset value, end of period | | $ | 9.13 | | | $ | | 9.35 | | | $ | | 9.12 | | | $ | | 8.77 | | | $ | 6.67 | |
| Total return(iii) | | | (1.03 | )% | | | | 5.42 | % | | | | 7.91 | % | | | | 31.68 | % | | | 11.00 | % |
| RATIOS/SUPPLEMENTAL DATA: | | | | | | | | | | | | | | | | | | | | | | | |
| Net assets, end of period (000's | | | | | | | | | | | | | | | | | | | | | | | |
| omitted) | $ | 28,461 | | $ | 42,860 | | $ | 41,888 | | $ | 35,108 | | $ | 19,717 | |
| Ratio of gross expenses to average | | | | | | | | | | | | | | | | | | | | | | | |
| net assets | | | 1.28 | % | | | | 1.27 | % | | | | 1.30 | % | | | | 1.35 | % | | | 1.52 | % |
| Ratio of expense reimbursements to | | | | | | | | | | | | | | | | | | | | | | | |
| average net assets | | | – | | | | | – | | | | | – | | | | | – | | | | (0.20 | )% |
| Ratio of net expenses to average net | | | | | | | | | | | | | | | | | | | | | | | |
| assets | | | 1.28 | % | | | | 1.27 | % | | | | 1.30 | % | | | | 1.35 | % | | | 1.32 | % |
| Ratio of net investment income (loss) to | | | | | | | | | | | | | | | | | | | | | | | |
| average net assets | | | 0.16 | % | | | | (0.05 | )% | | | | (0.03 | )% | | | | 0.14 | % | | | 0.10 | % |
| Portfolio turnover rate | | | 19.84 | % | | | | 16.85 | % | | | | 24.22 | % | | | | 43.35 | % | | | 21.25 | % |
| See Notes to Financial Statements. | | | | | | | | | | | | | | | | | | | | | |
(i) Amount was computed based on average shares outstanding during the period.
(ii) Amount was less than $0.005 per share.
(iii) Does not reflect the effect of sales charges, if applicable.
- 74 -
THE ALGER FUNDS II
Financial Highlights for a share outstanding throughout the period
| | | |
| Alger Green Fund | | Class Z | |
| | From 10/14/2016 | |
| | (commencement | |
| | of operations) to | |
| | 10/31/2016 | (i) |
| Net asset value, beginning of period | $ | 9.20 | |
| INCOME FROM INVESTMENT | | | |
| OPERATIONS: | | | |
| Net investment income(ii) | | 0.01 | |
| Net realized and unrealized loss on | | | |
| investments | | (0.07 | ) |
| Total from investment operations | | (0.06 | ) |
| Net asset value, end of period | $ | 9.14 | |
| Total return(iii) | | (0.65 | )% |
| RATIOS/SUPPLEMENTAL DATA: | | | |
| Net assets, end of period (000's | | | |
| omitted) | $ | 99 | |
| Ratio of gross expenses to average | | | |
| net assets | | 33.46 | % |
| Ratio of expense reimbursements to | | | |
| average net assets | | (32.56 | )% |
| Ratio of net expenses to average net | | | |
| assets | | 0.90 | % |
| Ratio of net investment income (loss) to | | | |
| average net assets | | 2.38 | % |
| Portfolio turnover rate | | 19.84 | % |
| See Notes to Financial Statements. | | |
(i) Ratios have been annualized; total return has not been annualized; portfolio turnover is for the twelve months then ended.
(ii) Amount was computed based on average shares outstanding during the period.
(iii) Does not reflect the effect of sales charges, if applicable.
- 75 -
THE ALGER FUNDS II
Financial Highlights for a share outstanding throughout the period
| | | | | | | | | | | | | | | | |
| Alger Mid Cap Focus Fund | | | | | | | | | Class A | | | | | | | |
| | Year ended | | Year ended | | Year ended | | Year ended | | Year ended | |
| | 10/31/2016 | | 10/31/2015 | | 10/31/2014 | | 10/31/2013 | | 10/31/2012 | |
| Net asset value, beginning of period | $ | 12.97 | | $ | 13.74 | | $ | | 13.86 | | $ | 10.83 | | $ | 9.85 | |
| INCOME FROM INVESTMENT | | | | | | | | | | | | | | | | |
| OPERATIONS: | | | | | | | | | | | | | | | | |
| Net investment loss(i) | | (0.01 | ) | | (0.09 | ) | | | (0.06 | ) | | (0.01 | ) | | (0.03 | ) |
| Net realized and unrealized gain (loss) | | | | | | | | | | | | | | | | |
| on investments | | (1.14 | ) | | 0.34 | | | | 1.33 | | | 3.66 | | | 1.01 | |
| Total from investment operations | | (1.15 | ) | | 0.25 | | | | 1.27 | | | 3.65 | | | 0.98 | |
| Dividends from net investment income | – | | | (0.06 | ) | | | – | | | – | | | – | |
| Distributions from net realized gains | | (0.65 | ) | | (0.96 | ) | | | (1.39 | ) | | (0.62 | ) | | – | |
| Net asset value, end of period | $ | 11.17 | | $ | 12.97 | | $ | | 13.74 | | $ | 13.86 | | $ | 10.83 | |
| Total return(ii) | | (9.26 | )% | | 1.75 | % | | | 9.83 | % | | 35.40 | % | | 10.00 | % |
| RATIOS/SUPPLEMENTAL DATA: | | | | | | | | | | | | | | | | |
| Net assets, end of period (000's | | | | | | | | | | | | | | | | |
| omitted) | $ | 6,080 | | $ | 6,707 | | $ | | 6,459 | | $ | 4,766 | | $ | 2,524 | |
| Ratio of gross expenses to average | | | | | | | | | | | | | | | | |
| net assets | | 2.56 | % | | 2.48 | % | | | 2.75 | % | | 4.07 | % | | 4.85 | % |
| Ratio of expense reimbursements to | | | | | | | | | | | | | | | | |
| average net assets | | (1.27 | )% | | (1.05 | )% | | | (1.45 | )% | | (2.77 | )% | | (3.58 | )% |
| Ratio of net expenses to average net | | | | | | | | | | | | | | | | |
| assets | | 1.29 | % | | 1.43 | % | | | 1.30 | % | | 1.30 | % | | 1.27 | % |
| Ratio of net investment income (loss) to | | | | | | | | | | | | | | | | |
| average net assets | | (0.06 | )% | | (0.66 | )% | | | (0.43 | )% | | (0.07 | )% | | (0.30 | )% |
| Portfolio turnover rate | | 111.74 | % | | 106.86 | % | | | 170.12 | % | | 158.26 | % | | 158.39 | % |
| See Notes to Financial Statements. | | | | | | | | | | | | | | | |
(i) Amount was computed based on average shares outstanding during the period.
(ii) Does not reflect the effect of sales charges, if applicable.
- 76 -
THE ALGER FUNDS II
Financial Highlights for a share outstanding throughout the period
| | | | | | | | | | | | | | | | |
| Alger Mid Cap Focus Fund | | | | | | | | | Class C | | | | | | | |
| | Year ended | | Year ended | | Year ended | | Year ended | | Year ended | |
| | 10/31/2016 | | 10/31/2015 | | 10/31/2014 | | 10/31/2013 | | 10/31/2012 | |
| Net asset value, beginning of period | $ | 12.29 | | $ | 13.09 | | $ | | 13.35 | | $ | 10.51 | | $ | 9.62 | |
| INCOME FROM INVESTMENT | | | | | | | | | | | | | | | | |
| OPERATIONS: | | | | | | | | | | | | | | | | |
| Net investment loss(i) | | (0.07 | ) | | (0.15 | ) | | | (0.14 | ) | | (0.09 | ) | | (0.10 | ) |
| Net realized and unrealized gain (loss) | | | | | | | | | | | | | | | | |
| on investments | | (1.08 | ) | | 0.31 | | | | 1.27 | | | 3.55 | | | 0.99 | |
| Total from investment operations | | (1.15 | ) | | 0.16 | | | | 1.13 | | | 3.46 | | | 0.89 | |
| Dividends from net investment income | – | | | – | | | | – | | | – | | | – | |
| Distributions from net realized gains | | (0.65 | ) | | (0.96 | ) | | | (1.39 | ) | | (0.62 | ) | | – | |
| Net asset value, end of period | $ | 10.49 | | $ | 12.29 | | $ | | 13.09 | | $ | 13.35 | | $ | 10.51 | |
| Total return(ii) | | (9.80 | )% | | 1.14 | % | | | 9.09 | % | | 34.63 | % | | 9.25 | % |
| RATIOS/SUPPLEMENTAL DATA: | | | | | | | | | | | | | | | | |
| Net assets, end of period (000's | | | | | | | | | | | | | | | | |
| omitted) | $ | 352 | | $ | 337 | | $ | | 368 | | $ | 282 | | $ | 184 | |
| Ratio of gross expenses to average | | | | | | | | | | | | | | | | |
| net assets | | 3.55 | % | | 3.41 | % | | | 3.53 | % | | 5.49 | % | | 6.00 | % |
| Ratio of expense reimbursements to | | | | | | | | | | | | | | | | |
| average net assets | | (1.60 | )% | | (1.46 | )% | | | (1.58 | )% | | (3.54 | )% | | (4.05 | )% |
| Ratio of net expenses to average net | | | | | | | | | | | | | | | | |
| assets | | 1.95 | % | | 1.95 | % | | | 1.95 | % | | 1.95 | % | | 1.95 | % |
| Ratio of net investment income (loss) to | | | | | | | | | | | | | | | | |
| average net assets | | (0.67 | )% | | (1.18 | )% | | | (1.08 | )% | | (0.73 | )% | | (0.99 | )% |
| Portfolio turnover rate | | 111.74 | % | | 106.86 | % | | | 170.12 | % | | 158.26 | % | | 158.39 | % |
| See Notes to Financial Statements. | | | | | | | | | | | | | | | |
(i) Amount was computed based on average shares outstanding during the period.
(ii) Does not reflect the effect of sales charges, if applicable.
- 77 -
THE ALGER FUNDS II
Financial Highlights for a share outstanding throughout the period
| | | | | | | | | | | | | | | | | |
| Alger Mid Cap Focus Fund | | | | | | | | | Class I | | | | | | | | |
| | Year ended | | Year ended | | Year ended | | Year ended | | Year ended | |
| | 10/31/2016 | | 10/31/2015 | | 10/31/2014 | | 10/31/2013 | | 10/31/2012 | |
| Net asset value, beginning of period | $ | 12.93 | | $ | 13.73 | | $ | | 13.85 | | $ | | 10.82 | | $ | 9.84 | |
| INCOME FROM INVESTMENT | | | | | | | | | | | | | | | | | |
| OPERATIONS: | | | | | | | | | | | | | | | | | |
| Net investment loss(i) | | (0.01 | ) | | (0.09 | ) | | | (0.06 | ) | | | (0.01 | ) | | (0.03 | ) |
| Net realized and unrealized gain (loss) | | | | | | | | | | | | | | | | | |
| on investments | | (1.14 | ) | | 0.33 | | | | 1.33 | | | | 3.66 | | | 1.01 | |
| Total from investment operations | | (1.15 | ) | | 0.24 | | | | 1.27 | | | | 3.65 | | | 0.98 | |
| Dividends from net investment income | – | | | (0.08 | ) | | | – | | | | – | | | – | |
| Distributions from net realized gains | | (0.65 | ) | | (0.96 | ) | | | (1.39 | ) | | | (0.62 | ) | | – | |
| Return of capital | | – | | | – | | | | – | | | | – | | | – | |
| Net asset value, end of period | $ | 11.13 | | $ | 12.93 | | $ | | 13.73 | | $ | | 13.85 | | $ | 10.82 | |
| Total return(ii) | | (9.29 | )% | | 1.72 | % | | | 9.84 | % | | | 35.44 | % | | 10.00 | % |
| RATIOS/SUPPLEMENTAL DATA: | | | | | | | | | | | | | | | | | |
| Net assets, end of period (000's | | | | | | | | | | | | | | | | | |
| omitted) | $ | 1,576 | | $ | 1,968 | | $ | | 1,975 | | $ | | 1,815 | | $ | 1,180 | |
| Ratio of gross expenses to average | | | | | | | | | | | | | | | | | |
| net assets | | 2.59 | % | | 2.50 | % | | | 2.79 | % | | | 4.07 | % | | 5.95 | % |
| Ratio of expense reimbursements to | | | | | | | | | | | | | | | | | |
| average net assets | | (1.29 | )% | | (1.07 | )% | | | (1.49 | )% | | | (2.77 | )% | | (4.68 | )% |
| Ratio of net expenses to average net | | | | | | | | | | | | | | | | | |
| assets | | 1.30 | % | | 1.43 | % | | | 1.30 | % | | | 1.30 | % | | 1.27 | % |
| Ratio of net investment income (loss) to | | | | | | | | | | | | | | | | | |
| average net assets | | (0.07 | )% | | (0.66 | )% | | | (0.41 | )% | | | (0.08 | )% | | (0.33 | )% |
| Portfolio turnover rate | | 111.74 | % | | 106.86 | % | | | 170.12 | % | | | 158.26 | % | | 158.39 | % |
| See Notes to Financial Statements. | | | | | | | | | | | | | | | | |
(i) Amount was computed based on average shares outstanding during the period.
(ii) Does not reflect the effect of sales charges, if applicable.
- 78 -
THE ALGER FUNDS II
Financial Highlights for a share outstanding throughout the period
| | | |
| Alger Mid Cap Focus Fund | | Class Z | |
| | From 10/14/2016 | |
| | (commencement | |
| | of operations) to | |
| | 10/31/2016 | (i) |
| Net asset value, beginning of period | $ | 11.25 | |
| INCOME FROM INVESTMENT | | | |
| OPERATIONS: | | | |
| Net investment income(ii) | | 0.04 | |
| Net realized and unrealized loss on | | | |
| investments | | (0.16 | ) |
| Total from investment operations | | (0.12 | ) |
| Net asset value, end of period | $ | 11.13 | |
| Total return(iii) | | (1.07 | )% |
| RATIOS/SUPPLEMENTAL DATA: | | | |
| Net assets, end of period (000's | | | |
| omitted) | $ | 99 | |
| Ratio of gross expenses to average | | | |
| net assets | | 34.74 | % |
| Ratio of expense reimbursements to | | | |
| average net assets | | (33.75 | )% |
| Ratio of net expenses to average net | | | |
| assets | | 0.99 | % |
| Ratio of net investment income (loss) to | | | |
| average net assets | | 8.35 | % |
| Portfolio turnover rate | | 111.74 | % |
| See Notes to Financial Statements. | | |
(i) Ratios have been annualized; total return has not been annualized; portfolio turnover is for the twelve months then ended.
(ii) Amount was computed based on average shares outstanding during the period.
(iii) Does not reflect the effect of sales charges, if applicable.
- 79 -
THE ALGER FUNDS II
Financial Highlights for a share outstanding throughout the period
| | | | | | | | | | | | | | | | | | | | | | | |
| Alger Dynamic Opportunities | | | | | | | | | | | | | | | | | | | | | | | |
| Fund | | | | | | | | | | | | | Class A | | | | | | | | | | |
| | | Year ended | | | Year ended | | | Year ended | | | Year ended | | | Year ended | |
| | | 10/31/2016 | | | 10/31/2015 | | | 10/31/2014 | | | 10/31/2013 | | | 10/31/2012 | |
| Net asset value, beginning of period | | $ | 12.48 | | | $ | | 12.86 | | | $ | | 12.90 | | | $ | | 11.12 | | | $ | 10.64 | |
| INCOME FROM INVESTMENT | | | | | | | | | | | | | | | | | | | | | | | |
| OPERATIONS: | | | | | | | | | | | | | | | | | | | | | | | |
| Net investment loss(i) | | | (0.17 | ) | | | | (0.19 | ) | | | | (0.20 | ) | | | | (0.16 | ) | | | (0.14 | ) |
| Net realized and unrealized gain (loss) | | | | | | | | | | | | | | | | | | | | | | | |
| on investments | | | (0.34 | ) | | | | 0.55 | | | | | 0.96 | | | | | 1.94 | | | | 0.77 | |
| Total from investment operations | | | (0.51 | ) | | | | 0.36 | | | | | 0.76 | | | | | 1.78 | | | | 0.63 | |
| Distributions from net realized gains | | | (0.34 | ) | | | | (0.74 | ) | | | | (0.80 | ) | | | | – | | | | (0.15 | ) |
| Net asset value, end of period | | $ | 11.63 | | | $ | | 12.48 | | | $ | | 12.86 | | | $ | | 12.90 | | | $ | 11.12 | |
| Total return(ii) | | | (4.22 | )% | | | | 2.86 | % | | | | 6.15 | % | | | | 16.01 | % | | | 6.07 | % |
| RATIOS/SUPPLEMENTAL DATA: | | | | | | | | | | | | | | | | | | | | | | | |
| Net assets, end of period (000's | | | | | | | | | | | | | | | | | | | | | | | |
| omitted) | $ | 30,031 | | $ | 67,533 | | $ | 48,464 | | $ | 36,712 | | $ | 21,741 | |
| Ratio of gross expenses to average | | | | | | | | | | | | | | | | | | | | | | | |
| net assets | | | 2.38%(iii) | | | | | 2.20%(iv) | | | | | 2.46 | %(v) | | | | 2.61%(vi) | | | | 2.98%(vii) | |
| Ratio of expense reimbursements to | | | | | | | | | | | | | | | | | | | | | | | |
| average net assets | | | – | | | | | – | | | | | – | | | | | (0.03 | )% | | | (0.36 | )% |
| Ratio of net expenses to average net | | | | | | | | | | | | | | | | | | | | | | | |
| assets | | | 2.38 | % | | | | 2.20 | % | | | | 2.46 | % | | | | 2.58 | % | | | 2.62 | % |
| Ratio of net investment income (loss) to | | | | | | | | | | | | | | | | | | | | | | | |
| average net assets | | | (1.43 | )% | | | | (1.51 | )% | | | | (1.57 | )% | | | | (1.37 | )% | | | (1.26 | )% |
| Portfolio turnover rate | | | 146.73 | % | | | | 178.19 | % | | | | 205.45 | % | | | | 201.50 | % | | | 257.74 | % |
| See Notes to Financial Statements. | | | | | | | | | | | | | | | | | | | | | |
(i) Amount was computed based on average shares outstanding during the period.
(ii) Does not reflect the effect of sales charges, if applicable.
(iii) Includes 0.58% related to dividend expense on short positions and interest expense for the period ended 10/31/16
(iv) Includes 0.44% related to dividend expense on short positions and interest expense for the period ended 10/31/15
(v) Includes 0.57% related to dividend expense on short positions and interest expense for the period ended 10/31/14
(vi) Includes 0.58% related to dividend expense on short positions and interest expense for the period ended 10/31/13
(vii) Includes 0.62% related to dividend expense on short positions and interest expense for the period ended 10/31/12
- 80 -
THE ALGER FUNDS II
Financial Highlights for a share outstanding throughout the period
| | | | | | | | | | | | | | | | | | |
| Alger Dynamic Opportunities | | | | | | | | | | | | | | | | | | |
| Fund | | | | | | | | | | Class C | | | | | | | | |
| | Year ended | | | Year ended | | Year ended | | Year ended | | Year ended | |
| | 10/31/2016 | | | 10/31/2015 | | 10/31/2014 | | 10/31/2013 | | 10/31/2012 | |
| Net asset value, beginning of period | $ | 11.98 | | | $ | 12.47 | | $ | | 12.62 | | $ | | 10.95 | | $ | 10.57 | |
| INCOME FROM INVESTMENT | | | | | | | | | | | | | | | | | | |
| OPERATIONS: | | | | | | | | | | | | | | | | | | |
| Net investment loss(i) | | (0.25 | ) | | | (0.28 | ) | | | (0.29 | ) | | | (0.25 | ) | | (0.22 | ) |
| Net realized and unrealized gain (loss) | | | | | | | | | | | | | | | | | | |
| on investments | | (0.32 | ) | | | 0.53 | | | | 0.94 | | | | 1.92 | | | 0.75 | |
| Total from investment operations | | (0.57 | ) | | | 0.25 | | | | 0.65 | | | | 1.67 | | | 0.53 | |
| Distributions from net realized gains | | (0.34 | ) | | | (0.74 | ) | | | (0.80 | ) | | | – | | | (0.15 | ) |
| Net asset value, end of period | $ | 11.07 | | | $ | 11.98 | | $ | | 12.47 | | $ | | 12.62 | | $ | 10.95 | |
| Total return(ii) | | (5.00 | )% | | | 2.11 | % | | | 5.38 | % | | | 15.15 | % | | 5.25 | % |
| RATIOS/SUPPLEMENTAL DATA: | | | | | | | | | | | | | | | | | | |
| Net assets, end of period (000's | | | | | | | | | | | | | | | | | | |
| omitted) | $ | 7,120 | | $ | 10,136 | | $ | | 5,808 | | $ | | 1,407 | | $ | 622 | |
| Ratio of gross expenses to average | | | | | | | | | | | | | | | | | | |
| net assets | | 3.14%(iii) | | | | 2.98%(iv) | | | | 3.23 | %(v) | | | 3.36%(vi) | | | 4.00%(vii) | |
| Ratio of expense reimbursements to | | | | | | | | | | | | | | | | | | |
| average net assets | | – | | | | – | | | | – | | | | (0.03 | )% | | (0.62 | )% |
| Ratio of net expenses to average net | | | | | | | | | | | | | | | | | | |
| assets | | 3.14 | % | | | 2.98 | % | | | 3.23 | % | | | 3.33 | % | | 3.38 | % |
| Ratio of net investment income (loss) to | | | | | | | | | | | | | | | | | | |
| average net assets | | (2.19 | )% | | | (2.28 | )% | | | (2.36 | )% | | | (2.13 | )% | | (2.05 | )% |
| Portfolio turnover rate | | 146.73 | % | | | 178.19 | % | | | 205.45 | % | | | 201.50 | % | | 257.74 | % |
| See Notes to Financial Statements. | | | | | | | | | | | | | | | | | |
(i) Amount was computed based on average shares outstanding during the period.
(ii) Does not reflect the effect of sales charges, if applicable.
(iii) Includes 0.59% related to dividend expense on short positions and interest expense for the period ended 10/31/16
(iv) Includes 0.44% related to dividend expense on short positions and interest expense for the period ended 10/31/15
(v) Includes 0.59% related to dividend expense on short positions and interest expense for the period ended 10/31/14
(vi) Includes 0.58% related to dividend expense on short positions and interest expense for the period ended 10/31/13
(vii) Includes 0.63% related to dividend expense on short positions and interest expense for the period ended 10/31/12
- 81 -
THE ALGER FUNDS II
Financial Highlights for a share outstanding throughout the period
| | | | | | | | | | | | | | | | | | | | | | | | |
| Alger Dynamic Opportunities | | | | | | | | | | | | | | | | | | | | | | | | |
| Fund | | | | | | | | | | | | | Class Z | | | | | | | | | | | |
| | | Year ended | | | Year ended | | | Year ended | | | Year ended | | | Year ended | |
| | | 10/31/2016 | | | 10/31/2015 | | | 10/31/2014 | | | 10/31/2013 | | | 10/31/2012 | |
| Net asset value, beginning of period | | $ | 12.64 | | | $ | | 12.99 | | | $ | | 12.98 | | | $ | | 11.16 | | | $ | | 10.66 | |
| INCOME FROM INVESTMENT | | | | | | | | | | | | | | | | | | | | | | | | |
| OPERATIONS: | | | | | | | | | | | | | | | | | | | | | | | | |
| Net investment loss(i) | | | (0.14 | ) | | | | (0.16 | ) | | | | (0.16 | ) | | | | (0.13 | ) | | | | (0.10 | ) |
| Net realized and unrealized gain (loss) | | | | | | | | | | | | | | | | | | | | | | | | |
| on investments | | | (0.33 | ) | | | | 0.55 | | | | | 0.97 | | | | | 1.95 | | | | | 0.75 | |
| Total from investment operations | | | (0.47 | ) | | | | 0.39 | | | | | 0.81 | | | | | 1.82 | | | | | 0.65 | |
| Distributions from net realized gains | | | (0.34 | ) | | | | (0.74 | ) | | | | (0.80 | ) | | | | – | | | | | (0.15 | ) |
| Net asset value, end of period | | $ | 11.83 | | | $ | | 12.64 | | | $ | | 12.99 | | | $ | | 12.98 | | | $ | | 11.16 | |
| Total return(ii) | | | (3.92 | )% | | | | 3.16 | % | | | | 6.52 | % | | | | 16.29 | % | | | | 6.34 | % |
| RATIOS/SUPPLEMENTAL DATA: | | | | | | | | | | | | | | | | | | | | | | | | |
| Net assets, end of period (000's | | | | | | | | | | | | | | | | | | | | | | | | |
| omitted) | $ | 44,947 | | $ | 46,966 | | $ | 29,828 | | $ | 20,504 | | $ | 17,158 | |
| Ratio of gross expenses to average | | | | | | | | | | | | | | | | | | | | | | | | |
| net assets | | | 2.07%(iii) | | | | | 1.93%(iv) | | | | | 2.18 | %(v) | | | | 2.34%(vi) | | | | | 2.73%(vii) | |
| Ratio of expense reimbursements to | | | | | | | | | | | | | | | | | | | | | | | | |
| average net assets | | | – | | | | | – | | | | | – | | | | | – | | | | | (0.35 | )% |
| Ratio of net expenses to average net | | | | | | | | | | | | | | | | | | | | | | | | |
| assets | | | 2.07 | % | | | | 1.93 | % | | | | 2.18 | % | | | | 2.34 | % | | | | 2.38 | % |
| Ratio of net investment income (loss) to | | | | | | | | | | | | | | | | | | | | | | | | |
| average net assets | | | (1.13 | )% | | | | (1.23 | )% | | | | (1.29 | )% | | | | (1.08 | )% | | | | (0.90 | )% |
| Portfolio turnover rate | | | 146.73 | % | | | | 178.19 | % | | | | 205.45 | % | | | | 201.50 | % | | | | 257.74 | % |
| See Notes to Financial Statements. | | | | | | | | | | | | | | | | | | | | | | |
(i) Amount was computed based on average shares outstanding during the period.
(ii) Does not reflect the effect of sales charges, if applicable.
(iii) Includes 0.58% related to dividend expense on short positions and interest expense for the period ended 10/31/16
(iv) Includes 0.44% related to dividend expense on short positions and interest expense for the period ended 10/31/15
(v) Includes 0.57% related to dividend expense on short positions and interest expense for the period ended 10/31/14
(vi) Includes 0.58% related to dividend expense on short positions and interest expense for the period ended 10/31/13
(vii) Includes 0.62% related to dividend expense on short positions and interest expense for the period ended 10/31/12
- 82 -
THE ALGER FUNDS II
Financial Highlights for a share outstanding throughout the period
| | | | | | | | | | | | | | | | |
| Alger Emerging Markets Fund | | | | | | | | Class A | | | | | | | | |
| | Year ended | | Year ended | | Year ended | | Year ended | | Year ended | |
| | 10/31/2016 | | 10/31/2015 | | 10/31/2014 | | 10/31/2013 | | 10/31/2012 | |
| Net asset value, beginning of period | $ | 8.55 | | $ | 9.44 | | $ | 9.57 | | $ | 8.52 | | $ | | 8.32 | |
| INCOME FROM INVESTMENT | | | | | | | | | | | | | | | | |
| OPERATIONS: | | | | | | | | | | | | | | | | |
| Net investment income (loss)(i) | | (0.01 | ) | | (0.03 | ) | | (0.01 | ) | | 0.02 | | | | 0.03 | |
| Net realized and unrealized gain (loss) | | | | | | | | | | | | | | | | |
| on investments | | 0.56 | | | (0.86 | ) | | (0.12 | ) | | 1.19 | | | | 0.17 | |
| Total from investment operations | | 0.55 | | | (0.89 | ) | | (0.13 | ) | | 1.21 | | | | 0.20 | |
| Dividends from net investment income | (0.01 | ) | | – | | | – | | | (0.16 | ) | | | – | |
| Net asset value, end of period | $ | 9.09 | | $ | 8.55 | | $ | 9.44 | | $ | 9.57 | | $ | | 8.52 | |
| Total return(ii) | | 6.41 | % | | (9.43 | )% | | (1.36 | )% | | 14.31 | % | | | 2.40 | % |
| RATIOS/SUPPLEMENTAL DATA: | | | | | | | | | | | | | | | | |
| Net assets, end of period (000's | | | | | | | | | | | | | | | | |
| omitted) | $ | 5,931 | | $ | 8,270 | | $ | 6,931 | | $ | 5,260 | | $ | | 1,176 | |
| Ratio of gross expenses to average | | | | | | | | | | | | | | | | |
| net assets | | 2.43 | % | | 2.71 | % | | 2.99 | % | | 3.49 | % | | | 4.43 | % |
| Ratio of expense reimbursements to | | | | | | | | | | | | | | | | |
| average net assets | | (0.83 | )% | | (1.01 | )% | | (1.29 | )% | | (1.79 | )% | | | (2.73 | )% |
| Ratio of net expenses to average net | | | | | | | | | | | | | | | | |
| assets | | 1.60 | % | | 1.70 | % | | 1.70 | % | | 1.70 | % | | | 1.70 | % |
| Ratio of net investment income (loss) to | | | | | | | | | | | | | | | | |
| average net assets | | (0.10 | )% | | (0.31 | )% | | (0.13 | )% | | 0.19 | % | | | 0.31 | % |
| Portfolio turnover rate | | 65.84 | % | | 84.93 | % | | 98.25 | % | | 103.59 | % | | | 150.09 | % |
| See Notes to Financial Statements. | | | | | | | | | | | | | | | |
(i) Amount was computed based on average shares outstanding during the period.
(ii) Does not reflect the effect of sales charges, if applicable.
- 83 -
THE ALGER FUNDS II
Financial Highlights for a share outstanding throughout the period
| | | | | | | | | | | | | | | |
| Alger Emerging Markets Fund | | | | | | | | Class C | | | | | | | |
| | Year ended | | Year ended | | Year ended | | Year ended | | Year ended | |
| | 10/31/2016 | | 10/31/2015 | | 10/31/2014 | | 10/31/2013 | | 10/31/2012 | |
| Net asset value, beginning of period | $ | 8.30 | | $ | 9.23 | | $ | 9.42 | | $ | 8.37 | | $ | 8.23 | |
| INCOME FROM INVESTMENT | | | | | | | | | | | | | | | |
| OPERATIONS: | | | | | | | | | | | | | | | |
| Net investment loss(i) | | (0.06 | ) | | (0.09 | ) | | (0.08 | ) | | (0.06 | ) | | (0.05 | ) |
| Net realized and unrealized gain (loss) | | | | | | | | | | | | | | | |
| on investments | | 0.52 | | | (0.84 | ) | | (0.11 | ) | | 1.17 | | | 0.19 | |
| Total from investment operations | | 0.46 | | | (0.93 | ) | | (0.19 | ) | | 1.11 | | | 0.14 | |
| Dividends from net investment income | – | | | – | | | – | | | (0.06 | ) | | – | |
| Net asset value, end of period | $ | 8.76 | | $ | 8.30 | | $ | 9.23 | | $ | 9.42 | | $ | 8.37 | |
| Total return(ii) | | 5.54 | % | | (10.08 | )% | | (2.02 | )% | | 13.34 | % | | 1.70 | % |
| RATIOS/SUPPLEMENTAL DATA: | | | | | | | | | | | | | | | |
| Net assets, end of period (000's | | | | | | | | | | | | | | | |
| omitted) | $ | 2,849 | | $ | 2,581 | | $ | 2,151 | | $ | 484 | | $ | 151 | |
| Ratio of gross expenses to average | | | | | | | | | | | | | | | |
| net assets | | 3.21 | % | | 3.51 | % | | 3.79 | % | | 4.75 | % | | 5.61 | % |
| Ratio of expense reimbursements to | | | | | | | | | | | | | | | |
| average net assets | | (0.86 | )% | | (1.06 | )% | | (1.34 | )% | | (2.30 | )% | | (3.16 | )% |
| Ratio of net expenses to average net | | | | | | | | | | | | | | | |
| assets | | 2.35 | % | | 2.45 | % | | 2.45 | % | | 2.45 | % | | 2.45 | % |
| Ratio of net investment income (loss) to | | | | | | | | | | | | | | | |
| average net assets | | (0.80 | )% | | (1.01 | )% | | (0.84 | )% | | (0.73 | )% | | (0.57 | )% |
| Portfolio turnover rate | | 65.84 | % | | 84.93 | % | | 98.25 | % | | 103.59 | % | | 150.09 | % |
| See Notes to Financial Statements. | | | | | | | | | | | | | | |
(i) Amount was computed based on average shares outstanding during the period.
(ii) Does not reflect the effect of sales charges, if applicable.
- 84 -
THE ALGER FUNDS II
Financial Highlights for a share outstanding throughout the period
| | | | | | | | | | | | | | | | | | | | | |
| Alger Emerging Markets Fund | | | | | | | | | | | | Class I | | | | | | | | | |
| | | Year ended | | | Year ended | | | Year ended | | | Year ended | | Year ended | |
| | | 10/31/2016 | | | 10/31/2015 | | | 10/31/2014 | | | 10/31/2013 | | 10/31/2012 | |
| Net asset value, beginning of period | | $ | 8.50 | | | $ | | 9.38 | | | $ | 9.51 | | | $ | 8.48 | | $ | | 8.28 | |
| INCOME FROM INVESTMENT | | | | | | | | | | | | | | | | | | | | | |
| OPERATIONS: | | | | | | | | | | | | | | | | | | | | | |
| Net investment income (loss)(i) | | | (0.01 | ) | | | | (0.03 | ) | | | (0.02 | ) | | | 0.01 | | | | 0.01 | |
| Net realized and unrealized gain (loss) | | | | | | | | | | | | | | | | | | | | | |
| on investments | | | 0.55 | | | | | (0.85 | ) | | | (0.11 | ) | | | 1.19 | | | | 0.19 | |
| Total from investment operations | | | 0.54 | | | | | (0.88 | ) | | | (0.13 | ) | | | 1.20 | | | | 0.20 | |
| Dividends from net investment income | –(ii) | | | | | – | | | | – | | | | (0.17 | ) | | | – | |
| Net asset value, end of period | | $ | 9.04 | | | $ | | 8.50 | | | $ | 9.38 | | | $ | 9.51 | | $ | | 8.48 | |
| Total return(iii) | | | 6.39 | % | | | | (9.38 | )% | | | (1.37 | )% | | | 14.26 | % | | | 2.42 | % |
| RATIOS/SUPPLEMENTAL DATA: | | | | | | | | | | | | | | | | | | | | | |
| Net assets, end of period (000's | | | | | | | | | | | | | | | | | | | | | |
| omitted) | $ | 14,006 | | $ | 11,814 | | $ | 11,451 | | $ | 10,218 | | $ | | 8,712 | |
| Ratio of gross expenses to average | | | | | | | | | | | | | | | | | | | | | |
| net assets | | | 2.32 | % | | | | 2.64 | % | | | 2.92 | % | | | 3.45 | % | | | 4.28 | % |
| Ratio of expense reimbursements to | | | | | | | | | | | | | | | | | | | | | |
| average net assets | | | (0.72 | )% | | | | (0.94 | )% | | | (1.22 | )% | | | (1.75 | )% | | | (2.58 | )% |
| Ratio of net expenses to average net | | | | | | | | | | | | | | | | | | | | | |
| assets | | | 1.60 | % | | | | 1.70 | % | | | 1.70 | % | | | 1.70 | % | | | 1.70 | % |
| Ratio of net investment income (loss) to | | | | | | | | | | | | | | | | | | | | | |
| average net assets | | | (0.06 | )% | | | | (0.35 | )% | | | (0.16 | )% | | | 0.06 | % | | | 0.15 | % |
| Portfolio turnover rate | | | 65.84 | % | | | | 84.93 | % | | | 98.25 | % | | | 103.59 | % | | | 150.09 | % |
| See Notes to Financial Statements. | | | | | | | | | | | | | | | | | | | |
(i) Amount was computed based on average shares outstanding during the period.
(ii) Amount was less than $0.005 per share.
(iii) Does not reflect the effect of sales charges, if applicable.
- 85 -
THE ALGER FUNDS II
Financial Highlights for a share outstanding throughout the period
| Alger Emerging Markets Fund | | | | | | | Class Z | | | | | |
| | | | | | | | | | | From 2/28/2014 | |
| | | | | | | | | | (commencement | |
| | | | Year ended | | | | Year ended | | of operations) to | | |
| | | | 10/31/2016 | | 10/31/2015 | | 10/31/2014 (i) | |
| Net asset value, beginning of period | | $ | 8.56 | | $ | | 9.41 | | $ | 9.24 | |
| INCOME FROM INVESTMENT | | | | | | | | | | | | |
| OPERATIONS: | | | | | | | | | | | | |
| Net investment income(ii) | | | 0.02 | | | | 0.01 | | | | 0.02 | |
| Net realized and unrealized gain (loss) | | | | | | | | | | | | |
| on investments | | | 0.56 | | | | (0.86 | ) | | | 0.15 | |
| Total from investment operations | | | 0.58 | | | | (0.85 | ) | | | 0.17 | |
| Dividends from net investment income | (0.02 | ) | | | – | | | | – | |
| Net asset value, end of period | | $ | 9.12 | | $ | | 8.56 | | $ | 9.41 | |
| Total return(iii) | | | 6.78 | % | | | (9.03 | )% | | | 1.84 | % |
| RATIOS/SUPPLEMENTAL DATA: | | | | | | | | | | | | |
| Net assets, end of period (000's | | | | | | | | | | | | |
| omitted) | $ | 17,568 | | $ | | 4,294 | | $ | 3,667 | |
| Ratio of gross expenses to average | | | | | | | | | | | | |
| net assets | | | 2.07 | % | | | 2.55 | % | | | 3.35 | % |
| Ratio of expense reimbursements to | | | | | | | | | | | | |
| average net assets | | | (0.82 | )% | | | (1.30 | )% | | | (2.10 | )% |
| Ratio of net expenses to average net | | | | | | | | | | | | |
| assets | | | 1.25 | % | | | 1.25 | % | | | 1.25 | % |
| Ratio of net investment income (loss) to | | | | | | | | | | | | |
| average net assets | | | 0.29 | % | | | 0.20 | % | | | 0.29 | % |
| Portfolio turnover rate | | | 65.84 | % | | | 84.93 | % | | | 98.25 | % |
| See Notes to Financial Statements. | | | | | | | | | | |
(i) Ratios have been annualized; total return has not been annualized; portfolio turnover is for the twelve months then ended.
(ii) Amount was computed based on average shares outstanding during the period.
(iii) Does not reflect the effect of sales charges, if applicable.
- 86 -
THE ALGER FUNDS II
Financial Highlights for a share outstanding throughout the period
| | | |
| Alger Emerging Markets Fund | | Class Y | |
| | From 5/9/2016 | |
| | (commencement | |
| | of operations) to | |
| | 10/31/2016 | (i) |
| Net asset value, beginning of period | $ | 7.94 | |
| INCOME FROM INVESTMENT | | | |
| OPERATIONS: | | | |
| Net investment income(ii) | | 0.03 | |
| Net realized and unrealized gain on | | | |
| investments | | 1.09 | |
| Total from investment operations | | 1.12 | |
| Net asset value, end of period | $ | 9.06 | |
| Total return(iii) | | 14.11 | % |
| RATIOS/SUPPLEMENTAL DATA: | | | |
| Net assets, end of period (000's | | | |
| omitted) | $ | 114 | |
| Ratio of gross expenses to average | | | |
| net assets | | 4.86 | % |
| Ratio of expense reimbursements to | | | |
| average net assets | | (3.81 | )% |
| Ratio of net expenses to average net | | | |
| assets | | 1.05 | % |
| Ratio of net investment income (loss) to | | | |
| average net assets | | 0.73 | % |
| Portfolio turnover rate | | 65.84 | % |
| See Notes to Financial Statements. | | |
(i) Ratios have been annualized; total return has not been annualized; portfolio turnover is for the twelve months then ended.
(ii) Amount was computed based on average shares outstanding during the period.
(iii) Does not reflect the effect of sales charges, if applicable.
- 87 -
THE ALGER FUNDS II
Financial Highlights for a share outstanding throughout the period
| | | |
| Alger Emerging Markets Fund | Class Y-2 | |
| | From 5/9/2016 | |
| | (commencement | |
| | of operations) to | |
| | 10/31/2016 | (i) |
| Net asset value, beginning of period | $ | 7.94 | |
| INCOME FROM INVESTMENT | | | |
| OPERATIONS: | | | |
| Net investment income(ii) | | 0.03 | |
| Net realized and unrealized gain on | | | |
| investments | | 1.09 | |
| Total from investment operations | | 1.12 | |
| Net asset value, end of period | $ | 9.06 | |
| Total return(iii) | | 14.11 | % |
| RATIOS/SUPPLEMENTAL DATA: | | | |
| Net assets, end of period (000's | | | |
| omitted) | $ | 114 | |
| Ratio of gross expenses to average | | | |
| net assets | | 4.86 | % |
| Ratio of expense reimbursements to | | | |
| average net assets | | (3.87 | )% |
| Ratio of net expenses to average net | | | |
| assets | | 0.99 | % |
| Ratio of net investment income (loss) to | | | |
| average net assets | | 0.79 | % |
| Portfolio turnover rate | | 65.84 | % |
| See Notes to Financial Statements. | | |
(i) Ratios have been annualized; total return has not been annualized; portfolio turnover is for the twelve months then ended.
(ii) Amount was computed based on average shares outstanding during the period.
(iii) Does not reflect the effect of sales charges, if applicable.
- 88 -
THE ALGER FUNDS II
NOTES TO FINANCIAL STATEMENTS
NOTE 1 — General:
The Alger Funds II (the “Trust”) is a diversified open-end registered investment company
organized as a business trust under the laws of the Commonwealth of Massachusetts. The
Trust qualifies as an investment company as defined in the Financial Accounting Standards
Board Accounting Standards Codification 946-Financial Services – Investment Companies.
The Trust operates as a series company currently offering an unlimited number of shares
of beneficial interest in five funds—Alger Spectra Fund, Alger Green Fund, Alger Mid
Cap Focus Fund, Alger Dynamic Opportunities Fund and Alger Emerging Markets Fund
(collectively, the “Funds” or individually, each a “Fund”). The Funds normally invest
primarily in equity securities and each has an investment objective of long-term capital
appreciation.
Each Fund offers one or more of the following share classes: Class A shares, Class C shares,
Class I shares, Class Y shares, Class Y-2 shares and Class Z shares. Class A shares are
generally subject to an initial sales charge while Class C shares are generally subject to a
deferred sales charge. Class I shares, Class Y shares, Class Y-2 shares and Class Z shares
are sold to institutional investors without an initial or deferred sales charge. Each class
has identical rights to assets and earnings, except that each share class bears the pro rata
allocation of the Fund’s expense other than a Class Expense (not including advisory or
custodial fees or other expenses related to the management of the Fund’s assets) to a share
class.
The Alger Analyst Fund changed its name to Alger Mid Cap Focus Fund effective December
30, 2015.
The Alger Green Fund and Alger Mid Cap Focus Fund started offering Class Z shares on
October 14, 2016 and the Alger Emerging Markets Fund started offering Class Y shares and
Class Y-2 shares on May 9, 2016.
NOTE 2 — Significant Accounting Policies:
(a) Investment Valuation: The Funds value their financial instruments at fair value using
independent dealers or pricing services under policies approved by the Trust’s Board of
Trustees (“Board”). Investments are valued on each day the New York Stock Exchange (the
“NYSE”) is open, as of the close of the NYSE (normally 4:00 p.m. Eastern Standard time).
Equity securities and option contracts for which valuation information is readily available are
valued at the last quoted sales price or official closing price as reported by an independent
pricing service on the primary market or exchange on which they are traded. In the absence
of quoted sales, such securities are valued at the bid price or, in the absence of a recent
bid price, the equivalent as obtained from one or more of the major market makers for the
securities to be valued.
The industry classifications of the Funds’ investments, as presented in the accompanying
Schedules of Investments, represent management’s belief as to the most meaningful
presentation of the classification of such investments. For Fund compliance purposes, the
Funds’ industry classifications refer to any one or more of the industry sub-classifications
- 89 -
THE ALGER FUNDS II
NOTES TO FINANCIAL STATEMENTS (Continued)
used by one or more widely recognized market indexes or rating group indexes, with the
primary source being Global Industry Classification Standard (GICS).
Debt securities generally trade in the over-the-counter market. Debt securities with
remaining maturities of more than sixty days at the time of acquisition are valued on
the basis of last available bid prices or current market quotations provided by dealers
or pricing services. In determining the value of a particular investment, pricing services
may use certain information with respect to transactions in such investments, quotations
from dealers, pricing matrixes, market transactions in comparable investments, various
relationships observed in the market between investments and calculated yield measures
based on valuation technology commonly employed in the market for such investments.
Asset-backed and mortgage-backed securities are valued by independent pricing services
using models that consider estimated cash flows of each tranche of the security, establish a
benchmark yield and develop an estimated tranche-specific spread to the benchmark yield
based on the unique attributes of the tranche. Debt securities with a remaining maturity of
sixty days or less are valued at amortized cost which approximates market value.
Securities for which market quotations are not readily available are valued at fair value, as
determined in good faith pursuant to procedures established by the Board.
Securities in which the Funds invest may be traded in foreign markets that close before the
close of the NYSE. Developments that occur between the close of the foreign markets
and the close of the NYSE may result in adjustments to the foreign closing prices to reflect
what the investment adviser, pursuant to policies established by the Board, believes to be
the fair value of these securities as of the close of the NYSE. The Funds may also fair value
securities in other situations, for example, when a particular foreign market is closed but the
Funds are open.
Financial Accounting Standards Board Accounting Standards Codification 820 – Fair Value
Measurements and Disclosures (“ASC 820”) defines fair value as the price that the Funds
would receive upon selling an investment in a timely transaction to an independent buyer
in the principal or most advantageous market of the investment. ASC 820 established a
three-tier hierarchy to maximize the use of observable market data and minimize the use of
unobservable inputs and to establish classification of fair value measurements for disclosure
purposes. Inputs refer broadly to the assumptions that market participants would use in
pricing the asset or liability and may be observable or unobservable. Observable inputs
are based on market data obtained from sources independent of the Funds. Unobservable
inputs are inputs that reflect the Funds’ own assumptions based on the best information
available in the circumstances. The three-tier hierarchy of inputs is summarized in the three
broad Levels listed below.
• Level 1 – quoted prices in active markets for identical investments
• Level 2 – significant other observable inputs (including quoted prices for similar
investments, interest rates, prepayment speeds, credit risk, etc.)
• Level 3 – significant unobservable inputs (including the Funds’ own assumptions in
determining the fair value of investments)
- 90 -
THE ALGER FUNDS II
NOTES TO FINANCIAL STATEMENTS (Continued)
The Funds’ valuation techniques are generally consistent with either the market or the
income approach to fair value. The market approach considers prices and other relevant
information generated by market transactions involving identical or comparable assets
to measure fair value. The income approach converts future amounts to a current, or
discounted, single amount. These fair value measurements are determined on the basis
of the value indicated by current market expectations about such future events. Inputs
for Level 1 include exchange-listed prices and broker quotes in an active market. Inputs
for Level 2 include the last trade price in the case of a halted security, an exchange-listed
price which has been adjusted for fair value factors, and prices of closely related securities.
Additional Level 2 inputs include an evaluated price which is based upon a compilation of
observable market information such as spreads for fixed income and preferred securities.
Inputs for Level 3 include revenue multiples, earnings before interest, taxes, depreciation
and amortization (“EBITDA”) multiples, discount rates, and the probabilities of success of
certain outcomes. Such unobservable market information may be obtained from a company’s
financial statements and from industry studies, market data, and market indicators such as
benchmarks and indices. Because of the inherent uncertainty and often limited markets for
restricted securities, the values may significantly differ from the values if there was an active
market.
Valuation processes are determined by a Valuation Committee (“Committee”) established
by the Board and comprised of representatives of the Trust’s investment adviser. The
Committee reports its fair valuation determinations to the Board which is responsible for
approving valuation policy and procedures.
While the Committee meets on an as-needed basis, the Committee generally meets
quarterly to review and evaluate the effectiveness of the procedures for making fair value
determinations. The Committee considers, among other things, the results of quarterly
back testing of the fair value model for foreign securities, pricing comparisons between
primary and secondary price sources, the outcome of price challenges put to the Funds’
pricing vendor, and variances between transactional prices and previous mark-to-markets.
The Funds will record a change to a security’s fair value level if new inputs are available
or it becomes evident that inputs previously considered for leveling have changed or are
no longer relevant. Transfers between Levels 1, 2 and 3 are recognized at the end of the
reporting period.
(b) Cash and Cash Equivalents: Cash and cash equivalents include U.S. dollars, foreign cash
and overnight time deposits.
(c) Securities Transactions and Investment Income: Securities transactions are recorded on a
trade date basis. Realized gains and losses from securities transactions are recorded on the
identified cost basis. Dividend income is recognized on the ex-dividend date and interest
income is recognized on the accrual basis.
Premiums and discounts on debt securities purchased are amortized or accreted over the
lives of the respective securities
- 91 -
THE ALGER FUNDS II
NOTES TO FINANCIAL STATEMENTS (Continued)
(d) Foreign Currency Translations: The books and records of the Funds are maintained in U.S.
dollars. Foreign currencies, investments and other assets and liabilities are translated into
U.S. dollars at the prevailing rates of exchange on the valuation date. Purchases and sales
of investment securities and income and expenses are translated into U.S. dollars at the
prevailing exchange rates on the respective dates of such transactions.
Net realized gains and losses on foreign currency transactions represent net gains and losses
from the disposition of foreign currencies, currency gains and losses realized between the
trade dates and settlement dates of security transactions, and the difference between the
amount of net investment income accrued and the U.S. dollar amount actually received.
The effects of changes in foreign currency exchange rates on investments in securities
are included in realized and unrealized gain or loss on investments in the accompanying
Statements of Operations.
(e) Short Sales: Securities sold short represent an obligation to deliver the securities at a
future date. A Fund may sell a security it does not own in anticipation of a decline in the
value of that security before the delivery date. When a Fund sells a security short, it must
borrow the security sold short and deliver it to the broker-dealer through which it made
the short sale. Dividends paid on securities sold short are disclosed as an expense on the
Statement of Operations. A gain, limited to the price at which the Fund sold the security
short, or a loss, unlimited in size, will be recognized upon the termination of a short sale.
To secure its obligation to deliver to the broker-dealer the securities sold short, the Fund
must segregate an amount of cash or liquid securities with its custodian equal to any excess
of the current market value of the securities sold short over any cash or liquid securities
deposited as collateral with the broker in connection with the short sale (not including the
proceeds of the short sale). As a result of that requirement, the Fund will not gain any
leverage merely by selling short, except to the extent that it earns interest or other income
or gains on the segregated cash or liquid securities while also being subject to gain or loss
from the securities sold short.
(f) Option Contracts: When a Fund writes an option, an amount equal to the premium received
by the Fund is recorded as a liability and is subsequently adjusted to the current fair value
of the option written. Premiums received from writing options that expire unexercised are
treated by the Fund on the expiration date as realized gains from investments. The difference
between the premium and the amount paid on effecting a closing purchase transaction,
including brokerage commissions, is also treated as a realized gain, or, if the premium is less
than the amount paid for the closing purchase transaction, as a realized loss. If a call option
is exercised, the premium is added to the proceeds from the sale of the underlying security
in determining whether the Fund has realized a gain or loss. If a put option is exercised, the
premium reduces the cost basis of the securities purchased by the Fund. The Fund, as writer
of an option, bears the market risk of an unfavorable change in the price of the security
underlying the written option.
The Funds may also purchase put and call options. Each Fund pays a premium which is
included in the Fund’s Statement of Assets and Liabilities as an investment and subsequently
marked to market to reflect the current value of the option. Premiums paid for purchasing
- 92 -
THE ALGER FUNDS II
NOTES TO FINANCIAL STATEMENTS (Continued)
options which expire are treated as realized losses. The risk associated with purchasing put
and call options is limited to the premium paid. Premiums paid for purchasing options
which are exercised or closed are added to the amounts paid or offset against the proceeds
on the underlying security to determine the realized gain or loss.
(g) Lending of Fund Securities: The Funds may lend their securities to financial institutions,
provided that the market value of the securities loaned will not at any time exceed one
third of a Fund’s total assets, as defined in its prospectuses. The Funds earn fees on the
securities loaned, which are included in interest income in the accompanying Statements
of Operations. In order to protect against the risk of failure by the borrower to return the
securities loaned or any delay in the delivery of such securities, the loan is collateralized by
cash or securities that are maintained with the Custodian in an amount equal to at least 102
percent of the current market value of U.S. loaned securities or 105 percent for non-U.S.
loaned securities. The market value of the loaned securities is determined at the close of
business of the Fund. Any required additional collateral is delivered to the Custodian and
any excess collateral is returned to the borrower on the next business day. In the event the
borrower fails to return the loaned securities when due, the Funds may take the collateral
to replace the securities. If the value of the collateral is less than the purchase cost of
replacement securities, the Custodian shall be responsible for any shortfall, but only to
the extent that the shortfall is not due to any diminution in collateral value, as defined in
the securities lending agreement. The Funds are required to maintain the collateral in a
segregated account and determine its value each day until the loaned securities are returned.
Cash collateral may be invested as determined by the Funds. Collateral is returned to the
borrower upon settlement of the loan. There were no securities loaned as of October 31,
2016.
(h) Dividends to Shareholders: Dividends and distributions payable to shareholders are
recorded by the Funds on the ex-dividend date. Dividends from net investment income and
distributions from net realized gains are declared and paid annually after the end of the fiscal
year in which earned.
Each class is treated separately in determining the amounts of dividends from net investment
income payable to holders of its shares.
The characterization of distributions to shareholders for financial reporting purposes is
determined in accordance with federal income tax rules. Therefore, the source of a Fund’s
distributions may be shown in the accompanying financial statements as either from, or in
excess of, net investment income, net realized gain on investment transactions or return of
capital, depending on the type of book/tax differences that may exist. Capital accounts within
the financial statements are adjusted for permanent book/tax differences. Reclassifications
result primarily from the difference in tax treatment of net operating losses, passive foreign
investment companies, and foreign currency transactions. The reclassifications are done
annually at fiscal year end and have no impact on the net asset values of the Funds, and are
designed to present each Fund’s capital accounts on a tax basis.
(i) Federal Income Taxes: It is each Fund’s policy to comply with the requirements of the
Internal Revenue Code Subchapter M applicable to regulated investment companies and to
- 93 -
THE ALGER FUNDS II
NOTES TO FINANCIAL STATEMENTS (Continued)
distribute all of its taxable income to its shareholders. Provided the Funds maintain such
compliance, no federal income tax provision is required. Each Fund is treated as a separate
entity for the purpose of determining such compliance.
Financial Accounting Standards Board Accounting Standards Codification 740 – Income
Taxes (“ASC 740”) requires the Funds to measure and recognize in their financial statements
the benefit of a tax position taken (or expected to be taken) on an income tax return if such
position will more likely than not be sustained upon examination based on the technical
merits of the position. No tax years are currently under investigation. The Funds file
income tax returns in the U.S., as well as New York State and New York City. The statute
of limitations on the tax returns for the Alger Spectra Fund, Alger Green Fund, Alger Mid
Cap Focus Fund, Alger Dynamic Opportunities Fund and Alger Emerging Markets Fund
remains open for the tax years 2013-2016. Management does not believe there are any
uncertain tax positions that require recognition of a tax liability.
(j) Allocation Methods: The Trust accounts separately for the assets, liabilities and operations
of each Fund. Expenses directly attributable to each Fund are charged to that Fund’s
operations; expenses which are applicable to all Funds are allocated among them based on
net assets. Income, realized and unrealized gains and losses, and expenses of each Fund
are allocated among the Fund’s classes based on relative net assets, with the exception of
distribution fees, transfer agency fees, and shareholder servicing and related fees.
(k) Estimates: These financial statements have been prepared in accordance with accounting
principles generally accepted in the United States of America, which require using estimates
and assumptions that affect the reported amounts therein. Actual results may differ from
those estimates. All such estimates are of normal recurring nature.
NOTE 3 — Investment Advisory Fees and Other Transactions with Affiliates:
(a) Investment Advisory Fees: Fees incurred by each Fund, pursuant to the provisions of
the Trust’s Investment Advisory Agreement with Fred Alger Management, Inc. (“Alger
Management” or the “Manager”), are payable monthly and computed based on the following
rates. The actual rate paid as a percentage of average daily net assets, for the year ended
October 31, 2016, is set forth below under the heading “Actual Rate.”:
| | | | | | | | | | | | | | | | | | | | | |
| | | Tier 1 | | | Tier 2 | | | | Tier 3 | | | | Tier 4 | | | | Tier 5 | | | Actual Rate | |
| Alger Spectra | | | | | | | | | | | | | | | | | | | | | |
| Fund(a) | | 0.900 | % | | 0.750 | % | | | 0.650 | % | | | 0.550 | % | | | 0.450 | % | | 0.778 | % |
| Alger Green Fund(b) | 0.710 | | | 0.650 | | | | — | | | | — | | | | — | | | 0.710 | |
| Alger Mid Cap | | | | | | | | | | | | | | | | | | | | | |
| Focus Fund(b) | | 0.750 | | | 0.700 | | | | — | | | | — | | | | — | | | 0.750 | |
| Alger Dynamic | | | | | | | | | | | | | | | | | | | | | |
| Opportunities | | | | | | | | | | | | | | | | | | | | | |
| Fund(b) | | 1.200 | | | 1.000 | | | | — | | | | — | | | | — | | | 1.200 | |
| Alger Emerging | | | | | | | | | | | | | | | | | | | | | |
| Markets Fund(c) | | 1.100 | | | — | | | | — | | | | — | | | | — | | | 1.100 | |
- 94 -
THE ALGER FUNDS II
NOTES TO FINANCIAL STATEMENTS (Continued)
(a) Tier 1 rate is paid on assets up to $2 billion, Tier 2 rate is paid on assets between $2 and
$4 billion, Tier 3 rate is paid on assets between $4 and $6 billion, Tier 4 rate is paid on assets
between $6 and $8 billion, and Tier 5 rate is paid on assets in excess of $8 billion.
(b) Tier 1 rate is paid on assets up to $1 billion and Tier 2 rate is paid on assets in excess of
$1 billion.
(c) Tier 1 rate is paid on all assets.
Alger Management has established expense caps for several share classes, effective through
February 28, 2017, for Alger Green Fund Class A and I shares, Alger Mid Cap Focus Fund
Class A, C and I shares, Alger Dynamic Fund Class A, C and Z shares and Alger Emerging
Markets Class A, C, and I shares, effective through October 13, 2017, for Alger Green
Fund Class Z, and Alger Mid Cap Focus Fund Class Z, and effective through May 8, 2017
for Alger Emerging Markets Fund Class Y and Class Y-2 shares whereby it reimburses the
share classes if annualized operating expenses (excluding interest, taxes, brokerage, dividend
expense and extraordinary expenses) exceed the rates, based on average daily net assets,
listed below:
| | | | | | | | | | | | | |
| | | | | | | | | | | | FEES WAIVED / |
| | | | | | | | | | | | REIMBURSED FOR |
| | | | | | | | CLASS | | | | THE YEAR ENDED |
| | | | | | | | | | | | OCTOBER 31, |
| | A | | C | | I | | Y | Y-2 | Z | | | 2016 |
| Alger Green Fund | 1.35 | % | – | | 1.35 | % | – | – | 0.90 | % | | $ | 1,513 |
| Alger Mid Cap Focus Fund* | 1.20 | | 1.95 | % | 1.20 | | – | – | 0.99 | | | | 108,257 |
| Alger Dynamic Opportunities Fund** | 1.95 | | 2.70 | | – | | – | – | 1.60 | | | | — |
| Alger Emerging Markets Fund*** | 1.55 | | 2.30 | | 1.55 | | 1.05% | 0.99% | 1.25 | | | | 236,914 |
* Prior to March 1, 2016, the expense cap for the Alger Mid Cap Focus Fund Class A and
Class I was 1.50%.
** Prior to March 1, 2016, the expense cap for the Alger Dynamic Opportunities Fund Class
A was 2.00%, Class C was 2.75% and Class Z was 1.75%.
*** Prior to March 1, 2016, the expense cap for the Alger Emerging Markets Fund Class A
was 1.70%, Class C was 2.45%, Class I was 1.70%.
Fred Alger Management, Inc. may recoup reimbursed expenses during the one-year term of
the expense reimbursement contract if the expense ratio falls below the stated limitation.
In addition to the fee cap, Alger Management voluntarily reduced its advisory fee for the
Alger Emerging Markets Fund by $83,000 for the year ended October 31, 2016.
(b) Administration Fees: Fees incurred by each Fund, pursuant to the provisions of the Trust’s
Administration Agreement with Fred Alger Management, Inc., are payable monthly and
computed based on the average daily net assets of each Fund at the annual rate of 0.0275%.
(c) Distribution Fees: The Trust has adopted a distribution plan pursuant to which Class
A shares, Class C shares and Class I shares of each Fund pay Fred Alger & Company,
Incorporated, the distributor (the “Distributor” or “Alger Inc.”), a fee at the annual rate
- 95 -
THE ALGER FUNDS II
NOTES TO FINANCIAL STATEMENTS (Continued)
listed below of the respective average daily net assets of the share class of the designated
Fund to compensate Alger Inc. for its activities and expenses incurred in distributing the
share class and shareholder servicing. Fees paid may be more or less than the expenses
incurred by Alger Inc.
| | |
| | FEE | |
| SHARE CLASS | RATE | |
| A | 0.25 | % |
| C | 1.00 | |
| I | 0.25 | |
(d) Sales Charges: Purchases and sales of shares of the Funds may be subject to initial sales
charges or contingent deferred sales charges. The contingent deferred sales charges are
used by Alger Inc. to offset distribution expenses previously incurred. Sales charges do
not represent expenses of the Trust. For the year ended October 31, 2016, the initial sales
charges and contingent deferred sales charges imposed, all of which were retained by Alger
Inc., were as follows:
| | | | |
| | | | | CONTINGENT |
| | INITIAL SALES | DEFERRED SALES |
| | | CHARGES | | CHARGES |
| Alger Spectra Fund | $ | 8,233 | $ | 160,563 |
| Alger Green Fund | | 1,230 | | 435 |
| Alger Mid Cap Focus Fund | | – | | 1,269 |
| Alger Dynamic Opportunities Fund | | – | | 8,975 |
| Alger Emerging Markets Fund | | 30 | | 1,495 |
(e) Brokerage Commissions: During the year ended October 31, 2016, Alger Spectra Fund,
Alger Green Fund, Alger Mid Cap Focus Fund, Alger Dynamic Opportunities Fund and
Alger Emerging Markets Fund paid Alger Inc., an affiliate of Alger Management, $1,744,314,
$6,664, $, $3,637, $34,082, and $144 respectively, in connection with securities transactions.
(f) Shareholder Administrative Fees: The Trust has entered into a shareholder administrative
services agreement with Alger Management, to compensate Alger Management for its
liaison and administrative oversight of Boston Financial Data Services, Inc., the transfer
agent, and other related services. The Funds compensate Alger Management at the annual
rate of 0.0165% of their respective average daily net assets for the Class A and Class C
shares and 0.01% of their respective average daily net assets of the Class I shares, Class Y
shares, Class Y-2 shares and Class Z shares for these services.
Alger Management makes payments to intermediaries that provide sub-accounting
services to omnibus accounts invested in the Funds. A portion of the fees paid by Alger
Management to intermediaries that provide sub-accounting services are charged back to
the appropriate Fund, subject to certain limitations, as approved by the Board. For the year
ended October 31, 2016, Alger Management charged back to Alger Spectra Fund, Alger
Green Fund, Alger Mid Cap Focus Fund, Alger Dynamic Opportunities Fund and Alger
Emerging Markets Fund $1,964,767, $44,134, $412, $21,583 and $9,167, respectively, for
these services, which are included in transfer agent fees and expenses in the accompanying
Statements of Operations.
- 96 -
THE ALGER FUNDS II
NOTES TO FINANCIAL STATEMENTS (Continued)
(g) Trustees’ Fees: From November 1, 2015 through February 29, 2016, each trustee who
is not affiliated with Alger Management or its affiliates (each, an “Independent Trustee”)
received a fee of $25,875 for each board meeting attended, to a maximum of $103,500
per annum, paid pro rata by each fund in the Alger Fund Complex, plus travel expenses
incurred for attending the meeting. The Independent Trustee appointed as Chairman of the
Board of Trustees received additional compensation of $24,300 per annum paid pro rata by
each fund in the Alger Fund Complex. Additionally, each member of the Audit Committee
received a fee of $2,500 for each Audit Committee meeting attended to a maximum of
$10,000 per annum, paid pro rata by each fund in the Alger Fund Complex.
Effective March 1, 2016, each Independent Trustee receives a fee of $27,250 for each board
meeting attended, to a maximum of $109,000 per annum, paid pro rata by each fund in
the Alger Fund Complex, plus travel expenses incurred for attending the meeting. The
Independent Trustee appointed as Chairman of the Board of Trustees receives additional
compensation of $26,000 per annum paid pro rata by each fund in the Alger Fund Complex.
Additionally, each member of the Audit Committee receives a fee of $2,500 for each Audit
Committee meeting attended to a maximum of $10,000 per annum, paid pro rata by each
fund in the Alger Fund Complex.
(h) Interfund Trades: The Funds engaged in purchase and sale transactions with funds that
have a common investment adviser. For the year ended October 31, 2016, these purchases
and sales were as follows:
| | | | | | | |
| | | Purchases | | Sales | Realized Gain/(loss) |
| | | | | | | | |
| Alger Spectra Fund | | – | $ | 196,014 | | $ | 1,361 |
(i) Interfund Loans: The Funds, along with other funds advised by Alger Management, may
borrow money from and lend money to each other for temporary or emergency purposes.
To the extent permitted under its investment restrictions, each fund may lend uninvested
cash in an amount up to 15% of its net assets to other funds. If a fund has borrowed from
other funds and has aggregate borrowings from all sources that exceed 10% of the fund’s
total assets, such fund will secure all of its loans from other funds. The interest rate charged
on interfund loans is equal to the average of the overnight time deposit rate and bank loan
rate available to the funds. There were no interfund loans outstanding as of October 31,
2016.
During the year ended October 31, 2016, Alger Spectra Fund and Alger Dynamic
Opportunities Fund incurred interfund loan interest expense of $13,499 and $1,322
respectively and Alger Spectra Fund earned interfund loan interest income of $10,255.
(j) Other Transactions with Affiliates: Certain officers of the Trust are directors and officers
of Alger Management and Alger Inc. At October 31, 2016, Alger Management and its
affiliated entities owned the following shares:
| | | | | | | | | | | | |
| | | | | | | SHARE CLASS | | | | |
| | | A | | C | | I | | Y | Y-2 | Z |
| Alger Spectra Fund | | 1,641,053 | | 15,759 | | 15,584 | | | — | | — | 99,800 |
- 97 -
THE ALGER FUNDS II
NOTES TO FINANCIAL STATEMENTS (Continued)
| | | | | | | | | | | | | | |
| | | | | | | | SHARE CLASS | | | | | |
| | | | A | | C | | I | | Y | | | Y-2 | Z | |
| Alger Green Fund | | | — | | — | | — | | — | | | — | 10,870 | |
| Alger Mid Cap Focus Fund | | 436,253 | | 15,690 | | 135,923 | | — | | | — | 8,889 | |
| Alger Dynamic Opportunities Fund | | | — | | 108 | | — | | — | | | — | 1,911,916 | |
| Alger Emerging Markets Fund | | | 103 | | 101 | | 1,008,139 | | 12,598 | | | 12,598 | 125,903 | |
NOTE 4 — Securities Transactions:
The following summarizes the securities transactions by the Trust, other than U.S.
Government securities, short-term securities, purchased options and short sales, for the
year ended October 31, 2016:
| | | | | | |
| | | | PURCHASES | | | SALES |
| Alger Spectra Fund | | $ | 5,887,902,901 | | $ | 6,175,704,611 |
| Alger Green Fund | | | 14,006,685 | | | 26,873,250 |
| Alger Mid Cap Focus Fund | | | 8,556,399 | | | 9,191,810 |
| Alger Dynamic Opportunities Fund | | | 114,765,247 | | | 136,074,179 |
| Alger Emerging Markets Fund | | | 30,414,399 | | | 19,090,466 |
Transactions in foreign securities may involve certain considerations and risks not typically
associated with those of U.S. companies because of, among other factors, the level of
governmental supervision and regulation of foreign security markets, and the possibility of
political or economic instability. Additional risks associated with investing in the emerging
markets include increased volatility, limited liquidity, and less stringent regulatory and legal
system.
NOTE 5 — Borrowing:
The Funds may borrow from their custodian on an uncommitted basis. Each Fund pays the
custodian a market rate of interest, generally based upon the London Interbank Offered
Rate. The Funds may also borrow from other funds advised by Alger Management, as
discussed in Note 3(i). For the year ended October 31, 2016, the Funds had the following
borrowings:
| | | | | |
| | AVERAGE DAILY | WEIGHTED AVERAGE | |
| | | BORROWING | | INTEREST RATE | |
| Alger Spectra Fund | $ | 1,327,015 | | 1.59 | % |
| Alger Dynamic Opportunities Fund | | 145,538 | | 1.61 | |
The highest amount borrowed during the year ended October 31, 2016 for each Fund was
as follows:
| | |
| | HIGHEST BORROWING |
| Alger Spectra Fund | $ | 49,564,380 |
| Alger Dynamic Opportunities Fund | | 4,991,353 |
- 98 -
THE ALGER FUNDS II
NOTES TO FINANCIAL STATEMENTS (Continued)
NOTE 6 — Share Capital:
(a) The Trust has an unlimited number of authorized shares of beneficial interest of $.001
par value which are presently divided into five series. Each series is divided into separate
classes. The transactions of shares of beneficial interest were as follows:
| | | | | | | | | | | | | | |
| | | FOR THE YEAR ENDED | | | FOR THE YEAR ENDED | |
| | | OCTOBER 31, 2016 | | | OCTOBER 31, 2015 | |
| | | SHARES | | | | AMOUNT | | | SHARES | | | | AMOUNT | |
| Alger Spectra Fund | | | | | | | | | | | | | | |
| Class A: | | | | | | | | | | | | | | |
| Shares sold | | 22,459,638 | | | $ | 376,448,174 | | | 39,752,696 | | | $ | 723,575,458 | |
| Shares converted from Class C | | — | | | | — | | | 789 | | | | 13,707 | |
| Dividends reinvested | | 7,841,338 | | | | 134,790,655 | | | 11,977,865 | | | | 207,942,485 | |
| Shares redeemed | | (55,164,586 | ) | | (949,972,686 | ) | | (26,642,149 | ) | | (480,791,797 | ) |
| Net increase (decrease) | | (24,863,610 | ) | | $ | (438,733,857 | ) | | 25,089,201 | | | $ | 450,739,853 | |
| Class C: | | | | | | | | | | | | | | |
| Shares sold | | 11,405,489 | | | $ | 179,771,128 | | | 17,773,236 | | | $ | 306,898,662 | |
| Shares converted to Class A | | — | | | | — | | | (829 | ) | | | (13,707 | ) |
| Dividends reinvested | | 3,746,272 | | | | 60,577,530 | | | 4,064,447 | | | | 67,185,473 | |
| Shares redeemed | | (15,006,117 | ) | | (236,215,817 | ) | | (5,784,391 | ) | | (100,117,136 | ) |
| Net increase | | 145,644 | | | $ | 4,132,841 | | | 16,052,463 | | | $ | 273,953,292 | |
| Class I: | | | | | | | | | | | | | | |
| Shares sold | | 26,907,311 | | | $ | 453,822,973 | | | 30,392,263 | | | $ | 553,225,190 | |
| Dividends reinvested | | 5,773,974 | | | | 100,120,707 | | | 7,049,801 | | | | 123,371,317 | |
| Shares redeemed | | (28,268,868 | ) | | (473,296,328 | ) | | (23,640,599 | ) | | (430,390,075 | ) |
| Net increase | | 4,412,417 | | | $ | 80,647,352 | | | 13,801,465 | | | $ | 246,206,432 | |
| Class Z: | | | | | | | | | | | | | | |
| Shares sold | | 51,225,696 | | | $ | 892,038,721 | | | 24,122,438 | | | $ | 443,811,354 | |
| Dividends reinvested | | 5,203,469 | | | | 90,748,498 | | | 4,088,271 | | | | 71,708,282 | |
| Shares redeemed | | (32,957,491 | ) | | (553,713,537 | ) | | (12,467,668 | ) | | (228,613,779 | ) |
| Net increase | | 23,471,674 | | | $ | 429,073,682 | | | 15,743,041 | | | $ | 286,905,857 | |
- 99 -
THE ALGER FUNDS II
NOTES TO FINANCIAL STATEMENTS (Continued)
| | | | | | | | | | | | | | | |
| | | FOR THE YEAR ENDED | | | | FOR THE YEAR ENDED | |
| | | OCTOBER 31, 2016 | | | | OCTOBER 31, 2015 | |
| | | SHARES | | | | AMOUNT | | | | SHARES | | | | AMOUNT | |
| Alger Green Fund | | | | | | | | | | | | | | | |
| Class A: | | | | | | | | | | | | | | | |
| Shares sold | | 462,409 | | $ | | 4,132,579 | | | | 848,336 | | $ | | 7,874,298 | |
| Dividends reinvested | | 42,735 | | | | 397,861 | | | | 87,670 | | | | 790,783 | |
| Shares redeemed | | (735,643 | ) | | | (6,721,779 | ) | | | (745,408 | ) | | | (6,861,948 | ) |
| Net increase (decrease) | | (230,499 | ) | $ | | (2,191,339 | ) | | | 190,598 | | $ | | 1,803,133 | |
| Class C: | | | | | | | | | | | | | | | |
| Shares sold | | 79,419 | | $ | | 671,004 | | | | 122,584 | | $ | | 1,081,809 | |
| Dividends reinvested | | 8,206 | | | | 72,049 | | | | 15,308 | | | | 131,343 | |
| Shares redeemed | | (109,021 | ) | | | (921,632 | ) | | | (68,828 | ) | | | (602,232 | ) |
| Net increase (decrease) | | (21,396 | ) | $ | | (178,579 | ) | | | 69,064 | | $ | | 610,920 | |
| Class I: | | | | | | | | | | | | | | | |
| Shares sold | | 1,219,128 | | $ | | 10,977,360 | | | | 1,046,757 | | $ | | 9,701,664 | |
| Dividends reinvested | | 63,193 | | | | 587,695 | | | | 126,542 | | | | 1,140,144 | |
| Shares redeemed | | (2,751,331 | ) | | | (24,524,569 | ) | | | (1,178,515 | ) | | | (10,860,854 | ) |
| Net decrease | | (1,469,010 | ) | $ | | (12,959,514 | ) | | | (5,216 | ) | $ | | (19,046 | ) |
| Class Z: | | | | | | | | | | | | | | | |
| Shares sold | | 10,870 | | $ | | 100,000 | | | | — | | $ | | — | |
| Net increase | | 10,870 | | $ | | 100,000 | | | | — | | $ | | — | |
| |
| Alger Mid Cap Focus Fund | | | | | | | | | | | | | | | |
| Class A: | | | | | | | | | | | | | | | |
| Shares sold | | 18,521 | | $ | | 218,620 | | | | 23,459 | | $ | | 324,232 | |
| Dividends reinvested | | 27,796 | | | | 338,004 | | | | 36,998 | | | | 484,675 | |
| Shares redeemed | | (19,040 | ) | | | (215,100 | ) | | | (13,283 | ) | | | (178,116 | ) |
| Net increase | | 27,277 | | $ | | 341,524 | | | | 47,174 | | $ | | 630,791 | |
| Class C: | | | | | | | | | | | | | | | |
| Shares sold | | 7,211 | | $ | | 77,824 | | | | 770 | | $ | | 10,000 | |
| Dividends reinvested | | 1,555 | | | | 17,866 | | | | 2,094 | | | | 26,114 | |
| Shares redeemed | | (2,569 | ) | | | (27,765 | ) | | | (3,599 | ) | | | (45,751 | ) |
| Net increase (decrease) | | 6,197 | | $ | | 67,925 | | | | (735 | ) | $ | | (9,637 | ) |
| Class I: | | | | | | | | | | | | | | | |
| Shares sold | | 11,104 | | $ | | 128,273 | | | | 5,526 | | $ | | 72,336 | |
| Dividends reinvested | | 7,127 | | | | 86,456 | | | | 9,914 | | | | 129,474 | |
| Shares redeemed | | (28,896 | ) | | | (346,428 | ) | | | (7,105 | ) | | | (96,943 | ) |
| Net increase (decrease) | | (10,665 | ) | $ | | (131,699 | ) | | | 8,335 | | $ | | 104,867 | |
| Class Z: | | | | | | | | | | | | | | | |
| Shares sold | | 8,889 | | $ | | 100,000 | | | | — | | $ | | — | |
| Net increase | | 8,889 | | $ | | 100,000 | | | | — | | $ | | — | |
- 100 -
THE ALGER FUNDS II
NOTES TO FINANCIAL STATEMENTS (Continued)
| | | | | | | | | | | | | | |
| | | FOR THE YEAR ENDED | | | | FOR THE YEAR ENDED | |
| | | OCTOBER 31, 2016 | | | | OCTOBER 31, 2015 | |
| | | SHARES | | | | AMOUNT | | | | SHARES | | | AMOUNT | |
| Alger Dynamic Opportunities Fund | | | | | | | | | | | | | | |
| Class A: | | | | | | | | | | | | | | |
| Shares sold | | 728,813 | | $ | | 8,593,757 | | | | 4,084,063 | | $ | 51,945,889 | |
| Dividends reinvested | | 92,399 | | | | 1,126,347 | | | | 184,459 | | | 2,266,955 | |
| Shares redeemed | | (3,650,521 | ) | | | (44,124,416 | ) | | | (2,624,269 | ) | | (33,370,150 | ) |
| Net increase (decrease) | | (2,829,309 | ) | $ | | (34,404,312 | ) | | | 1,644,253 | | $ | 20,842,694 | |
| Class C: | | | | | | | | | | | | | | |
| Shares sold | | 225,463 | | $ | | 2,559,720 | | | | 543,957 | | $ | 6,594,072 | |
| Dividends reinvested | | 24,644 | | | | 288,086 | | | | 29,847 | | | 354,289 | |
| Shares redeemed | | (452,884 | ) | | | (5,078,536 | ) | | | (193,562 | ) | | (2,330,099 | ) |
| Net increase (decrease) | | (202,777 | ) | $ | | (2,230,730 | ) | | | 380,242 | | $ | 4,618,262 | |
| Class Z: | | | | | | | | | | | | | | |
| Shares sold | | 3,489,434 | | $ | | 42,763,119 | | | | 1,808,583 | | $ | 23,361,291 | |
| Dividends reinvested | | 152,963 | | | | 1,892,152 | | | | 142,127 | | | 1,765,215 | |
| Shares redeemed | | (3,556,489 | ) | | | (42,344,017 | ) | | | (532,142 | ) | | (6,693,453 | ) |
| Net increase | | 85,908 | | $ | | 2,311,254 | | | | 1,418,568 | | $ | 18,433,053 | |
| |
| Alger Emerging Markets Fund | | | | | | | | | | | | | | |
| Class A: | | | | | | | | | | | | | | |
| Shares sold | | 352,921 | | $ | | 2,953,303 | | | | 533,918 | | $ | 4,935,891 | |
| Dividends reinvested | | 578 | | | | 4,778 | | | | — | | | — | |
| Shares redeemed | | (668,231 | ) | | | (5,552,598 | ) | | | (300,875 | ) | | (2,646,959 | ) |
| Net increase (decrease) | | (314,732 | ) | $ | | (2,594,517 | ) | | | 233,043 | | $ | 2,288,932 | |
| Class C: | | | | | | | | | | | | | | |
| Shares sold | | 121,899 | | $ | | 993,807 | | | | 154,495 | | $ | 1,360,751 | |
| Shares redeemed | | (107,944 | ) | | | (864,186 | ) | | | (76,427 | ) | | (660,491 | ) |
| Net increase | | 13,955 | | $ | | 129,621 | | | | 78,068 | | $ | 700,260 | |
| Class I: | | | | | | | | | | | | | | |
| Shares sold | | 369,492 | | $ | | 3,112,644 | | | | 237,045 | | $ | 2,083,456 | |
| Dividends reinvested | | 488 | | | | 4,013 | | | | — | | | — | |
| Shares redeemed | | (210,490 | ) | | | (1,649,529 | ) | | | (67,331 | ) | | (585,642 | ) |
| Net increase | | 159,490 | | $ | | 1,467,128 | | | | 169,714 | | $ | 1,497,814 | |
| Class Y: | | | | | | | | | | | | | | |
| Shares sold | | 12,598 | | $ | | 100,000 | | | | — | | $ | — | |
| Net increase | | 12,598 | | $ | | 100,000 | | | | — | | $ | — | |
| Class Y-2: | | | | | | | | | | | | | | |
| Shares sold | | 12,598 | | $ | | 100,000 | | | | — | | $ | — | |
| Net increase | | 12,598 | | $ | | 100,000 | | | | — | | $ | — | |
| Class Z: | | | | | | | | | | | | | | |
| Shares sold | | 1,782,637 | | $ | | 15,311,270 | | | | 381,907 | | $ | 3,463,640 | |
| Dividends reinvested | | 1,860 | | | | 15,394 | | | | — | | | — | |
| Shares redeemed | | (359,635 | ) | | | (2,918,791 | ) | | | (270,076 | ) | | (2,417,251 | ) |
| Net increase | | 1,424,862 | | $ | | 12,407,873 | | | | 111,831 | | $ | 1,046,389 | |
- 101 -
THE ALGER FUNDS II
NOTES TO FINANCIAL STATEMENTS (Continued)
(b) Redemption Fee: Prior to March 1, 2015, the Funds imposed a 2.00% redemption fee
on certain Class A and Class C shares redeemed (including shares redeemed by exchange)
within 30 days after such shares were acquired. Since March 1, 2015, the redemption fee is
no longer imposed.
NOTE 7 — Income Tax Information:
The tax character of distributions paid during the year ended October 31, 2016 and the year
ended October 31, 2015 were as follows:
| | | | | | |
| | FOR THE YEAR ENDED | | FOR THE YEAR ENDED | |
| | OCTOBER 31, 2016 | | OCTOBER 31, 2015 | |
| Alger Spectra Fund | | | | | | |
| Distributions paid from: | | | | | | |
| Ordinary Income | | — | | $ | 34,698,984 | |
| Long-term capital gain | $ | 460,707,023 | | | 528,595,355 | |
| Total distributions paid | $ | 460,707,023 | | $ | 563,294,339 | |
| |
| Alger Green Fund | | | | | | |
| Distributions paid from: | | | | | | |
| Ordinary Income | | — | | | — | |
| Long-term capital gain | | 1,122,971 | | | 2,195,126 | |
| Total distributions paid | $ | 1,122,971 | | $ | 2,195,126 | |
| |
| Alger Mid Cap Focus Fund | | | | | | |
| Distributions paid from: | | | | | | |
| Ordinary Income | | — | | | 79,338 | |
| Long-term capital gain | | 451,889 | | | 583,838 | |
| Total distributions paid | $ | 451,889 | | $ | 663,176 | |
| |
| Alger Dynamic Opportunities Fund | | | | | | |
| Distributions paid from: | | | | | | |
| Ordinary Income | | — | | | — | |
| Long-term capital gain | | 3,332,249 | | | 4,408,108 | |
| Total distributions paid | $ | 3,332,249 | | $ | 4,408,108 | |
| |
| Alger Emerging Markets Fund | | | | | | |
| Distributions paid from: | | | | | | |
| Ordinary Income | | 24,394 | | | — | |
| Long-term capital gain | | — | | | — | |
| Total distributions paid | $ | 24,394 | | | — | |
As of October 31, 2016 the components of accumulated gains (losses) on a tax basis were
as follows:
- 102 -
THE ALGER FUNDS II
NOTES TO FINANCIAL STATEMENTS (Continued)
| | | |
| Alger Spectra Fund | | | |
| Undistributed ordinary income | | — | |
| Undistributed long-term gains | $ | 102,502,427 | |
| Net accumulated earnings | | 102,502,427 | |
| Capital loss carryforwards | | — | |
| Late year ordinary income losses | | (8,041,051 | ) |
| Net unrealized appreciation | | 572,554,872 | |
| Total accumulated earnings | $ | 667,016,248 | |
| |
| Alger Green Fund | | | |
| Undistributed ordinary income | | — | |
| Undistributed long-term gains | | 2,579,793 | |
| Net accumulated earnings | | 2,579,793 | |
| Capital loss carryforwards | | — | |
| Late year ordinary income losses | | (42,150 | ) |
| Net unrealized appreciation | | 18,782,947 | |
| Total accumulated earnings | $ | 21,320,590 | |
| |
| Alger Mid Cap Focus Fund | | | |
| Undistributed ordinary income | | — | |
| Undistributed long-term gains | | — | |
| Net accumulated earnings | | — | |
| Capital loss carryforwards | | (113,611 | ) |
| Late year ordinary income losses | | (5,276 | ) |
| Net unrealized depreciation | | (50,232 | ) |
| Total accumulated losses | $ | (169,119 | ) |
| |
| Alger Dynamic Opportunities Fund | | | |
| Undistributed ordinary income | | — | |
| Undistributed long-term gains | | 247,957 | |
| Net accumulated earnings | | 247,957 | |
| Capital loss carryforwards | | — | |
| Late year ordinary income losses | | (1,202,959 | ) |
| Net unrealized appreciation | | 826,671 | |
| Total accumulated losses | $ | (128,331 | ) |
- 103 -
THE ALGER FUNDS II
NOTES TO FINANCIAL STATEMENTS (Continued)
| | | |
| Alger Emerging Markets Fund | | | |
| Undistributed ordinary income | | — | |
| Undistributed long-term gains | | — | |
| Net accumulated earnings | | — | |
| Capital loss carryforwards | | (5,105,361 | ) |
| Net unrealized appreciation | | 3,966,228 | |
| Total accumulated losses | $ | (1,139,133 | ) |
At October 31, 2016, the Alger Emerging Markets Fund, for federal income tax purposes,
had capital loss carryforwards as set forth in the table below. These amounts may be applied
against future net realized gains.
| | | | |
| | Alger Mid Cap | Alger Emerging |
| Expiration Dates | | Focus Fund | Markets Fund |
| POST ACT | $ | 113,611 | $ | 5,105,361 |
| Total | | 113,611 | | 5,105,361 |
Under the Regulated Investment Company Modernization Act of 2010, capital losses
incurred by the Funds after October 31, 2011 will not be subject to expiration. In addition,
losses incurred after October 31, 2011 must be utilized prior to the utilization of capital loss
carryforwards above.
The difference between book-basis and tax-basis unrealized appreciation (depreciation) is
determined annually and is attributable primarily to the tax deferral of losses on wash sales,
U.S. Internal Revenue Code Section 988 currency transactions, nondeductible expenses
on dividends sold short, the tax treatment of partnerships investments, the realization of
unrealized appreciation of passive foreign investment companies, and return of capital from
real estate investment trust investments.
Permanent differences, primarily from net operating losses and real estate investment trusts
and partnership investments sold by the Funds, resulted in the following reclassifications
among each Fund’s components of net assets at October 31, 2016:
| | | |
| Alger Spectra Fund | | | |
| Accumulated undistributed net investment income (accumulated loss) | $ | 15,159,550 | |
| Accumulated net realized gain (accumulated realized loss) | $ | 6,502,307 | |
| Paid-in Capital | $ | (21,661,857 | ) |
| |
| Alger Green Fund | | | |
| Accumulated undistributed net investment income (accumulated loss) | $ | (32,644 | ) |
| Accumulated net realized gain (accumulated realized loss) | $ | 66,420 | |
| Paid-in Capital | $ | (33,776 | ) |
- 104 -
THE ALGER FUNDS II
NOTES TO FINANCIAL STATEMENTS (Continued)
| | | |
| Alger Mid Cap Focus Fund | | | |
| Accumulated undistributed net investment income (accumulated loss) | $ | 73,578 | |
| Accumulated net realized gain (accumulated realized loss) | $ | 14,057 | |
| Paid-in Capital | $ | (87,635 | ) |
| |
| Alger Dynamic Opportunities Fund | | | |
| Accumulated undistributed net investment income (accumulated loss) | $ | 1,398,644 | |
| Accumulated net realized gain (accumulated realized loss) | $ | 117,150 | |
| Paid-in Capital | $ | (1,515,794 | ) |
| |
| Alger Emerging Markets Fund | | | |
| Accumulated undistributed net investment income (accumulated loss) | $ | 86,624 | |
| Accumulated net realized gain (accumulated realized loss) | $ | (79,607 | ) |
| Paid-in Capital | $ | (7,017 | ) |
NOTE 8 — Fair Value Measurements
The following is a summary of the inputs used as of October 31, 2016 in valuing the Funds’
investments carried at fair value on a recurring basis. Based upon the nature, characteristics,
and risks associated with their investments, the Funds have determined that presenting them
by security type and sector is appropriate.
| | | | | | | | | | | | | | |
| Alger Spectra Fund | | TOTAL FUND | | | | LEVEL 1 | | | LEVEL 2 | | | | LEVEL 3 | |
| COMMON STOCKS | | | | | | | | | | | | | | |
| Consumer Discretionary | $ | 864,252,862 | $ | 864,252,862 | | | — | | | | —* | |
| Consumer Staples | | 374,555,789 | | 374,555,789 | | | — | | | | — | |
| Energy | | 93,597,850 | | 93,597,850 | | | — | | | | — | |
| Financials | | 82,706,322 | | 82,706,322 | | | — | | | | — | |
| Health Care | | 791,388,480 | | 791,388,480 | | | — | | | | — | |
| Industrials | | 397,534,132 | | 397,534,132 | | | — | | | | — | |
| Information Technology | | 2,241,545,127 | | | 2,238,880,693 | | | — | | | 2,664,434 | |
| Materials | | 99,977,794 | | 99,977,794 | | | — | | | | — | |
| Telecommunication Services | | 21,878,342 | | 21,878,342 | | | — | | | | — | |
| TOTAL COMMON STOCKS | $ | 4,967,436,698 | $ | 4,964,772,264 | | | — | | $ | | 2,664,434 | |
| CORPORATE BONDS | | | | | | | | | | | | | | |
| Consumer Discretionary | | 838,287 | | | | — | | | — | | | 838,287 | |
| MASTER LIMITED PARTNERSHIP | | | | | | | | | | | | | | |
| Financials | | 40,538,488 | | 40,538,488 | | | — | | | | — | |
| PREFERRED STOCKS | | | | | | | | | | | | | | |
| Consumer Discretionary | | 2,221,727 | | | | — | | | — | | | 2,221,727 | * |
| Health Care | | 21,524,015 | | | | — | | | — | | 21,524,015 | |
| Information Technology | | 12,282,075 | | | | — | | | — | | 12,282,075 | |
| TOTAL PREFERRED STOCKS | $ | 36,027,817 | | | | — | | | — | | $ | | 36,027,817 | |
- 105 -
THE ALGER FUNDS II
NOTES TO FINANCIAL STATEMENTS (Continued)
| | | | | | | | | | | | | | | | |
| Alger Spectra Fund | | | | TOTAL FUND | | | | LEVEL 1 | | | LEVEL 2 | | | LEVEL 3 |
| REAL ESTATE INVESTMENT TRUST | | | | | | | | | | | | | | |
| Financials | | | | 29,574,724 | | 29,574,724 | | | | — | | | — |
| Real Estate | | | | 45,124,216 | | 45,124,216 | | | | — | | | — |
| TOTAL REAL ESTATE | | | | | | | | | | | | | | | | |
| INVESTMENT TRUST | | $ | 74,698,940 | | $ | | 74,698,940 | | | | — | | | — |
| SPECIAL PURPOSE VEHICLE | | | | | | | | | | | | | | | | |
| Financials | | | | | 2,821,272 | | | | — | | | | — | | 2,821,272 |
| WARRANTS | | | | | | | | | | | | | | | | |
| Consumer Discretionary | | | | | 821,521 | | | | — | | | | — | | 821,521 |
| TOTAL INVESTMENTS IN | | | | | | | | | | | | | | | | |
| SECURITIES | $ | 5,123,183,023 | $ | 5,080,009,692 | | | | — | $ | | 43,173,331 |
| SECURITIES SOLD SHORT | | | | | | | | | | | | | | | | |
| COMMON STOCKS | | | | | | | | | | | | | | | | |
| Consumer Discretionary | | | | 47,689,763 | | 47,689,763 | | | | — | | | — |
| Energy | | | | 32,845,161 | | 32,845,161 | | | | — | | | — |
| Financials | | | | | 5,787,257 | | | 5,787,257 | | | | — | | | — |
| Health Care | | | | 18,608,803 | | 18,608,803 | | | | — | | | — |
| Industrials | | | | 25,536,045 | | 25,536,045 | | | | — | | | — |
| Information Technology | | | | 22,651,068 | | 22,651,068 | | | | — | | | — |
| TOTAL COMMON STOCKS | | $ | 153,118,097 | | $ | | 153,118,097 | | | | — | | | — |
*Alger Spectra Fund’s shares of Choicestream Inc. common and preferred stock are
classified as a Level 3 investment and are fair valued at zero as of October 31, 2016.
| | | | | | | | | | | | | | |
| Alger Green Fund | | TOTAL FUND | | | | LEVEL 1 | | | LEVEL 2 | | | LEVEL 3 | |
| COMMON STOCKS | | | | | | | | | | | | | | |
| Consumer Discretionary | $ | 15,316,155 | $ | 15,316,155 | | | — | | | —** | |
| Consumer Staples | | | 3,941,656 | | | 3,941,656 | | | — | | | — | |
| Financials | | | 1,404,503 | | | 1,404,503 | | | — | | | — | |
| Health Care | | | 6,528,957 | | | 6,528,957 | | | — | | | — | |
| Industrials | | | 11,313,249 | | | 11,313,249 | | | — | | | — | |
| Information Technology | | 21,907,908 | | 21,907,908 | | | — | | | — | |
| Materials | | | 772,440 | | | 772,440 | | | — | | | — | |
| Telecommunication Services | | | 1,006,012 | | | 1,006,012 | | | — | | | — | |
| Utilities | | | 965,592 | | | 965,592 | | | — | | | — | |
| TOTAL COMMON STOCKS | | $ | 63,156,472 | | $ | | 63,156,472 | | | — | | | — | |
| CORPORATE BONDS | | | | | | | | | | | | | | |
| Consumer Discretionary | | | 10,518 | | | | — | | | — | | 10,518 | |
| PREFERRED STOCKS | | | | | | | | | | | | | | |
| Consumer Discretionary | | | 41,193 | | | | — | | | — | | 41,193 | ** |
| WARRANTS | | | | | | | | | | | | | | |
| Consumer Discretionary | | | 10,308 | | | | — | | | — | | 10,308 | |
| TOTAL INVESTMENTS IN | | | | | | | | | | | | | | |
| SECURITIES | | $ | 63,218,491 | | $ | | 63,156,472 | | | — | $ | | 62,019 | |
**Alger Green Fund’s shares of Choicestream Inc. common and preferred stock are
classified as a Level 3 investment and are fair valued at zero as of October 31, 2016.
- 106 -
THE ALGER FUNDS II
NOTES TO FINANCIAL STATEMENTS (Continued)
| | | | | | | | | | | | | | |
| Alger Mid Cap Focus Fund | | | TOTAL FUND | | | | LEVEL 1 | | | LEVEL 2 | | | LEVEL 3 |
| COMMON STOCKS | | | | | | | | | | | | | | |
| Consumer Discretionary | $ | 1,546,051 | | $ | 1,546,051 | | | — | | | — |
| Consumer Staples | | | | 233,686 | | | 233,686 | | | — | | | — |
| Financials | | | | 121,663 | | | 121,663 | | | — | | | — |
| Health Care | | | | 1,359,392 | | | 1,359,392 | | | — | | | — |
| Industrials | | | | 1,408,158 | | | 1,408,158 | | | — | | | — |
| Information Technology | | | | 1,628,176 | | | 1,628,176 | | | — | | | — |
| Materials | | | | 424,751 | | | 424,751 | | | — | | | — |
| TOTAL COMMON STOCKS | $ | 6,721,877 | | $ | | 6,721,877 | | | — | | | — |
| MASTER LIMITED PARTNERSHIP | | | | | | | | | | | | | | |
| Financials | | | | 102,948 | | | 102,948 | | | — | | | — |
| REAL ESTATE INVESTMENT TRUST | | | | | | | | | | | |
| Financials | | | | 177,969 | | | 177,969 | | | — | | | — |
| Real Estate | | | | 268,329 | | | 268,329 | | | — | | | — |
| TOTAL REAL ESTATE | | | | | | | | | | | | | | |
| INVESTMENT TRUST | $ | 446,298 | | $ | | 446,298 | | | — | | | — |
| TOTAL INVESTMENTS IN | | | | | | | | | | | | | | |
| SECURITIES | $ | 7,271,123 | | $ | | 7,271,123 | | | — | | | — |
| |
| |
| Alger Dynamic Opportunities Fund | | | TOTAL FUND | | | | LEVEL 1 | | | LEVEL 2 | | | LEVEL 3 |
| COMMON STOCKS | | | | | | | | | | | | | | |
| Consumer Discretionary | $ | 9,595,107 | | $ | 9,595,107 | | | — | | | — |
| Consumer Staples | | | | 4,139,848 | | | 4,139,848 | | | — | | | — |
| Energy | | | | 972,810 | | | 972,810 | | | — | | | — |
| Financials | | | | 3,355,573 | | | 3,355,573 | | | — | | | — |
| Health Care | | | 12,413,525 | | 12,413,525 | | | — | | | — |
| Industrials | | | | 2,505,539 | | | 2,505,539 | | | — | | | — |
| Information Technology | | | | 24,211,127 | | 23,798,439 | | 362,152 | | 50,536 |
| TOTAL COMMON STOCKS | $ | 57,193,529 | | $ | | 56,780,841 | $ | | 362,152 | $ | | 50,536 |
| MASTER LIMITED PARTNERSHIP | | | | | | | | | | | | | | |
| Financials | | | | 1,031,461 | | | 1,031,461 | | | — | | | — |
| PREFERRED STOCKS | | | | | | | | | | | | | | |
| Health Care | | | | 473,290 | | | | — | | | — | | 473,290 |
| Information Technology | | | | 232,950 | | | | — | | | — | | 232,950 |
| TOTAL PREFERRED STOCKS | $ | 706,240 | | | | — | | | — | $ | | 706,240 |
| PURCHASED OPTIONS | | | | | | | | | | | | | | |
| Information Technology | | | | 13,601 | | | 13,601 | | | — | | | — |
| Market Indices | | | | 62,000 | | | 62,000 | | | — | | | — |
| TOTAL PURCHASED OPTIONS | $ | 75,601 | | $ | | 75,601 | | | — | | | — |
| REAL ESTATE INVESTMENT TRUST | | | | | | | | | | | | | |
| Financials | | | | 483,834 | | | 483,834 | | | — | | | — |
| Real Estate | | | | 2,869,209 | | | 2,869,209 | | | — | | | — |
| TOTAL REAL ESTATE | | | | | | | | | | | | | | |
| INVESTMENT TRUST | $ | 3,353,043 | | $ | | 3,353,043 | | | — | | | — |
- 107 -
THE ALGER FUNDS II
NOTES TO FINANCIAL STATEMENTS (Continued)
| | | | | | | | | | | | | | |
| Alger Dynamic Opportunities Fund | | | TOTAL FUND | | | LEVEL 1 | | | | LEVEL 2 | | | LEVEL 3 |
| RIGHTS | | | | | | | | | | | | | | |
| Health Care | | | | — | | | — | | | | — | | | —*** |
| SPECIAL PURPOSE VEHICLE | | | | | | | | | | | | | | |
| Financials | | | | 165,437 | | | — | | | | — | | 165,437 |
| U.S. GOVERNMENT AGENCY OBLIGATIONS (EXCLUDING MORTGAGE-BACKED) | | | |
| Financials | | | 29,996,464 | | | — | | 29,996,464 | | | — |
| TOTAL INVESTMENTS IN | | | | | | | | | | | | | | |
| SECURITIES | $ | 92,521,775 | $ | | 61,240,946 | | $ | | 30,358,616 | $ | | 922,213 |
| SECURITIES SOLD SHORT | | | | | | | | | | | | | | |
| COMMON STOCKS | | | | | | | | | | | | | | |
| Consumer Discretionary | | | | 4,037,396 | | 4,037,396 | | | | — | | | — |
| Consumer Staples | | | | 187,138 | | 187,138 | | | | — | | | — |
| Energy | | | | 731,880 | | 731,880 | | | | — | | | — |
| Financials | | | | 1,916,762 | | 1,916,762 | | | | — | | | — |
| Health Care | | | | 2,910,491 | | 2,910,491 | | | | — | | | — |
| Industrials | | | | 1,655,460 | | 1,655,460 | | | | — | | | — |
| Information Technology | | | | 4,421,503 | | 4,421,503 | | | | — | | | — |
| Market Indices | | | | 1,083,235 | | 1,083,235 | | | | — | | | — |
| Materials | | | | 260,454 | | 260,454 | | | | — | | | — |
| Utilities | | | | 278,138 | | 278,138 | | | | — | | | — |
| TOTAL COMMON STOCKS | $ | 17,482,457 | $ | | 17,482,457 | | | | — | | | — |
| REAL ESTATE INVESTMENT TRUST | | | | | | | | | | | | | |
| Financials | | | | 687,349 | | 687,349 | | | | — | | | — |
| TOTAL SECURITIES SOLD SHORT $ | 18,169,806 | $ | | 18,169,806 | | | | — | | | — |
***Alger Dynamic Opportunities Fund’s holdings of Adolor Corp.’s rights are classified as
a Level 3 investment and fair valued at zero as of October 31, 2016.
| | | | | | | | | | |
| Alger Emerging Markets Fund | TOTAL FUND | | LEVEL 1 | | | LEVEL 2 | | | LEVEL 3 |
| COMMON STOCKS | | | | | | | | | | |
| Consumer Discretionary | $ | 5,072,210 | $ | 1,024,101 | $ | | 4,048,109 | | | — |
| Consumer Staples | | 3,047,901 | | 943,938 | | 2,103,963 | | | — |
| Energy | | 1,472,019 | | — | | 1,472,019 | | | — |
| Financials | | 8,186,016 | | 2,886,993 | | 5,299,023 | | | — |
| Health Care | | 2,589,922 | | 343,057 | | 2,246,865 | | | — |
| Industrials | | 3,307,577 | | 842,778 | | 2,464,799 | | | — |
| Information Technology | | 9,666,088 | | 2,581,202 | | 7,084,886 | | | — |
| Materials | | 3,411,545 | | 848,969 | | 2,562,576 | | | — |
| Telecommunication Services | | 1,243,115 | | 281,579 | | 961,536 | | | — |
| Utilities | | 713,572 | | 377,702 | | 335,870 | | | — |
| TOTAL COMMON STOCKS | $ | 38,709,965 | $ | 10,130,319 | $ | | 28,579,646 | | | — |
| PREFERRED STOCKS | | | | | | | | | | |
| Energy | | 396,362 | | 396,362 | | | — | | | — |
| SPECIAL PURPOSE VEHICLE | | | | | | | | | | |
| Financials | | 44,932 | | — | | | — | | 44,932 |
| TOTAL INVESTMENTS IN | | | | | | | | | | |
| SECURITIES | $ | 39,151,259 | $ | 10,526,681 | $ | | 28,579,646 | $ | | 44,932 |
- 108 -
THE ALGER FUNDS II
NOTES TO FINANCIAL STATEMENTS (Continued)
| | | |
| | | FAIR VALUE | |
| | MEASUREMENTS | |
| | USING SIGNIFICANT | |
| | UNOBSERVABLE | |
| | INPUTS (LEVEL 3) | |
| Alger Spectra Fund | Common Stocks | |
| Opening balance at November 1, 2015 | $ | 3,209,511 | |
| Transfers into Level 3 | | – | |
| Transfers out of Level 3 | | – | |
| Total gains or losses | | | |
| Included in net realized gain (loss) on investments | | – | |
| Included in net unrealized gain (loss) on investments | | (545,077 | ) |
| Purchases and sales | | – | |
| Purchases | | – | |
| Sales | | – | |
| Closing balance at October 31, 2016 | | 2,664,434 | |
| The amount of total gains or losses for the period included in net realized | | | |
| and unrealized gain (loss) attributable to change in unrealized appreciation | | | |
| (depreciation) relating to investments still held at 10/31/2016 | $ | (545,077 | ) |
| |
| Alger Spectra Fund | Corporate Bonds | |
| Opening balance at November 1, 2015 | $ | – | |
| Transfers into Level 3 | | – | |
| Transfers out of Level 3 | | – | |
| Total gains or losses | | | |
| Included in net realized gain (loss) on investments | | – | |
| Included in net unrealized gain (loss) on investments | | 837,451 | |
| Purchases and sales | | – | |
| Purchases | | 836 | |
| Sales | | – | |
| Closing balance at October 31, 2016 | | 838,287 | |
| The amount of total gains or losses for the period included in net realized | | | |
| and unrealized gain (loss) attributable to change in unrealized appreciation | | | |
| (depreciation) relating to investments still held at 10/31/2016 | $ | 837,451 | |
- 109 -
THE ALGER FUNDS II
NOTES TO FINANCIAL STATEMENTS (Continued)
| | | |
| | | FAIR VALUE | |
| | MEASUREMENTS | |
| | USING SIGNIFICANT | |
| | UNOBSERVABLE | |
| | INPUTS (LEVEL 3) | |
| Alger Spectra Fund | Preferred Stocks | |
| Opening balance at November 1, 2015 | $ | 36,227,853 | |
| Transfers into Level 3 | | – | |
| Transfers out of Level 3 | | – | |
| Total gains or losses | | | |
| Included in net realized gain (loss) on investments | | – | |
| Included in net unrealized gain (loss) on investments | | (200,036 | ) |
| Purchases and sales | | – | |
| Purchases | | – | |
| Sales | | – | |
| Closing balance at October 31, 2016 | | 36,027,817 | |
| The amount of total gains or losses for the period included in net realized | | | |
| and unrealized gain (loss) attributable to change in unrealized appreciation | | | |
| (depreciation) relating to investments still held at 10/31/2016 | $ | (200,036 | ) |
| |
| | Special Purpose | |
| Alger Spectra Fund | | Vehicle | |
| Opening balance at November 1, 2015 | $ | 2,715,111 | |
| Transfers into Level 3 | | – | |
| Transfers out of Level 3 | | – | |
| Total gains or losses | | | |
| Included in net realized gain (loss) on investments | | – | |
| Included in net unrealized gain (loss) on investments | | 106,161 | |
| Purchases and sales | | – | |
| Purchases | | – | |
| Sales | | – | |
| Closing balance at October 31, 2016 | | 2,821,272 | |
| The amount of total gains or losses for the period included in net realized | | | |
| and unrealized gain (loss) attributable to change in unrealized appreciation | | | |
| (depreciation) relating to investments still held at 10/31/2016 | $ | 106,161 | |
- 110 -
THE ALGER FUNDS II
NOTES TO FINANCIAL STATEMENTS (Continued)
| | | |
| | | FAIR VALUE | |
| | MEASUREMENTS | |
| | USING SIGNIFICANT | |
| | UNOBSERVABLE | |
| | INPUTS (LEVEL 3) | |
| Alger Spectra Fund | | Warrants | |
| Opening balance at November 1, 2015 | $ | – | |
| Transfers into Level 3 | | – | |
| Transfers out of Level 3 | | – | |
| Total gains or losses | | | |
| Included in net realized gain (loss) on investments | | – | |
| Included in net unrealized gain (loss) on investments | | (15,927 | ) |
| Purchases and sales | | – | |
| Purchases | | 837,448 | |
| Sales | | – | |
| Closing balance at October 31, 2016 | | 821,521 | |
| The amount of total gains or losses for the period included in net realized | | | |
| and unrealized gain (loss) attributable to change in unrealized appreciation | | | |
| (depreciation) relating to investments still held at 10/31/2016 | $ | (15,927 | ) |
| |
| | | FAIR VALUE | |
| | MEASUREMENTS | |
| | USING SIGNIFICANT | |
| | UNOBSERVABLE | |
| | INPUTS (LEVEL 3) | |
| Alger Green Fund | Common Stocks | |
| Opening balance at November 1, 2015 | $ | 1,520 | |
| Transfers into Level 3 | | – | |
| Transfers out of Level 3 | | – | |
| Total gains or losses | | | |
| Included in net realized gain (loss) on investments | | – | |
| Included in net unrealized gain (loss) on investments | | (1,520 | ) |
| Purchases and sales | | – | |
| Purchases | | – | |
| Sales | | – | |
| Closing balance at October 31, 2016 | | – | |
| The amount of total gains or losses for the period included in net realized | | | |
| and unrealized gain (loss) attributable to change in unrealized appreciation | | | |
| (depreciation) relating to investments still held at 10/31/2016 | $ | (1,520 | ) |
- 111 -
THE ALGER FUNDS II
NOTES TO FINANCIAL STATEMENTS (Continued)
| | | |
| | | FAIR VALUE | |
| | MEASUREMENTS | |
| | USING SIGNIFICANT | |
| | UNOBSERVABLE | |
| | INPUTS (LEVEL 3) | |
| Alger Green Fund | Corporate Bonds | |
| Opening balance at November 1, 2015 | $ | – | |
| Transfers into Level 3 | | – | |
| Transfers out of Level 3 | | – | |
| Total gains or losses | | | |
| Included in net realized gain (loss) on investments | | – | |
| Included in net unrealized gain (loss) on investments | | 10,507 | |
| Purchases and sales | | – | |
| Purchases | | 11 | |
| Sales | | – | |
| Closing balance at October 31, 2016 | | 10,518 | |
| The amount of total gains or losses for the period included in net realized | | | |
| and unrealized gain (loss) attributable to change in unrealized appreciation | | | |
| (depreciation) relating to investments still held at 10/31/2016 | $ | 10,507 | |
| |
| Alger Green Fund | Preferred Stocks | |
| Opening balance at November 1, 2015 | $ | 42,434 | |
| Transfers into Level 3 | | – | |
| Transfers out of Level 3 | | – | |
| Total gains or losses | | | |
| Included in net realized gain (loss) on investments | | – | |
| Included in net unrealized gain (loss) on investments | | (1,241 | ) |
| Purchases and sales | | – | |
| Purchases | | – | |
| Sales | | – | |
| Closing balance at October 31, 2016 | | 41,193 | |
| The amount of total gains or losses for the period included in net realized | | | |
| and unrealized gain (loss) attributable to change in unrealized appreciation | | | |
| (depreciation) relating to investments still held at 10/31/2016 | $ | (1,241 | ) |
- 112 -
THE ALGER FUNDS II
NOTES TO FINANCIAL STATEMENTS (Continued)
| | | |
| | | FAIR VALUE | |
| | MEASUREMENTS | |
| | USING SIGNIFICANT | |
| | UNOBSERVABLE | |
| | INPUTS (LEVEL 3) | |
| Alger Green Fund | | Warrants | |
| Opening balance at November 1, 2015 | $ | – | |
| Transfers into Level 3 | | – | |
| Transfers out of Level 3 | | – | |
| Total gains or losses | | | |
| Included in net realized gain (loss) on investments | | – | |
| Included in net unrealized gain (loss) on investments | | (200 | ) |
| Purchases and sales | | – | |
| Purchases | | 10,508 | |
| Sales | | – | |
| Closing balance at October 31, 2016 | | 10,308 | |
| The amount of total gains or losses for the period included in net realized | | | |
| and unrealized gain (loss) attributable to change in unrealized appreciation | | | |
| (depreciation) relating to investments still held at 10/31/2016 | $ | (200 | ) |
| |
| | | FAIR VALUE | |
| | MEASUREMENTS | |
| | USING SIGNIFICANT | |
| | UNOBSERVABLE | |
| | INPUTS (LEVEL 3) | |
| Alger Dynamic Opportunities Fund | Common Stocks | |
| Opening balance at November 1, 2015 | $ | 59,454 | |
| Transfers into Level 3 | | – | |
| Transfers out of Level 3 | | – | |
| Total gains or losses | | | |
| Included in net realized gain (loss) on investments | | – | |
| Included in net unrealized gain (loss) on investments | | (8,918 | ) |
| Purchases and sales | | – | |
| Purchases | | – | |
| Sales | | – | |
| Closing balance at October 31, 2016 | | 50,536 | |
| The amount of total gains or losses for the period included in net realized | | | |
| and unrealized gain (loss) attributable to change in unrealized appreciation | | | |
| (depreciation) relating to investments still held at 10/31/2016 | $ | (8,918 | ) |
- 113 -
THE ALGER FUNDS II
NOTES TO FINANCIAL STATEMENTS (Continued)
| | | |
| | | FAIR VALUE | |
| | MEASUREMENTS | |
| | USING SIGNIFICANT | |
| | UNOBSERVABLE | |
| | INPUTS (LEVEL 3) | |
| Alger Dynamic Opportunities Fund | Preferred Stocks | |
| Opening balance at November 1, 2015 | $ | 892,192 | |
| Transfers into Level 3 | | – | |
| Transfers out of Level 3 | | – | |
| Total gains or losses | | | |
| Included in net realized gain (loss) on investments | | – | |
| Included in net unrealized gain (loss) on investments | | (185,952 | ) |
| Purchases and sales | | – | |
| Purchases | | – | |
| Sales | | – | |
| Closing balance at October 31, 2016 | | 706,240 | |
| The amount of total gains or losses for the period included in net realized | | | |
| and unrealized gain (loss) attributable to change in unrealized appreciation | | | |
| (depreciation) relating to investments still held at 10/31/2016 | $ | (185,952 | ) |
| |
| Alger Dynamic Opportunities Fund | | Rights | |
| Opening balance at November 1, 2015 | $ | –* | |
| Transfers into Level 3 | | – | |
| Transfers out of Level 3 | | – | |
| Total gains or losses | | | |
| Included in net realized gain (loss) on investments | | – | |
| Included in net unrealized gain (loss) on investments | | – | |
| Purchases and sales | | – | |
| Purchases | | – | |
| Sales | | – | |
| Closing balance at October 31, 2016 | | – | |
| The amount of total gains or losses for the period included in net realized | | | |
| and unrealized gain (loss) attributable to change in unrealized appreciation | | | |
| (depreciation) relating to investments still held at 10/31/2016 | $ | –* | |
| *Alger Dynamic Opportunities Fund’s Level 3 rights are fair valued at zero at the beginning and | | | |
| ending of the period. | | | |
- 114 -
THE ALGER FUNDS II
NOTES TO FINANCIAL STATEMENTS (Continued)
| | | |
| | | FAIR VALUE | |
| | MEASUREMENTS | |
| | USING SIGNIFICANT | |
| | UNOBSERVABLE | |
| | INPUTS (LEVEL 3) | |
| | Special Purpose | |
| Alger Dynamic Opportunities Fund | | Vehicle | |
| Opening balance at November 1, 2015 | $ | 159,212 | |
| Transfers into Level 3 | | – | |
| Transfers out of Level 3 | | – | |
| Total gains or losses | | | |
| Included in net realized gain (loss) on investments | | – | |
| Included in net unrealized gain (loss) on investments | | 6,225 | |
| Purchases and sales | | – | |
| Purchases | | – | |
| Sales | | – | |
| Closing balance at October 31, 2016 | | 165,437 | |
| The amount of total gains or losses for the period included in net realized | | | |
| and unrealized gain (loss) attributable to change in unrealized appreciation | | | |
| (depreciation) relating to investments still held at 10/31/2016 | $ | 6,225 | |
| |
| | | FAIR VALUE | |
| | MEASUREMENTS | |
| | USING SIGNIFICANT | |
| | UNOBSERVABLE | |
| | INPUTS (LEVEL 3) | |
| | Special Purpose | |
| Alger Emerging Markets Fund | | Vehicle | |
| Opening balance at November 1, 2015 | $ | 43,241 | |
| Transfers into Level 3 | | – | |
| Transfers out of Level 3 | | – | |
| Total gains or losses | | | |
| Included in net realized gain (loss) on investments | | – | |
| Included in net unrealized gain (loss) on investments | | 1,691 | |
| Purchases and sales | | – | |
| Purchases | | – | |
| Sales | | – | |
| Closing balance at October 31, 2016 | | 44,932 | |
| The amount of total gains or losses for the period included in net realized | | | |
| and unrealized gain (loss) attributable to change in unrealized appreciation | | | |
| (depreciation) relating to investments still held at 10/31/2016 | $ | 1,691 | |
The following table provides quantitative information about our Level 3 fair value
measurements of our investments as of October 31, 2016. In addition to the techniques
and inputs noted in the table below, according to our valuation policy we may also use other
valuation techniques and methodologies when determining our fair value measurements.
- 115 -
THE ALGER FUNDS II
NOTES TO FINANCIAL STATEMENTS (Continued)
The table below is not intended to be all-inclusive, but rather provides information on the
Level 3 inputs as they relate to our fair value measurements.
| | | | | | | |
| | | Fair Value | | | | | |
| | | October 31, | Valuation | Unobservable | | | Weighted |
| | | 2016 | Methodology | Input | Input/Range | | Average Inputs |
| Alger Spectra Fund | | | | | | | |
| Common Stocks | $ | - | Income | Discount Rate | 40% | | N/A |
| Approach | | | | |
| Common Stocks | | 2,664,434 | Income | Revenue Multiple | 10x-18x | | N/A |
| | | | Approach | Discount Rate | 20% | | |
| | | | | Scenario | 10-50% | | |
| | | | | Probability | | | |
| | | | | Time to Exit | 1.3-3.3Years | | |
| Preferred Stocks | | 2,221,727 | Income | Discount Rate | 40% | | N/A |
| Approach | | | | |
| Preferred Stocks | | 11,764,528 | Income | Discount Rate | 35.5-39.5% | | N/A |
| Approach | | | | |
| Preferred Stocks | | 12,282,075 | Income | Revenue Multiple | 10x-18x | | N/A |
| | | | Approach | Discount Rate | 20% | | |
| | | | | Scenario | 10-50% | | |
| | | | | Probability | | | |
| | | | | Time to Exit | 1.3-3.3Years | | |
| Preferred Stocks | | 9,759,487 | Market Approach | Scenario | 80 to 100% | | N/A |
| | | | | Probability | | | |
| | | | | Time to Exit | 1.0-2.5Years | | |
| | | | | Volatility | 67.8% | | |
| Warrants | | 821,521 | Income | Discount Rate | 40% | | N/A |
| Approach | | | | |
| Corporate Bonds | | 838,287 | Income | Discount Rate | 40% | | N/A |
| Approach | | | | |
| Special Purpose Vehicle | | 2,821,272 | Market Approach | Revenue Multiple | 2.6x-3.1x | | N/A |
| |
| Alger Green Fund | | | | | | | |
| Common Stocks | $ | - | Income | Discount Rate | 40% | | N/A |
| Approach | | | | |
| Preferred Stocks | | 41,193 | Income | Discount Rate | 40% | | N/A |
| Approach | | | | |
| Warrants | | 10,308 | Income | Discount Rate | 40% | | N/A |
| | | | | | Approach | | | | |
| Corporate Bonds | | 10,518 | Income | Discount Rate | 40% | | N/A |
| Approach | | | | |
| Alger Dynamic Opportunities Fund | | | | | |
| Common Stocks | $ | 50,536 | Income | Revenue Multiple | 10x-18x | | N/A |
| | | | Approach | Discount Rate | 20% | | |
| | | | | Scenario | 10-50% | | |
| | | | | Probability | | | |
| | | | | Time to Exit | 1.3-3.3Years | | |
| Preferred Stocks | | 232,950 | Income | Revenue Multiple | 10x-18x | | N/A |
| | | | Approach | Discount Rate | 20% | | |
| | | | | Scenario | 10-50% | | |
| | | | | Probability | | | |
- 116 -
THE ALGER FUNDS II
NOTES TO FINANCIAL STATEMENTS (Continued)
| | | | | | | |
| | | | Time to Exit | 1.3-3.3 Years | | | |
| Preferred Stocks | 304,223 | Income | Discount Rate | 20.5-39.5% | | 30.08 | % |
| Approach | | | | | |
| |
| |
| Preferred Stocks | 169,067 | Market Approach | Scenario | 80 to 100% | | N/A | |
| | | | Probability | | | | |
| | | | Time to Exit | 1.0-2.5 Years | | | |
| | | | Volatility | 67.8% | | | |
| Rights | - | Income | Probability of | 0% | | | |
| | | Approach | Success | | | | |
| Special Purpose Vehicle | 165,437 | Market Approach | Revenue Multiple | 2.6x-3.1x | | N/A | |
| |
| Alger Emerging Markets Fund | | | | | | | |
| Special Purpose Vehicle | 44,932 | Market Approach | Revenue Multiple | 2.6x-3.1x | | N/A | |
The significant unobservable inputs used in the fair value measurement of the Fund’s
securities are revenue and EBITDA multiples, discount rates, and the probabilities of
success of certain outcomes. Significant increases and decreases in these inputs in isolation
and interrelationships between those inputs could result in significantly higher or lower fair
value measurements than those noted in the table above.
On October 31, 2016, there were no transfers of securities between Level 1 and Level 2.
Certain of the Funds’ assets and liabilities are held at carrying amount or face value, which
approximates fair value for financial statement purposes. As of October 31, 2016, such
assets are categorized within the ASC 820 disclosure hierarchy as follows:
| | | | | | | | | | | | | |
| | | TOTAL FUND | | LEVEL 1 | | | LEVEL 2 | | | LEVEL 3 |
| Cash, Foreign cash and Cash equivalents: | | | | | | | | | | | | | |
| Alger Spectra Fund | $ | 152,679,641 | $ | 85,511,422 | | $ | 67,168,219 | | | | — |
| Alger Green Fund | | | 2,149,409 | | | — | | | 2,149,409 | | | | — |
| Alger Mid Cap Focus Fund | | | 734,722 | | | — | | | 734,722 | | | | — |
| Alger Dynamic Opportunities Fund | | | 8,304,197 | | 6,702,362 | | | 1,601,835 | | | | — |
| Alger Emerging Markets Fund | | | 1,612,528 | | | 499,398 | | | 1,113,130 | | | | — |
NOTE 9 — Derivatives:
Financial Accounting Standards Board Accounting Standards Codification 815 – Derivatives
and Hedging (“ASC 815”) requires qualitative disclosures about objectives and strategies for
using derivatives, quantitative disclosures about fair value amounts of and gains and losses
on derivative instruments, and disclosures about credit-risk-related contingent features in
derivative agreements.
Options—The Funds seek to capture the majority of the returns associated with equity
market investments. To meet this investment goal, the Funds invest in a broadly diversified
portfolio of common stocks, while also buying and selling call and put options on equities
and equity indices. The Funds purchase call options to increase their exposure to the stock
- 117 -
THE ALGER FUNDS II
NOTES TO FINANCIAL STATEMENTS (Continued)
market and also provide diversification of risk. The Funds purchase put options in order
to protect from significant market declines that may occur over a short period of time. The
Funds will write covered call and cash secured put options to generate cash flows while
reducing the volatility of the Funds’ portfolios. The cash flows may be an important source
of the Funds’ returns, although written call options may reduce the Funds’ ability to profit
from increases in the value of the underlying security or equity portfolio. The value of a
call option generally increases as the price of the underlying stock increases and decreases
as the stock decreases in price. Conversely, the value of a put option generally increases
as the price of the underlying stock decreases and decreases as the stock increases in price.
The combination of the diversified stock portfolio and the purchase and sale of options
is intended to provide the Funds with the majority of the returns associated with equity
market investments but with reduced volatility and returns that are augmented with the cash
flows from the sale of options. During the year ended October 31, 2016, options were used
in accordance with these objectives.
The Funds’ option contracts were not subject to any rights of offset with any counterparty.
All of the Funds’ options were exchange traded which utilize a clearing house that acts as an
intermediary between buyer and seller, receiving initial and maintenance margin from both,
and guaranteeing performance of the option contract.
| | | | | |
| | ASSET DERIVATIVES 2016 | LIABILITY DERIVATIVES 2016 |
| Alger Dynamic Opportunities Fund | | | | |
| Derivatives not accounted | Balance Sheet | | | Balance Sheet | |
| for as hedging instruments | Location | | Fair Value | Location | Fair Value |
| | Investments in | | | - | $ – |
| Purchased Put Options | Securities, at value | $ | 62,000 | | |
| | Investments in | | | - | – |
| Purchased Call Options | Securities, at value | | 13,601 | | |
| Total | | $ | 75,601 | | $ - |
For the year ended October 31, 2016, Alger Dynamic Opportunities Fund had option
purchases of $513,731 and option sales of $201,991. The effect of derivative instruments
on the accompanying Statement of Operations for the year ended October 31, 2016, is as
follows:
| | | |
| NET REALIZED LOSS ON INVESTMENTS AND OPTIONS | |
| Alger Dynamic Opportunities Fund | | | |
| Derivatives not accounted for as hedging instruments | | Options | |
| Purchased Options | $ | (160,265 | ) |
| Total | $ | (160,265 | ) |
- 118 -
THE ALGER FUNDS II
NOTES TO FINANCIAL STATEMENTS (Continued)
| | | |
| NET CHANGE IN UNREALIZED DEPRECIATION ON INVESTMENTS, OPTIONS | |
| Alger Dynamic Opportunities Fund | | | |
| Derivatives not accounted for as hedging instruments | | Options | |
| Purchased Options | $ | (75,874 | ) |
| Written Options | | — | |
| Total | $ | (75,874 | ) |
NOTE 10 — Principal Risks:
As of October 31, 2016, the Funds invested a significant portion of their assets in securities
in the financials and information technology sectors. Changes in economic conditions
affecting such sectors would have a greater impact on the Funds and could affect the value,
income and/or liquidity of positions in such securities.
In the normal course of business, the Funds invest in securities and enter into transactions
where risks exist due to fluctuations in the market (market risk) or failure of the issuer
of a security to meet all its obligations (issuer credit risk). The value of securities held by
the Funds may decline in response to certain events, including those directly involving the
issuers whose securities are owned by the Funds; conditions affecting the general economy;
overall market changes; local, regional or global political, social or economic instability; and
currency and interest rate and price fluctuations. Similar to issuer credit risk, the Funds may
be exposed to counterparty credit risk, or the risk that an entity with which the Funds have
unsettled or open transactions may fail to or be unable to perform on its commitments. The
Funds manage counterparty credit risk by entering into transactions only with counterparties
that they believe have the financial resources to honor their obligations and by monitoring
the financial stability of those counterparties. Financial assets, which potentially expose
the Funds to market, issuer and counterparty credit risks, consist principally of financial
instruments and receivables due from counterparties. The extent of the Funds’ exposure to
market, issuer and counterparty credit risks with respect to these financial assets is generally
approximated by its value recorded in the Statement of Assets and Liabilities, less any
collateral held by the Funds.
The Funds invest in companies that are not yet available in the public markets and that are
accessible only through private equity investments. The Funds may also invest in venture
capital or private equity funds, direct private equity investments and other investments that
may have limited liquidity. There may be no trading market for these securities, and their sale
or transfer be limited or prohibited by contract or legal requirements, or may be dependent
on an exit strategy, such as an initial public offering or the sale of a business, which may
not occur, or may be dependent on managerial assistance provided by other investors and
their willingness to provide additional financial support. The securities may be able to be
liquidated, if at all, at disadvantageous prices. As a result, the Funds may be required to hold
these positions for several years, if not longer, regardless of adverse price movements. Such
positions may cause the Funds to be less liquid than would otherwise be the case.
- 119 -
THE ALGER FUNDS II
NOTES TO FINANCIAL STATEMENTS (Continued)
NOTE 11 — Affiliated Securities:
The issuers of the securities listed below are deemed to be affiliates of the Funds because
the Funds or their affiliates owned 5% or more of the issuer’s voting securities during all
or part of the year ended October 31, 2016. Purchase and sale transactions and dividend
income earned during the period were as follows:
| | | | | | | | | |
| | | Shares/ | | | Shares/Par | | | | |
| | | Par at | | | at | | Realized | | Value at |
| | | October | Purchases/ | Sales/ | October | | Gain | | October 31, |
| Security | | 31, 2015 | Conversion | Conversion | 31, 2016 | Interest Income | (Loss) | | 2016 |
| Alger Spectra Fund | | | | | | | | | |
| Common Stocks | | | | | | | | | |
| Choicestream, Inc.* | | 178,292 | – | – | 178,292 | – | – | $ | 0 |
| Preferred Stocks | | | | | | | | | |
| Choicestream, | | | | | | | | | |
| Inc.Series A and B* | | 5,303,067 | – | – | 5,303,067 | – | – | | 2,221,727 |
| Prosetta Biosciences, | | | | | | | | | |
| Inc., Series D* | | 2,912,012 | — | – | 2,912,012 | – | – | | 11,764,528 |
| Corporate Bonds | | | | | | | | | |
| Choicestream, Inc., | | | | | | | | | |
| 11.0%, 8/05/18 | | – | 838,287 | – | 838,287 | 7,579 | – | | 838,287 |
| Warrants | | | | | | | | | |
| Choicestream, Inc., | | | | | | | | | |
| 6/22/26* | | – | 838,287 | – | 838,287 | – | – | | 821,521 |
| Alger Green Fund | | | | | | | | | |
| Common Stocks | | | | | | | | | |
| Choicestream, Inc.* | | 3,619 | – | – | 3,619 | – | – | | 0 |
| Preferred Stocks | | | | | | | | | |
| Choicestream, Inc. | | | | | | | | | |
| Series A and B* | | 101,034 | – | – | 101,034 | – | – | | 41,193 |
| Corporate Bonds | | | | | | | | | |
| Choicestream, Inc., | | | | | | | | | |
| 11.0%, 8/05/18 | | – | 10,518, | – | 10,518 | 95 | – | | 10,518 |
| Warrants | | | | | | | | | |
| Choicestream, Inc., | | | | | | | | | |
| 6/22/26* | | – | 10,518 | – | 10,518 | – | – | | 10,308 |
| Alger Dynamic | | | | | | | | | |
| Opportunities Fund | | | | | | | | | |
| Preferred Stocks | | | | | | | | | |
| Prosetta Biosciences, | | | | | | | | | |
| Inc., Series D* | | 41,418 | — | – | 41,418 | – | – | | 167,328 |
| Tolero | | | | | | | | | |
| Pharmaceuticals, Inc. | | | | | | | | | |
| Series A and B* | | 106,120 | – | – | 106,120 | – | – | | 136,895 |
| |
| * Non-income producing security. | | | | | | |
- 120 -
THE ALGER FUNDS II
NOTES TO FINANCIAL STATEMENTS (Continued)
NOTE 12 — Subsequent Events:
Management of each Fund has evaluated events that have occurred subsequent to October
31, 2016 through the issuance date of the Financial Statements. No such events have been
identified which require recognition and disclosure other than the Board of Trustees of The
Alger Fund’s II approval of changes with respect to Alger Green Fund (the “Fund”) that
are anticipated to become effective on or about December 30, 2016. The Fund’s principal
investment strategy will expand from focusing exclusively on environmental sustainability
criteria to considering social and governance criteria as well. In addition, the Fund’s name
will change from Alger Green Fund to Alger Responsible Investing Fund. The Fund’s
investment objective to seek long-term capital appreciation will not change.
- 121 -
REPORT OF INDEPENDENT REGISTERED PUBLIC ACCOUNTING FIRM
To the Board of Trustees of The Alger Funds II and the Shareholders of the Alger Spectra
Fund, Alger Green Fund, Alger Mid Cap Focus Fund (formerly Alger Analyst Fund), Alger
Dynamic Opportunities Fund, and Alger Emerging Markets Fund:
We have audited the accompanying statements of assets and liabilities, including the
schedules of investments, of The Alger Funds II, comprised of the Alger Spectra Fund,
Alger Green Fund, Alger Mid Cap Focus Fund (formerly Alger Analyst Fund), Alger
Dynamic Opportunities Fund, and Alger Emerging Markets Fund (the “Funds”) as of
October 31, 2016, and the related statements of operations for the year then ended, the
statements of changes in net assets for each of the two years in the period then ended, and
the financial highlights for each of the periods presented. These financial statements and
financial highlights are the responsibility of the Funds' management. Our responsibility is
to express an opinion on these financial statements and financial highlights based on our
audits.
We conducted our audits in accordance with the standards of the Public Company
Accounting Oversight Board (United States). Those standards require that we plan and
perform the audit to obtain reasonable assurance about whether the financial statements and
financial highlights are free of material misstatement. The Funds are not required to have,
nor were we engaged to perform, an audit of their internal control over financial reporting.
Our audits included consideration of internal control over financial reporting as a basis for
designing audit procedures that are appropriate in the circumstances, but not for the purpose
of expressing an opinion on the effectiveness of the Funds' internal control over financial
reporting. Accordingly, we express no such opinion. An audit also includes examining, on
a test basis, evidence supporting the amounts and disclosures in the financial statements,
assessing the accounting principles used and significant estimates made by management,
as well as evaluating the overall financial statement presentation. Our procedures included
confirmation of securities owned as of October 31, 2016, by correspondence with the
custodian and brokers; when replies were not received from brokers, we performed other
auditing procedures. We believe that our audits provide a reasonable basis for our opinion.
In our opinion, the financial statements and financial highlights referred to above present
fairly, in all material respects, the financial position of each of the portfolios constituting
The Alger Funds II as of October 31, 2016, the results of their operations for the year then
ended, the changes in their net assets for each of the two years in the period then ended, and
the financial highlights for each of the periods presented, in conformity with accounting
principles generally accepted in the United States of America.
Deloitte & Touche LLP
New York, New York
December 29, 2016
- 122 -
THE ALGER FUNDS II
ADDITIONAL INFORMATION (Unaudited)
Shareholder Expense Example
As a shareholder of a Fund, you incur two types of costs: transaction costs, if applicable,
including sales charges (loads) and redemption fees; and ongoing costs, including
management fees, distribution (12b-1) fees, if applicable, and other fund expenses. This
example is intended to help you understand your ongoing costs (in dollars) of investing in
the Fund and to compare these costs with the ongoing costs of investing in other mutual
funds.
The example below is based on an investment of $1,000 invested at the beginning of the
six-month period starting May 1, 2016 and ending October 31, 2016.
Actual Expenses
The first line for each class of shares in the table below provides information about actual
account values and actual expenses. You may use the information in this line, together
with the amount you invested, to estimate the expenses that you would have paid over the
period. Simply divide your account value by $1,000 (for example, an $8,600 account value
divided by $1,000 = 8.6), then multiply the result by the number in the first line under the
heading entitled “Expenses Paid during the Period” to estimate the expenses you paid on
your account during this period.
Hypothetical Example for Comparison Purposes
The second line for each class of shares in the table below provides information about
hypothetical account values and hypothetical expenses based on the Fund’s actual expense
ratios for each class of shares and an assumed rate of return of 5% per year before expenses,
which is not the Fund’s actual return. The hypothetical account values and expenses may not
be used to estimate the actual ending account balance or expenses you paid for the period.
You may use this information to compare the ongoing costs of investing in the Fund and
other funds. To do so, compare this 5% hypothetical example with the 5% hypothetical
examples that appear in the shareholder reports of other funds.
Please note that the expenses shown in the table are meant to highlight your ongoing costs
only and do not reflect any transaction costs, such as sales charges (loads) and redemption
fees. Therefore, the second line under each class of shares in the table is useful in comparing
ongoing costs only, and will not help you determine the relative total costs of owning
different funds. In addition, if these transactional costs were included, your costs would
have been higher.
- 123 -
THE ALGER FUNDS II
ADDITIONAL INFORMATION (Unaudited) (Continued)
| | | | | | | | | | | | |
| | | | | | | | | | | Annualized | |
| | | | | | | | Expenses | | Expense Ratio | |
| | | | | | | | Paid During | | | For the | |
| | | Beginning | | Ending | | the Six Months | | Six Months | |
| | | | Account | | Account | | | Ended | | | Ended | |
| | | | Value | | Value | | October 31, | | October 31, | |
| | | May 1, 2016 | | October 31, 2016 | | | 2016 | (a) | | 2016 | (b) |
| Alger Spectra Fund | | | | | | | | | | | |
| Class A | Actual | $ | 1,000.00 | $ | 1,045.12 | | $ | 6.73 | | | 1.31 | % |
| | Hypothetical(c) | | 1,000.00 | | 1,018.55 | | | 6.65 | | | 1.31 | |
| Class C | Actual | | 1,000.00 | | 1,041.53 | | 10.62 | | | 2.07 | |
| | Hypothetical(c) | | 1,000.00 | | 1,014.73 | | 10.48 | | | 2.07 | |
| Class I | Actual | | 1,000.00 | | 1,045.34 | | | 6.63 | | | 1.29 | |
| | Hypothetical(c) | | 1,000.00 | | 1,018.65 | | | 6.55 | | | 1.29 | |
| Class Z | Actual | | 1,000.00 | | 1,046.84 | | | 5.09 | | | 0.99 | |
| | Hypothetical(c) | | 1,000.00 | | 1,020.16 | | | 5.03 | | | 0.99 | |
| | | | | | | | | | | | | |
| Alger Green Fund | | | | | | | | | | | |
| Class A | Actual | $ | 1,000.00 | $ | 1,025.81 | | $ | 6.67 | | | 1.31 | % |
| | Hypothetical(c) | | 1,000.00 | | 1,018.55 | | | 6.65 | | | 1.31 | |
| Class C | Actual | | 1,000.00 | | 1,021.48 | | 10.62 | | | 2.09 | |
| | Hypothetical(c) | | 1,000.00 | | 1,014.63 | | 10.58 | | | 2.09 | |
| Class I | Actual | | 1,000.00 | | 1,025.84 | | | 6.52 | | | 1.28 | |
| | Hypothetical(c) | | 1,000.00 | | 1,018.70 | | | 6.50 | | | 1.28 | |
| Class Z | Actual | | 1,000.00 | | 993.48 | | | 5.11 | | | 0.99 | |
| | Hypothetical(c) | | 1,000.00 | | 1,020.01 | | | 5.18 | | | 0.99 | |
| | | | | | | | | | | | | |
| Alger Mid Cap Focus Fund | | | | | | | | | | | |
| Class A | Actual | $ | 1,000.00 | $ | 962.10 | | $ | 6.36 | | | 1.29 | % |
| | Hypothetical(c) | | 1,000.00 | | 1,018.65 | | | 6.55 | | | 1.29 | |
| Class C | Actual | | 1,000.00 | | 958.87 | | | 9.65 | | | 1.95 | |
| | Hypothetical(c) | | 1,000.00 | | 1,015.28 | | | 9.93 | | | 1.95 | |
| Class I | Actual | | 1,000.00 | | 961.97 | | | 6.41 | | | 1.30 | |
| | Hypothetical(c) | | 1,000.00 | | 1,018.60 | | | 6.60 | | | 1.30 | |
| Class Z | Actual | | 1,000.00 | | 989.33 | | | 5.65 | | | 0.99 | |
| | Hypothetical(c) | | 1,000.00 | | 1,019.46 | | | 5.74 | | | 0.99 | |
| | | | | | | | | | | | | |
| Alger Dynamic Opportunities Fund | | | | | | | | | | | |
| Class A | Actual | $ | 1,000.00 | $ | 1,000.00 | | $ | 12.02 | | | 2.38 | % |
| | Hypothetical(c) | | 1,000.00 | | 1,013.12 | | 12.09 | | | 2.38 | |
| Class C | Actual | | 1,000.00 | | 995.50 | | 15.75 | | | 3.14 | |
| | Hypothetical(c) | | 1,000.00 | | 1,009.35 | | 15.86 | | | 3.14 | |
| Class Z | Actual | | 1,000.00 | | 1,001.69 | | 10.42 | | | 2.07 | |
| | Hypothetical(c) | | 1,000.00 | | 1,014.73 | | 10.48 | | | 2.07 | |
| | | | | | | | | | | | | |
- 124 -
THE ALGER FUNDS II
ADDITIONAL INFORMATION (Unaudited) (Continued)
| | | | | | | | | | | | |
| | | | | | | | | | | Annualized | |
| | | | | | | | Expenses | | Expense Ratio | |
| | | | | | | | Paid During | | | For the | |
| | | Beginning | | Ending | | the Six Months | | Six Months | |
| | | | Account | | Account | | | Ended | | | Ended | |
| | | | Value | | Value | | October 31, | | October 31, | |
| | | May 1, 2016 | | October 31, 2016 | | | 2016 | (a) | | 2016 | (b) |
| Alger Emerging Markets Fund | | | | | | | | | | | |
| Class A | Actual | $ | 1,000.00 | $ | 1,097.83 | | $ | 8.54 | | | 1.60 | % |
| | Hypothetical(c) | | 1,000.00 | | 1,016.99 | | | 8.21 | | | 1.60 | |
| Class C | Actual | | 1,000.00 | | 1,093.63 | | 12.37 | | | 2.35 | |
| | Hypothetical(c) | | 1,000.00 | | 1,013.32 | | | 11.89 | | | 2.35 | |
| Class I | Actual | | 1,000.00 | | 1,098.42 | | | 8.44 | | | 1.60 | |
| | Hypothetical(c) | | 1,000.00 | | 1,017.09 | | | 8.11 | | | 1.60 | |
| Class Y | Actual | | 1,000.00 | | 1,141.06 | | | 5.76 | | | 1.05 | |
| | Hypothetical(c) | | 1,000.00 | | 1,019.76 | | | 5.43 | | | 1.05 | |
| Class Y-2 | Actual | | 1,000.00 | | 1,141.06 | | | 5.44 | | | 0.99 | |
| | Hypothetical(c) | | 1,000.00 | | 1,020.06 | | | 5.13 | | | 0.99 | |
| Class Z | Actual | | 1,000.00 | | 1,098.79 | | | 6.70 | | | 1.25 | |
| | Hypothetical(c) | | 1,000.00 | | 1,018.75 | | | 6.44 | | | 1.25 | |
(a) Expenses are equal to the annualized expense ratio of the respective share class, multiplied by the average account
value over the period, multiple by 184/366 (to reflect the one-half year period).
(b) Annualized.
(c) 5% annual return before expenses.
- 125 -
THE ALGER FUNDS II
ADDITIONAL INFORMATION (Unaudited) (Continued)
Tax Information
For the year ended October 31, 2016, certain dividends paid by the Funds may be subject
to a maximum rate of 15%, as provided by the Jobs and Growth Tax Relief Reconciliation
Act of 2003. Of the distributions paid during the fiscal year, 100% of the Alger Emerging
Markets Fund’s dividend may be considered qualified dividend income.
Shareholders should not use the above information to prepare their tax returns. Since the
Fund’s fiscal year is not the calendar year, another notification will be sent with respect to
calendar year 2016. Such notification, which will reflect the amount to be used by tax payers
on their federal income tax returns, will be made in conjunction with Form 1099 DIV and
will be mailed in January 2017. Shareholders are advised to consult their own tax advisers
with respect to the tax consequences of their investment in the Fund.
Trustees and Officers of the Trust
Information about the trustees and officers of the Trust is set forth below. In the table the
term “Alger Fund Complex” refers to the Trust, The Alger Portfolios, The Alger Institutional
Funds, Alger Global Growth Fund and The Alger Funds, each of which is a registered
investment company managed by Fred Alger Management, Inc. (“Alger Management”).
Each Trustee serves until an event of termination, such as death or resignation, or until his
or her successor is duly elected; each officer’s term of office is one year. Unless otherwise
noted, the address of each person named below is 360 Park Avenue South, New York, NY
10010.
- 126 -
THE ALGER FUNDS II
ADDITIONAL INFORMATION (Unaudited) (Continued)
| | | |
| | | | Number |
| | | | of Funds |
| | | | in the |
| | | | Alger Fund |
| | | Trustee | Complex |
| | | and/or | which are |
| Name, Age, Position with the | | Officer | Overseen |
| Trust | Principal Occupations | Since | by Trustee |
| INTERESTED TRUSTEE | | | |
| |
| Hilary M. Alger (55) | Director of Development, Pennsylvania Ballet | 2003 | 25 |
| | 2004-2013; Associate Director of Development, | | |
| | College of Arts and Sciences and Graduate School, | | |
| | University of Virginia 1999-2003. | | |
| NON-INTERESTED TRUSTEE | | | |
| |
| Charles F. Baird, Jr. (63) | Managing Partner of North Castle Partners, a | 2000 | 25 |
| | private equity securities group; Chairman of | | |
| | Elizabeth Arden Red Door Spas and Barry’s | | |
| | Bootcamp, former Chairman of Cascade Helmets, | | |
| | gloProfessional (makeup and skincare business), | | |
| | Contigo (manufacturer of mugs and water bottles), | | |
| | and International Fitness. | | |
| Roger P. Cheever (71) | Associate Vice President for Principal Gifts, and | 2000 | 25 |
| | Senior Associate Dean for Development in the | | |
| | Faculty of Arts and Sciences at Harvard University; | | |
| | Formerly Deputy Director of the Harvard College | | |
| | Fund. | | |
| Stephen E. O'Neil (83) | Attorney. Private Investor since 1981. Formerly of | 1986 | 25 |
| | Counsel to the law firm of Kohler & Barnes. | | |
| David Rosenberg (54) | Associate Professor of Law since January 2006 | 2007 | 25 |
| | (Assistant Professor 2000-2005), Zicklin School of | | |
| | Business, Baruch College, City University of New | | |
| | York. | | |
| Nathan E. Saint-Amand | Medical doctor in private practice; Member of the | 1986 | 25 |
| M.D. (78) | Board of the Manhattan Institute (non-profit policy | | |
| | research) since 1988; Formerly Co-Chairman, Special | | |
| | Projects Committee, Memorial Sloan Kettering. | | |
Ms. Alger is an “interested person” (as defined in the Investment Company Act) of the
Trust because of her affiliations with Alger Management. No Trustee is a director of any
public company except as indicated under “Principal Occupations”.
- 127 -
THE ALGER FUNDS II
ADDITIONAL INFORMATION (Unaudited) (Continued)
| | | | |
| | | | | Number |
| | | | | of Funds |
| | | | | in the |
| | | | | Alger Fund |
| | | | Trustee | Complex |
| | | | and/or | which are |
| Name, Age, Position with the | | | Officer | Overseen |
| Trust | Principal Occupations | | Since | by Trustee |
| OFFICERS | | | | |
| |
| Hal Liebes (52) | Executive Vice President, Chief Operating Officer, | | 2005 | N/A |
| President | Chief Legal Officer and Secretary of Alger | | | |
| | Management and Alger Inc.; Director since 2006 of | | | |
| | Alger Management, Alger Inc. and Resources. | | | |
| Lisa A. Moss (51) | Senior Vice President since 2009, and Vice | | 2006 | N/A |
| Secretary | President and Assistant General Counsel of Alger | | | |
| | Management since June 2006. | | | |
| Michael D. Martins (51) | Senior Vice President of Alger Management; | | 2005 | N/A |
| Treasurer | Assistant Treasurer since 2004. | | | |
| Anthony S. Caputo (61) | Employed by Alger Management since 1986, | | 2007 | N/A |
| Assistant Treasurer | currently serving as Vice President. | | | |
| Sergio M. Pavone (55) | Employed by Alger Management since 2002, | | 2007 | N/A |
| Assistant Treasurer | currently serving as Vice President. | | | |
| Patrick J. Murphy (46) | Senior Vice President of Alger Management since | | 2014 | N/A |
| Chief Compliance Officer | 2014 | . | | |
| Christopher E. Ullman (31) | Associate Counsel of Alger Management since | | 2016 | N/A |
| Assistant Secretary | 2016. Formerly, Associate, Legal and Compliance, | | | |
| | BlackRock from 2015 to 2016; Compliance | | | |
| | Associate, Bridgewater Associates, from 2013 to | | | |
| | 2014; and full-time student from 2010 to 2013. | | |
The Statement of Additional Information contains additional information about the Funds’
Trustees and is available without charge upon request by calling (800) 992-3863.
- 128 -
THE ALGER FUNDS II
ADDITIONAL INFORMATION (Unaudited) (Continued)
Investment Management Agreement Renewal
At an in-person meeting held on September 27, 2016, the Trustees, including the Independent
Trustees, unanimously approved renewal of the Investment Advisory Agreement (the
“Agreement”) between the Trust and Fred Alger Management, Inc. (“Alger Management”).
The Independent Trustees were assisted in their review by independent legal counsel and met
with such counsel in executive session separate from representatives of Alger Management.
In evaluating the Agreement, the Trustees drew on materials that they had requested and
which were provided to them in advance of the meeting by Alger Management and by
counsel. The materials covered, among other matters, (i) the nature, extent and quality
of the services provided by Alger Management under the Agreement, (ii) the investment
performance of each of the Trust’s portfolios (each a “Fund”), (iii) the costs to Alger
Management of its services and the profits realized by Alger Management and Fred Alger
& Company, Incorporated (“Alger Inc.”), from their relationship with the Trust, and (iv)
the extent to which economies of scale would be realized if and as the Funds grow and
whether the fee levels in the Agreement reflect such economies of scale. These materials
included a presentation and analysis of the Funds and Alger Management’s services by
FUSE Research Network LLC (“FUSE”), an independent consulting firm selected by the
Trust’s Chief Compliance Officer and having no other material relationship with Alger
Management or its affiliates.
In deciding whether to approve renewal of the Agreement, the Trustees considered various
factors, including those enumerated above. They also considered other direct and indirect
benefits to Alger Management and its affiliates from their relationship with the Trust.
Nature, Extent and Quality of Services. In considering the nature, extent and quality of
the services provided by Alger Management pursuant to the Agreement, the Trustees relied
on their prior experience as Trustees of the Trust, their familiarity with the personnel and
resources of Alger Management and its affiliates (derived in part from quarterly meetings
with and presentations by Fund investment management and distribution personnel), and the
materials provided at the meeting. They noted that under the Agreement, Alger Management
is responsible for managing the investment operations of the Funds. The Trustees reviewed
the background and experience of Alger Management's senior investment management
personnel, including the individuals currently responsible for the investment operations
of the Funds. They also considered the resources and practices of Alger Management
in managing each Fund's portfolio, as well as Alger Management's overall investment
management business. They noted especially Alger Management's established expertise
in managing portfolios of "growth" stocks and that, according to an analysis provided by
FUSE, the characteristics of each Fund had been consistent with those of a growth-oriented
fund. They further noted that Alger Management’s investment management team includes
several individuals with successful backgrounds in emerging markets, a sector in which the
Emerging Markets Fund is active. They also noted that during the year Alger Management
had continued its ongoing efforts to strengthen its investment management team through
strategic hires, realignment of portfolio management responsibilities, and similar measures.
The Trustees concluded that Alger Management's experience, resources and strength in the
- 129 -
THE ALGER FUNDS II
ADDITIONAL INFORMATION (Unaudited) (Continued)
areas of importance to the Funds are considerable. The Trustees considered the level and
depth of Alger Management's ability to execute portfolio transactions to effect investment
decisions, including those through Alger Inc. They also noted that certain administrative,
compliance, reporting and accounting services necessary for the conduct of the Trust's
affairs are provided separately under a Fund Administration Agreement and a Shareholder
Administrative Services Agreement with Alger Management. The Trustees also considered
the control and compliance environment at Alger Management and within the Trust.
Investment Performance of the Funds. Drawing upon information provided at the
meeting by Alger Management as well as FUSE and upon reports provided to the Trustees
by Alger Management throughout the preceding year, the Trustees reviewed each Fund’s
returns for the year-to-date (at 6/30/16), second-quarter of 2016, 1-, 3- and 5-year and longer
periods to the extent available (and its year-by-year returns), together with supplemental
performance data through 8/31/16, and compared them with benchmark and peer-group
data for the same periods. They noted that Spectra Fund, the Dynamic Opportunities Fund
and the Green Fund fell short of their peer medians and benchmarks for all recent periods
from quarter-end (at 6/30/16) through one year, with the Green Fund showing similar
results for the longer 3- and 5-year periods and the Dynamic Opportunities Fund showing
somewhat better performance against its peers, but not against its benchmark, for 3 and 5
years. Notwithstanding its unimpressive recent performance, Spectra Fund still maintained
a high rating against its peers when calculated over the longer 3- and 5-year periods. The
Emerging Markets Fund showed an uneven record, performing just below its peer median
and above its benchmark for the quarter ended 6/30/16, falling well below its peer median
and benchmark for the year to date, but approaching or exceeding its peer medians, while
matching or surpassing its benchmark, for the 1-, 3- and 5-year periods. The Mid Cap Focus
Fund (formerly the Analyst Fund), which had acquired a materially different investment
approach at December 31, 2015, showed subpar performance against peers and benchmark
for the 6/30/16 quarter and year to date, but the Trustees attached less importance to these
results given the short time frame in which the Fund had been following its new investment
approach.
Representatives of Alger Management discussed with the Trustees the recent performance
of each Fund and the measures that the firm had instituted to improve the performance
of Funds that had underperformed. Throughout, the Trustees were mindful of the point,
alluded to in the discussion, that the current market in equity securities favors dividend-
paying equities rather than pure growth stocks, a trend directly contrary to the Alger
investment approach and tending to depress the prices of growth stocks as compared with
those of dividend stocks..On the basis of these discussions and their review, the Trustees
determined that the performance of the Funds was acceptable.
Fund Fees and Expense Ratios; Profitability to Alger Management and its Affiliates.
The Trustees reviewed each Fund's management fee and expense ratio and compared
them with those of a group of comparable funds. In order to assist the Trustees in this
comparison, FUSE had provided the Trustees with comparative information with respect to
- 130 -
THE ALGER FUNDS II
ADDITIONAL INFORMATION (Unaudited) (Continued)
the advisory fees and expense ratios of relevantly similar funds. That information indicated
that the advisory fees for all of the Funds other than Spectra Fund were below the median
for their peers while that of Spectra Fund exceeded its median by only eight percentage
points. Of the 19 expense ratios for the Funds’ various share classes, 15 were below or just
above their peer medians; of the remaining four, only one share class placed in the top
quartile of the applicable reference group, and it – the Class C Shares of the Green Fund -
was for a very small class, with assets of $5.7 million at 6/30/16 , which therefore suffered
in comparison with its peers.. The Trustees determined that this information should be
taken into account in weighing the size of the fee against the nature, extent and quality of
the services provided.
The Trustees also considered fees paid to Alger Management by four other types of
clients, specifically mutual funds for which Alger Management was sub-adviser, separately
managed institutional accounts, “wrap programs,” and collective investment trusts. The
Trustees determined that in all four cases the fees were of doubtful relevance for purposes
of comparison with those of the Funds because of the differences in services provided
by Alger Management to those types of clients as opposed to the Funds, but that to the
extent that meaningful comparison was practicable, the differences in services adequately
explained the differences in the fees. The Trustees then considered the profitability
of the Investment Advisory Agreement to Alger Management and its affiliates, and the
methodology used by Alger Management in determining such profitability. The Trustees
reviewed previously-provided data on each Fund's profitability to Alger Management and
its affiliates for the year ended June 30, 2016. After discussing with representatives of Alger
Management and FUSE the expense-allocation practices, which FUSE reported to be
consistent with accepted industry practice, used in computing the costs that formed the
bases of the profitability calculations, the Trustees turned to the profitability data provided.
After analysis and discussion, they concluded in each case that, to the extent that Alger
Management’s and its affiliates’ relationships with the Fund had been profitable, the profit
margin was not unacceptable.
Economies of Scale. On the basis of their discussions with management and their
analysis of information provided at the meeting, the Trustees determined that the nature of
the Funds and their operations is such that Alger Management is likely to realize economies
of scale in the management of each Fund at some point as (and if) it grows in size. In
that connection, they noted that the advisory fee schedules in the Agreement include fee
reductions for each Fund (other than the Alger Emerging Markets Fund) at specified Fund
asset levels (“breakpoints”), including additional breakpoints added for Spectra Fund at
June 1, 2016; these have the effect of lowering a Fund’s overall management fee as the Fund
grows past a breakpoint, thus sharing with the Fund’s shareholders economies of scale
achieved by Alger Management in managing the growing Fund. (The Emerging Markets
Fund, with assets at 6/30/16 of less than $37 million and for which Alger Management
was waiving some of its management fees, continued to be deemed too small realistically to
merit the institution of fee breakpoints.)
- 131 -
THE ALGER FUNDS II
ADDITIONAL INFORMATION (Unaudited) (Continued)
Other Benefits to Alger Management. The Trustees considered whether Alger
Management benefits in other ways from its relationship with the Trust. They noted that
Alger Management maintains soft-dollar arrangements in connection with the Funds'
brokerage transactions, reports on which are regularly supplied to the Trustees at their
quarterly meetings and summaries of which, listing soft-dollar commissions by Fund for the
twelve months through June 30, 2016, had been included in the materials supplied prior to
the meeting. The Trustees also noted that Alger Management receives fees from the Funds
under the Fund Administration Agreement and the Shareholder Administrative Services
Agreement, and that Alger Inc. provides a considerable portion of the Funds' equity
brokerage and receives shareholder servicing fees from the Funds as well. The Trustees
had been provided with information regarding, and had considered, the administration fee,
shareholder administrative services fee, brokerage and shareholder servicing fee benefits in
connection with their review of the profitability to Alger Management and its affiliates of
their relationships with the Funds. As to other benefits received, the Trustees decided that
none were so significant as to render Alger Management's fees excessive.
Conclusions and Determinations. At the conclusion of these discussions, each of the
Independent Trustees expressed the opinion that he had been furnished with sufficient
information to make an informed business decision with respect to renewal of the
Investment Advisory Agreement. Based on its discussions and considerations as described
above, the Board made the following conclusions and determinations in respect of each
Fund:
• The Board concluded that the nature, extent and quality of the services provided
to the Fund by Alger Management are adequate and appropriate.
• The Board determined that the Fund’s performance was acceptable.
• The Board concluded that the advisory fee paid to Alger Management by the
Fund was reasonable in light of comparative performance and expense and advi-
sory fee information, costs of the services provided and profits to be realized and
benefits derived or to be derived by Alger Management and its affiliates from the
relationship with the Fund. The Trustees noted in the case of certain Funds that
Alger Management had undertaken to cap Fund expenses through expense re-
imbursements and fee waivers, thus in effect lowering the fees it actually received
from the Fund.
• With respect to each Fund other than the small Alger Emerging Markets Fund,
the Board accepted Alger Management’s acknowledgement that economies of
scale were likely to be achieved in the management of the Fund as (and if) it grew
in size and determined that the fee breakpoints in the Agreement provided a
means by which Alger Management would share the benefits of such economies
with Fund shareholders.
The Board considered these conclusions and determinations and, without any one factor
being dispositive, determined with respect to each Fund that renewal of the Investment
Advisory Agreement was in the best interests of the Fund and its shareholders
- 132 -
THE ALGER FUNDS II
ADDITIONAL INFORMATION (Unaudited) (Continued)
Privacy Policy
U.S. Consumer Privacy Notice Rev. 12/20/16
| |
| FACTS | WHAT DOES ALGER DO WITH YOUR PERSONAL INFORMATION? |
| |
| |
| Why? | Financial companies choose how they share your personal information. Federal law |
| | gives consumers the right to limit some but not all sharing. Federal law also requires us |
| | to tell you how we collect, share, and protect your personal information. Please read this |
| | notice carefully to understand what we do. |
| What? | The types of personal information we collect and share depend on the product or service |
| | you have with us. |
| | This information can include: |
| | • Social Security number and |
| | • Account balances and |
| | • Transaction history and |
| | • Purchase history and |
| | • Assets |
| | When you are no longer our customer, we continue to share your information as |
| | described in this notice. |
| How? | All financial companies need to share personal information to run their everyday business. |
| | In the section below, we list the reasons financial companies can share personal |
| | information; the reasons Alger chooses to share; and whether you can limit this sharing. |
| | |
| Reasons we can share your personal | Does | Can you limit |
| information | Alger share? | this sharing? |
| For our everyday business purposes — | Yes | No |
| such as to process your transactions, maintain | | |
| your account(s), respond to court orders and | | |
| legal investigations, or report to credit bureaus | | |
| For our marketing purposes —to offer our | Yes | No |
| products and services to you | | |
| For joint marketing with other financial | No | We don’t share |
| companies | | |
| For our affiliates’ everyday business | Yes | No |
| purposes — information about your | | |
| transactions and experiences | | |
| For our affiliates’ everyday business | No | We don’t share |
| purposes — information about your | | |
| creditworthiness | | |
| For nonaffiliates to market to you | No | We don’t share |
| Question? Call 1-800-342-2186 | | |
- 133 -
THE ALGER FUNDS II
ADDITIONAL INFORMATION (Unaudited) (Continued)
| |
| Who we are | |
| |
| Who is providing this notice? | Alger includes Fred Alger Management, Inc. and Fred |
| | Alger & Company, Incorporated as well as the following |
| | funds: The Alger Funds, The Alger Funds II, The Alger |
| | Institutional Funds, The Alger Portfolios, and Alger |
| | Global Growth Fund. |
| |
| What we do | |
| How does Alger | To protect your personal information from unauthorized |
| protect my personal | access and use, we use security measures that comply |
| information? | with federal law. These measures include computer |
| | safeguards and secured files and buildings. |
| How does Alger | We collect your personal information, for example, |
| collect my personal | when you: |
| information? | • Open an account or |
| | • Make deposits or withdrawals from your account or |
| | • Give us your contact information or |
| | • Provide account information or |
| | • Pay us by check. |
| |
| |
| Why can’t I limit all sharing? | Federal law gives you the right to limit only |
| | • sharing for affiliates’ everyday business purposes |
| | information about your credit worthiness |
| | • affiliates from using your information to market to you |
| | • sharing for nonaffiliates to market to you |
| | State laws and individual companies may give you |
| | additional rights to limit sharing. |
| |
| Definitions | |
| Affiliates | Companies related by common ownership or control. |
| | They can be financial and nonfinancial companies. |
| | • Our affiliates include Fred Alger Management, Inc. |
| | and Fred Alger & Company, Incorporated as well as |
| | the following funds: The Alger Funds, The Alger |
| | Funds II, The Alger Institutional Funds, The Alger |
| | Portfolios, and Alger Global Growth Fund. |
| Nonaffiliates | Companies not related by common ownership or |
| | control. They can be financial and nonfinancial |
| | companies |
| Joint marketing | A formal agreement between nonaffiliated financial |
| | companies that together market financial products or |
| | services to you. |
| Other important information | |
- 134 -
THE ALGER FUNDS II
ADDITIONAL INFORMATION (Unaudited) (Continued)
Proxy Voting Policies
A description of the policies and procedures the Trust uses to determine how to vote
proxies relating to portfolio securities and information regarding how the Fund voted
proxies relating to portfolio securities during the most recent 12-month period ended June
30 are available, without charge, by calling (800) 992-3863 or online on the Funds’ website
at www.alger.com or on the SEC’s website at www.sec.gov.
Fund Holdings
The Board of Trustees has adopted policies and procedures relating to disclosure of the
Funds’ portfolio securities. These policies and procedures recognize that there may be
legitimate business reasons for holdings to be disclosed and seek to balance those interests
to protect the proprietary nature of the trading strategies and implementation thereof by
the Funds.
Generally, the policies prohibit the release of information concerning portfolio holdings
which have not previously been made public to individual investors, institutional investors,
intermediaries that distribute the Funds’ shares and other parties which are not employed
by the Manager or its affiliates except when the legitimate business purposes for selective
disclosure and other conditions (designed to protect the Funds) are acceptable.
The Funds make their full holdings available semi-annually in shareholder reports filed on
Form N-CSR and after the first and third fiscal quarters in regulatory filings on Form N-Q.
These shareholder reports and regulatory filings are filed with the SEC, as required by federal
securities laws, and are generally available within sixty (60) days of the end of the Funds’
fiscal quarter. The Funds’ Forms N-Q are available online on the SEC’s website at www.
sec.gov or may be reviewed and copied at the SEC’s Public Reference Room in Washington,
D.C. Information regarding the operation of the SEC’s Public Reference Room may be
obtained by calling 1-800-SEC-0330.
In addition, the Funds make publicly available their respective month-end top 10 holdings
with a 15 day lag and their month-end full portfolios with a 60 day lag on their website www.
alger.com and through other marketing communications (including printed advertising/
sales literature and/or shareholder telephone customer service centers). No compensation
or other consideration is received for the non-public disclosure of portfolio holdings
information.
In accordance with the foregoing, the Funds provide portfolio holdings information to
service providers who provide necessary or beneficial services when such service providers
need access to this information in the performance of their services and are subject to
duties of confidentiality (1) imposed by law, including a duty not to trade on non-public
information, and/or (2) pursuant to an agreement that confidential information is not to be
disclosed or used (including trading on such information) other than as required by law. From
time to time, the Funds will communicate with these service providers to confirm that they
understand the Funds’ policies and procedures regarding such disclosure. This agreement
must be approved by the Funds’ Chief Compliance Officer, President or Secretary.
- 135 -
THE ALGER FUNDS II
ADDITIONAL INFORMATION (Unaudited) (Continued)
The Board of Trustees periodically reviews a report disclosing the third parties to whom
each Fund’s holdings information has been disclosed and the purpose for such disclosure,
and it considers whether or not the release of information to such third parties is in the best
interest of the Fund and its shareholders.
In addition to material the Funds routinely provide to shareholders, the Manager may,
upon request, make additional statistical information available regarding the Funds. Such
information will include, but not be limited to, relative weightings and characteristics of a
Fund portfolios versus its peers or an index (such as P/E ratio, alpha, beta, capture ratio,
standard deviation, EPS forecasts, Sharpe ratio, information ratio, R-squared, and market
cap analysis), security specific impact on overall portfolio performance month-end top
ten contributors to and detractors from performance, breakdown of High Unit Volume
Growth holdings vs. Positive Lifecycle Change holdings, portfolio turnover, and requests
of a similar nature. Please contact the Funds at (800) 992-3863 to obtain such information.
- 136 -
THE ALGER FUNDS II
360 Park Avenue South
New York, NY 10010
(800) 992-3863
www.alger.com
Investment Manager
Fred Alger Management, Inc.
360 Park Avenue South
New York, NY 10010
Distributor
Fred Alger & Company, Incorporated
360 Park Avenue South
New York, NY 10010
Transfer Agent and Dividend Disbursing Agent
State Street Bank and Trust Company
c/o Boston Financial Data Services, Inc.
P.O. Box 8480
Boston, MA 02266-8480
Custodian
Brown Brothers Harriman & Company
50 Post Office Square
Boston, MA 02110
This report is submitted for the general information of the shareholders of The Alger
Funds II. It is not authorized for distribution to prospective investors unless accompanied
by an effective Prospectus for the Trust, which contains information concerning the Trust’s
investment policies, fees and expenses as well as other pertinent information.
- 137 -

ITEM 2. CODE OF ETHICS.
(a) The Registrant has adopted a code of ethics (the "Code of Ethics") that applies to its
principal executive officer, principal financial officer, principal accounting officer or
controller, or persons performing similar functions.
(b) Not applicable.
(c) The Registrant has not amended its Code of Ethics during the period covered by the
shareholder report presented in Item 1 hereto.
(d) The Registrant has not granted a waiver or an implicit waiver from a provision of its
Code of Ethics during the period covered by the shareholder report presented in Item 1
hereto.
(e) Not applicable.
(f) The Registrant's Code of Ethics is attached as an Exhibit hereto.
ITEM 3. AUDIT COMMITTEE FINANCIAL EXPERT.
The Board of Trustees of the Registrant determined that Stephen E. O’Neil is an audit committee
financial expert (within the meaning of that phrase specified in the instructions to Form N-CSR)
on the Registrant’s audit committee. Mr. O’Neil is an “independent” trustee – i.e., he is not an
interested person of the Registrant as defined in the Investment Company Act of 1940, nor has
he accepted directly or indirectly any consulting, advisory or other compensatory fee from the
Registrant, other than in his capacity as Trustee.
ITEM 4. PRINCIPAL ACCOUNTANT FEES AND SERVICES.
| | |
| a) Audit Fees: | | |
| October 31, 2016 | $ | 143,100 |
| October 31, 2015 | $ | 140,000 |
b) Audit-Related Fees: NONE
c) Tax Fees for tax advice, tax compliance and tax planning:
| | |
| October 31, 2016 | $ | 39,536 |
| October 31, 2015 | $ | 23,500 |
| |
| d) All Other Fees: | | |
| October 31, 2016 | $ | 9,600 |
| October 31, 2015 | $ | 10,100 |
Other fees include a review and consent for Registrants registration statement filing and
a review of the semi-annual financial statements.
e) 1) Audit Committee Pre-Approval Policies And Procedures:
Audit and non-audit services provided by the Registrant’s independent registered public
accounting firm (the “Auditors”) on behalf the Registrant must be pre-approved by the
Audit Committee. Non-audit services provided by the Auditors on behalf of the
Registrant’s Investment Adviser or any entity controlling, controlled by, or under
common control with the Investment Adviser must be pre-approved by the Audit
Committee if such non-audit services directly relate to the operations or financial
reporting of the Registrant.
2) All fees in item 4(b) through 4(d) above were approved by the Registrants’ Audit
Committee.
f) Not Applicable
g) Non-Audit Fees:
| | | |
| October 31, 2016 | $ | 219,975 | , €93,631 |
| October 31, 2015 | $ | 191,042 | , €69,347 |
h) The audit committee of the board of trustees has considered whether the provision of the
non-audit services that were rendered to the registrant's investment adviser and any entity
controlling, controlled by, or under common control, with the adviser that provides ongoing
services to the registrant that were not approved pursuant to (c)(7)(ii) of Rule 2-01 of
Regulation S-X is compatible with maintaining the principle accountant's independence.
ITEM 5. AUDIT COMMITTEE OF LISTED REGISTRANTS.
Not applicable
ITEM 6. INVESTMENTS.
Not applicable
ITEM 7. DISCLOSURE OF PROXY VOTING POLICIES AND PROCEDURES FOR CLOSED-END MANAGEMENT
INVESTMENT COMPANIES.
Not applicable
ITEM 8. PORTFOLIO MANAGERS OF CLOSED-END MANAGEMENT INVESTMENT COMPANIES.
Not applicable
ITEM 9. PURCHASES OF EQUITY SECURITIES BY CLOSED-END MANAGEMENT INVESTMENT COMPANY
AND AFFILIATED PURCHASERS.
Not applicable
ITEM 10. SUBMISSION OF MATTERS TO A VOTE OF SECURITY HOLDERS.
None
ITEM 11. CONTROLS AND PROCEDURES.
(a) The Registrant’s principal executive officer and principal financial officer have concluded
that the Registrant’s disclosure controls and procedures (as defined in Rule 30a-3(c) under
the Investment Company Act of 1940, as amended) are effective based on their evaluation
of the disclosure controls and procedures as of a date within 90 days of the filing date of
this document.
(b) No changes in the Registrant’s internal control over financial reporting occurred during
the Registrant’s second fiscal half-year that materially affected, or are reasonably likely to
materially affect, the Registrant’s internal control over financial reporting.
ITEM 12. EXHIBITS.
(a) (1) Code of Ethics as Exhibit 99.CODE ETH
(a) (2) Certifications of principal executive officer and principal financial officer as required by
rule 30a-2(a) under the Investment Company Act of 1940 are attached as Exhibit 99.CERT
(b) Certifications of principal executive officer and principal financial officer as required by rule
30a-2(b) under the Investment Company Act of 1940 are attached as Exhibit 99.906CERT
SIGNATURES
Pursuant to the requirements of the Securities Exchange Act of 1934 and the Investment
Company Act of 1940, the registrant has duly caused this report to be signed on its behalf
by the undersigned, thereunto duly authorized.
The Alger Funds II
By: /s/Hal Liebes
Hal Liebes
President
Date: December 21, 2016
Pursuant to the requirements of the Securities Exchange Act of 1934 and the Investment
Company Act of 1940, this report has been signed below by the following persons on behalf
of the registrant and in the capacities and on the dates indicated.
By: /s/Hal Liebes
Hal Liebes
President
Date: December 21, 2016
By: /s/Michael D. Martins
Michael D. Martins
Treasurer
Date: December 21, 2016